|
| OMB APPROVAL | ||
|
| OMB Number: | 3235-0570 | |
|
| Expires: | August 31, 2010 | |
| UNITED STATES | Estimated average burden hours per response. . . . . . . . . . . . . . . . .18.9 | ||
| SECURITIES AND EXCHANGE COMMISSION |
| ||
| Washington, D.C. 20549 |
| ||
FORM N-CSR
CERTIFIED SHAREHOLDER REPORT OF REGISTERED
MANAGEMENT INVESTMENT COMPANIES
Investment Company Act file number | 811-1743 | |||||||
| ||||||||
The Spectra Funds | ||||||||
(Exact name of registrant as specified in charter) | ||||||||
| ||||||||
111 Fifth Avenue New York, New York |
| 10003 | ||||||
(Address of principal executive offices) |
| (Zip code) | ||||||
| ||||||||
Mr. Hal Liebes | ||||||||
(Name and address of agent for service) | ||||||||
| ||||||||
Registrant’s telephone number, including area code: | 212-806-8800 |
| ||||||
| ||||||||
Date of fiscal year end: | October 31 |
| ||||||
| ||||||||
Date of reporting period: | April 30, 2008 |
| ||||||

See inside for important changes to your fund (Inside Cover)
Spectra Fund | Spectra Green Fund | Spectra Alchemy Fund | Spectra International Opportunities Fund | Spectra Technology Fund
The Spectra Funds
Semi-Annual Report
April 30, 2008
(Unaudited)
Important Notice
Fred Alger Management, Inc. has recommended, and the board of The Spectra Funds has approved, changes in the way The Spectra Funds are offered. Effective late-September 2008, The Spectra Funds will be renamed as "Alger" funds and will be included in The Alger Family of Funds.
The purpose of this change is to align all the Fred Alger Management-advised mutual funds more closely with the "Alger" brand. Fred Alger Management will continue as the investment adviser to your fund, and we anticipate no changes to the portfolio managers.
After the renaming, the funds will be primarily distributed through financial advisers with a sales charge. However, as a shareholder of The Spectra Funds, you will be "grandfathered in" and therefore allowed to continue purchasing — without a sales charge — the existing shares of The Spectra Funds and any other Fred Alger Management advised and branded fund (subject to relevant prospectus restrictions).
After the renaming, as shareholders of The Spectra Funds, you will also be allowed to exchange into and out of funds in The Alger Family of Funds and any other Fred Alger Management advised and branded fund at net asset value, also subject to relevant prospectus restrictions. Your fund share class following the renaming will be a Class "A" Share and will be listed by the various reporting services under the name "Alger."
The funds will be renamed as follows:
• Spectra Fund to Alger Spectra Fund
• Spectra Green Fund to Alger Green Fund
• Spectra Alchemy Fund to Alger Analyst Fund
• Spectra International Opportunities Fund to Alger International Opportunities Fund
• Spectra Technology Fund to Alger Technology Fund
We are excited about these changes and the broader investment options you will now have access to. Thank you for your continued support.
Dear Shareholders, May 30, 2008
Typically, halfway through the fiscal year is not the time to start making predictions. Those often rose-tinged foresights are usually better saved for year-end when the turbulence and froth of a hectic year have begun to settle down and investors have started to relax in an atmosphere of seasonal and consumer-driven glad tidings.
However, finding any reason to relax — much less celebrate — at our previous fiscal year-end proved difficult. Following one of the strongest growth-driven markets in years — with the Dow Jones Industrial Averagei spending several days above 14,000 — the end of 2007 saw the markets take a severe tailspin fueled by the subprime debacle and subsequent mass paranoia, only to worsen in early 2008. Only in the past month has the fallout begun to subside, providing investors with much needed breathing room.
So, while we'll save our broad predictions for another six months, we feel optimistic enough to reflect on why we think the worst of this cycle may be behind us, and why the recent downturn may actually provide investors with an opportunity to take advantage of what we are calling an "if only" market.
First Quarter Blues
The beginning of 2008 was remarkably painful in the markets, both in the United States and globally. Fall-out from the subprime mess touched almost every aspect of the economy, and reached well beyond the financial sector. The sell-off happened rapidly and with little fanfare, and few names or investors escaped unscathed. Without question, economic data for January was almost completely grim: an anemic jobs report that showed the first contraction (-17,000) of the labor force since 2003, although the unemployment rate did tick down to 4.9%; a preliminary reading of GDP growth for the last quarter of 2007 that showed the economy barely expanding at 0.6%.
It would be nice to say that the markets took these data points in stride. They did not. In fact, through the first week of February, both the S&P 500ii (down 9.3%) and the Nasdaqiii (down 13.2%) had their worst performance ever for the beginning of the year. While markets often end the year up when they begin the year down, the depth, speed, and intensity of the sell-off in January and early February hardly instilled investors with an optimistic sense of what lay ahead.
As of this writing, whether the economy as a whole ever officially entered a statistical recession or not seems beside the point. A significant majority of the American public — not to mention investors abroad — believed that it did, with investors feeling a significant psychological impediment to the aggressive devil-may-care spending of years past. Perception — particularly in the early months of 2008 — dictated that Wall Street earnings expectations for the year ahead were unrealistically high, with future growth likely to be minimal or non-existent.
-1-
Now, at the halfway mark of the fiscal year, it would be presumptuous to imply that the pain experienced during the first months of the year is over. Bear Stearn's meltdown may — or may not — be an isolated institutional failure, and repercussions from the fall-out may be felt throughout this year, and perhaps even into the next. As investors, we think that it's wise in the current market climate to take a conservative view of the economy and future earnings. At a time when negative results trigger sharp stock sell-offs and good results fade quickly, investors are well served by assessing base case and bear scenarios rigorously and steering clear of names where the downside risk outweighs the upside potential.
The above being said, we think there are certainly positives to consider, particularly concerning growth equity investing. Stocks and the economy do not necessarily move in sync, and few believe that we are looking at a protracted or steep economic contraction. Corporate balance sheets appear as stable and clean as they have ever been, with little debt and lots of cash. And the equity markets have already priced in most negative economic scenarios. In fact, we believe that years from now, today's market may be seen as one of the great "if only" markets: a missed opportunity for those who withdrew and have yet to re-enter; and a boom time for those who have returned or "stuck it out."
The "If Only" Market
What exactly is an "if only" market? It is a market looked back upon wistfully, by those not in it, who mutter to themselves, "If only I had known then what I know now, I would have bought, bought, and bought some more." And then they sigh, and say even more quietly, "If only..."
This is not a judgement call on the next few months. The markets have been trading sideways since early February and may even "violate" the lows of January and go down sharply. However, in our view, the markets have been witnessing a classic financial crisis unfolding in the context of a softening domestic economy. Unlike previous crises, however, the present issues are offset by a climate of global strength that benefits the earnings potential of many U.S.-listed companies. It is also occurring in a world awash in liquidity and where interest rates are historically low.
Typically, in periods of market flight, it is rare for growth managers to do particularly well, especially when the selling is not based on weak fundamentals. However, stock declines notwithstanding, the composition of many of our portfolios suggest strong earnings and revenue growth, certainly when compared to the S&P 500, as well as price-to-earnings-growth ratios that we believe are quite reasonable.
Investors discounting the possibility of future growth — a typical reaction in negative markets — have themselves created buying opportunities. Some companies we follow have sold off as much as 30% or more with forward earnings still looking to be above 20%. In many cases, that leads to buy points for growth stocks at unusually low prices.
And just to put too fine a point on it, historical evidence shows us that "significantly down" quarters (defined as a decline of 5% or more of the S&P 500 over the last 25 years) rarely happen back-to-back. During the subsequent rebound periods, those markets were more likely to favor growth-style investing.
-2-
Our research has shown us that investors who immediately invested after each down quarter fared significantly better than investors who waited to invest only after returns had already improved or enough time for the "markets to stabilize" had passed. So, it's quite possible that, years from now, the second fiscal quarter of 2008 may be viewed as that tremendous quarter in which to have invested, leaving many investors saying, "If only I had gotten in then."
Portfolio Matters
The Spectra Fund
The Spectra Fund returned -12.67% for the fiscal six months ended April 30, 2008, compared with a return of -9.68% for the Russell 3000 Growth Indexiv.
Information Technology represented an average weight of 29.39% of the Fund's holdings, an overweight to the benchmark, but underperformed. Lackluster performances included Tessera Technologies, Inc., a provider of miniaturization technologies for the electronics industry, DealerTrack Holdings, Inc., a provider of on-demand software and data solutions for the automotive retail industry in the United States, and SINA Corporation, an online media provider for China and global Chinese communities. The Fund did see strong contributions from Research In Motion, Ltd., manufacturer of the Blackberry, software manufacturer Solera Holdings Inc., and Mellanox Technologies, Ltd., a supplier of semiconductor-based products.
In the Health Care sector, the Fund, at an average weight of 15.69%, was underweight compared to the benchmark and underperformed. The Fund saw weaker returns in this sector from insurance provider Aetna, Inc., Northstar Neuroscience, Inc., a pioneer in the development of cortical stimulation therapies, and Inverness Medical Innovations, Inc., a manufacturer of women's health, cardiology, and infectious disease products. However, the Fund saw strong returns from Celgene Corp., a biopharmaceutical company developing innovative cancer therapies, Illumina, Inc., a developer of genomic and proteomic analysis tools, and pharmaceutical screening applications, and United Therapeutics, a biotechnology company focused on the development of products for patients with chronic and life-threatening diseases.
At an average weight of 11.95%, the Fund was overweight the benchmark in the Consumer Discretionary sector but underperformed. The Fund was negatively impacted by a steep drop in GPS device manufacturer TomTom N.V. due to worries about intensifying competition from cell phones and a bidding war with competitor Garmin, Ltd. While the Fund had promising returns from Deckers Outdoor Corp., a manufacturer of function-oriented, high-performance outdoor footwear, and LKQ Corp., it could not withstand lesser performances including Accor SA, one of the world's largest hotel groups, and the auction house Sotheby's.
At an average weight of 11.85%, the Fund was underweight the benchmark in the Industrials sector but outperformed. The Fund saw substantial contributions from JA Solar Holdings Co., Ltd., a China-based manufacturer of high-performance solar cells, BE Aerospace Inc., the world's leading manufacturer of cabin interior
-3-
products for commercial aircraft, and First Solar, Inc., a manufacturer of thin film solar modules for solar power plants. Detractors included Oshkosh Corporation, a manufacturer of trucking and specialty vehicles worldwide, Monster Worldwide, the parent company for Monster.com, the premier online recruitment site, and Boeing, Inc., the world's leading aerospace company.
Spectra Green Fund
Spectra Green Fund returned -10.85% for the fiscal six months ended April 30, 2008, compared to the Russell 3000 Growth Index which returned -9.68%.
In the Information Technology sector, the Fund, at an average weight of 24.02%, was underweight the benchmark but outperformed. Top performers included Solera Holdings, Inc., Apple Inc., and Visa, Inc. The Fund saw detractors in this sector from Microsoft Corp., Cisco Systems, Inc., and Google, Inc.
In the Consumer Discretionary sector, the Fund, at a weighted average of 18.04%, was overweight the benchmark, and underperformed. Despite solid performances from retailers Urban Outfitters, Inc., J. Crew Group, Inc., and Deckers Outdoor Corp., the Fund could not offset weaker performance from GPS manufacturer Garmin, Ltd., Starbucks Corp., and the retailer Crocs, Inc.
In the Industrials sector, the Fund, as an average weight of 15.14%, was overweight the benchmark, and outperformed. Once again, solar equipment and manufacturing proved a bright spot in this sector, with solid contributions from JA Solar Holdings Co. Ltd., and First Solar, Inc. The Fund saw additional strong returns from Deere & Company, the leading manufacturer of John Deere agricultural machinery. Detractors in this sector included McDermott International, Inc., a leading worldwide energy services company, BE Aerospace Inc., and General Electric Co.
At an average weight of 12.56%, the Fund was underweight the benchmark in the Health Care sector and underperformed. Significant detractors included the pharmaceutical company Schering-Plough Corp., Metabolix, Inc., a biotech manufacturer of sustainable, environmentally-friendly plastics and chemicals, and Inverness Medical Innovations, Inc. Stronger contributions in this sector came from BioMarin Pharmaceutical, Inc., a developer of innovative biopharmaceuticals for serious diseases, Gilead Sciences, Inc., a biopharma company that develops innovative therapeutics in areas of unmet medical need, and Teva Pharmaceutical Industries, Ltd., a manufacturer of generic and branded medications.
Spectra International Opportunities Fund
The six months ended April 30, 2008 were difficult for international markets as fears of a significant global economic slowdown intensified while commodity prices continued to move higher. Despite a continued underweight in financials, the Fund suffered from a sharp correction in Chinese company shares and exposure to poor mortgage debt, as the strong gains of 2007 were pared on concerns of slowing growth and increased inflationary pressure. On a positive note, the Fund continued to benefit from solid performance in Brazil driven by Petrobras (Petróleo Brasileiro S.A.), the world's leader in deepwater oil production, and a new position in Central European Distribution Corp., a spirits distributor.
-4-
The Spectra International Opportunities Fund returned -13.15% for the six months ending April 30, 2008. During the same period, the Fund's benchmarks, the Morgan Stanley Capital International (MSCI) EAFE Indexv and the MSCI All Country World Index ex U.S. Indexvi returned -14.58% and -13.73%, respectively.
In the Information Technology sector, the Fund, at an average weight of 17.89%, was overweight both benchmarks and underperformed both. During this period, the Fund saw substandard performances from Mellanox Technologies, Ltd., a leading supplier of semiconductor-based products, Net 1 U.E.P.S. Technologies, Inc., a provider of transactional technologies for developing countries, and NICE Systems, Ltd., an Israeli technology company specializing in emotion-sensitive software and call monitoring-systems. Stronger contributors included NetEase.com, Inc., a Chinese Internet company focused on search engine technology and massively multiplayer online gaming, Ubisoft Entertainment, S.A., a French computer and video game publisher, and Research in Motion, Ltd.
At an average weight of 10.59%, the Fund was underweight both benchmarks and underperformed both in the Consumer Discretionary sector. Key contributions from Game Group, PLC, Europe's leading retailer of video game products, and New World Department Store China, Ltd., operator of one of the largest networks of department stores in the Pacific Rim, were not enough to offset less prominent returns from Sony Corp., Accor S.A., and TomTom N.V.
Despite an increasingly difficult international market in the sector, the Fund, at an average weight of 11.49%, was underweight and outperformed both benchmarks in Financials. Top performers were Sun Hung Kai Properties Ltd., a major properties developer in Hong Kong, Cathay Financial Holding Co., Ltd., Taiwan's largest financial holding company, and China Construction Bank Corp., one of the top four banks in China. Detractors in this sector included Hong Kong Exchanges & Clearing, Ltd., operators of the Hong Kong stock exchange, ICICI Bank, Ltd., India's largest private sector bank in market capitalization, and Lazard, Ltd., the parent company of Lazard, LLC, an independent, international investment bank.
In the Industrials sector, at an average weight of 11.50%, the Fund was underweight the MSCI EAFE Index and overweight the MSCI World ex, but outperformed both. Notable contributors were JA Solar Holdings Co., Ltd., Suntech Power Holdings Co., Ltd., a manufacturer of photovoltaic cells, and Far Eastern Textile, Ltd., a Taiwanese producer of synthetic fibers and other textiles. In this sector, the Fund saw weaker performances from China Communications Construction Co., Ltd., the largest port construction and design company in China, Chicago Bridge & Iron Company N.V., a multinational engineering and construction company, and Rolls-Royce, PLC, the second-largest British aircraft engine maker in the world.
Spectra Alchemy Fund
Spectra Alchemy Fund returned -13.36% for the six months ended April 30, 2008. The Fund's benchmark, the Russell 3000 Growth Index, returned -9.68% during the same period.
-5-
In the Information Technology sector, the Fund, at an average weight of 22.57%, was underweight the benchmark, and underperformed it. Solid contributions from software manufacturers Oracle Corp., Solera Holdings Inc. and THQ, Inc. were not enough to offset substandard performance from Cognizant Technology Solutions Corp., a provider of information technology, and business process outsourcing services, DealerTrack Holdings, Inc., and eBay, Inc.
At an average weight of 15.12%, in the Health Care sector, the Fund was underweight the benchmark, but outperformed it despite increased turbulence for the sector during this period. Top performers in this sector included: Savient Pharmaceuticals, Inc., a biopharmaceutical company focused on developing products that target unmet medical needs, Pharmion Corp., a global pharmaceutical company, and Celgene Corp. Detractors included pharmaceutical companies Merck & Co., Inc. and Schering-Plough Corp., as well as Northstar Neuroscience, Inc.
In the Industrials sector, the Fund, with an average weight of 12.25%, was underweight, but outperformed the benchmark. Key contributors included Bucyrus International, Inc., a world leader in the manufacture of draglines, drills and shovels for the surface mining industry, Cummins, Inc., a manufacturer of diesel and natural gas engines and related technologies, and JA Solar Holdings Co., Ltd. The Fund did see less impressive performances from Geo Group, Inc., a pioneer in the privatization of correctional facilities throughout the world, Oshkosh Corporation, a manufacturer of trucking and specialty vehicles worldwide, and Chicago Bridge & Iron Company N.V.
The Fund, at an average weight of 18.07%, was overweight the benchmark in the Consumer Discretionary sector, but underperformed. During this period the Fund saw less prominent performances from Bally Technologies, Inc., a manufacturer of gaming machines and computerized monitoring systems, the auction house Sotheby's, and Garmin, Ltd. The Fund did see substantial returns from retailers Urban Outfitters, Inc., GameStop Corp., and Deckers Outdoor Corp.
Spectra Technology Fund
Spectra Technology Fund returned -21.52% for the fiscal period ended April 30, 2008. The Fund's benchmark, the Russell 3000 Growth Index, returned -9.68% during the same period.
The Fund was heavily weighted towards information technology. At an average weight of 74.25% the Fund was significantly overweight to the benchmark and underperformed. Detractors included Novatel Wireless, Inc., a provider of wireless broadband access solutions for pcs and mobile devices, DealerTrack Holdings, Inc., Tessera Technologies, Inc., Intel Corp., and Google, Inc. There were some strong contributors across subsectors, including Corning, Inc., a diversified technology company, Broadcom Corporation, a supplier of integrated circuits, and Mellanox Technologies, Ltd.
It should be noted that the Fund had extremely solid returns in the Industrials sector. At an average weight of 8.94% the Fund was underweight the benchmark in this sector, but outperformed with key contributions from FTI Consulting, Inc., a global business advisory firm, First Solar, Inc., and JA Solar Holdings Co., Ltd.
-6-
In Summary
There may still be continued fall-out in the credit markets; the U.S. economy may remain weak or even contract in the coming quarters; but the long-term investing climate for stocks strikes us as extremely favorable given both the global profit growth, reasonable valuations, and signs that not all areas of the U.S. economy are impacted by the twin blows of the housing crisis and the credit crunch. To reiterate, we firmly believe that years from now, the present could be seen as one of the great "if only" markets, a time when the stocks of quality growth companies could be purchased at deep discounts and deliver returns that most investors dream of but never quite attain.
Respectfully submitted,
 | |||||||
| Daniel C. Chung | |||||||
| Chief Investment Officer | |||||||
i The Dow Jones Industrial Average is an index of common stocks comprised of major industrial companies and assumes reinvestment of dividends. It is frequently used as a general measure of stock market performance.
ii Standard & Poor's 500 Index is an index of the 500 largest and most profitable companies in the United States.
iii The Nasdaq Composite Index is a market value-weighted index that measures all domestic and non-U.S.-based securities listed on the Nasdaq stock market.
iv The Russell 3000 Growth Index is an unmanaged index designed to measure the performance of those Russell 3000 Index companies with higher price-to-book ratios and higher forecasted growth values. The Russell 3000 Index measures the performance of the 3000 largest U.S. companies based on the total market capitalization, which represents 98% of the U.S. Equity Market.
v The Morgan Stanley Capital International (MSCI) Europe, Australasia and Far East (EAFE) Index is an unmanaged market capitalization-weighted index that is designed to measure the performance of publicly trades stocks issued by companies in developed markets, excluding the United States and Canada. Investors can not invest directly in an index. Index performance does not reflect the deduction for fees, expenses or taxes.
vi The MSCI All Country World Index ex U.S. is a free float-adjusted market capitalization index that is designed to measure equity market performance in the global developed and emerging markets. The MSCI All Country World Index includes 48 country indices.
Investors cannot invest directly in any index. Index performance does not reflect the deduction of fees, expenses or taxes.
This report and the financial statements contained herein are submitted for the general information of shareholders of the Fund. This report is not authorized for distribution to prospective investors in the Fund unless preceded or accompanied by an effective prospectus for the Fund. The performance data quoted represents past performance, which is not an indication or guarantee of future results. Standardized
-7-
performance results can be found on the following pages. The investment return and principal value of an investment in a fund will fluctuate so that an investor's shares when redeemed, may be worth more or less than their original cost. Current performance may be lower or higher than the performance quoted. For performance data current to the most recent month-end, visit us at www.spectrafund.com, or call us at (800) 711-6141.
The views and opinions of the Fund's management in this report are as of the date of the Shareholders letter and are subject to change at any time subsequent to this date. There is no guarantee that any of the assumptions that formed the basis for the opinions stated herein are accurate or that they will materialize. Moreover, the information forming the basis for such assumptions is from sources believed to be reliable, however, there is no guarantee that such information is accurate. Any securities mentioned should be considered in the context of the construction of an overall portfolio of securities and therefore reference to them should not be construed as a recommendation or offer to purchase or sell any such security. Inclusion of such securities in a fund and transactions in such securities may be for a variety of reasons, including without limitation, in response to cash flows, inclusion in a benchmark and risk control. Please refer to the Schedule of Investments for each fund which is included in this report for a complete list of fund holdings as of April 30, 2008. Securities mentioned in the Shareholders letter, if not found in the Schedule of Investments, were held by the Fund during the Fund's fiscal year. The Fund did not hold Bear Stearns Companies, Inc.
A Word About Risk
Growth stocks tend to be more volatile than other stocks as the price of growth stocks tends to be higher in relation to their companies' earnings and may be more sensitive to market, political and economic developments. Investing in the stock market involves gains and losses and may not be suitable for all investors. Stocks of small- and mid-sized companies are subject to greater risk than stocks of larger, more established companies owing to such factors as limited liquidity, inexperienced management, and limited financial resources. Investing in foreign securities involves additional risk (including currency risk, risks related to political, social or economic conditions, and risks associated with foreign markets, such as increased volatility, limited liquidity, less stringent regulatory and legal system, and lack of industry and country diversification), and may not be suitable for all investors. Funds that participate in leveraging are subject to the risk that borrowing money to leverage will exceed the returns for securities purchased or that the securities purchased may actually go down in value; thus, the Fund's net asset value can decrease more quickly than if the Fund had not borrowed. The Spectra Green Fund's environmental focus may limit the investment options available to the Fund and may result in lower returns than returns of funds not subject to such investment considerations.
For a more detailed discussion of the risks associated with a Fund, please see the Fund's Prospectus.
Before investing, carefully consider a fund's investment objective, risks, charges, and expenses. For a prospectus containing this and other information about the
-8-
Spectra Funds call us at (800) 711-6141 or visit us at www.spectrafund.com. Read it carefully before investing. Fred Alger & Company, Incorporated, Distributor. Member NYSE, SIPC.
NOT FDIC INSURED. NOT BANK GUARANTEED. MAY LOSE VALUE.
-9-
SPECTRA FUND
Fund Highlights Through April 30, 2008 (Unaudited)

The chart above illustrates the growth in value of a hypothetical $10,000 investment made in Spectra Fund Class N shares and the Russell 3000 Growth Index (an unmanaged index of common stocks) for the ten years ended April 30, 2008. The figures for Spectra Fund and the Russell 3000 Growth Index include reinvestment of dividends.
PERFORMANCE COMPARISON
AVERAGE ANNUAL TOTAL RETURNS
| 1 YEAR | 5 YEARS | 10 YEARS | 20 YEARS | ||||||||||||||||
| AS OF APRIL 30, 2008 | |||||||||||||||||||
| Spectra Fund | 6.29 | % | 16.04 | % | 6.33 | % | 14.36 | % | |||||||||||
| Russell 3000 Growth Index | (0.79 | %) | 9.78 | % | 1.66 | % | 9.90 | % | |||||||||||
| AS OF MARCH 31, 2008 | |||||||||||||||||||
| Spectra Fund | 3.69 | % | 16.32 | % | 5.84 | % | 14.10 | % | |||||||||||
| Russell 3000 Growth Index | (1.46 | %) | 10.25 | % | 1.28 | % | 9.64 | % | |||||||||||
The performance data quoted represents past performance, which is not an indication or a guarantee of future results. The Fund's average annual total returns include changes in share price and reinvestment of dividends and capital gains. The graph and table above do not reflect the deduction of taxes that a shareholder would have paid on fund distributions or on the redemption of fund shares. Investment return and principal will fluctuate and the Fund's shares, when redeemed, may be worth more or less than their original cost. Current performance may be higher or lower than the performance quoted. For performance current to the most recent month end, visit us at www.spectrafund.com or call us at (800) 992-3863.
-10-
GREEN FUND
Fund Highlights Through April 30, 2008 (Unaudited)

The chart above illustrates the growth in value of a hypothetical $10,000 investment made in Green Fund Class N shares and the Russell 3000 Growth Index (an unmanaged index of common stocks) on December 4, 2000 through April 30, 2008. The figures for Green Fund and the Russell 3000 Growth Index include reinvestment of dividends.
PERFORMANCE COMPARISON
AVERAGE ANNUAL TOTAL RETURNS
| 1 YEAR | 5 YEARS | SINCE INCEPTION | |||||||||||||
| AS OF APRIL 30, 2008 | |||||||||||||||
| Green Fund (Inception 12/4/00*) | 5.11 | % | 14.77 | % | (1.09 | %) | |||||||||
| Russell 3000 Growth Index | (0.79 | %) | 9.78 | % | (0.32 | %) | |||||||||
| AS OF MARCH 31, 2008 | |||||||||||||||
| Green Fund (Inception 12/4/00*) | 3.32 | % | 15.29 | % | (1.82 | %) | |||||||||
| Russell 3000 Growth Index | (1.46 | %) | 10.25 | % | (1.01 | %) | |||||||||
* Performance figures prior to 1/12/2007 are those of Alger Green Institutional Fund and performance prior to 10/19/2006 represents the performance of the Alger Socially Responsible Institutional Fund Class I shares, the predecessor fund to the Alger Green Institutional Fund. The predecessor fund followed different investment strategies and had different portfolio managers. As of 1/12/2007 the Alger Green Institutional Fund became the Spectra Green Fund.
The performance data quoted represents past performance, which is not an indication or a guarantee of future results. the fund's average annual total returns include changes in share price and reinvestment of dividends and capital gains. The graph and table above do not reflect the deduction of taxes that a shareholder would have paid on fund distributions or on the redemption of fund shares. Investment return and principal will fluctuate and the fund's shares, when redeemed, may be worth more or less than their original cost. Current performance may be higher or lower than the performance quoted. For performance current to the most recent month end, visit us at www.spectrafund.com or call us at (800) 992-3863.
-11-
ALCHEMY FUND
Fund Highlights Through April 30, 2008 (Unaudited)

The chart above illustrates the growth in value of a hypothetical $10,000 investment made in Alchemy Fund Class N shares and the Russell 3000 Growth Index (an unmanaged index of common stocks) on March 30, 2007, the inception date of the Alchemy Fund, through April 30, 2008. The figures for Alchemy Fund and the Russell 3000 Growth Index include reinvestment of dividends.
PERFORMANCE COMPARISON
TOTAL RETURNS
| 1 YEAR | SINCE INCEPTION | ||||||||||
| AS OF APRIL 30, 2008 | |||||||||||
| Alchemy Fund (Inception 3/30/07) | (1.44 | %) | 4.21 | % | |||||||
| Russell 3000 Growth Index | (0.79 | %) | 3.42 | % | |||||||
| AS OF MARCH 31, 2008 | |||||||||||
| Alchemy Fund (Inception 3/30/07) | (1.08 | %) | (1.08 | %) | |||||||
| Russell 3000 Growth Index | (1.46 | %) | (1.46 | %) | |||||||
The performance data quoted represents past performance, which is not an indication or a guarantee of future results. The Fund's average annual total returns include changes in share price and reinvestment of dividends and capital gains. The graph and table above do not reflect the deduction of taxes that a shareholder would have paid on fund distributions or on the redemption of fund shares. Investment return and principal will fluctuate and the Fund's shares, when redeemed, may be worth more or less than their original cost. Current performance may be higher or lower than the performance quoted. For performance current to the most recent month end, visit us at www.spectrafund.com or call us at (800) 992-3863.
-12-
INTERNATIONAL OPPORTUNITIES FUND
Fund Highlights Through April 30, 2008 (Unaudited)

The chart above illustrates the growth in value of a hypothetical $10,000 investment made in International Opportunities Fund Class N shares and the MSCI EAFE Index and the MSCI All Country World Index ex U.S. Index (both unmanaged indexes of common stocks) on February 28, 2007, the inception date of the International Opportunities Fund, through April 30, 2008. The figures for International Opportunities Fund, MSCI EAFE and the MSCI All Country World Index ex U.S. Index include reinvestment of dividends.
PERFORMANCE COMPARISON
TOTAL RETURNS
| 1 YEAR | SINCE INCEPTION | ||||||||||
| AS OF APRIL 30, 2008 | |||||||||||
| International Opportunities Fund (Inception 2/28/07) | 11.00 | % | 15.01 | % | |||||||
| MSCI EAFE Index | (13.29 | %) | (8.32 | %) | |||||||
| MSCI All Country World Index ex U.S. Index | (11.87 | %) | (7.11 | %) | |||||||
| AS OF MARCH 31, 2008 | |||||||||||
| International Opportunities Fund (Inception 2/28/07) | 7.89 | % | 9.89 | % | |||||||
| MSCI EAFE Index | (16.86 | %) | (14.39 | %) | |||||||
| MSCI All Country World Index ex U.S. Index | (15.43 | %) | (13.07 | %) | |||||||
The performance data quoted represents past performance, which is not an indication or a guarantee of future results. The Fund's average annual total returns include changes in share price and reinvestment of dividends and capital gains. The graph and table above do not reflect the deduction of taxes that a shareholder would have paid on fund distributions or on the redemption of fund shares. Investment return and principal will fluctuate and the Fund's shares, when redeemed, may be worth more or less than their original cost. Current performance may be higher or lower than the performance quoted. For performance current to the most recent month end, visit us at www.spectrafund.com or call us at (800) 992-3863.
-13-
TECHNOLOGY FUND
Fund Highlights Through April 30, 2008 (Unaudited)
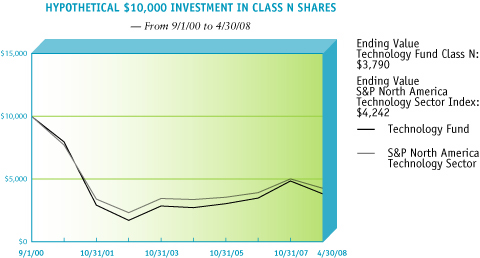
The chart above illustrates the growth in value of a hypothetical $10,000 investment made in Technology Fund Class N shares and the S&P North America Technology Sector Index (an unmanaged index of common stocks) on September 1, 2000, the inception date of the Technology Fund, through April 30, 2008. The figures for Technology Fund and the S&P North America Technology Sector Index include reinvestment of dividends.
PERFORMANCE COMPARISON
TOTAL RETURNS
| 1 YEAR | 5 YEARS | SINCE INCEPTION | |||||||||||||
| AS OF APRIL 30, 2008 | |||||||||||||||
| Technology Fund (Inception 9/1/00*) | (2.31 | %) | 13.41 | % | (11.89 | %) | |||||||||
| S&P North America Technology Sector Index | 1.08 | % | 10.86 | % | (10.58 | %) | |||||||||
| AS OF SEPTEMBER 30, 2007 | |||||||||||||||
| Technology Fund (Inception 9/1/00*) | (8.73 | %) | 14.39 | % | (12.97 | %) | |||||||||
| S&P North America Technology Sector Index | (1.05 | %) | 11.50 | % | (11.51 | %) | |||||||||
* Performance figures prior to December 7, 2007 are those of the SM&R Alger Technology Fund Class A shares, without a front end sales load.
The performance data quoted represents past performance, which is not an indication or a guarantee of future results. The Fund's average annual total returns include changes in share price and reinvestment of dividends and capital gains. The graph and table above do not reflect the deduction of taxes that a shareholder would have paid on fund distributions or on the redemption of fund shares. Investment return and principal will fluctuate and the Fund's shares, when redeemed, may be worth more or less than their original cost. Current performance may be higher or lower than the performance quoted. For performance current to the most recent month end, visit us at www.spectrafund.com or call us at (800) 992-3863.
-14-
PORTFOLIO SUMMARY†
April 30, 2008 (Unaudited)
| SECTOR | SPECTRA FUND | GREEN FUND | ALCHEMY FUND | TECHNOLOGY FUND | |||||||||||||||
| Consumer Discretionary | 7.9 | % | 17.0 | % | 19.5 | % | 3.9 | % | |||||||||||
| Consumer Staples | 6.1 | 4.6 | 4.9 | 0.0 | |||||||||||||||
| Energy | 10.0 | 3.7 | 3.1 | 0.0 | |||||||||||||||
| Financials | 8.2 | 5.5 | 8.7 | 0.0 | |||||||||||||||
| Health Care | 16.2 | 10.0 | 18.5 | 4.2 | |||||||||||||||
| Industrials | 11.5 | 15.6 | 12.5 | 8.9 | |||||||||||||||
| Information Technology | 32.6 | 24.4 | 20.9 | 70.1 | |||||||||||||||
| Materials | 5.2 | 6.8 | 1.1 | 3.2 | |||||||||||||||
| Telecommunication Services | 0.2 | 0.0 | 1.3 | 2.0 | |||||||||||||||
| Utilities | 0.0 | 0.0 | 0.0 | 0.0 | |||||||||||||||
| Cash and Net Other Assets | 2.1 | 12.4 | 9.5 | 7.7 | |||||||||||||||
| 100.0 | % | 100.0 | % | 100.0 | % | 100 | % | ||||||||||||
INTERNATIONAL OPPORTUNITIES FUND
| COUNTRY | VALUE (%) | ||||||
| Australia | 2.7 | % | |||||
| Belgium | 1.0 | ||||||
| Bermuda | 4.5 | ||||||
| Brazil | 6.1 | ||||||
| Britain | 9.7 | ||||||
| Canada | 2.7 | ||||||
| China | 6.0 | ||||||
| Denmark | 0.9 | ||||||
| Finland | 2.0 | ||||||
| France | 5.0 | ||||||
| Germany | 7.6 | ||||||
| Greece | 1.4 | ||||||
| Hong Kong | 3.5 | ||||||
| India | 2.8 | ||||||
| Ireland | 0.5 | ||||||
| COUNTRY | VALUE (%) | ||||||
| Israel | 5.0 | % | |||||
| Italy | 0.6 | ||||||
| Japan | 8.1 | ||||||
| Mexico | 1.8 | ||||||
| Netherlands | 7.8 | ||||||
| Norway | 2.1 | ||||||
| Portugal | 1.2 | ||||||
| South Africa | 1.6 | ||||||
| Sweden | 0.9 | ||||||
| Switzerland | 3.7 | ||||||
| Taiwan | 0.4 | ||||||
| United States | 2.6 | ||||||
| Cash and Net Other Assets | 7.8 | ||||||
| 100.0 | % | ||||||
† Based on net assets for each fund.
-15-
THE SPECTRA FUNDS | SPECTRA FUND
Schedule of Investments (Unaudited) April 30, 2008
| COMMON STOCKS—97.8% | SHARES | VALUE | |||||||||
| ADVERTISING—.1% | |||||||||||
| Focus Media Holding Ltd.* | 7,300 | $ | 269,297 | ||||||||
| AEROSPACE/DEFENSE—5.7% | |||||||||||
| BE Aerospace Inc.* | 58,200 | 2,348,952 | |||||||||
| General Dynamics Corp. | 95,200 | 8,607,984 | |||||||||
| Lockheed Martin Corp. | 49,200 | 5,217,168 | |||||||||
| 16,174,104 | |||||||||||
| AGRICULTURE—3.8% | |||||||||||
| Altria Group Inc. | 68,800 | 1,376,000 | |||||||||
| Philip Morris International Inc.* | 183,600 | 9,369,108 | |||||||||
| 10,745,108 | |||||||||||
| APPAREL—2.4% | |||||||||||
| American Apparel Inc.* | 231,000 | 1,806,420 | |||||||||
| Deckers Outdoor Corp.* | 29,800 | 4,114,486 | |||||||||
| Iconix Brand Group Inc.* | 44,900 | 714,808 | |||||||||
| 6,635,714 | |||||||||||
| AUTO MANUFACTURERS—1.1% | |||||||||||
| Oshkosh Corp. | 76,500 | 3,105,900 | |||||||||
| BIOTECHNOLOGY—1.9% | |||||||||||
| Celgene Corp.* | 25,019 | 1,554,681 | |||||||||
| Genentech Inc.* | 37,300 | 2,543,860 | |||||||||
| Illumina Inc.* | 17,200 | 1,339,708 | |||||||||
| 5,438,249 | |||||||||||
| CHEMICALS—2.1% | |||||||||||
| Celanese Corp. | 62,700 | 2,805,825 | |||||||||
| Mosaic Co.* | 23,300 | 2,854,483 | |||||||||
| Zoltek Cos., Inc.* | 6,500 | 173,355 | |||||||||
| 5,833,663 | |||||||||||
| COMMERCIAL SERVICES—2.4% | |||||||||||
| Aegean Marine Petroleum Network Inc. | 25,800 | 938,346 | |||||||||
| Net 1 UEPS Technologies Inc.* | 126,100 | 2,955,784 | |||||||||
| Quanta Services Inc.* | 35,100 | 931,554 | |||||||||
| Sotheby's | 57,900 | 1,603,830 | |||||||||
| 6,429,514 | |||||||||||
| COMPUTERS—9.9% | |||||||||||
| Apple Inc.* | 37,000 | 6,436,150 | |||||||||
| Brocade Communications Systems Inc. | 136,500 | 977,340 | |||||||||
| Cognizant Technology Solutions Corp., Cl. A* | 120,800 | 3,895,800 | |||||||||
| Dell Inc.* | 32,700 | 609,201 | |||||||||
| EMC Corp.* | 277,200 | 4,268,880 | |||||||||
| Hewlett-Packard Co. | 22,800 | 1,056,780 | |||||||||
| NCR Corp.* | 139,880 | 3,445,244 | |||||||||
| NetApp Inc.* | 136,900 | 3,312,980 | |||||||||
| Research in Motion Ltd.* | 32,200 | 3,916,486 | |||||||||
| 27,918,861 | |||||||||||
-16-
THE SPECTRA FUNDS | SPECTRA FUND
Schedule of Investments (Unaudited) (Continued) April 30, 2008
| COMMON STOCKS—(CONT.) | SHARES | VALUE | |||||||||
| DISTRIBUTION/WHOLESALE—.3% | |||||||||||
| LKQ Corp.* | 32,800 | $ | 713,728 | ||||||||
| DIVERSIFIED FINANCIAL SERVICES—5.8% | |||||||||||
| Affiliated Managers Group Inc.* | 12,800 | 1,271,552 | |||||||||
| AllianceBernstein Holding LP | 24,200 | 1,500,884 | |||||||||
| Bolsa de Mercadorias e Futuros - BM&F | 61,000 | 598,357 | |||||||||
| Bovespa Holding SA | 197,850 | 2,911,106 | |||||||||
| Janus Capital Group Inc. | 42,000 | 1,178,520 | |||||||||
| Lazard Ltd., Cl. A | 70,600 | 2,763,284 | |||||||||
| Merrill Lynch & Co., Inc. | 89,400 | 2,235,000 | |||||||||
| Nymex Holdings Inc. | 42,200 | 3,907,720 | |||||||||
| 16,366,423 | |||||||||||
| ELECTRONICS—.4% | |||||||||||
| Garmin Ltd. | 27,100 | 1,108,390 | |||||||||
| ENERGY-ALTERNATE SOURCES—1.9% | |||||||||||
| First Solar Inc.* | 2,800 | 817,572 | |||||||||
| JA Solar Holdings Co., Ltd.* | 191,080 | 4,587,831 | |||||||||
| 5,405,403 | |||||||||||
| ENGINEERING & CONSTRUCTION—.9% | |||||||||||
| Chicago Bridge & Iron Co., NV# | 67,000 | 2,669,280 | |||||||||
| ENTERTAINMENT—1,1% | |||||||||||
| Bally Technologies Inc.* | 152,400 | 5,134,356 | |||||||||
| HEALTHCARE-PRODUCTS—6.4% | |||||||||||
| Aetna Inc. | 58,200 | 2,537,520 | |||||||||
| Baxter International Inc. | 35,200 | 2,193,664 | |||||||||
| Community Health Systems Inc.* | 40,000 | 1,501,200 | |||||||||
| Hologic Inc.* | 78,600 | 2,294,334 | |||||||||
| Intuitive Surgical Inc.* | 4,200 | 1,214,892 | |||||||||
| Inverness Medical Innovations Inc.* | 169,961 | 6,288,557 | |||||||||
| LifePoint Hospitals Inc.* | 19,000 | 572,280 | |||||||||
| Thoratec Corp.* | 94,600 | 1,512,654 | |||||||||
| 18,115,101 | |||||||||||
| INSURANCE—2.1% | |||||||||||
| ACE Ltd. | 19,300 | 1,163,597 | |||||||||
| MetLife Inc. | 40,200 | 2,446,170 | |||||||||
| PartnerRe Ltd. | 29,900 | 2,212,002 | |||||||||
| 5,821,769 | |||||||||||
| INTERNET—4.6% | |||||||||||
| DealerTrack Holdings Inc.* | 19,650 | 378,066 | |||||||||
| Digital River Inc.* | 41,400 | 1,359,990 | |||||||||
| eBay Inc.* | 91,100 | 2,850,519 | |||||||||
| Google Inc., Cl. A* | 6,600 | 3,790,314 | |||||||||
| Sina Corp.* | 67,200 | 3,104,640 | |||||||||
| Yahoo! Inc.* | 56,600 | 1,551,406 | |||||||||
| 13,034,935 | |||||||||||
-17-
THE SPECTRA FUNDS | SPECTRA FUND
Schedule of Investments (Unaudited) (Continued) April 30, 2008
| COMMON STOCKS—(CONT.) | SHARES | VALUE | |||||||||
| LEISURE TIME—.7% | |||||||||||
| WMS Industries Inc.* | 51,600 | $ | 1,867,404 | ||||||||
| LODGING—1.9% | |||||||||||
| Accor SA | 15,000 | 1,244,741 | |||||||||
| MGM Mirage* | 36,600 | 1,872,090 | |||||||||
| 3,116,831 | |||||||||||
| MACHINERY-DIVERSIFIED—.2% | |||||||||||
| Cummins Inc. | 8,300 | 519,995 | |||||||||
| METAL DIVERSIFIED—.4% | |||||||||||
| Eurasian Natural Resource Corporation* | 43,800 | 1,040,977 | |||||||||
| MINING—2.3% | |||||||||||
| Freeport-McMoRan Copper & Gold Inc. | 39,300 | 4,470,375 | |||||||||
| Thompson Creek Metals Co., Inc.* | 59,100 | 1,278,333 | |||||||||
| Uranium One Inc.* | 133,000 | 614,090 | |||||||||
| 6,362,798 | |||||||||||
| MISCELLANEOUS MANUFACTURING—1.0% | |||||||||||
| ITT Corp. | 42,800 | 2,739,200 | |||||||||
| OIL & GAS—5.5% | |||||||||||
| Cabot Oil & Gas Corp. | 40,600 | 2,312,982 | |||||||||
| ConocoPhillips | 48,000 | 4,135,200 | |||||||||
| Hess Corp. | 20,300 | 2,155,860 | |||||||||
| Nabors Industries Ltd.* | 74,796 | 2,807,842 | |||||||||
| Petrobank Energy Resources Ltd.* | 43,900 | 2,118,500 | |||||||||
| Quicksilver Resources Inc.* | 22,800 | 945,972 | |||||||||
| Range Resources Corp. | 14,000 | 929,320 | |||||||||
| 15,405,676 | |||||||||||
| OIL & GAS SERVICES—4.4% | |||||||||||
| Flotek Industries Inc.* | 24,000 | 449,280 | |||||||||
| National Oilwell Varco Inc.* | 20,000 | 1,369,000 | |||||||||
| Transocean Inc.* | 43,048 | 6,347,858 | |||||||||
| Weatherford International Ltd.* | 53,700 | 4,331,979 | |||||||||
| 12,498,117 | |||||||||||
| PACKAGING & CONTAINERS—.5% | |||||||||||
| Ball Corp. | 28,100 | 1,511,218 | |||||||||
| PHARMACEUTICALS—7.8% | |||||||||||
| Abbott Laboratories | 105,500 | 5,565,125 | |||||||||
| BioMarin Pharmaceutical Inc.* | 61,800 | 2,253,228 | |||||||||
| Cardinal Health Inc. | 61,800 | 3,217,926 | |||||||||
| Cephalon Inc.* | 32,400 | 2,022,084 | |||||||||
| Gilead Sciences Inc.* | 10,700 | 553,832 | |||||||||
| ImClone Systems Inc.* | 52,000 | 2,425,800 | |||||||||
| Merck & Co., Inc. | 51,800 | 1,970,472 | |||||||||
-18-
THE SPECTRA FUNDS | SPECTRA FUND
Schedule of Investments (Unaudited) (Continued) April 30, 2008
| COMMON STOCKS—(CONT.) | SHARES | VALUE | |||||||||
| PHARMACEUTICALS—(CONT.) | |||||||||||
| Mylan Inc. | 142,100 | $ | 1,871,457 | ||||||||
| United Therapeutics Corp.* | 25,600 | 2,163,200 | |||||||||
| 22,043,124 | |||||||||||
| REITS—2.8% | |||||||||||
| CVS Caremark Corp. | 118,300 | 4,775,771 | |||||||||
| Digital Realty Trust Inc. | 19,900 | 771,125 | |||||||||
| Kohl's Corp.* | 14,800 | 722,980 | |||||||||
| Wal-Mart Stores Inc. | 27,300 | 1,582,854 | |||||||||
| 7,852,730 | |||||||||||
| SEMICONDUCTORS—5.3% | |||||||||||
| Broadcom Corp., Cl. A* | 90,700 | 2,354,572 | |||||||||
| Intel Corp. | 275,600 | 6,134,856 | |||||||||
| Lam Research Corp.* | 13,426 | 548,318 | |||||||||
| Mellanox Technologies Ltd.* | 119,300 | 1,785,921 | |||||||||
| MEMC Electronic Materials Inc.* | 26,500 | 1,668,705 | |||||||||
| Tessera Technologies Inc.* | 122,455 | 2,478,489 | |||||||||
| 14,970,861 | |||||||||||
| SOFTWARE—7.7% | |||||||||||
| Intuit Inc.* | 81,900 | 2,208,843 | |||||||||
| Microsoft Corp. | 431,000 | 12,292,120 | |||||||||
| NAVTEQ Corp.* | 12,200 | 905,362 | |||||||||
| Satyam Computer Services Ltd.# | 104,800 | 2,691,264 | |||||||||
| Solera Holdings Inc.* | 88,500 | 2,284,185 | |||||||||
| Tele Atlas NV* | 10,700 | 473,111 | |||||||||
| TomTom NV* | 17,300 | 603,330 | |||||||||
| 21,458,215 | |||||||||||
| TELECOMMUNICATIONS—3.5% | |||||||||||
| America Movil SAB de CV# | 8,300 | 481,068 | |||||||||
| Atheros Communications Inc.* | 112,100 | 2,984,101 | |||||||||
| Nice Systems Ltd.*# | 103,300 | 3,289,072 | |||||||||
| Polycom Inc.* | 15,000 | 336,000 | |||||||||
| SAVVIS Inc.* | 68,200 | 999,130 | |||||||||
| Sonus Networks Inc.* | 471,700 | 1,891,517 | |||||||||
| 9,980,888 | |||||||||||
| TOYS/GAMES/HOBBIES—1.1% | |||||||||||
| Nintendo Co., Ltd.# | 46,900 | 3,203,031 | |||||||||
| TOTAL COMMON STOCKS (Cost $288,290,865) | 275,490,860 | ||||||||||
-19-
THE SPECTRA FUNDS | SPECTRA FUND
Schedule of Investments (Unaudited) (Continued) April 30, 2008
| PURCHASED OPTIONS—.1% | CONTRACTS | VALUE | |||||||||
| PUT OPTIONS—.1% | |||||||||||
| Research in Motion/May/125 (Cost $433,896) | 550 | $ | 352,000 | ||||||||
| SHORT-TERM INVESTMENTS—1.5% | PRINCIPAL AMOUNT | ||||||||||
| TIME DEPOSITS | |||||||||||
| Branch Bank & Trust Grand Cayman, 1.84%, 5/1/08 (Cost $4,135,402) | $ | 4,135,402 | 4,135,402 | ||||||||
| Total Investments (Cost $292,860,163)(a) | 99.4 | % | 279,978,262 | ||||||||
| Other Assets in Excess of Liabilities | 0.6 | 1,689,663 | |||||||||
| NET ASSETS | 100.0 | % | $ | 281,667,925 | |||||||
* Non-income producing securities.
# American Depositary Trust
(a) At April 30, 2008, the net unrealized depreciation on investments, based on cost for federal income tax purposes of $292,860,163 amounted to $12,881,901 which consisted of aggregate gross unrealized appreciation of $15,341,783 and aggregate gross unrealized depreciation of $28,223,684.
See Notes to Financial Statements.
-20-
THE SPECTRA FUNDS | GREEN FUND
Schedule of Investments (Unaudited) April 30, 2008
| COMMON STOCKS—87.6% | SHARES | VALUE | |||||||||
| ADVERTISING—.5% | |||||||||||
| Focus Media Holding Ltd.* | 4,300 | $ | 158,627 | ||||||||
| AEROSPACE/DEFENSE—2.5% | |||||||||||
| Boeing Co. | 5,170 | 438,726 | |||||||||
| General Dynamics Corp. | 3,655 | 330,485 | |||||||||
| 769,211 | |||||||||||
| APPAREL—6.4% | |||||||||||
| American Apparel Inc.* | 48,700 | 380,834 | |||||||||
| Deckers Outdoor Corp.* | 7,490 | 1,034,144 | |||||||||
| Iconix Brand Group Inc.* | 22,680 | 361,066 | |||||||||
| Nike Inc., Cl. B | 2,185 | 145,958 | |||||||||
| 1,922,002 | |||||||||||
| AUTO PARTS & EQUIPMENT—1.9% | |||||||||||
| BorgWarner Inc. | 6,910 | 339,626 | |||||||||
| Tenneco Inc.* | 8,890 | 227,406 | |||||||||
| 567,032 | |||||||||||
| BANKS—.8% | |||||||||||
| PNC Financial Services Group Inc. | 3,430 | 237,871 | |||||||||
| BEVERAGES—1.7% | |||||||||||
| Coca-Cola Co. | 3,505 | 206,339 | |||||||||
| Hansen Natural Corp.* | 8,920 | 315,679 | |||||||||
| 522,018 | |||||||||||
| BIOTECHNOLOGY—.9% | |||||||||||
| Genentech Inc.* | 4,165 | 284,053 | |||||||||
| CHEMICALS—5% | |||||||||||
| Bayer AG# | 3,405 | 289,767 | |||||||||
| Celanese Corp. | 3,225 | 144,319 | |||||||||
| Metabolix Inc.* | 25,610 | 281,966 | |||||||||
| Praxair Inc. | 4,735 | 432,353 | |||||||||
| Zoltek Cos., Inc.* | 13,400 | 357,378 | |||||||||
| 1,505,783 | |||||||||||
| COMMERCIAL SERVICES—3% | |||||||||||
| Aegean Marine Petroleum Network Inc. | 14,385 | 523,182 | |||||||||
| Valassis Communications Inc.* | 12,605 | 178,991 | |||||||||
| Visa Inc., Cl. A* | 2,500 | 208,625 | |||||||||
| 910,798 | |||||||||||
| COMPUTERS—5.9% | |||||||||||
| Apple Inc.* | 4,210 | 732,329 | |||||||||
| EMC Corp.* | 27,350 | 421,190 | |||||||||
| Hewlett-Packard Co. | 7,215 | 334,415 | |||||||||
| International Business Machines Corp. | 2,315 | 279,421 | |||||||||
| 1,767,355 | |||||||||||
-21-
THE SPECTRA FUNDS | GREEN FUND
Schedule of Investments (Unaudited) (Continued) April 30, 2008
| COMMON STOCKS—(CONT.) | SHARES | VALUE | |||||||||
| COSMETICS/PERSONAL CARE—.8% | |||||||||||
| Procter & Gamble Co. | 3,689 | $ | 247,347 | ||||||||
| DISTRIBUTION/WHOLESALE—1.0% | |||||||||||
| LKQ Corp.* | 13,510 | 293,978 | |||||||||
| DIVERSIFIED FINANCIAL SERVICES—4.3% | |||||||||||
| AllianceBernstein Holding LP | 2,373 | 147,173 | |||||||||
| Goldman Sachs Group Inc. | 2,270 | 434,410 | |||||||||
| IntercontinentalExchange Inc.* | 1,820 | 282,373 | |||||||||
| Nymex Holdings Inc. | 2,955 | 273,633 | |||||||||
| T Rowe Price Group Inc. | 2,510 | 146,986 | |||||||||
| 1,284,575 | |||||||||||
| ELECTRONICS—1.1% | |||||||||||
| Garmin Ltd. | 7,810 | 319,429 | |||||||||
| ENERGY-ALTERNATE SOURCES—5.1% | |||||||||||
| Covanta Holding Corp.* | 10,440 | 278,017 | |||||||||
| First Solar Inc.* | 1,670 | 487,623 | |||||||||
| JA Solar Holdings Co., Ltd.* | 23,795 | 571,318 | |||||||||
| Yingli Green Energy Holding Co., Ltd.*# | 9,780 | 215,453 | |||||||||
| 1,552,411 | |||||||||||
| ENVIRONMENTAL CONTROL—.5% | |||||||||||
| Darling International Inc.* | 10,245 | 156,441 | |||||||||
| FOOD—1.0% | |||||||||||
| Whole Foods Market Inc. | 9,475 | 309,264 | |||||||||
| HEALTHCARE-PRODUCTS—3.2% | |||||||||||
| Hologic Inc.* | 6,450 | 188,276 | |||||||||
| Intuitive Surgical Inc.* | 405 | 117,150 | |||||||||
| Inverness Medical Innovations Inc.* | 4,610 | 170,570 | |||||||||
| Johnson & Johnson | 4,895 | 328,406 | |||||||||
| Zimmer Holdings Inc.* | 2,170 | 160,927 | |||||||||
| 965,329 | |||||||||||
| HOME FURNISHINGS—1.3% | |||||||||||
| Sony Corp.# | 8,645 | 395,854 | |||||||||
| INSURANCE—.4% | |||||||||||
| American International Group Inc. | 2,690 | 124,278 | |||||||||
| INTERNET—5.1% | |||||||||||
| DealerTrack Holdings Inc.* | 9,610 | 184,896 | |||||||||
| eBay Inc.* | 14,880 | 465,595 | |||||||||
| Google Inc., Cl. A* | 700 | 402,003 | |||||||||
| GSI Commerce Inc.* | 11,905 | 165,718 | |||||||||
| Yahoo! Inc.* | 11,538 | 316,257 | |||||||||
| 1,534,469 | |||||||||||
| LODGING—.9% | |||||||||||
| Accor SA | 3,415 | 283,386 | |||||||||
-22-
THE SPECTRA FUNDS | GREEN FUND
Schedule of Investments (Unaudited) (Continued) April 30, 2008
| COMMON STOCKS—(CONT.) | SHARES | VALUE | |||||||||
| MACHINERY-DIVERSIFIED—3.7% | |||||||||||
| Cummins Inc. | 7,905 | $ | 495,248 | ||||||||
| Deere & Co. | 7,350 | 617,915 | |||||||||
| 1,113,163 | |||||||||||
| MISCELLANEOUS MANUFACTURING—1.4% | |||||||||||
| General Electric Co. | 12,535 | 409,895 | |||||||||
| OIL & GAS—2.2% | |||||||||||
| Bill Barrett Corp.* | 4,070 | 209,320 | |||||||||
| BP PLC# | 4,495 | 327,191 | |||||||||
| Petrobank Energy & Resources Ltd.* | 2,710 | 130,777 | |||||||||
| 667,288 | |||||||||||
| OIL & GAS SERVICES—4.2% | |||||||||||
| Cameron International Corp.* | 5,855 | 288,242 | |||||||||
| Flotek Industries Inc* | 43,730 | 818,626 | |||||||||
| Schlumberger Ltd. | 1,500 | 150,825 | |||||||||
| 1,257,693 | |||||||||||
| PHARMACEUTICALS—4.9% | |||||||||||
| Abbott Laboratories | 4,215 | 222,341 | |||||||||
| BioMarin Pharmaceutical Inc.* | 6,505 | 237,172 | |||||||||
| Gilead Sciences Inc.* | 3,520 | 182,195 | |||||||||
| Pfizer Inc. | 4,090 | 82,250 | |||||||||
| Schering-Plough Corp. | 16,850 | 310,209 | |||||||||
| Teva Pharmaceutical Industries Ltd.# | 6,225 | 291,205 | |||||||||
| United Therapeutics Corp.* | 1,935 | 163,508 | |||||||||
| 1,488,880 | |||||||||||
| RETAIL—3.3% | |||||||||||
| Chipotle Mexican Grill Inc.* | 2,635 | 258,572 | |||||||||
| Darden Restaurants Inc. | 2,525 | 89,840 | |||||||||
| Lowe's Cos., Inc. | 7,000 | 176,330 | |||||||||
| Starbucks Corp.* | 19,625 | 318,514 | |||||||||
| Wal-Mart Stores Inc. | 2,540 | 147,269 | |||||||||
| 990,525 | |||||||||||
| SEMICONDUCTORS—3.1% | |||||||||||
| Cree Inc.* | 6,520 | 169,520 | |||||||||
| Intel Corp. | 17,645 | 392,778 | |||||||||
| Lam Research Corp.* | 2,085 | 85,151 | |||||||||
| MEMC Electronic Materials Inc.* | 4,680 | 294,700 | |||||||||
| 942,149 | |||||||||||
| SOFTWARE—8.8% | |||||||||||
| Adobe Systems Inc.* | 9,335 | 348,102 | |||||||||
| Electronic Arts Inc.* | 7,310 | 376,246 | |||||||||
| Microsoft Corp. | 30,105 | 858,595 | |||||||||
| NAVTEQ Corp.* | 5,295 | 392,942 | |||||||||
| Oracle Corp.* | 17,720 | 369,462 | |||||||||
| Solera Holdings Inc.* | 11,860 | 306,106 | |||||||||
| 2,651,453 | |||||||||||
-23-
THE SPECTRA FUNDS | GREEN FUND
Schedule of Investments (Unaudited) (Continued) April 30, 2008
| COMMON STOCKS—(CONT.) | SHARES | VALUE | |||||||||
| TELECOMMUNICATIONS—1.5 | |||||||||||
| Cisco Systems Inc.* | 18,255 | $ | 468,058 | ||||||||
| TRANSPORTATION—1.2% | |||||||||||
| FedEx Corp. | 1,125 | 107,854 | |||||||||
| United Parcel Service Inc., Cl. A | 3,365 | 243,660 | |||||||||
| 351,514 | |||||||||||
| TOTAL COMMON STOCKS (Cost $25,749,281) | 26,452,129 | ||||||||||
| SHORT-TERM INVESTMENTS—11.6% | PRINCIPAL AMOUNT | ||||||||||
| TIME DEPOSITS | |||||||||||
| Branch Bank & Trust Grand Cayman, 1.84%, 5/1/08 | $ | 1,100,000 | 1,100,000 | ||||||||
| Wachovia London, 1.84%, 5/1/08 | 1,100,000 | 1,100,000 | |||||||||
| Wells Fargo Grand Cayman, 1.84%, 5/1/08 | 1,100,000 | 1,100,000 | |||||||||
| Citibank London, 1.84%, 5/1/08 | 214,570 | 214,570 | |||||||||
| TOTAL TIME DEPOSITS (Cost $3,514,570) | 3,514,570 | ||||||||||
| Total Investments (Cost $29,263,851)(a) | 99.2 | % | 29,966,699 | ||||||||
| Other Assets in Excess of Liabilities | 0.8 | 231,602 | |||||||||
| NET ASSETS | 100.0 | % | $ | 30,198,301 | |||||||
* Non-income producing securities.
# American Depositary Trust
(a) At April 30, 2008, the net unrealized appreciation on investments, based on cost for federal income tax purposes of $29,263,851 amounted to $702,848 which consisted of aggregate gross unrealized appreciation of $2,254,732 and aggregate gross unrealized depreciation of $1,551,884.
See Notes to Financial Statements.
-24-
THE SPECTRA FUNDS | ALCHEMY FUND
Schedule of Investments (Unaudited) April 30, 2008
| COMMON STOCKS—90.5% | SHARES | VALUE | |||||||||
| AGRICULTURE—1.7% | |||||||||||
| Altria Group Inc. | 728 | $ | 14,560 | ||||||||
| Philip Morris International Inc.* | 477 | 24,341 | |||||||||
| 38,901 | |||||||||||
| APPAREL—4.0% | |||||||||||
| Deckers Outdoor Corp.* | 454 | 62,684 | |||||||||
| Iconix Brand Group Inc.* | 1,938 | 30,853 | |||||||||
| 93,537 | |||||||||||
| AUTO MANUFACTURERS—1.3% | |||||||||||
| Oshkosh Corp. | 733 | 29,760 | |||||||||
| BEVERAGES—1.8% | |||||||||||
| Central European Distribution Corp.* | 435 | 26,500 | |||||||||
| Hansen Natural Corp.* | 446 | 15,784 | |||||||||
| 42,284 | |||||||||||
| BIOTECHNOLOGY—4.1% | |||||||||||
| Celgene Corp.* | 948 | 58,909 | |||||||||
| Genentech Inc.* | 534 | 36,419 | |||||||||
| 95,328 | |||||||||||
| COMMERCIAL SERVICES—2.6% | |||||||||||
| Geo Group Inc.* | 1,028 | 27,191 | |||||||||
| Net 1 UEPS Technologies Inc.* | 828 | 19,408 | |||||||||
| Sotheby's | 524 | 14,515 | |||||||||
| 61,114 | |||||||||||
| COMPUTERS—5.8% | |||||||||||
| Apple Inc.* | 203 | 35,312 | |||||||||
| Cognizant Technology Solutions Corp., Cl. A* | 671 | 21,640 | |||||||||
| Hewlett-Packard Co. | 780 | 36,153 | |||||||||
| Limelight Networks Inc.* | 1,565 | 4,351 | |||||||||
| NetApp Inc.* | 226 | 5,469 | |||||||||
| Research In Motion Ltd.* | 298 | 36,246 | |||||||||
| 139,171 | |||||||||||
| DISTRIBUTION/WHOLESALE—1.0% | |||||||||||
| Fossil Inc.* | 628 | 22,476 | |||||||||
| DIVERSIFIED FINANCIAL SERVICES—6.5% | |||||||||||
| CME Group Inc. | 35 | 16,011 | |||||||||
| IntercontinentalExchange Inc.* | 315 | 48,872 | |||||||||
| Nymex Holdings Inc. | 312 | 28,891 | |||||||||
| NYSE Euronext | 600 | 39,660 | |||||||||
| Lazard Ltd., Cl. A | 554 | 21,683 | |||||||||
| 155,117 | |||||||||||
| ELECTRONICS—1.8% | |||||||||||
| Garmin Ltd. | 1,045 | 42,741 | |||||||||
-25-
THE SPECTRA FUNDS | ALCHEMY FUND
Schedule of Investments (Unaudited) (Continued) April 30, 2008
| COMMON STOCKS—(CONT.) | SHARES | VALUE | |||||||||
| ENERGY-ALTERNATE SOURCES—1.3% | |||||||||||
| JA Solar Holdings Co., Ltd.* | 1,317 | $ | 31,621 | ||||||||
| ENGINEERING & CONSTRUCTION—2.1% | |||||||||||
| Chicago Bridge & Iron Co., NV# | 1,217 | 48,485 | |||||||||
| ENTERTAINMENT—1.6% | |||||||||||
| Bally Technologies Inc.* | 1,105 | 37,227 | |||||||||
| FOOD—1.4% | |||||||||||
| Whole Foods Market Inc. | 1,039 | 33,913 | |||||||||
| HEALTHCARE-PRODUCTS—.5% | |||||||||||
| Hologic Inc.* | 327 | 9,545 | |||||||||
| Inverness Medical Innovations Inc.* | 59 | 2,183 | |||||||||
| 11,728 | |||||||||||
| HOUSEHOLD PRODUCTS/WARES—1.0% | |||||||||||
| Tupperware Brands Corp. | 599 | 23,601 | |||||||||
| INSURANCE—1.2% | |||||||||||
| First Mercury Financial Corp.* | 528 | 8,342 | |||||||||
| PartnerRe Ltd. | 263 | 19,457 | |||||||||
| 27,799 | |||||||||||
| INTERNET—1.5% | |||||||||||
| DealerTrack Holdings Inc.* | 1,807 | 34,767 | |||||||||
| LEISURE TIME—1.7% | |||||||||||
| WMS Industries Inc.* | 1,075 | 38,904 | |||||||||
| LODGING—1.8% | |||||||||||
| Wynn Resorts Ltd. | 402 | 42,347 | |||||||||
| MACHINERY-CONSTRUCTION & MINING—3.7% | |||||||||||
| Bucyrus International Inc., Cl. A | 692 | 87,143 | |||||||||
| MACHINERY-DIVERSIFIED—2.2% | |||||||||||
| Cummins Inc. | 830 | 52,000 | |||||||||
| MISCELLANEOUS MANUFACTURING—.7% | |||||||||||
| Clarcor Inc. | 378 | 15,861 | |||||||||
| OIL & GAS—1.7% | |||||||||||
| Concho Resources Inc.* | 516 | 14,226 | |||||||||
| Nabors Industries Ltd.* | 651 | 24,439 | |||||||||
| 38,665 | |||||||||||
| OIL & GAS SERVICES—1.5% | |||||||||||
| Cameron International Corp.* | 402 | 19,790 | |||||||||
| National Oilwell Varco Inc.* | 221 | 15,127 | |||||||||
| 34,917 | |||||||||||
-26-
THE SPECTRA FUNDS | ALCHEMY FUND
Schedule of Investments (Unaudited) (Continued) April 30, 2008
| COMMON STOCKS—(CONT.) | SHARES | VALUE | |||||||||
| PACKAGING & CONTAINERS—1.1% | |||||||||||
| Owens-Illinois Inc.* | 280 | $ | 15,442 | ||||||||
| Silgan Holdings Inc. | 176 | 9,377 | |||||||||
| 24,819 | |||||||||||
| PHARMACEUTICALS—13.9% | |||||||||||
| Barr Pharmaceuticals Inc.* | 185 | 9,293 | |||||||||
| BioMarin Pharmaceutical Inc.* | 895 | 32,632 | |||||||||
| ImClone Systems Inc.* | 1,786 | 83,317 | |||||||||
| Merck & Co., Inc. | 766 | 29,139 | |||||||||
| Mylan Inc. | 3,220 | 42,407 | |||||||||
| Pozen Inc.* | 1,571 | 20,784 | |||||||||
| Schering-Plough Corp. | 4,212 | 77,543 | |||||||||
| United Therapeutics Corp.* | 361 | 30,505 | |||||||||
| 325,620 | |||||||||||
| RETAIL—6.0% | |||||||||||
| Abercrombie & Fitch Co., Cl. A | 345 | 25,637 | |||||||||
| Guess Inc. | 599 | 22,930 | |||||||||
| Starbucks Corp.* | 1,033 | 16,766 | |||||||||
| Urban Outfitters Inc.* | 2,216 | 75,898 | |||||||||
| 141,231 | |||||||||||
| SAVINGS & LOANS—.9% | |||||||||||
| People's United Financial Inc. | 1,201 | 20,381 | |||||||||
| SEMICONDUCTORS—3.1% | |||||||||||
| Lam Research Corp.* | 489 | 19,971 | |||||||||
| MEMC Electronic Materials Inc.* | 261 | 16,435 | |||||||||
| ON Semiconductor Corp.* | 1,788 | 13,356 | |||||||||
| Varian Semiconductor Equipment Associates Inc.* | 613 | 22,454 | |||||||||
| 72,216 | |||||||||||
| SOFTWARE—7.3% | |||||||||||
| Autodesk Inc.* | 993 | 37,734 | |||||||||
| Oracle Corp.* | 3,794 | 79,105 | |||||||||
| Synchronoss Technologies Inc.* | 461 | 9,621 | |||||||||
| THQ Inc.* | 2,072 | 44,091 | |||||||||
| 170,551 | |||||||||||
| TELECOMMUNICATIONS—3.7% | |||||||||||
| Atheros Communications Inc.* | 998 | 26,567 | |||||||||
| Polycom Inc.* | 930 | 20,832 | |||||||||
| SBA Communications Corp.* | 922 | 29,817 | |||||||||
| Sonus Networks Inc.* | 2,414 | 9,680 | |||||||||
| 86,896 | |||||||||||
| TOTAL COMMON STOCKS (Cost $2,077,428) | 2,121,121 | ||||||||||
-27-
THE SPECTRA FUNDS | ALCHEMY FUND
Schedule of Investments (Unaudited) (Continued) April 30, 2008
| SHORT-TERM INVESTMENTS—8.9% | PRINCIPAL AMOUNT | VALUE | |||||||||
| TIME DEPOSITS | |||||||||||
| Brown Brothers Harriman Cayman, 1.84%, 5/1/08 | $ | 24,072 | $ | 24,072 | |||||||
| Wachovia London, 1.84%, 5/1/08 | 91,700 | 91,700 | |||||||||
| Branch Bank & Trust Grand Cayman, 1.84%, 5/1/08 | 91,700 | 91,700 | |||||||||
| TOTAL TIME DEPOSITS (Cost $207,472) | 207,472 | ||||||||||
| Total Investments (Cost $2,284,900)(a) | 99.4 | % | 2,328,593 | ||||||||
| Other Assets in Excess of Liabilities | 0.6 | 14,737 | |||||||||
| NET ASSETS | 100.0 | % | $ | 2,343,330 | |||||||
* Non-income producing securities.
# American Depositary Trust
(a) At April 30, 2008, the net unrealized appreciation on investments, based on cost for federal income tax purposes of $2,284,900 amounted to $43,692 which consisted of aggregate gross unrealized appreciation of $236,090 and aggregate gross unrealized depreciation of $192,398.
See Notes to Financial Statements.
-28-
THE SPECTRA FUNDS | INTERNATIONAL OPPORTUNITIES FUND
Schedule of Investments (Unaudited) April 30, 2008
| COMMON STOCKS—92.2% | SHARES | VALUE | |||||||||
| UNITED STATES—2.1% | |||||||||||
| BEVERAGES—2.1% | |||||||||||
| Central European Distribution Corp.* (Cost $78,145) | 1,278 | $ | 77,856 | ||||||||
| AUSTRALIA—2.6% | |||||||||||
| BANKS—.5% | |||||||||||
| Commonwealth Bank of Australia | 406 | 17,159 | |||||||||
| COMMERCIAL SERVICES—.1% | |||||||||||
| Brambles Ltd. | 601 | 5,041 | |||||||||
| FOOD RETAIL—.2% | |||||||||||
| Woolworths Ltd. | 260 | 7,032 | |||||||||
| MINING—1.8% | |||||||||||
| BHP Billiton Ltd. | 877 | 34,934 | |||||||||
| Fortescue Metals Group Ltd.* | 1,157 | 8,079 | |||||||||
| Rio Tinto Ltd. | 192 | 24,621 | |||||||||
| 67,634 | |||||||||||
| TOTAL AUSTRALIA (Cost $95,002) | 96,866 | ||||||||||
| BELGIUM—0.9% | |||||||||||
| BANKS—.1% | |||||||||||
| Dexia SA* | 205 | 5,707 | |||||||||
| BEVERAGES—.3 | |||||||||||
| InBev NV | 113 | 9,289 | |||||||||
| TELECOMMUNICATIONS—.5% | |||||||||||
| Belgacom SA | 398 | 18,376 | |||||||||
| TOTAL BELGIUM (Cost $33,585) | 33,372 | ||||||||||
| BERMUDA—2.5% | |||||||||||
| DIVERSIFIED FINANCIAL SERVICES—2.2% | |||||||||||
| Lazard Ltd., Cl A | 2,022 | 79,141 | |||||||||
| INSURANCE—.3% | |||||||||||
| Max Capital Group Ltd. | 559 | 13,086 | |||||||||
| TOTAL BERMUDA (Cost $109,945) | 92,227 | ||||||||||
| BRAZIL—6.3% | |||||||||||
| DIVERSIFIED FINANCIAL SERVICES—.4% | |||||||||||
| Bovespa Holding SA | 962 | 14,155 | |||||||||
-29-
THE SPECTRA FUNDS | INTERNATIONAL OPPORTUNITIES FUND
Schedule of Investments (Unaudited) (Continued) April 30, 2008
| COMMON STOCKS—(CONT.) | SHARES | VALUE | |||||||||
| FOOD—.5% | |||||||||||
| Cosan Ltd., Cl A* | 1,208 | $ | 16,018 | ||||||||
| MINING—3.0% | |||||||||||
| Companhia Vale do Rio Doce# | 2,843 | 111,104 | |||||||||
| OIL & GAS—2.4% | |||||||||||
| Petroleo Brasileiro SA# | 731 | 88,758 | |||||||||
| TOTAL BRAZIL (Cost $137,274) | 230,035 | ||||||||||
| BRITAIN—10.7% | |||||||||||
| AEROSPACE/DEFENSE—.7% | |||||||||||
| Rolls-Royce Group PLC, Cl. B | 333,132 | 660 | |||||||||
| Rolls-Royce Group PLC* | 2,840 | 24,693 | |||||||||
| 25,353 | |||||||||||
| BEVERAGES—.2% | |||||||||||
| Diageo PLC | 336 | 6,874 | |||||||||
| ELECTRIC—.7% | |||||||||||
| National Grid PLC | 1,903 | 26,402 | |||||||||
| FOOD SERVICES—.4% | |||||||||||
| Compass Group PLC | 2,447 | 16,526 | |||||||||
| HEALTH PRODUCTS—1.9% | |||||||||||
| Smith & Nephew PLC | 5,398 | 70,026 | |||||||||
| HOUSEHOLD PRODUCTS/WARES—.5% | |||||||||||
| Reckitt Benckiser Group PLC | 308 | 17,922 | |||||||||
| MEDIA—.3% | |||||||||||
| British Sky Broadcasting Group PLC | 557 | 6,012 | |||||||||
| WPP Group PLC | 316 | 3,871 | |||||||||
| 9,883 | |||||||||||
| MINING—.4% | |||||||||||
| Kazakhmys PLC | 491 | 15,384 | |||||||||
| OIL & GAS—2.6% | |||||||||||
| BG Group PLC | 655 | 15,969 | |||||||||
| BP PLC | 6,443 | 77,968 | |||||||||
| 93,937 | |||||||||||
| PHARMACEUTICALS—1.4% | |||||||||||
| Shire PLC | 2,718 | 50,413 | |||||||||
| REITS—.8% | |||||||||||
| Land Securities Group PLC | 929 | 28,335 | |||||||||
| RETAIL—.6% | |||||||||||
| Game Group PLC* | 4,196 | 22,791 | |||||||||
-30-
THE SPECTRA FUNDS | INTERNATIONAL OPPORTUNITIES FUND
Schedule of Investments (Unaudited) (Continued) April 30, 2008
| COMMON STOCKS—(CONT.) | SHARES | VALUE | |||||||||
| TOBACCO—.2% | |||||||||||
| Imperial Tobacco Group, PLC | 142 | $ | 6,803 | ||||||||
| TOTAL BRITAIN (Cost $364,163) | 390,649 | ||||||||||
| CANADA—2.7% | |||||||||||
| COMMUNICATIONS EQUIPMENT—1.5% | |||||||||||
| Research In Motion Ltd.* | 448 | 54,490 | |||||||||
| MINING—1.2% | |||||||||||
| Thompson Creek Metals Co., Inc.* | 794 | 17,174 | |||||||||
| Uranium One Inc.* | 5,498 | 25,385 | |||||||||
| 42,559 | |||||||||||
| TOTAL CANADA (Cost $113,457) | 97,049 | ||||||||||
| CHINA—6.2% | |||||||||||
| AUTO PARTS & EQUIPMENT—.3% | |||||||||||
| Minth Group Ltd. | 8,891 | 9,969 | |||||||||
| BANKS—.8% | |||||||||||
| China Construction Bank Corp. | 11,322 | 10,211 | |||||||||
| China Merchants Bank Co., Ltd | 2,236 | 9,352 | |||||||||
| Industrial & Commercial Bank of China | 12,826 | 10,169 | |||||||||
| 29,732 | |||||||||||
| COAL—.2% | |||||||||||
| Hidili Industry International Development Ltd* | 5,578 | 8,516 | |||||||||
| ENERGY-ALTERNATE SOURCES—.8% | |||||||||||
| JA Solar Holdings Co Ltd*# | 1,173 | 28,164 | |||||||||
| ENGINEERING & CONSTRUCTION—.5% | |||||||||||
| China Communications Construction Co., Ltd* | 7,074 | 16,862 | |||||||||
| INTERNET—2.4% | |||||||||||
| Ctrip.com International Ltd.# | 344 | 21,349 | |||||||||
| Netease.com*# | 1,034 | 23,079 | |||||||||
| Sina Corp* | 976 | 45,091 | |||||||||
| 89,519 | |||||||||||
| RETAIL—.5% | |||||||||||
| China Nepstar Chain Drugstore Ltd.# | 1,417 | 16,735 | |||||||||
| SEMICONDUCTORS—.4% | |||||||||||
| Spreadtrum Communications Inc*# | 1,772 | 15,399 | |||||||||
| TRANSPORTATION—.3% | |||||||||||
| China Shipping Development Co., Ltd. | 3,048 | 10,226 | |||||||||
| TOTAL CHINA (Cost $203,206) | 225,122 | ||||||||||
-31-
THE SPECTRA FUNDS | INTERNATIONAL OPPORTUNITIES FUND
Schedule of Investments (Unaudited) (Continued) April 30, 2008
| COMMON STOCKS—(CONT.) | SHARES | VALUE | |||||||||
| DENMARK—.9% | |||||||||||
| ENERGY-ALTERNATE SOURCES—.9% | |||||||||||
| Vestas Wind Systems A/S* (Cost $30,969) | 309 | $ | 33,779 | ||||||||
| FINLAND—2.0% | |||||||||||
| DIVERSIFIED FINANCIAL SERVICES—.3% | |||||||||||
| Sampo Oyj | 326 | 9,212 | |||||||||
| TELECOMMUNICATIONS—1.7% | |||||||||||
| Nokia OYJ* | 2,056 | 63,123 | |||||||||
| TOTAL FINLAND (Cost $85,060) | 72,335 | ||||||||||
| FRANCE—5.3% | |||||||||||
| METAL FABRICATE/HARDWARE—1.7% | |||||||||||
| Vallourec* | 228 | 62,209 | |||||||||
| LODGING—1.1% | |||||||||||
| Accor SA | 481 | 39,915 | |||||||||
| SEMICONDUCTORS—.4% | |||||||||||
| STMicroelectronics NV | 1,357 | 15,909 | |||||||||
| SOFTWARE—1.2% | |||||||||||
| UBISOFT Entertainment* | 455 | 45,762 | |||||||||
| WATER—.9% | |||||||||||
| Veolia Environnement* | 455 | 32,968 | |||||||||
| TOTAL FRANCE (Cost $193,073) | 196,763 | ||||||||||
| GERMANY—7.9% | |||||||||||
| AUTO MANUFACTURERS—1.0% | |||||||||||
| Porsche Automobile Holding SE | 206 | 37,993 | |||||||||
| CHEMICALS—3.6% | |||||||||||
| BASF SE | 162 | 23,116 | |||||||||
| Bayer AG | 1,175 | 100,249 | |||||||||
| Linde AG | 56 | 8,204 | |||||||||
| 131,569 | |||||||||||
| COSMETICS—.2% | |||||||||||
| Beiersdorf AG | 88 | 7,493 | |||||||||
| DIVERSIFIED FINANCIAL SERVICES—.6% | |||||||||||
| Deutsche Boerse AG* | 146 | 21,417 | |||||||||
| ELECTRIC—.9% | |||||||||||
| RWE AG | 293 | 33,729 | |||||||||
-32-
THE SPECTRA FUNDS | INTERNATIONAL OPPORTUNITIES FUND
Schedule of Investments (Unaudited) (Continued) April 30, 2008
| COMMON STOCKS—(CONT.) | SHARES | VALUE | |||||||||
| HOUSEHOLD PRODUCTS/WARES—.2% | |||||||||||
| Henkel AG & Co., KGAA | 150 | $ | 6,039 | ||||||||
| IRON/STEEL—.3% | |||||||||||
| ThyssenKrupp AG | 162 | 10,147 | |||||||||
| PHARMACEUTICALS—1.1% | |||||||||||
| Merck KGaA | 267 | 37,915 | |||||||||
| TOTAL GERMANY (Cost $255,528) | 286,302 | ||||||||||
| GREECE—1.4% | |||||||||||
| BEVERAGES—.7% | |||||||||||
| Coca Cola Hellenic Bottling Co., SA* | 593 | 26,682 | |||||||||
| COMMERCIAL SERVICES—.7% | |||||||||||
| Aegean Marine Petroleum Network Inc. | 715 | 26,005 | |||||||||
| TOTAL GREECE (Cost $54,224) | 52,687 | ||||||||||
| HONG KONG—3.7% | |||||||||||
| APPAREL—.4% | |||||||||||
| Esprit Holdings Ltd. | 1,327 | 16,344 | |||||||||
| CHEMICALS—.2% | |||||||||||
| Sinofert Holdings Ltd. | 7,521 | 5,741 | |||||||||
| COMPUTERS—.5% | |||||||||||
| Lenovo Group Ltd. | 24,268 | 18,556 | |||||||||
| DIVERSIFIED FINANCIAL SERVICES—1.1% | |||||||||||
| Hong Kong Exchanges and Clearing Ltd. | 1,956 | 40,000 | |||||||||
| GAS—.2% | |||||||||||
| Hong Kong & China Gas Co. | 2,958 | 8,652 | |||||||||
| MISCELLANEOUS MANUFACTURING—.3% | |||||||||||
| Peace Mark Holdings Ltd. | 10,401 | 12,090 | |||||||||
| TELECOMMUNICATIONS—.5% | |||||||||||
| China Mobile Ltd. | 985 | 16,934 | |||||||||
| OIL & GAS—.5% | |||||||||||
| CNOOC Ltd. | 9,483 | 16,741 | |||||||||
| TOTAL HONG KONG (Cost $97,838) | 135,058 | ||||||||||
| INDIA—2.8% | |||||||||||
| BANKS—.4% | |||||||||||
| ICICI Bank Ltd. | 302 | 13,466 | |||||||||
-33-
THE SPECTRA FUNDS | INTERNATIONAL OPPORTUNITIES FUND
Schedule of Investments (Unaudited) (Continued) April 30, 2008
| COMMON STOCKS—(CONT.) | SHARES | VALUE | |||||||||
| IT SERVICES—2.4% | |||||||||||
| Infosys Technologies Ltd.# | 717 | $ | 31,326 | ||||||||
| Satyam Computer Services Ltd.# | 2,200 | 56,496 | |||||||||
| 87,822 | |||||||||||
| TOTAL INDIA (Cost $100,909) | 101,288 | ||||||||||
| IRELAND—.5% | |||||||||||
| HEALTHCARE-SERVICES—.5% | |||||||||||
| Icon Plc*# (Cost $17,748) | 277 | 19,944 | |||||||||
| ISRAEL—5.0% | |||||||||||
| COMMUNICATIONS EQUIPMENT—1.7% | |||||||||||
| Nice Systems Ltd.* | 1,896 | 60,369 | |||||||||
| ELECTRONIC EQUIPMENT—1.4% | |||||||||||
| Mellanox Technologies Ltd.* | 3,412 | 51,078 | |||||||||
| PHARMACEUTICALS—1.9% | |||||||||||
| Teva Pharmaceutical Industries Ltd.# | 1,502 | 70,264 | |||||||||
| TOTAL ISRAEL (Cost $185,446) | 181,711 | ||||||||||
| ITALY—.6% | |||||||||||
| AUTO MANUFACTURERS—.6% | |||||||||||
| Fiat S.P.A. (Cost $27,462) | 956 | 21,418 | |||||||||
| JAPAN—8.1% | |||||||||||
| BANKS—.4% | |||||||||||
| Resona Holdings Inc. | 8 | 15,310 | |||||||||
| CONSUMER ELECTRONICS—2.2% | |||||||||||
| Sony Corp. | 1,736 | 79,400 | |||||||||
| DISTRIBUTION/WHOLESALE—.5% | |||||||||||
| ITOCHU Corp. | 1,606 | 16,673 | |||||||||
| ELECTRICAL COMPUTER & EQUIPMENT—.6% | |||||||||||
| Mitsubishi Electric Corp. | 2,134 | 21,685 | |||||||||
| IRON/STEEL—.2% | |||||||||||
| Sumitomo Metal Industries Ltd. | 1,989 | 8,317 | |||||||||
| MACHINERY-CONSTRUCTION & MINING—.4% | |||||||||||
| Komatsu Ltd. | 552 | 16,638 | |||||||||
-34-
THE SPECTRA FUNDS | INTERNATIONAL OPPORTUNITIES FUND
Schedule of Investments (Unaudited) (Continued) April 30, 2008
| COMMON STOCKS—(CONT.) | SHARES | VALUE | |||||||||
| PHARMACEUTICALS—.6% | |||||||||||
| Astellas Pharma Inc. | 179 | $ | 7,279 | ||||||||
| Takeda Pharmaceutical Co., Ltd. | 277 | 14,551 | |||||||||
| 21,830 | |||||||||||
| TELECOMMUNICATIONS—.7% | |||||||||||
| Softbank Corp.* | 1,230 | 24,715 | |||||||||
| TOYS/GAMES/HOBBIES—2.5% | |||||||||||
| Nintendo Co Ltd. | 168 | 91,788 | |||||||||
| TOTAL JAPAN (Cost $266,772) | 296,356 | ||||||||||
| MEXICO—1.7% | |||||||||||
| TELECOMMUNICATIONS—1.7% | |||||||||||
| America Movil SAB de CV# (Cost $46,926) | 1,107 | 64,162 | |||||||||
| NETHERLANDS—7.9% | |||||||||||
| BEVERAGES—1.5% | |||||||||||
| Heineken NV | 924 | 53,788 | |||||||||
| CONSUMER ELECTRONICS—.9% | |||||||||||
| TomTom NV* | 905 | 31,561 | |||||||||
| ELECTRONICS—1.1% | |||||||||||
| Koninklijke Philips Electronics NV | 1,112 | 41,810 | |||||||||
| ENGINEERING & CONSTRUCTION—1.7% | |||||||||||
| Chicago Bridge & Iron Co., NV# | 1,557 | 62,031 | |||||||||
| FOOD RETAIL—.5% | |||||||||||
| Koninklijke Ahold, NV | 1,148 | 17,015 | |||||||||
| MEDIA—.4% | |||||||||||
| Reed Elsevier NV | 834 | 15,802 | |||||||||
| SEMICONDUCTORS—1.0% | |||||||||||
| ASML Holding NV | 1,223 | 34,911 | |||||||||
| SOFTWARE—.5% | |||||||||||
| Tele Atlas NV* | 428 | 18,924 | |||||||||
| TELECOMMUNICATIONS—.3% | |||||||||||
| Koninklijke KPN NV | 643 | 11,798 | |||||||||
| TOTAL NETHERLANDS (Cost $294,338) | 287,640 | ||||||||||
-35-
THE SPECTRA FUNDS | INTERNATIONAL OPPORTUNITIES FUND
Schedule of Investments (Unaudited) (Continued) April 30, 2008
| COMMON STOCKS—(CONT.) | SHARES | VALUE | |||||||||
| NORWAY—3.1% | |||||||||||
| METAL FABRICATE/HARDWARE—2.1% | |||||||||||
| Norsk Hydro ASA | 5,218 | $ | 77,402 | ||||||||
| OIL & GAS—1.0% | |||||||||||
| Acergy SA | 1,508 | 37,257 | |||||||||
| TOTAL NORWAY (Cost $104,231) | 114,659 | ||||||||||
| PORTUGAL—1.2% | |||||||||||
| TELECOMMUNICATIONS—1.2% | |||||||||||
| Portugal Telecom SGPS SA (Cost $45,873) | 3,627 | 43,057 | |||||||||
| SOUTH AFRICA—1.6% | |||||||||||
| COMMERCIAL SERVICES—1.6% | |||||||||||
| Net 1 UEPS Technologies Inc* (Cost $64,647) | 2,463 | 57,733 | |||||||||
| SWEDEN—.9% | |||||||||||
| HAND/MACHINE TOOLS—.3% | |||||||||||
| Sandvik AB | 704 | 10,835 | |||||||||
| MACHINERY-CONSTRUCTION & MINING—.6% | |||||||||||
| Atlas Copco AB | 1,370 | 22,057 | |||||||||
| TOTAL SWEDEN (Cost $34,189) | 32,892 | ||||||||||
| SWITZERLAND—3.2% | |||||||||||
| DIVERSIFIED FINANCIAL SERVICES—1.3% | |||||||||||
| Credit Suisse Group AG | 62 | 3,435 | |||||||||
| UBS AG* | 1,261 | 42,374 | |||||||||
| UBS AG Rts.* | 1,261 | 2,119 | |||||||||
| 47,928 | |||||||||||
| ENGINEERING & CONSTRUCTION—.2% | |||||||||||
| ABB Ltd. | 259 | 7,918 | |||||||||
| PHARMACEUTICALS—1.7% | |||||||||||
| Novartis AG | 1,208 | 61,122 | |||||||||
| TOTAL SWITZERLAND (Cost $150,772) | 116,968 | ||||||||||
| TAIWAN—.4% | |||||||||||
| INSURANCE—.3% | |||||||||||
| Cathay Financial Holding Co., Ltd. | 3,453 | 9,696 | |||||||||
-36-
THE SPECTRA FUNDS | INTERNATIONAL OPPORTUNITIES FUND
Schedule of Investments (Unaudited) (Continued) April 30, 2008
| COMMON STOCKS—(CONT.) | SHARES | VALUE | |||||||||
| TELECOMMUNICATIONS—.1% | |||||||||||
| Chunghwa Telecom Co., Ltd. | 2,044 | $ | 5,270 | ||||||||
| TOTAL TAIWAN (Cost $13,845) | 14,966 | ||||||||||
| TOTAL COMMON STOCKS (Cost $3,204,627) | 3,372,894 | ||||||||||
| SHORT-TERM INVESTMENTS—7.6% | PRINCIPAL AMOUNT | ||||||||||
| TIME DEPOSITS | |||||||||||
| Brown Brothers Harriman Cayman, 1.84%, 5/1/08 | $ | 75,998 | 75,998 | ||||||||
| Branch Bank & Trust Grand Cayman, 1.84%, 5/1/08 | 100,000 | 100,000 | |||||||||
| Wachovia London, 1.84%, 5/1/08 | 100,000 | 100,000 | |||||||||
| TOTAL TIME DEPOSITS (Cost $275,998) | 275,998 | ||||||||||
| Total Investments (Cost $3,480,625) (a) | 99.8 | % | 3,648,892 | ||||||||
| Other Assets in Excess of Liabilities | 0.2 | 9,077 | |||||||||
| NET ASSETS | 100.0 | % | $ | 3,657,969 | |||||||
* Non-income producing securities.
# American Depositary Receipts.
(a) At April 30, 2008, the net unrealized appreciation on investments, based on cost for federal income tax purposes of $3,480,625 amounted to $168,267 which consisted of aggregate gross unrealized appreciation of $488,956 and aggregate gross unrealized depreciation of $320,689.
See Notes to Financial Statements.
-37-
THE SPECTRA FUNDS | TECHNOLOGY FUND
Schedule of Investments (Unaudited) April 30, 2008
| COMMON STOCKS—92.3%% | SHARES | VALUE | |||||||||
| CHEMICALS—4.2% | |||||||||||
| Metabolix Inc.* | 2,635 | $ | 29,011 | ||||||||
| COMMERCIAL SERVICES—5.2% | |||||||||||
| FTI Consulting Inc.* | 115 | 7,360 | |||||||||
| Monster Worldwide Inc.* | 505 | 12,287 | |||||||||
| TeleTech Holdings Inc.* | 710 | 16,280 | |||||||||
| 35,927 | |||||||||||
| COMPUTERS—11.4% | |||||||||||
| Apple Inc.* | 160 | 27,831 | |||||||||
| Cognizant Technology Solutions Corp., Cl. A* | 570 | 18,383 | |||||||||
| EMC Corp.* | 405 | 6,237 | |||||||||
| NetApp Inc.* | 295 | 7,139 | |||||||||
| Research In Motion Ltd.* | 150 | 18,245 | |||||||||
| 77,835 | |||||||||||
| ENERGY-ALTERNATE SOURCES—3.7% | |||||||||||
| First Solar Inc.* | 50 | 14,600 | |||||||||
| JA Solar Holdings Co., Ltd.*# | 435 | 10,444 | |||||||||
| 25,044 | |||||||||||
| HOME FURNISHINGS—2.6% | |||||||||||
| Sony Corp.# | 385 | 17,629 | |||||||||
| INTERNET—13.5% | |||||||||||
| eBay Inc.* | 675 | 21,121 | |||||||||
| Google Inc., Cl. A* | 25 | 14,357 | |||||||||
| Netease.com* | 420 | 9,374 | |||||||||
| Shutterfly Inc.* | 545 | 8,911 | |||||||||
| TIBCO Software Inc.* | 2,740 | 21,016 | |||||||||
| Vocus Inc.* | 365 | 10,143 | |||||||||
| Yahoo! Inc.* | 270 | 7,401 | |||||||||
| 92,323 | |||||||||||
| OIL & GAS SERVICES—3.2% | |||||||||||
| Flotek Industries Inc.* | 1,185 | 22,183 | |||||||||
| SEMICONDUCTORS—20.6% | |||||||||||
| Broadcom Corp., Cl. A* | 640 | 16,614 | |||||||||
| Cree Inc.* | 230 | 5,980 | |||||||||
| Intersil Corp. | 450 | 12,024 | |||||||||
| Lam Research Corp.* | 490 | 20,012 | |||||||||
| Mellanox Technologies Ltd.* | 820 | 12,275 | |||||||||
| MEMC Electronic Materials Inc.* | 305 | 19,206 | |||||||||
| Microsemi Corp.* | 280 | 6,860 | |||||||||
| NVIDIA Corp.* | 640 | 13,152 | |||||||||
| Spreadtrum Communications Inc.*# | 1,235 | 10,732 | |||||||||
| Tessera Technologies Inc.* | 370 | 7,489 | |||||||||
| Varian Semiconductor Equipment Associates Inc.* | 455 | 16,667 | |||||||||
| 141,011 | |||||||||||
-38-
THE SPECTRA FUNDS | TECHNOLOGY FUND
Schedule of Investments (Unaudited) (Continued) April 30, 2008
| COMMON STOCKS—(CONT.) | SHARES | VALUE | |||||||||
| SOFTWARE—14.5% | |||||||||||
| Adobe Systems Inc.* | 220 | $ | 8,203 | ||||||||
| Microsoft Corp. | 850 | 24,242 | |||||||||
| Omniture Inc.* | 841 | 19,192 | |||||||||
| Oracle Corp.* | 640 | 13,344 | |||||||||
| Satyam Computer Services Ltd.# | 840 | 21,571 | |||||||||
| Taleo Corp.* | 645 | 12,578 | |||||||||
| 99,130 | |||||||||||
| TELECOMMUNICATIONS—10.6% | |||||||||||
| American Tower Corp., Cl. A* | 315 | 13,676 | |||||||||
| Atheros Communications Inc.* | 830 | 22,095 | |||||||||
| Cisco Systems Inc.* | 815 | 20,897 | |||||||||
| Corning Inc. | 245 | 6,544 | |||||||||
| Foundry Networks Inc.* | 750 | 9,548 | |||||||||
| 72,760 | |||||||||||
| TOYS/GAMES/HOBBIES—2.8% | |||||||||||
| Nintendo Co., Ltd.# | 285 | 19,464 | |||||||||
| TOTAL COMMON STOCKS (Cost $613,577) | 632,317 | ||||||||||
| SHORT-TERM INVESTMENTS—4.2% | PRINCIPAL AMOUNT | ||||||||||
| TIME DEPOSITS | |||||||||||
| Brown Brothers Harriman Cayman, 1.84%, 5/1/08 (Cost $28,769) | $ | 28,769 | 28,769 | ||||||||
| Total Investments (Cost $642,346)(a) | 96.5 | % | 661,086 | ||||||||
| Other Assets in Excess of Liabilities | 3.5 | 24,106 | |||||||||
| NET ASSETS | 100.0 | % | $ | 685,192 | |||||||
* Non-income producing securities.
# American Depositary Trust
(a) At April 30, 2008, the net unrealized appreciation on investments, based on cost for federal income tax purposes of $642,346 amounted to $18,740 which consisted of aggregate gross unrealized appreciation of $65,478 and aggregate gross unrealized depreciation of $46,738.
See Notes to Financial Statements.
-39-
THE SPECTRA FUNDS
Statements of Assets and Liabilities (Unaudited) April 30, 2008
| Spectra Fund | Green Fund | Alchemy Fund | |||||||||||||
| ASSETS: | |||||||||||||||
| Investments in securities, at value (Identified cost*) see accompanying schedules of investments | $ | 279,978,262 | $ | 29,966,699 | $ | 2,328,593 | |||||||||
| Cash** | 1,587 | 2,137 | — | ||||||||||||
| Receivable for investment securities sold | 9,547,385 | 135,179 | 72,844 | ||||||||||||
| Receivable foreign currency contracts | 1,547 | — | — | ||||||||||||
| Receivable for shares of beneficial interest sold | 590,382 | 518,398 | — | ||||||||||||
| Dividends and interest receivable | 103,929 | 17,240 | 590 | ||||||||||||
| Receivable from Investment Manager | 55,387 | 18,276 | 3,072 | ||||||||||||
| Prepaid Expenses | 58,759 | 13,301 | 10,471 | ||||||||||||
| Total Assets | 290,337,238 | 30,671,230 | 2,415,570 | ||||||||||||
| LIABILITIES: | |||||||||||||||
| Payable for investment securities purchased | 7,907,307 | 390,662 | 64,153 | ||||||||||||
| Payable for shares of beneficial interest redeemed | 574,656 | 65,841 | — | ||||||||||||
| Accrued advisory fees | 8,953 | 583 | 55 | ||||||||||||
| Accrued transfer agent fees | 45,033 | 2,552 | 144 | ||||||||||||
| Accrued distribution fees | 1,930 | 205 | 16 | ||||||||||||
| Accrued administrative fees | 309 | 33 | 3 | ||||||||||||
| Accrued expenses | 131,125 | 13,053 | 7,869 | ||||||||||||
| Total Liabilites | 8,669,313 | 472,929 | 72,240 | ||||||||||||
| NET ASSETS | $ | 281,667,925 | $ | 30,198,301 | $ | 2,343,330 | |||||||||
| Net Assets Consist of: | |||||||||||||||
| Paid in capital | $ | 443,335,247 | $ | 29,885,842 | $ | 2,377,576 | |||||||||
| Undistributed net investment income (accumulated loss) | (1,130,572 | ) | (25,727 | ) | (8,345 | ) | |||||||||
| Undistributed net realized gain (accumulated loss) | (147,659,297 | ) | (364,663 | ) | (69,593 | ) | |||||||||
| Net unrealized appreciation (depreciation) of investments | (12,877,453 | ) | 702,849 | 43,692 | |||||||||||
| NET ASSETS | $ | 281,667,925 | $ | 30,198,301 | $ | 2,343,330 | |||||||||
| Net Asset Value Per Share | $ | 10.48 | $ | 6.88 | $ | 9.99 | |||||||||
| SHARES OF BENEFICIIAL INTEREST OUTSTANDING—NOTE 5 | 26,877,077 | 4,389,033 | 234,480 | ||||||||||||
| *Identified Cost | $ | 292,860,163 | $ | 29,263,851 | $ | 2,284,900 | |||||||||
** Restricted cash of $1,587 and $2,137 relating to initial margin requirements on options
for the Spectra Fund and Spectra Green Fund, respectively.
† Represents foreign cash with a cost of $49,910.
See Notes to Financial Statements.
-40-
| International Opportunities Fund | Technology Fund | ||||||||||
| ASSETS: | |||||||||||
| Investments in securities, at value (Identified cost*) see accompanying schedules of investments | $ | 3,648,892 | $ | 661,086 | |||||||
| Cash** | 49,989 | † | — | ||||||||
| Receivable for investment securities sold | 19,922 | — | |||||||||
| Receivable foreign currency contracts | — | — | |||||||||
| Receivable for shares of beneficial interest sold | 559 | — | |||||||||
| Dividends and interest receivable | 9,885 | — | |||||||||
| Receivable from Investment Manager | 6,184 | 6,845 | |||||||||
| Prepaid Expenses | 10,334 | 21,172 | |||||||||
| Total Assets | 3,745,765 | 689,103 | |||||||||
| LIABILITIES: | |||||||||||
| Payable for investment securities purchased | 19,571 | — | |||||||||
| Payable for shares of beneficial interest redeemed | 52,287 | — | |||||||||
| Accrued advisory fees | 101 | 15 | |||||||||
| Accrued transfer agent fees | 665 | 180 | |||||||||
| Accrued distribution fees | 25 | 5 | |||||||||
| Accrued administrative fees | 4 | — | |||||||||
| Accrued expenses | 15,143 | 3,711 | |||||||||
| Total Liabilites | 87,796 | 3,911 | |||||||||
| NET ASSETS | $ | 3,657,969 | $ | 685,192 | |||||||
| Net Assets Consist of: | |||||||||||
| Paid in capital | $ | 3,347,113 | $ | 663,198 | |||||||
| Undistributed net investment income (accumulated loss) | 13,407 | (3,468 | ) | ||||||||
| Undistributed net realized gain (accumulated loss) | 129,259 | 6,722 | |||||||||
| Net unrealized appreciation (depreciation) of investments | 168,190 | 18,740 | |||||||||
| NET ASSETS | $ | 3,657,969 | $ | 685,192 | |||||||
| Net Asset Value Per Share | $ | 11.67 | $ | 2.87 | |||||||
| SHARES OF BENEFICIIAL INTEREST OUTSTANDING—NOTE 5 | 313,579 | 238,509 | |||||||||
| *Identified Cost | $ | 3,480,625 | $ | 642,346 | |||||||
-41-
THE SPECTRA FUNDS
Statements of Operations (Unaudited)
For the six months ended April 30, 2008
| Spectra Fund | Green Fund | Alchemy Fund | |||||||||||||
| INVESTMENT INCOME: | |||||||||||||||
| Dividends (net of foreign withholding taxes*) | $ | 924,058 | $ | 67,356 | $ | 5,480 | |||||||||
| Interest and other income | 211,819 | 39,558 | 523 | ||||||||||||
| Total Income | 1,135,877 | 106,914 | 6,003 | ||||||||||||
| EXPENSES: | |||||||||||||||
| Investment advisory fees—Note 2(a) | 2,209,253 | 75,516 | 10,168 | ||||||||||||
| Distribution fees—Note 2(e) | 378,297 | 26,590 | 2,991 | ||||||||||||
| Administrative fees—Note 2(a) | 60,528 | 4,254 | 478 | ||||||||||||
| Interest expense | 7,375 | — | — | ||||||||||||
| Custodian fees | 53,131 | 6,404 | 463 | ||||||||||||
| Transfer agent fees and expenses—Note 2(b) | 96,326 | 7,341 | 267 | ||||||||||||
| Professional fees | 122,788 | 14,957 | 2,753 | ||||||||||||
| Printing fees | 57,700 | 4,177 | 746 | ||||||||||||
| Trustees fees | 6,412 | 6,483 | 6,490 | ||||||||||||
| Registration fees | 41,814 | 9,310 | 5,223 | ||||||||||||
| Miscellaneous | 22,839 | 6,320 | 552 | ||||||||||||
| Total Expenses | 3,056,463 | 161,352 | 30,131 | ||||||||||||
| Less, expense reimbursements—Note 2(a) | (790,014 | ) | (28,711 | ) | (15,783 | ) | |||||||||
| Net Expenses | 2,266,449 | 132,641 | 14,348 | ||||||||||||
| NET INVESTMENT INCOME (LOSS) | (1,130,572 | ) | (25,727 | ) | (8,345 | ) | |||||||||
| REALIZED AND UNREALIZED GAIN (LOSS) ON INVESTMENTS, OPTIONS AND FOREIGN CURRENCY TRANSACTIONS: | |||||||||||||||
| Net realized gain (loss) on investments | 3,426,383 | (371,871 | ) | (67,114 | ) | ||||||||||
| Net realized gain (loss) on foreign currency transactions | 533,983 | (510 | ) | — | |||||||||||
| Net realized gain on options written | 122,498 | 24,036 | — | ||||||||||||
| Net change in unrealized appreciation (depreciation) on investments and foreign currency translations | (48,332,551 | ) | (1,526,211 | ) | (283,096 | ) | |||||||||
| Net change in unrealized appreciation (depreciation) on options | (81,895 | ) | 1,548 | — | |||||||||||
| Net realized and unrealized loss on investments, options and foreign currency | (44,331,582 | ) | (1,873,008 | ) | (350,210 | ) | |||||||||
| NET DECREASE IN NET ASSETS RESULTING FROM OPERATIONS | $ | (45,462,154 | ) | $ | (1,898,735 | ) | $ | (358,555 | ) | ||||||
| *Foreign withholding taxes | $ | 3,332 | $ | 1,310 | $ | 7 | |||||||||
** Commenced operations December 8, 2007.
See Notes to Financial Statements.
-42-
| International Opportunities Fund | Technology Fund** | ||||||||||
| INVESTMENT INCOME: | |||||||||||
| Dividends (net of foreign withholding taxes*) | $ | 33,094 | $ | 198 | |||||||
| Interest and other income | 8,974 | 70 | |||||||||
| Total Income | 42,068 | 268 | |||||||||
| EXPENSES: | |||||||||||
| Investment advisory fees—Note 2(a) | 17,402 | 2,161 | |||||||||
| Distribution fees—Note 2(e) | 4,351 | 667 | |||||||||
| Administrative fees—Note 2(a) | 696 | 107 | |||||||||
| Interest expense | — | — | |||||||||
| Custodian fees | 27,864 | 3,431 | |||||||||
| Transfer agent fees and expenses—Note 2(b) | 1,478 | 2,595 | |||||||||
| Professional fees | 3,171 | 1,581 | |||||||||
| Printing fees | 1,073 | 429 | |||||||||
| Trustees fees | 6,452 | 6,412 | |||||||||
| Registration fees | 11,709 | 247 | |||||||||
| Miscellaneous | 4,760 | 375 | |||||||||
| Total Expenses | 78,956 | 18,005 | |||||||||
| Less, expense reimbursements—Note 2(a) | (50,404 | ) | (14,269 | ) | |||||||
| Net Expenses | 28,552 | 3,736 | |||||||||
| NET INVESTMENT INCOME (LOSS) | 13,516 | (3,468 | ) | ||||||||
| REALIZED AND UNREALIZED GAIN (LOSS) ON INVESTMENTS, OPTIONS AND FOREIGN CURRENCY TRANSACTIONS: | |||||||||||
| Net realized gain (loss) on investments | 113,392 | 4,141 | |||||||||
| Net realized gain (loss) on foreign currency transactions | 15,904 | — | |||||||||
| Net realized gain on options written | — | — | |||||||||
| Net change in unrealized appreciation (depreciation) on investments and foreign currency translations | (625,153 | ) | (122,887 | ) | |||||||
| Net change in unrealized appreciation (depreciation) on options | — | — | |||||||||
| Net realized and unrealized loss on investments, options and foreign currency | (495,857 | ) | (118,746 | ) | |||||||
| NET DECREASE IN NET ASSETS RESULTING FROM OPERATIONS | $ | (482,341 | ) | $ | (122,214 | ) | |||||
| *Foreign withholding taxes | $ | 4,553 | $ | — | |||||||
-43-
SM&R Alger Technology Fund*
Statement of Operations
For the period September 1, 2007 through December 7, 2007
| INVESTMENT INCOME: | |||||||
| Dividends | $ | 606 | |||||
| Interest from affiliated money market fund | 468 | ||||||
| Total Income | 1,074 | ||||||
| EXPENSES: | |||||||
| Investment advisory fees | 3,723 | ||||||
| Administrative service fees | 664 | ||||||
| Professional fees | 1,541 | ||||||
| Custody and transaction fees | 4,169 | ||||||
| Directors' fees and expenses | 1,539 | ||||||
| Compliance expenses | 20 | ||||||
| Qualification fees: | |||||||
| Class A | 1,736 | ||||||
| Class B | 1,685 | ||||||
| Distribution fees: | |||||||
| Class A | 735 | ||||||
| Class B | 664 | ||||||
| Insurance expenses | 135 | ||||||
| Total Expenses | 16,611 | ||||||
| Less, expense reimbursement | (11,229 | ) | |||||
| Net Expenses | 5,382 | ||||||
| NET INVESTMENT LOSS | (4,308 | ) | |||||
| REALIZED AND UNREALIZED GAIN (LOSS) ON INVESTMENTS | |||||||
| Net realized gain on investments | 142,236 | ||||||
| Change in unrealized appreciation of investments | (39,778 | ) | |||||
| Net gain on investments | 102,458 | ||||||
| NET INCREASE IN NET ASSETS RESULTING FROM OPERATIONS | $ | 98,150 | |||||
* See Note 1 in the Notes to Financial Statements.
-44-
[This page intentionally left blank]
THE SPECTRA FUNDS
Statements of Changes in Net Assets
| Spectra Fund | Green Fund(*) | ||||||||||||||||||
| For the Six Months Ended April 30, 2008 (Unaudited) | For the Year Ended October 31 2007 | For the Six Months Ended April 30, 2008 (Unaudited) | For the Year Ended October 31 2007 | ||||||||||||||||
| Net investment income (loss) | $ | (1,130,572 | ) | $ | (1,791,748 | ) | $ | (25,727 | ) | $ | (30,217 | ) | |||||||
| Net realized gain (loss) in investments, options and foreign currency transactions | 4,082,864 | 65,042,050 | (348,345 | ) | 496,350 | ||||||||||||||
| Net change in unrealized appreciation (depreciation) on investments, options and foreign currency translations | (48,414,446 | ) | 20,485,980 | (1,524,663 | ) | 1,941,675 | |||||||||||||
| Net increase (decrease) in net assets resulting from operations | (45,462,154 | ) | 83,736,282 | (1,898,735 | ) | 2,407,808 | |||||||||||||
| Dividends and distributions to shareholders from: | |||||||||||||||||||
| Net investment income | |||||||||||||||||||
| Class N | — | — | — | — | |||||||||||||||
| Net realized gains | |||||||||||||||||||
| Class I | — | — | — | (299,356 | ) | ||||||||||||||
| Class R | — | — | — | (135,264 | ) | ||||||||||||||
| Class N | — | — | (389,174 | ) | |||||||||||||||
| Total dividends and distributions to shareholders | — | — | (389,174 | ) | (434,620 | ) | |||||||||||||
| Increase (decrease) from shares of beneficial interest transactions: | |||||||||||||||||||
| Class N | (2,699,927 | ) | 54,706,528 | 18,742,404 | 11,543,562 | ||||||||||||||
| Class I | — | — | (2,297,645 | ) | |||||||||||||||
| Class R | — | — | (673,802 | ) | |||||||||||||||
| Net increase (decrease) from shares of beneficial interest transactions—Note 5 | (2,699,927 | ) | 54,706,528 | 18,742,404 | 8,572,115 | ||||||||||||||
| Total increase (decrease) | (48,162,081 | ) | 138,442,810 | 16,454,495 | 10,545,303 | ||||||||||||||
| Net Assets: | |||||||||||||||||||
| Beginning of period | 329,830,006 | 191,387,196 | 13,743,806 | 3,198,503 | |||||||||||||||
| END OF PERIOD | $ | 281,667,925 | $ | 329,830,006 | $ | 30,198,301 | $ | 13,743,806 | |||||||||||
| Undistributed net investment income (accumulated loss) | $ | (1,130,572 | ) | $ | — | $ | (25,727 | ) | $ | — | |||||||||
* Commenced operations January 12, 2007. Total increase in net assets from November 1, 2006 to
January 11, 2007 are that of its predecessor fund, Alger Green Institutional Fund. See Note 1 in
the Notes to Financial Statements.
** Commenced operations April 2, 2007.
*** Commenced operations March 1, 2007
See Notes to Financial Statements.
-46-
| Alchemy Fund(**) | International Opportunities Fund(***) | ||||||||||||||||||
| For the Six Months Ended April 30, 2008 (Unaudited) | For the Period Ended October 31 2007 | For the Six Months Ended April 30, 2008 (Unaudited) | For the Period Ended October 31 2007 | ||||||||||||||||
| Net investment income (loss) | $ | (8,345 | ) | $ | (8,952 | ) | $ | 13,516 | $ | 10,894 | |||||||||
| Net realized gain (loss) in investments, options and foreign currency transactions | (67,114 | ) | 120,291 | 129,296 | 24,029 | ||||||||||||||
| Net change in unrealized appreciation (depreciation) on investments, options and foreign currency translations | (283,096 | ) | 326,788 | (625,153 | ) | 793,343 | |||||||||||||
| Net increase (decrease) in net assets resulting from operations | (358,555 | ) | 438,127 | (482,341 | ) | 828,266 | |||||||||||||
| Dividends and distributions to shareholders from: | |||||||||||||||||||
| Net investment income | |||||||||||||||||||
| Class N | — | — | (7,082 | ) | — | ||||||||||||||
| Net realized gains | |||||||||||||||||||
| Class I | — | — | — | — | |||||||||||||||
| Class R | — | — | — | — | |||||||||||||||
| Class N | (113,818 | ) | — | (27,987 | ) | — | |||||||||||||
| Total dividends and distributions to shareholders | (113,818 | ) | — | (35,069 | ) | — | |||||||||||||
| Increase (decrease) from shares of beneficial interest transactions: | |||||||||||||||||||
| Class N | 140,856 | 2,236,720 | 542,477 | 2,804,636 | |||||||||||||||
| Class I | — | — | — | — | |||||||||||||||
| Class R | — | — | — | — | |||||||||||||||
| Net increase (decrease) from shares of beneficial interest transactions—Note 5 | 140,856 | 2,236,720 | 542,477 | 2,804,636 | |||||||||||||||
| Total increase (decrease) | (331,517 | ) | 2,674,847 | 25,067 | 3,632,902 | ||||||||||||||
| Net Assets: | |||||||||||||||||||
| Beginning of period | 2,674,847 | — | 3,632,902 | — | |||||||||||||||
| END OF PERIOD | $ | 2,343,330 | $ | 2,674,847 | $ | 3,657,969 | $ | 3,632,902 | |||||||||||
| Undistributed net investment income (accumulated loss) | $ | (8,345 | ) | $ | — | $ | 13,407 | $ | 7,071 | ||||||||||
-47-
THE SPECTRA FUNDS
Statements of Changes in Net Assets
| Technology Fund | |||||||||||||||
| For the Period December 8, 2007 to April 30, 2008 | For the Period September 1, 2007 to December 7, 2007* | For the Year Ended August 31, 2007* | |||||||||||||
| Net investment loss | $ | (3,468 | ) | $ | (4,308 | ) | $ | (22,843 | ) | ||||||
| Net realized gain in investments, options and foreign currency transactions | 4,141 | 142,236 | 308,396 | ||||||||||||
| Net change in unrealized appreciation (depreciation) on investments, options and foreign currency translations | (122,887 | ) | (39,778 | ) | 81,317 | ||||||||||
| Net increase (decrease) in net assets resulting from operations | (122,214 | ) | 98,150 | 366,870 | |||||||||||
| Distributions to shareholders from: | |||||||||||||||
| Net realized gains | |||||||||||||||
| Class A | — | (168,269 | ) | — | |||||||||||
| Class B | — | (50,896 | ) | — | |||||||||||
| Total distributions to shareholders | — | (219,165 | ) | — | |||||||||||
| Decrease from shares of beneficial interest transactions: | |||||||||||||||
| Class A | — | (66,577 | ) | (295,662 | ) | ||||||||||
| Class B | — | (100,213 | ) | (74,276 | ) | ||||||||||
| Class N | (88,480 | ) | — | ||||||||||||
| Net decrease from shares of beneficial interest transactions—Note 5 | (88,480 | ) | (166,790 | ) | (369,938 | ) | |||||||||
| Total decrease | (210,694 | ) | (287,805 | ) | (3,068 | ) | |||||||||
| Net Assets: | |||||||||||||||
| Beginning of period | 895,886 | 1,183,691 | 1,186,759 | ||||||||||||
| END OF PERIOD | $ | 685,192 | $ | 895,886 | $ | 1,183,691 | |||||||||
| Undistributed net investment income (accumulated loss) | $ | (5,642 | ) | $ | 2,174 | — | |||||||||
* Represents the changes in net assets of its Predecessor Fund, SM&R Alger Technology Fund.
See Notes to Financial Statements.
-48-
[This page intentionally left blank]
THE SPECTRA FUNDS
Financial Highlights for a share outstanding throughout the period
| SPECTRA FUND | |||||||||||||||||||||||||||
| Six Months Ended 4/30/08 (i)(x) | Year ended 10/31/07 | Year ended 10/31/06 | Year ended 10/31/05 | Year ended 10/31/04 | Year ended 10/31/03 | ||||||||||||||||||||||
| INCOME FROM INVESTMENT OPERATIONS | |||||||||||||||||||||||||||
| Net asset value, beginning of period | $ | 12.00 | $ | 8.49 | $ | 6.94 | $ | 5.84 | $ | 5.88 | $ | 4.76 | |||||||||||||||
| Net investment loss (ii) | (0.04 | ) | (0.08 | ) | (0.10 | ) | (0.05 | ) | (0.10 | ) | (0.07 | ) | |||||||||||||||
| Net realized and unrealized gain (loss) on investments | (1.48 | ) | 3.59 | 1.65 | 1.15 | 0.06 | 1.19 | ||||||||||||||||||||
| Total from investment operations | (1.52 | ) | 3.51 | 1.55 | 1.10 | (0.04 | ) | 1.12 | |||||||||||||||||||
| Distributions from net realized gains | — | — | — | — | — | — | |||||||||||||||||||||
| Net asset value, end of period | $ | 10.48 | $ | 12.00 | $ | 8.49 | $ | 6.94 | $ | 5.84 | $ | 5.88 | |||||||||||||||
| Total return | (12.7 | )% | 41.3 | % | 22.3 | % | 18.8 | % | (0.7 | )% | 23.5 | % | |||||||||||||||
| RATIOS/SUPPLEMENTAL DATA | |||||||||||||||||||||||||||
| Net assets, end of period (000's omitted) | $ | 281,668 | $ | 329,830 | $ | 191,387 | $ | 187,542 | $ | 210,439 | $ | 257,337 | |||||||||||||||
| Ratio of expenses to average net assets | 1.50 | %(xi) | 1.59 | %(iii) | 2.01 | % | 2.07 | % | 1.98 | % | 2.03 | % | |||||||||||||||
| Ratio of net investment loss to average net assets | (0.75 | )% | (0.79 | )% | (1.20 | )% | (0.81 | )% | (1.63 | )% | (1.39 | )% | |||||||||||||||
| Portfolio turnover rate | 121.47 | % | 282.13 | % | 232.20 | % | 247.72 | % | 159.35 | % | 192.19 | % | |||||||||||||||
(i) Ratios have been annualized; total return and portfolio turnover rate have not been annualized.
(ii) Amount was computed based on average shares outstanding during the period.
(iii) Amount has been reduced by 0.48% due to expense reimbursement.
(iv) Amount has been reduced by 1.12% due to expense reimbursement.
(vi) Commenced operations January 12, 2007. Financial highlights prior to January 12, 2007 are that of its predecessor fund, Alger Green Institutional Fund. See Note 1 in the Notes to Financial Statements.
(vii) Amount has been reduced by 5.79% due to expense reimbursement.
(viii) Amount has been reduced by 0.75% due to expense reimbursement.
(ix) Amount has been reduced by 0.90% due to expense reimbursement.
(x) Unaudited.
(xi) Amount has been reduced by 0.52% due to expense reimbursement.
(xii) Amount has been reduced by 0.26% due to expense reimbursement.
See Notes to Financial Statements.
-50-
| GREEN FUND (vi) CLASS N | |||||||||||||||||||||||||||
| Six Months Ended 4/30/08 (i)(x) | Year ended 10/31/07 | Year ended 10/31/06 | Year ended 10/31/05 | Year ended 10/31/04 | Year ended 10/31/03 | ||||||||||||||||||||||
| INCOME FROM INVESTMENT OPERATIONS | |||||||||||||||||||||||||||
| Net asset value, beginning of period | $ | 7.90 | $ | 6.61 | $ | 6.17 | $ | 5.37 | $ | 5.38 | $ | 4.43 | |||||||||||||||
| Net investment loss (ii) | (0.01 | ) | (0.03 | ) | (0.03 | ) | (0.01 | ) | (0.05 | ) | (0.09 | ) | |||||||||||||||
| Net realized and unrealized gain (loss) on investments | (0.83 | ) | 2.09 | 1.13 | 1.05 | 0.07 | 1.04 | ||||||||||||||||||||
| Total from investment operations | (0.84 | ) | 2.06 | 1.10 | 1.04 | 0.02 | 0.95 | ||||||||||||||||||||
| Distributions from net realized gains | (0.18 | ) | (0.77 | ) | (0.66 | ) | (0.24 | ) | (0.03 | ) | — | ||||||||||||||||
| Net asset value, end of period | $ | 6.88 | $ | 7.90 | $ | 6.61 | $ | 6.17 | $ | 5.37 | $ | 5.38 | |||||||||||||||
| Total return | (10.9 | )% | 34.4 | % | 19.1 | % | 19.8 | % | 0.3 | % | 21.4 | % | |||||||||||||||
| RATIOS/SUPPLEMENTAL DATA | |||||||||||||||||||||||||||
| Net assets, end of period (000's omitted) | $ | 30,198 | $ | 13,744 | $ | 2,446 | $ | 1,505 | $ | 1,277 | $ | 1,277 | |||||||||||||||
| Ratio of expenses to average net assets | 1.25 | %(xii) | 1.25 | %(iv) | 1.25 | %(vii) | 1.25 | %(viii) | 1.34 | %(ix) | 2.26 | % | |||||||||||||||
| Ratio of net investment loss to average net assets | (0.24 | )% | (0.42 | )% | (0.53 | )% | (0.25 | )% | (1.04 | )% | (1.69 | )% | |||||||||||||||
| Portfolio turnover rate | 42.58 | % | 131.66 | % | 209.65 | % | 152.60 | % | 166.03 | % | 187.82 | % | |||||||||||||||
-51-
THE SPECTRA FUNDS
Financial Highlights for a share outstanding throughout the period
| ALCHEMY FUND | INTERNATIONAL OPPORTUNITIES FUND | ||||||||||||||||||
| Six Months Ended 4/30/08 (i)(vii) | From 4/2/07 (commencement of operations) to 10/31/07 (i) | Six Months Ended 4/30/08 (i)(vii) | From 3/1/07 (commencement of operations) to 10/31/07 (i) | ||||||||||||||||
| INCOME FROM INVESTMENT OPERATIONS | |||||||||||||||||||
| Net asset value, beginning of period | $ | 12.07 | $ | 10.00 | $ | 13.56 | $ | 10.00 | |||||||||||
| Net investment loss (ii) | (0.04 | ) | (0.04 | ) | 0.05 | 0.05 | |||||||||||||
| Net realized and unrealized gain (loss) on investments | (1.53 | ) | 2.11 | (1.82 | ) | 3.51 | |||||||||||||
| Total from investment operations | (1.57 | ) | 2.07 | (1.77 | ) | 3.56 | |||||||||||||
| Dividends and distributions to Shareholders from: | |||||||||||||||||||
| Net investment income | — | — | (0.02 | ) | — | ||||||||||||||
| Distributions from net realized gains | (0.51 | ) | — | (0.10 | ) | — | |||||||||||||
| Total dividends and distributions to Shareholders | (0.51 | ) | — | (0.12 | ) | — | |||||||||||||
| Net asset value, end of period | $ | 9.99 | $ | 12.07 | $ | 11.67 | $ | 13.56 | |||||||||||
| Total return | (13.4 | )% | 20.7 | % | (13.2 | )% | 35.6 | % | |||||||||||
| RATIOS/SUPPLEMENTAL DATA | |||||||||||||||||||
| Net assets, end of period (000's omitted) | $ | 2,343 | $ | 2,675 | $ | 3,658 | $ | 3,633 | |||||||||||
| Ratio of expenses to average net assets | 1.20 | %(v) | 1.20 | %(iii) | 1.65 | %(vi) | 1.65 | %(iv) | |||||||||||
| Ratio of net investment loss to average net assets | (0.70 | )% | (0.66 | )% | 0.78 | % | 0.64 | % | |||||||||||
| Portfolio turnover rate | 61.92 | % | 67.44 | % | 32.46 | % | 40.19 | % | |||||||||||
(i) Ratios have been annualized; total return and portfolio turnover rate have not been annualized.
(ii) Amount was computed based on average shares outstanding during the period.
(iii) Amount has been reduced by 1.30% due to expense reimbursement.
(iv) Amount has been reduced by 2.47% due to expense reimbursement.
(v) Amount has been reduced by 1.32% due to expense reimbursement.
(vi) Amount has been reduced by 2.66% due to expense reimbursement.
(vii) Unaudited.
See Notes to Financial Statements.
-52-
[This page intentionally left blank]
THE SPECTRA FUNDS
Financial Highlights for a share outstanding throughout the period
| TECHNOLOGY FUND* | |||||||||||||||||||
| For the Period 12/8 to 4/30/08 (Unaudited) (iv) | For the Period 9/1/07 to 12/7/07 | Year ended 8/31/07 | Year ended 8/31/06 | ||||||||||||||||
| Net asset value, beginning of period | $ | 3.41 | $ | 4.10 | $ | 3.08 | $ | 3.02 | |||||||||||
| Net investment loss | (0.01 | ) | (0.01 | ) | (0.07 | ) | (0.05 | ) | |||||||||||
| Net realized and unrealized gain (loss) on investments | (0.53 | ) | 0.39 | 1.09 | 0.11 | ||||||||||||||
| Total from investment operations | (0.54 | ) | 4.48 | 1.02 | 0.06 | ||||||||||||||
| Distributions from net realized gains | — | (1.07 | ) | ||||||||||||||||
| Net asset value, end of period | $ | 2.87 | $ | 3.41 | $ | 4.10 | $ | 3.08 | |||||||||||
| Total return (ii) | (15.84 | )% | 9.84 | % | 33.12 | % | 1.99 | % | |||||||||||
| RATIOS (IN PERCENTAGES)/SUPPLEMENTAL DATA | |||||||||||||||||||
| Net assets, end of period | $ | 685 | $ | 682 | $ | 843,627 | $ | 870,234 | |||||||||||
| Ratio of expenses to average net assets | 1.40 | %(iii) | 1.83 | %(v) | 1.94 | %(vi) | 2.02 | %(vii) | |||||||||||
| Ratio of net investment loss to average net assets | (1.30 | )% | (1.44 | )% | (1.52 | )% | (1.75 | )% | |||||||||||
| Portfolio turnover rate | 85.29 | % | 157.28 | % | 121.18 | % | 127.07 | % | |||||||||||
* The Technology Fund commenced operations on December 7, 2007. Financial Highlights prior to the commencement of operations are those of the Class A shares of its predecessor fund, SM&R Alger Technology Fund.
(i) Per share information has been calculated using the average number of shares outstanding.
(ii) Does not include the effect of sales charge.
(iii) Amount has been reduced by 5.35% due to expense reimbursement.
(iv) Ratios have been annualized; total return and portfolio turnover rate have not been annualized.
(v) Amount has been reduced by 3.72% due to expense reimbursement.
(vi) Amount has been reduced by 1.90% due to expense reimbursement.
(vii) Amount has been reduced by 2.43% due to expense reimbursement.
(viii) Amount has been reduced by 4.19% due to expense reimbursement.
(ix) Amount has been reduced by 4.05% due to expense reimbursement.
(x) Amount has been reduced by 9.36% due to expense reimbursement.
See Notes to Financial Statements.
-54-
| Year ended 8/31/05 | Year ended 8/31/04 (i) | Year ended 8/31/03 (i) | |||||||||||||
| Net asset value, beginning of period | $ | 2.43 | $ | 2.59 | $ | 1.67 | |||||||||
| Net investment loss | (0.04 | ) | (0.06 | ) | (0.04 | ) | |||||||||
| Net realized and unrealized gain (loss) on investments | 0.63 | (0.10 | ) | 0.96 | |||||||||||
| Total from investment operations | 0.59 | (0.16 | ) | 0.92 | |||||||||||
| Distributions from net realized gains | |||||||||||||||
| Net asset value, end of period | $ | 3.02 | $ | 2.43 | $ | 2.59 | |||||||||
| Total return (ii) | 24.28 | % | (6.18 | )% | 55.09 | % | |||||||||
| RATIOS (IN PERCENTAGES)/SUPPLEMENTAL DATA | |||||||||||||||
| Net assets, end of period | $ | 798,200 | $ | 585,844 | $ | 449,337 | |||||||||
| Ratio of expenses to average net assets | 2.10 | %(viii) | 2.10 | %(ix) | 2.10 | %(x) | |||||||||
| Ratio of net investment loss to average net assets | (1.36 | )% | (1.97 | )% | (1.84 | )% | |||||||||
| Portfolio turnover rate | 269.32 | % | 215.21 | % | 291.66 | % | |||||||||
-55-
THE SPECTRA FUNDS |
NOTES TO FINANCIAL STATEMENTS (Unaudited)
NOTE 1 — Summary of Significant Accounting Policies:
The Spectra Funds (the "Trust") is a diversified open-end registered investment company organized as a business trust under the laws of the Commonwealth of Massachusetts. The Trust operates as a series company currently issuing an unlimited number of shares of beneficial interest in five funds—Spectra Fund, Green Fund, Alchemy Fund, International Opportunities Fund and Spectra Technology Fund (collectively, the "Funds" or individually, each a "Fund"). The Funds normally invest primarily in equity securities and each has an investment objective of long-term capital appreciation.
The Green Fund commenced operations on January 12, 2007 after the reorganization of the Class I and R Shares of the Alger Green Institutional Fund into the Class N Shares of the Green Fund. Information of the Green Fund prior to January 12, 2007 is that of the Alger Green Institutional Fund.
The Technology Fund commenced operations on December 8, 2007 after the reorganization of Class A shares and Class B shares of the SM&R Alger Technology Fund (the "Predecessor Fund") into the Class N shares of the Spectra Technology Fund. Information of the Technology Fund prior to December 8, 2007 is that of the Predecessor Fund.
The following is a summary of significant accounting policies consistently followed by the Funds in the preparation of their financial statements.
(a) Investment Valuation: Investments in securities are valued each day the New York Stock Exchange (the "NYSE") is open as of the close of the NYSE (normally 4:00 p.m. Eastern time). Securities for which such information is readily available are valued at the last reported sales price or official closing price as reported by an independent pricing service on the primary market or exchange on which they are traded. In the absence of reported sales, securities are valued at a price within the bid and asked price, or in the absence of a recent bid or asked price, the equivalent as obtained from one or more of the major market makers for the securities to be valued. Short-term notes are valued at amortized cost which approximates market value. Shares of mutual funds are valued at the net asset value of the underlying mutual fund.
Securities for which market quotations are not readily available are valued at fair value, as determined in good faith pursuant to procedures established by the Board of Trustees.
Securities in which the Funds invest may be traded in markets that close before the close of the NYSE. Developments that occur between the close of the foreign markets and the close of the NYSE (normally 4:00 p.m. Eastern time) may result in adjustments to the closing prices to reflect what the investment adviser, pursuant to policies established by the Board of Trustees, believes to be the fair value of these securities as of the close of the NYSE. The Funds may also fair value securities in
-56-
THE SPECTRA FUNDS |
NOTES TO FINANCIAL STATEMENTS (Unaudited) (Continued)
other situations, for example, when a particular foreign market is closed but the Fund is open.
Statement on Financial Accounting Standards No. 157, "Fair Value Measurements" (FAS 157) defines fair value for financial reporting, establishes a framework for measuring fair value and requires additional disclosures about the use of fair value measurements. FAS 157 is effective for financial statements issued for fiscal years beginning after November 15, 2007 and interim periods within those fiscal years. The Fund does not believe the adoption of FAS 157 will impact the amounts reported in the financial statements, however, additional disclosures will be required about the inputs used to develop the measurements of fair value and the effect of certain of the measurements reported in the statement of operations for a fiscal period. These inputs are summarized in the three broad levels listed below:
• Level 1 – quoted prices in active markets for identical securities
• Level 2 – other significant observable inputs (including quoted prices for similar securities, interest rates, credit risk, etc.)
• Level 3 – significant unobservable inputs (including the Fund's own assumptions in determining the fair value of investments)
The inputs or methodology used for valuing securities are not necessarily an indication of the risk associated with investing in those securities.
Recent Accounting Pronouncements
In March 2008, the Financial Accounting Standards Board issued the Statement of Financial Accounting Standards No. 161, Disclosures about Derivative Instruments and Hedging Activities ("FAS 161"). FAS 161 is effective for fiscal years and interim periods beginning after November 15, 2008. FAS 161 requires enhanced disclosures about the Fund's derivative and hedging activities, including how such activities are accounted for and their effect on the Fund's financial position, performance and cash flows. Management is currently evaluating the impact the adoption of FAS 161 will have on the Fund's financial statements and related disclosures.
(b) Securities Transactions and Investment Income: Securities transactions are recorded on a trade date basis. Realized gains and losses from securities transactions are recorded on the basis of the first-in, first-out method. Dividend income is recognized on the ex-dividend date and interest income is recognized on the accrual basis.
(c) Foreign Currency Translations: The books and records of the Funds are maintained in U.S. dollars. Foreign currencies, investments and other assets and liabilities are translated into U.S. dollars at the prevailing rates of exchange on the valuation date. Purchases and sales of investment securities and income and expenses are translated into U.S. dollars at the prevailing exchange rates on the respective dates of such transactions.
Net realized gains and losses on foreign currency transactions represent net gains and losses from the disposition of foreign currencies, currency gains and losses
-57-
THE SPECTRA FUNDS |
NOTES TO FINANCIAL STATEMENTS (Unaudited) (Continued)
realized between the trade dates and settlement dates of security transactions, and the difference between the amount of net investment income accrued and the U.S. dollar amount actually received. The effects of changes in foreign currency exchange rates on investments in securities are included in realized and unrealized gain or loss on investments in the Statement of Operations.
(d) Option Contracts: When a Fund writes an option, an amount equal to the premium received by the Fund is recorded as a liability and is subsequently adjusted to the current fair value of the option written. Premiums received from writing options that expire unexercised are treated by the Fund on the expiration date as realized gains from investments. The difference between the premium and the amount paid on effecting a closing purchase transaction, including brokerage commissions, is also treated as a realized gain, or, if the premium is less than the amount paid for the closing purchase transaction, as a realized loss. If a call option is exercised, the premium is added to the proceeds from the sale of the underlying security in determining whether the Fund has realized a gain or loss. If a put option is exercised, the premium reduces the cost basis of the secu rities purchased by the Fund. The Fund as writer of an option bears the market risk of an unfavorable change in the price of the security underlying the written option.
The Funds may also purchase put and call options. Purchasing put and call options tends to decrease the Fund's exposure to the underlying instrument. The Fund pays a premium which is included in the Funds' Statement of Assets and Liabilities as an investment and subsequently marked to market to reflect the current value of the option. Premiums paid for purchasing options which expire are treated as realized losses. The risk associated with purchasing put and call options is limited to the premium paid. Premiums paid for purchasing options which are exercised or closed are added to the amounts paid or offset against the proceeds on the underlying security to determine the realized gain or loss.
(e) Lending of Portfolio Securities: The Funds may lend their securities to financial institutions, provided that the market value of the securities loaned will not at any time exceed one third of the Fund's total assets, as defined. The Funds earn fees on the securities loaned.
In order to protect against the risk of failure by the borrower to return the securities loaned or any delay in the delivery of such securities, the loan is collateralized by cash, letters of credit or U.S. Government securities that are maintained in an amount equal to at least 100 percent of the current market value of the loaned securities. The market value of the loaned securities is determined at the close of business of the Funds and any required additional collateral is delivered to the Fund on the next business day. There were no securities on loan during the six months ended April 30, 2008.
(f) Dividends to Shareholders: Dividends and distributions payable to shareholders are recorded by the Funds on the ex-dividend date. Dividends from net investment
-58-
THE SPECTRA FUNDS |
NOTES TO FINANCIAL STATEMENTS (Unaudited) (Continued)
income and distributions from net realized gains are declared and paid annually after the end of the fiscal year in which earned.
The characterization of distributions to shareholders for financial reporting purposes is determined in accordance with federal income tax rules. Therefore, the source of the Fund's distributions may be shown in the accompanying financial statements as either from, or in excess of net investment income, net realized gain on investment transactions or return of capital, depending on the type of book/tax differences that may exist. Capital accounts within the financial statements are adjusted for permanent book/tax differences. Reclassifications result primarily from the difference in tax treatment of net operating losses, reorganization of the Alger Green Institutional Fund, and foreign currency transactions. The reclassifications have no impact on the net asset value of the Funds and is designed to present the Funds' capital accounts on a tax basis.
(g) Federal Income Taxes: It is the Funds' policy to comply with the requirements of the Internal Revenue Code applicable to regulated investment companies and to distribute all of its investment company taxable income to its shareholders. Provided the Funds maintain such compliance, no federal income tax provision is required.
(h) Indemnification: The Trust enters into contracts that contain a variety of indemnification provisions. The Trust's maximum exposure under these arrangements is unknown. The Trust does not anticipate recognizing any loss related to these arrangements.
(i) Other: These financial statements have been prepared using estimates and assumptions that affect the reported amounts therein. Actual results may differ from those estimates.
NOTE 2 — Investment Advisory Fees and Other Transactions with Affiliates:
(a) Investment Advisory and Administration Fees: Fees incurred by each Fund, pursuant to the provisions of its Investment Advisory Agreement and its Administration Agreement with Fred Alger Management, Inc. (Alger Management), are payable monthly and computed based on the value of the average daily net assets of each Fund, at the following rates:
| Advisory Fee | Administration Fee through March 16, 2008 | Administration Fee Effective March 17, 2008 | |||||||||||||
| Spectra Fund | 1.46 | % | .04 | % | .0275 | % | |||||||||
| Green Fund | .71 | .04 | .0275 | ||||||||||||
| Alchemy Fund | .85 | .04 | .0275 | ||||||||||||
| International Opportunities Fund | 1.00 | .04 | .0275 | ||||||||||||
| Technology Fund | .81 | .04 | .0275 | ||||||||||||
-59-
THE SPECTRA FUNDS |
NOTES TO FINANCIAL STATEMENTS (Unaudited) (Continued)
Prior to September 12, 2006, Alger Management provided both advisory services and administrative services to the Trust pursuant to an investment management agreement.
Effective February 28, 2007, Alger Management has established an expense cap for each of the Funds, whereby it reimbursed the Funds if annualized operating expenses (excluding interest, taxes, brokerage, and extraordinary expenses) exceed the rates, based on average daily net assets, listed below:
| Expense Cap | Fees Waived/Reimbursed for the Six Months Ended April 30, 2007 | ||||||||||
| Spectra Fund | 1.50 | % | $ | 790,014 | |||||||
| Green Fund | 1.25 | 28,711 | |||||||||
| Alchemy Fund | 1.20 | 15,783 | |||||||||
| International Opportunities Fund | 1.65 | 50,404 | |||||||||
| Technology Fund | 1.40 | 14,269 | |||||||||
As part of its settlement with the New York State Attorney General (see Note 7—Litigation) Alger Management has agreed to reduce the Spectra Fund's advisory fee to 1.16% for the period from December 1, 2006 to November 30, 2011.
(b) Shareholder Administrative Fees: The Trust has entered into a shareholder administrative services agreement with Alger Management, to compensate Alger Management on a per account basis for its liaison and administrative oversight of the transfer agent and related services. On June 30, 2007, the shareholder administrative services agreement was assigned to Alger Management. During the period ended April 30, 2007, Spectra Fund, Green Fund, Alchemy Fund, International Opportunities Fund and Technology Fund incurred fees of $17,746, $2,285, $27, $188, and $44 respectively, for these services provided by Alger Management which are included in the transfer agent fees and expenses in the Statement of Operations.
(c) Brokerage Commissions: During the period ended April 30, 2007, Spectra Fund, Green Fund, Alchemy Fund, International Opportunities Fund and Technology Fund paid Fred Alger & Company, Incorporated ("Alger Inc."), an affiliate of Alger Management, $246,936, $14,118, $983, $257 and $181 respectively in connection with securities transactions.
(d) Trustees' Fees: Each Fund pays each trustee who is not affiliated with Alger Management or its affiliates $500 for each meeting attended, to a maximum of $2,000 per annum. The Chairman of the Board of Trustees receives an additional annual fee of $10,000 which is paid, pro rata, by all funds managed by Alger Management. Additionally, each member of the audit committee receives an additional $50 from each Fund for each audit committee meeting attended, to a maximum of $200 per annum.
-60-
THE SPECTRA FUNDS |
NOTES TO FINANCIAL STATEMENTS (Unaudited) (Continued)
(e) Distribution/Shareholder Servicing Fees: The Trust entered into a shareholder servicing agreement with Alger Inc. whereby Alger Inc. provides the Fund with ongoing servicing of shareholder accounts. As compensation for such services, the Fund pays Alger Inc. a monthly fee at an annual rate equal to .25% of the value of the Fund's average daily net assets. The shareholder servicing agreement was terminated on February 28, 2007. On March 1, 2007, the Funds adopted a distribution plan pursuant to which Class N shares of each Fund pay Alger Inc. a fee at the annual rate of .25% of the respective average daily net assets of each Class N shares of the designated Funds to compensate Alger Inc. for its activities and expenses incurred in distributing the Class N shares. Fees charged may be more or less than the expenses incurred by Alger Inc.
(f) Other Transactions with Affiliates: Certain trustees and officers of the Trust are directors and officers of Alger Management, Alger Inc. and Alger Services. At April 30, 2007, Alger Management and its affiliates owned 202,008 shares and
223,682 shares of the Spectra International Fund and the Spectra Alchemy Fund, respectively.
NOTE 3 — Securities Transactions:
The following summarizes the securities transaction by the Trust, other than short-term securities, for the six months ended April 30, 2008:
| PURCHASES | SALES | ||||||||||
| Spectra Fund | $ | 355,287,741 | $ | 372,337,438 | |||||||
| Green Fund | 23,571,766 | 8,140,445 | |||||||||
| Alchemy Fund | 1,398,794 | 1,374,851 | |||||||||
| International Opportunities Fund | 1,732,274 | 1,042,340 | |||||||||
| Technology Fund | 3,314,001 | 962,762 | |||||||||
Written call and put option activity for the six months ended April 30, 2008 was as follows:
| NUMBER OF CONTRACTS | PREMIUMS RECEIVED | ||||||||||
| SPECTRA FUND | |||||||||||
| Options outstanding at October 31, 2007 | — | $ | — | ||||||||
| Options written | 1,736 | 726,041 | |||||||||
| Options closed or expired | 1,736 | (726,041 | ) | ||||||||
| Options exercised | — | — | |||||||||
| Options outstanding at October 31, 2007 | — | $ | — | ||||||||
-61-
THE SPECTRA FUNDS |
NOTES TO FINANCIAL STATEMENTS (Unaudited) (Continued)
| NUMBER OF CONTRACTS | PREMIUMS RECEIVED | ||||||||||
| GREEN FUND | |||||||||||
| Options outstanding at October 31, 2007 | 18 | $ | 6,966 | ||||||||
| Options written | 78 | 20,826 | |||||||||
| Options closed or expired | (96 | ) | (27,792 | ) | |||||||
| Options exercised | — | — | |||||||||
| Options outstanding at October 31, 2007 | — | $ | — | ||||||||
NOTE 4 — Lines of Credit:
The Trust participated in a $50 million committed line of credit with other mutual funds managed by Alger Management through March 14, 2008. All borrowings had variable interest rates and were payable on demand. To the extent the Funds borrow under these lines, the Funds must pledge securities with a total value of at least twice the amount borrowed. Effective March 17, 2008, the Funds borrows from its custodian on an uncommitted basis.
For the six months ended April 30, 2008, the Spectra Fund had borrowings which averaged $288,324 at a weighted average interest rate of 5.06%.
-62-
THE SPECTRA FUNDS |
NOTES TO FINANCIAL STATEMENTS (Unaudited) (Continued)
NOTE 5 — Share Capital:
(a) The Trust has an unlimited number of authorized shares of beneficial interest of $.001 par value which are presently divided into five series. The transaction of shares of beneficial interest were as follows:
During the six months ended April 30, 2008, transactions of the shares of beneficial interest were as follows:
| SHARES | AMOUNT | ||||||||||
| SPECTRA FUND CLASS N | |||||||||||
| Shares sold | 6,521,578 | $ | 71,210,705 | ||||||||
| Shares redeemed | (7,134,691 | ) | (73,910,632 | ) | |||||||
| Net decrease | (613,113 | ) | $ | (2,699,927 | ) | ||||||
| GREEN FUND CLASS N | |||||||||||
| Shares sold | 2,962,914 | $ | 20,846,450 | ||||||||
| Dividends reinvested | 47,758 | 357,227 | |||||||||
| Shares redeemed | (361,436 | ) | (2,461,273 | ) | |||||||
| Net increase | 2,649,236 | $ | 18,742,404 | ||||||||
| ALCHEMY FUND CLASS N | |||||||||||
| Shares sold | 3,241 | $ | 34,561 | ||||||||
| Dividends reinvested | 10,190 | 111,272 | |||||||||
| Shares redeemed | (512 | ) | (4,979 | ) | |||||||
| Net increase | 12,919 | $ | 140,854 | ||||||||
| INTERNATIONAL FUND CLASS N | |||||||||||
| Shares sold | 73,394 | $ | 873,410 | ||||||||
| Dividends reinvested | 2,612 | 31,947 | |||||||||
| Shares redeemed | (30,267 | ) | (362,880 | ) | |||||||
| Net increase | 45,739 | $ | 542,477 | ||||||||
| TECHNOLOGY FUND CLASS N* | |||||||||||
| Shares sold | 54,714 | $ | 152,449 | ||||||||
| Shares issued in reorganization | 262,723 | 895,885 | |||||||||
| Shares redeemed | (78,928 | ) | (240,929 | ) | |||||||
| Net increase | 238,509 | $ | 807,405 | ||||||||
* For the period from December 8, 2007 to April 30, 2008.
-63-
THE SPECTRA FUNDS |
NOTES TO FINANCIAL STATEMENTS (Unaudited) (Continued)
During the period ended October 31, 2007, transactions of beneficial interest were as follows:
| SHARES | AMOUNT | ||||||||||
| SPECTRA FUND CLASS N | |||||||||||
| Shares sold | 10,351,387 | $ | 107,050,527 | ||||||||
| Shares redeemed | (5,397,049 | ) | (52,343,999 | ) | |||||||
| Net increase | 4,954,338 | $ | 54,706,528 | ||||||||
| GREEN FUND | |||||||||||
| Class N* | |||||||||||
| Shares sold | 1,273,942 | $ | 8,721,256 | ||||||||
| Shares issued in reorganization | 630,628 | 3,935,701 | |||||||||
| Shares redeemed | (164,773 | ) | (1,113,395 | ) | |||||||
| Net increase | 1,739,797 | $ | 11,543,562 | ||||||||
| Class I | |||||||||||
| Shares sold | 16,029 | $ | 109,079 | ||||||||
| Dividends reinvested | 46,165 | 290,688 | |||||||||
| Shares redeemed in reorganization | (430,838 | ) | (2,688,841 | ) | |||||||
| Shares redeemed | (1,346 | ) | (8,571 | ) | |||||||
| Net decrease | (369,990 | ) | $ | (2,297,645 | ) | ||||||
| Class R | |||||||||||
| Shares sold | 111,099 | $ | 719,466 | ||||||||
| Dividends reinvested | 11,561 | 71,285 | |||||||||
| Shares redeemed in reorganization | (204,297 | ) | (1,246,860 | ) | |||||||
| Shares redeemed | (34,521 | ) | (217,693 | ) | |||||||
| Net decrease | (116,158 | ) | $ | (673,802 | ) | ||||||
| ALCHEMY FUND CLASS N** | |||||||||||
| Shares sold | 221,561 | $ | 2,236,720 | ||||||||
| Shares redeemed | — | — | |||||||||
| Net increase | 221,561 | $ | 2,236,720 | ||||||||
| INTERNATIONAL OPPORTUNITIES FUND CLASS N*** | |||||||||||
| Shares sold | 274,508 | $ | 2,877,818 | ||||||||
| Shares redeemed | (6,668 | ) | (73,182 | ) | |||||||
| Net increase | 267,840 | $ | 2,804,636 | ||||||||
* Initially offered January 12, 2007.
** Initially offered April 2, 2007.
*** Initially offered March 1, 2007.
-64-
THE SPECTRA FUNDS |
NOTES TO FINANCIAL STATEMENTS (Unaudited) (Continued)
During the period from September 1, 2007 to December 7, 2007, transactions of beneficial interest were as follows:
| SHARES | AMOUNT | ||||||||||
| SM&R ALGER TECHNOLOGY FUND | |||||||||||
| Class A | |||||||||||
| Shares sold | 6,369 | $ | 29,471 | ||||||||
| Dividends reinvested | 42,513 | 141,570 | |||||||||
| Shares redeemed | (54,513 | ) | (237,618 | ) | |||||||
| Net decrease | (5,631 | ) | $ | (66,577 | ) | ||||||
| Class B | |||||||||||
| Shares sold | 1,867 | $ | 8,252 | ||||||||
| Dividends reinvested | 15,330 | 50,896 | |||||||||
| Shares redeemed | (37,407 | ) | (159,361 | ) | |||||||
| Net decrease | (20,210 | ) | $ | (100,213 | ) | ||||||
During the year ended August 31, 2007, transactions of beneficial interest were as follows:
| SHARES | AMOUNT | ||||||||||
| SM&R ALGER TECHNOLOGY FUND | |||||||||||
| Class A | |||||||||||
| Shares sold | 48,193 | $ | 186,260 | ||||||||
| Shares redeemed | (125,213 | ) | (481,922 | ) | |||||||
| Net decrease | (77,020 | ) | $ | (295,662 | ) | ||||||
| Class B | |||||||||||
| Shares sold | 7,998 | $ | 29,786 | ||||||||
| Shares redeemed | (28,175 | ) | (104,062 | ) | |||||||
| Net decrease | (20,177 | ) | $ | (74,276 | ) | ||||||
(b) Redemption Fee: The Funds may impose a 2.00% redemption fee on Fund shares redeemed (including shares redeemed by exchange) within 30 days after such shares were acquired. The fees retained by the Funds are included as paid-in capital on the Statement of Assets and Liabilities. During the year ended October 31, 2007 and the year ended October 31, 2006, redemption fees were $10,947 and $93 respectively for the Spectra Fund. There were no redemption fees on the other Funds.
-65-
THE SPECTRA FUNDS |
NOTES TO FINANCIAL STATEMENTS (Unaudited) (Continued)
NOTE 6 — Tax Character of Distributions to Shareholders:
The tax character of distributions paid during the six months ended April 30, 2008 and the year ended October 31, 2007 were as follows:
| SIX MONTHS ENDED APRIL 30, 2008 | YEAR ENDED OCTOBER 31, 2007 | ||||||||||
| GREEN FUND | |||||||||||
| Distributions paid from: | |||||||||||
| Ordinary income | $ | 221,757 | $ | 251,131 | |||||||
| Long-term capital gain | 167,417 | 183,489 | |||||||||
| Total distributions paid | $ | 389,174 | $ | 434,620 | |||||||
| ALCHEMY FUND | |||||||||||
| Distributions paid from: | |||||||||||
| Ordinary income | $ | 113,818 | $ | — | |||||||
| Long-term capital gain | — | — | |||||||||
| Total distributions paid | $ | 113,818 | $ | — | |||||||
| INTERNATIONAL FUND | |||||||||||
| Distributions paid from: | |||||||||||
| Ordinary income | $ | 35,069 | $ | — | |||||||
| Long-term capital gain | — | — | |||||||||
| Total distributions paid | $ | 35,069 | $ | — | |||||||
The tax character of distributions paid during the period from September 1, 2007 to December 7, 2007 and the year ended August 31, 2007 were as follows:
| FOR THE PERIOD FROM SEPTEMBER 1, 2007 TO DECEMBER 7, 2007 | YEAR ENDED AUGUST 31, 2007 | ||||||||||
| SM&R ALGER TECHNOLOGY FUND | |||||||||||
| Distributions paid from: | |||||||||||
| Ordinary income | $ | 33,798 | $ | — | |||||||
| Long-term capital gain | 185,367 | — | |||||||||
| $ | 219,165 | $ | 0 | ||||||||
-66-
THE SPECTRA FUNDS |
NOTES TO FINANCIAL STATEMENTS (Unaudited) (Continued)
As of October 31, 2007, the components of distributable earnings on a tax basis were as follows:
| SPECTRA FUND | |||||||
| Undistributed ordinary capital | $ | — | |||||
| Undistributed long-term gain | — | ||||||
| Unrealized appreciation | $ | 34,841,989 | |||||
| GREEN FUND | |||||||
| Undistributed ordinary capital | $ | 221,697 | |||||
| Undistributed long-term gain | $ | 167,277 | |||||
| Unrealized appreciation | $ | 2,211,394 | |||||
| ALCHEMY FUND | |||||||
| Undistributed ordinary capital | $ | 113,813 | |||||
| Undistributed long-term gain | — | ||||||
| Unrealized appreciation | $ | 324,314 | |||||
| INTERNATIONAL OPPORTUNITIES | |||||||
| Undistributed ordinary capital | $ | 35,028 | |||||
| Undistributed long-term gain | — | ||||||
| Unrealized appreciation | $ | 793,238 | |||||
As of December 7, 2007, the components of distributable earnings on a tax basis were as follows:
| SM&R ALGER TECHNOLOGY FUND | |||||||
| Undistributed ordinary capital | $ | 2,577 | |||||
| Undistributed long-term gain | $ | 4 | |||||
| Unrealized appreciation | $ | 141,627 | |||||
The differences between book basis and tax basis unrealized appreciation is determined annually and is attributable primarily to the tax deferral of losses on wash sales.
At October 31, 2007, Spectra Fund, for federal income tax purposes, had capital loss carryforwards which expire as set forth in the table below. These amounts may be applied against future net realized gains until the earlier of their utilization or expiration.
| EXPIRATION DATE | AMOUNT | ||||||
| 2009 | $ | 43,979,856 | |||||
| 2010 | 107,067,302 | ||||||
| $ | 151,047,158 | ||||||
-67-
THE SPECTRA FUNDS |
NOTES TO FINANCIAL STATEMENTS (Unaudited) (Continued)
NOTE 7 — Litigation:
Alger Management has responded to inquiries, document requests and/or subpoenas from various regulatory authorities, in connection with their investigations of practices in the mutual fund industry identified as "market timing" and "late trading." On October 11, 2006, Alger Management, Alger Inc. and Alger Shareholder Services, Inc. executed an Assurance of Discontinuance with the Office of the New York State Attorney General ("NYAG"). On January 18, 2007 the Securities and Exchange Commission issued an order implementing settlements reached with Alger Management and Alger Inc. As part of the settlements with the Commission and the NYAG, without admitting or denying liability, the firms paid $30 million to reimburse fund shareholders and a fine of $10 million; and agreed to certain other remedial measures including a reduction in management fees of $1 million per year for five years. The entire $40 million and fee reduction will be available for the benefit of investors. Alger Management has advised the Funds that the settlement has not adversely affected the operations of Alger Management, Alger Inc. or their affiliates, or adversely affected their ability to continue to provide services to the Funds.
On August 31, 2005, the West Virginia Securities Commissioner (the "WVSC") in an ex parte Summary Order to Cease and Desist and Notice of Right to Hearing concluded that Alger Management and Alger Inc. had violated the West Virginia Uniform Securities Act (the "WVUSA"), and ordered Alger Management and Alger Inc. to cease and desist from further violations of the WVUSA by engaging in the market-timing related conduct described in the order. The ex parte order provided notice of their right to a hearing with respect to the violations of law asserted by the WVSC. Other firms unaffiliated with Alger Management were served with similar orders. Alger Management and Alger Inc. intend to request a hearing for the purpose of seeking to vacate or modify the order.
In addition, in 2003 and 2004 several purported class actions and shareholder derivative suits were filed against various parties in the mutual fund industry, including Alger Management, certain mutual funds managed by Alger Management (the "Alger Mutual Funds"), and certain current and former Alger Mutual Fund trustees and officers, alleging wrongful conduct related to market-timing and late-trading by mutual fund shareholders. These cases were transferred to the U.S. District Court of Maryland by the Judicial Panel on Multidistrict Litigation for consolidated pre-trial proceedings. In September 2004, consolidated amended complaints involving these cases — a Consolidated Amended Fund Derivative Complaint (the "Derivative Complaint") and two substantially identical Consolidated Amended Class Action Complaints (together, the "Class Action Complaint") — were filed in the Maryland federal district court under the caption
-68-
THE SPECTRA FUNDS |
NOTES TO FINANCIAL STATEMENTS (Unaudited) (Continued)
number 1:04-MD-15863 (JFM). In April 2005, a civil lawsuit involving similar allegations was filed by the West Virginia Attorney General and also transferred to the Maryland District Court, but such lawsuit has since been withdrawn.
The Derivative Complaint (which was later amended a second time) alleged (i) violations, by Alger Management and, depending on the specific offense alleged, by Alger Inc. and/or the fund trustee defendants, of Sections 36(a), 36(b), 47, and 48 of the Investment Company Act of 1940, as amended, (the "1940 Act") and of Sections 206 and 215 of the Investment Advisers Act of 1940, as amended, breach of fiduciary duty, and breach of contract, (ii) various offenses by other third-party defendants, and (iii) unjust enrichment by all the named defendants. The Class Action Complaint alleged, in addition to the offenses listed above, (i) violations, by Alger Management, Alger Inc., their affiliates, the funds named as defendants, including the Funds, and the current and former fund trustees and officers, of Sections 11, 12(a)(2), and 15 of the Securities Act of 1933, as amended, Sections 10(b) (and Rule 10b-5 thereunder) and 20(a) of the Securities Ex change Act of 1934, as amended, (the "1934 Act"), and Section 34(b) of the Investment Company Act, (ii) breach of contract by the funds named as defendants, and (iii) unjust enrichment of the defendants.
Motions to dismiss the Class Action Complaint and the Derivative Complaint were subsequently filed.
As a result of a series of court orders, all claims in the Class Action Complaint and the Derivative Complaint have been dismissed, other than claims under the 1934 Act against Alger Management, Alger Inc., Alger Associates, Inc. and Alger Shareholder Services, Inc., and certain present and former members of the senior management of Alger Management and/or Alger Inc., and claims under Section 36(b) of the Investment Company Act against Alger Management, Alger Inc., Alger Associates, Inc. and Alger Shareholder Services, Inc.
Note 8 — Acquisition of SM&R Alger Technology Fund
On December 7, 2007, the Spectra Technology Fund ("Spectra Tech") acquired all the net assets of the SM&R Alger Technology Fund ("SM&R Tech") pursuant to a plan of reorganization approved by the Fund's shareholders on November 26, 2007. The acquisition was accomplished by a tax-free exchange of 262,723 shares of Spectra Tech, valued at $895,885, for the 262,723 shares of SM&R Tech outstanding on December 7, 2007. SM&R Tech's net assets of $895,885, including $141,627 of unrealized appreciation, were combined with those of Spectra Tech. The combined net assets of Spectra Tech and SM&R Tech were $895,885 immediately after the acquisition.
-69-
THE SPECTRA FUNDS
ADDITIONAL INFORMATION (Unaudited)
Shareholder Expense Example
As a shareholder of the Funds, you incur two types of costs: transaction costs, if applicable, including redemption fees; and ongoing costs, including advisory fees, distribution (12b-1) fees, if applicable, and other fund expenses. This example is intended to help you understand your ongoing costs (in dollars) of investing in the Funds and to compare these costs with the ongoing costs of investing in other mutual funds.
The example below is based on an investment of $1,000 invested at the beginning of the six-month period starting November 1, 2007 and ending April 30, 2008.
Actual Expenses
The first line for each class of shares in the table below provides information about actual account values and actual expenses. You may use the information in this line, together with the amount you invested, to estimate the expenses that you would have paid over the period. Simply divide your account value by $1,000 (for example, an $8,600 account value divided by $1,000 = 8.6), then multiply the result by the number in the first line under the heading entitled "Expenses Paid During the Period" to estimate the expenses you paid on your account during this period.
Hypothetical Example for Comparison Purposes
The second line for each class of shares in the table below provides information about hypothetical account values and hypothetical expenses based on the Fund's actual expense ratios for each class of shares and an assumed rate of return of 5% per year before expenses, which is not the Funds' actual returns. The hypothetical account values and expenses may not be used to estimate the actual ending account balance or expenses you paid for the period. You may use this information to compare the ongoing costs of investing in the Funds and other funds. To do so, compare this 5% hypothetical example with the 5% hypothetical examples that appear in the shareholder reports of other funds.
Please note that the expenses shown in the table are meant to highlight your ongoing costs only and do not reflect any transaction costs, such as sales charges (loads) and redemption fees. Therefore, the second line under each class of shares in the table is useful in comparing ongoing costs only, and will not help you determine the relative total costs of owning different funds. In addition, if these transactional costs were included, your costs would have been higher.
-70-
THE SPECTRA FUNDS
ADDITIONAL INFORMATION (Unaudited) (Continued)
| Beginning Account Value November 1, 2007 | Ending Account Value April 30, 2008 | Expenses Paid During the Period November 1, 2007 to April 30, 2008(b) | Ratio of Expenses to Average Net Assets For the Six Months Ended April 30, 2008(c) | ||||||||||||||||||||
| SPECTRA FUND: | |||||||||||||||||||||||
| Actual | $ | 1,000.00 | $ | 873.30 | $ | 6.99 | 1.50 | % | |||||||||||||||
| Hypothetical(a) | 1,000.00 | 1,017.40 | 7.52 | 1.50 | |||||||||||||||||||
| GREEN FUND: | |||||||||||||||||||||||
| Actual | $ | 1,000.00 | $ | 891.50 | $ | 5.88 | 1.25 | % | |||||||||||||||
| Hypothetical(a) | 1,000.00 | 1,018.65 | 6.27 | 1.25 | |||||||||||||||||||
| ALCHEMY FUND: | |||||||||||||||||||||||
| Actual | $ | 1,000.00 | $ | 866.40 | $ | 5.57 | 1.20 | % | |||||||||||||||
| Hypothetical(a) | 1,000.00 | 1,018.90 | 6.02 | 1.20 | |||||||||||||||||||
| INTERNATIONAL OPPORTUNITIES FUND: | |||||||||||||||||||||||
| Actual | $ | 1,000.00 | $ | 868.50 | $ | 7.67 | 1.65 | % | |||||||||||||||
| Hypothetical(a) | 1,000.00 | 1,016.66 | 8.27 | 1.65 | |||||||||||||||||||
| TECHNOLOGY FUND: | |||||||||||||||||||||||
| Actual* | $ | 1,000.00 | $ | 784.80 | $ | 6.21 | 1.40 | % | |||||||||||||||
| Hypothetical | 1,000.00 | 1,017.90 | 7.02 | 1.40 | |||||||||||||||||||
(a) 5% annual return before expenses.
(b) Expenses are equal to the annualized expense ratio of the respective fund multiplied by the average account value over the period, multiplied by 182/366 (to reflect the one-half year period).
(c) Annualized.
* From 12/8/07 commencement of operations.
Proxy Voting Policies
A description of the policies and procedures the Funds use to determine how to vote proxies relating to portfolio securities and the proxy voting record is available, without charge, by calling (800) 711-6141 or online on the Funds' website at http://www.spectrafund.com or on the SEC's website at http://www.sec.gov.
-71-
THE SPECTRA FUNDS
ADDITIONAL INFORMATION (Unaudited) (Continued)
Fund Holdings
The Funds' most recent month end portfolio holdings are available approximately sixty days after month end on the Funds' website at www.spectrafund.com. The Funds also files their complete schedules of portfolio holdings with the SEC for the first and third quarter of each fiscal year on Form N-Q. The Funds' Forms N-Q is available online on the SEC's website at www.sec.gov or may be reviewed and copied at the SEC's Public Reference Room in Washington, D.C. Information regarding the operation of the SEC's Public Reference Room may be obtained by calling 1-800-SEC-0330. A copy of the most recent quarterly holdings may also be obtained from the Funds by calling (800) 711-6141.
-72-
THE SPECTRA FUNDS
111 Fifth Avenue
New York, NY 10003
(800) 711-6141
www.spectrafund.com
Investment Manager
Fred Alger Management, Inc.
111 Fifth Avenue
New York, NY 10003
Transfer Agent and Dividend Disbursing Agent
Boston Financial Data Services, Inc.
P.O. Box 8480
Boston, MA 02266
This report is submitted for the general information of the shareholders of The Spectra Funds. It is not authorized for distribution to prospective investors unless accompanied by an effective Prospectus for the Funds, which contains information concerning the Funds' investment policies, fees and expenses as well as other pertinent information.
Go Paperless with Alger Electronic Delivery Service
Alger is pleased to provide you with the ability to access regulatory materials online. When documents such as prospectuses and annual and semi-annual reports are available, we'll send you an e-mail notification with a convenient link that will take you directly to the fund information on our website. To sign up for this free service, simply enroll at www.icsdelivery.com/alger.


SAS 043008

ITEM 2. CODE OF ETHICS.
Not applicable.
ITEM 3. AUDIT COMMITTEE FINANCIAL EXPERT.
Not applicable.
ITEM 4. PRINCIPAL ACCOUNTANT FEES AND SERVICES.
Not applicable.
ITEM 5. AUDIT COMMITTEE OF LISTED REGISTRANTS.
Not applicable.
ITEM 6. INVESTMENTS.
Not applicable.
ITEM 7. DISCLOSURE OF PROXY VOTING POLICIES AND PROCEDURES FOR CLOSED END MANAGEMENT INVESTMENT COMPANIES.
Not applicable.
ITEM 8. PORTFOLIO MANAGERS OF CLOSED-END MANAGEMENT INVESTMENT COMPANIES.
Not applicable.
ITEM 9. PURCHASES OF EQUITY SECURITIES BY CLOSED-END MANAGEMENT INVESTMENT COMPANY AND AFFILIATED PURCHASERS.
Not applicable.
ITEM 10. SUBMISSION OF MATTERS TO A VOTE OF SECURITY HOLDERS.
Not applicable.
ITEM 11. CONTROLS AND PROCEDURES.
(a) The registrant’s principal executive officer and principal financial officer have concluded that the registrant’s disclosure controls and procedures (as defined in Rule 30a-3(c) under the Investment Company Act of 1940, as amended) are effective based on their evaluation of the disclosure controls and procedures as of a date within 90 days of the filing date of this document.
(b) No changes in the registrant’s internal control over financial reporting occurred during the registrant’s second fiscal quarter of the period covered by this report that materially affected, or are reasonably likely to materially affect, the registrant’s internal control over financial reporting.
ITEM 12. EXHIBITS.
(a) (1) Not applicable
(a) (2) Certifications of principal executive officer and principal financial officer as required by rule 30a-2(a) under the Investment Company Act of 1940 are attached as Exhibit 99.CERT
(a) (3) Not applicable
(b) Certifications of principal executive officer and principal financial officer as required by rule 30a-2(b) under the Investment Company Act of 1940 are attached as Exhibit 99.906CERT
SIGNATURES
Pursuant to the requirements of the Securities Exchange Act of 1934 and the Investment Company Act of 1940, the registrant has duly caused this report to be signed on its behalf by the undersigned, thereunto duly authorized.
The Spectra Funds
By: | /s/Dan C. Chung |
|
|
|
|
|
|
| Dan C. Chung |
|
|
|
|
|
|
| President |
|
|
|
| ||
Date: June 17, 2008 |
| ||
Pursuant to the requirements of the Securities Exchange Act of 1934 and the Investment Company Act of 1940, this report has been signed below by the following persons on behalf of the registrant and in the capacities and on the dates indicated.
By: | /s/Dan C. Chung |
|
|
|
|
|
|
| Dan C. Chung |
|
|
|
|
|
|
| President |
|
|
|
| ||
Date: June 17, 2008 |
| ||
By: | /s/Michael D. Martins |
|
|
|
|
|
|
| Michael D. Martins |
|
|
|
|
|
|
| Treasurer |
|
|
|
| ||
Date: June 17, 2008 |
| ||