Capital One Financial (COF) 425Business combination disclosure
Filed: 7 Mar 05, 12:00am

| March 7, 2005 Investor Presentation |

| Forward-Looking Information Information set forth in this document contains forward-looking statements, which involve a number of risks and uncertainties. Capital One and Hibernia caution readers that any forward-looking information is not a guarantee of future performance and that actual results could differ materially from those contained in the forward-looking information. Such forward- looking statements include, but are not limited to, statements about the benefits of the business combination transaction involving Capital One and Hibernia, including future financial and operating results, the new company's plans, objectives, expectations and intentions and other statements that are not historical facts. The following factors, among others, could cause actual results to differ from those set forth in the forward-looking statements: the ability to obtain regulatory approvals of the transaction on the proposed terms and schedule; the failure of Hibernia stockholders to approve the transaction; the risk that the businesses will not be integrated successfully; the risk that the cost savings and any other synergies from the transaction may not be fully realized or may take longer to realize than expected; disruption from the transaction making it more difficult to maintain relationships with customers, employees or suppliers; competition and its effect on pricing, spending, third-party relationships and revenues. Additional factors that may affect future results are contained in Capital One's and Hibernia's filings with the Securities and Exchange Commission ("SEC"), which are available at the SEC's Web site http://www.sec.gov. Capital One and Hibernia disclaim any obligation to update and revise statements contained in this presentation based on new information or otherwise. Additional Information About this Transaction In connection with the proposed merger, Capital One will file with the Securities and Exchange Commission (the "SEC") a Registration Statement on Form S-4 that will include a proxy statement of Hibernia that also constitutes a prospectus of Capital One. Hibernia will mail the proxy statement/prospectus to its stockholders. Investors and security holders are urged to read the proxy statement/prospectus regarding the proposed merger when it becomes available because it will contain important information. You may obtain a free copy of the proxy statement/prospectus (when available) and other related documents filed by Capital One and Hibernia with the SEC at the SEC's website at www.sec.gov. The proxy statement/prospectus (when it is available) and the other documents may also be obtained for free by accessing Capital One's website at www.capitalone.com under the tab "Investors" and then under the heading "SEC & Regulatory Filings" or by accessing Hibernia's website at www.hibernia.com under the tab "About Hibernia" and then under the heading "Investor Relations-SEC Filings". Capital One, Hibernia and their respective directors, executive officers and certain other members of management and employees may be soliciting proxies from Hibernia stockholders in favor of the merger. Information regarding the persons who may, under the rules of the SEC, be considered participants in the solicitation of the Hibernia stockholders in connection with the proposed merger will be set forth in the proxy statement/prospectus when it is filed with the SEC. You can find information about Capital One's executive officers and directors in its definitive proxy statement filed with the SEC on March 17, 2004. You can find information about Hibernia's executive officers and directors in its definitive proxy statement filed with the SEC on March 16, 2004. You can obtain free copies of these documents from Capital One and Hibernia using the contact information above. |
| Transaction Summary and Strategic Rationale Financial Overview |
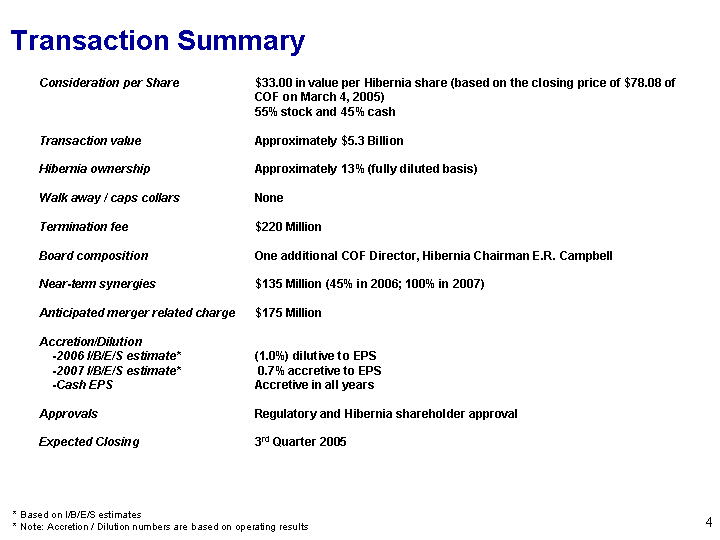
| Transaction Summary Consideration per Share $33.00 in value per Hibernia share (based on the closing price of $78.08 of COF on March 4, 2005) 55% stock and 45% cash Transaction value Approximately $5.3 Billion Hibernia ownership Approximately 13% (fully diluted basis) Walk away / caps collars None Termination fee $220 Million Board composition One additional COF Director, Hibernia Chairman E.R. Campbell Near-term synergies $135 Million (45% in 2006; 100% in 2007) Anticipated merger related charge $175 Million Accretion/Dilution -2006 I/B/E/S estimate* (1.0%) dilutive to EPS -2007 I/B/E/S estimate* 0.7% accretive to EPS -Cash EPS Accretive in all years Approvals Regulatory and Hibernia shareholder approval Expected Closing 3rd Quarter 2005 * Based on I/B/E/S estimates * Note: Accretion / Dilution numbers are based on operating results |
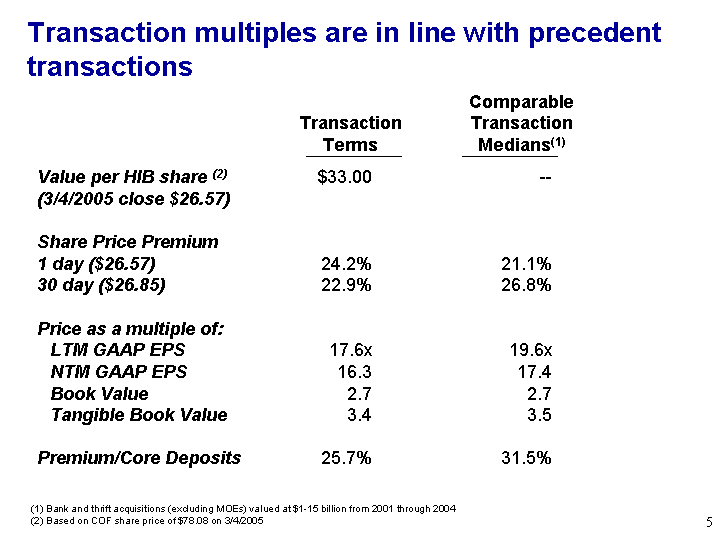
| Transaction multiples are in line with precedent transactions Bank and thrift acquisitions (excluding MOEs) valued at $1-15 billion from 2001 through 2004 Based on COF share price of $78.08 on 3/4/2005 Value per HIB share (2) (3/4/2005 close $26.57) Share Price Premium 1 day ($26.57) 30 day ($26.85) Price as a multiple of: LTM GAAP EPS NTM GAAP EPS Book Value Tangible Book Value Premium/Core Deposits $33.00 24.2% 22.9% 17.6x 16.3 2.7 3.4 25.7% -- 21.1% 26.8% 19.6x 17.4 2.7 3.5 31.5% Transaction Terms Comparable Transaction Medians(1) |

| Capital One and Hibernia are both well established financial institutions Hibernia (HIB) Capital One (COF) $19B market cap Fortune 200 company Leading provider of credit cards, auto finance and other consumer loans Average 29% EPS growth, 24% ROE since IPO in 1994 Headquartered in McLean, VA ~14,500 employees $4B market cap 134 year old institution Leading bank in Louisiana, growing in Texas Strong, diversified consumer and commercial lending franchise 198 locations in Louisiana, 108 locations in Texas* 13 non-branch locations Headquartered in New Orleans, LA ~6,200 employees *Includes 3 branches opened in 2005 Note: Market cap as of March 4, 2005 |
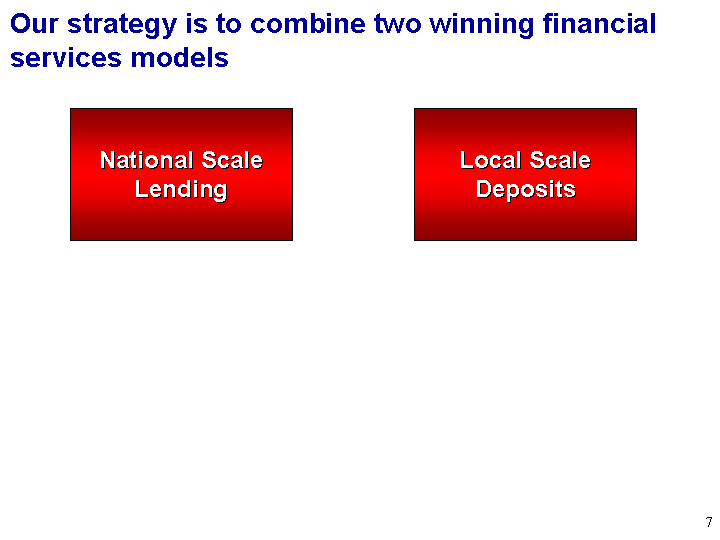
| Our strategy is to combine two winning financial services models Local Scale Deposits National Scale Lending |
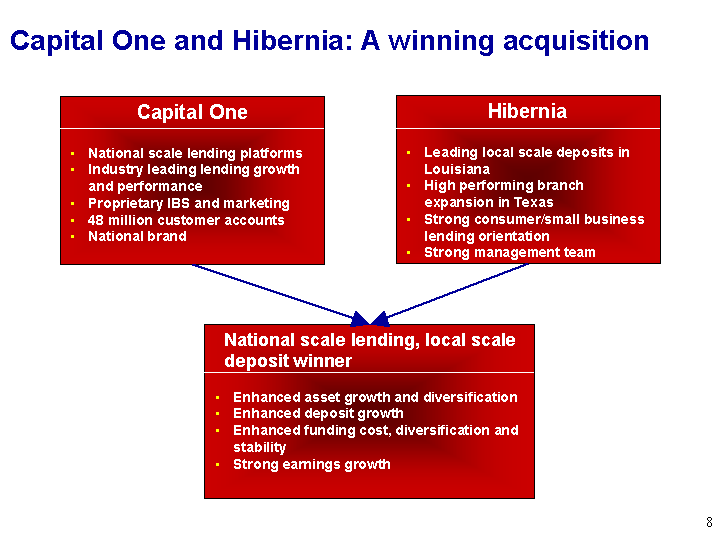
| Capital One and Hibernia: A winning acquisition Capital One National scale lending platforms Industry leading lending growth and performance Proprietary IBS and marketing 48 million customer accounts National brand Hibernia Leading local scale deposits in Louisiana High performing branch expansion in Texas Strong consumer/small business lending orientation Strong management team National scale lending, local scale deposit winner Enhanced asset growth and diversification Enhanced deposit growth Enhanced funding cost, diversification and stability Strong earnings growth |
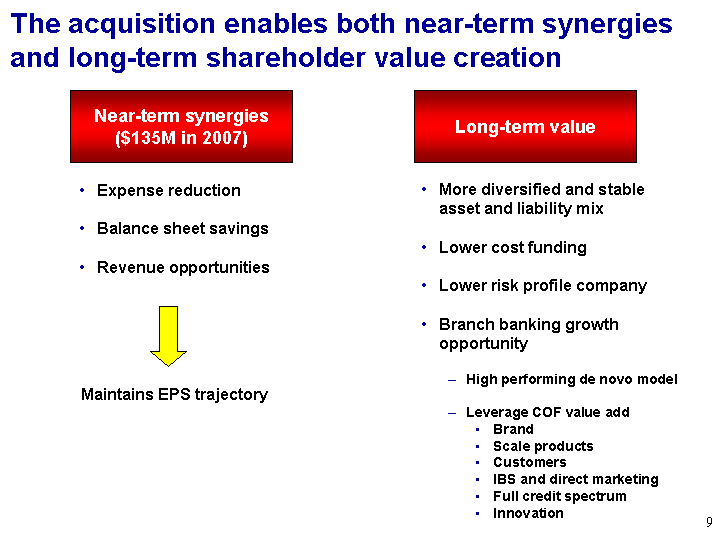
| The acquisition enables both near-term synergies and long-term shareholder value creation Long-term value Near-term synergies ($135M in 2007) Expense reduction Balance sheet savings Revenue opportunities More diversified and stable asset and liability mix Lower cost funding Lower risk profile company Branch banking growth opportunity High performing de novo model Leverage COF value add Brand Scale products Customers IBS and direct marketing Full credit spectrum Innovation Maintains EPS trajectory |
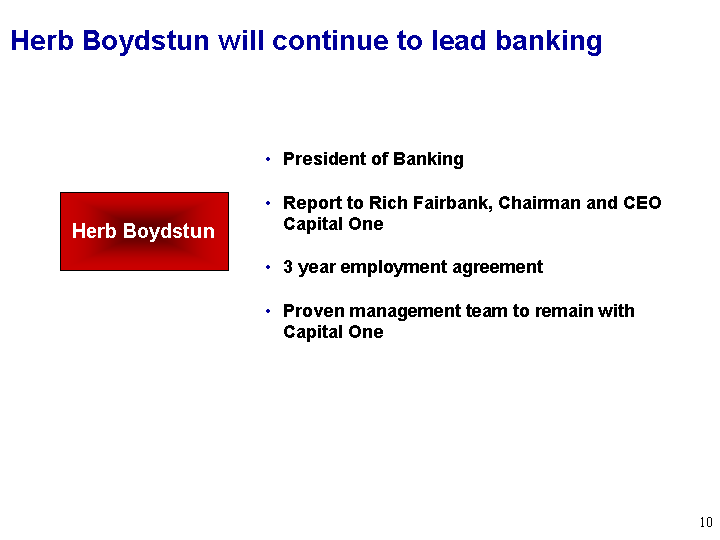
| President of Banking Report to Rich Fairbank, Chairman and CEO Capital One 3 year employment agreement Proven management team to remain with Capital One Herb Boydstun will continue to lead banking Herb Boydstun |
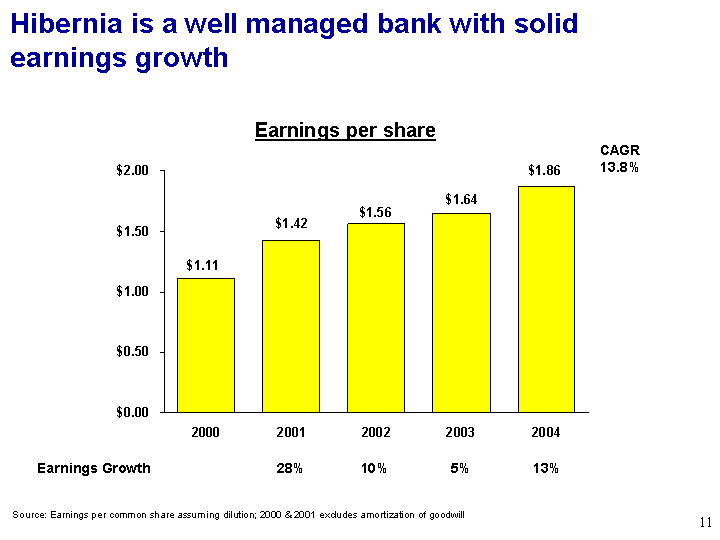
| Hibernia is a well managed bank with solid earnings growth 2000 2001 2002 2003 2004 Consumer 1.11 1.42 1.56 1.64 1.86 Earnings per share Source: Earnings per common share assuming dilution; 2000 & 2001 excludes amortization of goodwill Earnings Growth 28% 10% 5% 13% CAGR 13.8% |
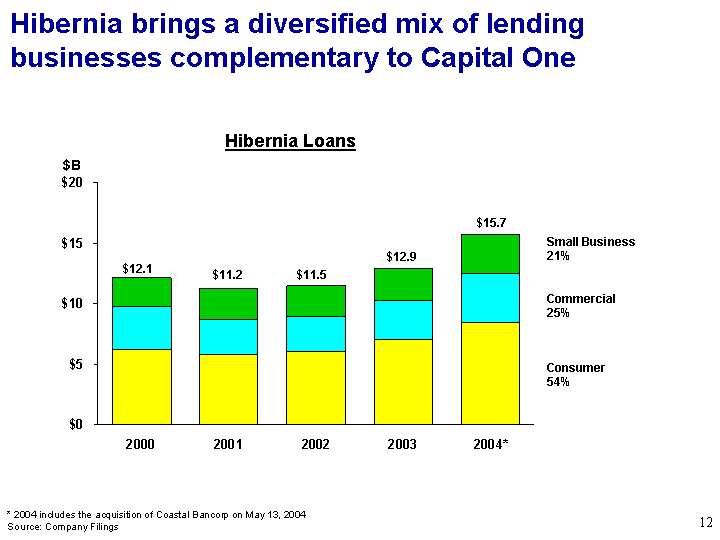
| Hibernia brings a diversified mix of lending businesses complementary to Capital One 2000 2001 2002 2003 9/1/2004 2004* Consumer 6.2271 5.7878 6.1079 7.0059 8.4177 8.4802 Commercial 3.5016 2.9624 2.8765 3.2342 3.6558 3.9979 Small Business 2.396 2.4908 2.5078 2.6429 3.4285 3.2411 Hibernia Loans $B $12.1 $11.2 $11.5 $12.9 $15.7 Commercial 25% Consumer 54% Small Business 21% * 2004 includes the acquisition of Coastal Bancorp on May 13, 2004 Source: Company Filings |
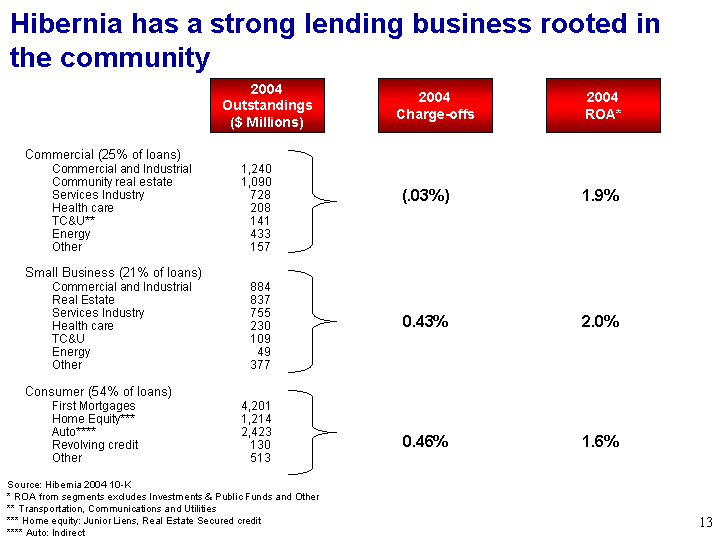
| Hibernia has a strong lending business rooted in the community Commercial (25% of loans) Commercial and Industrial 1,240 Community real estate 1,090 Services Industry 728 Health care 208 TC&U** 141 Energy 433 Other 157 Small Business (21% of loans) Commercial and Industrial 884 Real Estate 837 Services Industry 755 Health care 230 TC&U 109 Energy 49 Other 377 Consumer (54% of loans) First Mortgages 4,201 Home Equity*** 1,214 Auto**** 2,423 Revolving credit 130 Other 513 2004 Outstandings ($ Millions) 2004 Charge-offs 2004 ROA* Source: Hibernia 2004 10-K * ROA from segments excludes Investments & Public Funds and Other ** Transportation, Communications and Utilities *** Home equity: Junior Liens, Real Estate Secured credit **** Auto: Indirect 0.43% (.03%) 0.46% 2.0% 1.9% 1.6% |
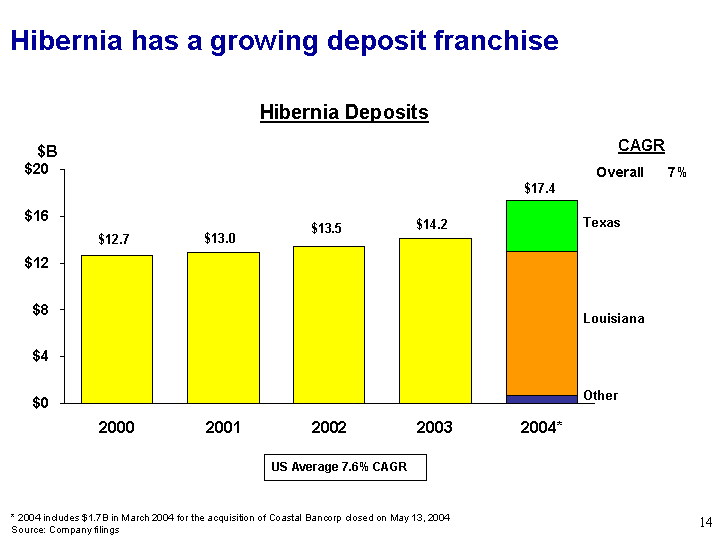
| Hibernia has a growing deposit franchise 2000 2001 2002 2003 2004* Deposits 12.693 12.953 13.481 14.159 0 LA 0.696 TX 12.35 Other 4.35 Hibernia Deposits * 2004 includes $1.7B in March 2004 for the acquisition of Coastal Bancorp closed on May 13, 2004 Source: Company filings $B CAGR Overall 7% US Average 7.6% CAGR $17.4 Texas Louisiana Other |
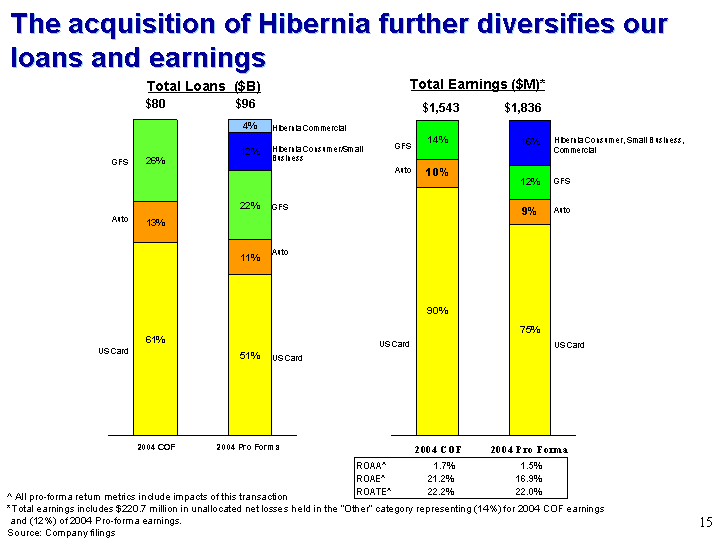
| The acquisition of Hibernia further diversifies our loans and earnings 2004 COF 2004 Pro Forma Card 0.61 0.51 Auto 0.13 0.11 GFS 0.26 0.22 Cypress Commercial 0.12 Cypress Consumer 0.04 Total Loans ($B) US Card GFS $80 Auto $96 Auto 2004 COF 2004 Pro Forma US Card 0.9000130967 0.750000000130967 Auto 0.1 0.09 Global Financial Service 0.14 0.12 Consumer Commercial Small Business Cypress 0.16 $1,543 $1,836 Total Earnings ($M)* Auto GFS US Card Auto GFS Hibernia Consumer, Small Business, Commercial US Card US Card GFS Hibernia Consumer/Small Business Hibernia Commercial ROAA^ 1.7% 1.5% ROAE^ 21.2% 16.9% ROATE^ 22.2% 22.0% ^ All pro-forma return metrics include impacts of this transaction *Total earnings includes $220.7 million in unallocated net losses held in the "Other" category representing (14%) for 2004 COF earnings and (12%) of 2004 Pro-forma earnings. Source: Company filings |

| The acquisition diversifies our liabilities and lowers our average cost of funds 2004 COF 2004 Pro Forma Card Securitization 0.47 0.38 Auto Securitization 0.1 0.08 Capital One Deposits 0.3 0.24 Cypress Deposits 0.16 Other Liabilities 0.13 0.14 $86 Card Securitization Capital One deposits Other $107 Total Liabilities ($B) 2004 Average Cost of Funds Interest bearing liabilities Deposits COF 4.24% 4.15% HIB 1.38% 1.19% COF Pro-forma 3.70% 2.98% Hibernia deposits Capital One deposits Source: Company filings Other Auto Securitization Card Securitization Auto Securitization 57% 40% 46% |

| Hibernia is the deposit leader in Louisiana Louisiana Source: SNL data 06/04 1 Hibernia 29.9% 2 JP Morgan / Chase 17.2% 3 Whitney 16.8% 4 Regions 7.2% 5 Fidelity Homestead Assn. 3.0% 6 Firstrust Corporation 2.6% 7 AmSouth Bancorp 2.1% 8 Omni Bancshares 1.9% 9 Gulf Coast B&TC 1.8% 10 Parish National Bank 1.5% New Orleans 1 Hibernia 22.4% 2 JP Morgan / Chase 16.5% 3 Regions 8.8% 4 Whitney 7.4% 5 IBERIABANK 3.6% 6 AmSouth Bancorp. 2.8% 7 Hancock Holding Co. 2.4% 8 Fidelity Homestead Assn. 1.1% 9 Firstrust Corporation 1.1% 10 Bancorp South Inc. 1.0% Total Deposit Share Company Rank Company Rank Total Deposit Share |
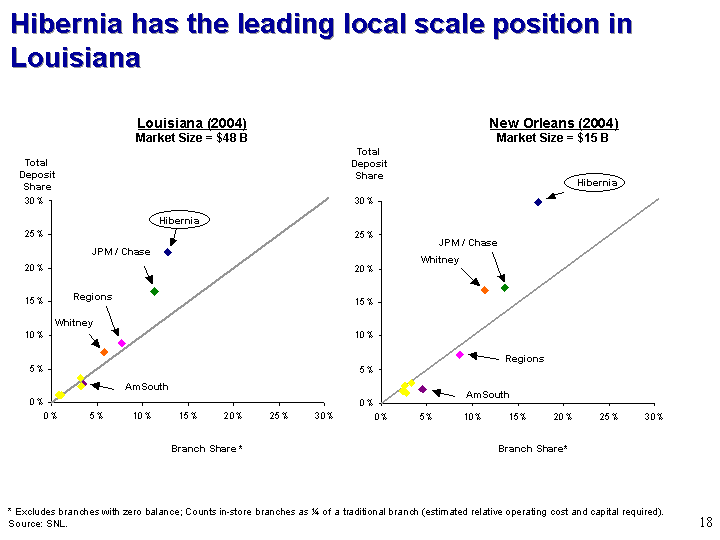
| Branch Share * Total Deposit Share Louisiana (2004) Market Size = $48 B Hibernia has the leading local scale position in Louisiana Hibernia Whitney Regions JPM / Chase Branch Share* Total Deposit Share New Orleans (2004) Market Size = $15 B Hibernia JPM / Chase * Excludes branches with zero balance; Counts in-store branches as 1/4 of a traditional branch (estimated relative operating cost and capital required). Source: SNL. Regions Whitney AmSouth AmSouth |

| Hibernia is leveraging its position in Louisiana to expand in Texas LA TX New Orleans 64 locations Other Louisiana 134 locations Source: Hibernia management presentation dated 3/4/2005; SNL Does not include 13 non-branch locations Includes 3 branches opened in 2005 Houston 24 locations Dallas 11 locations Other Texas 73 locations |
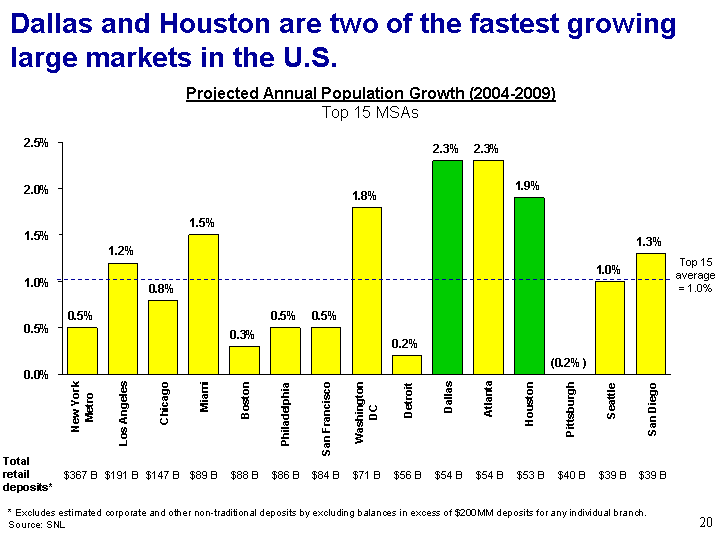
| Dallas and Houston are two of the fastest growing large markets in the U.S. New York Metro Los Angeles Chicago Miami Boston Philadelphia San Francisco Washington DC Detroit Dallas Atlanta Houston Pittsburgh Seattle San Diego 0.005 0.012 0.008 0.015 0.003 0.005 0.005 0.018 0.002 0.023 0.023 0.019 0 0.01 0.013 * Excludes estimated corporate and other non-traditional deposits by excluding balances in excess of $200MM deposits for any individual branch. Source: SNL Projected Annual Population Growth (2004-2009) Top 15 MSAs Top 15 average = 1.0% Total retail deposits* $367 B $191 B $147 B $89 B $88 B $86 B $84 B $71 B $56 B $54 B $54 B $53 B $40 B $39 B $39 B |
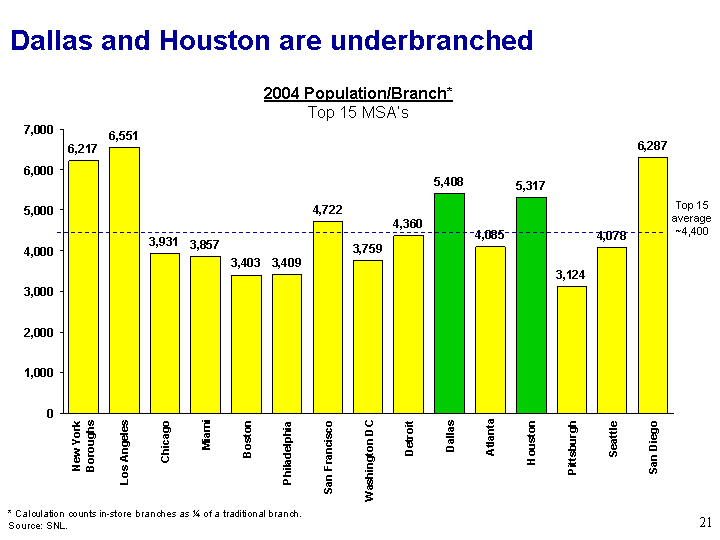
| Dallas and Houston are underbranched New York Boroughs Los Angeles Chicago Miami Boston Philadelphia San Francisco Washington DC Detroit Dallas Atlanta Houston Pittsburgh Seattle San Diego 6217 6551 3931 3857 3403 3409 4722 3759 4360 5408 4085 5317 3124 4078 6287 Top 15 average ~4,400 2004 Population/Branch* Top 15 MSA's * Calculation counts in-store branches as 1/4 of a traditional branch. Source: SNL. |
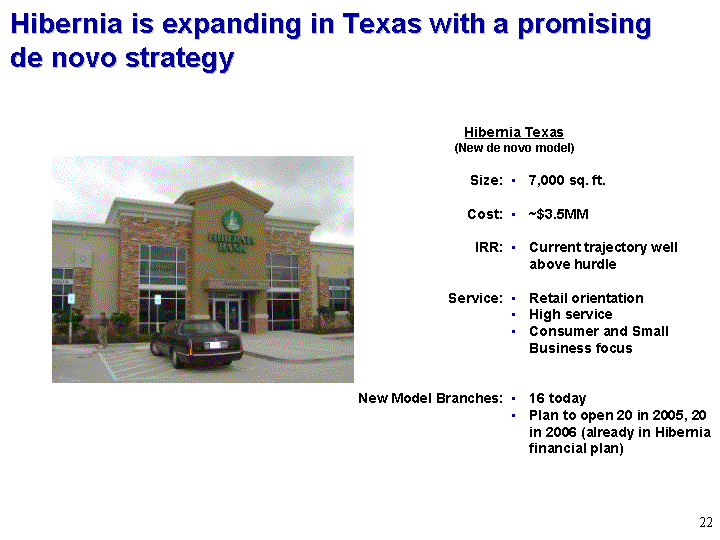
| Hibernia is expanding in Texas with a promising de novo strategy Size: Cost: IRR: Service: New Model Branches: Hibernia Texas (New de novo model) (New de novo model) (New de novo model) 7,000 sq. ft. ~$3.5MM Current trajectory well above hurdle Retail orientation High service Consumer and Small Business focus 16 today Plan to open 20 in 2005, 20 in 2006 (already in Hibernia financial plan) |
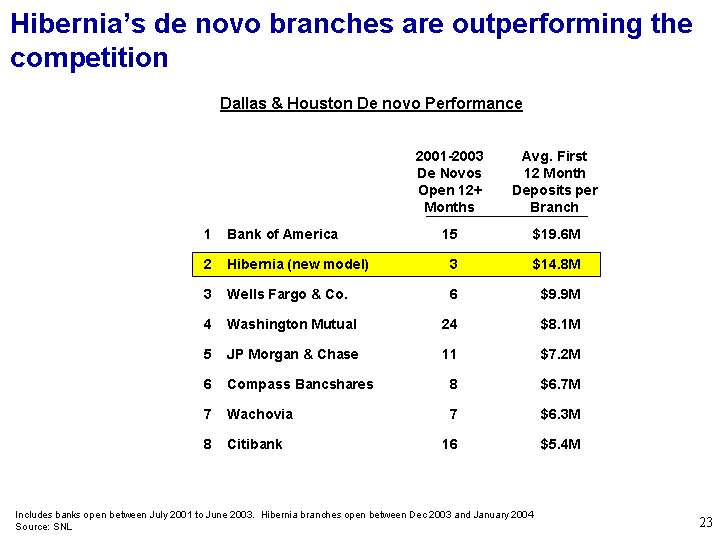
| Hibernia's de novo branches are outperforming the competition 1 Bank of America 15 $19.6M 2 Hibernia (new model) 3 $14.8M 3 Wells Fargo & Co. 6 $9.9M 4 Washington Mutual 24 $8.1M 5 JP Morgan & Chase 11 $7.2M 6 Compass Bancshares 8 $6.7M 7 Wachovia 7 $6.3M 8 Citibank 16 $5.4M 2001-2003 De Novos Open 12+ Months Avg. First 12 Month Deposits per Branch Dallas & Houston De novo Performance Includes banks open between July 2001 to June 2003. Hibernia branches open between Dec 2003 and January 2004 Source: SNL |
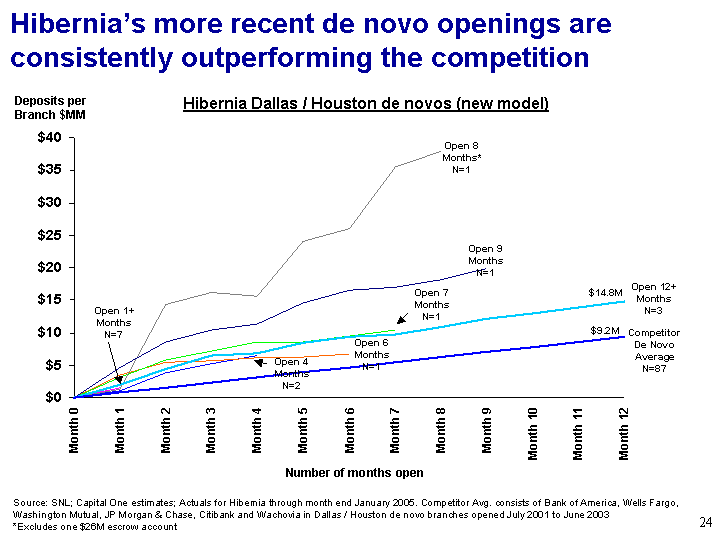
| Month 0 Month 1 Month 2 Month 3 Month 4 Month 5 Month 6 Month 7 Month 8 Month 9 Month 10 Month 11 Month 12 1 + Month 0 1.46 4 Month 0 1.08 3.77 5.2 6.47 6 Month 0 3.52 5.42 5.68 6.17 6.3 6.73 7 Month 0 3.16 5.79 7.18 8.51 8.54 9.47 10.39 8 Month 0 1.25 14.31 16.17 15.55 24.01 25.99 35.52 37.89 9 Month 0 4.68 8.57 10.35 11.32 14.54 16.54 17.01 18.19 19.88 12 Months 0 2.021 4.349 6.449 6.77 8.44 9.419 9.673 10.838 12.187 12.987 13.896 14.77 Peer Average 0 0.78 1.55 2.33 3.11 3.89 4.66 5.44 6.22 7 7.77 8.55 9.33 Hibernia's more recent de novo openings are consistently outperforming the competition Source: SNL; Capital One estimates; Actuals for Hibernia through month end January 2005. Competitor Avg. consists of Bank of America, Wells Fargo, Washington Mutual, JP Morgan & Chase, Citibank and Wachovia in Dallas / Houston de novo branches opened July 2001 to June 2003 *Excludes one $26M escrow account Hibernia Dallas / Houston de novos (new model) Deposits per Branch $MM Number of months open Open 9 Months N=1 Open 8 Months* N=1 Open 7 Months N=1 Open 12+ Months N=3 Competitor De Novo Average N=87 Open 6 Months N=1 Open 1+ Months N=7 Open 4 Months N=2 $14.8M $9.2M |
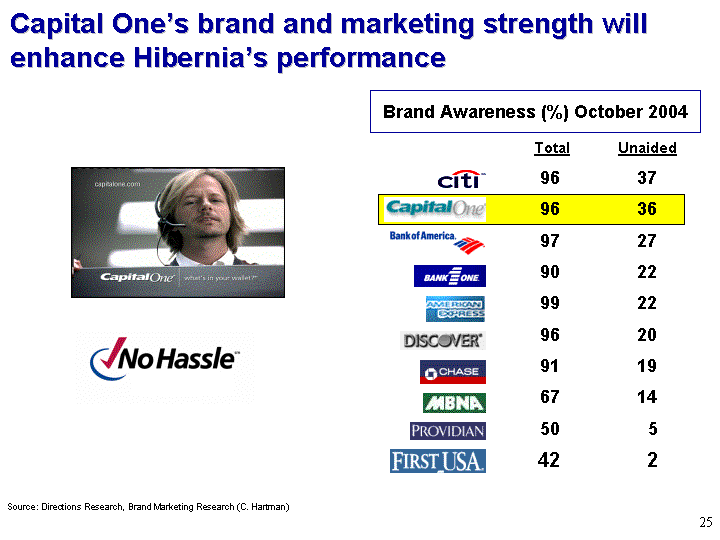
| Capital One's brand and marketing strength will enhance Hibernia's performance enhance Hibernia's performance enhance Hibernia's performance Source: Directions Research, Brand Marketing Research (C. Hartman) Brand Awareness (%) October 2004 Total 99 96 96 96 97 91 90 67 50 42 Unaided 22 20 36 37 27 19 22 14 5 2 2 |
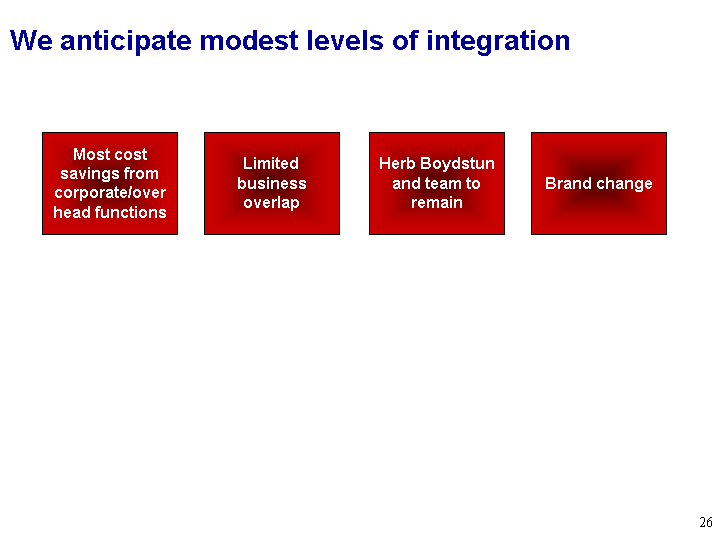
| We anticipate modest levels of integration Most cost savings from corporate/over head functions Limited business overlap Brand change Herb Boydstun and team to remain |

| We completed extensive due diligence Experienced diligence team Senior COF executives COF representatives from all functional areas Outside experts engaged (commercial, mortgage, compliance, legal and retail banking strategy) Appropriate time frame Engaged with Hibernia senior management over 3 week period Comprehensive on-site final diligence, including data review and management interviews Substantial physical diligence Key non-branch facilities 100+ branch visits (all regions) Mystery shopped significant sample of branches Visited 14 of 16 de novo branches Statistical sampling of all lending files and portfolios Reviewed material source documents and contracts |

| Citigroup Wells Fargo Bank of America / Fleet JP Morgan / Bank One Washington Mutual MBNA Wachovia SunTrust Capital One Pro-forma American Express^ $647 $432 $396 $339 $175 $122 $116 $109 $81 $64 We will be the 9th largest consumer lender 2004 Managed U.S. Consumer* Assets ($B) Total consumer managed assets are 1-4 family loans (mortgages), 1-4 family revolving (home equity), total consumer loans (incl. credit card, automobile, installment loans, and other), and consumer securitizations (incl. credit card, automobile, installment loans, other). Numbers are as of 12/31/2004. ^ American Express asset and asset growth figures came from Nilson Report Source: SNL: incl. credit card, automobile, installment loans Company Reports Capital One Pro-forma includes Capital One loans less International plus Hibernia Consumer and Small Business loans |
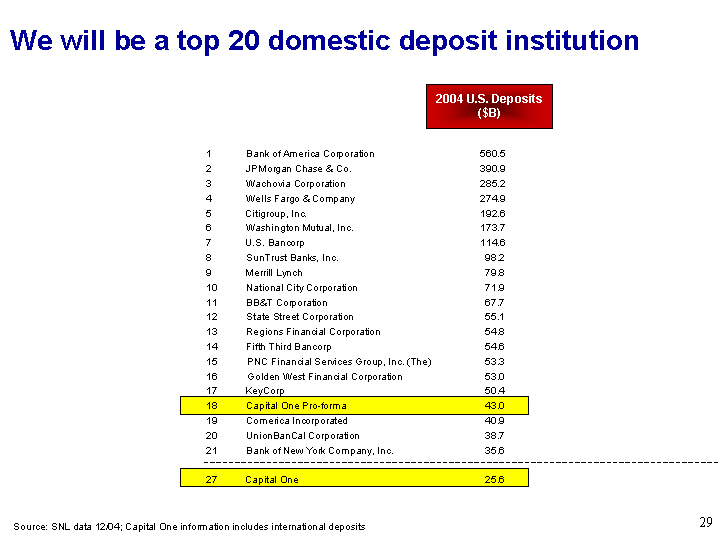
| We will be a top 20 domestic deposit institution Source: SNL data 12/04; Capital One information includes international deposits 1 Bank of America Corporation 560.5 2 JPMorgan Chase & Co. 390.9 3 Wachovia Corporation 285.2 4 Wells Fargo & Company 274.9 5 Citigroup, Inc. 192.6 6 Washington Mutual, Inc. 173.7 7 U.S. Bancorp 114.6 8 SunTrust Banks, Inc. 98.2 9 Merrill Lynch 79.8 10 National City Corporation 71.9 11 BB&T Corporation 67.7 12 State Street Corporation 55.1 13 Regions Financial Corporation 54.8 14 Fifth Third Bancorp 54.6 15 PNC Financial Services Group, Inc. (The) 53.3 16 Golden West Financial Corporation 53.0 17 KeyCorp 50.4 18 Capital One Pro-forma 43.0 19 Comerica Incorporated 40.9 20 UnionBanCal Corporation 38.7 21 Bank of New York Company, Inc. 35.6 27 Capital One 25.6 2004 U.S. Deposits ($B) |
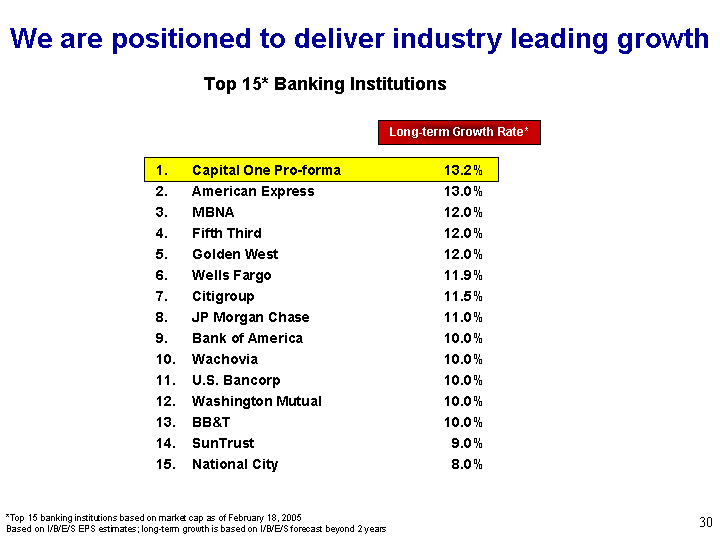
| We are positioned to deliver industry leading growth Top 15* Banking Institutions *Top 15 banking institutions based on market cap as of February 18, 2005 Based on I/B/E/S EPS estimates; long-term growth is based on I/B/E/S forecast beyond 2 years Capital One Pro-forma 13.2% American Express 13.0% MBNA 12.0% Fifth Third 12.0% Golden West 12.0% Wells Fargo 11.9% Citigroup 11.5% JP Morgan Chase 11.0% Bank of America 10.0% Wachovia 10.0% U.S. Bancorp 10.0% Washington Mutual 10.0% BB&T 10.0% SunTrust 9.0% National City 8.0% Long-term Growth Rate* |
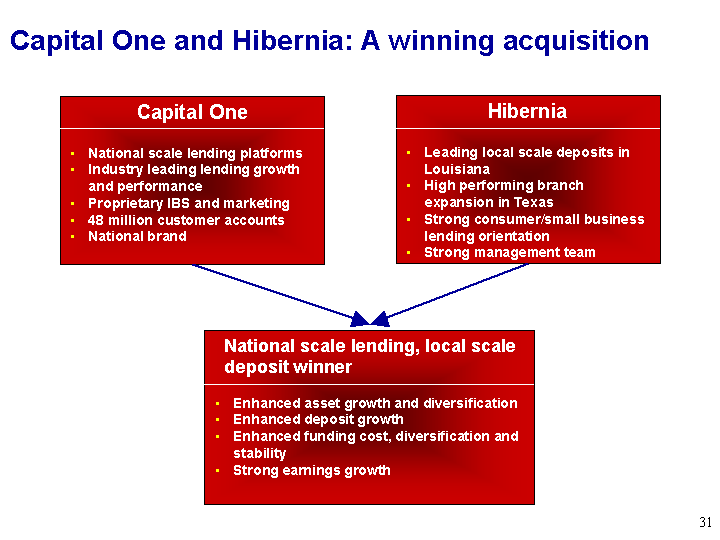
| Capital One and Hibernia: A winning acquisition Capital One National scale lending platforms Industry leading lending growth and performance Proprietary IBS and marketing 48 million customer accounts National brand Hibernia Leading local scale deposits in Louisiana High performing branch expansion in Texas Strong consumer/small business lending orientation Strong management team Enhanced asset growth and diversification Enhanced deposit growth Enhanced funding cost, diversification and stability Strong earnings growth National scale lending, local scale deposit winner Enhanced asset growth and diversification Enhanced deposit growth Enhanced funding cost, diversification and stability Strong earnings growth |
| Transaction Summary and Strategic Rationale Financial Overview |

| Transaction Summary $33.00 in value per Hibernia share (based on the closing price of COF on 3/4/2005) Approximately $5.3 billion Approximately 55% stock and 45% cash Fixed number of Capital One shares of approximately 37.68 million Fixed cash amount of approximately $2.4 billion Shareholders to elect between common stock or cash subject to proration None Tax-free reorganization (tax free to the extent COF stock received) Hibernia CEO Herb Boydstun to head banking at Capital One and report to Capital One CEO Rich Fairbank Board seat to be offered to Hibernia Chairman E.R. Campbell Regulatory and Hibernia shareholder approval 3rd Quarter 2005 Consideration per Share* Transaction value Consideration mix* Form of Consideration Stock / Cash election Walk-away/Caps/Collars Tax Structure Bank Management Board Composition Approvals Expected Closing * Based on COF closing price of $78.08 on 3/4/05 |
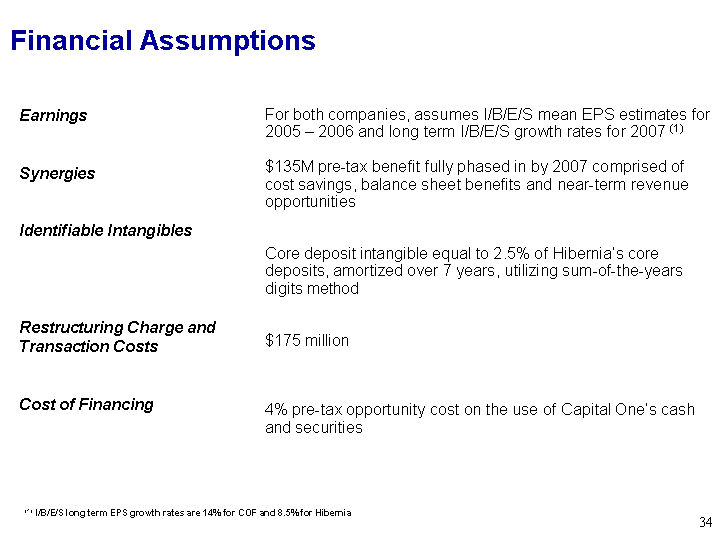
| Financial Assumptions For both companies, assumes I/B/E/S mean EPS estimates for 2005 - 2006 and long term I/B/E/S growth rates for 2007 (1) $135M pre-tax benefit fully phased in by 2007 comprised of cost savings, balance sheet benefits and near-term revenue opportunities Core deposit intangible equal to 2.5% of Hibernia's core deposits, amortized over 7 years, utilizing sum-of-the-years digits method $175 million 4% pre-tax opportunity cost on the use of Capital One's cash and securities Earnings Synergies Identifiable Intangibles Restructuring Charge and Transaction Costs Cost of Financing (1) I/B/E/S long term EPS growth rates are 14% for COF and 8.5% for Hibernia |

| Pro Forma Earnings Impact to 2006 and 2007 ($ in millions) 2006 2007 Capital One Earnings(1) $2,125 $2,460 Hibernia Earnings(1) 348 377 Estimated synergies 39 88 Financing costs (62) (62) CDI Amortization (58) (50) Other Costs(2) (15) (13) Pro Forma GAAP Earnings $2,377 $2,800 Pro Forma Cash Earnings 2,435 2,850 Pro Forma Operating Earnings 2,392 2,811 (1) Illustrative based on I/B/E/S earnings per share estimates at 3/4/05 (2) Excludes estimated purchase accounting adjustments. Includes expensed restructuring costs. After-tax impacts: |

| The transaction is expected to be accretive by 2007 ($ in millions) 2006 2007 Pro Forma GAAP Earnings $2,377 $2,800 Pro Forma Cash Earnings 2,435 2,850 Standalone GAAP EPS(1) $7.72 $8.80 Pro Forma GAAP EPS 7.60 8.83 Accretion / (Dilution) (1.6%) 0.3% Standalone Operating EPS(1) $7.72 $8.80 Pro Forma Operating EPS 7.64 8.86 Accretion / (Dilution) (1.0%) 0.7% Standalone Cash EPS(1) $7.72 $8.80 Pro Forma Cash EPS 7.78 8.98 Accretion / (Dilution) 0.8% 2.1% Pro Forma Operating Earnings 2,392 2,811 (1) Illustrative based on I/B/E/S estimate at 3/4/05 |

| Estimated 2007 Pretax Synergies Identified, near-term synergies Assumes 45% achieved in 2006 and 100% achieved in 2007 ($ in millions) Pretax 2007 Synergy Expense $75 Balance sheet benefits 25 Revenue opportunities 35 Total $135 |

| Estimated merger related costs ($ in millions) Personnel Operations $75 45 $140 35 $175 Pre-tax impact As a multiple of pre- tax cost savings Other 20 Total Restructuring Costs Transaction Costs Total Merger Related Costs 1.9x 2.3x * The majority of merger related costs will be capitalized. - - - |
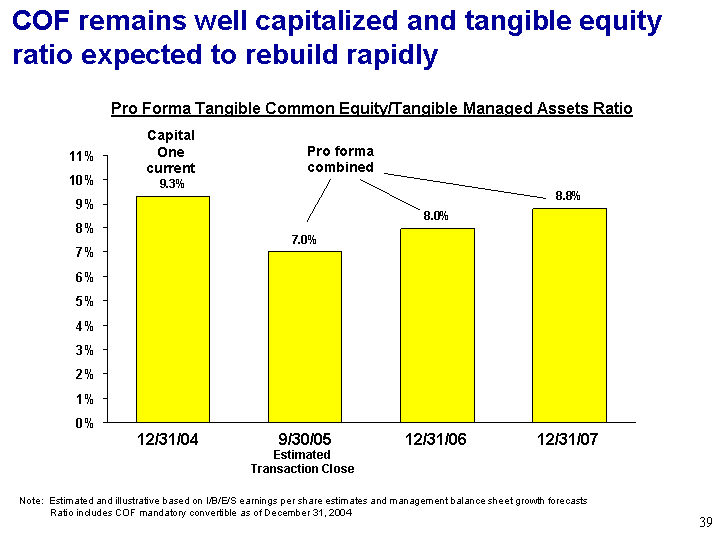
| 2005 9/30/2005 2006 Pro Forma 2007 Pro Forma COF 0.093 0.07 0.0798 0.088 COF remains well capitalized and tangible equity ratio expected to rebuild rapidly Note: Estimated and illustrative based on I/B/E/S earnings per share estimates and management balance sheet growth forecasts Ratio includes COF mandatory convertible as of December 31, 2004 12/31/04 9/30/05 12/31/06 12/31/07 Estimated Transaction Close Pro Forma Tangible Common Equity/Tangible Managed Assets Ratio Capital One current Pro forma combined |
