
| Debt & Equity Conference Introduction Presentation October 30, 2003 |
| Please note that the following materials containing information regarding Capital One's financial performance speak only as of the particular date or dates indicated in these materials. Capital One does not undertake any obligation to update or revise any of the information contained herein whether as a result of new information, future events or otherwise. Certain statements in this presentation and other oral and written statements made by the Company from time to time, are forward-looking statements, including those that discuss strategies, goals, outlook or other non- historical matters; or project revenues, income, returns or other financial measures. To the extent any such information is forward-looking, it is intended to fit within the safe harbor for forward-looking information provided by the Private Securities Litigation Reform Act of 1995. Numerous factors could cause our actual results to differ materially from those described in forward-looking statements, including, among other things: continued intense competition from numerous providers of products and services which compete with our businesses; an increase in credit losses (including increases due to worsening of economic conditions); our ability to continue to securitize our credit cards and consumer loans and to otherwise access the capital markets at attractive rates and terms to fund our operations and future growth; losses associated with new products or services or expansion internationally; any significant disruption of, or loss of public confidence in, the United States Mail service affecting our response rates and consumer payments; our ability to recruit experienced personnel to assist in the management and operations of new products and services; and other factors listed from time to time in reports we file with the Securities and Exchange Commission (the "SEC") , including, but not limited to, factors set forth under the caption "Risk Factors" in our Annual Report on Form 10-K for the year ended December 31, 2002, and any subsequent quarterly reports on Form 10-Q. You should carefully consider the factors discussed above in evaluating these forward-looking statements. All information in these slides is based on the consolidated results of Capital One Financial Corporation. Further information about Capital One can be obtained from the Corporation's public filings with the SEC. A reconciliation of any non-GAAP financial measures included in this presentation can be found in the Company's most recent Form 8-K or Form 10-Q concerning quarterly financial results, available on the Company's website at www.capitalone.com in the Investor Center under "About Capital One." Forward looking statements |
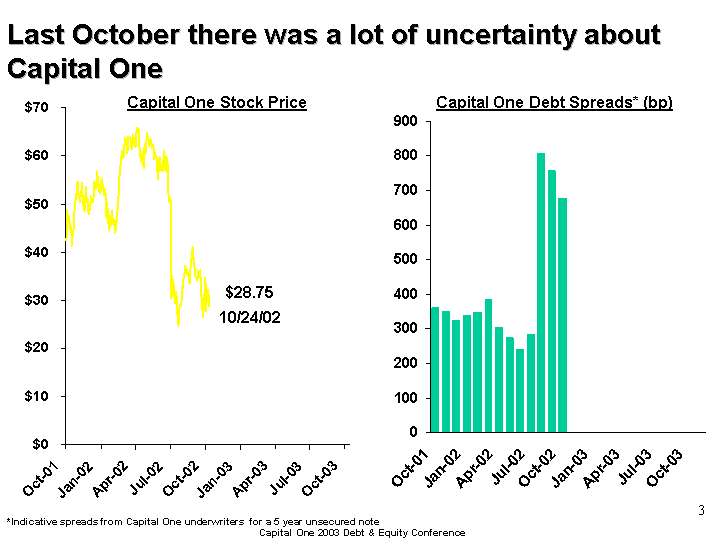
| Last October there was a lot of uncertainty about Capital One Date Stock Price 10/15/2001 42.5 10/16/2001 43.13 10/17/2001 47.89 10/18/2001 48.65 10/19/2001 47.67 10/22/2001 47.65 10/23/2001 47.6 10/24/2001 45.85 10/25/2001 44.81 10/26/2001 46.12 10/29/2001 44.51 10/30/2001 43.56 10/31/2001 41.31 11/1/2001 43.45 11/2/2001 44.04 11/5/2001 44.75 11/6/2001 47.13 11/7/2001 49.76 11/8/2001 50 11/9/2001 50.65 11/12/2001 51.8 11/13/2001 53.88 11/14/2001 54.5 11/15/2001 54.63 11/16/2001 51.9 11/19/2001 51.85 11/20/2001 51.12 11/21/2001 50.4 11/23/2001 52.04 11/26/2001 53.06 11/27/2001 54.45 11/28/2001 52.04 11/29/2001 51.5 11/30/2001 50.03 12/3/2001 48.55 12/4/2001 50.15 12/5/2001 51.35 12/6/2001 53.51 12/7/2001 52.07 12/10/2001 50.1 12/11/2001 51.08 12/12/2001 49.53 12/13/2001 48.3 12/14/2001 47.89 12/17/2001 48.95 12/18/2001 50.08 12/19/2001 51.7 12/20/2001 51.3 12/21/2001 50.35 12/24/2001 50.38 12/26/2001 51.34 12/27/2001 52.8 12/28/2001 54.73 12/31/2001 53.95 1/2/2002 53.12 1/3/2002 53.36 1/4/2002 56.9 1/7/2002 55.3 1/8/2002 54.41 1/9/2002 54.2 1/10/2002 53.45 1/11/2002 52.43 1/14/2002 52.3 1/15/2002 53.55 1/16/2002 54.36 1/17/2002 55.4 1/18/2002 54.84 1/22/2002 53.16 1/23/2002 52 1/24/2002 52.7 1/25/2002 53.25 1/28/2002 51.26 1/29/2002 47.11 1/30/2002 47.9 1/31/2002 50.17 2/1/2002 48.41 2/4/2002 45.56 2/5/2002 44.55 2/6/2002 44.42 2/7/2002 46.16 2/8/2002 47.52 2/11/2002 45.68 2/12/2002 47.6 2/13/2002 48.75 2/14/2002 47.46 2/15/2002 45.99 2/19/2002 45.38 2/20/2002 46.71 2/21/2002 44.9 2/22/2002 44.09 2/25/2002 47 2/26/2002 47.38 2/27/2002 48.9 2/28/2002 49.27 3/1/2002 50.59 3/4/2002 55.2 3/5/2002 56.2 3/6/2002 57.1 3/7/2002 58.19 Capital One Stock Price Capital One Debt Spreads* (bp) 10/1/2001 362 11/1/2001 350 12/1/2001 325 1/1/2002 340 2/1/2002 349 3/1/2002 385 4/1/2002 306 5/1/2002 275 6/1/2002 240 7/1/2002 284 8/1/2002 808 9/1/2002 757 10/1/2002 677 11/1/2002 12/1/2002 1/1/2003 2/7/2003 3/7/2003 4/4/2003 5/5/2003 6/2/2003 7/7/2003 8/4/2003 9/1/2003 10/6/2003 *Indicative spreads from Capital One underwriters for a 5 year unsecured note $28.75 10/24/02 |

| We have rebounded Date Stock Price 10/15/2001 42.5 10/16/2001 43.13 10/17/2001 47.89 10/18/2001 48.65 10/19/2001 47.67 10/22/2001 47.65 10/23/2001 47.6 10/24/2001 45.85 10/25/2001 44.81 10/26/2001 46.12 10/29/2001 44.51 10/30/2001 43.56 10/31/2001 41.31 11/1/2001 43.45 11/2/2001 44.04 11/5/2001 44.75 11/6/2001 47.13 11/7/2001 49.76 11/8/2001 50 11/9/2001 50.65 11/12/2001 51.8 11/13/2001 53.88 11/14/2001 54.5 11/15/2001 54.63 11/16/2001 51.9 11/19/2001 51.85 11/20/2001 51.12 11/21/2001 50.4 11/23/2001 52.04 11/26/2001 53.06 11/27/2001 54.45 11/28/2001 52.04 11/29/2001 51.5 11/30/2001 50.03 12/3/2001 48.55 12/4/2001 50.15 12/5/2001 51.35 12/6/2001 53.51 12/7/2001 52.07 12/10/2001 50.1 12/11/2001 51.08 12/12/2001 49.53 12/13/2001 48.3 12/14/2001 47.89 12/17/2001 48.95 12/18/2001 50.08 12/19/2001 51.7 12/20/2001 51.3 12/21/2001 50.35 12/24/2001 50.38 12/26/2001 51.34 12/27/2001 52.8 12/28/2001 54.73 12/31/2001 53.95 1/2/2002 53.12 1/3/2002 53.36 1/4/2002 56.9 1/7/2002 55.3 1/8/2002 54.41 1/9/2002 54.2 1/10/2002 53.45 1/11/2002 52.43 1/14/2002 52.3 1/15/2002 53.55 1/16/2002 54.36 1/17/2002 55.4 1/18/2002 54.84 1/22/2002 53.16 1/23/2002 52 1/24/2002 52.7 1/25/2002 53.25 1/28/2002 51.26 1/29/2002 47.11 1/30/2002 47.9 1/31/2002 50.17 2/1/2002 48.41 2/4/2002 45.56 2/5/2002 44.55 2/6/2002 44.42 2/7/2002 46.16 2/8/2002 47.52 2/11/2002 45.68 2/12/2002 47.6 2/13/2002 48.75 2/14/2002 47.46 2/15/2002 45.99 2/19/2002 45.38 2/20/2002 46.71 2/21/2002 44.9 2/22/2002 44.09 2/25/2002 47 2/26/2002 47.38 2/27/2002 48.9 2/28/2002 49.27 3/1/2002 50.59 3/4/2002 55.2 3/5/2002 56.2 3/6/2002 57.1 3/7/2002 58.19 Capital One Stock Price Capital One Debt Spreads* (bp) 10/1/2001 362 11/1/2001 350 12/1/2001 325 1/1/2002 340 2/1/2002 349 3/1/2002 385 4/1/2002 306 5/1/2002 275 6/1/2002 240 7/1/2002 284 8/1/2002 808 9/1/2002 757 10/1/2002 677 11/1/2002 650 12/1/2002 450 1/1/2003 525 2/7/2003 400 3/7/2003 405 4/4/2003 338 5/5/2003 225 6/2/2003 230 7/7/2003 185 8/4/2003 170 9/1/2003 150 10/6/2003 110 *Indicative spreads from Capital One underwriters for a 5 year unsecured note $64.12 10/28/03 |

| Maintained capital and allowances at high levels Established Enterprise Risk Management function Strengthened and implemented policies and procedures Nearly completed our program to address the MOU Our regulatory relationships have strengthened significantly since last year |
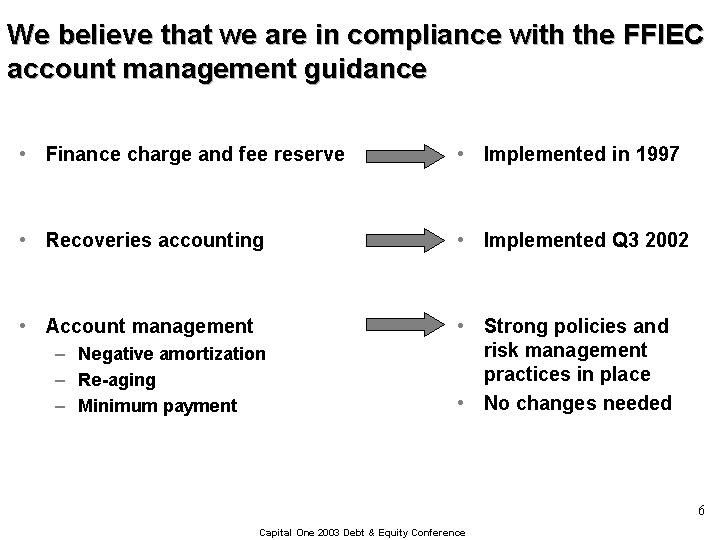
| We believe that we are in compliance with the FFIEC account management guidance Finance charge and fee reserve Recoveries accounting Account management Negative amortization Re-aging Minimum payment Implemented in 1997 Implemented Q3 2002 Strong policies and risk management practices in place No changes needed |

| Last October, we projected an increase in charge- offs through the first half of 2003 Capital One's Monthly Managed Net Charge-off Rate Quarterly Guidance: Low 6's Mid 6's High 6's Col 2 1/1/2002 0.0619 2/1/2002 0.0619 3/1/2002 0.0619 4/1/2002 0.0629 5/1/2002 0.0629 6/1/2002 0.0629 7/1/2002 0.0482 0.0579 8/1/2002 0.0475 0.0579 9/1/2002 0.0529 0.0579 10/1/2002 0.0562 0.0599 11/1/2002 0.0599 12/1/2002 0.0599 1/1/2003 0.062 2/1/2003 0.062 3/1/2003 0.062 4/1/2003 0.062 5/1/2003 0.062 6/1/2003 0.062 7/1/2003 8/1/2003 9/3/2003 |

| Our charge-off rate went up as predicted Capital One's Monthly Managed Net Charge-off Rate Quarterly Guidance: Low 6's Mid 6's High 6's Col 2 1/1/2002 0.0619 2/1/2002 0.0619 3/1/2002 0.0619 4/1/2002 0.0629 5/1/2002 0.0629 6/1/2002 0.0629 7/1/2002 0.0482 0.0579 8/1/2002 0.0475 0.0579 9/1/2002 0.0529 0.0579 10/1/2002 0.0562 0.0599 11/1/2002 0.064 0.0599 12/1/2002 0.0659 0.0599 1/1/2003 0.062 2/1/2003 0.062 3/1/2003 0.062 4/1/2003 0.062 5/1/2003 0.062 6/1/2003 0.062 7/1/2003 8/1/2003 9/3/2003 |
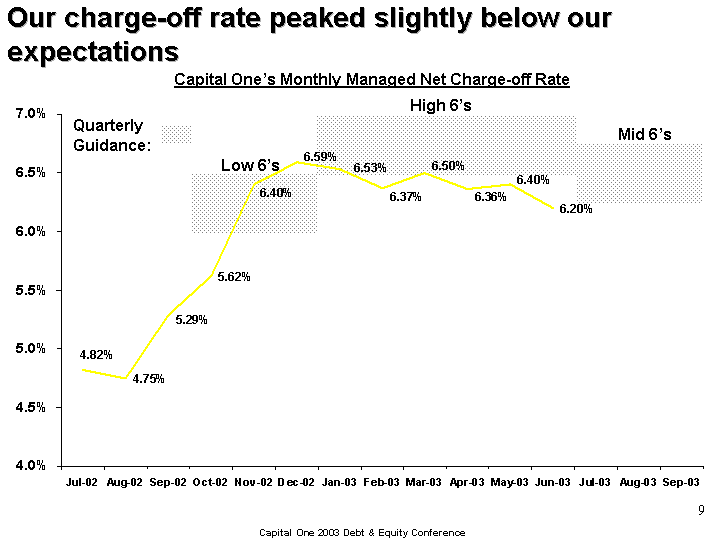
| Our charge-off rate peaked slightly below our expectations Capital One's Monthly Managed Net Charge-off Rate Quarterly Guidance: Low 6's Mid 6's High 6's Col 2 1/1/2002 0.0619 2/1/2002 0.0619 3/1/2002 0.0619 4/1/2002 0.0629 5/1/2002 0.0629 6/1/2002 0.0629 7/1/2002 0.0482 0.0579 8/1/2002 0.0475 0.0579 9/1/2002 0.0529 0.0579 10/1/2002 0.0562 0.0599 11/1/2002 0.064 0.0599 12/1/2002 0.0659 0.0599 1/1/2003 0.0653 0.062 2/1/2003 0.0637 0.062 3/1/2003 0.065 0.062 4/1/2003 0.0636 0.062 5/1/2003 0.064 0.062 6/1/2003 0.062 0.062 7/1/2003 8/1/2003 9/3/2003 |
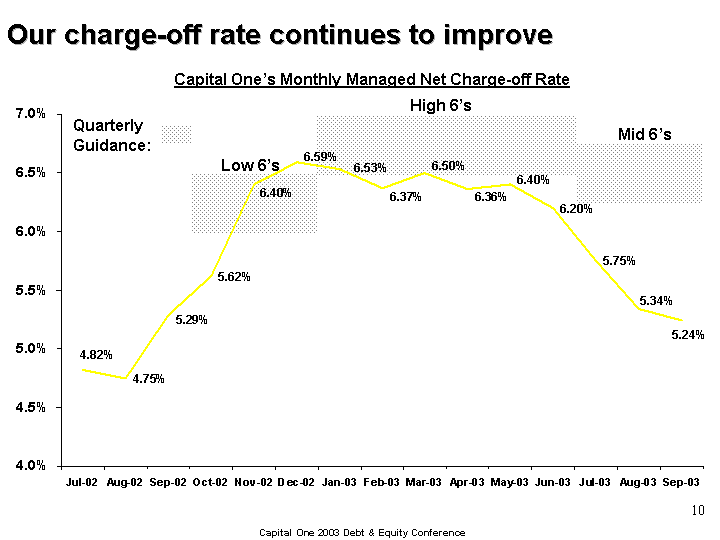
| Our charge-off rate continues to improve Capital One's Monthly Managed Net Charge-off Rate Quarterly Guidance: Low 6's Mid 6's High 6's Col 2 1/1/2002 0.0619 2/1/2002 0.0619 3/1/2002 0.0619 4/1/2002 0.0629 5/1/2002 0.0629 6/1/2002 0.0629 7/1/2002 0.0482 0.0579 8/1/2002 0.0475 0.0579 9/1/2002 0.0529 0.0579 10/1/2002 0.0562 0.0599 11/1/2002 0.064 0.0599 12/1/2002 0.0659 0.0599 1/1/2003 0.0653 0.062 2/1/2003 0.0637 0.062 3/1/2003 0.065 0.062 4/1/2003 0.0636 0.062 5/1/2003 0.064 0.062 6/1/2003 0.062 0.062 7/1/2003 0.0575 8/1/2003 0.0534 9/3/2003 0.0524 |
| Charge-offs are declining for several reasons Continued strong performance of loans across the company Very strong recoveries Moving past the charge-off spike from subprime loans booked in late '01/early '02 The continued mix shift upmarket and into diversified businesses The denominator effect of growth |
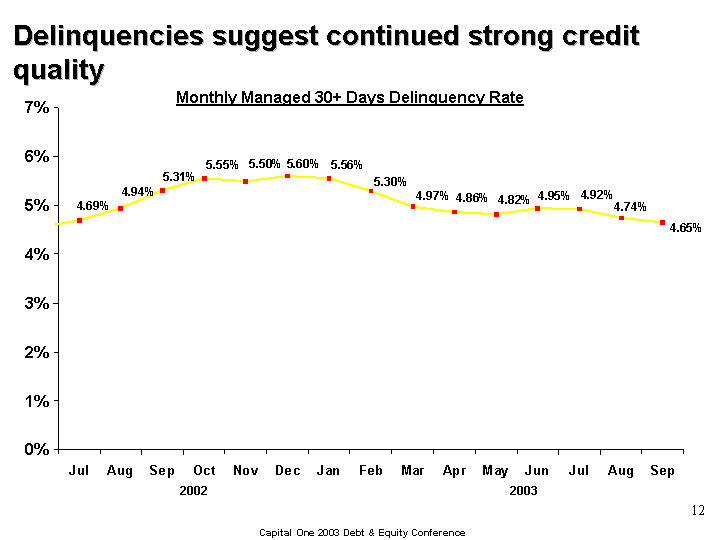
| 2002 2003 Monthly Managed 30+ Days Delinquency Rate Delinquencies suggest continued strong credit quality 1/1/2001 0.0534 2/1/2001 0.0525 3/1/2001 0.0473 4/1/2001 0.0479 5/1/2001 0.0485 6/1/2001 0.0493 7/1/2001 0.0511 8/1/2001 0.0514 9/1/2001 0.052 10/1/2001 0.0506 11/1/2001 0.0496 12/1/2001 0.0495 1/1/2002 0.0516 2/1/2002 0.0506 3/1/2002 0.048 4/1/2002 0.0467 5/1/2002 0.0461 6/1/2002 0.0454 7/1/2002 0.0469 8/1/2002 0.0494 9/1/2002 0.0531 10/1/2002 0.0555 11/1/2002 0.055 12/1/2002 0.056 1/1/2003 0.0556 2/1/2003 0.053 3/1/2003 0.0497 4/1/2003 0.0486 5/1/2003 0.0482 6/1/2003 0.0495 7/1/2003 0.0492 8/1/2003 0.0474 9/1/2003 0.0465 |
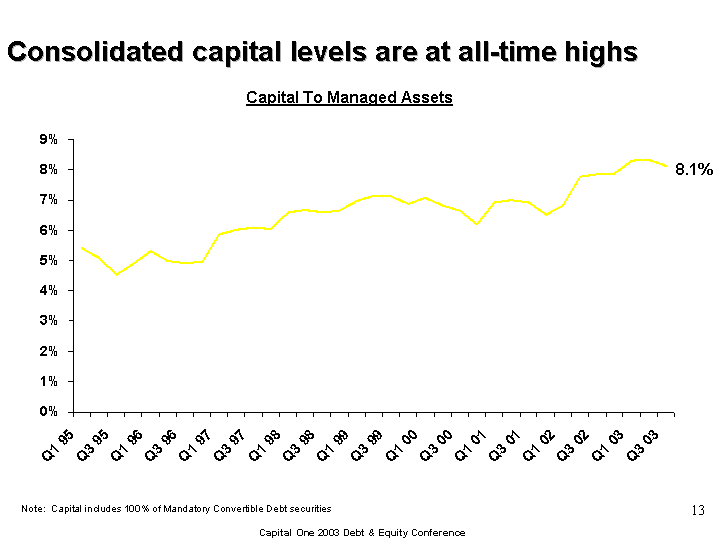
| Consolidated capital levels are at all-time highs Q1 95 Q2 95 Q3 95 Q4 95 Q1 96 Q2 96 Q3 96 Q4 96 Q1 97 Q2 97 Q3 97 Q4 97 Q1 98 Q2 98 Q3 98 Q4 98 Q1 99 Q2 99 Q3 99 Q4 99 Q1 00 Q2 00 Q3 00 Q4 00 Q1 01 Q2 01 Q3 01 Q4 01 Q1 02 Q2 02 Q3 02 Q4 02 Q1 03 Q2 03 Q3 03 Capital/Managed 0.0541 0.0508 0.0454 0.0488 0.0531 0.05 0.0491 0.0496 0.0586 0.0601 0.0609 0.0603 0.0659 0.0668 0.066 0.0664 0.0698 0.0715 0.0712 0.0687 0.0706 0.0681 0.0665 0.0619 0.0693 0.07 0.0693 0.0652 0.0682 0.0778 0.0785 0.0786 0.083 0.0833 0.0812 Capital + ALLL/Managed 0.0615 0.0575 0.0511 0.0546 0.0593 0.0556 0.0556 0.0575 0.0665 0.0679 0.0703 0.0714 0.0789 0.079 0.078 0.0776 0.0821 0.0842 0.0853 0.0827 0.0865 0.084 0.0827 0.0778 0.0856 0.0859 0.0856 0.0812 0.086 0.0977 0.1028 0.1035 0.107 0.1048 0.1009 Note: Capital includes 100% of Mandatory Convertible Debt securities 8.1% Capital To Managed Assets |
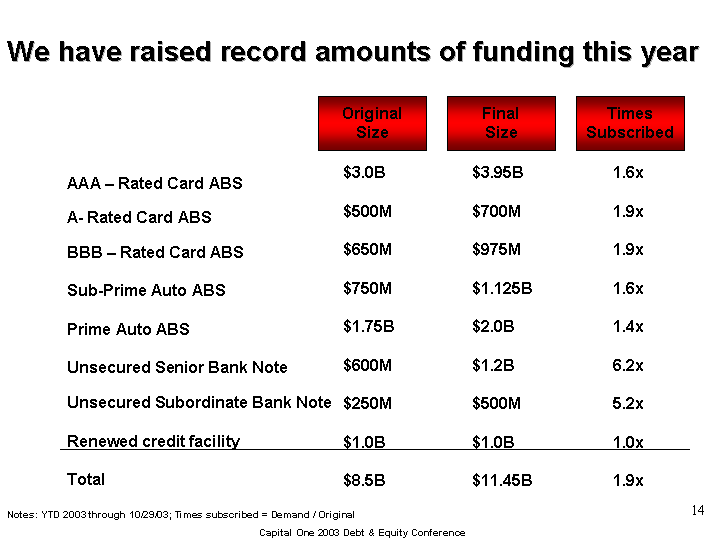
| We have raised record amounts of funding this year AAA - Rated Card ABS A- Rated Card ABS BBB - Rated Card ABS Sub-Prime Auto ABS Prime Auto ABS Unsecured Senior Bank Note Unsecured Subordinate Bank Note Renewed credit facility Total Original Size Final Size Times Subscribed 1.6x 1.9x 1.9x 1.6x 1.4x 6.2x 5.2x 1.0x 1.9x $3.95B $700M $975M $1.125B $2.0B $1.2B $500M $1.0B $11.45B $3.0B $500M $650M $750M $1.75B $600M $250M $1.0B $8.5B Notes: YTD 2003 through 10/29/03; Times subscribed = Demand / Original |

| We have a strong management team CEO (Rich Fairbank) Auto (Dave Lawson) Finance (Gary Perlin) Credit (Peter Schnall) Enterprise Ops (Catherine West) IT (Gregor Bailar) HR (Matt Schuyler) Corp. Reputation & Governance (John Finneran) U.S. Card (Catherine West) Global Financial Services (Larry Klane) |
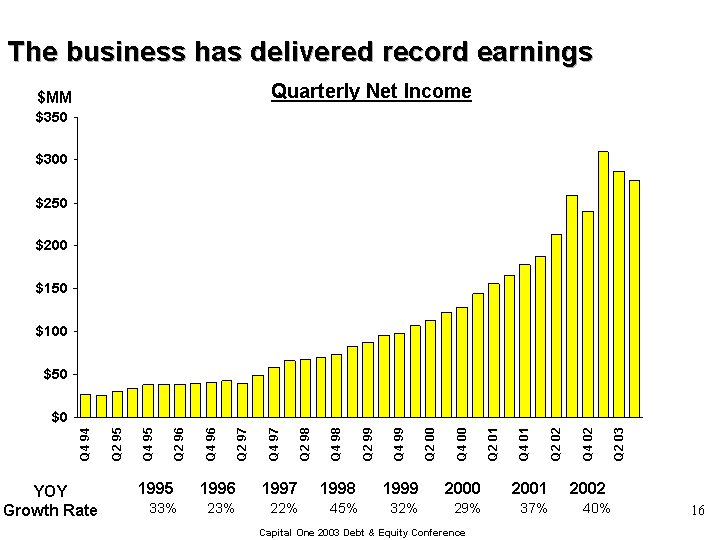
| The business has delivered record earnings Q4 94 Q1 95 Q2 95 Q3 95 Q4 95 Q1 96 Q2 96 Q3 96 Q4 96 Q1 97 Q2 97 Q3 97 Q4 97 Q1 98 Q2 98 Q3 98 Q4 98 Q1 99 Q2 99 Q3 99 Q4 99 Q1 00 Q2 00 Q3 00 Q4 00 Q1 01 Q2 01 Q3 01 Q4 01 Q1 02 Q2 02 Q3 02 Q4 02 Q1 03 Q2 03 Q3 03 26.5 25.1 29.646 33.948 37.808 38.013 38.183 38.821 40.25 42.482 39.352 49.33 58.217 65.703 66.853 70.006 72.669 82.379 87.478 95.362 97.872 106.709 112.525 122.123 128.277 143.6 155.3 165.3 177.7 188 213.1 258.8 239.7 309.1 286.8 276.3 Quarterly Net Income YOY Growth Rate 1995 1996 1997 1998 1999 2000 2001 2002 33% 23% 22% 45% 32% 29% 37% 40% $MM |
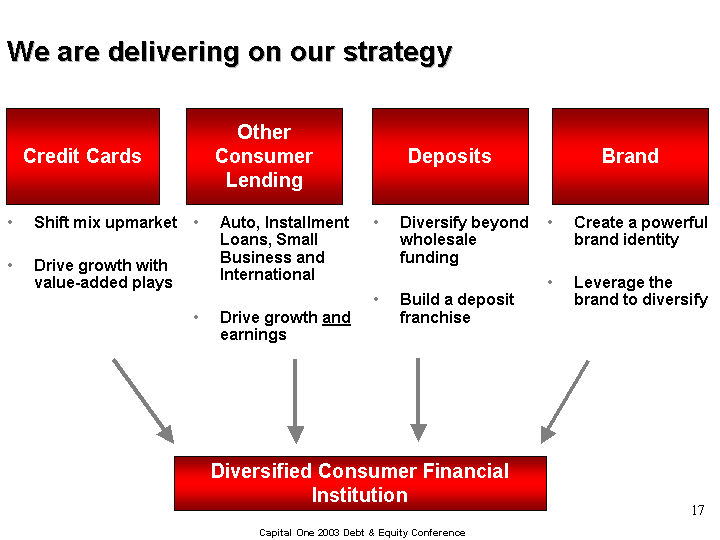
| We are delivering on our strategy Shift mix upmarket Drive growth with value-added plays Credit Cards Deposits Other Consumer Lending Auto, Installment Loans, Small Business and International Drive growth and earnings Diversify beyond wholesale funding Build a deposit franchise Diversified Consumer Financial Institution Brand Create a powerful brand identity Leverage the brand to diversify |
| We are delivering on our strategy Shift mix upmarket Drive growth with value-added plays Credit Cards Deposits Other Consumer Lending Auto, Installment Loans, Small Business and International Drive growth and earnings Diversify beyond wholesale funding Build a deposit franchise Diversified Consumer Financial Institution Brand Create a powerful brand identity Leverage the brand to diversify |

| We have diversified our card business along two dimensions Prime + Subprime and Superprime Credit Spectrum Value Proposition Price + Value-added plays - Lifestyles - Rewards - No Hassle/Brand Shift upmarket Compelling offers for consumers |
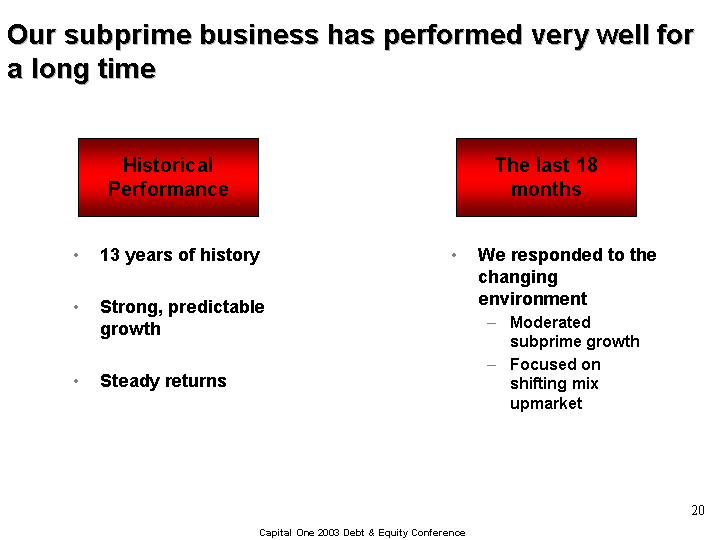
| Our subprime business has performed very well for a long time 13 years of history Strong, predictable growth Steady returns Historical Performance The last 18 months We responded to the changing environment Moderated subprime growth Focused on shifting mix upmarket |
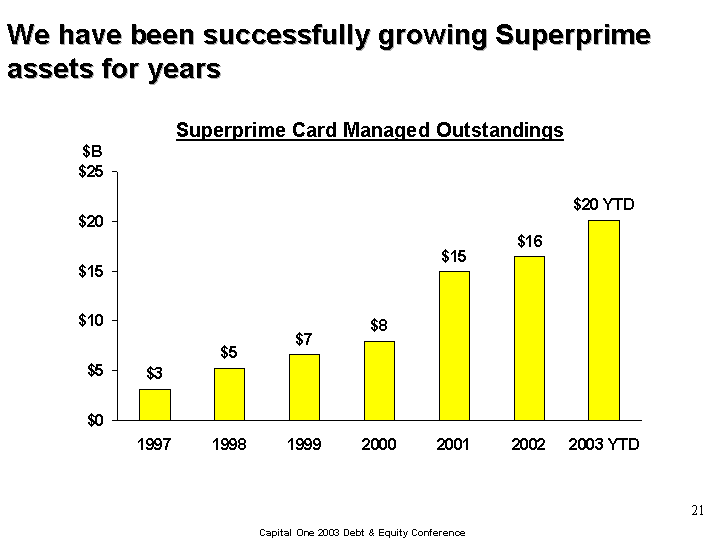
| We have been successfully growing Superprime assets for years $B 1997 1998 1999 2000 2001 2002 2003 YTD Superprime 3.08 5.2 6.56 7.98 14.95 16.48 20.16 Superprime Card Managed Outstandings |
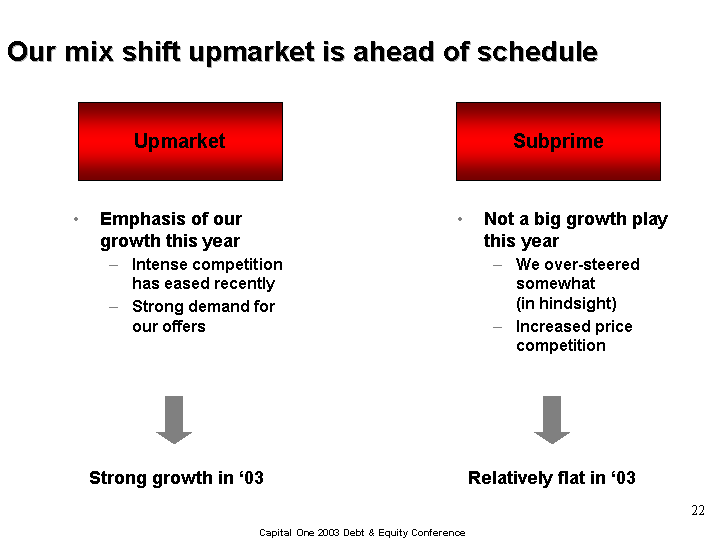
| Our mix shift upmarket is ahead of schedule Emphasis of our growth this year Intense competition has eased recently Strong demand for our offers Upmarket Subprime Not a big growth play this year We over-steered somewhat (in hindsight) Increased price competition Strong growth in '03 Relatively flat in '03 |
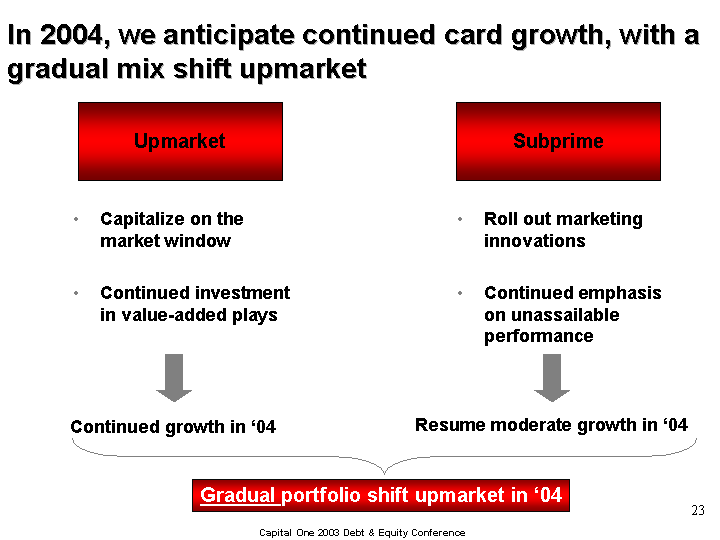
| In 2004, we anticipate continued card growth, with a gradual mix shift upmarket Capitalize on the market window Continued investment in value-added plays Upmarket Subprime Roll out marketing innovations Continued emphasis on unassailable performance Continued growth in '04 Resume moderate growth in '04 Gradual portfolio shift upmarket in '04 |
| The accelerated mix shift in 2003 impacts profit dynamics in 2004 Subprime : more front-loaded returns Superprime: more back-loaded returns Dampens earnings growth in late '03 and in '04 |
| We have diversified our card business along two dimensions Prime + Subprime and Superprime Credit Spectrum Value Proposition Price + Value-added plays - Lifestyles - Rewards - No Hassle/Brand Shift upmarket Compelling offers for consumers |
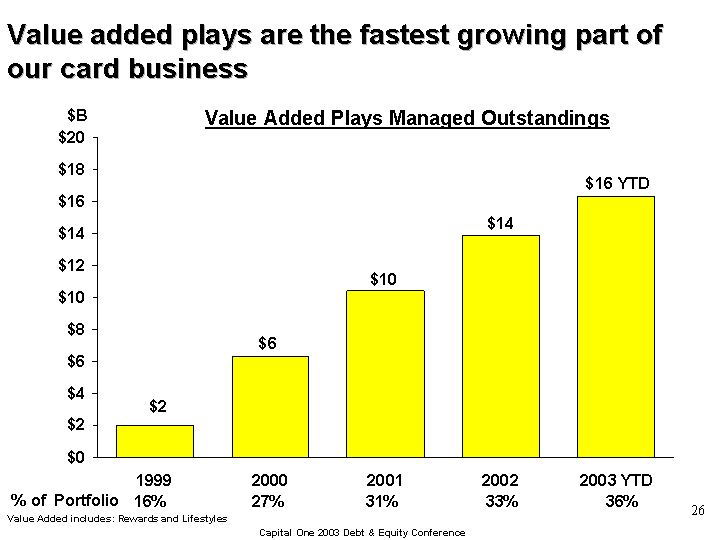
| Value added plays are the fastest growing part of our card business Value Added Plays Managed Outstandings $B 1999 2000 2001 2002 2003 YTD Value Added 2 6.3 10.4 13.9 16.3 Value Added includes: Rewards and Lifestyles 16% 27% 31% 33% 36% % of Portfolio |
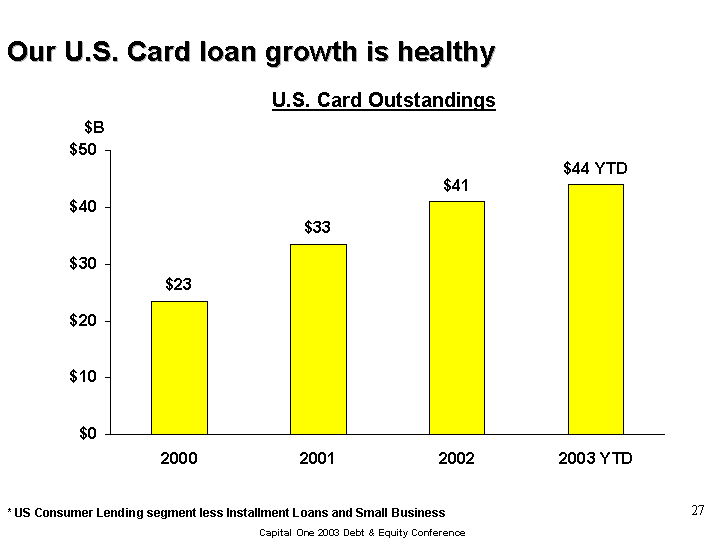
| Our U.S. Card loan growth is healthy U.S. Card Outstandings $B 2000 2001 2002 2003 YTD USCM 23.4 33.499 41 44 * US Consumer Lending segment less Installment Loans and Small Business |
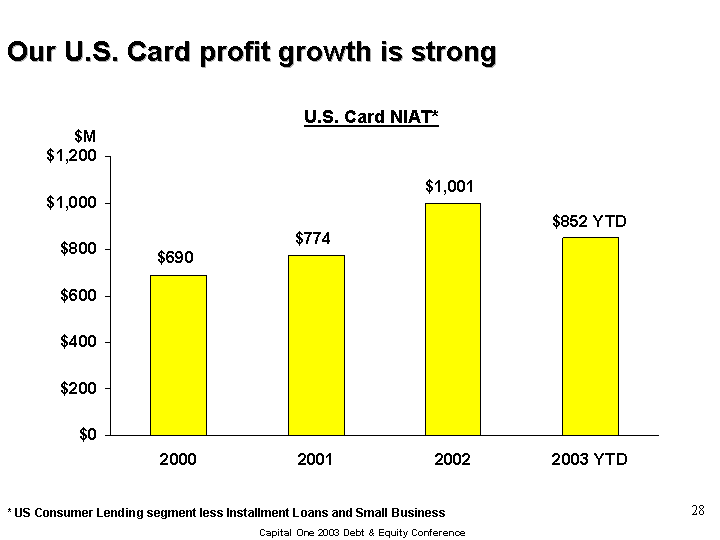
| Our U.S. Card profit growth is strong U.S. Card NIAT* $M 2000 2001 2002 2003 YTD USCM 690.38 774.13 1000.76 852 * US Consumer Lending segment less Installment Loans and Small Business |

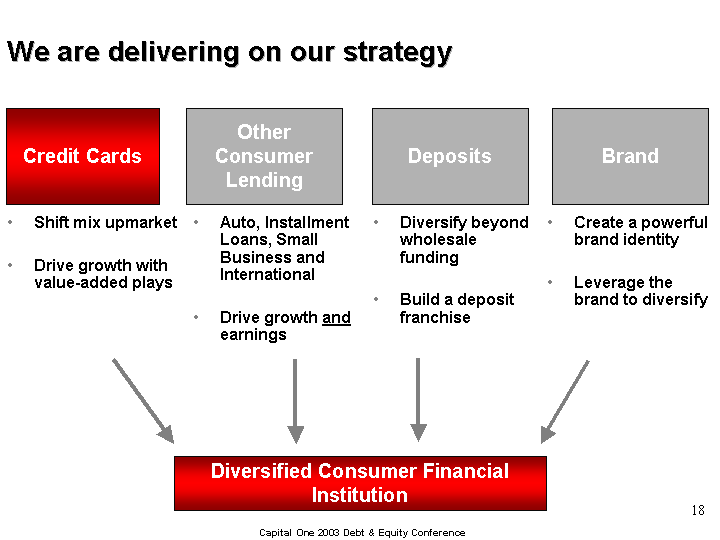
| We are delivering on our strategy Shift mix upmarket Drive growth with value-added plays Credit Cards Deposits Other Consumer Lending Auto, Installment Loans, Small Business and International Drive growth and earnings Diversify beyond wholesale funding Build a deposit franchise Diversified Consumer Financial Institution Brand Create a powerful brand identity Leverage the brand to diversify |
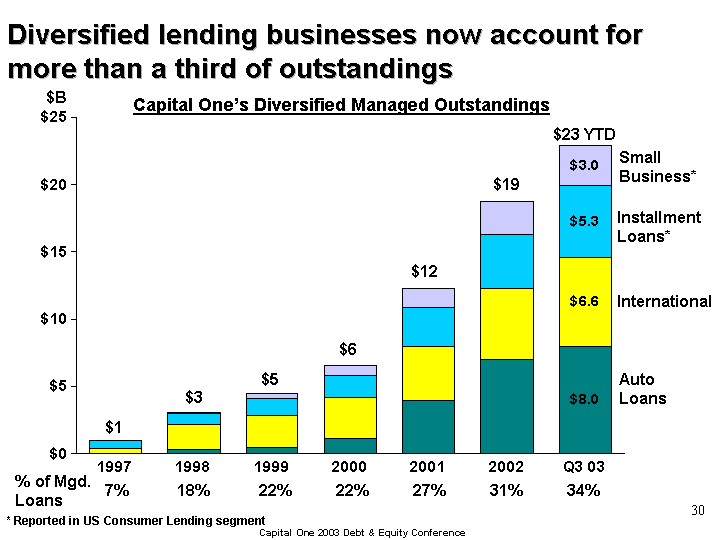
| Diversified lending businesses now account for more than a third of outstandings Year 1997 1998 1999 2000 2001 2002 Q3 03 Auto 0 0.3 0.5 1.2 4 7 8 International 0.4 1.9 2.4 3 4 5.3 6.6 Installment 0.6 0.8 1.2 1.6 2.9 4 5.3 Small Business 0.008 0.074 0.397 0.749 1.385 2.457 3 Installment Loans* International $3 $5 $6 % of Mgd. Loans 7% 18% 22% 22% 27% 31% 34% $12 Auto Loans $19 $23 YTD $1 Small Business* Capital One's Diversified Managed Outstandings $B * Reported in US Consumer Lending segment |
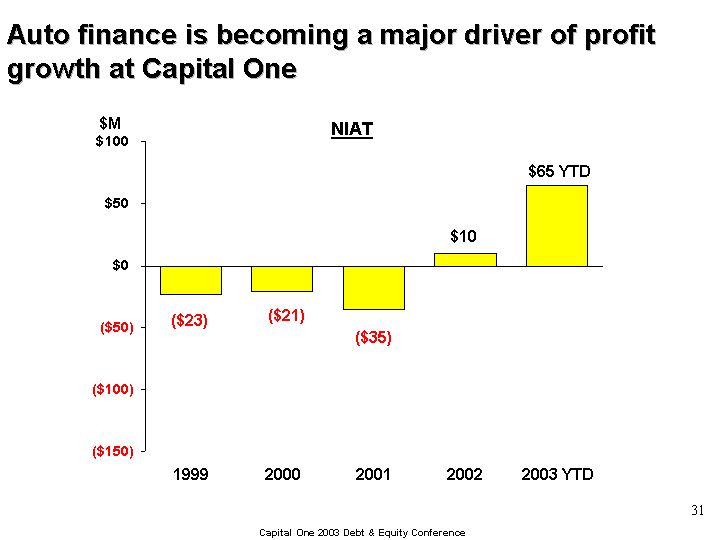
| Auto finance is becoming a major driver of profit growth at Capital One NIAT 1998 1999 2000 2001 2002 2003 YTD 2003E 2004E 2005 2006 2007 06E 07E Strategy -19 -23 -21 -35 10 64.9 99 165 210 250 300 $M |
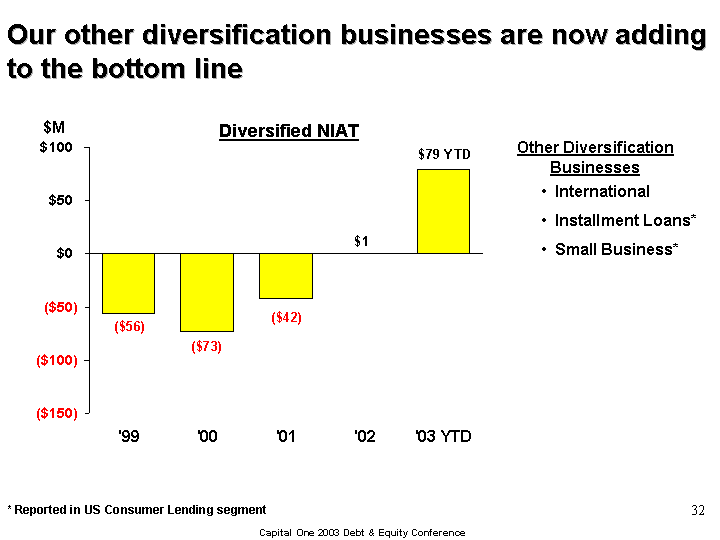
| Our other diversification businesses are now adding to the bottom line Diversified NIAT Other Diversification Businesses International Installment Loans* Small Business* '96 '97 '98 '99 '00 '01 '02 '03 YTD '03E '04E '05E 06E 07E International -3.6 -15.3 -62.2 -67.2 -91.2 -46.3 -35.6 40.7 41.6 48 IL -7 -5 24 10 6.6 20.4 18.4 43.1 76.8 110 72 Small Bus -15.8 -0.6 -0.1 21.8 22.3 50.1 67.6 Amerifee -8.5 -6.1 -5.5 0.4 5.4 COAF -5.1 -7.5 -21 -35.4 10.3 115 165 210 Total everything -3.6 -22.3 -76.39 -63.96 -94.23 -87.84 10.8 149 175 346.03 407.8 110 72 No Auto -56 -73 -42 0.5 79.2 $M * Reported in US Consumer Lending segment |
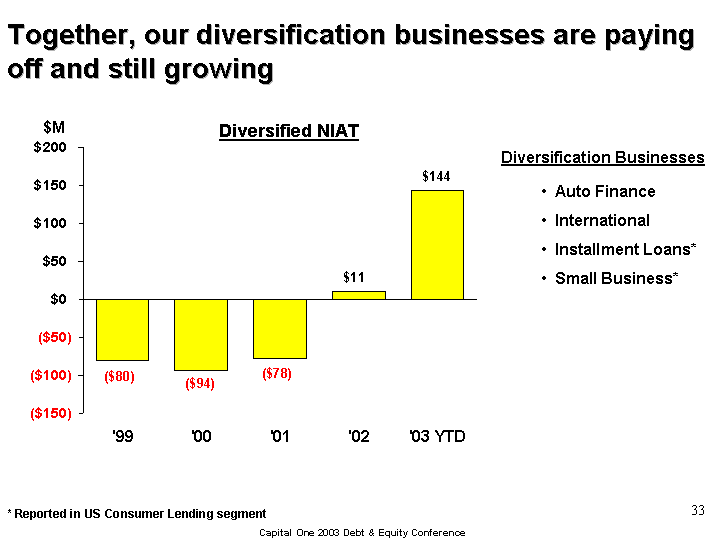
| Together, our diversification businesses are paying off and still growing Diversified NIAT Diversification Businesses Auto Finance International Installment Loans* Small Business* '96 '97 '98 '99 '00 '01 '02 '03 YTD '03E '04E '05E 06E 07E International -3.6 -15.3 -62.2 -67.2 -91.2 -46.3 -35.6 40.7 41.6 48 IL -7 -5 24 10 6.6 20.4 18.4 43.1 76.8 110 72 Small Bus -15.8 -0.6 -0.1 21.8 22.3 50.1 67.6 Amerifee -8.5 -6.1 -5.5 0.4 5.4 COAF -5.1 -7.5 -21 -35.4 10.3 115 165 210 Total everything -3.6 -22.3 -90 -80 -94 -78 10.8 144 175 346.03 407.8 110 72 $M * Reported in US Consumer Lending segment |
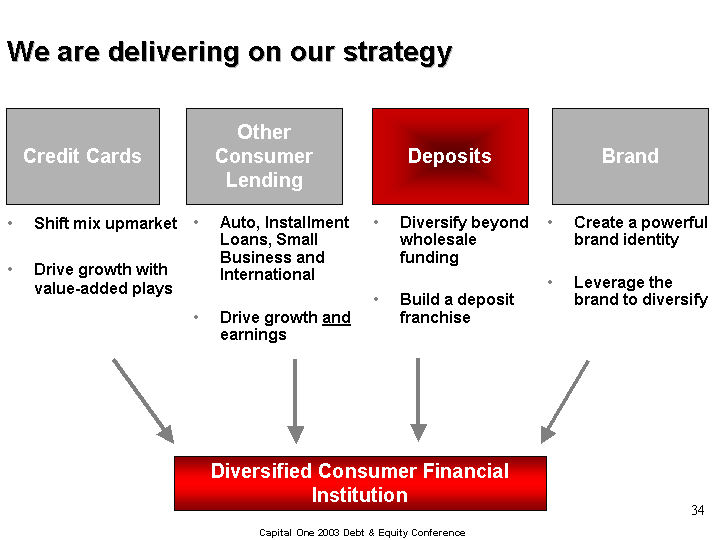
| We are delivering on our strategy Shift mix upmarket Drive growth with value-added plays Credit Cards Deposits Other Consumer Lending Auto, Installment Loans, Small Business and International Drive growth and earnings Diversify beyond wholesale funding Build a deposit franchise Diversified Consumer Financial Institution Brand Create a powerful brand identity Leverage the brand to diversify |
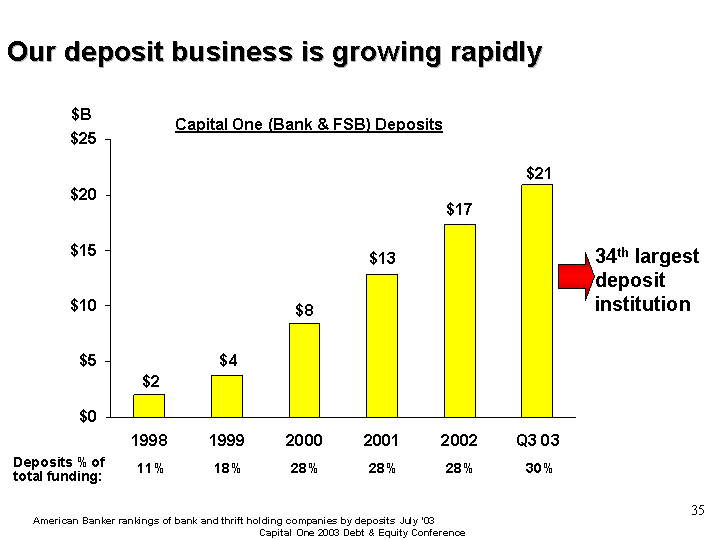
| Our deposit business is growing rapidly 1998 1999 2000 2001 2002 Q3 03 Deposits 2 3.784 8.379 12.839 17.326 20.9 Unsecured 3.739 4.181 4.051 5.335 5.566 Other 1.742 2.78 2.926 3.996 6.365 Securitization 11.238 10.323 14.411 24.343 31.893 Other Liab 0.667 1.076 1.571 2.691 3.503 Equity 1.27 1.516 1.963 3.323 4.623 Deposits % of total funding: 18% 28% 28% 28% 11% 34th largest deposit institution Capital One (Bank & FSB) Deposits 30% American Banker rankings of bank and thrift holding companies by deposits July '03 $B |

| We are working to expand our deposit franchise along several potential dimensions Capital One Deposits Products Channels Long-term CDs Money markets Innovative savings products Posting services Partnerships Cross-sell Branch banking |
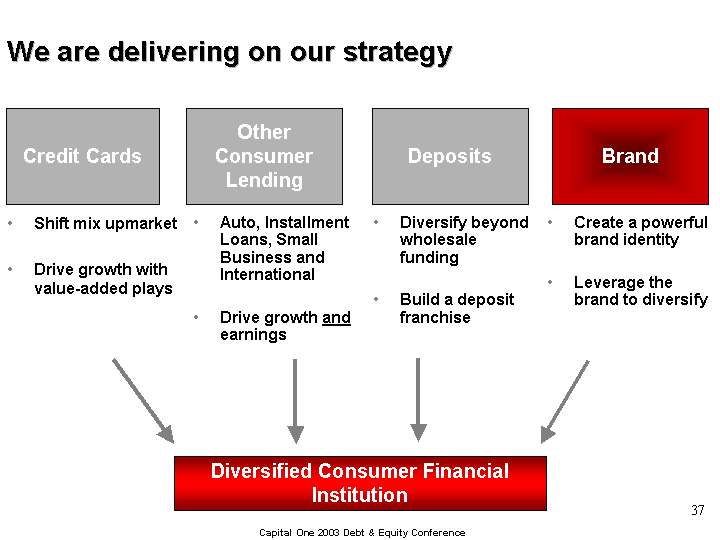
| We are delivering on our strategy Shift mix upmarket Drive growth with value-added plays Credit Cards Deposits Other Consumer Lending Auto, Installment Loans, Small Business and International Drive growth and earnings Diversify beyond wholesale funding Build a deposit franchise Diversified Consumer Financial Institution Brand Create a powerful brand identity Leverage the brand to diversify |
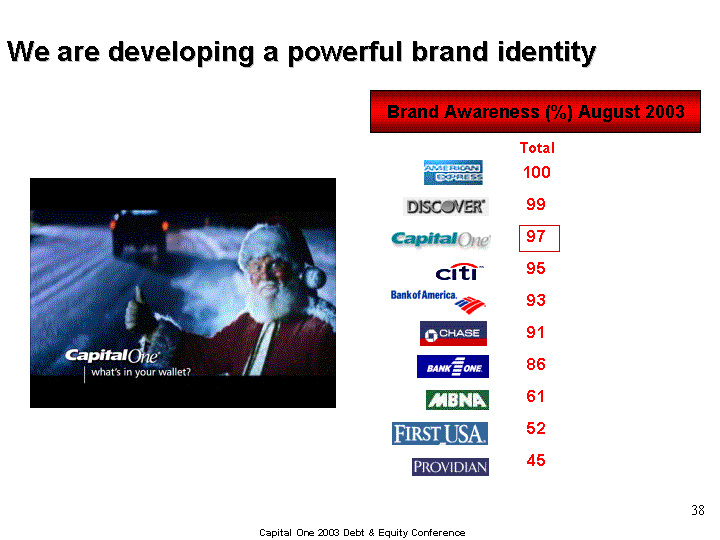
| We are developing a powerful brand identity Brand Awareness (%) August 2003 |
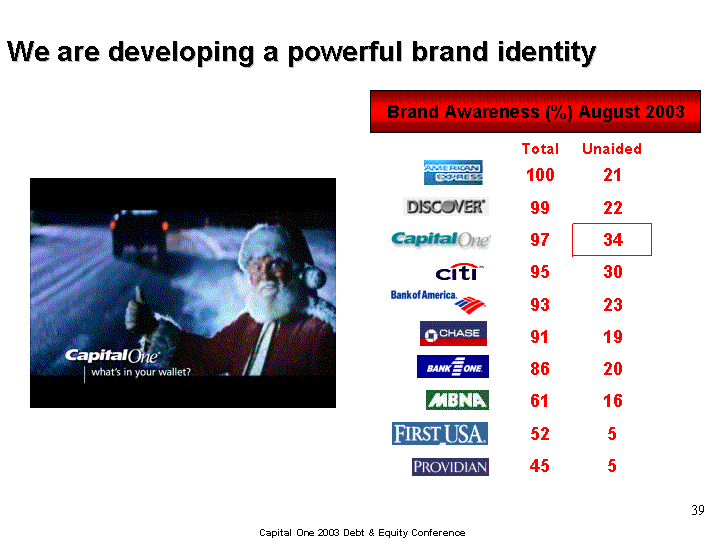
| We are developing a powerful brand identity Brand Awareness (%) August 2003 |
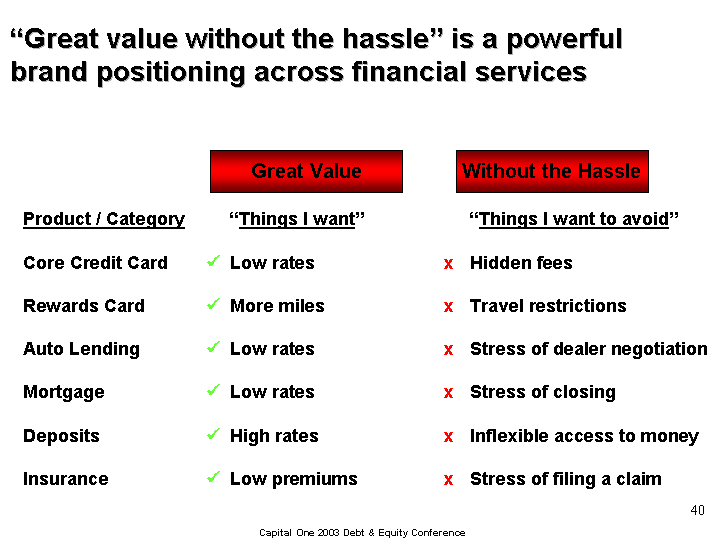
| Great Value Without the Hassle Product / Category Core Credit Card Rewards Card Auto Lending Mortgage Deposits Insurance "Things I want" Low rates More miles Low rates Low rates High rates Low premiums "Things I want to avoid" Hidden fees Travel restrictions Stress of dealer negotiation Stress of closing Inflexible access to money Stress of filing a claim x x x x x x ? ? ? ? ? ? "Great value without the hassle" is a powerful brand positioning across financial services |

| We are delivering on our strategy Shift mix upmarket Drive growth with value-added plays Credit Cards Deposits Other Consumer Lending Auto, Installment Loans, Small Business and International Drive growth and earnings Diversify beyond wholesale funding Build a deposit franchise Diversified Consumer Financial Institution Brand Create a powerful brand identity Leverage the brand to diversify |

| 2004 Outlook |

| We anticipate loan growth in the mid teens, with increased diversification U.S. Card Continued industry leading growth Gradual shift upmarket Diversified businesses Faster growth than U.S. Card COF: Managed loan growth in mid-teens |
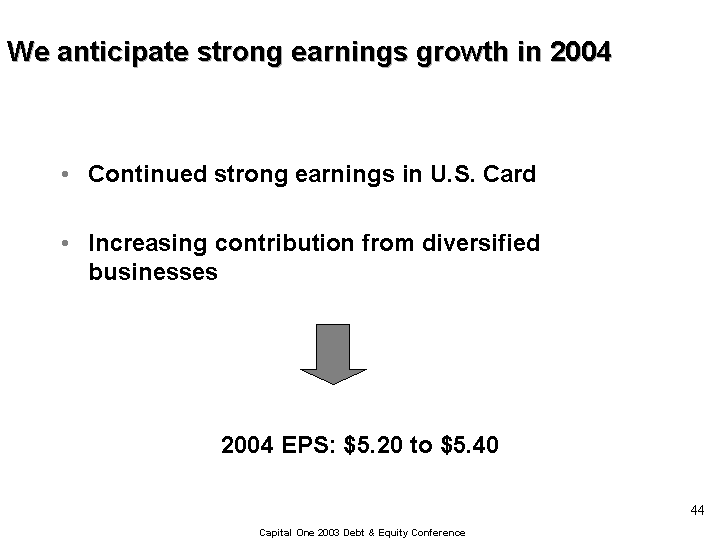
| We anticipate strong earnings growth in 2004 Continued strong earnings in U.S. Card Increasing contribution from diversified businesses 2004 EPS: $5.20 to $5.40 |

| As the business mix shifts, revenue margins are declining 1994 0.095984212 1995 0.085616844 1996 0.111793072 1997 0.133640529 1998 0.151681865 1999 0.179044203 2000 0.2268 2001 0.1988 2002 0.184 2003 YTD 0.1672 Loan Revenue Margin* *As a percent of average managed loans |
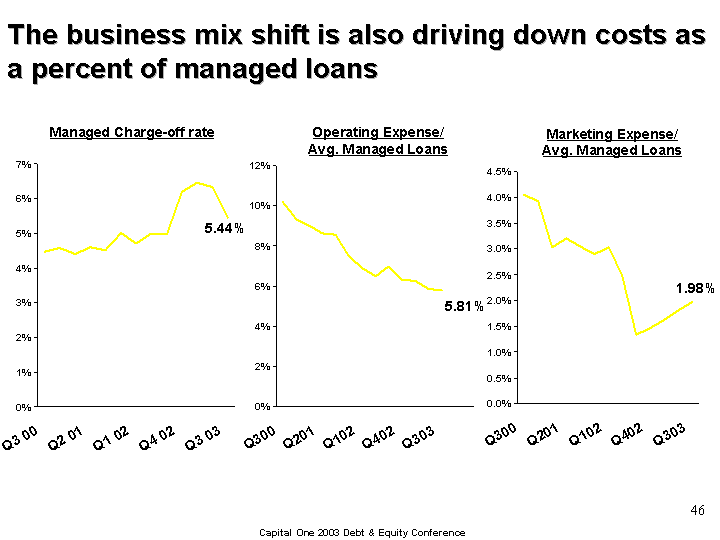
| Oper/loans Mkt/loans Q300 0.1018 0.0405 Q400 0.0936 0.0394 Q101 0.0901 0.0303 Q201 0.0863 0.0321 Q301 0.0857 0.0305 Q401 0.0748 0.0291 Q102 0.0691 0.0303 Q202 0.0649 0.025 Q302 0.0698 0.0134 Q402 0.0631 0.0146 Q103 0.0629 0.0163 Q203 0.0587 0.0181 Q303 0.0581 0.0198 Operating Expense/ Avg. Managed Loans Oper/loans Mkt/loans Q300 0.1018 0.0405 Q400 0.0936 0.0394 Q101 0.0901 0.0303 Q201 0.0863 0.0321 Q301 0.0857 0.0305 Q401 0.0748 0.0291 Q102 0.0691 0.0303 Q202 0.0649 0.025 Q302 0.0698 0.0134 Q402 0.0631 0.0146 Q103 0.0629 0.0163 Q203 0.0587 0.0181 Q303 0.0581 0.0198 Marketing Expense/ Avg. Managed Loans Q1 99 0.0439 Q2 99 0.0425 Q3 99 0.0436 Q4 99 0.0436 Q1 00 0.0452 Q2 00 0.0467 Q3 00 0.0448 Q4 00 0.0457 Q1 01 0.044 Q2 01 0.0461 Q3 01 0.0451 Q4 01 0.0501 Q1 02 0.047 Q2 02 0.0498 Q3 02 0.0496 Q4 02 0.0621 Q103 0.0647 Q203 0.0632 Q3 03 0.0544 Managed Charge-off rate The business mix shift is also driving down costs as a percent of managed loans 5.81% 1.98% 5.44% |
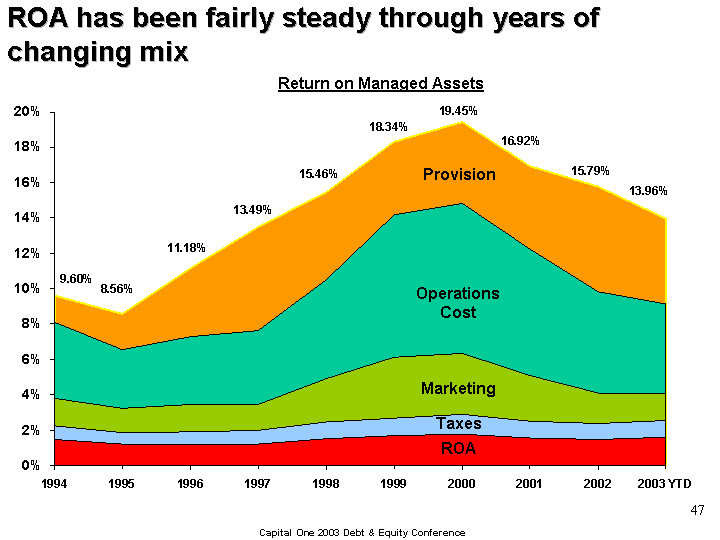
| Rev Mgn Provision Ops Cost Mktg Tax 1994 0.096 0.0812 0.0379 0.0225 0.0146 1995 0.0856 0.0657 0.0325 0.0187 0.012 1996 0.1118 0.0729 0.0345 0.0188 0.0118 1997 0.1349 0.0764 0.0343 0.0197 0.0122 1998 0.1546 0.1051 0.0491 0.0245 0.0153 1999 0.1834 0.1419 0.0611 0.0269 0.0169 2000 0.1945 0.1483 0.0632 0.0288 0.0178 2001 0.1692 0.1223 0.0509 0.0249 0.0154 2002 0.1579 0.0983 0.0411 0.0236 0.0147 2003 YTD 0.1396 0.0915 0.0408 0.0256 0.016 2003E 0.1378 0.0883 0.0385 0.0232 0.0146 2004E 0.1227 0.0809 0.036 0.0223 0.0142 ROA has been fairly steady through years of changing mix Return on Managed Assets Provision Operations Cost Marketing Taxes ROA |
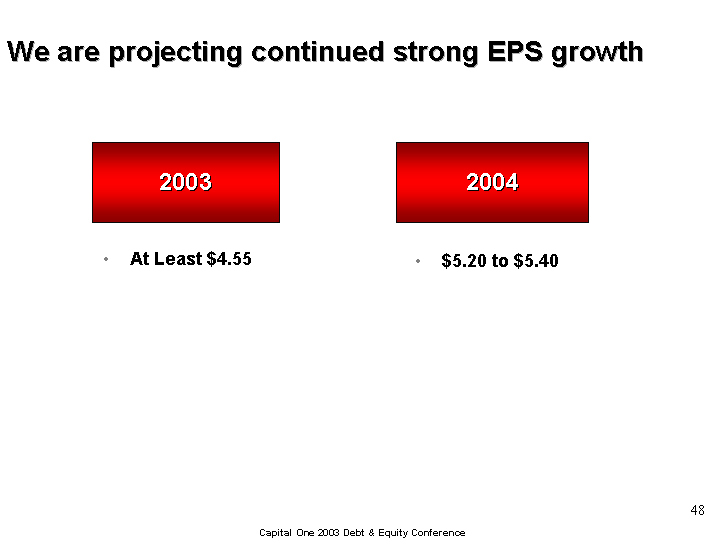
| We are projecting continued strong EPS growth At Least $4.55 2003 2004 $5.20 to $5.40 |
| 2004 Outlook: $5.20 - $5.40 EPS Key factors that create variability within this range: The actual mix of business booked in Q4 '03 and in '04 The pace at which we shift our portfolio upmarket Net charge-offs Investment in new business opportunities |