second quarter 2004 results
July 21, 2004
Forward looking statements
Please note that the following materials containing information regarding Capital One’s financial performance speak only as of the particular date or dates indicated in these materials. Capital One does not undertake any obligation to update or revise any of the information contained herein whether as a result of new information, future events or otherwise.
Certain statements in this presentation and other oral and written statements made by the Company from time to time, are forward-looking statements, including those that discuss strategies, goals, outlook or other non-historical matters; or project revenues, income, returns, earnings per share or other financial measures. To the extent any such information is forward-looking, it is intended to fit within the safe harbor for forward-looking information provided by the Private Securities Litigation Reform Act of 1995. Numerous factors could cause our actual results to differ materially from those described in forward-looking statements, including, among other things: continued intense competition from numerous providers of products and services which compete with our businesses; an increase or decrease in credit losses; financial, legal, regulatory or accounting changes or actions; changes in interest rates; general economic conditions affecting consumer income, spending and repayments; changes in our aggregate accounts or consumer loan balances and the growth rate and composition thereof; changes in the reputation of the credit card industry and/or the company with respect to practices and products; our ability to continue to securitize our credit cards and consumer loans and to otherwise access the capital markets at attractive rates and terms to fund our operations and future growth; our ability to successfully continue to diversify our assets; losses associated with new products or services or expansion internationally; the company’s ability to execute on its strategic and operational plans; any significant disruption of, or loss of public confidence in, the United States Mail service affecting our response rates and consumer payments; any significant disruption in our operations or technology platform; our ability to recruit and retain experienced personnel to assist in the management and operations of new products and services; and other factors listed from time to time in reports we file with the Securities and Exchange Commission (the “SEC”) , including, but not limited to, factors set forth under the caption “Risk Factors” in our Annual Report on Form 10-K for the year ended December 31, 2003, and any subsequent quarterly reports on Form 10-Q. You should carefully consider the factors discussed above in evaluating these forward-looking statements.
All information in these slides is based on the consolidated results of Capital One Financial Corporation. Further information about Capital One can be obtained from the Corporation’s public filings with the SEC. A reconciliation of any non-GAAP financial measures included in this presentation can be found in the Company’s most recent Form 8-K or Form 10-Q concerning quarterly financial results, available on the Company’s website at www.capitalone.com in Investor Relations under “About Capital One.”
1
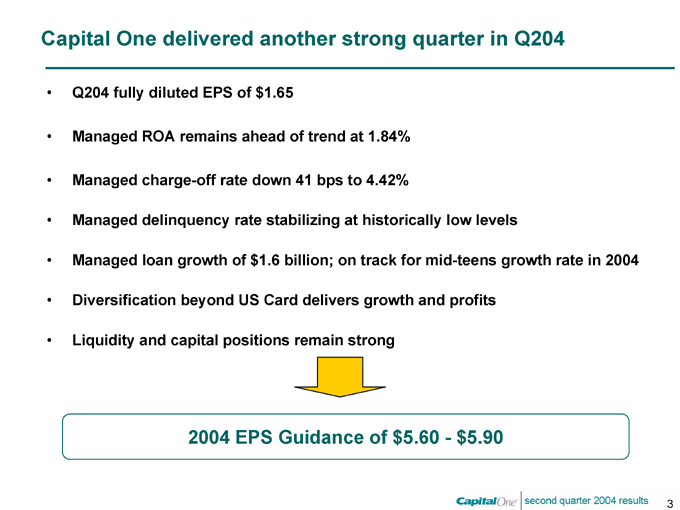
Capital One delivered another strong quarter in Q204
Q204 fully diluted EPS of $1.65
Managed ROA remains ahead of trend at 1.84%
Managed charge-off rate down 41 bps to 4.42%
Managed delinquency rate stabilizing at historically low levels
Managed loan growth of $1.6 billion; on track for mid-teens growth rate in 2004
Diversification beyond US Card delivers growth and profits
Liquidity and capital positions remain strong
2004 EPS Guidance of $5.60—$5.90
3

We have positioned Capital One to deliver strong performance in 2004 and 2005
Mid-teens loan growth rate target
Moderate growth in US Card
Strong growth in Auto and GFS
Bias toward lower loss assets
1.6% ROA target
Charge-off and expense reductions off-set revenue margin declines
Continued diversification
Diversification businesses continue to gain momentum:
38% of managed loans
24% of profits
Deposits 27% of total liabilities & capital
4
Second quarter 2004
Financial Update
Business Update
5
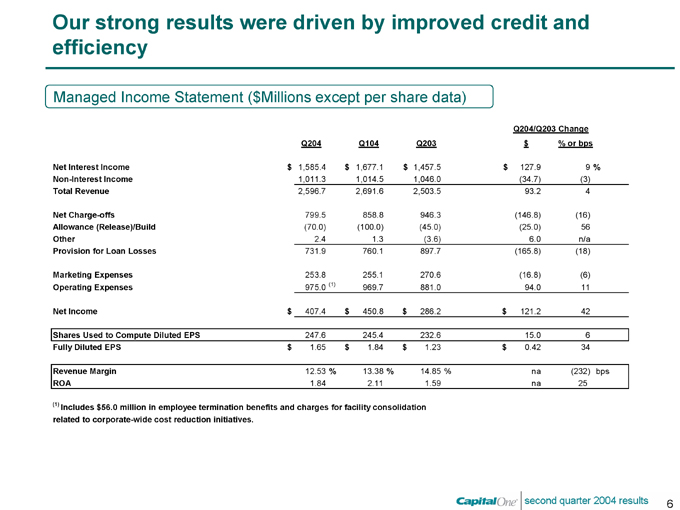
Our strong results were driven by improved credit and efficiency
Managed Income Statement ($Millions except per share data)
Q204/Q203 Change
Q204 Q104 Q203 $ % or bps
Net Interest Income $1,585.4 $1,677.1 $1,457.5 $127.9 9%
Non-Interest Income 1,011.3 1,014.5 1,046.0 (34.7) (3)
Total Revenue 2,596.7 2,691.6 2,503.5 93.2 4
Net Charge-offs 799.5 858.8 946.3 (146.8) (16)
Allowance (Release)/Build (70.0) (100.0) (45.0) (25.0) 56
Other 2.4 1.3 (3.6) 6.0 n/a
Provision for Loan Losses 731.9 760.1 897.7 (165.8) (18)
Marketing Expenses 253.8 255.1 270.6 (16.8) (6)
Operating Expenses 975.0 (1) 969.7 881.0 94.0 11
Net Income $407.4 $450.8 $286.2 $121.2 42
Shares Used to Compute Diluted EPS 247.6 245.4 232.6 15.0 6
Fully Diluted EPS $1.65 $1.84 $1.23 $0.42 34
Revenue Margin 12.53% 13.38% 14.85% na (232) bps
ROA 1.84 2.11 1.59 na 25
(1) Includes $56.0 million in employee termination benefits and charges for facility consolidation related to corporate-wide cost reduction initiatives.
6
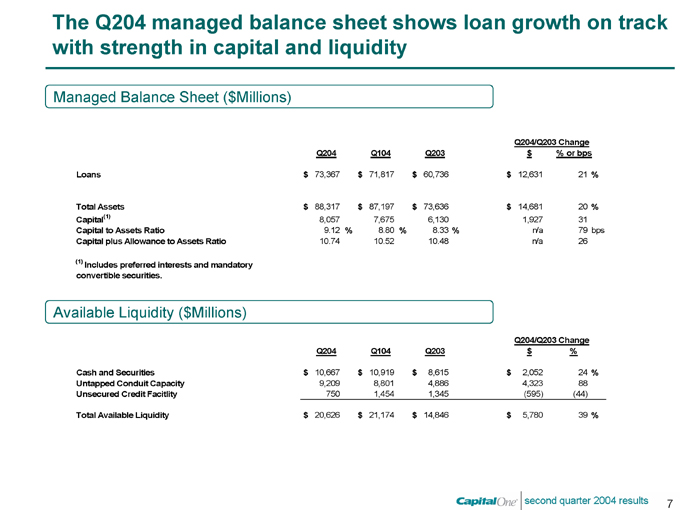
The Q204 managed balance sheet shows loan growth on track with strength in capital and liquidity
Managed Balance Sheet ($Millions)
Q204/Q203 Change
Q204 Q104 Q203 $ % or bps
Loans $73,367 $71,817 $60,736 $12,631 21%
Total Assets $88,317 $87,197 $73,636 $14,681 20%
Capital(1) 8,057 7,675 6,130 1,927 31
Capital to Assets Ratio 9.12% 8.80% 8.33% n/a 79 bps
Capital plus Allowance to Assets Ratio 10.74 10.52 10.48 n/a 26
(1) Includes preferred interests and mandatory convertible securities.
Available Liquidity ($Millions)
Q204/Q203 Change
Q204 Q104 Q203 $ %
Cash and Securities $10,667 $10,919 $8,615 $2,052 24%
Untapped Conduit Capacity 9,209 8,801 4,886 4,323 88
Unsecured Credit Facitlity 750 1,454 1,345 (595) (44)
Total Available Liquidity $20,626 $21,174 $14,846 $5,780 39%
7
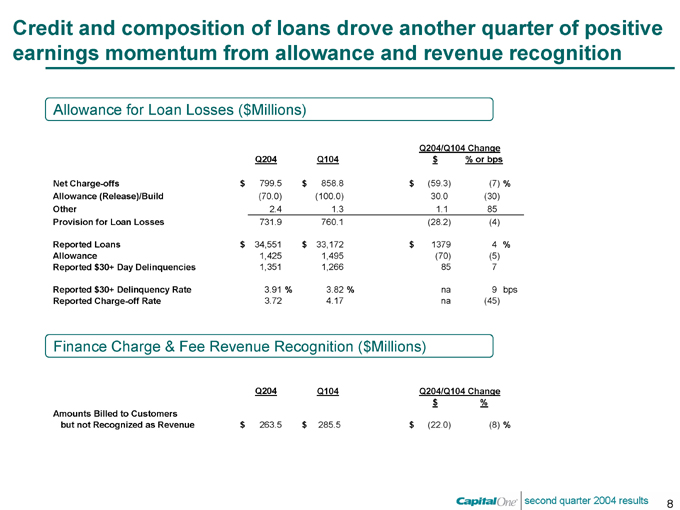
Credit and composition of loans drove another quarter of positive earnings momentum from allowance and revenue recognition
Allowance for Loan Losses ($Millions)
Q204/Q104 Change
Q204 Q104 $ % or bps
Net Charge-offs $799.5 $858.8 $(59.3) (7)%
Allowance (Release)/Build (70.0) (100.0) 30.0 (30)
Other 2.4 1.3 1.1 85
Provision for Loan Losses 731.9 760.1 (28.2) (4)
Reported Loans $34,551 $33,172 $1379 4%
Allowance 1,425 1,495 (70) (5)
Reported $30+ Day Delinquencies 1,351 1,266 85 7
Reported $30+ Delinquency Rate 3.91 % 3.82 % na 9 bps
Reported Charge-off Rate 3.72 4.17 na (45)
Finance Charge & Fee Revenue Recognition ($Millions)
Q204 Q104 Q204/Q104 Change
$ %
Amounts Billed to Customers
but not Recognized as Revenue $263.5 $285.5 $(22.0) (8)%
8
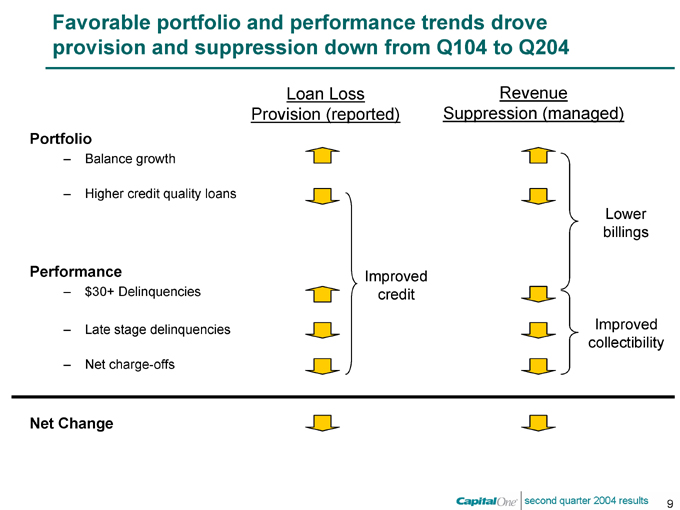
Favorable portfolio and performance trends drove provision and suppression down from Q104 to Q204
Loan Loss Provision (reported)
Revenue Suppression (managed)
Portfolio
Balance growth
Higher credit quality loans
Performance
$30+ Delinquencies
Late stage delinquencies
Net charge-offs
Improved credit
Lower billings
Improved collectibility
Net Change
9
Second quarter 2004
Financial Update
Business Update
10
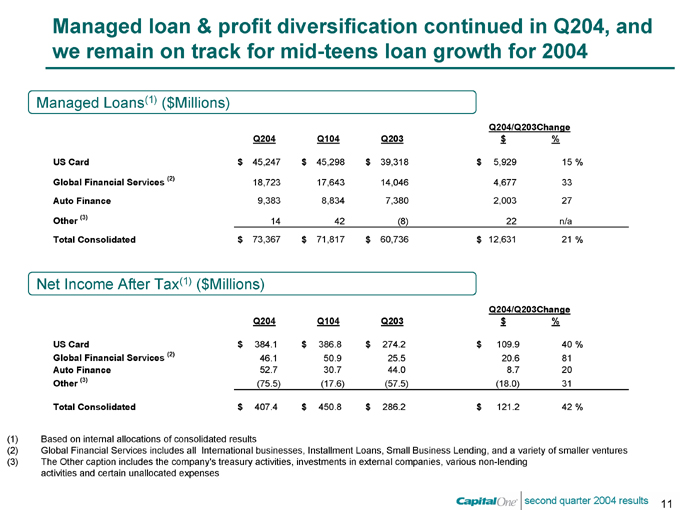
Managed loan & profit diversification continued in Q204, and we remain on track for mid-teens loan growth for 2004
Managed Loans(1) ($Millions)
Q204/Q203Change
Q204 Q104 Q203 $%
US Card $45,247 $45,298 $39,318 $5,929 15%
Global Financial Services (2) 18,723 17,643 14,046 4,677 33
Auto Finance 9,383 8,834 7,380 2,003 27
Other (3) 14 42 (8) 22 n/a
Total Consolidated $73,367 $71,817 $60,736 $12,631 21%
Net Income After Tax(1) ($Millions)
Q204/Q203Change
Q204 Q104 Q203 $%
US Card $384.1 $386.8 $274.2 $109.9 40%
Global Financial Services (2) 46.1 50.9 25.5 20.6 81
Auto Finance 52.7 30.7 44.0 8.7 20
Other (3) (75.5) (17.6) (57.5) (18.0) 31
Total Consolidated $407.4 $450.8 $286.2 $121.2 42%
(1) Based on internal allocations of consolidated results
(2) Global Financial Services includes all International businesses, Installment Loans, Small Business Lending, and a variety of smaller ventures
(3) The Other caption includes the company’s treasury activities, investments in external companies, various non-lending activities and certain unallocated expenses
11
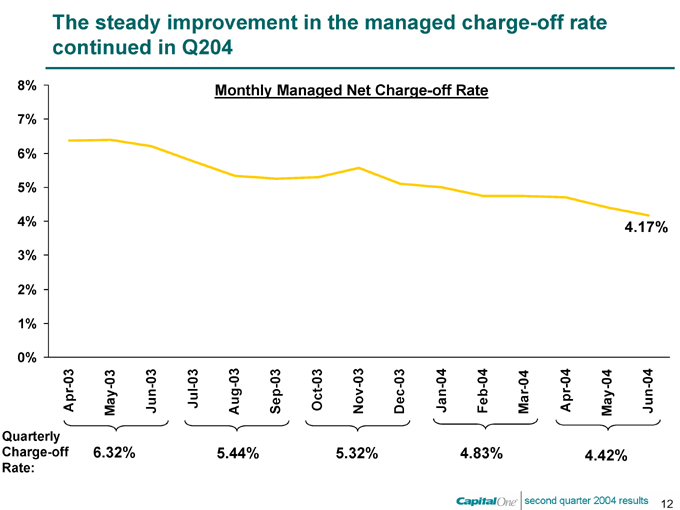
The steady improvement in the managed charge-off rate continued in Q204
Monthly Managed Net Charge-off Rate
8% 7% 6% 5% 4% 3% 2% 1% 0%
Apr-03 May-03 Jun-03 Jul-03 Aug-03 Sep-03 Oct-03 Nov-03 Dec-03 Jan-04 Feb-04 Mar-04 Apr-04 May-04 Jun-04
4.17%
Quarterly Charge-off Rate: 6.32% 5.44% 5.32% 4.83% 4.42%
12
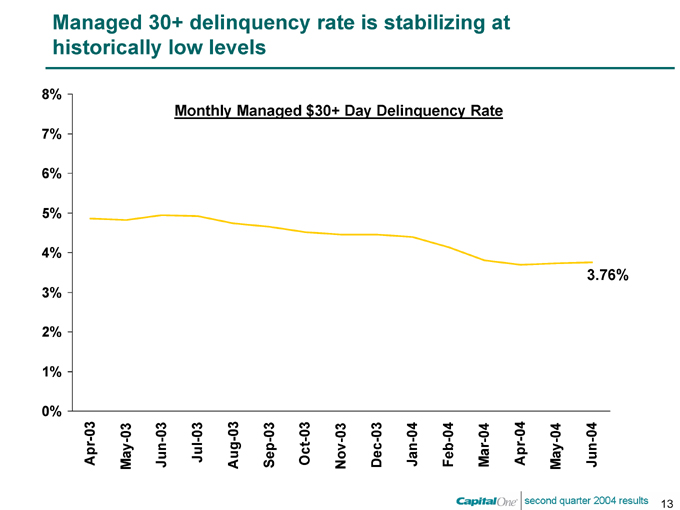
Managed 30+ delinquency rate is stabilizing at historically low levels
Monthly Managed $30+ Day Delinquency Rate
8% 7% 6% 5% 4% 3% 2% 1% 0%
Apr-03 May-03 Jun-03 Jul-03 Aug-03 Sep-03 Oct-03 Nov-03 Dec-03 Jan-04 Feb-04 Mar-04 Apr-04 May-04 Jun-04
3.76%
13
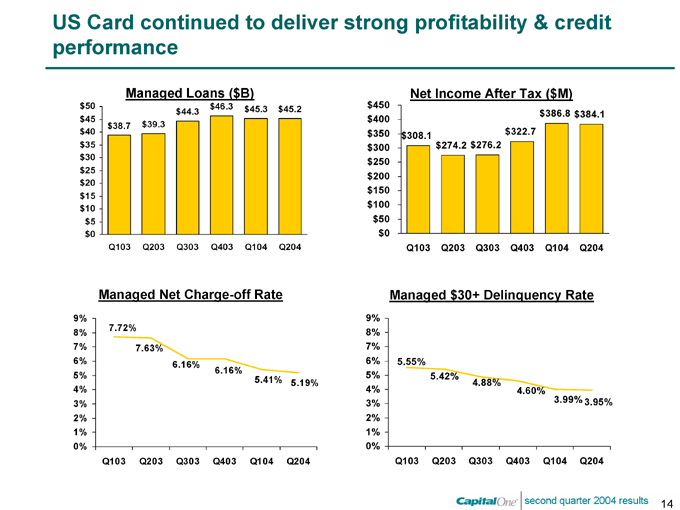
US Card continued to deliver strong profitability & credit performance
Managed Loans ($B)
$50 $45 $40 $35 $30 $25 $20 $15 $10 $5 $0
Q103 Q203 Q303 Q403 Q104 Q204 $38.7 $39.3 $44.3 $46.3 $45.3 $45.2
Net Income After Tax ($M)
$450 $400 $350 $300 $250 $200 $150 $100 $50 $0
Q103 Q203 Q303 Q403 Q104 Q204 $308.1 $274.2 $276.2 $322.7 $386.8 $384.1
Managed Net Charge-off Rate
9% 8% 7% 6% 5% 4% 3% 2% 1% 0%
Q103 Q203 Q303 Q403 Q104 Q204
7.72% 7.63% 6.16% 6.16% 5.41% 5.19%
Managed $30+ Delinquency Rate
9% 8% 7% 6% 5% 4% 3% 2% 1% 0%
Q103 Q203 Q303 Q403 Q104 Q204
5.55% 5.42% 4.88% 4.60% 3.99% 3.95%
14
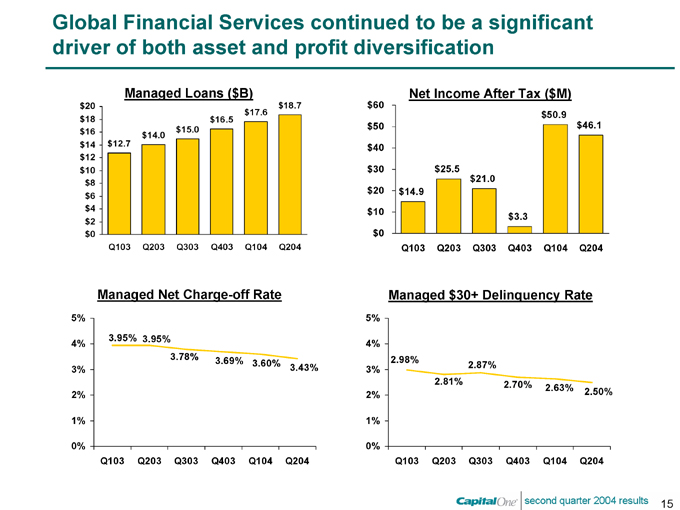
Global Financial Services continued to be a significant driver of both asset and profit diversification
Managed Loans ($B)
$20 $18 $16 $14 $12 $10 $8 $6 $4 $2 $0
Q103 Q203 Q303 Q403 Q104 Q204 $12.7 $14.0 $15.0 $16.5 $17.6 $18.7
Net Income After Tax ($M)
$60 $50 $40 $30 $20 $10 $0
Q103 Q203 Q303 Q403 Q104 Q204 $14.9 $25.5 $21.0 $3.3 $50.9 $46.1
Managed Net Charge-off Rate
5% 4% 3% 2% 1% 0%
Q103 Q203 Q303 Q403 Q104 Q204
3.95% 3.95% 3.78% 3.69% 3.60% 3.43%
Managed $30+ Delinquency Rate
5% 4% 3% 2% 1% 0%
Q103 Q203 Q303 Q403 Q104 Q204
2.98% 2.81% 2.87% 2.70% 2.63% 2.50%
15
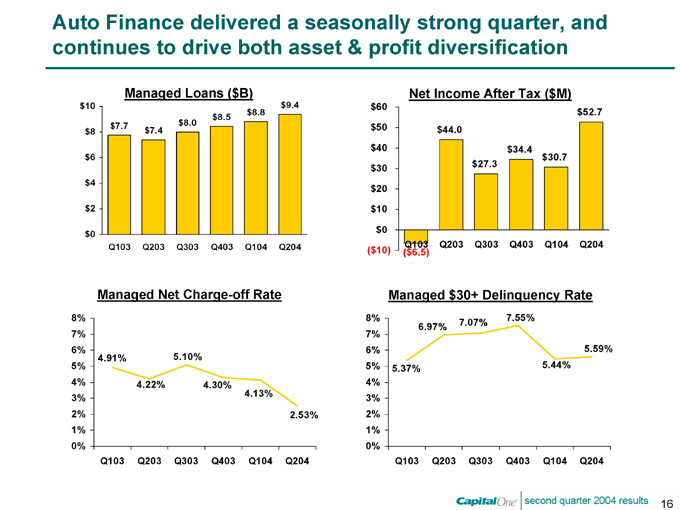
Auto Finance delivered a seasonally strong quarter, and continues to drive both asset & profit diversification
Managed Loans ($B) $10 $8 $6 $4 $2 $0
Q103 Q203 Q303 Q403 Q104 Q204 $7.7 $7.4 $8.0 $8.5 $8.8 $9.4
Net Income After Tax ($M)
$60 $50 $40 $30 $20 $10 $0 ($10)
Q103 Q203 Q303 Q403 Q104 Q204
($6.5) $44.0 $27.3 $34.4 $30.7 $52.7
Managed Net Charge-off Rate
8% 7% 6% 5% 4% 3% 2% 1% 0%
Q103 Q203 Q303 Q403 Q104 Q204
4.91% 4.22% 5.10% 4.30% 4.13% 2.53%
Managed $30+ Delinquency Rate
8% 7% 6% 5% 4% 3% 2% 1% 0%
Q103 Q203 Q303 Q403 Q104 Q204
5.37% 6.97% 7.07% 7.55% 5.44% 5.59%
16
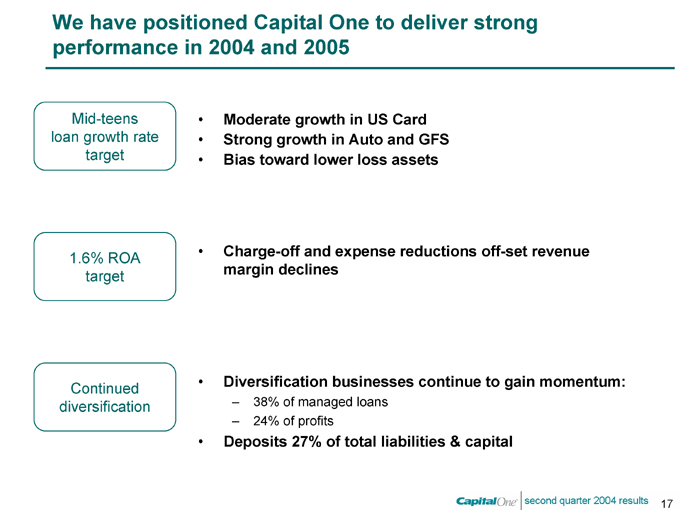
We have positioned Capital One to deliver strong performance in 2004 and 2005
Mid-teens loan growth rate target
Moderate growth in US Card
Strong growth in Auto and GFS
Bias toward lower loss assets
1.6% ROA target
Charge-off and expense reductions off-set revenue margin declines
Continued diversification
Diversification businesses continue to gain momentum:
38% of managed loans
24% of profits
Deposits 27% of total liabilities & capital
17