January 19, 2005
Forward looking statements
Please note that the following materials containing information regarding Capital One’s financial performance speak only as of the particular date or dates indicated in these materials. Capital One does not undertake any obligation to update or revise any of the information contained herein whether as a result of new information, future events or otherwise.
Certain statements in this presentation and other oral and written statements made by the Company from time to time, are forward-looking statements, including those that discuss strategies, goals, outlook or other non-historical matters; or project revenues, income, returns, earnings per share or other financial measures. To the extent any such information is forward-looking, it is intended to fit within the safe harbor for forward-looking information provided by the Private Securities Litigation Reform Act of 1995. Numerous factors could cause our actual results to differ materially from those described in forward-looking statements, including, among other things: continued intense competition from numerous providers of products and services which compete with our businesses; an increase or decrease in credit losses; financial, legal, regulatory or accounting changes or actions; changes in interest rates; general economic conditions affecting consumer income, spending and repayments; changes in our aggregate accounts or consumer loan balances and the growth rate and composition thereof; changes in the reputation of the credit card industry and/or the company with respect to practices and products; our ability to continue to securitize our credit cards and consumer loans and to otherwise access the capital markets at attractive rates and terms to fund our operations and future growth; our ability to successfully continue to diversify our assets; losses associated with new products or services or expansion internationally; the company’s ability to execute on its strategic and operational plans; any significant disruption in our operations or technology platform; our ability to effectively control our costs; the success of marketing efforts; our ability to execute effective tax planning strategies; our ability to recruit and retain experienced management personnel; and other factors listed from time to time in reports we file with the Securities and Exchange Commission (the “SEC”) , including, but not limited to, factors set forth under the caption “Risk Factors” in our Annual Report on Form 10-K for the year ended December 31, 2003, and any subsequent quarterly reports on Form 10-Q. You should carefully consider the factors discussed above in evaluating these forward-looking statements.
All information in these slides is based on the consolidated results of Capital One Financial Corporation. Further information about Capital One can be obtained from the Corporation’s public filings with the SEC. A reconciliation of any non-GAAP financial measures included in this presentation can be found in the Company’s most recent Form 8-K or Form 10-Q concerning quarterly financial results, available on the Company’s website at www.capitalone.com in Investor
Relations under “About Capital One.”
2
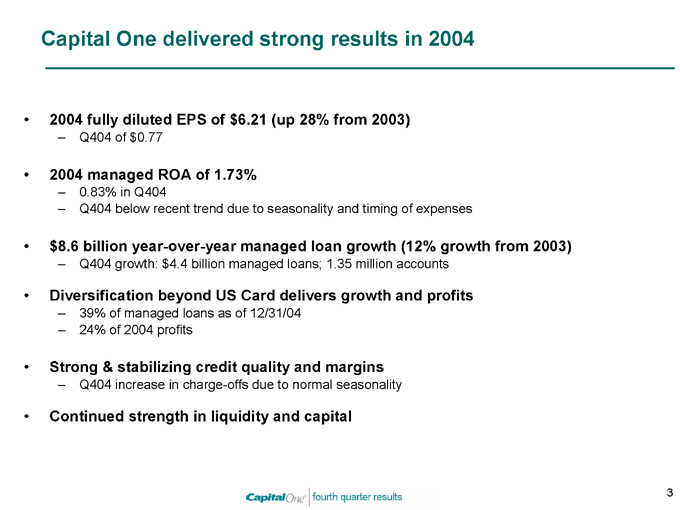
Capital One delivered strong results in 2004
2004 fully diluted EPS of $6.21 (up 28% from 2003)
– Q404 of $0.77
2004 managed ROA of 1.73%
– 0.83% in Q404
– Q404 below recent trend due to seasonality and timing of expenses
$8.6 billion year-over-year managed loan growth (12% growth from 2003)
– Q404 growth: $4.4 billion managed loans; 1.35 million accounts
Diversification beyond US Card delivers growth and profits
– 39% of managed loans as of 12/31/04
– 24% of 2004 profits
Strong & stabilizing credit quality and margins
– Q404 increase in charge-offs due to normal seasonality
Continued strength in liquidity and capital
3

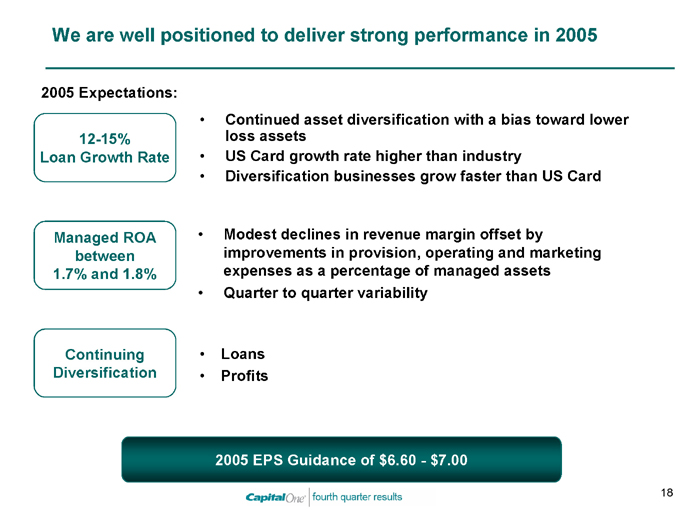
We are well positioned to deliver strong performance in 2005
2005 Expectations:
12-15% Loan Growth Rate
Continued asset diversification with a bias toward lower loss assets US Card growth rate higher than industry Diversification businesses grow faster than US Card
Managed ROA between 1.7% and 1.8%
Modest declines in revenue margin offset by improvements in provision, operating and marketing expenses as a percentage of managed assets Quarter to quarter variability
Continuing Diversification
Loans Profits
2005 EPS Guidance of $6.60—$7.00
4
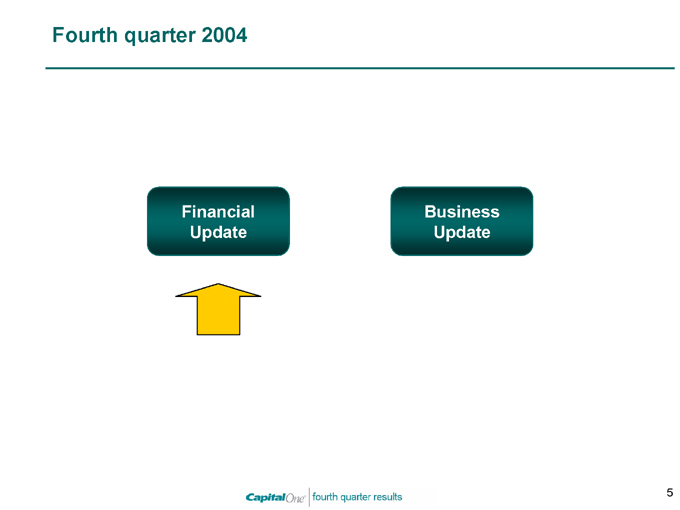
Fourth quarter 2004
Financial Update
Business Update
5
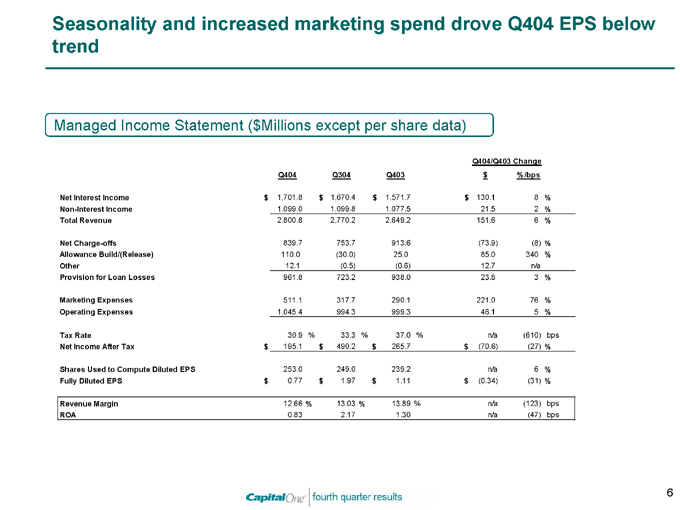
Seasonality and increased marketing spend drove Q404 EPS below trend
Managed Income Statement ($Millions except per share data)
Q404/Q403 Change
Q404 Q304 Q403 $ %/bps
Net Interest Income $ 1,701.8 $ 1,670.4 $ 1,571.7 $ 130.1 8 %
Non-Interest Income 1,099.0 1,099.8 1,077.5 21.5 2 %
Total Revenue 2,800.8 2,770.2 2,649.2 151.6 6 %
Net Charge-offs 839.7 753.7 913.6 (73.9) (8)%
Allowance Build/(Release) 110.0 (30.0) 25.0 85.0 340 %
Other 12.1 (0.5) (0.6) 12.7 n/a
Provision for Loan Losses 961.8 723.2 938.0 23.8 3 %
Marketing Expenses 511.1 317.7 290.1 221.0 76 %
Operating Expenses 1,045.4 994.3 999.3 46.1 5 %
Tax Rate 30.9 % 33.3 % 37.0 % n/a (610) bps
Net Income After Tax $ 195.1 $ 490.2 $ 265.7 $ (70.6) (27)%
Shares Used to Compute Diluted EPS 253.0 249.0 239.2 n/a 6 %
Fully Diluted EPS $ 0.77 $ 1.97 $ 1.11 $ (0.34) (31)%
Revenue Margin 12.66 % 13.03 % 13.89 % n/a (123) bps
ROA 0.83 2.17 1.30 n/a (47) bps
6
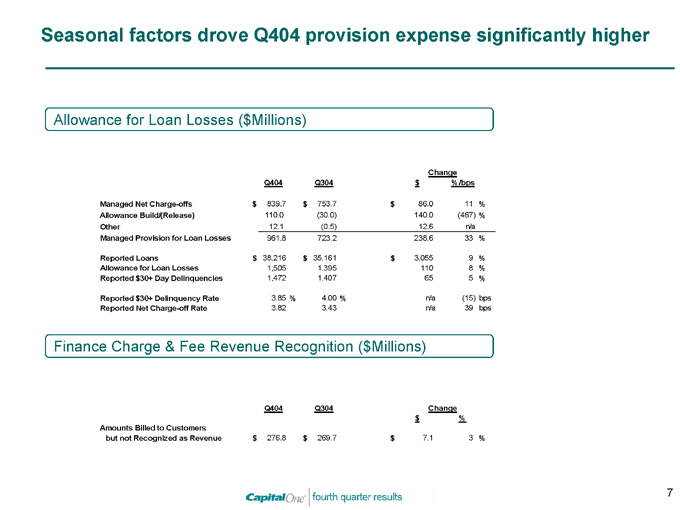
Seasonal factors drove Q404 provision expense significantly higher
Allowance for Loan Losses ($Millions)
Change
Q404 Q304 $ %/bps
Managed Net Charge-offs $ 839.7 $ 753.7 $ 86.0 11 %
Allowance Build/(Release) 110.0 (30.0) 140.0 (467)%
Other 12.1 (0.5) 12.6 n/a
Managed Provision for Loan Losses 961.8 723.2 238.6 33 %
Reported Loans $ 38,216 $ 35,161 $ 3,055 9 %
Allowance for Loan Losses 1,505 1,395 110 8 %
Reported $30+ Day Delinquencies 1,472 1,407 65 5 %
Reported $30+ Delinquency Rate 3.85 % 4.00 % n/a (15) bps
Reported Net Charge-off Rate 3.82 3.43 n/a 39 bps
Finance Charge & Fee Revenue Recognition ($Millions)
Q404 Q304 Change $ %
Amounts Billed to Customers but not Recognized as Revenue $ 276.8 $ 269.7 $ 7.1 3 %
7
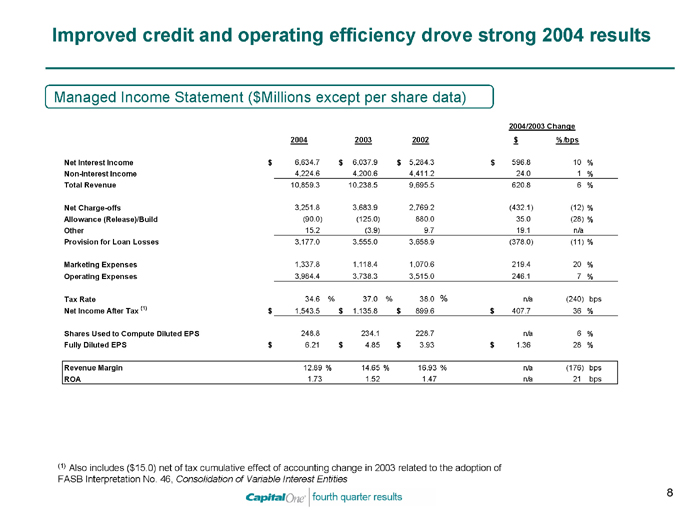
Improved credit and operating efficiency drove strong 2004 results
Managed Income Statement ($Millions except per share data)
2004/2003 Change
2004 2003 2002 $ %/bps
Net Interest Income $ 6,634.7 $ 6,037.9 $ 5,284.3 $ 596.8 10 %
Non-Interest Income 4,224.6 4,200.6 4,411.2 24.0 1 %
Total Revenue 10,859.3 10,238.5 9,695.5 620.8 6 %
Net Charge-offs 3,251.8 3,683.9 2,769.2 (432.1) (12)%
Allowance (Release)/Build (90.0) (125.0) 880.0 35.0 (28)%
Other 15.2 (3.9) 9.7 19.1 n/a
Provision for Loan Losses 3,177.0 3,555.0 3,658.9 (378.0) (11)%
Marketing Expenses 1,337.8 1,118.4 1,070.6 219.4 20 %
Operating Expenses 3,984.4 3,738.3 3,515.0 246.1 7 %
Tax Rate 34.6 % 37.0 % 38.0 % n/a (240) bps
Net Income After Tax (1) $ 1,543.5 $ 1,135.8 $ 899.6 $ 407.7 36 %
Shares Used to Compute Diluted EPS 248.8 234.1 228.7 n/a 6 %
Fully Diluted EPS $ 6.21 $ 4.85 $ 3.93 $ 1.36 28 %
Revenue Margin 12.89 % 14.65 % 16.93 % n/a (176) bps
ROA 1.73 1.52 1.47 n/a 21 bps
(1) Also includes ($15.0) net of tax cumulative effect of accounting change in 2003 related to the adoption of FASB Interpretation No. 46, Consolidation of Variable Interest Entities
8
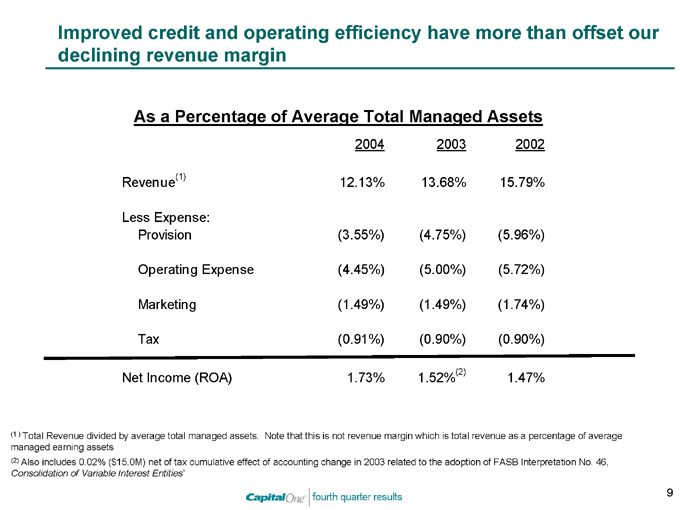
Improved credit and operating efficiency have more than offset our declining revenue margin
As a Percentage of Average Total Managed Assets
2004 2003 2002
Revenue(1) 12.13% 13.68% 15.79%
Less Expense:
Provision (3.55%) (4.75%) (5.96%)
Operating Expense (4.45%) (5.00%) (5.72%)
Marketing (1.49%) (1.49%) (1.74%)
Tax (0.91%) (0.90%) (0.90%)
Net Income (ROA) 1.73% 1.52%(2) 1.47%
(1 ) Total Revenue divided by average total managed assets. Note that this is not revenue margin which is total revenue as a percentage of average managed earning assets (2) Also includes 0.02% ($15.0M) net of tax cumulative effect of accounting change in 2003 related to the adoption of FASB Interpretation No. 46,
Consolidation of Variable Interest Entities”
9
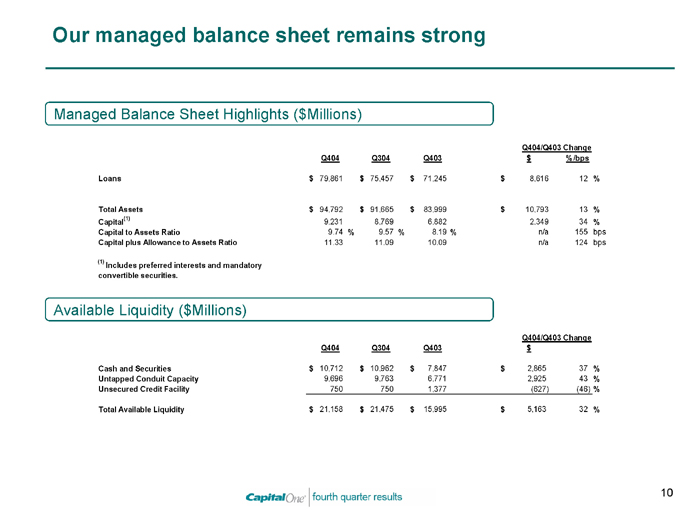
Our managed balance sheet remains strong
Managed Balance Sheet Highlights ($Millions)
Q404/Q403 Change
Q404 Q304 Q403 $ %/bps
Loans $ 79,861 $ 75,457 $ 71,245 $ 8,616 12 %
Total Assets $ 94,792 $ 91,665 $ 83,999 $ 10,793 13 %
Capital(1) 9,231 8,769 6,882 2,349 34 %
Capital to Assets Ratio 9.74 % 9.57 % 8.19 % n/a 155 bps
Capital plus Allowance to Assets Ratio 11.33 11.09 10.09 n/a 124 bps
(1) Includes preferred interests and mandatory convertible securities.
Available Liquidity ($Millions)
Q404/Q403 Change
Q404 Q304 Q403 $
Cash and Securities $ 10,712 $ 10,962 $ 7,847 $ 2,865 37 %
Untapped Conduit Capacity 9,696 9,763 6,771 2,925 43 %
Unsecured Credit Facility 750 750 1,377 (627) (46)%
Total Available Liquidity $ 21,158 $ 21,475 $ 15,995 $ 5,163 32 %
10
Fourth quarter 2004
Financial Update
Business Update
11
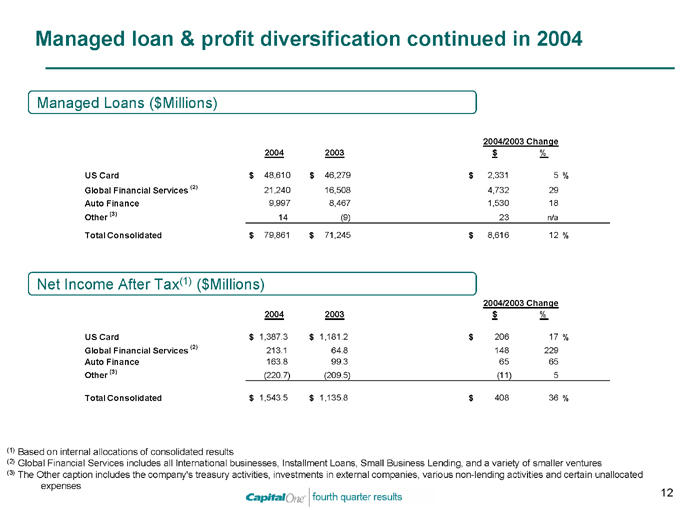
Managed loan & profit diversification continued in 2004
Managed Loans ($Millions)
2004/2003 Change
2004 2003 $ %
US Card $ 48,610 $ 46,279 $ 2,331 5 %
Global Financial Services (2) 21,240 16,508 4,732 29
Auto Finance 9,997 8,467 1,530 18
Other (3) 14 (9) 23 n/a
Total Consolidated $ 79,861 $ 71,245 $ 8,616 12 %
Net Income After Tax(1) ($Millions)
2004/2003 Change
2004 2003 $ %
US Card $ 1,387.3 $ 1,181.2 $ 206 17 %
Global Financial Services
(2) 213.1 64.8 148 229
Auto Finance 163.8 99.3 65 65
Other
(3) (220.7) (209.5) (11) 5
Total Consolidated $ 1,543.5 $ 1,135.8 $ 408 36 %
(1) Based on internal allocations of consolidated results
(2) Global Financial Services includes all International businesses, Installment Loans, Small Business Lending, and a variety of smaller ventures
(3) The Other caption includes the company’s treasury activities, investments in external companies, various non-lending activities and certain unallocated expenses
12
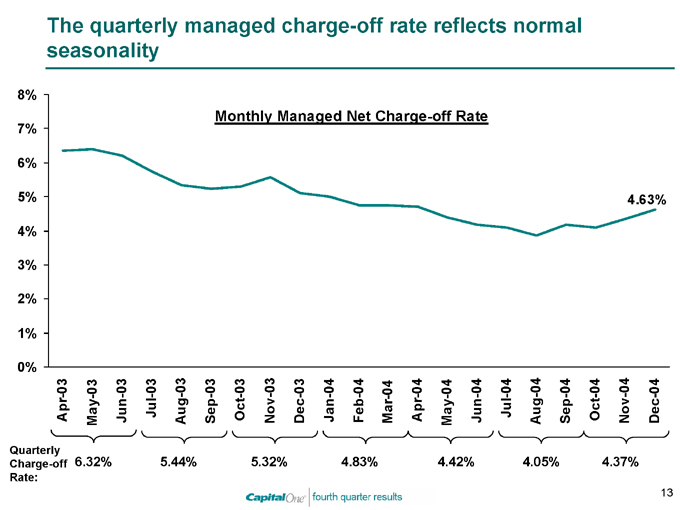
The quarterly managed charge-off rate reflects normal seasonality
8% 7% 6% 5% 4% 3% 2% 1% 0%
Monthly Managed Net Charge-off Rate
4.63%
Apr-03 May-03 Jun-03 Jul-03 Aug-03 Sep-03 Oct-03 Nov-03 Dec-03 Jan-04 Feb-04
Mar-04 Apr-04 May-04 Jun-04 Jul-04 Aug-04 Sep-04 Oct-04 Nov-04 Dec-04
Quarterly
Charge-off 6.32% 5.44% 5.32% 4.83% 4.42% 4.05% 4.37%
Rate:
13
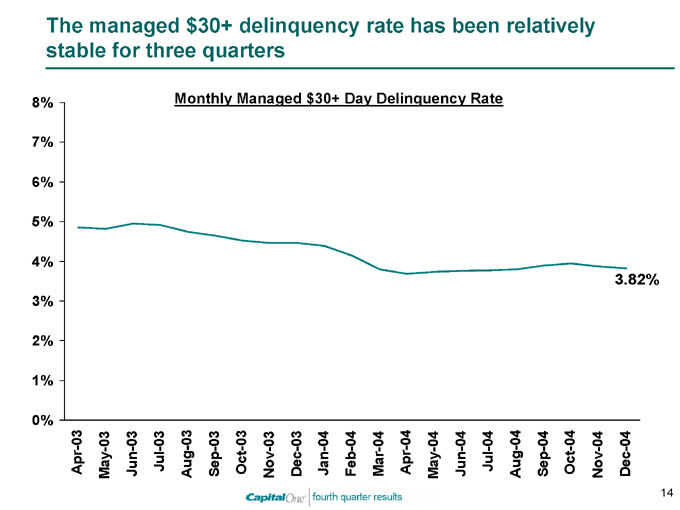
The managed $30+ delinquency rate has been relatively stable for three quarters
Monthly Managed $30+ Day Delinquency Rate
8% 7% 6% 5% 4% 3% 2% 1% 0%
Apr-03 May-03 Jun-03 Jul-03 Aug-03 Sep-03 Oct-03 Nov-03 Dec-03 Jan-04 Feb-04 Mar-04 Apr-04 May-04 Jun-04 Jul-04 Aug-04 Sep-04 Oct-04 Nov-04 Dec-04
3.82%
14
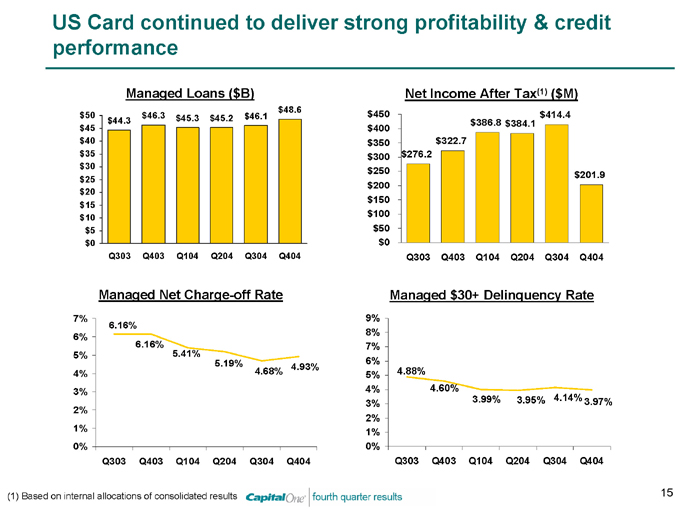
US Card continued to deliver strong profitability & credit performance
Managed Loans ($B) $50 $45 $40 $35 $30 $25 $20 $15 $10 $5 $0
Q303 Q403 Q104 Q204 Q304 Q404 $48.6 $46.3 $45.3 $45.2 $46.1 $44.3 $450 $400 $350 $300 $250 $200 $150 $100 $50 $0
Net Income After Tax(1) ($M) $414.4 $386.8 $384.1 $322.7 $276.2
$201.9
Q303 Q403 Q104 Q204 Q304 Q404
Managed Net Charge-off Rate
7% 6% 5% 4% 3% 2% 1% 0%
6.16% 6.16% 5.41%
5.19% 4.93% 4.68%
Q303 Q403 Q104 Q204 Q304 Q404
9% 8% 7% 6% 5% 4% 3% 2% 1%
0%
Managed $30+ Delinquency Rate
4.88% 4.60%
3.99% 3.95% 4.14% 3.97%
Q303 Q403 Q104 Q204 Q304 Q404
(1) Based on internal allocations of consolidated results
15
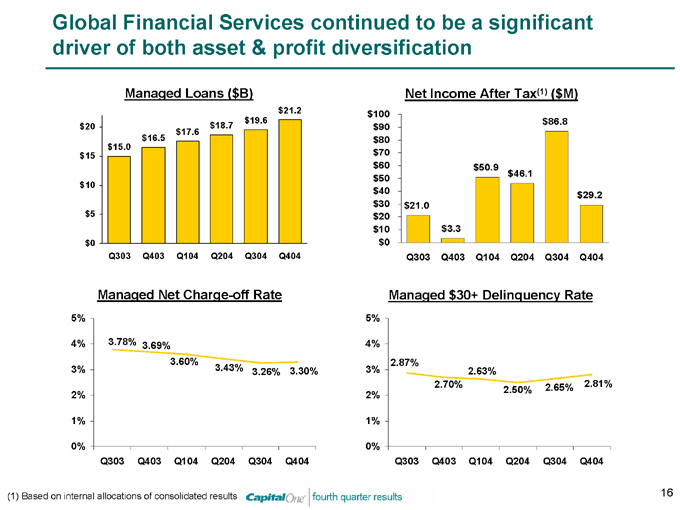
Global Financial Services continued to be a significant driver of both asset & profit diversification
Managed Loans ($B) $20 $15 $10 $5 $0
Q303 Q403 Q104 Q204 Q304 Q404 $21.2 $19.6 $18.7 $17.6 $16.5 $15.0
Net Income After Tax(1) ($M) $100 $90 $80 $70 $60 $50 $40 $30 $20 $10 $0
Q303 Q403 Q104 Q204 Q304 Q404 $86.8
$50.9 $46.1
$29.2 $21.0
$3.3
Managed Net Charge-off Rate
5% 4% 3% 2% 1% 0%
3.78% 3.69% 3.60%
3.43% 3.26% 3.30%
Q303 Q403 Q104 Q204 Q304 Q404
Managed $30+ Delinquency Rate
2.87%
2.63%
2.70% 2.65% 2.81% 2.50%
5% 4% 3% 2% 1% 0%
Q303 Q403 Q104 Q204 Q304 Q404
(1) Based on internal allocations of consolidated results
16
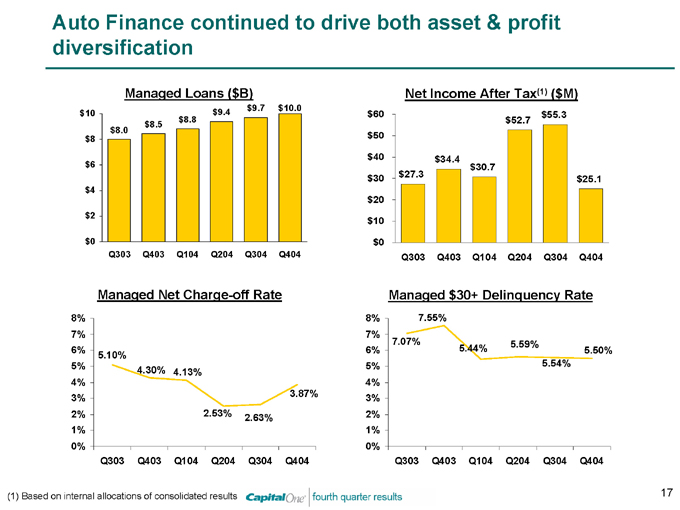
Auto Finance continued to drive both asset & profit diversification
Managed Loans ($B) $10 $8 $6 $4 $2 $0
Q303 Q403 Q104 Q204 Q304 Q404 $9.7 $10.0 $9.4 $8.8 $8.5 $8.0
Net Income After Tax(1) ($M) $60 $50 $40 $30 $20 $10 $0 $55.3 $52.7
$34.4 $30.7 $27.3 $25.1
Q303 Q403 Q104 Q204 Q304 Q404
Managed Net Charge-off Rate
8% 7% 6% 5% 4% 3% 2% 1% 0%
Q303 Q403 Q104 Q204 Q304 Q404
5.10%
4.30% 4.13%
3.87%
2.53%
2.63%
Managed $30+ Delinquency Rate
7.55%
7.07% 5.59%
5.44% 5.50% 5.54%
8% 7% 6% 5% 4% 3% 2% 1% 0%
Q303 Q403 Q104 Q204 Q304 Q404
(1) Based on internal allocations of consolidated results
17
We are well positioned to deliver strong performance in 2005
2005 Expectations:
12-15% Loan Growth Rate
Continued asset diversification with a bias toward lower loss assets US Card growth rate higher than industry Diversification businesses grow faster than US Card
Managed ROA between 1.7% and 1.8%
Modest declines in revenue margin offset by improvements in provision, operating and marketing expenses as a percentage of managed assets Quarter to quarter variability
Continuing Diversification
Loans Profits
2005 EPS Guidance of $6.60—$7.00
18