April 20, 2005

Forward-Looking Information
Forward-Looking Information
Please note that the following materials containing information regarding Capital One’s financial performance speak only as of the particular date or dates indicated in these materials. Capital One does not undertake any obligation to update or revise any of the information contained herein whether as a result of new information, future events or otherwise.
Certain statements in this presentation and other oral and written statements made by the Company from time to time, are forward-looking statements, including those that discuss strategies, goals, outlook or other non-historical matters including the benefits of the business combination transaction involving Capital One and Hibernia Corporation and the new company’s plans, objectives, expectations, and intentions; or project revenues, income, returns, earnings per share or other financial measures for Capital One or the new company. To the extent any such information is forward-looking, it is intended to fit within the safe harbor for forward-looking information provided by the Private Securities Litigation Reform Act of 1995. Numerous factors could cause our actual results to differ materially from those described in forward-looking statements, including, among other things: continued intense competition from numerous providers of products and services which compete with our businesses; an increase or decrease in credit losses; financial, legal, regulatory or accounting changes or actions; changes in interest rates; general economic conditions affecting consumer income, spending and repayments; changes in our aggregate accounts or consumer loan balances and the growth rate and composition thereof; changes in the reputation of the credit card industry and/or the company with respect to practices and products; our ability to continue to securitize our credit cards and consumer loans and to otherwise access the capital markets at attractive rates and terms to fund our operations and future growth; our ability to successfully continue to diversify our assets; losses associated with new products or services or expansion internationally; the company’s ability to execute on its strategic and operational plans; any significant disruption in our operations or technology platform; our ability to effectively control our costs; the success of marketing efforts; our ability to execute effective tax planning strategies; our ability to recruit and retain experienced management personnel; the ability to obtain regulatory approvals of the Capital One - Hibernia transaction on the proposed terms and schedule; the failure of Hibernia stockholders to approve the transaction; the risk that the businesses will not be integrated successfully; the risk that the cost savings and any other synergies from the transaction may not be fully realized or may take longer to realize than expected; disruption from the transaction making it more difficult to maintain relationships with customers, employees or suppliers; and other factors listed from time to time in reports we file with the Securities and Exchange Commission (the “SEC”), including, but not limited to, factors set forth under the caption “Risk Factors” in our Annual Report on Form 10-K for the year ended December 31, 2004, and any subsequent quarterly reports on Form 10-Q. You should carefully consider the factors discussed above in evaluating these forward-looking statements. All information in these slides is based on the consolidated results of Capital One Financial Corporation. Further information about Capital One can be obtained from the Corporation’s public filings with the SEC. A reconciliation of any non-GAAP financial measures included in this presentation can be found in the Company’s most recent Form 8-K or Form 10-Q concerning quarterly financial results, available on the Company’s website at www.capitalone.com in Investor Relations under “About Capital One.” based on new information or otherwise.
Additional Information About the Capital One - Hibernia Transaction
In connection with the proposed merger between Capital One and Hibernia Corporation, Capital One will file with the Securities and Exchange Commission (the “SEC”) a Registration Statement on Form S-4 that will include a proxy statement of Hibernia that also constitutes a prospectus of Capital One. Hibernia will mail the proxy statement/prospectus to its stockholders. Investors and security holders are urged to read the proxy statement/prospectus regarding the proposed merger when it becomes available because it will contain important information. You may obtain a free copy of the proxy statement/prospectus (when available) and other related documents filed by Capital One and Hibernia with the SEC at the SEC’s website at www.sec.gov. The proxy statement/prospectus (when it is available) and the other documents may also be obtained for free by accessing Capital One’s website at www.capitalone.com under the tab “Investors” and then under the heading “SEC & Regulatory Filings” or by accessing Hibernia’s website at www.hibernia.com under the tab “About Hibernia” and then under the heading “Investor Relations—SEC Filings”.
Capital One, Hibernia and their respective directors, executive officers and certain other members of management and employees may be soliciting proxies from Hibernia stockholders in favor of the merger. Information regarding the persons who may, under the rules of the SEC, be considered participants in the solicitation of the
Hibernia stockholders in connection with the proposed merger will be set forth in the proxy statement/prospectus when it is filed with the SEC. You can find information about
Capital One’s executive officers and directors in its definitive proxy statement filed with the SEC on March 21, 2005. You can find information about Hibernia’s executive officers and directors in its definitive proxy statement filed with the SEC on March 15, 2005. You can obtain free copies of these documents from Capital One and Hibernia using the contact information above.
2
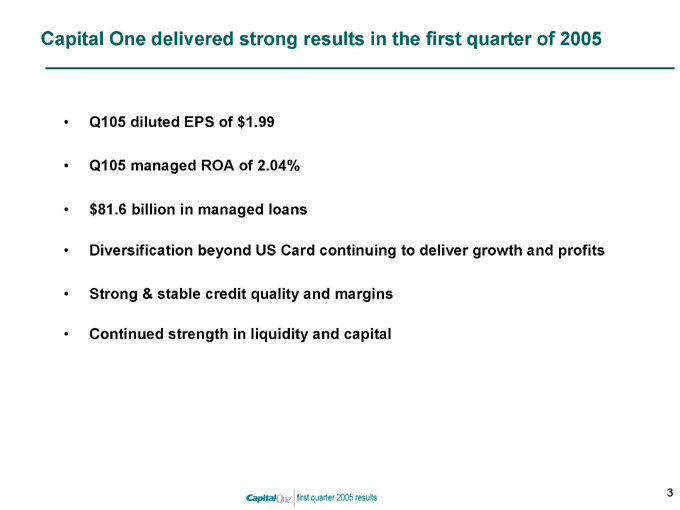
Capital One delivered strong results in the first quarter of 2005
Q105 diluted EPS of $1.99
Q105 managed ROA of 2.04%
$81.6 billion in managed loans
Diversification beyond US Card continuing to deliver growth and profits
Strong & stable credit quality and margins
Continued strength in liquidity and capital
3
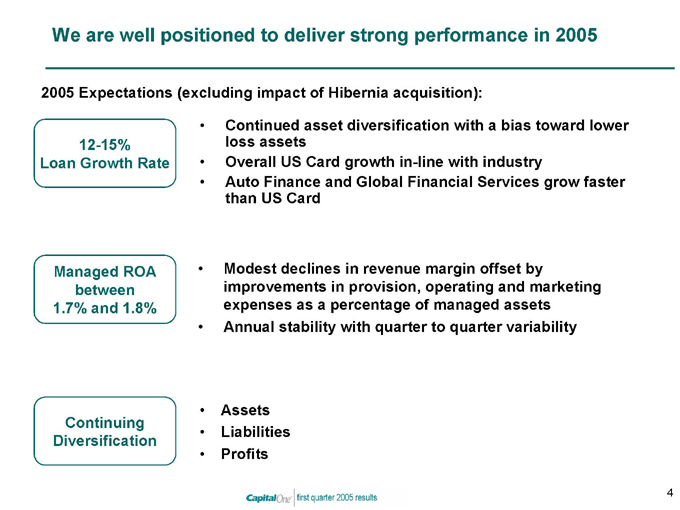
We are well positioned to deliver strong performance in 2005
2005 Expectations (excluding impact of Hibernia acquisition):
12-15% Loan Growth Rate
Continued asset diversification with a bias toward lower loss assets
Overall US Card growth in-line with industry
Auto Finance and Global Financial Services grow faster than US Card
Managed ROA between 1.7% and 1.8%
Modest declines in revenue margin offset by improvements in provision, operating and marketing expenses as a percentage of managed assets
Annual stability with quarter to quarter variability
Continuing Diversification
Assets
Liabilities
Profits
4
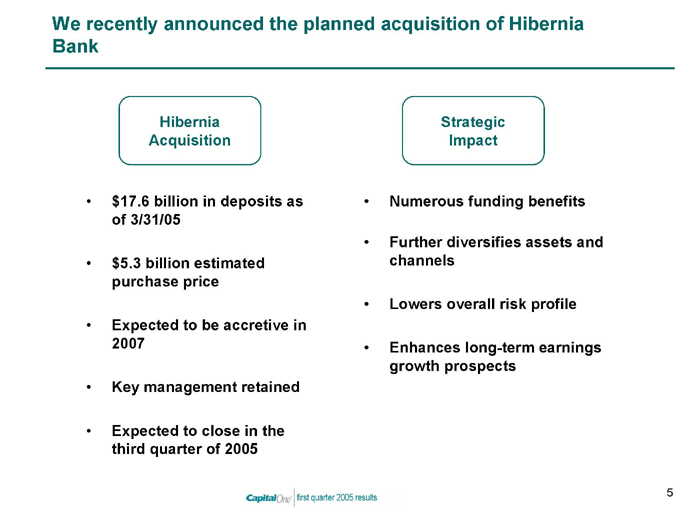
We recently announced the planned acquisition of Hibernia Bank
Hibernia Acquisition
$17.6 billion in deposits as of 3/31/05
$5.3 billion estimated purchase price
Expected to be accretive in 2007
Key management retained
Expected to close in the third quarter of 2005
Strategic Impact
Numerous funding benefits
Further diversifies assets and channels
Lowers overall risk profile
Enhances long-term earnings growth prospects
5
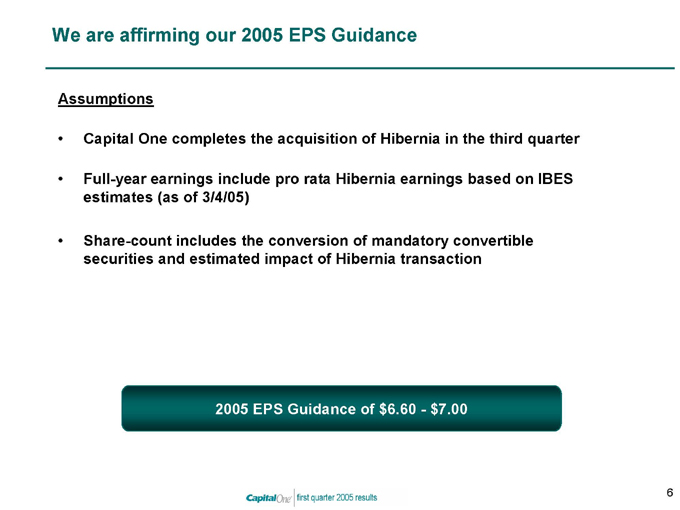
We are affirming our 2005 EPS Guidance
Assumptions
Capital One completes the acquisition of Hibernia in the third quarter
Full-year earnings include pro rata Hibernia earnings based on IBES estimates (as of 3/4/05)
Share-count includes the conversion of mandatory convertible securities and estimated impact of Hibernia transaction
2005 EPS Guidance of $6.60 - $7.00
6
First Quarter 2005
Financial Update
Segment Update
7
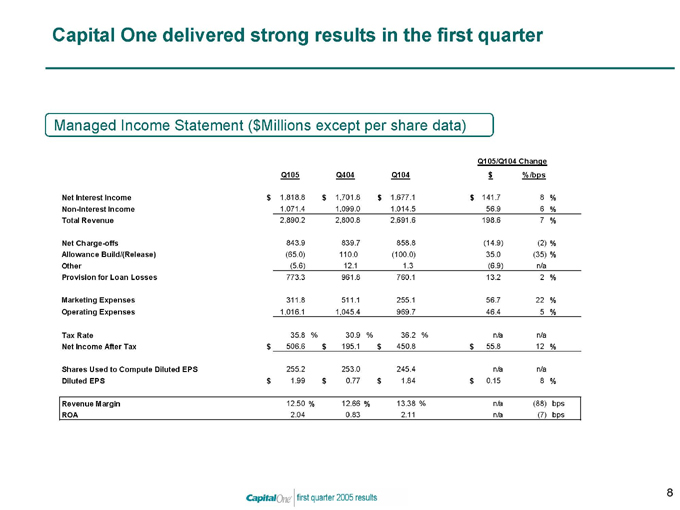
Capital One delivered strong results in the first quarter
Managed Income Statement ($Millions except per share data)
Q105/Q104 Change
Q105 Q404 Q104 $ %/bps
Net Interest Income $1,818.8 $1,701.8 $1,677.1 $141.7 8%
Non-Interest Income 1,071.4 1,099.0 1,014.5 56.9 6%
Total Revenue 2,890.2 2,800.8 2,691.6 198.6 7%
Net Charge-offs 843.9 839.7 858.8 (14.9) (2)%
Allowance Build/(Release) (65.0) 110.0 (100.0) 35.0 (35)%
Other (5.6) 12.1 1.3 (6.9) n/a
Provision for Loan Losses 773.3 961.8 760.1 13.2 2%
Marketing Expenses 311.8 511.1 255.1 56.7 22%
Operating Expenses 1,016.1 1,045.4 969.7 46.4 5%
Tax Rate 35.8% 30.9% 36.2% n/a n/a
Net Income After Tax $506.6 $195.1 $450.8 $55.8 12%
Shares Used to Compute Diluted EPS 255.2 253.0 245.4 n/a n/a
Diluted EPS $1.99 $0.77 $1.84 $0.15 8%
Revenue Margin 12.50% 12.66% 13.38% n/a (88) bps
ROA 2.04 0.83 2.11 n/a (7) bps
8
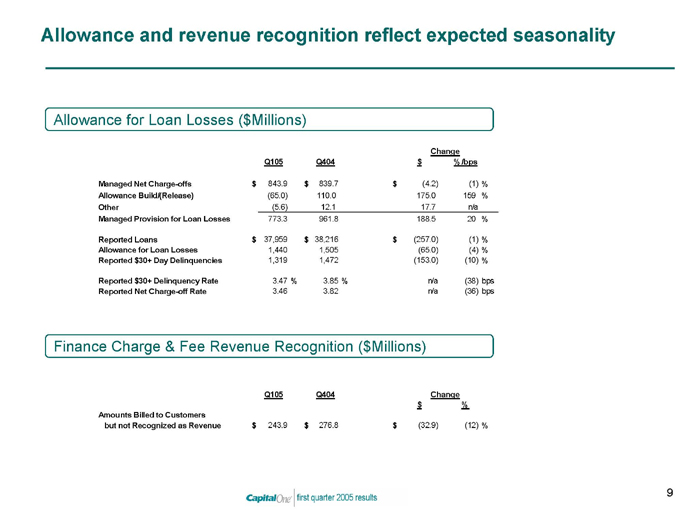
Allowance and revenue recognition reflect expected seasonality
Allowance for Loan Losses ($Millions)
Change
Q105 Q404 $ %/bps
Managed Net Charge-offs $843.9 $839.7 $(4.2) (1)%
Allowance Build/(Release) (65.0) 110.0 175.0 159%
Other (5.6) 12.1 17.7 n/a
Managed Provision for Loan Losses 773.3 961.8 188.5 20%
Reported Loans $37,959 $38,216 $(257.0) (1)%
Allowance for Loan Losses 1,440 1,505 (65.0) (4)%
Reported $30+ Day Delinquencies 1,319 1,472 (153.0) (10)%
Reported $30+ Delinquency Rate 3.47% 3.85% n/a (38) bps
Reported Net Charge-off Rate 3.46 3.82 n/a (36) bps
Finance Charge & Fee Revenue Recognition ($Millions)
Q105 Q404 Change $ %
Amounts Billed to Customers
but not Recognized as Revenue $243.9 $276.8 $(32.9) (12)%
9
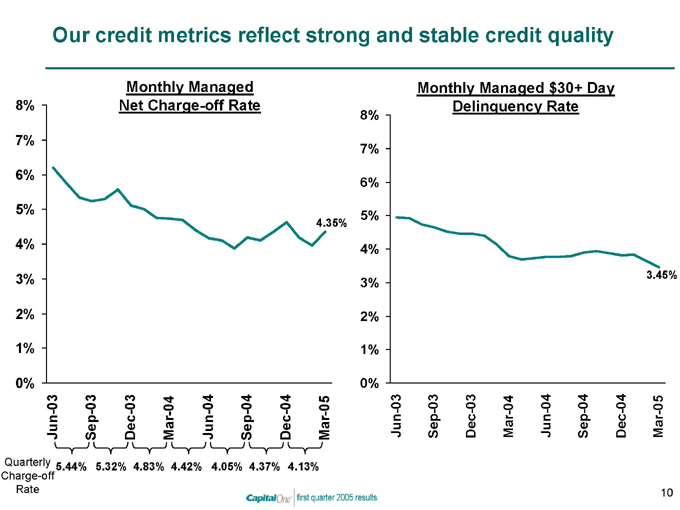
Our credit metrics reflect strong and stable credit quality
Monthly Managed Net Charge-off Rate
8% 7% 6% 5% 4% 3% 2% 1% 0%
Jun-03 Sep-03 Dec-03 Mar-04 Jun-04 Sep-04 Dec-04 Mar-05
Quarterly 5.44% 5.32% 4.83% 4.42% 4.05% 4.37% 4.13%
Charge-off Rate
4.35%
Monthly Managed $30+ Day Delinquency Rate
8% 7% 6% 5% 4% 3% 2% 1% 0%
Jun-03 Sep-03 Dec-03 Mar-04 Jun-04 Sep-04 Dec-04 Mar-05
3.45%
10
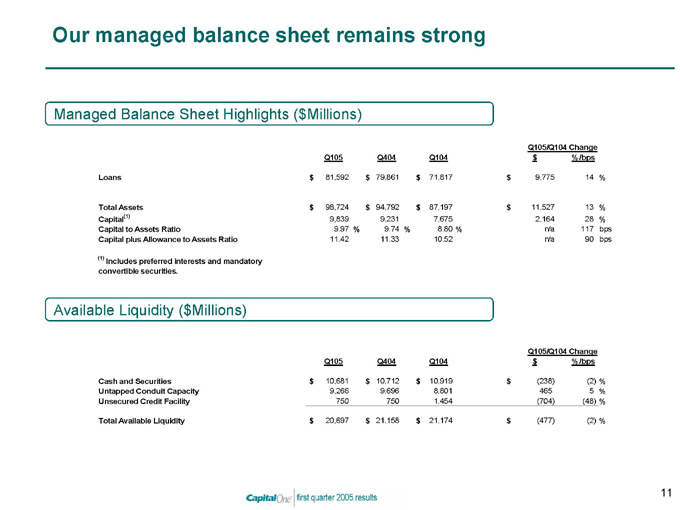
Our managed balance sheet remains strong
Managed Balance Sheet Highlights ($Millions)
Q105/Q104 Change
Q105 Q404 Q104 $ %/bps
Loans $81,592 $79,861 $71,817 $9,775 14%
Total Assets $98,724 $94,792 $87,197 $11,527 13%
Capital(1) 9,839 9,231 7,675 2,164 28%
Capital to Assets Ratio 9.97% 9.74% 8.80% n/a 117 bps
Capital plus Allowance to Assets Ratio 11.42 11.33 10.52 n/a 90 bps
(1) Includes preferred interests and mandatory
convertible securities.
Available Liquidity ($Millions)
Q105/Q104 Change
Q105 Q404 Q104 $ %/bps
Cash and Securities $10,681 $10,712 $10,919 $(238) (2)%
Untapped Conduit Capacity 9,266 9,696 8,801 465 5%
Unsecured Credit Facility 750 750 1,454 (704) (48)%
Total Available Liquidity $20,697 $21,158 $21,174 $(477) (2)%
11
First Quarter 2005
Financial Update
Segment Update
12
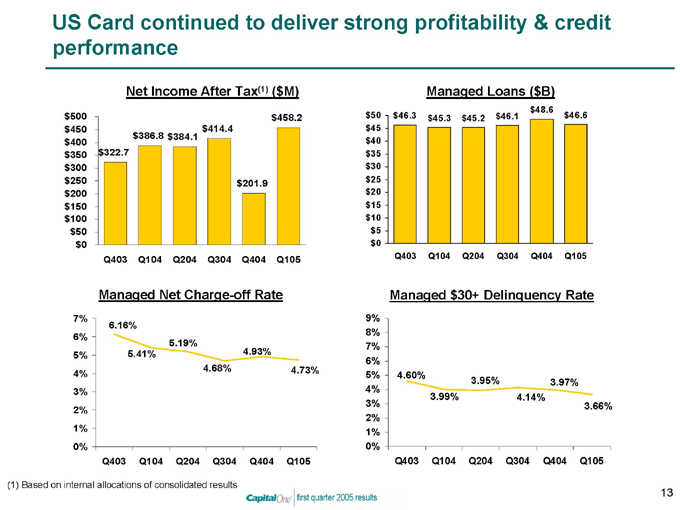
US Card continued to deliver strong profitability & credit performance
Net Income After Tax(1) ($M) $500 $450 $400 $350 $300 $250 $200 $150 $100 $50 $0
Q403 Q104 Q204 Q304 Q404 Q105 $322.7 $386.8 $384.1 $414.4 $201.9 $458.2
Managed Net Charge-off Rate
7% 6% 5% 4% 3% 2% 1% 0%
Q403 Q104 Q204 Q304 Q404 Q105
6.16%
5.41%
5.19%
4.68%
4.93%
4.73%
Managed Loans ($B) $50 $45 $40 $35 $30 $25 $20 $15 $10 $5 $0
Q403 Q104 Q204 Q304 Q404 Q105 $46.3 $45.3 $45.2 $46.1 $48.6 $46.6
Managed $30+ Delinquency Rate
9% 8% 7% 6% 5% 4% 3% 2% 1% 0%
Q403 Q104 Q204 Q304 Q404 Q105
4.60%
3.99%
3.95%
4.14%
3.97%
3.66%
(1) Based on internal allocations of consolidated results
13
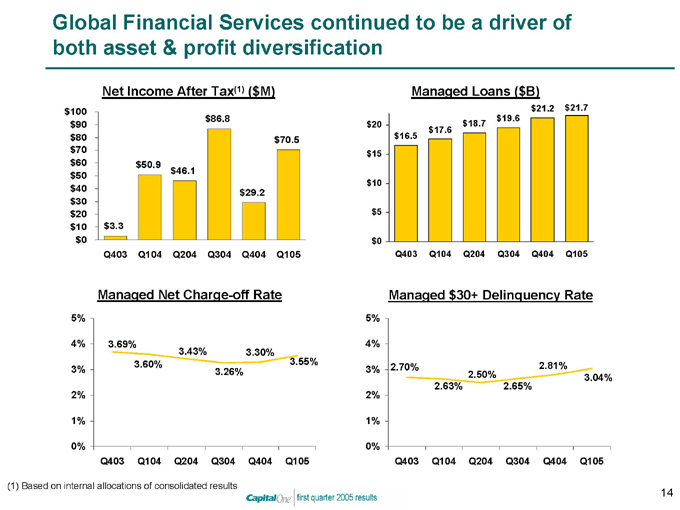
Global Financial Services continued to be a driver of both asset & profit diversification
Net Income After Tax(1) ($M) $100 $90 $80 $70 $60 $50 $40 $30 $20 $10 $0
Q403 Q104 Q204 Q304 Q404 Q105 $3.3 $50.9 $46.1 $86.8 $29.2 $70.5
Managed Net Charge-off Rate
5% 4% 3% 2% 1% 0%
Q403 Q104 Q204 Q304 Q404 Q105
3.69%
3.60%
3.43%
3.26%
3.30%
3.55%
Managed Loans ($B) $20 $15 $10 $5 $0
Q403 Q104 Q204 Q304 Q404 Q105 $16.5 $17.6 $18.7 $19.6 $21.2 $21.7
Managed $30+ Delinquency Rate
5% 4% 3% 2% 1% 0%
Q403 Q104 Q204 Q304 Q404 Q105
2.70%
2.63%
2.50%
2.65%
2.81%
3.04%
(1) Based on internal allocations of consolidated results
14
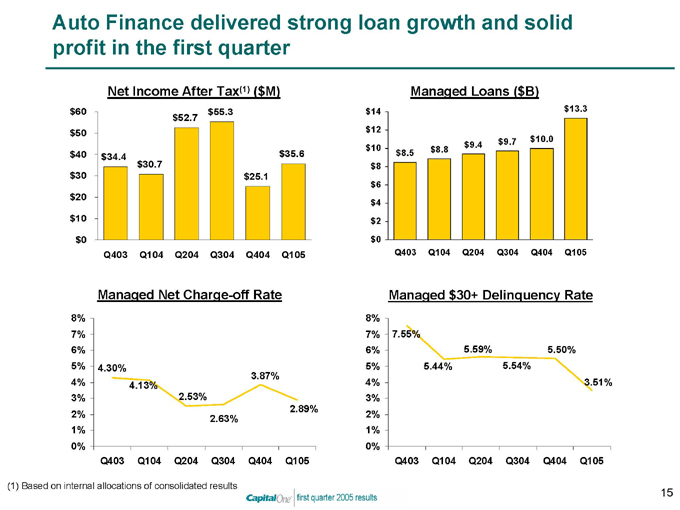
Auto Finance delivered strong loan growth and solid profit in the first quarter
Net Income After Tax(1) ($M) $60 $50 $40 $30 $20 $10 $0
Q403 Q104 Q204 Q304 Q404 Q105 $34.4 $30.7 $52.7 $55.3 $25.1 $35.6
Managed Net Charge-off Rate
8% 7% 6% 5% 4% 3% 2% 1% 0%
Q403 Q104 Q204 Q304 Q404 Q105
4.30%
4.13%
2.53%
2.63%
3.87%
2.89%
Managed Loans ($B) $14 $12 $10 $8 $6 $4 $2 $0
Q403 Q104 Q204 Q304 Q404 Q105 $8.5 $8.8 $9.4 $9.7 $10.0 $13.3
Managed $30+ Delinquency Rate
8% 7% 6% 5% 4% 3% 2% 1% 0%
Q403 Q104 Q204 Q304 Q404 Q105
7.55%
5.44%
5.59%
5.54%
5.50%
3.51%
(1) Based on internal allocations of consolidated results
15

We are delivering strong results while building a stronger company
Strong Quarter
Solid growth in loans, revenues
Strong and stable credit quality and margins
Strong balance sheet
Solid 2005 Trajectory
12-15% loan growth rate
1.7% to 1.8% managed ROA
Sustained earnings power
Lower-Risk Profile
Continuing diversification of assets, liabilities and profits
Lower-cost, more fortified funding
16