 July 20, 2006 Exhibit 99.2 |
 2 Forward-Looking Information Please note that the following materials containing information regarding Capital One’s financial performance speak only as of the particular date or dates indicated in these materials. Capital One does not undertake any obligation to update or revise any of the information contained herein whether as a result of new information, future events or otherwise. Certain statements in this presentation and other oral and written statements made by the Company from time to time, are forward-looking statements, including those that discuss strategies, goals, outlook or other non-historical matters; project revenues, income, returns, earnings per share or other financial measures for Capital One or those that discuss the benefits of the business combination transaction involving Capital One and North Fork Bancorporation, including future financial and operating results, and the new company’s plans, objectives, expectations and intentions. To the extent any such information is forward-looking, it is intended to fit within the safe harbor for forward-looking information provided by the Private Securities Litigation Reform Act of 1995. Numerous factors could cause our actual results to differ materially from those described in forward-looking statements, including, among other things: continued intense competition from numerous providers of products and services which compete with our businesses; an increase or decrease in credit losses; financial, legal, regulatory or accounting changes or actions; changes in interest rates; general economic conditions affecting consumer income, spending and repayments; changes in our aggregate accounts or consumer loan balances and the growth rate and composition thereof; the amount of deposit growth; changes in the reputation of the credit card industry and/or the company with respect to practices and products; our ability access the capital markets at attractive rates and terms to fund our operations and future growth; the company’s ability to execute on its strategic and operational plans; any significant disruption in our operations or technology platform; our ability to effectively managel our costs; the success of our marketing efforts; our ability to execute effective tax planning strategies; our ability to recruit and retain experienced management personnel; the risks that our acquired businesses will not be integrated successfully and that the cost savings and other synergies from the transactions may not be fully realized; the long-term impact of the Gulf Coast Hurricanes on the impacted region, including the amount of property and credit losses, the amount of investment, including deposits, in the region, and the pace and magnitude of economic recovery in the region; the ability to obtain regulatory approvals of the North Fork transaction on the proposed terms and schedule; the failure of Capital One or North Fork stockholders to approve the transaction; the exact timing of the close of the North Fork merger; the purchase accounting impacts of the North Fork merger; the amount and timing of integration expenses; disruption from the transaction making it more difficult to maintain relationships with customers, employees or suppliers; the ability to obtain regulatory approvals of the North Fork transaction on the proposed terms and schedule; the failure of Capital One or North Fork stockholders to approve the transaction; the exact timing of the close of the North Fork merger; the purchase accounting impacts of the North Fork merger; the amount and timing of integration expenses; disruption from the transaction making it more difficult to maintain relationships with customers, employees or suppliers; the ability to obtain regulatory approvals of the North Fork transaction on the proposed terms and schedule; the failure of Capital One or North Fork stockholders to approve the transaction; the exact timing of the close of the North Fork merger; the magnitude of market-driven purchase accounting adjustments related to the close; the amount and timing of integration expenses; disruption from the transaction making it more difficult to maintain relationships with customers, employees or suppliers; and other factors listed from time to time in reports we file with the Securities and Exchange Commission (the “SEC”) , including, but not limited to, factors set forth under the caption “Risk Factors” in our Annual Report on Form 10-K for the year ended December 31, 2005, and any subsequent quarterly reports on Form 10-Q. You should carefully consider the factors discussed above in evaluating these forward-looking statements. All information in these slides is based on the consolidated results of Capital One Financial Corporation. A reconciliation of any non-GAAP financial measures included in this presentation can be found in the Company’s most recent Form 8-K or Form 10-Q concerning quarterly financial results, available on the Company’s website at www.capitalone.com in Investor Relations under “About Capital One.” Additional Information About the Capital One – North Fork Transaction In connection with the proposed merger between Capital One and North Fork, Capital One filed with the Securities and Exchange Commission (the “SEC”) a Registration Statement on Form S-4 that includes a joint proxy statement of Capital One and North Fork that also constitutes a prospectus of Capital One. Capital One and North Fork have mailed the joint proxy statement/prospectus to their respective stockholders. Investors and security holders are urged to read the joint proxy statement/prospectus regarding the proposed merger because it contains important information. You may obtain a free copy of the joint proxy statement/prospectus and other related documents filed by Capital One and North Fork with the SEC at the SEC’s website at www.sec.gov. The joint proxy statement/prospectus and the other documents may also be obtained for free by accessing Capital One’s website at www.capitalone.com under the heading “Investors” and then under the heading “SEC & Regulatory Filings” or by accessing North Fork’s website at www.northforkbank.com under the tab “Investor Relations” and then under the heading “SEC Filings”. Participants in the Capital One – North Fork Transaction Capital One, North Fork and their respective directors, executive officers and certain other members of management and employees may be soliciting proxies from stockholders in favor of the merger. Information regarding the persons who may, under the rules of the SEC, be considered participants in the solicitation of the stockholders in connection with the proposed merger will be set forth in the joint proxy statement/prospectus when it is filed with the SEC. You can find information about Capital One’s executive officers and directors in Capital One’s definitive proxy statement filed with the SEC on March 23, 2006. You can find information about North Fork’s executive officers and directors in the Form 10-K/A filed with the SEC on April 28, 2006. You can obtain free copies of these documents from the Capital One or North Fork using the contact information above. Forward looking statements |
 3 Second quarter 2006 results and 2006 guidance • Net income after tax of $553M, up 4% from Q205 • Q206 diluted EPS of $1.78, down 12% from Q205 • $108.4 billion in managed loans, up 4.3% from Q106 • $35.3B in bank deposits, flat from Q106 • Managed revenue margin of 10.77%, down 53bp from Q106 • Managed charge-off rate of 2.75%, up 10bp from Q106 • Reaffirm 2006 guidance assuming 4 th quarter close of North Fork acquisition – $7.40-7.80 Diluted EPS, including the expected impact of North Fork acquisition – 7-9% loan growth, excluding North Fork acquisition – Continued stability in managed ROA, including North Fork acquisition • Purchase accounting and timing of close add significant uncertainty as to the effect of North Fork acquisition on our 4th quarter ROA and EPS |
 4 ($Millions except per share data) Q206/Q205 Change Q206 Q106 Q205 $ %/bps Net Interest Income $ 2,140.8 $ 2,235.0 $ 1,830.3 $ 310.5 17 % Non-Interest Income 1,199.4 1,222.2 1,144.8 54.6 5 % Total Revenue 3,340.2 3,457.2 2,975.1 365.1 12 % Net Charge-offs 729.0 692.5 844.6 (115.6) (14) % Allowance Build/(Release) 90.0 (115.0) (35.0) 125.0 n/a Other (23.4) (15.2) 2.6 (26.0) n/a Provision for Loan Losses 795.6 562.3 812.2 (16.6) (2) % Marketing Expenses 356.7 323.8 277.0 79.7 29 % Operating Expenses 1,324.2 1,249.7 1,058.6 265.6 25 % Tax Rate 36.0 % 33.2 % 35.8 % n/a 2 bps Net Income After Tax $ 552.6 $ 883.3 $ 531.1 $ 21.5 4 % Shares Used to Compute Diluted EPS (MM) 310.0 309.1 261.7 n/a 18 % Diluted EPS $ 1.78 $ 2.86 $ 2.03 $ (0.25) (12) % Revenue Margin 10.77 % 11.30 % 12.65 % n/a (188) bps Return on Managed Assets 1.62 2.62 2.11 n/a (49) bps Return on Equity 14.19 24.18 23.80 n/a (961) bps Second quarter 2006 managed income statement |
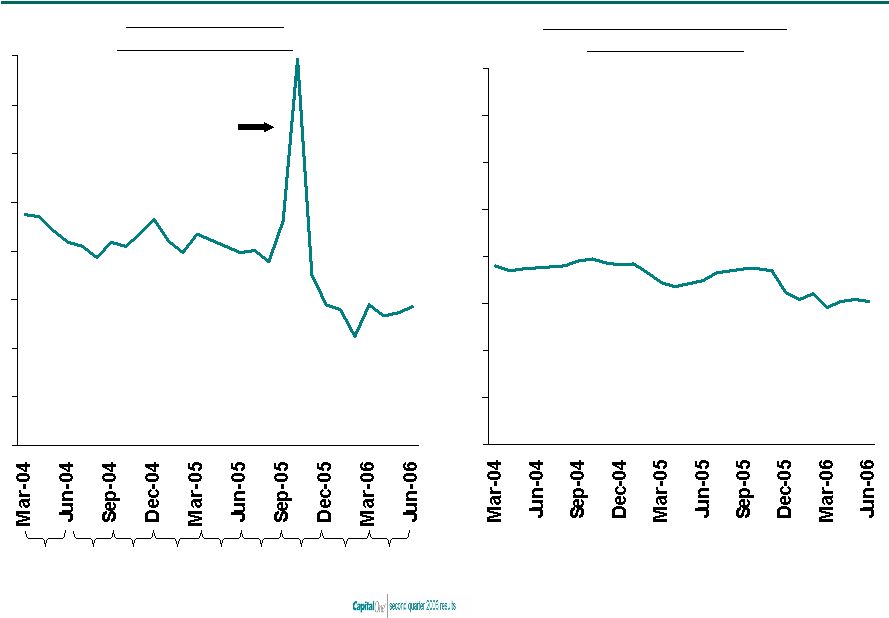 5 Credit metrics remain strong 0% 1% 2% 3% 4% 5% 6% 7% 8% Monthly Managed Net Charge-off Rate 0% 1% 2% 3% 4% 5% 6% 7% 8% Monthly Managed $30+ Day Delinquency Rate 4.42% 4.05% 4.37% 4.13% 4.10% Quarterly Charge-off Rate 4.14% 4.53% 2.65% Bankruptcy Filing Spike 3.05% 2.75% |
 6 Loan growth and allowance build in the second quarter Charge-offs and Allowance for Loan Losses ($Millions) Finance Charge & Fee Revenue Recognition ($Millions) Q206/Q106 Change Q206 Q106 Q205 $ %/bps Managed Net Charge-offs $ 729.0 $ 692.5 $ 844.6 $ 36.5 5 % Allowance Build/(Release) 90.0 (115.0) (35.0) 205.0 n/a Other (23.4) (15.2) 2.6 (8.2) n/a Managed Provision for Loan Losses 795.6 562.3 812.2 233.3 41 % Reported Loans $ 60,603 $ 58,119 $ 38,611 $ 2,484 4 % Allowance for Loan Losses 1,765 1,675 1,405 90 5 % Reported $30+ Day Delinquencies 1,772 1,559 1,400 213 14 % Reported $30+ Delinquency Rate 2.92 % 2.68 % 3.62 % n/a 24 bps Reported Net Charge-off Rate 2.01 2.07 3.39 n/a (6) bps Q206 Q106 Q205 Q206/Q106 Change $ % Amounts Billed to Customers but not Recognized as Revenue $ 215.0 $ 170.9 $ 259.8 $ 44.1 26 % |
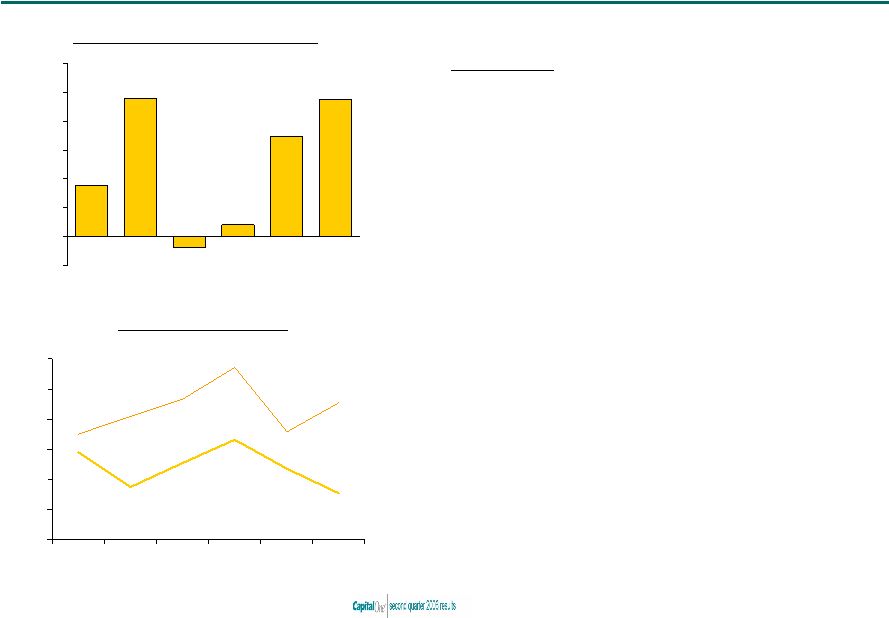
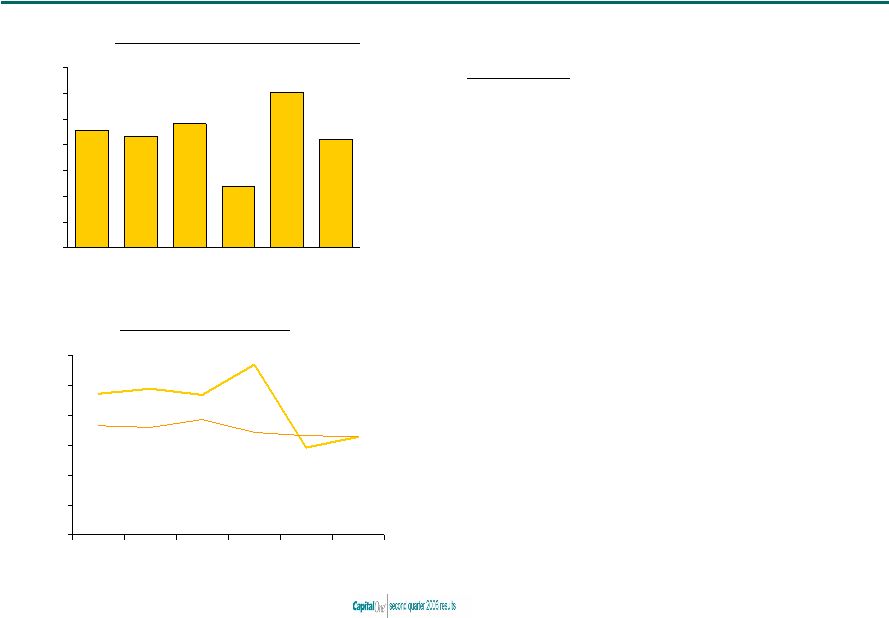 7 US Card delivered strong growth in loans and purchase volume 3.29% 2.93% 4.73% 5.70% 4.69% 4.90% 3.30% 3.31% 3.44% 3.86% 3.66% 3.60% 0% 1% 2% 3% 4% 5% 6% Q105 Q205 Q305 Q405 Q106 Q206 Net Income After Tax (1) ($M) Credit Risk Metrics (1) Based on internal allocations of consolidated results Managed 30+ Delinquency Rate Managed Net Charge-off Rate Highlights • Net income down $11M from Q205 • Charge-off rate rose modestly, but remains near historical lows • Seasonality and strong credit contributed to lower past-due fees and compressed revenue margin • Strong growth versus Q205 – managed loans up 5% – purchase volume up 16% • Competition remains intense – long-dated 0% teasers still dominate revolver segments $458.2 $432.4 $481.8 $237.0 $602.8 $421.8 $0 $100 $200 $300 $400 $500 $600 $700 Q105 Q205 Q305 Q405 Q106 Q206 |
 8 3.90% 3.63% 4.33% 4.09% 3.89% 3.55% 2.82% 2.90% 2.83% 2.93% 2.93% 3.04% 0% 1% 2% 3% 4% 5% 6% Q105 Q205 Q305 Q405 Q106 Q206 GFS businesses in North America delivered strong performance, while our U.K. business continued to struggle Credit Risk Metrics $70.5 $26.7 $81.9 $7.1 $113.5 $51.2 $0 $20 $40 $60 $80 $100 $120 Q105 Q205 Q305 Q405 Q106 Q206 Net Income After Tax (1) ($M) (1) Based on internal allocations of consolidated results Managed Net Charge-off Rate Managed 30+ Delinquency Rate Highlights • Net income up $24M from Q205 • $3.9B loan growth, or 18%, over Q205, driven principally by Installment Loans • Home Loans, Small Business, and Canada continue to perform well • Credit strong in U.S. and Canada; weak in U.K. |
 9 1.54% 2.35% 2.89% 1.74% 3.32% 2.54% 4.55% 3.57% 5.71% 4.65% 4.09% 3.51% 0% 1% 2% 3% 4% 5% 6% Q105 Q205 Q305 Q405 Q106 Q206 Strong originations and credit quality resulted in a solid quarter in Auto Finance Credit Risk Metrics $35.6 $96.1 ($7.7) $8.1 $69.4 $95.1 ($20) $0 $20 $40 $60 $80 $100 $120 Q105 Q205 Q305 Q405 Q106 Q206 Net Income After Tax (1) ($M) (1) Based on internal allocations of consolidated results Managed Net Charge-off Rate Managed 30+ Delinquency Rate Highlights • Net income of $95M, down $1M, or 1%, from Q205 • $3.1B in originations, $20.6B in managed loans • Strong credit performance – Favorable credit environment – Mix shift upmarket – Seasonal impacts on charge-offs and delinquencies • Growth in prime loans drove margins, costs, and loss rates lower |
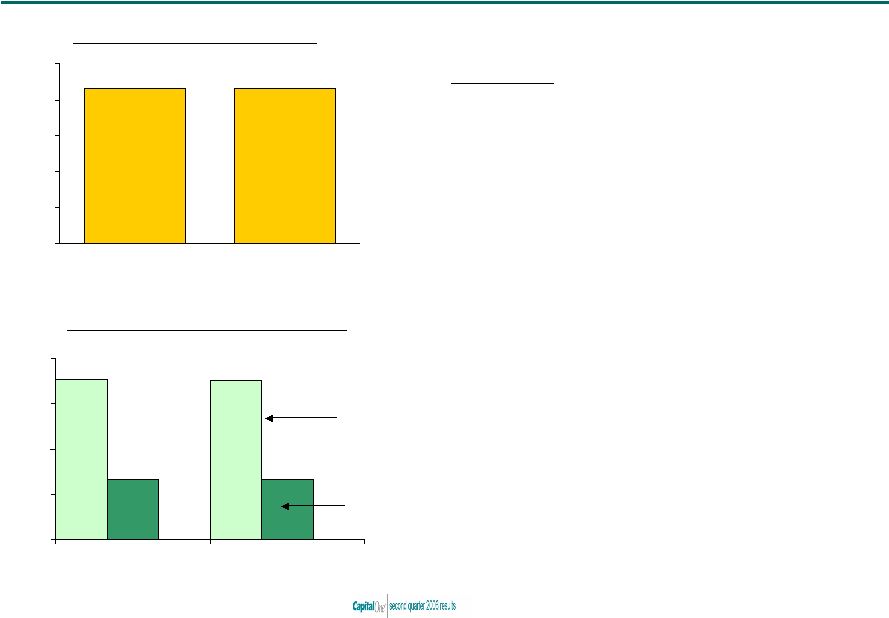 10 $35.4 $35.3 $13.2 $13.2 $0 $10 $20 $30 $40 Q106 Q206 Banking segment loan and deposit dynamics reflect the environment in the Gulf Coast hurricane impacted region Deposit and Loan Portfolio ($B) $43.3 $43.3 $0 $10 $20 $30 $40 $50 Q106 Q206 Net Income After Tax (1) ($M) (1) Based on internal allocations of consolidated results Loans Deposits Highlights • $43M NIAT, in-line with Q106 • Loans and deposits declined in hurricane impacted areas, grew in rest of network • Credit metrics remain modestly elevated in the post-hurricane environment • Opened 7 new branches, on track to open 40 in 2006 • Integration proceeding smoothly – Costs and synergies tracking plan – Brand conversion completed in May |
 11 North Fork transaction expected to close in fourth quarter of 2006 • Multiple growth platforms – Local scale deposits, small business, mid- market banking – National scale Alt-A mortgage and Home Equity originator • Leverages Capital One strengths – National brand – National scale lending – Massive customer base – Marketing and analytics • Balances the company – Assets, Liabilities, Earnings – Lowers overall risk profile – Lowers capital requirements North Fork Bank Acquisition Strategic Fit • $14.6 billion estimated purchase price • $36.6 billion in deposits as of 12/31/05 • Expected to be accretive to Operating EPS in 2008 • CEO John Kanas will lead banking |