 October 18, 2006 Exhibit 99.2 |
 2 Forward-Looking Information Please note that the following materials containing information regarding Capital One’s financial performance speak only as of the particular date or dates indicated in these materials. Capital One does not undertake any obligation to update or revise any of the information contained herein whether as a result of new information, future events or otherwise. Certain statements in this presentation and other oral and written statements made by the Company from time to time, are forward-looking statements, including those that discuss strategies, goals, outlook or other non-historical matters; project revenues, income, returns, earnings per share or other financial measures for Capital One or those that discuss the benefits of the business combination transaction involving Capital One and North Fork Bancorporation, including future financial and operating results, and the new company’s plans, objectives, expectations and intentions. To the extent any such information is forward-looking, it is intended to fit within the safe harbor for forward-looking information provided by the Private Securities Litigation Reform Act of 1995. Numerous factors could cause our actual results to differ materially from those described in forward- looking statements, including, among other things: the ability to obtain regulatory approvals of the North Fork transaction on the proposed terms and schedule; the exact timing of the close of the North Fork transaction and magnitude of market-driven purchase accounting adjustments related to the close; the risk that the Capital One’s acquired businesses will not be integrated successfully; the risk that the cost savings and other synergies from such acquisitions may not be fully realized or may take longer to realize than expected; disruption from the acquisitions making it more difficult to maintain relationships with customers, employees or suppliers; continued intense competition from numerous providers of products and services which compete with our businesses; an increase or decrease in credit losses; financial, legal, regulatory or accounting changes or actions; changes in interest rates; general economic conditions affecting consumer income, spending and repayments; changes in our aggregate accounts or consumer loan balances and the growth rate and composition thereof; the amount of deposit growth; changes in the reputation of the credit card industry and/or the company with respect to practices and products; our ability to access the capital markets at attractive rates and terms to fund our operations and future growth; our ability to successfully continue to diversify our assets; losses associated with new products or services; the company’s ability to execute on its strategic and operational plans; any significant disruption in our operations or technology platform; our ability to effectively control our costs; the success of marketing efforts; our ability to execute effective tax planning strategies; our ability to recruit and retain experienced management personnel; the long-term impact of the Gulf Coast Hurricanes on the impacted region, including the amount of property and credit losses, the amount of investment, including deposits, in the region, and the pace and magnitude of economic recovery in the region; and other factors listed from time to time in reports we file with the Securities and Exchange Commission (the “SEC”) , including, but not limited to, factors set forth under the caption “Risk Factors” in our Annual Report on Form 10-K for the year ended December 31, 2005, and any subsequent quarterly reports on Form 10-Q. You should carefully consider the factors discussed above in evaluating these forward-looking statements. All information in these slides is based on the consolidated results of Capital One Financial Corporation. A reconciliation of any non-GAAP financial measures included in this presentation can be found in the Company’s most recent Form 8-K or Form 10-Q concerning quarterly financial results, available on the Company’s website at www.capitalone.com in Investor Relations under “About Capital One.” Additional Information About the Capital One – North Fork Transaction In connection with the proposed merger between Capital One and North Fork, Capital One filed with the Securities and Exchange Commission (the “SEC”) a Registration Statement on Form S-4 that includes a joint proxy statement of Capital One and North Fork that also constitutes a prospectus of Capital One. Capital One and North Fork mailed the definitive joint proxy statement/prospectus to their respective stockholders on or about July 14, 2006. Investors and security holders are urged to read the definitive joint proxy statement/prospectus regarding the proposed merger because it contains important information. You may obtain a free copy of the definitive joint proxy statement/prospectus and other related documents filed by Capital One and North Fork with the SEC at the SEC’s website at www.sec.gov. The definitive joint proxy statement/prospectus and the other documents may also be obtained for free by accessing Capital One’s website at www.capitalone.com under the heading “Investors” and then under the heading “SEC & Regulatory Filings” or by accessing North Fork’s website at www.northforkbank.com under the tab “Investor Relations” and then under the heading “SEC Filings”. Forward looking statements * |
 3 Third quarter 2006 summary • Q306 diluted EPS of $1.89, up 4% from Q305 • Net income after tax of $588M, up 20% from Q305 • $112.2 billion in managed loans, up 4% from Q206 • $47.5B in average deposits, up 0.6% from Q206 • Managed revenue margin of 10.95%, up 18 bp from Q206 • Managed charge-off rate of 2.92%, up 17 bp from Q206 We expect diluted EPS in the higher end of our 2006 guidance range of $7.40-7.80, assuming a ($0.30) impact of a 4 th quarter close of the North Fork acquisition. * |
 4 ($Millions except per share data) Third quarter 2006 managed income statement * Q306/Q206 Change Q306 Q206 Q305 $ %/bps Net Interest Income $ 2,217.8 $ 2,140.8 $ 1,931.2 $ 77.0 4 % Non-Interest Income 1,275.4 1,199.4 1,099.8 76.0 6 Total Revenue 3,493.2 3,340.2 3,031.0 153.0 5 Net Charge-offs $ 806.0 $ 729.0 $ 868.0 77.0 11 % Allowance Build 75.0 90.0 42.0 (15.0) (17)% Other (13.1) (23.4) (9.6) 10.3 n/a Provision for Loan Losses 867.9 795.6 900.4 72.3 9 % Marketing Expenses $ 368.5 $ 356.7 $ 343.7 11.8 3 % Operating Expenses 1,358.1 1,324.2 1,021.9 33.9 3 % Tax Rate 34.6 % 36.0 % 35.8 % n/a (140)bps Net Income After Tax $ 587.8 $ 552.6 $ 491.1 $ 35.2 6 % Shares Used to Compute Diluted EPS (MM) 310.4 310.0 270.7 n/a 0.13% Diluted EPS $ 1.89 $ 1.78 $ 1.81 $ 0.11 6 % Net Interest Margin 6.95% 6.90% 7.99% n/a 5 bps Revenue Margin 10.95 10.77 12.54 n/a 18 Return on Managed Assets 1.68 1.62 1.89 n/a 6 Return on Equity 14.42 14.19 18.19 n/a 23 |
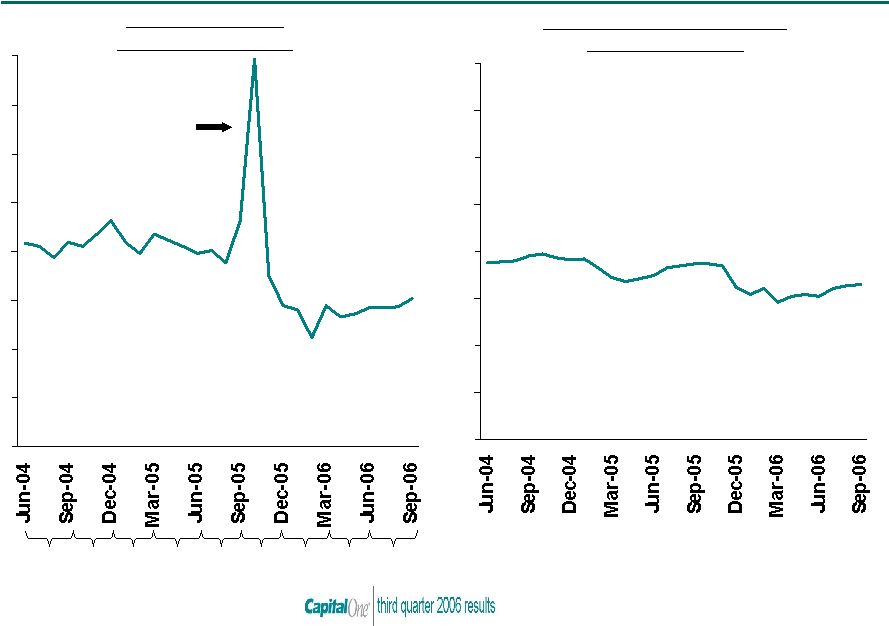 5 Credit loss and delinquency rates remain at historically low levels 0% 1% 2% 3% 4% 5% 6% 7% 8% Monthly Managed Net Charge-off Rate 0% 1% 2% 3% 4% 5% 6% 7% 8% Monthly Managed $30+ Day Delinquency Rate 4.05% 4.37% 4.13% 4.10% Quarterly Charge-off Rate 4.14% 4.53% 2.65% Bankruptcy Filing Spike 2.75% 2.92% 3.29% * |
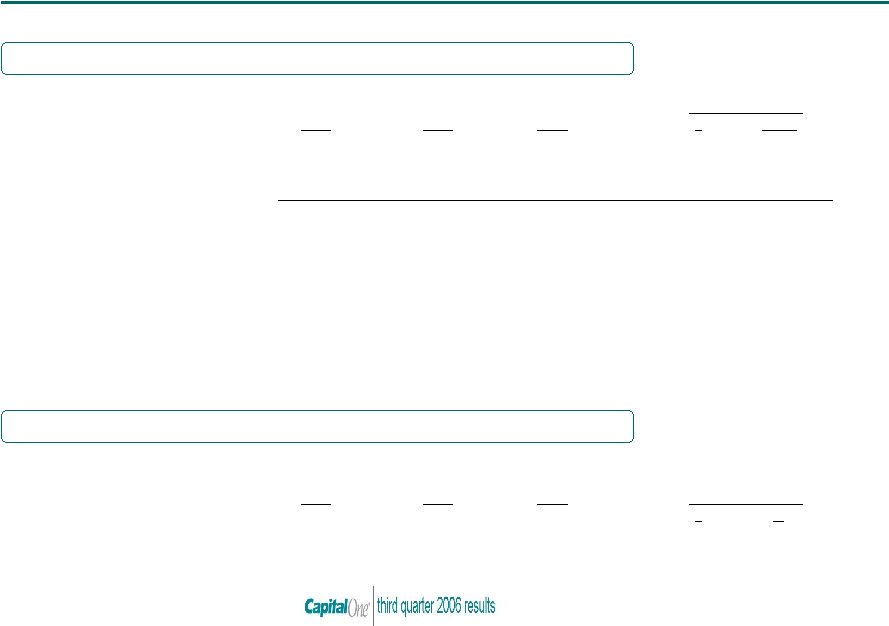 6 Loan growth drove modest increases in both provision and allowance Charge-offs and Allowance for Loan Losses ($Millions) Finance Charge & Fee Revenue Recognition ($Millions) Q306/Q206 Change Q306 Q206 Q305 $ %/bps Managed Net Charge-offs $ 806.0 $ 729.0 $ 868.0 $ 77.0 11 % Allowance Build/(Release) 75.0 90.0 42.0 (15.0) (17) Other (13.1) (23.4) (9.6) 10.3 n/a Managed Provision for Loan Losses 867.9 795.6 900.4 72.3 9 % Reported Loans $ 63,612 $ 60,603 $ 38,852 $ 3,009 5 % Allowance for Loan Losses 1,840 1,765 1,447 75 4 Reported $30+ Day Delinquencies 2,060 1,772 1,497 288 16 Reported $30+ Delinquency Rate 3.24 % 2.92 % 3.85 % n/a 32 bps Reported Net Charge-off Rate 2.36 2.01 3.55 n/a 35 Q306 Q206 Q305 Q306/Q206 Change $ % Amounts Billed to Customers but not Recognized as Revenue $ 226.3 $ 215.0 $ 255.6 $ 11.3 5 % * |
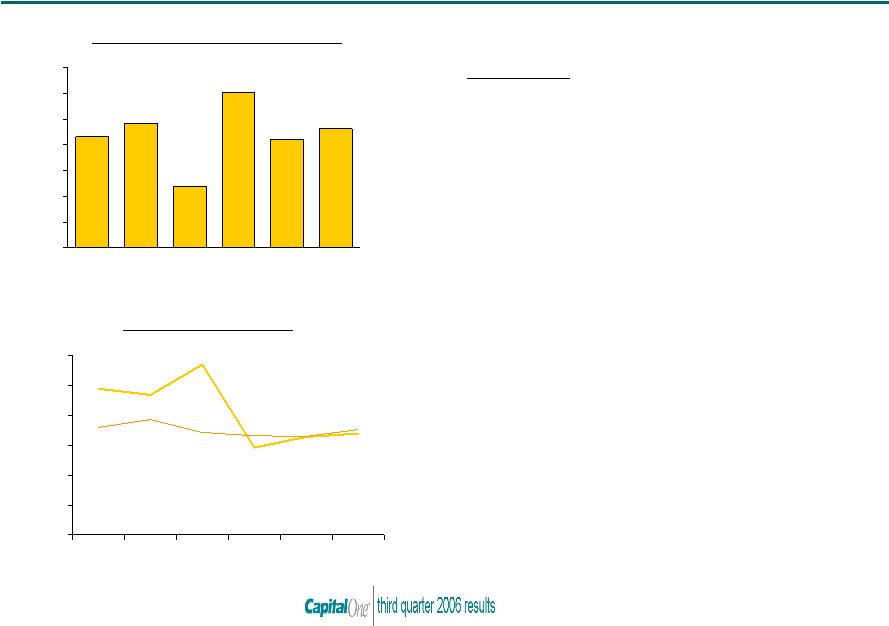 7 US Card continued to deliver strong growth, credit, and profits 4.69% 5.70% 2.93% 4.90% 3.29% 3.39% 3.86% 3.60% 3.44% 3.31% 3.30% 3.53% 0% 1% 2% 3% 4% 5% 6% Q205 Q305 Q405 Q106 Q206 Q306 Net Income After Tax (1) ($M) Credit Risk Metrics (1) Based on internal allocations of consolidated results Managed 30+ Delinquency Rate Managed Net Charge-off Rate Highlights • Net income down $20M from Q305 • Charge-off rate rose 10 bp from Q206, and remains near historical lows • Loans grew $2.4B from Q206, driven by favorable attrition and new prime strategies • Revenue margin up 37 bp over Q206, Net interest margin up 5 bp • Competition remains intense, with long- dated 0% teasers still dominating revolver segments • Purchase volume up 13% from Q305, reflecting our continued focus on rewards cards and transactors $432.4 $481.8 $237.0 $602.8 $421.8 $461.6 $0 $100 $200 $300 $400 $500 $600 $700 Q205 Q305 Q405 Q106 Q206 Q306 * |
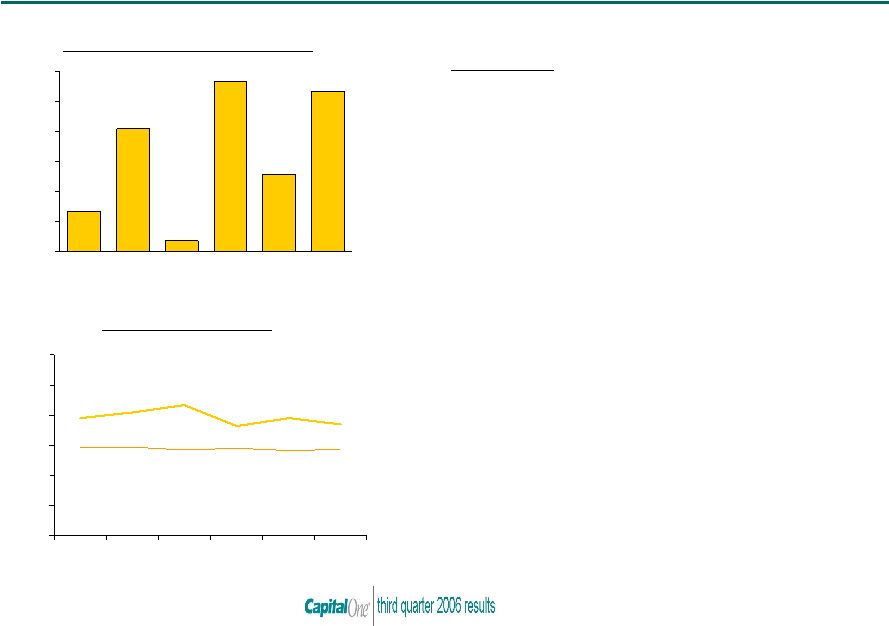 8 3.70% 3.90% 3.63% 4.33% 4.09% 3.89% 2.86% 2.82% 2.90% 2.83% 2.93% 2.93% 0% 1% 2% 3% 4% 5% 6% Q205 Q305 Q405 Q106 Q206 Q306 North American GFS businesses continue to more than offset pressure in the U.K. business Credit Risk Metrics $26.7 $81.9 $7.1 $113.5 $51.2 $107.2 $0 $20 $40 $60 $80 $100 $120 Q205 Q305 Q405 Q106 Q206 Q306 Net Income After Tax (1) ($M) (1) Based on internal allocations of consolidated results Managed Net Charge-off Rate Managed 30+ Delinquency Rate Highlights • Net income up $25M from Q305 • $3.9B loan growth, or 17%, over Q305 • Revenue margin down 20 bp over Q206; Net interest margin down 16 bp • North American GFS businesses continue to deliver strong growth and credit quality • Our U.K. business continues to face a challenging credit environment * |
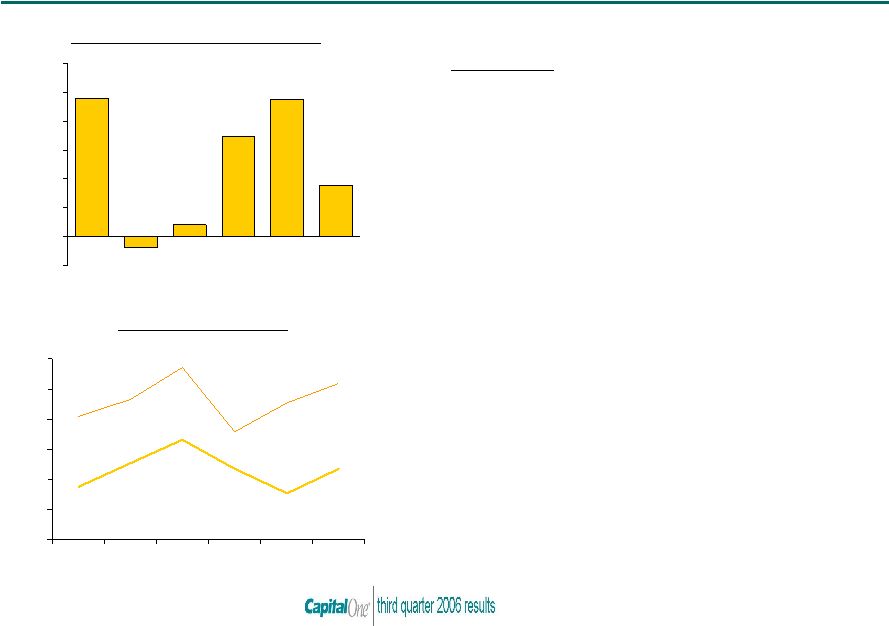 9 2.34% 1.54% 1.74% 2.54% 2.35% 3.32% 5.18% 4.55% 3.57% 5.71% 4.65% 4.09% 0% 1% 2% 3% 4% 5% 6% Q205 Q305 Q405 Q106 Q206 Q306 Auto Finance continues to deliver solid results Credit Risk Metrics $96.1 ($7.7) $8.1 $69.4 $95.1 $35.3 ($20) $0 $20 $40 $60 $80 $100 $120 Q205 Q305 Q405 Q106 Q206 Q306 Net Income After Tax (1) ($M) (1) Based on internal allocations of consolidated results Managed Net Charge-off Rate Managed 30+ Delinquency Rate Highlights • Net income up $43M from Q305 • $3.2B in originations, $21.2B in managed loans • Net interest margin down 5 bp from Q206 • Credit metrics reflect expected seasonal impacts • Continuing to focus on prime segment to fill in credit spectrum * |
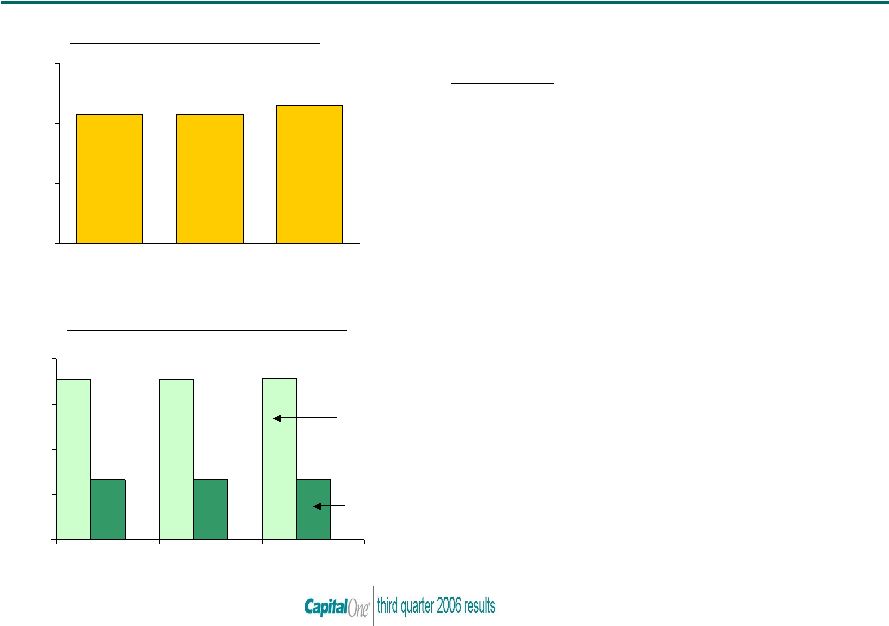 10 $35.4 $35.3 $35.7 $13.3 $13.2 $13.2 $0 $10 $20 $30 $40 Q106 Q206 Q306 Banking continues to deliver stable, predictable performance Deposit and Loan Portfolio ($B) $43.3 $43.3 $46.2 $0 $20 $40 $60 Q106 Q206 Q306 Net Income After Tax (1) ($M) (1) Based on internal allocations of consolidated results Loans Deposits Highlights • $46M NIAT, up 7% from Q206 • Loans and deposits declined in hurricane impacted areas, grew in rest of network • Credit metrics remain modestly elevated in the Gulf Coast hurricane impacted areas • Opened 9 de novo branches in Q3, bringing the total to 19 year-to-date • Hibernia integration costs & synergies continue to track plans • North Fork planning well underway, expecting Q406 close * |