 Investor Conference 2007 Investor Conference 2007 U.S. Card Business Review U.S. Card Business Review Rich Fairbank Rich Fairbank March 1, 2007 * * * Exhibit 99.1 |
 1 Forward-Looking Information Please note that the following materials containing information regarding Capital One’s financial performance speak only as of the particular date or dates indicated in these materials. Capital One does not undertake any obligation to update or revise any of the information contained herein whether as a result of new information, future events or otherwise. Certain statements in this presentation and other oral and written statements made by the Company from time to time, are forward- looking statements, including those that discuss strategies, goals, outlook or other non-historical matters; project revenues, income, returns, earnings per share or other financial measures for Capital One and/or discuss the assumptions that underlie these projects, including future financial and operating results, and the company’s plans, objectives, expectations and intentions. To the extent any such information is forward-looking, it is intended to fit within the safe harbor for forward-looking information provided by the Private Securities Litigation Reform Act of 1995. Numerous factors could cause our actual results to differ materially from those described in forward-looking statements, including, among other things: the risk that Capital One’s acquired businesses will not be integrated successfully; the risk that synergies from such acquisitions may not be fully realized or may take longer to realize than expected; disruption from the acquisitions making it more difficult to maintain relationships with customers, employees or suppliers; changes in the interest rate environment; continued intense competition from numerous providers of products and services which compete with our businesses; an increase or decrease in credit losses; financial, legal, regulatory or accounting changes or actions; general economic conditions affecting consumer income, spending and repayments; changes in our aggregate accounts or consumer loan balances and the growth rate and composition thereof; the amount of deposit growth; changes in the reputation of the credit card industry and/or the company with respect to practices and products; our ability to access the capital markets at attractive rates and terms to fund our operations and future growth; losses associated with new products or services; the company’s ability to execute on its strategic and operational plans; any significant disruption in our operations or technology platform; our ability to effectively control our costs; the success of marketing efforts; our ability to recruit and retain experienced management personnel; and other factors listed from time to time in reports we file with the Securities and Exchange Commission (the “SEC”), including, but not limited to, factors set forth under the caption “Risk Factors” in our Annual Report on Form 10-K for the year ended December 31, 2006. You should carefully consider the factors discussed above in evaluating these forward-looking statements. All information in these slides is based on the consolidated results of Capital One Financial Corporation. A reconciliation of any non-GAAP financial measures included in this presentation can be found in the Company’s most recent Form 10-K concerning annual financial results, available on the Company’s website at www.capitalone.com in Investor Relations under “ About Capital One.” |
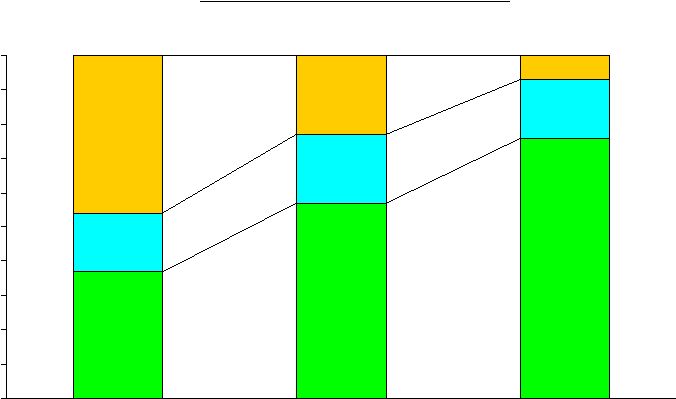 Sources: VISA, MasterCard, American Express, Discover. 2006 estimated based on Q4 2006 reporting companies. The credit card industry is at the forefront of The credit card industry is at the forefront of national scale consolidation national scale consolidation % of Credit Card Outstandings 37% 57% 76% 17% 20% 17% 46% 23% 7% 0% 10% 20% 30% 40% 50% 60% 70% 80% 90% 100% 1994 1999 2006E Top 5 issuers Next 5 issuers All others |
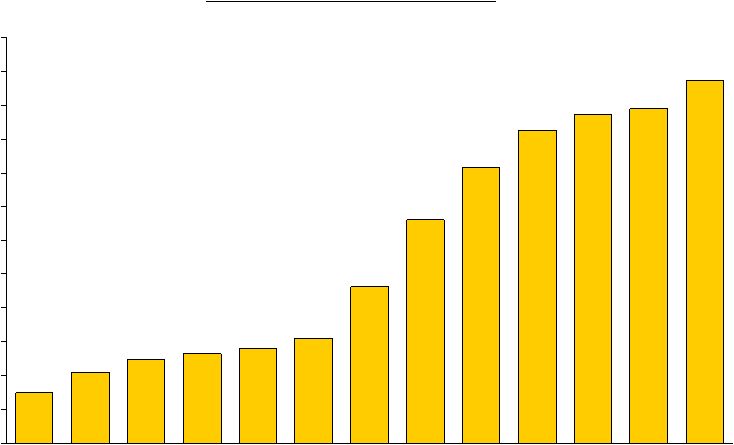 As a consolidator in card we have realized outsized As a consolidator in card we have realized outsized growth growth $53.6 $49.5 $48.6 $46.3 $40.9 $33.0 $23.1 $15.5 $14.1 $13.2 $12.4 $7.4 $10.5 $0 $5 $10 $15 $20 $25 $30 $35 $40 $45 $50 $55 $60 1994 1995 1996 1997 1998 1999 2000 2001 2002 2003 2004 2005 2006 COF U.S. Card Outstandings $B COF Growth 42% 19% 6% 7% 10% 49% 43% 24% 13% 5% 2% 8% Industry Growth 23% 15% 7% 4% 7% 12% 8% 7% 2% 2% 2% 3%* Source: VISA, MasterCard, American Express, Discover. *2006 estimated based on Q4 2006 reporting companies. |
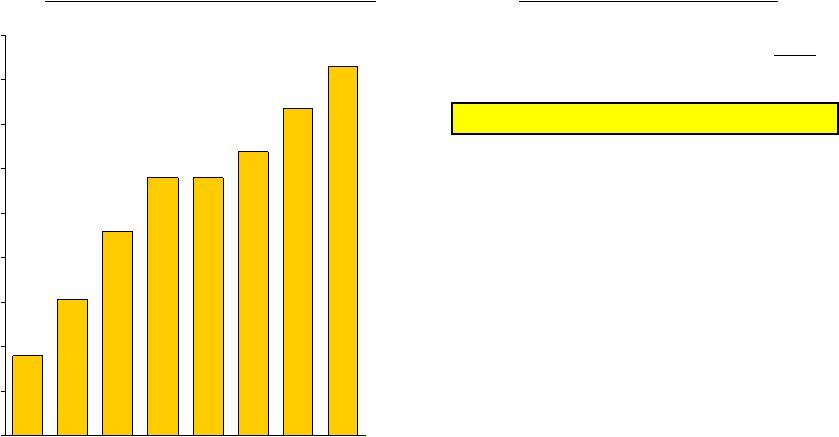
 Our U.S. Card business continues to deliver strong Our U.S. Card business continues to deliver strong profit growth profit growth $1,823 $1,609 $1,387 $1,182 $1,001 $774 $515 $690 $0 $200 $400 $600 $800 $1,000 $1,200 $1,400 $1,600 $1,800 $2,000 1999 2000 2001 2002 2003 2004 2005 2006 COF U.S. Card NIAT $MM Growth 34% 12% 29% 18% 17% 16% 13% |
Over the past several years we have repositioned Over the past several years we have repositioned the card business for long-term success the card business for long-term success • Increased focus on transactors/rewards • Building of a branded franchise • Focus on franchise-enhancing products and practices • Replacement of our operating platform • Emphasis on operating efficiency |
 Our rewards programs are driving strong growth Our rewards programs are driving strong growth Purchase Volume Growth 2006 COF U.S. Card Purchase Volume $B $18.1 $30.8 $45.9 $58.1 $58.1 $64.0 $73.7 $83.1 $0 $10 $20 $30 $40 $50 $60 $70 $80 $90 1999 2000 2001 2002 2003 2004 2005 2006 Source: Company Reports; *Data comes from Nilson Growth 70% 49% 15% 27% 0% 10% 13% American Express (U.S. Card) 13.8% Capital One (U.S. Card) 12.8% JPM Chase (Card Services) 12.5% Washington Mutual (U.S. Card)* 12.0% Discover 10.1% Citigroup (U.S. Card) 9.4% Bank of America* 7.0% |
 Building a branded franchise begins with awareness Building a branded franchise begins with awareness Total Credit Card Brand Awareness (%) 99 98 62 95 94 78 98 95 Source: Millward Brown Financial Services Brand Health Wave 37. (January 2007) 1 - Question: “I’d like you to think of any credit card issuers. Which ones come to mind? Have you seen or heard of {company}? 1 |
• Provides a Good Value #2 • Makes My Life Easier #1 • Looks Out for My Best Interests #2 • Is Straightforward #3 • Is a Cool Company #1 • Is Innovative #1 We are building important brand equities We are building important brand equities Source: Millward Brown Online ATP 1-Respondants ranked the following companies Capital One, American Express, Citibank, Bank of America/MBNA, Discover, MBNA, JPM Chase Brand Equities Capital One Rank 1 |
 We are enhancing our customer franchise by We are enhancing our customer franchise by investing in differentiated credit card practices investing in differentiated credit card practices Repricing Example Capital One’s Repricing Policy • We maintain our long-standing policy of not engaging in “universal default” repricing • Customers are only eligible to be repriced if they pay 3 or more days late twice in one year (going over limit or bouncing a check will not trigger repricing) • Customers receive a written reminder after the 1 st late payment • Customers who are repriced automatically earn back their prior rates if they pay on time for one year • As a matter of fiduciary responsibility, we reserve the right to reprice (e.g., if the economy or interest rates change significantly) with advance written notice and the option for customers to pay off balances at existing rates • The ability to reprice is integral to a safe and sound credit card business because: – loans can last indefinitely and balances can fluctuate – creditworthiness can change significantly over time (e.g. economy, customer behavior) • Historically, credit cards were repriced only with advance written notice and the option to pay off balances at existing rates • More recently, contractual “default repricing” terms have been introduced in the industry that can cause rates to increase (without additional notice) based on customer behavior (e.g., paying late a single time, going over limit, bouncing a check, and changes to credit bureau or “universal default”) • Competitors’ products with 0% teaser rates and long teaser periods appear to rely heavily on aggressive default repricing to achieve profitability • We believe that aggressive default repricing practices compromise long-term profitability and customer loyalty • We voluntarily introduced a simple and clear repricing policy across our entire portfolio |
 We have been less aggressive with teaser products We have been less aggressive with teaser products Source: Compremedia 0% 10% 20% 30% 40% 50% 60% 70% 80% 90% 100% Q1 03 Q2 03 Q3 03 Q4 03 Q1 04 Q2 04 Q3 04 Q4 04 Q1 05 Q2 05 Q3 05 Q4 05 Q1 06 Q2 06 Q3 06 Q4 06 % of Mail Volume with 0% Balance Transfer Teasers1 COF AXP HSBC WaMu BofA JPM Chase Citi Discover 1. Defined as “% of Estimated Mail Volume with 0% Teasers (BT Only & Combo Teasers)” |
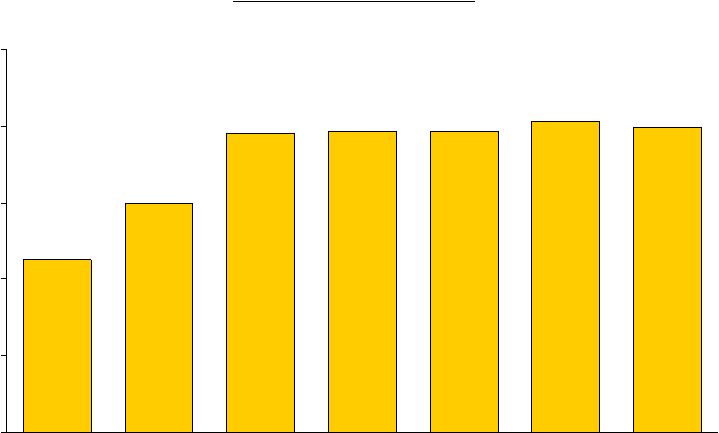
 Our investment in building a franchise is paying off Our investment in building a franchise is paying off 0.0 0.2 0.4 0.6 0.8 1.0 1.2 2002 2003 2004 2005 2006 COF U.S. Card Indexed Attrition Rate • Increased focus on transactors/rewards • Building of a branded franchise • Focus on franchise enhancing products and practices |
 Repositioning our card business has resulted in flat revenue growth COF U.S. Card Revenue $4.5 $6.0 $7.8 $7.9 $7.9 $8.1 $8.0 $0 $2 $4 $6 $8 $10 2000 2001 2002 2003 2004 2005 2006 $B |
 Operating efficiency has become a key driver of Operating efficiency has become a key driver of profit growth profit growth COF U.S. Card Expense Ratio* *Noninterest expense as a % of managed $OS; includes marketing 7.12% 0% 2% 4% 6% 8% 10% 12% 14% 2000 2001 2002 2003 2004 2005 2006 |
 We have invested over the last several years to We have invested over the last several years to replace our card operating platform replace our card operating platform Billing System Customer Service Platforms Portfolio Management Systems Rewards Platform Data Warehouse • Enhanced innovation: new functionality and faster time to market • Operational efficiency: lower operations and IT costs |
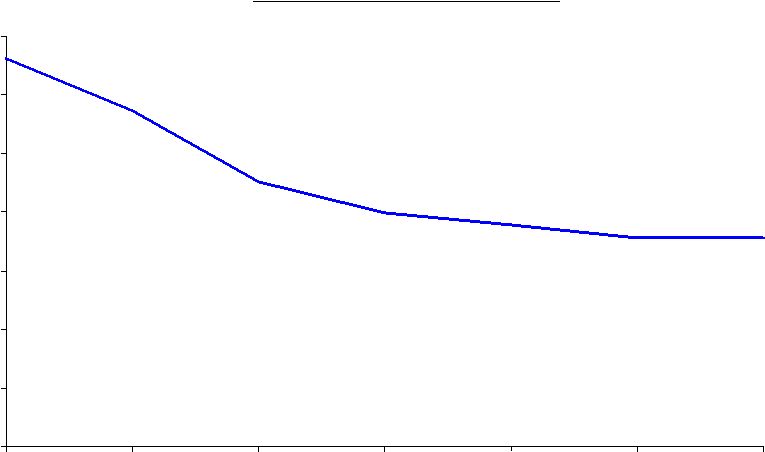
 0% 2% 4% 6% 8% 10% 12% Our repositioning has driven dramatically lower Our repositioning has driven dramatically lower credit losses, aided also by the external credit losses, aided also by the external environment environment COF U.S. Card Managed Charge-Off Rate 2003 2004 2006 2005 2007 |
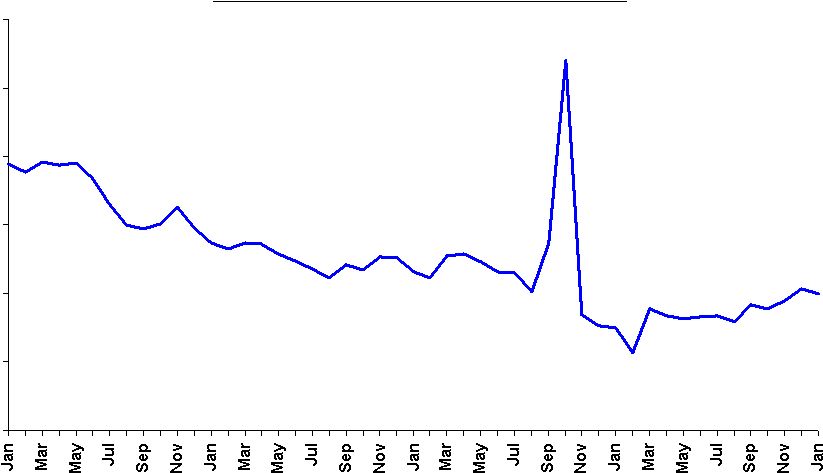
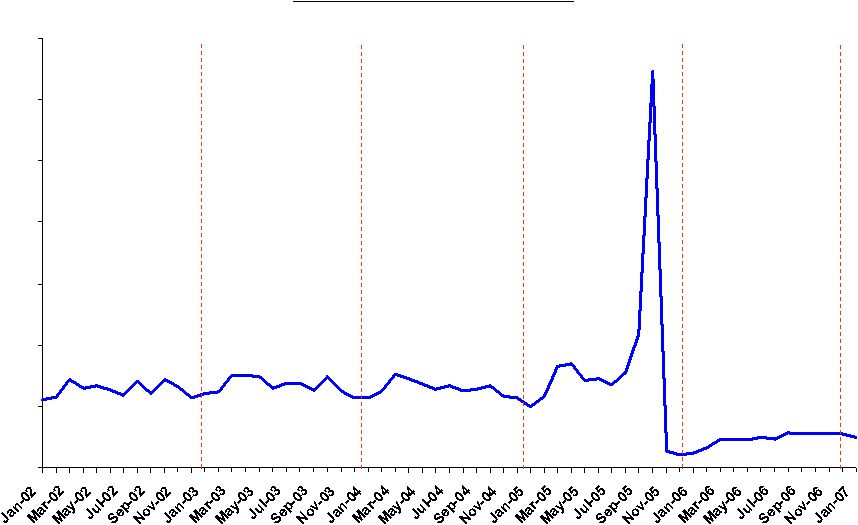 Bankruptcies have been artificially low Bankruptcies have been artificially low 0 100,000 200,000 300,000 400,000 500,000 600,000 700,000 National Bankruptcy Filings Filings Source: Visa |
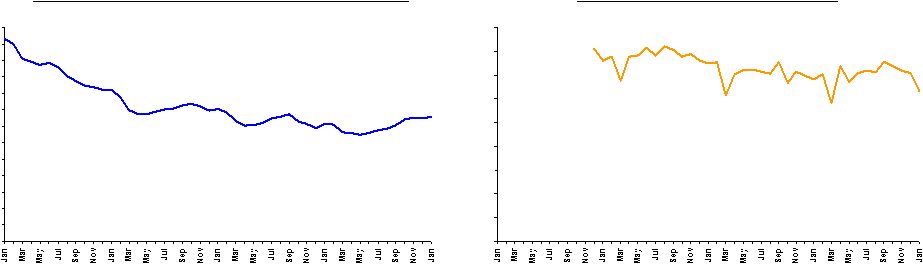 Our U.S. Card business continues to indicate a Our U.S. Card business continues to indicate a strong U.S. consumer strong U.S. consumer 0% 1% 1% 2% 2% 3% 3% 4% 4% 5% 5% 6% 6% 7% COF U.S. Card Managed Delinquency Rate 2003 2004 2006 2005 0% 5% 10% 15% 20% 25% 30% 35% 40% 45% COF U.S. Card 1-2 Flow Rate* 2003 2004 2006 2005 *1-2 Flow Rate defined as (% of Delinquent $ moving from 0-29 Days delinquent to 30-59 Days delinquent)/(Total $ 0-29 Days delinquent); Flow rate data not available for U.S. Card segment prior to December 2003 2007 2007 |
Over the past several years we have repositioned Over the past several years we have repositioned the card business for long-term success the card business for long-term success • Increased focus on transactors/rewards • Building of a branded franchise • Focus on franchise-enhancing products and practices • Replacement of our operating platform • Emphasis on operating efficiency |
 Managed Charge-Off Rate 2004 2005 5.92% 5.63% 5.29% 6.00% Citigroup Bankcard 5.78% Bank of America Card 6.85% JPM Chase Card 5.21% Discover 5.23% 5.05% Capital One (U.S. Card) 5.01% Source: Company Reports 2006 3.84% 3.78% 3.33% 4.74% 3.37% Our charge-off rate is among the best Our charge-off rate is among the best |
 Our U.S. Card business continues to deliver industry Our U.S. Card business continues to deliver industry leading returns leading returns After-Tax Return on Managed Loans 2004 2005 2.6% 3.1% 1.4% 1.7% Citigroup Card 2.0% Bank of America Card 2.2% JPM Chase Card 1.4% Discover 1.2% 3.0% Capital One (U.S. Card) 3.4% Source: Company Reports 2006 2.8% 3.0% 2.3% 2.2% 3.7% |