 October 18, 2007 Exhibit 99.2 |
 2 Forward-Looking Information Please note that the following materials containing information regarding Capital One’s financial performance speak only as of the particular date or dates indicated in these materials. Capital One does not undertake any obligation to update or revise any of the information contained herein whether as a result of new information, future events or otherwise. Certain statements in this presentation and other oral and written statements made by the Company from time to time, are forward-looking statements, including those that discuss strategies, goals, outlook or other non-historical matters; projections, revenues, income, returns, earnings per share or other financial measures for Capital One and/or discuss the assumptions that underlie these projects, including future financial and operating results, and the company’s plans, objectives, expectations and intentions. To the extent any such information is forward-looking, it is intended to fit within the safe harbor for forward-looking information provided by the Private Securities Litigation Reform Act of 1995. Numerous factors could cause our actual results to differ materially from those described in forward-looking statements, including, among other things: the risk that Capital One’s acquired businesses will not be integrated successfully; the risk that synergies from such acquisitions may not be fully realized or may take longer to realize than expected; disruption from the acquisitions making it more difficult to maintain relationships with customers, employees or suppliers; the risk that the benefits of the Company’s restructuring initiative, including cost savings, may not be fully realized; changes in the interest rate environment; continued intense competition from numerous providers of products and services which compete with our businesses; an increase or decrease in credit losses; general economic conditions in the mortgage industry; financial, legal, regulatory or accounting changes or actions; general economic conditions affecting consumer income, spending and repayments; changes in our aggregate accounts or consumer loan balances and the growth rate and composition thereof; the amount of deposit growth; changes in the reputation of the credit card industry and/or the company with respect to practices and products; our ability to access the capital markets at attractive rates and terms to fund our operations and future growth; losses associated with new products or services; the company’s ability to execute on its strategic and operational plans; any significant disruption in our operations or technology platform; our ability to effectively control our costs; the success of marketing efforts; our ability to recruit and retain experienced management personnel; changes in the labor market; and other factors listed from time to time in reports we file with the Securities and Exchange Commission (the “SEC”), including, but not limited to, factors set forth under the caption “Risk Factors” in our Annual Report on Form 10-K for the year ended December 31, 2006, and our Quarterly Report on Form 10-Q for the quarter ended March 31, 2007. You should carefully consider the factors discussed above in evaluating these forward-looking statements. All information in these slides is based on the consolidated results of Capital One Financial Corporation. A reconciliation of any non-GAAP financial measures included in this presentation can be found in the Company’s most recent Form 10-K concerning annual financial results, available on the Company’s website at www.capitalone.com in Investor Relations under “About Capital One.” Forward looking statements |
 3 Third quarter 2007 financial highlights • Diluted earnings per share of ($0.21), or $2.09 excluding loss from discontinued operations of $898M related to the shutdown of GreenPoint Mortgage – EPS from continuing operations up 8% linked quarter and 11% from Q306 – Significant revenue growth partially offset by higher provision expense • Executed $480M in open market share repurchases in the quarter – Completed $2.23B through Q307, including $1.5B Accelerated Share Repurchase plan – $770M to be executed in Q407 • Achieving operating leverage; cost restructuring initiative remains on track • Executed $3.8B in funding transactions despite difficult capital markets conditions – $2.3B in secured ABS funding – $1.5B in unsecured parent-level funding Continue to expect 2007 earnings of approximately $5.00 per share |
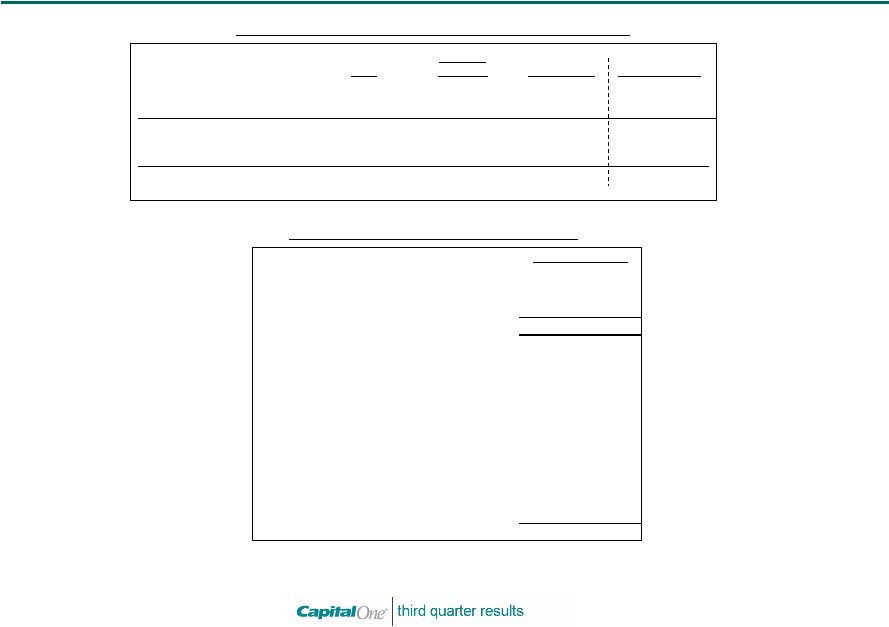 4 Shutdown of GreenPoint Mortgage largely complete ($ millions, after tax) Valuation Adjustments¹ Restructuring Charges Goodwill Total Charges Loss from Operations Total Discontinued Operations ($898) ($53) ($951) Q307 Remaining Total Estimate Original Estimate ($178) ($178) ($646) ($646) ($100) ($15) ($30) ($45) Estimated ($650) ($883) ($23) ($906) ($860) ($110) ($59) ($23) ($82) Financial Impact from GreenPoint Shutdown GreenPoint Portfolio Disposition 1 Includes LOCOM adjustments on HFS loans, loans moved to HFI, and additional allowance build on loans moved to HFI in Q207 2 Includes $2.66B of GreenPoint HFS loans at 7/31/07 plus net funded loans between 8/1/07 and 8/20/07 3 $691M of the $1171M sold since end of Q307 4 Includes repurchased and other loans marked as of 9/30/07 to an average 55% of par 3 GPM Loans Held for Sale UPB ($Millions) 8/20 Balance² 3,060 Funded Loans 8/21/07 - 9/30/07 578 Repurchased Loans 8/21/07 - 9/30/07 31 Total 3,670 Disposition as of 9/30/07 Loans Sold 1,320 Committed not yet Sold 1,171 Loans Marked and Moved to HFI: Small Ticket Commercial (LTV 66%) 650 Heloc (Avg FICO 712; CLTV 86%) 202 Jumbo (Avg FICO 748; LTV 70%) 153 Other Removals (PIF, REO, Chg off, etc.) 23 Remaining Uncommitted Loans 4 151 Total 3,670 |
 5 On track to deliver cost reductions • Remain on track for gross cost savings of $700M by 2009 – Continue to expect the reported level of operating expense to fall in 2008 by $100-200M • Now expect to recognize around $150M of charges in 2007 – Recognized $19M of charges in Q307; $91M in Q207 – Overall program charges expected to remain around $300M or less • Savings and charges related to the mortgage business have been moved to discontinued operations |
 6 Managed Balance Sheet Highlights ($Millions) Third quarter 2007 balance sheet and return metrics from Continuing Operations Q307/Q207 Change Q307 Q207 Q306 $ %/bps Total Deposits $ 83,343 $ 85,680 $ 47,613 $ (2,337) (2.7) % Total Managed Loans Held for Investment 144,769 143,498 112,239 1,271 0.9 Tangible Assets 180,363 179,888 138,817 475 0.3 Tangible Common Equity 11,131 11,393 12,517 (262) (2.3) Tangible Common Equity to Tangible Assets Ratio 6.17 % 6.33 % 9.02 % n/a (16) bps Net Interest Margin 6.69 % 6.19 % 6.94 % n/a 50 bps Revenue Margin 10.31 9.48 10.94 n/a 83 Return on Managed Assets 1.68 1.59 1.68 n/a 9 Return on Equity 12.89 12.22 14.42 n/a 67 Return on Tangible Equity 29.34 26.94 18.78 n/a 240 |
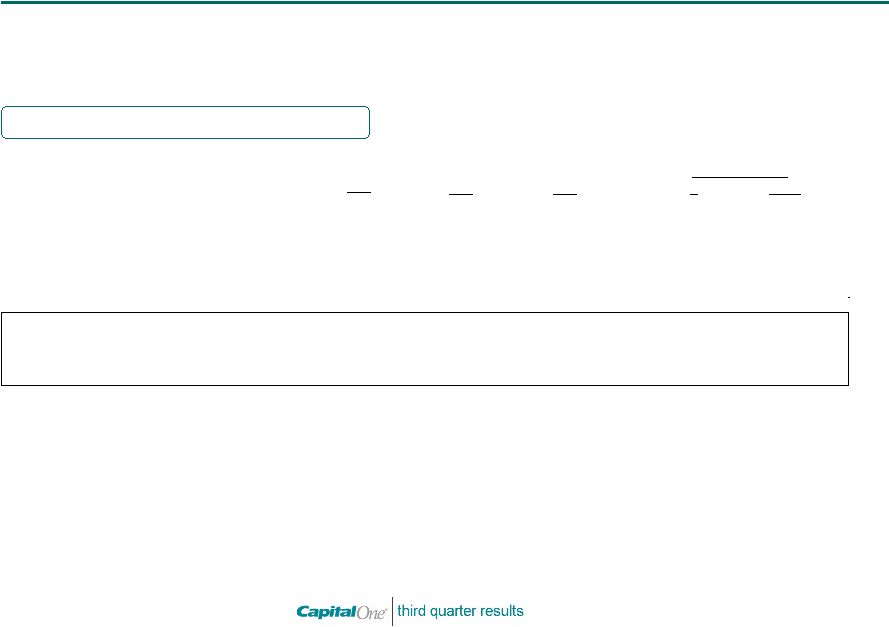
 7 Q307/Q207 Change Q307 Q207 Q306 $ %/bps Net Interest Income $ 2,803.4 $ 2,613.3 $ 2,217.8 $ 190.1 7 % Non-Interest Income 1,518.0 1,387.5 1,275.4 130.5 9 Total Revenue 4,321.4 4,000.8 3,493.2 320.6 8 % Net Charge-offs $ 1,027.4 $ 891.2 $ 806.0 $ 136.2 15 % Allowance Build 124.2 7.1 75.5 117.1 1649 Other (8.9) (11.2) (13.6) 2.3 (21) Provision for Loan Losses 1,142.7 887.1 867.9 255.6 29 % Marketing Expenses $ 332.7 $ 326.1 $ 368.5 6.6 2 % Restructuring Expenses 19.4 91.1 n/a (71.7) n/a Operating Expenses 1,582.2 1,617.4 1,358.1 (35.2) (2) % Tax Rate 34.4 % 28.9 % 34.6 % n/a 550 bps Income from Continuing Operations, Net of Tax $ 816.4 $ 767.6 $ 587.8 $ 48.8 6 % Loss from Discontinued Operations, Net of Tax (898.0) (17.2) n/a (880.8) n/a Net (Loss) Income (81.6) 750.4 587.8 (832.0) (111) Shares Used to Compute Diluted EPS (MM) 390.8 397.5 310.4 n/a (2) % Diluted EPS from Continuing Operations $ 2.09 $ 1.93 $ 1.89 $ 0.16 8 % Diluted EPS from Discontinued Operations (2.30) (0.04) n/a (2.26) n/a Managed Income Statement Highlights ($Millions except per share data) Third quarter 2007 managed income statement |
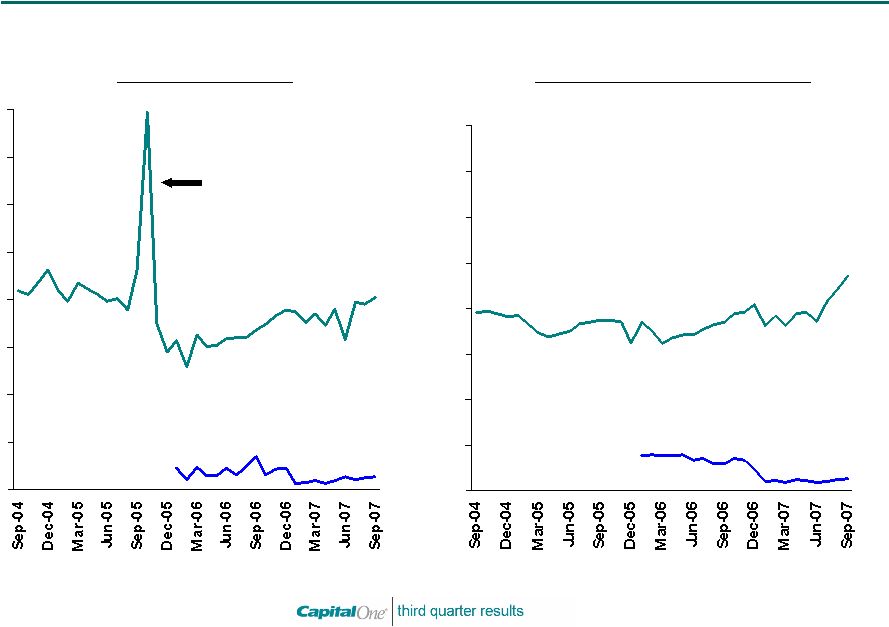 8 0% 1% 2% 3% 4% 5% 6% 7% 8% Credit trends 0% 1% 2% 3% 4% 5% 6% 7% 8% Monthly Managed Net Charge-off Rate Monthly Managed Delinquency and Non-Performing Loan Rate Bankruptcy Filing Spike National Lending Local Banking Local Banking: Non performing loans as % of loans HFI National Lending 30+ Delinquency Rate Q307: 3.96% (1) Q307: 0.19% 4.70% (1) Net losses reflect 16bp one-time positive impact from the change to a 25-day grace period 0.27% |
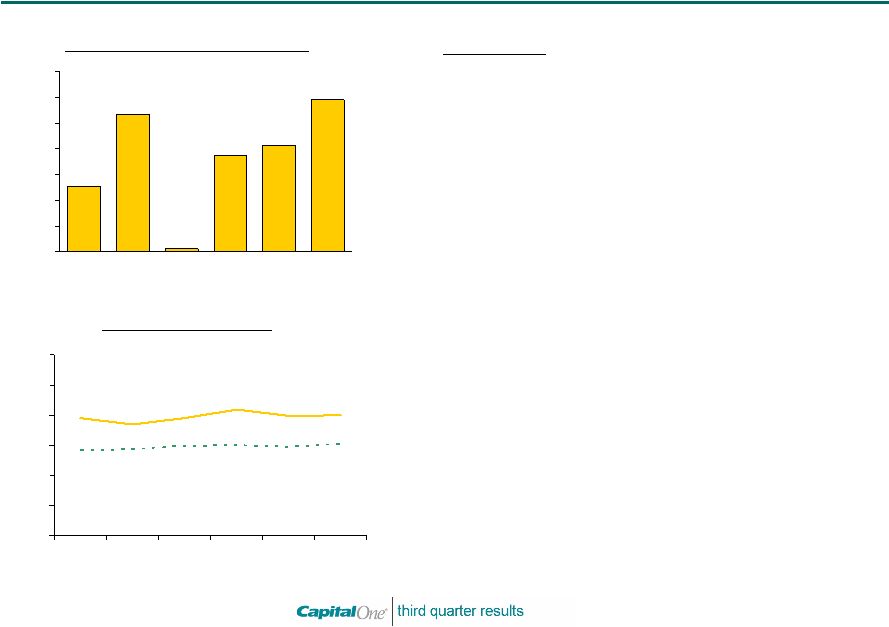
 9 Profit growth in US Card, Global Financial Services and Local Banking more than offset declines in Auto Finance Net Income After Tax ($Millions) 1. Based on Pro-Forma disclosures for combined NFB and COF for 2006. 2. Includes results of GPM’s mortgage servicing business in 2007. Q307 Q207 Q306 $ % National Lending US Card $ 560.8 $ 538.3 $ 461.6 $ 99.2 21.5 % Auto Finance (3.8) 38.0 35.3 (39.1) (110.8) Global Financial Services 118.4 82.8 107.2 11.2 10.4 SUBTOTAL 675.4 659.1 604.1 71.3 11.8 % Local Banking 2 $ 192.3 $ 144.8 $ 165.3 $ 27.0 16.3 % Q307/Q306 Change PRO-FORMA 1 |
 10 US Card revenue margin expansion and expense management more than offset higher credit costs 3.39% 3.82% 3.99% 3.29% 3.73% 4.13% 3.53% 3.30% 3.74% 3.48% 3.41% 4.46% 0% 1% 2% 3% 4% 5% 6% Q206 Q306 Q406 Q107 Q207 Q307 Credit Risk Metrics (1) Based on internal allocations of consolidated results Managed 30+ Delinquency Rate Managed Net Charge-off Rate Highlights Q307 NIAT of $561 million, up 22% from Q306 - Revenues up 13% - Expenses down 9% - Provision up 47% • $50 billion in managed loans, down 3% from Q306 - Reduced teaser rate marketing to prime revolvers - Exited 2 retail partnerships earlier in 2007 • Revenue margin up 233bps from Q306 • Post TSYS conversion “backlog” actions • Fee policies closer to, or in-line with, industry standards • Reduced teaser rate marketing to prime revolvers • Purchase volume flat with Q306 - Modest US retail sales growth - Exited two retail partnerships earlier in 2007 - Reduced teaser rate marketing to prime revolvers • Charge-off and delinquency rates up from Q306 and Q207 - Chargeoff normalization and product strategies - Seasonality - Move to 25-day grace period - Lower receivables “denominator effect” Net Income After Tax (1) ($M) $421.8 $461.6 $337.2 $495.3 $538.3 $560.8 $0 $200 $400 $600 Q206 Q306 Q406 Q107 Q207 Q307 |
 11 4.00% 3.98% 4.18% 3.89% 3.70% 3.90% 3.02% 2.93% 2.99% 2.97% 2.86% 2.82% 0% 1% 2% 3% 4% 5% 6% Q206 Q306 Q406 Q107 Q207 Q307 Global Financial Services continues to grow profits and loans while delivering stable credit performance Credit Risk Metrics (1) Based on internal allocations of consolidated results Managed Net Charge-off Rate Managed 30+ Delinquency Rate Highlights • Net income of $118.4 million, up 11% from Q306 - Revenue up 12% - Expenses up 11% - Provision up 16% • Risk metrics up modestly from Q306 – Normalization – Credit normalization continues in US – UK credit outlook stable • $29 billion in managed loans, up 8% from Q306 - Small business loans up 12% - Installment Loans up 14% - Canadian Credit Card loans up 24% - Point-of-Sale originations up 23% - Capital One Home Loans originations up 26% - UK Card loans down 5% $107.2 $2.1 $74.8 $82.8 $118.4 $51.2 $0 $20 $40 $60 $80 $100 $120 $140 Q206 Q306 Q406 Q107 Q207 Q307 Net Income After Tax (1) ($M) |
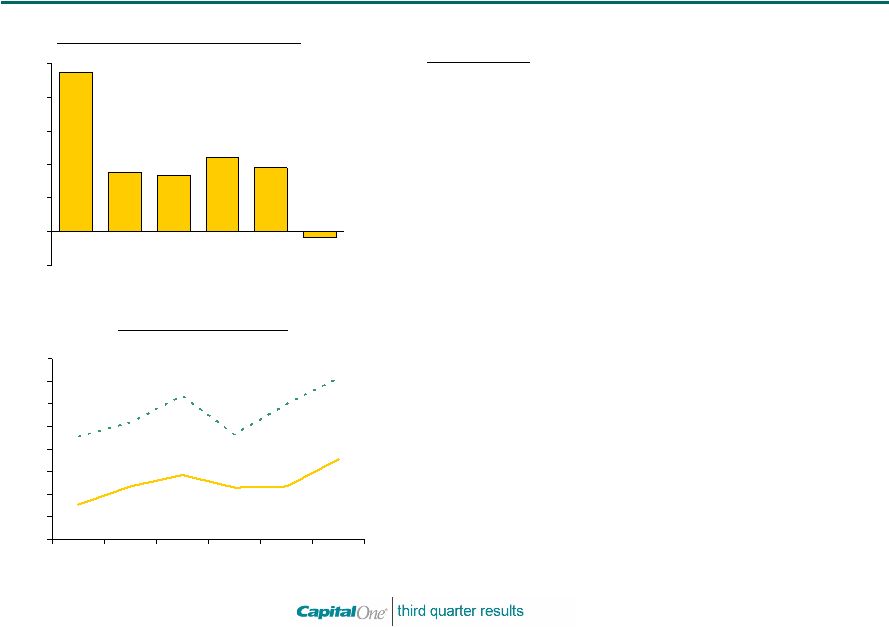 12 3.56% 2.35% 1.54% 2.34% 2.29% 2.85% 7.15% 6.00% 4.64% 6.35% 5.18% 4.55% 0% 1% 2% 3% 4% 5% 6% 7% 8% Q206 Q306 Q406 Q107 Q207 Q307 Credit Risk Metrics (1) Based on internal allocations of consolidated results Managed Net Charge-off Rate Managed 30+ Delinquency Rate Highlights • Net loss of $(3.8) million, compared to $35.3M of net income in Q306 – Revenues up 6% – Expenses down 1% – Provision up 52% • Charge offs & delinquencies up from Q306 – Normalization – Dealer Prime ’05 and ’06 tranches continue to season – Industry-wide risk expansion (e.g. LTV, term) in subprime • Managed loans of $24 billion, up 15% since Q306 – $3.2B in Q307 originations, up 3% over Q306 $95.1 $35.3 $33.7 $44.4 $38.0 ($3.8) ($20) $0 $20 $40 $60 $80 $100 Q206 Q306 Q406 Q107 Q207 Q307 Net Income After Tax (1) ($M) Auto Finance is working its way through tough industry conditions |
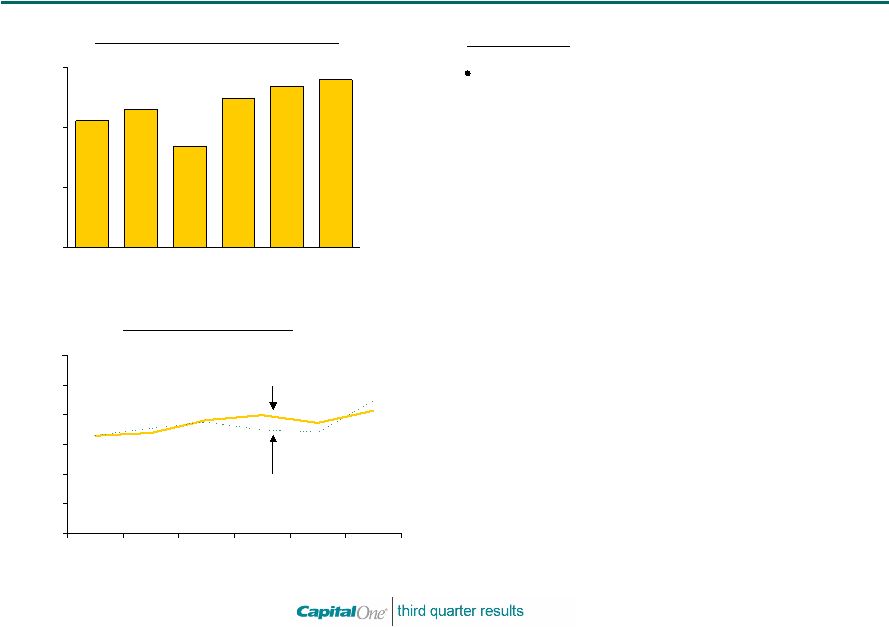
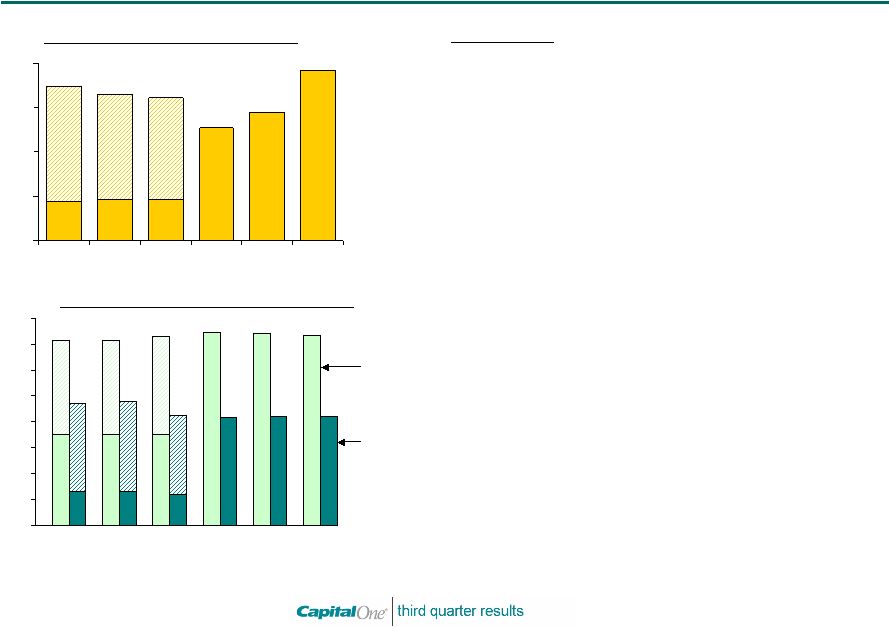 13 $0 $10 $20 $30 $40 $50 $60 $70 $80 $41.6 Local banking delivered solid results and further progress on integration Deposit and Loan Portfolio (2) ($B) $192.3 $144.8 $127.0 $160.9 $165.4 $174.0 $0 $50 $100 $150 $200 Q206 Q306 Q406 Q107 Q207 Q307 Net Income After Tax (1,2) ($M) (1) Based on internal allocations of consolidated results (2) 2006 Numbers based on pro-forma disclosures for combined NFB and COF; net of purchase accounting and integration expenses. (3) Includes adjustment reflecting incorporation of float deposits. Loans Held for Investment Deposits³ Highlights • NIAT of $192 million in Q307, up $48 from Q207 - Revenues down 2% - Expenses down 1% - Allowance release from methodology change • Credit performance strong and stable - Charge-off rate of 19 basis points - Non-performing loans as a % of managed loans at 27 basis points • Deposits of $73 billion, down slightly from Q207 - Expected re-investment by several large customers - Continued tough deposit competition • Loans up modestly from Q107 - Commercial and small business loans grew - Expected paydowns in mortgage portfolio • Integration and synergies on track; New bank leadership team in place $71.6 $71.5 $73.2 $74.5 $47.2 $47.9 $42.3 Q306 Q406 Q107 Q207 $74.5 $41.9 Q307 Q206 $73.4 $42.2 |
 14 Summary of 2008 expectations • Low- to-mid single digit loan and deposit growth • Revenue growth in-line with or slightly higher than loan growth • Operating efficiency ratio (including marketing but excluding restructuring charges) improving to the mid-40%s • Operating expenses to decline by $100-200M from 2007 to 2008 • Charge-offs of approximately $4.9 billion – Includes “extra” $175M US Card charge-offs in Q108 • Tangible common equity ratio target of 5.5% - 6.0% • Dividends, beginning in Q108, at a fixed dollar amount of approximately 25% of expected 2008 NIAT • Expect to return the balance of excess capital in 2008 through continuing share repurchases |