 First quarter 2008 results April 17, 2008 Exhibit 99.2 * * * * * * * |
 2 Forward-Looking Information Please note that the following materials containing information regarding Capital One’s financial performance speak only as of the particular date or dates indicated in these materials. Capital One does not undertake any obligation to update or revise any of the information contained herein whether as a result of new information, future events or otherwise. Certain statements in this presentation and other oral and written statements made by the Company from time to time, are forward-looking statements, including those that discuss strategies, goals, outlook or other non-historical matters; projections, revenues, income, returns, earnings per share or other financial measures for Capital One and/or discuss the assumptions that underlie these projections, including future financial and operating results, and the company’s plans, objectives, expectations and intentions. To the extent that any such information is forward-looking, it is intended to fit within the safe harbor for forward-looking information provided by the Private Securities Litigation Reform Act of 1995. Numerous factors could cause our actual results to differ materially from those described in forward-looking statements, including, among other things: general economic and business conditions in the U.S. and or the UK, including conditions affecting consumer income, spending and repayments, changes in the credit environment in the U.S. and or the UK, including an increase or decrease in credit losses, changes in the interest rate environment; continued intense competition from numerous providers of products and services that compete with our businesses; financial, legal, regulatory or accounting changes or actions; changes in our aggregate accounts or consumer loan balances and the growth rate and composition thereof; the amount of deposit growth; changes in the reputation of the credit card industry and/or the company with respect to practices and products; the risk that Capital One’s acquired businesses will not be integrated successfully; the risk that synergies from such acquisitions may not be fully realized or may take longer to realize than expected; disruption from the acquisitions making it more difficult to maintain relationships with customers, employees or suppliers; the risk that the benefits of the Company’s restructuring initiative, including cost savings, may not be fully realized; our ability to access the capital markets at attractive rates and terms to fund our operations and future growth; losses associated with new products or services; the company’s ability to execute on its strategic and operational plans; any significant disruption in our operations or technology platform; our ability to effectively control our costs; the success of marketing efforts; our ability to recruit and retain experienced management personnel; changes in the labor and employment market; general economic conditions in the mortgage industry; and other factors listed from time to time in reports we file with the Securities and Exchange Commission (the “SEC”), including, but not limited to, factors set forth under the caption “Risk Factors” in our Annual Report on Form 10-K for the year ended December 31, 2007. You should carefully consider the factors discussed above in evaluating these forward-looking statements. All information in these slides is based on the consolidated results of Capital One Financial Corporation. A reconciliation of any non-GAAP financial measures included in this presentation can be found in the Company’s most recent Form 10-K concerning annual financial results, available on the Company’s website at www.capitalone.com in Investor Relations under “About Capital One.” Forward looking statements |
3 • Diluted EPS of $1.47; EPS from Continuing Operations of $1.70, up 3% over Q107 – Allowance build of $310M – $104M increase to GreenPoint Rep and Warranty reserve – $200M benefit from Visa IPO • Substantial increase in revenue margin year-over-year, coupled with expense reductions, largely offset the adverse impact of higher credit costs • Credit performance largely in line with expectations, but credit outlook worsening due to weakening US economy • Remain cautious on loan growth; bullish on deposit growth – Managed loans declined $3.3B from Q407; deposits grew $4.9B • Balance sheet remains a source of strength – TCE ratio increased from 5.83% in Q407 to 6.03% – Maintained strong liquidity and diverse funding sources – Increased quarterly dividend to $0.375 • Completed integration of multiple systems, including deposit platform, and New York metro bank brand conversion First quarter 2008 highlights |
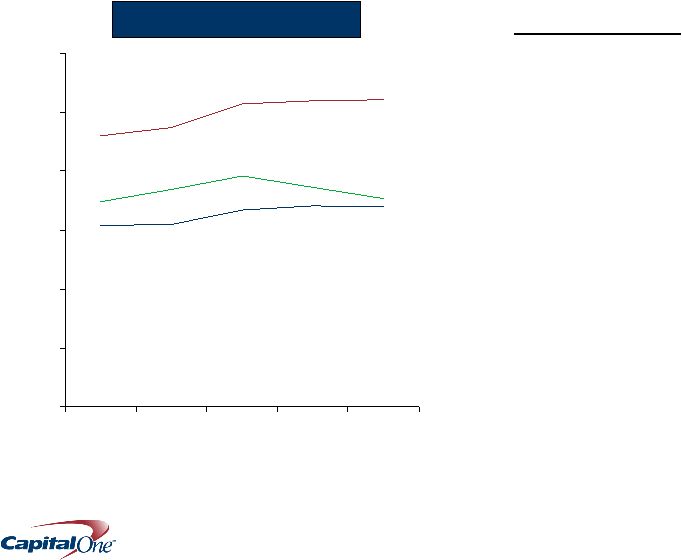 4 Substantial increase in revenue margin year-over-year largely offset the adverse impact of higher credit costs 10.43% 10.40% 9.20% 6.78% 6.83% 6.15% 7.06% 7.45% 6.97% 0% 2% 4% 6% 8% 10% 12% Q107 Q207 Q307 Q407 Q108 Margins Revenue Margin Net Interest Margin Margin Drivers • Year-over-year: US Card pricing and fee changes drove substantial increase in revenue margin • Quarter-over-quarter: Reduced US Card fees offset by more active balance sheet management Risk-Adjusted Margin |
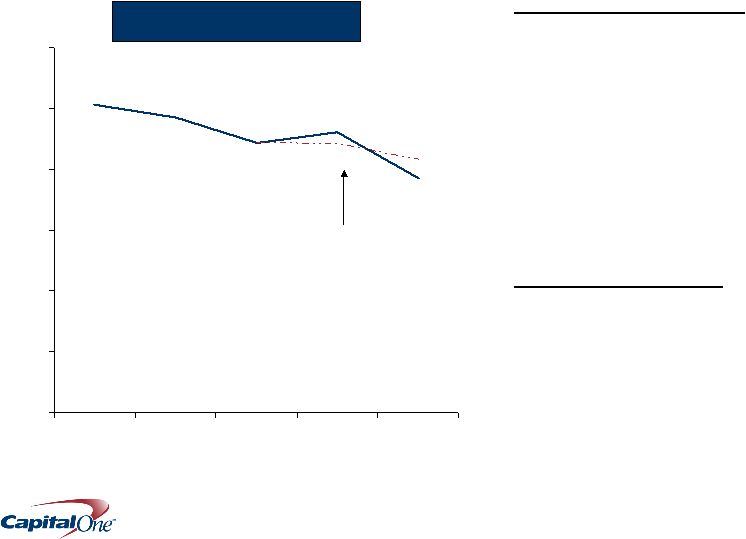 5 We continue to drive efficiency gains 38.6% 41.6% 46.2% 50.7% 44.2% 0% 10% 20% 30% 40% 50% 60% Q107 Q207 Q307 Q407 Q108 Efficiency Ratio Excluding Visa one-time impacts Quarterly Highlights • Reduced headcount by 1,600 in Q108; 5,400 since Q107 • Announced UK and Auto Finance restructurings – Approximately 1000 positions to be eliminated 2008 Expectations • Mid-40%’s or lower efficiency ratio • 2008 operating expenses at least $200M below 2007 |
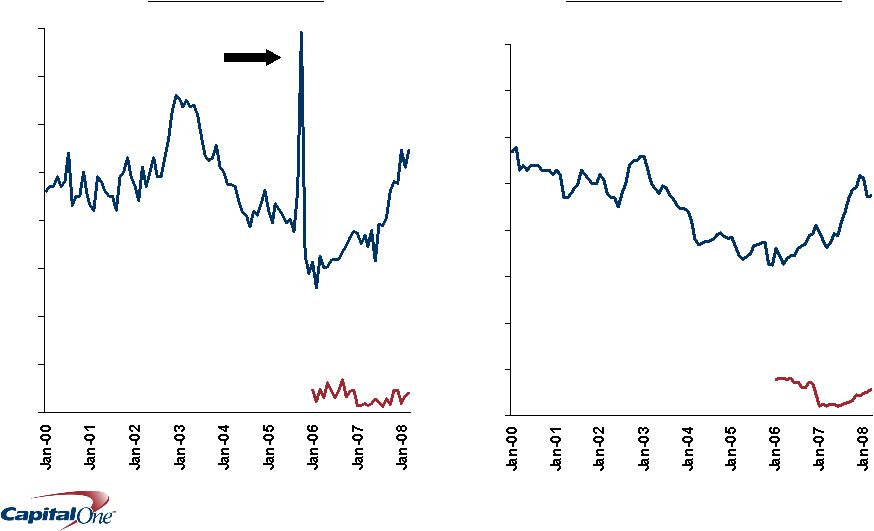 6 0% 1% 2% 3% 4% 5% 6% 7% 8% Credit metrics reflect weakening in the U.S. economy 0% 1% 2% 3% 4% 5% 6% 7% 8% Monthly Managed Net Charge-off Rate Monthly Managed Delinquency and Non-Performing Loan Rate Bankruptcy Filing Spike National Lending Local Banking Local Banking: Non-performing loans as % of loans National Lending 30+ Delinquency Rate Q108: 5.34% Q108: 0.31% Q108 4.73% Q108 0.56% |
 7 Given the deteriorating outlook for the US economy, we have increased our loan loss allowance 165% 64% 129% 134% 44% 153% 0% 50% 100% 150% 200% Q107 Q207 Q307 Q407 Q108 Quarterly Highlights • Increased loan loss allowance by $310M to $3.3B • Allowance consistent with managed charge-offs of approximately $6.7B over the next 12 months Allowance as % of Reported 30+ Delinquencies US Card Auto International Allowance as % of Reported Loans 2.3% 2.3% 2.4% 2.9% 3.3% |
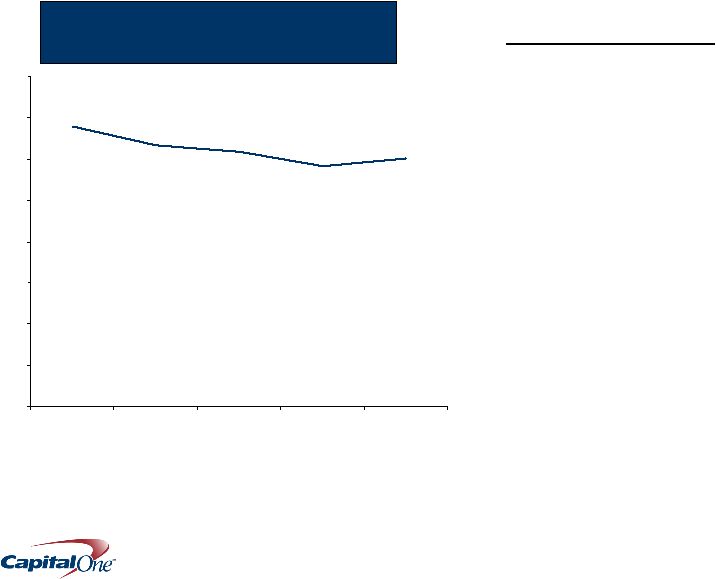 8 Despite credit headwinds, we remain capital generative 2008 Expectations • TCE ratio at or above high-end of 5.5%-6% target range • Expect to continue $0.375 quarterly dividend • Share buybacks dependent on economic outlook – 2H08 at the earliest 6.03% 5.83% 0% 1% 2% 3% 4% 5% 6% 7% 8% Q107 Q207 Q307 Q407 Q108 Tangible Common Equity to Tangible Managed Assets Ratio |
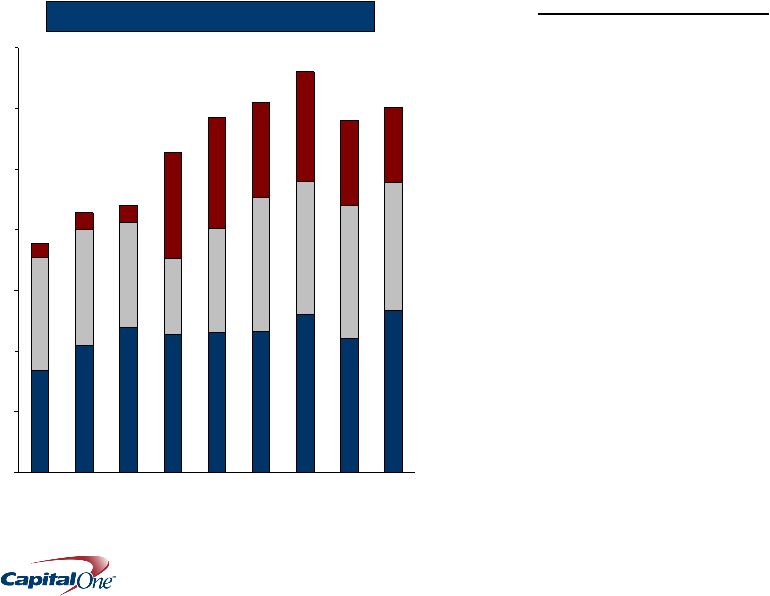 9 0 5 10 15 20 25 30 35 1Q06 2Q06 3Q06 4Q06 1Q07 2Q07 3Q07 4Q07 1Q08 We continue to maintain ample liquidity Quarterly Highlights • Liquidity position is 5x next 12 months of capital markets funding plan • Moved Auto Finance to be a subsidiary of National Bank • $5.7B Holding company cash: – Covers parent obligations for over 2 years, including common stock and dividends • Maintained strong, diversified funding – Q1 deposit growth of $4.9B – $3.0B AAA US Card ABS YTD • Highly liquid, low risk investment portfolio $B Readily Available Liquidity Undrawn FHLB Capacity Unencumbered Securities Undrawn Conduit $30B $29B |
 10 Capital One remains highly profitable despite significant cyclical credit headwinds Net Income from Continuing Operations ($Millions) Q108 Q407 Q307 Q207 Q107 National Lending US Card $ 491.2 $ 498.7 $ 626.8 $ 592.9 $ 538.5 Auto Finance (82.4) (112.4) (3.8) 38.0 44.4 International 33.3 54.7 47.4 18.2 19.5 SUBTOTAL 442.1 441.0 670.4 649.1 602.3 Local Banking 75.8 103.6 195.5 154.8 139.2 Other 114.6 (223.0) (49.6) (36.3) (55.4) Total Company $ 632.6 $ 321.6 $ 816.4 $ 767.6 $ 686.1 |
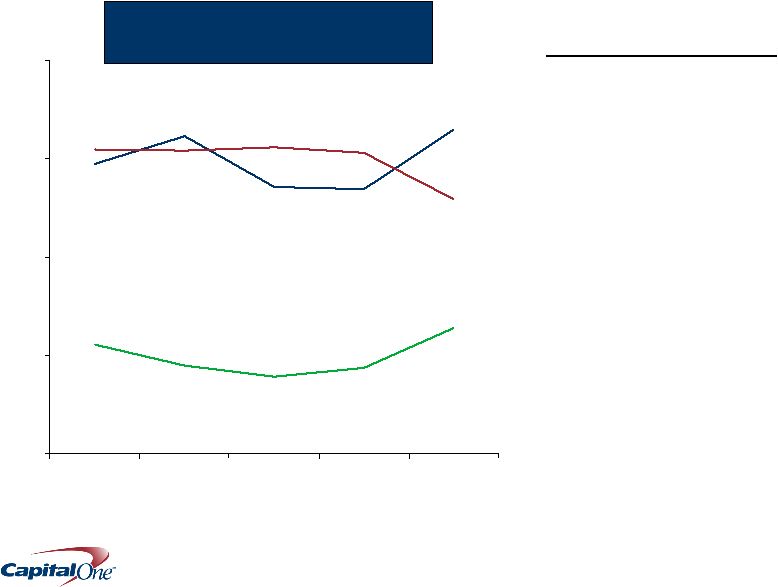
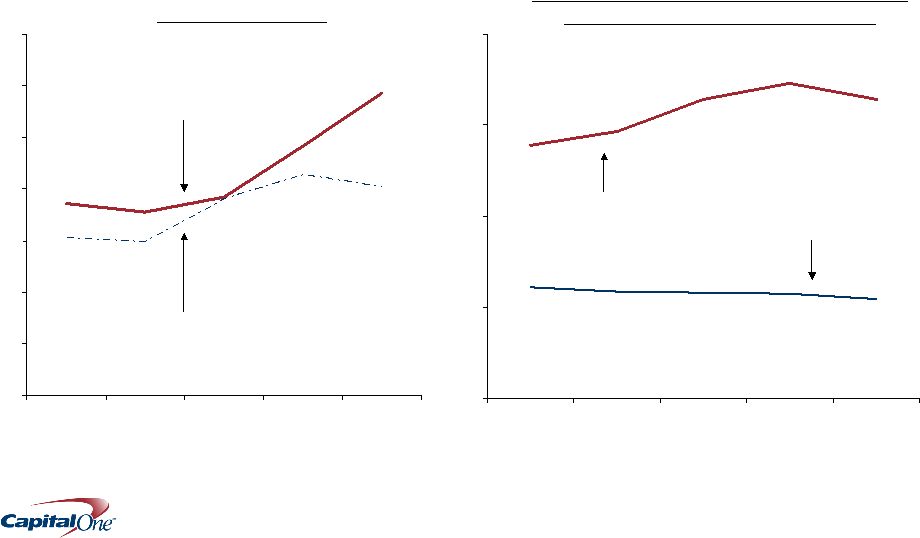 11 We are taking action to strengthen resiliency and sustain the strong financial returns of our US Card business 3.56% 3.85% 4.84% 3.72% 5.85% 2.98% 3.06% 3.80% 4.28% 4.04% 0% 1% 2% 3% 4% 5% 6% 7% Q107 Q207 Q307 Q407 Q108 US Card Credit Risk Metrics 16.42% 13.92% 17.31% 16.42% 14.67% 5.48% 5.76% 5.81% 6.11% 5.88% 0% 5% 10% 15% 20% Q107 Q207 Q307 Q407 Q108 US Card Revenue Margin and Non-Interest Expenses as a % of Average Loans Revenue Margin Managed Net Charge-off Rate Non-Interest Expenses as a % of Average Loans Managed 30+ Delinquency Rate |
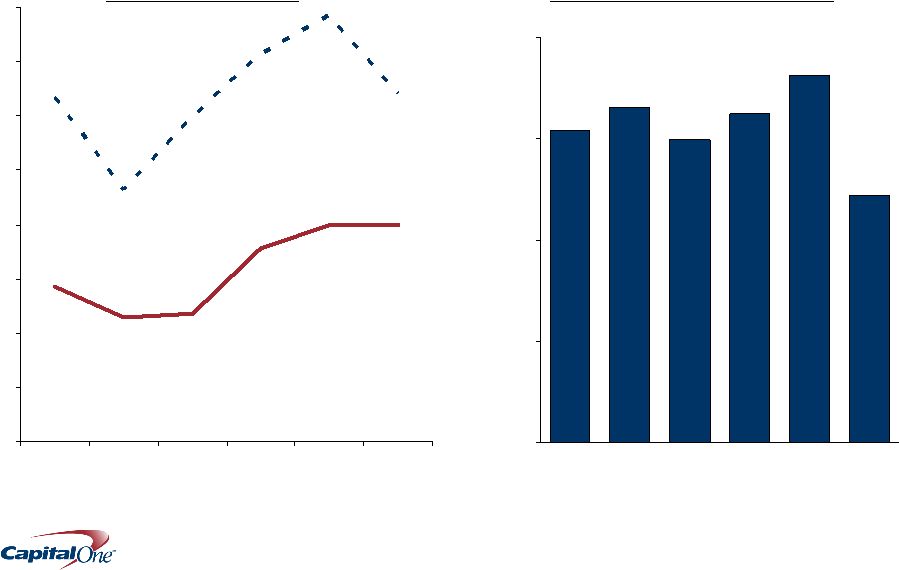 12 3.98% 4.00% 2.85% 2.29% 3.56% 2.35% 6.42% 7.84% 7.15% 6.00% 4.64% 6.35% 0% 1% 2% 3% 4% 5% 6% 7% 8% Q406 Q107 Q207 Q307 Q407 Q108 Credit Risk Metrics (1) Based on internal allocations of consolidated results Managed Net Charge-off Rate Managed 30+ Delinquency Rate $3.1 $3.3 $3.0 $3.2 $3.6 $2.4 $0 $1 $2 $3 $4 Q406 Q107 Q207 Q307 Q407 Q108 We continue to aggressively retrench and reposition our auto business for resilience Auto Loan Originations ($B) |
 13 Bank integration was largely completed in the quarter 0.31% 0.15% 0.19% 0.28% 0.19% 0.56% 0.41% 0.27% 0.19% 0.19% 0% 1% 2% Q107 Q207 Q307 Q407 Q108 Credit Risk Metrics Managed Net Charge-off Rate Non Performing Loans as a % of Loans • Launched new Capital One logo • Completed brand conversion of former North Fork branches • Consolidated banking operations onto a single deposit platform $0 $10 $20 $30 $40 $50 $60 $70 $80 $41.6 Deposit and Loan Portfolio ($B) Loans Deposits $74.3 Q107 Q207 Q307 Q407 $74.3 $41.9 Q108 $72.8 $42.2 $73.1 $44.0 $44.2 $73.4 |
 14 We expect sound operating metrics in 2008, despite continued credit headwinds Commentary Loan/Deposit Growth Cautious on loan growth; bullish on deposit growth Revenue Growth Revenue margin remains strong Cost Management Capital Management Expect to continue $0.375 quarterly dividend; share repurchases dependent on economic outlook; 2H08 at the earliest Credit Expectations Allowance at 3/31/08 consistent with $6.7B in charge- offs for the next 12 months 2008 Outlook Flat loan growth; double-digit deposit growth Efficiency ratio in the low-to mid- 40%’s Manage to the high end or above 5.5-6.0% TCE target Continued economic weakness At least $200M Y/Y OpEx reduction vs. 2007 Low-to mid-single digits |
 15 Our actions position Capital One to deliver shareholder value over the cycle Strong Position Decisive Actions • Resilient businesses • Conservatism imbedded in underwriting decisions • Banking transformation – Fortified funding and liquidity – Strong capital position – Broad funding flexibility • Pulled back on loan growth across lending businesses – Tightened underwriting across lending businesses • Retrenching and repositioning Auto Finance • Pulled back or exited least resilient businesses • Shut down GreenPoint Mortgage origination businesses • Increased pricing to strengthen margins • Driving strong operating efficiency gains • Enhancing and leveraging strong balance sheet • Managing capital with discipline |
16 Appendix |
 17 Q108/Q407 Change Q108 Q407 Q107 $ %/bps Total Deposits $ 87,695 $ 82,761 $ 87,471 $ 4,934 6.0 % Total Managed Loans Held for Investment 148,037 151,362 142,005 (3,325) (2.2) Tangible Assets 185,962 185,428 180,501 534 0.3 Tangible Common Equity 11,220 10,814 12,270 406 3.8 Tangible Common Equity to Tangible Assets Ratio 6.03 % 5.83 % 6.80 % n/a 20 bps Net Interest Margin 6.78 % 6.83 % 6.15 % n/a (5) bps Revenue Margin 10.43 10.40 9.20 n/a 3 Return on Average Managed Assets 1.27 0.64 1.42 n/a 63 Return on Average Equity 10.30 5.20 10.72 n/a 510 Return on Average Tangible Common Equity 22.70 11.54 24.53 n/a 1,116 Managed Balance Sheet Highlights ($Millions) First quarter 2008 balance sheet and return metrics from Continuing Operations |
 18 Q108/Q407 Change Q108 Q407 Q107 $ %/bps Net Interest Income $ 2,976.8 $ 3,000.5 $ 2,602.5 $ (23.7) (1) % Non-Interest Income 1,606.7 1,566.2 1,294.1 40.5 3 Total Revenue 4,583.5 4,566.7 3,896.6 16.8 0 % Net Charge-offs $ 1,482.3 $ 1,296.2 $ 947.3 $ 186.1 14 % Allowance Build 310.4 643.0 (75.0) (332.6) (52) Other 1.5 1.1 (4.6) 0.4 36 Provision for Loan Losses 1,794.2 1,940.3 867.7 (146.1) (8) % Marketing Expenses $ 297.8 $ 358.2 $ 330.9 (60.4) (17) % Restructuring Expenses 52.8 27.8 - 25.0 90 Operating Expenses 1,471.7 1,749.2 1,643.2 (277.5) (16) Tax Rate 34.6 % 34.5 % 35.0 % n/a 10 bps Income from Continuing Operations, Net of Tax $ 632.6 $ 321.6 $ 686.1 $ 311.0 97 % Loss from Discontinued Operations, Net of Tax (84.1) (95.0) (11.1) 10.9 11 Net Income 548.5 226.6 675.0 321.9 142 Shares Used to Compute Diluted EPS (MM) 372.3 378.4 415.5 n/a (2) % Diluted EPS from Continuing Operations $ 1.70 $ 0.85 $ 1.65 $ 0.85 100 % Diluted EPS from Discontinued Operations (0.23) (0.25) (0.03) 0.02 (8) % Managed Income Statement Highlights ($Millions except per share data) First quarter 2008 managed income statement |
 19 With the $310M build in Q108, our allowance for loan losses is consistent with $6.7B of managed charge offs for the next 12 months Charge-offs and Allowance for Loan Losses ($Millions) 1 : Based on Continuing Operations. 2 : Based on Total Company balance sheet. Q108/Q407 Change Q108 Q407 Q107 $ %/bps Managed Net Charge-offs 1 $ 1,482.3 $ 1,296.2 $ 947.3 $ 186.1 14 % Allowance Build1 310.4 643.0 (75.0) (332.6) (52) Other 1 1.5 1.1 (4.6) 0.4 36 Managed Provision for Loan Losses 1 1,794.2 1,940.3 867.7 (146.1) (8) % Reported Net Charge-off Rate 1 3.07 % 2.66 % 1.84 % n/a 41 bps Reported Loans 2 $ 98,356 $ 101,805 $ 90,869 $ (3,449) (3) % Allowance for Loan Losses 2 3,273 2,963 2,105 310 10 Reported 30+ Day Delinquencies 2 3,207 3,721 2,093 (514) (14) Reported 30+ Delinquency Rate 2 3.26 % 3.66 % 2.30 % n/a (40) bps |