 Second quarter 2008 results July 17, 2008 Exhibit 99.2 |
 2 Please note that the following materials containing information regarding Capital One’s financial performance speak only as of the particular date or dates indicated in these materials. Capital One does not undertake any obligation to update or revise any of the information contained herein whether as a result of new information, future events or otherwise. Certain statements in this presentation and other oral and written statements made by Capital One from time to time are forward-looking statements, including those that discuss, among other things, strategies, goals, outlook or other non-historical matters; projections, revenues, income, returns, earnings per share or other financial measures for Capital One; future financial and operating results; and Capital One’s plans, objectives, expectations and intentions; and the assumptions that underlie these matters. To the extent that any such information is forward-looking, it is intended to fit within the safe harbor for forward-looking information provided by the Private Securities Litigation Reform Act of 1995. Numerous factors could cause our actual results to differ materially from those described in such forward-looking statements, including, among other things: general economic and business conditions in the U.S., the UK, or Capital One’s local markets, including conditions affecting consumer income and confidence, spending and repayments, changes in the credit environment, including an increase or decrease in credit losses or changes in the interest rate environment; competition from providers of products and services that compete with Capital One’s businesses; financial, legal, regulatory, tax or accounting changes or actions, including actions with respect to litigation matters involving Capital One; increases or decreases in our aggregate accounts or consumer loan balances or the growth rate or composition thereof; the amount and rate of deposit growth; changes in the reputation of or expectations regarding the financial services industry and/or Capital One with respect to practices, products or financial condition; the risk that synergies from Capital One’s acquisitions may not be fully realized or may take longer to realize than expected; disruptions from Capital One’s acquisitions negatively impacting Capital One’s ability to maintain relationships with customers, employees or suppliers; the risk that the benefits of Capital One’s cost savings initiatives may not be fully realized; Capital One’s ability to access the capital markets at attractive rates and terms to fund its operations and future growth; losses associated with new or changed products or services; Capital One’s ability to execute on its strategic and operational plans; any significant disruption in Capital One’s operations or technology platform; Capital One’s ability to effectively control costs; the success of Capital One’s marketing efforts in attracting and retaining customers; Capital One’s ability to recruit and retain experienced management personnel; changes in the labor and employment market; and other factors listed from time to time in reports that Capital One files with the Securities and Exchange Commission (the “SEC”), including, but not limited to, factors set forth under the caption “Risk Factors” in its Annual Report on Form 10-K for the year ended December 31, 2007 and its Quarterly Report on Form 10-Q for the quarter ended March 31, 2008. You should carefully consider the factors discussed above in evaluating these forward-looking statements. All information in these slides is based on the consolidated results of Capital One Financial Corporation, unless otherwise noted. A reconciliation of any non-GAAP financial measures included in this presentation can be found in Capital One’s most recent Form 10-K concerning annual financial results, available on Capital One’s website at www.capitalone.com in Investor Relations under “About Capital One.” Forward looking statements |
3 • Diluted EPS of $1.21; EPS from Continuing Operations of $1.24 – Continuing Operations EPS down $0.72 from Q207, and down $0.46 from Q108 – Higher provision expense drove decline from prior year – Lower revenue drove decline from prior quarter – Non-interest expense decreased $54M from Q108, adjusting for one-time effects • Credit performance in the quarter largely in line with previous expectations – Managed chargeoff rate up 19bp from Q108 to 4.15% – Managed delinquency rate up 8bp from Q108 to 3.56% • Results reflect expectations for continued weakening in US economy – Increased delinquency coverage ratios – Increased uncollectible revenue assumption • Tighter underwriting in recent quarters resulting in portfolio contraction – Managed loans declined $0.8B from Q108 • Balance sheet remains a source of strength – Deposits increased $4.7B from Q108 to $92.4B – Increased immediately available liquidity by $3B to $33B – Internally generated capital increased TCE ratio 15bp to 6.18% after dividends Second quarter 2008 highlights |
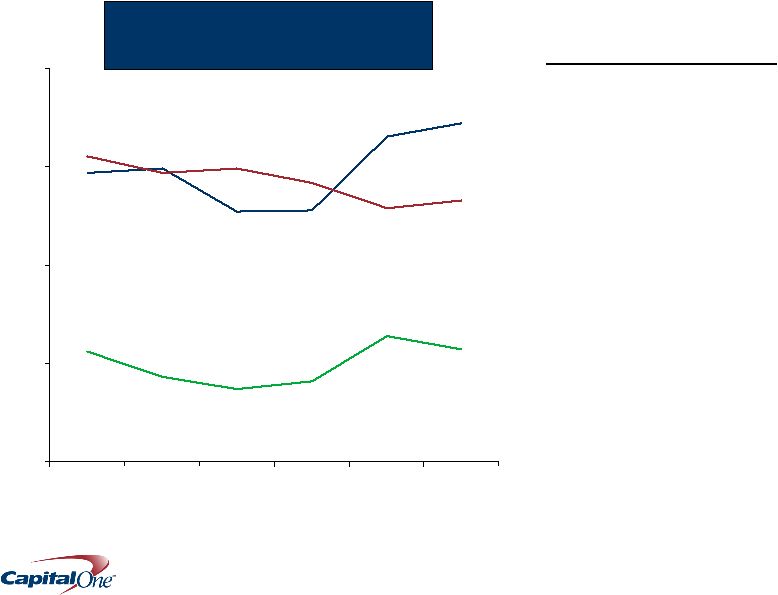
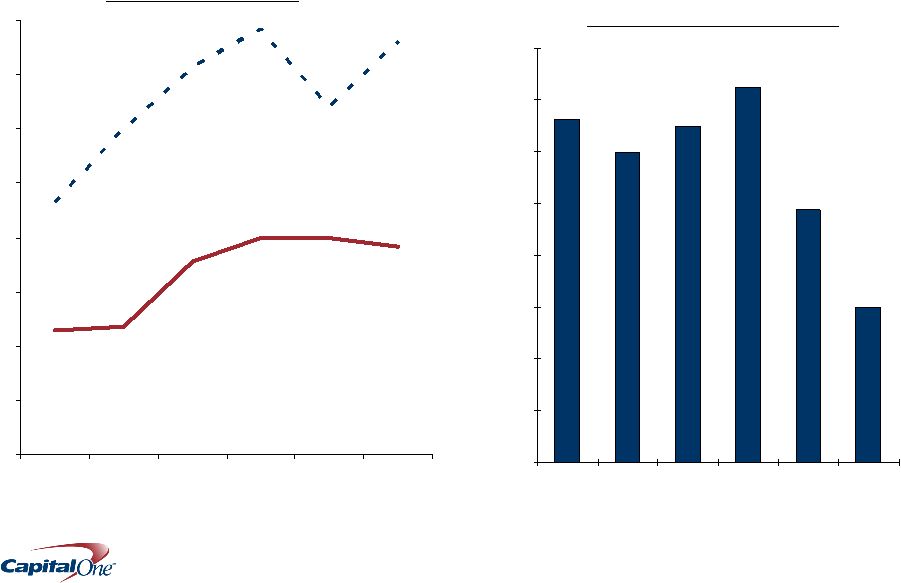
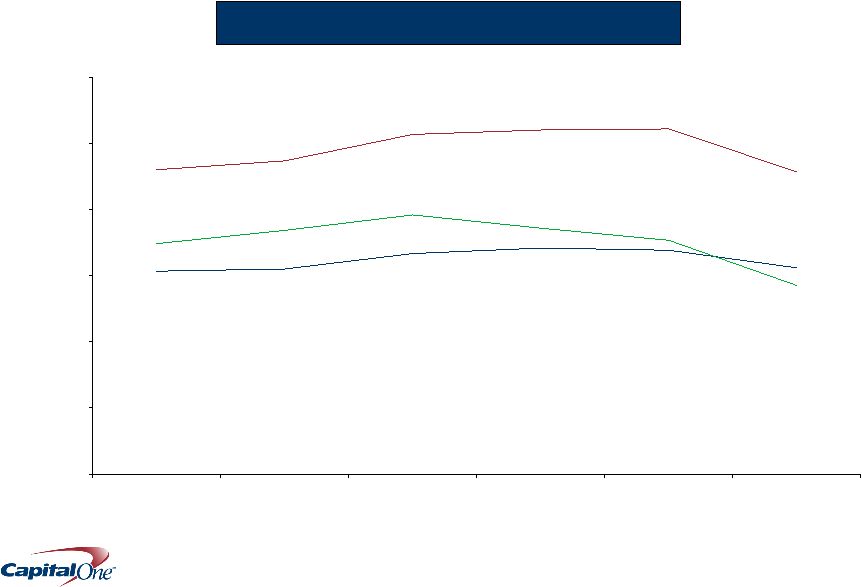 4 Margins declined in the quarter 9.12% 6.22% 9.20% 10.43% 6.15% 6.78% 5.70% 6.97% 7.06% 0% 2% 4% 6% 8% 10% 12% Q107 Q207 Q307 Q407 Q108 Q208 Margins as % of Managed Assets Revenue Margin Net Interest Margin Risk-Adjusted Margin |
 5 Revenue margin declined from Q1 highs due to a variety of factors Factors which drove Q1 margin higher Interest Rates (30 bp) Timing benefit from 200bp Q1 drop in rates Seasonality (15 bp) Higher fees and lower suppression in Q1 One-time items (25 bp) Q1 gains from Visa IPO & debt extinguishment Factors pressuring Q2 margin Increased investment portfolio (25 bp) Strengthens liquidity position, positive carry Higher late stage delinquency flow rates Increased suppression Lower early delinquencies & overlimits - Consumer behavior Consumer caution; adapting to 2007 policy changes - Tightened underwriting Originating only in the most resilient segments - Increased collections intensity Focused on curing early delinquencies - Economic stimulus payments Difficult to quantify impact Comments (35 bp) Revenue Margin Driver Estimate d Impact Q1 to Q2 |
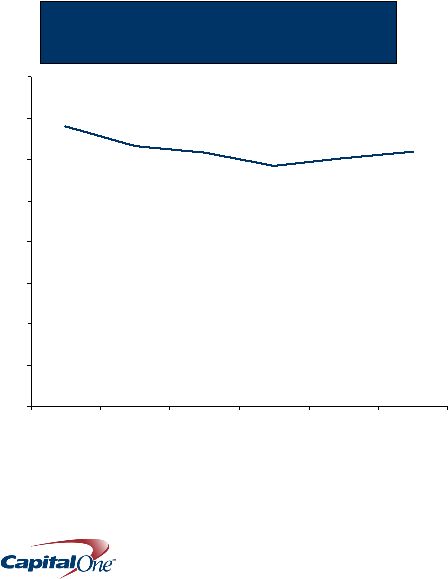
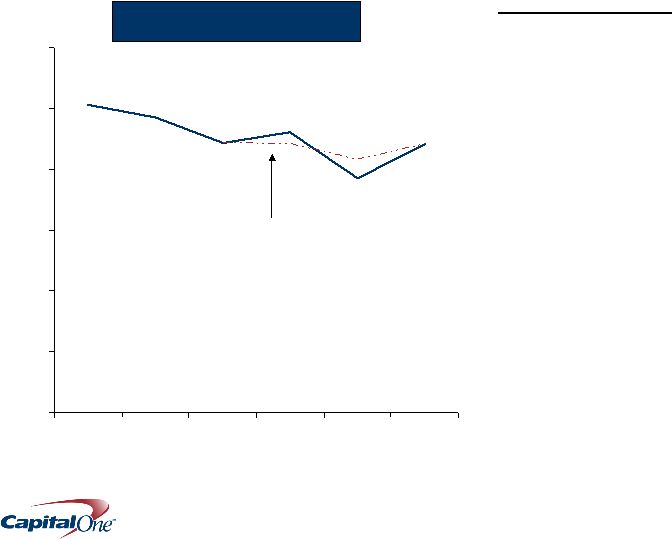 6 We continue to drive efficiency gains 44.2% 50.7% 41.6% 0% 10% 20% 30% 40% 50% 60% Q107 Q207 Q307 Q407 Q108 Q208 Efficiency Ratio Excluding Visa one-time impacts Q208 Summary • Operating expenses down $45M from Q108, adjusted for $91M legal reserve release in Q108 • Marketing down $10M from Q108, due to cautious view of loan growth • Lower revenue drove increase to efficiency ratio |
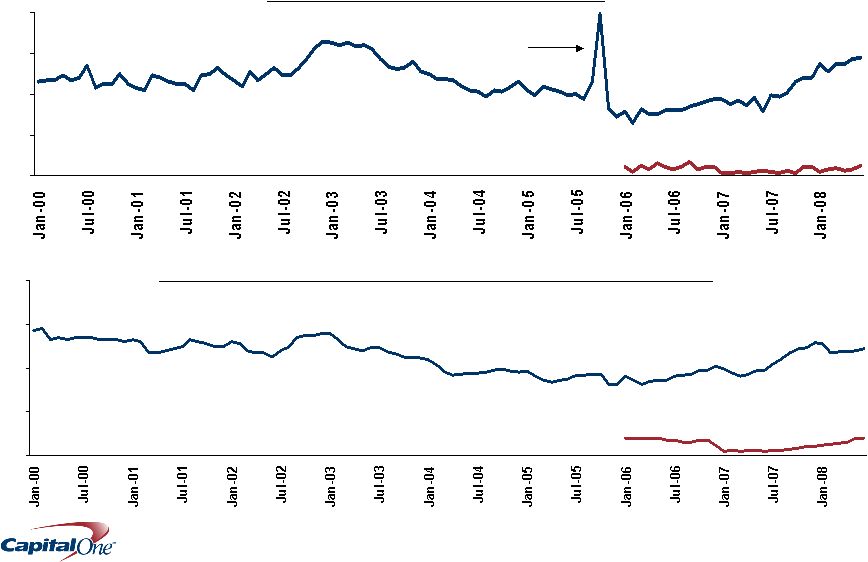 7 0% 2% 4% 6% 8% Credit performance is largely in-line with expectations 0% 2% 4% 6% 8% Monthly Managed Net Charge-off Rate Monthly Managed Delinquency and Non-Performing Loan Rate Bankruptcy Filing Spike National Lending Local Banking Local Banking: Non-performing loans as % of loans National Lending 30+ Delinquency Rate Q208: 5.67% Q208: 0.34% Q208 4.87% Q208 0.81% |
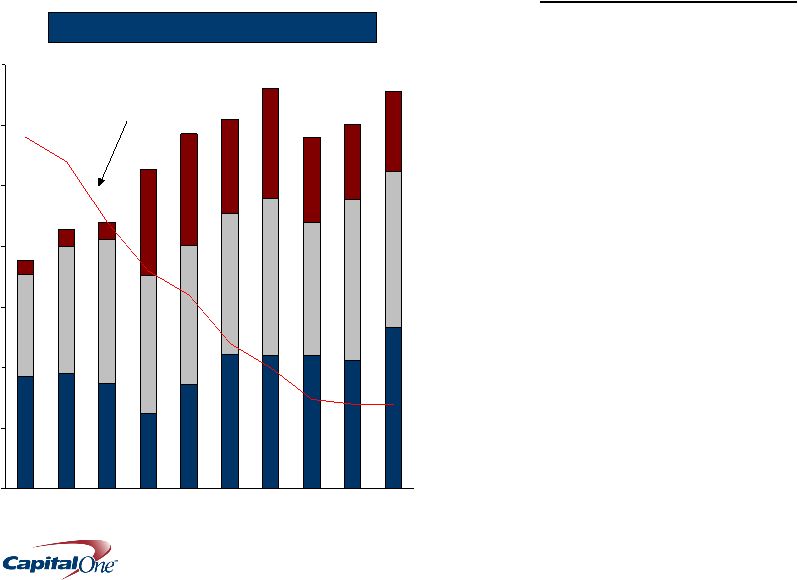
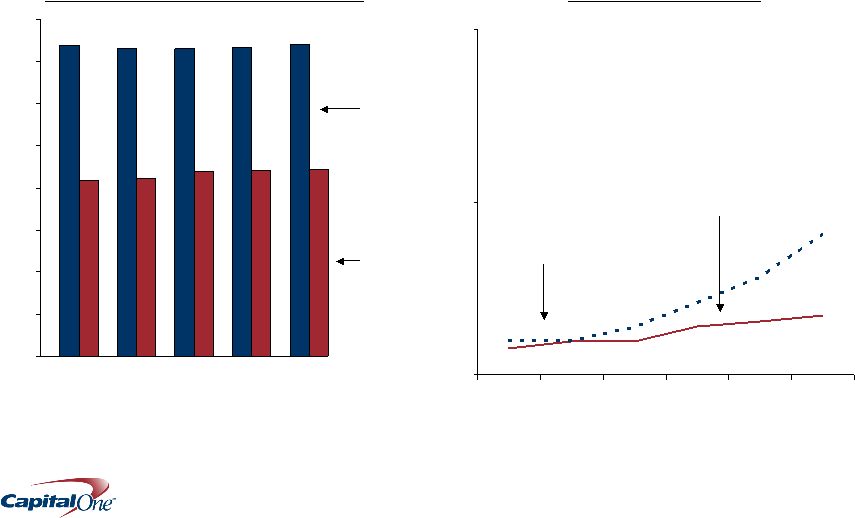
 8 We have increased loan-loss allowance coverage ratios in-line with indications of a weaker US economy 147% 165% 172% 57% 56% 64% 155% 129% 133% 0% 50% 100% 150% 200% Q107 Q207 Q307 Q407 Q108 Q208 Quarterly Highlights • Observed delinquency trends and portfolio contraction reduced base allowance requirement by more than $100M • Weakening economic indicators suggest further credit pressure likely, resulting in $38M allowance build • Allowance has capacity to absorb the equivalent of $7B of managed charge-offs over the next 12 months National Lending Segment Allowance as % of Reported 30+ Delinquencies US Card Auto International Allowance as % of Reported Loans 2.3% 2.4% 2.9% 3.3% 3.4% 2.3% |
 9 Despite economic headwinds, we remain capital generative • Continue $0.375 quarterly dividend • Share buybacks unlikely until economic outlook improves • Expect TCE ratio to remain above target range of 5.5%-6.0% • Tier 1 risk-based capital ratio of 11.4% (estimated) 6.18% 6.03% 6.80% 0% 1% 2% 3% 4% 5% 6% 7% 8% Q107 Q207 Q307 Q407 Q108 Q208 Tangible Common Equity to Tangible Managed Assets Ratio |
 10 We continue to maintain ample liquidity Quarterly Highlights • Liquidity of 5x next 12 months of capital markets funding plan • $5.5B Holding Company cash covers parent obligations for over 2 years, including current dividend • Quarterly funding favored deposits – $4.7B net deposit growth – $2.6B AAA US Card ABS • Increased investment portfolio by $3B to $25B – Highly liquid, low risk assets – No SIV’s, CDO’s, leveraged loans – No exposure to equity or hybrids $B Readily Available Liquidity Undrawn FHLB Capacity Unencumbered Securities Undrawn Conduit $33B 0 5 10 15 20 25 30 35 1Q06 2Q06 3Q06 4Q06 1Q07 2Q07 3Q07 4Q07 1Q08 Q208 12-Month Forward Capital Markets Issuance Plan |
 11 Capital One delivered an operating profit of $463M despite significant cyclical credit headwinds Net Income from Continuing Operations ($Millions) Q208 Q108 Q407 Q307 Q207 National Lending US Card $ 340.4 $ 491.1 $ 498.7 $ 626.8 $ 592.9 Auto Finance 33.6 (82.4) (112.4) (3.8) 38.0 International 33.7 33.3 54.7 47.4 18.2 SUBTOTAL 407.6 442.0 441.0 670.5 649.1 Local Banking 67.1 75.8 103.6 195.5 154.8 Other (12.2) 114.6 (223.0) (49.6) (36.3) Total Company $ 462.5 $ 632.6 $ 321.6 $ 816.4 $ 767.6 |
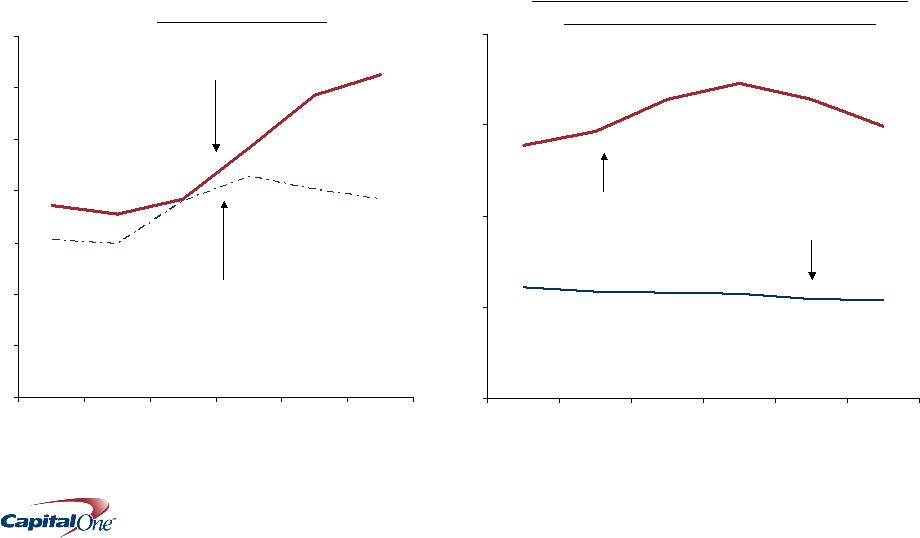 12 Our US Card business continues to deliver profits and generate capital despite a deteriorating economic environment 3.56% 3.85% 4.84% 3.72% 5.85% 6.26% 2.98% 3.06% 3.80% 4.28% 4.04% 3.85% 0% 1% 2% 3% 4% 5% 6% 7% Q107 Q207 Q307 Q407 Q108 Q208 US Card Credit Risk Metrics 14.96% 16.42% 13.92% 17.31% 16.42% 14.67% 5.38% 5.48% 5.76% 5.81% 6.11% 5.88% 0% 5% 10% 15% 20% Q107 Q207 Q307 Q407 Q108 Q208 US Card Revenue Margin and Non-Interest Expenses as a % of Average Loans Revenue Margin Managed Net Charge-off Rate Non-Interest Expenses as a % of Average Loans Managed 30+ Delinquency Rate |
 13 3.84% 3.98% 2.29% 2.35% 4.00% 3.56% 7.62% 6.42% 7.84% 7.15% 6.00% 4.64% 0% 1% 2% 3% 4% 5% 6% 7% 8% Q107 Q207 Q307 Q407 Q108 Q208 Credit Risk Metrics Managed Net Charge-off Rate Managed 30+ Delinquency Rate $3.3 $3.0 $3.2 $3.6 $2.4 $1.5 $0.0 $0.5 $1.0 $1.5 $2.0 $2.5 $3.0 $3.5 $4.0 Q107 Q207 Q307 Q407 Q108 Q208 We continue to aggressively retrench and reposition our auto business for resilience Auto Loan Originations and Managed Loans ($B) Total Outstandings ($B) $24.1 $24.3 $25.1 $24.6 $23.4 $23.9 |
 14 Our banking team is focused on aggressively managing credit exposures, growing deposits, and investing for the long-term Credit Risk Metrics Managed Net Charge-off Rate Non Performing Loans as a % of Loans $0 $10 $20 $30 $40 $50 $60 $70 $80 Deposit and Loan Portfolio ($B) Loans Deposits Q207 Q307 Q407 Q108 $74.3 $41.9 Q208 $72.8 $42.2 $73.1 $44.0 $44.2 $73.4 $74.2 $44.3 0.34% 0.31% 0.15% 0.19% 0.28% 0.19% 0.81% 0.56% 0.41% 0.27% 0.19% 0.19% 0% 1% 2% Q107 Q207 Q307 Q407 Q108 Q208 |
 15 We expect sound operating metrics in 2008, despite continued credit headwinds Commentary Loan/Deposit Growth Flat growth in average loans High single-digit growth in average deposits Revenue Growth Revenue growth towards lower end of range if Q2 trends persist Cost Management Capital Management Continue $0.375 quarterly dividend No share repurchases until economic outlook improves Credit Expectations Allowance at 6/30/08 has capacity to absorb up to the equivalent of $7B in managed charge-offs over the next 12 months 2008 Outlook Low single-digit decline in ending loans Double-digit growth in ending deposits Low-to mid-40%’s efficiency ratio; At least $200M Y/Y OpEx reduction vs. 2007 TCE ratio above 5.5-6.0% target Continued economic weakness Low-to-mid single digits Revenue trends will drive efficiency ratio |
 16 Despite continuing economic headwinds, Capital One remains well positioned to deliver value through the cycle Strong Position Decisive Actions • Resilient businesses • Conservatism imbedded in underwriting decisions • Banking transformation – Fortified funding and liquidity – Strong capital position – Broad funding flexibility • Pulled back on loan growth across lending businesses – Tightened underwriting across lending businesses • Retrenching and repositioning Auto Finance • Pulled back or exited least resilient businesses • Recalibrated underwriting models and approaches • Increased collections intensity • Enhancing and leveraging strong balance sheet • Managing capital with discipline |
 |