 Fourth quarter 2008 results January 22, 2009 Exhibit 99.2 |
 2 Forward looking statements Please note that the following materials containing information regarding Capital One’s financial performance speak only as of the particular date or dates indicated in these materials. Capital One does not undertake any obligation to update or revise any of the information contained herein whether as a result of new information, future events or otherwise. Certain statements in this presentation and other oral and written statements made by Capital One from time to time are forward-looking statements, including those that discuss, among other things, strategies, goals, outlook or other non-historical matters; projections, revenues, income, returns, earnings per share or other financial measures for Capital One; future financial and operating results; and Capital One’s plans, objectives, expectations and intentions; and the assumptions that underlie these matters. To the extent that any such information is forward-looking, it is intended to fit within the safe harbor for forward-looking information provided by the Private Securities Litigation Reform Act of 1995. Numerous factors could cause our actual results to differ materially from those described in such forward-looking statements, including, among other things: general economic and business conditions in the U.S., the UK, or Capital One’s local markets, including conditions affecting consumer income and confidence, spending and repayments; changes in the credit environment, including an increase or decrease in credit losses or changes in the interest rate environment; financial, legal, regulatory, tax or accounting changes or actions, including actions with respect to litigation matters involving Capital One; increases or decreases in our aggregate accounts or consumer loan balances or the growth rate or composition thereof; the amount and rate of deposit growth; changes in the reputation of or expectations regarding the financial services industry and/or Capital One with respect to practices, products or financial condition; the risk that synergies from Capital One’s acquisitions may not be fully realized or may take longer to realize than expected; disruptions from Capital One’s acquisitions negatively impacting Capital One’s ability to maintain relationships with customers, employees or suppliers, Capital One’s ability to access the capital markets at attractive rates and terms to fund its operations and future growth; losses associated with new or changed products or services; competition from providers of products and services that compete with Capital One’s businesses; Capital One’s ability to execute on its strategic and operational plans; any significant disruption in Capital One’s operations or technology platform; Capital One’s ability to effectively control costs; the success of Capital One’s marketing efforts in attracting and retaining customers; Capital One’s ability to recruit and retain experienced management personnel; changes in the labor and employment market; and other factors listed from time to time in reports that Capital One files with the Securities and Exchange Commission (the “SEC”), including, but not limited to, factors set forth under the caption “Risk Factors” in its Annual Report on Form 10-K for the year ended December 31, 2007, and its Quarterly Reports on Form 10-Q for the quarters ended March 31, 2008, June 30, 2008, and September 30, 2008. You should carefully consider the factors discussed above in evaluating these forward-looking statements. All information in these slides is based on the consolidated results of Capital One Financial Corporation, unless otherwise noted. A reconciliation of any non-GAAP financial measures included in this presentation can be found in Relations under “About Capital One.” www.capitalone.com Capital One’s most recent Form 10-K concerning annual financial results, available on Capital One’s website at in Investor |
 3 Fourth Quarter 2008 Summary • Declines in EPS driven by: – Higher provision expense, including $1.0B allowance build consistent with assumption that unemployment rate increases to 8.7% by year end 2009 – Goodwill write down of $811MM associated with smaller Auto Finance business • Credit performance reflects the impact of significant economic deterioration across the loan portfolio – Managed charge-off rate up 68 basis points from Q308 to 4.98% – Managed 30+ delinquency rate up 50 basis points from Q308 to 4.49% • Our strong and transparent balance sheet positions us to weather the storm – Significantly increased allowance coverage ratios – High quality investment portfolio – Readily available liquidity of $40B, up $8B from 9/30/08 – Ending deposits of $109B; strong deposit growth with disciplined pricing and stable margins – TCE ratio of 5.57%, including OCI Q408 2008 $MM EPS $MM EPS Earnings from Continuing Ops (Excluding Goodwill Impairment) $ (585) $ (1.59) 895 $ 2.28 Earnings from Continuing Ops (Including Goodwill Impairment) (1,396) $ (3.67) 85 0.14 Total Company Earnings (1,422) $ (3.74) (46) (0.21) |
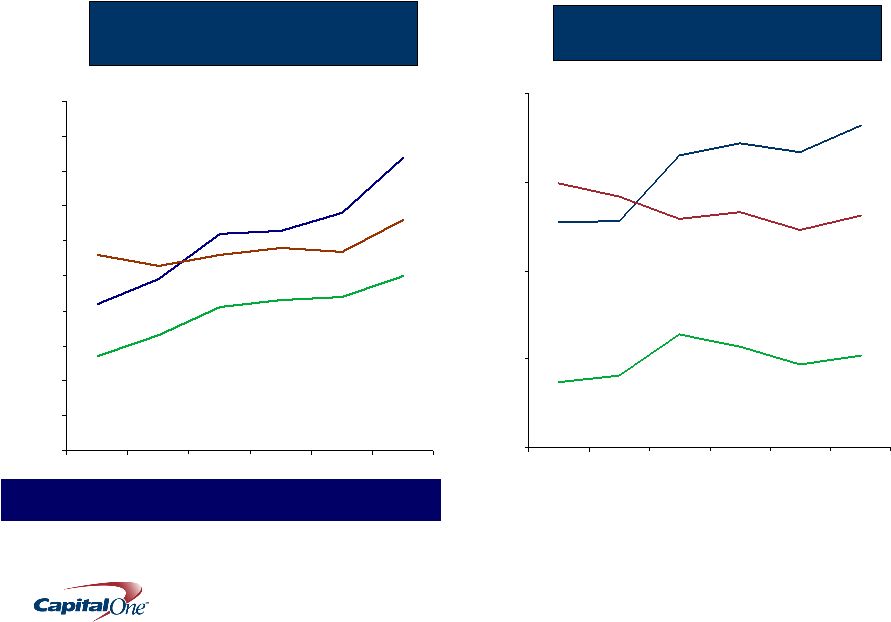
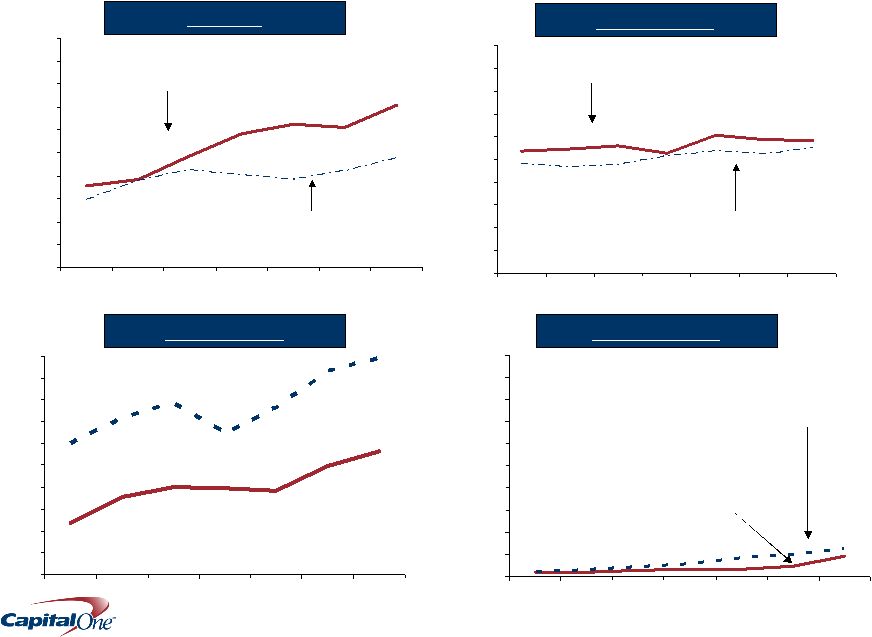 4 The worsening economy drove rising delinquency and loss trends across our lending businesses 7.08% 3.85% 4.84% 5.85% 3.56% 6.26% 6.13% 3.80% 2.98% 4.28% 4.04% 3.85% 4.20% 4.78% 0% 1% 2% 3% 4% 5% 6% 7% 8% 9% 10% Q207 Q307 Q407 Q108 Q208 Q308 Q408 US Card Managed Net Charge-off Rate Managed 30+ Delinquency Rate International 5.67% 5.00% 3.84% 2.35% 3.56% 3.98% 4.00% 9.91% 9.32% 7.62% 6.42% 7.84% 7.15% 6.00% 0% 1% 2% 3% 4% 5% 6% 7% 8% 9% 10% Q207 Q307 Q407 Q108 Q208 Q308 Q408 Managed Net Charge-off Rate Managed 30+ Delinquency Rate Auto Finance Local Banking 0.90% 0.46% 0.34% 0.19% 0.20% 0.31% 0.29% 1.25% 0.96% 0.81% 0.56% 0.41% 0.27% 0.19% 0% 1% 2% 3% 4% 5% 6% 7% 8% 9% 10% Q207 Q307 Q407 Q108 Q208 Q308 Q408 Managed Net Charge-off Rate Non Performing Loans as a % of Loans 5.84% 5.45% 5.61% 5.30% 5.39% 6.07% 5.90% 4.69% 4.82% 4.79% 5.12%5.35% 5.24% 5.51% 0% 1% 2% 3% 4% 5% 6% 7% 8% 9% 10% Q207 Q307 Q407 Q108 Q208 Q308 Q408 Managed Net Charge-off Rate Managed 30+ Delinquency Rate |
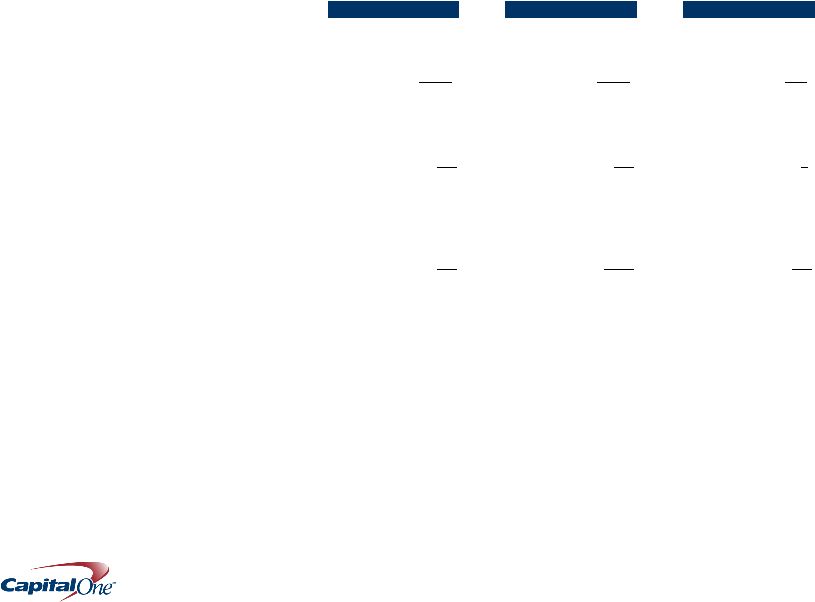
 5 Economic conditions deteriorated rapidly in Q4, driving our outlook for managed credit losses Next 12 Month Period Unemployment Rate Unemployment Rate Assumption Home Price History Home Price Assumption Managed Credit Loss Outlook for next 12 months As of 9/30/08 10/1/08-9/30/09 6.5% as of 9/30/08 Around 7% by mid 2009 Case Schiller 20 city index down 21% from peak 1/1/09-12/31/09 7.2% as of 12/31/08 8.7% by end 2009 Case Schiller 20 city index down~25% from peak As of 12/31/08 Additional 10 percentage point decline by mid 2009 Additional 10 percentage point decline by end 2009 $7.2B $8.6B |
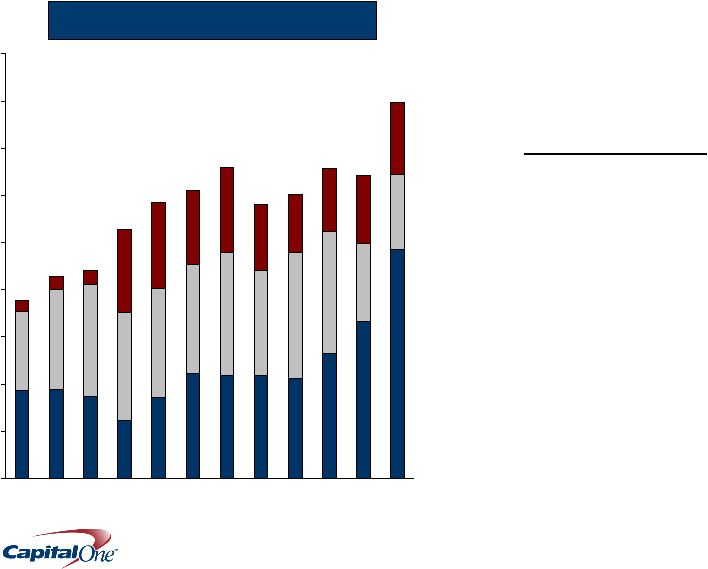
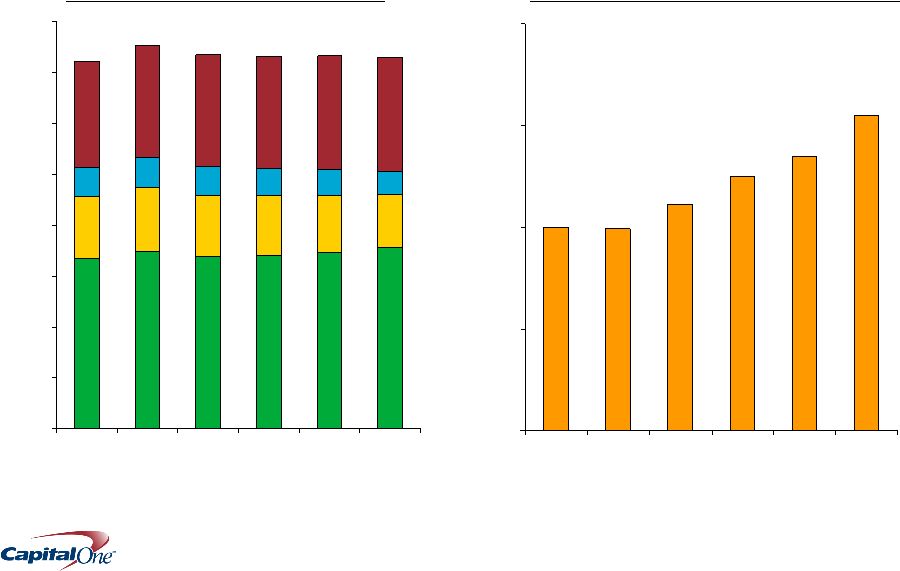 6 The mix of earning assets has shifted as multiple factors have resulted in flat loan growth $71 $69 $70 $21 $22 $25 $9 $10 $12 $45 $45 $44 $0 $20 $40 $60 $80 $100 $120 $140 $160 Q307 Q407 Q108 Q208 Q308 Q408 Managed Loans (End of Period) Card Auto Int’l Bank $31.0 $27.0 $25.0 $22.2 $19.8 $20.0 $0 $10 $20 $30 $40 Q307 Q407 Q108 Q208 Q308 Q408 Investment Portfolio 1 (End of Period) $151 $147 $147 1 net of unrealized gains/losses $B $B |
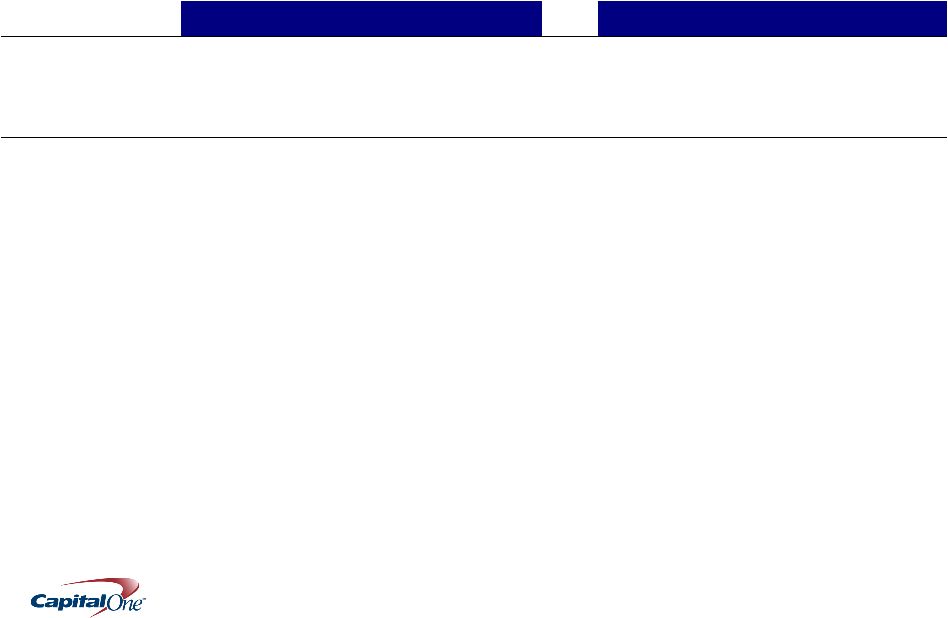
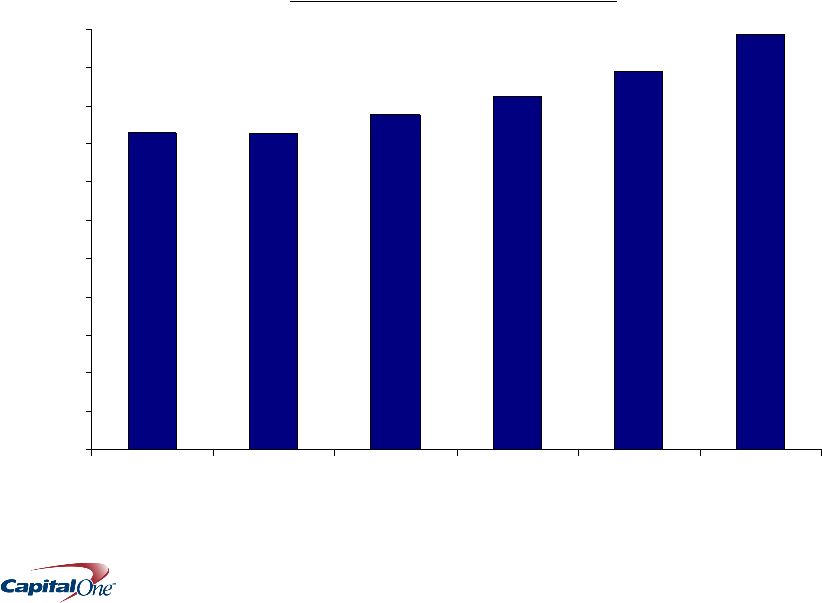 7 We achieved significant deposit growth with stable margins $108.6 $98.9 $92.4 $87.7 $82.8 $83.1 $0 $10 $20 $30 $50 $60 $70 $80 $90 $100 $110 Q307 Q407 Q108 Q208 Q308 Q408 Total Company Ending Deposits Local Banking Deposit Margin 2.09% 2.05% 1.93% 2.04% 2.18% 2.12% ($B) |
8 Chevy Chase is a strategically and financially attractive acquisition • A leading local banking franchise in one of the best local markets* – $11.6 billion in deposits – #1 branch share, #1 ATM share, #5 deposit share – Attractive market • 9 th largest MSA by population, with above average population growth • Highest per capita income and lowest unemployment among the Top 20 MSAs • Enhances our local banking business – Expands our portfolio of attractive local banking franchises – Further improves our core deposit funding base – Adds additional scale to our bank operations – Brings outstanding customer and technology platforms • Financially attractive and low-risk transaction – Accretive to 2009 operating EPS (excluding restructuring charges) and to 2010 GAAP EPS – Credit risks mitigated by a $1.75 billion net mark – Balance sheet and liquidity remain strong post-acquisition – Proximity to Capital One headquarters reduces integration risk and enables synergies – Small acquisition relative to the size of Capital One *Company data and SNL |
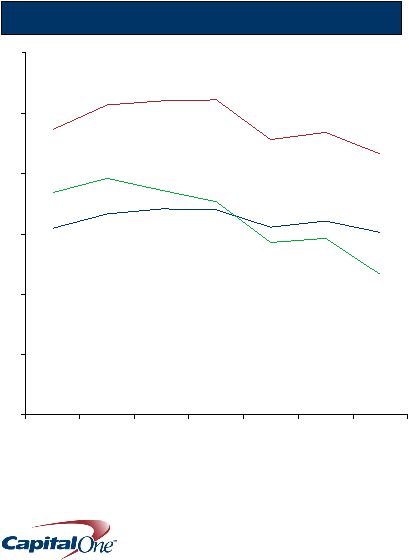 9 Margins declined as compared to both the sequential quarter and the prior year quarter Revenue Margin Net Interest Margin Risk-Adjusted Margin 8.65% 6.06% 4.65% 9.38% 9.48% 6.43% 6.19% 5.86% 7.37% 0% 2% 4% 6% 8% 10% 12% Q207 Q307 Q407 Q108 Q208 Q308 Q408 Margins as % of Managed Assets • Credit Impacts – I/O strip write downs – Increase in uncollectible finance charges & fees not recognized as revenue • Other Impacts – Declining purchase volumes in US Card – Mix shift from loans to investment securities – Prime/Libor dislocation (sequential quarter) – Elevated Q407 margins from 2007 pricing & fee policy moves |
 10 Efficiency Ratio and operating expenses improved as a result of our continuing cost management actions 47.9% 42.6% 50.7% 0% 10% 20% 30% 40% 50% 60% 70% Q107 Q207 Q307 Q407 Q108 Q208 Q308 Q408 Efficiency Ratio 1 excludes impact from Goodwill write-down of $810.9MM 2 excludes restructuring expenses 1 2007 2008 Improvement Efficiency Ratio 47.3% 43.1% 416 bps Non-Interest Expense 2 ($MM) $ 7,940 7,264 676 Operating Expense 6,593 6,146 447 Marketing Expense 1,347 1,118 229 $ |
 11 We continue to increase allowance coverage ratios in all of our National Lending businesses 127% 167% 182% 52% 37% 47% 149% 123% 131% 0% 50% 100% 150% 200% Q307 Q407 Q108 Q208 Q308 Q408 Allowance as % of Reported 30+ Delinquencies US Card Auto International Allowance as % of Reported Loans 4.20% 6.80% 8.40% 6.60% 5.70% 5.60% 4.40% 2.70% 5.00% 0% 1% 2% 3% 4% 5% 6% 7% 8% 9% 10% Q307 Q407 Q108 Q208 Q308 Q408 US Card Auto International Total Company: 2.39% 2.91% 3.33% 3.41% 3.59% 4.48% |
 12 We recorded an $811MM non-cash impairment to goodwill in our Auto Finance business in Q408 Goodwill ($MM) Local Banking US Card Auto Finance International Total Company Balance at January 1, 2008 $ 6,683 3,761 1,430 956 12,830 Other Adjustments 36 - - (33) 3 Goodwill Impairment - - (811) - (811) Balance at December 31, 2008 $ 6,719 3,761 619 923 12,022 |
 13 Credit was the big driver of operating earnings $MM unless otherwise noted * In line with the Company’s finance charge and fee revenue recognition policy, amounts billed to customers but not recognized as revenue 2007 2008 YoY $ Inc/(Dec) Revenue excl. I/O Strip & Supression 17,912 18,984 1,073 I/O Strip Valuation Change 14 (225) (239) Revenue Supression* (1,140) (1,920) (780) Revenue 16,786 16,839 54 Marketing 1,348 1,118 (230) Operating Expense 6,593 6,146 (447) Restructuring 137 135 (2) Non Interest Expense 8,078 7,399 (679) Pre Provision Earnings (before tax) 8,708 9,440 733 Net Charge Offs 4,162 6,425 2,263 Allowance Build 676 1,623 947 Provision 4,838 8,048 3,210 Operating Earnings (after tax) 2,592 896 (1,696) $6.55 EPS $2.28 EPS ($4.26 EPS) Goodwill Impairment 0 811 811 Continuing Operations (after tax) 2,592 85 (2,507) $6.55 EPS $0.14 EPS ($6.41 EPS) Discontinued Ops (1,021) (131) 891 Total Company (after tax) 1,570 (46) (1,616) $3.97 EPS ($0.21 EPS) ($4.18 EPS) |
 14 We increased readily available liquidity by $8B in the quarter $B Readily Available Liquidity Undrawn FHLB Capacity Cash & Unencumbered Securities Undrawn Conduit $40B Q408 Highlights • $8.8B Holding company cash covers parent obligations for 3+ years, including current dividend level • $40B of readily available liquidity is 6x next 12 months of debt maturities $32B 0 5 10 15 20 25 30 35 40 45 Q106 Q206 Q306 Q406 Q107 Q207 Q307 Q407 Q108 Q208 Q308 Q408 |
 15 • Our liquidity focus results in an investment portfolio comprised of liquid, low risk securities – Over 70% invested in Treasuries, Agencies and Agency-backed MBS – No SIV’s, CDO’s, leveraged loans – No exposure to equity or hybrids – No securities backed by Option ARMs • Over 90% of our unrealized loss is concentrated in $3.8B of remaining Non-Agency MBS – Almost entirely collateralized by Prime Jumbo mortgages (Average FICO over 730), less than $71 million Alt-A/Subprime collateral – Two-thirds of these securities originally structured with at least twice the credit enhancement needed for AAA. – Have the liquidity strength to hold the $3.8B of securities to maturity • Other than Temporary Impairment (OTTI) was $5MM or less than 0.5% of the total net unrealized loss The growth in our investment portfolio has been in lower risk assets December 31, 2007 December 31, 2008 $MM Book Value Net Unrealized Gain/(Loss) Book Value Net Unrealized Gain/(Loss) Treasuries/Agencies $ 1,370 16 $ 1,549 61 Agency MBS 11,486 26 21,844 217 Non-Agency MBS 4,411 (11) 3,789 (1,035) ABS 546 (3) 3,356 (200) CMBS 1,250 (1) 1,082 (142) Other 696 (5) 496 (14) Total $ 19,759 22 $ 32,116 (1,113) |
 16 Our TCE ratio remain strong Capital Ratios Tangible Common Equity to Tangible Managed Assets Ratio 0% 1% 2% 3% 4% 5% 6% 7% 8% Q307 Q407 Q108 Q208 Q308 Q408 Long-Term Target Range Q408 5.57% 1 Adjusted TCE excludes OCI and gives 25% tangible common credit for hybrid securities and 25% tangible capital credit for preferred stock 2 Adjusted TCE / RWMA defined as Adjusted TCE divided by risk weighted managed assets 3 Q408 are estimates Q307 Q407 Q108 Q208 Q308 Q408 TCE/TMA 6.2% 5.8% 6.0% 6.2% 6.5% 5.6% TCE/TMA (Excluding OCI) 6.2% 5.9% 6.1% 6.3% 6.6% 6.1% Adjusted TCE/TMA 1 6.8% 6.4% 6.6% 6.8% 7.2% 7.0% Adjusted TCE / RWMA 2 7.6% 7.3% 7.7% 8.0% 8.5% 8.5% Tier 1 leverage ratio 3 9.5% 9.0% 9.4% 9.4% 9.9% 11.1% Tier 1 risk-based capital ratio 3 10.7% 10.1% 10.9% 11.3% 12.0% 13.6% Total risk-based capital ratio 3 13.8% 13.1% 13.8% 14.2% 14.9% 16.5% |
17 Our strong and transparent managed balance sheet positions us to weather the storm • Significantly increased allowance coverage ratios • $40B in readily available liquidity • High quality investment portfolio • Healthy capital position |
 |