 Third Quarter 2009 Results October 22, 2009 Exhibit 99.2 |
 2 October 22, 2009 Forward looking statements Please note that the following materials containing information regarding Capital One’s financial performance speak only as of the particular date or dates indicated in these materials. Capital One does not undertake any obligation to update or revise any of the information contained herein whether as a result of new information, future events or otherwise. Certain statements in this presentation and other oral and written statements made by Capital One from time to time are forward-looking statements, including those that discuss, among other things, strategies, goals, outlook or other non-historical matters; projections, revenues, income, returns, earnings per share or other financial measures for Capital One; future financial and operating results; and Capital One’s plans, objectives, expectations and intentions; and the assumptions that underlie these matters. To the extent that any such information is forward-looking, it is intended to fit within the safe harbor for forward-looking information provided by the Private Securities Litigation Reform Act of 1995. Numerous factors could cause our actual results to differ materially from those described in such forward-looking statements, including, among other things: general economic and business conditions in the U.S., the UK, or Capital One’s local markets, including conditions affecting consumer income and confidence, spending and repayments; changes in the credit environment, including an increase or decrease in credit losses or changes in the interest rate environment; financial, legal, regulatory, tax or accounting changes or actions, including actions with respect to litigation matters involving Capital One; increases or decreases in our aggregate accounts or consumer loan balances or the growth rate or composition thereof; the amount and rate of deposit growth; changes in the reputation of or expectations regarding the financial services industry and/or Capital One with respect to practices, products or financial condition; the risk that synergies from Capital One’s acquisitions may not be fully realized or may take longer to realize than expected; disruptions from Capital One’s acquisitions negatively impacting Capital One’s ability to maintain relationships with customers, employees or suppliers; Capital One’s ability to access the capital markets at attractive rates and terms to fund its operations and future growth; losses associated with new or changed products or services; competition from providers of products and services that compete with Capital One’s businesses; Capital One’s ability to execute on its strategic and operational plans; any significant disruption in Capital One’s operations or technology platform; Capital One’s ability to effectively control costs; the success of Capital One’s marketing efforts in attracting and retaining customers; Capital One’s ability to recruit and retain experienced management personnel; changes in the labor and employment market; and other factors listed from time to time in reports that Capital One files with the Securities and Exchange Commission (the “SEC”), including, but not limited to, factors set forth under the caption “Risk Factors” in its Annual Report on Form 10-K for the year ended December 31, 2008 and in its Quarterly Reports on Form 10-Q for the quarters ended March 31, 2009 and June 30, 2009. You should carefully consider the factors discussed above in evaluating these forward-looking statements. All information in these slides is based on the consolidated results of Capital One Financial Corporation, unless otherwise noted. A reconciliation of any non-GAAP financial measures included in this presentation can be found in Capital One’s most recent Form 10-K concerning annual financial results, available on Capital One’s website at www.capitalone.com under “Investors”. |
 3 October 22, 2009 Q309 Earnings rose as revenue growth more than offset an increase in provision expense 1 Includes TARP dividend and accounting impact of June redemption of TARP preferred shares; excluding those impacts operating earnings in Q209 would have been $0.55 and Total Company earnings would have been $0.53 Revenue excl. Retained Interest & Suppression Retained Interests Valuation Changes Revenue Suppression Revenue Marketing Expense Operating Expense Restructuring Expense Non-Interest Expense Pre-Provision Earnings (before tax) Net Charge-offs Other Allowance Build (Release) Provision Expense Operating Earnings (after tax) Discontinued Operations, net of tax Total Company (after tax) Tax Expense 43 4,835 (115) (572) 4,148 134 1,744 1,922 2,226 2,087 (17) (166) 1,904 224 230 (6) ($0.64) EPS ($0.65) EPS 1 322 92 26 5,110 37 (517) 4,630 104 1,672 1,802 2,827 2,155 14 31 2,200 426 469 (44) $1.03 EPS $0.94 EPS 627 158 15 4,735 (74) (446) 4,215 267 1,528 1,810 2,405 1,583 13 209 1,805 374 386 (12) $1.03 EPS $1.00 EPS 600 214 Pretax Income $MM 1 Q309 Q209 Q308 |
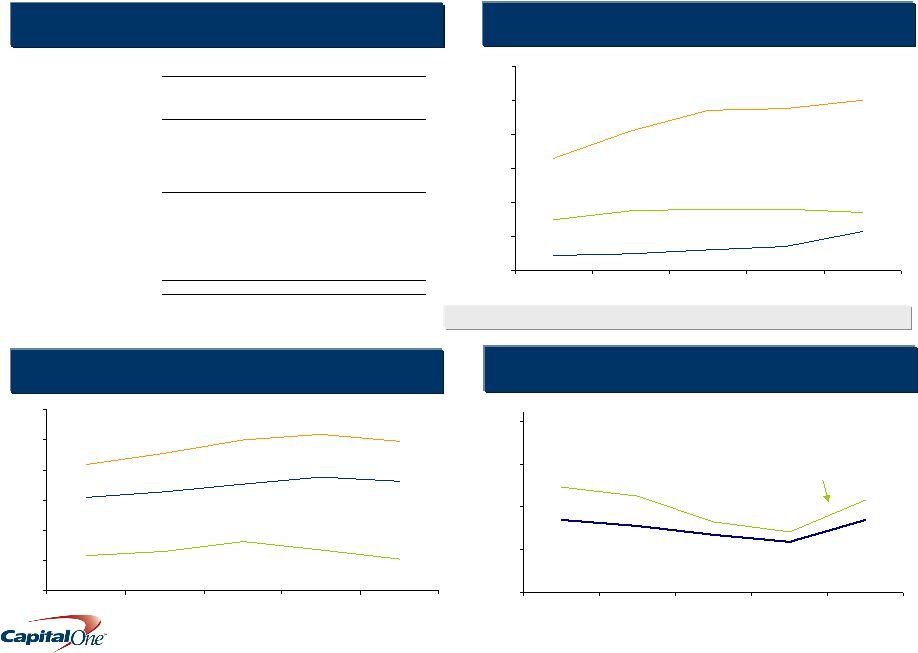 4 October 22, 2009 Allowance coverage ratios remain elevated Allowance as % of Reported 30+ Delinquencies 10.0% 9.5% 1.4% 2.3% 3.4% 3.6% 0% 2% 4% 6% 8% 10% 12% Q308 Q408 Q109 Q209 Q309 208% 198% 54% 41% 150% 145% 0% 40% 80% 120% 160% 200% 240% Q308 Q408 Q109 Q209 Q309 Allowance as % of Reported Loans Total Company¹: 3.59% 4.48% 4.84% 4.84% 5.08% Consumer Card Commercial Dom. Card Int’l Card Auto 1 excluding CCB Loans Allowance Change Q2 '09 Q3 '09 Build(Release) Credit Card Domestic 2,431 $ 2,343 $ (89) $ International 211 222 11 Total Credit Card 2,642 $ 2,565 $ (78) $ Consumer Banking Auto 951 $ 761 $ (190) $ Other Consumer Banking 290 357 67 Total Consumer Banking 1,242 $ 1,118 $ (124) $ Commercial Banking 414 $ 671 $ 256 $ Other 183 $ 160 $ (24) $ Total Allowance 4,482 $ 4,513 $ 31 $ Commercial Lending Allowance as % of Non- Performing Loans 59% 85% 71% 108% 0% 50% 100% 150% 200% Q308 Q408 Q109 Q209 Q309 Commercial Allowance excluding Small Ticket CRE $MM |
 5 October 22, 2009 Average cost of funds declined in the quarter while asset yields rose Average Earning Assets Weighted Avg Asset Yield 8.33% 8.33% 9.06% 9.0 5.3 34.2 37.5 37.4 63.3 65.9 69.2 8.3 8.6 8.4 30.5 29.5 30.1 43.0 41.3 36.5 6.6 $0 $20 $40 $60 $80 $100 $120 $140 $160 $180 $200 Q109 Q209 Q309 Domestic Card Commercial Int’l Card Consumer $B Securities Average Interest-Bearing Liabilities 26% 26% 26% 9% 10% 9% 65% 64% 65% 0% 10% 20% 30% 40% 50% 60% 70% 80% 90% 100% Q109 Q209 Q309 Securitization Interest Bearing Deposits Other Cost of Interest Bearing Liabilities 2.76% 2.40% 2.28% Total Cost of Funds 2.58% 2.24% 2.12% Other |
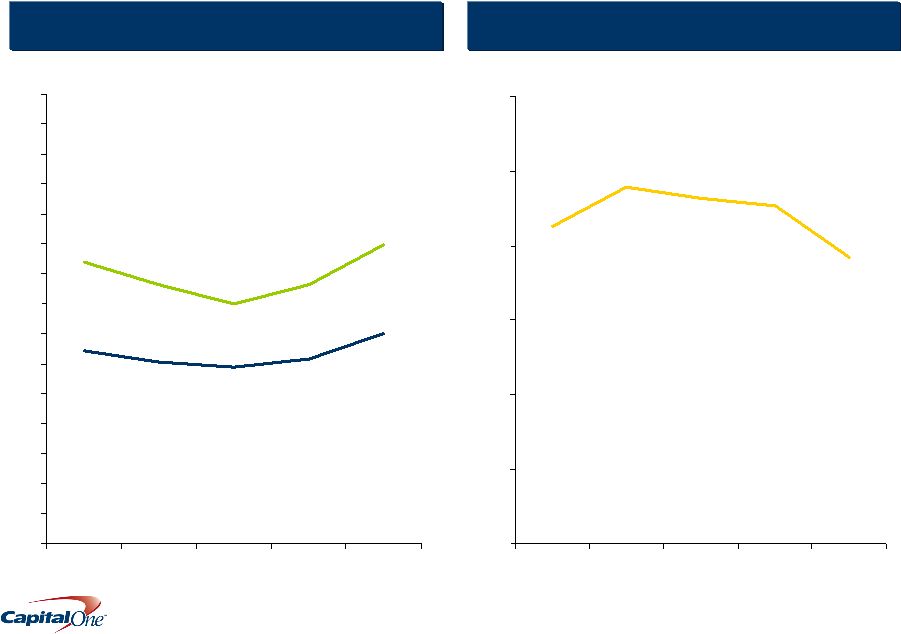 6 October 22, 2009 Margins as % of Managed Assets Efficiency Ratio Margins improved in the quarter Revenue Margin Net Interest Margin 9.38% 8.65% 7.99% 8.65% 9.96% 6.06% 5.87% 6.43% 6.17% 7.01% 0% 1% 2% 3% 4% 5% 6% 7% 8% 9% 10% 11% 12% 13% 14% 15% Q308 Q408 Q109 Q209 Q309 38.4% 45.3% 46.3% 47.9% 42.6% 0% 10% 20% 30% 40% 50% 60% Q308 Q408 Q109 Q209 Q309 |
 7 October 22, 2009 Our low risk investment portfolio continues to provide balance sheet flexibility $MM Treasuries/Agencies Agency MBS Non-Agency MBS ABS CMBS Other Total September 30, 2009 Book Value Net Unrealized Gain/(Loss) $ 839 39 26,998 678 2,882 (535) 6,206 155 - - 425 6 $37,350 $343 June 30, 2009 Book Value Net Unrealized Gain/(Loss) $ 892 38 26,414 547 3,263 (924) 5,900 97 1,054 (56) 443 (1) $37,966 $(299) |
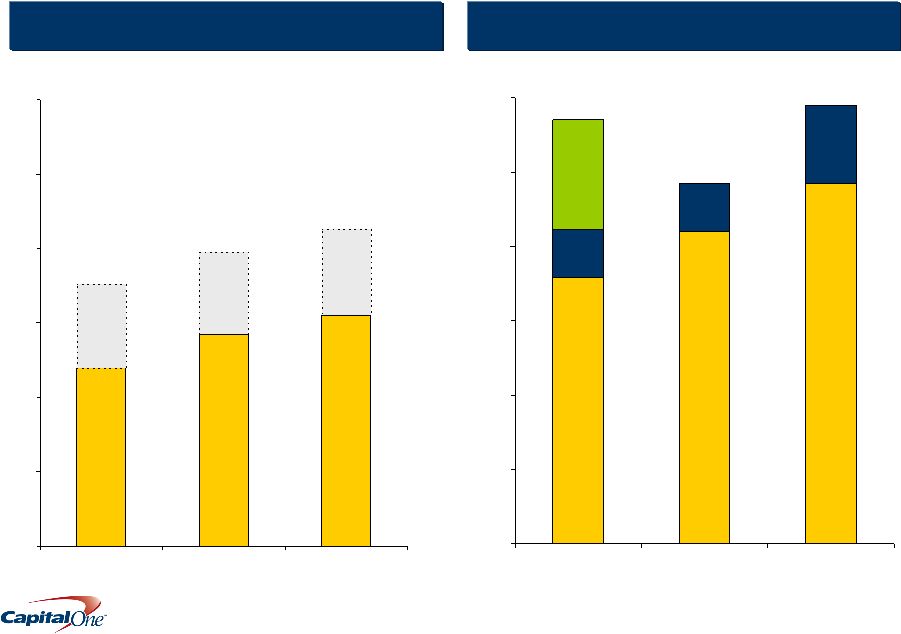 8 October 22, 2009 Tangible Common Equity + Allowance to Tangible Managed Assets Tier 1 Capital to Risk Weighted Assets 11.4% 9.7% 0% 2% 4% 6% 8% 10% 12% Q109 Q209 Q309 Our capacity to absorb risk continues to rise Other Tier 1 Common TARP 8.5% 0% 2% 4% 6% 8% 10% 12% Q109 Q209 Q309 4.8% 5.7% 6.2% Allowance TCE 7.0% 7.9% 8.5% 11.8% |
 9 October 22, 2009 Capital One delivered a profit from continuing operations of $469MM Net Income from Continuing Operations ($MM) Credit Card Domestic International SUBTOTAL Commercial Banking Consumer Banking Total Company Q209 $ 166.9 5.7 172.6 29.8 89.8 $ 230.2 Other (62.0) Q309 $ 289.7 2.0 291.7 (130.2) 184.6 $ 469.2 123.1 Q308 $ 344.2 12.3 356.5 72.1 33.2 $ 385.8 (76.0) |
 10 October 22, 2009 The Domestic Credit Card business continues to deliver profits, despite declining loan balances 15.09% 13.81% 14.46% 15.42% 16.76% 0% 5% 10% 15% 20% Q308 Q408 Q109 Q209 Q309 $61,892 $64,760 $67,015 $70,945 $69,362 $70,369 $73,399 $75,085 $79,665 $79,616 0 10 20 30 40 50 60 70 80 90 100 Q308 Q408 Q109 Q209 Q309 Int’l Domestic Domestic Loans Held for Investment Domestic Card Revenue Margin $MM |
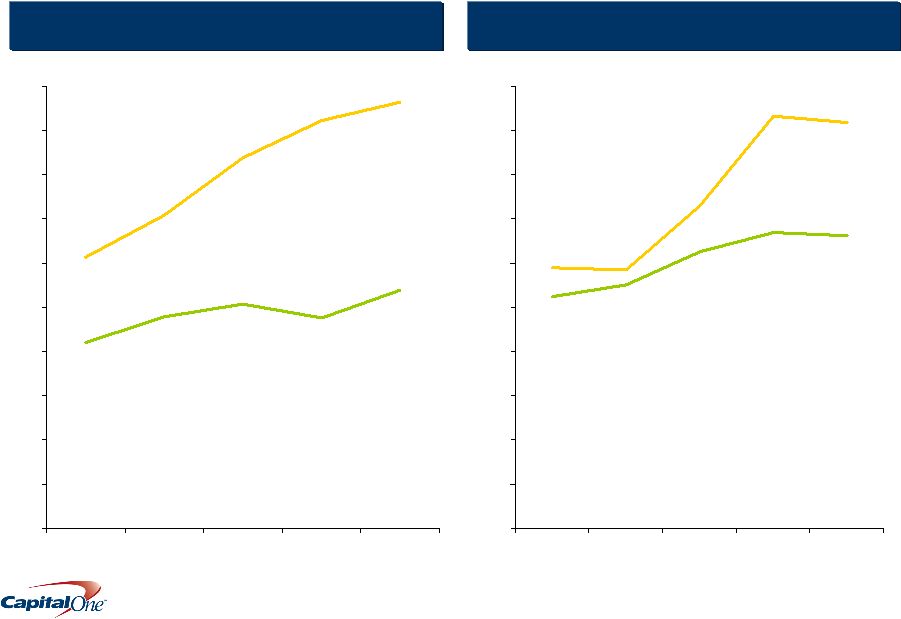 11 October 22, 2009 International Card experienced modest improvement in credit, while Domestic Card credit worsened 7.08% 8.39% 9.23% 6.13% 9.64% 4.78% 4.20% 5.08% 4.77% 5.38% 0% 1% 2% 3% 4% 5% 6% 7% 8% 9% 10% Q308 Q408 Q109 Q209 Q309 Managed Net Charge-off Rate Managed 30+ Delinquency Rate 5.84% 7.30% 9.32% 5.90% 9.19% 5.51% 5.24% 6.25% 6.69% 6.63% 0% 1% 2% 3% 4% 5% 6% 7% 8% 9% 10% Q308 Q408 Q109 Q209 Q309 Managed Net Charge-off Rate Managed 30+ Delinquency Rate Domestic Card Credit International Card Credit |
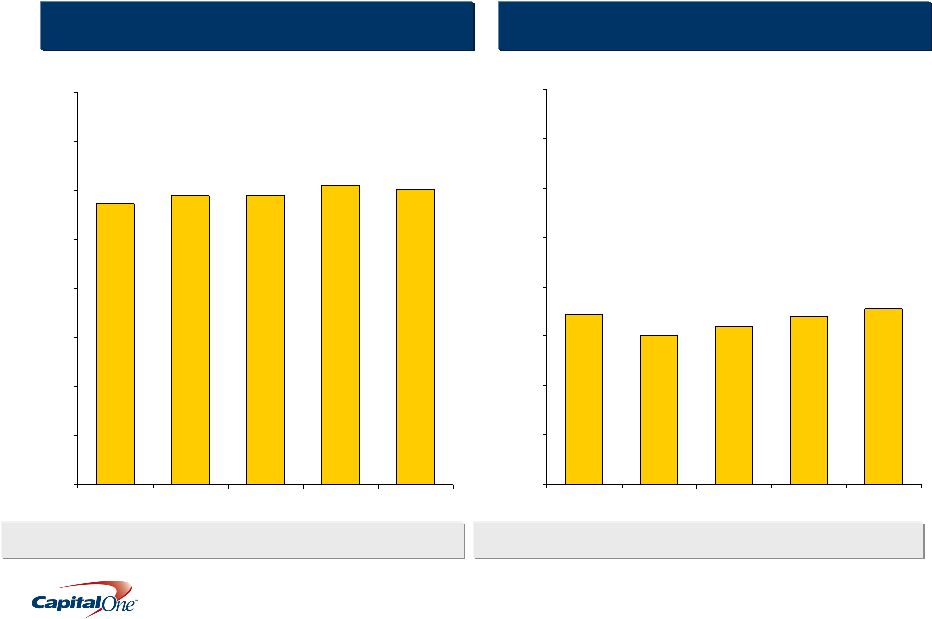 12 October 22, 2009 Commercial Banking loans declined modestly, while deposits grew 29,416 28,608 29,545 30,497 30,105 0 5,000 10,000 15,000 20,000 25,000 30,000 35,000 40,000 Q308 Q408 Q109 Q209 Q309 17,761 17,021 16,046 17,153 15,103 0 5,000 10,000 15,000 20,000 25,000 30,000 35,000 40,000 Q308 Q408 Q109 Q209 Q309 Loans Held for Investment Yield 5.82% 5.72% 4.92% 4.97% 5.01% Deposit Interest Expense Rate 1.75% 1.42% 0.92% 0.77% 0.75% Average Loans Held for Investment Average Deposits $MM $MM |
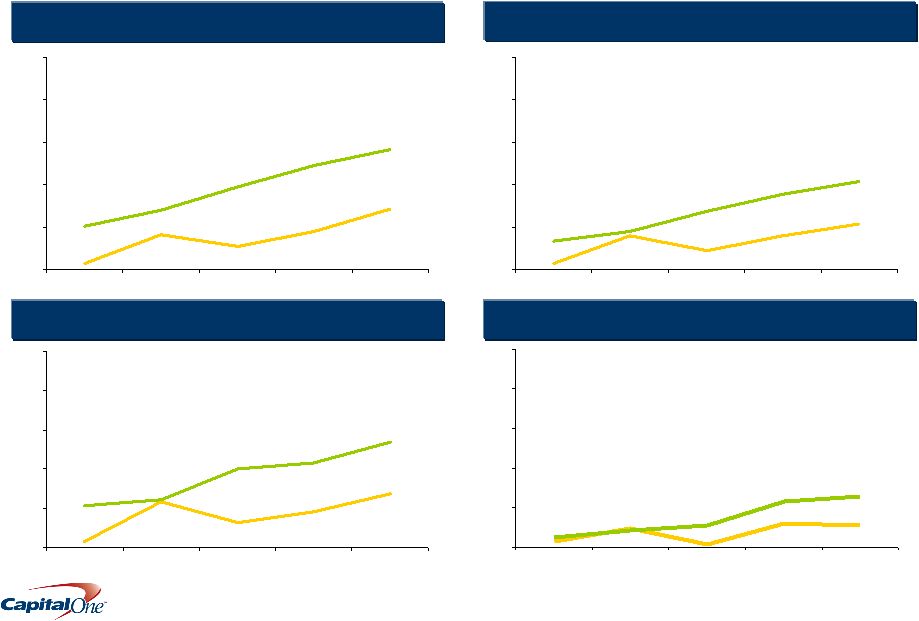 13 October 22, 2009 Continuing economic deterioration drove worsening credit trends and a significant allowance build in Commercial Banking 0.82% 0.56% 0.89% 0.16% 1.42% 1.41% 1.03% 1.95% 2.46% 2.83% 0% 1% 2% 3% 4% 5% Q308 Q408 Q109 Q209 Q309 Total Commercial Banking ($29.9 B) Non Performing Asset Rate Charge-off Rate Commercial & Multi Family ($13.9 B) 1.37% 2.68% 1.16% 0.92% 0.14% 0.63% 1.07% 1.21% 2.16% 2.00% 0% 1% 2% 3% 4% 5% Middle Market ($10.0 B) Q308 Q408 Q108 Q209 Q309 Q308 Q408 Q109 Q209 Q309 Non Performing Asset Rate Charge-off Rate 0.81% 0.45% 0.80% 0.16% 1.08% 0.89% 0.67% 1.37% 1.77% 2.08% 0% 1% 2% 3% 4% 5% Q308 Q408 Q109 Q209 Q309 Total Commercial Banking Excluding Small Ticket CRE ($27.5 B) 0.56% 0.15% 0.47% 0.58% 0.07% 1.26% 1.16% 0.57% 0.43% 0.26% 0% 1% 2% 3% 4% 5% Non Performing Asset Rate Charge-off Rate Non Performing Asset Rate Charge-off Rate |
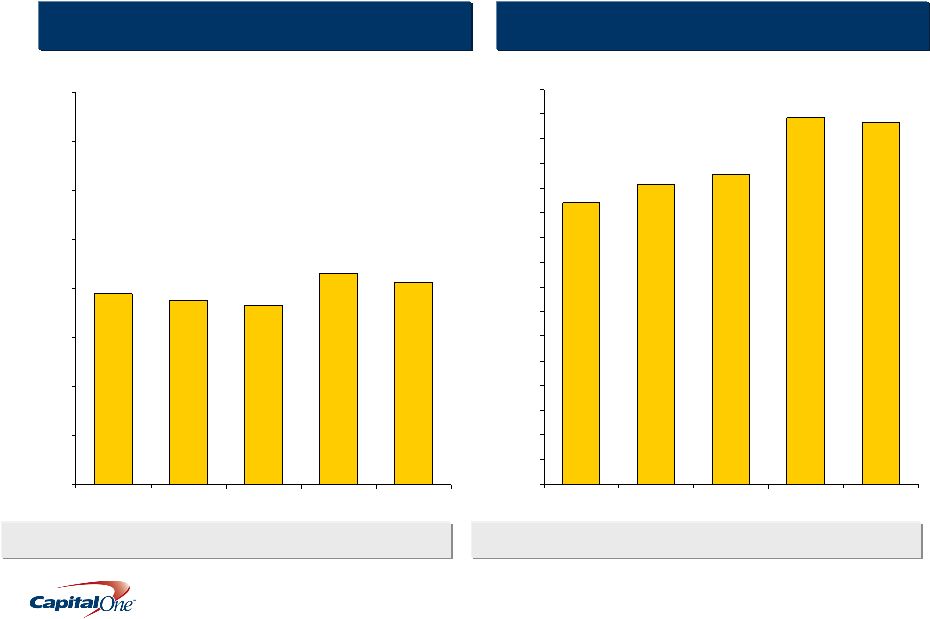 14 October 22, 2009 Consumer Banking delivered gains in revenue and profits, even as loans and deposits declined modestly 41,308 43,044 36,543 38,824 37,535 0 10,000 20,000 30,000 40,000 50,000 60,000 70,000 80,000 Q308 Q408 Q109 Q209 Q309 73,284 74,321 62,730 57,035 60,748 0 5,000 10,000 15,000 20,000 25,000 30,000 35,000 40,000 45,000 50,000 55,000 60,000 65,000 70,000 75,000 80,000 Q308 Q408 Q109 Q209 Q309 Loans Held for Investment Yield 9.19% 9.22% 9.09% 8.52% 9.50% Deposit Interest Expense Rate 2.39% 2.45% 2.04% 1.76% 1.58% Average Loans Held for Investment Average Deposits $MM $MM |
 15 October 22, 2009 The Mortgage Portfolio and the Auto Finance business were the key drivers of Consumer Banking credit results and profitability Managed Net Charge-off Rate Managed 30+ Delinquency Rate Mortgage Credit Auto Credit 0.45% 0.42% 0.46% 0.43% 0.68% 0.82% 1.57% 1.91% 0.97% 1.15% 0% 1% 2% 3% 4% 5% Q308 Q408 Q109 Q209 Q309 4.38% 4.99% 5.67% 3.65% 4.88% 9.52% 8.89% 7.48% 9.90% 9.31% 0% 1% 2% 3% 4% 5% 6% 7% 8% 9% 10% Q308 Q408 Q109 Q209 Q309 Managed Net Charge-off Rate Managed 30+ Delinquency Rate |
 |