 First Quarter 2010 Results April 22, 2010 Exhibit 99.2 |
2 April 22, 2010 Forward looking statements April 22, 2010, available on Capital One’s website at www.capitalone.com under “Investors”. Please note that the following materials containing information regarding Capital One’s financial performance speak only as of the particular date or dates indicated in these materials. Capital One does not undertake any obligation to update or revise any of the information contained herein whether as a result of new information, future events or otherwise. Certain statements in this presentation and other oral and written statements made by Capital One from time to time are forward-looking statements, including those that discuss, among other things, strategies, goals, outlook or other non-historical matters; projections, revenues, income, returns, earnings per share or other financial measures for Capital One; future financial and operating results; and Capital One’s plans, objectives, expectations and intentions; and the assumptions that underlie these matters. To the extent that any such information is forward-looking, it is intended to fit within the safe harbor for forward- looking information provided by the Private Securities Litigation Reform Act of 1995. Numerous factors could cause our actual results to differ materially from those described in such forward-looking statements, including, among other things: general economic and business conditions in the U.S., the UK, or Capital One’s local markets, including conditions affecting employment levels, interest rates, consumer income and confidence, spending and savings that may affect consumer bankruptcies, defaults, charge-offs and deposit activity; an increase or decrease in credit losses (including increases due to a worsening of general economic conditions in the credit environment); financial, legal, regulatory, tax or accounting changes or actions, including with respect to any litigation matter involving Capital One; increases or decreases in interest rates; the success of Capital One’s marketing efforts in attracting and retaining customers; the ability of the company to continue to securitize its credit cards and consumer loans and to otherwise access the capital markets at attractive rates and terms to capitalize and fund its operations and future growth; with respect to financial and other products, increases or decreases in Capital One’s aggregate loan balances and/or the number of customers and the growth rate and composition thereof, including increases or decreases resulting from factors such as a shifting product mix, the amount of actual marketing expenses made by Capital One and attrition of loan balances; the amount and rate of deposit growth; Capital One’s ability to control costs; changes in the reputation of or expectations regarding the financial services industry and/or Capital One with respect to practices, products or financial condition; any significant disruption in Capital One’s operations or technology platform; Capital One’s ability to maintain a compliance infrastructure suitable for its size and complexity; the amount of, and rate of growth in, Capital One’s expenses as Capital One’s business develops or changes or as it expands into new market areas; Capital One’s ability to execute on its strategic and operational plans; any significant disruption of, or loss of public confidence in, the United States Mail service affecting our response rates and consumer payments; Capital One’s ability to recruit and retain experienced personnel to assist in the management and operations of new products and services; changes in the labor and employment markets; the risk that cost savings and any other synergies from Capital One’s acquisitions may not be fully realized or may take longer to realize than expected; disruptions from Capital One’s acquisitions negatively impacting Capital One’s ability to maintain relationships with customers, employees or suppliers; competition from providers of products and services that compete with Capital One’s businesses; and other risk factors listed from time to time in reports that Capital One files with the Securities and Exchange Commission (the “SEC”), including, but not limited to, the Annual Report on Form 10-K for the year ended December 31, 2009. You should carefully consider the factors discussed above in evaluating these forward-looking statements. All information in these slides is based on the consolidated results of Capital One Financial Corporation, unless otherwise noted. A reconciliation of any non-GAAP financial measures included in this presentation can be found in Capital One’s most recent Form 10-K concerning annual financial results and in our most recent Form 8-K filed |
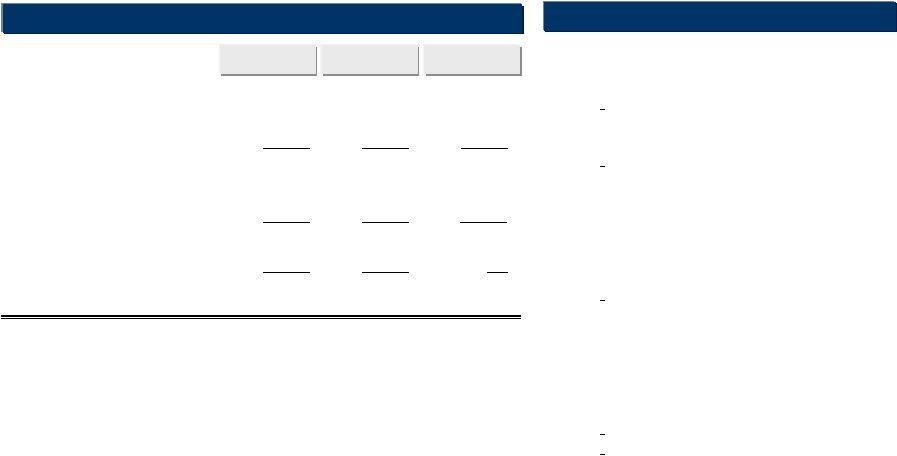
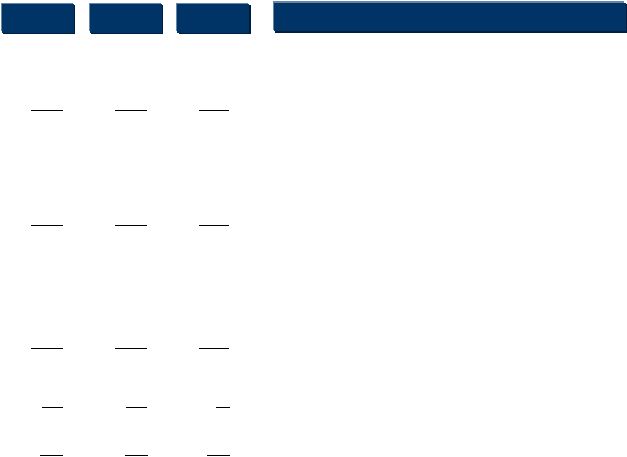 3 April 22, 2010 Net Interest Income Non Interest Income Revenue Marketing Expense Operating Expense Non-Interest Expense Pre-Provision Earnings (before tax) Net Charge-offs Other Allowance Build (Release) Provision Expense Discontinued Operations, net of tax Total Company (after tax) EPS Available to Common Shareholders Tax Expense Change Q110 Pretax Income $MM 3,170 1,199 4,369 188 1,760 1,948 2,421 2,188 45 (386) 1,847 376 404 (28) $0.83 574 170 Q409 Operating Earnings (after tax) 3,228 1,062 4,290 181 1,667 1,848 2,442 2,018 26 (566) 1,478 636 720 (83) $1.40 964 244 58 (137) (79) (7) (93) (100) 21 (170) (19) (180) (369) 260 316 (55) $0.57 390 74 Quarterly earnings were up $260MM to $636MM, or $1.40 per share Highlights • Pre-provision earnings up $21MM, or 1%, as modest decline in revenue more than offset by decline in non-interest expense – Revenue declined $79MM, or 1.8%, despite a 2.9% decline in average loans o Lower cost of funds o Improved collectability of finance charges and fees – Non-Interest expenses down $100MM • Provision expense declined $369MM driven by lower charge-offs and allowance release – Allowance build of $4.3B on January 1 through retained earnings per FAS 167 • Other Items: $MM Net Gain on Securities 65 Mortgage I/O Bond Sale 127 Tax Settlement 50 Rep & Warranty (224) |
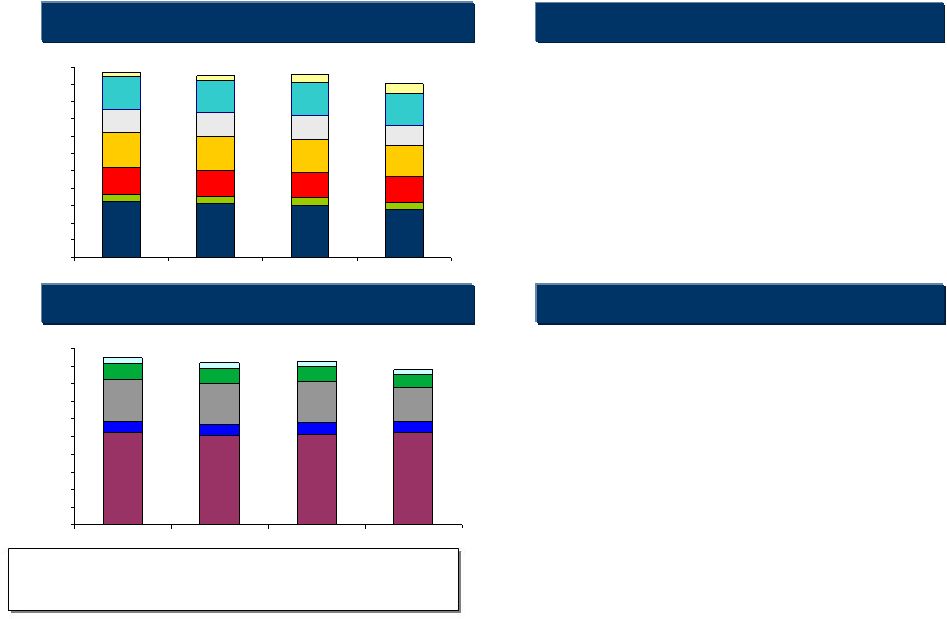 4 April 22, 2010 Loan balances fell in line with expectations as deposits continue to drive lower funding costs End of Period Assets 1 End of Period Liabilities 1 Liability Highlights Asset Highlights – Loans down $6.7B or 4.9% driven by • $2.0B of charge-offs • $1.9B of run-off in Installment Lending (Domestic Card) and Mortgage (Consumer Banking) • Seasonal decline in card balances • Slower pace of decline in auto loans – Cost of funds decreased to 1.76% in first quarter from 1.93% in Q409 and 2.45% in Q109 – Continue to leverage the flexibility of our Commercial and Consumer Banking platforms – Steep decline in securitization liability as a result of pay-down of securitization conduits and scheduled maturities 64.8 61.9 60.3 8.6 8.5 8.2 30.2 29.8 29.6 41.8 40.1 38.2 25.7 26.9 27.7 37.8 37.8 38.9 56.2 7.6 29.6 36.4 21.8 38.3 10.8 5.3 4.7 9.2 0 20 40 60 80 100 120 140 160 180 200 220 Q209 Q309 Q409 Q110 Domestic Card Commercial Int’l Card Consumer $B Other Cash & Cash Equivalents Securities 1 Managed portfolio data Q2-Q409 Securitization Interest Bearing Deposits Other Borrowings Non-Interest Bearing Deposits Other Liabilities $B 104.1 101.8 102.4 104.0 13.4 13.8 47.5 45.9 46.7 38.0 18.1 16.7 17.1 14.8 6.4 5.5 12.6 12.7 6.6 6.0 0 20 40 60 80 100 120 140 160 180 200 Q209 Q309 Q409 Q110 Cost of Interest Bearing Liabilities 2.40% 2.28% 2.16% 1.96% Total Cost of Funds 2.16% 2.05% 1.93% 1.76% |
 5 April 22, 2010 FAS 167 12/31/2009 Adjustments 1/1/2010 Assets: Cash and cash equivalents 8.7 4.0 12.7 Loans held for investment 90.6 47.6 138.2 Less: Allowance for loan and lease losses (4.1) (4.3) (8.4) Net loans held for investment 86.5 43.3 129.8 Accounts receivable from securitizations 7.6 (7.5) 0.1 Other 66.8 2.1 68.9 Total assets 169.6 41.9 211.5 Liabilities: Securitization liability 4.0 44.3 48.3 Other liabilities 139.1 0.5 139.6 Total liabilities 143.1 44.8 187.9 Stockholders' Equity: 26.5 (2.9) 23.6 Total liabilities and stockholders' equity 169.6 41.9 211.5 $B Impacts from Consolidation on Reported Balance Sheet |
 6 April 22, 2010 Allowance to loans ratio increased to 6% in Q1 2010 as a result of the consolidation of $48B of credit card loans Allowance Balance Allowance as % of Reported 30+ Delinquencies Commercial Lending Allowance as % of Non-Performing Loans Allowance as % of Loans Q4 '09 Jan 1 2010 Q1 '10 Build/(Release) Credit Card Domestic 1,927 $ 5,590 $ 5,162 $ (428) $ International 199 727 612 (115) $ Total Credit Card 2,126 $ 6,317 $ 5,774 $ (543) $ Consumer Banking Auto 665 $ 665 $ 523 $ (142) $ Other Consumer Banking 411 484 412 1 $ Total Consumer Banking 1,076 $ 1,149 $ 935 $ (141) $ Commercial Banking 785 $ 785 $ 915 $ 130 $ Other 140 $ 140 $ 128 $ (12) $ Total Allowance 4,127 $ 8,391 $ 7,752 $ (566) $ $MM 1 1 $73MM Q110 reduction in ALLL associated with deconsolidation upon mortgage I/O sale recorded in non-interest income 9.4% 9.7% 9.3% 3.2% 2.7% 1.2% 3.6% 3.4% 3.3% 0% 2% 4% 6% 8% 10% 12% Q109 Q209 Q309 Q409 Q110 Consumer Banking Credit Card Commercial Banking 185% 181% 200% 39% 36% 65% 135% 147% 142% 0% 40% 80% 120% 160% 200% 240% Q109 Q209 Q309 Q409 Q110 Domestic Card Int’l Card Auto Finance 112% 67% 122% 0% 50% 100% 150% 200% Q109 Q209 Q309 Q409 Q110 Commercial Total Company: 4.43% 4.44% 4.67% 4.55% 5.96% |
 7 April 22, 2010 Tier 1 Capital to Risk Weighted Assets 0% 2% 4% 6% 8% 10% 12% 14% Q209 Q309 Q409 Q409 Pro- Forma for FAS 167 Q110 Our capacity to absorb risk remains high Other Tier 1 Common 11.9% 13.8% 9.7% Tangible Common Equity + Allowance to Tangible Managed Assets 0% 2% 4% 6% 8% 10% 12% Q209 Q309 Q409 Q409 Pro- Forma for FAS 167 Q110 5.6% 6.3% Allowance TCE 4.8% 5.5% 6.2% 7.8% 8.4% 9.1% 9.7% 8.5% 9.9% 9.6% |
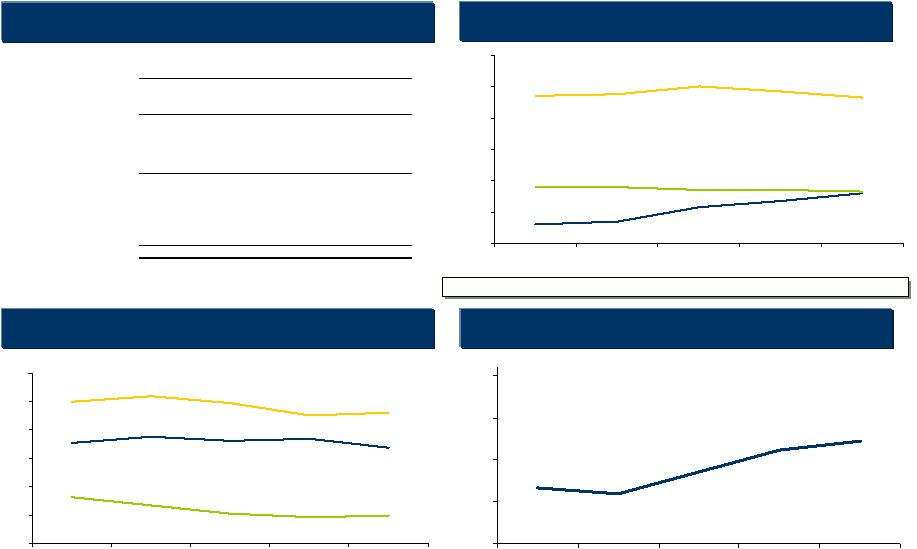
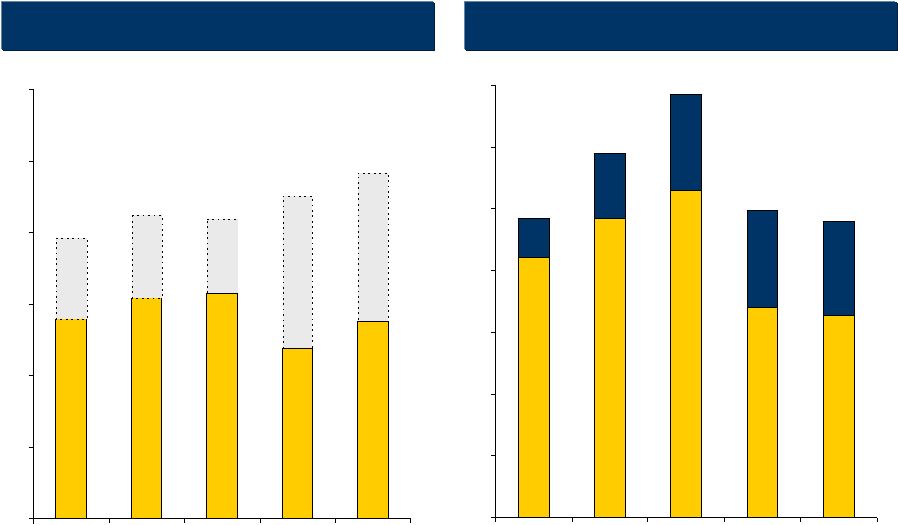
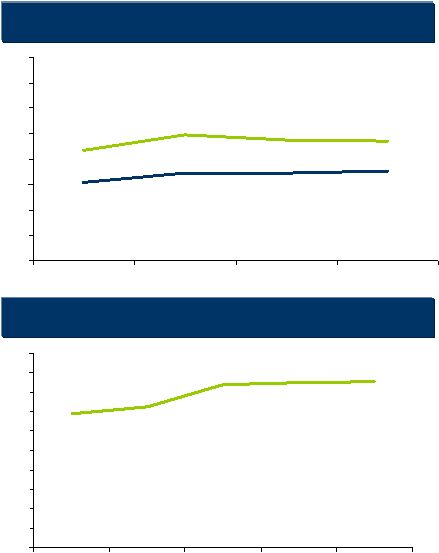 8 April 22, 2010 Margins as % of Managed Assets Domestic Card Revenue Margin 8.68% 9.87% 9.50% 9.43% 6.91% 6.90% 6.19% 7.10% 0% 2% 4% 6% 8% 10% 12% 14% 16% Q209 Q309 Q409 Q110 Lower funding costs and strong Domestic Card revenue margin drove stable to improving margins in the quarter Revenue Margin Net Interest Margin 13.81% 14.46% 16.76% 17.04% 17.10% 0% 2% 4% 6% 8% 10% 12% 14% 16% 18% 20% Q109 Q209 Q309 Q409 Q110 Funding costs improved 17 basis points • Mix shift from wholesale funding to bank deposits • Favorable mix shift within the deposit portfolio • Favorable interest rates and disciplined pricing Loan yields improved 3 basis points • Strong revenue margin in Domestic Card business Partially offset by: • Greater mix of investment securities vs. loans Revenue margin remained elevated in Q1 • Impact of better-then-expected credit, and strong loan yields Partially offset by: • Decline in overlimit fees in non-interest income • Expect quarterly Domestic Card revenue margin to decline to around 15% by early 2011 Revenue Margin |
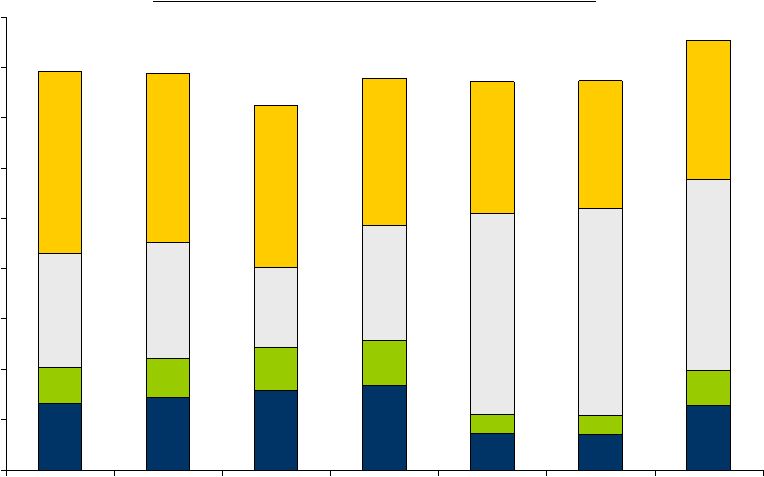 9 April 22, 2010 Our Domestic Card business has delivered solid “pre-provision” and bottom-line ROA Return on Managed Assets - Domestic Card 17.1% 15.5% 15.5% 15.6% 14.5% 15.7% 15.8% 0% 2% 4% 6% 8% 10% 12% 14% 16% 18% 2004 2005 2006 2007 2008 2009 Q1'10 Provision Taxes ROA Non-interest Expense Revenue Margin |
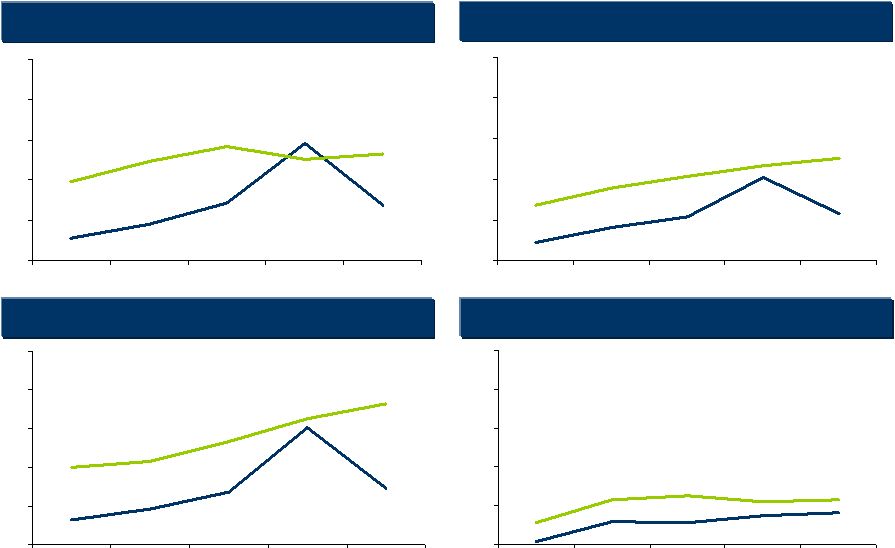
 10 April 22, 2010 The first quarter of 2010 is likely the peak of consumer credit charge-offs 10.48% 8.39% 9.59% 9.64% 9.23% 5.30% 5.78% 5.38% 5.08% 4.77% 0% 1% 2% 3% 4% 5% 6% 7% 8% 9% 10% 11% Q109 Q209 Q309 Q409 Q110 Domestic Credit Card ($58.1B*) Net Charge-off Rate 30+ Delinquency Rate Mortgage Credit ($15.4B*) 0.94% 0.43% 0.72% 0.45% 0.69% 0.93% 1.91% 0.97% 1.26% 1.17% 0% 1% 2% 3% 4% 5% Auto Credit($17.8B*) Q109 Q209 Q309 Q409 Q110 9.32% 9.19% 9.52% 7.30% 8.83% 6.69% 6.25% 6.63% 6.55% 6.39% 0% 1% 2% 3% 4% 5% 6% 7% 8% 9% 10% Q109 Q209 Q309 Q409 Q110 International Credit Card ($7.8B*) 2.97% 3.65% 4.55% 4.88% 4.38% 7.58% 7.48% 8.89% 10.03% 9.52% 0% 1% 2% 3% 4% 5% 6% 7% 8% 9% 10% 11% Q109 Q209 Q309 Q409 Q110 Net Charge-off Rate 30+ Delinquency Rate Net Charge-off Rate 30+ Delinquency Rate Net Charge-off Rate 30+ Delinquency Rate * Average assets for Q1 |
 11 April 22, 2010 Commercial Banking non-performing asset rates increased in the first quarter of 2010 1.37% 0.56% 2.91% 1.42% 0.89% 2.64% 2.52% 2.84% 1.95% 2.47% 0% 1% 2% 3% 4% 5% Q109 Q209 Q309 Q409 Q110 Total Commercial Banking ($29.7B*) Non Performing Asset Rate Charge-off Rate Commercial & Multi Family ($13.7B*) 1.45% 0.92% 3.02% 0.63% 1.37% 3.65% 2.00% 2.15% 3.25% 2.66% 0% 1% 2% 3% 4% 5% Middle Market ($10.3B*) Q109 Q209 Q309 Q409 Q110 Non Performing Asset Rate Charge-off Rate 0.80% 1.08% 2.04% 0.45% 1.14% 1.78% 1.37% 2.08% 2.33% 2.52% 0% 1% 2% 3% 4% 5% Q109 Q209 Q309 Q409 Q110 Total Commercial Lending Excluding Small Ticket CRE ($27.6B*) Non Performing Asset Rate Charge-off Rate 0.82% 0.58% 0.75% 0.07% 0.56% 1.15% 0.57% 1.15% 1.09% 1.25% 0% 1% 2% 3% 4% 5% Q109 Q209 Q309 Q409 Q110 Non Performing Asset Rate Charge-off Rate * Period end assets for Q1 |
 12 April 22, 2010 • Delivered resilient profitability • Maintained strong balance sheet – Solid liquidity and growing deposits – Healthy coverage ratios and capital We remain well positioned to deliver significant shareholder value over the long term • Businesses with sustainable, above-hurdle returns • Positioned to grow as credit normalizes • Strong and resilient balance sheet • Lower pre-provision earnings into 2011 – Margins decline to more normal levels – Elevated charge-offs and runoff portfolios reduce loan balances – Marketing and infrastructure investments • Bottom line cushioned by lower provision expense – Improving charge-offs – Potential for significant allowance release Weathered the Storm Path to “Normalized” Earnings Delivering Long-Term Value |
 13 April 22, 2010 Appendix |
 14 April 22, 2010 Q1 2009 Q1 2010 Q4 2009 Domestic Card delivered another quarter of strong pre-provision earnings and net income Highlights Domestic Card • Revenues declined modestly from Q409, but were up modestly from Q109 Declining loan balances partially offset by modest increase in revenue margin in the quarter Redistribution between non-interest income and net interest income continued • Seasonal decline in non-interest expenses • Provision expense increased Peaking charge-off dollars partially offset by allowance release • Delinquency rate improved nearly 40 basis points from Q409 • Loans declined $4.1 billion in the quarter Charge-off dollars peaking ILs continue to run off • Purchase volumes declined seasonally, but were up modestly vs. Q109 Net interest income Non-interest income Total revenue Provision for loan and lease losses Non-interest expenses Income (loss) before taxes Income taxes (benefit) Net income (loss) Selected Metrics Period end loans held for investment Average loans held for investment Loans held for investment yield Revenue Margin Net charge-off rate 30+ day performing delinquency rate Purchase Volume 618,507 1,096,215 809,423 2,483,787 578,149 205,937 372,212 56,228,012 58,107,647 14.78% 17.10% 5.30% 21,987,661 1,865,280 10.48% 793,934 1,033,341 832,878 2,575,507 709,288 248,251 461,037 60,299,827 60,443,441 14.08% 17.04% 24,592,679 1,781,573 9.59% Earnings 5.78% 883,891 1,521,997 865,460 1,129 396 733 67,015,166 11.40% 13.81% 21,601,837 8.39% 5.08% 1,504,695 2,388,586 69,187,704 (in thousands) |
 15 April 22, 2010 Q1 2009 Q1 2010 Q4 2009 The International Card business posted increased net income as credit results and provision expense improved Highlights International Card • Revenues relatively stable compared to Q409, and up from Q109 • Seasonal decline in non-interest expenses • Significant improvement in provision expense, resulting from: { Significant pull backs and management actions in the UK and Canada { Stabilizing to improving economic conditions in the UK and Canada • Delinquency rate improved 16 basis points from Q409 • Loans declined $646 million in the quarter • Purchase volumes declined seasonally, but were up modestly vs. Q109 Net interest income Non-interest income Total revenue Provision for loan and lease losses Non-interest expenses Income (loss) before taxes Net income (loss) Selected Metrics Period end loans held for investment Average loans held for investment Loans held for investment yield Revenue Margin Net charge-off rate 30+ day performing delinquency rate Purchase Volume 100,125 79,002 104,629 347,920 164,289 46,916 117,373 7,578,110 7,814,411 15.65% 17.81% 6.39% 1,935,853 247,795 8.83% 103,072 171,352 109,550 350,720 69,818 20,931 48,887 8,223,835 8,299,895 15.19% 16.90% 2,272,819 247,648 9.52% Earnings 6.55% 101,590 160,789 123,192 4,602 2,006 2,596 8,069,961 12.41% 13.77% 1,871,723 7.30% 6.25% 186,993 288,583 8,382,679 (in thousands) Income taxes (benefit) |
 16 April 22, 2010 Q1 2009 Q1 2010 Q4 2009 Commercial Banking pre-provision earnings were relatively stable, with elevated credit costs driving a net loss in the quarter Highlights Commercial Banking • Revenues declined modestly from Q4 • Relatively stable loan balances, modest decline in loan yields • 13% sequential growth in average deposits, modest improvement in deposit expense rate • Provision expense declined from Q409, but remains elevated • Non-performing asset rate continued to increase Net interest income Non-interest income Total revenue Provision for loan and lease losses Non-interest expenses Income (loss) before taxes Net income (loss) Selected Metrics Period end loans held for investment Average loans held for investment Loans held for investment yield Period end deposits Average deposits Deposit interest expense rate Core deposit intangible amortization Net charge-off rate 42,375 238,209 192,420 353,776 (76,853) (27,375) (49,478) 29,612,138 29,722,674 5.03% 21,605,482 21,858,792 14,389 1.37% 311,401 0.72% 37,992 368,493 197,355 356,568 (209,280) (73,248) (136,032) 29,613,050 29,867,245 5.11% 20,480,297 19,420,005 2.91% 318,576 0.80% Earnings 13,847 41,214 117,304 141,805 27,564 9,647 17,917 29,431,097 4.92% 15,691,679 16,045,943 0.56% 0.92% 9,092 245,459 286,673 29,545,277 Non-performing loans as a % of loans HFI Non-performing asset rate 2.64% 2.48% 2.52% 2.37% 1.95% 1.85% (in thousands) Income taxes (benefit) |
 17 April 22, 2010 Q1 2009 Q1 2010 Q4 2009 Consumer Banking profits increased in the quarter, driven by strong deposit results and improving credit Highlights Consumer Banking • Revenue improvement from Q409 driven by sale of I/O bonds and deconsolidation of certain mortgage trusts • Significant improvement in provision expense, driven by Improving credit performance and outlook in Auto Finance business • Loans declined as a result of: Continuing impact of repositioning the Auto Finance business earlier in the recession Continuing run off of mortgage portfolio • Auto originations increased 32% from Q409, but down modestly from Q109 • Average deposit growth of $2.1 billion, or 3%, with disciplined pricing and improving interest expense rate Net interest income Non-interest income Total revenue Provision for loan and lease losses Non-interest expenses Income (loss) before taxes Net income (loss) Selected Metrics Period end loans held for investment Average loans held for investment Loans held for investment yield Auto loan originations Period end deposits Average deposits Deposit interest expense rate Core deposit intangible amortization 315,612 49,526 688,381 1,212,200 474,293 168,943 305,350 36,382,676 38,245,360 8.96% 1,343,463 76,883,450 1.27% 37,735 896,588 75,115,342 153,099 249,309 749,021 986,468 (11,862) (4,152) (7,710) 38,214,493 39,114,123 8.83% 1,018,125 74,144,805 39,974 833,369 72,975,666 Earnings 1.41% 163,257 268,233 579,724 38,954 13,634 25,320 35,942,632 9.43% 1,463,402 63,422,760 35,593 62,730,380 2.04% 723,654 886,911 36,543,097 Non-performing loans as a % of loans HFI Non-performing asset rate 1.75% 1.62% 1.60% 1.45% 1.16% 0.98% Net charge-off rate 2.03% 2.85% 3.30% 30+ day performing delinquency rate 4.13% 5.43% 5.01% Period end loans serviced for others 27,777,607 30,283,326 22,270,797 (in thousands) Income taxes (benefit) |
 |