 Fourth Quarter 2011 Results January 19, 2012 Exhibit 99.3 |
2 January 19, 2012 Forward-Looking Statements Please note that the following materials containing information regarding Capital One’s financial performance speak only as of the particular date or dates indicated in these materials. Capital One does not undertake any obligation to update or revise any of the information contained herein whether as a result of new information, future events or otherwise. Certain statements in this presentation and other oral and written statements made by Capital One from time to time are forward-looking statements, including those that discuss, among other things: strategies, goals, outlook or other non-historical matters; projections, revenues, income, returns, expenses, capital measures, accruals for claims in litigation and for other claims against Capital One, earnings per share or other financial measures for Capital One; future financial and operating results; Capital One’s plans, objectives, expectations and intentions; the projected impact and benefits of the pending transactions involving Capital One, HSBC and ING Direct (the “transactions”); and the assumptions that underlie these matters. To the extent that any such information is forward-looking, it is intended to fit within the safe harbor for forward-looking information provided by the Private Securities Litigation Reform Act of 1995. Numerous factors could cause Capital One’s actual results to differ materially from those described in such forward- looking statements, including, among other things: general economic and business conditions in the U.S., the U.K., Canada or Capital One’s local markets, including conditions affecting employment levels, interest rates, consumer income and confidence, spending and savings that may affect consumer bankruptcies, defaults, charge-offs and deposit activity; an increase or decrease in credit losses (including increases due to a worsening of general economic conditions in the credit environment); the possibility that regulatory and other approvals and conditions to either of the transactions are not obtained or satisfied on a timely basis or at all; the possibility that modifications to the terms of either of the transactions may be required in order to obtain or satisfy such approvals or conditions; the possibility that Capital One will not receive third-party consents necessary to fully realize the anticipated benefits of the transactions; the possibility that Capital One may not fully realize the projected cost savings and other projected benefits of the transactions; changes in the anticipated timing for closing either of the transactions; difficulties and delays in integrating the assets and businesses acquired in the transactions; business disruption during the pendency of or following the transactions; the inability to sustain revenue and earnings growth; diversion of management time on issues related to the transactions; reputational risks and the reaction of customers and counterparties to the transactions; disruptions relating to the transactions negatively impacting Capital One’s ability to maintain relationships with customers, employees and suppliers; changes in asset quality and credit risk as a result of the transactions; financial, legal, regulatory, tax or accounting changes or actions, including the impact of the Dodd-Frank Wall Street Reform and Consumer Protection Act and the regulations promulgated thereunder; developments, changes or actions relating to any litigation matter involving Capital One; increases or decreases in interest rates; Capital One’s ability to access the capital markets at attractive rates and terms to capitalize and fund its operations and future growth; the success of Capital One’s marketing efforts in attracting and retaining customers; increases or decreases in Capital One’s aggregate loan balances or the number of customers and the growth rate and composition thereof, including increases or decreases resulting from factors such as shifting product mix, amount of actual marketing expenses Capital One incurs and attrition of loan balances; the level of future repurchase or indemnification requests Capital One may receive, the actual future performance of mortgage loans relating to such requests, the success rates of claimants against Capital One, any developments in litigation and the actual recoveries Capital One may make on any collateral relating to claims against Capital One; the amount and rate of deposit growth; changes in the reputation of or expectations regarding the financial services industry or Capital One with respect to practices, products or financial condition; any significant disruption in Capital One’s operations or technology platform; Capital One’s ability to maintain a compliance infrastructure suitable for its size and complexity; Capital One’s ability to control costs; the amount of, and rate of growth in, Capital One’s expenses as its business develops or changes or as it expands into new market areas; Capital One’s ability to execute on its strategic and operational plans; any significant disruption of, or loss of public confidence in, the United States Mail service affecting Capital One’s response rates and consumer payments; Capital One’s ability to recruit and retain experienced personnel to assist in the management and operations of new products and services; changes in the labor and employment markets; fraud or misconduct by Capital One’s customers, employees or business partners; competition from providers of products and services that compete with Capital One’s businesses; and other risk factors set forth from time to time in reports that Capital One files with the Securities and Exchange Commission, including, but not limited to, the Annual Report on Form 10-K for the year ended December 31, 2010, and Exhibit 99.5 to the Current Report on Form 8-K filed on July 13, 2011. You should carefully consider the factors discussed above in evaluating these forward-looking statements. All information in these slides is based on the consolidated results of Capital One Financial Corporation, unless otherwise noted. A reconciliation of any non-GAAP financial measures included in this presentation can be found in Capital One’s most recent Current Report on Form 8-K filed January 19, 2012, available on Capital One’s website at www.capitalone.com under “Investors.” |
3 January 19, 2012 Fourth Quarter and Full Year 2011 Highlights • Q4 2011 net income was $407MM or $0.88 per share – 5% loan growth over Q311 – Slightly lower revenue due to impact of UK reserve and the absence of Q311 FCFR release – Higher non-interest expense driven by increased marketing & operating expenses, including litigation reserves – Higher provision expense driven by seasonally higher charge-offs and stabilizing allowance • Full year 2011 net income was $3.1B or $6.80 per share – Strong and stable revenue margins – Increased marketing & operating expenses – Significant credit improvement, now stabilizing at strong levels – Return to loan growth – Deposit growth with disciplined pricing – Enhanced balance sheet strength, Tier 1 Common Ratio near 10% |
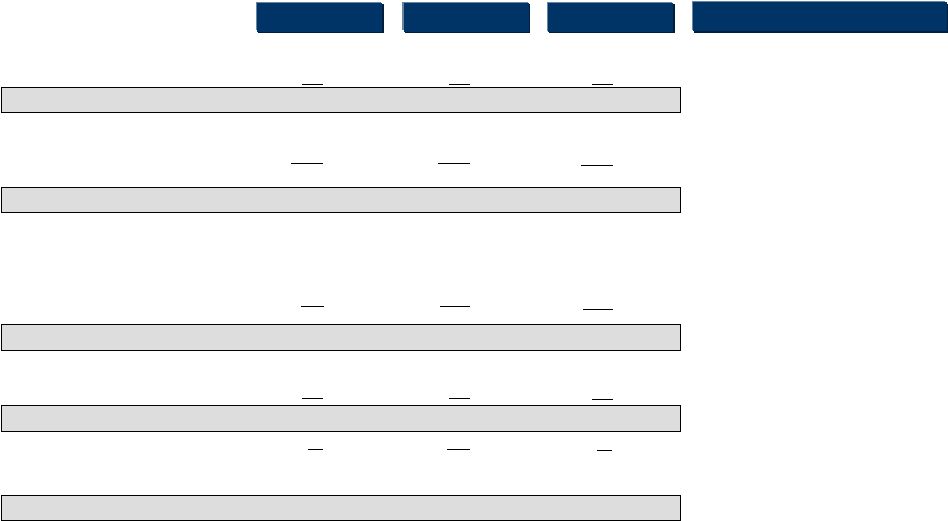 4 January 19, 2012 Fourth Quarter 2011 earnings were $407MM, or $0.88 per share, compared with $813MM, or $1.77 per share, in Third Quarter 2011 Highlights • Revenue negatively impacted by absence of Q311 FCFR release of $83MM and by UK PPI Reserve ($81MM) in Q411 • OpEx increase includes $90MM of litigation related expenses and accelerated infrastructure build • Provision expense increased with seasonally higher charge-offs and smaller allowance release Net interest income Non-interest income Revenue Marketing expense Operating expense Pre-Provision Earnings (before tax) Net charge-offs Other Allowance build (release) Provision Expense Discontinued operations, net of tax Total company (after tax) EPS Tax expense Pretax income $MM Operating Earnings (after tax) Non-Interest Expense 3,182 868 4,050 420 2,198 2,618 1,432 884 7 (30) 861 407 411 (4) $0.88 571 160 Q411 3,283 871 4,154 312 1,985 2,297 1,857 812 18 (208) 622 813 865 (52) $1.77 1,235 370 Q311 3,023 939 3,962 308 1,783 2,091 1,871 1,394 (14) (547) 839 697 701 (4) $1.52 1,032 331 Q410 |
 5 January 19, 2012 Loan balances increased and net interest margin was stable in the fourth quarter Average Balances & Margin Highlights Average Yield/ Average Yield/ (Dollars in millions) Balance Rate Balance Rate Loans held for investment $ 131,581 10.46 % 129,043 $ 11.00 % Investment securities 39,005 2.50 37,189 2.84 Cash equivalents and other 5,681 1.20 11,478 0.73 Total interest-earning assets $ 176,267 8.40 % 177,710 $ 8.63 % Interest-bearing liabilities: Total interest-bearing deposits $ 109,914 0.96 % 110,750 $ 1.06 % Securitized debt obligations 16,780 1.91 18,478 1.93 Senior and subordinated notes 3.48 10,519 3.19 Other borrowings 4.41 8,369 4.06 Total interest-bearing liabilities $ 1.43 % 148,116 $ 1.49 % Impact of non-interest bearing funding 0.25 % 0.25 % Net interest margin 7.22 % 7.39 % Quarter Ended 12/31/11 Quarter Ended 09/30/11 10,237 7,794 144,725 |
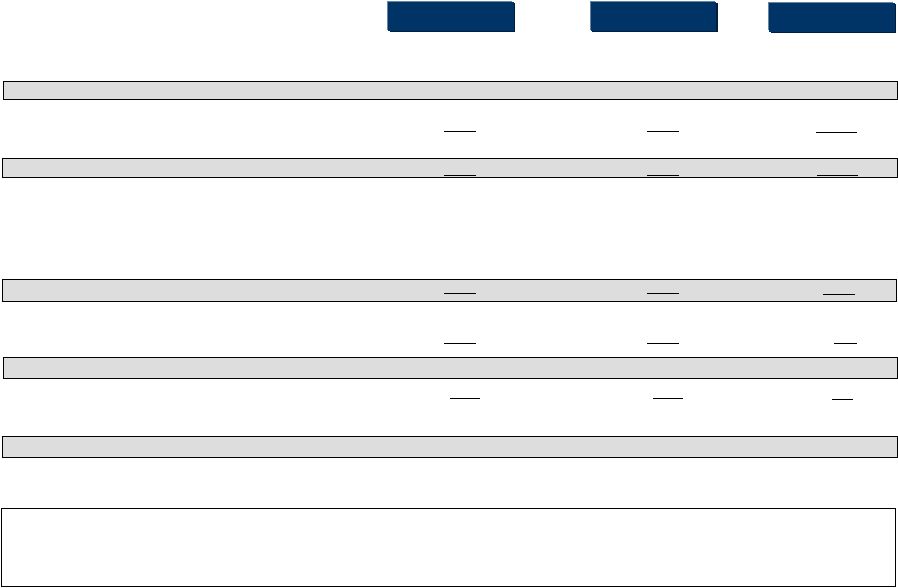 6 January 19, 2012 Full year 2011 earnings were $3,147MM, or $6.80 per share, compared with $2,743MM, or $6.01 per share, in full year 2010 Net interest income Non-interest income Revenue Marketing expense Operating expense Non-Interest Expense Pre-Provision Earnings (before tax) Net charge-offs Other Allowance build (release) Provision Expense Discontinued operations, net of tax Total Company (after tax) EPS Tax expense Pretax income $MM Operating Earnings (after tax) Average Loans Held For Investment Revenue Margin Net Interest Margin 2010 12,457 3,714 16,171 958 6,976 7,934 8,237 6,651 72 (2,816) 3,907 2,743 3,050 (307) $6.01 4,330 1,280 $ 128,526 9.20% 7.09% Fav/(Unfav) ($) 284 (176) 108 (379) (1,019) (1,398) (1,290) 2,879 106 (1,438) 1,547 404 203 201 $0.79 257 $ (102) 8 bps 18bps 2011 12,741 3,538 16,279 1,337 7,995 9,332 6,947 3,772 (34) (1,378) 2,360 3,147 3,253 (106) $6.80 4,587 1,334 $ 128,424 9.28% 7.27% Period-end Loans Held For Investment $ 125,947 $ 9,945 $ 135,892 (54) |
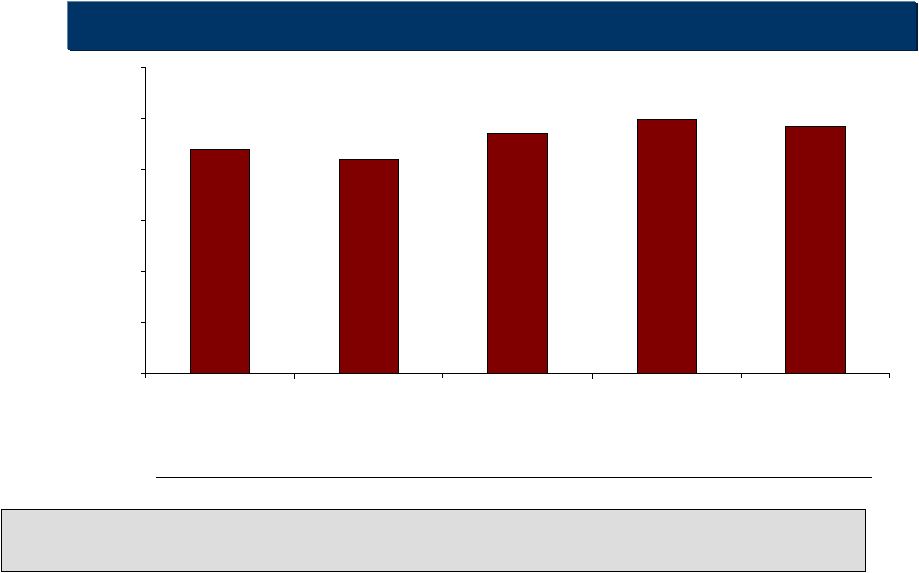 7 January 19, 2012 Our capital position remains strong Tier 1 Common Equity to Risk-Weighted Assets (Basel I) Disallowed DTA RWA EOP Loans (1.2) 127 126 (1.4) 142 124 Tier 1 Common excluding disallowed DTA ($B) 12.4 13.4 Tier 1 Common 11.2 12.0 (0.6) 146 129 14.3 13.7 (0.2) 149 130 15.1 14.9 2 (0.5) 155 15.6 15.1 2 136 1 1 Tier 1 Common Equity ratio is a non-GAAP measure calculated based on Tier 1 common equity divided by risk-weighted assets. See "Exhibit 99.2—Table 12: Reconciliation of Non-GAAP Measures and Calculation of Regulatory Capital Measures" for the calculation of this ratio. 2 Tier 1 Common Equity ratio as of the quarter end does not reflect any impact from the equity forward sale agreements executed in July 2011 which have not been settled in whole or in part. 8.8% 8.4% 9.4% 10.0% 9.7% 0% 2% 4% 6% 8% 10% 12% Q410 Q111 Q211 Q311 Q411 |
 8 January 19, 2012 Loan balances grew across all business segments in the fourth quarter and the full year Credit Card 13,396 13,543 14,035 14,389 15,410 10,484 10,758 11,404 11,924 12,684 4,020 3,936 4,122 4,221 4,404 1,842 1,780 1,642 1,571 1,503 0 5 10 15 20 25 30 35 40 Q410 Q111 Q211 Q311 Q411 Commercial Banking Consumer Banking Comm’l & Multi-Family Middle Market 49,970 47,298 51,234 51,510 54,682 7,522 8,735 8,711 8,210 8,466 3,879 3,272 2,760 2,310 1,927 0 10 20 30 40 50 60 70 80 Q410 Q111 Q211 Q311 Q411 Revolving Domestic Card International 17,867 18,342 19,223 20,422 21,779 12,103 11,741 11,323 10,916 10,433 4,413 4,223 4,046 4,014 4,103 0 5 10 15 20 25 30 35 40 45 50 Q410 Q111 Q211 Q311 Q411 Home Loans Retail Banking Auto Specialty Lending Small Ticket CRE $M $M $M Installment loans |
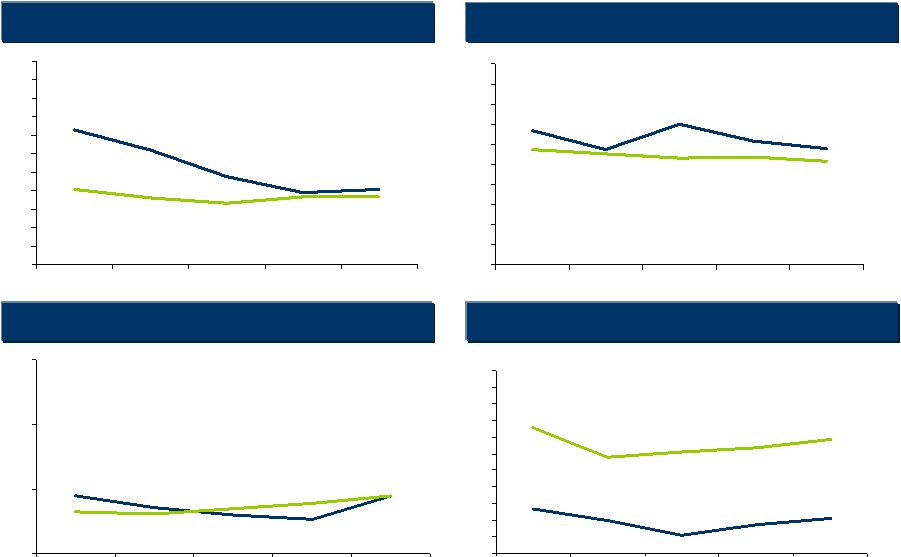 9 January 19, 2012 Consumer credit is exhibiting expected seasonal patterns 4.07% 7.28% 3.92% 4.74% 6.20% 3.66% 3.65% 3.33% 4.09% 3.59% 0% 1% 2% 3% 4% 5% 6% 7% 8% 9% 10% 11% Q410 Q111 Q211 Q311 Q411 Domestic Credit Card ($54.4B*) Net Charge-off Rate 30+ Day Delinquency Rate Home Loan ($10.7B*) 0.90% 0.71% 0.53% 0.89% 0.60% 0.89% 0.64% 0.61% 0.78% 0.70% 0% 1% 2% 3% Q410 Q111 Q211 Q311 Q411 Auto ($21.1B*) 5.74% 7.02% 6.15% 6.68% 5.77% 5.55% 5.75% 5.30% 5.35% 5.18% 0% 1% 2% 3% 4% 5% 6% 7% 8% 9% 10% Q410 Q111 Q211 Q311 Q411 International Credit Card ($8.4B*) 2.07% 1.98% 1.69% 2.65% 1.11% 6.88% 7.58% 5.79% 6.34% 6.09% 0% 1% 2% 3% 4% 5% 6% 7% 8% 9% 10% 11% Q410 Q111 Q211 Q311 Q411 Net Charge-off Rate 30+ Day Delinquency Rate Net Charge-off Rate 30+ Day Performing Delinquency Rate Net Charge-off Rate 30+ Day Performing Delinquency Rate * Average Loans for Q4 2011 |
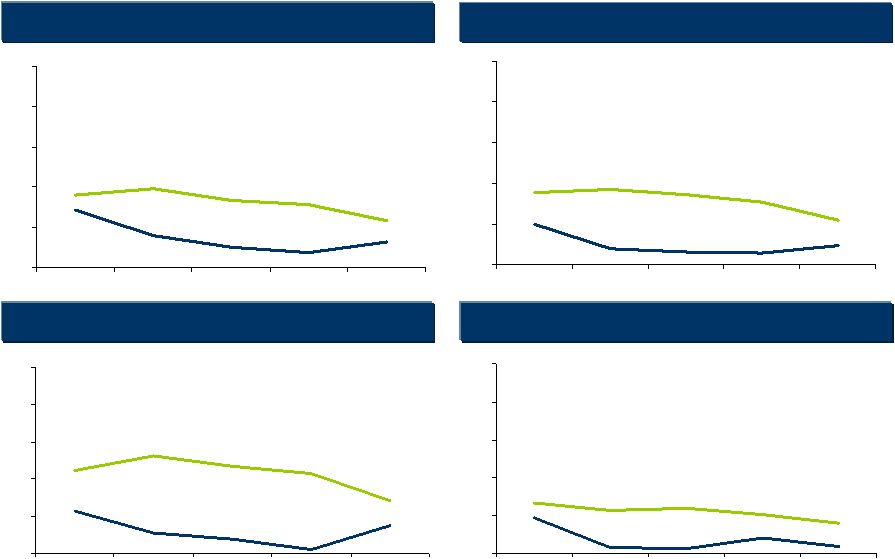 10 January 19, 2012 Commercial Banking credit metrics have stabilized and improved over the last five quarters * Average Loans for Q4 2011 0.79% 0.50% 0.37% 1.43% 0.63% 1.95% 1.80% 1.66% 1.55% 1.17% 0% 1% 2% 3% 4% 5% Q410 Q111 Q211 Q311 Q411 Total Commercial Banking ($32.6B*) Nonperforming Asset Rate Charge-off Rate Commercial & Multi-Family Real Estate ($14.6B*) 0.76% 0.56% 0.12% 1.15% 0.39% 1.43% 2.23% 2.63% 2.16% 2.35% 0% 1% 2% 3% 4% 5% Q410 Q111 Q211 Q311 Q411 Middle Market ($12.1B*) Nonperforming Asset Rate Charge-off Rate 0.38% 0.30% 0.28% 1.00% 0.47% 1.86% 1.76% 1.71% 1.54% 1.10% 0% 1% 2% 3% 4% 5% Q410 Q111 Q211 Q311 Q411 Total Commercial Lending Excluding Small Ticket CRE ($31.0B*) Nonperforming Asset Rate Charge-off Rate 0.20% 0.18% 0.41% 0.94% 0.13% 0.82% 1.33% 1.14% 1.04% 1.19% 0% 1% 2% 3% 4% 5% Q410 Q111 Q211 Q311 Q411 Nonperforming Asset Rate Charge-off Rate |
 We are in a strong position to deliver sustained shareholder value Outlook 2011 Results • Strong and stable margins and revenue • Significant credit improvement offset growth in non-interest expense – Invested in infrastructure – Prepared for acquisitions – “Primed the pump” for growth • Returned to loan growth • Deposit growth with improving interest expense rate • Expect acquisitions will have significant impacts on reported results, especially in 2012 – Purchase accounting impacts – Integration expenses – Partial-year results • Expect continuing strength in underlying businesses • Positioned to deliver sustained shareholder value – Growth potential (off a larger base) – Strong returns and capital generation – Strong balance sheet and financial resilience 11 |
 |