UNITED STATES
SECURITIES AND EXCHANGE COMMISSION
Washington, D.C. 20549
FORM 10-K
[X] ANNUAL REPORT PURSUANT TO SECTION 13 OR 15(d) OF
THE SECURITIES EXCHANGE ACT OF 1934
For The Fiscal Year EndedDECEMBER 31, 2006
Commission File Number000-23377
INTERVEST BANCSHARES CORPORATION
(Exact name of registrant as specified in its charter)
| | | | | | | | |
| | Delaware | | | | 13-3699013 | | |
| | (State or other jurisdiction of incorporation) | | | | (I.R.S. Employer Identification No.) | | |
| | | | |
| | One Rockefeller Plaza, Suite 400 | | |
| | New York, New York 10020-2002 | | |
| | (Address of principal executive offices including Zip Code) | | |
| | | | |
| | (212) 218-2800 | | |
| | (Registrant’s telephone number, including area code) | | |
Securities registered pursuant to Section 12(b) of the Securities Exchange Act of 1934
| | | | |
| | Class A Common Stock, par value $1.00 per share | | |
| | (Title of class) | | |
Securities registered pursuant to Section 12(g) of the Securities Exchange Act of 1934
Indicate by check mark if the registrant is a well-known seasoned issuer, as defined in Rule 405 of the Securities Act:
Yes NoXX.
Indicate by check mark if the registrant is not required to file reports pursuant to Section 13 or 15(d) of the Act: Yes NoXX
Indicate by check mark whether the registrant: (1) has filed all reports required to be filed by Section 13 or 15(d) of the Securities Exchange Act of 1934 during the preceding 12 months (or for such shorter period that the registrant was required to file such reports), and (2) has been subject to such filing requirements for the past 90 days: YesXX No .
Indicate by check mark if disclosure of delinquent filers pursuant to Item 405 of Regulation S-K is not contained herein, and will not be contained, to the best of the Registrant’s knowledge, in definitive proxy or information statements incorporated by reference in Part III of this Form 10-K or any amendments to this Form 10-K.XX
Indicate by check mark whether the registrant is a large accelerated filer, an accelerated filer, or a nonaccelerated filer (as defined in Rule 12b-2 of the Exchange Act). Check one:
Large Accelerated Filer Accelerated FilerXX Nonaccelerated Filer
Indicate by check mark whether the registrant is a shell company (as defined in Rule 12b-2 of the Exchange Act): Yes NoXX.
The aggregate market value of 4,965,408 shares of the Registrant’s Class A common stock on the close of business June 30, 2006, which excludes 2,498,497 shares held by affiliates as a group, was $201,099,024. This value is based on the average bid and asked price of $40.50 per share on June 30, 2006 of the Class A common stock on the NASDAQ. All of the Class B common stock is held by affiliates.
On the close of business on January 31, 2007, there were 7,988,791 shares of the Registrant’s Class A common stock and 385,000 shares of its Class B common stock issued and outstanding.
DOCUMENTS INCORPORATED BY REFERENCE
|
Portions of the Proxy Statement for the 2007 Annual Meeting of Stockholders to be held in May 2007 are incorporated by reference into Part II and III of this Form 10-K. |
Intervest Bancshares Corporation and Subsidiaries
2006 ANNUAL REPORT ON FORM 10-K
TABLE OF CONTENTS
1
PART I
The disclosures and discussions set forth in this report on Form 10-K are qualified by the paragraph captioned “Private Securities Litigation Reform Act Safe Harbor Statement” in “Item 1 Business,” and by “Item 1A Risk Factors.”
Item 1. Business
General
Intervest Bancshares Corporation
Intervest Bancshares Corporation (the “Holding Company”) is a registered financial holding company incorporated in 1993 under the laws of the State of Delaware. The Holding Company’s Class A common stock is listed for trading on the Nasdaq Global Select Market under the symbol “IBCA.” There is no public-trading market for the Holding Company’s Class B common stock.
The Holding Company is the parent company of Intervest National Bank (the “Bank”) and Intervest Mortgage Corporation, hereafter referred to collectively as the “Company” on a consolidated basis. The Holding Company owns 100% of the outstanding capital stock of each of these entities. The Holding Company also owns 100% of the outstanding capital stock of Intervest Statutory Trust II, III, IV and V, all of which are unconsolidated entities for financial statement purposes as required by Financial Accounting Standards Board (FASB) Interpretation No. 46-R, “Consolidation of Variable Interest Entities.”
The offices of the Holding Company and Intervest Mortgage Corporation and the Bank’s headquarters and full-service banking office are located on the entire fourth floor of One Rockefeller Plaza in New York City, New York, 10020-2002. The main telephone number is 212-218-2800.
The Holding Company’s primary business is the ownership and operation of its subsidiaries. It does not engage in any other substantial business activities other than a limited amount of real estate mortgage lending, including the participation in loans originated by the Bank. From time to time, the Holding Company also issues debt and equity securities to raise funds for working capital purposes. The Holding Company is subject to examination and regulation by the Federal Reserve Board (FRB).
At December 31, 2006, the Company had total assets of $1.97 billion, cash and security investments of $451.1 million, net loans of $1.49 billion, deposits of $1.59 billion, borrowed funds and related interest payable of $172.9 million, and stockholders’ equity of $170.0 million, compared to total assets of $1.71 billion, cash and security investments of $313.5 million, net loans of $1.37 billion, deposits of $1.38 billion, borrowed funds and related interest payable of $155.7 million, and stockholders’ equity of $136.2 million at December 31, 2005.
Intervest National Bank
The Bank is a nationally chartered commercial bank that has its headquarters and full-service banking office at One Rockefeller Plaza, Suite 400, in New York City, and a total of six full-service banking offices in Pinellas County, Florida - four in Clearwater, one in Clearwater Beach and one in South Pasadena. In December 2006, the Bank opened its sixth office at 483 Mandalay Avenue in Clearwater Beach, Florida.
At December 31, 2006, the Bank had total assets of $1.86 billion, cash and security investments of $432.9 million, net loans of $1.40 billion, deposits of $1.61 billion, borrowed funds and related interest payable of $25.2 million, and stockholder’s equity of $181.2 million, compared to total assets of $1.60 billion, cash and security investments of $309.4 million, net loans of $1.27 billion, deposits of $1.40 billion, borrowed funds and related interest payable of $0.2 million and stockholder’s equity of $156.8 million at December 31, 2005.
The Bank provides a variety of personalized commercial and consumer banking services to small and middle-market businesses and individuals. The Bank attracts deposits from the areas served by its banking offices. The Bank also provides internet banking through its web site: www.intervestnatbank.com, which attracts deposit customers from within as well as outside its primary market areas. The deposits, together with funds derived from other sources, are mainly used to fund the origination of mortgage loans secured by commercial and multifamily real estate properties and to purchase investment securities. The Bank does not offer annuity products or mutual funds.
2
The Bank’s revenues are primarily derived from interest and fees received from originating loans, and from interest and dividends earned on securities and other short-term investments. The principal sources of funds for the Bank’s lending activities are deposits, repayment of loans, maturities and calls of securities and cash flow generated from operations. The Bank’s principal expenses are interest paid on deposits and operating and general and administrative expenses.
The Bank’s deposit flows and the rates paid thereon are influenced by interest rates on competing investments available to depositors and general market rates of interest. The Bank’s lending activities are affected by the interest rates it charges on loans, customer demand for loans, the supply of money available for lending purposes, the rates offered by its competitors and the terms and credit risks associated with the loans. The Bank faces strong competition in the attraction of deposits and in the origination of loans. The Bank’s deposits are insured by the Federal Deposit Insurance Corporation (FDIC) to the extent permitted by law.
The Bank’s operations are significantly influenced by general and local economic conditions, particularly those in the New York City metropolitan area and the State of Florida where most of the properties that secure its mortgage loans are concentrated, and by related monetary and fiscal policies of banking regulatory agencies, including the FRB and FDIC. The Bank is also subject to the supervision, regulation and examination of the Office of the Comptroller of the Currency of the United States of America (OCC).
The Bank has an agreement that expires in 2014 with Fidelity Information Services, a division of Fidelity National Financial, to provide the Bank with its core data processing using the Kirchman Bankway software, a product of the Kirchman Corporation, which is a division of Metavante Corporation. Management believes that these entities will continue to be able to provide data processing services to support the Bank’s current and future needs.
Intervest Mortgage Corporation
Intervest Mortgage Corporation’s business focuses on the origination of first mortgage and junior mortgage loans secured by commercial and multifamily real estate properties. It also provides loan origination services to the Bank. Intervest Mortgage Corporation funds its loans through the issuance of subordinated debentures in public offerings.
At December 31, 2006, Intervest Mortgage Corporation had total assets of $119.5 million, cash and short-term investments of $36.6 million, net loans of $77.2 million, debentures and related interest payable of $86.6 million, and stockholder’s equity of $29.7 million, compared to total assets of $115.8 million, cash and short-term investments of $27.9 million, net loans of $82.5 million, debentures and related interest payable of $87.4 million and stockholder’s equity of $26.6 million, at December 31, 2005.
Intervest Mortgage Corporation’s lending business is also significantly influenced by the movement of interest rates, general and local economic conditions, particularly those in the New York City metropolitan area where most of the properties that secure its mortgage loans are concentrated, and its service fee income is directly affected by the volume of origination services it provides to the Bank, whose lending business is also affected by similar factors. In addition to its lending business, Intervest Mortgage Corporation receives fee income from the Bank for the loan origination services it provides to the Bank, the amount of which is eliminated in the Company’s consolidated financial statements. As the Bank’s mortgage loan portfolio has grown, service fee income from the Bank has comprised an increasing percentage of Intervest Mortgage Corporation’s income.
Intervest Securities Corporation
Intervest Securities Corporation was another wholly owned subsidiary of the Holding Company whose limited operations were discontinued in 2006. Its net assets of $506,000 were distributed to the Holding Company. Intervest Securities Corporation was a broker/dealer and its business activities were not material to the consolidated financial statements. Its revenues had been derived from participating as a selected dealer from time to time in offerings of debt securities of primarily those of Intervest Mortgage Corporation.
Intervest Statutory Trusts
Intervest Statutory Trust II, III, IV and V are business trusts that were formed for the sole purpose of issuing and administering trust preferred securities and they do not conduct any trade or business. See note 9 to the consolidated financial statements included in this report for a further discussion of the trusts.
3
Available Information
The Company’s annual reports on Form 10-K, quarterly reports on Form 10-Q, current reports on Form 8-K, Proxy Statements and any amendments to those reports, can be obtained (excluding exhibits) without charge by writing to: Intervest Bancshares Corporation, Attention: Secretary, One Rockefeller Plaza (Suite 400) New York, New York 10020. In addition, the reports (with exhibits) are available on the Securities and Exchange Commission’s website www.sec.gov. Although the Holding Company does not have a website, the Bank has a website at www.intervestnatbank.com. The information on the Bank’s web site is not and should not be considered part of this report and is not incorporated by reference in this report.
Private Securities Litigation Reform Act Safe Harbor Statement
The Company is making this statement in order to satisfy the “Safe Harbor” provision contained in the Private Securities Litigation Reform Act of 1995. The statements contained in this report on Form 10-K that are not statements of historical fact may include forward-looking statements that involve a number of risks and uncertainties. Such forward-looking statements are made based on management’s expectations concerning future events affecting the Company and are subject to uncertainties and factors relating to the Company’s operations and economic environment, all of which are difficult to predict and many of which are beyond the control of the Company, that could cause actual results of the Company to differ materially from those matters expressed in or implied by forward-looking statements.
Business Overview and Strategy
The Company’s business segment is banking and real estate lending. The Company’s lending activities are comprised of the origination for its loan portfolio mortgage loans secured by commercial and multifamily real estate properties (including rental and cooperative/condominium apartment buildings, office buildings, mixed-use properties, shopping centers, hotels, restaurants, industrial properties, parking lots/garages and vacant land). These loans have an average life of approximately three years. The Company tends to lend in areas that are in the process of being revitalized or redeveloped, with a concentration of loans on properties located in New York State and the State of Florida. A large number of the properties in New York are located in Manhattan, Brooklyn, Queens and the Bronx. A large number of the properties in Florida are located in Clearwater, Tampa, Fort Lauderdale, Miami, Orlando and St. Petersburg. Many of the multifamily properties located in New York City and surrounding boroughs are also subject to rent control and rent stabilization laws, which limit the ability of the property owners to increase rents, which in turn may affect the borrower’s ability to repay those mortgage loans. The Company’s business is affected by a number of factors that are discussed herein in the section entitled “Item 1A Risk Factors.”
The Company’s business strategy is committed to the continued origination of multifamily residential and commercial real estate loans. The Company expects to continue to rely upon the relationships it has developed both with its borrowers and with the brokers with whom it has done business as a primary source of new loans. The Company believes that its ability to rapidly and efficiently process and close mortgage loans gives it a competitive advantage. From time to time, the Company has and will continue to explore opportunities to diversify its revenues, including evaluating the possibility of growth and expansion through acquisitions both within and outside the Company’s primary market areas.
Market Area
The Bank’s primary market area for its New York office is considered to be the New York metropolitan area, consisting of the five boroughs of New York City and the areas surrounding them. Historically, the New York City metropolitan area has benefited from being the corporate headquarters of many large industrial and commercial national companies, which have, in turn, attracted many smaller companies, particularly within the service industry. However, as a consequence of being the home of many national companies and to a large number of national securities and investment banking firms, as well as being a popular travel destination, the New York City metropolitan area is particularly sensitive to the economic health of the United States. As a result, economic conditions in other parts of the United States can also affect the economic climate of New York City. The Bank’s primary market area for its Florida offices is considered to be Pinellas County, which is the most populous county in the Tampa Bay area of Florida that also has many seasonal residents. The Tampa Bay area is located on the
4
West Coast of Florida, midway up the Florida peninsula. The major cities in the area are Tampa (Hillsborough County) and St. Petersburg and Clearwater (Pinellas County). Management believes that the Bank’s offices are located in middle and upper income communities. The Bank’s deposit-gathering market also includes its internet web site: www.intervestnatbank.com, which attracts deposit customers from both within and outside the Bank’s primary market areas.
Intervest Mortgage Corporation’s lending market has also been concentrated in the New York City metropolitan region. Both the Bank and Intervest Mortgage Corporation originate loans on properties in other states, including Alabama, Connecticut, Florida, Georgia, Indiana, Kentucky, Massachusetts, Maryland, Michigan, New Jersey, North Carolina, Ohio, Pennsylvania, Virginia and Washington D.C.
Competition
In one or more aspects of its business, the Bank competes with other commercial banks, savings and loan associations, credit unions, finance companies, mutual funds, insurance companies, brokerage and investment banking companies, and other financial intermediaries. Most of these competitors, some of which are affiliated with large financial holding companies, have substantially greater financial and marketing resources and lending limits, and may offer services that the Bank does not currently provide. In addition, many of the Bank’s nonbank competitors are not subject to the same extensive federal regulations that govern financial holding companies and federally insured banks. Competition among financial institutions is based upon interest rates offered on deposit accounts, interest rates charged on loans and other credit and service charges, the quality and scope of the services rendered, the convenience of banking facilities and, in the case of loans to commercial borrowers, relative lending limits. An increase in the general availability of funds may increase competition in the origination of mortgage loans and may reduce the yields available therefrom.
In making its mortgage investments, Intervest Mortgage Corporation also experiences significant competition from banks, insurance companies, savings and loan associations, mortgage bankers, pension funds, real estate investment trusts, limited partnerships and other lenders and investors. Most of these competitors also have significantly greater financial and marketing resources.
In addition, certain entities owned or controlled by the Chairman of the Company and certain relatives of his who are also shareholders of the Company are engaged in limited real estate lending activities involving properties that are similar to those underlying the Company’s mortgage loans and, in that regard, may also be competing with the Company. The Company believes that such activities do not materially affect its lending business.
Lending Activities
General
The volume of the Company’s loan originations is dependent on the interest rates it charges for loans, customer demand for loans, the availability of funds to lend, the rates offered by competitors and the terms and credit risks associated with the loans. The Company’s lending activities emphasize the origination of first and second mortgage loans secured by commercial and multifamily real estate properties. To a very limited extent, the Bank also offers single-family residential mortgage loans, commercial loans and consumer loans. To date such lending has not been emphasized by the Bank and its current portfolio of such loans is insignificant. The Bank does not expect to become active in such lending.
The Bank’s lending activities are conducted pursuant to written policies and defined lending limits. In originating loans, the Bank places emphasis on the borrower’s ability to generate cash flow to support its debt obligations and other cash related expenses. All potential new loans are referred to the Chairman of the Bank or to the President of the Florida Division of the Bank, both of whom have substantial experience in commercial and multifamily real estate lending. Generally, all loans originated by the Bank must be first reviewed and approved by the Bank’s Loan Committee, which is currently comprised of three members of the Board of Directors, one of whom is the Chairman.
5
As a national bank, the Bank may not make a loan or extend credit to a single or related group of borrowers in excess of 15% of the Bank’s unimpaired capital and surplus. Additional amounts may be loaned, not in excess of 10% of unimpaired capital and surplus, if such loans or extensions of credit are secured by readily-marketable collateral.
Intervest Mortgage Corporation is not a bank and is therefore not subject to the same degree of regulation as applies to the Bank. It does not have any formal policies regarding the percentage of its assets that may be invested in any single or type of mortgage loan, the geographic location of properties collateralizing those mortgages or limits to amounts to any one borrower, loan-to-value ratios and debt service coverage ratios. It also does not have a loan committee or a formal loan approval process. Intervest Mortgage Corporation normally does not invest more than 10% of its assets in any single mortgage. All of Intervest Mortgage Corporation’s underwriting and lending decisions are made by its Chairman, who also serves as the Chairman of the Bank and the Holding Company. Its real estate loans consist of first mortgage loans and junior mortgage loans. Junior mortgages normally have greater risks than first mortgages. Like the Bank, Intervest Mortgage Corporation also considers the borrower’s experience in owning or managing real estate and its lending experience with the borrower when originating loans.
At December 31, 2006, the consolidated loan portfolio was concentrated in mortgage loans secured by commercial and multifamily real estate properties, including vacant land. At December 31, 2006, there were 536 such loans with an aggregate principal balance of $1.5 billion and an average principal size of $2.8 million. Loans with principal balances of $5.0 million or more aggregated to 82 loans or $738.7 million, with the largest loan amounting to $20.5 million.
The following table sets forth information regarding the consolidated loan portfolio:
| | | | | | | | | | | | | | | | | | | | |
| | | At December 31, | |
| ($ in thousands) | | 2006 | | | 2005 | | | 2004 | | | 2003 | | | 2002 | |
Commercial real estate loans | | $ | 812,063 | | | $ | 735,650 | | | $ | 601,512 | | | $ | 344,071 | | | $ | 275,096 | |
Residential multifamily loans | | | 634,753 | | | | 538,760 | | | | 403,613 | | | | 310,650 | | | | 214,515 | |
Land development and other land loans | | | 54,917 | | | | 105,251 | | | | 19,198 | | | | 20,526 | | | | 1,890 | |
Residential 1-4 family loans | | | 35 | | | | 100 | | | | 984 | | | | 1,628 | | | | 1,953 | |
Commercial business loans | | | 745 | | | | 1,089 | | | | 1,215 | | | | 1,662 | | | | 1,608 | |
Consumer loans | | | 218 | | | | 194 | | | | 221 | | | | 319 | | | | 240 | |
Loans receivable | | | 1,502,731 | | | | 1,381,044 | | | | 1,026,743 | | | | 678,856 | | | | 495,302 | |
Deferred loan fees | | | (12,078 | ) | | | (13,058 | ) | | | (11,347 | ) | | | (7,731 | ) | | | (5,390 | ) |
Loans receivable, net of deferred fees | | | 1,490,653 | | | | 1,367,986 | | | | 1,015,396 | | | | 671,125 | | | | 489,912 | |
Allowance for loan losses | | | (17,833 | ) | | | (15,181 | ) | | | (11,106 | ) | | | (6,580 | ) | | | (4,611 | ) |
Loans receivable, net (1) | | $ | 1,472,820 | | | $ | 1,352,805 | | | $ | 1,004,290 | | | $ | 664,545 | | | $ | 485,301 | |
Loans included above that were
on a nonaccrual status at year end (2) | | $ | 3,274 | | | $ | 750 | | | $ | 4,607 | | | $ | 8,474 | | | $ | - | |
Accruing loans included above which are
contractually past due 90 days or more (2) | | $ | - | | | $ | 2,649 | | | $ | - | | | $ | - | | | $ | - | |
Interest income not recorded on loans that
were on nonaccrual status during the year | | $ | 153 | | | $ | 75 | | | $ | 236 | | | $ | 339 | | | $ | 29 | |
| (1) | During the periods presented, there were no “troubled debt restructurings” as defined in SFAS No. 15 or known information about possible credit problems of borrowers which would cause management to have serious doubts as to the ability of such borrowers to comply with the present loan repayment terms. |
| (2) | Represents multifamily and commercial real estate loans. |
The following table sets forth the scheduled contractual principal repayments of the loan portfolio in the aggregate:
| | | | | | | | | | | | | | | |
| | | At December 31, |
| ($ in thousands) | | 2006 | | 2005 | | 2004 | | 2003 | | 2002 |
Due within one year | | $ | 366,457 | | $ | 419,749 | | $ | 227,889 | | $ | 133,137 | | $ | 103,398 |
Due over one to five years | | | 918,255 | | | 805,905 | | | 645,050 | | | 430,783 | | | 305,013 |
Due over five years | | | 218,019 | | | 155,390 | | | 153,804 | | | 114,936 | | | 86,891 |
| | | $ | 1,502,731 | | $ | 1,381,044 | | $ | 1,026,743 | | $ | 678,856 | | $ | 495,302 |
6
The following table sets forth the scheduled contractual principal repayments of the loan portfolio by type:
| | | | | | | | |
| | | At December 31, 2006 |
($ in thousands) | | Due Within
One Year | | Due Over One
to Five Years (1) | | Due Over
Five Years (1) | | Total |
Commercial real estate loans | | $195,257 | | $487,285 | | $129,521 | | $ 812,063 |
Residential multifamily loans | | 121,366 | | 425,146 | | 88,241 | | 634,753 |
Land development and other land loans | | 49,184 | | 5,531 | | 202 | | 54,917 |
Residential 1-4 family loans | | - | | - | | 35 | | 35 |
Commercial business loans | | 491 | | 254 | | - | | 745 |
Consumer loans | | 159 | | 39 | | 20 | | 218 |
| | | $366,457 | | $918,255 | | $218,019 | | $1,502,731 |
| (1) | At December 31, 2006, $635 million of loans with adjustable rates and $501 million of loans with fixed rates were due after one year. |
The following table sets forth the types of properties securing the mortgage loan portfolio:
| | | | | | |
| | | At December 31, |
($ in thousands) | | | 2006 | | | 2005 |
Commercial Real Estate: | | | | | | |
Retail stores | | $ | 298,652 | | $ | 266,965 |
Office buildings | | | 244,767 | | | 198,326 |
Industrial/warehouse | | | 103,971 | | | 134,817 |
Hotels | | | 89,333 | | | 80,665 |
Mobile home parks | | | 18,627 | | | 26,173 |
Parking lots/garages | | | 18,551 | | | 8,367 |
Other | | | 38,162 | | | 20,337 |
Residential Multifamily (5 or more units) | | | 634,753 | | | 536,624 |
Residential All Other | | | 998 | | | 2,236 |
Vacant Land | | | 54,917 | | | 105,251 |
| | | $ | 1,502,731 | | $ | 1,379,761 |
The following table sets forth the activity in the Company’s loan portfolio in the aggregate:
| | | | | | | | | | | | | | | | | | | | |
| | | For the Year Ended December 31, | |
($ in thousands) | | | 2006 | | | | 2005 | | | | 2004 | | | | 2003 | | | | 2002 | |
Loans receivable, net, at beginning of year | | $ | 1,352,805 | | | $ | 1,004,290 | | | $ | 664,545 | | | $ | 485,301 | | | $ | 365,146 | |
Loans originated | | | 548,474 | | | | 706,672 | | | | 626,252 | | | | 378,630 | | | | 233,689 | |
Principal repayments | | | (426,787 | ) | | | (352,371 | ) | | | (278,365 | ) | | | (195,076 | ) | | | (110,661 | ) |
Recoveries | | | - | | | | - | | | | - | | | | - | | | | (107 | ) |
Chargeoffs | | | - | | | | - | | | | - | | | | - | | | | 150 | |
Decrease (increase) in deferred loan fees | | | 980 | | | | (1,711 | ) | | | (3,616 | ) | | | (2,341 | ) | | | (1,642 | ) |
Provision for loan losses | | | (2,652 | ) | | | (4,075 | ) | | | (4,526 | ) | | | (1,969 | ) | | | (1,274 | ) |
Loans receivable, net, at end of year | | $ | 1,472,820 | | | $ | 1,352,805 | | | $ | 1,004,290 | | | $ | 664,545 | | | $ | 485,301 | |
The following table sets forth the geographic distribution of the loan portfolio in the aggregate:
| | | | | | | | | | | | | | | | | | | | | | | | | | | | | | | |
| | | At December 31, | |
| | | 2006 | | | 2005 | | | 2004 | | | 2003 | | | 2002 | |
($ in thousands) | | Amount | | % of
Total |
| | | Amount | | % of
Total |
| | | Amount | | % of
Total |
| | | Amount | | % of
Total |
| | | Amount | | % of
Total |
|
New York | | $1,005,946 | | 67 | % | | $ | 896,746 | | 65 | % | | $ | 729,301 | | 71 | % | | $ | 435,790 | | 64 | % | | $ | 278,280 | | 56 | % |
Florida | | 366,393 | | 24 | | | | 323,764 | | 24 | | | | 198,823 | | 19 | | | | 189,802 | | 28 | | | | 184,257 | | 37 | |
Connecticut & New Jersey | | 52,185 | | 4 | | | | 84,373 | | 6 | | | | 51,186 | | 5 | | | | 39,681 | | 6 | | | | 21,991 | | 5 | |
All Other | | 78,207 | | 5 | | | | 76,161 | | 5 | | | | 47,433 | | 5 | | | | 13,583 | | 2 | | | | 10,774 | | 2 | |
| | | $1,502,731 | | 100 | % | | $ | 1,381,044 | | 100 | % | | $ | 1,026,743 | | 100 | % | | $ | 678,856 | | 100 | % | | $ | 495,302 | | 100 | % |
7
Real Estate Mortgage Lending
Commercial and multifamily real estate lending is generally considered to have more credit risk than 1-4 family residential lending because these loans tend to involve larger loan balances to single borrowers and their repayment is typically dependent upon the successful operation of the underlying real estate for income-producing properties. In addition, loans on vacant or substantially vacant properties and vacant land typically have limited or no income streams and depend upon other sources of cash flow from the borrower for repayment.
Mortgage loans on commercial and multifamily properties typically provide for periodic payments of interest and principal during the term of the mortgage, with the remaining principal balance and any accrued interest due at the maturity date. The majority of the mortgage loans originated by the Company provide for balloon payments at maturity, which means that a substantial part or the entire original principal amount is due in one lump sum payment at maturity. If the net revenue from the property is not sufficient to make all debt service payments due on the mortgage or, if at maturity or the due date of any balloon payment, the owner of the property fails to raise the funds (by refinancing the loan, sale of the property or otherwise) to make the lump sum payment, the Company could sustain a loss on its investment in the mortgage loan.
The Company’s real estate loans are normally originated for terms of no more than 10 years, with the entire portfolio having an average life of approximately three years. Many of the loans have floating interest rates that are indexed to the prime rate. In addition, the floating-rate loans have a “floor,” or minimum rate, that is determined in relation to prevailing market rates on the date of origination. This floor only adjusts upwards in the event of increases in the loan’s interest rate. This feature reduces the effect on interest income of a falling rate environment because the interest rates on such loans do not reset downward. However, the Company may nonetheless experience loan prepayments, the amount of which cannot be predicted, and reinvestment risk associated with the investment of the resulting proceeds.
As part of the Bank’s written policies for real estate loans, loan-to-value ratios (the ratio that the original principal amount of the loan bears to the lower of the purchase price or appraised value of the property securing the loan at the time of origination) on new loans originated by the Bank typically do not exceed 80%. Debt service coverage ratios (the ratio of the net operating income generated by the property securing the loan to the required debt service) on new loans typically are not less than 1.2 times. However, the Bank has originated and expects to continue to originate from time to time mortgage loans on vacant properties or vacant land for which there is limited or no cash flow being generated by the operation of the underlying real estate.
While the Company may require guarantees from the principals of its borrowers, loans are often made on a limited recourse basis. The Company does have some nonrecourse loans in its loan portfolio. Under the terms of nonrecourse mortgages, the owner of the property subject to the mortgage has no personal obligation to pay the mortgage note which the mortgage secures. Therefore, in the event of a default, the Company’s ability to recover its investment is solely dependent upon the value of the mortgaged property. The Company’s mortgage loans are also not insured or guaranteed by governmental agencies.
Intervest Mortgage Corporation’s loan portfolio includes junior mortgages, which at December 31, 2006 amounted to 17 junior mortgages, which constituted 12%, or $9.5 million, of its total loan portfolio. Junior mortgages are subordinate in right of repayment to the senior mortgage on the property. As a result, in the event of a default on a senior mortgage secured by the property, the holder of the senior mortgage may independently commence foreclosure proceedings. In such an event, a junior mortgage holder must often cure the default in order to prevent foreclosure. If there is a foreclosure on the senior mortgage, the owner of the junior mortgage is only entitled to share in liquidation proceeds after all amounts due to senior lienholders have been fully paid. Actual proceeds available for distribution upon foreclosure may not be sufficient to pay all sums due on the senior mortgage, other senior liens and the junior mortgage, and the costs and fees associated with the foreclosure proceedings. At December 31, 2006, all of the junior mortgages held by Intervest Mortgage Corporation were on properties where the Bank holds the senior mortgage.
8
Loan Solicitation and Processing
The Company’s loan originations are derived primarily from referrals from mortgage brokers and existing customers and borrowers and, to a lesser extent, from direct solicitation by its officers, advertising in newspapers and trade journals, and walk-in customers. The mortgage brokers receive a fee from the borrower upon the funding of the loans by the Company. Historically, mortgage brokers have been the source of substantially all of the real estate loans originated by the Company.
The Company’s underwriting procedures normally require the following: physical inspections of the properties being considered for mortgage loans; mortgage title insurance; fire and casualty insurance and environmental surveys. Analyses are also performed for relevant real property and financial factors, which may include: the condition and use of the subject property; the property’s income-producing capacity; and the quality, experience and creditworthiness of the property’s owner. Credit reports and other verifications, including searches related to the Office of Foreign Assets Control (OFAC) and the USA Patriot Act, are obtained to substantiate specific information relating to the applicant’s income, credit standing and legal status. In addition, the Bank requires an appraisal of the property securing the mortgage loan to determine the property’s adequacy as collateral performed by an appraiser approved by the Bank. Intervest Mortgage Corporation does not have an appraisal requirement and often appraisals are not obtained.
The Bank has a servicing agreement with Intervest Mortgage Corporation whereby Intervest Mortgage Corporation provides the Bank with mortgage loan origination services for a monthly fee that is based on loan origination volumes. The services include: the identification of potential properties and borrowers; the inspection of properties constituting collateral for such loans; the negotiation of the terms and conditions of such loans in accordance with the Bank’s underwriting standards; and coordinating the preparation of commitment letters and the loan closing process. The services are performed by Intervest Mortgage Corporation’s personnel and the related expenses are borne by Intervest Mortgage Corporation. The agreement renews each January 1 unless terminated by either party. The Bank paid $5.0 million, $5.1 million and $4.3 million in 2006, 2005 and 2004, respectively, to Intervest Mortgage Corporation in connection with this servicing agreement, all of which is eliminated in the Company’s consolidated financial statements. As a result of this agreement, origination services for the entire Company are furnished by the same staff.
Loan Origination, Loan Fees and Prepayment Income From the Early Repayment of Loans.
The Company normally charges loan origination fees on the mortgage loans it originates based on a percentage of the principal amount of the loan. These fees are normally comprised of a fee that is received from the borrower at the time the loan is originated and another similar fee that is contractually due when the loan is repaid. The total fees, net of related direct loan origination costs, are deferred and amortized over the contractual life of the loan as an adjustment to the loan’s yield. At December 31, 2006, the Company had $12.1 million of net unearned loan fees and $10.4 million of loan fees receivable. The Company also earns other fee income from the servicing of its loans.
When a mortgage loan is repaid prior to maturity, the Company may recognize prepayment income, which consists of the recognition of unearned fees associated with such loans at the time of payoff and the receipt of additional prepayment fees and or interest in certain cases in accordance with the prepayment provisions in the mortgage loan. The amount and timing of, as well as income from loan prepayments, if any, cannot be predicted and can fluctuate significantly. Normally, the number of instances of prepayment of mortgage loans tends to increase during periods of declining interest rates and tends to decrease during periods of increasing interest rates. However, given the nature and type of the mortgage loans the Company originates, including their short average life, the Company may still experience loan prepayments notwithstanding the effects of movements in interest rates. The Company earned prepayment income from the early repayment of loans of $4.9 million in 2006, $5.1 million in 2005 and $3.5 million in 2004.
9
Temporary Investments in Loans and Loan Participations
From time to time, Intervest Mortgage Corporation may originate a real estate mortgage loan in its own name and temporarily hold such loan in its portfolio for a short period, subsequently transferring the loan to the Bank at cost. In addition, from time to time, the Holding Company or Intervest Mortgage Corporation may purchase a participation in a real estate mortgage loan originated by the Bank. All participations are purchased at face value and the interest of the participant in the collateral securing the loan ispari passu with the Bank. The above transactions are undertaken to provide the Bank additional flexibility in originating loans.
Real Estate Investing Activities
The Company may purchase equity interests in real property or acquire such equity interests pursuant to a foreclosure of a mortgage in the normal course of business, as a result of which the Company may acquire and retain title to properties either directly or through a subsidiary.
Asset Quality
The Company considers asset quality to be of primary importance to its business and has procedures in place designed to mitigate the risks associated with its lending activities. After a loan is originated, various steps are undertaken (such as a annual physical inspection of the subject property and periodic reviews of loan files in order to monitor loan documentation and the value of the property securing the loan) with the objective of quickly identifying, evaluating and initiating corrective actions if necessary. The Company also engages in the constant monitoring of the payment status of its outstanding loans and pursues a timely follow-up on any delinquencies, including initiating collection procedures when necessary. Late fees are also assessed on delinquent loan payments.
All loans are subject to the risk of default, otherwise known as credit risk, which represents the possibility of the Company not recovering amounts due from its borrowers. A borrower’s ability to make payments due under a mortgage loan is dependent upon the risks associated with real estate investments in general, including the following: general or local economic conditions in the areas the properties are located, neighborhood values, interest rates, real estate tax rates, operating expenses of the mortgaged properties, supply of and demand for rental units, supply of and demand for properties, ability to obtain and maintain adequate occupancy of the properties, zoning laws, governmental rules, regulations and fiscal policies. Additionally, political issues, including armed conflicts, acts of terrorism, or natural disasters, such as hurricanes, may have an adverse impact on economic conditions of the country as a whole and may be more pronounced in specific geographic regions. Economic conditions as well as the levels of rent and occupancy of income-producing properties affect the market value of the mortgaged properties underlying the Company’s loans.
Loan concentrations are defined as amounts loaned to a number of borrowers engaged in similar activities or on properties located in a particular geographic area. The Company’s loan portfolio has historically been concentrated in commercial real estate and multifamily mortgage loans (including land loans), which represented 99.9% of the total loan portfolio at December 31, 2006. The properties underlying the Company’s mortgage loans are also concentrated in two states, New York and Florida, representing 67% and 24%, respectively, of the total dollar amount of loans outstanding at December 31, 2006. Many of the properties in New York State are located in New York City and are subject to rent control and rent stabilization laws, which limit the ability of the property owners to increase rents, which in turn may affect the borrower’s ability to repay the mortgage loan. As such, these properties may not be affected by the general movement of real estate values in the same manner as other income-producing properties. Many of the properties securing the Company’s loans are also located in areas that are being revitalized or redeveloped.
Loans are placed on nonaccrual status when principal or interest becomes 90 days or more past due unless the loan is well secured and in the process of collection. At December 31, 2006, there were two multifamily real estate loans totaling $3.3 million on nonaccrual status, compared to two loans totaling $0.7 million at December 31, 2005. In September 2006, the Company received full principal repayment of the loans on nonaccrual status at December 31, 2005. With respect to the nonaccrual loans at December 31, 2006, foreclosure actions have been commenced for nonpayment.
10
Nonaccrual loans are considered impaired under the criteria of SFAS No. 114, but no valuation allowance was maintained at any time since the Company believes that the estimated fair value of the underlying properties exceeded its recorded investment. At December 31, 2006 and 2005, there were no other impaired loans. At December 31, 2005, there were $2.6 million, compared to none at December 31, 2006, of loans ninety days past due and still accruing interest. At December 31, 2006, the allowance for loan losses amounted to $17.8 million, compared to $15.2 million at December 31, 2005.
In the last five years, the Company has experienced only one loan chargeoff from its lending activities amounting to $150,000 that was related to a commercial real estate property located in Florida that was acquired by the Bank through foreclosure. There can be no assurance however, that a downturn in real estate values and local economic conditions, as well as other factors such as those discussed earlier, would not have an adverse impact on the Company’s asset quality and future level of nonperforming assets, chargeoffs and profitability.
The following table sets forth information regarding the activity in the consolidated allowance for loan losses:
| | | | | | | | | | | | | | | | |
| | | At December 31, | |
| ($ in thousands) | | 2006 | | 2005 | | 2004 | | 2003 | | 2002 | |
Allowance at beginning of year (1) | | $ | 15,181 | | $ | 11,106 | | $ | 6,580 | | $ | 4,611 | | $ | 3,380 | |
Provision charged to operations | | | 2,652 | | | 4,075 | | | 4,526 | | | 1,969 | | | 1,274 | |
Chargeoffs - commercial real estate loan (2) | | | - | | | - | | | - | | | - | | | (150 | ) |
Recoveries - commercial real estate loan (3) | | | - | | | - | | | - | | | - | | | 107 | |
Allowance at end of year (1) | | $ | 17,833 | | $ | 15,181 | | $ | 11,106 | | $ | 6,580 | | $ | 4,611 | |
Total loans, net of deferred fees | | $ | 1,490,653 | | $ | 1,367,986 | | $ | 1,015,396 | | $ | 671,125 | | $ | 489,912 | |
Average loans outstanding during the year | | $ | 1,451,366 | | $ | 1,206,089 | | $ | 867,724 | | $ | 585,556 | | $ | 439,241 | |
Ratio of allowance to net loans receivable | | | 1.20% | | | 1.11% | | | 1.09% | | | 0.98% | | | 0.94% | |
Ratio of net chargeoffs to average loans | | | - | | | - | | | - | | | - | | | - | |
| (1) | Nearly all of the allowance for loan losses is allocated to real estate loans. |
| (2) | The amount for 2002 represents a chargeoff taken in connection with the transfer of a nonperforming loan to foreclosed real estate. |
| (3) | The amount for 2002 represents proceeds received from the sale of collateral from a loan that was charged off prior to 1997. |
Investment Activities
The Bank invests in securities after satisfying its liquidity objectives and lending commitments. The Bank’s investment policy is designed to provide and maintain liquidity, without incurring undue interest rate risk and credit risk. Securities are classified as held to maturity and are carried at amortized cost when management has the intent and ability to hold them to maturity. The Bank has historically purchased securities that are issued directly by the U.S. government or one of its agencies that have adjustable rates or that have fixed rates with short- to intermediate-maturity terms. Such securities have a significantly lower credit risk than the loan portfolio as well as lower yields. During 2006, the Bank selectively purchased a number of corporate securities, consisting of trust preferred notes, to enhance yield. The Bank’s goal is to maintain a securities portfolio with a short weighted-average life of one to five years, which allows for the resulting cash flows to either be reinvested in securities at current market interest rates, used to fund loan growth or pay off short-term borrowings as needed. The Bank currently targets its loan-to-deposit ratio at approximately 85%. This ratio stood at 84% at December 31, 2006.
From time to time, a securities available-for-sale portfolio may be maintained by the Bank for securities that are held for indefinite periods of time for use in its asset/liability management strategy, or that may be sold in response to changes in interest rates or other factors. Such securities are classified as available for sale and are carried at estimated fair value. The Bank has not classified securities as available for sale since 2002. The Company as a whole does not engage in trading activities.
The table that follows depicts the amortized cost (carrying value), contractual maturities and weighted-average yields regarding the Bank’s portfolio of securities held to maturity. The table excludes FHLB and FRB stock investments required by the Bank in order to be a member of the FHLB and FRB.
11
| | | | | | | | | | | | | | | | | | | | | | | | | |
| | | Due One Year or Less | | Due After One Year to
Five Years | | Due After Five Years to
Ten Years | | Due After Ten Years | | Total |
| ($ in thousands) | | Carrying
Value | | Avg.
Yield | | Carrying
Value | | Avg.
Yield | | Carrying
Value | | Avg.
Yield | | Carrying
Value | | Avg.
Yield | | Carrying
Value | | Avg. Yield |
At December 31, 2006: | | | | | | | | | | | | | | | | | | | | | | | | | |
U.S. government agencies | | $ | 112,454 | | 4.11% | | $ | 284,555 | | 5.17% | | $ | 996 | | 5.02% | | $ | - | | -% | | $ | 398,005 | | 4.87% |
Corporate | | | - | | - | | | - | | - | | | - | | - | | | 6,010 | | 5.62 | | | 6,010 | | 5.62 |
| | | $ | 112,454 | | 4.11% | | $ | 284,555 | | 5.17% | | $ | 996 | | 5.02% | | $ | 6,010 | | 5.62% | | $ | 404,015 | | 4.88% |
At December 31, 2005: | | | | | | | | | | | | | | | | | | | | | | | | | |
U.S. government agencies | | $ | 124,413 | | 2.71% | | $ | 127,095 | | 3.79% | | $ | - | | -% | | $ | - | | -% | | $ | 251,508 | | 3.26% |
At December 31, 2004: | | | | | | | | | | | | | | | | | | | | | | | | | |
U.S. government agencies | | $ | 84,586 | | 1.81% | | $ | 164,302 | | 2.59% | | $ | - | | -% | | $ | - | | -% | | $ | 248,888 | | 2.33% |
At December 31, 2003: | | | | | | | | | | | | | | | | | | | | | | | | | |
U.S. government agencies | | $ | 70,026 | | 1.68% | | $ | 82,797 | | 1.81% | | $ | - | | -% | | $ | - | | -% | | $ | 152,823 | | 1.75% |
At December 31, 2002: | | | | | | | | | | | | | | | | | | | | | | | | | |
U.S. government agencies | | $ | 75,566 | | 2.52% | | $ | 70,128 | | 2.25% | | $ | - | | -% | | $ | - | | -% | | $ | 145,694 | | 2.39% |
The Company also invests in various money market instruments (including overnight and term federal funds, short-term bank commercial paper and certificate of deposits) to temporarily invest funds resulting from deposit-gathering activities, normal cash flow from operations and sales of debentures. Cash and short-term investments at December 31, 2006 amounted to $40.2 million, compared to $56.7 million at December 31, 2005.
Sources of Funds
The Bank’s primary sources of funds consist of the following: retail deposits obtained through its branch offices and through the mail, principal repayments from loans; maturities and calls of securities; and cash generated by operating activities. In addition, the Bank has from time to time borrowed funds on a short-term basis from the FHLB and the federal funds market to manage its liquidity needs. The Bank has also received capital contributions from the Holding Company.
The Bank’s deposit accounts are solicited from individuals, small businesses and professional firms located throughout the Bank’s primary market areas through the offering of a variety of deposit services. The Bank also uses its internet web site: www.intervestnatbank.com to attract deposit customers from both within and outside its primary market areas. The Bank believes it does not have a concentration of deposits from any one source.
The Bank has and expects to continue to rely heavily on certificates of deposit (time deposits) as a source of funds for its lending business. Total consolidated deposits amounted to $1.59 billion at December 31, 2006 and time deposits represented 84%, or $1.34 billion, of those deposits. Additionally, time deposits of $100,000 or more at December 31, 2006 totaled $490.9 million and included $55.7 million of brokered deposits. Brokered deposits are sold by investment firms, which are paid a fee by the Bank for placing the deposit. The Bank must maintain its status as well-capitalized insured depository institution in order to solicit and accept, renew or roll over any brokered deposit without restriction. Time deposits are the only deposit accounts offered by the Bank that have stated maturity dates. These deposits are generally considered to be rate sensitive and have a higher cost than deposits with no stated maturities, such as checking, savings and money market accounts. The Bank needs to pay competitive interest rates to attract and retain time deposits to fund its loan originations.
The Bank’s deposit services include the following: certificates of deposit (including denominations of $100,000 or more); individual retirement accounts (IRAs); checking and other demand deposit accounts; negotiable order of withdrawal (NOW) accounts; savings accounts; and money market accounts. Interest rates offered by the Bank on deposit accounts are normally competitive with those in the principal market areas of the Bank. In addition, the determination of rates and terms on deposit accounts takes into account the Bank’s liquidity requirements, loan demand, growth goals, capital levels and federal regulations. Maturity terms, service fees and withdrawal penalties on deposit products are reviewed and established by the Bank on a periodic basis.
12
The Bank offers internet banking services, ATM services with access to local, state and national networks, wire transfers, automated clearing house (ACH) transfers, direct deposit of payroll and social security checks and automated drafts for various accounts. In addition, the Bank offers safe deposit boxes to its customers in Florida. The Bank periodically reviews the scope of the banking products and services it offers consistent with market opportunities and its available resources.
The following table sets forth the distribution of deposit accounts by type:
| | | | | | | | | | | | | | | | | | | | | | | | | | | | | | |
| | | At December 31, | |
| | | 2006 | | | 2005 | | | 2004 | | | 2003 | | | 2002 | |
| ($ in thousands) | | Amount | | % of
Total | | | Amount | | % of
Total | | | Amount | | % of
Total | | | Amount | | % of
Total | | | Amount | | % of
Total | |
Demand | | $ | 4,849 | | 0.3 | % | | $ | 9,188 | | 0.7 | % | | $ | 6,142 | | 0.6 | % | | $ | 6,210 | | 0.9 | % | | $ | 5,924 | | 1.2 | % |
Interest checking | | | 12,934 | | 0.8 | | | | 7,202 | | 0.5 | | | | 15,051 | | 1.5 | | | | 9,146 | | 1.4 | | | | 10,584 | | 2.1 | |
Savings | | | 10,684 | | 0.7 | | | | 17,351 | | 1.3 | | | | 27,359 | | 2.8 | | | | 30,784 | | 4.6 | | | | 30,174 | | 6.0 | |
Money Markets | | | 224,673 | | 14.1 | | | | 223,075 | | 16.2 | | | | 200,549 | | 20.2 | | | | 162,214 | | 24.0 | | | | 134,293 | | 26.5 | |
Certificates of deposit | | | 1,335,394 | | 84.1 | | | | 1,118,514 | | 81.3 | | | | 744,771 | | 74.9 | | | | 467,159 | | 69.1 | | | | 324,983 | | 64.2 | |
| | | $ | 1,588,534 | | 100.0 | % | | $ | 1,375,330 | | 100.0 | % | | $ | 993,872 | | 100.0 | % | | $ | 675,513 | | 100.0 | % | | $ | 505,958 | | 100.0 | % |
At December 31, 2006, 2005, 2004, 2003 and 2002, individual retirement account deposits totaled $218.7 million, $163.2 million, $113.3 million, $74.2 million and $53.3 million, respectively, nearly all of which were certificates of deposit.
The following table sets forth total deposits by office:
| | | | | | | | | | | | | | | |
| | | At December 31, |
| ($ in thousands) | | 2006 | | 2005 | | 2004 | | 2003 | | 2002 |
New York Main Office | | $ | 875,474 | | $ | 712,181 | | $ | 497,717 | | $ | 347,088 | | $ | 233,312 |
Florida Offices | | | 713,060 | | | 663,149 | | | 496,155 | | | 328,425 | | | 272,646 |
| | | $ | 1,588,534 | | $ | 1,375,330 | | $ | 993,872 | | $ | 675,513 | | $ | 505,958 |
The following table sets forth certificate of deposits by maturity:
| | | | | | | | | | | | | | | | | | | | | | | | | | | | | | |
| | | At December 31, | |
| | | 2006 | | | 2005 | | | 2004 | | | 2003 | | | 2002 | |
| ($ in thousands) | | Amount | | Wtd-Avg Stated
Rate | | | Amount | | Wtd-Avg Stated
Rate | | | Amount | | Wtd-Avg Stated
Rate | | | Amount | | Wtd-Avg Stated
Rate | | | Amount | | Wtd-Avg Stated
Rate | |
Within one year | | $ | 630,454 | | 4.77 | % | | $ | 381,968 | | 3.77 | % | | $ | 269,553 | | 2.84 | % | | $ | 182,693 | | 2.75 | % | | $ | 122,890 | | 3.51 | % |
Over one to two years | | | 193,993 | | 4.49 | | | | 259,698 | | 4.30 | | | | 119,780 | | 3.43 | | | | 90,936 | | 3.64 | | | | 57,895 | | 4.18 | |
Over two to three years | | | 204,636 | | 4.59 | | | | 126,546 | | 4.13 | | | | 134,409 | | 4.48 | | | | 30,094 | | 4.43 | | | | 31,281 | | 5.53 | |
Over three to four years | | | 178,767 | | 4.71 | | | | 160,344 | | 4.43 | | | | 75,317 | | 4.06 | | | | 89,085 | | 4.83 | | | | 17,730 | | 5.32 | |
Over four years | | | 127,544 | | 5.36 | | | | 189,958 | | 4.69 | | | | 145,712 | | 4.48 | | | | 74,351 | | 4.20 | | | | 95,187 | | 4.92 | |
| | | $ | 1,335,394 | | 4.75 | % | | $ | 1,118,514 | | 4.18 | % | | $ | 744,771 | | 3.68 | % | | $ | 467,159 | | 3.66 | % | | $ | 324,983 | | 4.33 | % |
The following table sets forth the maturities of certificates of deposit in denominations of $100,000 or more:
| | | | | | | | | | | | | | | |
| | | At December 31, |
| ($ in thousands) | | 2006 | | 2005 | | 2004 | | 2003 | | 2002 |
Due within three months or less | | $ | 60,534 | | $ | 30,165 | | $ | 15,761 | | $ | 7,514 | | $ | 7,508 |
Due over three months to six months | | | 69,121 | | | 25,109 | | | 24,450 | | | 7,446 | | | 6,122 |
Due over six months to one year | | | 111,387 | | | 65,077 | | | 40,351 | | | 31,459 | | | 13,033 |
Due over one year | | | 249,840 | | | 251,403 | | | 135,314 | | | 76,644 | | | 46,209 |
Total | | $ | 490,882 | | $ | 371,754 | | $ | 215,876 | | $ | 123,063 | | $ | 72,872 |
As a percentage of total deposits | | | 30.9% | | | 27.0% | | | 21.7% | | | 18.2% | | | 14.4% |
| | | | | |
| The following table sets forth net deposit flows: | | | | | | | | | | | | | | | |
| |
| | | For the Year Ended December 31, |
| ($ in thousands) | | 2006 | | 2005 | | 2004 | | 2003 | | 2002 |
Net increase before interest credited | | $ | 148,600 | | $ | 338,053 | | $ | 292,667 | | $ | 151,138 | | $ | 126,230 |
Net interest credited | | | 64,604 | | | 43,405 | | | 25,692 | | | 18,417 | | | 17,291 |
Net deposit increase | | $ | 213,204 | | $ | 381,458 | | $ | 318,359 | | $ | 169,555 | | $ | 143,521 |
13
The Bank also borrow funds on an overnight or short-term basis to manage its liquidity needs. At December 31, 2006, the Bank had agreements with correspondent banks whereby it could borrow up to $16 million on an unsecured basis. In addition, as a member of the FHLB and FRB, the Bank could also borrow from these institutions on a secured basis. At December 31, 2006, $25.0 million of FHLB advances were outstanding. At December 31, 2006, the Bank had available collateral consisting of investment securities to support additional total borrowings of $361 million from the FHLB and FRB.
The following is a summary of certain information regarding short-term borrowings in the aggregate:
| | | | | | | | | | | | | | | | | | | | |
| | | For the Year Ended December 31, | |
| ($ in thousands) | | 2006 | | | 2005 | | | 2004 | | | 2003 | | | 2002 | |
Balance at period end | | $ | 25,000 | | | $ | - | | | $ | 36,000 | | | $ | - | | | $ | - | |
Maximum amount outstanding at any month end | | $ | 46,200 | | | $ | 17,000 | | | $ | 36,000 | | | $ | - | | | $ | - | |
Average outstanding balance for the period | | $ | 10,215 | | | $ | 4,871 | | | $ | 1,914 | | | $ | - | | | $ | 116 | |
Weighted-average interest rate paid for the period | | | 5.32 | % | | | 2.85 | % | | | 2.08 | % | | | - | % | | | 1.87 | % |
Weighted-average interest rate at period end | | | 5.44 | % | | | - | % | | | 2.56 | % | | | - | % | | | 2.56 | % |
Intervest Mortgage Corporation’s principal sources of funds for lending consist of borrowings (through the issuance of its debentures to the public), mortgage repayments and cash flow generated from operations, including fee income received from the Bank for loan origination services performed for the Bank. From time to time, it has also received capital contributions from the Holding Company.
The Holding Company’s principal sources of funds have been derived from the following: interest income from a limited portfolio of mortgage loans and short-term investments; monthly dividends from the Bank to service interest expense on trust preferred securities; monthly management fees from Intervest Mortgage Corporation and the Bank for providing these subsidiaries with certain administrative services; the issuance of its common stock through public offerings, exercise of outstanding common stock warrants; the issuance of trust preferred securities through its wholly owned business trusts; and the direct issuance of other subordinated debentures to the public.
The following table summarizes debentures and related accrued interest payable outstanding:
| | | | | | | | | | | | | | | |
| | | At December 31, |
| ($ in thousands) | | 2006 | | 2005 | | 2004 | | 2003 | | 2002 |
Intervest Mortgage Corporation: | | | | | | | | | | | | | | | |
Subordinated debentures | | $ | 83,750 | | $ | 82,750 | | $ | 88,850 | | $ | 87,350 | | $ | 74,000 |
Accrued interest payable — debentures | | | 2,875 | | | 4,699 | | | 8,219 | | | 12,052 | | | 10,751 |
| | | $ | 86,625 | | $ | 87,449 | | $ | 97,069 | | $ | 99,402 | | $ | 84,751 |
Weighted average interest rate paid for the year | | | 8.17% | | | 8.30% | | | 7.94% | | | 7.75% | | | 8.09% |
Holding Company: | | | | | | | | | | | | | | | |
Subordinated debentures | | $ | 1,250 | | $ | 2,500 | | $ | 2,500 | | $ | 2,500 | | $ | 3,500 |
Subordinated debentures — convertible into Class A common stock | | | 1,710 | | | 2,140 | | | 3,080 | | | 4,840 | | | 6,930 |
Subordinated debentures - trust preferred securities | | | 56,702 | | | 61,856 | | | 61,856 | | | 30,928 | | | 15,464 |
Accrued interest payable — debentures | | | 1,396 | | | 1,551 | | | 1,914 | | | 2,461 | | | 3,123 |
| | | $ | 61,058 | | $ | 68,047 | | $ | 69,350 | | $ | 40,729 | | $ | 29,017 |
Weighted average interest rate paid for the year | | | 7.13% | | | 7.25% | | | 7.61% | | | 9.13% | | | 9.46% |
Employees
At December 31, 2006, the Company employed 72 full-time equivalent employees, compared to 69 at December 31, 2005. The Company provides various benefit plans, including group life, health and a 401(k) Plan. None of the Company’s employees are covered by a collective bargaining agreement and the Company believes employee relations are good.
Federal and State Taxation
The Holding Company and its subsidiaries file a consolidated federal income tax return and combined state and city income tax returns in New York. The Holding Company also files a franchise tax return in Delaware. The Bank files a state income tax return in Florida. All the returns are filed on a calendar year basis.
14
Consolidated income tax returns have the effect of eliminating intercompany income and expense, including dividends, from the computation of consolidated taxable income for the taxable year in which the items occur. In accordance with an income tax sharing agreement, income tax charges or credits are allocated among the Holding Company and its subsidiaries on the basis of their respective taxable income or taxable loss that is included in the consolidated income tax return.
Banks and bank holding companies are subject to federal and state income taxes in essentially the same manner as other corporations. Florida, New York State and New York City taxable income is calculated under applicable sections of the Internal Revenue Code of 1986, as amended (the “Code”), with some modifications required by state and city law.
Although the Bank’s federal income tax liability is determined under provisions of the Code, which is applicable to all taxpayers, Sections 581 through 597 of the Code apply specifically to financial institutions. The two primary areas in which the treatment of financial institutions differs from the treatment of other corporations under the Code are in the areas of investment gains and losses and bad debt deductions. Investment gains and losses generated from the sale or exchange of portfolio instruments are generally treated for financial institutions as ordinary gains and losses as opposed to capital gains and losses for other corporations, as the Code considers investment portfolios held by banks to be inventory in a trade or business rather than capital assets. Banks are allowed a statutory method for calculating a reserve for bad debt deductions. Based on its asset size, a bank is permitted to maintain a bad debt reserve calculated on an experience method, based on chargeoffs and recoveries for the current and preceding five years, or a “grandfathered” base year reserve, if larger. Commencing in 2002, due to its asset size, the Bank no longer qualified for this method and began using the direct write-off method in computing its bad debt deduction for tax purposes.
As a Delaware corporation not earning income in Delaware, the Holding Company is exempt from Delaware corporate income tax but is required to file an annual report with and pay an annual franchise tax to the State of Delaware. The tax is imposed as a percentage of the capital base of the Holding Company and is reported in the line item ��All other” in the noninterest expense section of the consolidated statements of earnings.
Investment in Subsidiaries
The following table provides information regarding the Holding Company’s subsidiaries:
| | | | | | | | | | | | | | | |
| | | At December 31, 2006 | | | | | | |
| ($ in thousands) | | % of
Voting | | Total | | Equity in
Underlying | |
| Subsidiaries
Earnings for the
Year Ended December 31, |
Subsidiary | | Stock | | Investment | | Net Assets | | | 2006 | | | 2005 | | | 2004 |
Intervest National Bank | | 100% | | $181,176 | | $181,176 | | $ | 22,969 | | $ | 17,355 | | $ | 10,865 |
Intervest Mortgage Corporation | | 100% | | $ 29,742 | | $ 29,742 | | $ | 3,126 | | $ | 3,089 | | $ | 2,354 |
Intervest Securities Corporation | | 100% | | $ - | | $ - | | $ | 1 | | $ | 24 | | $ | 22 |
Intervest Statutory Trusts | | 100% | | $ 1,702 | | $ 1,702 | | $ | - | | $ | - | | $ | - |
Supervision and Regulation
The supervision and regulation of bank or financial holding companies and their subsidiaries is intended primarily for the protection of depositors, the deposit insurance funds of the FDIC, and the banking system as a whole, and not for the protection of the bank or financial holding company stockholders or creditors. The banking agencies have broad enforcement power over banks and financial holding companies, including the power to impose substantial fines and other penalties for violations of laws and regulations.
To the extent that the following information describes statutory and regulatory provisions, it is qualified in its entirety by reference to the particular statutory and regulatory provisions. Any change in the applicable law or regulation may have a material effect on the business and prospects of the Holding Company and its subsidiaries.
15
Bank Holding Company Regulation- Intervest Bancshares Corporation
The Holding Company is a bank holding company that has elected to be treated as a financial holding company under the Gramm-Leach Bliley Financial Services Modernization Act of 1999, referred to as the Modernization Act. The Holding Company is subject to supervision, regulation and examination by the Board of Governors of the Federal Reserve System, referred to as the FRB. The Modernization Act, the Bank Holding Company Act of 1956, as amended, referred to as the BHCA, and other federal laws subject financial and bank holding companies to particular restrictions on the types of activities in which they may engage, and to a broad range of supervisory requirements and activities, including regulatory enforcement actions for violations of laws and regulations.
Scope of Permissible Activities. Under the BHCA, a bank holding company generally may not, subject to certain exceptions, engage in, or acquire or control, directly or indirectly, voting securities or assets of any company that is engaged in activities other than those of banking, managing or controlling banks or certain activities that the FRB determines to be closely related to banking, managing and controlling banks as to the proper incident thereto. In approving acquisitions or the addition of activities, the FRB considers whether the acquisition or the additional activities can reasonably be expected to produce benefits to the public, such as greater convenience, increased competition and gains in efficiency, that outweigh such possible adverse effects as undue concentration of resources, decreased or unfair competition, conflicts of interest or unsound banking practices.
However, the Modernization Act permits bank holding companies to become financial holding companies and thereby engage in, or acquire shares of any company engaged in, activities that are financial in nature or incidental to financial activities. “Financial in nature” activities include, among other matters, securities underwriting, dealings in or making a market in securities and insurance underwriting and agency activities.
A bank holding company may become a financial holding company under the Modernization Act if each of the depository institutions controlled by it is “well-capitalized,” is and remains well managed and has at least a satisfactory rating under the Community Reinvestment Act. In addition, a bank holding company must have an effective election filed with the FRB to become a financial holding company. A bank holding company that falls out of compliance with some of these requirements may be required to cease engaging in some of its activities.
The FRB serves as the “umbrella” regulator for financial holding companies and has the power to examine new activities, regulate and supervise activities that are financial in nature or determined to be incidental to such financial activities. Accordingly, activities of subsidiaries of a financial holding company are regulated by the agency or authorities with the most experience regulating that activity as it is conducted in a financial holding company.
Source of Strength for Subsidiaries. Under the Regulation Y, a bank holding company must serve as a source of financial and managerial strength for its subsidiary banks and must not conduct its operations in an unsafe or unsound manner. If the FRB believes that an activity of a bank holding company or control of a nonbank subsidiary constitutes a serious risk to the financial safety, soundness or stability of a subsidiary bank or the bank holding company and is inconsistent with sound banking practices, the FRB may require that the bank holding company terminate the activity or terminate its control of the subsidiary engaging in that activity.
Mergers and Acquisitions by Bank Holding Companies. Subject to certain exceptions, the BHCA requires every bank holding company to obtain the prior approval of the FRB before the bank holding company may merge or consolidate with another bank holding company, acquire all or substantially all of the assets of any bank, or, direct or indirect, ownership or control of any voting securities of any bank or bank holding company, if after such acquisition the bank holding company would control, directly or indirectly, more than 5% of the voting securities of such bank or bank holding company. In approving bank acquisitions by bank holding companies, the FRB is required to consider the financial and managerial resources and future prospects of the bank holding company and the banks concerned, the convenience and needs of the communities to be served, and various competitive factors.
Anti-Tying Restrictions. Subject to certain exceptions, a bank holding company and its subsidiaries are prohibited from engaging in certain tying arrangements in connection with any extension of credit, lease or sale of property or furnishing of services.
16
Capital Adequacy. The FRB has promulgated capital adequacy guidelines for all bank holding companies with consolidated assets in excess of $150 million. The FRB’s capital adequacy guidelines are based upon a risk-based capital determination, whereby a bank holding company’s capital adequacy is determined by assigning different categories of assets and off-balance sheet items to broad risk categories.
The guidelines divide the qualifying total capital of a bank holding company into Tier I capital elements (core capital elements) and Tier 2 capital elements (supplementary capital elements). Tier I capital consists primarily of, subject to certain limitations, common stock, noncumulative perpetual preferred stock, minority interests in consolidated subsidiaries and qualifying trust preferred securities; goodwill and certain other intangibles are excluded from Tier I capital. Tier 2 capital may consist of, subject to certain limitations, an amount equal to the allowance for loan and lease losses, limited other types of preferred stock not included in Tier I capital, hybrid capital instruments and term subordinated debt. The Tier I capital must comprise at least 50% of the qualifying total capital categories.
Every bank holding company has to achieve and maintain a minimum Tier I capital ratio of at least 4% and a minimum total capital ratio of at least 8% of weighted-risk assets. In addition, bank holding companies are required to maintain a minimum ratio of Tier 1 capital to average total consolidated assets (leverage capital ratio) of at least 3% for strong banks and bank holding companies and a minimum leverage ratio of at least 4% for all other bank holding companies. As of December 31, 2006, the Holding Company’s Tier I capital ratio and total capital were 13.85% and 14.95%, respectively, and its leverage capital ratio was 11.43%.
Dividends. As a holding company that does not, as an entity, currently engage in separate business activities of a material nature, the Holding Company’s ability to pay cash dividends depends upon the cash dividends and management fees received from Intervest National Bank and management fees received from Intervest Mortgage Corporation. The Holding Company must first pay its operating and interest expenses from funds it receives from its subsidiaries. As a result, stockholders may receive cash dividends from the Holding Company only to the extent that funds are available after payment of the aforementioned expenses. In addition, the FRB generally prohibits a bank holding company from paying cash dividends except out of its net income, provided that the prospective rate of earnings retention appears consistent with the bank holding company’s capital needs, asset quality and overall financial condition.
Control Acquisitions. The Bank Control Act prohibits a person or group of persons from acquiring “control” of a bank holding company unless the FRB has been notified and has not objected to the transaction. Under a rebuttable presumption established by the FRB, the acquisition of 10% or more of a class of voting securities of a bank holding company with a class of securities registered under Section 12 of the Exchange Act, such as us, would, under the circumstances set forth in the presumption, constitute acquisition of control of such company.
In addition, any entity is required to obtain the approval of the FRB before acquiring 25% (5% in the case of an acquirer that is a bank holding company) or more of our outstanding voting securities.
Enforcement Authority. The FRB may impose civil or criminal penalties or may institute a cease-and-desist proceeding, in accordance with the Financial Institutions Supervisory Act of 1966, as amended, for the violation of applicable laws and regulations.
The Holding Company is also under the jurisdiction of the Securities and Exchange Commission (SEC) and various state securities commissions for matters related to the offering and sale of its securities, and is subject to the SEC rules and regulations relating to periodic reporting, reporting to shareholders, proxy solicitation and insider trading.
Bank Regulation – Intervest National Bank
Intervest National Bank is a nationally chartered banking association that is subject to the regulation and examination by the OCC, its primary regulator, and by virtue of the insurance of the Bank’s deposits, it is also subject to the supervision and regulation of the FDIC. Because the Bank is a member of the Federal Reserve System, it is subject to regulation pursuant to the Federal Reserve Act. In addition, because the FRB regulates the Holding Company, as described above, the FRB also has supervisory authority, which directly affects the Bank.
17
Transactions with Affiliates. Under Section 23A of the Federal Reserve Act, subject to certain exemptions, the Bank may engage in a transaction with an affiliate, including, but not limited to, a loan or extension of credit to the affiliate, a purchase of or an investment in securities issued by the affiliate, a purchase of assets from the affiliate or the issuance of a guarantee or letter of credit on behalf of an affiliate, only if the aggregate amount of the transactions with one affiliate or with all affiliates does not exceed 10% or 20%, respectively, of the capital stock and surplus of the Bank. The Bank is also generally prohibited from purchasing a low-quality asset from an affiliate. Any transaction between the Bank and an affiliate must be on terms and conditions that are consistent with safe and sound banking practices. Each loan or extension of credit to, or guarantee, acceptance, or letter of credit issued on behalf of, an affiliate by the Bank must be secured at the time of the transaction by certain collateral, as specified in Section 23A of the Federal Reserve Act.
Under Section 23B of the Federal Reserve Act, the Bank can engage in transactions with affiliates only on terms and under circumstances, including credit standards, that are substantially the same, or at least as favorable to the Bank, as those prevailing at the time for comparable transactions with nonaffiliated companies, or, in the absence of comparable transactions, on terms and under circumstances, including credit standards, that in good faith would be offered to nonaffiliated companies. The term “affiliate” with respect to the Bank includes any company that controls the Bank and any other company that is controlled by the company that controls the Bank (i.e., the term affiliate includes the Holding Company and its subsidiaries).
Loans to Insiders. Under Regulation O, the Bank is prohibited from extending credit to its executive officers, directors, principal shareholders and their related interests, collectively referred to as “insiders,” unless the extension of credit is made on substantially the same terms and in accordance with underwriting procedures that are not less stringent than those prevailing at the time for comparable transactions with unrelated persons. Regulation O also sets limits on the amount of the loan extended to insiders and stipulates what types of loans should be reported to and/or approved by the Bank’s board of directors.
Reserve Requirements. Pursuant to Regulation D, the Bank must hold a percentage of certain types of deposits as reserves in the form of vault cash, as a deposit in a Federal Reserve Bank or as a deposit in a pass-through account at a correspondent institution. For net transaction accounts in 2007, the first $8.5 million will be exempt from reserve requirements. A 3% reserve ratio will be assessed on net transaction accounts over $8.5 million up to and including $45.8 million, and a 10% reserve ratio will be assessed on net transaction accounts in excess of $45.8 million.
Dividends. All dividends paid by the Bank are paid to the Holding Company as the sole shareholder of the Bank. The general dividend policy of the Bank is to pay dividends at levels consistent with maintaining liquidity and preserving applicable capital ratios and debt servicing obligations. Under the National Bank Act and the OCC regulations, the Bank’s board of directors may declare dividends to be paid out of the Bank’s undivided profits. However, until the capital surplus equals or exceeds the capital stock of the Bank, no dividends can be declared unless, in the case of a quarterly or semiannual dividend, the Bank transfers 10% of its net income for the preceding two quarters to capital surplus, and in the case of an annual dividend, the Bank transfers 10% of its net income for the preceding four quarters to capital surplus. In addition, no dividends may be paid without the OCC’s approval if the total amount of all dividends, including the proposed dividend, declared by the Bank in any calendar year exceeds the total of the Bank’s retained net income of that year to date, combined with its retained net income of the preceding two years. Also, the Bank may not declare or pay any dividends if, after making the dividend, the Bank will be “undercapitalized” and no cash dividend may be paid by the Bank if it is in default of any deposit insurance assessment due to the FDIC.
Capital Adequacy. In general, the capital adequacy regulations which apply to national banks, such as the Bank, are similar to the FRB guidelines, which are discussed above, promulgated with respect to bank holding companies. Under the OCC regulations and guidelines, all banks must maintain a minimum ratio of total capital (after deductions) to risk-weighted assets of 8%, total assets leverage ratio (i.e., Tier 1 capital in an amount equal to at least 3% of adjusted total assets) and Tier 1 leverage ratio. For all but the most highly rated banks, the minimum Tier 1 leverage ratio is 4%. The Bank’s Tier 1 leverage capital ratio at December 31, 2006 was 9.84%.
18
Prompt Corrective Action. Banks are subject to restrictions on their activities depending on their level of capital. The OCC “prompt corrective action” regulations divide banks into five different categories, depending on their level of capital: (i) a well-capitalized bank; (ii) an adequately capitalized bank; (iii) an undercapitalized bank; (iv) a significantly undercapitalized bank; and (v) a critically undercapitalized bank.
Under these regulations, a bank is deemed to be “well-capitalized” if it has a total risk-based capital ratio of 10% or more, a Tier 1 risk-based capital ratio of 6% or more and a leverage ratio of 5% or more, and if the bank is not subject to an order or capital directive to meet and maintain a specific capital level. A bank is deemed to be “adequately capitalized” if it has a total risk-based capital ratio of 8% or more, a Tier 1 risk-based capital ratio of 4% or more and a leverage ratio of 4% or more (unless the bank is rated 1 in its most recent examination, in which instance it must maintain a leverage ratio of 3% or more) and does not meet the definition of a well-capitalized bank. A bank is deemed to be “undercapitalized” if it has a total risk-based capital ratio of less than 8%, a Tier 1 risk-based capital ratio of less than 4%, or a leverage ratio of less than 4%. A bank is deemed to be “significantly undercapitalized” if it has a total risk-based capital ratio of less than 6%, a Tier 1 risk-based capital ratio of less than 3% or a leverage ratio of less than 3%. A bank is deemed to be “critically undercapitalized” if it has a ratio of tangible equity to total assets that is equal to or less than 2%. In addition, the OCC may reclassify a well-capitalized bank as adequately capitalized and may require an adequately capitalized or an undercapitalized bank to comply with certain supervisory actions, except that the OCC may not reclassify a significantly undercapitalized bank as a critically undercapitalized bank, if the OCC has determined that the bank is in unsafe or unsound condition or that the bank has not corrected a less-than-satisfactory rating for any of the categories of asset quality, management, earnings or liquidity. At December 31, 2006, the Bank met the definition of a well-capitalized institution. A bank’s capital category is determined solely for the purpose of applying prompt corrective action regulations and the capital category may not constitute an accurate representation of a bank’s overall financial condition or prospects for other purposes.
If a bank is classified as undercapitalized, significantly undercapitalized or critically undercapitalized, it is required to submit a capital restoration plan to the OCC and becomes subject to certain requirements restricting the bank’s payment of capital distributions, management fees and compensation of senior executive officers of the bank, requiring that the OCC monitor the condition of the bank, restricting the growth of the bank’s assets, requiring prior approval of certain expansion proposals and restricting the activities of the bank.
Deposit Insurance Assessments. The Bank’s deposits are insured up to applicable limits through the Deposit Insurance Fund of the FDIC generally up to a maximum of $100,000 per separately insured depositor and up to a maximum of $250,000 for self-directed retirement accounts. The Bank, along with other depository institutions, must pay a semiannual assessment, determined in accordance with the FDIC regulations, to maintain the reserve ratio of the deposit insurance fund at the designated reserve ratio. On February 15, 2006, federal legislation to reform federal deposit insurance was enacted, which requires, among other things, an increase in the amount of federal deposit insurance coverage from $100,000 to $130,000 (with a cost of living adjustment to become effective in five years). The legislation also requires the reserve ratio to be modified to provide for a range between 1.15% and 1.50% of estimated insured deposits.
On November 2, 2006, the FDIC adopted final regulations that assess insurance premiums based on risk, which will enable the FDIC to more closely tie each financial institution’s deposit insurance premiums to the risk it poses to the deposit insurance fund. Under the new risk-based assessment system, which becomes effective in the beginning of 2007, the FDIC will evaluate the risk of each financial institution based on its supervisory rating, its financial ratios, and its long-term debt issuer rating. The new rates for nearly all of the financial institution industry will vary between five and seven cents for every $100 of domestic deposits. At the same time, the FDIC also adopted final regulations designating the reserve ratio for the deposit insurance fund during 2007 at 1.25% of estimated insured deposits.
Effective March 31, 2006, the FDIC merged the Bank Insurance Fund (“BIF”) and the Savings Association Insurance Fund (“SAIF”) into a single fund called the Deposit Insurance Fund (the “DIF”). As a result of the merger, the BIF and the SAIF were abolished. The merger does not affect the authority of the Financing
19
Corporation (“FICO”) to impose and collect, with the approval of the FDIC, assessments for anticipated payments, issuance costs and custodial fees on bonds issued by the FICO in the 1980s to recapitalize the Federal Savings and Loan Insurance Corporation. The bonds issued by the FICO are due to mature in the years 2017 through 2019. Insured banks are expected to make payments for the FICO obligations currently equal to an estimated $0.0122 per $100 of eligible deposits each year. The assessment is determined quarterly.
Community Reinvestment. Under the Community Reinvestment Act of 1977, referred to as the CRA, and regulations promulgated under the CRA, the Bank must assist in meeting the credit needs of the communities in its market areas by, among other things, providing credit to low and moderate-income individuals and neighborhoods. The FDIC applies the lending, investment and service tests to assess the bank’s CRA performance and assigns to a bank a rating of “outstanding,” “satisfactory,” “needs to improve,” or “substantial noncompliance” on the basis of the bank’s performance under these tests. All banks are required to publicly disclose their CRA performance ratings.
Enforcement Authority. The FDIC and other federal banking agencies have broad enforcement powers, including, but not limited to, the power to terminate deposit insurance, impose substantial fines and other civil and criminal penalties.
Regulation of Lending Activity. In addition to the laws and regulations discussed above, the Bank is also subject to certain consumer laws and regulations, including, but not limited to, the Truth in Lending Act, the Real Estate Settlement Procedures Act, the Equal Credit Opportunity Act of 1974, and their associated Regulations Z, X and B, respectively.
Monetary Policy and Economic Control. Commercial banking is affected not only by general economic conditions, but also by the monetary policies of the FRB. Changes in the discount rate on member bank borrowing, availability of borrowing at the “discount window,” open market operations, the imposition of changes in reserve requirements against member banks’ deposits and assets of foreign branches and the imposition of and changes in reserve requirements against certain borrowings by banks and their affiliates are some of the instruments of monetary policy available to the FRB. These monetary policies are used in varying combinations to influence overall growth and distributions of bank loans, investments and deposits, and this use may affect interest rates charged on loans or paid on deposits. The monetary policies of the FRB, which have a significant effect on the operating results of commercial banks, are influenced by various factors, including inflation, unemployment, short-term and long-term changes in the international trade balance and in the fiscal policies of the United States Government. Future monetary policies and the effect of such policies on the future business and earnings of the Company cannot be predicted.
Other Regulation - Mortgage Lending
Investment in mortgages on real properties may be affected by government regulation in several ways. Residential properties may be subject to rent control and rent stabilization laws. As a consequence, the owner of the property may be restricted in its ability to raise the rents on apartments. If real estate taxes, fuel costs and maintenance of and repairs to the property were to increase substantially, and such increases are not offset by increases in rental income, the ability of the owner of the property to make the payments due on the mortgage as and when they are due might be adversely affected.
Laws and regulations relating to asbestos have been adopted in many jurisdictions, including New York City, which require that whenever any work is undertaken in a property in an area in which asbestos is present, the asbestos must be removed or encapsulated in accordance with such applicable local and federal laws and regulations. The cost of asbestos removal or encapsulation may be substantial, and if there were not sufficient cash flow from the property, after debt service on mortgages, to fund the required work, and the owner of the property fails to fund such work from other sources, the value of the property could be adversely affected, with consequent impairment of the security for the mortgage.
Laws regulating the storage, disposal and clean up of hazardous or toxic substances at real property have been adopted at the federal, state and local levels. Such laws may impose a lien on the real property superior to any
20
mortgages on the property. In the event such a lien were imposed on any property which serves as security for a mortgage owned by the Company, the security for such mortgage could be impaired.
The lending business of the Company is regulated by federal, state and, in certain cases, local laws, including, but not limited to, the Equal Credit Opportunity Act of 1974 and Regulation B. The Equal Credit Opportunity Act and Regulation B prohibit creditors from discriminating against applicants on the basis of race, color, religion, national origin, sex, age or marital status. Regulation B also restricts creditors from obtaining certain types of information from loan applicants. Among other things, it also requires lenders to advise applicants of the reasons for any credit denial. Equal Credit Opportunity Act violations can also result in fines, penalties and other remedies.
The Company is also subject to various other federal, state and local laws, rules and regulations governing, among other things, the licensing of mortgage lenders and servicers. The Company must comply with procedures mandated for mortgage lenders and servicers, and must provide disclosures to certain borrowers. Failure to comply with these laws, as well as with the laws described above, may result in civil and criminal liability, termination or suspension of licenses, rights of rescission for mortgage loans, lawsuits and/or administrative enforcement actions.
Interstate Banking and Other Legislation Affecting the Company
The Riegle-Neal Interstate Banking and Branching Efficiency Act of 1994 facilitates the interstate expansion and consolidation of banking organizations by permitting bank holding companies that are adequately capitalized and managed to acquire banks located in states outside their home states regardless of whether such acquisitions are authorized under the law of the host state. The Act also permits interstate mergers of banks, with some limitations and the establishment of new branches on an interstate basis provided that such action is authorized by the law of the host state. The Gramm-Leach-Bliley Act of 1999 permits banks, securities firms and insurance companies to affiliate under a common holding company structure. In addition to allowing new forms of financial services combinations, this Act clarifies how financial services conglomerates will be regulated by the different federal and state regulators. The Gramm-Leach-Bliley Act amended the BHCA and expanded the permissible activities of certain qualifying bank holding companies, known as financial holding companies. In addition to engaging in banking and activities closely related to banking, as determined by the FRB by regulation or order, financial holding companies may engage in activities that are financial in nature or incidental to financial activities that are complementary to a financial activity and do not pose a substantial risk to the safety and soundness of depository institutions or the financial system generally. Under the Gramm-Leach-Bliley Act, all financial institutions, including the Company and the Bank, were required to develop privacy policies, restrict the sharing of nonpublic customer data with nonaffiliated parties at the customer’s request, and establish procedures and practices to protect customer data from unauthorized access.
A major focus of governmental policy on financial institutions recently is the emphasis on combating money laundering and terrorist financing. Under the International Money Laundering Abatement and Anti-Terrorism Financing Act of 2001 (adopted as Title III of the USA PATRIOT Act), all financial institutions are subject to additional requirements to collect customer information, monitor transactions and report certain information to U.S. law enforcement agencies concerning customers and their transactions. In general, accounts maintained by or on behalf of “non-United States persons,” as defined in the Act, are subject to particular scrutiny. Correspondent accounts for or on behalf of foreign banks with profiles that raise money-laundering concerns are subject to even greater scrutiny, and correspondent accounts for or on behalf of foreign banks with no physical presence in any country are barred altogether. Additional requirements are imposed by this Act on financial institutions, all with a view towards encouraging information sharing among financial institutions, regulators and law enforcement agencies. Financial institutions are also required to adopt and implement “anti-money-laundering programs.” The United States has imposed economic sanctions that affect transactions with designated countries, nationals and others. These rules are administered by the U.S. Treasury Department Office of Foreign Assets Control (“OFAC”). The OFAC-administered sanctions targeting countries take different forms, but generally contain one or more of the following elements: restrictions on trade with or investment in the sanctioned country, including prohibitions on U.S. persons engaging in financial transactions relating to making investments in, or providing investment related advice or assistance to a sanctioned country; and blocking of assets in which the government or specially
21
designated nationals of the sanctioned country have an interest, by prohibiting transfers of property subject to U.S. jurisdiction. Blocked assets may not be paid out, withdrawn, set off or transferred without a license from OFAC.
The Sarbanes-Oxley Act of 2002 implements legislative reforms intended to address corporate and accounting fraud. In addition to establishing a new accounting oversight board to enforce auditing, quality control and independence standards, the Act restricts auditing and consulting services by accounting firms. To ensure auditor independence, any nonaudit services being provided to an audit client will require pre-approval by a company’s audit committee. In addition, audit partners must be rotated. The Act requires chief executive and chief financial officers, or their equivalent, to certify to the accuracy of reports filed with the SEC, subject to civil and criminal penalties. In addition, under the Act, legal counsel will be required to report evidence of material violation of the securities laws or a breach of fiduciary duty by a company to its chief executive officer and, if such officer does not appropriately respond, to report such evidence to the audit committee of the board or the board itself. Executives are also prohibited from trading during retirement plan “blackout” periods, and loans to executives are restricted. The Act accelerates the time frame for disclosures by public companies, and directors and executive officers must also provide information for most changes in ownership of company securities within two business days of the change. The Act also prohibits any officer or director or any other person under their direction from taking any action to fraudulently induce, coerce, manipulate or mislead any independent public or certified accountant engaged in the audit of a company’s financial statements for the purpose of rendering the financial statement’s materially misleading. The Act also required the SEC to prescribe rules requiring the inclusion of an internal report and assessment by management in the annual report to shareholders.
Additional legislative and regulatory proposals have been made and others can be expected. These include proposals designed to improve the overall financial stability of the United States banking system, and to provide for other changes in the bank regulatory structure, including proposals to reduce regulatory burdens on banking organizations and to expand the nature of products and services banks and bank holding companies may offer. It is not possible to predict whether or in what form these proposals may be adopted in the future and, if adopted, what their effect will be on the Company.
Item 1A. Risk Factors
References in this section to “we,” “us,” and “our” refer to Intervest Bancshares Corporation and its consolidated subsidiaries, unless otherwise specified. References to the “bank” and our “mortgage lending subsidiary” refer to our subsidiaries, Intervest National Bank and Intervest Mortgage Corporation, respectively.
The following risk factors contain important information about us and our business and should be read in their entirety. Additional risks and uncertainties not known to us or that we now believe to be not material could also impair our business. If any of the following risks actually occur, our business, results of operations and financial condition could suffer significantly. As a result, the market price of our common stock could decline and you could lose all of your investment.
We depend on a small number of our executive officers and other key employees to implement our business strategy and our business may suffer if we lose their services.
Our success is largely dependent on the business expertise and relationships of a small number of our executive officers and other key employees. Jerome Dansker, our founding chairman and chief executive officer who was instrumental to our growth and performance, passed away in August 2006. Consistent with our succession planning, his duties were assumed by his son, Lowell S. Dansker. On August 17, 2006, Lowell S. Dansker, age 56, was elected our new Chairman and Chief Executive Officer. In addition, John J. Arvonio, age 44, was elected our Chief Financial Officer. Mr. Lowell S. Dansker previously served as our Vice Chairman since October 2003 and as President and Treasurer since 1993. He will continue to serve as our President. Mr. Arvonio has served as Senior Vice President, Chief Financial Officer and Secretary of the bank since September 2000 and as our Chief Accounting Officer since December 2005. He will continue to serve in those capacities. Currently, Mr. Lowell S. Dansker and Mr. Keith Olsen, age 53, President of the Florida Division of the bank, serve as our only officers with significant real estate lending experience and they make all the underwriting and lending decisions for us. If their services or any of our other executive officers or key employees were to become unavailable for any reason, our
22
growth, operations and performance may be adversely affected because of their skills and knowledge of the markets in which we operate, years of real estate lending experience and the difficulty of promptly finding qualified replacement personnel.
The Board of Directors of the Holding Company recently adopted a formal management succession plan for the Holding Company and its subsidiaries. The plan identifies internal officers to perform executive officer functions in connection with any temporary change in executive officers due to such things as illnesses or leaves of absence. The plan also describes the procedures to be followed in connection with the selection of permanent replacements, if any, for key officers. There can be no assurance that such plan would be effective.
We depend on brokers and other sources for our mortgage lending activities and any reduction in referrals could limit our ability to grow or maintain the size of our loan portfolio.
We rely significantly on referrals from mortgage brokers for our loan originations. Our ability to maintain our historical growth depends on our ability to continue to attract referrals from mortgage brokers. If those referrals were to decline or did not continue to expand, there can be no assurances that other sources of loan originations would be available to us to maintain a level of growth consistent with our historical performance.
Our loans are highly concentrated in commercial real estate and multifamily mortgage loans, increasing the risk associated with our loan portfolio.
Our loan portfolio is comprised of commercial real estate and multifamily mortgage loans, including some loans on vacant or substantially vacant properties and vacant land. We plan to continue to emphasize the origination of these types of loans. This concentration increases the risk associated with our loan portfolio. Commercial real estate and multifamily loans are generally considered riskier than many other kinds of loans, like single family residential real estate loans, since these loans tend to involve larger loan balances to one borrower or groups of related borrowers and repayment of loans secured by income-producing property is typically dependent upon the successful operation of the underlying real estate. Additionally, loans on vacant properties or vacant land typically do not have income streams and depend upon other sources of cash flow from the borrower for repayment. Additionally, many of our borrowers also have more than one mortgage loan outstanding with us. Consequently, an adverse development with respect to one loan or one credit relationship may expose us to a greater risk of loss. Our average real estate loan size was $2.8 million at December 31, 2006 and we expect that it will also continue to increase in the future. Regardless of the underwriting criteria we utilize, losses may be experienced as a result of various factors beyond our control, including, among other things, changes in market and economic conditions affecting the value of our loan collateral and problems affecting the credit and business of our borrowers.
An economic downturn in New York or Florida could hinder our ability to operate profitably and have an adverse impact on our operations.
The properties collateralizing our mortgage loans are heavily concentrated in New York City and Florida, our two primary lending market areas. Accordingly, our business and operations are vulnerable to downturns in the economies of those geographic areas. At December 31, 2006, mortgages representing 67% and 24% of the principal balance of our total loan portfolio were on properties located in New York State and Florida, respectively. A large number of the loans in New York are secured by properties located in Manhattan, Brooklyn, Queens and the Bronx. A large number of the loans in Florida are secured by properties located in Clearwater, Tampa, Fort Lauderdale, Miami, Orlando and St. Petersburg. The geographical concentration of our loans subjects us to risk that a downturn in the economy or recession in those areas could result in a decrease in our loan originations and increases in our loan delinquencies and foreclosures. Many of the properties located in the New York City area underlying our mortgage loans are subject to rent control and rent stabilization laws, which limit the ability of property owners to increase rents, which in turn may affect the borrowers’ ability to repay those mortgage loans. In addition, since a large portion of our portfolio is secured by properties located in Florida, the occurrence of a natural disaster, such as a hurricane, could result in a decline in loan originations, a decline in the value or destruction of mortgaged properties and an increase in the risk of delinquencies, foreclosures or loss on loans originated by us in that state. We may suffer losses if there is a decline in the value of the properties underlying our mortgage loans which would have an adverse impact on our operations.
23
Our historical levels of balance sheet growth and financial performance trends may not continue if our growth strategy is not successful.
A key component of our business strategy has been and will continue to be our growth, including the attraction of additional deposits and the origination of additional loans. Our ability to sustain continued growth depends upon several factors outside of our control, including economic conditions generally and in our market areas in particular, as well as interest rate trends, loan demand and competition. We can provide no assurance that we will continue to be successful in increasing the volume of our loans and deposits at acceptable risk and asset quality levels and upon acceptable terms, while managing the costs and implementation risks associated with this growth strategy. There can be no assurance that further expansion will be profitable or that we will continue to be able to sustain our historical rate of growth, either through internal growth or through other expansion of our banking markets. In addition, we have relied historically on a relatively small number of key executives in relation to the size of our company, and there can be no assurance that we will be able to manage anticipated future growth without additional management staff, which could limit short-term increases in our profitability, as we dedicate resources to the building of our infrastructure.
Changes in interest rates could adversely impact our earnings and we must continually identify and invest in mortgage loans or other instruments with rates of return above our cost of funds.
Like many financial institutions, we are subject to the risk of fluctuations in interest rates. A significant change in interest rates could have a material adverse effect on our net income. Our profitability depends primarily on the generation of net interest income which is dependent on the interest rate spread, which is the difference between yields earned on our interest-earning assets and the rates paid on our interest-bearing liabilities. As a result, our success, in large part, depends on our ability to invest a substantial percentage of our assets in mortgage loans with rates of return that exceed our cost of funds. We may also experience lower rates of return from the investment of our assets, including but not limited to proceeds from the prepayment of loans, in liquid assets such as government securities and overnight funds.
In 2006, a higher cost of funds as well as a persistent flat to inverted U.S. Treasury yield curve negatively affected our net interest margin. Our net interest margin was 2.75% and 2.70% for the year ended December 31, 2006 and 2005, respectively. Should the yield curve continue to remain flat or inverted, a decline in our net interest margin may occur, offsetting a portion of, or all gains in net interest income generated from any increase in the volume of interest-earning assets. Fluctuations in interest rates are not predictable or controllable and, therefore, there can be no assurance of our ability to maintain a consistent positive interest rate spread between the yield earned on our interest-earning assets and the rates paid on our interest-bearing liabilities. There can be no assurances that a sudden and substantial change in interest rates may not adversely impact our earnings, to the extent that the interest rates borne by assets and liabilities do not change at the same speed, to the same extent, or on the same basis. For a further discussion on interest rate risk, see the section entitled “Asset and Liability Management” in this report on Form 10-K.
If the properties underlying many of our mortgage loans lose value, we may suffer loan losses.
Our ability to recover our investment in mortgage loans is solely or primarily dependent on the market value of the properties underlying our mortgage loans because many of our mortgages that we have originated, or will originate in the future, are nonrecourse or limited recourse. Under the terms of nonrecourse mortgages, the owner of the property subject to the mortgage has no personal obligation to repay the mortgage note which the mortgage secures. In some circumstances, we may have limited recourse against the owner with respect to liabilities related to tenant security deposits, proceeds from insurance policies, losses arising under environmental laws and/or losses resulting from waste or acts of malfeasance. In addition, our losses in connection with delinquent and foreclosed loans may be more pronounced because commercial and multifamily real estate mortgage loans generally defer repayment of a substantial part of the original principal amount until maturity, and if borrowers default on their balloon payments or if we have a junior lien position, it may have a material adverse effect on our business, financial condition and results of operations. Additionally, since we tend to lend in areas that are in the process of being revitalized or redeveloped, properties securing our loans in these types of neighborhoods may be more
24
susceptible to fluctuations in property values than in more established areas. In the event we are required to foreclose on a property securing one of our mortgage loans or otherwise pursue our remedies in order to protect our investment, there can be no assurance that we will recover funds in an amount equal to our projected return on our investment or in an amount sufficient to prevent a loss to us due to prevailing economic conditions, real estate values and other factors associated with the ownership of real property. As a result, the market value of the real estate or other collateral underlying our loans may not, at any given time, be sufficient to satisfy the outstanding principal amount of the loans.
We may have higher loan losses than we have allowed for, in which case our results of operations and financial condition will be adversely affected.
We maintain an allowance for loan losses in order to mitigate the effect of possible losses inherent in our loan portfolio. There is a risk that we may experience losses which could exceed the allowance for loan losses we have set aside. In determining the size of the allowance, our management makes various assumptions and judgments about the collectibility of our loan portfolio, which are discussed in the section “Critical Accounting Policies” in this report on Form 10-K. If our assumptions and judgments prove to be incorrect or federal regulators require us to increase our provision for loan losses or recognize loan chargeoffs based on their judgments, we may have to increase our allowance for loan losses or loan chargeoffs which could have an adverse effect on our operating results and financial condition. There can be no assurances that our allowance for loan losses will be adequate to protect us against loan losses that we may incur.
We are a highly leveraged company and our indebtedness could adversely affect our financial condition and prevent us from continuing to grow our balance sheet.
At December 31, 2006, our borrowed funds (exclusive of deposits) and related interest payable was approximately $172.9 million. This level of indebtedness could make it difficult for us to satisfy all of our obligations to the holders of our debt and could limit our ability to obtain additional debt financing to fund our working capital requirements. In addition, the indentures underlying the subordinated debentures of our mortgage lending subsidiary contain financial and other restrictive covenants that may limit its ability to incur additional indebtedness. Our mortgage lending subsidiary has and expects to continue to rely on the issuance of its subordinated debentures in registered, best efforts offerings to the public as a source of funds to support its loan originations. The inability to incur additional indebtedness could adversely affect our business and financial condition by, among other things, limiting our flexibility in planning for, or reacting to, changes in our industry; placing us at a competitive disadvantage with respect to our competitors who may operate on a less leveraged basis. As a result, this may make us more vulnerable to changes in economic conditions and require us to dedicate a substantial portion of our cash flow from operations to the repayment of our indebtedness, which would reduce the funds available for other purposes, which, in turn, could have a negative impact on our profitability and growth.
We operate in a highly regulated industry and government regulations significantly affect our business.
The banking industry is extensively regulated. Banking regulations are intended primarily to protect depositors, consumers and the Deposit Insurance Fund of the Federal Deposit Insurance Corporation, referred to in this report as the FDIC, and not stockholders. We are subject to regulation and supervision by the Board of Governors of the Federal Reserve System, or Federal Reserve Board, referred to in this report as the FRB, and the bank is subject to regulation and supervision by the Office of the Comptroller of the Currency, referred to in this report as the OCC. Regulatory requirements affect our lending practices, capital structure, investment practices, asset allocations, operating practices, growth and dividend policy. The bank regulatory agencies have broad authority to prevent or remedy unsafe or unsound practices or violations of law. Recently, regulators have intensified their focus on the USA PATRIOT Act’s anti-money laundering and Bank Secrecy Act compliance requirements resulting in increased burdens to comply. There is also increased scrutiny of our compliance with the rules enforced by the Office of Foreign Assets Control. We are also subject to regulatory capital requirements, and a failure to meet minimum capital requirements or to comply with other regulations could result in actions by regulators that could adversely affect our business. In addition, changes in law, regulations and regulatory practices affecting the banking industry may limit the manner in which we may conduct our business.
25
Since we engage in collateral-based lending and may be forced to foreclose on the collateral property and own the underlying real estate, we may be subject to the risks and increased costs associated with the ownership of real estate, which could adversely affect our operating results.
Since we are a collateral-based lender, we may need to from time to time foreclose on the collateral property to protect our investment and may thereafter own and operate such property, in which case we are exposed to the risks and costs inherent in the ownership of real estate. The amount that we, as a mortgagee, may realize after a loan default, is dependent upon factors outside of our control, including, but not limited to: general or local economic conditions; neighborhood values; limitations on interest rates imposed by local law; real estate tax rates; operating expenses of the mortgaged properties; supply of and demand for rental units or properties; ability to obtain and maintain adequate occupancy of the properties; zoning laws; governmental rules, regulations and fiscal policies; and acts of God. The costs associated with the ownership of real estate, principally real estate taxes and maintenance costs, may exceed the rental income earned from such property, and we may therefore have to advance additional funds in order to protect our investment or we may be required to dispose of the real estate at a loss. Further, there is a risk that hazardous substances could be discovered on the foreclosed properties. We may then be required to remove the substances from and remediate the properties at our cost and expense. The cost of removal and environmental remediation could be substantial. We may not have adequate remedies against the owners of the properties or other responsible parties and could find it difficult or impossible to sell the affected properties. These events as well as the foregoing expenditures and costs could adversely affect our operating results, resulting in reduced levels of profitability.
The employment agreement with our Chairman permits him to engage in activities that may be considered to be competing with us, which may have an adverse effect on our business.
The employment agreement between our Chairman and the Holding Company expressly permit him to engage in outside business activities, including activities that may be competitive with our lending business.
Failure to maintain an effective system of internal control over financial reporting may not allow us to be able to accurately report our financial results or prevent fraud.
The requirements of Section 404 of the Sarbanes Oxley Act and Securities and Exchange Commission rules and regulations require an annual management report on our internal controls over financial reporting, including, among other matters, management’s assessment of the effectiveness of our internal control over financial reporting, and an attestation report by our independent registered public accounting firm addressing these assessments. Such reports have been included in this annual report on Form 10-K. Management assessed the effectiveness of our internal control over financial reporting, including safeguarding of assets as of December 31, 2006 and believes that, as of December 31, 2006, we maintained effective internal control over financial reporting, including safeguarding of assets. If we fail to maintain an effective system of internal control over financial reporting we may not be able to report our financial results with the desired degree of accuracy or to prevent fraud.
We face strong competition in our market areas, which may limit our growth and profitability.
Our primary markets consist of the New York City area and the Tampa Bay area of Florida, which are very competitive and the level of competition facing us may increase further, which may limit our growth and profitability. We experience competition in both lending and attracting deposits from other banks and nonbanks located within and outside our primary market areas, some of which are significantly larger institutions or institutions with greater resources, lower cost of funds or a more established market presence. Nonbank competitors for deposits and deposit-type accounts include savings associations, credit unions, securities firms, investment bankers, money market funds, life insurance companies and the mutual funds industry. For loans, we encounter strong competition from other banks, savings associations, finance companies, mortgage bankers and brokers, insurance companies, credit card companies, credit unions, pension funds and securities firms.
Political issues, including armed conflicts and acts of terrorism, may adversely affect our business.
Political issues, including armed conflicts and acts of terrorism, may have an adverse impact on economic conditions of the country as a whole and may be more pronounced in specific geographic regions. Economic conditions affect the market value of the mortgaged properties underlying the Company’s loans as well as the levels
26
of rent and occupancy of income-producing properties. Since the properties underlying a high concentration of our mortgage loans are located in New York City, we may be more vulnerable to the adverse impact of such occurrences than other institutions.
A breach of information security could negatively affect our business.
Increasingly, we depend upon data processing, communication and information exchange on a variety of computing platforms and networks, including over the internet. We cannot be certain that all our systems are entirely free from vulnerability to attack, despite safeguards we have instituted. In addition, we rely on the services of a variety of vendors to meet our data processing and communication needs. If information security is breached, information can be lost or misappropriated and could result in financial loss or costs to us or damages to others. These costs or losses could materially exceed the amount of insurance coverage, if any, which would adversely affect our earnings.
Item 1B. Unresolved Staff Comments
None
Item 2. Properties
The office of the Holding Company and the offices of Intervest Mortgage Corporation and the Bank’s headquarters and full-service banking office are located in leased premises (of approximately 21,500 sq. ft.) on the entire fourth floor of One Rockefeller Plaza in New York City, New York, 10020. The Bank occupies approximately one-half of this space. The lease expires in March 2014.
The Bank’s principal office in Florida is located at 625 Court Street, Clearwater, Florida, 33756. In addition, the Bank operates five other branch offices in Florida; three of which are in Clearwater, Florida, at 1875 Belcher Road North, 2175 Nursery Road and 2575 Ulmerton Road, one is at 6750 Gulfport Blvd, South Pasadena, Florida, and one is at 483 Mandalay Avenue, Clearwater Beach, Florida. The Mandalay office was opened on December 1, 2006. With the exception of the Belcher Road and Mandalay Avenue offices, which are leased through June 2012 and January 2009, respectively, the Bank owns all the properties in which its offices are located in Florida. Additionally, the Bank has options to extend the terms of the Belcher lease (for an additional five years) and the Mandalay lease (for up to an additional 12 years). All the above leases contain operating escalation clauses related to real estate taxes and operating costs based upon various criteria and are accounted for as operating leases.
The Bank’s office at 625 Court Street consists of a two-story building containing approximately 22,000 sq. ft. The Bank occupies the ground floor (approximately 8,500 sq. ft.) and leases the 2nd floor to a single commercial tenant. The branch office at 1875 Belcher Road is a two-story building in which the Bank leases approximately 5,100 sq. ft. on the ground floor. The branch office at 2175 Nursery Road is a one-story building containing approximately 2,700 sq. ft., which is entirely occupied by the Bank. The branch office at 2575 Ulmerton Road is a three-story building containing approximately 17,000 sq. ft. The Bank occupies the ground floor (approximately 2,500 sq. ft.) and leases the upper floors to various commercial tenants. The branch office at 6750 Gulfport Blvd. is a one-story building containing approximately 2,800 sq. ft., which is entirely occupied by the Bank. The branch office at 483 Mandalay Avenue is located in a shopping center known as Pelican Walk Shopping Center in which the Bank leases approximately 2,100 sq. ft. In addition, each of the Bank’s Florida offices include drive-through teller facilities (except for Mandalay Avenue) and Automated Teller Machines (ATMs). The Bank also owns a two-story building located on property contiguous to its Court Street office in Florida. The building contains approximately 12,000 sq. ft. and is leased to commercial tenants. The Bank also owns property across from its Court Street branch office in Florida. which consists of an office building that contains approximately 1,400 sq.ft. that is leased to one commercial tenant. This property provides additional parking for the Court Street branch. The Company believes that its facilities are adequate to meet its present and currently foreseeable needs.
Item 3. Legal Proceedings
The Holding Company was party to a class action lawsuit that was filed in conjunction with its 2006 proxy statement issued in advance of its annual meeting of shareholders that was held in May 2006. The lawsuit was filed in the Court of Chancery of the State of Delaware, individually and as a class action on behalf of Class A
27
stockholders. The action challenged the proposed amendment and delegation of authority to the Board of Directors of the Holding Company to extend the expiration date of the warrants held by Jerome Dansker, the Holding Company’s former Chairman.
Although the Holding Company denied any wrongdoing or liability, it determined that it was in the best interests of the Holding Company and its stockholders to reach a prompt and amicable settlement with respect to the action. In that regard, on May 15, 2006, the Holding Company entered into a Memorandum of Understanding with the plaintiff in the matter. The Memorandum provided, among other things, that: (i) if the amendments were approved by the stockholders, the authority conferred on the directors by the amendments would not provide for an extension of the terms of the warrants for more than 2 years; (ii) in determining incentive compensation of the then chairman, the Holding Company’s Compensation Committee would take into consideration any extension of the term of the warrants, the value of such extension and any related expense to the Holding Company; and (iii) the Holding Company agreed to and did send to its stockholders a supplement to its proxy statement. The proposed amendments were approved by the Holding Company’s stockholders at the annual meeting.
The parties agreed to a Stipulation of Settlement and dismissal of the action consistent with the Memorandum, which was approved by the Court of Chancery. By the terms of the Stipulation of Settlement, the Holding Company paid a total of $150,000 for the fees and out of pocket expenses of plaintiffs counsel, which is included in “professional fees” in the noninterest expense section of the 2006 consolidated statement of earnings. Jerome Dansker has since passed away and the only remaining outstanding warrants at December 31, 2006 were warrants to purchase 195,000 shares of the Holding Company’s Class B common stock, all of which were held by Mr. Dansker’s estate.
The Company is also periodically a party to or otherwise involved in legal proceedings arising in the normal course of business, such as foreclosure proceedings. Based on review and consultation with legal counsel, management does not believe that there is any pending or threatened proceeding against the Company, which, if determined adversely, would have a material effect on the business, results of operations, financial position or liquidity of the Company.
Item 4. Submission of Matters to a Vote of Security Holders
No matter was submitted to a vote of security holders during the fourth quarter ended December 31, 2006.
Executive Officers and Other Significant Employees
John J. Arvonio,age 44, serves as Chief Financial Officer and Chief Accounting Officer of Intervest Bancshares Corporation since August 2006 and December 2005, respectively, and as Senior Vice President, Chief Financial Officer and Secretary of Intervest National Bank since September 2000. Prior to that, Mr. Arvonio served as Vice President, Controller and Secretary of Intervest National Bank from April 1999 to August 2000 and as an employee of Intervest Bancshares Corporation from April 1998 to March 1999. Mr. Arvonio also serves as an Administrator of Intervest Statutory Trust V. Mr. Arvonio received a Bachelor of Business Administration degree from Iona College and is a certified public accountant. Mr. Arvonio has more than 17 years of banking experience. Prior to joining the Company, Mr. Arvonio served as Second Vice President Accounting Policy, and Technical Advisor to the Controller for The Greater New York Savings Bank from 1992 to 1997. Prior to that, Mr. Arvonio was a Manager of Financial Reporting for the Leasing and Investment Banking Divisions of Citibank from 1989 to 1992, and a Senior Auditor for Ernst & Young from 1985 to 1989.
Lowell S. Dansker, age 56, serves as Chairman of the Board of Directors, Chief Executive Officer and Chairman of the Executive Committee of Intervest Bancshares Corporation since August 2006. He previously served as Vice Chairman of the Board of Directors, President, Treasurer and member of the Executive Committee of Intervest Bancshares Corporation, except for Vice Chairman, since incorporation in 1993. Mr. Dansker served as Vice Chairman from October 2003 to August 2006. Mr. Dansker also serves as: the Chairman, Chief Executive Officer and Chairman of the Executive and Loan Committees of Intervest National Bank; Chairman, Chief Executive Officer and Chairman of the Executive Committee of Intervest Mortgage Corporation; and as an Administrator of Intervest Statutory Trust II through V. Mr. Dansker received a Bachelor of Science in Business Administration
28
from Babson College and a Law degree from the University of Akron School of Law and has been admitted to practice in New York, Ohio, Florida and the District of Columbia.
Stephen A. Helman,age 67, serves as a Director, and as Vice President and Secretary of Intervest Bancshares Corporation and has served in such capacities since December 2003 and February 2006, respectively. Mr. Helman is also a Vice President and Director of Intervest National Bank and a Vice President, Secretary and Director of Intervest Mortgage Corporation. Mr. Helman also is a member of the Executive Committee of Intervest Bancshares Corporation and Intervest Mortgage Corporation, and an Administrator of Intervest Statutory Trust V. Mr. Helman received a Bachelor of Arts degree from the University of Rochester and a law degree from Columbia University. Mr. Helman has been a practicing attorney for more than 25 years.
John H. Hoffmann,age 55, serves as Vice President and Chief Financial Officer of Intervest Mortgage Corporation since August 2006. He previously served as Vice President and Controller from 2002 to August 2006, respectively. Mr. Hoffmann received a Bachelor of Business Administration degree from Susquehanna University and is a certified public accountant. Mr. Hoffmann has more than 21 years of banking experience. Mr. Hoffmann was as Accounting Manager for Smart World Technologies, an Internet service provider, from 1998 to 2000 and a Vice President of Mortgage Accounting for The Greater New York Savings Bank from 1987 to 1997.
Erik E. Larson, age 34, serves as Vice President, Loan Operations Officer in the Florida Division of Intervest National Bank and has served in such capacities since October 2005. Prior to that, Mr. Larson was an Assistant Vice President with the Bank both in Loan Operations and Branch Management capacities. Mr. Larson joined the Bank in 1998. Prior to that, Mr. Larson served in a supervisory position with Barnett Bank. Mr. Larson received a Bachelors degree in Mathematics from Stockton State College, Pomona, New Jersey.
Elizabeth Macias,age 51, serves as Vice President of Information Technology, Systems and Security for Intervest National Bank since October 2005. Ms. Macias has served in the capacity of Bank Management Information Systems and Technology for over 23 years and Banking in general for over 30 years. Ms. Macias received a Bachelors of Science in Business from Manhattan College and an AAS, in Computer Digital Systems from PSI Institute in New York. Prior to joining the Bank, Ms. Macias served as Vice President and Director of Management Information Systems at First Central Savings Bank from April 2004 to September 2005. Prior to that, Ms. Macias served as Vice President-Director of Management Information Systems and Product Development for New York National Bank from 1983 to 2004.
Keith A. Olsen, age 53, serves as a Director and as President of the Florida Division of Intervest National Bank and has served in such capacities since July 2001. Prior to that, Mr. Olsen was the President of Intervest Bank from 1994 until it merged into Intervest National Bank in July 2001. Mr. Olsen also served as Senior Vice President of Intervest Bank from 1991 to 1994. Mr. Olsen received an Associates degree from St. Petersburg Junior College and a Bachelors degree in Business Administration and Finance from the University of Florida, Gainesville. He is also a graduate of the Florida School of Banking of the University of Florida, Gainesville, the National School of Real Estate Finance of Ohio State University and the Graduate School of Banking of the South of Louisiana State University. Mr. Olsen has been in banking for more than 30 years.
Michael Primiani,age 46, serves as Vice President, Compliance/BSA Officer and New York Office Security Officer for Intervest National Bank since December 2005. Mr. Primiani received an Associate Degree in Business Management from Queensborough Community College. Mr. Primiani has more that 26 years of banking experience. Prior to joining Intervest National Bank, Mr. Primiani served as Vice President, BSA Officer and Branch Administrator for First Central Savings Bank from March 2001 to December 2005. Prior to that, Mr. Primiani served as Assistant Vice President and Branch Manager for Astoria Federal Savings from May 1987 to February 2001, and in various supervisory positions at Astoria Federal Savings from 1979 to 1987.
Diane S. Rathburn,age 44, serves as Vice President, Operations/Human Resource Manager of the Florida Division of Intervest National Bank and has served in such capacities since January 2003. Prior to that, Mrs. Rathburn was an Assistant Vice President, Branch Coordinator and Assistant Vice President, Branch Administrator since August 1999. Mrs. Rathburn joined the Bank in July 1991. Prior to that, Mrs. Rathburn served in a supervisory position of the Bookkeeping Department of Southeast Bank.
29
Raymond C. Sullivan,age 60, serves as a Director and as President of Intervest National Bank and has served in such capacities since April 1999. Prior to that, Mr. Sullivan was an employee of Intervest Bancshares Corporation from March 1998 to March 1999. Mr. Sullivan received a Bachelor of Arts degree from St. Francis College, a Master of Business Administration degree from Fordham University, and a Master of Science degree from City College of New York. Mr. Sullivan also has a Certificate in Advanced Graduate Study in Accounting from Pace University and is a graduate of the National School of Finance and Management. Mr. Sullivan has more than 28 years of banking experience. Prior to joining the Company, Mr. Sullivan was the Operations Manager of the New York Agency Office of Banco Mercantile, C.A. from 1994 to 1997; a Senior Associate at LoBue Associates, Inc. from 1992 to 1993; and Executive Vice President, Chief Operations Officer and a director of Central Federal Savings Bank from 1985 to 1992.
PART II
Item 5. Market for Common Equity, Related Stockholder Matters and Issuer Purchases of Equity Securities
Market for Securities
The Holding Company’s Class A common stock is listed for trading on the Nasdaq Global Select Market: under the symbol “IBCA.” There is no public-trading market for the Holding Company’s Class B common stock. At December 31, 2006, there were 7,986,595 and 385,000 shares of Class A and Class B common stock outstanding, respectively. At December 31, 2006, there were approximately 100 holders of record of the Class A common stock and approximately 2,300 beneficial owners of the Class A common stock, which includes persons or entities that hold their stock in nominee form or in street name through various brokerage firms. At December 31, 2006, there were four holders of record of the Class B common stock, one of which is the Chairman of the Holding Company and its subsidiaries, and the other three are related parties of that individual. The holders of the Class B common stock, as a separate class, can elect two-thirds of the Holding Company’s directors.
The last reported sales price of the Class A common stock on December 29, 2006 and January 31, 2007 was $34.41 and $30.35 per share, respectively. The following table shows the high and low sales prices per share for the Class A common stock by calendar quarter for the periods indicated. The quotations set forth below reflect inter-dealer quotations that do not include retail markups, markdowns or commissions and may not represent actual transactions.
| | | | | | | | | | |
| | | 2006 | | | | 2005 |
| | High Low | | | | High Low |
First quarter | | $36.98 | | $23.03 | | | | $20.15 | | $17.51 |
Second quarter | | $42.87 | | $31.00 | | | | $19.25 | | $17.25 |
Third quarter | | $48.43 | | $39.43 | | | | $23.26 | | $17.80 |
Fourth quarter | | $44.64 | | $33.80 | | | | $27.40 | | $18.97 |
Dividends
Class A and Class B common stockholders are entitled to receive cash dividends when and if declared by the Holding Company’s Board of Directors out of funds legally available for such purposes. The Holding Company has never paid any cash or stock dividends on its capital stock and currently is not contemplating the payment of any dividend. The Holding Company’s ability to pay cash dividends is limited to an amount equal to the surplus which represents the excess of its net assets over paid-in-capital or, if there is no surplus, net earnings for the current and/or immediately preceding fiscal year. The primary source of funds for cash dividends payable by the Holding Company to its shareholders is the cash dividends, if any, received from its subsidiaries, Intervest Mortgage Corporation and Intervest National Bank. The payment of cash dividends by a subsidiary to the Holding Company is determined by that subsidiary’s Board of Directors and is dependent upon a number of factors, including the subsidiary’s capital requirements, applicable regulatory limitations, results of operations, financial condition and any restrictions arising from outstanding indentures. The members of the Holding Company’s Board of Directors are also members of the Board of Directors for each of the Holding Company’s subsidiaries.
The Holding Company’s ability to pay cash dividends to its shareholders is further limited by the funding requirements of its outstanding trust preferred securities. These securities were issued at various times by the Holding Company’s wholly owned business trusts, which were formed for the sole purpose of issuing trust preferred securities, the proceeds of which have been contributed to the Bank as capital contributions at various
30
times to support the Bank’s growth in assets. The Bank currently pays a monthly cash dividend to the Holding Company in order to provide the necessary funds for the debt service on the outstanding trust preferred securities. Total dividends paid by the Bank to the Holding Company in 2006, 2005 and 2004 amounted to $4.9 million, $4.4 million and $3.4 million, respectively. For a further discussion of legal limitations with regard to the payment of dividends, see the section entitled “Supervision and Regulation” included in this report.
Equity Compensation Plans
The following table summarizes information regarding equity compensation plans as of December 31, 2006, consisting of 195,000 warrants to acquire shares of Class B common stock that were granted prior to 2001 and are now held by the estate of Jerome Dansker, the Holding Company’s former Chairman, and 750,000 shares of Class A common stock issuable under the 2006 Long Term Incentive Plan, all of which were approved by stockholders.
| | | | | | |
| | | Number of securities to be issued upon exercise of outstanding options, warrants and rights | | Weighted average
exercise price of
outstanding
options, warrants
and rights | | Number of securities remaining available for future issuance under equity compensation plans, excluding securities in column (a) |
| | | (a) | | (b) | | (c) |
Plans approved by stockholders | | 195,000 | | $7.52 | | 750,000 |
Plans not approved by stockholders | | - | | - | | - |
Performance Graph
The following graph compares the cumulative total shareholder return of the Holding Company’s Class A common stock against the cumulative total return of the Nasdaq Stock Market (U.S. companies) Index, an index for banks with total assets of $1 billion to $5 billion, and the Nasdaq Bank index. The graph was prepared by SNL Financial L.C. and assumes that $100 was invested on December 31, 2001. The points marked on the horizontal axis correspond to December 31 of each year. Each of the referenced indices is calculated in the same manner. The graph depicts past performance and should not be considered to be an indication of future performance.
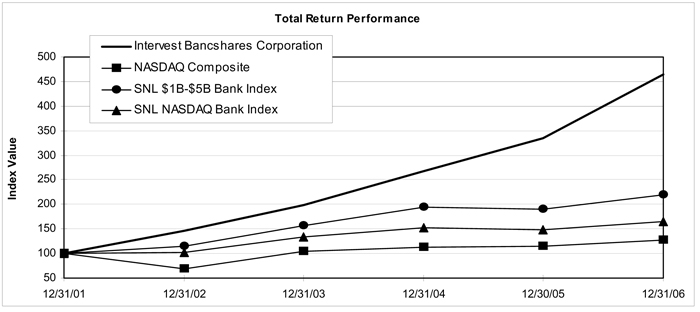
| | | | | | | | | | | | | | |
| | | Period Ending |
| Index | | | | 12/31/01 | | 12/31/02 | | 12/31/03 | | 12/31/04 | | 12/30/05 | | 12/31/06 |
Intervest Bancshares Corporation | | | | 100.00 | | 145.95 | | 197.97 | | 266.74 | | 334.46 | | 465.00 |
NASDAQ Composite | | | | 100.00 | | 68.76 | | 103.67 | | 113.16 | | 115.57 | | 127.58 |
SNL $1B-$5B Bank Index | | | | 100.00 | | 115.44 | | 156.98 | | 193.74 | | 190.43 | | 220.36 |
SNL NASDAQ Bank Index | | | | 100.00 | | 102.85 | | 132.76 | | 152.16 | | 147.52 | | 165.62 |
31
Item 6. Selected Consolidated Financial and Other Data
| | | | | | | | | | | | | | | |
| | | At or For The Year Ended December 31, |
($ in thousands, except per share data) | | | 2006 | | | 2005 | | | 2004 | | | 2003 | | | 2002 |
Financial Condition Data: | | | | | | | | | | | | | | | |
Total assets | | $ | 1,971,753 | | $ | 1,706,423 | | $ | 1,316,751 | | $ | 911,523 | | $ | 686,443 |
Cash and cash equivalents | | $ | 40,195 | | $ | 56,716 | | $ | 24,599 | | $ | 64,128 | | $ | 30,849 |
Securities held to maturity, net | | $ | 404,015 | | $ | 251,508 | | $ | 248,888 | | $ | 152,823 | | $ | 145,694 |
Loans receivable, net of deferred fees | | $ | 1,490,653 | | $ | 1,367,986 | | $ | 1,015,396 | | $ | 671,125 | | $ | 489,912 |
Deposits | | $ | 1,588,534 | | $ | 1,375,330 | | $ | 993,872 | | $ | 675,513 | | $ | 505,958 |
Borrowed funds and related accrued interest payable (1) | | $ | 172,909 | | $ | 155,725 | | $ | 202,682 | | $ | 140,383 | | $ | 114,032 |
Stockholders’ equity | | $ | 170,046 | | $ | 136,178 | | $ | 90,094 | | $ | 75,385 | | $ | 53,126 |
Nonaccrual loans | | $ | 3,274 | | $ | 750 | | $ | 4,607 | | $ | 8,474 | | $ | - |
Foreclosed real estate | | $ | - | | $ | - | | $ | - | | $ | - | | $ | 1,081 |
Allowance for loan losses | | $ | 17,833 | | $ | 15,181 | | $ | 11,106 | | $ | 6,580 | | $ | 4,611 |
Loan chargeoffs | | $ | - | | $ | - | | $ | - | | $ | - | | $ | 150 |
Loan recoveries | | $ | - | | $ | - | | $ | - | | $ | - | | $ | 107 |
Operations Data: | | | | | | | | | | | | | | | |
Interest and dividend income | | | $128,605 | | | $97,881 | | | $66,549 | | | $50,464 | | | $43,479 |
Interest expense | | | 78,297 | | | 57,447 | | | 38,683 | | | 28,564 | | | 26,325 |
Net interest and dividend income | | | 50,308 | | | 40,434 | | | 27,866 | | | 21,900 | | | 17,154 |
Provision for loan losses | | | 2,652 | | | 4,075 | | | 4,526 | | | 1,969 | | | 1,274 |
Net interest and dividend income after provision for loan losses | | | 47,656 | | | 36,359 | | | 23,340 | | | 19,931 | | | 15,880 |
Noninterest income | | | 6,855 | | | 6,594 | | | 5,140 | | | 3,321 | | | 2,218 |
Noninterest expenses | | | 13,027 | | | 10,703 | | | 8,251 | | | 7,259 | | | 6,479 |
Earnings before income taxes | | | 41,484 | | | 32,250 | | | 20,229 | | | 15,993 | | | 11,619 |
Provision for income taxes | | | 17,953 | | | 14,066 | | | 8,776 | | | 6,873 | | | 4,713 |
Net earnings | | | $ 23,531 | | | $18,184 | | | $11,453 | | | $ 9,120 | | | $ 6,906 |
Per Common Share Data (2): | | | | | | | | | | | | | | | |
Basic earnings per share | | | $ 2.98 | | | $ 2.65 | | | $ 1.89 | | | $ 1.85 | | | $ 1.71 |
Diluted earnings per share | | | $ 2.82 | | | $ 2.47 | | | $ 1.71 | | | $ 1.53 | | | $ 1.37 |
Book value per share | | | $ 20.31 | | | $ 17.41 | | | $ 14.37 | | | $ 12.59 | | | $ 11.30 |
Market price per share | | | $ 34.41 | | | $ 24.04 | | | $ 19.74 | | | $ 14.65 | | | $ 10.80 |
Other Data and Ratios: | | | | | | | | | | | | | | | |
Total Class A and B common stock outstanding | | | 8,371,595 | | | 7,823,058 | | | 6,271,433 | | | 5,988,377 | | | 4,703,087 |
Total Class A and B common stock warrants outstanding | | | 195,000 | | | 696,465 | | | 696,465 | | | 738,975 | | | 1,750,010 |
Average common shares used to calculate: | | | | | | | | | | | | | | | |
Basic earnings per share | | | 7,893,489 | | | 6,861,667 | | | 6,068,755 | | | 4,938,995 | | | 4,043,619 |
Diluted earnings per share | | | 8,401,379 | | | 7,449,658 | | | 6,828,176 | | | 6,257,720 | | | 5,348,121 |
Adjusted net earnings for diluted earnings per share | | | $23,679 | | | $18,399 | | | $11,707 | | | $9,572 | | | $7,342 |
Net interest margin | | | 2.75% | | | 2.70% | | | 2.52% | | | 2.90% | | | 2.88% |
Return on average assets | | | 1.28% | | | 1.20% | | | 1.02% | | | 1.19% | | | 1.13% |
Return on average equity | | | 15.82% | | | 16.91% | | | 14.14% | | | 15.34% | | | 15.56% |
Noninterest income to average assets | | | 0.37% | | | 0.44% | | | 0.46% | | | 0.43% | | | 0.36% |
Noninterest expenses to average assets | | | 0.71% | | | 0.71% | | | 0.74% | | | 0.95% | | | 1.06% |
Total nonperforming assets to total assets | | | 0.17% | | | 0.04% | | | 0.35% | | | 0.93% | | | 0.16% |
Total nonperforming loans to total loans | | | 0.22% | | | 0.05% | | | 0.45% | | | 1.26% | | | 0.00% |
Loans, net of unearned income to deposits | | | 94% | | | 99% | | | 102% | | | 99% | | | 97% |
Loans, net of unearned income to deposits (bank only) | | | 84% | | | 88% | | | 86% | | | 79% | | | 76% |
Allowance for loan losses to total net loans | | | 1.20% | | | 1.11% | | | 1.09% | | | 0.98% | | | 0.94% |
Allowance for loan losses to nonperforming assets | | | 545% | | | 2024% | | | 241% | | | 78% | | | 427% |
Efficiency ratio | | | 23% | | | 23% | | | 25% | | | 29% | | | 33% |
Average stockholders’ equity to average total assets | | | 8.06% | | | 7.11% | | | 7.23% | | | 7.74% | | | 7.27% |
Stockholders’ equity to total assets | | | 8.62% | | | 7.98% | | | 6.84% | | | 8.27% | | | 7.74% |
Tier 1 capital to average assets | | | 11.43% | | | 10.85% | | | 9.03% | | | 11.31% | | | 9.88% |
Tier 1 capital to risk weighted assets | | | 13.85% | | | 12.39% | | | 10.49% | | | 13.28% | | | 12.21% |
Total capital to risk weighted assets | | | 14.95% | | | 14.42% | | | 14.23% | | | 14.84% | | | 13.06% |
| (1) | Includes trust preferred securities of $56,702, $61,856, $61,856, $30,928 and $15,464 at December 31, 2006, 2005, 2004, 2003, 2002, respectively. |
| (2) | The Company has never paid any dividends whether in cash or otherwise on its Class A or Class B common stock. |
32
Item 7. Management’s Discussion and Analysis of Financial Condition and Results of Operations
Overview
Management’s discussion and analysis of financial condition and results of operations that follows should be read in conjunction with the consolidated financial statements and notes thereto included in this report on Form 10-K.
At December 31, 2006, Intervest Bancshares Corporation had two wholly owned consolidated subsidiaries, Intervest National Bank and Intervest Mortgage Corporation (hereafter referred to collectively as the “Company” on a consolidated basis). Intervest Bancshares Corporation and Intervest National Bank may be referred to individually as the “Holding Company” and the “Bank,” respectively. The Holding Company also had four wholly owned unconsolidated subsidiaries, Intervest Statutory Trust II, III, IV and V, which were formed in connection with the issuance of trust preferred securities. In October 2006, the limited operations of Intervest Securities Corporation, another wholly owned subsidiary of the Holding Company, were discontinued and its net assets were distributed to the Holding Company. For a discussion of the Company’s business, see the section entitled “Item 1 Business” in this report.
The Company’s revenues are derived from interest, dividends and fees earned on its interest-earning assets, which are comprised of mortgage loans, securities and other short-term investments, and noninterest income. The Company’s expenses consist of interest paid on its interest-bearing liabilities, which are comprised of deposits, debentures and other short-term borrowings, as well as its operating and general expenses.
The Company’s profitability depends primarily on its net interest income, which is the difference between interest income generated from its interest-earning assets and interest expense incurred on its interest-bearing liabilities. Net interest income is dependent upon the interest-rate spread, which is the difference between the average yield earned on interest-earning assets and the average rate paid on interest-bearing liabilities. When interest-earning assets approximate or exceed interest-bearing liabilities, any positive interest-rate spread will generate net interest income. The interest-rate spread is affected by interest rates, deposit flows and loan demand.
The Company’s profitability is also affected by the level of its noninterest income and expenses, provision for loan losses and income tax expense. Noninterest income consists mostly of loan and other banking fees as well as income from loan prepayments. When a mortgage loan is repaid prior to maturity, the Company may recognize prepayment income, which consists of the recognition of unearned fees associated with such loans at the time of payoff and the receipt of additional prepayment fees and or interest in certain cases, in accordance with the prepayment provisions of the mortgage loan. The Company’s income from loan prepayments fluctuates and cannot be predicted. Normally, loan prepayments tend to increase during periods of declining interest rates and tend to decrease during periods of increasing interest rates. However, given the nature and type of the mortgage loans the Company originates, including their short average life, the Company may still experience loan prepayments notwithstanding the effects of movements in interest rates. Noninterest expenses consist of the following: compensation and benefits, occupancy and equipment, data processing, advertising, professional fees, FDIC and general insurance and other operating and general expenses. The Company’s profitability is also significantly affected by general and local economic conditions, competition, changes in market interest rates, government policies and actions of regulatory authorities.
The Company’s loan portfolio is concentrated in mortgage loans secured by commercial and multifamily real estate properties (including rental and cooperative/condominium apartment buildings, office buildings, mixed-use properties, shopping centers, hotels, restaurants, industrial properties, parking lots/garages and vacant land). The loans have an average life of approximately three years.
The Company tends to lend in areas that are in the process of being revitalized or redeveloped, with a concentration of loans on properties located in New York State and the State of Florida. A significant portion of the residential properties are located in New York City and are subject to rent control and rent stabilization laws, which limit the ability of the property owners to increase rents, which in turn may affect the borrower’s ability to repay those mortgage loans.
33
Critical Accounting Policies
The preparation of the Company’s consolidated financial statements and the information included in Management’s Discussion and Analysis herein is governed by policies that are based on accounting principles generally accepted in the United States (GAAP) and general practices within the banking industry. The financial information contained in the Company’s financial statements is, to a significant extent, based on measures of the financial effects of transactions and events that have already occurred. A variety of factors could affect the ultimate value that is obtained either when earning income, recognizing an expense, recovering an asset or relieving a liability. In addition, GAAP itself may change from one previously acceptable method to another method. Among the more significant policies of the Company are those that govern accounting for loans and the allowance for loan losses. For a summary of all of the Company’s significant accounting policies, see note 1 to the consolidated financial statements included in this report.
An accounting policy is deemed to be “critical” if it is important to a company’s results of operations and financial condition, and requires significant judgment and estimates on the part of management in its application. The preparation of financial statements and related disclosures in conformity with GAAP requires management to make estimates and assumptions that affect certain amounts reported in the financial statements and related disclosures. Actual results could differ from these estimates and assumptions. The Company believes that the estimates and assumptions used in connection with the amounts reported in its financial statements and related disclosures are reasonable and made in good faith.
The Company believes that currently its only significant critical accounting policy relates to the determination of the allowance for loan losses. The allowance for loan losses is a critical accounting estimate because it is highly susceptible to change from period to period requiring management to make assumptions about future loan chargeoffs. The impact of a sudden large chargeoff could deplete the allowance and potentially require increased provisions to replenish the allowance, which could negatively affect the Company’s earnings and financial position.
The allowance for loan losses reflects management’s judgment as to the estimated losses that may result from defaults in the loan portfolio. The allowance for loan losses is established through a provision charged to operations. Loans are charged against the allowance when management believes that the collection of the principal is unlikely. Subsequent recoveries are added to the allowance.
The adequacy of the allowance for loan losses is evaluated monthly or more frequently when necessary with consideration given to the following factors: (i) the size of the loan portfolio, which has experienced rapid growth and increased individual loan balances; (ii) the nature of the loan portfolio, which is concentrated in loans secured by commercial and multifamily real estate properties, including some vacant properties and vacant land, all of which are generally considered to have more credit risk than 1-4 family residential lending because these loans tend to involve larger loan balances to single borrowers and their repayment is typically dependent upon the successful operation of the underlying real estate for income-producing properties, while loans on vacant properties and vacant land typically do not have income streams and depend upon other sources of cash flow from the borrower for repayment; (iii) specific problem loans, including loans on nonaccrual status, and estimates of fair value of the underlying properties; (iv) historical chargeoffs and recoveries; (v) adverse situations which may affect the borrowers’ ability to repay; and (vi) management’s perception of the current and anticipated economic conditions in the Company’s lending areas, which are concentrated in New York and Florida. Although management believes it uses the best information available to make determinations with respect to the allowance for loan losses, future adjustments may be necessary if economic conditions, or other factors, differ from those previously assumed in the determination of the level of the allowance.
The Company’s allowance for loan losses is comprised of an unallocated portion (which is derived from an estimated loss factor currently ranging from 0.30% to 1.35% multiplied by the principal amount of loans rated acceptable, and higher percentages for loans that are assigned a credit grade of special mention or lower) and, from time to time, an allocated (or specific) portion on certain loans, particularly for loans that have been identified as being impaired.
34
Statement of Financial Accounting Standards (SFAS) No. 114 specifies the manner in which the portion of the allowance for loan losses related to impaired loans is computed. A loan is normally deemed impaired when, based upon current information and events, it is probable that we will be unable to collect both full principal and interest due according to the contractual terms of the loan agreement. Impairment for larger balance loans such as commercial real estate and multifamily loans are measured based on: the present value of expected future cash flows, discounted at the loan’s effective interest rate; or the observable market price of the loan; or the estimated fair value of the loan’s collateral, if payment of the principal and interest is dependent upon the collateral. When the fair value of the property is less than the recorded investment in the loan, this deficiency is recognized as a valuation allowance within the overall allowance for loan losses and a charge through the provision for loan losses. The Company’s policy is to charge off any portion of the recorded investment in the loan that exceeds the fair value of the collateral. The Company considers a variety of factors in determining whether a loan is impaired, including (i) any notice from the borrower that the borrower will be unable to repay all principal and interest amounts contractually due under the loan agreement, (ii) any delinquency in the principal and/or interest payments other than minimum delays or shortfalls in payments, and (iii) other information known by management that would indicate the full repayment of principal and interest is not probable. In evaluating loans for impairment, management generally considers delinquencies of 60 days or less to be minimum delays, and accordingly does not consider such delinquent loans to be impaired in the absence of other indications. Impaired loans normally consist of loans on nonaccrual status. Generally, all loans are evaluated for impairment on a loan-by-loan basis.
Finally, the Company’s regulators, as an integral part of their examination process, periodically review the allowance for loan losses. Accordingly, the Company may be required to take certain chargeoffs and/or recognize additions to the allowance based on the regulators’ judgment concerning information available to them during their examination.
Comparison of Financial Condition at December 31, 2006 and 2005.
Overview
Selected balance sheet information by entity as of December 31, 2006 follows:
| | | | | | | | | | |
($ in thousands) | | Holding
Company | | Intervest
National
Bank | | Intervest
Mortgage
Corporation | | Inter-
Company
Amounts (1) | | Consolidated |
Cash and cash equivalents | | $ 6,700 | | $ 21,918 | | $ 36,649 | | $ (25,072) | | $ 40,195 |
Security investments | | - | | 410,953 | | - | | - | | 410,953 |
Loans receivable, net of deferred fees | | 9,076 | | 1,404,416 | | 77,161 | | - | | 1,490,653 |
Allowance for loan losses | | (85) | | (17,486) | | (262) | | - | | (17,833) |
Investment in consolidated subsidiaries | | 210,918 | | - | | - | | (210,918) | | - |
All other assets | | 4,746 | | 38,024 | | 5,923 | | (908) | | 47,785 |
Total assets | | $231,355 | | $1,857,825 | | $119,471 | | $(236,898) | | $1,971,753 |
Deposits | | $ - | | $1,613,611 | | $ - | | $ (25,077) | | $1,588,534 |
Borrowed funds and related interest payable | | 61,058 | | 25,226 | | 86,625 | | - | | 172,909 |
All other liabilities | | 251 | | 37,812 | | 3,104 | | (903) | | 40,264 |
Total liabilities | | 61,309 | | 1,676,649 | | 89,729 | | (25,980) | | 1,801,707 |
Stockholders’ equity | | 170,046 | | 181,176 | | 29,742 | | (210,918) | | 170,046 |
Total liabilities and stockholders’ equity | | $231,355 | | $1,857,825 | | $119,471 | | $(236,898) | | $1,971,753 |
| (1) | All significant intercompany balances and transactions are eliminated in consolidation. Such amounts arise largely from intercompany deposit accounts and investments in subsidiaries. |
35
A comparison of the consolidated balance sheets follows:
| | | | | | | | | | | | |
| | | At December 31, 2006 | | | At December 31, 2005 | |
($ in thousands) | |
| Carrying
Value | | % of
Total Assets |
| |
| Carrying
Value | | % of
Total Assets |
|
Cash and cash equivalents | | $ | 40,195 | | 2.0 | % | | $ | 56,716 | | 3.3 | % |
Security investments | | | 410,953 | | 20.9 | | | | 256,749 | | 15.0 | |
Loans receivable, net of deferred fees and loan loss allowance | | | 1,472,820 | | 74.7 | | | | 1,352,805 | | 79.3 | |
All other assets | | | 47,785 | | 2.4 | | | | 40,153 | | 2.4 | |
Total assets | | $ | 1,971,753 | | 100.0 | % | | $ | 1,706,423 | | 100.0 | % |
Deposits | | $ | 1,588,534 | | 80.6 | % | | $ | 1,375,330 | | 80.6 | % |
Borrowed funds and related interest payable | | | 172,909 | | 8.8 | | | | 155,725 | | 9.1 | |
All other liabilities | | | 40,264 | | 2.0 | | | | 39,190 | | 2.3 | |
Total liabilities | | | 1,801,707 | | 91.4 | | | | 1,570,245 | | 92.0 | |
Stockholders’ equity | | | 170,046 | | 8.6 | | | | 136,178 | | 8.0 | |
Total liabilities and stockholders’ equity | | $ | 1,971,753 | | 100.0 | % | | $ | 1,706,423 | | 100.0 | % |
Cash and Cash Equivalents
Cash and cash equivalents decreased to $40.2 million at December 31, 2006, from $56.7 million at December 31, 2005, due to a lower level of overnight federal funds investments. Cash and cash equivalents also include interest-bearing and noninterest-bearing cash balances with banks, and other short-term investments that have original maturities of three months or less, which are normally comprised of commercial paper and certificates of deposit issued by large commercial banks. The level of cash and cash equivalents fluctuates based on various factors, including liquidity needs, loan demand, deposit flows, calls of securities, repayments of borrowed funds and alternative investment opportunities.
Security Investments
Securities are classified as held to maturity and are carried at amortized cost when management has the intent and ability to hold them to maturity. Such investments, which are held by the Bank, increased to $404.0 million at December 31, 2006, from $251.5 million at December 31, 2005. The increase reflected new purchases exceeding maturities and calls during the period. The Bank continues to invest mainly in short-term (up to 5 year maturities) U.S. government agency debt obligations to emphasize liquidity and to target its loan-to-deposit ratio at approximately 85%. This ratio stood at 84% at December 31, 2006. During 2006, the Bank selectively purchased a number of corporate securities, consisting of trust preferred notes, to enhance yield.
At December 31, 2006, nearly all of the held-to-maturity portfolio consisted of short-term debt obligations of the Federal Home Loan Bank, Federal Farm Credit Bank, Federal National Mortgage Association and Federal Home Loan Mortgage Corporation with a weighted-average yield of 4.88% and a weighted-average remaining maturity of 2.3 years, compared to 3.26% and 1.1 years, respectively, at December 31, 2005. Nearly all of the securities have fixed rates of interest or have predetermined scheduled rate increases, and many have call features that allow the issuer to call the security before its stated maturity without penalty.
At December 31, 2006 and 2005, the held-to-maturity portfolio’s estimated fair value was $402.9 million and $249.1 million, respectively. At December 31, 2006, the held-to-maturity portfolio had net unrealized losses totaling $1.1 million, compared to $2.4 million of net unrealized losses at December 31, 2005.
Management believes that the cause of the unrealized losses is directly related to changes in market interest rates. In general, as interest rates rise, the fair value of fixed-rate securities will decrease; as interest rates fall, their fair value will increase. Management views the unrealized losses to be temporary based on the impact of changes in interest rates, the very short maturities of the investments and their high credit quality. In addition, the Bank has the ability and intent to hold its investments for a period of time sufficient for the fair value of the securities to recover, which may be at maturity. Historically, the Bank has always recovered the cost of its investment securities upon maturity.
36
In order for the Bank to be a member of the Federal Reserve Bank (FRB) and the Federal Home Loan Bank of New York (FHLB), the Bank maintains an investment in their capital stock, which amounted to $3.4 million and $3.5 million, respectively, at December 31, 2006. The FRB stock has historically paid a dividend of 6%, while the FHLB stock dividend fluctuates and most recently was 7%. The total investment, which amounted to $6.9 million at December 31, 2006, compared to $5.2 million at December 31, 2005, fluctuates based on the Bank’s capital level for the FRB stock and the Bank’s loans and borrowings for the FHLB stock.
Loans Receivable, Net of Deferred Fees and Allowance for Loan Losses
Loans receivable, net of deferred fees and the allowance for loan losses, increased to $1.47 billion at December 31, 2006, from $1.35 billion at December 31, 2005. The growth reflected new mortgage loan originations secured by commercial and multifamily real estate exceeding principal repayments. New loan originations totaled $548 million in 2006, compared to $707 million in 2005, of which the Bank’s originations were $487 million in 2006 compared to $661 million in 2005, and Intervest Mortgage Corporation’s originations were $61 million in 2006 compared to $46 million in 2005.
Nearly all (99.9%) of the Company’s loan portfolio is concentrated in mortgage loans secured by commercial and multifamily real estate properties (including rental and cooperative/condominium apartment buildings, office buildings, mixed-use properties, shopping centers, hotels, restaurants, industrial properties, parking lots/garages and vacant land). At December 31, 2006, such loans consisted of 536 loans with an aggregate principal balance of $1.5 billion and an average principal size of $2.8 million. Loans with principal balances of $5.0 million or more aggregated to 82 loans or $738.7 million, with the largest loan amounting to $20.5 million.
Nonaccrual loans at December 31, 2006 totaled $3.3 million and were comprised of two multifamily real estate loans. Foreclosure actions have been commenced for nonpayment. In September 2006, the Company received full principal repayment of loans on nonaccrual status at December 31, 2005 totaling $0.7 million. Nonaccrual loans are considered impaired under the criteria of SFAS No. 114, but no valuation allowance was maintained at any time since the Company believes that the estimated fair value of the underlying properties exceeded its recorded investment. At December 31, 2006 and 2005, there were no other impaired loans. At December 31, 2005, there were $2.6 million of loans ninety days past due and still accruing interest, compared to none at December 31, 2006.
At December 31, 2006, the Bank was closely monitoring four real estate loans totaling $8.5 million, each of which are collateralized by real estate located in New Jersey. Each loan is guaranteed by a principal who is experiencing legal and financial difficulties and for whom a court-appointed fiscal and liquidation agent has been appointed to administer his assets. As of December 31, 2006, all of these loans were on accruing status as the Bank is receiving payments of principal and interest. All four loans were originated within the Bank’s underwriting guidelines.
Although the Company presently believes that its two nonaccrual loans and the four loans it is closely monitoring are well collateralized, there can be no assurance that the Company will not incur loan chargeoffs or significant expenses with respect to the ultimate collection of these loans.
Allowance for Loan Losses
At December 31, 2006, the allowance for loan losses amounted to $17.8 million, compared to $15.1 million at December 31, 2005, and represented 1.20% of total loans (net of deferred fees) outstanding at December 31, 2006 and 1.11% at December 31, 2005. The increase in the allowance was due to provisions aggregating $2.7 million, of which $1.6 million resulted from net loan growth (which amounted to $122 million from December 31, 2005) and $1.1 million resulted from decreases in the internal credit ratings of several loans.
For a further discussion of the criteria the Company uses to determine the adequacy of the allowance for loan losses, see the section entitled “Critical Accounting Policies” included in this report.
37
All Other Assets
The following below sets forth the composition of the caption “All other assets:”
| | | | | | |
| | | At December 31, |
($ in thousands) | | | 2006 | | | 2005 |
Accrued interest receivable | | $ | 12,769 | | $ | 7,706 |
Loan fees receivable | | | 10,443 | | | 10,941 |
Premises and equipment, net | | | 6,379 | | | 6,421 |
Deferred income tax asset | | | 8,694 | | | 6,988 |
Deferred debenture offering costs, net | | | 5,158 | | | 5,610 |
Investment in unconsolidated subsidiaries | | | 1,702 | | | 1,856 |
Income tax receivable | | | 1,402 | | | - |
All other | | | 1,238 | | | 631 |
| | | $ | 47,785 | | $ | 40,153 |
Accrued interest receivable fluctuates based on the level of interest-earning assets outstanding and the timing of interest payments received. The increase of $5.1 million from December 31, 2005 was due to the growth in interest-earning assets.
Loan fees receivable are fees due to the Company in accordance with the terms of mortgage loans. Such amounts are generally due upon the full repayment of the loan. This fee is recorded as deferred income at the time a loan is originated and is then amortized to interest income over the life of the loan as a yield adjustment. The decrease of $0.5 million from December 31, 2005 was due to payments exceeding new fees.
Premises and equipment remained relatively unchanged as net purchases of $0.5 million during the year were offset by normal depreciation and amortization.
The deferred income tax asset relates primarily to the unrealized tax benefit on the Company’s allowance for loan losses. The allowance has been expensed for financial statement purposes but it is currently not deductible for income tax purposes until actual loan chargeoffs are incurred. The increase in the deferred tax asset of $1.7 million from December 31, 2005 is primarily a function of the increase in the allowance for loan losses during the period.
Deferred debenture offering costs consist primarily of underwriters’ commissions and are amortized over the terms of the debentures. The net decrease of $0.5 million from December 31, 2005 was due to normal amortization during 2006 of $1.2 million as well as $0.5 million that was expensed as a result of the repayment of certain debentures prior to their stated maturity, partially offset by $1.2 million of additional costs incurred in connection with the issuance of new debentures. The $0.5 million expense was reported as a “Loss on the early extinguishment of debentures” in the 2006 consolidated statement of earnings.
The investment in unconsolidated subsidiaries at December 31, 2006 consists of the Holding Company’s total common stock investment in its wholly owned business trusts, Intervest Statutory Trust II, III, IV and V. Income tax receivable represents an overpayment of estimated taxes as of December 31, 2006. The increase in all other assets was due to a $0.6 million receivable resulting from a satisfaction of a loan at year-end 2006. The receivable was collected in the first quarter of 2007.
Deposits
Deposits increased to $1.59 billion at December 31, 2006, from $1.38 billion at December 31, 2005, reflecting an increase of $216.9 million in certificate of deposit accounts, partially offset by a net decrease in checking, savings and money market accounts totaling $3.7 million.
At December 31, 2006, certificate of deposit accounts totaled $1.34 billion, and checking, savings and money market accounts aggregated $253.1 million. The same categories of deposit accounts totaled $1.12 billion and $256.8 million, respectively, at December 31, 2005. Certificate of deposit accounts represented 84% of total deposits at December 31, 2006, compared to 81% at December 31, 2005. At December 31, 2006 and 2005, certificate of deposit accounts included $55.7 million and $40.5 million, respectively, of brokered deposits.
38
Borrowed Funds and Related Interest Payable
The following table summarizes borrowed funds and related interest payable:
| | | | | | | | |
| | | At December 31, 2006 | | At December 31, 2005 |
($ in thousands) | | Principal | | Accrued
Interest | | Principal | | Accrued
Interest |
Debentures - Intervest Mortgage Corporation | | $ 83,750 | | $2,875 | | $ 82,750 | | $4,699 |
Debentures - Holding Company | | 2,960 | | 1,265 | | 4,640 | | 1,397 |
Debentures - Capital Securities - Holding Company | | 56,702 | | 131 | | 61,856 | | 154 |
FHLB advances - Intervest National Bank | | 25,000 | | 11 | | - | | - |
Mortgage note payable - Intervest National Bank | | 215 | | - | | 229 | | - |
| | | $168,627 | | $4,282 | | $149,475 | | $6,250 |
Intervest Mortgage Corporation’s outstanding debentures increased by $1.0 million due to a new issue of $16.0 million, largely offset by principal repayments totaling $15.0 million.
The Holding Company’s outstanding debentures decreased by $1.7 million due to principal repayments of $1.3 million and the conversion of $0.4 million of convertible debentures into common stock. In 2006, $0.7 million of convertible debentures ($0.4 million of principal and $0.3 million of related accrued interest payable) were converted into 47,072 shares of the Holding Company’s Class A common stock at the election of the debenture holders.
The Holding Company’s outstanding debentures–capital securities decreased by $5.2 million due to the repayment of $15.5 million of debentures (with a fixed rate of 9.88%), partially offset by the issuance of $10.3 million of new debentures (with a fixed rate of 6.83% for five years and thereafter floating at 1.65% over 3 month libor).
As a result of the repayment of debentures prior to their stated maturity, a total of $0.5 million of related unamortized issuance costs were expensed, which is included in “Loss on the early extinguishment of debentures” in the 2006 consolidated statement of earnings.
At December 31, 2006, the Bank had $25.0 million of FHLB borrowings outstanding that mature in January 2007. The Bank also has a mortgage note payable outstanding that was issued in connection with the Bank’s purchase in 2002 of property that is located across the street from its Court Street branch office in Florida.
Accrued interest payable on borrowed funds decreased to $4.3 million at December 31 2006, from $6.3 million at December 31, 2005. The decrease was due to repayments of interest as well as the decrease resulting from the conversion of debentures noted above, partially offset by new accruals. A large portion of the accrued interest payable is due and payable at the maturity of various debentures. For a further discussion of borrowed funds, see notes 7 and 9 to the consolidated financial statements included in this report, as well as the section entitled “Liquidity and Capital Resources.”
All Other Liabilities
The following table sets forth the composition of the caption “All other liabilities:”
| | | | | | |
| | | At December 31, |
($ in thousands) | | | 2006 | | | 2005 |
Mortgage escrow funds payable | | $ | 19,747 | | $ | 20,302 |
Official checks outstanding | | | 13,178 | | | 11,689 |
Accrued interest payable on deposits | | | 4,259 | | | 3,232 |
Income taxes payable | | | - | | | 1,643 |
All other liabilities | | | 3,080 | | | 2,324 |
| | | $ | 40,264 | | $ | 39,190 |
Mortgage escrow funds payable represent advance payments made to the Company by borrowers for property taxes and insurance that are remitted by the Company to third parties. The decrease of $0.6 million from December 31, 2005 reflected primarily the timing of tax payments made by the Company to third parties.
39
Official checks outstanding vary and fluctuate based on banking activity. Accrued interest payable on deposits fluctuates based on total deposits and the timing of interest payments. The increase of $1.0 million in accrued interest payable from December 31, 2005 reflected the growth in deposits.
Income taxes payable fluctuates based on the Company’s earnings, effective tax rate and timing of tax payments. At December 31, 2006, the Company was in an income taxes receivable position due to the exercise of employee stock warrants in the fourth quarter of 2006. The Company’s income taxes payable was reduced by a $6.2 million tax benefit from the exercise of employee stock warrants (calculated as the difference between the fair market value of the stock issued at the time of the exercise and the warrant exercise price, multiplied by the Company’s effective income tax rate). The net tax benefit is reflected as an increase to the Company’s paid-in capital as required by GAAP.
All other liabilities are comprised mainly of accrued expenses and fees received on loan commitments that have not yet been funded. The increase of $0.8 million from December 31, 2005 reflected a $1.5 million death benefit expense accrual (as more fully described in note 18 to the consolidated financial statements included in this report), partially offset primarily by a lower level of other accrued expenses.
Stockholders’ Equity
Stockholders’ equity increased to $170.0 million at December 31, 2006, from $136.2 million at December 31, 2005 as follows:
| | | | | | | | |
($ in thousands) | | | Amount | | Shares | |
| Per
Share |
Stockholders’ equity at December 31, 2005 | | $ | 136,178 | | 7,823,058 | | $ | 17.41 |
Net earnings for the year | | | 23,531 | | - | | | - |
Exercise of common stock warrants, inclusive of income tax benefit (1) | | | 9,593 | | 501,465 | | | 19.13 |
Convertible debentures converted at election of debenture holders | | | 744 | | 47,072 | | | 15.80 |
Stockholders’ equity at December 31, 2006 | | $ | 170,046 | | 8,371,595 | | $ | 20.31 |
(1) Includes $6.2 million of income tax benefit.
40
Comparison of Results of Operations for the Years Ended December 31, 2006 and 2005.
Overview
Consolidated net earnings for 2006 increased by $5.3 million, or 29%, to $23.5 million, or $2.82 per diluted share, from $18.2 million, or $2.47 per diluted share, in 2005. The increase in earnings was due to growth in net interest and dividend income of $9.9 million, a decrease of $1.4 million in the provision for loan losses and a $0.2 million increase in noninterest income. These improvements were partially offset by a $3.9 million increase in the provision for income taxes and a $2.3 million increase in noninterest expenses.
The Company’s return on average assets and equity was 1.28% and 15.82%, respectively, in 2006, compared to 1.20% and 16.91% in 2005, and its efficiency ratio (which is a measure of its ability to control expenses as a percentage of its revenues) continued to be favorable and was 23% in 2006 and 2005.
Selected information regarding results of operations by entity for 2006 follows:
| | | | | | | | | | | | |
| ($ in thousands) | | Intervest
National Bank | | Intervest Mortgage Corp. | | Intervest Securities Corp. | | Holding Company | | Inter- Company Amts (2) | | Consolidated |
Interest and dividend income | | $117,460 | | $11,079 | | $20 | | $ 852 | | $ (806) | | $128,605 |
Interest expense | | 66,996 | | 7,197 | | - | | 4,910 | | (806) | | 78,297 |
| | |
Net interest and dividend income | | 50,464 | | 3,882 | | 20 | | (4,058) | | - | | 50,308 |
Provision for loan losses | | 2,640 | | 12 | | - | | - | | - | | 2,652 |
Noninterest income | | 5,906 | | 5,911 | | 50 | | 458 | | (5,470) | | 6,855 |
Noninterest expenses | | 13,295 | | 3,968 | | 68 | | 1,166 | | (5,470) | | 13,027 |
Earnings before taxes | | 40,435 | | 5,813 | | 2 | | (4,766) | | - | | 41,484 |
Provision for income taxes | | 17,466 | | 2,687 | | 1 | | (2,201) | | - | | 17,953 |
Net earnings | | $ 22,969 | | $ 3,126 | | $ 1 | | $(2,565) | | $ - | | $ 23,531 |
Intercompany dividends (1) | | (4,884) | | - | | - | | 4,884 | | - | | - |
Net earnings after intercompany dividends | | $ 18,085 | | $ 3,126 | | $ 1 | | $ 2,319 | | $ - | | $ 23,531 |
Net earnings after intercompany dividends for 2005 | | $ 12,999 | | $ 3,089 | | $24 | | $ 2,072 | | $ - | | $ 18,184 |
| (1) | Dividends to the Holding Company from the Bank provide funds for the debt service on the subordinated debentures- capital securities, which is included in the Holding Company’s interest expense. |
| (2) | All significant intercompany balances and transactions are eliminated in consolidation. Such amounts arise from intercompany deposit accounts and management and service agreements. |
Net Interest and Dividend Income
Net interest and dividend income is the Company’s primary source of earnings and is influenced primarily by the amount, distribution and repricing characteristics of its interest-earning assets and interest-bearing liabilities as well as by the relative levels and movements of interest rates.
Net interest and dividend income increased by $9.9 million to $50.3 million in 2006, from $40.4 million in 2005. The improvement was attributable to a $329 million increase in average interest-earning assets resulting from continued growth in loans of $245 million and security and short-term investments aggregating $84 million. The growth in average assets was funded by $281 million of additional interest-bearing deposits, a $4 million increase in borrowed funds and a $41 million increase in stockholders’ equity. The increase in average stockholders equity was due to earnings, the issuance of shares in a public offering ($26.3 million of proceeds) in the third quarter of 2005 and from the conversion of convertible debentures and exercise of common stock warrants during 2006.
The Company’s net interest margin increased to 2.75% in 2006 from 2.70% in 2005. The higher margin was a function of a $44 million increase in net average interest-earning assets, resulting mostly from the growth in stockholders’ equity noted above, partially offset by the Company’s cost of funds increasing at a faster pace than the yield on its interest-earning assets. In a rising rate environment, the yield on interest-earning assets increased 51 basis points to 7.04% in 2006. The increase was a function of rate increases on existing variable-rate loans indexed to the prime rate (the impact of which was partially offset by lower competitive pricing for new loans) and
41
higher yields earned on security and other short-term investments. The cost of funds increased by 53 basis points to 4.74% in 2006 due to higher rates paid on deposit accounts.
The following table provides information on average assets, liabilities and stockholders’ equity; yields earned on interest-earning assets; and rates paid on interest-bearing liabilities for 2006 and 2005. The yields and rates shown are based on a computation of income/expense (including any related fee income or expense) for each year divided by average interest-earning assets/interest-bearing liabilities during each year. Average balances are derived from daily balances. Net interest margin is computed by dividing net interest and dividend income by the average of total interest-earning assets during each year.
| | | | | | | | | | | | | | | | | | |
| | | For the Year Ended December 31, | |
| | | 2006 | | | 2005 | |
| ($ in thousands) | | Average
Balance | | Interest
Inc./Exp. | | Yield/
Rate | | | Average
Balance | | Interest
Inc./Exp. | | Yield/
Rate | |
Assets | | | | | | | | | | | | | | | | | | |
Interest-earning assets: | | | | | | | | | | | | | | | | | | |
Loans (1) | | $ | 1,451,366 | | $ | 112,390 | | 7.74 | % | | $ | 1,206,089 | | $ | 89,590 | | 7.43 | % |
Securities | | | 343,728 | | | 14,647 | | 4.26 | | | | 258,906 | | | 7,229 | | 2.79 | |
Other interest-earning assets | | | 32,105 | | | 1,568 | | 4.88 | | | | 32,865 | | | 1,062 | | 3.23 | |
Total interest-earning assets | | | 1,827,199 | | $ | 128,605 | | 7.04 | % | | | 1,497,860 | | $ | 97,881 | | 6.53 | % |
Noninterest-earning assets | | | 17,634 | | | | | | | | | 14,906 | | | | | | |
Total assets | | $ | 1,844,833 | | | | | | | | $ | 1,512,766 | | | | | | |
Liabilities and Stockholders’ Equity | | | | | | | | | | | | | | | | | | |
Interest-bearing liabilities: | | | | | | | | | | | | | | | | | | |
Interest checking deposits | | $ | 7,991 | | $ | 148 | | 1.85 | % | | $ | 10,636 | | $ | 166 | | 1.56 | % |
Savings deposits | | | 13,803 | | | 407 | | 2.95 | | | | 22,397 | | | 536 | | 2.39 | |
Money market deposits | | | 234,723 | | | 9,782 | | 4.17 | | | | 202,618 | | | 5,947 | | 2.94 | |
Certificates of deposit | | | 1,226,258 | | | 55,294 | | 4.51 | | | | 966,128 | | | 38,270 | | 3.96 | |
Total deposit accounts | | | 1,482,775 | | | 65,631 | | 4.43 | | | | 1,201,779 | | | 44,919 | | 3.74 | |
FHLB advances and Federal funds purchased | | | 10,215 | | | 543 | | 5.32 | | | | 4,871 | | | 139 | | 2.85 | |
Debentures and related interest payable | | | 92,820 | | | 7,617 | | 8.21 | | | | 96,007 | | | 8,014 | | 8.35 | |
Debentures - capital securities | | | 64,144 | | | 4,490 | | 7.00 | | | | 61,856 | | | 4,359 | | 7.05 | |
Mortgage note payable | | | 222 | | | 16 | | 7.21 | | | | 236 | | | 16 | | 6.99 | |
Total borrowed funds | | | 167,401 | | | 12,666 | | 7.57 | | | | 162,970 | | | 12,528 | | 7.69 | |
Total interest-bearing liabilities | | | 1,650,176 | | $ | 78,297 | | 4.74 | % | | | 1,364,749 | | $ | 57,447 | | 4.21 | % |
Noninterest-bearing deposits | | | 5,322 | | | | | | | | | 6,335 | | | | | | |
Noninterest-bearing liabilities | | | 40,554 | | | | | | | | | 34,162 | | | | | | |
Stockholders’ equity | | | 148,781 | | | | | | | | | 107,520 | | | | | | |
Total liabilities and stockholders’ equity | | $ | 1,844,833 | | | | | | | | $ | 1,512,766 | | | | | | |
Net interest and dividend income/spread | | | | | $ | 50,308 | | 2.30 | % | | | | | $ | 40,434 | | 2.32 | % |
Net interest-earning assets/margin | | $ | 177,023 | | | | | 2.75 | % | | $ | 133,111 | | | | | 2.70 | % |
Ratio of total interest-earning assets | | | | | | | | | | | | | | | | | | |
To total interest-bearing liabilities | | | 1.11x | | | | | | | | | 1.10x | | | | | | |
Other Ratios: | | | | | | | | | | | | | | | | | | |
Return on average assets | | | 1.28% | | | | | | | | | 1.20% | | | | | | |
Return on average equity | | | 15.82% | | | | | | | | | 16.91% | | | | | | |
Noninterest expense to average assets | | | 0.71% | | | | | | | | | 0.71% | | | | | | |
Efficiency ratio (2) | | | 23% | | | | | | | | | 23% | | | | | | |
Average stockholders’ equity to average assets | | | 8.06% | | | | | | | | | 7.11% | | | | | | |
| (1) | Includes average nonaccrual loans of $6.7 million in 2006 and $3.8 million in 2005. |
| (2) | Defined as noninterest expenses (excluding the provision for loan losses) as a percentage of net interest and dividend income plus noninterest income. Noninterest expenses for 2006 period included a one-time charge of $1.5 million. |
42
The following table provides information regarding changes in interest and dividend income and interest expense. For each category of interest-earning assets and interest-bearing liabilities, information is provided on changes attributable to (1) changes in rate (change in rate multiplied by prior volume), (2) changes in volume (change in volume multiplied by prior rate) and (3) changes in rate-volume (change in rate multiplied by change in volume).
| | | | | | | | | | | | | | | |
| | | For the Year Ended December 31, 2006 vs. 2005
Increase (Decrease) Due To Change In: | |
($ in thousands) | | | Rate | | | | Volume | | | Rate/Volume | | | | Total | |
Interest-earning assets: | | | | | | | | | | | | | | | |
Loans | | $ | 3,739 | | | $ | 18,224 | | | $ 837 | | | $ | 22,800 | |
Securities | | | 3,806 | | | | 2,367 | | | 1,245 | | | | 7,418 | |
Other interest-earning assets | | | 542 | | | | (25 | ) | | (11 | ) | | | 506 | |
Total interest-earning assets | | | 8,087 | | | | 20,566 | | | 2,071 | | | | 30,724 | |
Interest-bearing liabilities: | | | | | | | | | | | | | | | |
Interest checking deposits | | | 31 | | | | (41 | ) | | (8 | ) | | | (18 | ) |
Savings deposits | | | 125 | | | | (205 | ) | | (49 | ) | | | (129 | ) |
Money market deposits | | | 2,492 | | | | 944 | | | 399 | | | | 3,835 | |
Certificates of deposit | | | 5,314 | | | | 10,301 | | | 1,409 | | | | 17,024 | |
Total deposit accounts | | | 7,962 | | | | 10,999 | | | 1,751 | | | | 20,712 | |
FHLB advances and Federal funds purchased | | | 120 | | | | 152 | | | 132 | | | | 404 | |
Debentures and related interest payable | | | (134 | ) | | | (266 | ) | | 3 | | | | (397 | ) |
Debentures- capital securities | | | (31 | ) | | | 161 | | | 1 | | | | 131 | |
Mortgage note payable | | | 1 | | | | (1 | ) | | - | | | | - | |
Total borrowed funds | | | (44 | ) | | | 46 | | | 136 | | | | 138 | |
Total interest-bearing liabilities | | | 7,918 | | | | 11,045 | | | 1,887 | | | | 20,850 | |
Net change in interest and dividend income | | $ | 169 | | | $ | 9,521 | | | $ 184 | | | $ | 9,874 | |
Provision for Loan Losses
The provision for loan losses decreased by $1.4 million to $2.7 million in 2006, from $4.1 million in 2005. The lower provision was primarily due to a decrease in the rate of net loan growth over 2005, partially offset by $1.1 million of additional reserves associated with decreases in internal credit ratings of several loans in 2006. Total loans grew by $123 million in 2006, compared to $354 million in 2005. The provision for 2005 was favorably affected by a $0.6 million reduction in reserves resulting from the full repayment of a $3.9 million nonaccrual loan in April 2005.
Noninterest Income
Noninterest income increased by $0.2 million to $6.8 million in 2006 and is summarized as follows:
| | | | |
| | | For the Year Ended December 31, |
| ($ in thousands) | | 2006 | | 2005 |
Customer service fees | | $ 447 | | $ 334 |
Income from mortgage lending activities (1) | | 1,409 | | 1,082 |
Income from the early repayment of mortgage loans (2) | | 4,937 | | 5,062 |
Commissions and fees | | 50 | | 115 |
Gain from early call of investment securities (3) | | 12 | | 1 |
| | | $6,855 | | $6,594 |
| | (1) | Consists mostly of fees from expired loan commitments and loan servicing, maintenance and inspection charges. |
| | (2) | Consists of the recognition of unearned fees associated with such loans at the time of payoff and the receipt of prepayment penalties and interest in certain cases. |
| | (3) | Consists of the recognition of any unamortized premium or discount at time of call. |
Noninterest income increased due to a $0.3 million increase in income from mortgage lending activities resulting from an increase in fees earned from expired loan commitments that were not funded and higher loan service charges. Income from the early repayment of loans for 2006 and 2005 included $0.3 million and $0.6 million, respectively, from the satisfaction of nonaccrual loans.
43
Noninterest Expenses
Noninterest expenses increased by $2.3 million to $13.0 million in 2006 and are summarized as follows:
| | | | |
| | | For the Year Ended December 31, |
| ($ in thousands) | | 2006 | | 2005 |
Salaries and employee benefits | | $ 6,935 | | $ 5,726 |
Occupancy and equipment, net | | 1,675 | | 1,487 |
Data processing | | 743 | | 605 |
Professional fees and services | | 1,160 | | 773 |
Stationery, printing and supplies | | 230 | | 211 |
Postage and delivery | | 142 | | 129 |
FDIC and general insurance | | 374 | | 324 |
Director and committee fees | | 407 | | 527 |
Advertising and promotion | | 281 | | 225 |
Loss on the early extinguishment of debentures | | 501 | | - |
All other expenses | | 579 | | 696 |
| | | $13,027 | | $10,703 |
Salaries and employee benefits expense increased due to a one-time charge of $1.5 million associated with the Company’s contractual obligation to provide death benefit payments to the spouse of the Company’s former Chairman and founder, Jerome Dansker (as discussed in note 18 to the consolidated financial statements included in this report), and increases in payroll costs of $0.5 million (resulting from additional employees, salary increases and a higher cost of employee benefits). These items were partially offset by a decrease of $0.8 million in executive bonuses. The Company had 72 employees at December 31, 2006, compared to 69 at December 31, 2005.
Occupancy and equipment expense increased primarily due to additional rent for the Bank’s new Mandalay branch, as well as increases in real estate taxes, escalation charges, utilities and repair and maintenance expenses.
Data processing expense increased due to the growth in the Bank’s assets.
Professional fees and services expense increased due to higher legal fees, increased fees associated with external financial statement audits and OCC regulatory exams, and a full year’s expense associated with the outsourcing of the Bank’s internal audit function in late 2005.
FDIC and general insurance expense increased primarily due to a higher level of deposits and insurance rate increases.
Director and committee fees expense decreased primarily due to their being one less director for part of 2006 and one director who became an employee in 2006 and no longer receives fees for attending meetings.
Advertising expense increased due to additional advertising to support loan and deposit growth. Expenses for stationery, printing, supplies, postage and delivery increased primarily due to the Company’s growth in assets and deposits.
The loss on the early extinguishment of debentures represents unamortized issuance costs that were expensed in connection with the repayment of debentures prior to their stated maturity, of which $0.4 million was associated with the early repayment of $15.5 million of trust preferred securities.
All other expenses decreased primarily due to the payment of a Nasdaq National Market entry fee in 2005.
Provision for Income Taxes
The provision for income taxes increased by $3.9 million to $18.0 million in 2006, from $14.1 million in 2005, due to higher pre-tax income. The Company’s effective tax rate (inclusive of state and local taxes) amounted to 43.3% in 2006, compared to 43.6% in 2005.
44
Comparison of Results of Operations for the Years Ended December 31, 2005 and 2004.
Overview
Consolidated net earnings for 2005 increased by $6.7 million, or 59%, to $18.2 million, or $2.47 per diluted share, from $11.5 million, or $1.71 per diluted share, reported in 2004. The $6.7 million increase in earnings was due to growth in net interest and dividend income of $12.6 million, an increase of $1.5 million in noninterest income and a decrease in the provision for loan losses of $0.4 million. These improvements were partially offset by a $5.3 million increase in the provision for income taxes and a $2.5 million increase in noninterest expenses. The Company’s return on average assets and equity improved to 1.20% and 16.91%, respectively, in 2005, from 1.02% and 14.14% in 2004, and its efficiency ratio (which is a measure of its ability to control expenses as a percentage of its revenues) continued to be favorable and improved to 23% in 2005 from 25% in 2004.
Selected information regarding results of operations by entity for 2005 follows:
| | | | | | | | | | | | | |
($ in thousands) | | Intervest
National
Bank |
| | Intervest
Mortgage
Corp. | | Intervest
Securities
Corp. | | Holding
Company | | Inter-
Company
Amts (2) | | Consolidated |
Interest and dividend income | | $87,257 | | | $10,197 | | $ 13 | | $ 931 | | $ (517) | | $ 97,881 |
Interest expense | | 45,591 | | | 7,370 | | - | | 5,003 | | (517) | | 57,447 |
| | |
Net interest and dividend income | | 41,666 | | | 2,827 | | 13 | | (4,072) | | - | | 40,434 |
Provision for loan losses | | 4,157 | | | (82) | | - | | - | | - | | 4,075 |
Noninterest income | | 5,524 | | | 6,008 | | 115 | | 520 | | (5,573) | | 6,594 |
Noninterest expenses | | 12,329 | | | 3,172 | | 83 | | 692 | | (5,573) | | 10,703 |
| | |
Earnings before taxes | | 30,704 | | | 5,745 | | 45 | | (4,244) | | - | | 32,250 |
Provision for income taxes | | 13,349 | | | 2,656 | | 21 | | (1,960) | | - | | 14,066 |
Net earnings | | $17,355 | | | $ 3,089 | | $ 24 | | $(2,284) | | $ - | | $ 18,184 |
Intercompany dividends (1) | | (4,356 | ) | | - | | - | | 4,356 | | - | | - |
Net earnings after intercompany dividends | | $12,999 | | | $ 3,089 | | $ 24 | | $ 2,072 | | $ - | | $ 18,184 |
Net earnings after intercompany dividends for 2004 | | $ 7,436 | | | $ 2,354 | | $ 22 | | $ 1,641 | | $ - | | $ 11,453 |
| (3) | Dividends to the Holding Company provide funds for the debt service on the Capital Securities, which is included in the Holding Company’s interest expense. |
| (4) | All significant intercompany balances and transactions are eliminated in consolidation. Such amounts arise from intercompany deposit accounts and management and service agreements. |
Net Interest and Dividend Income
Net interest and dividend income increased by $12.6 million to $40.4 million in 2005, from $27.8 million in 2004. The improvement was attributable to a $392.8 million increase in average interest-earning assets resulting from continued growth in loans of $338.4 million and a higher level of security and short-term investments aggregating to $54.4 million. The growth in average assets was funded by $354.7 million of additional interest-bearing deposits, $3.6 million of additional borrowed funds and a $26.5 million increase in stockholders’ equity (resulting from earnings and the issuance of shares in a public offering and from the conversion of convertible debentures).
The Company’s net interest margin increased to 2.70% in 2005 from 2.52% in 2004. The higher margin was due to the Company’s yield on interest-earning assets increasing at a faster pace than its cost of funds. In a steadily rising interest rate environment in 2005, the yield on the Company’s interest-earning assets increased 51 basis points to 6.53% in 2005, primarily due to higher yields on new mortgage loans originated, an increase in yields earned on variable-rate loans indexed to the prime rate, and higher yields earned on security and other short-term investments. The cost of funds also increased by 37 basis points to 4.21% in 2005 due to higher rates paid on deposit accounts.
45
The following table provides information on average assets, liabilities and stockholders’ equity; yields earned on interest-earning assets; and rates paid on interest-bearing liabilities for 2005 and 2004. The yields and rates shown are based on a computation of income/expense (including any related fee income or expense) for each year divided by average interest-earning assets/interest-bearing liabilities during each year. Average balances are derived from daily balances. Net interest margin is computed by dividing net interest and dividend income by the average of total interest-earning assets during each year.
| | | | | | | | | | | | | | | | | | |
| | | For the Year Ended December 31, | |
| | | 2005 | | | 2004 | |
| ($ in thousands) | | Average
Balance | | Interest
Inc./Exp. | | Yield/
Rate | | | Average
Balance | | Interest
Inc./Exp. | | Yield/
Rate | |
| Assets | | | | | | | | | | | | | | | | | | |
Interest-earning assets: | | | | | | | | | | | | | | | | | | |
Loans (1) | | $ | 1,206,089 | | $ | 89,590 | | 7.43 | % | | $ | 867,724 | | $ | 61,928 | | 7.14 | % |
Securities | | | 258,906 | | | 7,229 | | 2.79 | | | | 207,557 | | | 4,259 | | 2.05 | |
Other interest-earning assets | | | 32,865 | | | 1,062 | | 3.23 | | | | 29,766 | | | 362 | | 1.22 | |
Total interest-earning assets | | | 1,497,860 | | $ | 97,881 | | 6.53 | % | | | 1,105,047 | | $ | 66,549 | | 6.02 | % |
Noninterest-earning assets | | | 14,906 | | | | | | | | | 15,505 | | | | | | |
Total assets | | $ | 1,512,766 | | | | | | | | $ | 1,120,552 | | | | | | |
| Liabilities and Stockholders’ Equity | | | | | | | | | | | | | | | | | | |
Interest-bearing liabilities: | | | | | | | | | | | | | | | | | | |
Interest checking deposits | | $ | 10,636 | | $ | 166 | | 1.56 | % | | $ | 12,052 | | $ | 187 | | 1.55 | % |
Savings deposits | | | 22,397 | | | 536 | | 2.39 | | | | 30,803 | | | 550 | | 1.79 | |
Money market deposits | | | 202,618 | | | 5,947 | | 2.94 | | | | 191,495 | | | 3,583 | | 1.87 | |
Certificates of deposit | | | 966,128 | | | 38,270 | | 3.96 | | | | 612,735 | | | 22,010 | | 3.59 | |
Total deposit accounts | | | 1,201,779 | | | 44,919 | | 3.74 | | | | 847,085 | | | 26,330 | | 3.11 | |
Federal funds purchased and FHLB advances | | | 4,871 | | | 139 | | 2.85 | | | | 1,914 | | | 40 | | 2.09 | |
Debentures and accrued interest payable | | | 96,007 | | | 8,014 | | 8.35 | | | | 109,697 | | | 8,801 | | 8.02 | |
Debentures - capital securities | | | 61,856 | | | 4,359 | | 7.05 | | | | 47,533 | | | 3,495 | | 7.35 | |
Mortgage note payable | | | 236 | | | 16 | | 6.99 | | | | 249 | | | 17 | | 7.00 | |
Total borrowed funds | | | 162,970 | | | 12,528 | | 7.69 | | | | 159,393 | | | 12,353 | | 7.75 | |
Total interest-bearing liabilities | | | 1,364,749 | | $ | 57,447 | | 4.21 | % | | | 1,006,478 | | $ | 38,683 | | 3.84 | % |
Noninterest-bearing deposits | | | 6,335 | | | | | | | | | 6,599 | | | | | | |
Noninterest-bearing liabilities | | | 34,162 | | | | | | | | | 26,471 | | | | | | |
Stockholders’ equity | | | 107,520 | | | | | | | | | 81,004 | | | | | | |
Total liabilities and stockholders’ equity | | $ | 1,512,766 | | | | | | | | $ | 1,120,552 | | | | | | |
Net interest and dividend income/spread | | | | | $ | 40,434 | | 2.32 | % | | | | | $ | 27,866 | | 2.18 | % |
Net interest-earning assets/margin | | $ | 133,111 | | | | | 2.70 | % | | $ | 98,569 | | | | | 2.52 | % |
Ratio of total interest-earning assets to total interest-bearing liabilities | | | 1.10x | | | | | | | | | 1.10x | | | | | | |
Other Ratios: | | | | | | | | | | | | | | | | | | |
Return on average assets | | | 1.20% | | | | | | | | | 1.02% | | | | | | |
Return on average equity | | | 16.91% | | | | | | | | | 14.14% | | | | | | |
Noninterest expense to average assets | | | 0.71% | | | | | | | | | 0.74% | | | | | | |
Efficiency ratio (2) | | | 23% | | | | | | | | | 25% | | | | | | |
Average stockholders’ equity to average assets | | | 7.11% | | | | | | | | | 7.23% | | | | | | |
| (1) | Includes average nonaccrual loans of $3.8 million in 2005 and $3.2 million in 2004. |
| (2) | Defined as noninterest expenses (excluding the provision for loan losses) as a percentage of net interest and dividend income plus noninterest income. |
46
The following table provides information regarding changes in interest and dividend income and interest expense. For each category of interest-earning assets and interest-bearing liabilities, information is provided on changes attributable to (1) changes in rate (change in rate multiplied by prior volume), (2) changes in volume (change in volume multiplied by prior rate) and (3) changes in rate-volume (change in rate multiplied by change in volume).
| | | | | | | | |
| | | For the Year Ended December 31, 2005 vs. 2004
Increase (Decrease) Due To Change In: |
| ($ in thousands) | | Rate | | Volume | | Rate/Volume | | Total |
Interest-earning assets: | | | | | | | | |
Loans | | $ 2,516 | | $ 24,159 | | $ 987 | | $ 27,662 |
Securities | | 1,536 | | 1,053 | | 381 | | 2,970 |
Other interest-earning assets | | 598 | | 38 | | 64 | | 700 |
Total interest-earning assets | | 4,650 | | 25,250 | | 1,432 | | 31,332 |
Interest-bearing liabilities: | | | | | | | | |
Interest checking deposits | | 1 | | (22) | | - | | (21) |
Savings deposits | | 185 | | (150) | | (49) | | (14) |
Money market deposits | | 2,049 | | 208 | | 107 | | 2,364 |
Certificates of deposit | | 2,267 | | 12,687 | | 1,306 | | 16,260 |
Total deposit accounts | | 4,502 | | 12,723 | | 1,364 | | 18,589 |
Federal funds purchased and FHLB advances | | 15 | | 62 | | 22 | | 99 |
Debentures and accrued interest payable | | 362 | | (1,098) | | (51) | | (787) |
Debentures - capital securities | | (143) | | 1,040 | | (33) | | 864 |
Mortgage note payable | | - | | (1) | | - | | (1) |
Total borrowed funds | | 234 | | 3 | | (62) | | 175 |
Total interest-bearing liabilities | | 4,736 | | 12,726 | | 1,302 | | 18,764 |
Net change in interest and dividend income | | $ (86) | | $ 12,524 | | $ 130 | | $ 12,568 |
Provision for Loan Losses
The provision for loan losses decreased by $0.4 million to $4.1 million in 2005, from $4.5 million in 2004. The lower provision was a function of the favorable effect (of approximately $0.6 million in reduced reserves) from the satisfaction of a $3.9 million nonaccrual loan in the second quarter of 2005, partially offset by an increase in the amount of loan growth over the prior year. Total loans grew by $354 million in 2005, compared to $348 million in 2004.
Noninterest Income
Noninterest income increased by $1.5 million to $6.6 million in 2005 and is summarized as follows:
| | | | |
| | | For the Year Ended December 31, |
| ($ in thousands) | | 2005 | | 2004 |
Customer service fees | | $ 334 | | $ 252 |
Income from mortgage lending activities (1) | | 1,082 | | 1,221 |
Income from the early repayment of mortgage loans (2) | | 5,062 | | 3,546 |
Commissions and fees | | 115 | | 119 |
Gain from early call of investment securities (3) | | 1 | | 2 |
| | | $ 6,594 | | $ 5,140 |
| | (1) | Consists mostly of fees from expired loan commitments and loan servicing, maintenance and inspection charges. |
| | (2) | Consists of the recognition of unearned fees associated with such loans at the time of payoff and the receipt of prepayment penalties and interest in certain cases. |
| | (3) | Consists of the recognition of any unamortized premium or discount at time of call. |
Noninterest income increased due to a $1.5 million increase in income from the prepayment of mortgage loans and a $0.1 million increase in fees from early deposit withdrawals, partially offset by a $0.1 million decrease in fees earned from expired loan commitments that were not funded. The prepayment income for 2005 included $0.6 million from the early satisfaction of the nonaccrual loan noted above.
47
Noninterest Expenses
Noninterest expenses increased by $2.5 million to $10.7 million in 2005 and are summarized as follows:
| | | | |
| | | For the Year Ended December 31, |
| ($ in thousands) | | 2005 | | 2004 |
Salaries and employee benefits | | $ 5,726 | | $ 4,046 |
Occupancy and equipment, net | | 1,487 | | 1,659 |
Data processing | | 605 | | 428 |
Professional fees and services | | 773 | | 411 |
Stationery, printing and supplies | | 211 | | 180 |
Postage and delivery | | 129 | | 111 |
FDIC and general insurance | | 324 | | 264 |
Director and committee fees | | 527 | | 397 |
Advertising and promotion | | 225 | | 110 |
All other expenses | | 696 | | 645 |
| | | $ 10,703 | | $ 8,251 |
Salaries and employee benefits expense increased primarily due to salary increases, a higher cost of employee benefits and additional staff aggregating $0.8 million, and a $0.8 million increase in bonus payments to certain executive officers in connection with capital raising activities. The Company had 69 fulltime employees at December 31, 2005 versus 64 at December 31, 2004.
Occupancy and equipment expense decreased due to a decrease in rent expense resulting from the termination in September 2004 of Intervest Mortgage Corporation’s lease on its former space at 10 Rockefeller Plaza and an increase in sublease income from the Bank’s Florida offices. These items were partially offset by increased rent on the Company’s new larger office space at One Rockefeller Plaza.
Data processing expense increased primarily due to the growth in the Bank’s assets.
Professional fees expense increased due to the growth in the Company’s assets as well as additional accruals (of $0.2 million) for consulting expense associated with the ongoing compliance with the Sarbanes Oxley requirements for internal controls.
Director and committee fees expense increased due to higher fees paid to directors for each board and committee meeting attended. The fees were increased in October 2004 for board and committee meetings and an additional increase was made in June 2005 for audit committee meetings.
Advertising expense increased due to additional advertising to support loan and deposit growth. Stationery, printing and supplies, postage and delivery, and FDIC and general insurance expenses increased primarily due to the Company’s growth as well as a rate increase for general insurance.
All other expense increased primarily due to the payment of a Nasdaq National Market entry fee. The Company’s Class A common stock began trading on the Nasdaq National Market on June 27, 2005. Previously, the stock had traded on the Nasdaq SmallCap Market. In 2006, the Nasdaq created three market tiers and as a result the Company’s Class A common stock now trades on top tier: the Nasdaq Global Select Market.
Provision for Income Taxes
The provision for income taxes increased by $5.3 million to $14.1 million in 2005, from $8.8 million in 2004, due to higher pre-tax income. The Company’s effective tax rate (inclusive of state and local taxes) amounted to 43.6% in 2005, compared to 43.4% in 2004.
Off-Balance Sheet and Other Financing Arrangements
The Company is party to financial instruments with off-balance sheet risk in the normal course of business to meet the financing needs of its customers. For a further discussion of these financial instruments, see note 19 to the consolidated financial statements included in this report.
48
Liquidity and Capital Resources
General. The Company manages its liquidity position on a daily basis to assure that funds are available to meet its operating requirements, loan and investment commitments, deposit withdrawals and debt service obligations. Primary sources of funds consist of the following: retail deposits obtained through the Bank’s branch offices and through the mail; principal repayments of loans; maturities and calls of securities; issuance of debentures; borrowings from the federal funds market and through FHLB advances; and cash flow provided by operating activities. For additional detail concerning the Company’s cash flows, see the consolidated statements of cash flows included in this report.
Intervest National Bank. The Bank’s lending business is dependent on its continuing ability to generate a positive interest rate spread between the rates offered on its deposits and the yields earned on its loans. The Bank needs to pay competitive interest rates to attract and retain deposits to fund its loan originations. The Bank has and expects to continue to rely heavily on certificates of deposit (time deposits) as its main source of funds. Total consolidated deposits amounted to $1.59 billion at December 31, 2006 and time deposits represented 84%, or $1.34 billion, of those deposits, up from 81% at December 31, 2005. Additionally, time deposits of $100,000 or more at December 31, 2006 totaled $490.9 million and included $55.7 million of brokered deposits. Brokered deposits are sold by investment firms, which are paid a fee by the Bank for placing the deposit. The Bank must maintain its status as a well-capitalized insured depository institution in order to solicit and accept, renew or roll over any brokered deposit without restriction. Time deposits are the only deposit accounts offered by the Bank that have stated maturity dates. These deposits are generally considered to be rate sensitive and have a higher cost than deposits with no stated maturities, such as checking, savings and money market accounts. At December 31, 2006, the Bank had $630.5 million of time deposits maturing by December 31, 2007. The Bank expects that a substantial portion of these deposits will be renewed and stay with the Bank. The Bank has in the past and may continue in the future to rely on capital contributions from the Holding Company to increase its capital to support its asset growth. The Holding Company made a total of $32.5 million of cash capital contributions to the Bank during 2005 and none in 2006. At December 31, 2006, the Bank had excess capital to support an additional $460 million of asset growth and still maintain a well-capitalized designation.
The Bank also borrows funds on an overnight or short-term basis to manage its liquidity needs. At December 31, 2006, the Bank had agreements with correspondent banks whereby it could borrow up to $16 million on an unsecured basis. As a member of the FHLB and FRB, the Bank can also borrow from these institutions on a secured basis. During 2006, the Bank utilized a total of $251 million of short-term borrowings of which $25 million was outstanding at December 31, 2006. At December 31, 2006, the Bank had available collateral consisting of investment securities to support additional total borrowings of $361 million from the FHLB and FRB.
At December 31, 2006, the Bank had commitments to lend of $108.9 million, most of which are anticipated to be funded over the next 12 months from the sources of funds described above.
Intervest Mortgage Corporation. Intervest Mortgage Corporation has and expects to continue to rely on the issuance of its subordinated debentures in registered, best efforts offerings to the public as a source of funds to support its loan originations. In addition, as the Bank’s mortgage loan portfolio has grown, service fee income received by Intervest Mortgage Corporation from the Bank has comprised a large percentage of Intervest Mortgage Corporation’s earnings and cash inflows. The Bank has a servicing agreement with Intervest Mortgage Corporation which is described under the caption “Loan Solicitation and Processing” in Item. 1 “Business.” The Bank paid $5.0 million in 2006 to Intervest Mortgage Corporation in connection with this agreement. From time to time, Intervest Mortgage Corporation has also received cash capital contributions from the Holding Company. No contributions have been made since 2002.
Intervest Mortgage Corporation’s lending business is dependent on its ability to sell its subordinated debentures with interest rates that result in a positive interest rate spread, which is the difference between yields earned on its loans and the rates paid on its debentures. At December 31, 2006, Intervest Mortgage Corporation had $83.8 million of debentures outstanding with fixed interest rates that range from 6.25% to 7.75% and maturities that range from April 1, 2007 to July 1, 2014. In 2006, Intervest Mortgage Corporation repaid $15.0 million of its debentures prior to their stated maturity, including $3.0 million of related accrued interest payable, and issued new debentures totaling $16.0 million for net proceeds, after offering costs, of $14.8 million. At December 31, 2006, Intervest Mortgage Corporation
49
had $2.0 million of debentures and $1.3 million of accrued interest payable maturing by December 31, 2007. Subsequent to December 31, 2006 and prior to the filing of this report, Intervest Mortgage Corporation repaid the $2.0 million prior to the stated maturity of the debentures, including $0.5 million of related accrued interest payable, from cash on hand.
At December 31, 2006, Intervest Mortgage Corporation had $36.6 million in cash and short-term investments and commitments to lend of less than $0.1 million. In addition, $36 million of its mortgage loans are scheduled to mature during 2007. As a result, both current cash and the proceeds from repayment of maturing mortgages will be available for investment in new mortgage loans. The current level of cash and short-term investments is higher than has been customary for Intervest Mortgage Corporation and the level of its outstanding commitments is at a historically low level. The increase in cash is primarily attributable to a significant decline in originations of new mortgage loans during the second half of 2006 that is attributable to increased competitive market conditions and lower pricing, which have made it more difficult for Intervest Mortgage Corporation, as well as the Bank, to identify suitable mortgage investment opportunities. The level of outstanding loan commitments has always fluctuated with market conditions and is unpredictable.
Holding Company. The Holding Company’s sources of funds and capital to date have been derived from the following: interest income from a limited portfolio of mortgage loans and short-term investments; monthly dividends from the Bank to service interest expense on trust preferred securities; monthly management fees from Intervest Mortgage Corporation and the Bank for providing these subsidiaries with certain administrative services; the issuance of its common stock through public offerings; exercise of outstanding common stock warrants and conversion of outstanding convertible debentures; the issuance of trust preferred securities through its wholly owned business trusts; and the direct issuance of other subordinated debentures to the public.
In 2006, the Holding Company repaid prior to their stated maturity a total of $16.7 million of debentures with higher interest rates (including $15.4 million of trust preferred securities). At December 31, 2006, the Holding Company did not have any debentures maturing in 2007. Subsequent to December 31, 2006 and prior to the filing of this report, the Holding Company repaid $1.3 million of additional debentures prior to their stated maturity from cash on hand. In the third quarter of 2005, the Holding Company completed a public offering of 1,436,468 shares of its Class A common stock for $19.75 per share. The issuance of these shares, after underwriting commissions and expenses, resulted in $26.3 million of additional capital, which was invested in the Bank as a capital contribution.
The Holding Company, through its wholly owned business trusts, has issued at various times since 2001 a total of $61.9 million of trust preferred securities, with both fixed and variable rates of interest, that mature in 2031 or later. The resulting proceeds have been invested in the Bank at various times through capital contributions. In September 2006, the Holding Company issued additional trust preferred securities in the amount of $10.3 million through its newly established Intervest Statutory Trust V. The new securities mature in 30 years and bear interest at a fixed rate of 6.83% per annum for the first five years and thereafter at a floating rate of 1.65% over 3 month LIBOR. On December 18, 2006, the Holding Company used the proceeds from the recent sale, together with available cash on hand, to repay prior to their stated maturity $15.4 million of trust preferred securities with a fixed rate of 9.88% that were issued in 2001. The early repayment of these securities, as well as those of Intervest Mortgage Corporation noted above, resulted in a total of $0.5 million of related unamortized issuance costs being expensed in the fourth quarter of 2006. At December 31, 2006, $56.7 million of trust preferred securities were outstanding for which the Holding Company is required to make interest payments that total $3.5 million annually. The Bank provides the funds in the form of dividends to the Holding Company for this debt service. At December 31, 2006, $55 million of the trust preferred securities (representing outstanding debentures net of the Holding Company’s common stock investments in the trusts) qualified as regulatory Tier 1 capital.
Other. Information concerning time deposits, debentures and trust preferred securities, including interest rates and maturity dates can be found in notes 6, 7 and 9 to the consolidated financial statements included in this report. The Holding Company, the Bank and Intervest Mortgage Corporation consider their current liquidity and sources of funds sufficient to satisfy their outstanding lending commitments and maturing liabilities. Management is not aware of any trends, known demand, commitments or uncertainties that are expected to have a material impact on future operating results, liquidity or capital resources of each entity.
50
Contractual Obligations
The table below summarizes the Company’s contractual obligations as of December 31, 2006.
| | | | | | | | | | |
| | | | | Due In |
($ in thousands) | | Total | | 2007 | | 2008 and
2009 | | 2010 and
2011 | | 2012 and
Later |
Subordinated debentures and mortgage note payable | | $ 86,925 | | $ 2,015 | | $ 25,243 | | $ 28,039 | | $ 31,628 |
Subordinated debentures - capital securities | | 56,702 | | - | | - | | - | | 56,702 |
Federal Home Loan Bank advances | | 25,000 | | 25,000 | | - | | - | | - |
Accrued interest payable on all borrowed funds | | 4,282 | | 1,508 | | 1,738 | | 682 | | 354 |
Death benefit payments | | 1,879 | | 201 | | 446 | | 499 | | 733 |
Deposits with no stated maturities | | 253,140 | | 253,140 | | - | | - | | - |
Deposits with stated maturities | | 1,335,394 | | 630,454 | | 398,629 | | 262,349 | | 43,962 |
Operating lease payments | | 7,237 | | 986 | | 2,071 | | 2,037 | | 2,143 |
Unfunded loan commitments (1) | | 107,848 | | 107,848 | | - | | - | | - |
Available lines of credit (1) | | 939 | | 939 | | - | | - | | - |
Standby letters of credit (1) | | 100 | | 100 | | - | | - | | - |
| | | $ 1,879,446 | | $ 1,022,191 | | $ 428,127 | | $ 293,606 | | $ 135,522 |
| (1) | Since some of the commitments are expected to expire without being drawn upon, the total commitment amount does not necessarily represent future cash requirements. |
Regulatory Capital
The Bank is subject to various regulatory capital requirements. As disclosed in detail elsewhere in this report, the Federal Deposit Insurance Corporation (FDIC) and other bank regulatory agencies use five capital categories ranging from well capitalized to critically undercapitalized to determine various matters, including prompt corrective action and each institution’s FDIC deposit insurance premiums. These categories involve quantitative measures of a bank’s assets, liabilities, and certain off-balance-sheet items as calculated under regulatory accounting practices. The capital amounts and classifications are also subject to qualitative judgments by the regulators about components, risk weightings, and other factors. Failure to meet minimum capital requirements can result in certain mandatory and possibly additional discretionary actions by the regulators that, if undertaken, could have a direct material effect on the Bank’s and the Company’s financial statements.
The Bank is required to maintain regulatory defined minimum Tier 1 leverage and Tier 1and total risk-based capital ratio levels of at least 4%, 4% and 8%, respectively. At December 31, 2006 and 2005, management believes the Bank met its capital adequacy requirements and is a well-capitalized institution as defined in the regulations, which require minimum Tier 1 leverage and Tier 1 and total risk-based ratios of 5%, 6% and 10%, respectively. Management is not aware of any conditions or events that would change the Bank’s designation as a well-capitalized institution.
Information regarding the Bank’s regulatory capital and related ratios is summarized as follows:
| | | | | | |
| | | At December 31, |
| ($ in thousands) | | 2006 | | 2005 |
Tier 1 Capital | | $ | 181,176 | | $ | 156,842 |
Tier 2 Capital | | | 17,486 | | | 14,846 |
Total risk-based capital | | $ | 198,662 | | $ | 171,688 |
Net risk-weighted assets | | $ | 1,526,791 | | $ | 1,362,728 |
Average assets for regulatory purposes | | $ | 1,841,231 | | $ | 1,562,779 |
Tier 1 capital to average assets | | | 9.84% | | | 10.04% |
Tier 1 capital to risk-weighted assets | | | 11.87% | | | 11.51% |
Total capital to risk-weighted assets | | | 13.01% | | | 12.60% |
The Holding Company on a consolidated basis is subject to minimum regulatory capital requirements administered by the FRB. These guidelines require a ratio of Tier 1 or Core Capital, as defined in the guidelines, to total risk-weighted assets of at least 4% and a ratio of total capital to risk-weighted assets of at least 8%. The guidelines also require a ratio of Tier 1 capital to adjusted total average assets of not less than 3%. At December 31, 2006 and 2005, management believes that the Holding Company met its capital adequacy requirements.
51
Information regarding consolidated regulatory capital and related ratios is summarized below:
| | | | | | |
| | | At December 31, |
($ in thousands) | | | 2006 | | | 2005 |
Tier 1 Capital (1) | | $ | 225,046 | | $ | 181,571 |
Tier 2 Capital (1) | | | 17,833 | | | 29,788 |
Total risk-based capital | | $ | 242,879 | | $ | 211,359 |
Net risk-weighted assets | | $ | 1,624,713 | | $ | 1,466,027 |
Average assets for regulatory purposes | | $ | 1,969,533 | | $ | 1,673,832 |
Tier 1 capital to average assets | | | 11.43% | | | 10.85% |
Tier 1 capital to risk-weighted assets | | | 13.85% | | | 12.39% |
Total capital to risk-weighted assets | | | 14.95% | | | 14.42% |
| | (1) | At December 31, 2006 and 2005, there were $55 million and $60 million of qualifying capital securities outstanding, respectively, representing the total outstanding debentures issued to Statutory Trust I, II, III, IV and V by the Holding Company, net of the Holding Company’s investments in those trusts. At December 31, 2006, $55.0 million was included in Tier I capital and at December 31, 2005, $45.4 million was included in Tier 1 Capital, and the remaining portion was included in Tier 2 Capital. The inclusion of these securities in Tier 1 capital is limited to 25% of core capital elements, as defined in the FDIC regulations |
In 2005, the Federal Reserve issued a final rule that retains trust preferred securities in the Tier 1 capital of bank holding companies (BHC), but with stricter quantitative limits and clearer qualitative standards. The rule provides a transition period for BHCs to meet the new, stricter limitations within regulatory capital by allowing the limits on restricted core capital elements to become fully effective as of March 31, 2009.
Until March 31, 2009, BHCs generally must comply with the current Tier 1 capital limits. That is, BHCs generally must calculate their Tier 1 capital on a basis that limits the aggregate amount of qualifying cumulative perpetual preferred stock and qualifying trust preferred securities to 25 percent of the sum of qualifying common stockholder’s equity, qualifying noncumulative and cumulative perpetual preferred stock (including related surplus), qualifying minority interest in the equity accounts of consolidated subsidiaries, and qualifying trust preferred securities. Amounts of qualifying cumulative perpetual preferred stock and qualifying trust preferred securities in excess of this limit may be included in Tier 2 capital.
Beginning March 31, 2009, qualifying cumulative perpetual preferred stock and trust preferred securities, as well as certain types of minority interest, are limited to 25 percent of the sum of core capital elements net of goodwill. The Company does not have any goodwill or outstanding preferred stock.
Beginning March 31, 2009, the excess amounts of restricted core capital elements in the form of qualifying trust preferred securities included in Tier 2 capital are limited to 50 percent of Tier 1 capital (net of goodwill). However, amounts in excess of this limit will still be taken into account in the overall assessment of an organization’s funding and financial condition. The final rule also provides that in the last five years before the underlying subordinated note matures, the associated trust preferred securities must be treated as limited-life preferred stock. Thus, in the last five years of the life of the note, the outstanding amount of trust preferred securities will be excluded from Tier 1 capital and included in Tier 2 capital, subject, together with subordinated debt and other limited-life preferred stock, to a limit of 50 percent of Tier 1 capital. During this period, the trust preferred securities will be amortized out of Tier 2 capital by one-fifth of the original amount (less redemptions) each year and excluded totally from Tier 2 capital during the last year of life of the underlying note.
As of December 31, 2006 and 2005, assuming the Holding Company no longer included its trust preferred securities in Tier 1 Capital, it would still have exceed the well capitalized threshold under the regulatory framework for prompt corrective action. See note 9 to the consolidated financial statements for a further discussion of trust preferred securities.
Asset and Liability Management
Interest rate risk arises from differences in the repricing of assets and liabilities within a given time period. The primary objective of the Company’s asset/liability management strategy is to limit, within established guidelines, the adverse effect of changes in interest rates on its net interest income and capital. The Company does not engage in trading or hedging activities, nor does it invest in interest rate derivatives or enter into interest rate swaps.
52
The Company uses “gap analysis,” which measures the difference between interest-earning assets and interest-bearing liabilities that mature or reprice within a given time period, to monitor its interest rate sensitivity. An asset or liability is normally considered to be interest-rate sensitive if it will reprice or mature within one year or less. The interest-rate sensitivity gap is the difference between interest-earning assets and interest-bearing liabilities scheduled to mature or reprice within one-year. A gap is considered positive when the amount of interest rate-sensitive assets exceeds the amount of interest rate-sensitive liabilities. Conversely, a gap is considered negative when the opposite is true.
In a period of rising interest rates, a negative gap would tend to adversely affect net interest income, while a positive gap would tend to increase net interest income. In a period of falling interest rates, a negative gap would tend to increase net interest income, while a positive gap would tend to adversely affect net interest income. If the repricing of the Company’s assets and liabilities were equally flexible and moved concurrently, the impact of any increase or decrease in interest rates on net interest income would be minimal.
A simple interest rate gap analysis by itself may not be an accurate indicator of how net interest income will be affected by changes in interest rates for the following reasons. Income associated with interest-earning assets and costs associated with interest-bearing liabilities may not be affected uniformly by changes in interest rates. In addition, the magnitude and duration of changes in interest rates may have a significant impact on net interest income. For example, although certain assets and liabilities may have similar maturities or periods of repricing, they may react in different degrees to changes in market interest rates. Interest rates on certain types of assets and liabilities fluctuate in advance of changes in general market interest rates, while interest rates on other types may lag behind changes in market rates. In addition, certain assets, such as adjustable-rate mortgage loans, may have features generally referred to in the industry as “interest rate caps and floors,” which limit changes in interest rates on a short-term basis and over the life of the asset. In the event of a change in interest rates, asset prepayment and early deposit withdrawal levels also could deviate significantly from those assumed in calculating the interest-rate gap. The ability of many borrowers to service their debts also may decrease in the event of an interest-rate increase, and the behavior of depositors may be different than those assumed in the gap analysis.
The Company’s one-year positive interest rate sensitivity gap decreased to $108.8 million, or 5.5% of total assets, at December 31, 2006, from $498.7 million, or 29.2% at December 31, 2005. The decrease in the positive gap primarily reflects an increase in loans and security investments with maturities in excess of one year, funded by increases in time deposits with maturities of one year or less. For purposes of computing the gap, all deposits with no stated maturities are treated as readily accessible accounts. However, if such deposits were treated differently, the one-year gap would then change. Depositors may not necessarily immediately withdraw funds in the event deposit rates offered by the Bank did not change as quickly and uniformly as changes in general market rates. For example, if only 25% of deposits with no stated maturity were assumed to be readily accessible, the one-year gap would have been a positive 15.0% at December 31, 2006, compared to a positive 40.1 % at December 31, 2005.
Many of the Company’s floating-rate loans have a “floor,” or minimum rate, that is determined in relation to prevailing market rates on the date of origination. This floor only adjusts upwards in the event of increases in the loan’s interest rate. This feature reduces the unfavorable effect on interest income of a falling rate environment because the interest rates on such loans do not reset downward. However, the Company may nonetheless experience loan prepayments, the amount of which cannot be predicted, and reinvestment risk associated with the investment of the resulting proceeds.
Notwithstanding all of the above, there can be no assurances that a sudden and substantial change in interest rates may not adversely impact the Company’s earnings, to the extent that the interest rates borne by assets and liabilities do not change at the same speed, to the same extent, or on the same basis.
53
The table below summarizes interest-earning assets and interest-bearing liabilities as of December 31, 2006, that are scheduled to mature or reprice within the periods shown.
| | | | | | | | | | | | | | | | | |
($ in thousands) | |
| 0-3
Months | |
| 4-12
Months |
| |
| Over 1-4
Years |
| |
| Over 4
Years | | | Total |
Loans (1) | | $ | 489,723 | | $ | 318,499 | | | $ | 428,968 | | | $ | 262,268 | | $ | 1,499,458 |
Securities held to maturity (2) | | | 68,627 | | | 105,247 | | | | 196,248 | | | | 33,893 | | | 404,015 |
Short-term investments | | | 30,448 | | | - | | | | - | | | | - | | | 30,448 |
FRB and FHLB stock | | | 3,499 | | | - | | | | - | | | | 3,439 | | | 6,938 |
Total rate-sensitive assets | | $ | 592,297 | | $ | 423,746 | | | $ | 625,216 | | | $ | 299,600 | | $ | 1,940,859 |
Deposit accounts (3): | | | | | | | | | | | | | | | | | |
Interest checking deposits | | $ | 12,934 | | $ | - | | | $ | - | | | $ | - | | $ | 12,934 |
Savings deposits | | | 10,684 | | | - | | | | - | | | | - | | | 10,684 |
Money market deposits | | | 224,673 | | | - | | | | - | | | | - | | | 224,673 |
Certificates of deposit | | | 154,548 | | | 475,906 | | | | 577,396 | | | | 127,544 | | | 1,335,394 |
Total deposits | | | 402,839 | | | 475,906 | | | | 577,396 | | | | 127,544 | | | 1,583,685 |
FHLB advances | | | 25,000 | | | - | | | | - | | | | - | | | 25,000 |
Debentures and mortgage note payable (1) | | | - | | | 2,000 | | | | 86,602 | | | | 55,025 | | | 143,627 |
Accrued interest on all borrowed funds (1) | | | 1,425 | | | 83 | | | | 2,104 | | | | 670 | | | 4,282 |
Total borrowed funds | | | 26,425 | | | 2,083 | | | | 88,706 | | | | 55,695 | | | 172,909 |
Total rate-sensitive liabilities | | $ | 429,264 | | $ | 477,989 | | | $ | 666,102 | | | $ | 183,239 | | $ | 1,756,594 |
GAP (repricing differences) | | $ | 163,033 | | $ | (54,243 | ) | | $ | (40,886 | ) | | $ | 116,361 | | $ | 184,265 |
Cumulative GAP | | $ | 163,033 | | $ | 108,790 | | | $ | 67,904 | | | $ | 184,265 | | $ | 184,265 |
Cumulative GAP to total assets | | | 8.3% | | | 5.5% | | | | 3.4% | | | | 9.3% | | | 9.3% |
Significant assumptions used in preparing the gap table above follow:
(1) Floating-rate loans and debentures payable are included in the period in which their interest rates are next scheduled to adjust rather than in the period in which they mature. Fixed-rate loans and debentures payable are scheduled, including repayments, according to their contractual maturities. Deferred loan fees, nonaccrual loans and the effect of possible loan prepayments are excluded from the analysis.
(2) Securities are scheduled according to the earlier of their contractual maturity or the date in which the interest rate is scheduled to increase. The effects of possible prepayments that may result from the issuer’s right to call a security before its contractual maturity date are not considered.
(3) Interest checking, savings and money market deposits are regarded as readily accessible withdrawable accounts; and certificates of deposit are scheduled according to their contractual maturity dates.
Recent Accounting Pronouncements
See note 1 to the consolidated financial statements included in this report for a discussion of this topic.
Impact of Inflation and Changing Prices
The financial statements and related financial data concerning the Company presented herein have been prepared in accordance with accounting principles generally accepted in the United States of America, which require the measurement of financial position and operating results in terms of historical dollars without considering changes in the relative purchasing power of money over time due to inflation. The primary impact of inflation on the operations of the Company is reflected in increased operating costs. Virtually all of the assets and liabilities of the Company are monetary in nature. As a result, changes in interest rates have a more significant impact on the performance of the Company than do the effects of changes in the general rate of inflation and in prices. Interest rates do not necessarily move in the same direction or in the same magnitude as the prices of goods and services.
Item 7A. Quantitative and Qualitative Disclosures About Market Risk
Market risk is the risk of loss from adverse changes in market prices and interest rates. The Company’s market risk arises primarily from interest rate risk inherent in its lending and deposit-taking activities, and the issuance of its debentures. The Company has not engaged in and accordingly has no risk related to trading accounts, commodities, interest rate hedges or foreign exchange.
54
The measurement of market risk associated with financial instruments is meaningful only when all related and offsetting on-and off-balance sheet transactions are aggregated, and the resulting net positions are identified. Disclosures about the fair value of financial instruments as of December 31, 2006 and 2005, which reflect changes in market prices and rates, can be found in note 21 to the consolidated financial statements included in this report.
Management actively monitors and manages the Company’s interest rate risk exposure. The primary objective in managing interest rate risk is to limit, within established guidelines, the adverse impact of changes in interest rates on the Company’s net interest income and capital. To this regard, the Bank does internal analyses by preparing interest rate shock scenarios to its basic one-year gap model as a quantitative tool to measure the amount of interest rate risk associated with changing market interest rates. The Bank also engages an outside consultant to prepare quarterly reports using an earnings simulation model to quantify the effects of various interest rate scenarios on projected net interest income and net income over projected periods. These computations rely on various assumptions regarding balance sheet growth and composition, and the pricing and repricing and maturity characteristics of the balance sheet. For a further discussion of GAP analysis, see the section entitled “Asset and Liability Management” in Item 7 of this report.
Item 8. Financial Statements and Supplementary Data
Financial Statements
The following are included in this item:
- Management’s Report on Internal Control over Financial Reporting(page 56)
- Report of Independent Registered Public Accounting Firm on Internal Control(page 57)
- Report of Independent Registered Public Accounting Firm(page 58)
- Consolidated Balance Sheets at December 31, 2006 and 2005 (page 59)
- Consolidated Statements of Earnings for the Years Ended December 31, 2006, 2005 and 2004(page 60)
- Consolidated Statements of Changes in Stockholders’ Equity for the Years Ended December 31, 2006, 2005 and 2004 (page 61)
- Consolidated Statements of Cash Flows for the Years Ended December 31, 2006, 2005 and 2004(page 62)
- Notes to the Consolidated Financial Statements (pages 63 to 86)
Supplementary Data
Other financial statement schedules and inapplicable periods with respect to schedules listed above are omitted because the conditions requiring their filing do not exist or the information required thereby is included in the consolidated financial statements filed, including the notes thereto.
55
Management’s Report on Internal Control Over Financial Reporting
Board of Directors and Stockholders
Intervest Bancshares Corporation
New York, New York:
The management of Intervest Bancshares Corporation and subsidiaries (the “Company”) is responsible for establishing and maintaining effective internal control over financial reporting, including safeguarding of assets. The Company’s internal control structure contains monitoring mechanisms and actions are taken to correct deficiencies identified.
There are inherent limitations in the effectiveness of any internal control, including the possibility of human error and the circumvention or overriding of controls. Accordingly, even effective internal control can provide only reasonable assurance with respect to financial statement preparation. Further, because of changes in conditions, the effectiveness of internal control may vary over time.
Management assessed the effectiveness of the Company’s internal control over financial reporting, including safeguarding of assets as of December 31, 2006. This assessment was based on criteria for effective internal control over financial reporting, including safeguarding of assets, described in “Internal Control – Integrated Framework,” issued by the Committee of Sponsoring Organizations of the Treadway Commission. Based on this assessment, management believes that, as of December 31, 2006, the Company maintained effective internal control over financial reporting, including safeguarding of assets.
Management’s assessment of the effectiveness of the Company’s internal control over financial reporting has been audited by Hacker, Johnson & Smith, P.A., P.C., an independent registered public accounting firm, in accordance with the standards of the Public Company Accounting Oversight Board (United States). Their report follows.
/s/ Lowell S. Dansker
Lowell S. Dansker, Chairman and Chief Executive Officer
(Principal Executive Officer)
February 16, 2007
/s/ John J. Arvonio
John J. Arvonio, Chief Financial and Accounting Officer
(Principal Financial Officer)
February 16, 2007
56
Report of Independent Registered Public Accounting Firm on Internal Control
Board of Directors and Stockholders
Intervest Bancshares Corporation
New York, New York:
We have audited management’s assessment, included in the accompanying Management’s Report on Internal Control Over Financial Reporting, that Intervest Bancshares Corporation and subsidiaries (the “Company”) maintained effective internal control over financial reporting as of December 31, 2006, based on criteria established in Internal Control – Integrated Framework issued by the Committee of Sponsoring Organizations of the Treadway Commission. The Company’s management is responsible for maintaining effective internal control over financial reporting and for its assessment of the effectiveness of internal control over financial reporting. Our responsibility is to express an opinion on management’s assessment and an opinion on the effectiveness of the Company’s internal control over financial reporting based on our audit.
We conducted our audit in accordance with the standards of the Public Company Accounting Oversight Board (United States) (“PCAOB”). Those standards require that we plan and perform the audit to obtain reasonable assurance about whether effective internal control over financial reporting was maintained in all material respects. Our audit included obtaining an understanding of internal control over financial reporting, evaluating management’s assessment, testing and evaluating the design and operating effectiveness of internal control, and performing such other procedures as we considered necessary in the circumstances. We believe that our audit provides a reasonable basis for our opinions.
A company’s internal control over financial reporting is a process designed by, or under the supervision of, the company’s principal executive and principal financial officers, or persons performing similar functions, and effected by the company’s board of directors, management and other personnel to provide reasonable assurance regarding the reliability of financial reporting and the preparation of financial statements for external purposes in accordance with generally accepted accounting principles. A company’s internal control over financial reporting includes those policies and procedures that (1) pertain to the maintenance of records that, in reasonable detail, accurately and fairly reflect the transactions and dispositions of the assets of the company; (2) provide reasonable assurance that transactions are recorded as necessary to permit preparation of financial statements in accordance with generally accepted accounting principles, and that receipts and expenditures of the company are being made only in accordance with authorizations of management and directors of the company; and (3) provide reasonable assurance regarding prevention or timely detection of unauthorized acquisition, use or disposition of the company’s assets that could have a material effect on the financial statements.
Because of the inherent limitations of internal control over financial reporting, including the possibility of collusion or improper management override of controls, material misstatements due to error or fraud may not be prevented or detected on a timely basis. Also, projections of any evaluation of the effectiveness of the internal control over financial reporting to future periods are subject to the risk that the controls may become inadequate because of changes in conditions, or that the degree of compliance with the policies or procedures may deteriorate.
In our opinion, management’s assessment that the Company maintained effective internal control over financial reporting as of December 31, 2006, is fairly stated, in all material respects, based on the criteria established in Internal Control – Integrated Framework issued by the Committee of Sponsoring Organizations of the Treadway Commission. Also, in our opinion, the Company maintained, in all material respects, effective internal control over financial reporting as of December 31, 2006, based on the criteria established in Internal Control – Integrated Framework issued by the Committee of Sponsoring Organizations of the Treadway Commission.
We have also audited, in accordance with the standards of the PCAOB, the consolidated balance sheets of the Company as of December 31, 2006 and 2005, and the related consolidated statements of earnings, changes in stockholders’ equity, and cash flows for each of the years in the three-year period ended December 31, 2006, and in our report dated February 16 2007, we expressed an unqualified opinion on those consolidated financial statements.
/s/ Hacker, Johnson & Smith, P.A., P.C.
Hacker, Johnson & Smith, P.A., P.C.
Tampa, Florida
February 16, 2007
57
Report of Independent Registered Public Accounting Firm
Board of Directors and Stockholders
Intervest Bancshares Corporation
New York, New York:
We have audited the accompanying consolidated balance sheets of Intervest Bancshares Corporation and Subsidiaries (the “Company”) as of December 31, 2006 and 2005 and the related consolidated statements of earnings, changes in stockholders’ equity, and cash flows for each of the years in the three-year period ended December 31, 2006. These financial statements are the responsibility of the Company’s management. Our responsibility is to express an opinion on these financial statements based on our audits.
We conducted our audits in accordance with the standards of the Public Company Accounting Oversight Board (United States). Those standards require that we plan and perform the audit to obtain reasonable assurance about whether the financial statements are free of material misstatement. An audit includes examining, on a test basis, evidence supporting the amounts and disclosures in the financial statements. An audit also includes assessing the accounting principles used and significant estimates made by management, as well as evaluating the overall financial statement presentation. We believe that our audits provide a reasonable basis for our opinion.
In our opinion, the consolidated financial statements referred to above present fairly, in all material respects, the financial position of the Company at December 31, 2006 and 2005, and the results of its operations and its cash flows for each of the years in the three-year period ended December 31, 2006 in conformity with United States generally accepted accounting principles.
We also have audited, in accordance with the standards of the Public Company Accounting Oversight Board (United States), the effectiveness of the Bank’s internal control over financial reporting as of December 31, 2006, based on criteria established inInternal Control-Integrated Framework issued by the Committee of Sponsoring Organizations of the Treadway Commission (COSO), and our report dated February 16, 2007 expresses an unqualified opinion on management’s assessment of, and the effective operation of, internal control over financial reporting and an unqualified opinion on the effectiveness of the Company’s internal control over financial reporting.
/s/ Hacker, Johnson & Smith, P.A., P.C.
Hacker, Johnson & Smith, P.A., P.C.
Tampa, Florida
February 16, 2007
58
Intervest Bancshares Corporation and Subsidiaries
Consolidated Balance Sheets
| | | | | | |
| | At December 31, | | |
($ in thousands, except par value) | | 2006 | | 2005 | | |
ASSETS | | | | | | |
Cash and due from banks | | $ 9,747 | | $11,595 | | |
Federal funds sold | | 13,662 | | 42,675 | | |
Commercial paper and other short-term investments | | 16,786 | | 2,446 | | |
| | |
Total cash and cash equivalents | | 40,195 | | 56,716 | | |
Securities held to maturity, net | | 404,015 | | 251,508 | | |
Federal Reserve Bank and Federal Home Loan Bank stock, at cost | | 6,938 | | 5,241 | | |
Loans receivable (net of allowance for loan losses of $17,833 and $15,181, respectively) | | 1,472,820 | | 1,352,805 | | |
Accrued interest receivable | | 12,769 | | 7,706 | | |
Loan fees receivable | | 10,443 | | 10,941 | | |
Premises and equipment, net | | 6,379 | | 6,421 | | |
Deferred income tax asset | | 8,694 | | 6,988 | | |
Deferred debenture offering costs, net | | 5,158 | | 5,610 | | |
Investments in unconsolidated subsidiaries | | 1,702 | | 1,856 | | |
Other assets | | 2,640 | | 631 | | |
Total assets | | $1,971,753 | | $1,706,423 | | |
LIABILITIES | | | | | | |
Deposits: | | | | | | |
Noninterest-bearing demand deposit accounts | | $4,849 | | $9,188 | | |
Interest-bearing deposit accounts: | | | | | | |
Checking (NOW) accounts | | 12,934 | | 7,202 | | |
Savings accounts | | 10,684 | | 17,351 | | |
Money market accounts | | 224,673 | | 223,075 | | |
Certificate of deposit accounts | | 1,335,394 | | 1,118,514 | | |
| | | | |
Total deposit accounts | | 1,588,534 | | 1,375,330 | | |
Borrowed funds: | | | | | | |
Federal Home Loan Bank advances | | 25,000 | | - | | |
Subordinated debentures | | 86,710 | | 87,390 | | |
Subordinated debentures - capital securities | | 56,702 | | 61,856 | | |
Accrued interest payable on all borrowed funds | | 4,282 | | 6,250 | | |
Mortgage note payable | | 215 | | 229 | | |
| | | | |
Total borrowed funds | | 172,909 | | 155,725 | | |
Accrued interest payable on deposits | | 4,259 | | 3,232 | | |
Mortgage escrow funds payable | | 19,747 | | 20,302 | | |
Official checks outstanding | | 13,178 | | 11,689 | | |
Other liabilities | | 3,080 | | 3,967 | | |
Total liabilities | | 1,801,707 | | 1,570,245 | | |
Commitments and contingencies (notes 5, 9,17,18 and 19) | | | | | | |
STOCKHOLDERS’ EQUITY | | | | | | |
Preferred stock (300,000 shares authorized, none issued) | | - | | - | | |
Class A common stock ($1.00 par value, 12,000,000 shares authorized, 7,986,595 and 7,438,058 shares issued and outstanding, respectively) | | 7,986 | | 7,438 | | |
Class B common stock ($1.00 par value, 700,000 shares authorized, and 385,000 shares issued and outstanding) | | 385 | | 385 | | |
Additional paid-in-capital, common | | 75,098 | | 65,309 | | |
Retained earnings | | 86,577 | | 63,046 | | |
Total stockholders’ equity | | 170,046 | | 136,178 | | |
Total liabilities and stockholders’ equity | | $1,971,753 | | $1,706,423 | | |
See accompanying notes to consolidated financial statements.
59
Intervest Bancshares Corporation and Subsidiaries
Consolidated Statements of Earnings
| | | | | | | | | |
| | | Year Ended December 31, |
($ in thousands, except per share data) | | | 2006 | | | 2005 | | | 2004 |
INTEREST AND DIVIDEND INCOME | | | | | | | | | |
Loans receivable | | $ | 112,390 | | $ | 89,590 | | $ | 61,928 |
Securities | | | 14,647 | | | 7,229 | | | 4,259 |
Other interest-earning assets | | | 1,568 | | | 1,062 | | | 362 |
Total interest and dividend income | | | 128,605 | | | 97,881 | | | 66,549 |
INTEREST EXPENSE | | | | | | | | | |
Deposits | | | 65,631 | | | 44,919 | | | 26,330 |
Subordinated debentures | | | 7,617 | | | 8,014 | | | 8,801 |
Subordinated debentures - capital securities | | | 4,490 | | | 4,359 | | | 3,495 |
Other borrowed funds | | | 559 | | | 155 | | | 57 |
Total interest expense | | | 78,297 | | | 57,447 | | | 38,683 |
Net interest and dividend income | | | 50,308 | | | 40,434 | | | 27,866 |
Provision for loan losses | | | 2,652 | | | 4,075 | | | 4,526 |
Net interest and dividend income after provision for loan losses | | | 47,656 | | | 36,359 | | | 23,340 |
NONINTEREST INCOME | | | | | | | | | |
Customer service fees | | | 447 | | | 334 | | | 252 |
Income from mortgage lending activities | | | 1,409 | | | 1,082 | | | 1,221 |
Income from the early repayment of mortgage loans | | | 4,937 | | | 5,062 | | | 3,546 |
Commissions and fees | | | 50 | | | 115 | | | 119 |
Gain from early call of investment securities | | | 12 | | | 1 | | | 2 |
Total noninterest income | | | 6,855 | | | 6,594 | | | 5,140 |
NONINTEREST EXPENSES | | | | | | | | | |
Salaries and employee benefits | | | 6,935 | | | 5,726 | | | 4,046 |
Occupancy and equipment, net | | | 1,675 | | | 1,487 | | | 1,659 |
Data processing | | | 743 | | | 605 | | | 428 |
Professional fees and services | | | 1,160 | | | 773 | | | 411 |
Stationery, printing and supplies | | | 230 | | | 211 | | | 180 |
Postage and delivery | | | 142 | | | 129 | | | 111 |
FDIC and general insurance | | | 374 | | | 324 | | | 264 |
Director and committee fees | | | 407 | | | 527 | | | 397 |
Advertising and promotion | | | 281 | | | 225 | | | 110 |
Loss on the early extinguishment of debentures | | | 501 | | | - | | | - |
All other | | | 579 | | | 696 | | | 645 |
Total noninterest expenses | | | 13,027 | | | 10,703 | | | 8,251 |
Earnings before income taxes | | | 41,484 | | | 32,250 | | | 20,229 |
Provision for income taxes | | | 17,953 | | | 14,066 | | | 8,776 |
Net earnings | | $ | 23,531 | | $ | 18,184 | | $ | 11,453 |
Basic earnings per share | | $ | 2.98 | | $ | 2.65 | | $ | 1.89 |
Diluted earnings per share | | $ | 2.82 | | $ | 2.47 | | $ | 1.71 |
Cash dividends per share | | $ | - | | $ | - | | $ | - |
See accompanying notes to consolidated financial statements.
60
Intervest Bancshares Corporation and Subsidiaries
Consolidated Statements of Changes in Stockholders’ Equity
| | | | | | |
| | | Year Ended December 31, |
($ in thousands) | | 2006 | | 2005 | | 2004 |
| | | |
CLASS A COMMON STOCK | | | | | | |
Balance at beginning of year | | $ 7,438 | | $ 5,886 | | $ 5,603 |
Issuance of 501,465 shares and 42,510 shares upon the exercise of warrants | | 501 | | - | | 43 |
Issuance of 47,072 shares, 115,157 shares and 240,546 shares upon the conversion of debentures | | 47 | | 115 | | 240 |
Issuance of 1,436,468 shares in public offering | | - | | 1,437 | | - |
Balance at end of year | | 7,986 | | 7,438 | | 5,886 |
| | | |
CLASS B COMMON STOCK | | | | | | |
Balance at beginning and end of year | | 385 | | 385 | | 385 |
| | | |
ADDITIONAL PAID-IN-CAPITAL, COMMON | | | | | | |
Balance at beginning of year | | 65,309 | | 38,961 | | 35,988 |
Compensation related to vesting of certain Class B stock warrants | | - | | - | | 9 |
Issuance of 501,465 shares and 42,510 shares of Class A stock upon the exercise of Class A stock warrants, inclusive of income tax benefits | | 9,092 | | - | | 383 |
Issuance of 47,072 shares, 115,157 shares and 240,546 shares of Class A stock upon the conversion of debentures | | 697 | | 1,474 | | 2,581 |
Issuance of 1,436,468 shares in public offering | | - | | 24,874 | | - |
Balance at end of year | | 75,098 | | 65,309 | | 38,961 |
| | | |
RETAINED EARNINGS | | | | | | |
Balance at beginning of year | | 63,046 | | 44,862 | | 33,409 |
Net earnings for the year | | 23,531 | | 18,184 | | 11,453 |
Balance at end of year | | 86,577 | | 63,046 | | 44,862 |
| | | | | | | |
Total stockholders’ equity at end of year | | $170,046 | | $136,178 | | $90,094 |
| | | |
RECONCILIATION OF SHARES OUTSTANDING | | | | | | |
Total Class A and Class B shares outstanding at beginning of year | | 7,823,058 | | 6,271,433 | | 5,988,377 |
Issuance of shares upon the exercise of common stock warrants | | 501,465 | | - | | 42,510 |
Issuance of shares upon the conversion of debentures | | 47,072 | | 115,157 | | 240,546 |
Issuance of shares in public offering | | - | | 1,436,468 | | - |
Total Class A and Class B shares outstanding at end of year | | 8,371,595 | | 7,823,058 | | 6,271,433 |
See accompanying notes to consolidated financial statements.
61
Intervest Bancshares Corporation and Subsidiaries
Consolidated Statements of Cash Flows
| | | | | | | | | | | | |
| | | Year Ended December 31, | |
($ in thousands) | | | 2006 | | | | 2005 | | | | 2004 | |
OPERATING ACTIVITIES | | | | | | | | | | | | |
Net earnings | | $ | 23,531 | | | $ | 18,184 | | | $ | 11,453 | |
Adjustments to reconcile net earnings to net cash provided by operating activities: | | | | | | | | | | | | |
Depreciation and amortization | | | 546 | | | | 551 | | | | 593 | |
Provision for loan losses | | | 2,652 | | | | 4,075 | | | | 4,526 | |
Deferred income tax benefit | | | (1,706 | ) | | | (1,893 | ) | | | (2,135 | ) |
Amortization of deferred debenture offering costs | | | 1,164 | | | | 1,173 | | | | 1,249 | |
Loss on the early extinguishment of debentures | | | 501 | | | | - | | | | - | |
Compensation expense related to common stock warrants | | | - | | | | - | | | | 9 | |
Amortization of premiums (accretion) of discounts and deferred loan fees, net | | | (10,132 | ) | | | (7,903 | ) | | | (3,539 | ) |
Net decrease in accrued interest payable on debentures | | | (1,656 | ) | | | (3,210 | ) | | | (3,254 | ) |
Net increase (decrease) in official checks outstanding | | | 1,489 | | | | (372 | ) | | | 5,939 | |
Net decrease (increase) in loan fees receivable | | | 498 | | | | (2,733 | ) | | | (2,586 | ) |
Net change in all other assets and liabilities | | | 7,934 | | | | 12,862 | | | | 7,223 | |
Net cash provided by operating activities | | | 24,821 | | | | 20,734 | | | | 19,478 | |
INVESTING ACTIVITIES | | | | | | | | | | | | |
Maturities and calls of securities held to maturity | | | 147,519 | | | | 92,058 | | | | 88,880 | |
Purchases of securities held to maturity | | | (299,481 | ) | | | (95,436 | ) | | | (187,089 | ) |
Net increase in loans receivable | | | (121,687 | ) | | | (354,301 | ) | | | (347,887 | ) |
Purchases of Federal Reserve Bank and Federal Home Loan Bank stock, net | | | (1,697 | ) | | | (149 | ) | | | (2,017 | ) |
Purchases of premises and equipment, net | | | (504 | ) | | | (336 | ) | | | (1,477 | ) |
Return of capital (investment in) unconsolidated subsidiaries, net | | | 154 | | | | - | | | | (928 | ) |
Net cash used in investing activities | | | (275,696 | ) | | | (358,164 | ) | | | (450,518 | ) |
FINANCING ACTIVITIES | | | | | | | | | | | | |
Net increase in deposits | | | 213,204 | | | | 381,458 | | | | 318,359 | |
Net (decrease) increase in mortgage escrow funds payable | | | (555 | ) | | | 5,769 | | | | 3,993 | |
Net increase (decrease) in FHLB advances | | | 25,000 | | | | (36,000 | ) | | | 36,000 | |
Principal repayments of debentures and mortgage note payable | | | (31,728 | ) | | | (32,113 | ) | | | (20,013 | ) |
Gross proceeds from issuance of debentures | | | 26,310 | | | | 26,000 | | | | 52,428 | |
Debentures issuance costs | | | (1,222 | ) | | | (1,878 | ) | | | (2,217 | ) |
Gross proceeds from issuance of common stock | | | 3,345 | | | | 28,370 | | | | 2,961 | |
Common stock issuance costs | | | - | | | | (2,059 | ) | | | - | |
Net cash provided by financing activities | | | 234,354 | | | | 369,547 | | | | 391,511 | |
Net (decrease) increase in cash and cash equivalents | | | (16,521 | ) | | | 32,117 | | | | (39,529 | ) |
Cash and cash equivalents at beginning of year | | | 56,716 | | | | 24,599 | | | | 64,128 | |
Cash and cash equivalents at end of year | | $ | 40,195 | | | $ | 56,716 | | | $ | 24,599 | |
SUPPLEMENTAL DISCLOSURES | | | | | | | | | | | | |
Cash paid during the year for interest | | $ | 77,751 | | | $ | 57,970 | | | $ | 40,050 | |
Cash paid during the year for income taxes | | | 16,455 | | | | 14,397 | | | | 11,637 | |
Income tax benefit from conversion of warrants recorded to paid in capital | | | 6,248 | | | | - | | | | - | |
Conversion of debentures and accrued interest payable into Class A common stock | | | 744 | | | | 1,589 | | | | 2,821 | |
See accompanying notes to consolidated financial statements.
62
Intervest Bancshares Corporation and Subsidiaries
Notes to Consolidated Financial Statements
|
For the Years Ended December 31, 2006, 2005 and 2004 |
| 1. | Description of Business and Summary of Significant Accounting Policies |
Description of Business
Intervest Bancshares Corporation is a registered financial holding company referred to by itself as the “Holding Company.” At December 31, 2006, its wholly owned consolidated subsidiaries consisted of Intervest National Bank (the “Bank”) and Intervest Mortgage Corporation. All the entities are referred to collectively as the “Company” on a consolidated basis. The Holding Company’s primary business is the ownership and operation of its subsidiaries. It does not engage in any other substantial business activities other than a limited amount of real estate mortgage lending, including the participation in loans originated by the Bank. From time to time, the Holding Company also issues debt and equity securities to raise funds for working capital purposes.
In the fourth quarter of 2006, the limited operations of Intervest Securities Corporation, another wholly owned subsidiary of the Holding Company, were discontinued. Intervest Securities Corporation was a broker/dealer whose business activities were not material to the consolidated financial statements. Its only revenues had been derived from participating as a selected dealer from time to time in offerings of debt securities of primarily those of Intervest Mortgage Corporation. The Holding Company also has four wholly owned subsidiaries, Intervest Statutory Trust II, III, IV and V, that are unconsolidated entities as required by Financial Accounting Standards Board (FASB) Interpretation No. 46-R, “Consolidation of Variable Interest Entities.”
The offices of the Holding Company, Intervest Mortgage Corporation and the Bank’s headquarters and full-service banking office are located on the entire fourth floor of One Rockefeller Plaza in New York City, New York, 10020-2002 and the main telephone number is 212-218-2800.
The Company’s primary business segment is banking and real estate lending. The Company’s lending activities are comprised almost entirely of origination for its loan portfolio, mortgage loans secured by commercial and multifamily real estate properties (including rental and cooperative/condominium apartment buildings, office buildings, mixed-use properties, shopping centers, hotels, restaurants, industrial properties, parking lots/garages and vacant land). These loans have an average life of approximately three years. The Company tends to lend in areas that are in the process of being revitalized or redeveloped, with a concentration of loans on properties located in New York State and the State of Florida. A large number of the properties in New York are located in Manhattan, Brooklyn, Queens and the Bronx. A large number of the properties in Florida are located in Clearwater, Tampa, Fort Lauderdale, Miami, Orlando and St. Petersburg. Many of the multifamily properties located in New York City and surrounding boroughs are also subject to rent control and rent stabilization laws, which limit the ability of the property owners to increase rents, which may in turn limit the borrower’s ability to repay those mortgage loans.
The Bank is a nationally chartered, full-service commercial bank that has its headquarters and full-service banking office in Rockefeller Plaza in New York City, and a total of six full-service banking offices in Pinellas County, Florida—five in Clearwater and one in South Pasadena. The Bank opened its sixth branch office in Florida in December 2006. The Bank conducts a personalized commercial and consumer banking business and attracts deposits from the areas served by its banking offices. The Bank also provides internet banking services through its web site: www.intervestnatbank.com, which can attract deposit customers from outside its primary market areas. The deposits, together with funds derived from other sources, are mainly used to originate mortgage loans secured by commercial and multifamily real estate properties and to purchase investment securities. The information on the aforementioned web site is not and should not be considered part of this report and is not incorporated by reference.
Intervest Mortgage Corporation’s lending business focuses on the origination of first mortgage and junior mortgage loans secured by commercial and multifamily real estate properties. It also provides loan origination services to the Bank. Intervest Mortgage Corporation funds its loans through the issuance of subordinated debentures in public offerings.
63
Intervest Bancshares Corporation and Subsidiaries
Notes to Consolidated Financial Statements
|
For the Years Ended December 31, 2006, 2005 and 2004 |
| 1. | Description of Business and Summary of Significant Accounting Policies, Continued |
Intervest Statutory Trust II, III, IV and V are business trusts that were formed for the sole purpose of issuing and administering trust preferred securities and they do not conduct any trade or business. For a further discussion, see note 9 herein.
Principles of Consolidation, Basis of Presentation and Use of Estimates
The consolidated financial statements include the accounts of the Holding Company and its consolidated subsidiaries. All significant intercompany balances and transactions have been eliminated in consolidation. Certain reclassifications have been made to prior year amounts to conform to the current year’s presentation. The accounting and reporting policies of the Company conform to United States generally accepted accounting principles and to general practices within the banking industry.
In preparing the consolidated financial statements, management is required to make estimates and assumptions that affect the reported amounts of assets and liabilities, and disclosure of contingent liabilities, as of the date of the consolidated financial statements, and revenues and expenses during the reporting periods. Actual results could differ from those estimates. Estimates that are particularly susceptible to significant change relate to the determination of the allowance for loan losses and the estimated fair values of financial instruments.
Cash Equivalents
For purposes of the consolidated statements of cash flows, cash equivalents include federal funds sold (generally sold for one-day periods) and commercial paper and other short-term investments that have maturities of three months or less from the time of purchase.
Securities
Securities that the Company has the ability and intent to hold until maturity are classified as securities held to maturity and are carried at cost, adjusted for accretion of discounts and amortization of premiums, which are recognized into interest income using the interest method over the period to maturity. Securities that are held for indefinite periods of time which management intends to use as part of its asset/liability management strategy, or that may be sold in response to changes in interest rates or other factors, are classified as available for sale and are carried at fair value. Unrealized gains and losses on securities available for sale, net of related income taxes, are reported as a separate component of comprehensive income. Realized gains and losses from sales of securities are determined using the specific identification method. The Company does not acquire securities for the purpose of engaging in trading activities.
Loans Receivable
Loans that the Company has the intent and ability to hold for the foreseeable future or until maturity or satisfaction are carried at their outstanding principal net of chargeoffs, the allowance for loan losses, unamortized discounts and deferred loan fees or costs. Loan origination and commitment fees, net of certain costs, are deferred and amortized to interest income as an adjustment to the yield of the related loans over the contractual life of the loans using the interest method. When a loan is paid off or sold, or if a commitment expires unexercised, any unamortized net deferred amount is credited or charged to earnings accordingly.
Loans are placed on nonaccrual status when principal or interest becomes 90 days or more past due unless the loan is well secured and in the process of collection. Accrued interest receivable previously recognized is reversed when a loan is placed on nonaccrual status. Amortization of net deferred fee income is discontinued for loans placed on nonaccrual status. Interest payments received on loans in nonaccrual status are recognized as income on a cash basis unless future collections of principal are doubtful, in which case the payments received are applied as a reduction of principal. Loans remain on nonaccrual status until principal and interest payments are current.
64
Intervest Bancshares Corporation and Subsidiaries
Notes to Consolidated Financial Statements
|
For the Years Ended December 31, 2006, 2005 and 2004 |
| 1. | Description of Business and Summary of Significant Accounting Policies, Continued |
Allowance for Loan Losses
The allowance for loan losses is netted against loans receivable and is increased by provisions charged to operations and decreased by chargeoffs (net of recoveries). The adequacy of the allowance is evaluated monthly with consideration given to: the nature and size of the loan portfolio; overall portfolio quality; loan concentrations; specific problem loans and estimates of fair value thereof; historical chargeoffs and recoveries; adverse situations which may affect the borrowers’ ability to repay; and management’s perception of the current and anticipated economic conditions in the Company’s lending areas. In addition, Statement of Financial Accounting Standards (SFAS) No. 114 specifies the manner in which the portion of the allowance for loan losses is computed related to certain loans that are impaired. A loan is normally deemed impaired when, based upon current information and events, it is probable the Company will be unable to collect both principal and interest due according to the contractual terms of the loan agreement. Impaired loans normally consist of loans on nonaccrual status. Interest income on impaired loans is recognized on a cash basis. Impairment for commercial real estate and multifamily loans is measured based on: the present value of expected future cash flows, discounted at the loan’s effective interest rate; or the observable market price of the loan; or the estimated fair value of the loan’s collateral, if payment of the principal and interest is dependent upon the collateral. When the fair value of the property is less than the recorded investment in the loan, this deficiency is recognized as a valuation allowance within the overall allowance for loan losses and a charge through the provision for loan losses. The Company charges off any portion of the recorded investment in the loan that exceeds the fair value of the collateral. The net carrying amount of an impaired loan does not at any time exceed the recorded investment in the loan.
Lastly, the Company’s regulators, as an integral part of their examination process, periodically review the allowance for loan losses. Accordingly, the Company may be required to take certain chargeoffs and/or recognize additions to the allowance based on the regulators’ judgment concerning information available to them during their examination.
Premises and Equipment
Land is carried at cost. Buildings, leasehold improvements and furniture, fixtures and equipment are carried at cost, less accumulated depreciation and amortization. Depreciation is computed using the straight-line method over the estimated useful life of the asset. Leasehold improvements are amortized using the straight-line method over the terms of the related leases, or the useful life of the asset, whichever is shorter. Maintenance, repairs and minor improvements are expensed as incurred, while major improvements are capitalized.
Deferred Debenture Offering Costs
Costs relating to offerings of debentures are amortized over the terms of the debentures. The costs consist primarily of underwriters’ commissions. Accumulated amortization amounted to $3.3 million at December 31, 2006 and $3.0 million at December 31, 2005.
Foreclosed Real Estate
Real estate properties acquired through, or in lieu of, loan foreclosure are to be sold. Upon foreclosure of the property, the related loan is transferred from the loan portfolio to foreclosed real estate at the lower of the loan’s carrying value at the date of transfer, or estimated fair value of the property less estimated selling costs. Such amount becomes the new cost basis of the property. Adjustments made to the carrying value at the time of transfer are charged to the allowance for loan losses. After foreclosure, management periodically performs market valuations and the real estate is carried at the lower of cost or estimated fair value less estimated selling costs. Revenue and expenses from operations and changes in the valuation allowance of the property are included in the consolidated statements of earnings.
65
Intervest Bancshares Corporation and Subsidiaries
Notes to Consolidated Financial Statements
|
For the Years Ended December 31, 2006, 2005 and 2004 |
| 1. | Description of Business and Summary of Significant Accounting Policies, Continued |
Stock-Based Compensation
The Company used Accounting Principles Board (APB) No.25, “Accounting for Stock Issued to Employees” and related interpretations in accounting for compensation related to its stock warrants in 2005 and 2004. In December 2004, SFAS No. 123R “Share-Based Payment” was issued, which eliminates accounting for share-based compensation transactions using the intrinsic value method previously prescribed in APB No. 25, and requires instead that such transactions be accounted for using a fair value based method beginning January 1, 2006. The Company adopted SFAS 123 R on January 1, 2006. The adoption had no effect on the Company’s prior period financial statements since all of its outstanding common stock warrants were fully vested. SFAS 123R requires companies to record compensation cost for stock options awarded to employees and directors in return for their service. The cost is measured at the time of grant based on the estimated fair value of the options and is expensed over the employment service period, which is normally the vesting period of the warrants or options. The fair value approach will apply to awards granted or modified beginning in 2006. Had the Company’s compensation expense in 2005 and 2004 related to common stock warrants been determined based on estimated fair value as now required under SFAS 123R, the Company’s net earnings and earnings per share would not have been different than those reported.
Advertising Costs
Advertising costs are expensed as incurred.
Income Taxes
Deferred tax assets and liabilities are recognized for the estimated future tax consequences attributable to temporary differences between the financial statement carrying amounts of existing assets and liabilities and their respective tax bases. Deferred tax assets and liabilities are measured using enacted tax rates expected to apply to taxable income in the year in which those temporary differences are expected to be recovered or settled. A valuation allowance is recorded if it is more likely than not that some portion or all of the deferred tax assets will not be realized based on a review of available evidence.
Earnings Per Share (EPS)
Basic and diluted EPS are calculated in accordance with SFAS No. 128, “Earnings per Share.” Basic EPS is calculated by dividing net earnings by the weighted-average number of shares of common stock outstanding. Diluted EPS is calculated by dividing adjusted net earnings by the weighted-average number of shares of common stock and dilutive potential common stock shares that may be outstanding in the future.
Potential common stock shares consist of shares that may arise from outstanding dilutive common stock warrants (the number of which is computed using the “treasury stock method”) and from outstanding convertible debentures (the number of which is computed using the “if converted method”). Diluted EPS considers the potential dilution that could occur if the Company’s outstanding common stock warrants and convertible debentures were converted into common stock that then shared in the Company’s earnings (as adjusted for interest expense, net of taxes, that would no longer occur if the debentures were converted).
Comprehensive Income
Accounting principles generally require that recognized revenue, expenses, gains and losses be included in net earnings. However, certain changes in assets and liabilities, such as unrealized gains and losses on available-for-sale securities, are reported as a separate component of the stockholders’ equity section of the consolidated balance sheet, such items along with net earnings, are components of comprehensive income.
66
Intervest Bancshares Corporation and Subsidiaries
Notes to Consolidated Financial Statements
|
For the Years Ended December 31, 2006, 2005 and 2004 |
| 1. | Description of Business and Summary of Significant Accounting Policies, Continued |
Off-Balance Sheet Financial Instruments
In the ordinary course of business, the Company enters into off-balance sheet financial instruments consisting of commitments to extend credit, unused lines of credit and standby letters of credit. Such financial instruments are recorded in the financial statements when they are funded or related fees are incurred or received.
Recent Accounting Developments
Share-Based Compensation. See the caption “Shared-Based Compensation” in note 1 for a discussion of SFAS No. 123R,“Share-Based Payment”
Concentration of Credit Risks. On January 1, 2006, the Company adopted Statement of Position (“SOP”) 94-6-1, “Terms of Loan Products That May Give Rise to a Concentration of Credit Risk.” SOP 94 addresses the circumstances under which the terms of loan products give rise to a concentration of credit risk and related disclosures and accounting considerations, and is intended to emphasize the requirement to assess the adequacy of disclosures for all lending products and the effect of changes in market or economic conditions on the adequacy of those disclosures. The adoption did not affect the Company’s financial statements.
Impairment.On January 1, 2006, the Company adopted FASB Staff Position (“FSP”) 115-1, “The Meaning of Other-Than-Temporary Impairment and Its Application to Certain Investments,” which supersedes Emerging Issues Task Force Issue (“EITF”) 03-1 and related amendments to EITF 03-1. The guidance in FSP 115-1 outlines a three-step model for identifying investment impairments regarding impairment measurement, other-than-temporary impairment evaluation and recognition of other-than-temporary impairment losses and subsequent accounting. It also carries forward the disclosure requirements of EITF 03-1. The adoption did not affect the Company’s financial statements.
Accounting Changes and Error Corrections. On January 1, 2006, the Company adopted SFAS No. 154 “Accounting Changes and Error Corrections.” This statement requires entities that voluntarily make a change in accounting principle to apply that change retrospectively to prior periods’ financial statements, unless this would be impracticable. SFAS 154 supersedes APB Opinion No. 20, “Accounting Changes”, which previously required that most voluntary changes in accounting principle be recognized by including in the current period’s net income the cumulative effect of changing to the new accounting principle. SFAS 154 also makes a distinction between “retrospective application” of an accounting principle and the “restatement” of financial statements to reflect the correction of an error. Another significant change in practice under SFAS 154 will be that if an entity changes its method of depreciation, amortization, or depletion for long-lived, non-financial assets, the change must be accounted for as a change in accounting estimate. Under APB 20, such a change would have been reported as a change in accounting principle. The adoption did not affect the Company’s financial statements.
Accounting for Pension Plans. In September 2006, the FASB issued SFAS No. 158, “Employers Accounting for Defined Benefit Pension and Other Postretirement Plans.” SFAS 158 requires recognition in the consolidated statement of financial condition of the over or underfunded status of postretirement plans, measured as the difference between the fair value of the plan assets and the benefit obligation. SFAS 158 is effective beginning January 1, 2007. Currently, the Company does not offer any plans covered under this statement and therefore the statement will have no effect on the Company’s financial statements.
Fair Value Measurements. In September 2006, the FASB issued SFAS No. 157, “Fair Value Measurements.” SFAS 157, among other things, defines fair value, establishes a framework for measuring fair value and enhances disclosures about fair value measurements required under other accounting pronouncements, but does not change existing guidance as to whether or not an instrument is carried at fair value. SFAS 157 is effective beginning January 1, 2008. The Company is currently evaluating the provisions of SFAS 157 and its potential effect on its financial statements.
67
Intervest Bancshares Corporation and Subsidiaries
Notes to Consolidated Financial Statements
|
For the Years Ended December 31, 2006, 2005 and 2004 |
| 1. | Description of Business and Summary of Significant Accounting Policies, Continued |
Recent Accounting Developments, Continued
Accounting for Servicing of Financial Assets. In March 2006, the FASB issued SFAS No. 156, “Accounting for Servicing of Financial Assets.” SFAS 156 amends SFAS 140 with respect to the accounting for separately-recognized servicing assets and liabilities. SFAS 156 requires all separately-recognized servicing assets and liabilities to be initially measured at fair value, and permits companies to elect, on a class-by-class basis, to account for servicing assets and liabilities on either a lower of cost or market value basis or a fair value basis. SFAS 156 is effective beginning January 1, 2007. The adoption of this statement is not expected to have a material effect on the Company’s financial statements.
FSP FIN 46(R)-6. In April 2006, the FASB issued FASB Staff Position FIN 46(R)-6, “Determining the Variability to Be Considered in Applying FASB Interpretation No. 46(R).” This staff position addresses how variability should be considered when applying FIN 46(R). Variability affects the determination of whether an entity is a VIE, which interests are variable interests, and which party, if any, is the primary beneficiary of the VIE required to consolidate. FSP FIN 46(R)-6 clarifies that the design of the entity also should be considered when identifying which interests are variable interests. The Company adopted FSP FIN 46(R)-6 effective September 1, 2006. FSP FIN 46(R)-6 must be applied prospectively to all entities in which the Company first becomes involved with as of the date of adoption. The adoption of FSP FIN 46(R)-6 is not expected to have a material effect on the Company’s financial statements.
Accounting for Uncertainty in Income Taxes. On January 1, 2007, the Company adopted FASB Interpretation No. 48, “Accounting for Uncertainty in Income Taxes—an interpretation of FASB Statement No. 109.” FIN 48 clarifies the accounting for income taxes by prescribing the minimum recognition threshold that a tax position must meet to be recognized in the financial statements. FIN 48 also provides guidance on measurement, derecognition, classification, interest and penalties, accounting in interim periods, disclosure and transition. The adoption did not affect the Company’s financial statements.
Accounting for Certain Hybrid Financial Instruments. On January 1, 2007, the Company adopted SFAS No. 155, “Accounting for Certain Hybrid Financial Instruments”, which amends SFAS No. 133, Accounting for Derivative Instruments and Hedging Activities, and SFAS No. 140, Accounting for Transfers and Servicing of Financial Assets and Extinguishments of Liabilities. This statement also resolves issues addressed in SFAS 133 Implementation Issue No. D1, Application of Statement 133 to Beneficial Interests in Securitized Financial Assets. SFAS 155 eliminates the exemption from applying SFAS 133 to interests in securitized financial assets so that similar instruments are accounted for similarly regardless of the form of the instruments. SFAS 155 also allows a preparer to elect fair value measurement at acquisition, at issuance, or when a previously recognized financial instrument is subject to a remeasurement (new basis) event, on an instrument-by-instrument basis, in case in which a derivative would otherwise have to be bifurcated. SFAS 155 is effective for all financial instruments acquired or issued by the Company after December 31, 2006. The adoption did not affect the Company’s financial statements.
Accounting for Misstatements. On January 1, 2007, the Company adopted the SEC’s Staff Accounting Bulletin No. 108 (“SAB 108”), “Considering the Effects of Prior Year Misstatements When Quantifying Misstatements in Current Year Financial Statements”, providing guidance on quantifying financial statement misstatement and implementation (e.g., restatement or cumulative effect to assets, liabilities and retained earnings) when first applying this guidance. The Company does not believe the guidance provided by SAB 108 will have a material effect on the Company’s financial statements.
68
Intervest Bancshares Corporation and Subsidiaries
Notes to Consolidated Financial Statements
|
For the Years Ended December 31, 2006, 2005 and 2004 |
The carrying value (amortized cost) and estimated fair value of securities held to maturity are as follows:
| | | | | | | | | | | | | | |
($ in thousands) | | Number of
Securities | | Amortized
Cost | | Gross
Unrealized
Gains | | Gross
Unrealized
Losses | | Estimated
Fair
Value | | Wtd-Avg
Yield | | Wtd-Avg
Remaining
Maturity |
At December 31, 2006 | | | | | | | | | | | | | | |
U.S. government agencies (1) | | 221 | | $398,005 | | $120 | | $1,218 | | $396,907 | | 4.87% | | 1.9 Years |
Corporate | | 6 | | 6,010 | | - | | 46 | | 5,964 | | 5.62% | | 26.5 Years |
| | | 227 | | $404,015 | | $120 | | $1,264 | | $402,871 | | 4.88% | | 2.3 Years |
At December 31, 2005 | | | | | | | | | | | | | | |
U.S. government agencies (1) | | 159 | | $251,508 | | $14 | | $2,434 | | $249,088 | | 3.26% | | 1.1 Years |
(1) Consist of debt obligations of FHLB, FNMA, FHLMC or FFCB.
The estimated fair values of securities with gross unrealized losses segregated between securities that have been in a continuous unrealized loss position for less than twelve months at the respective dates and those that have been in a continuous unrealized loss position for twelve months or longer are summarized as follows:
| | | | | | | | | | | | | | |
($ in thousands) | | Number of
Securities | | Less Than Twelve Months | | Twelve Months or Longer | | Total |
| | | Estimated
Fair
Value | | Gross
Unrealized
Losses | | Estimated
Fair
Value | | Gross
Unrealized
Losses | | Estimated
Fair
Value | | Gross
Unrealized
Losses |
At December 31, 2006 | | | | | | | | | | | | | | |
U.S. government agencies | | 184 | | $227,971 | | $597 | | $113,510 | | $621 | | $341,481 | | $1,218 |
Corporate | | 6 | | 5,964 | | 46 | | — | | — | | 5,964 | | 46 |
| | | 190 | | $233,935 | | $643 | | $113,510 | | $621 | | $347,445 | | $1,264 |
At December 31, 2005 | | | | | | | | | | | | | | |
U.S. government agencies | | 150 | | $75,661 | | $426 | | $157,915 | | $2,008 | | $233,576 | | $2,434 |
Management believes that the cause of the unrealized losses is directly related to changes in interest rates, which is consistent with its experience. In general, as interest rates rise, the fair value of fixed rate securities will decrease; as interest rates fall, their fair value will increase. Nearly all of the securities in the portfolio have fixed rates or have predetermined scheduled rate increases, and many have call features that allow the issuer to call the security at par before its stated maturity without penalty.
Management views the unrealized losses to be temporary based on the impact of interest rates, the very short maturities of the investments and their high credit quality. In addition, the Bank, which holds the portfolio, has the ability and intent to hold its investments for a period of time sufficient for the fair value of the securities to recover, which may be at maturity. Historically, the Bank has always recovered the cost of its investment securities upon maturity. Management evaluates the securities for other-than-temporary impairment at least on a quarterly basis, and more frequently when economic or market concerns warrant such evaluation. There were no other-than-temporary impairment write-downs recorded in 2006, 2005 or 2004. There were also no securities classified as available for sale and no sales of securities during 2006, 2005 and 2004.
The amortized cost and estimated fair value of securities held to maturity by remaining term to contractual maturity as of December 31, 2006 is as follows:
| | | | | | | |
($ in thousands) | | Amortized Cost | | Estimated Fair Value | | Average Yield | |
Due in one year or less | | $112,454 | | $111,958 | | 4.11 | % |
Due after one year through five years | | 284,555 | | 283,961 | | 5.17 | |
Due after five years through ten years | | 996 | | 988 | | 5.02 | |
Due after ten years | | 6,010 | | 5,964 | | 5.62 | |
| | | $404,015 | | $402,871 | | 4.88 | % |
69
Intervest Bancshares Corporation and Subsidiaries
Notes to Consolidated Financial Statements
|
For the Years Ended December 31, 2006, 2005 and 2004 |
Loans receivable is as follows:
| | | | | | | | | | | | |
| | At December 31, 2006 | | | At December 31, 2005 | |
($ in thousands) | | # of Loans | | | Amount | | | # of Loans | | | Amount | |
Commercial real estate loans | | 285 | | $ | 812,063 | | | 264 | | $ | 735,650 | |
Residential multifamily loans | | 228 | | | 634,753 | | | 234 | | | 538,760 | |
Land development and other land loans | | 23 | | | 54,917 | | | 31 | | | 105,251 | |
Residential 1-4 family loans | | 1 | | | 35 | | | 3 | | | 100 | |
Commercial business loans | | 21 | | | 745 | | | 22 | | | 1,089 | |
Consumer loans | | 12 | | | 218 | | | 10 | | | 194 | |
Loans receivable | | 570 | | | 1,502,731 | | | 564 | | | 1,381,044 | |
Deferred loan fees | | | | | (12,078 | ) | | | | | (13,058 | ) |
Loans receivable, net of deferred fees | | | | | 1,490,653 | | | | | | 1,367,986 | |
Allowance for loan losses | | | | | (17,833 | ) | | | | | (15,181 | ) |
Loans receivable, net | | | | $ | 1,472,820 | | | | | $ | 1,352,805 | |
At December 31, 2006 and 2005, there were $3.3 million and $0.7 million of loans on a nonaccrual status, respectively. These loans were considered impaired under the criteria of SFAS No.114. but no valuation allowance was maintained at any time since the Company believes that the estimated fair value of the underlying properties exceeded the Company’s recorded investment. At December 31, 2006 and 2005, there were no other loans classified as nonaccrual or impaired. At December 31, 2005, there were $2.6 million of loans ninety days past due and still accruing interest since they were deemed by management to be well secured and in the process of collection. There were no such loans at December 31, 2006.
Interest income that was not recorded on nonaccrual loans under their contractual terms amounted to $0.2 million in 2006, $0.1 million in 2005 and $0.2 million in 2004. The average balance of nonaccrual (impaired) loans for 2006, 2005 and 2004 was $6.7 million, $3.8 million and $3.2 million, respectively.
The geographic distribution of the loan portfolio is as follows:
| | | | | | | | | | | | |
| | | At December 31, 2006 | | | | At December 31, 2005 | |
($ in thousands) | | | Amount | | % of Total | | | | Amount | | % of Total | |
New York | | $ | 1,005,946 | | 66.9 | % | | $ | 896,746 | | 64.9 | % |
Florida | | | 366,393 | | 24.4 | | | | 323,764 | | 23.5 | |
Connecticut and New Jersey | | | 52,185 | | 3.5 | | | | 84,373 | | 6.1 | |
All other | | | 78,207 | | 5.2 | | | | 76,161 | | 5.5 | |
| | | $ | 1,502,731 | | 100.0 | % | | $ | 1,381,044 | | 100.0 | % |
| 4. | Allowance for Loan Losses |
Activity in the allowance for loan losses is as follows:
| | | | | | |
| | For the Year Ended December 31, |
($ in thousands) | | 2006 | | 2005 | | 2004 |
Allowance at beginning of year | | $ 15,181 | | $ 11,106 | | $ 6,580 |
Provision charged to operations | | 2,652 | | 4,075 | | 4,526 |
Allowance at end of year | | $ 17,833 | | $ 15,181 | | $ 11,106 |
| 5. | Premises and Equipment, Lease Commitments and Rental Expense |
Premises and equipment is as follows:
| | | | | | | | |
| | | At December 31, | |
($ in thousands) | | | 2006 | | | | 2005 | |
Land | | $ | 1,516 | | | $ | 1,516 | |
Buildings | | | 5,016 | | | | 5,002 | |
Leasehold improvements | | | 1,699 | | | | 1,356 | |
Furniture, fixtures and equipment | | | 2,364 | | | | 2,282 | |
Total cost | | | 10,595 | | | | 10,156 | |
Less accumulated deprecation and amortization | | | (4,216 | ) | | | (3,735 | ) |
Net book value | | $ | 6,379 | | | $ | 6,421 | |
70
Intervest Bancshares Corporation and Subsidiaries
Notes to Consolidated Financial Statements
|
For the Years Ended December 31, 2006, 2005 and 2004 |
| 5. | Premises and Equipment, Lease Commitments and Rental Expense, Continued |
Depreciation and amortization of premises and equipment is reflected as a component of noninterest expense in the consolidated statements of earnings and was $0.5 million for 2006 and $0.6 million in 2005 and 2004.
The offices of the Holding Company, Intervest Mortgage Corporation and the Bank’s headquarters and full-service banking office are located in leased premises on the entire fourth floor of One Rockefeller Plaza in New York City, with such lease expiring in March 2014. In addition, the Bank leases its Belcher Road and Mandalay Avenue branch offices in Florida, which such leases expiring in June 2012 and January 2009, respectively. Additionally, the Bank has options to extend the Belcher Road lease (for an additional five years) and the Mandalay office lease (for up to an additional 12 years) prior to expiration, the cost of which is not reflected in the table below. All the leases above contain operating escalation clauses related to taxes and operating costs based upon various criteria and are accounted for as operating leases. The Bank owns all of its remaining offices in Florida and also leases a portion of the space in its office buildings in Florida that is not used for banking operations to other companies under leases that expire at various times through October 2009.
Future minimum annual lease payments (expense) and sublease income due under non-cancelable leases as of December 31, 2006 are as follows:
| | | | |
| | | Minimum Rentals |
($ in thousands) | | Lease Expense | | Sublease Income |
In 2007 | | $ 986 | | $376 |
In 2008 | | 1,057 | | 70 |
In 2009 | | 1,014 | | 46 |
In 2010 | | 1,011 | | - |
In 2011 | | 1,026 | | - |
Thereafter | | 2,143 | | - |
| | | $7,237 | | $492 |
Rent expense under operating leases aggregated $1.0 million in 2006, $0.9 million in 2005 and $1.0 million in 2004. Lease rental income aggregated $0.6 million in 2006, $0.6 million in 2005 and $0.5 million in 2004.
Scheduled maturities of certificates of deposit accounts are as follows:
| | | | | | | | | | |
| | | At December 31, 2006 | | At December 31, 2005 |
($ in thousands) | | | Amount | | Wtd-Avg
Stated Rate | | | Amount | | Wtd-Avg
Stated Rate |
Within one year | | $ | 630,454 | | 4.77% | | $ | 381,968 | | 3.77% |
Over one to two years | | | 193,993 | | 4.49 | | | 259,698 | | 4.30 |
Over two to three years | | | 204,636 | | 4.59 | | | 126,546 | | 4.13 |
Over three to four years | | | 178,767 | | 4.71 | | | 160,344 | | 4.43 |
Over four years | | | 127,544 | | 5.36 | | | 189,958 | | 4.69 |
| | | $ | 1,335,394 | | 4.75% | | $ | 1,118,514 | | 4.18% |
Certificate of deposit accounts of $100,000 or more totaled $490.9 million and $371.8 million at December 31, 2006 and 2005, respectively. At December 31, 2006, certificate of deposit accounts of $100,000 or more by remaining maturity were as follows: $241.0 million due within one year; $57.9 million due over one to two years; $75.8 million due over two to three years; $61.0 million due over three to four years; and $55.2 million due over four years.
Interest expense on deposit accounts is as follows:
| | | | | | | | | |
| | | For the Year Ended December 31, |
($ in thousands) | | | 2006 | | | 2005 | | | 2004 |
Interest checking accounts | | $ | 148 | | $ | 166 | | $ | 187 |
Savings accounts | | | 407 | | | 536 | | | 550 |
Money market accounts | | | 9,782 | | | 5,947 | | | 3,583 |
Certificates of deposit accounts | | | 55,294 | | | 38,270 | | | 22,010 |
| | | $ | 65,631 | | $ | 44,919 | | $ | 26,330 |
71
Intervest Bancshares Corporation and Subsidiaries
Notes to Consolidated Financial Statements
|
For the Years Ended December 31, 2006, 2005 and 2004 |
| 7. | Subordinated Debentures and Mortgage Note Payable |
Subordinated debentures and mortgage note payable outstanding are summarized as follows:
| | | | | | |
| | | | | At December 31, |
($ in thousands) | | | | 2006 | | 2005 |
INTERVEST MORTGAGE CORPORATION: | | | | | | |
Series 06/28/99 - interest at 9% fixed | | - due July 1, 2006 | | $ - | | $ 2,000 |
Series 09/18/00 - interest at 9% fixed | | - due January 1, 2008 | | - | | 1,250 |
Series 08/01/01 - interest at 8% fixed | | - due April 1, 2007 | | - | | 2,750 |
Series 08/01/01 - interest at 8 1/2% fixed | | - due April 1, 2009 | | - | | 2,750 |
Series 01/17/02 - interest at 7 1/2% fixed | | - due October 1, 2007 | | - | | 2,250 |
Series 01/17/02 - interest at 7 3/4% fixed | | - due October 1, 2009 | | 2,250 | | 2,250 |
Series 08/05/02 - interest at 7 1/2% fixed | | - due January 1, 2008 | | 3,000 | | 3,000 |
Series 08/05/02 - interest at 7 3/4% fixed | | - due January 1, 2010 | | 3,000 | | 3,000 |
Series 01/21/03 - interest at 6 3/4% fixed | | - due July 1, 2006 | | - | | 1,500 |
Series 01/21/03 - interest at 7 % fixed | | - due July 1, 2008 | | 3,000 | | 3,000 |
Series 01/21/03 - interest at 7 1/4% fixed | | - due July 1, 2010 | | 3,000 | | 3,000 |
Series 07/25/03 - interest at 6 1/2% fixed | | - due October 1, 2006 | | - | | 2,500 |
Series 07/25/03 - interest at 6 3/4% fixed | | - due October 1, 2008 | | 3,000 | | 3,000 |
Series 07/25/03 - interest at 7 % fixed | | - due October 1, 2010 | | 3,000 | | 3,000 |
Series 11/28/03 - interest at 6 1/4% fixed | | - due April 1, 2007 | | 2,000 | | 2,000 |
Series 11/28/03 - interest at 6 1/2% fixed | | - due April 1, 2009 | | 3,500 | | 3,500 |
Series 11/28/03 - interest at 6 3/4% fixed | | - due April 1, 2011 | | 4,500 | | 4,500 |
Series 06/07/04 - interest at 6 1/4% fixed | | - due January 1, 2008 | | 2,500 | | 2,500 |
Series 06/07/04 - interest at 6 1/2% fixed | | - due January 1, 2010 | | 4,000 | | 4,000 |
Series 06/07/04 - interest at 6 3/4% fixed | | - due January 1, 2012 | | 5,000 | | 5,000 |
Series 03/21/05 - interest at 6 1/4% fixed | | - due April 1, 2009 | | 3,000 | | 3,000 |
Series 03/21/05 - interest at 6 1/2% fixed | | - due April 1, 2011 | | 4,500 | | 4,500 |
Series 03/21/05 - interest at 7% fixed | | - due April 1, 2013 | | 6,500 | | 6,500 |
Series 08/12/05 - interest at 6 1/4% fixed | | - due October 1, 2009 | | 2,000 | | 2,000 |
Series 08/12/05 - interest at 6 1/2% fixed | | - due October 1, 2011 | | 4,000 | | 4,000 |
Series 08/12/05 - interest at 7% fixed | | - due October 1, 2013 | | 6,000 | | 6,000 |
Series 06/12/06 - interest at 6 1/2% fixed | | - due July 1, 2010 | | 2,000 | | - |
Series 06/12/06 - interest at 6 3/4% fixed | | - due July 1, 2012 | | 4,000 | | - |
Series 06/12/06 - interest at 7% fixed | | - due July 1, 2014 | | 10,000 | | - |
| | | | |
| | | | 83,750 | | 82,750 |
INTERVEST BANCSHARES CORPORATION: | | | | | | |
Series 05/14/98 - interest at 8% fixed | | - due July 1, 2008 | | 1,710 | | 2,140 |
Series 12/15/00 - interest at 8 1/2% fixed | | - due April 1, 2006 | | - | | 1,250 |
Series 12/15/00 - interest at 9% fixed | | - due April 1, 2008 | | 1,250 | | 1,250 |
| | | | |
| | | | 2,960 | | 4,640 |
INTERVEST NATIONAL BANK: | | | | | | |
Mortgage note payable (1) - interest at 7% fixed - due February 1, 2017 | | 215 | | 229 |
| | | $ 86,925 | | $ 87,619 |
| | (1) | The note cannot be prepaid except during the last year of its term. |
Scheduled contractual maturities as of December 31, 2006 are as follows:
| | | | |
($ in thousands) | | Principal | | Accrued Interest |
In 2007 | | $ 2,015 | | $1,366 |
In 2008 | | 14,476 | | 1,519 |
In 2009 | | 10,767 | | 219 |
In 2010 | | 15,019 | | 366 |
In 2011 | | 13,020 | | 316 |
Thereafter | | 31,628 | | 354 |
| | | $86,925 | | $4,140 |
72
Intervest Bancshares Corporation and Subsidiaries
Notes to Consolidated Financial Statements
|
For the Years Ended December 31, 2006, 2005 and 2004 |
| 7. | Subordinated Debentures and Mortgage Note Payable, Continued |
The following debentures were repaid in 2006:
Series 12/15/00 due 04/01/06 were repaid early on 03/1/06 for $1.25 million of principal and $18,000 of accrued interest.
Series 06/28/99 due 07/01/06 were repaid early on 05/1/06 for $2.0 million of principal and $1,645,000 of accrued interest.
Series 01/21/03 due 07/01/06 were repaid early on 05/1/06 for $1.5 million of principal and $8,000 of accrued interest.
Series 07/25/03 due 10/01/06 were repaid early on 09/1/06 for $2.5 million of principal and $27,000 of accrued interest.
Series 09/18/00 due 11/01/08 were repaid early on 11/1/06 for $1.25 million of principal and $882,000 of accrued interest.
Series 08/01/01 due 04/01/07 were repaid early on 11/1/06 for $2.75 million of principal and $123,000 of accrued interest.
Series 08/01/01 due 04/01/09 were repaid early on 11/1/06 for $2.75 million of principal and $224,000 of accrued interest.
Series 01/17/02 due 10/01/07 were repaid early on 11/1/06 for $2.25 million of principal and $80,000 of accrued interest.
The following debentures were issued in 2006:
Series 06/12/06 issued in July for $16.0 million of principal for net proceeds, after offering costs, of $14.8 million.
The following debentures were repaid subsequent to December 31, 2006 and prior to the filing of this report:
Series 11/28/03 due 04/01/07 were repaid early on 2/1/07 for $2.0 million of principal and $504,000 of accrued interest.
Series 12/15/00 due 04/01/08 were repaid early on 3/1/07 for $1.25 million of principal and $13,000 of accrued interest.
Interest is paid quarterly on Intervest Mortgage Corporation’s debentures except for the following: $0.1 million of Series 1/17/02; $1.1 million of Series 8/05/02; $1.8 million of Series 11/28/03 ($1.3 million after the February 1, 2007 repayments); $1.9 million of Series 6/7/04; $1.9 million of Series 3/21/05; $1.8 million of Series 8/12/05 and $2.3 million of Series 6/12/06, all of which accrue and compound interest quarterly, with such interest due and payable at maturity. The holders of Intervest Mortgage Corporation’s Series 1/17/02 through 8/12/05 debentures can require Intervest Mortgage Corporation, on a first come basis during a specified time, to repurchase the debentures for face amount plus accrued interest once each year (beginning January 1, 2008 for Series 6/7/04, April 1, 2009 for Series 3/21/05 and October 1, 2009 for Series 8/12/05). However, in no calendar year can the required purchases be more than $100,000 in principal amount of each maturity, in each series of debentures, on a non-cumulative basis.
Intervest Mortgage Corporation’s may redeem its debentures at any time, in whole or in part, for face value, except for Series 8/12/05 and Series 6/12/06, which would be at a premium of 1% if they were redeemed prior to April 1, 2007 and January 1, 2008, respectively. All the debentures are unsecured and subordinate to all present and future senior indebtedness, as defined in the indenture related to each debenture.
The Holding Company’s Series 5/14/98 subordinated debentures are convertible along with accrued interest at the option of the holders at any time prior to April 1, 2008 into shares of its Class A common stock at the following conversion prices per share: $18.00 in 2007 and $20.00 from January 1, 2008 through April 1, 2008. In 2006, $753,000 of debentures ($430,000 of principal and $323,000 of accrued interest) were converted into 47,072 shares of Class A common stock at $16.00 per share.
At December 31, 2006, interest accrued and compounded quarterly on $1.3 million of the Holding Company’s convertible debentures at the rate of 8% per annum, while $0.4 million of the convertible debentures pay interest quarterly at the rate of 8% per annum. All accrued interest of $1.2 million is due and payable at maturity whether by acceleration, redemption or otherwise. Any convertible debenture holder may, on or before July 1 of each year, elect to be paid all accrued interest and to thereafter receive regular quarterly payments of interest. The Holding Company may redeem any of its debentures, in whole or in part, at any time for face value.
| 8. | Short-Term Borrowings and Lines of Credit |
At December 31, 2006, the Bank had agreements with correspondent banks whereby it could borrow up to $16 million on an unsecured basis. In addition, as a member of the Federal Home Loan Bank of New York (FHLB) and the Federal Reserve Bank of New York (FRB), the Bank can also borrow from these institutions on a secured basis.
73
Intervest Bancshares Corporation and Subsidiaries
Notes to Consolidated Financial Statements
|
For the Years Ended December 31, 2006, 2005 and 2004 |
| 8. | Short-Term Borrowings and Lines of Credit, Continued |
The following is a summary of certain information regarding short-term borrowings in the aggregate:
| | | | | | | | | | | | |
($ in thousands) | | | 2006 | | | | 2005 | | | | 2004 | |
Balance at year end (1) | | $ | 25,000 | | | $ | - | | | $ | 36,000 | |
Maximum amount outstanding at any month end | | $ | 46,200 | | | $ | 17,000 | | | $ | 36,000 | |
Average outstanding balance for the year | | $ | 10,215 | | | $ | 4,871 | | | $ | 1,914 | |
Weighted-average interest rate paid for the year | | | 5.31 | % | | | 2.85 | % | | | 2.08 | % |
Weighted-average interest rate at year end | | | 5.44 | % | | | - | % | | | 2.56 | % |
(1) The balance at December 31, 2006 represents an FHLB advance that matures on January 12, 2007.
At December 31, 2006, the Bank had available collateral consisting of investment securities to support additional total borrowings of $361 million from the FHLB and FRB.
| 9. | Subordinated Debentures - Capital Securities |
Capital Securities (commonly referred to as Trust Preferred Securities) are summarized as follows:
| | | | | | | | | | | | |
| | | At December 31, 2006 | | At December 31, 2005 |
($ in thousands) | | | Principal | |
| Accrued
Interest | | | Principal | |
| Accrued
Interest |
Capital Securities I - debentures due December 18, 2031 | | $ | - | | $ | - | | $ | 15,464 | | $ | 59 |
Capital Securities II - debentures due September 17, 2033 | | | 15,464 | | | 38 | | | 15,464 | | | 35 |
Capital Securities III - debentures due March 17, 2034 | | | 15,464 | | | 33 | | | 15,464 | | | 31 |
Capital Securities IV - debentures due September 20, 2034 | | | 15,464 | | | 29 | | | 15,464 | | | 29 |
Capital Securities V - debentures due December 15, 2036 | | | 10,310 | | | 31 | | | - | | | - |
| | | $ | 56,702 | | $ | 131 | | $ | 61,856 | | $ | 154 |
Capital Securities outstanding at December 31, 2006 are obligations of the Holding Company’s wholly owned statutory business trusts, Intervest Statutory Trust II, III, IV and V, respectively. Each Trust was formed with a capital contribution from the Holding Company and for the sole purpose of issuing and administering the Capital Securities. The proceeds from the issuance of the Capital Securities together with the capital contribution for each Trust were used to acquire the Holding Company’s Junior Subordinated Debentures that are due concurrently with the Capital Securities. The Capital Securities, net of the Holding Company’s capital contributions totaling $1.7 million, or $55 million, qualified as regulatory capital at December 31, 2006.
The sole assets of the Trusts, the obligors on the Capital Securities, are the Junior Subordinated Debentures. In addition, for each Trust, the Holding Company has guaranteed the payment of distributions on, payments on any redemptions of, and any liquidation distribution with respect to the Capital Securities. Issuance costs associated with Capital Securities II, III and IV totaling $1.1 million have been capitalized by the Holding Company and are being amortized over the life of the securities using the straight-line method. There are no deferred issuance costs associated with Capital Securities V.
Interest payments on the Junior Subordinated Debentures (and the corresponding distributions on the Capital Securities) are payable in arrears as follows:
| | • | | Capital Securities II - quarterly at the fixed rate of 6.75% per annum until September 17, 2008 and thereafter at the rate of 2.95% over 3 month libor; |
| | • | | Capital Securities III - quarterly at the fixed rate of 5.88% per annum until March 17, 2009 and thereafter at the rate of 2.79% over 3 month libor; |
| | • | | Capital Securities IV - quarterly at the fixed rate of 6.20% per annum until September 20, 2009 and thereafter at the rate of 2.40% over 3 month libor; and |
| | • | | Capital Securities V - quarterly at the fixed rate of 6.83% per annum until September 15, 2011 and thereafter at the rate of 1.65% over 3 month libor. |
74
Intervest Bancshares Corporation and Subsidiaries
Notes to Consolidated Financial Statements
|
For the Years Ended December 31, 2006, 2005 and 2004 |
| 9. | Subordinated Debentures - Capital Securities, Continued |
Interest payments may be deferred at any time and from time to time during the term of the Junior Subordinated Debentures at the election of the Holding Company for up to 20 consecutive quarterly periods, or 5 years. There is no limitation on the number of extension periods the Holding Company may elect; provided, however, no deferral period may extend beyond the maturity date of the Junior Subordinated Debentures. During an interest deferral period, interest will continue to accrue on the Junior Subordinated Debentures and interest on such accrued interest will accrue at an annual rate equal to the interest rate in effect for such deferral period, compounded quarterly from the date such interest would have been payable were it not deferred. At the end of the deferral period, the Holding Company will be obligated to pay all interest then accrued and unpaid.
All of the Capital Securities are subject to mandatory redemption as follows: (i) in whole, but not in part, upon repayment of the Junior Subordinated Debentures at stated maturity or earlier, at the option of the Holding Company, within 90 days following the occurrence and continuation of certain changes in the tax or capital treatment of the Capital Securities, or a change in law such that the statutory trust would be considered an investment company, contemporaneously with the redemption by the Holding Company of the Junior Subordinated Debentures; and (ii) in whole or in part at any time on or after September 17, 2008 for Capital Securities II, March 17, 2009 for Capital Securities III, September 20, 2009 for Capital Securities IV and September 15, 2011 for Capital Securities V contemporaneously with the optional redemption by the Holding Company of the Junior Subordinated Debentures in whole or in part. Any redemption would be subject to the receipt of regulatory approvals.
On December 18, 2006, the Holding Company used the proceeds from the sale of Capital Securities V (that was completed in September 2006), together with $5 million of available cash on hand, and repaid Capital Securities I in the principal amount of $15.5 million. The early repayment of these debentures resulted in $0.4 million of related unamortized issuance costs being expensed, which is included in “Loss on the early extinguishment of debentures” in the 2006 consolidated statement of earnings.
The Holding Company’s Board of Directors is authorized to issue without stockholder approval up to 13,000,000 shares of the Holding Company’s capital stock, consisting of 12,000,000 shares of Class A common stock, 700,000 shares of Class B common stock and 300,000 shares of preferred stock. The powers, preferences and rights, and the qualifications, limitations, and restrictions thereof on any series of preferred stock issued is determined by the Board of Directors. There is no preferred stock issued and outstanding. Class A and B common stock have equal voting rights as to all matters, except that, so long as at least 50,000 shares of Class B common stock remain issued and outstanding, the holders of the outstanding shares of Class B common stock are entitled to vote for the election of two-thirds of the Holding Company’s Board of Directors (rounded up to the nearest whole number), and the holders of the outstanding shares of Class A common stock are entitled to vote for the remaining directors. The shares of Class B common stock are convertible, on a share-for-share basis, into Class A common stock at any time.
| 11. | Asset and Dividend Restrictions |
The Bank is required under Federal Reserve Board regulations to maintain reserves, generally consisting of cash or noninterest-earning accounts, against its transaction accounts. At December 31, 2006 and 2005, balances maintained as reserves were approximately $1.0 million and $1.1 million, respectively.
As a member of the Federal Reserve Banking and Federal Home Loan Banking systems, the Bank must maintain an investment in the capital stock of the FRB and FHLB. At December 31, 2006 and 2005, the total investment, which earns a dividend, aggregated $6.9 million and $5.2 million. At December 31, 2006 and 2005, U.S. government agency securities with a carrying value of $75.6 million and $72.1 million, respectively, were pledged against various lines of credit.
75
Intervest Bancshares Corporation and Subsidiaries
Notes to Consolidated Financial Statements
|
For the Years Ended December 31, 2006, 2005 and 2004 |
| 11. | Asset and Dividend Restrictions, Continued |
The payment of cash dividends by the Holding Company to its shareholders and the payment of cash dividends by the Holding Company’s subsidiaries to the Holding Company itself are subject to various regulatory restrictions, as well as restrictions that may arise from outstanding indentures. These restrictions take into consideration various factors such as whether there are sufficient net earnings, as defined, liquidity, asset quality, capital adequacy and economic conditions. The holders of Class A common stock and Class B common stock share ratably in any dividend. The Holding Company has never paid a cash or stock dividend on its capital stock and currently is not contemplating the payment of a dividend.
The Company sponsors a tax-qualified profit sharing plan in accordance with the provisions of Section 401(k) of the Internal Revenue Code, whereby eligible employees meeting certain length-of-service requirements may make tax-deferred contributions up to certain limits. The Company makes discretionary matching contributions up to 3% of employee compensation, which vest to the employees over a five-year period. Total cash contributions to the plan aggregated $78,000, $72,000 and $68,000 in 2006, 2005 and 2004, respectively, and were included in the line item “salaries and benefits” in the consolidated statements of earnings
| 13. | Related Party Transactions |
At December 31, 2006 and 2005, consolidated deposits included deposit accounts from directors, executive officers and members of their immediate families and related business interests totaling $27 million and $24 million, respectively. No loans were outstanding or made to any directors or executive officers of the Holding Company or its subsidiaries in 2006 or 2005. The Company paid fees of $0.2 million in 2006, 2005 and 2004 for legal services rendered by a law firm, a principal of which is a director of the Company. Intervest Mortgage Corporation paid commissions and fees in connection with the placement of debentures of $0.5 million in 2006, $0.9 million in 2005 and $0.7 million in 2004 to a broker/dealer, a principal of which is a director of the Company. The Bank paid commissions to the same broker/dealer of $53,000 in 2006, $22,000 in 2005 and $69,000 in 2004 in connection with the purchase of investment securities.
The Holding Company had common stock warrants outstanding at December 31, 2006 that entitle its current holder, the estate of the former Chairman of the Company, Jerome Dansker, to purchase one share of the Holding Company’s Class B common stock. All warrants are vested and exercisable and expire on January 31, 2008.
A summary of the activity in the Holding Company’s common stock warrants and related information for the last three years follows (intrinsic value is presented in thousands):
| | | | | | | | | | | |
| | Exercise Price Per Warrant | | | Total
Warrants |
| | Wtd.-Avg.
Exercise Price |
Class A Common Stock Warrants: | | $6.67 | | | $10.01 | | | |
Outstanding at December 31, 2003 | | 501,465 | | | 42,510 | | | 543,975 | | | $ 6.93 |
Exercised in 2004 | | - | | | (42,510 | ) | | (42,510 | ) | | $ 10.01 |
Outstanding at December 31, 2004 and 2005 | | 501,465 | | | - | | | 501,465 | | | $ 6.67 |
Exercised in 2006 | | (501,465 | ) | | - | | | (501,465 | ) | | $ 6.67 |
Outstanding at December 31, 2006 | | - | | | - | | | - | | | - |
| | | |
| | Exercise Price Per Warrant | | | Total
Warrants |
| | Wtd.-Avg.
Exercise Price |
Class B Common Stock Warrants: | | $6.67 | | | $10.00 | | | |
Outstanding at December 31, 2004, 2005 and 2006 | | 145,000 | | | 50,000 | | | 195,000 | | | $ 7.52 |
Remaining contractual term at December 31, 2006 | | 1.1 years | | | 1.1 years | | | 1.1 years | | | |
Intrinsic value (1) | | $4,022 | | | $1,221 | | | $5,243 | | | |
(1) Intrinsic value represents the value of the Holding Company’s closing stock price of its Class A common stock on December 29, 2006 in excess of the exercise price multiplied by the number of warrants outstanding. Total intrinsic value of warrants exercised in 2006 was $14.3 million and the related income tax benefit was $6.2 million, which was recorded in paid in capital. There is no trading market for the Class B common stock. The Class B common stock can be converted into Class A common stock at anytime.
76
Intervest Bancshares Corporation and Subsidiaries
Notes to Consolidated Financial Statements
|
For the Years Ended December 31, 2006, 2005 and 2004 |
| 14. | Common Stock Warrants, Continued |
There were no grants of warrants or options in 2006, 2005 or 2004 and no compensation expense was recorded in the consolidated financial statements for 2006 and 2005 in connection with the Holding Company’s outstanding warrants. In 2004, $9,000 of compensation expense was recorded in connection with various warrants whose terms were modified in 2002.
The Holding Company and its subsidiaries file a consolidated federal income tax return and combined state and city income tax returns in New York. The Holding Company also files a franchise tax return in Delaware and the Bank files a state income tax return in Florida. All returns are filed on a calendar year basis. At December 31, 2006 and 2005, the Company had a net deferred tax asset amounting to $8.7 million and $7.0 million, respectively. The asset relates to the unrealized benefit for net temporary differences between the financial statement carrying amounts of existing assets and liabilities and their respective tax bases that will result in future tax deductions. In assessing the realizability of deferred tax assets, management considers whether it is more likely than not that some portion or all of the deferred tax assets will not be realized based on available evidence. Management concluded that a valuation allowance for deferred tax assets was not necessary at any time during the reporting periods.
Allocation of federal, state and local income taxes between current and deferred portions is as follows:
| | | | | | | | | | |
($ in thousands) | | | Current | | | Deferred | | | | Total |
Year Ended December 31, 2006: | | | | | | | | | | |
Federal | | $ | 13,761 | | $ | (1,353 | ) | | $ | 12,408 |
State and Local | | | 5,898 | | | (353 | ) | | | 5,545 |
| | | $ | 19,659 | | $ | (1,706 | ) | | $ | 17,953 |
Year Ended December 31, 2005: | | | | | | | | | | |
Federal | | $ | 11,122 | | $ | (1,547 | ) | | $ | 9,575 |
State and Local | | | 4,837 | | | (346 | ) | | | 4,491 |
| | | $ | 15,959 | | $ | (1,893 | ) | | $ | 14,066 |
Year Ended December 31, 2004: | | | | | | | | | | |
Federal | | $ | 7,707 | | $ | (1,742 | ) | | $ | 5,965 |
State and Local | | | 3,204 | | | (393 | ) | | | 2,811 |
| | | $ | 10,911 | | $ | (2,135 | ) | | $ | 8,776 |
The components of the deferred tax benefit are as follows:
| | | | | | |
| | For the Year Ended December 31, |
($ in thousands) | | 2006 | | 2005 | | 2004 |
Allowance for loan losses | | $(1,150) | | $(1,939) | | $(2,073) |
Organization and startup costs | | - | | - | | 11 |
Deferred compensation and benefits | | (462) | | (175) | | (4) |
Depreciation | | (94) | | 165 | | (88) |
Deferred income | | - | | 56 | | 19 |
| | | $(1,706) | | $(1,893) | | $(2,135) |
The tax effects of the temporary differences that give rise to the deferred tax asset are as follows:
| | | | | | |
| | | At December 31, |
($ in thousands) | | | 2006 | | | 2005 |
Allowance for loan losses | | $ | 7,630 | | $ | 6,480 |
Deferred compensation and benefits | | | 714 | | | 252 |
Depreciation | | | 196 | | | 102 |
Deferred income | | | 144 | | | 144 |
All other | | | 10 | | | 10 |
Total deferred tax asset | | $ | 8,694 | | $ | 6,988 |
77
Intervest Bancshares Corporation and Subsidiaries
Notes to Consolidated Financial Statements
|
For the Years Ended December 31, 2006, 2005 and 2004 |
| 15. | Income Taxes, Continued |
The reconciliation between the statutory federal income tax rate and the Company’s effective income tax rate (including state and local taxes) is as follows:
| | | | | | | | | |
| | For the Year Ended December 31, | |
| | | 2006 | | | 2005 | | | 2004 | |
Federal statutory income tax rate | | 35.0 | % | | 35.0 | % | | 35.0 | % |
State and local income tax rate, net of federal benefit | | 8.3 | | | 8.6 | | | 8.4 | |
| | | 43.3 | % | | 43.6 | % | | 43.4 | % |
The Company’s income taxes payable has been reduced by the tax benefit from the exercise of common stock warrants held by employees or directors (calculated as the difference between the fair market value of the stock issued at the time of the exercise and the warrant exercise price, multiplied by the effective income tax rate). The net tax benefit from these common stock warrant transactions amounted to $6.2 million in 2006 and none in 2005 and 2004, and is reflected as an increase to paid-in capital.
Net earnings applicable to common stock and the weighted-average number of shares used for basic and diluted earnings per share computations are summarized in the table that follows:
| | | | | | |
| | For the Year Ended December 31, |
($ in thousands, except share and per share amounts) | | 2006 | | 2005 | | 2004 |
Basic Earnings Per Share: | | | | | | |
Net earnings applicable to common stockholders | | $23,531 | | $18,184 | | $11,453 |
Weighted-average number of common shares outstanding | | 7,893,489 | | 6,861,887 | | 6,068,755 |
Basic Earnings Per Share | | $ 2.98 | | $ 2.65 | | $ 1.89 |
Diluted Earnings Per Share: | | | | | | |
Net earnings applicable to common stockholders | | $23,531 | | $18,184 | | $11,453 |
Adjustment to net earnings from assumed conversion of debentures (1) | | 148 | | 215 | | 254 |
| | |
Adjusted net earnings for diluted earnings per share computation | | $ 23,679 | | $18,399 | | $11,707 |
| | |
Weighted-Average number of common shares outstanding: | | | | | | |
Common shares outstanding | | 7,893,489 | | 6,861,887 | | 6,068,755 |
Potential dilutive shares resulting from exercise of warrants (2) | | 307,335 | | 266,668 | | 255,171 |
Potential dilutive shares resulting from conversion of debentures (3) | | 200,555 | | 321,103 | | 504,250 |
| | |
Total average number of common shares outstanding used for dilution | | 8,401,379 | | 7,449,658 | | 6,828,176 |
Diluted Earnings Per Share | | $ 2.82 | | $ 2.47 | | $ 1.71 |
| | (1) | Represents interest expense on dilutive convertible debentures, net of taxes, that would not occur if they were assumed converted. |
| | (2) | All outstanding warrants were considered for the EPS computations. |
| | (3) | Convertible debentures (principal and accrued interest) outstanding at December 31, 2006, 2005 and 2004 totaling $2.9 million, $3.5 million and $4.8 million, respectively, were convertible into common stock at a price of $16.00 per share in 2006, $14.00 per share in 2005 and $12.00 per share in 2004, which result in potential common shares (based on average balances outstanding). |
The Holding Company was party to a class action lawsuit that was filed in conjunction with its 2006 proxy statement issued in advance of its annual meeting of shareholders that was held in May 2006. The lawsuit was filed in the Court of Chancery of the State of Delaware, individually and as a class action on behalf of Class A stockholders. The action challenged the proposed amendment and delegation of authority to the Board of Directors of the Holding Company to extend the expiration date of the warrants held by Jerome Dansker, the Holding Company’s former Chairman.
Although the Holding Company denied any wrongdoing or liability, it determined that it was in the best interests of the Holding Company and its stockholders to reach a prompt and amicable settlement with respect to the action. In that regard, on May 15, 2006, the Holding Company entered into a Memorandum of Understanding with the plaintiff in the matter.
78
Intervest Bancshares Corporation and Subsidiaries
Notes to Consolidated Financial Statements
|
For the Years Ended December 31, 2006, 2005 and 2004 |
| 17. | Contingencies, Continued |
The Memorandum provided, among other things, that: (i) if the amendments were approved by the stockholders, the authority conferred on the directors by the amendments would not provide for an extension of the terms of the warrants for more than 2 years; (ii) in determining incentive compensation of the then chairman, the Holding Company’s Compensation Committee would take into consideration any extension of the term of the warrants, the value of such extension and any related expense to the Holding Company; and (iii) the Holding Company agreed to and did send to its stockholders a supplement to its proxy statement. The proposed amendments were approved by the Holding Company’s stockholders at the annual meeting.
The parties agreed to a Stipulation of Settlement and dismissal of the action consistent with the Memorandum, which was approved by the Court of Chancery. By the terms of the Stipulation of Settlement, the Holding Company paid a total of $150,000 for the fees and out of pocket expenses of plaintiffs counsel, which is included in “professional fees” in the noninterest expense section of the 2006 consolidated statement of earnings. Jerome Dansker has since passed away and the only remaining outstanding warrants at December 31, 2006 were warrants to purchase 195,000 shares of the Holding Company’s Class B common stock, all of which were held by Mr. Dansker’s estate.
The Company is also periodically a party to or otherwise involved in legal proceedings arising in the normal course of business, such as foreclosure proceedings. Based on review and consultation with legal counsel, management does not believe that there is any pending or threatened proceeding against the Company, which, if determined adversely, would have a material effect on the business, results of operations, financial position or liquidity of the Company.
| 18. | Contractual Death Benefit Payments |
The Holding Company and Intervest Mortgage Corporation, are contractually obligated to pay death benefits to the spouse of each company’s former Chairman, Jerome Dansker, pursuant to the terms of the employment agreements between Jerome Dansker and those two companies. The employment agreements require the payment to his spouse of an amount called the “Distribution Amount” during a period called the “Distribution Term.” The Distribution Amount, in the case of the Holding Company is 25% of the amounts that would have been paid monthly to Jerome Dansker as salary by the Holding Company and the Distribution Term is the balance of the term of the agreement, or through June 30, 2014. In the case of Intervest Mortgage Corporation, the Distribution Amount is 50% of the amounts that would have been paid monthly to Jerome Dansker as salary by Intervest Mortgage Corporation and the Distribution Term is likewise through June 30, 2014.
As a result of the death of the former Chairman in August 2006, a consolidated death benefit payable and corresponding expense of $1.5 million was recorded in the third quarter of 2006. The payable is included in the consolidated balance sheet in the line item “other liabilities” and the expense is included in the consolidated statement of earnings in the line item “salaries and employee benefits.” The amount recorded represented the estimated net present value of the total monthly death benefit payments of $1.9 million that is payable to Jerome Dansker’s spouse through June 30, 2014. The difference between the estimated net present value and the total payments of $1.9 million is being recorded as interest expense in future periods through June 30, 2014 and included as a component of “salaries and employee benefits.”
At December 31, 2006, the remaining payments due are as follows: $0.2 million each year from 2007 through 2010, $0.3 million each year from 2011 to 2013 and $0.2 million in 2014. In the event of the death of Jerome Dansker’s spouse prior to the June 30, 2014, any remaining payments will be paid in a lump sum to the spouse’s estate.
79
Intervest Bancshares Corporation and Subsidiaries
Notes to Consolidated Financial Statements
|
For the Years Ended December 31, 2006, 2005 and 2004 |
| 19. | Off-Balance Sheet Financial Instruments |
The Company is a party to financial instruments with off-balance sheet risk in the normal course of business to meet the financing needs of its customers. These instruments are in the form of commitments to extend credit, unused lines of credit and standby letters of credit, and may involve, to varying degrees, elements of credit and interest rate risk in excess of the amounts recognized in the consolidated financial statements. The Company’s maximum exposure to credit risk is represented by the contractual amount of those instruments.
Commitments to extend credit are agreements to lend funds to a customer as long as there is no violation of any condition established in the contract. Such commitments generally have fixed expiration dates or other termination clauses and normally require payment of fees to the Company. Since some of the commitments are expected to expire without being drawn upon, the total commitment amount does not necessarily represent future cash requirements. The Company evaluates each customer’s creditworthiness on a case-by-case basis. The amount of collateral obtained upon extension of credit is based on management’s credit evaluation of the counterparty. Standby letters of credit are conditional commitments issued by the Bank to guarantee the performance of a customer to a third party. The credit risk involved in issuing letters of credit is essentially the same as that involved in originating loans.
The contractual amounts of off-balance sheet financial instruments are as follows:
| | | | | | |
| | | At December 31, |
($ in thousands) | | | 2006 | | | 2005 |
Unfunded loan commitments | | $ | 107,848 | | $ | 101,597 |
Available lines of credit | | | 939 | | | 737 |
Standby letters of credit | | | 100 | | | 100 |
| | | $ | 108,887 | | $ | 102,434 |
The Company is subject to regulation, examination and supervision by the FRB. The Bank is also subject to regulation, examination and supervision by the Federal Deposit Insurance Corporation (FDIC) and the Office of the Comptroller of the Currency of the United States of America (OCC).
The Holding Company and the Bank are subject to various regulatory capital requirements administered by the federal banking agencies. Failure to meet them can initiate certain mandatory and possibly discretionary actions by the regulators that, if undertaken, could have a direct material effect on the Company’s and the Bank’s financial statements. Under capital adequacy guidelines and the regulatory framework for prompt corrective action, the Holding Company and the Bank must meet specific capital guidelines that involve quantitative measures of their assets, liabilities and certain off-balance sheet items as calculated under regulatory accounting practices. These capital amounts are also subject to qualitative judgement by the regulators about components, risk weighting and other factors.
Quantitative measures established by the regulations to ensure capital adequacy require the Holding Company, on a consolidated basis, and the Bank to maintain minimum amounts and ratios of total and Tier 1 capital to risk-weighted assets and of Tier 1 capital to average assets, as defined by the regulations.
In 2005, the Federal Reserve issued a final rule that retains trust preferred securities in the Tier 1 capital of bank holding companies (BHC), but with stricter quantitative limits and clearer qualitative standards. The rule provides a transition period for BHCs to meet the new, stricter limitations within regulatory capital by allowing the limits on restricted core capital elements to become fully effective as of March 31, 2009. Until March 31, 2009, BHCs generally must comply with the current Tier 1 capital limits. As of December 31, 2006 and 2005, assuming the Holding Company no longer included its eligible trust preferred securities (which totaled $55.0 million and $45.4 million, respectively) in Tier 1 Capital, the Holding Company would still have exceed the well capitalized threshold under the regulatory framework for prompt corrective action.
80
Intervest Bancshares Corporation and Subsidiaries
Notes to Consolidated Financial Statements
|
For the Years Ended December 31, 2006, 2005 and 2004 |
| 20. | Regulatory Capital, Continued |
Management believes, as of December 31, 2006 and 2005, that the Holding Company and the Bank met all capital adequacy requirements to which they are subject. As of December 31, 2006, the most recent notification from the Bank’s regulators categorized the Bank as a well-capitalized institution under the regulatory framework for prompt corrective action, which requires minimum Tier 1 leverage and Tier 1 and total risk-based capital ratios of 5%, 6% and 10%, respectively. Management is not aware of any current conditions or events outstanding that would change the designation from well capitalized.
The table that follows presents information regarding capital adequacy.
| | | | | | | | | | | | | | |
| | | Actual | |
| Minimum Capital
Requirements | | Minimum to Be Well
Capitalized Under
Prompt Corrective
Action Provisions |
($ in thousands) | | | Amount | | Ratio | | | Amount | | Ratio | | Amount | | Ratio |
Consolidated as of December 31, 2006: | | | | | | | | | | | | | | |
Total capital to risk-weighted assets | | $ | 242,879 | | 14.95% | | $ | 129,977 | | 8.00% | | NA | | NA |
Tier 1 capital to risk-weighted assets | | $ | 225,046 | | 13.85% | | $ | 64,989 | | 4.00% | | NA | | NA |
Tier 1 capital to average assets | | $ | 225,046 | | 11.43% | | $ | 78,781 | | 4.00% | | NA | | NA |
| | | | | | |
Consolidated as of December 31, 2005: | | | | | | | | | | | | | | |
Total capital to risk-weighted assets | | $ | 211,359 | | 14.42% | | $ | 117,282 | | 8.00% | | NA | | NA |
Tier 1 capital to risk-weighted assets | | $ | 181,571 | | 12.39% | | $ | 58,641 | | 4.00% | | NA | | NA |
Tier 1 capital to average assets | | $ | 181,571 | | 10.85% | | $ | 66,953 | | 4.00% | | NA | | NA |
| | | | | | |
Intervest National Bank at December 31, 2006: | | | | | | | | | | | | | | |
Total capital to risk-weighted assets | | $ | 198,662 | | 13.01% | | $ | 122,143 | | 8.00% | | $152,679 | | 10.00% |
Tier 1 capital to risk-weighted assets | | $ | 181,176 | | 11.87% | | $ | 61,072 | | 4.00% | | $ 91,607 | | 6.00% |
Tier 1 capital to average assets | | $ | 181,176 | | 9.84% | | $ | 73,649 | | 4.00% | | $ 92,062 | | 5.00% |
| | | | | | |
Intervest National Bank at December 31, 2005: | | | | | | | | | | | | | | |
Total capital to risk-weighted assets | | $ | 171,688 | | 12.60% | | $ | 109,018 | | 8.00% | | $136,273 | | 10.00% |
Tier 1 capital to risk-weighted assets | | $ | 156,842 | | 11.51% | | $ | 54,509 | | 4.00% | | $ 81,764 | | 6.00% |
Tier 1 capital to average assets | | $ | 156,842 | | 10.04% | | $ | 62,511 | | 4.00% | | $ 78,139 | | 5.00% |
| 21. | Fair Value of Financial Instruments |
The carrying and estimated fair values of the Company’s financial instruments are as follows:
| | | | | | | | | | | | |
| | | At December 31, 2006 | | | At December 31, 2005 |
($ in thousands) | |
| Carrying
Value | |
| Fair
Value | |
| Carrying
Value | |
| Fair
Value |
Financial Assets: | | | | | | | | | | | | |
Cash and cash equivalents | | $ | 40,195 | | $ | 40,195 | | $ | 56,716 | | $ | 56,716 |
Securities held to maturity, net | | | 404,015 | | | 402,871 | | | 251,508 | | | 249,088 |
FRB and FHLB stock | | | 6,938 | | | 6,938 | | | 5,241 | | | 5,241 |
Loans receivable, net | | | 1,472,820 | | | 1,497,323 | | | 1,352,805 | | | 1,355,504 |
Loan fees receivable | | | 10,443 | | | 8,484 | | | 10,941 | | | 9,097 |
Accrued interest receivable | | | 12,769 | | | 12,769 | | | 7,706 | | | 7,706 |
Financial Liabilities: | | | | | | | | | | | | |
Deposit liabilities | | | 1,588,534 | | | 1,582,426 | | | 1,375,330 | | | 1,366,539 |
Borrowed funds plus accrued interest payable | | | 172,909 | | | 178,610 | | | 155,725 | | | 156,615 |
Accrued interest payable on deposits | | | 4,259 | | | 4,259 | | | 3,232 | | | 3,232 |
Off-Balance Sheet Instruments: | | | | | | | | | | | | |
Commitments to lend | | | 545 | | | 545 | | | 794 | | | 794 |
81
Intervest Bancshares Corporation and Subsidiaries
Notes to Consolidated Financial Statements
|
For the Years Ended December 31, 2006, 2005 and 2004 |
| 21. | Fair Value of Financial Instruments, Continued |
Fair value estimates are made at a specific point in time based on available information. Where available, quoted market prices are used. However, a significant portion of the Company’s financial instruments, such as mortgage loans, do not have an active marketplace in which they can be readily sold or purchased to determine fair value. Consequently, fair value estimates for such instruments are based on assumptions made by management that include the instrument’s credit risk characteristics and future estimated cash flows and prevailing interest rates. As a result, these fair value estimates are subjective in nature, involve uncertainties and matters of significant judgment and therefore, cannot be determined with precision. Accordingly, changes in any of management’s assumptions could cause the fair value estimates to deviate substantially. The fair value estimates also do not reflect any additional premium or discount that could result from offering for sale, at one time, the Company’s entire holdings of a particular financial instrument, nor estimated transaction costs.
Further, the tax ramifications related to the realization of unrealized gains and losses can have a significant effect on and have not been considered in the fair value estimates. Finally, fair value estimates do not attempt to estimate the value of anticipated future business, the Company’s customer relationships, branch network, and the value of assets and liabilities that are not considered financial instruments, such as core deposit intangibles and premises and equipment.
The following methods and assumptions were used to estimate the fair value of financial instruments:
Securities.The estimated fair value of securities held to maturity is based on quoted market prices. The estimated fair value of the FRB and FHLB stock approximates carrying value since the securities do not present credit concerns and are redeemable at cost.
Loans Receivable. The estimated fair value of loans is based on a discounted cash flow analysis, using interest rates currently being offered for loans with similar terms to borrowers of similar credit quality. Management can make no assurance that its perception and quantification of credit risk would be viewed in the same manner as that of a potential investor. Therefore, changes in any of management’s assumptions could cause the fair value estimates of loans to deviate substantially.
Deposits. The estimated fair value of deposits with no stated maturity, such as savings, money market, checking and noninterest-bearing demand deposit accounts approximates carrying value. The estimated fair value of certificates of deposit are based on the discounted value of their contractual cash flows. The discount rate used in the present value computation was estimated by comparison to current interest rates offered by the Bank for certificates of deposit with similar remaining maturities.
Borrowed Funds and Accrued Interest Payable. The estimated fair value of borrowed funds and related accrued interest payable is based on a discounted cash flow analysis. The discount rate used in the present value computation was estimated by comparison to what management believes to be the Company’s incremental borrowing rate for similar arrangements.
All Other Financial Assets and Liabilities.The estimated fair value of cash and cash equivalents, accrued interest receivable and accrued interest payable on deposits approximates their carrying values since these instruments are payable on demand or have short-term maturities. The estimated fair value of loan fees receivable is based on the discounted value of their contractual cash flows using the same discount rate that is used to value loans receivable.
Off-Balance Sheet Instruments.The carrying amounts of commitments to lend approximated estimated fair value. The fair value of commitments to lend is based on fees currently charged to enter into similar agreements, taking into account the remaining terms of the agreements and the counter party’s credit standing.
82
Intervest Bancshares Corporation and Subsidiaries
Notes to Consolidated Financial Statements
|
For the Years Ended December 31, 2006, 2005 and 2004 |
| 22. | Business Segment Information |
The provisions of SFAS No. 131, “Disclosures about Segments of an Enterprise and Related Information,” defines an operating segment as a component of an enterprise that engages in business activities from which it may earn revenues and incur expenses whose separate financial information is available and is evaluated regularly by a company’s chief operating decision makers to perform resource allocations and performance assessments.
The Company’s business segment is banking and real estate lending as described in note 1 herein. The significant day-to-day operating decisions for the Holding Company and its subsidiaries are normally made by the Holding Company’s Executive Committee of the Board of Directors. The Executive Committee generally uses revenue and earnings performance to determine operating, strategic and resource allocation decisions.
The accounting policies of the segments identified below are the same as those described in the summary of significant accounting policies. The revenues and net earnings of the segments are not necessarily indicative of the amounts which would be achieved if intercompany transactions were ignored.
In the fourth quarter of 2006, the limited operations of Intervest Securities Corporation, a wholly owned subsidiary of the Holding Company, were discontinued. Intervest Securities Corporation was a broker/dealer whose business activities were not material to the consolidated financial statements. Its only revenues had been derived from participating as a selected dealer from time to time in offerings of debt securities of primarily those of Intervest Mortgage Corporation.
The following table presents certain information regarding the Company’s operations by business segment:
| | | | | | | | | | | | | | | | | | | | | | | | | | | | | |
| | | Revenues, Net of Interest Expense | | | Net Earnings | | Total Assets | |
($ in thousands) | | | 2006 | | | | 2005 | | | | 2004 | | | | 2006 | | | 2005 | | | 2004 | | | 2006 | | | | 2005 | |
Intervest National Bank (1) | | $ | 51,486 | | | $ | 42,834 | | | $ | 30,016 | | | $ | 18,085 | | $ | 12,999 | | $ | 7,436 | | $ | 1,857,825 | | | $ | 1,598,393 | |
Intervest Mortgage Corp. | | | 9,793 | | | | 8,835 | | | | 6,866 | | | | 3,126 | | | 3,089 | | | 2,354 | | | 119,471 | | | | 115,809 | |
Intervest Securities Corp. | | | 70 | | | | 128 | | | | 125 | | | | 1 | | | 24 | | | 22 | | | - | | | | 511 | |
Holding Company (1) | | | 1,284 | | | | 804 | | | | 554 | | | | 2,319 | | | 2,072 | | | 1,641 | | | 231,355 | | | | 204,387 | |
Intersegment (2) | | | (5,470 | ) | | | (5,573 | ) | | | (4,555 | ) | | | - | | | - | | | - | | | (236,898 | ) | | | (212,677 | ) |
Consolidated | | $ | 57,163 | | | $ | 47,028 | | | $ | 33,006 | | | $ | 23,531 | | $ | 18,184 | | $ | 11,453 | | $ | 1,971,753 | | | $ | 1,706,423 | |
(1) The amounts for “Revenues, net of interest expense” and “Net Earnings” are shown after intercompany dividends of $4.9 million in 2006, $4.4 million in 2005 and $3.4 million in 2004 that were paid by the Bank to the Holding Company for debt service on trust preferred securities, the proceeds of which are invested in the capital of the Bank.
(2) Intersegment revenues, net of interest expense, arise from intercompany management and loan origination service agreements. All significant intercompany balances and transactions are eliminated in consolidation. The Bank has a servicing agreement with Intervest Mortgage Corporation to provide the Bank with mortgage loan origination services. The services include: the identification of potential properties and borrowers; the inspection of properties constituting collateral for such loans; the negotiation of the terms and conditions of such loans in accordance with the Bank’s underwriting standards; preparing commitment letters; and coordinating the loan closing process. The services are performed by Intervest Mortgage Corporation’s personnel and the expenses associated with the services are borne by Intervest Mortgage Corporation. The Bank paid $5.0 million, $5.1 million and $4.3 million in 2006, 2005 and 2004, respectively, to Intervest Mortgage Corporation in connection with this servicing agreement. The Holding Company receives management fees from the Bank and Intervest Mortgage Corporation as a result of providing services to these subsidiaries related to corporate finance and planning and intercompany administration, and to act as a liaison for the Company in various corporate matters. Management fees amounted to $0.4 million, $0.5 million and $0.4 million in 2006, 2005 and 2004, respectively.
83
Intervest Bancshares Corporation and Subsidiaries
Notes to Consolidated Financial Statements
|
For the Years Ended December 31, 2006, 2005 and 2004 |
| 23. | Holding Company Financial Information |
Condensed Balance Sheets
| | | | |
| | | At December 31, |
($ in thousands) | | 2006 | | 2005 |
ASSETS | | | | |
Cash and due from banks | | $ 58 | | $ 76 |
Short-term investments | | 6,642 | | 4,166 |
| | |
Total cash and cash equivalents | | 6,700 | | 4,242 |
Loans receivable, net (net of allowance for loan losses of $85 and $85, respectively) | | 8,991 | | 11,379 |
Investment in consolidated subsidiaries | | 210,918 | | 183,963 |
Investment in unconsolidated subsidiaries - Intervest Statutory Trusts | | 1,702 | | 1,856 |
Deferred debenture offering costs, net of amortization | | 1,040 | | 1,526 |
Premises and equipment, net | | 918 | | 1,010 |
All other assets | | 1,086 | | 411 |
Total assets | | $231,355 | | $204,387 |
| | |
LIABILITIES | | | | |
Debentures payable | | $ 2,960 | | $ 4,640 |
Debentures payable - capital securities (1) | | 56,702 | | 61,856 |
Accrued interest payable on all debentures | | 1,396 | | 1,551 |
All other liabilities | | 251 | | 162 |
Total liabilities | | 61,309 | | 68,209 |
| | |
STOCKHOLDERS’ EQUITY | | | | |
Common equity | | 170,046 | | 136,178 |
Total stockholders’ equity | | 170,046 | | 136,178 |
Total liabilities and stockholders’ equity | | $231,355 | | $204,387 |
Condensed Statements of Earnings
| | | | | | |
| | | For the Year Ended December 31, |
($ in thousands) | | 2006 | | 2005 | | 2004 |
Interest income | | $ 852 | | $ 931 | | $ 1,087 |
Dividend income from subsidiary (1) | | 4,884 | | 4,356 | | 3,429 |
Interest expense | | 4,910 | | 5,003 | | 4,351 |
| | |
Net interest and dividend income | | 826 | | 284 | | 165 |
Provision for loan losses | | - | | - | | 7 |
Management fee income from subsidiaries | | 450 | | 450 | | 375 |
Income from mortgage lending activities | | 8 | | 70 | | 14 |
Loss on the early extinguishment of debentures | | 391 | | - | | - |
All other noninterest expenses | | 775 | | 692 | | 440 |
| | |
Income before income taxes | | 118 | | 112 | | 107 |
Credit for income taxes (2) | | 2,201 | | 1,960 | | 1,534 |
| | |
Net earnings before earnings of subsidiaries | | 2,319 | | 2,072 | | 1,641 |
Equity in undistributed earnings of Intervest National Bank | | 18,085 | | 12,999 | | 7,436 |
Equity in undistributed earnings of Intervest Mortgage Corporation | | 3,126 | | 3,089 | | 2,354 |
Equity in undistributed earnings of Intervest Securities Corporation | | 1 | | 24 | | 22 |
Net consolidated earnings | | $23,531 | | $18,184 | | $11,453 |
| | (1) | Represent dividends paid to the Holding Company from the Bank to provide funds for the debt service on the debentures payable - capital securities. This debt service is included in the Holding Company’s interest expense. The proceeds from the capital securities are invested in the capital of the Bank. |
| | (2) | Dividends from subsidiaries are eliminated in consolidation and are not included in the Holding Company’s pre-tax income for purposes of computing income taxes. |
84
Intervest Bancshares Corporation and Subsidiaries
Notes to Consolidated Financial Statements
|
For the Years Ended December 31, 2006, 2005 and 2004 |
| 23. | Holding Company Financial Information, Continued |
Condensed Statements of Cash Flows
| | | | | | | | | | | | |
| | | For the Year Ended December 31, | |
| ($ in thousands) | | 2006 | | 2005 | | | 2004 | |
OPERATING ACTIVITIES | | | | | | | | | | |
Consolidated net earnings | | $23,531 | | $ | 18,184 | | | $ | 11,453 | |
Adjustments to reconcile net earnings to net cash provided by operating activities: | | | | | | | | | | |
Equity in earnings of subsidiaries | | (26,096) | | | (20,468 | ) | | | (13,241 | ) |
Cash dividends received from subsidiary | | 4,884 | | | 4,356 | | | | 3,429 | |
Provision for loan losses | | - | | | - | | | | 7 | |
Depreciation and amortization | | 126 | | | 122 | | | | 86 | |
Amortization of deferred debenture costs | | 86 | | | 108 | | | | 115 | |
Loss on the early extinguishment of debentures | | 391 | | | - | | | | - | |
Amortization of deferred loan fees, net | | (2) | | | (21 | ) | | | (35 | ) |
Deferred income tax (benefit) expense | | (49) | | | 182 | | | | (3 | ) |
Compensation expense from awards/modifications of stock warrants | | - | | | - | | | | 9 | |
Increase in accrued interest payable on debentures | | 168 | | | 310 | | | | 576 | |
Change in all other assets and liabilities, net | | (542) | | | 185 | | | | (97 | ) |
Net cash provided by operating activities | | 2,497 | | | 2,958 | | | | 2,299 | |
| | | |
INVESTING ACTIVITIES | | | | | | | | | | |
Return of capital (investment in) subsidiaries, net | | 660 | | | (32,500 | ) | | | (33,928 | ) |
Purchase of equipment and leasehold improvements | | (34) | | | - | | | | (1,206 | ) |
Loan principal repayments, net of originations | | 2,394 | | | 2,619 | | | | 1,519 | |
Net cash provided by (used in) investing activities | | 3,020 | | | (29,881 | ) | | | (33,615 | ) |
FINANCING ACTIVITIES | | | | | | | | | | |
Net decrease in mortgage escrow funds payable | | - | | | (8 | ) | | | (16 | ) |
Gross proceeds from issuance of debentures | | 10,310 | | | - | | | | 30,928 | |
Debenture offering costs | | - | | | - | | | | (663 | ) |
Principal repayments of debentures | | (16,714) | | | - | | | | - | |
Proceeds from issuance of common stock upon the exercise of stock warrants, | | 3,345 | | | - | | | | 2,961 | |
Proceeds from issuance of common stock in public offering | | - | | | 28,370 | | | | - | |
Common stock issuance costs | | - | | | (2,059 | ) | | | - | |
Net cash (used in) provided by financing activities | | (3,059) | | | 26,303 | | | | 33,210 | |
| | | |
Net increase (decrease) in cash and cash equivalents | | 2,458 | | | (620 | ) | | | 1,894 | |
Cash and cash equivalents at beginning of year | | 4,242 | | | 4,862 | | | | 2,968 | |
Cash and cash equivalents at end of year | | $6,700 | | $ | 4,242 | | | $ | 4,862 | |
SUPPLEMENTAL DISCLOSURES | | | | | | | | | | |
Cash paid (received) during the year for: | | | | | | | | | | |
Interest | | $4,656 | | $ | 4,585 | | | $ | 3,658 | |
Income taxes | | (1,445) | | | (2,245 | ) | | | (1,621 | ) |
Noncash transactions: | | | | | | | | | | |
Income tax benefit from conversion of warrants recorded to paid in capital | | 6,248 | | | - | | | | - | |
Conversion of debentures into Class A common stock: | | | | | | | | | | |
Principal converted | | 430 | | | 940 | | | | 1,760 | |
Accrued interest payable converted | | 323 | | | 673 | | | | 1,123 | |
Unamortized debenture offering costs converted | | (9) | | | (24 | ) | | | (62 | ) |
85
Intervest Bancshares Corporation and Subsidiaries
Notes to Consolidated Financial Statements
|
For the Years Ended December 31, 2006, 2005 and 2004 |
| 24. | Selected Quarterly Financial Data (Unaudited) |
The following information is as of or for the period ended:
| | | | | | | | | | | | |
| | | 2006 |
| | | First | | | Second | | | Third | | | Fourth |
($ in thousands, except per share amounts) | | | Quarter | | | Quarter | | | Quarter | | | Quarter |
Interest and dividend income | | $ | 30,066 | | $ | 31,737 | | $ | 32,760 | | $ | 34,042 |
Interest expense | | | 17,580 | | | 18,647 | | | 20,206 | | | 21,864 |
Net interest and dividend income | | | 12,486 | | | 13,090 | | | 12,554 | | | 12,178 |
Provision for loan losses | | | 361 | | | 589 | | | 907 | | | 795 |
Net interest and dividend income after provision for loan losses | | | 12,125 | | | 12,501 | | | 11,647 | | | 11,383 |
Noninterest income | | | 2,082 | | | 1,612 | | | 1,215 | | | 1,946 |
Noninterest expenses | | | 2,796 | | | 2,732 | | | 4,202 | | | 3,297 |
Earnings before income taxes | | | 11,411 | | | 11,381 | | | 8,660 | | | 10,032 |
Provision for income taxes | | | 4,991 | | | 4,973 | | | 3,776 | | | 4,213 |
Net earnings | | $ | 6,420 | | $ | 6,408 | | $ | 4,884 | | $ | 5,819 |
Basic earnings per share: | | $ | .82 | | $ | .82 | | $ | .62 | | $ | .72 |
Diluted earnings per share: | | $ | .77 | | $ | .77 | | $ | .59 | | $ | .69 |
| | | | |
Return on average assets | | | 1.47% | | | 1.42% | | | 1.05% | | | 1.18% |
Return on average equity | | | 18.55% | | | 17.66% | | | 12.90% | | | 14.56% |
Total assets | | $ | 1,790,524 | | $ | 1,791,672 | | $ | 1,970,106 | | $ | 1,971,753 |
Total cash and investment securities | | $ | 362,104 | | $ | 326,132 | | $ | 449,597 | | $ | 451,148 |
Total loans, net of unearned fees | | $ | 1,402,008 | | $ | 1,439,436 | | $ | 1,492,352 | | $ | 1,490,653 |
Total deposits | | $ | 1,429,681 | | $ | 1,450,955 | | $ | 1,601,124 | | $ | 1,588,534 |
Total borrowed funds and related interest payable | | $ | 178,480 | | $ | 149,528 | | $ | 174,080 | | $ | 172,909 |
Total stockholders’ equity | | $ | 142,828 | | $ | 149,413 | | $ | 154,402 | | $ | 170,046 |
| |
| | | 2005 |
| | | First | | | Second | | | Third | | | Fourth |
($ in thousands, except per share amounts) | | | Quarter | | | Quarter | | | Quarter | | | Quarter |
Interest and dividend income | | $ | 20,568 | | $ | 22,696 | | $ | 25,761 | | $ | 28,856 |
Interest expense | | | 12,283 | | | 13,500 | | | 15,106 | | | 16,558 |
Net interest and dividend income | | | 8,285 | | | 9,196 | | | 10,655 | | | 12,298 |
Provision for loan losses | | | 1,033 | | | 452 | | | 1,803 | | | 787 |
Net interest and dividend income after provision for loan losses | | | 7,252 | | | 8,744 | | | 8,852 | | | 11,511 |
Noninterest income | | | 878 | | | 2,009 | | | 1,813 | | | 1,894 |
Noninterest expenses | | | 2,374 | | | 2,749 | | | 2,566 | | | 3,014 |
Earnings before income taxes | | | 5,756 | | | 8,004 | | | 8,099 | | | 10,391 |
Provision for income taxes | | | 2,508 | | | 3,481 | | | 3,533 | | | 4,544 |
Net earnings | | $ | 3,248 | | $ | 4,523 | | $ | 4,566 | | $ | 5,847 |
Basic earnings per share: | | $ | .52 | | $ | .72 | | $ | .66 | | $ | .75 |
Diluted earnings per share: | | $ | .48 | | $ | .67 | | $ | .61 | | $ | .71 |
| | | | |
Return on average assets | | | 0.94% | | | 1.26% | | | 1.17% | | | 1.40% |
Return on average equity | | | 14.25% | | | 19.01% | | | 16.32% | | | 17.81% |
Total assets | | $ | 1,427,439 | | $ | 1,511,604 | | $ | 1,630,845 | | $ | 1,706,423 |
Total cash and investment securities | | $ | 309,193 | | $ | 312,810 | | $ | 286,865 | | $ | 313,465 |
Total loans, net of unearned fees | | $ | 1,095,161 | | $ | 1,174,107 | | $ | 1,319,155 | | $ | 1,367,986 |
Total deposits | | $ | 1,123,657 | | $ | 1,217,506 | | $ | 1,302,309 | | $ | 1,375,330 |
Total borrowed funds and related interest payable | | $ | 177,995 | | $ | 163,021 | | $ | 160,491 | | $ | 155,725 |
Total stockholders’ equity | | $ | 93,376 | | $ | 97,975 | | $ | 129,207 | | $ | 136,178 |
86
Item 9. Changes In and Disagreements with Accountants on Accounting and Financial Disclosure
In 2005, Intervest Mortgage Corporation replaced its independent accountants with the Holding Company’s independent accountants. There were no disagreements with the prior accountants. The detailed information for this item is contained under the section entitled “Independent Public Accountants” in the Holding Company’s definitive proxy statement for its 2007 Annual Meeting (the “Proxy Statement”) to be held in May 2007, which will be filed with the SEC within 120 days from December 31, 2006, and is incorporated herein by reference.
Item 9A. Controls and Procedures
The Company’s management evaluated, with the participation of its Principal Executive and Financial Officers, the effectiveness of the Company’s disclosure controls and procedures (as defined in Rule 13a-15(e) or 15d-15(e) under the Securities Exchange Act of 1934) as of the end of the period covered by this report. Based on such evaluation, the Principal Executive and Financial Officers have concluded that the Company’s disclosure controls and procedures are designed to ensure that information required to be disclosed in the reports the Company files or furnishes under the Securities Exchange Act of 1934 is recorded, processed, summarized and reported within the time periods specified in the SEC’s rules and regulations, and are operating in an effective manner. The Company made no significant changes in its internal controls over financial reporting or in other factors that could significantly affect these controls subsequent to December 31, 2006.
Item 9B. Other Information - Not Applicable
PART III
Item 10. Directors, Executive Officers and Corporate Governance
Directors. The information required by this item is contained under the section entitled “Proposal One: Election of Directors” of the Proxy Statement and is incorporated herein by reference.
Executive Officers. The information required by this item is set forth at the end of Part I of this report under the caption “Executive Officers and Other Key Employees.”
Compliance with Section 16(a) Beneficial Ownership Reporting Compliance. The information required by this item is contained under the section entitled “Compliance with Section 16(a) of the Securities Exchange Act of 1934” in the Proxy Statement and is incorporated herein by reference.
Audit Committee Financial Expert. The information required by this item regarding the Audit Committee of the Company’s Board of Directors, including information regarding audit committee financial experts serving on the Audit Committee is contained in the section of the Proxy Statement entitled “Corporate Governance Principles and Board Matters” and is incorporated herein by reference.
Code of Business Conduct and Ethics. The Company has a written code of business conduct and ethics that applies to its directors, officers and employees, and also has a written code of ethics for its principal executive and financial officers. The Company’s Audit Committee has procedures for the submission of complaints or concerns regarding financial statement disclosures and other matters. A copy of these documents will be furnished without charge to beneficial holders of Class A common stock by writing to: Intervest Bancshares Corporation, Attention: Secretary, One Rockefeller Plaza, Suite 400, New York, NY 10020.
Item 11. Executive Compensation
The information required by this item is contained in the section entitled “Executive Compensation” of the Proxy Statement and is incorporated herein by reference.
Item 12. Security Ownership of Certain Beneficial Owners and Management and Related Stockholder Transactions
The information required by this item is contained in the sections entitled “Security Ownership of Certain Beneficial Owners and Management” and “Stock Warrant Exercises, Grants and Outstanding Equity Awards” of the Proxy Statement and are incorporated herein by reference.
Item 13. Certain Relationships and Related Transactions and Director Independence
The information required by this item is contained in the sections entitled “Corporate Governance Principles and Board Matters” and “Certain Relationships and Related Transactions” of the Proxy Statement and is incorporated herein by reference.
Item 14. Principal Accountant Fees and Services
The information required by this item is contained in the section entitled “Independent Public Accountants” of the Proxy Statement and is incorporated herein by reference.
87
PART IV
Item 15. Exhibits and Financial Statement Schedules
(a) Documents Filed as Part of this Report
| | (1) | Financial Statements:See Item 8 “Financial Statements and Supplementary Data” |
| | (2) | Financial Statement Schedules:See Item 8 “Financial Statements and Supplementary Data” |
| | (3) | Exhibits: The following exhibits are filed herein as part of this Form 10-K: |
| | | | | | | | | | |
Exhibit Number | | Exhibit Description | | Incorporated by Reference |
| | | Form | | File Number | | Exhibit | | Filing Date |
2.1 * | | Agreement and Plan of Merger dated as of November 1, 1999 by and among Intervest Bancshares Corporation, ICNY Acquisition Corporation and Intervest Corporation of New York. | | DEFS-14A | | 000-23377 | | Annex A | | 02/10/00 |
2.2 * | | Stock Purchase Agreement dated as of December 18, 2002, by and between Intervest Bancshares Corporation and Jean Dansker regarding the purchase and sale of the issued and outstanding shares of Intervest Securities Corporation. | | S-1 | | 333-26493 | | 2.2 | | 07/08/05 |
3.1 * | | Restated Certificate of Incorporation of the Company. | | 10-Q | | 000-23377 | | 3.0 | | 08/07/06 |
3.2 * | | Bylaws of the Company as amended. | | 8-K | | 000-23377 | | 3.1 | | 06/29/05 |
4.1 * | | Form of Certificate for Shares of Class A common stock of the Company. | | SB-2 | | 033-82246 | | 4.1 | | 09/15/04 |
4.2 * | | Form of Certificate for Shares of Class B common stock of the Company. | | SB-2 | | 033-82246 | | 4.1 | | 09/15/04 |
4.3 * | | Form of Warrant for Class B Common Stock issued to Mr. Jerome Dansker. | | 10-KSB | | 033-82246 | | 4.2 | | 03/21/96 |
4.4 * | | Form of Warrant for Class A Common Stock. | | SB-2 | | 033-82246 | | 4.3 | | 09/15/04 |
4.5 * | | Form of Warrant between the Company and the Bank of New York. | | SB-2 | | 033-82246 | | 4.4 | | 09/15/04 |
4.6 * | | Form of Indenture between the Company and the Bank of New York. | | SB-2 | | 333-50113 | | 4.1 | | 04/15/98 |
4.7 * | | Form of Indenture between the Company and the Bank of New York dated as of January 1, 2001. | | 10-K | | 000-23377 | | 4.7 | | 03/06/01 |
4.8 * | | Form of Indenture between the Company and State Street Bank and Trust Company dated as of December 18, 2001. | | 10-K | | 000-23377 | | 4.8 | | 03/11/02 |
4.9 * | | Form of Indenture between the Company and U.S Bank National Association dated as of September 17, 2003. | | 10-K | | 000-23377 | | 4.9 | | 03/19/04 |
4.10 * | | Form of Indenture between the Company and U.S Bank National Association dated as of March 17, 2004. | | 10-Q | | 000-23377 | | 4.10 | | 11/12/04 |
4.11 * | | Form of Indenture between the Company and Wilmington Trust Company dated as of September 20, 2004. | | 10-Q | | 000-23377 | | 4.11 | | 11/12/04 |
4.12 * | | Form of Indenture between the Company and Wilmington Trust Company dated as of September 21, 2006. | | 10-Q | | 000-23377 | | 4.1 | | 11/02/06 |
4.13 * | | Form of Indenture between the Company’s subsidiary, Intervest Mortgage Corporation, and The Bank of New York dated as of July 1, 1999. | | S-11 | | 333-78135 | | 4.1 | | 05/07/99 |
4.14 * | | Form of Indenture between the Company’s subsidiary, Intervest Mortgage Corporation, and The Bank of New York dated as of September 15, 2000. | | 10-K | | 033-27404 | | 4.16 | | 03/07/01 |
4.15 * | | Form of Indenture between the Company’s subsidiary, Intervest Mortgage Corporation, and The Bank of New York dated as of August 1, 2001. | | S-11 | | 333-57324 | | 4.1 | | 03/20/01 |
4.16 * | | Form of Indenture between the Company’s subsidiary, Intervest Mortgage Corporation, and The Bank of New York dated as of February 1, 2002, | | S-11 | | 333-73580 | | 4.1 | | 11/16/01 |
4.17 * | | Form of Indenture between the Company’s subsidiary, Intervest Mortgage Corporation, and The Bank of New York dated as of August 1, 2002. | | S-11 | | 333-90346 | | 4.1 | | 06/12/02 |
4.18 * | | Form of Indenture between the Company’s subsidiary, Intervest Mortgage Corporation, and The Bank of New York dated as of January 1, 2003. | | S-11 | | 333-101722 | | 4.1 | | 12/09/02 |
4.19 * | | Form of Indenture between the Company’s subsidiary, Intervest Mortgage Corporation, and The Bank of New York dated as of August 1, 2003. | | S-11 | | 333-105199 | | 4.1 | | 05/13/03 |
88
| | | | | | | | | | |
Exhibit Number | | Exhibit Description | | Incorporated by Reference |
| | | Form | | File Number | | Exhibit | | Filing Date |
4.20 * | | Form of Indenture between the Company’s subsidiary, Intervest Mortgage Corporation, and The Bank of New York dated as of December 1, 2003. | | S-11 | | 333-109128 | | 4.1 | | 09/25/03 |
4.21 * | | Form of Indenture between the Company’s subsidiary, Intervest Mortgage Corporation, and The Bank of New York dated as of June 1, 2004. | | 10-Q | | 033-27404 | | 4.23 | | 11/15/04 |
4.22 * | | Form of Indenture between the Company’s subsidiary, Intervest Mortgage Corporation, and The Bank of New York dated as of April 1, 2005. | | 10-Q | | 033-27404 | | 4.0 | | 05/16/05 |
4.23 * | | Form of Indenture between the Company’s subsidiary, Intervest Mortgage Corporation, and The Bank of New York dated as of June 14, 2005. | | S-11 | | 333-125793 | | 4.1 | | 06/14/05 |
4.24 * | | Form of Indenture between the Company’s subsidiary, Intervest Mortgage Corporation, and The Bank of New York dated as of July 1, 2006 | | S-11 | | 333-132403 | | 4.1 | | 03/14/06 |
10.1 +* | | Employment and Supplemental Benefits Agreement between the Company and Jerome Dansker dated as of July 1, 2004. | | 10-Q | | 000-23377 | | 10.0 | | 11/12/04 |
10.2 +* | | Employment and Supplemental Benefits Agreement between the Company and Lowell S. Dansker dated as of July 1, 2004. | | 10-Q | | 000-23377 | | 10.1 | | 11/12/04 |
10.3 * | | Mortgage Servicing Agreement dated as of April 1, 2002, as supplemented on October 21, 2004 for the purpose of clarification of the intent of the original agreement between the Company’s subsidiaries, Intervest Mortgage Corporation and Intervest National Bank. | | 10-Q | | 033-27404 | | 10.1 | | 11/15/04 |
10.4 +* | | Employment Agreement between Intervest Mortgage Corporation and Jerome Dansker, dated as of July 1, 1995. | | S-11 | | 033-96662 | | 10.2 | | 09/07/95 |
10.5 +* | | Amendment to Employment Agreement between Intervest Mortgage Corporation and Jerome Dansker dated as of August 3, 1998. | | 10-K | | 033-27404 | | 10.1 | | 03/31/99 |
10.6 +* | | Amendment to Employment Agreement between Intervest Mortgage Corporation and Jerome Dansker dated as of July 1, 2004. | | 10-Q | | 033-27404 | | 10.0 | | 11/10/05 |
10.7 +* | | Letter Agreement between the Company and Jean Dansker dated as of October 4, 2006. | | 8-K | | 000-23377 | | 99.1 | | 10/06/06 |
10.8+* | | Intervest Bancshares Corporation Long Term Incentive Plan. | | S-8 | | 333-138651 | | 4.4 | | 11/13/06 |
10.9+* | | Employment Agreement between Intervest Mortgage Corporation and Jerome Dansker, dated as of July 1, 1995. | | S-11 | | 033-96662 | | 10.2 | | 11/15/04 |
10.10+** | | Employment Agreement between Intervest Mortgage Corporation and Stephen A. Helman dated as of January 1, 2007. | | | | | | | | |
10.11+** | | Employment Agreement between Intervest National Bank and Keith A. Olsen dated as of January 1, 2007. | | | | | | | | |
10.12+** | | Employment Agreement between Intervest National Bank and Raymond C. Sullivan dated as of January 1, 2007. | | | | | | | | |
10.13+** | | Employment Agreement between Intervest National Bank and John J. Arvonio dated as of January 1, 2007. | | | | | | | | |
10.14+** | | Employment Agreement between Intervest Mortgage Corporation and John H. Hoffmann dated as of January 1, 2007. | | | | | | | | |
12.0 ** | | Computation of ratios of earnings to fixed charges | | | | | | | | |
14.1 * | | Code of Business Conduct | | 10-K | | 000-23377 | | 14.1 | | 03/28/05 |
14.2 * | | Code of Ethics | | 10-K | | 000-23377 | | 14.2 | | 03/28/05 |
14.3 ** | | Procedures for Submissions Regarding Questionable Accounting, Internal Accounting Controls and Auditing Matters | | | | | | | | |
21.0 ** | | Subsidiaries | | | | | | | | |
23.0 ** | | Consent of Independent Registered Public Accounting Firm | | | | | | | | |
31.0 ** | | Certification of the principal executive officer pursuant to Section 302 of The Sarbanes-Oxley Act of 2002. | | | | | | | | |
31.1 ** | | Certification of the principal financial officer pursuant to Section 302 of The Sarbanes-Oxley Act of 2002. | | | | | | | | |
32.0 ** | | Certification of the principal executive and financial officers pursuant to Section 906 of The Sarbanes-Oxley Act of 2002. | | | | | | | | |
* Previously filed. ** Filed herewith. + Denotes management contract or compensatory plan or arrangement.
89
SIGNATURES
Pursuant to the requirements of Section 13 or 15(d) of the Securities Exchange Act of 1934, the Company has duly caused this report to be signed on its behalf by the undersigned, thereunto duly authorized, on the date indicated.
INTERVEST BANCSHARES CORPORATION
(Registrant)
| | | | | | | | |
| By: | | /s/ Lowell S. Dansker | | | | Date: February 22, 2007 | | |
| | Lowell S. Dansker, | | | | | | |
| | Chairman and Chief Executive Officer (Principal Executive Officer) | | | | |
Pursuant to the requirements of the Securities Exchange Act of 1934, this report has been signed below by the following persons on behalf of the registrant and in the capacities and on the date indicated.
Chairman and Chief Executive Officer:
(Principal Executive Officer):
| | | | | | | | |
| By: | | /s/ Lowell S. Dansker | | | | Date: February 22, 2007 | | |
| | Lowell S. Dansker | | | | | | |
Chief Financial and Accounting Officer:
(Principal Financial Officer):
| | | | | | | | |
| By: | | /s/ John J. Arvonio | | | | Date: February 22, 2007 | | |
| | John J. Arvonio | | | | | | |
Vice President, Secretary and Director:
| | | | | | | | |
| By: | | /s/ Stephen A. Helman | | | | Date: February 22, 2007 | | |
| | Stephen A. Helman | | | | | | |
Directors:
| | | | | | | | |
| By: | | /s/ Michael A. Callen | | | | Date: February 22, 2007 | | |
| | Michael A. Callen | | | | | | |
| | | | |
| By: | | /s/ Paul R. DeRosa | | | | Date: February 22, 2007 | | |
| | Paul R. DeRosa | | | | | | |
| | | | |
| By: | | /s/ Wayne F. Holly | | | | Date: February 22, 2007 | | |
| | Wayne F. Holly | | | | | | |
| | | | |
| By: | | /s/ Lawton Swan, III | | | | Date: February 22, 2007 | | |
| | Lawton Swan, III | | | | | | |
| | | | |
| By: | | /s/ Thomas E. Willett | | | | Date: February 22, 2007 | | |
| | Thomas E. Willett | | | | | | |
| | | | |
| By: | | /s/ David J. Willmott | | | | Date: February 22, 2007 | | |
| | David J. Willmott | | | | | | |
| | | | |
| By: | | /s/ Wesley T. Wood | | | | Date: February 22, 2007 | | |
| | Wesley T. Wood | | | | | | |
90