| UNITED STATES |
| SECURITIES AND EXCHANGE COMMISSION |
| Washington, D.C. 20549 |
| |
FORM N-CSR |
| |
CERTIFIED SHAREHOLDER REPORT OF REGISTERED |
MANAGEMENT INVESTMENT COMPANIES |
| |
| |
| |
| Investment Company Act File Number: 811-07209 |
|
| |
| T. Rowe Price Value Fund, Inc. |
|
| (Exact name of registrant as specified in charter) |
| |
| 100 East Pratt Street, Baltimore, MD 21202 |
|
| (Address of principal executive offices) |
| |
| David Oestreicher |
| 100 East Pratt Street, Baltimore, MD 21202 |
|
| (Name and address of agent for service) |
| |
| |
| Registrant’s telephone number, including area code: (410) 345-2000 |
| |
| |
| Date of fiscal year end: December 31 |
| |
| |
| Date of reporting period: June 30, 2008 |
Item 1: Report to Shareholders The views and opinions in this report were current as of June 30, 2008. They are not guarantees of performance or investment results and should not be taken as investment advice. Investment decisions reflect a variety of factors, and the managers reserve the right to change their views about individual stocks, sectors, and the markets at any time. As a result, the views expressed should not be relied upon as a forecast of the fund’s future investment intent. The report is certified under the Sarbanes-Oxley Act, which requires mutual funds and other public companies to affirm that, to the best of their knowledge, the information in their financial reports is fairly and accurately stated in all material respects.
REPORTS ON THE WEB
Sign up for our E-mail Program, and you can begin to receive updated fund reports and prospectuses online rather than through the mail. Log in to your account at troweprice.com for more information.
Manager’s Letter
Fellow Shareholders
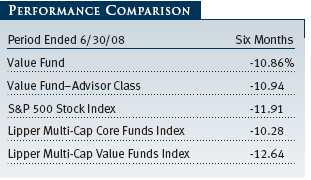
“The only thing we have to fear is fear itself.” In our last communication to you, which we themed “greed and fear,” we wrote about how these competing emotions impact market prices and also how, in a normal market, they roughly balance out. Looking back at the first half of 2008, it is clear to us that there was no balance in the emotional composition of the market. Instead, we simply saw a tsunami of fear overwhelm the market and send stock prices cascading lower. These investor fears were driven by concern over a slowing U.S. economy, higher energy prices, and the potential for higher inflation and led to the poorest six-month performance for the market in six years as the S&P 500 fell by 11.91%.
HIGHLIGHTS
• Fear swept the market like a tsunami in the first half of 2008 due to concerns about inflation, energy prices, and the slowing U.S. economy.
• Your fund performed well on a relative basis, but we were nonetheless disappointed in our loss in the period.
• Our moderate exposure to the poorly performing financial sector mitigated our losses and was a primary reason for outperforming our primary benchmark.
• We are optimistic that the U.S. economy will prove resilient, and we take note that past economic downturns have proved excellent buying opportunities for patient investors.
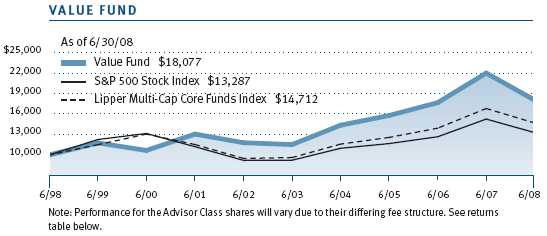
On a relative basis, your fund performed well in this environment, but we take little solace in our relative performance given that our absolute return was -10.86%. Nonetheless, this return does compare favorably with both the returns of the S&P 500 and your fund’s Lipper Multi-Cap Value benchmark. (Lipper currently classifies our fund as “multi-cap core,” but we prefer to measure our performance against the multi-cap value benchmark, which we believe is more consistent with our investment style and objective.) Please see the Performance Comparison table, which provides a more detailed quantitative analysis of performance. Returns for Advisor Class shares were slightly lower due to a differing fee structure.
Since the fund’s inception in 1994, it has outpaced both the market and its Lipper Multi-Cap Value benchmark by posting an annualized gain of 11.91% as compared with the S&P 500’s gain of 9.60% and the Lipper Multi-Cap Value benchmark’s gain of 9.18% . (Annualized returns for the S&P 500 Index were -13.12%, 7.58%, and 2.88% for the 1-, 5-, and 10-year periods ended June 30, 2008, respectively. Annualized returns for the Lipper Multi-Cap Value Funds Index were -19.23%, 7.64%, and 4.47% for the 1-, 5-, and 10-year periods ended June 30, 2008, respectively. Annualized returns for the Lipper Multi-Cap Core Funds Index were -12.67%, 8.89%, and 3.94% for the 1-, 5-, and 10-year periods ended June 30, 2008, respectively. Past performance cannot guarantee future results.)
PORTFOLIO REVIEW
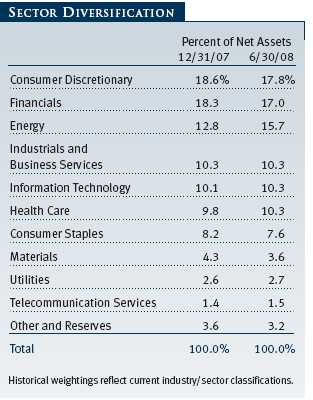
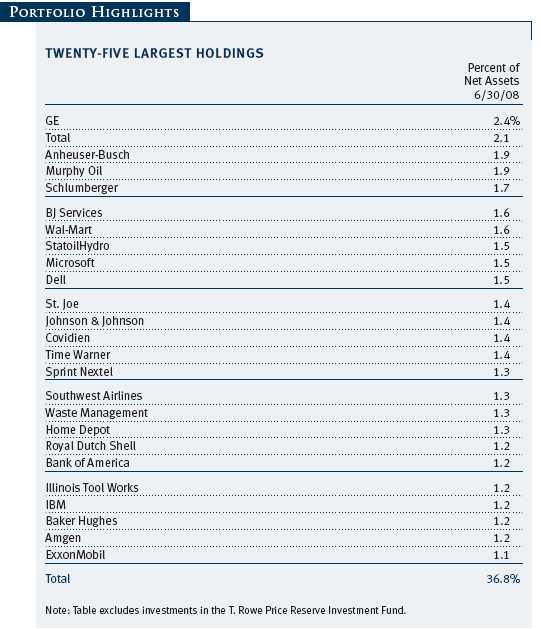
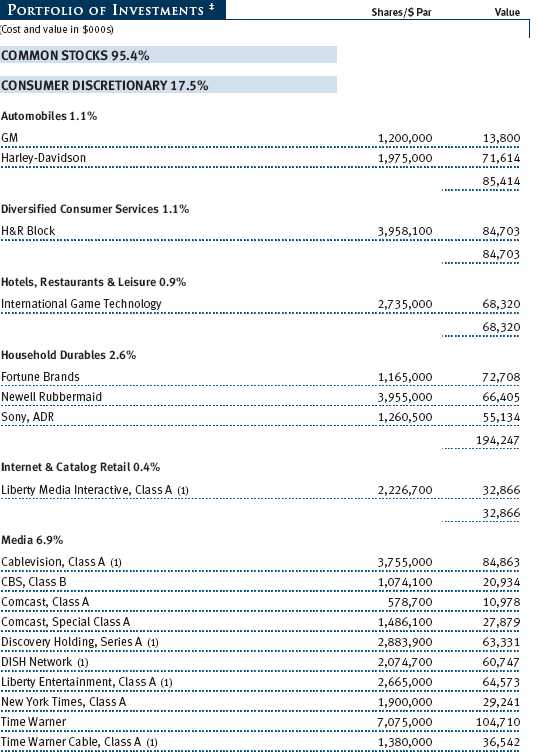
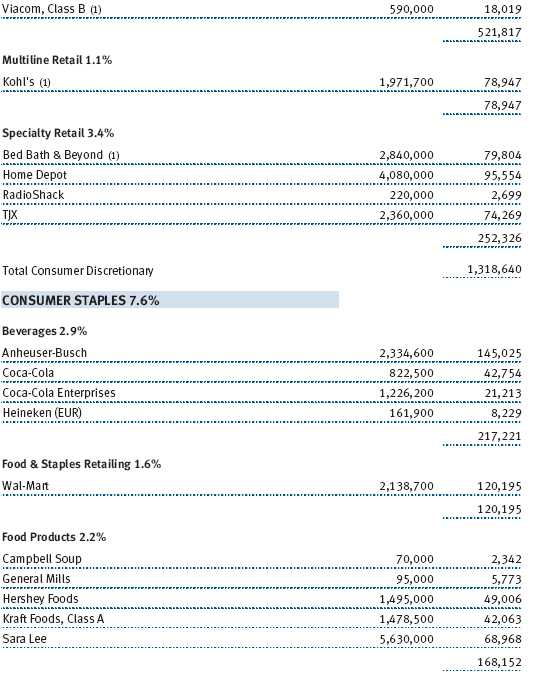
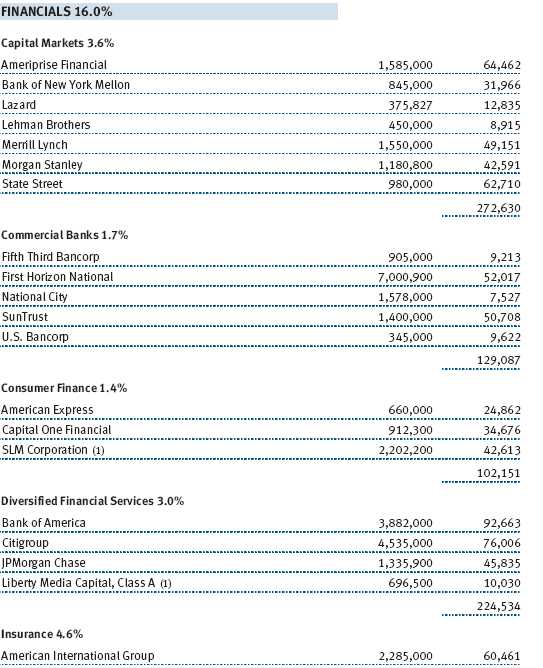
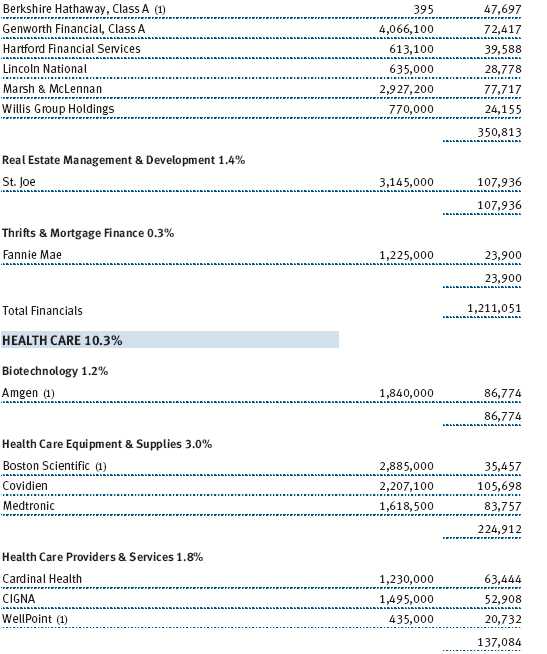
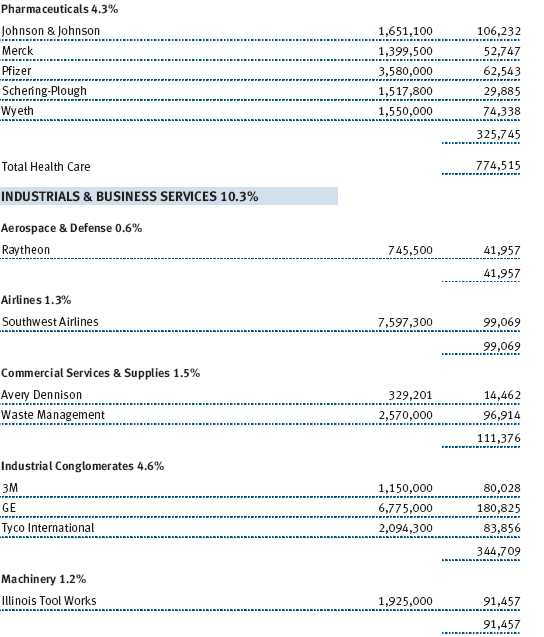
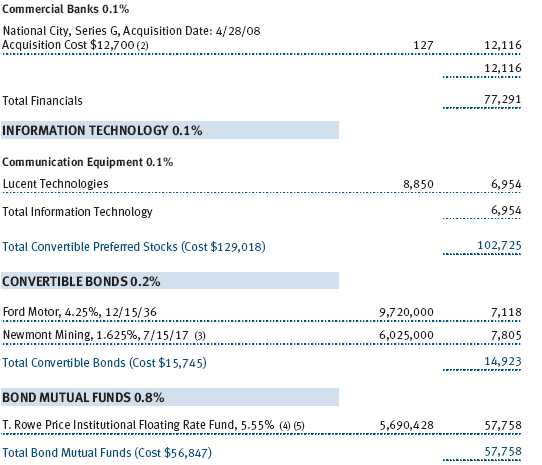
Investor fear was felt strongest in the financial sector, which was down almost 30% for the first half of the year. The spread of the credit crisis created significant strain on the balance sheets of many companies in the sector. Specifically, insurers AIG and Genworth, large money center banks Bank of America and Citigroup, commercial bank First Horizon National, and capital markets firm Merrill Lynch all weighed on results as the fallout from the credit crisis spread. (Please refer to our portfolio of investments for a complete listing of holdings and the amount each represents of the portfolio.)
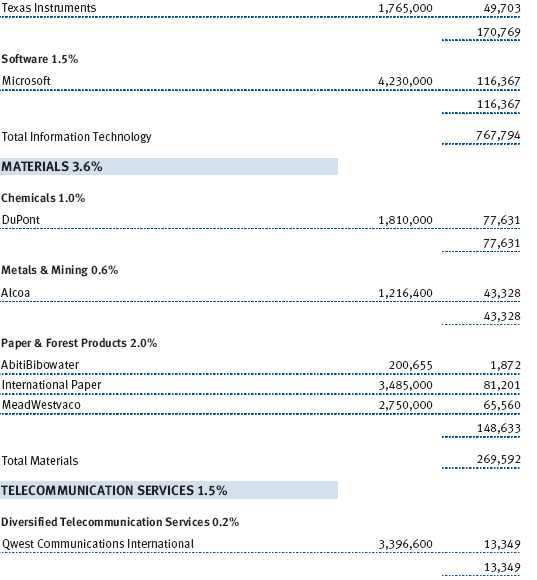
Additional detractors include two high-quality names. The first, GE, was hurt in part by its financial unit’s deteriorating credit portfolio. The second, Microsoft, is still working to determine its Internet strategy following its failed bid for Yahoo!.
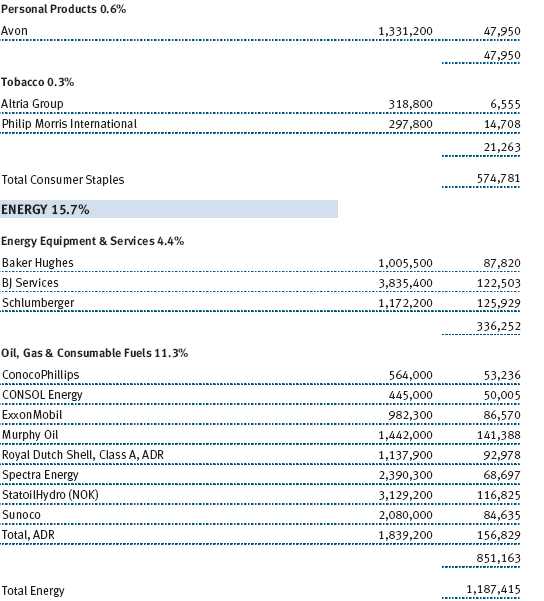
Several of our holdings bucked the downtrend in the market and performed well during the first half of the year. Driven by record high commodity prices, the energy sector was one of only two sectors in the S&P 500 Index to provide positive returns for the period. Our holdings of oil services firms BJ Services and Schlumberger, oil and gas companies StatoilHydro and Murphy Oil, and coal company CONSOL Energy all benefited from the surge in the price of the underlying commodities. Holdings in the traditionally defensive consumer staples sector also contributed to your fund’s performance. In particular, the stock of Anheuser-Busch rose following InBev’s bid to acquire the brewer and Wal-Mart benefited as consumers have favored the discount retailer in the slowing economy. In the industrials and business services sector, railroad company Union Pacific contributed positively as the high price of fuel now makes moving cargo by rail more cost efficient than hauling by truck. Waste Management has been buoyed by strong pricing and industry consolidation.
PORTFOLIO STRATEGY AND CHANGES
To place our portfolio changes in perspective, we believe it is important to review the investment strategy we use in managing your fund. We focus on companies with both attractive relative valuations and favorable long-term fundamental characteristics. We view ourselves as investors, not speculators, and we have a longer-term time horizon when making investment decisions. Indeed, our portfolio turnover has been consistently less than the average of our peers.
In making our investments, we focus a great deal on understanding both the return potential and risk associated with a given investment. Our investment approach is predicated on identifying companies where we believe that the upside implicit in the investment is significantly greater than the inherent risk. While we will not always be right, if we can accurately identify companies with an asymmetry between return and risk, then over time we should be able to outperform the market and our peer universe.
Over the past six months, there has been tremendous disparity in returns among the different segments of the market. Given these disparities, we thought it would be useful to more closely examine our strategies for different sectors in the market, including the two sectors that are the most visible in today’s marketplace: financials and energy.
Regarding financials, we have had a cautious stance on the prospects for the sector for as long as we have managed your fund. Until recently, the financials sector has enjoyed a long period of strong performance driven by several powerful secular forces, including declining interest rates, deregulation, and consolidation within the industry, all of which helped sector performance. Looking forward, we see most of these forces abating, which has led to our cautious stance. Our positioning within the sector reflects this caution as we have typically owned fewer financial stocks than many of our peers.
Another reason for our caution has been the significant leverage within the financial system. (A simple way to think of leverage is to compute the ratio between the assets of a company and the equity of the company—the higher that ratio, the greater the leverage.) The extent of the credit crisis and the severity of woes in the financial sector have surprised many market observers. The excess of permissive lending standards, rampant speculation in the real estate markets, and companies overleveraging themselves to increase near-term performance has been a volatile and disastrous brew for many companies.
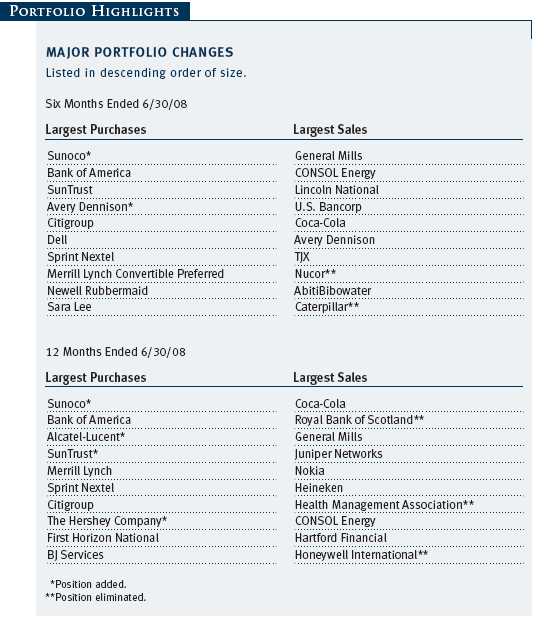
Nonetheless, the significant depreciation in stock prices in the sector has created selected buying opportunities. Over the first half of the year, two of our five largest purchases were Bank of America and SunTrust. In Bank of America, we are buying a company with a diverse balance sheet and a diverse income stream that should help protect the company from the travails of the mortgage market and the credit crisis. SunTrust is a regional bank based in the Southeast. In the current environment, the market is fixated on the poor near-term prospects for the company; however, longer term, we see considerable value in SunTrust’s branch network, which is not reflected in the company’s current stock price.
Going forward, we will continue to search for value in the financials sector on a selected, company-by-company basis. We feel that the significant fear that dominates investor sentiment will diminish and that financials could see an intermediate-term bounce. We remain cautious longer term about the sector given the secular concerns we discussed earlier. As a result, even though we have been buying financials, we still remain underweight relative to many of our peers.
Another sector that has consistently been in the news over the last six months is energy. Strong demand from the developing world, coupled with concerns over the geopolitical environment in the Middle East, has led to crude oil prices surging approximately $40 per barrel in the first half of this year.
We have found trying to predict the future price of oil to be an extraordinarily difficult task. Almost no one predicted that crude oil prices would be where they are now, but here we are with crude oil above $125 per barrel. When we look at the energy complex, we believe that there are both strong arguments for why crude oil could go below $100 per barrel and strong arguments for why it could go above $150 per barrel. Rather than focus our efforts on predicting near-term crude prices, we would rather focus on finding the right companies within the sector while maintaining a roughly neutral stance. We are currently slightly underweight the sector on a relative basis.
Our main concern with most energy companies is the returns that the companies will generate on their current investments. Capital spending is up significantly for the sector, tax rates and royalties are increasing, and geopolitical risk is rising as well. Also, the opportunity set for finding oil is shrinking. National oil companies are far less willing to allow foreign oil companies to explore and, when they do, the terms are onerous for the foreign company. Increasingly, public companies are finding oil and natural gas in places where it is difficult to extract the natural resource as a result of the find being technologically challenging (such as the Canadian oil sands or the Kashagan field in Kazakhstan), in deep water offshore (U.S. Gulf Coast, West Africa, and Brazil), in remote areas of the world (Sakhalin Islands, Alaska, and the Barents Sea), or in regions of the world suffering from political instability (Nigeria, Venezuela, and Chad). In this environment, we think that the oil service companies, including your fund’s holdings in Schlumberger, Baker Hughes, and BJ Services, should benefit as many of the secular trends described above will increase demand for their services.
We also believe that major oil companies are cheap when compared with other energy companies. In particular, we believe that several European oil companies, including Statoil and Total, should perform well. Their opportunity set is greater than that for many of the U.S. majors and their valuation is cheaper.
Regardless of the sector, our focus is on selecting stocks with both upside potential and limited downside. As we have discussed with you previously, we also look for companies whose stocks trade at a significant discount to our sum-of-the-parts valuation of the company. In the first half of this year, we added to our position in St. Joe, a land holding company based in Florida, and we initiated positions in Sunoco and Lazard Freres. In the case of Sunoco, we believe we were able to buy the stock at a valuation that is at a discount to what its refining, coke, and pipeline assets are worth in the private market.
Another area of investment for us has been companies facing extreme negative sentiment. Often, the most opportune time to buy a stock is when consensus is uniformly negative on the company and the sector. Currently, the market is extremely bearish on companies with significant exposure to the U.S. consumer and to the U.S. economy in general. Our strategy over the past six months has been to buy uncertainty and to sell certainty. We increased our positions in economically cyclical companies such as Bed Bath & Beyond, Dell, Fortune Brands, and Newell Rubbermaid, and we sold down positions in companies with less economic sensitivity (and more certainty), including General Mills, Coca-Cola, and Union Pacific, all of which had seen significant price improvement over the past year.
OUTLOOK
“The only thing we have to fear is fear itself.” Clearly, there is significant negative sentiment in today’s market. While many fears are well founded, we are optimistic that the U.S. economy is more resilient than commonly believed. We are also mindful that market valuations are, in relation to interest rates, the cheapest that we have seen in decades. Finally, we have found that, over time, with fear comes opportunity. Academic studies have shown that, counterintuitively, the best time to buy U.S. equities is during a time of negative economic growth.
In the shorter term, however, we understand the powerful influence that market sentiment can have on security prices. Indeed, to paraphrase FDR, what we have most to fear in today’s market is the fear of other investors. When investors start to see signs that there is some recovery in the economy, we believe that the cloud of fear overhanging the market will dissipate and allow stock prices to move higher.
While we will closely monitor economic conditions, our focus will continue to be on selecting individual stocks with valuation appeal, sound fundamentals, and reasonable balance sheet integrity. As always, we will concentrate our efforts on making sound investment decisions in our ongoing attempt to enhance shareholder value.
Respectfully submitted,

John D. Linehan
President of the fund and chairman of its Investment Advisory Committee
July 28, 2008
The committee chairman has day-to-day responsibility for managing the portfolio and works with committee members in developing and executing the fund’s investment program.
RISKS OF INVESTING IN THE FUND
Value investors seek to invest in companies whose stock prices are low in relation to their real worth or future prospects. By identifying companies whose stocks are currently out of favor or misunderstood, value investors hope to realize significant appreciation as other investors recognize the stock’s intrinsic value and the price rises accordingly. The value approach carries the risk that the market will not recognize a security’s intrinsic value for a long time or that a stock judged to be undervalued may actually be appropriately priced.
GLOSSARY
Lipper index: An index of mutual fund performance returns for specified periods in defined categories as tracked by Lipper Inc.
S&P 500 Stock Index: A market cap-weighted index of 500 widely held stocks often used as a proxy for the overall stock market. Performance is reported on a total return basis.
Performance and Expenses
This chart shows the value of a hypothetical $10,000 investment in the fund over the past 10 fiscal year periods or since inception (for funds lacking 10-year records). The result is compared with benchmarks, which may include a broad-based market index and a peer group average or index. Market indexes do not include expenses, which are deducted from fund returns as well as mutual fund averages and indexes.
| AVERAGE ANNUAL COMPOUND TOTAL RETURN |
This table shows how the fund would have performed each year if its actual (or cumulative) returns had been earned at a constant rate.

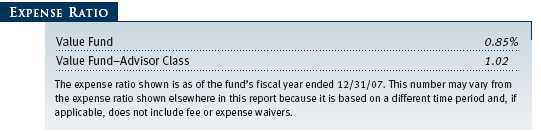
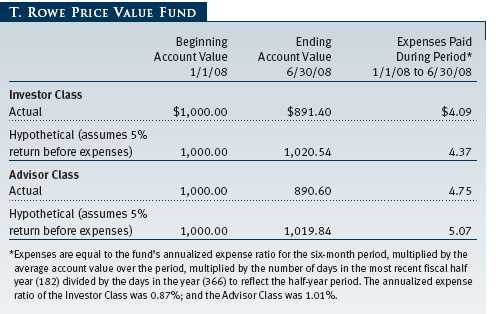
As a mutual fund shareholder, you may incur two types of costs: (1) transaction costs, such as redemption fees or sales loads, and (2) ongoing costs, including management fees, distribution and service (12b-1) fees, and other fund expenses. The following example is intended to help you understand your ongoing costs (in dollars) of investing in the fund and to compare these costs with the ongoing costs of investing in other mutual funds. The example is based on an investment of $1,000 invested at the beginning of the most recent six-month period and held for the entire period.
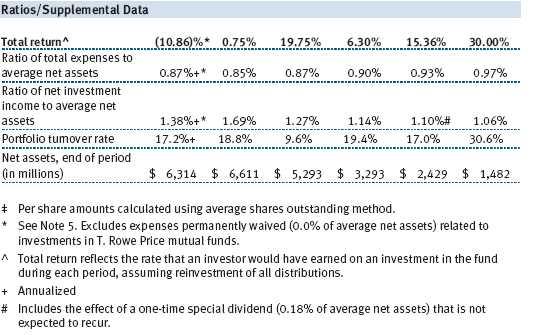
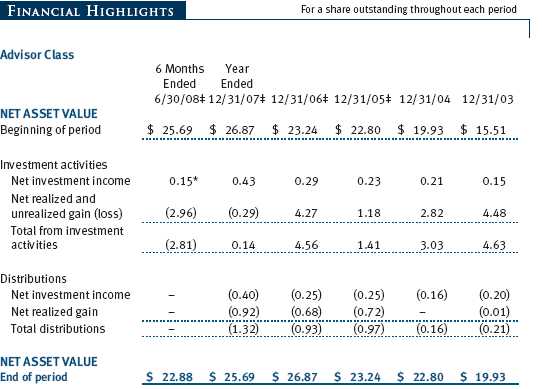
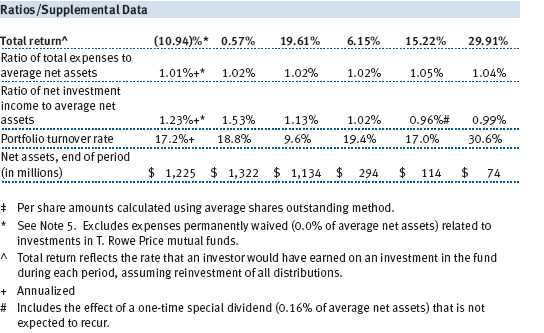
Please note that the fund has two share classes: The original share class (“investor class”) charges no distribution and service (12b-1) fee, and the Advisor Class shares are offered only through unaffiliated brokers and other financial intermediaries and charge a 0.25% 12b-1 fee. Each share class is presented separately in the table.
Actual Expenses
The first line of the following table (“Actual”) provides information about actual account values and expenses based on the fund’s actual returns. You may use the information in this line, together with your account balance, to estimate the expenses that you paid over the period. Simply divide your account value by $1,000 (for example, an $8,600 account value divided by $1,000 = 8.6), then multiply the result by the number in the first line under the heading “Expenses Paid During Period” to estimate the expenses you paid on your account during this period.
Hypothetical Example for Comparison Purposes
The information on the second line of the table (“Hypothetical”) is based on hypothetical account values and expenses derived from the fund’s actual expense ratio and an assumed 5% per year rate of return before expenses (not the fund’s actual return). You may compare the ongoing costs of investing in the fund with other funds by contrasting this 5% hypothetical example and the 5% hypothetical examples that appear in the shareholder reports of the other funds. The hypothetical account values and expenses may not be used to estimate the actual ending account balance or expenses you paid for the period.
Note: T. Rowe Price charges an annual small-account maintenance fee of $10, generally for accounts with less than $2,000 ($500 for UGMA/UTMA). The fee is waived for any investor whose T. Rowe Price mutual fund accounts total $25,000 or more, accounts employing automatic investing, and IRAs and other retirement plan accounts that utilize a prototype plan sponsored by T. Rowe Price (although a separate custodial or administrative fee may apply to such accounts). This fee is not included in the accompanying table. If you are subject to the fee, keep it in mind when you are estimating the ongoing expenses of investing in the fund and when comparing the expenses of this fund with other funds.
You should also be aware that the expenses shown in the table highlight only your ongoing costs and do not reflect any transaction costs, such as redemption fees or sales loads. Therefore, the second line of the table is useful in comparing ongoing costs only and will not help you determine the relative total costs of owning different funds. To the extent a fund charges transaction costs, however, the total cost of owning that fund is higher.
Unaudited
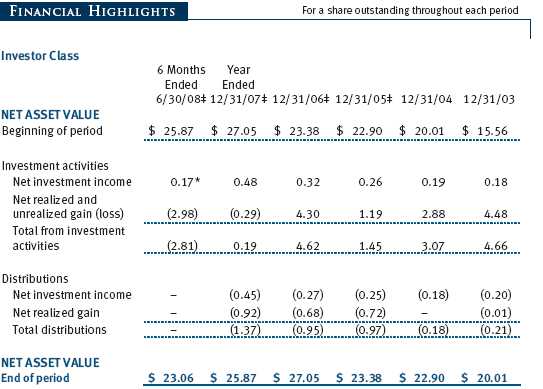
The accompanying notes are an integral part of these financial statements.
Unaudited
The accompanying notes are an integral part of these financial statements.
Unaudited

The accompanying notes are an integral part of these financial statements.
Unaudited
The accompanying notes are an integral part of these financial statements.
Unaudited
The accompanying notes are an integral part of these financial statements.
Unaudited
The accompanying notes are an integral part of these financial statements.
Unaudited
| NOTES TO FINANCIAL STATEMENTS |
T. Rowe Price Value Fund, Inc. (the fund), is registered under the Investment Company Act of 1940 (the 1940 Act) as a diversified, open-end management investment company. The fund seeks to provide long-term capital appreciation by investing in common stocks believed to be undervalued. Income is a secondary objective. The fund has two classes of shares: the Value Fund original share class, referred to in this report as the Investor Class, offered since September 30, 1994, and Value Fund—Advisor Class (Advisor Class), offered since March 31, 2000. Advisor Class shares are sold only through unaffiliated brokers and other unaffiliated financial intermediaries that are compensated by the class for distribution, shareholder servicing, and/or certain administrative services under a Board-approved Rule 12b-1 plan. Each class has exclusive voting rights on matters related solely to that class, separate voting rights on matters that relate to both classes, and, in all other respects, the same rights and obligations as the other class.
NOTE 1 - SIGNIFICANT ACCOUNTING POLICIES
Basis of Preparation The accompanying financial statements were prepared in accordance with accounting principles generally accepted in the United States of America, which require the use of estimates made by fund management. Fund management believes that estimates and security valuations are appropriate; however, actual results may differ from those estimates, and the security valuations reflected in the financial statements may differ from the value the fund ultimately realizes upon sale of the securities.
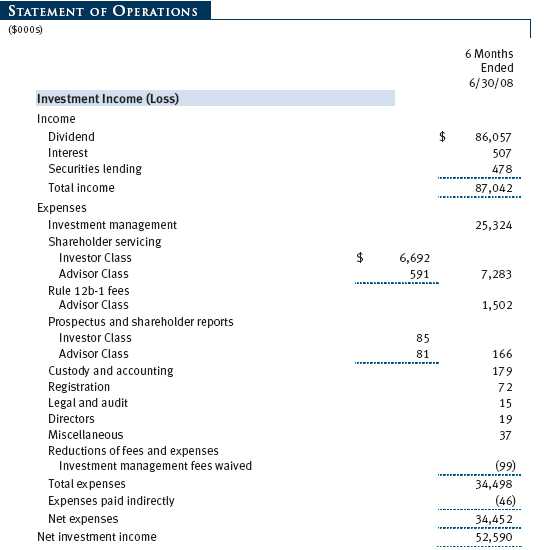
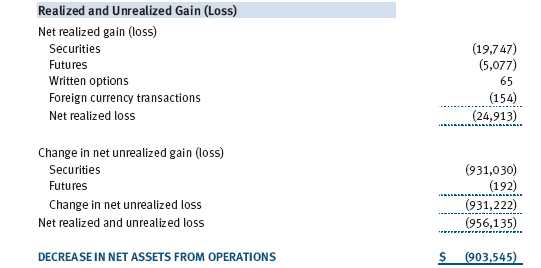
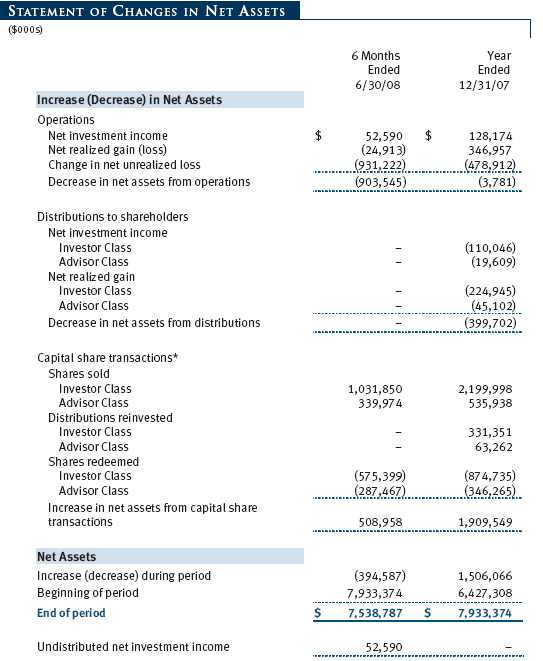
Investment Transactions, Investment Income, and Distributions Income and expenses are recorded on the accrual basis. Premiums and discounts on debt securities are amortized for financial reporting purposes. Dividends received from mutual fund investments are reflected as dividend income; capital gain distributions are reflected as realized gain/loss. Dividend income and capital gain distributions are recorded on the ex-dividend date. Income tax-related interest and penalties, if incurred, would be recorded as income tax expense. Investment transactions are accounted for on the trade date. Realized gains and losses are reported on the identified cost basis. Payments (“variation margin”) made or received to settle the daily fluctuations in the value of futures contracts are recorded as unrealized gains or losses until the contracts are closed. Unsettled variation margin on futures contracts is reflected as other assets or liabilities, and unrealized gains and losses on futures contracts are reflected as the change in net unrealized gain or loss in the accompanying financial statements. Distributions to shareholders are recorded on the ex-dividend date. Income distributions are declared and paid by each class on an annual basis. Capital gain distributions, if any, are declared and paid by the fund, typically on an annual basis.
Currency Translation Assets, including investments, and liabilities denominated in foreign currencies are translated into U.S. dollar values each day at the prevailing exchange rate, using the mean of the bid and asked prices of such currencies against U.S. dollars as quoted by a major bank. Purchases and sales of securities, income, and expenses are translated into U.S. dollars at the prevailing exchange rate on the date of the transaction. The effect of changes in foreign currency exchange rates on realized and unrealized security gains and losses is reflected as a component of security gains and losses.
Class Accounting The Advisor Class pays distribution, shareholder servicing, and/or certain administrative expenses in the form of Rule 12b-1 fees, in an amount not exceeding 0.25% of the class’s average daily net assets. Shareholder servicing, prospectus, and shareholder report expenses incurred by each class are charged directly to the class to which they relate. Expenses common to both classes, investment income, and realized and unrealized gains and losses are allocated to the classes based upon the relative daily net assets of each class.
Rebates and Credits Subject to best execution, the fund may direct certain security trades to brokers who have agreed to rebate a portion of the related brokerage commission to the fund in cash. Commission rebates are reflected as realized gain on securities in the accompanying financial statements and totaled $49,000 for the six months ended June 30, 2008. Additionally, the fund earns credits on temporarily uninvested cash balances at the custodian that reduce the fund’s custody charges. Custody expense in the accompanying financial statements is presented before reduction for credits, which are reflected as expenses paid indirectly.
In-Kind Redemptions In accordance with guidelines described in the fund’s prospectus, the fund may distribute portfolio securities rather than cash as payment for a redemption of fund shares (in-kind redemption). For financial reporting purposes, the fund recognizes a gain on in-kind redemptions to the extent the value of the distributed securities on the date of redemption exceeds the cost of those securities; the fund recognizes a loss if cost exceeds value. Gains and losses realized on in-kind redemptions are not recognized for tax purposes and are reclassified from undistributed realized gain (loss) to paid-in capital. During the six months ended June 30, 2008, the fund realized $147,264,000 of net gain on $49,943,000 of in-kind redemptions.
New Accounting Pronouncements On January 1, 2008, the fund adopted Statement of Financial Accounting Standards No. 157 (FAS 157), Fair Value Measurements. FAS 157 defines fair value, establishes the framework for measuring fair value, and expands the disclosures of fair value measurements in the financial statements. Adoption of FAS 157 did not have a material impact on the fund’s net assets or results of operations.
In March 2008, the Financial Accounting Standards Board issued Statement of Financial Accounting Standards No. 161, Disclosures about Derivative Instruments and Hedging Activities (“FAS 161”), which is effective for fiscal years and interim periods beginning after November 15, 2008. FAS 161 requires enhanced disclosures about derivative and hedging activities, including how such activities are accounted for and their effect on financial position, performance and cash flows. Management is currently evaluating the impact the adoption of FAS 161 will have on the fund’s financial statements and related disclosures.
NOTE 2 - VALUATION
The fund’s investments are reported at fair value as defined under FAS 157. The fund values its investments and computes its net asset value per share at the close of the New York Stock Exchange (NYSE), normally 4 p.m. ET, each day that the NYSE is open for business.
Valuation Methods Equity securities listed or regularly traded on a securities exchange or in the over-the-counter (OTC) market are valued at the last quoted sale price or, for certain markets, the official closing price at the time the valuations are made, except for OTC Bulletin Board securities, which are valued at the mean of the latest bid and asked prices. A security that is listed or traded on more than one exchange is valued at the quotation on the exchange determined to be the primary market for such security. Listed securities not traded on a particular day are valued at the mean of the latest bid and asked prices for domestic securities and the last quoted sale price for international securities.
Debt securities are generally traded in the OTC market. Securities with remaining maturities of one year or more at the time of acquisition are valued at prices furnished by dealers who make markets in such securities or by an independent pricing service, which considers the yield or price of bonds of comparable quality, coupon, maturity, and type, as well as prices quoted by dealers who make markets in such securities. Securities with remaining maturities of less than one year at the time of acquisition generally use amortized cost in local currency to approximate fair value. However, if amortized cost is deemed not to reflect fair value or the fund holds a significant amount of such securities with remaining maturities of more than 60 days, the securities are valued at prices furnished by dealers who make markets in such securities or by an independent pricing service.
Investments in mutual funds are valued at the mutual fund’s closing net asset value per share on the day of valuation. Financial futures contracts are valued at closing settlement prices.
Other investments, including restricted securities, and those for which the above valuation procedures are inappropriate or are deemed not to reflect fair value are stated at fair value as determined in good faith by the T. Rowe Price Valuation Committee, established by the fund’s Board of Directors.
For valuation purposes, the last quoted prices of non-U.S. equity securities may be adjusted under the circumstances described below. If the fund determines that developments between the close of a foreign market and the close of the NYSE will, in its judgment, materially affect the value of some or all of its portfolio securities, the fund will adjust the previous closing prices to reflect what it believes to be the fair value of the securities as of the close of the NYSE. In deciding whether it is necessary to adjust closing prices to reflect fair value, the fund reviews a variety of factors, including developments in foreign markets, the performance of U.S. securities markets, and the performance of instruments trading in U.S. markets that represent foreign securities and baskets of foreign securities. A fund may also fair value securities in other situations, such as when a particular foreign market is closed but the fund is open. The fund uses outside pricing services to provide it with closing prices and information to evaluate and/or adjust those prices. The fund cannot predict how often it will use closing prices and how often it will determine it necessary to adjust those prices to reflect fair value. As a means of evaluating its security valuation process, the fund routinely compares closing prices, the next day’s opening prices in the same markets, and adjusted prices.
Valuation Inputs Various inputs are used to determine the value of the fund’s investments. These inputs are summarized in the three broad levels listed below:
Level 1 – quoted prices in active markets for identical securities
Level 2 – observable inputs other than Level 1 quoted prices (including, but not limited to, quoted prices for similar securities, interest rates, prepayment speeds, credit risk)
Level 3 – unobservable inputs
Observable inputs are those based on market data obtained from sources independent of the fund, and unobservable inputs reflect the fund’s own assumptions based on the best information available. The input levels are not necessarily an indication of the risk or liquidity associated with investments at that level. For example, non-U.S. equity securities actively traded in foreign markets generally are reflected in Level 2 despite the availability of closing prices, because the fund evaluates and determines whether those closing prices reflect fair value at the close of the NYSE or require adjustment, as described above. The following table summarizes the fund’s investments, based on the inputs used to determine their values on June 30, 2008:

*Other financial instruments are derivative instruments not reflected in the Portfolio of Investments, such as futures contracts, forward currency exchange contracts, written options, and swaps, which are presented following the Portfolio of Investments.
NOTE 3 - INVESTMENT TRANSACTIONS
Consistent with its investment objective, the fund engages in the following practices to manage exposure to certain risks or to enhance performance. The investment objective, policies, program, and risk factors of the fund are described more fully in the fund’s prospectus and Statement of Additional Information.
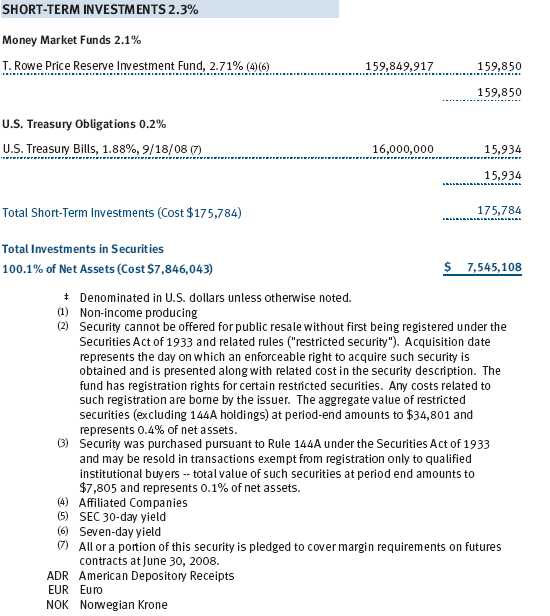
Restricted Securities The fund may invest in securities that are subject to legal or contractual restrictions on resale. Prompt sale of such securities at an acceptable price may be difficult and may involve substantial delays and additional costs.
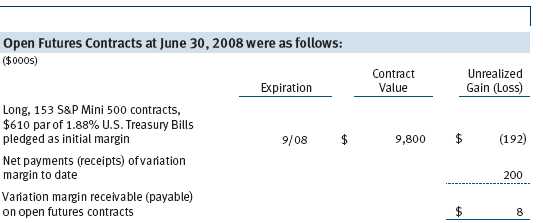
Futures Contracts During the six months ended June 30, 2008, the fund was a party to futures contracts, which provide for the future sale by one party and purchase by another of a specified amount of a specific financial instrument at an agreed upon price, date, time, and place. Risks arise from possible illiquidity of the futures market and from movements in security values.
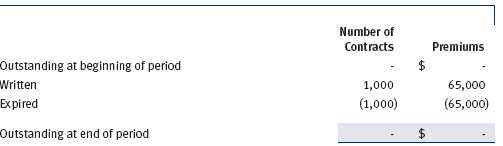
Options Call and put options give the holder the right to purchase and sell, respectively, a security at a specified price on a certain date. Risks arise from possible illiquidity of the options market and from movements in security values. Written options are reflected in the accompanying Statement of Assets and Liabilities at market value. Transactions in options written and related premiums received during the six months ended June 30, 2008, were as follows:
Securities Lending The fund lends its securities to approved brokers to earn additional income. It receives as collateral cash and U.S. government securities valued at 102% to 105% of the value of the securities on loan. Cash collateral is invested by the fund’s lending agent(s) in accordance with investment guidelines approved by fund management. Although risk is mitigated by the collateral, the fund could experience a delay in recovering its securities and a possible loss of income or value if the borrower fails to return the securities or if collateral investments decline in value. Securities lending revenue recognized by the fund consists of earnings on invested collateral and borrowing fees, net of any rebates to the borrower and compensation to the lending agent. At June 30, 2008, there were no securities on loan.
Other Purchases and sales of portfolio securities, other than short-term securities, aggregated $1,343,280,000 and $653,415,000, respectively, for the six months ended June 30, 2008.
NOTE 4 - FEDERAL INCOME TAXES
No provision for federal income taxes is required since the fund intends to continue to qualify as a regulated investment company under Subchapter M of the Internal Revenue Code and distribute to shareholders all of its taxable income and gains. Distributions are determined in accordance with Federal income tax regulations, which differ from generally accepted accounting principles, and, therefore, may differ in amount or character from net investment income and realized gains for financial reporting purposes. Financial reporting records are adjusted for permanent book/tax differences to reflect tax character but are not adjusted for temporary differences. The amount and character of tax-basis distributions and composition of net assets are finalized at fiscal year-end; accordingly, tax-basis balances have not been determined as of June 30, 2008.
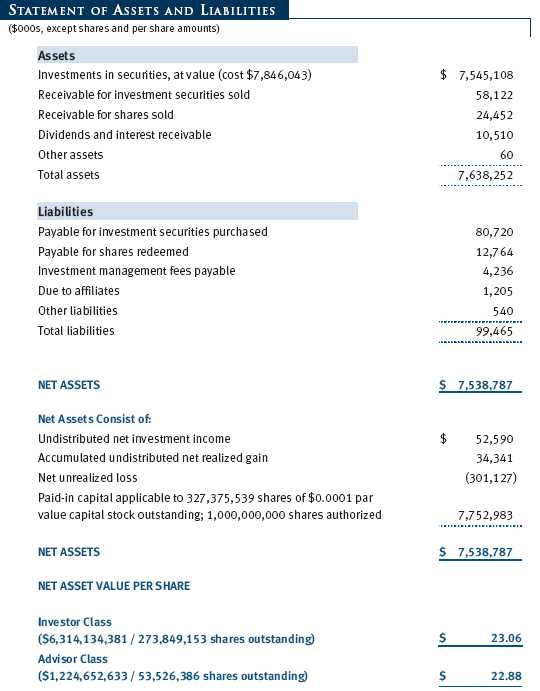
At June 30, 2008, the cost of investments for federal income tax purposes was $7,846,043,000. Net unrealized loss aggregated $301,127,000 at period-end, of which $986,135,000 related to appreciated investments and $1,287,262,000 related to depreciated investments.
NOTE 5 - RELATED PARTY TRANSACTIONS
The fund is managed by T. Rowe Price Associates, Inc. (the manager or Price Associates), a wholly owned subsidiary of T. Rowe Price Group, Inc. The investment management agreement between the fund and the manager provides for an annual investment management fee, which is computed daily and paid monthly. The fee consists of an individual fund fee, equal to 0.35% of the fund’s average daily net assets, and a group fee. The group fee rate is calculated based on the combined net assets of certain mutual funds sponsored by Price Associates (the group) applied to a graduated fee schedule, with rates ranging from 0.48% for the first $1 billion of assets to 0.285% for assets in excess of $220 billion. The fund’s group fee is determined by applying the group fee rate to the fund’s average daily net assets. At June 30, 2008, the effective annual group fee rate was 0.30%.
In addition, the fund has entered into service agreements with Price Associates and two wholly owned subsidiaries of Price Associates (collectively, Price). Price Associates computes the daily share prices and provides certain other administrative services to the fund. T. Rowe Price Services, Inc., provides shareholder and administrative services in its capacity as the fund’s transfer and dividend disbursing agent. T. Rowe Price Retirement Plan Services, Inc., provides subaccounting and recordkeeping services for certain retirement accounts invested in the Investor Class. For the six months ended June 30, 2008, expenses incurred pursuant to these service agreements were $60,000 for Price Associates, $573,000 for T. Rowe Price Services, Inc., and $675,000 for T. Rowe Price Retirement Plan Services, Inc. The total amount payable at period-end pursuant to these service agreements is reflected as Due to Affiliates in the accompanying financial statements.
Additionally, the fund is one of several mutual funds in which certain college savings plans managed by Price Associates may invest. As approved by the fund’s Board of Directors, shareholder servicing costs associated with each college savings plan are borne by the fund in proportion to the average daily value of its shares owned by the college savings plan. For the six months ended June 30, 2008, the fund was charged $177,000 for shareholder servicing costs related to the college savings plans, of which $155,000 was for services provided by Price. The amount payable at period-end pursuant to this agreement is reflected as Due to Affiliates in the accompanying financial statements. At June 30, 2008, approximately 2% of the outstanding shares of the Investor Class were held by college savings plans.
The fund is also one of several mutual funds sponsored by Price Associates (underlying Price funds) in which the T. Rowe Price Spectrum Funds (Spectrum Funds) and T. Rowe Price Retirement Funds (Retirement Funds) may invest. Neither the Spectrum Funds nor the Retirement Funds invest in the underlying Price funds for the purpose of exercising management or control. Pursuant to separate special servicing agreements, expenses associated with the operation of the Spectrum and Retirement Funds are borne by each underlying Price fund to the extent of estimated savings to it and in proportion to the average daily value of its shares owned by the Spectrum and Retirement Funds, respectively. Expenses allocated under these agreements are reflected as shareholder servicing expenses in the accompanying financial statements. For the six months ended June 30, 2008, the fund was allocated $335,000 of Spectrum Funds’ expenses and $4,621,000 of Retirement Funds’ expenses. Of these amounts, $3,760,000 related to services provided by Price. The amount payable at period-end pursuant to this agreement is reflected as Due to Affiliates in the accompanying financial statements. At June 30, 2008, approximately 7% of the outstanding shares of the Investor Class were held by the Spectrum Funds and 63% were held by the Retirement Funds.
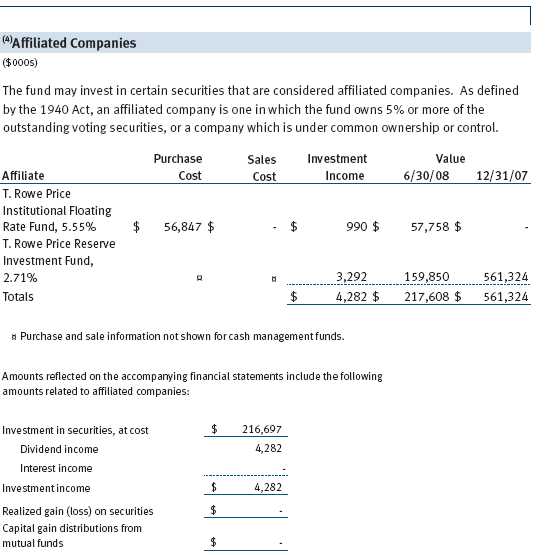
The fund may invest in the T. Rowe Price Reserve Investment Fund and the T. Rowe Price Government Reserve Investment Fund (collectively, the T. Rowe Price Reserve Investment Funds), open-end management investment companies managed by Price Associates and considered affiliates of the fund. The T. Rowe Price Reserve Investment Funds are offered as cash management options to mutual funds, trusts, and other accounts managed by Price Associates and/or its affiliates and are not available for direct purchase by members of the public. The T. Rowe Price Reserve Investment Funds pay no investment management fees.
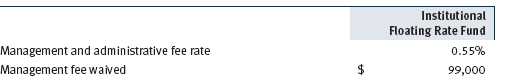
The fund may also invest in certain T. Rowe Price institutional funds (underlying institutional funds) as a means of gaining efficient and cost-effective exposure to certain markets. The underlying institutional funds are open-end management investment companies managed by Price Associates and/or T. Rowe Price International, Inc. (collectively, the Price managers) and are considered affiliates of the fund. Each underlying institutional fund pays an all-inclusive management and administrative fee to its Price manager. To ensure that the fund does not incur duplicate fees, each Price manager has agreed to permanently waive a portion of its management fee charged to the fund in an amount sufficient to fully offset the fees paid by the underlying institutional funds related to fund assets invested therein. Accordingly, the accompanying Statement of Operations includes management fees permanently waived pursuant to this agreement. Annual fee rates and amounts waived within the accompanying Statement of Operations related to shares of the underlying institutional funds for the six months ended June 30, 2008 are as follows:
As of June 30, 2008, T. Rowe Price Group, Inc., and/or its wholly owned subsidiaries owned 211,336 shares of the fund, representing less than 1% of the fund’s net assets.
| INFORMATION ON PROXY VOTING POLICIES, PROCEDURES, AND RECORDS |
A description of the policies and procedures used by T. Rowe Price funds and portfolios to determine how to vote proxies relating to portfolio securities is available in each fund’s Statement of Additional Information, which you may request by calling 1-800-225-5132 or by accessing the SEC’s Web site, www.sec.gov. The description of our proxy voting policies and procedures is also available on our Web site, www.troweprice.com. To access it, click on the words “Company Info” at the top of our homepage for individual investors. Then, in the window that appears, click on the “Proxy Voting Policy” navigation button in the top left corner.
Each fund’s most recent annual proxy voting record is available on our Web site and through the SEC’s Web site. To access it through our Web site, follow the directions above, then click on the words “Proxy Voting Record” at the bottom of the Proxy Voting Policy page.
| HOW TO OBTAIN QUARTERLY PORTFOLIO HOLDINGS |
The fund files a complete schedule of portfolio holdings with the Securities and Exchange Commission for the first and third quarters of each fiscal year on Form N-Q. The fund’s Form N-Q is available electronically on the SEC’s Web site (www.sec.gov); hard copies may be reviewed and copied at the SEC’s Public Reference Room, 450 Fifth St. N.W., Washington, DC 20549. For more information on the Public Reference Room, call 1-800-SEC-0330.
| APPROVAL OF INVESTMENT MANAGEMENT AGREEMENT |
On March 4, 2008, the fund’s Board of Directors (Board) unanimously approved the investment advisory contract (Contract) between the fund and its investment manager, T. Rowe Price Associates, Inc. (Manager). The Board considered a variety of factors in connection with its review of the Contract, also taking into account information provided by the Manager during the course of the year, as discussed below:
Services Provided by the Manager
The Board considered the nature, quality, and extent of the services provided to the fund by the Manager. These services included, but were not limited to, management of the fund’s portfolio and a variety of related activities, as well as financial and administrative services, reporting, and communications. The Board also reviewed the background and experience of the Manager’s senior management team and investment personnel involved in the management of the fund. The Board concluded that it was satisfied with the nature, quality, and extent of the services provided by the Manager.
Investment Performance of the Fund
The Board reviewed the fund’s average annual total returns over the 1-, 3-, 5-, and 10-year periods as well as the fund’s year-by-year returns and compared these returns with previously agreed upon comparable performance measures and market data, including those supplied by Lipper and Morningstar, which are independent providers of mutual fund data. On the basis of this evaluation and the Board’s ongoing review of investment results, the Board concluded that the fund’s performance was satisfactory.
Costs, Benefits, Profits, and Economies of Scale
The Board reviewed detailed information regarding the revenues received by the Manager under the Contract and other benefits that the Manager (and its affiliates) may have realized from its relationship with the fund, including research received under “soft dollar” agreements. The Board noted that soft dollars were not used to pay for third-party, non-broker research. The Board also received information on the estimated costs incurred and profits realized by the Manager and its affiliates from advising T. Rowe Price mutual funds, as well as estimates of the gross profits realized from managing the fund in particular. The Board concluded that the Manager’s profits were reasonable in light of the services provided to the fund. The Board also considered whether the fund or other funds benefit under the fee levels set forth in the Contract from any economies of scale realized by the Manager. Under the Contract, the fund pays a fee to the Manager composed of two components—a group fee rate based on the aggregate assets of certain T. Rowe Price mutual funds (including the fund) that declines at certain asset levels and an individual fund fee rate that is assessed on the assets of the fund. The Board concluded that the advisory fee structure for the fund continued to provide for a reasonable sharing of benefits from any economies of scale with the fund’s investors.
Fees
The Board reviewed the fund’s management fee rate, operating expenses, and total expense ratio (for the Investor Class and the Advisor Class) and compared them with fees and expenses of other comparable funds based on information and data supplied by Lipper. The information provided to the Board indicated that the fund’s management fee rate was above the median for certain groups of comparable funds but at or below the median for other groups of comparable funds. The information also indicated that the fund’s expense ratio for the Investor Class was above the median for certain groups of comparable funds but below the median for other groups of comparable funds and that the fund’s expense ratio for the Advisor Class was at or below the median for comparable funds. The Board also reviewed the fee schedules for comparable privately managed accounts of the Manager and its affiliates. Management informed the Board that the Manager’s responsibilities for privately managed accounts are more limited than its responsibilities for the fund and other T. Rowe Price mutual funds that it or its affiliates advise. On the basis of the information provided, the Board concluded that the fees paid by the fund under the Contract were reasonable.
Approval of the Contract
As noted, the Board approved the continuation of the Contract. No single factor was considered in isolation or to be determinative to the decision. Rather, the Board concluded, in light of a weighting and balancing of all factors considered, that it was in the best interests of the fund to approve the continuation of the Contract, including the fees to be charged for services thereunder.
Item 2. Code of Ethics.
A code of ethics, as defined in Item 2 of Form N-CSR, applicable to its principal executive officer, principal financial officer, principal accounting officer or controller, or persons performing similar functions is filed as an exhibit to the registrant’s annual Form N-CSR. No substantive amendments were approved or waivers were granted to this code of ethics during the registrant’s most recent fiscal half-year.
Item 3. Audit Committee Financial Expert.
Disclosure required in registrant’s annual Form N-CSR.
Item 4. Principal Accountant Fees and Services.
Disclosure required in registrant’s annual Form N-CSR.
Item 5. Audit Committee of Listed Registrants.
Not applicable.
Item 6. Investments.
(a) Not applicable. The complete schedule of investments is included in Item 1 of this Form N-CSR.
(b) Not applicable.
Item 7. Disclosure of Proxy Voting Policies and Procedures for Closed-End Management Investment Companies.
Not applicable.
Item 8. Portfolio Managers of Closed-End Management Investment Companies.
Not applicable.
Item 9. Purchases of Equity Securities by Closed-End Management Investment Company and Affiliated Purchasers.
Not applicable.
Item 10. Submission of Matters to a Vote of Security Holders.
Not applicable.
Item 11. Controls and Procedures.
(a) The registrant’s principal executive officer and principal financial officer have evaluated the registrant’s disclosure controls and procedures within 90 days of this filing and have concluded that the registrant’s disclosure controls and procedures were effective, as of that date, in ensuring that information required to be disclosed by the registrant in this Form N-CSR was recorded, processed, summarized, and reported timely.
(b) The registrant’s principal executive officer and principal financial officer are aware of no change in the registrant’s internal control over financial reporting that occurred during the registrant’s second fiscal quarter covered by this report that has materially affected, or is reasonably likely to materially affect, the registrant’s internal control over financial reporting.
Item 12. Exhibits.
(a)(1) The registrant’s code of ethics pursuant to Item 2 of Form N-CSR is filed with the registrant’s annual Form N-CSR.
(2) Separate certifications by the registrant's principal executive officer and principal financial officer, pursuant to Section 302 of the Sarbanes-Oxley Act of 2002 and required by Rule 30a-2(a) under the Investment Company Act of 1940, are attached.
(3) Written solicitation to repurchase securities issued by closed-end companies: not applicable.
(b) A certification by the registrant's principal executive officer and principal financial officer, pursuant to Section 906 of the Sarbanes-Oxley Act of 2002 and required by Rule 30a-2(b) under the Investment Company Act of 1940, is attached.
| | |
SIGNATURES |
| |
| | Pursuant to the requirements of the Securities Exchange Act of 1934 and the Investment |
| Company Act of 1940, the registrant has duly caused this report to be signed on its behalf by the |
| undersigned, thereunto duly authorized. |
| |
| T. Rowe Price Value Fund, Inc. |
| |
| |
| |
| By | /s/ Edward C. Bernard |
| | Edward C. Bernard |
| | Principal Executive Officer |
| |
| Date | August 20, 2008 |
| |
| |
| |
| | Pursuant to the requirements of the Securities Exchange Act of 1934 and the Investment |
| Company Act of 1940, this report has been signed below by the following persons on behalf of |
| the registrant and in the capacities and on the dates indicated. |
| |
| |
| By | /s/ Edward C. Bernard |
| | Edward C. Bernard |
| | Principal Executive Officer |
| |
| Date | August 20, 2008 |
| |
| |
| |
| By | /s/ Gregory K. Hinkle |
| | Gregory K. Hinkle |
| | Principal Financial Officer |
| |
| Date | August 20, 2008 |