UNITED STATES
SECURITIES AND EXCHANGE COMMISSION
Washington, D.C. 20549
FORM N-CSR
CERTIFIED SHAREHOLDER REPORT OF REGISTERED
MANAGEMENT INVESTMENT COMPANIES
Investment Company Act File Number: 811-07209
| T. Rowe Price Value Fund, Inc. |
|
| (Exact name of registrant as specified in charter) |
| |
| 100 East Pratt Street, Baltimore, MD 21202 |
|
| (Address of principal executive offices) |
| |
| David Oestreicher |
| 100 East Pratt Street, Baltimore, MD 21202 |
|
| (Name and address of agent for service) |
Registrant’s telephone number, including area code: (410) 345-2000
Date of fiscal year end: December 31
Date of reporting period: December 31, 2011
Item 1. Report to Shareholders
| Value Fund | December 31, 2011 |
The views and opinions in this report were current as of December 31, 2011. They are not guarantees of performance or investment results and should not be taken as investment advice. Investment decisions reflect a variety of factors, and the managers reserve the right to change their views about individual stocks, sectors, and the markets at any time. As a result, the views expressed should not be relied upon as a forecast of the fund’s future investment intent. The report is certified under the Sarbanes-Oxley Act, which requires mutual funds and other public companies to affirm that, to the best of their knowledge, the information in their financial reports is fairly and accurately stated in all material respects.
REPORTS ON THE WEB
Sign up for our E-mail Program, and you can begin to receive updated fund reports and prospectuses online rather than through the mail. Log in to your account at troweprice.com for more information.
Manager’s Letter
Fellow Shareholders
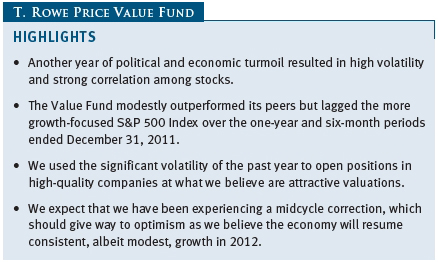
The world is clearly a different place in this post-financial crisis era, and 2011 was another year filled with unprecedented events. Decades-old autocratic regimes were overthrown during the Arab Spring, several eurozone countries experienced severe fiscal challenges, and the credit rating of the United States was downgraded for the first time in history. These and other world events resulted in another year of elevated volatility in the financial markets, and when it came to stocks, many were predisposed to shoot first and ask questions later. Volatility reigned once again, and correlation among equities revisited all-time highs last seen during the financial crisis of 2008.
We remained confident, however, that this was not a repeat of 2008. Since the downturn, many management teams have taken critical steps toward right-sizing their companies’ cost structures and repairing their balance sheets. Excess leverage and bloated inventories have been trimmed, and measures to ensure adequate liquidity are in place. We would argue that the pace of revenue growth is the larger question facing corporate America, as the U.S. continues to find its footing with housing and unemployment, Europe defines itself in the age of austerity, and China grapples with the effects of rapid economic growth.
Although we are unable to predict what this year will bring, we want to remind our investors that regardless of the market environment, we are committed to our investment strategy of selecting investments based on bottom-up, fundamental analysis where we can identify securities that are mispriced by the market. While we may not always be right, if we can successfully identify companies with asymmetric return potential—in other words, the upside is proportionately greater than the downside—then we should be able to outperform the market and our peer universe over time.
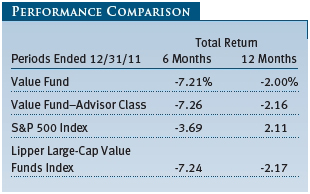
For the 12-month period, the Value Fund recorded a return of -2.00%, which compared favorably to the Lipper Large-Cap Value Funds Index return of -2.17%. However, the fund underperformed the S&P 500 Index, which ended the year with a 2.11% total return. Over the six-month period, the fund slightly outperformed its Lipper peer group and lagged the S&P. The divergence of the S&P 500 Index from the traditional value indices highlights, in our view, investors’ preference for areas of the market that exhibit growth and momentum characteristics. While some value managers may be tempted to chase growth, we will remain disciplined in our process of identifying securities that represent compelling value for our investors.
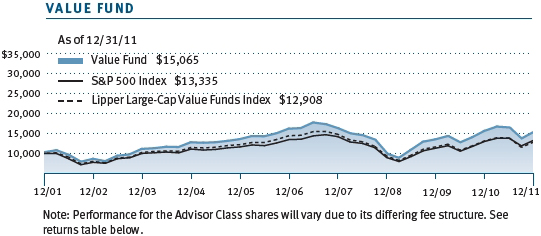
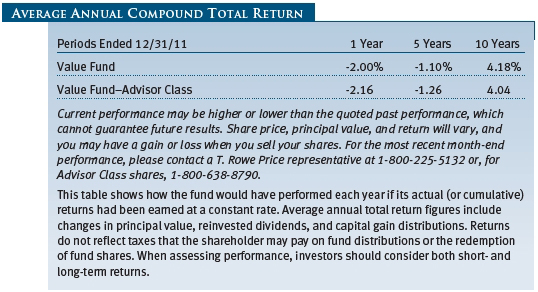
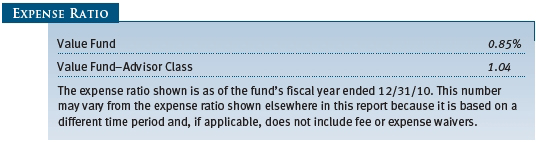
Since your fund’s inception in 1994, it has outpaced both the market and the Lipper Large-Cap Value Funds Index by posting an annualized gain of 9.71% as compared with the S&P 500’s gain of 7.96% and the Lipper value benchmark’s gain of 7.05%. (Annualized returns for the fund were -2.00%, -1.10%, and 4.18% for the 1-, 5-, and 10-year periods ended December 31, 2011, respectively. Current performance may be higher or lower than the quoted past performance, which cannot guarantee future results. Share price, principal value, and return will vary, and you may have a gain or loss when you sell your shares. To obtain the most recent month-end performance, please call 1-800-225-5132 or go to troweprice.com. The fund’s expense ratio was 0.85% as of its fiscal year ended December 31, 2010.)
PORTFOLIO REVIEW
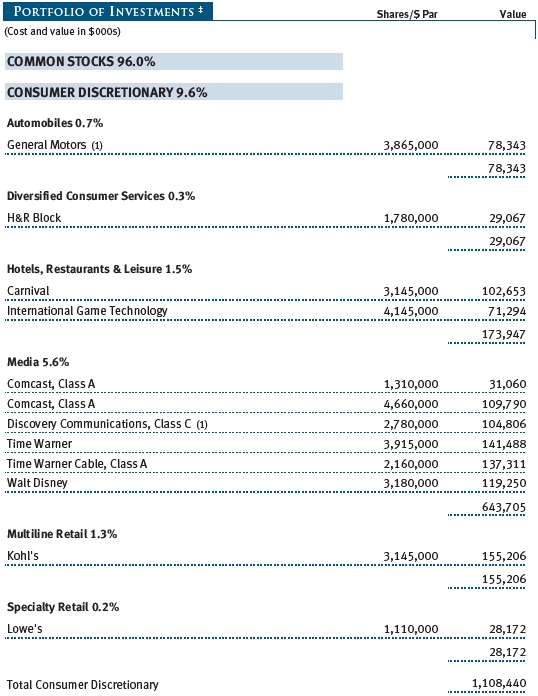
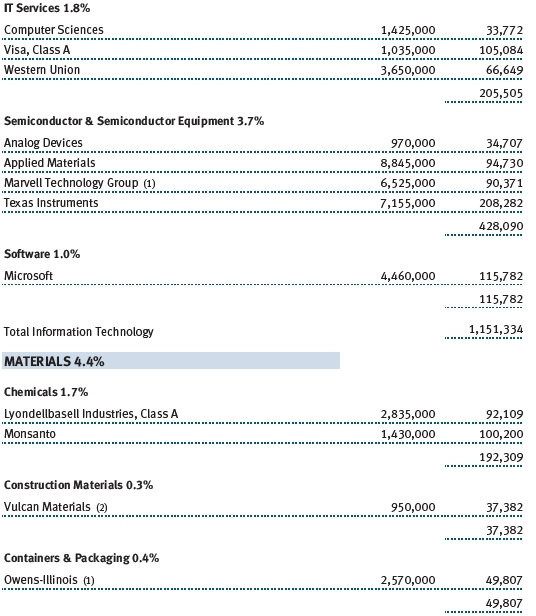
The contrast between growing corporate confidence and investor uncertainty led to an interesting dynamic within the market during the year. Company management teams showed that they were willing to take on more risk by expanding their workforces and product lines or by pursuing mergers and acquisitions. Your fund benefited directly from this as two holdings—El Paso Corporation and Motorola Mobility—were announced as acquisition targets during the year at prices that offered substantial premiums to their market values. (Please refer to the fund’s portfolio of investments for a complete list of holdings and the amount each represents in the portfolio.)
Investors, on the other hand, placed a premium on low volatility, or perceived “safer” sectors, such as consumer staples, utilities, and health care. They also embraced the certainty of cash flows from high-yielding stocks as long-term interest rates remained depressed. Again, your fund benefited from this sentiment as the health care and utilities sectors had the greatest positive impact on performance. In addition, we have always maintained a bias toward high free cash flow and dividend-paying stocks.
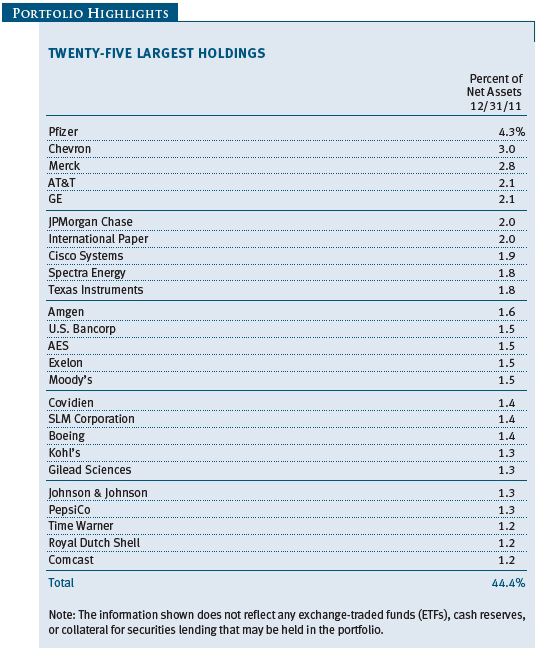
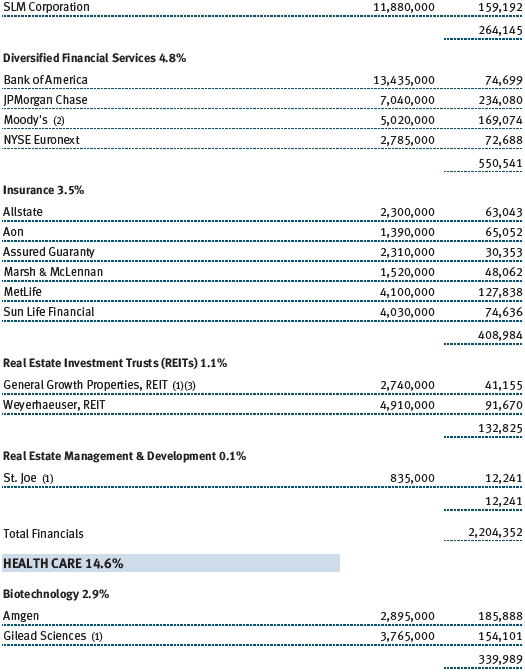
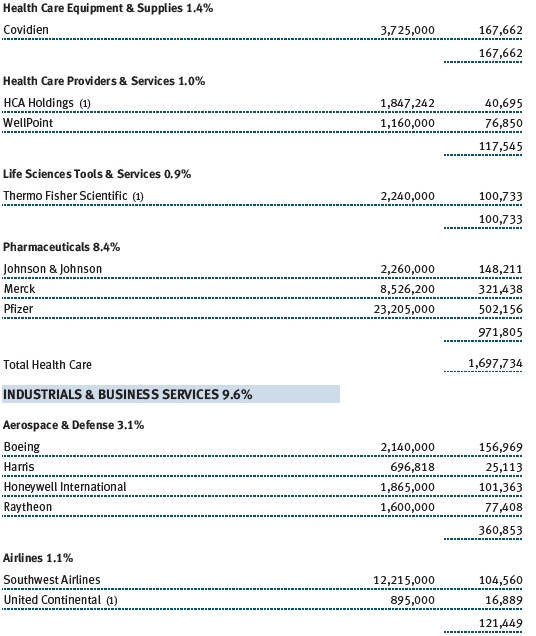
Among your fund’s health care holdings, Pfizer continued to be a top-performing holding. Prior to this year, Pfizer lagged its peers as investors worried about key patent expirations and other operational concerns. What we found most attractive about Pfizer—as well as other top-performing health care holdings Merck and Amgen—was its substantial, highly defendable cash flows, to which the market did not seem to ascribe proper value. Throughout the year, market participants began to reward Pfizer for its steady cash flow stream, improvements to operations and management, and increasingly shareholder-friendly capital return program via dividends and stock buybacks.
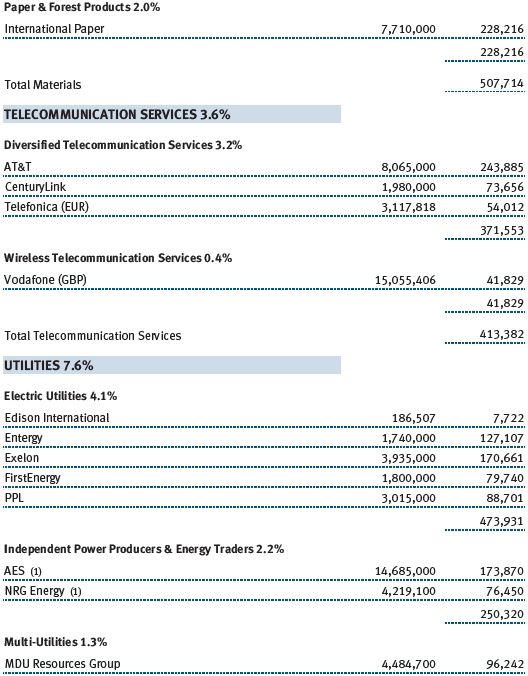
Similarly, stocks within the utilities sector performed extremely well as investors sought solid dividend yields backed by steady, recurring free cash flows. Your fund benefited most in this sector from investments in PPL, CenterPoint Energy, FirstEnergy, and NiSource.
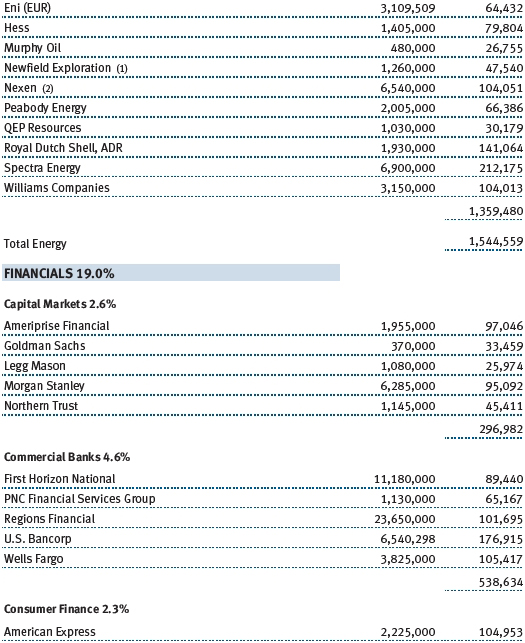
Given the high value that investors were willing to place on the safety and predictability of health care and utilities stocks, it is less surprising that financials, beleaguered by continued uncertainty, was the worst-performing sector in the market. Many financial companies continue to struggle with a murky regulatory environment, growing mortgage loan losses, and weak loan demand. In addition, eurozone debt fears spread to the U.S. as investors tried to assess the likelihood of another Lehman-type financial collapse in Europe. Within financials, Bank of America, Morgan Stanley, and JPMorgan Chase had the largest negative impact on your fund, but this was partially offset by strong performance from Moody’s, which was a top-performing holding during the year. We understand the trepidation that many investors have with investing in financial companies, but valuations are at historically low levels, and we expect financial stocks to enjoy stronger performance as the economic recovery progresses and regulatory clouds dissipate.
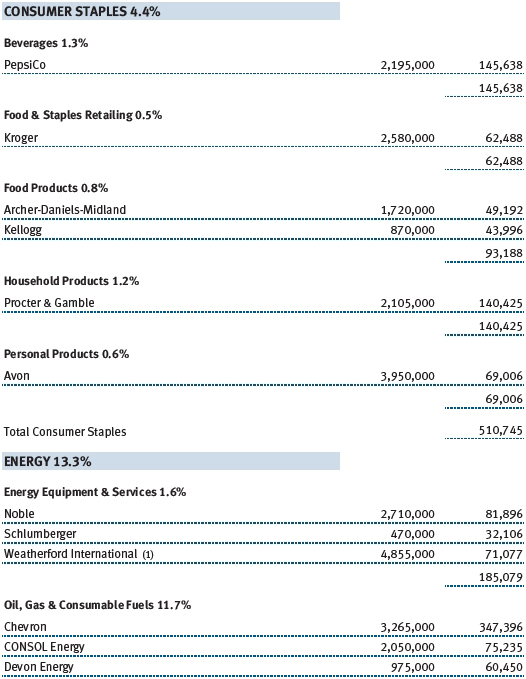
Unfortunately, negative returns were not confined to financial stocks. Investors shied away from Southwest Airlines as fears set in about a double-dip recession, while oil prices stayed stubbornly high. We remain confident about our investment in Southwest because the company continues to take market share within a consolidating airline industry. In sharp contrast, Avon has been a clear disappointment. Despite an ideal global footprint and attractively priced cosmetic offerings, Avon continued to execute poorly in three key geographic areas, including the U.S., Brazil, and Russia. Consequently, there were several management changes during the year, with the CEO ultimately stepping aside as well. We expect a better year from Avon in 2012 as management begins to take the difficult, but necessary steps to improve its regional execution.
PORTFOLIO STRATEGY AND CHANGES
To place our portfolio changes in perspective, we believe it is important to review the investment strategy we use in managing your fund. Our focus is to invest in companies with both attractive relative valuations and favorable long-term fundamental characteristics. We view ourselves as investors, not speculators, and we have a longer-term horizon when we make our investment decisions. Indeed, our portfolio turnover has been consistently lower than the average of our peers.
We focus a great deal on understanding both the return potential and risk associated with a given company when selecting the appropriate investments for your portfolio. Our approach is predicated on identifying companies where we believe the investment’s implicit upside is significantly greater than its inherent risk. We have a particular affinity for companies that generate strong free cash flow and are trading at a discount to our estimated sum-of-the-parts valuation.
As investors, we find that periods of high emotion within the market often lead to distorted individual stock valuations that are disconnected from underlying fundamentals. As the market fluctuated at several points during the year, we attempted to use these periods of market disruption to your benefit by starting positions in high-quality companies whose prices declined to compelling valuation levels, such as Walt Disney and Visa. We also added to our holdings of Boeing, Texas Instruments, and PepsiCo during the year.
Shares of Disney dipped along with the broader market during late summer, and we used this as an opportunity to initiate a position. Disney’s well-recognized franchise in both media content and theme parks, combined with its lucrative ESPN Sports business, gives us confidence in the persistence of its substantial cash flows. We have had our eye on Disney for some time, and our valuation discipline appears to have paid off.

Visa’s stock price declined early in 2010 over regulatory concerns, and shares remained depressed into 2011, even trading at a discount to its closest rival, MasterCard. We believed the market was overly discounting the severity of potential new regulation, and we are pleased that shares rose nearly 15% upon announcement of final rules for interchange fees for electronic debit transactions. In addition, we thought fears over “mobile wallets” taking market share were also overblown. We believe mobile wallet technology, which uses smartphones to make payments, is more of an opportunity than a threat, as Visa would likely be a part of any future solution due to its dominance within the payments industry.
Boeing shares waned as investors grew weary of multiple delays in the launch of its new 787 Dreamliner, providing us with the opportunity to add to our position at what we believe were bargain prices. With a successful first flight under its belt and the opening of a state-of-the-art production facility in South Carolina, we expect the 787, along with the redesign of the 737 engine, will be a strong source of earnings power for Boeing for many years to come.
Texas Instruments’ shares declined after it announced acquisition of National Semiconductor, and we used this as an opportunity to increase your fund’s position at what we view as an attractive valuation. Texas Instruments is now the second-largest holding within information technology. We believe the continued proliferation of technology into everyday products will provide a solid runway to exploit the company’s leading market share in semiconductors.
As investors flocked to shares of consumer staples companies throughout the year, PepsiCo continued to lag its peers and the sector. We added to your fund’s position early in the year, and it is now our biggest overweight within the consumer staples sector. We believe the value of PepsiCo’s snack business is not fully reflected in its share price and that the solid dividend provides a good backstop to its valuation.
Many of your fund’s holdings performed well despite the volatility experienced by the market this year, and we took the opportunity to take profits in shares that reached what we believed was fair value, including IBM and EQT. Shares of IBM strongly outperformed its peers and the broader market on the back of IBM’s strong information technology services business. We initiated our position in IBM at the depths of the market downturn in 2009 and felt this was a good opportunity to redeploy funds into companies with lower valuations, such as Cisco Systems and Dell. EQT also performed exceptionally well versus its peers, especially given the difficult environment faced by natural gas companies, so we took gains in the position.
OUTLOOK
We continue to view recent volatility and unprecedented equity correlations—exacerbated by macro fears surrounding European fiscal woes and a potential slowing of China’s growth—as an opportunity to buy quality companies at attractive valuations. We expect that what we believe is a midcycle correction in the U.S. will give way to a more optimistic outlook as the economy resumes consistent, albeit modest, growth in 2012. Corporate earnings remain strong, balance sheets are flush with cash, and stock valuations are reasonable. We continue to work closely with our in-house proprietary research analysts to select stocks with valuation appeal, sound fundamentals, and reasonable balance sheet integrity. As always, we will concentrate our efforts on making sound investment decisions in our ongoing attempt to enhance shareholder value.
Respectfully submitted,

Mark S. Finn
Portfolio manager and chairman of the fund’s Investment
Advisory Committee
January 18, 2012
The committee chairman has day-to-day responsibility for managing the portfolio and works with committee members in developing and executing the fund’s investment program.
RISKS OF INVESTING IN THE FUND
Value investors seek to invest in companies whose stock prices are low in relation to their real worth or future prospects. By identifying companies whose stocks are currently out of favor or misunderstood, value investors hope to realize significant appreciation as other investors recognize the stock’s intrinsic value and the price rises accordingly. The value approach carries the risk that the market will not recognize a security’s intrinsic value for a long time or that a stock judged to be undervalued may actually be appropriately priced.
GLOSSARY
Lipper index: An index of mutual fund performance returns for specified periods in defined categories as tracked by Lipper Inc.
S&P 500 Index: An unmanaged index that tracks the stocks of 500 primarily large-cap U.S. companies.

Performance and Expenses
This chart shows the value of a hypothetical $10,000 investment in the fund over the past 10 fiscal year periods or since inception (for funds lacking 10-year records). The result is compared with benchmarks, which may include a broad-based market index and a peer group average or index. Market indexes do not include expenses, which are deducted from fund returns as well as mutual fund averages and indexes.
As a mutual fund shareholder, you may incur two types of costs: (1) transaction costs, such as redemption fees or sales loads, and (2) ongoing costs, including management fees, distribution and service (12b-1) fees, and other fund expenses. The following example is intended to help you understand your ongoing costs (in dollars) of investing in the fund and to compare these costs with the ongoing costs of investing in other mutual funds. The example is based on an investment of $1,000 invested at the beginning of the most recent six-month period and held for the entire period.
Please note that the fund has two share classes: The original share class (“Investor Class”) charges no distribution and service (12b-1) fee, and the Advisor Class shares are offered only through unaffiliated brokers and other financial intermediaries and charge a 0.25% 12b-1 fee. Each share class is presented separately in the table.
Actual Expenses
The first line of the following table (“Actual”) provides information about actual account values and expenses based on the fund’s actual returns. You may use the information on this line, together with your account balance, to estimate the expenses that you paid over the period. Simply divide your account value by $1,000 (for example, an $8,600 account value divided by $1,000 = 8.6), then multiply the result by the number on the first line under the heading “Expenses Paid During Period” to estimate the expenses you paid on your account during this period.
Hypothetical Example for Comparison Purposes
The information on the second line of the table (“Hypothetical”) is based on hypothetical account values and expenses derived from the fund’s actual expense ratio and an assumed 5% per year rate of return before expenses (not the fund’s actual return). You may compare the ongoing costs of investing in the fund with other funds by contrasting this 5% hypothetical example and the 5% hypothetical examples that appear in the shareholder reports of the other funds. The hypothetical account values and expenses may not be used to estimate the actual ending account balance or expenses you paid for the period.
Note: T. Rowe Price charges an annual account service fee of $20, generally for accounts with less than $10,000 ($1,000 for UGMA/UTMA). The fee is waived for any investor whose T. Rowe Price mutual fund accounts total $50,000 or more; accounts employing automatic investing; accounts electing to receive electronic delivery of account statements, transaction confirmations, prospectuses, and shareholder reports; accounts of an investor who is a T. Rowe Price Preferred Services, Personal Services, or Enhanced Personal Services client (enrollment in these programs generally requires T. Rowe Price assets of at least $100,000); and IRAs and other retirement plan accounts that utilize a prototype plan sponsored by T. Rowe Price (although a separate custodial or administrative fee may apply to such accounts). This fee is not included in the accompanying table. If you are subject to the fee, keep it in mind when you are estimating the ongoing expenses of investing in the fund and when comparing the expenses of this fund with other funds.
You should also be aware that the expenses shown in the table highlight only your ongoing costs and do not reflect any transaction costs, such as redemption fees or sales loads. Therefore, the second line of the table is useful in comparing ongoing costs only and will not help you determine the relative total costs of owning different funds. To the extent a fund charges transaction costs, however, the total cost of owning that fund is higher.

The accompanying notes are an integral part of these financial statements.

The accompanying notes are an integral part of these financial statements.

The accompanying notes are an integral part of these financial statements.
The accompanying notes are an integral part of these financial statements.
The accompanying notes are an integral part of these financial statements.
The accompanying notes are an integral part of these financial statements.
| Notes to Financial Statements |
T. Rowe Price Value Fund, Inc. (the fund), is registered under the Investment Company Act of 1940 (the 1940 Act) as a diversified, open-end management investment company. The fund seeks to provide long-term capital appreciation by investing in common stocks believed to be undervalued. Income is a secondary objective. The fund has two classes of shares: the Value Fund original share class, referred to in this report as the Investor Class, offered since September 30, 1994, and the Value Fund–Advisor Class (Advisor Class), offered since March 31, 2000. Advisor Class shares are sold only through unaffiliated brokers and other unaffiliated financial intermediaries that are compensated by the class for distribution, shareholder servicing, and/or certain administrative services under a Board-approved Rule 12b-1 plan. Each class has exclusive voting rights on matters related solely to that class; separate voting rights on matters that relate to both classes; and, in all other respects, the same rights and obligations as the other class.
NOTE 1 - SIGNIFICANT ACCOUNTING POLICIES
Basis of Preparation The accompanying financial statements were prepared in accordance with accounting principles generally accepted in the United States of America (GAAP), which require the use of estimates made by management. Management believes that estimates and valuations are appropriate; however, actual results may differ from those estimates, and the valuations reflected in the accompanying financial statements may differ from the value ultimately realized upon sale or maturity.
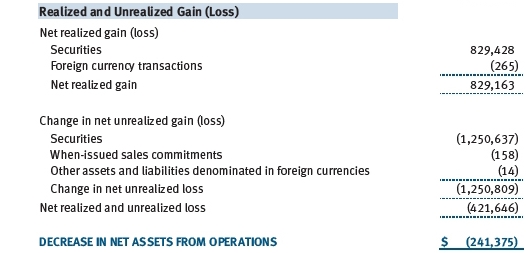
Investment Transactions, Investment Income, and Distributions Income and expenses are recorded on the accrual basis. Premiums and discounts on debt securities are amortized for financial reporting purposes. Dividends received from mutual fund investments are reflected as dividend income; capital gain distributions are reflected as realized gain/loss. Dividend income and capital gain distributions are recorded on the ex-dividend date. Income tax-related interest and penalties, if incurred, would be recorded as income tax expense. Investment transactions are accounted for on the trade date. Realized gains and losses are reported on the identified cost basis. Distributions to shareholders are recorded on the ex-dividend date. Income distributions are declared and paid by each class annually. Capital gain distributions, if any, are generally declared and paid by the fund annually.
Currency Translation Assets, including investments, and liabilities denominated in foreign currencies are translated into U.S. dollar values each day at the prevailing exchange rate, using the mean of the bid and asked prices of such currencies against U.S. dollars as quoted by a major bank. Purchases and sales of securities, income, and expenses are translated into U.S. dollars at the prevailing exchange rate on the date of the transaction. The effect of changes in foreign currency exchange rates on realized and unrealized security gains and losses is reflected as a component of security gains and losses.
Class Accounting The Advisor Class pays distribution, shareholder servicing, and/or certain administrative expenses in the form of Rule 12b-1 fees, in an amount not exceeding 0.25% of the class’s average daily net assets. Shareholder servicing, prospectus, and shareholder report expenses incurred by each class are charged directly to the class to which they relate. Expenses common to both classes, investment income, and realized and unrealized gains and losses are allocated to the classes based upon the relative daily net assets of each class.
Rebates and Credits Subject to best execution, the fund may direct certain security trades to brokers who have agreed to rebate a portion of the related brokerage commission to the fund in cash. Commission rebates are reflected as realized gain on securities in the accompanying financial statements and totaled $326,000 for the year ended December 31, 2011. Additionally, the fund earns credits on temporarily uninvested cash balances held at the custodian, which reduce the fund’s custody charges. Custody expense in the accompanying financial statements is presented before reduction for credits.
New Accounting Pronouncement In December 2011, the Financial Accounting Standards Board issued amended guidance to enhance disclosure for offsetting assets and liabilities. The guidance is effective for fiscal years and interim periods beginning on or after January 1, 2013; adoption will have no effect on the fund’s net assets or results of operations.
NOTE 2 - VALUATION
The fund’s financial instruments are reported at fair value as defined by GAAP. The fund determines the values of its assets and liabilities and computes each class’s net asset value per share at the close of the New York Stock Exchange (NYSE), normally 4 p.m. ET, each day that the NYSE is open for business. Values in the accompanying Portfolio of Investments are as of December 30, 2011, the last business day in the fund’s fiscal year ended December 31, 2011. Some foreign markets were open between December 30 and the close of the fund’s reporting period on December 31, but any differences in values and foreign exchange rates subsequent to December 30 through December 31 were immaterial to the fund’s financial statements.
Valuation Methods Equity securities listed or regularly traded on a securities exchange or in the over-the-counter (OTC) market are valued at the last quoted sale price or, for certain markets, the official closing price at the time the valuations are made, except for OTC Bulletin Board securities, which are valued at the mean of the latest bid and asked prices. A security that is listed or traded on more than one exchange is valued at the quotation on the exchange determined to be the primary market for such security. Listed securities not traded on a particular day are valued at the mean of the latest bid and asked prices for domestic securities and the last quoted sale price for international securities.
Debt securities are generally traded in the OTC market. Securities with remaining maturities of one year or more at the time of acquisition are valued at prices furnished by dealers who make markets in such securities or by an independent pricing service, which considers the yield or price of bonds of comparable quality, coupon, maturity, and type, as well as prices quoted by dealers who make markets in such securities. Securities with remaining maturities of less than one year at the time of acquisition generally use amortized cost in local currency to approximate fair value. However, if amortized cost is deemed not to reflect fair value or the fund holds a significant amount of such securities with remaining maturities of more than 60 days, the securities are valued at prices furnished by dealers who make markets in such securities or by an independent pricing service.
Investments in mutual funds are valued at the mutual fund’s closing net asset value per share on the day of valuation.
Other investments, including restricted securities and private placements, and those financial instruments for which the above valuation procedures are inappropriate or are deemed not to reflect fair value, are stated at fair value as determined in good faith by the T. Rowe Price Valuation Committee, established by the fund’s Board of Directors (the Board). Subject to oversight by the Board, the Valuation Committee develops pricing-related policies and procedures and approves all fair-value determinations. The Valuation Committee regularly makes good faith judgments, using a wide variety of sources and information, to establish and adjust valuations of certain securities as events occur and circumstances warrant. For instance, in determining the fair value of private-equity instruments, the Valuation Committee considers a variety of factors, including the company’s business prospects, its financial performance, strategic events impacting the company, relevant valuations of similar companies, new rounds of financing, and any negotiated transactions of significant size between other investors in the company. Because any fair-value determination involves a significant amount of judgment, there is a degree of subjectivity inherent in such pricing decisions.
For valuation purposes, the last quoted prices of non-U.S. equity securities may be adjusted under the circumstances described below. If the fund determines that developments between the close of a foreign market and the close of the NYSE will, in its judgment, materially affect the value of some or all of its portfolio securities, the fund will adjust the previous closing prices to reflect what it believes to be the fair value of the securities as of the close of the NYSE. In deciding whether it is necessary to adjust closing prices to reflect fair value, the fund reviews a variety of factors, including developments in foreign markets, the performance of U.S. securities markets, and the performance of instruments trading in U.S. markets that represent foreign securities and baskets of foreign securities. A fund may also fair value securities in other situations, such as when a particular foreign market is closed but the fund is open. The fund uses outside pricing services to provide it with closing prices and information to evaluate and/or adjust those prices. The fund cannot predict how often it will use closing prices and how often it will determine it necessary to adjust those prices to reflect fair value. As a means of evaluating its security valuation process, the fund routinely compares closing prices, the next day’s opening prices in the same markets, and adjusted prices. Additionally, trading in the underlying securities of the fund may take place in various foreign markets on certain days when the fund is not open for business and does not calculate a net asset value. As a result, net asset values may be significantly affected on days when shareholders cannot make transactions.
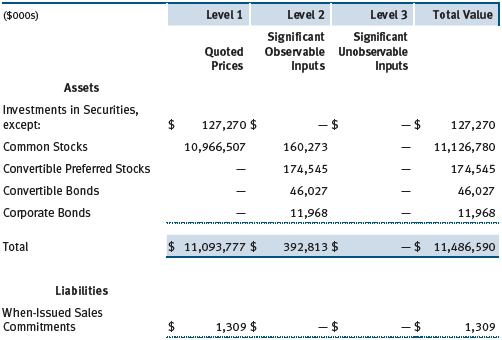
Valuation Inputs Various inputs are used to determine the value of the fund’s financial instruments. These inputs are summarized in the three broad levels listed below:
Level 1 – quoted prices in active markets for identical financial instruments
Level 2 – observable inputs other than Level 1 quoted prices (including, but not limited to, quoted prices for similar financial instruments, interest rates, prepayment speeds, and credit risk)
Level 3 – unobservable inputs
Observable inputs are those based on market data obtained from sources independent of the fund, and unobservable inputs reflect the fund’s own assumptions based on the best information available. The input levels are not necessarily an indication of the risk or liquidity associated with financial instruments at that level. For example, non-U.S. equity securities actively traded in foreign markets generally are reflected in Level 2 despite the availability of closing prices because the fund evaluates and determines whether those closing prices reflect fair value at the close of the NYSE or require adjustment, as described above. The following table summarizes the fund’s financial instruments, based on the inputs used to determine their values on December 31, 2011:
NOTE 3 - OTHER INVESTMENT TRANSACTIONS
Consistent with its investment objective, the fund engages in the following practices to manage exposure to certain risks and/or to enhance performance. The investment objective, policies, program, and risk factors of the fund are described more fully in the fund’s prospectus and Statement of Additional Information.
Restricted Securities The fund may invest in securities that are subject to legal or contractual restrictions on resale. Prompt sale of such securities at an acceptable price may be difficult and may involve substantial delays and additional costs.
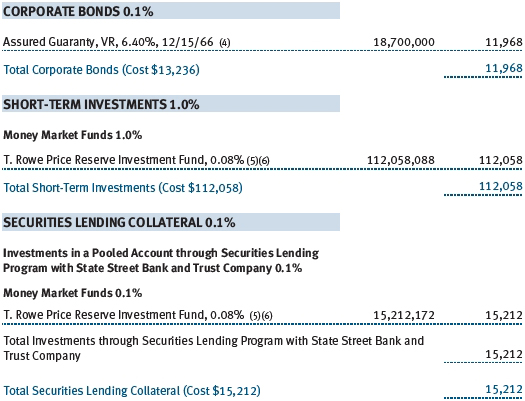
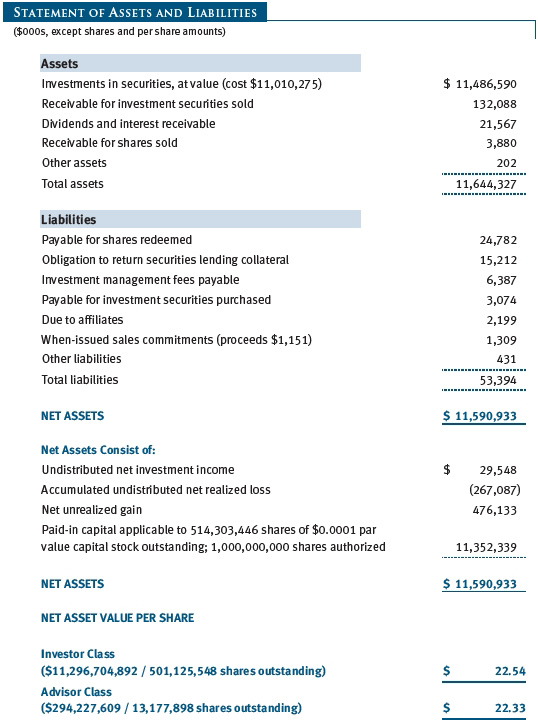
Securities Lending The fund lends its securities to approved brokers to earn additional income. It receives as collateral cash and U.S. government securities valued at 102% to 105% of the value of the securities on loan. Cash collateral is invested by the fund’s lending agent(s) in accordance with investment guidelines approved by management. Collateral is maintained over the life of the loan in an amount not less than the value of loaned securities as determined at the close of fund business each day; any additional collateral required due to changes in security values is delivered to the fund the next business day. Although risk is mitigated by the collateral, the fund could experience a delay in recovering its securities and a possible loss of income or value if the borrower fails to return the securities or if collateral investments decline in value. Securities lending revenue recognized by the fund consists of earnings on invested collateral and borrowing fees, net of any rebates to the borrower and compensation to the lending agent. In accordance with GAAP, investments made with cash collateral are reflected in the accompanying financial statements, but collateral received in the form of securities are not. On December 31, 2011, the value of cash collateral investments was $15,212,000 and the value of loaned securities was $15,013,000.
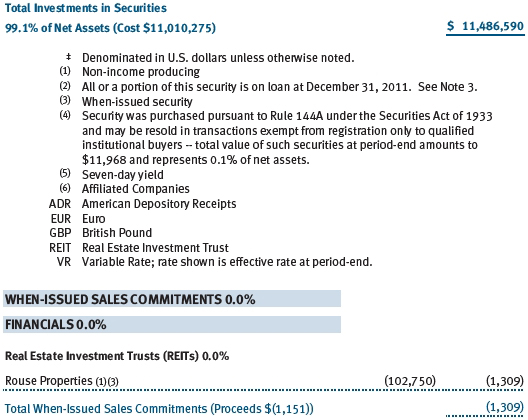
When-Issued Securities The fund may enter into when-issued purchases and/or sales commitments, pursuant to which it agrees to purchase or sell, respectively, the underlying security for a fixed unit price, with payment and delivery at a scheduled future date generally beyond the customary settlement period for such securities. When-issued refers to securities that have not yet been issued but will be issued in the future and may include new securities or securities obtained through a corporate action on a current holding. The fund normally purchases when-issued securities with the intention of taking possession but may enter into a separate agreement to sell the securities before the settlement date. Until settlement, the fund maintains cash reserves and liquid assets sufficient to settle its when-issued commitments. Amounts realized on when-issued transactions are included with realized gain/loss on securities on the accompanying financial statements.
Other Purchases and sales of portfolio securities other than short-term securities aggregated $6,503,573,000 and $6,411,226,000, respectively, for the year ended December 31, 2011.
NOTE 4 - FEDERAL INCOME TAXES
No provision for federal income taxes is required since the fund intends to continue to qualify as a regulated investment company under Subchapter M of the Internal Revenue Code and distribute to shareholders all of its taxable income and gains. Distributions determined in accordance with federal income tax regulations may differ in amount or character from net investment income and realized gains for financial reporting purposes. Financial reporting records are adjusted for permanent book/tax differences to reflect tax character but are not adjusted for temporary differences.
The fund files U.S. federal, state, and local tax returns as required. The fund’s tax returns are subject to examination by the relevant tax authorities until expiration of the applicable statute of limitations, which is generally three years after the filing of the tax return but which can be extended to six years in certain circumstances. Tax returns for open years have incorporated no uncertain tax positions that require a provision for income taxes.
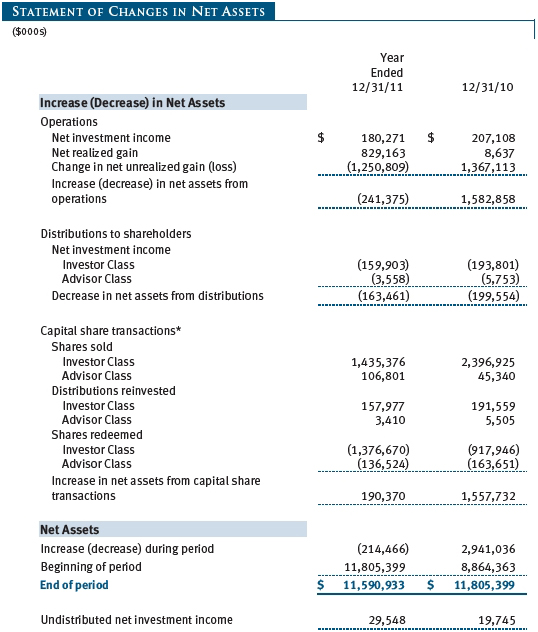
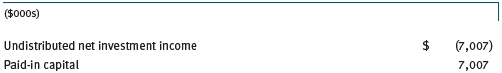
Reclassifications to paid-in capital relate primarily to a tax practice that treats a portion of the proceeds from each redemption of capital shares as a distribution of taxable net investment income and/or realized capital gain. For the year ended December 31, 2011, the following reclassifications were recorded to reflect tax character (there was no impact on results of operations or net assets):
Distributions during the years ended December 31, 2011 and December 31, 2010, totaled $163,461,000 and $199,554,000, respectively, and were characterized as ordinary income for tax purposes. At December 31, 2011, the tax-basis cost of investments and components of net assets were as follows:
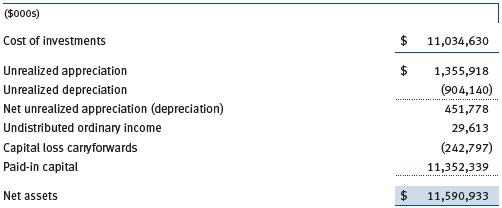
The difference between book-basis and tax-basis net unrealized appreciation (depreciation) is attributable to the deferral of losses from wash sales for tax purposes. As a result of the Regulated Investment Company Modernization Act of 2010, net capital losses realized on or after January 1, 2011 (effective date) may be carried forward indefinitely to offset future realized capital gains; however, post-effective losses must be used before pre-effective capital loss carryforwards with expiration dates. Accordingly, it is possible that all or a portion of the fund’s pre-effective capital loss carryforwards could expire unused. The fund intends to retain realized gains to the extent of available capital loss carryforwards. During the year ended December 31, 2011, the fund utilized $714,036,000 of capital loss carryforwards. The fund’s available capital loss carryforwards as of December 31, 2011, expire as follows: $147,845,000 in fiscal 2017, and $94,952,000 in fiscal 2018.
NOTE 5 - RELATED PARTY TRANSACTIONS
The fund is managed by T. Rowe Price Associates, Inc. (Price Associates), a wholly owned subsidiary of T. Rowe Price Group, Inc. (Price Group). The investment management agreement between the fund and Price Associates provides for an annual investment management fee, which is computed daily and paid monthly. The fee consists of an individual fund fee, equal to 0.35% of the fund’s average daily net assets, and a group fee. The group fee rate is calculated based on the combined net assets of certain mutual funds sponsored by Price Associates (the group) applied to a graduated fee schedule, with rates ranging from 0.48% for the first $1 billion of assets to 0.28% for assets in excess of $300 billion. The fund’s group fee is determined by applying the group fee rate to the fund’s average daily net assets. At December 31, 2011, the effective annual group fee rate was 0.30%.
In addition, the fund has entered into service agreements with Price Associates and two wholly owned subsidiaries of Price Associates (collectively, Price). Price Associates computes the daily share prices and provides certain other administrative services to the fund. T. Rowe Price Services, Inc., provides shareholder and administrative services in its capacity as the fund’s transfer and dividend disbursing agent. T. Rowe Price Retirement Plan Services, Inc., provides subaccounting and recordkeeping services for certain retirement accounts invested in the Investor Class. For the year ended December 31, 2011, expenses incurred pursuant to these service agreements were $110,000 for Price Associates; $790,000 for T. Rowe Price Services, Inc.; and $1,003,000 for T. Rowe Price Retirement Plan Services, Inc. The total amount payable at period-end pursuant to these service agreements is reflected as Due to Affiliates in the accompanying financial statements.
Additionally, the fund is one of several mutual funds in which certain college savings plans managed by Price Associates may invest. As approved by the fund’s Board of Directors, shareholder servicing costs associated with each college savings plan are borne by the fund in proportion to the average daily value of its shares owned by the college savings plan. For the year ended December 31, 2011, the fund was charged $495,000 for shareholder servicing costs related to the college savings plans, of which $412,000 was for services provided by Price. The amount payable at period-end pursuant to this agreement is reflected as Due to Affiliates in the accompanying financial statements. At December 31, 2011, approximately 2% of the outstanding shares of the Investor Class were held by college savings plans.
The fund is also one of several mutual funds sponsored by Price Associates (underlying Price funds) in which the T. Rowe Price Spectrum Funds (Spectrum Funds) and T. Rowe Price Retirement Funds (Retirement Funds) may invest. Neither the Spectrum Funds nor the Retirement Funds invest in the underlying Price funds for the purpose of exercising management or control. Pursuant to separate special servicing agreements, expenses associated with the operation of the Spectrum and Retirement Funds are borne by each underlying Price fund to the extent of estimated savings to it and in proportion to the average daily value of its shares owned by the Spectrum and Retirement Funds, respectively. Expenses allocated under these agreements are reflected as shareholder servicing expenses in the accompanying financial statements. For the year ended December 31, 2011, the fund was allocated $718,000 of Spectrum Funds’ expenses and $18,858,000 of Retirement Funds’ expenses. Of these amounts, $11,279,000 related to services provided by Price. The amount payable at period-end pursuant to this agreement is reflected as Due to Affiliates in the accompanying financial statements. At December 31, 2011, approximately 4% of the outstanding shares of the Investor Class were held by the Spectrum Funds and 78% were held by the Retirement Funds.
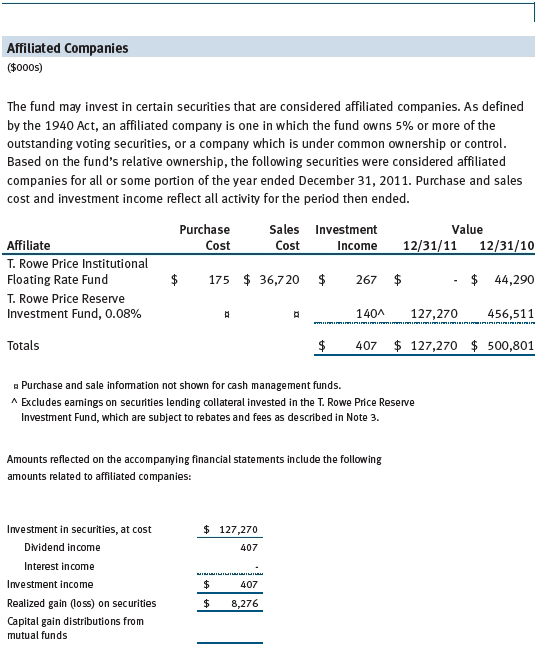
The fund may invest in the T. Rowe Price Reserve Investment Fund and the T. Rowe Price Government Reserve Investment Fund (collectively, the T. Rowe Price Reserve Investment Funds), open-end management investment companies managed by Price Associates and considered affiliates of the fund. The T. Rowe Price Reserve Investment Funds are offered as cash management options to mutual funds, trusts, and other accounts managed by Price Associates and/or its affiliates and are not available for direct purchase by members of the public. The T. Rowe Price Reserve Investment Funds pay no investment management fees.
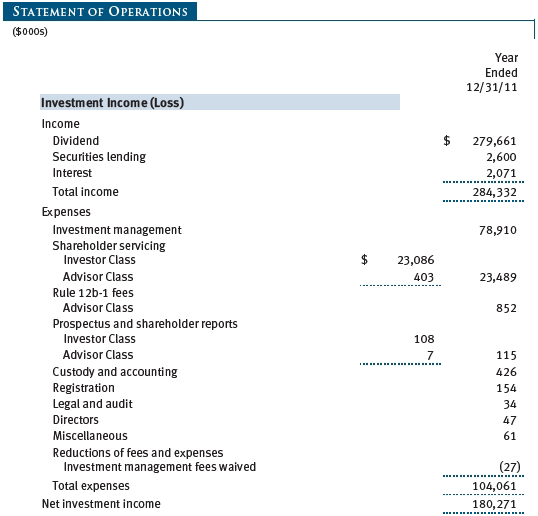
The fund may also invest in certain T. Rowe Price institutional funds (underlying institutional funds) as a means of gaining efficient and cost-effective exposure to certain markets. The underlying institutional funds are open-end management investment companies managed by Price Associates and are considered affiliates of the fund. Each underlying institutional fund pays an all-inclusive management and administrative fee to Price Associates. To ensure that the fund does not incur duplicate fees, Price Associates has agreed to permanently waive a portion of its management fee charged to the fund in an amount sufficient to fully offset the management fees paid by the underlying institutional funds related to fund assets invested therein. Accordingly, the accompanying Statement of Operations includes management fees permanently waived pursuant to this agreement. Annual fee rates and amounts waived within the accompanying Statement of Operations related to shares of the underlying institutional funds for the year ended December 31, 2011, are as follows:

As of December 31, 2011, T. Rowe Price Group, Inc., and/or its wholly owned subsidiaries owned 1,424,654 shares of the Investor Class, representing less than 1% of the fund’s net assets.
| Report of Independent Registered Public Accounting Firm |
To the Board of Directors and Shareholders of
T. Rowe Price Value Fund, Inc.
In our opinion, the accompanying statement of assets and liabilities, including the portfolio of investments, and the related statements of operations and of changes in net assets and the financial highlights present fairly, in all material respects, the financial position of T. Rowe Price Value Fund, Inc. (the “Fund”) at December 31, 2011, and the results of its operations, the changes in its net assets and the financial highlights for each of the periods indicated therein, in conformity with accounting principles generally accepted in the United States of America. These financial statements and financial highlights (hereafter referred to as “financial statements”) are the responsibility of the Fund’s management; our responsibility is to express an opinion on these financial statements based on our audits. We conducted our audits of these financial statements in accordance with the standards of the Public Company Accounting Oversight Board (United States). Those standards require that we plan and perform the audit to obtain reasonable assurance about whether the financial statements are free of material misstatement. An audit includes examining, on a test basis, evidence supporting the amounts and disclosures in the financial statements, assessing the accounting principles used and significant estimates made by management, and evaluating the overall financial statement presentation. We believe that our audits, which included confirmation of securities at December 31, 2011 by correspondence with the custodian and brokers, and confirmation of the underlying funds by correspondence with the transfer agent, provide a reasonable basis for our opinion.
PricewaterhouseCoopers LLP
Baltimore, Maryland
February 17, 2012
| Tax Information (Unaudited) for the Tax Year Ended 12/31/11 |
We are providing this information as required by the Internal Revenue Code. The amounts shown may differ from those elsewhere in this report because of differences between tax and financial reporting requirements.
For taxable non-corporate shareholders, $180,077,000 of the fund’s income represents qualified dividend income subject to the 15% rate category.
For corporate shareholders, $180,077,000 of the fund’s income qualifies for the dividends-received deduction.
| Information on Proxy Voting Policies, Procedures, and Records |
A description of the policies and procedures used by T. Rowe Price funds and portfolios to determine how to vote proxies relating to portfolio securities is available in each fund’s Statement of Additional Information, which you may request by calling 1-800-225-5132 or by accessing the SEC’s website, sec.gov. The description of our proxy voting policies and procedures is also available on our website, troweprice.com. To access it, click on the words “Our Company” at the top of our corporate homepage. Then, when the next page appears, click on the words “Proxy Voting Policies” on the left side of the page.
Each fund’s most recent annual proxy voting record is available on our website and through the SEC’s website. To access it through our website, follow the directions above, then click on the words “Proxy Voting Records” on the right side of the Proxy Voting Policies page.
| How to Obtain Quarterly Portfolio Holdings |
The fund files a complete schedule of portfolio holdings with the Securities and Exchange Commission for the first and third quarters of each fiscal year on Form N-Q. The fund’s Form N-Q is available electronically on the SEC’s website (sec.gov); hard copies may be reviewed and copied at the SEC’s Public Reference Room, 450 Fifth St. N.W., Washington, DC 20549. For more information on the Public Reference Room, call 1-800-SEC-0330.
| About the Fund’s Directors and Officers |
Your fund is overseen by a Board of Directors (Board) that meets regularly to review a wide variety of matters affecting the fund, including performance, investment programs, compliance matters, advisory fees and expenses, service providers, and other business affairs. The Board elects the fund’s officers, who are listed in the final table. At least 75% of the Board’s members are independent of T. Rowe Price Associates, Inc. (T. Rowe Price), and its affiliates; “inside” or “interested” directors are employees or officers of T. Rowe Price. The business address of each director and officer is 100 East Pratt Street, Baltimore, Maryland 21202. The Statement of Additional Information includes additional information about the fund directors and is available without charge by calling a T. Rowe Price representative at 1-800-638-5660.
| Independent Directors | | |
| |
| Name | | |
| (Year of Birth) | | Principal Occupation(s) and Directorships of Public Companies and |
| Year Elected* | | Other Investment Companies During the Past Five Years |
| | | |
| William R. Brody, M.D., Ph.D. | | President and Trustee, Salk Institute for Biological Studies (2009 |
| (1944) | | to present); Director, Novartis, Inc. (2009 to present); Director, IBM |
| 2009 | | (2007 to present); President and Trustee, Johns Hopkins University |
| | (1996 to 2009); Chairman of Executive Committee and Trustee, |
| | Johns Hopkins Health System (1996 to 2009) |
| | | |
| Jeremiah E. Casey | | Retired |
| (1940) | | |
| 2005 | | |
| | | |
| Anthony W. Deering | | Chairman, Exeter Capital, LLC, a private investment firm (2004 |
| (1945) | | to present); Director, Under Armour (2008 to present); Director, |
| 2001 | | Vornado Real Estate Investment Trust (2004 to present); Director, |
| | Mercantile Bankshares (2002 to 2007); Director and Member of the |
| | Advisory Board, Deutsche Bank North America (2004 to present) |
| | | |
| Donald W. Dick, Jr. | | Principal, EuroCapital Partners, LLC, an acquisition and management |
| (1943) | | advisory firm (1995 to present) |
| 1994 | | |
| | | |
| Karen N. Horn | | Senior Managing Director, Brock Capital Group, an advisory and |
| (1943) | | investment banking firm (2004 to present); Director, Eli Lilly and |
| 2003 | | Company (1987 to present); Director, Simon Property Group |
| | (2004 to present); Director, Norfolk Southern (2008 to present); |
| | | Director, Fannie Mae (2006 to 2008) |
| | |
| Theo C. Rodgers | | President, A&R Development Corporation (1977 to present) |
| (1941) | | |
| 2005 | | |
| | | |
| John G. Schreiber | | Owner/President, Centaur Capital Partners, Inc., a real estate |
| (1946) | | investment company (1991 to present); Cofounder and Partner, |
| 2001 | | Blackstone Real Estate Advisors, L.P. (1992 to present); Director, |
| | General Growth Properties, Inc. (2010 to present) |
| | | |
| Mark R. Tercek | | President and Chief Executive Officer, The Nature Conservancy |
| (1957) | | (2008 to present); Managing Director, The Goldman Sachs Group, |
| 2009 | | Inc. (1984 to 2008) |
| |
| *Each independent director oversees 130 T. Rowe Price portfolios and serves until retirement, resignation, or election of a successor. |
| |
| Inside Directors | | |
| |
| Name | | |
| (Year of Birth) | | |
| Year Elected* | | |
| [Number of T. Rowe Price | | Principal Occupation(s) and Directorships of Public Companies and |
| Portfolios Overseen] | | Other Investment Companies During the Past Five Years |
| | | |
| Edward C. Bernard | | Director and Vice President, T. Rowe Price; Vice Chairman of the |
| (1956) | | Board, Director, and Vice President, T. Rowe Price Group, Inc.; |
| 2006 | | Chairman of the Board, Director, and President, T. Rowe Price |
| [130] | | Investment Services, Inc.; Chairman of the Board and Director, |
| | T. Rowe Price Retirement Plan Services, Inc., T. Rowe Price Savings |
| | Bank, and T. Rowe Price Services, Inc.; Chairman of the Board, Chief |
| | Executive Officer, and Director, T. Rowe Price International; Chief |
| | Executive Officer, Chairman of the Board, Director, and President, |
| | T. Rowe Price Trust Company; Chairman of the Board, all funds |
| | | |
| Brian C. Rogers, CFA, CIC | | Chief Investment Officer, Director, and Vice President, T. Rowe Price; |
| (1955) | | Chairman of the Board, Chief Investment Officer, Director, and Vice |
| 2006 | | President, T. Rowe Price Group, Inc.; Vice President, T. Rowe Price |
| [74] | | Trust Company |
| |
| *Each inside director serves until retirement, resignation, or election of a successor. |
| Officers | | |
| |
| Name (Year of Birth) | | |
| Position Held With Value Fund | | Principal Occupation(s) |
| | | |
| Peter J. Bates, CFA (1974) | | Vice President, T. Rowe Price and T. Rowe Price |
| Vice President | | Group, Inc. |
| | | |
| Ryan N. Burgess, CFA (1974) | | Vice President, T. Rowe Price and T. Rowe Price |
| Vice President | | Group, Inc. |
| | | |
| Ira W. Carnahan, CFA (1963) | | Vice President, T. Rowe Price and T. Rowe Price |
| Vice President | | Group, Inc. |
| | | |
| Andrew S. Davis (1978) | | Employee, T. Rowe Price; Intern, Franklin |
| Vice President | | Templeton Investments (to 2009); Manager, |
| | Deloitte Financial Advisory Services (to 2008) |
| | | |
| Roger L. Fiery III, CPA (1959) | | Vice President, Price Hong Kong, Price |
| Vice President | | Singapore, T. Rowe Price, T. Rowe Price Group, |
| | Inc., T. Rowe Price International, and T. Rowe |
| | Price Trust Company |
| | | |
| Mark S. Finn, CFA, CPA (1963) | | Vice President, T. Rowe Price and T. Rowe Price |
| President | | Group, Inc. |
| | | |
| John R. Gilner (1961) | | Chief Compliance Officer and Vice President, |
| Chief Compliance Officer | | T. Rowe Price; Vice President, T. Rowe Price |
| | Group, Inc., and T. Rowe Price Investment |
| | Services, Inc. |
| | | |
| David R. Giroux, CFA (1975) | | Vice President, T. Rowe Price, T. Rowe Price |
| Vice President | | Group, Inc., and T. Rowe Price Trust Company |
| | | |
| Gregory S. Golczewski (1966) | | Vice President, T. Rowe Price and T. Rowe Price |
| Vice President | | Trust Company |
| | | |
| Gregory K. Hinkle, CPA (1958) | | Vice President, T. Rowe Price, T. Rowe Price |
| Treasurer | | Group, Inc., and T. Rowe Price Trust Company; |
| | formerly Partner, PricewaterhouseCoopers LLP |
| | (to 2007) |
| | | |
| John D. Linehan, CFA (1965) | | Vice President, T. Rowe Price, T. Rowe Price |
| Vice President | | Group, Inc., and T. Rowe Price Trust Company |
| | | |
| Patricia B. Lippert (1953) | | Assistant Vice President, T. Rowe Price and |
| Secretary | | T. Rowe Price Investment Services, Inc. |
| | | |
| Heather K. McPherson, CPA (1967) | | Vice President, T. Rowe Price and T. Rowe Price |
| Vice President | | Group, Inc. |
| | | |
| David Oestreicher (1967) | | Director and Vice President, T. Rowe Price |
| Vice President | | Investment Services, Inc., T. Rowe Price |
| | Retirement Plan Services, Inc., T. Rowe |
| | Price Services, Inc., and T. Rowe Price Trust |
| | Company; Vice President, Price Hong Kong, |
| | Price Singapore, T. Rowe Price, T. Rowe Price |
| | Group, Inc., and T. Rowe Price International |
| | | |
| Robert T. Quinn, Jr. (1972) | | Vice President, T. Rowe Price and T. Rowe Price |
| Vice President | | Group, Inc. |
| | | |
| Deborah D. Seidel (1962) | | Vice President, T. Rowe Price, T. Rowe Price |
| Vice President | | Group, Inc., and T. Rowe Price Investment |
| | Services, Inc.; Assistant Treasurer and Vice |
| | President, T. Rowe Price Services, Inc. |
| | | |
| Joshua K. Spencer, CFA (1973) | | Vice President, T. Rowe Price and T. Rowe Price |
| Vice President | | Group, Inc. |
| | | |
| Walter P. Stuart III, CFA (1960) | | Vice President, T. Rowe Price and T. Rowe Price |
| Vice President | | Group, Inc. |
| | | |
| Eric L. Veiel, CFA (1972) | | Vice President, T. Rowe Price and T. Rowe Price |
| Vice President | | Group, Inc. |
| | | |
| Julie L. Waples (1970) | | Vice President, T. Rowe Price |
| Vice President | | |
| | | |
| Tamara P. Wiggs (1979) | | Vice President, T. Rowe Price and T. Rowe |
| Vice President | | Price Group, Inc.; formerly Vice President, |
| | Institutional Equity Trading, Merrill Lynch & Co., |
| | Inc. (to 2007) |
| |
| Unless otherwise noted, officers have been employees of T. Rowe Price or T. Rowe Price International for at least 5 years. |
Item 2. Code of Ethics.
The registrant has adopted a code of ethics, as defined in Item 2 of Form N-CSR, applicable to its principal executive officer, principal financial officer, principal accounting officer or controller, or persons performing similar functions. A copy of this code of ethics is filed as an exhibit to this Form N-CSR. No substantive amendments were approved or waivers were granted to this code of ethics during the period covered by this report.
Item 3. Audit Committee Financial Expert.
The registrant’s Board of Directors/Trustees has determined that Mr. Anthony W. Deering qualifies as an audit committee financial expert, as defined in Item 3 of Form N-CSR. Mr. Deering is considered independent for purposes of Item 3 of Form N-CSR.
Item 4. Principal Accountant Fees and Services.
(a) – (d) Aggregate fees billed to the registrant for the last two fiscal years for professional services rendered by the registrant’s principal accountant were as follows:

Audit fees include amounts related to the audit of the registrant’s annual financial statements and services normally provided by the accountant in connection with statutory and regulatory filings. Audit-related fees include amounts reasonably related to the performance of the audit of the registrant’s financial statements and specifically include the issuance of a report on internal controls and, if applicable, agreed-upon procedures related to fund acquisitions. Tax fees include amounts related to services for tax compliance, tax planning, and tax advice. The nature of these services specifically includes the review of distribution calculations and the preparation of Federal, state, and excise tax returns. All other fees include the registrant’s pro-rata share of amounts for agreed-upon procedures in conjunction with service contract approvals by the registrant’s Board of Directors/Trustees.
(e)(1) The registrant’s audit committee has adopted a policy whereby audit and non-audit services performed by the registrant’s principal accountant for the registrant, its investment adviser, and any entity controlling, controlled by, or under common control with the investment adviser that provides ongoing services to the registrant require pre-approval in advance at regularly scheduled audit committee meetings. If such a service is required between regularly scheduled audit committee meetings, pre-approval may be authorized by one audit committee member with ratification at the next scheduled audit committee meeting. Waiver of pre-approval for audit or non-audit services requiring fees of a de minimis amount is not permitted.
(2) No services included in (b) – (d) above were approved pursuant to paragraph (c)(7)(i)(C) of Rule 2-01 of Regulation S-X.
(f) Less than 50 percent of the hours expended on the principal accountant’s engagement to audit the registrant’s financial statements for the most recent fiscal year were attributed to work performed by persons other than the principal accountant’s full-time, permanent employees.
(g) The aggregate fees billed for the most recent fiscal year and the preceding fiscal year by the registrant’s principal accountant for non-audit services rendered to the registrant, its investment adviser, and any entity controlling, controlled by, or under common control with the investment adviser that provides ongoing services to the registrant were $1,764,000 and $1,417,000, respectively.
(h) All non-audit services rendered in (g) above were pre-approved by the registrant’s audit committee. Accordingly, these services were considered by the registrant’s audit committee in maintaining the principal accountant’s independence.
Item 5. Audit Committee of Listed Registrants.
Not applicable.
Item 6. Investments.
(a) Not applicable. The complete schedule of investments is included in Item 1 of this Form N-CSR.
(b) Not applicable.
Item 7. Disclosure of Proxy Voting Policies and Procedures for Closed-End Management Investment Companies.
Not applicable.
Item 8. Portfolio Managers of Closed-End Management Investment Companies.
Not applicable.
Item 9. Purchases of Equity Securities by Closed-End Management Investment Company and Affiliated Purchasers.
Not applicable.
Item 10. Submission of Matters to a Vote of Security Holders.
Not applicable.
Item 11. Controls and Procedures.
(a) The registrant’s principal executive officer and principal financial officer have evaluated the registrant’s disclosure controls and procedures within 90 days of this filing and have concluded that the registrant’s disclosure controls and procedures were effective, as of that date, in ensuring that information required to be disclosed by the registrant in this Form N-CSR was recorded, processed, summarized, and reported timely.
(b) The registrant’s principal executive officer and principal financial officer are aware of no change in the registrant’s internal control over financial reporting that occurred during the registrant’s second fiscal quarter covered by this report that has materially affected, or is reasonably likely to materially affect, the registrant’s internal control over financial reporting.
Item 12. Exhibits.
(a)(1) The registrant’s code of ethics pursuant to Item 2 of Form N-CSR is attached.
(2) Separate certifications by the registrant's principal executive officer and principal financial officer, pursuant to Section 302 of the Sarbanes-Oxley Act of 2002 and required by Rule 30a-2(a) under the Investment Company Act of 1940, are attached.
(3) Written solicitation to repurchase securities issued by closed-end companies: not applicable.
(b) A certification by the registrant's principal executive officer and principal financial officer, pursuant to Section 906 of the Sarbanes-Oxley Act of 2002 and required by Rule 30a-2(b) under the Investment Company Act of 1940, is attached.
SIGNATURES
Pursuant to the requirements of the Securities Exchange Act of 1934 and the Investment Company Act of 1940, the registrant has duly caused this report to be signed on its behalf by the undersigned, thereunto duly authorized.
T. Rowe Price Value Fund, Inc.
| | By | /s/ Edward C. Bernard |
| | Edward C. Bernard |
| | Principal Executive Officer |
| |
| Date February 17, 2012 | | |
Pursuant to the requirements of the Securities Exchange Act of 1934 and the Investment Company Act of 1940, this report has been signed below by the following persons on behalf of the registrant and in the capacities and on the dates indicated.
| | By | /s/ Edward C. Bernard |
| | Edward C. Bernard |
| | Principal Executive Officer |
| |
| Date February 17, 2012 | | |
| |
| |
| By | /s/ Gregory K. Hinkle |
| | Gregory K. Hinkle |
| | Principal Financial Officer |
| |
| Date February 17, 2012 | | |