(Exact name of registrant as specified in charter)
100 East Pratt Street, Baltimore, MD 21202
(Address of principal executive offices)
David Oestreicher
100 East Pratt Street, Baltimore, MD 21202
(Name and address of agent for service)
Registrant’s telephone number, including area code: (410) 345-2000
Date of fiscal year end: December 31
Date of reporting period: December 31, 2008
Item 1: Report to Shareholders
Value Fund
December 31, 2008
The views and opinions in this report were current as of December 31, 2008. They are not guarantees of performance or investment results and should not be taken as investment advice. Investment decisions reflect a variety of factors, and the managers reserve the right to change their views about individual stocks, sectors, and the markets at any time. As a result, the views expressed should not be relied upon as a forecast of the fund’s future investment intent. The report is certified under the Sarbanes-Oxley Act, which requires mutual funds and other public companies to affirm that, to the best of their knowledge, the information in their financial reports is fairly and accurately stated in all material respects.
REPORTS ON THE WEB
Sign up for our E-mail Program, and you can begin to receive updated fund reports and prospectuses online rather than through the mail. Log in to your account at troweprice.com for more information.
Manager’s Letter
Fellow Shareholders
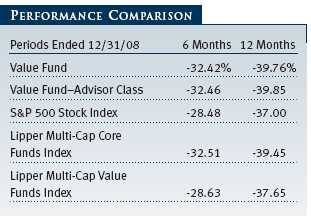
The Longest Year. At the very least, 2008 felt like the longest year from an investment perspective as the market suffered its worst percentage loss in three-quarters of a century. Mounting concerns about a rapidly slowing global economy and a fragile financial system helped propel the market to a 37% loss. The year saw a steep fourth-quarter decline in gross domestic product, an increase in unemployment, a dramatic fall in housing prices, and several companies in the financial sector either fail or be rescued by the government. The crescendo of bad news was overwhelming; in all, it was a horrible year for the economy and for the markets. Your fund did not escape the carnage and was down 39.76% for the year.
HIGHLIGHTS
• The rapidly slowing economy and fragile financial system caused the stock market to suffer its worst percentage loss in three-quarters of a century.
• The fund endured substantial losses in the past six months and year as even defensive sectors felt the pain of the market downturn.
• We have gradually increased the fund’s exposure to economically sensitive companies while focusing on firms most likely to survive the downturn and emerge in a stronger competitive position.
• The “one-two punch” of monetary and fiscal stimulus may lead to an economic recovery sooner than most pundits believe.
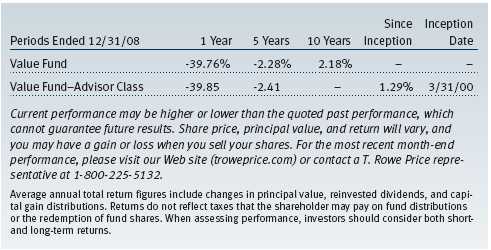
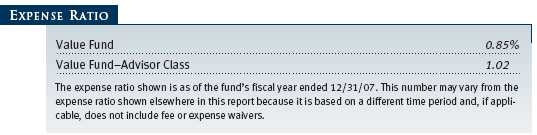
We are not pleased with our performance in the last year on either a relative or an absolute basis. Almost all of our underperformance occurred in the last four months of the year as the market came under significant selling pressure. Against our benchmarks, the last year was our poorest in the last six as we failed to outperform both the S&P 500 and the Lipper Multi-Cap Value Funds Index. As we have written to you previously, we believe that the Lipper Multi-Cap Value Funds Index is the most appropriate benchmark for our fund even though Lipper classifies our fund in its Multi-Cap Core Funds Index. (In actuality, the Value Fund performed better against the Lipper Multi-Cap Core Funds Index than the Lipper Multi-Cap Value Funds Index). Even with one of the worst years that the market has seen, your fund has still managed to return 8.44% on an annualized basis to investors since its inception in September 1994. (Annualized returns for the fund were -39.76%, -2.28%, and 2.18% for 1-, 5-, and 10-year periods ended December 31, 2008, respectively. Current performance may be higher or lower than the quoted past performance, which cannot guarantee future results. Share price, principal value, and return will vary, and you may have a gain or loss when you sell your shares. To obtain the most recent month-end performance, please call 1-800-225-5132 or go to troweprice.com. The fund's expense ratio was 0.85% as of its fiscal year ended December 31, 2007.)
Our long-term investment style means that from time to time we will be out of sync with short-term movements in the market. While we are disappointed with our investment results of the past year, we feel that your fund is well positioned for the future. Benjamin Graham, one of the deans of value investing, once made the comment that in the short term, the market is a voting mechanism, but in the long term, it is a weighing mechanism. In our minds, the tremendous volatility displayed by the market in the second half of 2008 is consistent with a market that is voting rather than weighing the value of companies. Over time, we believe that the market will be less concerned about the perception of the value of a company and more concerned about the inherent economic value of a company. This change in focus should be beneficial to our fund given our long-term investment horizon and our focus on finding and investing in companies whose current stock price does not fully reflect the actual value of the company.
Please see the Performance Comparison table above for a more detailed quantitative analysis of performance.
YEAR-END DISTRIBUTION
On December 11, 2008, your Board of Directors declared an annual income dividend of $0.26 and a long-term capital gain of $0.16 per share ($0.23 and $0.16 for the Advisor Class, respectively). This distribution was paid on December 15 to shareholders of record on December 11, 2008, and you should have already received your check or statement reflecting them. Because capital gains may sometimes be reclassified as income, please be sure to rely on the dividend information provided in your 1099-DIV when preparing your taxes.
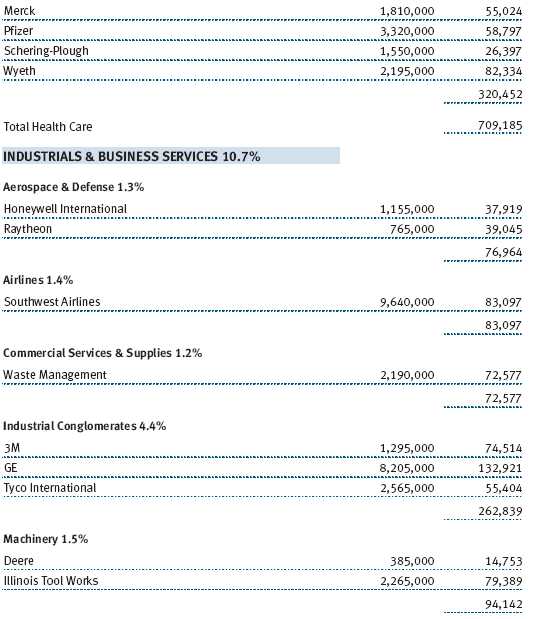
PORTFOLIO REVIEW
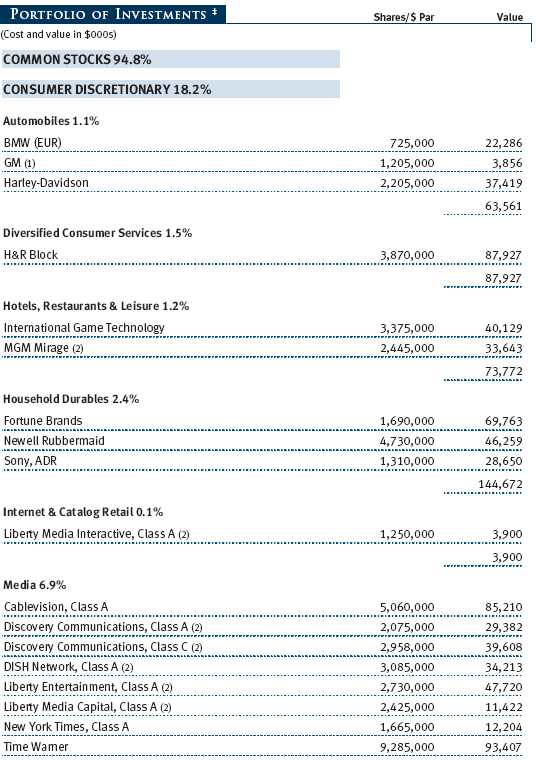
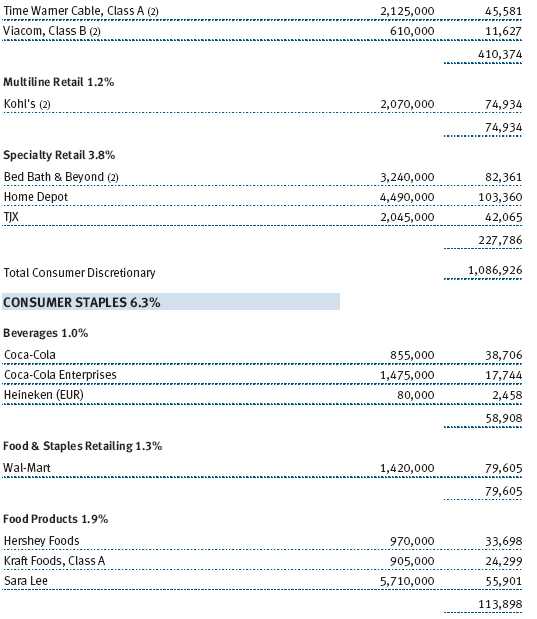
Even in poor markets, there are usually places where an investor can seek shelter. After all, even when the economy sinks into recession, we all need to eat, drink, and have access to health care. In 2008, the recessionary tide was so strong that even traditionally defensive sectors were down considerably. For example, while both the consumer staples and health care sectors held up better than others, they still saw declines of over 15%. Within your fund, there were several holdings that did contribute positively to performance. Within the consumer staples sector, brewer Anheuser-Busch (which was acquired by InBev), discount retailer Wal-Mart, and cereal maker General Mills all aided performance. Several purchases we made in the latter half of the year also helped performance, led by industrial and business services companies Honeywell International and Deere. Waste Management International, a longer-term industrial holding, also helped, though conglomerate General Electric, your portfolio’s largest holding, came under pressure as concerns arose regarding its ability to maintain its dividend in 2009. Biotechnology company Amgen, tax-preparer H&R Block, and steel producer Nucor also contributed positively to performance for the year. (Please refer to the fund’s portfolio of investments for a complete listing of our holdings and the amount each represents in the portfolio.)
The financials sector led the way down in the market; it seemed that the only truly effective investment strategy for financials was not to invest in them at all. The financials sector took the brunt of the dramatically slowing economy as it was the sector most undercapitalized and the most dependent on a fully functioning capital market. Your fund’s performance was hurt by positions in Citigroup, Bank of America, AIG, and Merrill Lynch. XL Capital detracted as well. However, we sold the company when the unprecedented turmoil in the credit markets wiped out the company’s excess capital position, dramatically changing its risk/reward profile.
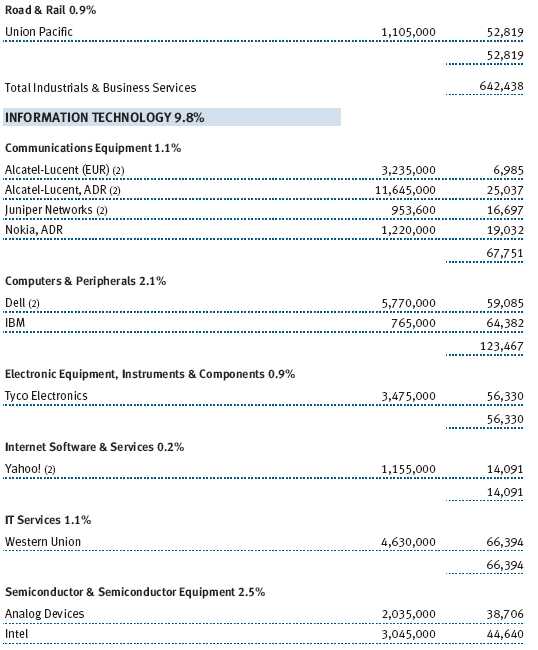
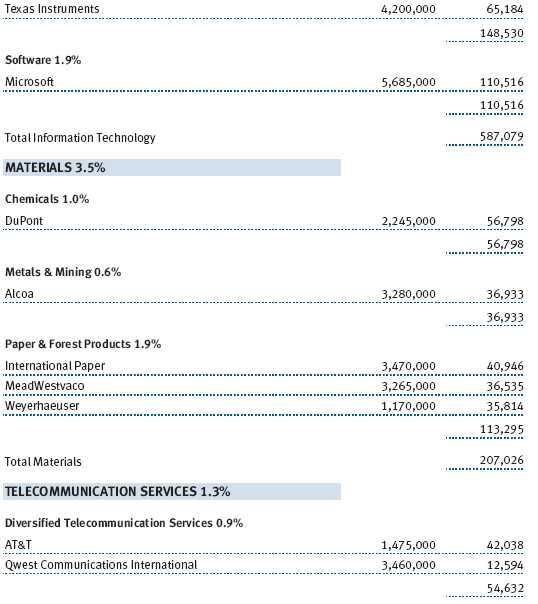
Wireless telecommunications company Sprint Nextel also detracted from performance, with investors preferring higher-quality telecommunications names rather than one in the midst of a turnaround. International Game Technology struggled along with other companies associated with the gaming industry, driven by slowing demand for their slot machines as consumers stopped traveling to Las Vegas and other gambling hubs. Finally, the weakened economy spread to the information technology sector later in the year, hurting Microsoft, Alcatel-Lucent, and Dell.
PORTFOLIO STRATEGY AND CHANGES
To place our portfolio changes in perspective, we believe it is important to review the investment strategy we use in managing your fund. Our focus is to invest in companies with both attractive relative valuations and favorable long-term fundamental characteristics. We view ourselves as investors, not speculators, and we have a longer-term time horizon when we make our investment decisions. Indeed, our portfolio turnover has been consistently less than the average of our peers.
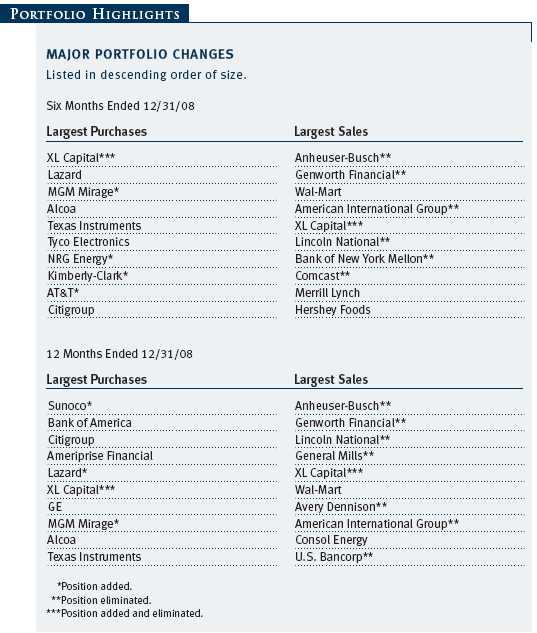
We have written to you several times in the past about our willingness to invest when there is extreme negative sentiment surrounding a company as long as that negative sentiment is accompanied by significant valuation appeal. Often, the most opportune time to buy a stock is when consensus is uniformly negative on the company and the sector. Currently, the market is extremely bearish on companies with significant exposure to the U.S. economy in general. Our strategy over the past year has been to buy uncertainty and to sell certainty in a balanced and gradual fashion. We increased our positions in economically cyclical companies, such as Texas Instruments, General Electric, and Fortune Brands, and we sold down positions in companies with less economic sensitivity (and more certainty), including General Mills, Coca-Cola, and Anheuser-Busch, all of which had seen significant price improvement over the past year. The primary basis for these changes was valuation; most of the purchases mentioned above were in companies trading at decade lows on a variety of relative valuation metrics, whereas most sales were in companies trading at decade highs on the same metrics.
We have also tried to identify companies that we believe will be “winners” within their industries regardless of the path that the economy takes from here. For the most part, we are trying to find companies that have strong balance sheets and compete in an industry where their rivals have been weakened as a result of the economic downturn. An example of this strategy is our fund’s investment in Southwest Airlines. We are drawn to Southwest because of its balance sheet strength and its low-cost position within the airline industry and because it is competing with other airline companies that have been financially crippled by the current economic slowdown. If the economy improves from here, Southwest will benefit from increased demand and from other airlines having been forced to reduce their domestic air capacity. In a slowing economy, Southwest’s low-cost position and balance sheet strength will differentiate it from all of its peers and should lead to a very favorable competitive dynamic for the company. At some point, demand for air travel will increase, and when it does, Southwest will be uniquely positioned to take advantage of the demand shift.
Our investment in Southwest highlights another aspect of our approach. Southwest should perform better than its peers in an economic downturn but will probably lag other airlines in an improving economy. In general, we are willing to give up some upside return potential in order to protect against large downside risk. This trade-off is embedded in every portfolio decision that we make. Our focus has been and remains on finding companies where there is a positive asymmetry between the return and the risk inherent in the investment. In an environment as unpredictable as the current one, companies with balance sheet strength and the ability to survive a variety of potential outcomes, both positive and negative, are very attractive investment candidates.
OUTLOOK
Several years ago, we started our correspondence to you with the words “expect the unexpected.” Never have these words rung more true than they do today. In fact, the only thing that we can state with certainty about 2009 is that we will be surprised by events in the market. For over a year, we have lived in a world where unexpected events have occurred regularly. Indeed, 2008 was truly the longest year for a generation of market participants.
With the markets having entered uncharted waters, the task of market forecasting has become extraordinarily difficult. At the very least, we believe that 2009 will be a better year than 2008. In fact, history would suggest that 2009 should be a good one for investors as the market has typically rebounded sharply after seeing such poor performance over a one-year period. Also, the middle of recessions historically have been good times to invest in equities as most of the bad economic news has been discounted by the markets. However, it seems highly likely that in the short term, the economy will continue to weaken; the key question for investors is how much deterioration is currently factored into stock prices. While it is difficult to answer that question, we do take comfort in the amount of negative sentiment that surrounds the market.
Longer term, we remain steadfast in our belief that the U.S. economy will prove to be more resilient than many pundits believe. Over the course of the next year, we will see the Federal Reserve keep interest rates at extraordinarily low levels, while the Obama administration will move aggressively to fiscally stimulate our economy. We believe that at some point this “one-two punch” should be effective in arresting the deterioration of the economy and will help push equity prices higher.
In this type of market, we believe in the old saying, “Hope for the best; prepare for the worst.” While we remain cautiously optimistic about the stock market’s prospects for the year, our primary discipline is to follow the course we have taken since the fund’s inception more than 10 years ago: selecting stocks with valuation appeal, sound fundamentals, and reasonable balance sheet integrity. As always, we will focus our efforts on making sound investment decisions in our ongoing attempt to enhance shareholder value.
Respectfully submitted,
John D. Linehan President of the fund and chairman of its Investment Advisory Committee
January 21, 2009
The committee chairman has day-to-day responsibility for managing the portfolio and works with committee members in developing and executing the fund’s investment program.
RISKS OF INVESTING IN THE FUND
Value investors seek to invest in companies whose stock prices are low in relation to their real worth or future prospects. By identifying companies whose stocks are currently out of favor or misunderstood, value investors hope to realize significant appreciation as other investors recognize the stock’s intrinsic value and the price rises accordingly. The value approach carries the risk that the market will not recognize a security’s intrinsic value for a long time or that a stock judged to be undervalued may actually be appropriately priced.
GLOSSARY
Lipper index: An index of mutual fund performance returns for specified periods in defined categories as tracked by Lipper Inc.
S&P 500 Stock Index: A market cap-weighted index of 500 widely held stocks often used as a proxy for the overall stock market. Performance is reported on a total return basis.
Performance and Expenses
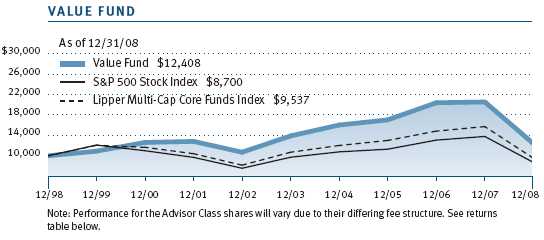
GROWTH OF $10,000
This chart shows the value of a hypothetical $10,000 investment in the fund over the past 10 fiscal year periods or since inception (for funds lacking 10-year records). The result is compared with benchmarks, which may include a broad-based market index and a peer group average or index. Market indexes do not include expenses, which are deducted from fund returns as well as mutual fund averages and indexes.
AVERAGE ANNUAL COMPOUND TOTAL RETURN
This table shows how the fund would have performed each year if its actual (or cumulative) returns had been earned at a constant rate.
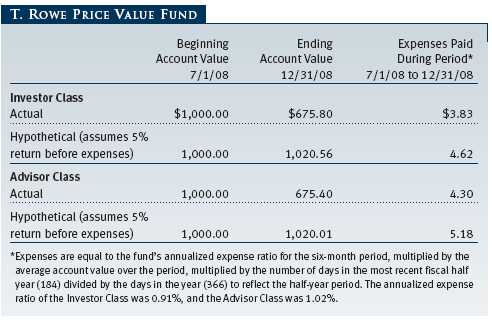
FUND EXPENSE EXAMPLE
As a mutual fund shareholder, you may incur two types of costs: (1) transaction costs, such as redemption fees or sales loads, and (2) ongoing costs, including management fees, distribution and service (12b-1) fees, and other fund expenses. The following example is intended to help you understand your ongoing costs (in dollars) of investing in the fund and to compare these costs with the ongoing costs of investing in other mutual funds. The example is based on an investment of $1,000 invested at the beginning of the most recent six-month period and held for the entire period.
Please note that the fund has two share classes: The original share class (“investor class”) charges no distribution and service (12b-1) fee, and the Advisor Class shares are offered only through unaffiliated brokers and other financial intermediaries and charge a 0.25% 12b-1 fee. Each share class is presented separately in the table.
Actual Expenses The first line of the following table (“Actual”) provides information about actual account values and expenses based on the fund’s actual returns. You may use the information in this line, together with your account balance, to estimate the expenses that you paid over the period. Simply divide your account value by $1,000 (for example, an $8,600 account value divided by $1,000 = 8.6), then multiply the result by the number in the first line under the heading “Expenses Paid During Period” to estimate the expenses you paid on your account during this period.
Hypothetical Example for Comparison Purposes The information on the second line of the table (“Hypothetical”) is based on hypothetical account values and expenses derived from the fund’s actual expense ratio and an assumed 5% per year rate of return before expenses (not the fund’s actual return). You may compare the ongoing costs of investing in the fund with other funds by contrasting this 5% hypothetical example and the 5% hypothetical examples that appear in the shareholder reports of the other funds. The hypothetical account values and expenses may not be used to estimate the actual ending account balance or expenses you paid for the period.
Note: T. Rowe Price charges an annual small-account maintenance fee of $10, generally for accounts with less than $2,000 ($500 for UGMA/UTMA). The fee is waived for any investor whose T. Rowe Price mutual fund accounts total $25,000 or more, accounts employing automatic investing, and IRAs and other retirement plan accounts that utilize a prototype plan sponsored by T. Rowe Price (although a separate custodial or administrative fee may apply to such accounts). This fee is not included in the accompanying table. If you are subject to the fee, keep it in mind when you are estimating the ongoing expenses of investing in the fund and when comparing the expenses of this fund with other funds.
You should also be aware that the expenses shown in the table highlight only your ongoing costs and do not reflect any transaction costs, such as redemption fees or sales loads. Therefore, the second line of the table is useful in comparing ongoing costs only and will not help you determine the relative total costs of owning different funds. To the extent a fund charges transaction costs, however, the total cost of owning that fund is higher.
The accompanying notes are an integral part of these financial statements.
The accompanying notes are an integral part of these financial statements.
The accompanying notes are an integral part of these financial statements.
The accompanying notes are an integral part of these financial statements.
The accompanying notes are an integral part of these financial statements.
The accompanying notes are an integral part of these financial statements.
NOTES TO FINANCIAL STATEMENTS
T. Rowe Price Value Fund, Inc. (the fund), is registered under the Investment Company Act of 1940 (the 1940 Act) as a diversified, open-end management investment company. The fund seeks to provide long-term capital appreciation by investing in common stocks believed to be undervalued. Income is a secondary objective. The fund has two classes of shares: the Value Fund original share class, referred to in this report as the Investor Class, offered since September 30, 1994, and Value Fund—Advisor Class (Advisor Class), offered since March 31, 2000. Advisor Class shares are sold only through unaffiliated brokers and other unaffiliated financial intermediaries that are compensated by the class for distribution, shareholder servicing, and/or certain administrative services under a Board-approved Rule 12b-1 plan. Each class has exclusive voting rights on matters related solely to that class, separate voting rights on matters that relate to both classes, and, in all other respects, the same rights and obligations as the other class.
NOTE 1 - SIGNIFICANT ACCOUNTING POLICIES
Basis of Preparation The accompanying financial statements were prepared in accordance with accounting principles generally accepted in the United States of America, which require the use of estimates made by fund management. Fund management believes that estimates and security valuations are appropriate; however, actual results may differ from those estimates, and the security valuations reflected in the financial statements may differ from the value the fund ultimately realizes upon sale of the securities.
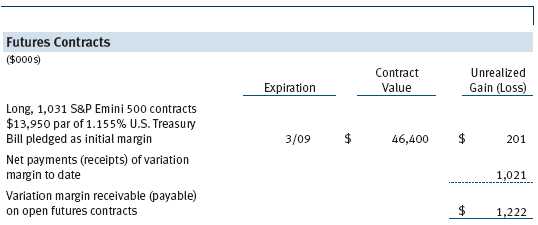
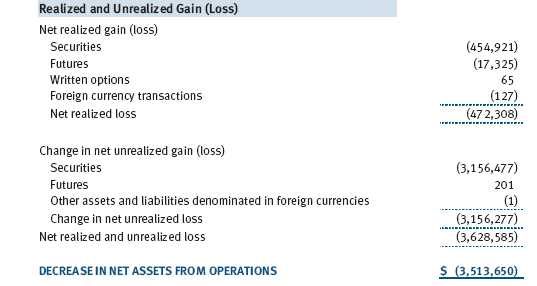
Investment Transactions, Investment Income, and Distributions Income and expenses are recorded on the accrual basis. Premiums and discounts on debt securities are amortized for financial reporting purposes. Dividends received from mutual fund investments are reflected as dividend income; capital gain distributions are reflected as realized gain/loss. Dividend income and capital gain distributions are recorded on the ex-dividend date. Income tax-related interest and penalties, if incurred, would be recorded as income tax expense. Investment transactions are accounted for on the trade date. Realized gains and losses are reported on the identified cost basis. Payments (“variation margin”) made or received to settle the daily fluctuations in the value of futures contracts are recorded as unrealized gains or losses until the contracts are closed. Unsettled variation margin on futures contracts is reflected as other assets or liabilities, and unrealized gains and losses on futures contracts are reflected as the change in net unrealized gain or loss in the accompanying financial statements. Distributions to shareholders are recorded on the ex-dividend date. Income distributions are declared and paid by each class on an annual basis. Capital gain distributions, if any, are declared and paid by the fund, typically on an annual basis.
Currency Translation Assets, including investments, and liabilities denominated in foreign currencies are translated into U.S. dollar values each day at the prevailing exchange rate, using the mean of the bid and asked prices of such currencies against U.S. dollars as quoted by a major bank. Purchases and sales of securities, income, and expenses are translated into U.S. dollars at the prevailing exchange rate on the date of the transaction. The effect of changes in foreign currency exchange rates on realized and unrealized security gains and losses is reflected as a component of security gains and losses.
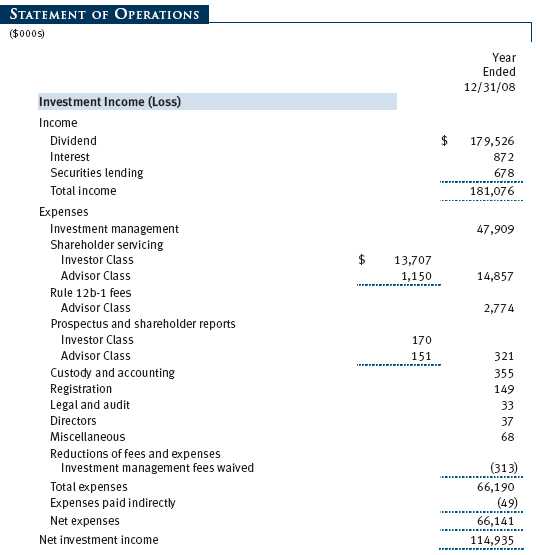
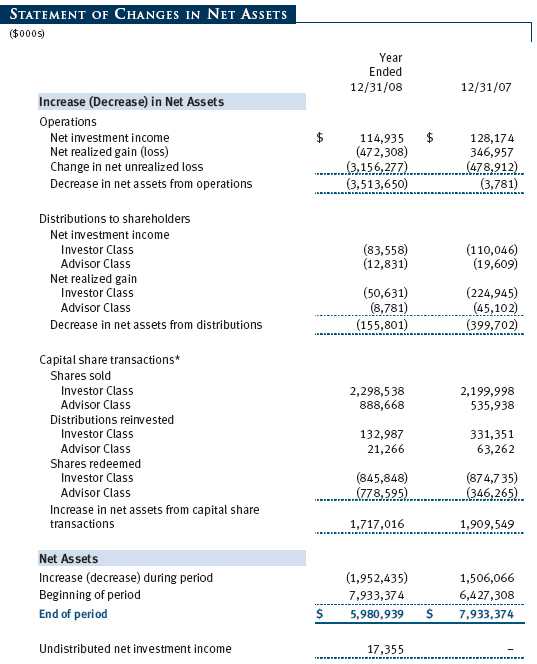
Class Accounting The Advisor Class pays distribution, shareholder servicing, and/or certain administrative expenses in the form of Rule 12b-1 fees, in an amount not exceeding 0.25% of the class’s average daily net assets. Shareholder servicing, prospectus, and shareholder report expenses incurred by each class are charged directly to the class to which they relate. Expenses common to both classes, investment income, and realized and unrealized gains and losses are allocated to the classes based upon the relative daily net assets of each class.
Rebates and Credits Subject to best execution, the fund may direct certain security trades to brokers who have agreed to rebate a portion of the related brokerage commission to the fund in cash. Commission rebates are reflected as realized gain on securities in the accompanying financial statements and totaled $129,000 for the year ended December 31, 2008. Additionally, the fund earns credits on temporarily uninvested cash balances at the custodian that reduce the fund’s custody charges. Custody expense in the accompanying financial statements is presented before reduction for credits, which are reflected as expenses paid indirectly.
In-Kind Redemptions In accordance with guidelines described in the fund’s prospectus, the fund may distribute portfolio securities rather than cash as payment for a redemption of fund shares (in-kind redemption). For financial reporting purposes, the fund recognizes a gain on in-kind redemptions to the extent the value of the distributed securities on the date of redemption exceeds the cost of those securities. Gains and losses realized on in-kind redemptions are not recognized for tax purposes and are reclassified from undistributed realized gain (loss) to paid-in capital. During the year ended December 31, 2008, the fund realized $70,107,000 of net gain on $214,713,000 of in-kind redemptions.
New Accounting Pronouncements On January 1, 2008, the fund adopted Statement of Financial Accounting Standards No. 157 (FAS 157), Fair Value Measurements. FAS 157 defines fair value, establishes the framework for measuring fair value, and expands the disclosures of fair value measurements in the financial statements. Adoption of FAS 157 did not have a material impact on the fund’s net assets or results of operations.
In March 2008, the Financial Accounting Standards Board issued Statement of Financial Accounting Standards No. 161 (FAS 161), Disclosures about Derivative Instruments and Hedging Activities, which is effective for fiscal years and interim periods beginning after November 15, 2008. FAS 161 requires enhanced disclosures about derivative and hedging activities, including how such activities are accounted for and their effect on financial position, performance and cash flows. Management is currently evaluating the impact the adoption of FAS 161 will have on the fund’s financial statements and related disclosures.
NOTE 2 - VALUATION
The fund’s investments are reported at fair value as defined under FAS 157. The fund values its investments and computes its net asset value per share at the close of the New York Stock Exchange (NYSE), normally 4 p.m. ET, each day that the NYSE is open for business.
Valuation Methods Equity securities listed or regularly traded on a securities exchange or in the over-the-counter (OTC) market are valued at the last quoted sale price or, for certain markets, the official closing price at the time the valuations are made, except for OTC Bulletin Board securities, which are valued at the mean of the latest bid and asked prices. A security that is listed or traded on more than one exchange is valued at the quotation on the exchange determined to be the primary market for such security. Listed securities not traded on a particular day are valued at the mean of the latest bid and asked prices for domestic securities and the last quoted sale price for international securities.
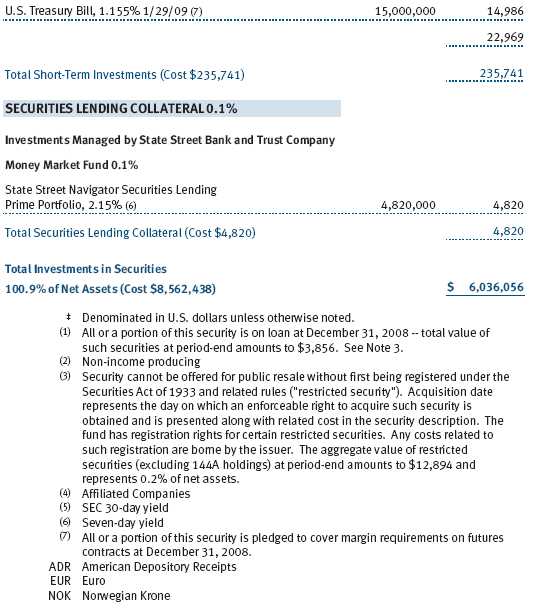
Debt securities are generally traded in the OTC market. Securities with remaining maturities of one year or more at the time of acquisition are valued at prices furnished by dealers who make markets in such securities or by an independent pricing service, which considers the yield or price of bonds of comparable quality, coupon, maturity, and type, as well as prices quoted by dealers who make markets in such securities. Securities with remaining maturities of less than one year at the time of acquisition generally use amortized cost in local currency to approximate fair value. However, if amortized cost is deemed not to reflect fair value or the fund holds a significant amount of such securities with remaining maturities of more than 60 days, the securities are valued at prices furnished by dealers who make markets in such securities or by an independent pricing service.
Investments in mutual funds are valued at the mutual fund’s closing net asset value per share on the day of valuation. Financial futures contracts are valued at closing settlement prices.
Other investments, including restricted securities, and those for which the above valuation procedures are inappropriate or are deemed not to reflect fair value are stated at fair value as determined in good faith by the T. Rowe Price Valuation Committee, established by the fund’s Board of Directors.
For valuation purposes, the last quoted prices of non-U.S. equity securities may be adjusted under the circumstances described below. If the fund determines that developments between the close of a foreign market and the close of the NYSE will, in its judgment, materially affect the value of some or all of its portfolio securities, the fund will adjust the previous closing prices to reflect what it believes to be the fair value of the securities as of the close of the NYSE. In deciding whether it is necessary to adjust closing prices to reflect fair value, the fund reviews a variety of factors, including developments in foreign markets, the performance of U.S. securities markets, and the performance of instruments trading in U.S. markets that represent foreign securities and baskets of foreign securities. A fund may also fair value securities in other situations, such as when a particular foreign market is closed but the fund is open. The fund uses outside pricing services to provide it with closing prices and information to evaluate and/or adjust those prices. The fund cannot predict how often it will use closing prices and how often it will determine it necessary to adjust those prices to reflect fair value. As a means of evaluating its security valuation process, the fund routinely compares closing prices, the next day’s opening prices in the same markets, and adjusted prices.
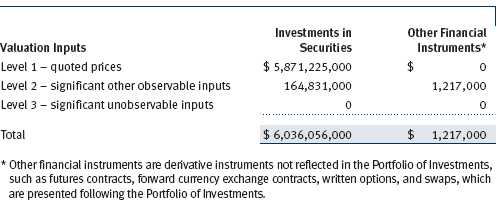
Valuation Inputs Various inputs are used to determine the value of the fund’s investments. These inputs are summarized in the three broad levels listed below:
Level 1 – quoted prices in active markets for identical securities
Level 2 – observable inputs other than Level 1 quoted prices (including, but not limited to, quoted prices for similar securities, interest rates, prepayment speeds, credit risk)
Level 3 – unobservable inputs
Observable inputs are those based on market data obtained from sources independent of the fund, and unobservable inputs reflect the fund’s own assumptions based on the best information available. The input levels are not necessarily an indication of the risk or liquidity associated with investments at that level. For example, non-U.S. equity securities actively traded in foreign markets generally are reflected in Level 2 despite the availability of closing prices, because the fund evaluates and determines whether those closing prices reflect fair value at the close of the NYSE or require adjustment, as described above. The following table summarizes the fund’s investments, based on the inputs used to determine their values on December 31, 2008:
NOTE 3 - INVESTMENT TRANSACTIONS
Consistent with its investment objective, the fund engages in the following practices to manage exposure to certain risks or to enhance performance. The investment objective, policies, program, and risk factors of the fund are described more fully in the fund’s prospectus and Statement of Additional Information.
Restricted Securities The fund may invest in securities that are subject to legal or contractual restrictions on resale. Prompt sale of such securities at an acceptable price may be difficult and may involve substantial delays and additional costs.
Futures Contracts During the year ended December 31, 2008, the fund was a party to futures contracts, which provide for the future sale by one party and purchase by another of a specified amount of a specific financial instrument at an agreed upon price, date, time, and place. Risks arise from possible illiquidity of the futures market and from movements in security values.
Options Call and put options give the holder the right to purchase and sell, respectively, a security at a specified price on a certain date. Risks arise from possible illiquidity of the options market and from movements in security values. Transactions in options written and related premiums received during the year ended December 31, 2008, were as follows:
Securities Lending The fund lends its securities to approved brokers to earn additional income. It receives as collateral cash and U.S. government securities valued at 102% to 105% of the value of the securities on loan. Cash collateral is invested by the fund’s lending agent(s) in accordance with investment guidelines approved by fund management. Although risk is mitigated by the collateral, the fund could experience a delay in recovering its securities and a possible loss of income or value if the borrower fails to return the securities or if collateral investments decline in value. Securities lending revenue recognized by the fund consists of earnings on invested collateral and borrowing fees, net of any rebates to the borrower and compensation to the lending agent. On December 31, 2008, the value of loaned securities was $3,856,000.
Other Purchases and sales of portfolio securities, other than short-term securities, aggregated $3,203,233,000 and $1,425,508,000, respectively, for the year ended December 31, 2008.
NOTE 4 - FEDERAL INCOME TAXES
No provision for federal income taxes is required since the fund intends to continue to qualify as a regulated investment company under Subchapter M of the Internal Revenue Code and distribute to shareholders all of its taxable income and gains. Distributions are determined in accordance with Federal income tax regulations, which differ from generally accepted accounting principles, and, therefore, may differ significantly in amount or character from net investment income and realized gains for financial reporting purposes. Financial reporting records are adjusted for permanent book/tax differences to reflect tax character but are not adjusted for temporary differences.
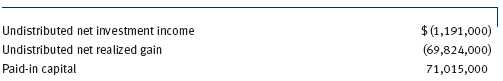
Reclassifications to paid-in capital relate primarily to redemptions in kind. For the year ended December 31, 2008, the following reclassifications, which had no impact on results of operations or net assets, were recorded to reflect tax character:
Distributions during the years ended December 31, 2008 and December 31, 2007 were characterized for tax purposes as follows:
At December 31, 2008, the tax-basis cost of investments and components of net assets were as follows:
The difference between book-basis and tax-basis net unrealized appreciation (depreciation) is attributable to the deferral of losses from wash sales and/or on certain derivative contracts for tax purposes. The fund intends to retain realized gains to the extent of available capital loss carryforwards. As of December 31, 2008, all unused capital loss carryforwards expire in fiscal 2016. Pursuant to federal income tax regulations applicable to investment companies, recognition of capital losses on certain transactions is deferred until the subsequent tax year. Consequently, realized losses reflected in the accompanying financial statements include net capital losses realized between November 1 and the fund’s fiscal year-end that have not been recognized for tax purposes (Post-October loss deferrals).
NOTE 5 - RELATED PARTY TRANSACTIONS
The fund is managed by T. Rowe Price Associates, Inc. (the manager or Price Associates), a wholly owned subsidiary of T. Rowe Price Group, Inc. The investment management agreement between the fund and the manager provides for an annual investment management fee, which is computed daily and paid monthly. The fee consists of an individual fund fee, equal to 0.35% of the fund’s average daily net assets, and a group fee. The group fee rate is calculated based on the combined net assets of certain mutual funds sponsored by Price Associates (the group) applied to a graduated fee schedule, with rates ranging from 0.48% for the first $1 billion of assets to 0.285% for assets in excess of $220 billion. The fund’s group fee is determined by applying the group fee rate to the fund’s average daily net assets. At December 31, 2008, the effective annual group fee rate was 0.31%.
In addition, the fund has entered into service agreements with Price Associates and two wholly owned subsidiaries of Price Associates (collectively, Price). Price Associates computes the daily share prices and provides certain other administrative services to the fund. T. Rowe Price Services, Inc., provides shareholder and administrative services in its capacity as the fund’s transfer and dividend disbursing agent. T. Rowe Price Retirement Plan Services, Inc., provides subaccounting and recordkeeping services for certain retirement accounts invested in the Investor Class. For the year ended December 31, 2008, expenses incurred pursuant to these service agreements were $120,000 for Price Associates, $1,103,000 for T. Rowe Price Services, Inc., and $1,274,000 for T. Rowe Price Retirement Plan Services, Inc. The total amount payable at period-end pursuant to these service agreements is reflected as Due to Affiliates in the accompanying financial statements.
Additionally, the fund is one of several mutual funds in which certain college savings plans managed by Price Associates may invest. As approved by the fund’s Board of Directors, shareholder servicing costs associated with each college savings plan are borne by the fund in proportion to the average daily value of its shares owned by the college savings plan. For the year ended December 31, 2008, the fund was charged $366,000 for shareholder servicing costs related to the college savings plans, of which $316,000 was for services provided by Price. The amount payable at period-end pursuant to this agreement is reflected as Due to Affiliates in the accompanying financial statements. At December 31, 2008, approximately 2% of the outstanding shares of the Investor Class were held by college savings plans.
The fund is also one of several mutual funds sponsored by Price Associates (underlying Price funds) in which the T. Rowe Price Spectrum Funds (Spectrum Funds) and T.Rowe Price Retirement Funds (Retirement Funds) may invest. Neither the Spectrum Funds nor the Retirement Funds invest in the underlying Price funds for the purpose of exercising management or control. Pursuant to separate special servicing agreements, expenses associated with the operation of the Spectrum and Retirement Funds are borne by each underlying Price fund to the extent of estimated savings to it and in proportion to the average daily value of its shares owned by the Spectrum and Retirement Funds, respectively. Expenses allocated under these agreements are reflected as shareholder servicing expenses in the accompanying financial statements. For the year ended December 31, 2008, the fund was allocated $681,000 of Spectrum Funds’ expenses and $9,650,000 of Retirement Funds’ expenses. Of these amounts, $7,692,000 related to services provided by Price. The amount payable at period-end pursuant to this agreement is reflected as Due to Affiliates in the accompanying financial statements. At December 31, 2008, approximately 6% of the outstanding shares of the Investor Class were held by the Spectrum Funds and 69% were held by the Retirement Funds.
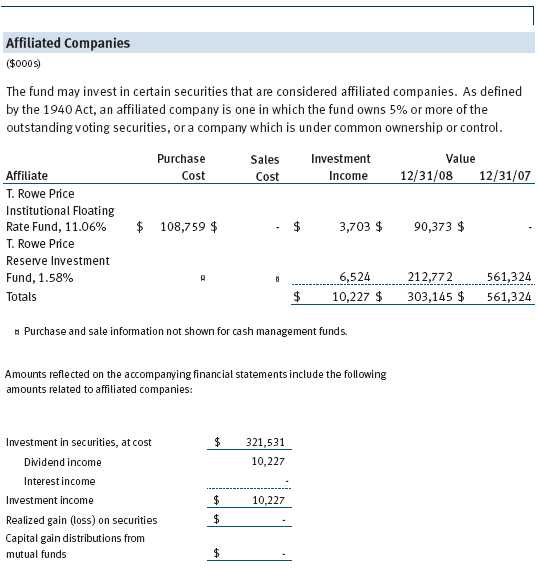
The fund may invest in the T. Rowe Price Reserve Investment Fund and the T. Rowe Price Government Reserve Investment Fund (collectively, the T. Rowe Price Reserve Investment Funds), open-end management investment companies managed by Price Associates and considered affiliates of the fund. The T. Rowe Price Reserve Investment Funds are offered as cash management options to mutual funds, trusts, and other accounts managed by Price Associates and/or its affiliates and are not available for direct purchase by members of the public. The T. Rowe Price Reserve Investment Funds pay no investment management fees.
The fund may also invest in certain T. Rowe Price institutional funds (underlying institutional funds) as a means of gaining efficient and cost-effective exposure to certain markets. The underlying institutional funds are open-end management investment companies managed by Price Associates and/or T. Rowe Price International, Inc. (collectively, the Price managers) and are considered affiliates of the fund. Each underlying institutional fund pays an all-inclusive management and administrative fee to its Price manager. To ensure that the fund does not incur duplicate fees, each Price manager has agreed to permanently waive a portion of its management fee charged to the fund in an amount sufficient to fully offset the fees paid by the underlying institutional funds related to fund assets invested therein. Accordingly, the accompanying Statement of Operations includes management fees permanently waived pursuant to this agreement. Annual fee rates and amounts waived within the accompanying Statement of Operations related to shares of the underlying institutional funds for the year ended December 31, 2008 are as follows:
As of December 31, 2008, T. Rowe Price Group, Inc., and/or its wholly owned subsidiaries owned 1,424,654 shares of the Investor Class, aggregating less than 1% of the fund’s net assets.
REPORT OF INDEPENDENT REGISTERED PUBLIC ACCOUNTING FIRM
To the Board of Directors and Shareholders of T. Rowe Price Value Fund, Inc.
In our opinion, the accompanying statement of assets and liabilities, including the schedule of investments, and the related statements of operations and of changes in net assets and the financial highlights present fairly, in all material respects, the financial position of T. Rowe Price Value Fund, Inc. (the “Fund”) at December 31, 2008, the results of its operations for the year then ended, the changes in its net assets for each of the two years in the period then ended and the financial highlights for each of the five years in the period then ended, in conformity with accounting principles generally accepted in the United States of America. These financial statements and financial highlights (hereafter referred to as “financial statements”) are the responsibility of the Fund’s management; our responsibility is to express an opinion on these financial statements based on our audits. We conducted our audits of these financial statements in accordance with the standards of the Public Company Accounting Oversight Board (United States). Those standards require that we plan and perform the audit to obtain reasonable assurance about whether the financial statements are free of material misstatement. An audit includes examining, on a test basis, evidence supporting the amounts and disclosures in the financial statements, assessing the accounting principles used and significant estimates made by management, and evaluating the overall financial statement presentation. We believe that our audits, which included confirmation of securities at December 31, 2008 by correspondence with the custodian and brokers and confirmation of the underlying fund by correspondence with the transfer agent, provide a reasonable basis for our opinion.
PricewaterhouseCoopers LLP Baltimore, Maryland February 12, 2009
TAX INFORMATION (UNAUDITED) FOR THE TAX YEAR ENDED 12/31/08
We are providing this information as required by the Internal Revenue Code. The amounts shown may differ from those elsewhere in this report because of differences between tax and financial reporting requirements.
The fund’s distributions to shareholders included:
• $15,000 from short-term capital gains
• $59,412,000 from long-term capital gains, subject to the 15% rate gains category.
For taxable non-corporate shareholders, $114,949,000 of the fund’s income represents qualified dividend income subject to the 15% rate category.
For corporate shareholders, $114,949,000 of the fund’s income qualifies for the dividends-received deduction.
INFORMATION ON PROXY VOTING POLICIES, PROCEDURES, AND RECORDS
A description of the policies and procedures used by T. Rowe Price funds and portfolios to determine how to vote proxies relating to portfolio securities is available in each fund’s Statement of Additional Information, which you may request by calling 1-800-225-5132 or by accessing the SEC’s Web site, www.sec.gov. The description of our proxy voting policies and procedures is also available on our Web site, www.troweprice.com. To access it, click on the words “Our Company” at the top of our corporate homepage. Then, when the next page appears, click on the words “Proxy Voting Policies” on the left side of the page.
Each fund’s most recent annual proxy voting record is available on our Web site and through the SEC’s Web site. To access it through our Web site, follow the directions above, then click on the words “Proxy Voting Records” on the right side of the Proxy Voting Policies page.
HOW TO OBTAIN QUARTERLY PORTFOLIO HOLDINGS
The fund files a complete schedule of portfolio holdings with the Securities and Exchange Commission for the first and third quarters of each fiscal year on Form N-Q. The fund’s Form N-Q is available electronically on the SEC’s Web site (www.sec.gov); hard copies may be reviewed and copied at the SEC’s Public Reference Room, 450 Fifth St. N.W., Washington, DC 20549. For more information on the Public Reference Room, call 1-800-SEC-0330.
ABOUT THE FUND’S DIRECTORS AND OFFICERS
Your fund is governed by a Board of Directors (Board) that meets regularly to review a wide variety of matters affecting the fund, including performance, investment programs, compliance matters, advisory fees and expenses, service providers, and other business affairs. The Board elects the fund’s officers, who are listed in the final table. At least 75% of Board members are independent of T. Rowe Price Associates, Inc. (T. Rowe Price), and T. Rowe Price International, Inc. (T. Rowe Price International); “inside” or “interested” directors are employees or officers of T. Rowe Price. The business address of each director and officer is 100 East Pratt Street, Baltimore, Maryland 21202. The Statement of Additional Information includes additional information about the directors and is available without charge by calling a T. Rowe Price representative at 1-800-225-5132.
Independent Directors
Name
(Year of Birth)
Principal Occupation(s) During Past Five Years and Directorships of
Year Elected*
Other Public Companies
Jeremiah E. Casey
Director, National Life Insurance (2001 to 2005); Director, The Rouse
(1940)
Company, real estate developers (1990 to 2004)
2005
Anthony W. Deering
Chairman, Exeter Capital, LLC, a private investment firm (2004 to
(1945)
present); Director, Under Armour (8/08 to present); Director, Vornado
2001
Real Estate Investment Trust (3/04 to present); Director, Mercantile
Bankshares (2002 to 2007); Member, Advisory Board, Deutsche
Bank North America (2004 to present); Director, Chairman of the
Board, and Chief Executive Officer, The Rouse Company, real estate
developers (1997 to 2004)
Donald W. Dick, Jr.
Principal, EuroCapital Advisors, LLC, an acquisition and management
(1943)
advisory firm (10/95 to present); Chairman, The Haven Group, a cus-
1994
tom manufacturer of modular homes (1/04 to present)
David K. Fagin
Chairman and President, Nye Corporation (6/88 to present); Director,
(1938)
Golden Star Resources Ltd. (5/92 to present); Director, Pacific Rim
1994
Mining Corp. (2/02 to present); Director, B.C. Corporation (3/08 to
present); Chairman, Canyon Resources Corp. (8/07 to 3/08); Director,
Atna Resources Ltd. (3/08 to present)
Karen N. Horn
Director, Eli Lilly and Company (1987 to present); Director, Simon
(1943)
Property Group (2004 to present); Director, Federal National Mortgage
2003
Association (9/06 to present); Director, Norfolk Southern (2/08 to pres-
ent); Director, Georgia Pacific (5/04 to 12/05); Managing Director and
President, Global Private Client Services, Marsh Inc. (1999 to 2003)
Theo C. Rodgers
President, A&R Development Corporation (1977 to present)
(1941)
2005
John G. Schreiber
Owner/President, Centaur Capital Partners, Inc., a real estate invest-
(1946)
ment company (1991 to present); Partner, Blackstone Real Estate
2001
Advisors, L.P. (10/92 to present)
*Each independent director oversees 126 T. Rowe Price portfolios (except for Mr. Fagin, who oversees
125 T. Rowe Price portfolios) and serves until retirement, resignation, or election of a successor.
Inside Directors
Name
(Year of Birth)
Year Elected*
[Number of T. Rowe Price
Principal Occupation(s) During Past Five Years and Directorships of
Portfolios Overseen]
Other Public Companies
Edward C. Bernard
Director and Vice President, T. Rowe Price; Vice Chairman of the Board,
(1956)
Director, and Vice President, T. Rowe Price Group, Inc.; Chairman of
2006
the Board, Director, and President, T. Rowe Price Investment Services,
[126]
Inc.; Chairman of the Board and Director, T. Rowe Price Global Asset
Management Limited, T. Rowe Price Global Investment Services
Limited, T. Rowe Price Retirement Plan Services, Inc., T. Rowe Price
Savings Bank, and T. Rowe Price Services, Inc.; Director, T. Rowe Price
International, Inc.; Chief Executive Officer, Chairman of the Board,
Director, and President, T. Rowe Price Trust Company; Chairman of
the Board, all funds
Brian C. Rogers, CFA, CIC
Chief Investment Officer, Director, and Vice President, T. Rowe Price;
(1955)
Chairman of the Board, Chief Investment Officer, Director, and Vice
2006
President, T. Rowe Price Group, Inc.; Vice President, T. Rowe Price
[71]
Trust Company; Vice President, Value Fund
*Each inside director serves until retirement, resignation, or election of a successor.
Officers
Name (Year of Birth)
Title and Fund(s) Served
Principal Occupation(s)
Jeffrey W. Arricale, CPA (1971)
Vice President, T. Rowe Price and T. Rowe Price
Vice President, Value Fund
Group, Inc.
Peter J. Bates, CFA (1974)
Vice President, T. Rowe Price and T. Rowe Price
Vice President, Value Fund
Group, Inc.; formerly intern, T. Rowe Price (to
2004); Vice President of Finance, Rent-A-Center,
Inc. (to 2003)
Ryan Burgess, CFA (1974)
Employee, T. Rowe Price; formerly intern,
Vice President, Value Fund
T. Rowe Price (to 2006); Vice President and
Senior Portfolio Manager, Evergreen Private
Asset Management (to 2005)
Ira W. Carnahan, CFA (1963)
Vice President, T. Rowe Price and T. Rowe Price
Vice President, Value Fund
Group, Inc.; formerly Associate Editor, Forbes
magazine (to 2005)
Roger L. Fiery III, CPA (1959)
Vice President, T. Rowe Price, T. Rowe Price
Vice President, Value Fund
Group, Inc., T. Rowe Price International, Inc.,
and T. Rowe Price Trust Company
John R. Gilner (1961)
Chief Compliance Officer and Vice President,
Chief Compliance Officer, Value Fund
T. Rowe Price; Vice President, T. Rowe Price
Group, Inc., and T. Rowe Price Investment
Services, Inc.
David R. Giroux, CFA (1975)
Vice President, T. Rowe Price, T. Rowe Price
Vice President, Value Fund
Group, Inc., and T. Rowe Price Trust Company
Gregory S. Golczewski (1966)
Vice President, T. Rowe Price and T. Rowe Price
Vice President, Value Fund
Trust Company
Gregory K. Hinkle, CPA (1958)
Vice President, T. Rowe Price, T. Rowe Price
Treasurer, Value Fund
Group, Inc., T. Rowe Price Investment Services,
Inc., and T. Rowe Price Trust Company; formerly
Partner, PricewaterhouseCoopers LLP (to 2007)
John D. Linehan, CFA (1965)
Vice President, T. Rowe Price, T. Rowe Price
President, Value Fund
Group, Inc., and T. Rowe Price Trust Company
Patricia B. Lippert (1953)
Assistant Vice President, T. Rowe Price and
Secretary, Value Fund
T. Rowe Price Investment Services, Inc.
Heather K. McPherson, CPA (1967)
Vice President, T. Rowe Price and T. Rowe Price
Vice President, Value Fund
Group, Inc.
David Oestreicher (1967)
Director and Vice President, T. Rowe Price
Vice President, Value Fund
Investment Services, Inc., T. Rowe Price Trust
Company, and T. Rowe Price Services, Inc.; Vice
President, T. Rowe Price, T. Rowe Price Global
Asset Management Limited, T. Rowe Price Global
Investment Services Limited, T. Rowe Price
Group, Inc., T. Rowe Price International, Inc.,
and T. Rowe Price Retirement Plan Services, Inc.
Eric L. Veiel, CFA (1972)
Vice President, T. Rowe Price and T. Rowe Price
Vice President, Value Fund
Group, Inc.; formerly Senior Equity Analyst,
Wachovia Securities (to 2005)
Julie L. Waples (1970)
Vice President, T. Rowe Price
Vice President, Value Fund
Tamara P. Wiggs (1979)
Vice President, T. Rowe Price; formerly Vice
Vice President, Value Fund
President, Institutional Equity Trading, Merrill
Lynch (to 2003)
Unless otherwise noted, officers have been employees of T. Rowe Price or T. Rowe Price International
for at least five years.
Item 2. Code of Ethics.
The registrant has adopted a code of ethics, as defined in Item 2 of Form N-CSR, applicable to its principal executive officer, principal financial officer, principal accounting officer or controller, or persons performing similar functions. A copy of this code of ethics is filed as an exhibit to this Form N-CSR. No substantive amendments were approved or waivers were granted to this code of ethics during the period covered by this report.
Item 3. Audit Committee Financial Expert.
The registrant’s Board of Directors/Trustees has determined that Ms. Karen N. Horn qualifies as an audit committee financial expert, as defined in Item 3 of Form N-CSR. Ms. Horn is considered independent for purposes of Item 3 of Form N-CSR.
Item 4. Principal Accountant Fees and Services.
(a) – (d) Aggregate fees billed to the registrant for the last two fiscal years for professional services rendered by the registrant’s principal accountant were as follows:
Audit fees include amounts related to the audit of the registrant’s annual financial statements and services normally provided by the accountant in connection with statutory and regulatory filings. Audit-related fees include amounts reasonably related to the performance of the audit of the registrant’s financial statements and specifically include the issuance of a report on internal controls and, if applicable, agreed-upon procedures related to fund acquisitions. Tax fees include amounts related to services for tax compliance, tax planning, and tax advice. The nature of these services specifically includes the review of distribution calculations and the preparation of Federal, state, and excise tax returns. All other fees include the registrant’s pro-rata share of amounts for agreed-upon procedures in conjunction with service contract approvals by the registrant’s Board of Directors/Trustees.
(e)(1) The registrant’s audit committee has adopted a policy whereby audit and non-audit services performed by the registrant’s principal accountant for the registrant, its investment adviser, and any entity controlling, controlled by, or under common control with the investment adviser that provides ongoing services to the registrant require pre-approval in advance at regularly scheduled audit committee meetings. If such a service is required between regularly scheduled audit committee meetings, pre-approval may be authorized by one audit committee member with ratification at the next scheduled audit committee meeting. Waiver of pre-approval for audit or non-audit services requiring fees of a de minimis amount is not permitted.
(2) No services included in (b) – (d) above were approved pursuant to paragraph (c)(7)(i)(C) of Rule 2-01 of Regulation S-X.
(f) Less than 50 percent of the hours expended on the principal accountant’s engagement to audit the registrant’s financial statements for the most recent fiscal year were attributed to work performed by persons other than the principal accountant’s full-time, permanent employees.
(g) The aggregate fees billed for the most recent fiscal year and the preceding fiscal year by the registrant’s principal accountant for non-audit services rendered to the registrant, its investment adviser, and any entity controlling, controlled by, or under common control with the investment adviser that provides ongoing services to the registrant were $1,922,000 and $1,486,000, respectively.
(h) All non-audit services rendered in (g) above were pre-approved by the registrant’s audit committee. Accordingly, these services were considered by the registrant’s audit committee in maintaining the principal accountant’s independence.
Item 5. Audit Committee of Listed Registrants.
Not applicable.
Item 6. Investments.
(a) Not applicable. The complete schedule of investments is included in Item 1 of this Form N-CSR.
(b) Not applicable.
Item 7. Disclosure of Proxy Voting Policies and Procedures for Closed-End Management Investment Companies.
Not applicable.
Item 8. Portfolio Managers of Closed-End Management Investment Companies.
Not applicable.
Item 9. Purchases of Equity Securities by Closed-End Management Investment Company and Affiliated Purchasers.
Not applicable.
Item 10. Submission of Matters to a Vote of Security Holders.
Not applicable.
Item 11. Controls and Procedures.
(a) The registrant’s principal executive officer and principal financial officer have evaluated the registrant’s disclosure controls and procedures within 90 days of this filing and have concluded that the registrant’s disclosure controls and procedures were effective, as of that date, in ensuring that information required to be disclosed by the registrant in this Form N-CSR was recorded, processed, summarized, and reported timely.
(b) The registrant’s principal executive officer and principal financial officer are aware of no change in the registrant’s internal control over financial reporting that occurred during the registrant’s second fiscal quarter covered by this report that has materially affected, or is reasonably likely to materially affect, the registrant’s internal control over financial reporting.
Item 12. Exhibits.
(a)(1) The registrant’s code of ethics pursuant to Item 2 of Form N-CSR is attached.
(2) Separate certifications by the registrant's principal executive officer and principal financial officer, pursuant to Section 302 of the Sarbanes-Oxley Act of 2002 and required by Rule 30a-2(a) under the Investment Company Act of 1940, are attached.
(3) Written solicitation to repurchase securities issued by closed-end companies: not applicable.
(b) A certification by the registrant's principal executive officer and principal financial officer, pursuant to Section 906 of the Sarbanes-Oxley Act of 2002 and required by Rule 30a-2(b) under the Investment Company Act of 1940, is attached.
SIGNATURES
Pursuant to the requirements of the Securities Exchange Act of 1934 and the Investment
Company Act of 1940, the registrant has duly caused this report to be signed on its behalf by the
undersigned, thereunto duly authorized.
T. Rowe Price Value Fund, Inc.
By
/s/ Edward C. Bernard
Edward C. Bernard
Principal Executive Officer
Date
February 19, 2009
Pursuant to the requirements of the Securities Exchange Act of 1934 and the Investment
Company Act of 1940, this report has been signed below by the following persons on behalf of
the registrant and in the capacities and on the dates indicated.
By
/s/ Edward C. Bernard
Edward C. Bernard
Principal Executive Officer
Date
February 19, 2009
By
/s/ Gregory K. Hinkle
Gregory K. Hinkle
Principal Financial Officer
Date
February 19, 2009
We use cookies on this site to provide a more responsive and personalized service. Continuing to browse, clicking I Agree, or closing this banner indicates agreement. See our Cookie Policy for more information.