Item 1: Report to Shareholders| Value Fund | December 31, 2007 |
The views and opinions in this report were current as of December 31, 2007. They are not guarantees of performance or investment results and should not be taken as investment advice. Investment decisions reflect a variety of factors, and the managers reserve the right to change their views about individual stocks, sectors, and the markets at any time. As a result, the views expressed should not be relied upon as a forecast of the fund’s future investment intent. The report is certified under the Sarbanes-Oxley Act, which requires mutual funds and other public companies to affirm that, to the best of their knowledge, the information in their financial reports is fairly and accurately stated in all material respects.
REPORTS ON THE WEB
Sign up for our E-mail Program, and you can begin to receive updated fund reports and prospectuses online rather than through the mail. Log in to your account at troweprice.com for more information.
Manager’s Letter
Fellow Shareholders
Greed and Fear. Over the past year, we have seen plenty of both in the market. The first half of the year was dominated by greed, as investors paid little heed to potential credit and economic risk and bid up both equity and debt instruments. The S&P 500 Stock Index was up 6.96% for the first half of 2007, fueled by substantial merger and acquisition activity, strong global economic growth, and abundant liquidity within the markets. The second half of the year was a completely different story, as greed abruptly gave way to fear. Investor concern about the slowing housing market, a deteriorating credit environment, and a decelerating U.S. economy took its toll, and the S&P 500’s 1.37% decline whittled its full-year return down to 5.49%.
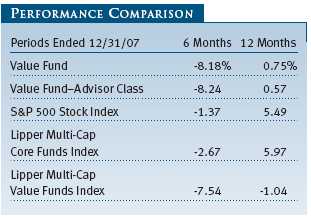
While we are careful to maintain a long-term perspective with our investments, your fund’s results were unable to escape the substantial market fluctuations. For the first half of the year, the fund gained 9.72%, but in the second half, your fund lost 8.18%. For the year, your fund managed to eke out a small gain of 0.75%, underperforming the S&P 500 and outpacing the Lipper Multi-Cap Value Funds Index. (Returns for Advisor Class shares will vary due to their differing fee structure.)
HIGHLIGHTS
•The market started the year dominated by greed and ended the year driven by fear.
• The fund posted a small gain for 2007, but it was weighed down in the second half of the year by its value investing style and its avoidance of momentum stocks.
• In line with our contrarian approach, we have been harvesting gains in defensive companies to invest in financial firms and others that have been particularly punished in past months.
• We expect that the market will improve later in 2008 as fear recedes and investors anticipate improved economic conditions.
Generally, our performance relative to the S&P 500 can be explained by stylistic differences. When our value style of investing lags the growth style, our fund’s returns will typically be less than those of the S&P 500 benchmark, which is made up of both growth and value shares. Nonetheless, we are disappointed by our relative performance over the past year, especially as it relates to our Lipper core benchmark. (While Lipper classifies our fund as “core,” as we have mentioned in previous letters, we measure performance against the value benchmark, which we believe is more consistent with our investing style and objective.)
In terms of your fund’s comparison to our Lipper value benchmark, 2007 was truly a tale of two halves. In the first half of the year, we outperformed the benchmark as a result of a number of our portfolio holdings being sold to either financial or strategic buyers. Our focus on investing in companies with strong franchises and durable cash flow streams was congruent with the type of company that both private-equity and strategic buyers sought to purchase. Our overweight of the technology sector also significantly aided performance. The investment strategies that worked well in the first half of the year quickly fell into disfavor in the second, and companies with strong price momentum and poor valuation attributes performed very well. This market environment runs counter to our investment style, and our performance suffered as a result. Further pressuring returns were poor stock selection in the financial sector and an overweight of the retail industry. Over the second half of the yea r, your fund returned -8.18% compared with -1.37% for the S&P 500 Index and -7.54% for the Lipper Multi-Cap Value Funds Index.
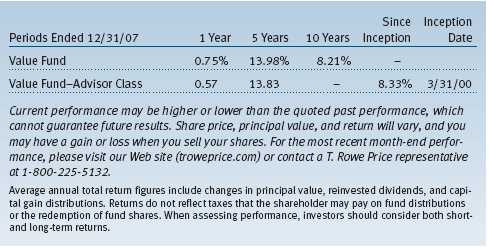
As long-term investors, our focus is to deliver to you strong absolute and relative returns over the course of an investment cycle and not be overly fixated by performance in any one year. We would note that since your fund’s inception in 1994, it has outpaced both the broad market and its Lipper Multi-Cap Value benchmark by posting an annualized gain of 13.36% versus 11.04% for the S&P 500 and 10.66% for the fund’s Lipper value index. (Annualized returns for the S&P 500 Index were 5.49%, 12.83%, and 5.91% for the 1-, 5-, and 10-year periods ended December 31, 2007, respectively. Annualized returns for the Lipper Multi-Cap Value Funds Index were -1.04%, 13.45%, and 6.86% for the 1-, 5-, and 10-year periods ended December 31, 2007, respectively. Annualized returns for the Lipper Multi-Cap Core Funds Index were 5.97%, 14.08%, and 6.46% for the 1-, 5-, and 10-year periods ended December 31, 2007, respectively. Past performance cannot guarantee future results.)
YEAR-END DISTRIBUTION
On December 19, your Board of Directors declared an annual income dividend of $0.45 per share and capital gain distributions of $0.92 per share, of which $0.80 were long-term gains. These distributions were paid on December 19 to shareholders of record on December 17, 2007, and you should have already received your check or statement reflecting these distributions.
PORTFOLIO REVIEW
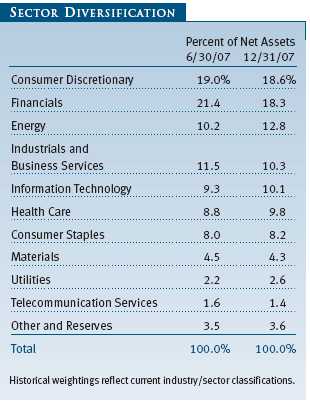
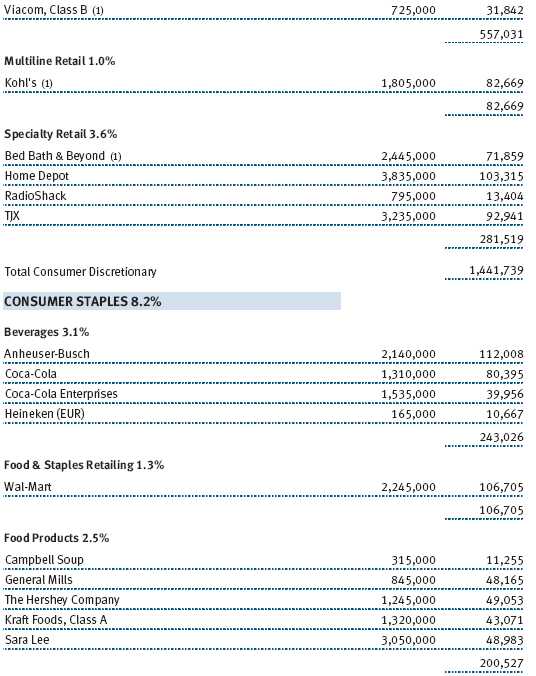
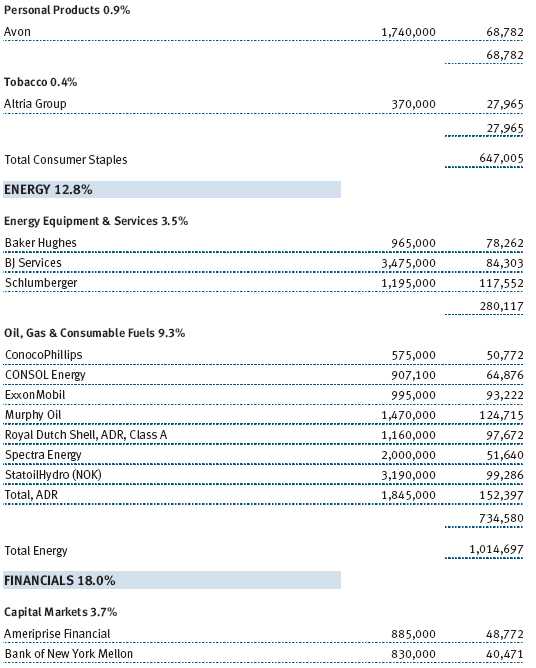
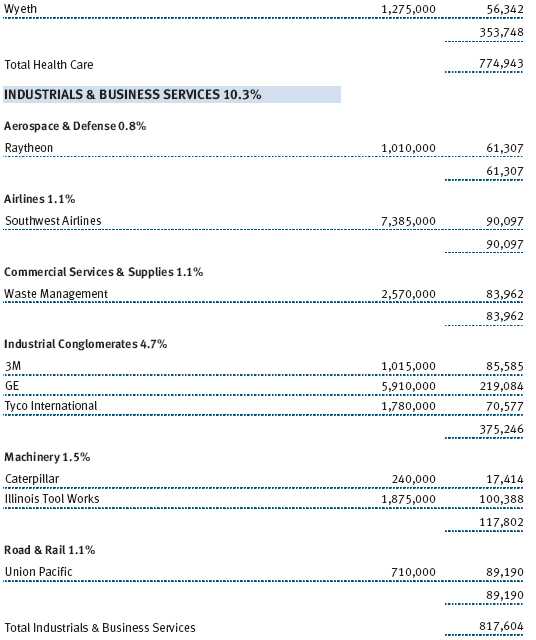
For the third straight year, several energy and natural resources companies were among the strongest contributors to your fund’s performance. Schlumberger, Murphy Oil, and coal company CONSOL Energy continued to benefit from global demand for energy. In the technology sector, semiconductor manufacturer Intel and communications equipment companies Nokia and Juniper Networks boosted performance. While top-10 holding Microsoft was weak in the first part of the year, it was among your fund’s strongest performers in the latter half of 2007, fueled by sales of Vista, Office, and its Xbox game console. Coca-Cola, among the world’s strongest brands, benefited early in the year as investors began to discern the opportunity for stronger growth and, more recently, from a defensive rotation into high-quality names in the consumer staples sector. Other stocks that contributed to performance included railroad company Union Pacific and health insurer Cigna. (Please see the portfolio of investments for a complete list of holdings and the amount each represents in the portfolio.)
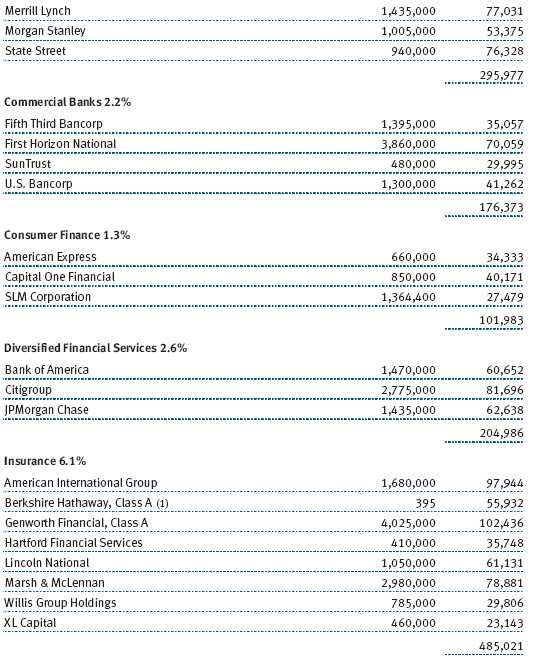
For the last six months and for the entire year, stocks in the financials sector were the largest detractors from absolute performance in both the index and your fund. As the effects of the collapse of the subprime mortgage market began to work their way through the system, holdings with direct exposure to problem loans and dampened business prospects were hit particularly hard, including Countrywide Financial, First Horizon National, Citigroup, and Genworth Financial. On a positive note, two financial stocks, State Street and Berkshire Hathaway, were among your fund’s largest contributors in the past six months.
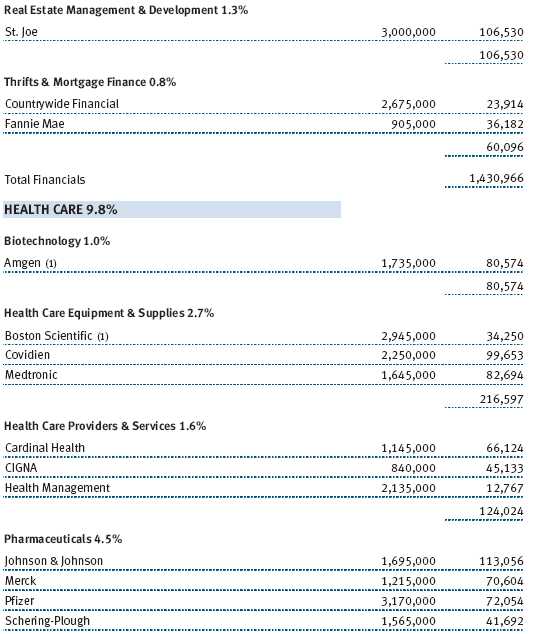
The market also punished those companies with exposure to the U.S. consumer or to the U.S. housing market. In this vein, other detractors for the year included retailers Home Depot and Kohl’s, consumer stocks Harley-Davidson and Comcast, and real estate holding company St. Joe.
PORTFOLIO STRATEGY AND CHANGES
To place our portfolio changes in perspective, we believe it is important to review the investment strategy we use in managing your fund. Our focus is to invest in companies with both attractive relative valuations and favorable long-term fundamental characteristics. We view ourselves as investors, not speculators, and we have a long-term time horizon when we make our investment decisions. Indeed, our portfolio turnover has been consistently less than the average of our peers.
We are contrarian investors, and we often will be going against consensus thought when we either buy or sell a company. We strive to be different and invest counter to collective investment sentiment, as we firmly believe that, over time, if we embrace consensus in formulating our investment decisions, then we will be embracing mediocrity.
In making our investments, we focus a great deal on understanding both the return potential and the risk associated with a given investment. Our investment approach is predicated on identifying companies where we believe that the upside implicit in the investment is significantly greater than the inherent risk. While we will not always be right, we believe that we have the potential to outperform the market and our peer universe over time if we can truly identify companies with an asymmetry between return and risk of investment.
A hallmark of our strategy has been our willingness to own companies until they reach our targeted upside. If we are truly successful in selecting companies where there is significantly greater upside than downside, then we will need to be patient with our holdings so that they realize the full upside of the investment. Often, this strategy will mean holding on to a company even after it has experienced significant price appreciation if we feel that the market is still not fully valuing the company. Over time, this strategy has worked very well for us, as we have realized outsized returns on a number of our investments.
We recognize that not every investment will work as planned. Consequently, maximizing the returns in holdings that do fare well is critical to our long-term success. Current portfolio holdings Discovery, Juniper, CNX Energy, and Schlumberger all have more than doubled from our average purchase price. These stocks have helped offset the results of some of our poorer-performing holdings, including New York Times, First Horizon, and St. Joe.
We see the best investment opportunities today in companies where there is an excess of negative investor sentiment. It is unclear whether the U.S. economy will enter into a recession in 2008; however, what is clear is that the market is aggressively discounting a significant slowing of the U.S. economy. Fear has gripped the markets, and, as a result, the market has placed a premium on those companies that are less exposed to a slowing economy. Consumer staples, defense contractors, and selected health care companies have all seen strong investor demand over the past six months.
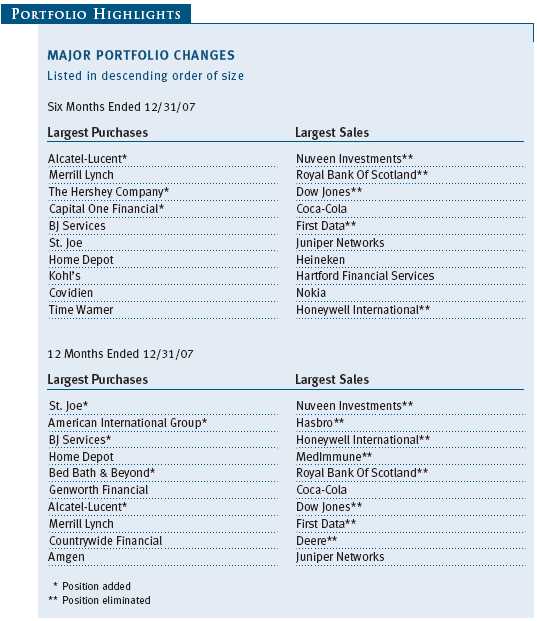
Benjamin Graham, one of the deans of value investing, once commented that the best time to sell a stock is when everyone else is willing to buy it, and the best time to buy a stock is when everyone else is willing to sell. We heartily concur. Accordingly, in today’s market environment, we want to sell those stocks that possess more defensive characteristics and buy companies that have greater uncertainty and more significant negative investor sentiment associated with them. In the past several months, we have initiated positions in Time Warner Cable, SunTrust Bank, and Alcatel-Lucent and added to existing holdings in Home Depot, Southwest Airlines, Genworth, BJ Services, and American International Group (AIG). In our view, all of these companies were attractively valued on both an absolute and a relative basis at the time of purchase, and most possess a higher-quality asset base. Many of these holdings are either exposed to the U.S. consumer or have sensitivity to the slowing U.S. housing market. What they all have in common is extremely poor sentiment, as investor fears have driven valuations to compelling levels. We have funded our purchases by selling or trimming strongly performing holdings that have more defensive characteristics, including Coca-Cola, Heineken, Entergy, and Merck.
In sum, we have been selling certainty to buy uncertainty. While we will most likely be early, we do believe that employing this strategy will serve us very well in a market rebound. Markets cannot remain in a perpetual state of fear; thus, when investor fears recede, we believe that our portfolio will be well positioned.
We also see opportunities in companies where we believe that the market price of the company does not accurately reflect the underlying asset value of the company. In the past year, we have either initiated or added to investments in Time Warner, St. Joe, and Merrill Lynch. In each of these instances, our analysis suggests that the breakup value of the company is significantly higher than where the stocks currently trade. Furthermore, in all of these companies, we believe that management is taking steps to restructure each company and to unlock its hidden value.
Additionally, we have focused our investment activity on swapping one company whose valuation merits have faded for another with more appealing characteristics. We sold Family Dollar Stores to buy Bed Bath & Beyond. Toward the end of the year, we began to trade out of our holdings of Hartford Financial to buy AIG. In both cases, we sold companies that had performed well on a relative basis to buy similar companies with better valuation appeal and higher-quality assets. The Major Portfolio Changes table at the end of this letter highlights our purchase and sale activity during the past six months and year.
OUTLOOK
Greed and Fear. We expect, once again, to see plenty of both in 2008. As we write this letter, the market is consumed with the fear of a global economic slowdown and the potential for the U.S. economy to slide into recession at some point in the year. We believe that investor fears will diminish over the course of the year, however, and equity markets will rebound. Academic studies have shown that, counterintuitively, the best time to buy U.S. equities is during a time of negative economic growth. While we do not have a crystal ball and will leave to economic pundits the serious job of forecasting economic growth, we do believe that at some point in 2008 excessive fear and concern about the pace of both domestic and global economic growth will offer a significant opportunity for investors. As a result, we remain cautiously optimistic for the year, as we believe that the market will begin to pick up steam in the second half as investors start to price in the prospect of a ccelerating economic growth.
While we will closely monitor economic conditions, our focus will continue to be selecting individual stocks with valuation appeal, sound fundamentals, and reasonable balance sheet integrity. As always, we will concentrate our efforts on making sound investment decisions in our ongoing attempt to enhance shareholder value.
Respectfully submitted,
John D. Linehan
President of the fund and chairman of its Investment Advisory Committee
January 22, 2008
The committee chairman has day-to-day responsibility for managing the portfolio and works with committee members in developing and executing the fund’s investment program.
RISKS OF INVESTING IN THE FUND
Value investors seek to invest in companies whose stock prices are low in relation to their real worth or future prospects. By identifying companies whose stocks are currently out of favor or misunderstood, value investors hope to realize significant appreciation as other investors recognize the stock’s intrinsic value and the price rises accordingly. The value approach carries the risk that the market will not recognize a security’s intrinsic value for a long time or that a stock judged to be undervalued may actually be appropriately priced.
GLOSSARY
Lipper index: An index of mutual fund performance returns for specified periods in defined categories as tracked by Lipper Inc.
Price/earnings (P/E) ratio: Calculated by dividing a stock’s market value per share by the company’s earnings per share for the past 12 months or by expected earnings for the coming year.
S&P 500 Stock Index: A market cap-weighted index of 500 widely held stocks often used as a proxy for the overall stock market. Performance is reported on a total return basis.

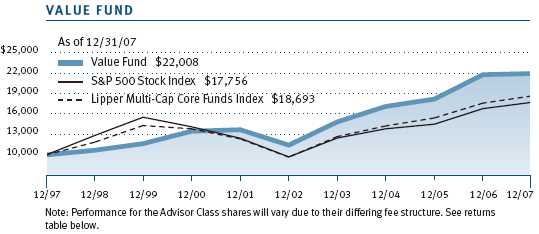
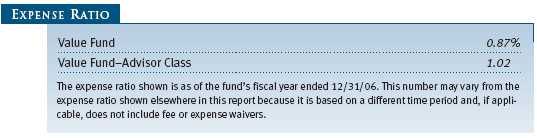
Performance and Expenses
This chart shows the value of a hypothetical $10,000 investment in the fund over the past 10 fiscal year periods or since inception (for funds lacking 10-year records). The result is compared with benchmarks, which may include a broad-based market index and a peer group average or index. Market indexes do not include expenses, which are deducted from fund returns as well as mutual fund averages and indexes.
| AVERAGE ANNUAL COMPOUND TOTAL RETURN |
This table shows how the fund would have performed each year if its actual (or cumulative) returns had been earned at a constant rate.
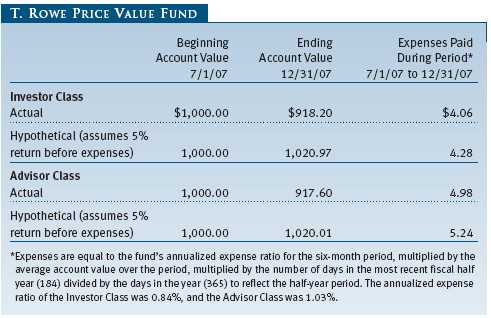
As a mutual fund shareholder, you may incur two types of costs: (1) transaction costs, such as redemption fees or sales loads, and (2) ongoing costs, including management fees, distribution and service (12b-1) fees, and other fund expenses. The following example is intended to help you understand your ongoing costs (in dollars) of investing in the fund and to compare these costs with the ongoing costs of investing in other mutual funds. The example is based on an investment of $1,000 invested at the beginning of the most recent six-month period and held for the entire period.
Please note that the fund has two share classes: The original share class (“investor class”) charges no distribution and service (12b-1) fee. Advisor Class shares are offered only through unaffiliated brokers and other financial intermediaries and charge a 0.25% 12b-1 fee. Each share class is presented separately in the table.
Actual Expenses
The first line of the following table (“Actual”) provides information about actual account values and expenses based on the fund’s actual returns. You may use the information in this line, together with your account balance, to estimate the expenses that you paid over the period. Simply divide your account value by $1,000 (for example, an $8,600 account value divided by $1,000 = 8.6), then multiply the result by the number in the first line under the heading “Expenses Paid During Period” to estimate the expenses you paid on your account during this period.
Hypothetical Example for Comparison Purposes
The information on the second line of the table (“Hypothetical”) is based on hypothetical account values and expenses derived from the fund’s actual expense ratio and an assumed 5% per year rate of return before expenses (not the fund’s actual return). You may compare the ongoing costs of investing in the fund with other funds by contrasting this 5% hypothetical example and the 5% hypothetical examples that appear in the shareholder reports of the other funds. The hypothetical account values and expenses may not be used to estimate the actual ending account balance or expenses you paid for the period.
Note: T. Rowe Price charges an annual small-account maintenance fee of $10, generally for accounts with less than $2,000 ($500 for UGMA/UTMA). The fee is waived for any investor whose T. Rowe Price mutual fund accounts total $25,000 or more, accounts employing automatic investing, and IRAs and other retirement plan accounts that utilize a prototype plan sponsored by T. Rowe Price (although a separate custodial or administrative fee may apply to such accounts). This fee is not included in the accompanying table. If you are subject to the fee, keep it in mind when you are estimating the ongoing expenses of investing in the fund and when comparing the expenses of this fund with other funds.
You should also be aware that the expenses shown in the table highlight only your ongoing costs and do not reflect any transaction costs, such as redemption fees or sales loads. Therefore, the second line of the table is useful in comparing ongoing costs only and will not help you determine the relative total costs of owning different funds. To the extent a fund charges transaction costs, however, the total cost of owning that fund is higher.
The accompanying notes are an integral part of these financial statements.
The accompanying notes are an integral part of these financial statements.


The accompanying notes are an integral part of these financial statements.
The accompanying notes are an integral part of these financial statements.
The accompanying notes are an integral part of these financial statements.
The accompanying notes are an integral part of these financial statements.
| NOTES TO FINANCIAL STATEMENTS |
NOTE 1 - SIGNIFICANT ACCOUNTING POLICIES
T. Rowe Price Value Fund, Inc. (the fund), is registered under the Investment Company Act of 1940 (the 1940 Act) as a diversified, open-end management investment company. The fund seeks to provide long-term capital appreciation by investing in common stocks believed to be undervalued. Income is a secondary objective. The fund has two classes of shares: the Value Fund original share class, referred to in this report as the Investor Class, offered since September 30, 1994, and Value Fund—Advisor Class (Advisor Class), offered since March 31, 2000. Advisor Class shares are sold only through unaffiliated brokers and other unaffiliated financial intermediaries that are compensated by the class for distribution, shareholder servicing, and/or certain administrative services under a Board-approved Rule 12b-1 plan. Each class has exclusive voting rights on matters related solely to that class, separate voting rights on matters that relate to both classes, and, in all other respects, the same rights and obligations as the other class.
The accompanying financial statements were prepared in accordance with accounting principles generally accepted in the United States of America, which require the use of estimates made by fund management. Fund management believes that estimates and security valuations are appropriate; however, actual results may differ from those estimates, and the security valuations reflected in the financial statements may differ from the value the fund ultimately realizes upon sale of the securities.
Valuation The fund values its investments and computes its net asset value per share at the close of the New York Stock Exchange (NYSE), normally 4 p.m. ET, each day that the NYSE is open for business. Equity securities listed or regularly traded on a securities exchange or in the over-the-counter (OTC) market are valued at the last quoted sale price or, for certain markets, the official closing price at the time the valuations are made, except for OTC Bulletin Board securities, which are valued at the mean of the latest bid and asked prices. A security that is listed or traded on more than one exchange is valued at the quotation on the exchange determined to be the primary market for such security. Listed securities not traded on a particular day are valued at the mean of the latest bid and asked prices for domestic securities and the last quoted sale price for international securities.
Debt securities are generally traded in the over-the-counter market. Securities with original maturities of one year or more are valued at prices furnished by dealers who make markets in such securities or by an independent pricing service, which considers yield or price of bonds of comparable quality, coupon, maturity, and type, as well as prices quoted by dealers who make markets in such securities. Securities with original maturities of less than one year are valued at amortized cost in local currency, which approximates fair value when combined with accrued interest.
Investments in mutual funds are valued at the mutual fund’s closing net asset value per share on the day of valuation. Financial futures contracts are valued at closing settlement prices.
Other investments, including restricted securities, and those for which the above valuation procedures are inappropriate or are deemed not to reflect fair value are stated at fair value as determined in good faith by the T. Rowe Price Valuation Committee, established by the fund’s Board of Directors.
Most foreign markets close before the close of trading on the NYSE. If the fund determines that developments between the close of a foreign market and the close of the NYSE will, in its judgment, materially affect the value of some or all of its portfolio securities, which in turn will affect the fund’s share price, the fund will adjust the previous closing prices to reflect the fair value of the securities as of the close of the NYSE, as determined in good faith by the T. Rowe Price Valuation Committee, established by the fund’s Board of Directors. A fund may also fair value securities in other situations, such as when a particular foreign market is closed but the fund is open. In deciding whether to make fair value adjustments, the fund reviews a variety of factors, including developments in foreign markets, the performance of U.S. securities markets, and the performance of instruments trading in U.S. markets that represent foreign securities and baskets of foreign securities. The fund uses outside pricing services to provide it with closing market prices and information used for adjusting those prices. The fund cannot predict when and how often it will use closing prices and when it will adjust those prices to reflect fair value. As a means of evaluating its fair value process, the fund routinely compares closing market prices, the next day’s opening prices in the same markets, and adjusted prices.
Currency Translation Assets, including investments, and liabilities denominated in foreign currencies are translated into U.S. dollar values each day at the prevailing exchange rate, using the mean of the bid and asked prices of such currencies against U.S. dollars as quoted by a major bank. Purchases and sales of securities, income, and expenses are translated into U.S. dollars at the prevailing exchange rate on the date of the transaction. The effect of changes in foreign currency exchange rates on realized and unrealized security gains and losses is reflected as a component of security gains and losses.
Class Accounting The Advisor Class pays distribution, shareholder servicing, and/or certain administrative expenses in the form of Rule 12b-1 fees, in an amount not exceeding 0.25% of the class’s average daily net assets. Shareholder servicing, prospectus, and shareholder report expenses incurred by each class are charged directly to the class to which they relate. Expenses common to both classes, investment income, and realized and unrealized gains and losses are allocated to the classes based upon the relative daily net assets of each class.
Rebates and Credits Subject to best execution, the fund may direct certain security trades to brokers who have agreed to rebate a portion of the related brokerage commission to the fund in cash. Commission rebates are reflected as realized gain on securities in the accompanying financial statements and totaled $113,000 for the year ended December 31, 2007. Additionally, the fund earns credits on temporarily uninvested cash balances at the custodian that reduce the fund’s custody charges. Custody expense in the accompanying financial statements is presented before reduction for credits, which are reflected as expenses paid indirectly.
Investment Transactions, Investment Income, and Distributions Income and expenses are recorded on the accrual basis. Premiums and discounts on debt securities are amortized for financial reporting purposes. Dividends received from mutual fund investments are reflected as dividend income; capital gain distributions are reflected as realized gain/loss. Dividend income and capital gain distributions are recorded on the ex-dividend date. Income tax-related interest and penalties, if incurred, would be recorded as income tax expense. Investment transactions are accounted for on the trade date. Realized gains and losses are reported on the identified cost basis. Payments (“variation margin”) made or received to settle the daily fluctuations in the value of futures contracts are recorded as unrealized gains or losses until the contracts are closed. Distributions to shareholders are recorded on the ex-dividend date. Income distributions are declared and paid by each class on an annual basis. Capital gain distributions, if any, are declared and paid by the fund, typically on an annual basis.
New Accounting Pronouncements Effective June 29, 2007, the fund adopted Financial Accounting Standards Board (FASB) Interpretation No. 48 (FIN 48), Accounting for Uncertainty in Income Taxes, a clarification of FASB Statement No. 109, Accounting for Income Taxes. FIN 48 establishes financial accounting and disclosure requirements for recognition and measurement of tax positions taken or expected to be taken on an income tax return. The adoption of FIN 48 had no impact on the fund’s net assets or results of operations.
In September 2006, the FASB released the Statement of Financial Accounting Standard No. 157 (FAS 157), Fair Value Measurements. FAS 157 clarifies the definition of fair value and establishes the framework for measuring fair value, as well as proper disclosure of this methodology in the financial statements. It will be effective for the fund’s fiscal year beginning January 1, 2008. Management is evaluating the effects of FAS 157; however, it is not expected to have a material impact on the fund’s net assets or results of operations.
NOTE 2 - INVESTMENT TRANSACTIONS
Consistent with its investment objective, the fund engages in the following practices to manage exposure to certain risks or to enhance performance. The investment objective, policies, program, and risk factors of the fund are described more fully in the fund’s prospectus and Statement of Additional Information.
Restricted Securities The fund may invest in securities that are subject to legal or contractual restrictions on resale. Prompt sale of such securities at an acceptable price may be difficult due to substantial delays and additional costs related to their restrictions.
Futures Contracts During the year ended December 31, 2007, the fund was a party to futures contracts, which provide for the future sale by one party and purchase by another of a specified amount of a specific financial instrument at an agreed upon price, date, time, and place. Risks arise from possible illiquidity of the futures market and from movements in security values.
Securities Lending The fund lends its securities to approved brokers to earn additional income. It receives as collateral cash and U.S. government securities valued at 102% to 105% of the value of the securities on loan. Cash collateral is invested in a money market pooled trust managed by the fund’s lending agent in accordance with investment guidelines approved by fund management. Collateral is maintained over the life of the loan in an amount not less than the value of loaned securities, as determined at the close of fund business each day; any additional collateral required due to changes in security values is delivered to the fund the next business day. Although risk is mitigated by the collateral, the fund could experience a delay in recovering its securities and a possible loss of income or value if the borrower fails to return the securities. Securities lending revenue recognized by the fund consists of earnings on invested collateral and borrowing fees, net of any rebates to the borrower and compensation to the lending agent. At December 31, 2007, there were no securities on loan.
Other Purchases and sales of portfolio securities, other than short-term securities, aggregated $2,921,921,000 and $1,389,318,000, respectively, for the year ended December 31, 2007.
NOTE 3 - FEDERAL INCOME TAXES
No provision for federal income taxes is required since the fund intends to continue to qualify as a regulated investment company under Subchapter M of the Internal Revenue Code and distribute to shareholders all of its taxable income and gains. Federal income tax regulations differ from generally accepted accounting principles; therefore, distributions determined in accordance with tax regulations may differ significantly in amount or character from net investment income and realized gains for financial reporting purposes. Financial reporting records are adjusted for permanent book/tax differences to reflect tax character. Financial records are not adjusted for temporary differences.
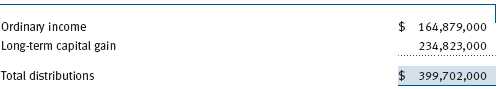
Distributions during the year ended December 31, 2007, were characterized as follows for tax purposes:
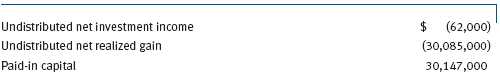
At December 31, 2007, the tax-basis components of net assets were as follows:
For the year ended December 31, 2007, the fund recorded the following permanent reclassifications to reflect tax character. Reclassifications to paid-in capital relate primarily to a tax practice that treats a portion of the proceeds from each redemption of capital shares as a distribution of taxable net investment income and/or realized capital gain. Results of operations and net assets were not affected by these reclassifications.
At December 31, 2007, the cost of investments for federal income tax purposes was $7,582,317,000.
NOTE 4 - ACQUISITION
On June 19, 2006, the fund acquired substantially all of the assets of the Preferred Value Fund (the acquired fund), pursuant to the Agreement and Plan of Reorganization dated February 15, 2006, and approved by shareholders of the acquired fund on June 9, 2006. The acquisition was accomplished by a tax-free exchange of 2,910,594 shares of the fund (with a value of $70,465,000) for all 5,048,611 shares of the acquired fund outstanding on June 16, 2006 with the same value. The net assets of the acquired fund at that date included $1,446,000 of unrealized depreciation. Net assets of the acquired fund were combined with those of the fund, resulting in aggregate net assets of $3,892,485,000 immediately after the acquisition.
NOTE 5 - RELATED PARTY TRANSACTIONS
The fund is managed by T. Rowe Price Associates, Inc. (the manager or Price Associates), a wholly owned subsidiary of T. Rowe Price Group, Inc. The investment management agreement between the fund and the manager provides for an annual investment management fee, which is computed daily and paid monthly. The fee consists of an individual fund fee, equal to 0.35% of the fund’s average daily net assets, and a group fee. The group fee rate is calculated based on the combined net assets of certain mutual funds sponsored by Price Associates (the group) applied to a graduated fee schedule, with rates ranging from 0.48% for the first $1 billion of assets to 0.285% for assets in excess of $220 billion. The fund’s group fee is determined by applying the group fee rate to the fund’s average daily net assets. At December 31, 2007, the effective annual group fee rate was 0.30%.
In addition, the fund has entered into service agreements with Price Associates and two wholly owned subsidiaries of Price Associates (collectively, Price). Price Associates computes the daily share prices and provides certain other administrative services to the fund. T. Rowe Price Services, Inc., provides shareholder and administrative services in its capacity as the fund’s transfer and dividend disbursing agent. T. Rowe Price Retirement Plan Services, Inc., provides subaccounting and recordkeeping services for certain retirement accounts invested in the Investor Class. For the year ended December 31, 2007, expenses incurred pursuant to these service agreements were $111,000 for Price Associates, $1,147,000 for T. Rowe Price Services, Inc., and $1,513,000 for T. Rowe Price Retirement Plan Services, Inc. The total amount payable at period-end pursuant to these service agreements is reflected as Due to Affiliates in the accompanying financial statements.
Additionally, the fund is one of several mutual funds in which certain college savings plans managed by Price Associates may invest. As approved by the fund’s Board of Directors, shareholder servicing costs associated with each college savings plan are borne by the fund in proportion to the average daily value of its shares owned by the college savings plan. For the year ended December 31, 2007, the fund was charged $344,000 for shareholder servicing costs related to the college savings plans, of which $306,000 was for services provided by Price. The amount payable at period-end pursuant to this agreement is reflected as Due to Affiliates in the accompanying financial statements. At December 31, 2007, approximately 2% of the outstanding shares of the Investor Class were held by college savings plans.
The fund is also one of several mutual funds sponsored by Price Associates (underlying Price funds) in which the T. Rowe Price Spectrum Funds (Spectrum Funds) and T. Rowe Price Retirement Funds (Retirement Funds) may invest. Neither the Spectrum Funds nor the Retirement Funds invest in the underlying Price funds for the purpose of exercising management or control. Pursuant to separate special servicing agreements, expenses associated with the operation of the Spectrum and Retirement Funds are borne by each underlying Price fund to the extent of estimated savings to it and in proportion to the average daily value of its shares owned by the Spectrum and Retirement Funds, respectively. Expenses allocated under these agreements are reflected as shareholder servicing expenses in the accompanying financial statements. For the year ended December 31, 2007, the fund was allocated $660,000 of Spectrum Funds’ expenses and $7,398,000 of Retirement Funds’ expenses. Of these amounts, $6,156,000 related to services provided by Price. The amount payable at period-end pursuant to this agreement is reflected as Due to Affiliates in the accompanying financial statements. At December 31, 2007, approximately 7% of the outstanding shares of the Investor Class were held by the Spectrum Funds and 60% were held by the Retirement Funds.
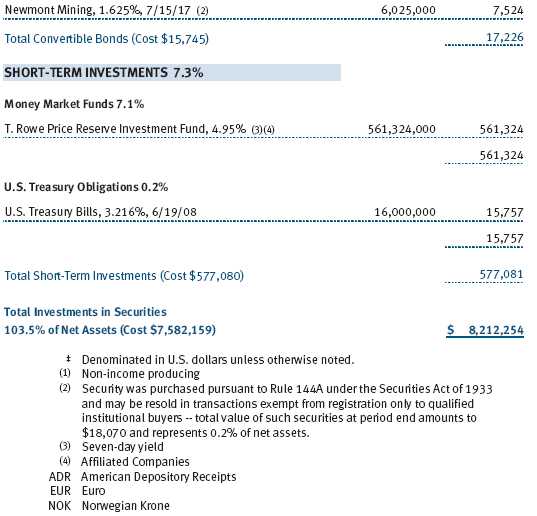
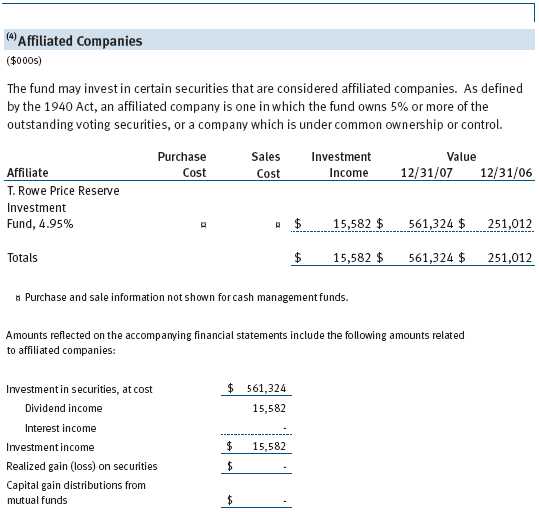
The fund may invest in the T. Rowe Price Reserve Investment Fund and the T. Rowe Price Government Reserve Investment Fund (collectively, the T. Rowe Price Reserve Investment Funds), open-end management investment companies managed by Price Associates and affiliates of the fund. The T. Rowe Price Reserve Investment Funds are offered as cash management options to mutual funds, trusts, and other accounts managed by Price Associates and/or its affiliates, and are not available for direct purchase by members of the public. The T. Rowe Price Reserve Investment Funds pay no investment management fees.
As of December 31, 2007, T. Rowe Price Group, Inc., and/or its wholly owned subsidiaries owned 211,336 shares of the Investor Class, representing less than 1% of the fund’s net assets.
| REPORT OF INDEPENDENT REGISTERED PUBLIC ACCOUNTING FIRM |
To the Board of Directors and Shareholders of T. Rowe Price Value Fund, Inc.
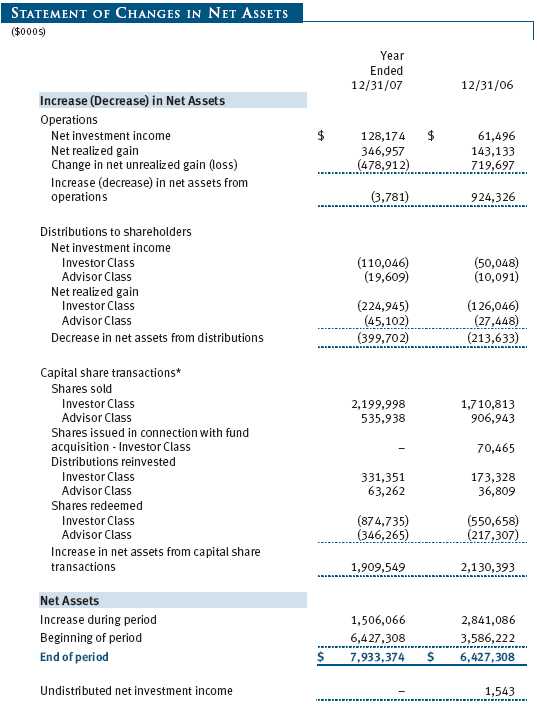
In our opinion, the accompanying statement of assets and liabilities, including the portfolio of investments, and the related statements of operations and of changes in net assets and the financial highlights present fairly, in all material respects, the financial position of T. Rowe Price Value Fund, Inc. (the “Fund”) at December 31, 2007, the results of its operations for the year then ended, the changes in its net assets for each of the two years in the period then ended and the financial highlights for each of the five years in the period then ended, in conformity with accounting principles generally accepted in the United States of America. These financial statements and financial highlights (hereafter referred to as “financial statements”) are the responsibility of the Fund’s management; our responsibility is to express an opinion on these financial statements based on our audits. We conducted our audits of these financial statements in accordance with the auditing standards of the Public Company Accounting Oversight Board (United States). Those standards require that we plan and perform the audit to obtain reasonable assurance about whether the financial statements are free of material misstatement. An audit includes examining, on a test basis, evidence supporting the amounts and disclosures in the financial statements, assessing the accounting principles used and significant estimates made by management, and evaluating the overall financial statement presentation. We believe that our audits, which included confirmation of securities at December 31, 2007, by correspondence with the custodian and by agreement to the underlying ownership records for T. Rowe Price Reserve Investment Fund, provide a reasonable basis for our opinion.
PricewaterhouseCoopers LLP
Baltimore, Maryland
February 12, 2008
| TAX INFORMATION (UNAUDITED) FOR THE TAX YEAR ENDED 12/31/07 |
We are providing this information as required by the Internal Revenue Code. The amounts shown may differ from those elsewhere in this report because of differences between tax and financial reporting requirements.
The fund’s distributions to shareholders included:
• $44,704,000 from short-term capital gains,
• $254,804,000 from long-term capital gains, subject to the 15% rate gains category.
For taxable non-corporate shareholders, $168,780,000 of the fund’s income represents qualified dividend income subject to the 15% rate category.
For corporate shareholders, $156,083,000 of the fund’s income qualifies for the dividends-received deduction.
| INFORMATION ON PROXY VOTING POLICIES, PROCEDURES, AND RECORDS |
A description of the policies and procedures used by T. Rowe Price funds and portfolios to determine how to vote proxies relating to portfolio securities is available in each fund’s Statement of Additional Information, which you may request by calling 1-800-225-5132 or by accessing the SEC’s Web site, www.sec.gov. The description of our proxy voting policies and procedures is also available on our Web site, www.troweprice.com. To access it, click on the words “Company Info” at the top of our homepage for individual investors. Then, in the window that appears, click on the “Proxy Voting Policy” navigation button in the top left corner.
Each fund’s most recent annual proxy voting record is available on our Web site and through the SEC’s Web site. To access it through our Web site, follow the directions above, then click on the words “Proxy Voting Record” at the bottom of the Proxy Voting Policy page.
| HOW TO OBTAIN QUARTERLY PORTFOLIO HOLDINGS |
The fund files a complete schedule of portfolio holdings with the Securities and Exchange Commission for the first and third quarters of each fiscal year on Form N-Q. The fund’s Form N-Q is available electronically on the SEC’s Web site (www.sec.gov); hard copies may be reviewed and copied at the SEC’s Public Reference Room, 450 Fifth St. N.W., Washington, DC 20549. For more information on the Public Reference Room, call 1-800-SEC-0330.
| ABOUT THE FUND’S DIRECTORS AND OFFICERS |
Your fund is governed by a Board of Directors (Board) that meets regularly to review a wide variety of matters affecting the fund, including performance, investment programs, compliance matters, advisory fees and expenses, service providers, and other business affairs. The Board elects the fund’s officers, who are listed in the final table. At least 75% of Board members are independent of T. Rowe Price Associates, Inc. (T. Rowe Price), and T. Rowe Price International, Inc. (T. Rowe Price International); “inside” or “interested” directors are employees or officers of T. Rowe Price. The business address of each director and officer is 100 East Pratt Street, Baltimore, Maryland 21202. The Statement of Additional Information includes additional information about the directors and is available without charge by calling a T. Rowe Price representative at 1-800-225-5132.
| Independent Directors | |
| |
| Name | |
| (Year of Birth) | Principal Occupation(s) During Past 5 Years and Directorships of |
| Year Elected* | Other Public Companies |
| |
| Jeremiah E. Casey | Director, National Life Insurance (2001 to 2005); Director, The Rouse |
| (1940) | Company, real estate developers (1990 to 2004); Director, Allfirst |
| 2005 | Financial Inc. (previously First Maryland Bancorp) (1983 to 2002) |
| |
| Anthony W. Deering | Chairman, Exeter Capital, LLC, a private investment firm (2004 to pres- |
| (1945) | ent); Director, Vornado Real Estate Investment Trust (3/04 to present); |
| 2001 | Member, Advisory Board, Deutsche Bank North America (2004 to pres- |
| | ent); Director, Chairman of the Board, and Chief Executive Officer, The |
| | Rouse Company, real estate developers (1997 to 2004) |
| |
| Donald W. Dick, Jr. | Principal, EuroCapital Advisors, LLC, an acquisition and management |
| (1943) | advisory firm; Chairman, The Haven Group, a custom manufacturer of |
| 1994 | modular homes (1/04 to present) |
| |
| David K. Fagin | Chairman and President, Nye Corporation (6/88 to present); Chairman, |
| (1938) | Canyon Resources Corp. (8/07 to present); Director, Golden Star |
| 1994 | Resources Ltd. (5/92 to present); Director, Pacific Rim Mining Corp. |
| | (2/02 to present) |
| |
| Karen N. Horn | Director, Federal National Mortgage Association (9/06 to present); |
| (1943) | Managing Director and President, Global Private Client Services, Marsh |
| 2003 | Inc. (1999 to 2003); Director, Georgia Pacific (5/04 to 12/05), Eli Lilly |
| | and Company, and Simon Property Group |
| |
| Theo C. Rodgers | President, A&R Development Corporation (1977 to present) |
| (1941) | |
| 2005 | |
| John G. Schreiber | Owner/President, Centaur Capital Partners, Inc., a real estate invest- |
| (1946) | ment company; Partner, Blackstone Real Estate Advisors, L.P. |
| 2001 | |
| |
| *Each independent director oversees 121 T. Rowe Price portfolios and serves until retirement, resignation, or |
| election of a successor. | |
| Inside Directors | |
| |
| Name | |
| (Year of Birth) | |
| Year Elected* | |
| [Number of T. Rowe Price | Principal Occupation(s) During Past 5 Years and Directorships of |
| Portfolios Overseen] | Other Public Companies |
| |
| Edward C. Bernard | Director and Vice President, T. Rowe Price; Vice Chairman of the Board, |
| (1956) | Director, and Vice President, T. Rowe Price Group, Inc.; Chairman of the |
| 2006 | Board, Director, and President, T. Rowe Price Investment Services, |
| [121] | Inc.; Chairman of the Board and Director, T. Rowe Price Global Asset |
| | Management Limited, T. Rowe Price Global Investment Services |
| | Limited, T. Rowe Price Retirement Plan Services, Inc., T. Rowe Price |
| | Savings Bank, and T. Rowe Price Services, Inc.; Director, T. Rowe Price |
| | International, Inc.; Chief Executive Officer, Chairman of the Board, |
| | Director, and President, T. Rowe Price Trust Company; Chairman of |
| | the Board, all funds |
| |
| Brian C. Rogers, CFA, CIC | Chief Investment Officer, Director, and Vice President, T. Rowe Price; |
| (1955) | Chairman of the Board, Chief Investment Officer, Director, and Vice |
| 2006 | President, T. Rowe Price Group, Inc.; Vice President, T. Rowe Price |
| [68] | Trust Company; Vice President, Value Fund |
| |
| *Each inside director serves until retirement, resignation, or election of a successor. |
| Officers | |
| |
| Name (Year of Birth) | |
| Title and Fund(s) Served | Principal Occupation(s) |
| |
| Jeffrey W. Arricale, CPA (1971) | Vice President, T. Rowe Price and T. Rowe Price |
| Vice President, Value Fund | Group, Inc. |
| |
| Peter J. Bates, CFA (1974) | Vice President, T. Rowe Price and T. Rowe Price |
| Vice President, Value Fund | Group, Inc.; formerly intern, T. Rowe Price (to |
| | 2004); Vice President of Finance, Rent-A-Center, |
| | Inc. (to 2003) |
| |
| Timothy F. Bei, CFA (1973) | Vice President, T. Rowe Price and T. Rowe Price |
| Vice President, Value Fund | Group, Inc.; formerly student, University of |
| | Virginia (to 2003) |
| |
| Andrew M. Brooks (1956) | Vice President, T. Rowe Price and T. Rowe Price |
| Vice President, Value Fund | Group, Inc. |
| |
| Ira W. Carnahan (1963) | Vice President, T. Rowe Price; formerly |
| Vice President, Value Fund | Associate Editor, Forbes Magazine (to 2005) |
| |
| Joseph A. Carrier, CPA (1960) | Vice President, T. Rowe Price, T. Rowe Price |
| Treasurer, Value Fund | Group, Inc., T. Rowe Price Investment Services, |
| | Inc., and T. Rowe Price Trust Company |
| |
| Kara Cheseby, CFA (1963) | Vice President, T. Rowe Price and T. Rowe Price |
| Vice President, Value Fund | Group, Inc. |
| |
| Roger L. Fiery III, CPA (1959) | Vice President, T. Rowe Price, T. Rowe Price |
| Vice President, Value Fund | Group, Inc., T. Rowe Price International, Inc., |
| | and T. Rowe Price Trust Company |
| |
| John R. Gilner (1961) | Chief Compliance Officer and Vice President, |
| Chief Compliance Officer, Value Fund | T. Rowe Price; Vice President, T. Rowe Price |
| | Group, Inc., and T. Rowe Price Investment |
| | Services, Inc. |
| |
| David R. Giroux, CFA (1975) | Vice President, T. Rowe Price, T. Rowe Price |
| Vice President, Value Fund | Group, Inc., and T. Rowe Price Trust Company |
| |
| Gregory S. Golczewski (1966) | Vice President, T. Rowe Price and T. Rowe Price |
| Vice President, Value Fund | Trust Company |
| Henry H. Hopkins (1942) | Director and Vice President, T. Rowe Price |
| Vice President, Value Fund | Investment Services, Inc., T. Rowe Price Services, |
| | Inc., and T. Rowe Price Trust Company; Vice |
| | President, T. Rowe Price, T. Rowe Price Group, |
| | Inc., T. Rowe Price International, Inc., and |
| | T. Rowe Price Retirement Plan Services, Inc. |
| |
| John D. Linehan, CFA (1965) | Vice President, T. Rowe Price and T. Rowe Price |
| President, Value Fund | Group, Inc. |
| |
| Patricia B. Lippert (1953) | Assistant Vice President, T. Rowe Price and |
| Secretary, Value Fund | T. Rowe Price Investment Services, Inc. |
| |
| Heather K. McPherson, CPA (1967) | Vice President, T. Rowe Price and T. Rowe Price |
| Vice President, Value Fund | Group, Inc. |
| |
| Eric L. Veiel, CFA (1972) | Vice President, T. Rowe Price and T. Rowe Price |
| Vice President, Value Fund | Group, Inc.; formerly Senior Equity Analyst, |
| | Wachovia Securities (to 2005) |
| |
| Julie L. Waples (1970) | Vice President, T. Rowe Price |
| Vice President, Value Fund | |
| |
| Unless otherwise noted, officers have been employees of T. Rowe Price or T. Rowe Price International for at least |
| five years. | |
Item 2. Code of Ethics.
The registrant has adopted a code of ethics, as defined in Item 2 of Form N-CSR, applicable to its principal executive officer, principal financial officer, principal accounting officer or controller, or persons performing similar functions. A copy of this code of ethics is filed as an exhibit to this Form N-CSR. No substantive amendments were approved or waivers were granted to this code of ethics during the period covered by this report.
Item 3. Audit Committee Financial Expert.
The registrant’s Board of Directors/Trustees has determined that Ms. Karen N. Horn qualifies as an audit committee financial expert, as defined in Item 3 of Form N-CSR. Ms. Horn is considered independent for purposes of Item 3 of Form N-CSR.
Item 4. Principal Accountant Fees and Services.
(a) – (d) Aggregate fees billed to the registrant for the last two fiscal years for professional services rendered by the registrant’s principal accountant were as follows:
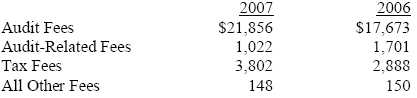
Audit fees include amounts related to the audit of the registrant’s annual financial statements and services normally provided by the accountant in connection with statutory and regulatory filings. Audit-related fees include amounts reasonably related to the performance of the audit of the registrant’s financial statements and specifically include the issuance of a report on internal controls and, if applicable, agreed-upon procedures related to fund acquisitions. Tax fees include amounts related to services for tax compliance, tax planning, and tax advice. The nature of these services specifically includes the review of distribution calculations and the preparation of Federal, state, and excise tax returns. All other fees include the registrant’s pro-rata share of amounts for agreed-upon procedures in conjunction with service contract approvals by the registrant’s Board of Directors/Trustees.
(e)(1) The registrant’s audit committee has adopted a policy whereby audit and non-audit services performed by the registrant’s principal accountant for the registrant, its investment adviser, and any entity controlling, controlled by, or under common control with the investment adviser that provides ongoing services to the registrant require pre-approval in advance at regularly scheduled audit committee meetings. If such a service is required between regularly scheduled audit committee meetings, pre-approval may be authorized by one audit committee member with ratification at the next scheduled audit committee meeting. Waiver of pre-approval for audit or non-audit services requiring fees of a de minimis amount is not permitted.
(2) No services included in (b) – (d) above were approved pursuant to paragraph (c)(7)(i)(C) of Rule 2-01 of Regulation S-X.
(f) Less than 50 percent of the hours expended on the principal accountant’s engagement to audit the registrant’s financial statements for the most recent fiscal year were attributed to work performed by persons other than the principal accountant’s full-time, permanent employees.
(g) The aggregate fees billed for the most recent fiscal year and the preceding fiscal year by the registrant’s principal accountant for non-audit services rendered to the registrant, its investment adviser, and any entity controlling, controlled by, or under common control with the investment adviser that provides ongoing services to the registrant were $1,486,000 and $1,401,000, respectively, and were less than the aggregate fees billed for those same periods by the registrant’s principal accountant for audit services rendered to the T. Rowe Price Funds.
(h) All non-audit services rendered in (g) above were pre-approved by the registrant’s audit committee. Accordingly, these services were considered by the registrant’s audit committee in maintaining the principal accountant’s independence.
Item 5. Audit Committee of Listed Registrants.
Not applicable.
Item 6. Schedule of Investments.
Not applicable. The complete schedule of investments is included in Item 1 of this Form N-CSR.
Item 7. Disclosure of Proxy Voting Policies and Procedures for Closed-End Management Investment Companies.
Not applicable.
Item 8. Portfolio Managers of Closed-End Management Investment Companies.
Not applicable.
Item 9. Purchases of Equity Securities by Closed-End Management Investment Company and Affiliated Purchasers.
Not applicable.
Item 10. Submission of Matters to a Vote of Security Holders.
Not applicable.
Item 11. Controls and Procedures.
(a) The registrant’s principal executive officer and principal financial officer have evaluated the registrant’s disclosure controls and procedures within 90 days of this filing and have concluded that the registrant’s disclosure controls and procedures were effective, as of that date, in ensuring that information required to be disclosed by the registrant in this Form N-CSR was recorded, processed, summarized, and reported timely.
(b) The registrant’s principal executive officer and principal financial officer are aware of no change in the registrant’s internal control over financial reporting that occurred during the registrant’s second fiscal quarter covered by this report that has materially affected, or is reasonably likely to materially affect, the registrant’s internal control over financial reporting.
Item 12. Exhibits.
(a)(1) The registrant’s code of ethics pursuant to Item 2 of Form N-CSR is attached.
(2) Separate certifications by the registrant's principal executive officer and principal financial officer, pursuant to Section 302 of the Sarbanes-Oxley Act of 2002 and required by Rule 30a-2(a) under the Investment Company Act of 1940, are attached.
(3) Written solicitation to repurchase securities issued by closed-end companies: not applicable.
(b) A certification by the registrant's principal executive officer and principal financial officer, pursuant to Section 906 of the Sarbanes-Oxley Act of 2002 and required by Rule 30a-2(b) under the Investment Company Act of 1940, is attached.
| | |
SIGNATURES |
| |
| | Pursuant to the requirements of the Securities Exchange Act of 1934 and the Investment |
| Company Act of 1940, the registrant has duly caused this report to be signed on its behalf by the |
| undersigned, thereunto duly authorized. |
| |
| T. Rowe Price Value Fund, Inc. |
| |
| |
| By | /s/ Edward C. Bernard |
| | Edward C. Bernard |
| | Principal Executive Officer |
| |
| Date | February 19, 2008 |
| |
| |
| |
| | Pursuant to the requirements of the Securities Exchange Act of 1934 and the Investment |
| Company Act of 1940, this report has been signed below by the following persons on behalf of |
| the registrant and in the capacities and on the dates indicated. |
| |
| |
| By | /s/ Edward C. Bernard |
| | Edward C. Bernard |
| | Principal Executive Officer |
| |
| Date | February 19, 2008 |
| |
| |
| |
| By | /s/ Joseph A. Carrier |
| | Joseph A. Carrier |
| | Principal Financial Officer |
| |
| Date | February 19, 2008 |