MANAGEMENT’S DISCUSSION AND ANALYSIS
Management’s Discussion and Analysis
BMO’s President and Chief Executive Officer and its Executive Vice-President and Chief Financial Officer have signed a statement outlining management’s responsibility for financial information in the annual consolidated financial statements and Management’s Discussion and Analysis (MD&A). The statement, which can be found on page 112, also explains the roles of the Audit Committee and Board of Directors in respect of that financial information.
The MD&A comments on BMO’s operations and financial condition for the years ended October 31, 2011 and 2010. The MD&A should be read in conjunction with our consolidated financial statements for the year ended October 31, 2011. The MD&A commentary is as of December 6, 2011. Unless otherwise indicated, all amounts are stated in Canadian dollars and have been derived from financial statements prepared in accordance with Canadian generally accepted accounting principles (GAAP).
Certain prior year data has been reclassified to conform with the current year’s presentation, including restatements arising from transfers of certain businesses between operating groups. See pages 44 and 45.
| | | | |
| | 27 | | Who We Are provides an overview of BMO Financial Group, explains the links between our financial objectives and our overall vision, and outlines “Reasons to invest in BMO” along with relevant key performance data. |
| | 28 | | Enterprise-Wide Strategy outlines our enterprise-wide strategy and the context in which it is developed, as well as our progress in relation to our priorities. |
| | 29 | | Caution Regarding Forward-Looking Statements advises readers about the limitations and inherent risks and uncertainties of forward-looking statements. |
| | 30 | | Factors That May Affect Future Results outlines certain industry and company-specific factors that investors should consider when assessing BMO’s earnings prospects. |
| | 32 | | Economic Developments includes commentary on the impact of the economy on our businesses in 2011 and our expectations for the Canadian and U.S. economies in 2012. |
| | | | Value Measures reviews financial performance on the four key measures that assess or most directly influence shareholder return. It also includes a summary of adjusting items that are excluded from results to assist in the review of key measures and adjusted results. |
| | 33 | | Total Shareholder Return |
| | 34 | | Adjusting Items |
| | 34 | | Earnings per Share Growth |
| | 35 | | Return on Equity |
| | 35 | | Net Economic Profit Growth |
| | 36 | | Acquisition of Marshall & Ilsley Corporation (M&I)provides an overview of the major acquisition completed in 2011. |
| | 37 | | 2011 Financial Performance Review provides a detailed review of BMO’s consolidated financial performance by major income statement category. It also includes summaries of the impact of business acquisitions and changes in foreign exchange rates. |
| | | | Operating Group Review outlines the strategies of our operating groups, how they choose to differentiate their businesses and the challenges they face, along with their strengths and key value drivers. It also includes a summary of their achievements in 2011, their priorities for 2012, the business environment and a review of their financial performance for the year. |
| | | | | | |
| | 44 | | Summary | | |
| | 46 | | Personal and Commercial Banking | | |
| | 47 | | Personal and Commercial Banking Canada | | |
| | 50 | | Personal and Commercial Banking U.S. | | |
| | 53 | | Private Client Group | | |
| | 56 | | BMO Capital Markets | | |
| | 59 | | Corporate Services, including Technology and Operations | | |
| | | | Financial Condition Review comments on our assets and liabilities by major balance sheet category. It includes a review of our capital adequacy and our approach to optimizing our capital position to support our business strategies and maximize returns to our shareholders. It outlines proposed regulatory changes that are expected to impact capital and liquidity management as well as certain business operations. It also includes a review of off-balance sheet arrangements and certain select financial instruments and European balances. | | |
| | 59 | | Summary Balance Sheet | | |
| | 61 | | Enterprise-Wide Capital Management | | |
| | 65 | | Select Financial Instruments | | |
| | 69 | | U.S. Regulatory Developments | | |
| | 70 | | Off-Balance Sheet Arrangements | | |
| | | | Accounting Matters and Disclosure and Internal Control reviews critical accounting estimates and changes in accounting policies in 2011 and for future periods. It also outlines our evaluation of disclosure controls and procedures and internal control over financial reporting. | | |
| | 70 | | Critical Accounting Estimates | | |
| | 73 | | Changes in Accounting Policies in 2011 | | |
| | 73 | | Future Changes in Accounting Policies – IFRS | | |
| | 77 | | Disclosure Controls and Procedures and Internal Control over Financial Reporting | | |
| | 77 | | Shareholders’ Auditors’ Services and Fees | | |
| | 78 | | Enterprise-Wide Risk Management outlines our approach to managing the key financial risks and other related risks we face. | | |
| | 94 | | Non-GAAP Measures includes explanations of non-GAAP measures and a reconciliation to their GAAP counterparts for the fiscal year and fourth quarter. | | |
| | | |
| | 96 | | 2010 Performance Review, Review of Fourth Quarter Performanceand Quarterly Earnings Trends provide commentary on results for relevant periods other than fiscal 2011. | | |
| | | |
| | 100 | | Supplemental Information presents other useful financial tables and more historical detail. | | |
Regulatory Filings
Our continuous disclosure materials, including our interim financial statements and interim MD&A, annual audited consolidated financial statements and annual MD&A, Annual Information Form and Notice of Annual Meeting of Shareholders and Management Proxy Circular, are available on our website at www.bmo.com, on the Canadian Securities Administrators’ website at www.sedar.com and on the EDGAR section of the SEC’s website at www.sec.gov. BMO’s President and Chief Executive Officer and its Executive Vice-President and Chief Financial Officer certify the appropriateness and fairness of BMO’s annual and interim consolidated financial statements and MD&A and Annual Information Form, and the effectiveness of BMO’s disclosure controls and procedures and material changes in our internal control over financial reporting.
| | |
| 26 | | BMO Financial Group 194th Annual Report 2011 |
Who We Are
Established in 1817, BMO Financial Group is a highly diversified financial services provider based in North America. With total assets of $477 billion and 47,000 employees, BMO provides a broad range of retail banking, wealth management and investment banking products and services to more than 12 million customers. We serve more than seven million customers across Canada through our Canadian retail arm, BMO Bank of Montreal. We also serve customers through our wealth management businesses: BMO Nesbitt Burns, BMO InvestorLine, BMO Global Private Banking, BMO Global Asset Management and BMO Insurance. BMO Capital Markets, our North American investment and corporate banking division, provides a full suite of financial products and services to our North American and international clients. In the United States, BMO serves customers through BMO Harris Bank, an integrated financial services organization based in the U.S. Midwest with more than two million retail, small business and commercial customers. BMO Financial Group conducts business through three operating groups: Personal and Commercial Banking, Private Client Group and BMO Capital Markets.
Our Financial Objectives
BMO’s vision, guiding principle and medium-term financial objectives for certain important performance measures are set out in the adjacent chart. We believe that we will deliver top-tier total shareholder return and meet our medium-term financial objectives by aligning our operations with and executing on our strategic priorities, as outlined on the following page. We consider top-tier returns to be top-quartile shareholder returns relative to our Canadian and North American peer group.
BMO’s business planning process is rigorous and considers the prevailing economic conditions, our customers’ evolving needs and the opportunities available across our lines of business. It includes clear and direct accountability for annual performance that is measured against internal and external benchmarks and progress towards our strategic priorities.
Over the medium term, our financial objectives are to achieve average annual adjusted earnings per share (EPS) growth of 8% to 10%, earn average annual adjusted return on equity (ROE) of between 15% and 18%, generate average annual adjusted operating leverage of 2% or more, and maintain strong capital ratios that exceed regulatory requirements. These objectives are key guideposts as we execute against our strategic priorities. Our operating philosophy is to increase revenues at rates higher than general economic growth rates, while limiting expense growth to achieve average annual adjusted operating leverage (defined as the difference between the growth rates of adjusted revenue and adjusted non-interest expense) of 2% or more. In managing our operations, we balance current profitability with the need to invest in our businesses for future growth.
|
Our Vision To be the bank that defines great customer experience. |
|
Our Guiding Principle We aim to deliver top-tier total shareholder return and balance our commitments to financial performance, our customers, our employees, the environment and the communities where we live and work. |
Our Medium-Term Financial Objectives Over the medium term, achieve average annual adjusted EPS growth of 8% to 10%, earn average annual adjusted ROE of between 15% and 18%, generate average annual adjusted operating leverage of 2% or more, and maintain strong capital ratios that exceed regulatory requirements. |
Reasons to Invest in BMO Ÿ Clear growth strategy Ÿ Well-positioned businesses in the current environment Ÿ Strong financial position Ÿ Proactive risk management Ÿ Commitment to stakeholders |
| | | | | | | | | | | | | | | | |
| | | As at or for the periods ended October 31, 2011 (%, except as noted) | | 1-year | | | 5-year | | | 10-year | | | |
| | Compound annual total shareholder return | | | 2.4 | | | | 1.9 | | | | 10.2 | | | |
| | Compound growth in annual EPS | | | 10.7 | | | | 0.4 | | | | 7.1 | | | |
| | Compound growth in annual adjusted EPS | | | 10.0 | | | | na | | | | na | | | |
| | Average annual ROE | | | 15.3 | | | | 13.6 | | | | 15.2 | | | |
| | Average annual adjusted ROE | | | 15.3 | | | | na | | | | na | | | |
| | Compound growth in annual dividends declared per share | | | – | | | | 4.4 | | | | 9.6 | | | |
| | Dividend yield at October 31, 2011 | | | 4.75 | | | | na | | | | na | | | |
| | Price-to-earnings multiple | | | 11.20 | | | | na | | | | na | | | |
| | Market value/book value ratio | | | 1.49 | | | | na | | | | na | | | |
| | Common Equity Ratio | | | 9.59 | | | | na | | | | na | | | |
| | | | | | | | | | | | | | | | |
| | Adjusted results in this section are non-GAAP and are discussed in the Non-GAAP Measures section on page 94. |
The Our Financial Objectives section above and the Enterprise-Wide Strategy and Economic Developments sections that follow contain certain forward-looking statements. By their nature, forward-looking statements require us to make assumptions and are subject to inherent risks and uncertainties. Please refer to the Caution Regarding Forward-Looking Statements on page 29 of this MD&A for a discussion of such risks and uncertainties and the material factors and assumptions related to the statements set forth in such sections.
| | | | |
| BMO Financial Group 194th Annual Report 2011 | | | 27 | |
MANAGEMENT’S DISCUSSION AND ANALYSIS
Enterprise-Wide Strategy
Our Vision
To be the bank that defines great customer experience.
Our Guiding Principle
We aim to deliver top-tier total shareholder return and balance our commitments to financial performance, our customers, our employees, the environment and the communities where we live and work.
Our Strategy in Context
Changes in the economic environment, and their effects on our customers, are ongoing. Our focus on helping our customers succeed and giving them confidence they are making the right financial choices — Making Money Make Sense — serves as a compass for us in all economic environments. It also drives our employees to deliver their best, every day.
Our strategies have proven robust despite significant market uncertainty over the past few years. Recognizing that a company’s first responsibility is to be well managed, we believe that the strength of our business model, balance sheet, risk management framework and leadership team, along with the benefits we expect from the acquisition of Marshall & Ilsley Corporation (M&I) and its successful integration, will continue to generate sustainable growth. We remain steadfastly committed to our strategy, our customers and our shareholders.
Our Priorities and Progress
Drive quality earnings growth across all North American personal and commercial banking businesses by focusing on industry-leading customer experience and enhancing operating and sales force productivity.
In Canada:
| Ÿ | | Strengthened our branch network, opening or upgrading 58 branches and significantly expanding our automated banking machine (ABM) network by adding 136 machines. |
| Ÿ | | Increased the number of mortgage specialists by 13%, financial planners by 9%, commercial cash management specialists and support staff by 18%, and added 150 small business bankers. |
| Ÿ | | Significantly improved the online customer experience, ranking second among the public websites of the largest Canadian banks in Forrester Research Inc.’s 2011 Canadian Online Bank Rankings (July 2011). |
| Ÿ | | Launched compelling new offers, including BMO SmartSteps for Parents, BMO Mobile Banking, a new Online Banking for Business site and a new online personal account application. BMO MoneyLogic continues to be popular, with 280,000 customers using the application. |
| Ÿ | | Invested $43 million in training and development for front-line employees, focusing on improving the quality and consistency of the customer experience, which drives improvement in our loyalty scores. |
In the United States:
| Ÿ | | We now have a significant market presence in eight U.S. states, primarily focused in the U.S. Midwest. The integration of the acquired M&I business is a key focus for the organization and it is well underway. |
| Ÿ | | BMO Harris Bank was ranked as the most reputable U.S. bank by Reputation Institute in a study conducted in collaboration withAmerican Banker. BMO Harris Bank improved on its top 10 ranking from 2010. |
| Ÿ | | Our personal banking Net Promoter Score (excluding M&I) was 43, an increase of three points from 2010. |
| Ÿ | | Continued to help our customers with their financial needs with Helpful Steps; launched Helpful Steps for Small Business and Parents; and strengthened our New Customer Welcome Program. |
| Ÿ | | For the third year in a row, BMO Harris Contact Center was certified as a Center of Excellence by BenchmarkPortal, reflecting our focus on maintaining the highest-quality distribution network. |
| Ÿ | | Customer retention rates continue to be strong. |
Accelerate the growth of our wealth management businesses by helping our broad range of clients meet all their wealth management needs and by continuing to invest in our North American and global operations.
| Ÿ | | Launched Retirement Savings Outlook, an innovative online tool to help clients determine how much money they need for retirement. |
| Ÿ | | Developed an enhanced creditor insurance offering that increased sales. |
| Ÿ | | Achieved significant ongoing success with joint deal teams, better addressing the complex financial needs of our clients. |
| Ÿ | | The M&I acquisition almost doubled our U.S. private banking footprint. With the acquisition of M&I and Lloyd George Management (LGM), our global asset management business is now one of the 100 largest investment managers worldwide based on assets under management. |
| Ÿ | | In the United States, we now have an established family of mutual funds, a large team of financial advisors and strong capabilities in institutional trust services. |
| Ÿ | | Expanded our Exchange Traded Funds family of lower-cost and risk-diversifying investment products to 44 funds. |
Build deeper client relationships in our capital markets businesses to deliver growth in net income and strong ROE, while maintaining an appropriate risk/return profile.
| Ÿ | | Continued to build a North American Capital Markets business with a unified approach to client coverage, creating a better client experience. |
| Ÿ | | Strengthened our distribution capabilities, including designation as a Primary Dealer by the Federal Reserve Bank of New York, augmenting our U.S. Fixed Income business. |
| Ÿ | | Aligned our capital and capabilities with client opportunity, including expanding our capabilities in U.S. Equity Research and Sales & Trading, as well as extending our Metals & Mining capabilities beyond North America, while also introducing a standardized client prioritization system for Investment and Corporate Banking business in Canada and the United States. |
| Ÿ | | Focused on strategic sectors by expanding coverage in Investment and Corporate Banking and in Research in sectors such as Food & Consumer & Retail, Energy and Technology. |
| Ÿ | | Upgraded talent across our North American and global sectors. |
Develop our business in select global markets to grow with our clients, expand our capabilities and reach new customers.
| Ÿ | | Strengthened our presence in China and globally by expanding our footprint in existing markets and exploring new opportunities to address our current and potential clients’ specific wealth management and capital markets needs. |
| | |
| 28 | | BMO Financial Group 194th Annual Report 2011 |
Sustain a culture that focuses on customers, high performance and our people.
| Ÿ | | Enhanced our offering at BMO’s Institute for Learning, our educational facility that develops inspirational leaders and passionate, customer-focused employees, while fostering BMO’s culture of integrity and ethical decision-making. |
| Ÿ | | Continued to enhance our leading talent management practices, reaffirming BMO as an employer of choice where everyone can contribute to their fullest and strong performance is rewarded. |
| Ÿ | | Sustained a high-performance risk management culture that continually focuses on strengthening and embedding our risk management capabilities and practices across the enterprise. |
| Ÿ | | Strengthened our Technology and Operations (T&O) leadership team, launched a comprehensive communications plan to engage all 9,700 of our T&O employees, and continued to drive productivity improvements across T&O and build capabilities to support our business in delivering a great customer experience. |
| | | | |
| | |
| | Caution Regarding Forward-Looking Statements Bank of Montreal’s public communications often include written or oral forward-looking statements. Statements of this type are included in this Annual Report, and may be included in other filings with Canadian securities regulators or the U.S. Securities and Exchange Commission, or in other communications. All such statements are made pursuant to the “safe harbor” provisions of, and are intended to be forward-looking statements under, the United StatesPrivate Securities Litigation Reform Actof 1995 and any applicable Canadian securities legislation. Forward-looking statements may involve, but are not limited to, comments with respect to our objectives and priorities for 2012 and beyond, our strategies or future actions, our targets, expectations for our financial condition or share price, and the results of or outlook for our operations or for the Canadian and U.S. economies. By their nature, forward-looking statements require us to make assumptions and are subject to inherent risks and uncertainties. There is significant risk that predictions, forecasts, conclusions or projections will not prove to be accurate, that our assumptions may not be correct and that actual results may differ materially from such predictions, forecasts, conclusions or projections. We caution readers of this Annual Report not to place undue reliance on our forward-looking statements as a number of factors could cause actual future results, conditions, actions or events to differ materially from the targets, expectations, estimates or intentions expressed in the forward-looking statements. The future outcomes that relate to forward-looking statements may be influenced by many factors, including but not limited to: general economic and market conditions in the countries in which we operate; weak, volatile or illiquid capital and/or credit markets; interest rate and currency value fluctuations; changes in monetary, fiscal or economic policy; the degree of competition in the geographic and business areas in which we operate; changes in laws or in supervisory expectations or requirements, including capital, interest rate and liquidity requirements and guidance; judicial or regulatory proceedings; the accuracy and completeness of the information we obtain with respect to our customers and counterparties; our ability to execute our strategic plans and to complete and integrate acquisitions; critical accounting estimates and the effect of changes to accounting standards, rules and interpretations on these estimates; operational and infrastructure risks; changes to our credit ratings; general political conditions; global capital markets activities; the possible effects on our business of war or terrorist activities; disease or illness that affects local, national or international economies; natural disasters and disruptions to public infrastructure, such as transportation, communications, power or water supply; technological changes; and our ability to anticipate and effectively manage risks associated with all of the foregoing factors. With respect to the recently completed acquisition of Marshall & Ilsley Corporation (M&I), factors that may influence the future outcomes that relate to forward-looking statements include, but are not limited to: the possibility that the anticipated benefits from the transaction, such as expanding our North American presence, providing synergies, being accretive to earnings and resulting in other impacts on earnings, are not realized in the time frame anticipated, or at all, as a result of changes in general economic and market conditions, interest and exchange rates, monetary policy, laws and regulations (including changes to capital requirements) and their enforcement, and the degree of competition in the geographic and business areas in which the combined business now operates; our ability to effectively integrate the businesses of M&I and BMO on a timely basis; reputational risks and the reaction of M&I’s customers to the transaction; diversion of management time to issues related to integration and restructuring; and increased exposure to exchange rate fluctuations. A significant amount of M&I’s business involved making loans or otherwise committing resources to specific borrowers, industries or geographic areas. Unforeseen events affecting such borrowers, industries or geographic areas could have a material adverse effect on the performance of our integrated U.S. operations. Our anticipation that annual cost savings from the integration of M&I and BMO will exceed US$300 million is based on the assumption that changes to business operations and support infrastructure and staffing will be consistent with our plans and that our expectations for business volumes are met. Our anticipation that the M&I acquisition will be accretive to adjusted earnings per share in 2012 is based on the assumption that results in 2012 will be consistent with our expectations based on our experience since the acquisition, our expectations for the economy and anticipated savings from integration and restructuring in 2012. We caution that the foregoing list is not exhaustive of all possible factors. Other factors could adversely affect our results. For more information, please see the discussion below, which outlines in detail certain key factors that may affect Bank of Montreal’s future results. When relying on forward-looking statements to make decisions with respect to Bank of Montreal, investors and others should carefully consider these factors, as well as other uncertainties and potential events, and the inherent uncertainty of forward-looking statements. Bank of Montreal does not undertake to update any forward-looking statements, whether written or oral, that may be made from time to time by the organization or on its behalf, except as required by law. The forward-looking information contained in this document is presented for the purpose of assisting our shareholders in understanding our financial position as at and for the periods ended on the dates presented, as well as our strategic priorities and objectives, and may not be appropriate for other purposes. In calculating the pro-forma impact of Basel III on our regulatory capital, risk-weighted assets (including Counterparty Credit Risk and Market Risk) and regulatory capital ratios, we have assumed that our interpretation of the proposed rules announced by the Basel Committee on Banking Supervision (BCBS) as of this date and our models used to assess those requirements are consistent with the final requirements that will be promulgated by BCBS and the Office of the Superintendent of Financial Institutions Canada (OSFI). We have also assumed that the proposed changes affecting capital deductions, risk-weighted assets, the regulatory capital treatment for non-common share capital instruments (i.e. grandfathered capital instruments) and the minimum regulatory capital ratios are adopted as proposed by BCBS and OSFI. We have also assumed that existing capital instruments that are non-Basel III compliant but are Basel II compliant can be fully included in the October 31, 2011, pro-forma calculations. The full impact of the Basel III proposals has been quantified based on our financial and risk positions at year end or as close to year end as was practical. The impacts of the transition to International Financial Reporting Standards (IFRS) are set out in Transition to International Financial Reporting Standards in the Future Changes in Accounting Policies – IFRS section in this Annual Report. In setting out the expectation that we will be able to refinance certain capital instruments in the future, as and when necessary to meet regulatory capital requirements, we have assumed that factors beyond our control, including the state of the economic and capital markets environment, will not impair our ability to do so. Assumptions about the level of asset sales, expected asset sale prices, net funding cost, credit quality, risk of default and losses on default of the underlying assets of certain structured investment vehicles were material factors we considered when establishing our expectations regarding the structured investment vehicles discussed in this Annual Report, including the amount to be drawn under the BMO liquidity facilities and whether the first-loss protection provided by the subordinated capital notes will exceed future losses. Key assumptions included that assets will continue to be sold with a view to reducing the size of the structured investment vehicles, under various asset price scenarios, and that the level of default and losses will be consistent with the credit quality of the underlying assets and our current expectations regarding continuing difficult market conditions. In determining amounts of asset maturities by year, we have made assumptions as to which issuers will or will not redeem subordinated debt prior to its maturity date, where permitted. Assumptions about the level of default and losses on default were material factors we considered when establishing our expectations regarding the future performance of the transactions into which Apex Trust has entered. Among the key assumptions were that the level of default and losses on default will be consistent with historical experience. Material factors that were taken into account when establishing our expectations regarding the future risk of credit losses in Apex Trust and risk of loss to BMO included industry diversification in the portfolio, initial credit quality by portfolio, the first-loss protection incorporated into the structure and the hedges that BMO has entered. In determining the impact of reductions to interchange fees in the U.S. Regulatory Developments section, we have assumed that business volumes remain consistent with our expectations and that certain management actions are implemented that will modestly reduce the impact of the rules on our revenues. Assumptions about the performance of the Canadian and U.S. economies, as well as overall market conditions and their combined effect on our business, are material factors we consider when determining our strategic priorities, objectives and expectations for our business. In determining our expectations for economic growth, both broadly and in the financial services sector, we primarily consider historical economic data provided by the Canadian and U.S. governments and their agencies. See the Economic Developments section of this Annual Report. | | |
| | | | |
| BMO Financial Group 194th Annual Report 2011 | | | 29 | |
MANAGEMENT’S DISCUSSION AND ANALYSIS
Factors That May Affect Future Results
As noted in the preceding Caution Regarding Forward-Looking Statements, all forward-looking statements and information, by their nature, are subject to inherent risks and uncertainties, both general and specific, which may cause actual results to differ materially from the expectations expressed in any forward-looking statement. The Enterprise-Wide Risk Management section starting on page 78 describes a number of risks, including credit and counterparty, market, liquidity and funding, operational, insurance, legal and regulatory, business, model, strategic, reputation and environmental. Should our risk management framework prove ineffective, there could be a material adverse impact on our financial position. The sections that follow outline some additional risks and uncertainties.
General Economic and Market Conditions in the Countries in which We Conduct Business
We conduct business in Canada, the United States and other countries. Factors such as the general health of capital and/or credit markets, including liquidity, level of activity, volatility and stability, could have a material impact on our business. As well, interest rates, foreign exchange rates, consumer saving and spending, consumer borrowing and repayment, business investment, government spending and the rate of inflation affect the business and economic environments in which we operate. Therefore, the amount of business we conduct in a specific geographic region and its local economic and business conditions may have an effect on our revenues and earnings. For example, a regional economic decline may result in an increase in credit losses, a decrease in loan growth and reduced capital markets activity. In addition, the financial services industry is characterized by interrelations among financial services companies. As a result, defaults by other financial services companies in Canada, the United States or other countries could adversely affect our earnings. Given the interconnectedness of global financial markets and the importance of trade flows, deterioration of the still-unresolved European sovereign debt situation could affect the supply and cost of credit and constrain the pace of economic growth in North America.
Fiscal, Monetary and Interest Rate Policies
Our earnings are affected by fiscal, monetary, interest rate and economic policies that are adopted by Canadian, U.S. and other regulatory authorities. Such policies can have the effect of reducing competition and increasing uncertainty in the markets. Such policies may also adversely affect our customers and counterparties in the countries in which we operate, causing an increased risk of default by these customers and counterparties. As well, bond and money market expectations about inflation and central bank monetary policy have an impact on the level of interest rates. Changes in market expectations and monetary policy are difficult to anticipate and predict. Fluctuations in interest rates that result from these changes can have an impact on our earnings. The current prolonged low interest rate policies have had a negative impact on results and a continuation of such policies would likely continue to pressure earnings. Refer to the Market Risk section on pages 85 to 88 for a more complete discussion of our interest rate risk exposures.
Changes in Laws, Regulations and Approach to Supervision
Regulations are in place to protect our clients, investors and the public interest. Considerable changes in laws and regulations that relate to the financial services industry have been proposed, including changes related to capital and liquidity requirements. Changes in laws and regulations, including their interpretation and application, and in approaches to supervision could adversely affect our earnings. For example, such changes could limit the products or services we can provide and the manner in which we provide them and, potentially, lower our ability to
compete, while also increasing the costs of compliance. These changes could also affect the levels of capital and liquidity we choose to maintain. In particular, the Basel III global standards for capital and liquidity, which are discussed in the Enterprise-Wide Capital Management section that starts on page 61, and enactment of theDodd-Frank Wall Street Reform and ConsumerProtection Act, which is discussed in the U.S. Regulatory Developments section on page 69, will have an impact on our results or activities. Liquidity and funding risk is discussed starting on page 88. In addition to the factors outlined here, our failure to comply with laws and regulations could result in sanctions and financial penalties that could adversely affect our reputation and earnings.
Execution of Strategy
Our financial performance is influenced by our ability to execute strategic plans developed by management. If these strategic plans do not meet with success or if there is a change in these strategic plans, our earnings could grow at a slower pace or decline. In addition, our ability to execute our strategic plans is dependent to a large extent on our ability to attract, develop and retain key executives, and there is no assurance we will continue to do so successfully.
Acquisitions
We conduct thorough due diligence before completing an acquisition. However, it is possible that we might make an acquisition that subsequently does not perform in line with our financial or strategic objectives. Our ability to successfully complete an acquisition may be subject to regulatory and shareholder approvals and we may not be able to determine when or if, or on what terms, the necessary approvals will be granted. Changes in the competitive and economic environment as well as other factors may lower revenues, while higher than anticipated integration costs and failure to realize expected cost savings could also adversely affect our earnings after an acquisition. Integration costs may increase as a result of increased regulatory costs related to an acquisition, unanticipated costs that were not identified in the due diligence process or more significant demands on management time than anticipated, as well as unexpected delays in implementing certain plans that in turn lead to delays in achieving full integration. In particular, risks associated with the acquisition of M&I are discussed in the Acquisition of Marshall & Ilsley Corporation (M&I) section on page 36. Our post-acquisition performance is also contingent on retaining the clients and key employees of acquired companies, and there can be no assurance that we will always succeed in doing so.
Level of Competition
The level of competition among financial services companies is high. Furthermore, non-financial companies have increasingly been offering services traditionally provided by banks. Customer loyalty and retention can be influenced by a number of factors, including service levels, prices for products or services, our reputation and the actions of our competitors. Also, laws and regulations enacted by regulatory authorities in the United States and other jurisdictions in which we operate may provide benefits to our international competitors that could affect our ability to compete. Changes in these factors or any subsequent loss of market share could adversely affect our earnings.
Currency Rates
The Canadian dollar equivalents of our revenues and expenses denominated in currencies other than the Canadian dollar are subject to fluctuations in the value of the Canadian dollar relative to those currencies. Changes in the value of the Canadian dollar relative to the U.S. dollar may also affect the earnings of our small business, corporate and commercial clients in Canada. Refer to the Foreign Exchange section on page 38 and the Market Risk section on pages 85 to 88 for a more complete discussion of our foreign exchange risk exposures.
| | |
| 30 | | BMO Financial Group 194th Annual Report 2011 |
Changes to Our Credit Ratings
Credit ratings are important to our ability to raise both capital and funding to support our business operations. Maintaining strong credit ratings allows us to access the capital markets at competitive pricing. Should our credit ratings experience a material downgrade, our costs of funding would likely increase significantly and our access to funding and capital through capital markets could be reduced. A material downgrade of our ratings could also have other consequences, including those set out in Note 10 on page 138 of the financial statements.
Operational and Infrastructure Risks
We are exposed to many of the operational risks that affect large enterprises conducting business in multiple jurisdictions. Such risks include the risk of fraud by employees or others, unauthorized transactions by employees, and operational or human error. We also face the risk that computer or telecommunications systems could fail, despite our efforts to maintain these systems in good working order. Some operational aspects of our services, such as online banking, have inherent security risks due to the nature of the risks related to the use of the internet in the delivery of these services, which may impact our customers and infrastructure. Given the high volume of transactions we process on a daily basis, certain errors may be repeated or compounded before they are discovered and rectified. Shortcomings or failures of our internal processes, employees or systems, or those provided by third parties, including any of our financial, accounting or other data processing systems, could lead to financial loss and damage our reputation. In addition, despite the contingency plans we have in place, our ability to conduct business may be adversely affected by a disruption in the infrastructure that supports both our operations and the communities in which we do business, including but not limited to disruption caused by public health emergencies or terrorist acts.
Judicial or Regulatory Judgments and Legal and Regulatory Proceedings
We take reasonable measures to comply with the laws and regulations of the jurisdictions in which we conduct business. Should these measures prove not to be effective, it is possible that we could be subject to a judicial or regulatory judgment or decision which results in fines, damages or other costs that would adversely affect our earnings and reputation. We are also subject to litigation arising in the ordinary course of our business. The unfavourable resolution of any litigation could have a material adverse effect on our financial results. Damage to our reputation could also result, harming our future business prospects. Information about certain legal and regulatory proceedings we currently face is provided in Note 28 on page 170 of the financial statements.
Critical Accounting Estimates and Accounting Standards
Beginning on November 1, 2011, we will prepare our financial statements in accordance with International Financial Reporting Standards (IFRS). Changes by the International Accounting Standards Board to international financial accounting and reporting standards that will govern the preparation of our financial statements can be difficult to anticipate and may materially affect how we record and report our financial results. The impact of the adoption of these standards is discussed in the Future Changes in Accounting Policies – IFRS section on page 73. Significant accounting policies and the impact of the adoption of IFRS are discussed in Note 1 on page 119 of the financial statements.
We currently prepare our financial statements in accordance with Canadian generally accepted accounting principles (GAAP). The application of GAAP and IFRS require that management make significant judgments and estimates that can affect when certain assets, liabilities, revenues and expenses are recorded in our financial statements and their recorded values. In making these judgments and estimates, we rely on the best information available at the time. However, it is possible that circumstances may change or new information may become available.
Our financial results would be affected in the period in which any such new information or change in circumstances became apparent, and the extent of the impact could be significant. More information is included in the discussion of Critical Accounting Estimates on page 70.
Accuracy and Completeness of Customer and Counterparty Information
When deciding to extend credit or enter into other transactions with customers and counterparties, we may rely on information provided by or on behalf of those customers and counterparties, including audited financial statements and other financial information. We also may rely on representations made by customers and counterparties that the information they provide is accurate and complete. Our financial results could be adversely affected if the financial statements or other financial information provided by customers and counterparties is materially misleading.
Other Factors
Other factors beyond our control that may affect our future results are noted in the Caution Regarding Forward-Looking Statements on page 29.
We caution that the preceding discussion of factors that may affect future results is not exhaustive. When relying on forward-looking statements to make decisions with respect to BMO, investors and others should carefully consider these factors, as well as other uncertainties, potential events and industry and company-specific factors that may adversely affect future results. We do not undertake to update any forward-looking statements, whether written or oral, that may be made from time to time by us or on our behalf, except as required by law.
| | | | |
| BMO Financial Group 194th Annual Report 2011 | | | 31 | |
MANAGEMENT’S DISCUSSION AND ANALYSIS
Economic Developments
Economic and Financial Services Developments in 2011
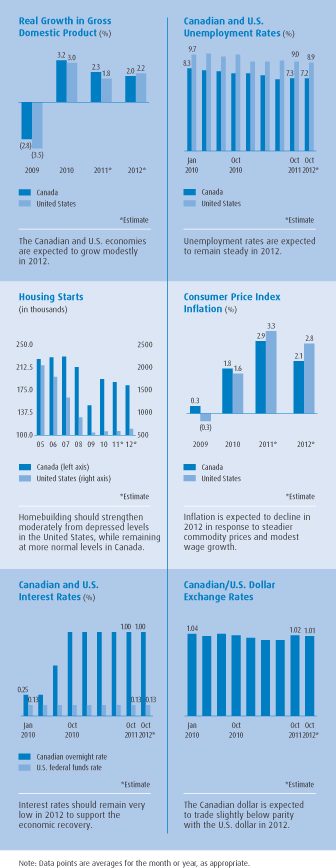
After recovering strongly in 2010, economic growth in Canada slowed to 2.3% in 2011. The export sector was the major constraint on growth as a result of the strong Canadian dollar and weak demand in the developed economies of the United States and Europe. Consumer spending also moderated in response to high levels of household debt, reducing personal loan growth. In contrast, business investment remained strong and business loan growth picked up in response to low interest rates and continued robust demand for resources from emerging-market economies. Housing markets also remained buoyant, supporting mortgage growth, but have moderated in response to tighter mortgage insurance rules. Employment growth remained healthy, reducing the unemployment rate. Despite low interest rates, personal deposit growth improved, reflecting a decrease in investors’ risk tolerance in the face of growing concerns about a U.S. recession and European sovereign debt and economic difficulties. Business deposit growth also remained healthy due to strong growth in profits and the uncertain investment climate.
Economic growth in the United States in 2011 is estimated to have slowed to 1.8% from 3% in 2010. While exports and business investment remained strong, consumer spending weakened, housing markets and commercial construction remained soft, and state and municipal governments continued to reduce spending and payrolls. In response to increased economic and fiscal uncertainty, businesses held back on hiring, undermining consumer spending. Demand for consumer credit and residential mortgages remained weak. The Federal Reserve maintained its near-zero rate policy and expanded its asset purchases in the first half of the year to support the economic recovery. In the Midwest, where most of our U.S. operations are located, the economy grew at an estimated 1.9%, with strong export sales and healthy manufacturing and agricultural activity offsetting soft housing markets and the effects of state and local budget cuts.
Economic and Financial Services Outlook for 2012
Assuming European credit and economic difficulties are contained, the Canadian economy is expected to continue growing at a real rate of close to 2% in 2012, led by the resource-producing Western provinces. Support from low interest rates and relatively high commodity prices will likely be offset by the effects of the strong Canadian dollar and slow growth in the developed economies. In this modest growth environment, the unemployment rate is likely to remain above 7%. Growth in residential mortgages and personal credit will likely moderate, although demand for business credit should continue to improve in response to strong investment spending. The Bank of Canada is expected to keep interest rates at low levels in 2012 to support the economic recovery. The Canadian dollar should trade slightly below parity with the U.S. dollar, supported by firm commodity prices.
The U.S. economy is projected to grow by approximately 2.2% in 2012, restrained by continued fiscal retrenchment at the state and municipal levels. Depending on the outcome of various budgetary and stimulus measures being considered by congress, growth could be weaker than expected. However, healthy business balance sheets will likely encourage investment growth, supporting demand for business credit. Housing markets and residential mortgage growth are expected to improve modestly in 2012, supported by the Federal Reserve’s low
interest rate policy. Continued uncertainty about Europe’s economy could constrain capital markets activity.
The U.S. Midwest economy is expected to grow 2.3% in 2012, a rate slightly faster than the national economy, supported by strong business investment, a pickup in the automotive industry and continued solid demand for farm products.
| | |
| 32 | | BMO Financial Group 194th Annual Report 2011 |
Value Measures
Highlights
| | Ÿ | | Total shareholder return (TSR) – Our three-year TSR was 17.4%, driven by annual returns of more than 20% in 2009 and 2010. |
| | Ÿ | | Earnings per share (EPS) growth – EPS grew 10% from 2010 on an adjusted basis, as net income rose significantly. There was good revenue growth, along with lower provisions for credit losses. Expenses increased at a slightly higher rate than revenues, but incremental revenues exceeded incremental costs, contributing to net income growth. There was a higher effective income tax rate in 2011. The average number of common shares outstanding increased, primarily due to the issuance of common shares on the acquisition of M&I. |
| Ÿ | | Net income increased $456 million or 16% to $3,266 million. Adjusted net income was up 15%, increasing $439 million to $3,281 million. There was continued growth in all operating groups. | |
| Ÿ | | Adjusted return on equity (ROE) was 15.3% in 2011, up from 15.0% in 2010 due to increased adjusted net income. BMO has achieved an ROE of 13% or better in 21 of the past 22 years, one of only two banks in our North American peer group to have done so. | |
| Ÿ | | We maintained our dividend payments at $2.80 per common share in 2011 while issuing common shares for the M&I acquisition and continuing to maintain strong capital levels. Dividends paid per common share over five-year and ten-year periods have increased at average annual compound rates of 5.6% and 9.9%, respectively. | |
Adjusted results in this section are non-GAAP and are discussed in the Non-GAAP Measures section on page 94.
Total Shareholder Return
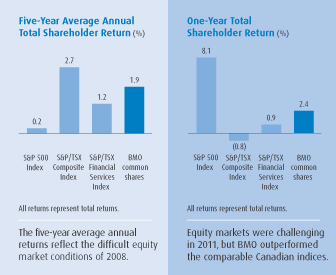
The five-year average annual TSR is a key measure of shareholder value and is the most important of our financial performance and condition measures, since it assesses our success in achieving our guiding principle of achieving top-tier shareholder returns. Over the past five years, shareholders have earned an average annual TSR of 1.9% on their investment in BMO common shares. The five-year average was suppressed primarily by the low valuations in the difficult equity market conditions of 2008. BMO’s one-year TSR of 2.4% was higher than the comparable Canadian indices. Annual returns of more than 20% in each of 2009 and 2010 resulted in a strong three-year average annual TSR of 17.4%.
The table below summarizes dividends paid on BMO common shares over the past five years and the movements in BMO’s share price. An investment of $1,000 in Bank of Montreal common shares made at the beginning of fiscal 2007 would have been worth $1,099 at October 31, 2011, assuming reinvestment of dividends, for a total return of 9.9%. We maintained our dividend payments at $0.70 per common share in each quarter of 2011, consistent with payments in the past two years, but dividends paid over five-year and ten-year periods have increased at average annual compound rates of 5.6% and 9.9%, respectively.
The average annual TSR of 1.9% for the most recent five-year period deteriorated from the 5.9% average annual return for the five years ended October 31, 2010. The averages are affected by each one-year TSR included in the calculations.
Thefive-year average annual total shareholder return (TSR) represents the average annual total return earned on an investment in Bank of Montreal common shares made at the beginning of a five-year period. The return includes the change in share price and assumes that dividends received were reinvested in additional common shares. The one-year TSR also assumes that dividends were reinvested in shares.
Total Shareholder Return
| | | | | | | | | | | | | | | | | | | | | | | | | | | | |
| For the year ended October 31 | | 2011 | | | 2010 | | | 2009 | | | 2008 | | | 2007 | | | Three-year CAGR (1) | | | Five-year CAGR (1) | |
Closing market price per common share ($) | | | 58.89 | | | | 60.23 | | | | 50.06 | | | | 43.02 | | | | 63.00 | | | | 11.0 | | | | (3.2 | ) |
Dividends paid ($ per share) | | | 2.80 | | | | 2.80 | | | | 2.80 | | | | 2.80 | | | | 2.63 | | | | – | | | | 5.6 | |
Dividends paid (%) (2) | | | 4.6 | | | | 5.6 | | | | 6.5 | | | | 4.4 | | | | 3.8 | | | | | | | | | |
Increase (decrease) in share price (%) | | | (2.2 | ) | | | 20.3 | | | | 16.4 | | | | (31.7 | ) | | | (9.3 | ) | | | | | | | | |
Total shareholder return (%) | | | 2.4 | | | | 26.4 | | | | 25.1 | | | | (27.9 | ) | | | (5.8 | ) | | | 17.4 | | | | 1.9 | |
| | Total annual shareholder return assumes reinvestment of quarterly dividends and therefore does not equal the sum of dividend and share price returns in the table. |
| | (1) | Compound annual growth rate (CAGR) expressed as a percentage. |
| | (2) | As a percentage of the closing market price in the prior year. |
| | | | |
| BMO Financial Group 194th Annual Report 2011 | | | 33 | |
MANAGEMENT’S DISCUSSION AND ANALYSIS
Adjusting Items
We have designated certain amounts as adjusting items and have adjusted GAAP results so that we can present and discuss financial results without the effects of adjusting items to facilitate understanding of business performance and related trends. Management assesses performance on a GAAP basis and on an adjusted basis and considers both to be useful in the assessment of underlying business performance. Presenting results on both bases provides readers with an enhanced understanding of how management assesses results. Adjusted results and measures are non-GAAP and, together with items excluded in determining adjusted results, are disclosed in more detail in the Non-GAAP Measures section on page 94, along with comments on the uses and limitations of such measures.
The adjusting items that reduced net income in 2011 by $15 million or $0.03 per share were:
| Ÿ | | the $107 million after-tax net benefit of credit-related items in respect of the acquired M&I loan portfolio, including $271 million for the recognition in net interest income of a portion of the credit mark on the portfolio (including $161 million for credit mark amortization and $110 million for the release of the credit mark related to early repayment of loans), net of a $98 million increase in provisions for credit losses on the portfolio, primarily due to an $80 million increase in the general allowance; |
| Ÿ | | costs of $131 million ($84 million after tax) for M&I integration and restructuring, including professional fees for integration planning as well as costs for systems development and certain severance; |
| Ÿ | | amortization of acquisition-related intangible assets of $70 million ($54 million after tax), including $34 million ($22 million after tax) related to the acquired M&I business; |
| Ÿ | | a charge to revenue for the hedge of foreign exchange risk on the purchase of M&I of $20 million ($14 million after tax); and |
| Ÿ | | a decrease in the general allowance for credit losses, for loans other than the acquired M&I portfolio of $42 million ($30 million after tax). |
In 2010, there was one adjusting item, the amortization of acquisition-related intangible assets of $36 million ($32 million after tax).
Adjusting Items (Pre-Tax)
| | | | | | | | | | | | |
| ($ millions) | | 2011 | | | 2010 | | | 2009 | |
Hedge of foreign exchange risk on the purchase of M&I | | | (20 | ) | | | – | | | | – | |
Credit-related items on the acquired M&I loan portfolio | | | 173 | | | | – | | | | – | |
Costs of M&I integration and restructuring | | | (131 | ) | | | – | | | | – | |
Amortization of acquisition-related intangible assets | | | (70 | ) | | | (36 | ) | | | (43 | ) |
Decrease (increase) in the general allowance (other than M&I) | | | 42 | | | | – | | | | (60 | ) |
Charges related to deterioration in capital markets environment | | | – | | | | – | | | | (521 | ) |
Severance costs | | | – | | | | – | | | | (118 | ) |
Reduction in pre-tax income due to adjusting items in reported results | | | (6 | ) | | | (36 | ) | | | (742 | ) |
Adjusting Items (After Tax)
| | | | | | | | | | | | |
| ($ millions) | | 2011 | | | 2010 | | | 2009 | |
Hedge of foreign exchange risk on the purchase of M&I | | | (14 | ) | | | – | | | | – | |
Credit-related items on the acquired M&I loan portfolio | | | 107 | | | | – | | | | – | |
Costs of M&I integration and restructuring | | | (84 | ) | | | – | | | | – | |
Amortization of acquisition-related intangible assets | | | (54 | ) | | | (32 | ) | | | (35 | ) |
Decrease (increase) in the general allowance (other than M&I) | | | 30 | | | | – | | | | (39 | ) |
Charges related to deterioration in capital markets environment | | | – | | | | – | | | | (355 | ) |
Severance costs | | | – | | | | – | | | | (80 | ) |
Reduction in net income after tax due to adjusting items in reported results | | | (15 | ) | | | (32 | ) | | | (509 | ) |
Adjusting items in 2009 included amounts related to deterioration in the capital markets environment charged to BMO Capital Markets and severance charges recorded in Corporate Services.
Further details on the effects of adjusting items can be found on page 95.
Earnings per Share Growth
The year-over-year percentage change in earnings per share (EPS) and in adjusted EPS are our key measures for analyzing earnings growth. All references to EPS are to diluted EPS, unless indicated otherwise.
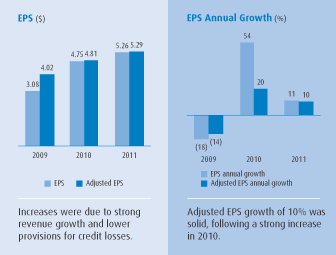
EPS was $5.26, up $0.51 or 11% from $4.75 in 2010. Adjusted EPS was $5.29, up $0.48 or 10% from $4.81 in 2010. Our three-year compound average annual adjusted EPS growth rate was 4.0%, below our current medium-term objective of average annual adjusted EPS growth of 8% to 10%, as EPS growth was affected by our decision to increase capital. Adjusted net income available to common shareholders was 33% higher than in the 2008 base year, while the average number of diluted common shares outstanding increased 17% over the same period as we chose to bolster capital levels in 2009 and 2010 and issued common shares on the acquisition of M&I in July 2011.
Net income was $3,266 million in 2011, up $456 million or 16% from $2,810 million a year ago. Adjusted net income was $3,281 million, up $439 million or 15%.
Amounts in the rest of this Earnings per Share Growth section are stated on an adjusted basis.
There was good revenue growth and a decrease in provisions for credit losses. Expenses increased at a slightly higher rate than revenues, but incremental revenues exceeded incremental costs, contributing to net income growth. There was a higher effective income tax rate in 2011.
| | | | |
| | Earnings per share (EPS) is calculated by dividing net income, after deduction of preferred dividends, by the average number of common shares outstanding. Diluted EPS, which is our basis for measuring performance, adjusts for possible conversions of financial instruments into common shares if those conversions would reduce EPS, and is more fully explained in Note 25 on page 166 of the financial statements. Adjusted EPS is calculated in the same manner using adjusted net income. | | |
| | |
| 34 | | BMO Financial Group 194th Annual Report 2011 |
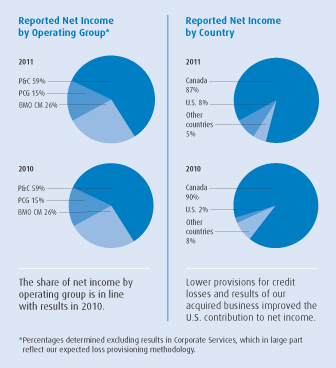
Personal and Commercial Banking results in 2011 continued to show strong growth, while net income in Private Client Group and BMO Capital Markets was up significantly from 2010 and the net loss in Corporate Services was reduced.
Personal and Commercial Banking (P&C) net income rose $221 million or 12% from a year ago to $2,100 million. The P&C group combines our two retail and business banking operating segments, Personal and Commercial Banking Canada (P&C Canada) and Personal and Commercial Banking U.S. (P&C U.S.). P&C Canada net income rose $64 million or 3.9% to $1,710 million. The improvement was attributable to volume-driven revenue growth, partially offset by lower net interest margin. P&C Canada results are discussed in the operating group review on page 47. P&C U.S. net income increased $157 million or 67% to $390 million, but increased US$171 million or 77% on a U.S. dollar basis. That increase was attributable to the US$142 million impact of the acquired M&I business and a US$29 million or 13% increase from organic operations. P&C U.S. results are discussed in the operating group review on page 50.
Private Client Group (PCG) net income increased $62 million or 13% to $528 million. The increase was largely attributable to revenue growth in all of PCG’s businesses, except insurance, and the results of the acquired M&I business. PCG results are discussed in the operating group review on page 53.
BMO Capital Markets (BMO CM) net income increased $103 million or 13% to $920 million due to a lower provision for credit losses, improved investment banking fees and a lower effective income tax rate. Revenue growth was affected by a weaker market environment late in the year. BMO CM results are discussed in the operating group review on page 56.
Corporate Services net loss decreased $53 million to $267 million as a result of improved revenues, in part reflecting the M&I acquisition, and lower provisions for credit losses recorded in Corporate Services under BMO’s expected loss provisioning methodology. This methodology and Corporate Services results are discussed in the operating group review on page 59.
Adjusted results in this section are non-GAAP and are discussed in the Non-GAAP Measures section on page 94.
Return on Equity
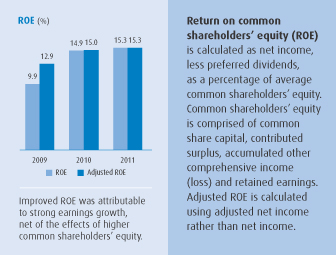
Return on equity (ROE) is another key value measure. ROE and adjusted ROE were 15.3% in 2011, compared with 14.9% and 15.0%, respectively, in 2010. The improvements were primarily attributable to an increase of $448 million in earnings ($431 million in adjusted earnings) available to common shareholders. Average common shareholders’ equity increased by almost $2.5 billion from 2010 primarily due to the issuance of common shares to M&I shareholders in July as consideration for the acquisition, as well as internally generated capital. Adjusted ROE of 15.3% was in line with our medium-term objective of earning average annual adjusted ROE of 15% to 18%. BMO has achieved an ROE of 13% or better in 21 of the past 22 years, one of only two banks in our North American peer group to have done so. As in 2010, our ROE in 2011 compared favourably with our global peers. Table 3 on page 101 includes ROE statistics for the past 10 years.
Adjusted results in this section are non-GAAP and are discussed in the Non-GAAP Measures section on page 94.
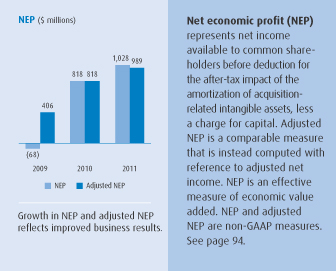
Net Economic Profit Growth
The last of our four key value measures is net economic profit (NEP)growth. Adjusted NEP was $989 million, up $171 million or 21%. The improvement was attributable to an increase in earnings across all groups, net of a higher charge for capital as a result of the increase in shareholders’ equity. NEP calculations are set out in the table that follows.
| | | | |
| BMO Financial Group 194th Annual Report 2011 | | | 35 | |
MANAGEMENT’S DISCUSSION AND ANALYSIS
Net Economic Profit($ millions, except as noted)
| | | | | | | | | | | | | | | | | | | | |
| For the year ended October 31 | | 2011 | | | 2010 | | | 2009 | | | 2008 | | | 2007 | |
Net income available to common shareholders | | | 3,122 | | | | 2,674 | | | | 1,667 | | | | 1,905 | | | | 2,088 | |
After-tax impact of the amortization of acquisition-related intangible assets | | | 54 | | | | 32 | | | | 35 | | | | 35 | | | | 38 | |
Net income available to common shareholders after adjusting for the amortization of acquisition-related intangible assets | | | 3,176 | | | | 2,706 | | | | 1,702 | | | | 1,940 | | | | 2,126 | |
Charge for capital* | | | (2,148 | ) | | | (1,888 | ) | | | (1,770 | ) | | | (1,535 | ) | | | (1,523 | ) |
Net economic profit | | | 1,028 | | | | 818 | | | | (68 | ) | | | 405 | | | | 603 | |
| | | | | |
After-tax impact of the amortization of acquisition-related intangible assets | | | (54 | ) | | | (32 | ) | | | (35 | ) | | | (35 | ) | | | (38 | ) |
After-tax impact of adjusting items | | | 15 | | | | 32 | | | | 509 | | | | 460 | | | | 675 | |
Adjusted net economic profit | | | 989 | | | | 818 | | | | 406 | | | | 830 | | | | 1,240 | |
Net economic profit growth (%) | | | 26 | | | | +100 | | | | (+100 | ) | | | (33 | ) | | | (51 | ) |
Adjusted net economic profit growth (%) | | | 21 | | | | +100 | | | | (51 | ) | | | (33 | ) | | | 3 | |
*Charge for capital | | | | | | | | | | | | | | | | | | | | |
Average common shareholders’ equity | | | 20,452 | | | | 17,980 | | | | 16,865 | | | | 14,612 | | | | 14,506 | |
Cost of capital (%) | | | 10.5 | | | | 10.5 | | | | 10.5 | | | | 10.5 | | | | 10.5 | |
Charge for capital | | | (2,148 | ) | | | (1,888 | ) | | | (1,770 | ) | | | (1,535 | ) | | | (1,523 | ) |
NEP and adjusted results in this section are non-GAAP measures and are discussed in the Non-GAAP Measures section on page 94.
Acquisition of Marshall & Ilsley Corporation (M&I)
On July 5, 2011, BMO completed the acquisition of M&I for consideration of $4.0 billion in the form of approximately 67 million common shares issued to M&I shareholders. M&I Bank combined with Harris Bank to form BMO Harris Bank. In addition, immediately prior to the closing of the transaction, a BMO subsidiary purchased from the U.S. Treasury all of M&I’s outstanding Troubled Asset Relief Program (TARP) preferred shares and warrants for cash consideration of approximately US$1.7 billion.
At acquisition, inclusion of the assets and liabilities of M&I added $29 billion of loans, after adjustment for expected credit losses, and $34 billion of deposits. The allocation of the purchase price is subject to refinement as we complete the valuation of the assets acquired and liabilities assumed. The acquisition more than doubled our U.S. branch count to 688, added more than one million customers and increased BMO’s total assets under management and administration to over $530 billion at the date of acquisition.
We expect that annual cost savings from the integration of M&I and BMO will exceed US$300 million. We also expect there to be opportunities to add to revenues through expanded access to existing and new markets resulting from increased brand awareness and a greater ability to compete in the market. In fiscal 2011, M&I acquired businesses contributed $167 million to BMO’s net income and $180 million to adjusted net income. We now anticipate that the M&I acquisition will be accretive to BMO’s adjusted EPS for fiscal 2012.
M&I’s activities are primarily reflected in our P&C U.S., Private Client Group and Corporate Services segments, with a small amount included in BMO Capital Markets.
Integration and restructuring costs are included in non-interest expense in Corporate Services and are expected to total approximately US$600 million by the time integration has been completed in the next few years. We recorded US$131 million of such expenses in 2011. These include amounts related to system conversions, severance and other employee-related charges, as well as other integration expenses, such as consulting fees and marketing costs in connection with customer communications and rebranding activities.
Prior to the close of the transaction, approximately US$1.0 billion of impaired real estate secured assets, comprised primarily of commercial real estate loans, were transferred from P&C U.S. to Corporate Services to allow our businesses to focus on ongoing customer relationships and leverage the risk management expertise in our special assets management unit. Prior period loan balances, revenues and expenses have been restated to reflect the transfer. In addition, similar assets valued at approximately
US$1.5 billion that were acquired on the M&I transaction were included in Corporate Services for the same reasons.
Corporate Services net income includes the $107 million net after-tax benefit of credit-related items on the acquired M&I loan portfolio. A portion of the credit mark is recognized as higher effective yield in net interest income over the life of the purchased loan portfolio to reflect the risk profile of the acquired portfolio. Of the total credit mark of $3.5 billion on the loans and $0.2 billion on undrawn commitments and letters of credit, $1.3 billion will be amortized over time to net interest income as increased yield on the portfolio, and $2.4 billion will not be amortized. The portion that will not be amortized relates to credit impaired loans and the portion of the credit mark on performing term loans in respect of losses that existed in the portfolio on the acquisition date that were not specifically identified at that time. This latter portion of the credit mark will be reviewed regularly and any changes in the credit quality of the portfolio will be recognized through the provision for credit losses when they occur. When acquired performing loans are repaid at amounts above their discounted value, any remaining credit mark will be recognized in net interest income. In 2011, $110 million was recognized in net interest income as a result of loan repayments. The entire credit mark is amortized on non-credit impaired revolving facilities, undrawn commitments and letters of credit and a general allowance is built as appropriate as the credit mark is amortized. These impacts, together with any related provision for credit losses, are considered adjusting items and are not included in adjusted net income.
As a result of the addition of loans acquired in the M&I transaction, certain credit quality ratios are now less comparable to the ratios of prior periods or our peer group, as the ratios now reflect the impact of the acquired loans and certain adjusting items related to them. The ratios most affected are the provision for credit losses-to-average net loans and acceptances, allowance for credit losses-to-gross impaired loans (GIL), GIL-to-gross loans and acceptances and general allowance to credit risk-weighted assets. We have presented these ratios in the MD&A including and excluding the impact of the purchased portfolios to provide for better comparison to the ratios in prior periods and the ratios of our peers.
While the acquisition of M&I adds scale and provides an effective entry into new markets, integration risk is a key focus for the organization. It includes risks related to customer and employee retention and system integration. We are addressing these risks by maintaining our program management office, along with experienced BMO and former M&I staff who are tasked with ensuring these risks are well managed. Both organizations have considerable experience with integrating acquired businesses and the integration is now well underway.
Caution
This Acquisition of Marshall & Ilsley Corporation (M&I) section contains forward-looking statements.
Please see the Caution Regarding Forward-Looking Statements.
Adjusted results in this section are non-GAAP and are discussed in the Non-GAAP Measures section on page 94.
| | |
| 36 | | BMO Financial Group 194th Annual Report 2011 |
2011 Financial Performance Review
This section provides a review of our enterprise financial performance for 2011 that focuses on the Consolidated Statement of Income included in our consolidated financial statements, which begin on page 115. A review of our operating groups’ strategies and performance follows the enterprise review. A summary of the enterprise financial performance for 2010 appears on page 96. This section contains adjusted results, which are non-GAAP and are disclosed in more detail in the Non-GAAP Measures section on page 94.
Highlights
| | Ÿ | | Revenue increased $1,508 million or 12% in 2011 to $13.7 billion. Adjusted revenue increased $1,257 million or 10% to $13.5 billion, following growth of 5% in 2010 and 9% in 2009. This consistently high rate of revenue growth demonstrates the benefit of our diversified business mix and successful execution against our strategic priorities, in market conditions that have been challenging at times. |
| | Ÿ | | Revenue growth in P&C Canada was primarily attributable to volume growth in most products, offset in part by a modest decline in net interest margin. P&C U.S. revenue growth reflected the results of our acquired M&I business, as well as significant margin improvement. Revenue growth in Private Client Group was strong in most businesses, reflecting the impact of acquisitions, but was reduced by the impact of earthquake-related reinsurance claims. BMO Capital Markets recorded modest revenue growth, but contributed increased profitability. There was also a modest improvement in Corporate Services revenue. |
| | Ÿ | | Specific provisions for credit losses were $819 million, compared with $1,049 million in 2010. Specific provisions were down $248 million on an adjusted basis and down $230 million on a reported basis. While credit market conditions have improved over the past two years, uncertainty regarding the global economic recovery persists. | |
| | Ÿ | | Adjusted non-interest expense increased due to continued investment in our people and in technology and due to the impact of our acquired businesses, reduced in part by the effects of the weaker U.S. dollar. | |
| | Ÿ | | The effective income tax rate was 21.5%, compared with 19.2% in 2010. The adjusted effective income tax rate(1) was21.3%, compared with a rate of 19.2% in 2010. The higher effective rate in 2011 was mainly attributable to proportionately lower tax-exempt income and lower net recoveries of prior periods’ income taxes. | |
| (1) | The adjusted rate is computed using adjusted net income rather than net income in the determination of income subject to tax. |
Impact of Business Acquisitions
BMO Financial Group has selectively acquired a number of businesses. These acquisitions increase revenues and expenses, affecting year-over-year comparisons of operating results. The adjacent table outlines significant acquisitions by operating group and their impact on BMO’s adjusted revenues, adjusted expenses and adjusted net income for 2011, 2010 and 2009, to assist in analyzing changes in results. The impact on adjusted net income includes the impact of adjusted provisions for credit losses and income taxes, which are not disclosed separately in the table. Adjusting items are excluded from amounts reflected in the table and are discussed in the Adjusting Items section on page 34.
For 2011, on an adjusted basis, the significant business acquisitions contributed $926 million of revenue, $587 million of expense and $214 million of net income. On a reported basis, they contributed $1,178 million of revenue, $767 million of expense and $190 million of net income.
Impact of Significant Business Acquisitions on Adjusted Operating Results($ millions)
| | | | | | | | | | | | |
Business acquired | | Adjusted | |
| | Revenue | | | Expense | | | Net income | |
Personal and Commercial Banking Canada | | | | | | | | | | | | |
Diners Club North American franchise (1) Acquired December 2009 | | | | | | | | | |
Effects on results for:2011 | | | 110 | | | | 65 | | | | 12 | |
2010 | | | 114 | | | | 40 | | | | 27 | |
Personal and Commercial Banking U.S. | | | | | | | | | | | | |
M&I | | | | | | | | | | | | |
Effects on results for:2011 | | | 552 | | | | 275 | | | | 142 | |
AMCORE Bank N.A. – certain assets and liabilities Acquired April 2010 | | | | | | | | | |
Effects on results for:2011 | | | 66 | | | | 48 | | | | 8 | |
2010 | | | 44 | | | | 39 | | | | 3 | |
Private Client Group | | | | | | | | | | | | |
M&I | | | | | | | | | | | | |
Effects on results for:2011 | | | 115 | | | | 92 | | | | 14 | |
Lloyd George Management Acquired April 2011 Effects on results for:2011 | | | 15 | | | | 18 | | | | (2 | ) |
AIG Life Insurance Company of Canada (BMO Life Assurance) Acquired April 2009 | | | | | |
Effects on results for:2011 | | | 95 | | | | 74 | | | | 15 | |
2010 | | | 106 | | | | 69 | | | | 26 | |
2009 | | | 64 | | | | 33 | | | | 21 | |
BMO Capital Markets | | | | | | | | | | | | |
M&I | | | | | | | | | | | | |
Effects on results for:2011 | | | 7 | | | | 9 | | | | 1 | |
BMO Financial Group | | | | | | | | | | | | |
Effects on results for:2011 (2) | | | 926 | | | | 587 | | | | 214 | |
2010 | | | 264 | | | | 148 | | | | 56 | |
2009 | | | 64 | | | | 33 | | | | 21 | |
For Reference Only | | | | | | | | | | | | |
M&I Acquired July 2011 | | | | | | | | | | | | |
Effects on results for:2011 (2) | | | 640 | | | | 381 | | | | 180 | |
| | (1) | The Diners Club franchise acquisition raised provisions for credit losses by $24 million in 2011 and $32 million in 2010. |
| | (2) | The effects of the M&I acquisition on results of BMO Financial Group as shown above include the adjusted results of Corporate Services, which are not separately disclosed above. |
Adjusted results in this section are non-GAAP and are discussed in the Non-GAAP Measures section on page 94.
| | | | |
| BMO Financial Group 194th Annual Report 2011 | | | 37 | |
MANAGEMENT’S DISCUSSION AND ANALYSIS
Foreign Exchange
The U.S. dollar was weaker at October 31, 2011 than at October 31, 2010, and assets and liabilities are translated at year-end rates. The average exchange rate over the course of 2011 is used for translation of revenues and expenses in 2011, and this rate also weakened in 2010 relative to 2009. The Canadian dollar equivalents of BMO’s U.S.-dollar-denominated net income, revenues, expenses, income taxes and provision for credit losses in 2011 were reduced relative to the preceding year by the weakening of the U.S. dollar. The adjacent table indicates average Canadian/U.S. dollar exchange rates in 2011, 2010 and 2009 and the impact of changes in the average rates. At October 31, 2011, the Canadian dollar traded at $0.997 per U.S. dollar. It traded at $1.020 per U.S. dollar at October 31, 2010.
At the start of each quarter, BMO assesses whether to enter into hedging transactions that are designed to partially offset the pre-tax effects of exchange rate fluctuations in the quarter on our expected U.S.-dollar-denominated net income for that quarter. As such, these activities partially mitigate the impact of exchange rate fluctuations, but only within that quarter. As a result, the sum of the hedging gains/losses for the four quarters in a year is not directly comparable to the impact of year-over-year exchange rate fluctuations on earnings for the year. Hedging transactions resulted in an after-tax loss of $3 million in 2011 ($5 million gain in 2010).
The gain or loss from hedging transactions in future periods will be determined by both future exchange rate fluctuations and the amount of the underlying future hedging transactions, since the transactions are entered into each quarter in relation to expected U.S.-dollar-denominated net income for the next three months. The effect of exchange rate fluctuations on our net investment in foreign operations is discussed in the Provision for Income Taxes section on page 44.
Changes in the exchange rate affect future results measured in Canadian dollars and the impact on results is a function of the periods in which revenues, expenses and provisions for credit losses arise. If future results are consistent with the range of results for the past three years, each one cent increase (decrease) in the Canadian/U.S. dollar exchange rate, expressed in terms of how many Canadian dollars one U.S. dollar buys, would be expected to increase (decrease) the Canadian dollar equivalents of U.S.-dollar-denominated net income before income taxes for the year by between $6 million and $12 million.
The acquisition of M&I increased U.S.-dollar-denominated earnings in the fourth quarter. If future results are consistent with results in the fourth quarter of 2011, each one cent increase (decrease) in the Canadian/U.S. dollar exchange rate would be expected to increase (decrease) net income before income taxes for the year by $17 million.
Effects of Changes in Exchange Rates on BMO’s Reported and Adjusted Results
| | | | | | | | |
| ($ millions, except as noted) | | 2011 vs. 2010 | | | 2010 vs.
2009 | |
Canadian/U.S. dollar exchange rate (average) | | | | | | | | |
2011 | | | 0.985 | | | | | |
2010 | | | 1.043 | | | | 1.043 | |
2009 | | | | | | | 1.165 | |
| | |
Effects on reported results | | | | | | | | |
Reduced net interest income | | | (133 | ) | | | (210 | ) |
Reduced non-interest revenue | | | (74 | ) | | | (155 | ) |
Reduced revenues | | | (207 | ) | | | (365 | ) |
Reduced expenses | | | 135 | | | | 213 | |
Reduced provisions for credit losses | | | 28 | | | | 70 | |
Reduced income taxes and non-controlling interest in subsidiaries | | | 5 | | | | 18 | |
Reduced reported net income | | | (39 | ) | | | (64 | ) |
| | |
Effects on adjusted results | | | | | | | | |
Reduced net interest income | | | (126 | ) | | | (210 | ) |
Reduced non-interest revenue | | | (74 | ) | | | (155 | ) |
Reduced revenues | | | (200 | ) | | | (365 | ) |
Reduced expenses | | | 124 | | | | 210 | |
Reduced provisions for credit losses | | | 28 | | | | 68 | |
Reduced income taxes and non-controlling interest in subsidiaries | | | 6 | | | | 18 | |
Reduced adjusted net income | | | (42 | ) | | | (69 | ) |
Adjusted results in this section are non-GAAP and are discussed in the Non-GAAP Measures section on page 94.
| | |
| 38 | | BMO Financial Group 194th Annual Report 2011 |
Revenue
Revenue increased $1,508 million or 12% in 2011 to $13,718 million.
Amounts in the rest of this Revenue section are stated on an adjusted basis.
Adjusted revenue increased $1,257 million or 10%. Adjusted revenue excludes the portion of the credit mark recorded in net interest income on the acquired M&I loan portfolio and the hedge of foreign exchange risk on the M&I purchase, which are recorded in Corporate Services, as discussed in the Adjusting Items section on page 34. M&I contributed $640 million or 5.2% to revenue growth in 2011. The weaker U.S. dollar lowered overall revenue growth by $200 million or 1.6 percentage points.
BMO analyzes revenue at the consolidated level based on GAAP revenues reflected in the financial statements and on an adjusted basis. Consistent with our Canadian peer group, we do not analyze revenue at the consolidated level on a taxable equivalent basis (teb). However, like many banks, we continue to analyze revenue on a teb basis at the operating group level. The teb adjustments for fiscal 2011 totalled $220 million, down from $355 million in 2010.
P&C Canada revenue increased $237 million or 4.1%. The segment’s revenue growth was driven by volume growth in most products, offset in part by a modest reduction in net interest margin of 2 basis points. P&C U.S. revenue increased US$646 million or 47%, primarily due to the inclusion of revenues from the acquired M&I business. The remaining increase was primarily driven by improved loan spreads and higher deposit balances. Private Client Group revenue increased $314 million or 14%, of which $130 million was contributed by the acquired M&I and LGM businesses. Revenue in the group, excluding insurance, increased significantly with revenue growth across all of its businesses, particularly in brokerage and mutual funds. Assets under management and administration improved by $158 billion to $422 billion. On a basis that excludes the impact of the acquisitions and the weaker U.S. dollar, assets under management and administration grew $12 billion or 4.4% from a year ago. Insurance revenue decreased 15%, primarily due to the impact of earthquake-related reinsurance claims and the adverse effect of long-term interest rate movements on policyholder liabilities relative to the less unfavourable effect in 2010, partially offset by higher premium revenue. BMO Capital Markets revenue grew $63 million or 1.9% to $3,341 million, reflecting higher investment banking fees, particularly from mergers and acquisitions and underwriting, and increased equity trading revenues. There was lower trading net interest income, decreased corporate lending revenues and lower lending volumes. Corporate Services revenues were up $78 million, primarily due to a lower group teb offset, partially offset by higher residual funding costs and costs associated with supplemental liquidity.
For the fourth consecutive year, there was solid growth in both BMO net interest income and non-interest revenue, with both rising at double-digit rates in 2011.
Net Interest Income
Net interest income for the year was $7,079 million, an increase of $844 million or 14% from 2010. Adjusted net interest income was $6,828 million, up $593 million from 2010, of which $417 million was due to the M&I acquisition. Adjusted net interest income excludes the portion of the credit mark recorded in net interest income on the acquired M&I loan portfolio and the cost of hedging the exposure to changes in foreign exchange rates on the M&I purchase.
Taxable equivalent basis (teb) Revenues of operating groups reflected in our MD&A are presented on a taxable equivalent basis (teb). The teb adjustment increases GAAP revenues and the provision for income taxes by an amount that would increase revenues on certain tax-exempt securities to a level that would incur tax at the statutory rate, to facilitate comparisons.
Net interest income is comprised of earnings on assets, such as loans and securities, including interest and dividend income and BMO’s share of income from investments accounted for using the equity method of accounting, less interest expense paid on liabilities, such as deposits.
Net interest margin is the ratio of net interest income to earning assets, expressed as a percentage or in basis points.
Revenue and Adjusted Revenue($ millions)
| | | | | | | | | | | | | | | | | | | | |
| For the year ended October 31 | | 2011 | | | 2010 | | | 2009 | | | 2008 | | | 2007 | |
Net interest income | | | 7,079 | | | | 6,235 | | | | 5,570 | | | | 5,072 | | | | 4,829 | |
Year-over-year growth (%) | | | 13.5 | | | | 11.9 | | | | 9.8 | | | | 5.0 | | | | 2.0 | |
Non-interest revenue | | | 6,639 | | | | 5,975 | | | | 5,494 | | | | 5,133 | | | | 4,520 | |
Year-over-year growth (%) | | | 11.1 | | | | 8.8 | | | | 7.0 | | | | 13.6 | | | | (14.0 | ) |
Total revenue | | | 13,718 | | | | 12,210 | | | | 11,064 | | | | 10,205 | | | | 9,349 | |
Year-over-year growth (%) | | | 12.3 | | | | 10.4 | | | | 8.4 | | | | 9.2 | | | | (6.4 | ) |
| | | | | |
Adjusted net interest income | | | 6,828 | | | | 6,235 | | | | 5,570 | | | | 5,072 | | | | 4,841 | |
Year-over-year growth (%) | | | 9.5 | | | | 11.9 | | | | 9.8 | | | | 4.8 | | | | 2.3 | |
Adjusted non-interest revenue | | | 6,639 | | | | 5,975 | | | | 6,015 | | | | 5,521 | | | | 5,455 | |
Year-over-year growth (%) | | | 11.1 | | | | (0.7 | ) | | | 8.9 | | | | 1.2 | | | | 3.8 | |
Total adjusted revenue | | | 13,467 | | | | 12,210 | | | | 11,585 | | | | 10,593 | | | | 10,296 | |
Year-over-year growth (%) | | | 10.3 | | | | 5.4 | | | | 9.4 | | | | 2.9 | | | | 3.1 | |
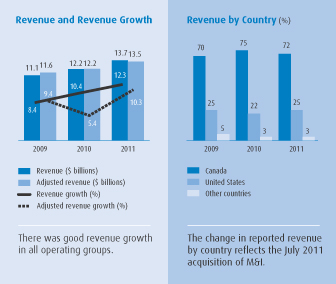
Change in Net Interest Income, Average Earning Assets and Net Interest Margin
| | | | | | | | | | | | | | | | | | | | | | | | | | | | | | | | | | | | | | | | | | | | | | | | |
| | | Net interest income (teb) | | | | | Average earning assets | | | | | Net interest margin | |
| | | ($ millions) | | | Change | | | | | ($ millions) | | | Change | | | | | (in basis points) | |
| For the year ended October 31 | | 2011 | | | 2010 | | | $ | | | % | | | | | 2011 | | | 2010 | | | $ | | | % | | | | | 2011 | | | 2010 | | | Change | |
P&C Canada | | | 4,368 | | | | 4,164 | | | | 204 | | | | 5 | | | | | | 148,957 | | | | 141,107 | | | | 7,850 | | | | 6 | | | | | | 293 | | | | 295 | | | | (2 | ) |
P&C U.S. | | | 1,625 | | | | 1,104 | | | | 521 | | | | 47 | | | | | | 36,695 | | | | 29,445 | | | | 7,250 | | | | 25 | | | | | | 443 | | | | 375 | | | | 68 | |
Personal and Commercial Banking (P&C) | | | 5,993 | | | | 5,268 | | | | 725 | | | | 14 | | | | | | 185,652 | | | | 170,552 | | | | 15,100 | | | | 9 | | | | | | 323 | | | | 309 | | | | 14 | |
Private Client Group (PCG) | | | 440 | | | | 365 | | | | 75 | | | | 21 | | | | | | 14,968 | | | | 12,981 | | | | 1,987 | | | | 15 | | | | | | 294 | | | | 281 | | | | 13 | |
BMO Capital Markets (BMO CM) | | | 1,208 | | | | 1,394 | | | | (186 | ) | | | (13 | ) | | | | | 169,240 | | | | 152,076 | | | | 17,164 | | | | 11 | | | | | | 71 | | | | 92 | | | | (21 | ) |
Corporate Services, including Technology and Operations | | | (562 | ) | | | (792 | ) | | | 230 | | | | 29 | | | | | | 4,530 | | | | (3,141 | ) | | | 7,671 | | | | +100 | | | | | | nm | | | | nm | | | | nm | |
Total BMO | | | 7,079 | | | | 6,235 | | | | 844 | | | | 14 | | | | | | 374,390 | | | | 332,468 | | | | 41,922 | | | | 13 | | | | | | 189 | | | | 188 | | | | 1 | |
Adjusting items impacting net interest income | | | (251 | ) | | | – | | | | (251 | ) | | | (+100 | ) | | | | | – | | | | – | | | | – | | | | – | | | | | | nm | | | | nm | | | | nm | |
Total BMO adjusted | | | 6,828 | | | | 6,235 | | | | 593 | | | | 10 | | | | | | 374,390 | | | | 332,468 | | | | 41,922 | | | | 13 | | | | | | 182 | | | | 188 | | | | (6 | ) |
nm – not meaningful
| | | | |
| BMO Financial Group 194th Annual Report 2011 | | | 39 | |
MANAGEMENT’S DISCUSSION AND ANALYSIS
Amounts in the rest of this Net Interest Income section are stated on an adjusted basis.
The impact of the weaker U.S. dollar decreased net interest income by $126 million. The bank’s average earning assets increased by $41.9 billion in fiscal 2011, of which $11.6 billion was attributable to M&I. The weaker U.S. dollar lowered average assets by $8.1 billion. Asset levels increased in each of the operating groups, with particularly strong growth in P&C U.S. due to the acquired business. BMO’s overall net interest margin was down 6 basis points in 2011. The main drivers of BMO’s overall net interest margin are the individual group margins, changes in the magnitude of each operating group’s assets and changes in net interest income in Corporate Services.
P&C Canada recorded a solid increase in net interest income. There was volume growth in most product categories. Net interest margin decreased 2 basis points, driven primarily by lower deposit spreads in a low interest rate environment, competitive mortgage pricing and lower industry-wide cards usage.
In P&C U.S., net interest income increased significantly. The increase was due to the favourable effects of the M&I acquisition and loan spread improvement as a result of a change in the mix of loan balances, as well as higher deposit balances. P&C U.S. net interest margin increased 68 basis points from 2010 for the same reasons and also due to higher net interest margin on the acquired M&I loan portfolio.
Private Client Group net interest income increased. There were higher deposit spreads in our brokerage businesses, higher loan and deposit balances in private banking and a favourable effect from the M&I acquisition. The group’s net interest margin increased 13 basis points.
BMO Capital Markets net interest income decreased $186 million or 13%. There was reduced trading net interest income in the more challenging environment and a decrease in corporate banking revenue due to lower asset levels and spreads. The group’s average earning assets increased due mainly to higher levels of trading assets, offset in part by reduced corporate lending assets. Net interest margin decreased 21 basis points due to lower trading net interest income and higher levels of low yielding deposits held with the U.S. Federal Reserve.
Corporate Services net interest income was modestly lower than in 2010.
Table 9 on page 104 and Table 10 on page 105 provide further details on net interest income and net interest margin.
Non-Interest Revenue
Non-interest revenue, which comprises all revenues other than net interest income, was $6,639 million in 2011, an increase of $664 million or 11% from 2010. There were no adjusting items reflected in non-interest revenue and, as such, reported amounts are equivalent to adjusted amounts in this section. The acquired M&I business contributed approximately 35% of the total increase, primarily in investment management and custodial fees in Private Client Group, and deposit and payment service charges and card fees in P&C U.S. Revenues were higher in each of the groups, with particularly good growth in BMO Capital Markets and Private Client Group. The net impact of acquired businesses increased non-interest revenue by $196 million, while the impact of the weaker U.S. dollar decreased non-interest revenue by $74 million.
Securities commissions and fees increased $138 million or 13%. These revenues consist largely of brokerage commissions and fees within Private Client Group, which account for about two-thirds of the total, and institutional equity trading commissions within BMO Capital Markets. There were increases in both groups due to higher trading volumes, as well as higher client asset levels in Private Client Group.
Deposit and payment service charges increased $32 million or 4% due to the M&I acquisition, offset in part by reductions in other service charge revenues in P&C U.S.
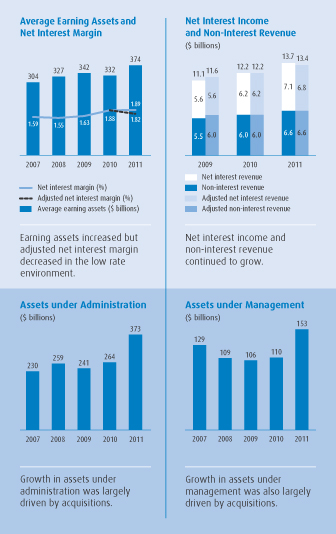
Non-Interest Revenue($ millions)
| | | | | | | | | | | | | | | | | | | | |
| | | | | | | | | | | | Change
from 2010 | |
| For the year ended October 31 | | 2011 | | | 2010 | | | 2009 | | | $ | | | % | |
Securities commissions and fees | | | 1,186 | | | | 1,048 | | | | 973 | | | | 138 | | | | 13 | |
Deposit and payment service charges | | | 834 | | | | 802 | | | | 820 | | | | 32 | | | | 4 | |
Trading revenues | | | 571 | | | | 504 | | | | 723 | | | | 67 | | | | 13 | |
Lending fees | | | 577 | | | | 572 | | | | 556 | | | | 5 | | | | 1 | |
Card fees | | | 145 | | | | 233 | | | | 121 | | | | (88 | ) | | | (38 | ) |
Investment management and custodial fees | | | 495 | | | | 355 | | | | 344 | | | | 140 | | | | 39 | |
Mutual fund revenues | | | 633 | | | | 550 | | | | 467 | | | | 83 | | | | 15 | |
Securitization revenues | | | 821 | | | | 678 | | | | 929 | | | | 143 | | | | 21 | |
Underwriting and advisory fees | | | 512 | | | | 445 | | | | 397 | | | | 67 | | | | 15 | |
Securities gains (losses) | | | 172 | | | | 150 | | | | (354 | ) | | | 22 | | | | 15 | |
Foreign exchange, other than trading | | | 93 | | | | 93 | | | | 53 | | | | – | | | | – | |
Insurance income | | | 283 | | | | 321 | | | | 295 | | | | (38 | ) | | | (12 | ) |
Other | | | 317 | | | | 224 | | | | 170 | | | | 93 | | | | 42 | |
Total | | | 6,639 | | | | 5,975 | | | | 5,494 | | | | 664 | | | | 11 | |
Trading revenues are discussed in the Trading-Related Revenues section that follows.
Lending fees increased $5 million or 1% due to the acquired M&I business.
| | |
| 40 | | BMO Financial Group 194th Annual Report 2011 |
Card fees decreased $88 million or 38%. The decrease reflects the negative impact of higher credit card securitizations in 2011 and higher AIR MILES rewards costs. This was offset to some extent by increased other revenues.
Investment management and custodial fees increased $140 million or 39%, with three-quarters of the increase attributable to the M&I and LGM acquisitions and the balance due primarily to growth in the private banking business.
Mutual fund revenues improved by $83 million or 15%, following growth of 18% in 2010. Higher client asset levels drove the increase.
Securitization revenues increased $143 million or 21%, reflecting increased revenues from securitizing credit card loans. Revenues included gains of $99 million on the sales of loans for new securitizations, up $31 million from 2010, and gains of $511 million on sales of loans to revolving securitization vehicles, up $83 million from 2010. We securitize loans primarily to obtain alternate sources of cost-effective funding. We securitized $1.2 billion of credit card loans in 2011 and none in 2010. We securitized $4.5 billion of residential mortgage loans in 2011, up from $4.3 billion of residential mortgage loans in 2010. Securitization revenues are detailed in Note 8 on page 133 of the financial statements.
Underwriting and advisory fees were $67 million or 15% higher than in 2010. Mergers and acquisitions and debt underwriting fees improved considerably, reflecting strong performance and improved market conditions for the majority of the year.
Securities gains were $172 million, increasing $22 million or 15% from 2010. Higher investment gains in P&C Canada and P&C U.S. were largely offset by lower gains in BMO Capital Markets.
Income from foreign exchange, other than trading, was unchanged year over year at $93 million.
Insurance income decreased $38 million or 12% due to the impact of earthquake-related reinsurance claims and the adverse effect of long-term interest rate movements on policyholder liabilities relative to the less unfavourable effect in 2010, partially offset by higher premium revenue.
Other revenue includes various sundry amounts and increased $93 million or 42%, with approximately half attributable to the M&I acquisition.
Table 7 on page 102 provides further details on revenue and revenue growth.
Trading-Related Revenues
Trading-related revenues are dependent on, among other things, the volume of activities undertaken for clients who enter into transactions with BMO to mitigate their risks or to invest. BMO earns a spread or
Trading-related revenues include net interest income and non-interest revenue earned from on and off-balance sheet positions undertaken for trading purposes. The management of these positions typically includes marking them to market on a daily basis. Trading-related revenues also include income (expense) and gains (losses) from both on-balance sheet instruments and interest rate, foreign exchange (including spot positions), equity, commodity and credit contracts.
Interest and Non-Interest Trading-Related Revenues
| | | | | | | | | | | | | | | | | | | | |
($ millions) (taxable equivalent basis) | | | | | | | | Change
from 2010 | |
| For the year ended October 31 | | 2011 | | | 2010 | | | 2009 | | | $ | | | % | |
Interest rate | | | 388 | | | | 562 | | | | 467 | | | | (174 | ) | | | (31 | ) |
Foreign exchange | | | 288 | | | | 247 | | | | 362 | | | | 41 | | | | 17 | |
Equities | | | 322 | | | | 314 | | | | 409 | | | | 8 | | | | 3 | |
Commodities | | | 40 | | | | 52 | | | | 79 | | | | (12 | ) | | | (23 | ) |
Other | | | (3 | ) | | | 9 | | | | (76 | ) | | | (12 | ) | | | (+100 | ) |
Total | | | 1,035 | | | | 1,184 | | | | 1,241 | | | | (149 | ) | | | (13 | ) |
Reported as: | | | | | | | | | | | | | | | | | | | | |
Net interest income | | | 464 | | | | 680 | | | | 518 | | | | (216 | ) | | | (32 | ) |
Non-interest revenue – trading revenues | | | 571 | | | | 504 | | | | 723 | | | | 67 | | | | 13 | |
Total | | | 1,035 | | | | 1,184 | | | | 1,241 | | | | (149 | ) | | | (13 | ) |
profit on the net sum of its client positions by profitably managing, within prescribed limits, the overall risk of the net positions. BMO also assumes proprietary positions with the goal of earning trading profits.
Interest and non-interest trading-related revenues decreased $149 million or 13% from 2010, as the trading environment was weak in the final quarter of the year. There were no adjusting items reflected in trading-related revenues and, as such, reported amounts are equivalent to adjusted amounts in this Trading-Related Revenues section. Interest rate trading revenues were down appreciably from a year ago, with low revenues in the latter half of the year. Foreign exchange trading revenues increased due to improved spreads and higher volatility compared to 2010, which resulted in an increase in trading opportunities. Equity trading revenue was modestly higher but results in 2010 were lowered by accounting adjustments.
The Market Risk section on page 85 provides more information on trading-related revenues.
Adjusted results in this Revenue section are non-GAAP and are discussed in the Non-GAAP Measures section on page 94.
Provision for Credit Losses
The global economy experienced volatile and uncertain market conditions throughout 2011, causing certain sectors to remain challenged, notably the real estate sector. The uncertainty persists, largely due to growing concerns surrounding both the European and U.S. economies, placing pressure on the global economic recovery.
BMO recorded $857 million of provision for credit losses in the current year, comprised of $819 million of specific provisions for credit losses and a $38 million increase in the general allowance for credit losses. Adjusted specific provisions for credit losses were $801 million and exclude $18 million of specific provisions associated with the M&I purchased loan portfolio. This compares to a $1,049 million provision recorded in 2010, comprised solely of specific provisions with no change in the general allowance. Provisions as a percentage of average net loans and acceptances decreased to 0.46% in 2011 from 0.61% in 2010. The provision as a percentage of average net loans and acceptances, excluding purchased loan portfolios, decreased to 0.44% in 2011 from
0.61% in 2010. The majority of our provisions continue to relate to our U.S. portfolio.
A significant factor influencing both provisions for credit losses and write-offs is the level of formations of new impaired loans – identified as additions to impaired loans and acceptances in the following Changes in Gross Impaired Loans and Acceptances table. As with specific provisions and consistent with a year ago, impaired loan formations remain above the low levels of 2007 and 2006, but decreased to $1,225 million from $1,525 million in 2010 and from a peak of $2,690 million in 2009. On a geographic basis, the United States accounted for the majority of impaired loan formations, with the purchased performing loan portfolios adding $185 million to impaired loan formations in 2011. The commercial real estate and commercial mortgage sectors accounted for the largest portion of formations in the United States, consistent with the prior year.
| | | | |
| BMO Financial Group 194th Annual Report 2011 | | | 41 | |
MANAGEMENT’S DISCUSSION AND ANALYSIS
Gross impaired loans, excluding purchased credit impaired loans, decreased to $2,685 million from $2,894 million in 2010. Factors contributing to the change in impaired loans are outlined in the adjacent table. In 2011, sales of gross impaired loans totalled $119 million, with related reversals and recoveries of $21 million. This compares with sales of $29 million and related reversals and recoveries of $9 million in 2010.
The general allowance is maintained to cover impairment in the existing credit portfolio that cannot yet be associated with specific loans, and is assessed on a quarterly basis. The general provision increased by $38 million from the prior fiscal year. The increase was comprised of a $42 million recovery recorded in the second quarter of 2011 and an $80 million provision in the fourth quarter of 2011, which related to the M&I purchased loan portfolio. The general allowance remains adequate and, as at October 31, 2011, represented 0.74% of credit risk-weighted assets and 0.89% of credit risk-weighted assets excluding purchased loan portfolios. The total allowance for credit losses decreased $46 million in 2011 to $1,832 million (excluding a $45 million allowance included in Other Liabilities related to undrawn commitments and letters of credit that are considered Other Credit Instruments).
BMO’s loan book continues to be well diversified by segment and geographic area, and is comprised primarily of the more stable consumer and commercial portfolios, which represented 89.4% of the portfolio at year end, compared with 86.2% in 2010. The Canadian and U.S. portfolios represented 67% and 29% of total loans, respectively, compared with 76% and 19% in 2010. The increase in the U.S. loan book in 2011 was primarily due to the acquired M&I loan portfolio, which represented 14% of BMO’s total loans at October 31, 2011. The consumer loans portfolio represented 53.8% of the total portfolio, down from 56.6% in 2010, with approximately 87% of the portfolio secured in Canada and 96% in the United States. Corporate and commercial loans represented 46.2% of the total portfolio, up from 43.4% in 2010. We continue to proactively monitor industry sectors that we consider to be of concern, including U.S. real estate. With the addition of the acquired M&I loan portfolio, BMO’s exposure to U.S. real estate-related loans and to potential deterioration in U.S. real estate markets has increased.
Credit risk management is discussed further on page 83. Note 6 on page 129 of the financial statements and Tables 11 to 19 on pages 106 to 109 provide details of BMO’s loan portfolio, impaired loans and provisions and allowances for credit losses.
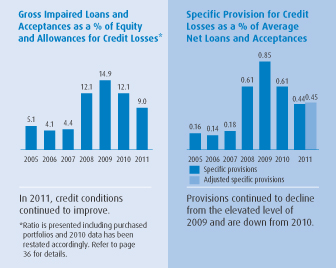
| | | | | | | | | | | | | | | | | | | | | | | | | | | | |
Changes in Gross Impaired Loans (GIL) and Acceptances(1)($ millions, except as noted) | |
| | | | | | | |
For the year
ended October 31 | | 2011 | | | 2010 | | | 2009 | | | 2008 | | | 2007 | | | 2006 | | | 2005 | |
GIL, beginning of year | | | 2,894 | | | | 3,297 | | | | 2,387 | | | | 720 | | | | 666 | | | | 804 | | | | 1,119 | |
Additions to impaired
loans and acceptances | | | 1,225 | | | | 1,525 | | | | 2,690 | | | | 2,506 | | | | 588 | | | | 420 | | | | 423 | |
Reductions in
impaired
loans and
acceptances (2) | | | (326 | ) | | | (712 | ) | | | (288 | ) | | | 131 | | | | (143 | ) | | | (220 | ) | | | (319 | ) |
Write-offs | | | (1,108 | ) | | | (1,216 | ) | | | (1,492 | ) | | | (970 | ) | | | (391 | ) | | | (338 | ) | | | (419 | ) |
GIL, end of year | | | 2,685 | | | | 2,894 | | | | 3,297 | | | | 2,387 | | | | 720 | | | | 666 | | | | 804 | |
GIL as a % of gross loans and acceptances | | | 1.30 | | | | 1.62 | | | | 1.94 | | | | 1.26 | | | | 0.44 | | | | 0.41 | | | | 0.55 | |
GIL as a % of gross loans and acceptances excluding purchased portfolios (3) | | | 1.40 | | | | 1.63 | | | | 1.94 | | | | 1.26 | | | | 0.44 | | | | 0.41 | | | | 0.55 | |
| | (1) | GIL excludes purchased credit impaired loans and 2010 data has been restated accordingly. |
| | (2) | Includes the impact of foreign exchange and write-offs of consumer loans included in additions to impaired loans in the period. |
| | (3) | Ratio is presented excluding purchased portfolios, to provide for better historical comparisons (refer to the Acquisition of M&I section on page 36 for details). |
Provision for Credit Losses (PCL)($ millions, except as noted)
| | | | | | | | | | | | | | | | | | | | | | | | | | | | |
| | | | | | | |
For the year
ended October 31 | | 2011 | | | 2010 | | | 2009 | | | 2008 | | | 2007 | | | 2006 | | | 2005 | |
New specific provisions | | | 1,188 | | | | 1,419 | | | | 1,765 | | | | 1,242 | | | | 460 | | | | 410 | | | | 407 | |
Reversals of previous allowances | | | (128 | ) | | | (187 | ) | | | (77 | ) | | | (58 | ) | | | (66 | ) | | | (87 | ) | | | (121 | ) |
Recoveries of prior write-offs | | | (241 | ) | | | (183 | ) | | | (145 | ) | | | (114 | ) | | | (91 | ) | | | (112 | ) | | | (67 | ) |
Specific PCL | | | 819 | | | | 1,049 | | | | 1,543 | | | | 1,070 | | | | 303 | | | | 211 | | | | 219 | |
Increase in (reduction of) general allowance | | | 38 | | | | – | | | | 60 | | | | 260 | | | | 50 | | | | (35 | ) | | | (40 | ) |
Provision for credit losses | | | 857 | | | | 1,049 | | | | 1,603 | | | | 1,330 | | | | 353 | | | | 176 | | | | 179 | |
Adjusted specific
PCL (1) | | | 801 | | | | 1,049 | | | | 1,543 | | | | 1,070 | | | | 303 | | | | 211 | | | | 219 | |
PCL as a % of
average net
loans and
acceptances (%) | | | 0.46 | | | | 0.61 | | | | 0.88 | | | | 0.76 | | | | 0.21 | | | | 0.11 | | | | 0.13 | |
PCL as a % of
average net
loans and
acceptances
excluding
purchased
portfolios (%) (2) | | | 0.44 | | | | 0.61 | | | | 0.88 | | | | 0.76 | | | | 0.21 | | | | 0.11 | | | | 0.13 | |
Adjusted specific
PCL as a % of
average net
loans and
acceptances (%) (1) | | | 0.45 | | | | 0.61 | | | | 0.85 | | | | 0.61 | | | | 0.18 | | | | 0.14 | | | | 0.16 | |
(1) Adjusted excludes provisions related to the M&I purchased portfolio, as of 2011. Please see the Non-GAAP Measures section on page 94. (2) Ratio is presented excluding purchased portfolios, to provide for better historical comparisons (refer to the Acquisition of Marshall & Ilsley Corporation section on page 36 for details). | |
Adjusted results in this section are non-GAAP and are discussed in the Non-GAAP Measures section on page 94.
This Provision for Credit Losses section contains forward-looking statements.
Please see the Caution Regarding Forward-Looking Statements.
Adjusted results in this section are non-GAAP and are discussed in the Non-GAAP Measures section on page 94.
| | |
| 42 | | BMO Financial Group 194th Annual Report 2011 |
Non-Interest Expense
Non-interest expense increased $1,015 million or 13% to $8,605 million in 2011. BMO’s adjusted non-interest expense(1) increased $850 million or 11% to $8,404 million. Adjusted non-interest expense excludes costs of the M&I integration and restructuring in 2011, as well as amortization of acquisition-related intangible assets in all years and severance costs in 2009. The factors contributing to the increases are set out in the adjacent Contribution to Growth in Adjusted Non-Interest Expense and Non-Interest Expense table.
Amounts in the rest of this Non-Interest Expense section are stated on an adjusted basis.
As explained on page 37, the net effect of businesses acquired in 2011 and 2010 increased expenses in 2011 relative to 2010 by $439 million (5.8%). As further explained on page 38, the weaker U.S. dollar reduced costs in 2011 by $124 million (1.6%). Higher performance-based compensation costs, in line with improved performance, and increases in our workforce, including M&I staff, increased expenses by $105 million (1.4%).
The dollar and percentage changes in expenses by category are outlined in the adjacent Adjusted Non-Interest Expense and Non-Interest Expense table. Table 8 on page 103 provides more detail on expenses and expense growth.
Other employee compensation expense, which includes salaries and employee benefits, increased $398 million or 14% from 2010, of which $178 million was attributable to the M&I acquisition. The remaining increase of $220 million was due to increases in our workforce as we continued to invest in our businesses over the course of 2011.
Premises and equipment costs increased $202 million or 15%, with $76 million related to the M&I acquisition and the majority of the balance related to software development in support of our business growth.
Other expenses rose $152 million or 9%, with $94 million of the increase attributable to the impact of the M&I acquisition. The remainder was mainly due to a large number of small increases for initiative-related expenses such as professional fees and travel costs, primarily related to activities in support of our business growth.
The harmonized sales tax that was implemented on July 1, 2010, in both Ontario and British Columbia increased the sales tax paid in these two jurisdictions, resulting in an increase in expense of approximately $90 million in 2011 and $30 million in 2010 in a number of expense categories relative to 2009.
Productivity
The productivity ratio (expense-to-revenue ratio) deteriorated by 50 basis points to 62.7% in 2011. BMO’s adjusted productivity ratio was 62.4%, a 50 basis point deterioration from 61.9% in 2010.
P&C Canada is BMO’s largest operating segment, and its productivity ratio of 51.9% deteriorated by 70 basis points from 2010, as expected, with non-interest expense growth outpacing revenue growth due to spending on initiatives, including additions to our sales force and investments to enhance our multi-channel distribution network.
The 2011 productivity ratio in P&C U.S. of 62.7% improved by 580 basis points and the adjusted productivity ratio improved by 660 basis points to 60.3%. Revenues in P&C U.S. grew at a faster pace than expenses in part due to the acquired M&I business.
The productivity ratio in Private Client Group in 2011 deteriorated by 70 basis points to 73.1%, but improved by 20 basis points excluding the impact of acquisitions. Revenue growth in the group, excluding insurance, was strong.
BMO Capital Markets productivity ratio deteriorated by 140 basis points, driven by increased non-interest expense due in part to strategic hiring.
Examples of initiatives to enhance productivity are outlined in the 2011 Review of Operating Groups Performance, which starts on page 44. Operating leverage was negative 1.1% and adjusted operating leverage was negative 1.0%. One of our medium-term financial objectives is to generate average annual adjusted operating leverage of 2% or more,
Theproductivity ratio (orexpense-to-revenue ratio) is a key measure of productivity. It is calculated as non-interest expense divided by total revenues (on a taxable equivalent basis in the operating groups), expressed as a percentage. Theadjusted productivity ratio is another key measure of productivity and is calculated in the same manner, utilizing adjusted revenue and expense. See page 95.
Contribution to Growth in Adjusted Non-Interest Expense and Non-Interest Expense(%)
| | | | | | | | | | | | |
| For the year ended October 31 | | 2011 | | | 2010 | | | 2009 | |
Significant businesses acquired | | | 5.8 | | | | 1.2 | | | | 0.5 | |
Canadian/U.S. foreign exchange currency translation effect | | | (1.6 | ) | | | (2.8 | ) | | | 3.2 | |
Performance-based compensation | | | 1.4 | | | | 1.6 | | | | 0.6 | |
Other | | | 5.6 | | | | 4.5 | | | | 1.0 | |
Total adjusted non-interest expense growth | | | 11.2 | | | | 4.5 | | | | 5.3 | |
Impact of adjusting items | | | 2.2 | | | | (1.7 | ) | | | 1.8 | |
Total non-interest expense growth | | | 13.4 | | | | 2.8 | | | | 7.1 | |
Adjusted Non-Interest Expense and Non-Interest Expense
($ millions, except as noted)
| | | | | | | | | | | | | | | | | | | | |
| | | | | | | | | Change
from 2010 | |
| For the year ended October 31 | | 2011 | | | 2010 | | | 2009 | | | $ | | | % | |
Performance-based compensation | | | 1,560 | | | | 1,455 | | | | 1,338 | | | | 105 | | | | 7 | |
Other employee compensation | | | 3,307 | | | | 2,909 | | | | 2,929 | | | | 398 | | | | 14 | |
Total employee compensation | | | 4,867 | | | | 4,364 | | | | 4,267 | | | | 503 | | | | 12 | |
Premises and equipment | | | 1,545 | | | | 1,343 | | | | 1,281 | | | | 202 | | | | 15 | |
Other | | | 1,831 | | | | 1,679 | | | | 1,512 | | | | 152 | | | | 9 | |
Amortization of intangible assets | | | 161 | | | | 168 | | | | 160 | | | | (7 | ) | | | (4 | ) |
Total adjusted non-interest expense | | | 8,404 | | | | 7,554 | | | | 7,220 | | | | 850 | | | | 11 | |
Adjusting items | | | 201 | | | | 36 | | | | 161 | | | | 165 | | | | +100 | |
Total non-interest expense | | | 8,605 | | | | 7,590 | | | | 7,381 | | | | 1,015 | | | | 13 | |
Adjusted non-interest expense growth (%) | | | 11.3 | | | | 4.6 | | | | 5.4 | | | | na | | | | na | |
Non-interest expense growth (%) | | | 13.4 | | | | 2.8 | | | | 7.1 | | | | na | | | | na | |
na – not applicable
Productivity Ratios by Group (teb) (%)
| | | | | | | | | | | | |
For the year ended October 31 | | | 2011 | | | | 2010 | | | | 2009 | |
Productivity Ratios | | | | | | | | | | | | |
P&C Canada | | | 51.9 | | | | 51.2 | | | | 53.4 | |
P&C U.S. | | | 62.7 | | | | 68.5 | | | | 63.8 | |
PCG | | | 73.1 | | | | 72.4 | | | | 77.9 | |
BMO Capital Markets | | | 57.1 | | | | 55.7 | | | | 56.5 | |
Total bank | | | 62.7 | | | | 62.2 | | | | 66.7 | |
Selected Adjusted Productivity Ratios | | | | | | | | | | | | |
P&C U.S. | | | 60.3 | | | | 66.9 | | | | 61.7 | |
Total bank | | | 62.4 | | | | 61.9 | | | | 62.3 | |
increasing the rate of adjusted revenue growth by an average of at least two percentage points more than the rate of adjusted non-interest expense growth. We aim to improve productivity and generate operating leverage by driving revenues through a strong customer focus and effective expense management, and through achieving synergies on the M&I integration. In what may now be a low growth environment, we are renewing our focus on productivity, revenues and customers to achieve greater efficiency and effectiveness in all support functions, operating groups and underlying business processes.
Adjusted results in this section are non-GAAP and are discussed in the Non-GAAP Measures section on page 94.
| | | | |
| BMO Financial Group 194th Annual Report 2011 | | | 43 | |
MANAGEMENT’S DISCUSSION AND ANALYSIS
Provision for Income Taxes
The provision for income taxes reflected in the Consolidated Statement of Income is based upon transactions recorded in income, regardless of when such transactions are subject to taxation by tax authorities, with the exception of the repatriation of retained earnings from foreign subsidiaries, as outlined in Note 24 on page 164 of the financial statements.
Management assesses BMO’s consolidated results and associated provisions for income taxes on a GAAP basis. We assess the performance of the operating groups and associated income taxes on a taxable equivalent basis and report accordingly.
The provision for income taxes was $917 million in 2011, compared with $687 million in 2010. The adjusted provision for income taxes(1) in 2011 was $908 million. The effective tax rate in 2011 was 21.5%, compared with 19.2% in 2010. The adjusted effective tax rate in 2011 was 21.3%. The higher effective tax rate in 2011 was mainly attributable to proportionately lower tax-exempt income and lower net recoveries of prior years’ income taxes, partially offset by the effect of a reduction in the Canadian statutory income tax rate.
BMO hedges the foreign exchange risk arising from its investments in U.S. operations by funding the investments in U.S. dollars. Under this
program, the gain or loss on hedging and the unrealized gain or loss on translation of investments in U.S. operations are charged or credited to shareholders’ equity. For income tax purposes, the gain or loss on the hedging activities results in an income tax charge or credit in the current period, which is charged or credited to shareholders’ equity, while the associated unrealized gain or loss on the investments in U.S. operations does not incur income taxes until the investments are liquidated. The income tax charge/benefit arising from a hedging gain/loss is a function of the fluctuations in exchange rates from period to period. Hedging of the investments in U.S. operations has given rise to income tax expense in shareholders’ equity of $41 million for the year, compared with $206 million in 2010. Refer to the Consolidated Statement of Changes in Shareholders’ Equity on page 117 of the financial statements for further details.
Table 8 on page 103 details the $1,437 million of total net government levies and income tax expense incurred by BMO in 2011. The increase from $1,089 million in 2010 was primarily due to higher income tax expense, as well as higher harmonized sales tax and GST expenses.
| (1) | The adjusted rate is computed using adjusted net income rather than net income in the determination of income subject to tax. |
Adjusted results in this section are non-GAAP and are discussed in the Non-GAAP Measures section on page 94.
Transactions with Related Parties
In the ordinary course of business, we provide banking services to our directors and executives and their affiliated entities, joint ventures and equity-accounted investees on the same terms that we offer to our customers for those services. A select suite of customer loan and mortgage products is offered to our employees at rates normally made
available to our preferred customers. We also offer employees a fee-based subsidy on annual credit card fees.
Stock options and deferred share units granted to directors, and preferred rate loan agreements for executives relating to transfers we initiate, are discussed in Note 27 on page 169 of the financial statements.
2011 Review of Operating Groups Performance
This section includes an analysis of the financial results of our operating groups and descriptions of their businesses, strategies, strengths, challenges, key value drivers, achievements and outlooks.
Personal and Commercial Banking (P&C) (pages 46 to 52)
Net income was $2,056 million in 2011, an increase of $202 million or 11% from 2010. Adjusted net income was $2,100 million, an increase of $221 million or 12%.
Private Client Group (PCG) (pages 53 to 55)
Net income was $518 million in 2011, an increase of $58 million or 13% from 2010. Adjusted net income was $528 million, an increase of $62 million or 13%.
BMO Capital Markets (BMO CM) (pages 56 to 58)
Net income was $920 million in 2011, an increase of $104 million or 13% from 2010. Adjusted net income was $920 million, an increase of $103 million or 13%.
Corporate Services, including Technology and Operations (page 59)
The net loss was $228 million in 2011, compared with a net loss of $320 million in 2010. The adjusted net loss was $267 million, an improvement of $53 million from 2010.
Allocation of Results
The basis for the allocation of results geographically and among operating groups is outlined in Note 26 on page 167 of the financial statements. Certain prior-year data has been restated, as explained on the following page, which also provides further information on the allocation of results.
| | |
| 44 | | BMO Financial Group 194th Annual Report 2011 |
Contributions to Revenue, Expenses, Net Income and Average Assets by Operating Group and by Location($ millions, except as noted)
| | | | | | | | | | | | | | | | | | | | | | | | | | | | | | | | | | | | | | | | | | | | | | | | | | | | | | | | | | | | |
| | | Personal and Commercial | | | Private | | | BMO | | | Corporate Services, including | | | Total | |
| | | Banking | | | Client Group | | | Capital Markets | | | Technology and Operations | | | Consolidated | |
For the year ended October 31 | | 2011 | | | 2010 | | | 2009 | | | 2011 | | | 2010 | | | 2009 | | | 2011 | | | 2010 | | | 2009 | | | 2011 | | | 2010 | | | 2009 | | | 2011 | | | 2010 | | | 2009 | |
Operating Groups Relative Contribution to BMO’s Performance(%) | | | | | | | | | | | | | | | | | | | | | | | | | | | | | | | | | | | | | |
Revenue | | | 58.8 | | | | 59.5 | | | | 62.2 | | | | 18.7 | | | | 18.4 | | | | 18.2 | | | | 24.4 | | | | 26.8 | | | | 27.9 | | | | (1.9 | ) | | | (4.7 | ) | | | (8.2 | ) | | | 100 | | | | 100 | | | | 100 | |
Expenses | | | 51.1 | | | | 52.2 | | | | 52.0 | | | | 21.7 | | | | 21.4 | | | | 21.2 | | | | 22.2 | | | | 24.0 | | | | 23.6 | | | | 5.0 | | | | 2.4 | | | | 3.1 | | | | 100 | | | | 100 | | | | 100 | |
Net income | | | 63.0 | | | | 66.0 | | | | 97.8 | | | | 15.9 | | | | 16.4 | | | | 20.2 | | | | 28.2 | | | | 29.0 | | | | 48.7 | | | | (7.1 | ) | | | (11.4 | ) | | | (66.6 | ) | | | 100 | | | | 100 | | | | 100 | |
Adjusted net income | | | 64.0 | | | | 66.1 | | | | 77.5 | | | | 16.1 | | | | 16.4 | | | | 15.9 | | | | 28.0 | | | | 28.7 | | | | 53.4 | | | | (8.1 | ) | | | (11.2 | ) | | | (46.8 | ) | | | 100 | | | | 100 | | | | 100 | |
Average assets | | | 43.8 | | | | 44.5 | | | | 41.3 | | | | 3.7 | | | | 3.6 | | | | 2.6 | | | | 49.2 | | | | 50.4 | | | | 56.6 | | | | 3.3 | | | | 1.5 | | | | (0.5 | ) | | | 100 | | | | 100 | | | | 100 | |
Total Revenue | | | | | | | | | | | | | | | | | | | | | | | | | | | | | | | | | | | | | | | | | | | | | | | | | | | | | | | | | | | | |
Canada | | | 5,985 | | | | 5,742 | | | | 5,288 | | | | 2,016 | | | | 1,818 | | | | 1,598 | | | | 2,117 | | | | 2,027 | | | | 1,468 | | | | (188 | ) | | | (413 | ) | | | (640 | ) | | | 9,930 | | | | 9,174 | | | | 7,714 | |
United States | | | 2,076 | | | | 1,518 | | | | 1,595 | | | | 386 | | | | 252 | | | | 241 | | | | 997 | | | | 1,035 | | | | 1,331 | | | | (36 | ) | | | (166 | ) | | | (347 | ) | | | 3,423 | | | | 2,639 | | | | 2,820 | |
Other countries | | | – | | | | – | | | | – | | | | 157 | | | | 175 | | | | 173 | | | | 227 | | | | 216 | | | | 286 | | | | (19 | ) | | | 6 | | | | 71 | | | | 365 | | | | 397 | | | | 530 | |
| | | | 8,061 | | | | 7,260 | | | | 6,883 | | | | 2,559 | | | | 2,245 | | | | 2,012 | | | | 3,341 | | | | 3,278 | | | | 3,085 | | | | (243 | ) | | | (573 | ) | | | (916 | ) | | | 13,718 | | | | 12,210 | | | | 11,064 | |
Total Expenses | | | | | | | | | | | | | | | | | | | | | | | | | | | | | | | | | | | | | | | | | | | | | | | | | | | | | | | | | | | | |
Canada | | | 3,104 | | | | 2,952 | | | | 2,822 | | | | 1,525 | | | | 1,376 | | | | 1,294 | | | | 967 | | | | 931 | | | | 889 | | | | 247 | | | | 180 | | | | 225 | | | | 5,843 | | | | 5,439 | | | | 5,230 | |
United States | | | 1,295 | | | | 1,011 | | | | 1,017 | | | | 315 | | | | 222 | | | | 250 | | | | 784 | | | | 756 | | | | 724 | | | | 165 | | | | (14 | ) | | | (2 | ) | | | 2,559 | | | | 1,975 | | | | 1,989 | |
Other countries | | | – | | | | – | | | | – | | | | 31 | | | | 27 | | | | 22 | | | | 156 | | | | 138 | | | | 131 | | | | 16 | | | | 11 | | | | 9 | | | | 203 | | | | 176 | | | | 162 | |
| | | | 4,399 | | | | 3,963 | | | | 3,839 | | | | 1,871 | | | | 1,625 | | | | 1,566 | | | | 1,907 | | | | 1,825 | | | | 1,744 | | | | 428 | | | | 177 | | | | 232 | | | | 8,605 | | | | 7,590 | | | | 7,381 | |
Net Income | | | | | | | | | | | | | | | | | | | | | | | | | | | | | | | | | | | | | | | | | | | | | | | | | | | | | | | | | | | | |
Canada | | | 1,686 | | | | 1,622 | | | | 1,429 | | | | 348 | | | | 301 | | | | 199 | | | | 819 | | | | 678 | | | | 366 | | | | (24 | ) | | | (67 | ) | | | (433 | ) | | | 2,829 | | | | 2,534 | | | | 1,561 | |
United States | | | 370 | | | | 232 | | | | 319 | | | | 43 | | | | 17 | | | | (6 | ) | | | 43 | | | | 71 | | | | 363 | | | | (180 | ) | | | (261 | ) | | | (786 | ) | | | 276 | | | | 59 | | | | (110 | ) |
Other countries | | | – | | | | – | | | | – | | | | 127 | | | | 142 | | | | 168 | | | | 58 | | | | 67 | | | | 141 | | | | (24 | ) | | | 8 | | | | 27 | | | | 161 | | | | 217 | | | | 336 | |
| | | | 2,056 | | | | 1,854 | | | | 1,748 | | | | 518 | | | | 460 | | | | 361 | | | | 920 | | | | 816 | | | | 870 | | | | (228 | ) | | | (320 | ) | | | (1,192 | ) | | | 3,266 | | | | 2,810 | | | | 1,787 | |
Adjusted Net Income | | | | | | | | | | | | | | | | | | | | | | | | | | | | | | | | | | | | | | | | | | | | | | | | | | | | | | | | | | | | |
Canada | | | 1,691 | | | | 1,626 | | | | 1,433 | | | | 352 | | | | 305 | | | | 199 | | | | 819 | | | | 679 | | | | 721 | | | | (47 | ) | | | (68 | ) | | | (358 | ) | | | 2,815 | | | | 2,542 | | | | 1,995 | |
United States | | | 409 | | | | 253 | | | | 347 | | | | 48 | | | | 18 | | | | (4 | ) | | | 43 | | | | 71 | | | | 364 | | | | (196 | ) | | | (260 | ) | | | (743 | ) | | | 304 | | | | 82 | | | | (36 | ) |
Other countries | | | – | | | | – | | | | – | | | | 128 | | | | 143 | | | | 169 | | | | 58 | | | | 67 | | | | 141 | | | | (24 | ) | | | 8 | | | | 27 | | | | 162 | | | | 218 | | | | 337 | |
| | | | 2,100 | | | | 1,879 | | | | 1,780 | | | | 528 | | | | 466 | | | | 364 | | | | 920 | | | | 817 | | | | 1,226 | | | | (267 | ) | | | (320 | ) | | | (1,074 | ) | | | 3,281 | | | | 2,842 | | | | 2,296 | |
Average Assets | | | | | | | | | | | | | | | | | | | | | | | | | | | | | | | | | | | | | | | | | | | | | | | | | | | | | | | | | | | | |
Canada | | | 153,107 | | | | 144,837 | | | | 139,945 | | | | 13,300 | | | | 11,370 | | | | 8,332 | | | | 120,161 | | | | 107,411 | | | | 128,681 | | | | (7,014 | ) | | | (7,007 | ) | | | (10,309 | ) | | | 279,554 | | | | 256,611 | | | | 266,649 | |
United States | | | 41,122 | | | | 32,367 | | | | 41,175 | | | | 2,547 | | | | 2,340 | | | | 2,811 | | | | 77,233 | | | | 66,443 | | | | 90,581 | | | | 21,773 | | | | 13,184 | | | | 7,911 | | | | 142,675 | | | | 114,334 | | | | 142,478 | |
Other countries | | | – | | | | – | | | | – | | | | 519 | | | | 503 | | | | 451 | | | | 20,845 | | | | 27,009 | | | | 28,926 | | | | 56 | | | | 17 | | | | 44 | | | | 21,420 | | | | 27,529 | | | | 29,421 | |
| | | | 194,229 | | | | 177,204 | | | | 181,120 | | | | 16,366 | | | | 14,213 | | | | 11,594 | | | | 218,239 | | | | 200,863 | | | | 248,188 | | | | 14,815 | | | | 6,194 | | | | (2,354 | ) | | | 443,649 | | | | 398,474 | | | | 438,548 | |
BMO employs a methodology for segmented reporting purposes whereby expected credit losses are charged to the operating groups quarterly based on their share of expected credit losses. The difference between quarterly charges based on expected credit losses and required quarterly provisions based on actual losses is charged to Corporate Services. The operating group results are presented on an expected credit loss basis.
The actual specific provision for credit losses for P&C was $980 million, comprised of $630 million in P&C Canada and $350 million in P&C U.S., compared with $1,177 million, $712 million and $465 million, respectively, for the 2010 fiscal year. The P&C Canada provision for credit losses of $630 million included credit losses of $212 million related to securitized assets, which are reflected as a reduction of non-interest revenue in Corporate Services under our securitization reporting methodology and are therefore not included in BMO’s $819 million of specific provisions. For Private Client Group, the actual specific provision for credit losses for 2011 was $8 million, compared with $13 million in 2010, and for BMO Capital Markets, the actual specific provision for credit losses for 2011 was $17 million, compared with $62 million in 2010. In addition, in 2011 there was a $26 million provision ($nil in 2010) for actual credit losses in respect of loans transferred from P&C U.S. to Corporate Services.
BMO analyzes consolidated revenues on a GAAP basis. However, like many banks, BMO analyzes the revenues of its operating groups and associated ratios computed using revenue on a taxable equivalent basis (teb). This basis includes an adjustment that increases GAAP revenues
and the GAAP provision for income taxes by an amount that would raise revenues on certain tax-exempt securities to a level equivalent to amounts that would incur tax at the statutory rate. The offset to the group teb adjustments is reflected in Corporate Services revenues and income tax provisions.
During the year, approximately US$1.0 billion of impaired real estate secured assets, comprised primarily of commercial real estate loans, were transferred to Corporate Services from P&C U.S. to allow our businesses to focus on ongoing customer relationships and leverage our risk management expertise in our special assets management unit. Prior period loan balances, revenues and expenses were restated to reflect the transfer. Approximately US$1.5 billion of similar assets acquired in the M&I transaction have also been included in Corporate Services.
M&I’s activities are primarily reflected in our P&C U.S., PCG and Corporate Services segments, with a small amount included in BMO Capital Markets. Corporate Services results reflect credit-related items in respect of the acquired M&I loan portfolio. The recognition of a portion of the credit mark recorded on the portfolio is included in net interest income. Results also include provisions for credit losses on the acquired M&I portfolio. Integration and restructuring costs are also included in Corporate Services. We have included expected losses in P&C U.S. and PCG for the acquired M&I loan portfolio on the same basis as expected losses are determined for other loans in P&C U.S. and PCG.
| | | | |
| BMO Financial Group 194th Annual Report 2011 | | | 45 | |
Adjusted results in this section are non-GAAP and are discussed in the Non-GAAP Measures section on page 94.
MANAGEMENT’S DISCUSSION AND ANALYSIS
Personal and Commercial Banking(Canadian $ in millions, except as noted)
| | | | | | | | | | | | | | | | | | | | | | | | | | | | | | | | | | | | | | | | | | | | | | | | | | | | | | | | | | | | | | | | |
As at or for the year ended
October 31 | | P&C Canada | | | | | P&C U.S. | | | | | P&C | |
| | | | | | | | | | | Change | | | | | | | | | | | | | | Change | | | | | | | | | | | | | | Change | |
| | Fiscal | | | Fiscal | | | Fiscal | | | from 2010 | | | | | Fiscal | | | Fiscal | | | Fiscal | | | from 2010 | | | | | Fiscal | | | Fiscal | | | Fiscal | | | from 2010 | |
| | 2011 | | | 2010 | | | 2009 | | | $ | | | % | | | | | 2011 | | | 2010 | | | 2009 | | | $ | | | % | | | | | 2011 | | | 2010 | | | 2009 | | | $ | | | % | |
Net interest income (teb) | | | 4,368 | | | | 4,164 | | | | 3,810 | | | | 204 | | | | 5 | | | | | | 1,625 | | | | 1,104 | | | | 1,248 | | | | 521 | | | | 47 | | | | | | 5,993 | | | | 5,268 | | | | 5,058 | | | | 725 | | | | 14 | |
Non-interest revenue | | | 1,700 | | | | 1,667 | | | | 1,478 | | | | 33 | | | | 2 | | | | | | 368 | | | | 325 | | | | 347 | | | | 43 | | | | 13 | | | | | | 2,068 | | | | 1,992 | | | | 1,825 | | | | 76 | | | | 4 | |
Total revenue (teb) | | | 6,068 | | | | 5,831 | | | | 5,288 | | | | 237 | | | | 4 | | | | | | 1,993 | | | | 1,429 | | | | 1,595 | | | | 564 | | | | 39 | | | | | | 8,061 | | | | 7,260 | | | | 6,883 | | | | 801 | | | | 11 | |
Provision for credit losses | | | 547 | | | | 502 | | | | 387 | | | | 45 | | | | 9 | | | | | | 202 | | | | 124 | | | | 92 | | | | 78 | | | | 64 | | | | | | 749 | | | | 626 | | | | 479 | | | | 123 | | | | 20 | |
Non-interest expense | | | 3,150 | | | | 2,985 | | | | 2,822 | | | | 165 | | | | 6 | | | | | | 1,249 | | | | 978 | | | | 1,017 | | | | 271 | | | | 28 | | | | | | 4,399 | | | | 3,963 | | | | 3,839 | | | | 436 | | | | 11 | |
Income before income taxes and non-controlling interest in subsidiaries | | | 2,371 | | | | 2,344 | | | | 2,079 | | | | 27 | | | | 1 | | | | | | 542 | | | | 327 | | | | 486 | | | | 215 | | | | 66 | | | | | | 2,913 | | | | 2,671 | | | | 2,565 | | | | 242 | | | | 9 | |
Income taxes (teb) | | | 670 | | | | 704 | | | | 650 | | | | (34 | ) | | | (5 | ) | | | | | 187 | | | | 113 | | | | 167 | | | | 74 | | | | 65 | | | | | | 857 | | | | 817 | | | | 817 | | | | 40 | | | | 5 | |
Net income | | | 1,701 | | | | 1,640 | | | | 1,429 | | | | 61 | | | | 4 | | | | | | 355 | | | | 214 | | | | 319 | | | | 141 | | | | 66 | | | | | | 2,056 | | | | 1,854 | | | | 1,748 | | | | 202 | | | | 11 | |
Adjusted net income | | | 1,710 | | | | 1,646 | | | | 1,433 | | | | 64 | | | | 4 | | | | | | 390 | | | | 233 | | | | 347 | | | | 157 | | | | 67 | | | | | | 2,100 | | | | 1,879 | | | | 1,780 | | | | 221 | | | | 12 | |
Net economic profit | | | | | | | | | | | | | | | | | | | | | | | | | | | | | | | | | | | | | | | | | | | | | | | 1,108 | | | | 1,152 | | | | 1,000 | | | | (44 | ) | | | (4 | ) |
Return on equity (%) | | | | | | | | | | | | | | | | | | | | | | | | | | | | | | | | | | | | | | | | | | | | | | | 22.7 | | | | 28.1 | | | | 24.3 | | | | | | | | (5.4 | ) |
Adjusted productivity ratio (teb) (%) | | | 51.8 | | | | 51.1 | | | | 53.3 | | | | | | | | 0.7 | | | | | | 60.3 | | | | 66.9 | | | | 61.7 | | | | | | | | (6.6 | ) | | | | | 53.9 | | | | 54.2 | | | | 55.2 | | | | | | | | (0.3 | ) |
Productivity ratio (%) | | | 51.9 | | | | 51.2 | | | | 53.4 | | | | | | | | 0.7 | | | | | | 62.7 | | | | 68.5 | | | | 63.8 | | | | | | | | (5.8 | ) | | | | | 54.6 | | | | 54.6 | | | | 55.8 | | | | | | | | – | |
Net interest margin on earning assets (%) | | | 2.93 | | | | 2.95 | | | | 2.82 | | | | | | | | (0.02 | ) | | | | | 4.43 | | | | 3.75 | | | | 3.25 | | | | | | | | 0.68 | | | | | | 3.23 | | | | 3.09 | | | | 2.92 | | | | | | | | 0.14 | |
Average common equity | | | | | | | | | | | | | | | | | | | | | | | | | | | | | | | | | | | | | | | | | | | | | | | 8,669 | | | | 6,403 | | | | 6,977 | | | | 2,266 | | | | 35 | |
Average earning assets | | | 148,957 | | | | 141,107 | | | | 135,035 | | | | 7,850 | | | | 6 | | | | | | 36,695 | | | | 29,445 | | | | 38,439 | | | | 7,250 | | | | 25 | | | | | | 185,652 | | | | 170,552 | | | | 173,474 | | | | 15,100 | | | | 9 | |
Average loans and acceptances | | | 151,247 | | | | 143,034 | | | | 136,698 | | | | 8,213 | | | | 6 | | | | | | 33,225 | | | | 25,737 | | | | 33,646 | | | | 7,488 | | | | 29 | | | | | | 184,472 | | | | 168,771 | | | | 170,344 | | | | 15,701 | | | | 9 | |
Average deposits | | | 102,455 | | | | 98,945 | | | | 95,941 | | | | 3,510 | | | | 4 | | | | | | 37,273 | | | | 26,178 | | | | 29,726 | | | | 11,095 | | | | 42 | | | | | | 139,728 | | | | 125,123 | | | | 125,667 | | | | 14,605 | | | | 12 | |
Assets under administration | | | 22,421 | | | | 22,740 | | | | 24,513 | | | | (319 | ) | | | (1 | ) | | | | | 59,216 | | | | 58,596 | | | | 49,736 | | | | 620 | | | | 1 | | | | | | 81,637 | | | | 81,336 | | | | 74,249 | | | | 301 | | | | – | |
Assets under management | | | – | | | | – | | | | – | | | | – | | | | – | | | | | | – | | | | 805 | | | | – | | | | (805 | ) | | | nm | | | | | | – | | | | 805 | | | | – | | | | (805 | ) | | | nm | |
Full-time equivalent employees | | | 16,765 | | | | 16,246 | | | | 15,761 | | | | 519 | | | | 3 | | | | | | 7,661 | | | | 4,456 | | | | 3,928 | | | | 3,205 | | | | 72 | | | | | | 24,426 | | | | 20,702 | | | | 19,689 | | | | 3,724 | | | | 18 | |
nm – not meaningful P&C U.S. Selected Financial Data(US$ in millions) | | | | | | | | | | | | | | | | | | | | | | | | | | | | | | | | | | | | | | | | | | | | | |
As at or for the year ended October 31 | | | | | | | | | | | | | | | | | | | | | | | | | Fiscal | | | | Fiscal | | | | Fiscal | | |
| Change
from 2010 |
| | | | | | | | | | | | | | | | | | | | | | |
| | | | | | | | | | | | | | | | | | | 2011 | | | 2010 | | | 2009 | | | $ | | | % | | | | | | | | | | | | | | | | | | |
Total revenue (teb) | | | | | | | | | | | | | | | | | | | | | | | | | 2,017 | | | | 1,371 | | | | 1,365 | | | | 646 | | | | 47 | | | | | | | | | | | | | | | | | | | | | | | |
Non-interest expense | | | | | | | | | | | | | | | | | | | | | | | | | 1,265 | | | | 939 | | | | 873 | | | | 326 | | | | 35 | | | | | | | | | | | | | | | | | | | | | | | |
Net income | | | | | | | | | | | | | | | | | | | | | | | | | 359 | | | | 205 | | | | 271 | | | | 154 | | | | 75 | | | | | | | | | | | | | | | | | | | | | | | |
Adjusted net income | | | | | | | | | | | | | | | | | | | | | | | | | 394 | | | | 223 | | | | 295 | | | | 171 | | | | 77 | | | | | | | | | | | | | | | | | | | | | | | |
Average earning assets | | | | | | | | | | | | | | | | | | | | | | | | | 37,144 | | | | 28,234 | | | | 32,862 | | | | 8,910 | | | | 32 | | | | | | | | | | | | | | | | | | | | | | | |
Average loans and acceptances | | | | | | | | | | | | | | | | | | | | | | | | | 33,624 | | | | 24,679 | | | | 28,754 | | | | 8,945 | | | | 36 | | | | | | | | | | | | | | | | | | | | | | | |
Average deposits | | | | | | | | | | | | | | | | | | | | | | | | | 37,727 | | | | 25,112 | | | | 25,388 | | | | 12,615 | | | | 50 | | | | | | | | | | | | | | | | | | | | | | | |
Net economic profit and adjusted results in this section are non-GAAP and are discussed in the Non-GAAP Measures section on page 94.
| | |
| 46 | | BMO Financial Group 194th Annual Report 2011 |
Personal and Commercial Banking Canada
We offer a broad range of products and services to more than seven million customers. These include solutions for everyday banking, financing, investing, credit cards and creditor insurance, as well as a broad suite of commercial products and financial advisory services. We provide an integrated network of BMO Bank of Montreal branches, telephone banking, online and mobile banking and automated banking machines (ABMs), along with the expertise of our mortgage specialists, financial planners and small business bankers.
| | |
 | | “We have a clear focus on differentiating BMO by delivering a great customer experience that deepens relationships with existing customers and attracts new ones.” Frank Techar President and Chief Executive Officer Personal and Commercial Banking Canada |
Strengths and Value Drivers
| Ÿ | | Strong competitive position in commercial banking, reflected in our number two ranking in market share for business loans of $5 million and less. |
| Ÿ | | Largest MasterCard issuer in Canada, as measured by transaction volumes, and one of the top commercial card issuers in North America. |
| Ÿ | | Highly experienced team of senior account managers in upper mid-market commercial banking, offering integrated products and services that are driving high customer loyalty scores in the segment. |
| Ÿ | | Strong and consistently applied credit risk management practices that provide customers with reliable access to appropriate financing solutions in all economic conditions. |
| Ÿ | | Rigorous performance management system, encompassing planning, tracking, assessment and coaching. |
Challenges
| Ÿ | | Recent slowing of economic environment expected to reduce demand for some products and services. |
| Ÿ | | Increased pace of change and innovation allows customers to access an array of products and services from competitors. |
| Ÿ | | Demand continues to grow for resources to meet regulatory, compliance, information security and fraud management requirements. |
Our Lines of Business
Personal Banking provides financial solutions for everyday banking, financing, investing, credit cards and creditor insurance needs. We serve approximately 20% of Canadian households.
Commercial Banking provides our small business, medium-sized enterprise and mid-market banking clients with a broad suite of commercial products and financial advisory services.
Our Strategy
We aim to succeed in the Canadian market through the quality and consistency of our customer experience and through the productivity of our sales and distribution network.
Our Path to Differentiation
| | Ÿ | | Deliver world-class people and leadership capabilities. |
| | Ÿ | | Excel at sales leadership and performance management. |
| | Ÿ | | Leverage customer insights to drive compelling and meaningful offers. |
| | Ÿ | | Expand our distribution reach with a focus on branch service and online innovation. |
| | Ÿ | | Eliminate process complexity for customers and employees. |
| | | | | | | | | | | | | | | | |
| | | Key Performance Metrics and Drivers | | 2011 | | | 2010 | | | 2009 | | | |
| | Net income growth (%) Revenue growth (%) Operating leverage (%) Personal banking revenue ($ millions) Personal loan growth (%) (1) Personal deposit growth (%) Commercial banking revenue ($ millions) Commercial loan growth (%) (1) Commercial deposit growth (%) | |
| 3.7
4.1 (1.5 3,785 5.7 0.5 2,283 5.9 10.0 |
) | |
| 14.8
10.2 4.5 3,663 4.8 0.5 2,168 4.1 9.1 |
| |
| 24.0
10.3 7.2 3,392 4.7 14.6 1,896 1.7 4.8 |
| | |
| | Employee engagement index (%) (2) | | | 78 | | | | 75 | | | | 75 | | | |
| | (1) | Includes current loans, acceptances and securitized loans. |
| | (2) | Source: BMO Annual Employee Survey, conducted by Burke Inc., an independent research company. |
This Personal and Commercial Banking Canada section contains forward-looking statements. Please see the Caution Regarding Forward-Looking Statements.
| | | | |
| BMO Financial Group 194th Annual Report 2011 | | | 47 | |
MANAGEMENT’S DISCUSSION AND ANALYSIS
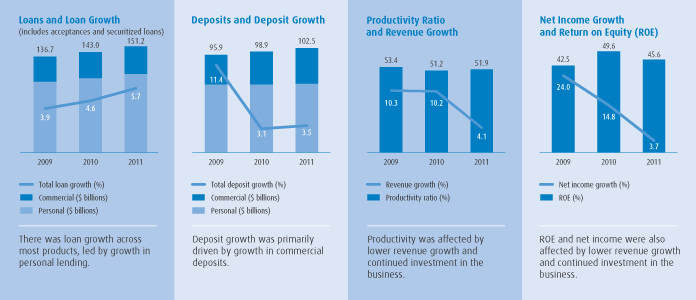
2011 Group Objectives and Achievements
Continue to enhance the customer experience and create a differentiated position in the Canadian market.
| Ÿ | | Revenue grew by 4.1% to $6.1 billion and customer loyalty improved. |
| Ÿ | | Employees are aligned behind one vision and one brand promise, both centred on providing our customers with great experiences. In 2011, 97% of employees participating in the annual employee survey indicated that they understand how their work aligns with our vision of being the bank that defines great customer experience. |
| Ÿ | | Training for front-line employees continues to focus on improving the quality and consistency of the customer experience, which is driving improvements in our loyalty scores. We invested $43 million in training and development in 2011. |
Launch attractive and compelling new offers that drive results.
| Ÿ | | Launched BMO SmartSteps for Parents, an interactive online hub to help parents teach children about money management. |
| Ÿ | | Rolled out a new Online Banking for Business site to more than 10,000 business customers, providing them with access to their financial information, accounts and banking services in a fully integrated online environment. |
| Ÿ | | Launched BMO Mobile Banking, allowing customers to use their mobile phones to check balances and account activity, transfer money between accounts, find a branch or ABM or call our customer contact centre. By October 31, 2011, more than 245,000 customers had registered for BMO Mobile Banking. |
| Ÿ | | 280,000 customers have become BMO MoneyLogic users, which allows them to set budget and savings goals and anonymously compare their spending patterns with other BMO customers. |
| Ÿ | | Launched the BMO SmartSteps for Business Online Community, a virtual hub with new media features and numerous tools, including a blog and a live Twitter feed. |
| Ÿ | | BMO Alerts, a feature of BMO Mobile Banking, allows customers to receive instant notification of low account balances or fraudulent activity on their debit cards. By October 31, 2011, we had issued two million alerts to customers to help them manage their money. |
Improve productivity of our sales and distribution network.
| Ÿ | | Strengthened our branch network, opening or upgrading a total of 58 branches, including the launch of nine branches in an innovative new format that encourages great conversations with our customers. In each of the 58 branches, productivity enhancements have been implemented, such as right-sizing and improvements in design, as well as the installation of productivity-driving technologies. |
| Ÿ | | Expanded our ABM network by adding 136 machines. |
| Ÿ | | Added to our specialized sales force, increasing the number of mortgage specialists by 13%, financial planners by 9%, and commercial cash management specialists and support staff by 18%. |
| Ÿ | | Added 150 small business bankers to provide a differentiated customer experience to our small business customers. |
| Ÿ | | Significantly improved the online customer experience, ranking second among the public websites of the six largest Canadian banks as evaluated by an independent research firm in Forrester Research Inc.’s 2011 Canadian Online Bank Rankings (July 2011). |
Continue the redesign of core processes and technologies to achieve a high-quality customer experience, create capacity for customer-facing employees and reduce costs.
| Ÿ | | Launched our new online personal account application in May 2011, which significantly increased our online retail banking volumes. Applications in the five months following the launch were 30% higher than in the same period last year. The new process automates most new account openings and has eliminated thousands of hours of manual processing each month. |
| Ÿ | | One million customers have opted out of paper statements as a result of improved functionality such as the ability to view cheque images and access two years of account history online. |
2012 Group Objectives
| | Ÿ | | Continue to enhance the customer experience and create a differentiated position in the Canadian market. |
| | Ÿ | | Launch attractive and compelling new offers that drive results. |
| | Ÿ | | Improve productivity of our sales and distribution network. |
| | Ÿ | | Continue the redesign of core processes and technologies to achieve a high-quality customer experience, create capacity for customer-facing employees and reduce costs. |
| | |
| 48 | | BMO Financial Group 194th Annual Report 2011 |
Canadian Business Environment and Outlook
Domestic demand for goods and services in Canada slowed notably during the first half of calendar 2011, reflecting much weaker growth in consumer and government spending. Business investment in machinery and infrastructure remained strong and residential construction recovered after having declined during each of the last three quarters of 2010. Growth in demand for personal credit slowed during the first three quarters of fiscal 2011 as households became more cautious in the face of stretched finances and mounting economic uncertainty. Residential mortgage growth picked up during the first half of fiscal 2011, but has slowed from last year. Although home sales and construction remained robust, there are signs that demand in the housing market is losing momentum.
Looking ahead, we anticipate that the North American economy will continue to grow modestly, although downside risks relating to Europe’s debt concerns are significant. Financial product performance will likely
reflect a moderate rate of growth. In Canadian personal banking, growth in demand for consumer credit has already slowed and will likely remain soft through 2013. Residential mortgage growth has remained buoyant, but should slow moderately as the growth in demand for housing eases from its earlier strong pace. In commercial banking, the demand for business credit is growing, after falling during 2009 and 2010. Demand should continue to accelerate as businesses invest more to upgrade equipment, rebuild inventories and expand commercial and industrial space. The strong growth in business deposits during the first three quarters of 2011 is likely to ease over the next several quarters as the rate of increase in business profits moderates from its post-recession, commodity-driven recovery rate. With core deposit growth slowing to a rate below that for credit, the demand for wholesale funding and non-personal fixed-term deposits will likely rise.
P&C Canada Financial Results
P&C Canada net income was $1,701 million, up $61 million or 3.7% from a year ago. Reported results reflect provisions for credit losses in BMO’s operating groups on an expected loss basis. Net income increased $148 million or 9.9% on a basis that adjusts reported results to reflect provisions on an actual loss basis.
Revenue increased $237 million or 4.1% to $6,068 million, driven by volume growth in most products, partially offset by lower net interest margin. Net interest margin was 2.93%, 2 basis points lower than in the prior year, mainly due to lower deposit spreads in a low interest rate environment, competitive pricing on mortgages and lower industry-wide cards usage.
In our personal banking business, revenue increased $122 million or 3.3%. The increase was driven by volume growth across most products,
partially offset by lower deposit spreads in the low interest rate environment, lower retail card volumes and competitive pricing on mortgages.
In our commercial banking business, revenue increased $115 million or 5.3%. The increase was due to volume growth across most products and improved spreads in commercial lending, partially offset by lower deposit spreads in a low interest rate environment.
Non-interest expense was $3,150 million, up $165 million or 5.6% from 2010. The increase was due to higher initiative spending, employee-related costs and the inclusion of two additional months of the results of the Diners Club business in the current year. Our productivity ratio deteriorated by 70 basis points to 51.9%.
Note: The P&C Canada summary income statement appears on page 46.
| | | | |
| BMO Financial Group 194th Annual Report 2011 | | | 49 | |
MANAGEMENT’S DISCUSSION AND ANALYSIS
Personal and Commercial Banking U.S.
We are helping make money make sense to more than two million customers. Our retail, small and mid-sized business banking customers are served through 679 branches, an award-winning call centre, online banking and more than 1,350 ABMs across eight states. We deliver financial expertise to our commercial banking customers through a broad range of lending and treasury management services and products, offering in-depth specific industry knowledge and strategic capital markets solutions.
The acquisition of M&I in July 2011 substantially increased our market presence in the U.S. Midwest. We have an enviable market position for competing effectively everywhere we do business. Our focus on developing new customer relationships and deepening existing relationships across our businesses has never been stronger.
| | |
 | | “This is an unprecedented time for our industry. The nature of the relationship between customers and their bank has changed fundamentally. As we work to successfully transition BMO Harris Bank to a common platform, we’ve focused our efforts on exceeding those changing expectations.” Mark Furlong President and Chief Executive Officer Personal and Commercial Banking U.S. and BMO Harris Bank, N.A. |
Strengths and Value Drivers
| Ÿ | | A rich heritage of more than 160 years in the U.S. Midwest under the established Harris and M&I brands, both of which are identified with a deep commitment to the community and to helping customers succeed. |
| Ÿ | | The strengths that result from approaching the integration of the two banks by choosing the best products, processes and people from the two predecessors. |
| Ÿ | | An attractive branch footprint and top-tier deposit market share in key U.S. Midwest markets, which provide an enviable platform for profitable growth. |
| Ÿ | | A large-scale, relationship-based national commercial banking business based in the U.S. Midwest, with in-depth industry knowledge in select sectors. |
| Ÿ | | Strong working relationships with our colleagues in Private Client Group and BMO Capital Markets. |
| Ÿ | | Ability to leverage the capabilities and scale of BMO Financial Group. |
Challenges
| Ÿ | | The U.S. economic outlook continues to be uncertain, with relatively slow improvement and modest expectations for increased loan demand in 2012. |
| Ÿ | | Market dynamics remain competitive, as banks compete aggressively on pricing for both loans and deposits to maintain and increase market share. |
| Ÿ | | Regulatory oversight has become increasingly complex with the advent of new regulations and compliance requirements. |
Our Lines of Business
Personal Banking offers a broad range of products and services to individuals and small and mid-sized business customers, including deposit and investment services, mortgages, consumer credit, business lending, credit cards and other banking services.
Commercial Banking provides larger businesses with a broad range of banking products and services, including lending, deposits, treasury management and risk management. Segments of focus include corporate finance, diversified industries, financial institutions, food and consumer, auto dealership finance, equipment finance, healthcare, agriculture and commercial real estate.
Our Strategies
| | Ÿ | | Deliver a great customer experience and improve retail banking profitability in a challenging environment by focusing on key segments and products, while continuing to increase overall sales and improve channel capabilities and productivity. |
| | Ÿ | | Establish a position as a leader in commercial banking in the U.S. Midwest by delivering a unique combination of local access and sector/product expertise to our clients, while also serving the treasury management needs of our client base. | |
Our Path to Differentiation
| | Ÿ | | A customer-focused culture centred on understanding our customers and helping them achieve their financial goals. |
| | Ÿ | | A one-team approach that brings the entire organization’s capabilities to our customers. |
| | Ÿ | | Effective sales management and leadership that drive our sales and service employees to excel. | |
| | Ÿ | | A disciplined, transparent and well aligned performance management system that supports our business objectives, motivates employees and rewards top performers. |
| | Ÿ | | Products and services that are consistent with our brand promise of removing complexity from financial matters. | |
| | | | | | | | | | | | | | | | |
| | | Key Performance Metrics and Drivers | | 2011 | | | 2010 | | | 2009* | | | |
| | Net income growth (US$) (%) | | | 75.1 | | | | (24.5 | ) | | | 14.6 | | | |
| | Adjusted net income growth (US$) (%) | | | 76.6 | | | | (24.3 | ) | | | 24.7 | | | |
| | Revenue growth (US$)(%) | | | 47.2 | | | | 0.4 | | | | 4.9 | | | |
| | Average US$ loan growth (%) (1) | | | 36.2 | | | | (14.1 | ) | | | (2.4 | ) | | |
| | Average US$ deposit growth (%) | | | 50.2 | | | | (1.1 | ) | | | 17.6 | | | |
| | Operating leverage (US$)(%) | | | 12.5 | | | | (7.1 | ) | | | 5.8 | | | |
| | Adjusted operating leverage (US$)(%) | | | 14.6 | | | | (8.2 | ) | | | 5.4 | | | |
| | Number of branches | | | 679 | | | | 312 | | | | 280 | | | |
| | Personal banking Net Promoter Score (2) | | | 43 | | | | 40 | | | | 43 | | | |
| | Employee engagement index (3) | | | 72 | | | | 71 | | | | 74 | | | |
Adjusted results in this section are non-GAAP and are discussed in the Non-GAAP Measures section on page 94.
| | (1) | Based on current loans. |
| | (2) | A measure of the strength of customer loyalty. Commercial banking does not have a comparable measure on a consolidated basis. |
| | (3) | Source: BMO Annual Employee Survey, conducted by Burke Inc., an independent research company. |
| | * | Net income growth, revenue growth and operating leverage in fiscal 2009 have not been restated for the impact of the corporate real estate transfer from P&C U.S. to Corporate Services in 2011. |
P&C U.S. also offers wealth management and investment banking services through our colleagues in Private Client Group and BMO Capital Markets.
This Personal and Commercial Banking U.S. section contains forward-looking statements. Please see the Caution Regarding Forward-Looking Statements.
| | |
| 50 | | BMO Financial Group 194th Annual Report 2011 |
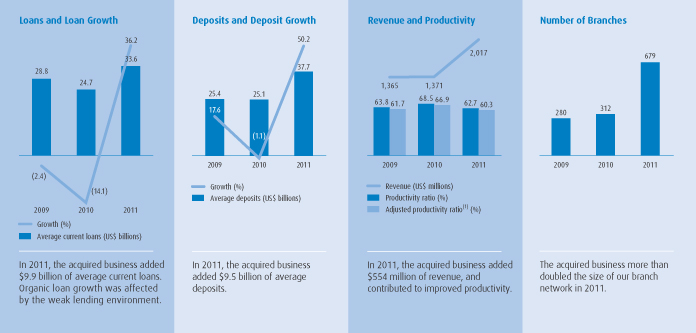
2011 Group Objectives and Achievements
Maintain strong customer loyalty.
| Ÿ | | In 2011, our U.S. personal banking Net Promoter Score was 43, an increase of three points from 2010, and remained strong compared to those of our large competitors. |
| Ÿ | | In 2011, BMO Harris Bank was ranked as the most reputable U.S. bank by Reputation Institute in a study conducted in collaboration withAmerican Banker, while M&I was ranked sixth. BMO Harris Bank improved on its top 10 ranking from 2010, the first year the study was conducted. |
| Ÿ | | We continued to build on the success of Helpful Steps, working with our customers to help them control spending, grow savings, and borrow and invest wisely. We added to the tools and guidance we provide online with the program, and we launched Helpful Steps for Small Business and Helpful Steps for Parents. |
| Ÿ | | We strengthened our New Customer Welcome Program to deepen new relationships and encourage customer loyalty. |
| Ÿ | | To position BMO Harris Bank as a trusted advisor, we partnered with the Tribune Media Group to launch a wide-ranging financial education initiative, leveraging the expertise of employees who are able to provide education and guidance on a wide range of financial topics. |
Improve financial performance by growing revenue through sales productivity, effectively managing costs and continuing to optimize our distribution network.
| Ÿ | | We completed the acquisition of M&I, significantly growing our footprint and capabilities while boosting our financial performance. |
| Ÿ | | Revenue of US$2,017 million increased US$646 million or 47%. Excluding the impact of the M&I acquisition in 2011 and the Rockford, Illinois-based bank transaction (the Rockford transaction) in 2010, revenue increased US$67 million or 5.1%. |
| Ÿ | | Non-interest expense of US$1,265 million increased US$326 million or 35%. Excluding the impact of the M&I acquisition in 2011 and the Rockford transaction in 2010, expenses increased US$21 million or 2.3%. Our productivity ratio of 62.7% improved 580 basis points from 2010. Our adjusted productivity ratio(1) improved 660 basis points to 60.3%. |
| Ÿ | | For the third year in a row, BMO Harris Contact Center was certified as a Center of Excellence by BenchmarkPortal, a recognized leader in benchmarking and certifying customer contact centres. This reflects our focus on maintaining the highest-quality distribution network. |
Increase the level of profitable customer acquisition to complement our high customer retention rates.
| Ÿ | | Our deep customer relationships and focus on the customer experience resulted in our retention rates continuing to be among the highest in the industry. |
| Ÿ | | Commercial customer acquisition has grown in select segments, while the intake of new customers remains strong. |
| Ÿ | | The acquired M&I business added approximately one million customers. |
Establish a commercial banking leadership position and drive growth in sectors where we have expertise and an opportunity to grow market share.
| Ÿ | | Commercial banking revenue grew 62% from 2010. Excluding M&I, revenue grew 16%. |
| Ÿ | | Commercial loans increased US$1.3 billion or 20% from the beginning of the fiscal year, excluding M&I and our exit portfolio. Deposits remained at record levels, excluding M&I. |
| Ÿ | | We completed the roll-out of an integrated marketing campaign to position BMO Harris Bank as a leader in commercial banking, a bank that knows its clients and understands what companies are looking for in a financial services partner. |
| Ÿ | | We are leveraging our proven expertise in the key specialty segments of auto dealership, agriculture and equipment finance to create growth opportunities. |
2012 Group Objectives
| | Ÿ | | Successfully integrate our acquired M&I businesses. |
| | Ÿ | | Maintain strong customer loyalty. |
| | Ÿ | | Improve financial performance by growing revenue, effectively managing costs and continuing to optimize our distribution network. |
| | Ÿ | | Deploy our unique commercial operating model, which drives growth by delivering local access and industry expertise to our clients across a broad geographic footprint. | |
Adjusted results in this section are non-GAAP and are discussed in the Non-GAAP Measures section on page 94.
| | | | |
| BMO Financial Group 194th Annual Report 2011 | | | 51 | |
MANAGEMENT’S DISCUSSION AND ANALYSIS
U.S. Business Environment and Outlook
With the completion of the acquisition of M&I in July 2011, P&C U.S. now has a significant footprint in eight U.S. states, primarily focused in six contiguous U.S. Midwest states (Illinois, Wisconsin, Indiana, Minnesota, Missouri and Kansas). There has been substantial consolidation in this marketplace over the past several years. The five largest banks held only 21% of the personal and commercial deposits market in this six-state area in 1998, but by the end of 2010, the five largest (adjusted to reflect the combination of Harris Bank and M&I Bank as BMO Harris Bank) held 34% of the market. With a GDP and population comparable to Canada’s, this U.S. Midwest area remains highly contested because of growth opportunities presented by fragmentation in the market. Competitors are attempting to capture market share through acquisitions, aggressive pricing and continuous investment in their brands. Real GDP growth in the U.S. Midwest was slightly higher than the national rate in 2011 and is expected to maintain that outperformance in 2012. The unemployment rate in the U.S. Midwest was lower than the national rate in 2011 and is expected to remain so in 2012.
Assuming that European economic and debt concerns are contained, the U.S. Midwest economy is expected to strengthen moderately in 2012, benefiting from low interest rates, a relatively weak U.S. dollar and possible fiscal stimulus. Business loan demand is slowly improving as credit availability increases and product demand slowly grows.
Business investment in machinery and equipment continued to advance briskly in 2011, although some slowing in growth is anticipated. However, non-residential construction has remained weak, due to vacancy rates for commercial and industrial properties that are still high, but falling. Consumer spending growth was sluggish in 2011 and will likely continue on a similar path in 2012 as households focus on reducing debt and building savings. Consumer loan demand is expected to remain constrained in 2012 as low home prices continue to dampen demand for home equity loans. With household confidence still soft, residential construction and the demand for mortgages have also remained weak, with only modest improvement, if any, expected in 2012.
In 2012, we plan to leverage our increased scale, enhanced business mix and well-aligned capabilities to grow organically by embedding customer acquisition within our sales culture and providing compelling product offerings. Our highly attractive U.S. Midwest footprint, areas of commercial expertise and strong customer loyalty relative to our largest competitors provide a solid platform from which to drive revenue growth and improve profitability. By bringing clarity to our customers through a highly productive sales and distribution network, we plan to continue to enhance our reputation as a strong, stable and customer-focused bank.
P&C U.S. Financial Results
P&C U.S. net income increased $141 million or 66% from the prior year to $355 million. Amounts in the rest of this section are expressed in U.S. dollars.
Net income was $359 million, up $154 million or 75% from the prior year. Adjusted net income, which excludes the amortization of acquisition-related intangible assets, was $394 million, up $171 million, with $142 million attributable to the acquired M&I business and the remaining $29 million related to organic operations and representing growth of 13% from 2010.
Revenue of $2,017 million increased $646 million or 47% from the prior year. The increase in revenue included $554 million from the acquired M&I business and $25 million from the assets and liabilities acquired in the Rockford transaction. Excluding the impact of these acquisitions, revenue increased $67 million or 5.1%, primarily driven by improved loan spreads and higher deposit balances and securities gains, partially offset by lower fee revenue.
Net interest margin of 4.43% increased 68 basis points from the prior year. Excluding the impact of M&I, net interest margin was 4.40%, up 65 basis points from the prior year, primarily due to improved loan spreads that resulted from a favourable change in the mix of loan balances, as well as higher deposit balances.
Provisions for credit losses increased $86 million under BMO’s expected loss methodology, with approximately three-quarters of the increase due to the acquired M&I business.
Non-interest expense of $1,265 million increased $326 million or 35% from the prior year. Adjusted non-interest expense of $1,216 million was $299 million higher than in the prior year. The acquired M&I business increased adjusted non-interest expense by $276 million and there was a $23 million or 2.5% increase from organic operations. The latter increase was primarily due to higher performance-based compensation costs, in line with improved financial results, lower recoveries on our Visa litigation accrual, and increased advertising, partially offset by the impact of a valuation adjustment on our serviced mortgage portfolio that increased expense in 2010. The adjusted productivity ratio of 60.3% improved 660 basis points from the prior year.
During the third quarter of 2011, certain impaired real estate secured assets of approximately US$1.0 billion, primarily commercial real estate loans, were transferred to Corporate Services to allow our businesses to focus on ongoing customer relationships and leverage our risk management expertise in our special assets management unit. Prior period loan balances, revenues and expenses have been restated to reflect the transfer. Similar assets acquired in the M&I transaction valued at approximately US$1.5 billion have also been included in Corporate Services.
Note: The P&C U.S. summary income statement appears on page 46.
Adjusted results in this section are non-GAAP and are discussed in the Non-GAAP Measures section on page 94.
| | |
| 52 | | BMO Financial Group 194th Annual Report 2011 |
Private Client Group
Private Client Group (PCG), BMO’s group of wealth management businesses, serves a full range of client segments from mainstream to ultra-high net worth and institutional, with a broad offering of wealth management products and solutions including insurance products. PCG operates in both Canada and the United States, as well as in Asia and Europe.
| | |
 | | “Helping clients plan for the future – and invest wisely – is our first priority. That reputation is what drives asset growth and revenue. With our new scale in the United States, the American mass affluent is an opportunity to which we want to pay particular attention.” �� Gilles Ouellette President and Chief Executive Officer Private Client Group |
Strengths and Value Drivers
| Ÿ | | A planning and advice-based approach that integrates investments, insurance, specialized wealth management and core banking solutions. |
| Ÿ | | A team of highly skilled wealth professionals committed to providing an exceptional client experience. |
| Ÿ | | Brand prestige, recognition and trust. |
| Ÿ | | Strong national presence in Canada, as well as strategic positioning in select high-growth U.S. and emerging wealth management markets. |
| Ÿ | | Access to BMO’s broad client base and distribution network in Canada and the United States. |
| Ÿ | | A culture of innovation focused on achieving competitive advantage. |
Challenges
| Ÿ | | Evolving client needs based on changing demographics and rapidly advancing technology. |
| Ÿ | | Increasing regulatory complexity requiring proactive engagement and oversight. |
| Ÿ | | Erosion of consumer confidence in market performance. |
| Ÿ | | Competition for top talent. |
Our Strategies
Our vision is to be the wealth management solutions provider that defines great client experience. Our strategy is to deliver on all our clients’ wealth management needs while continuing to invest for future growth. Our priorities include:
| | Ÿ | | Ensuring our clients are front and centre in everything we do; | |
| | Ÿ | | Integrating and strengthening our wealth management and insurance offerings; | |
| | Ÿ | | Building North American and global platforms for new growth. | |
Our Path to Differentiation
| | Ÿ | | Deliver a personalized and unique financial planning experience to our clients. | |
| | Ÿ | | Build a culture of innovation. | |
| | Ÿ | | Attract, develop and retain superior talent. | |
| | | | | | | | | | | | | | | | |
| | | Key Performance Metrics and Drivers | | 2011 | | | 2010 | | | 2009 | | | |
| | Net income growth (%) | | | 12.7 | | | | 27.5 | | | | (15.5 | ) | | |
| | Revenue growth (%) | | | 14.0 | | | | 11.6 | | | | (6.2 | ) | | |
| | Assets under management and administration growth (%) (1) | | | 61.9 | | | | 12.7 | | | | 7.5 | | | |
| | Employee engagement index (%) (2) | | | 77 | | | | 75 | | | | 74 | | | |
| | (1) | Excludes the impact of changes in the Canadian/U.S. dollar exchange rate. |
| | (2) | Source: BMO Annual Employee Survey, conducted by Burke Inc., an independent research company. |
Our Lines of Business
BMO Nesbitt Burns, PCG’s full-service investing business, offers comprehensive and client-focused investment and wealth advisory services, leveraging strong financial planning capabilities, a broad range of internal and external relationships and high-quality products.
BMO InvestorLine, PCG’s self-directed investing business, understands and anticipates our clients’ diverse needs and offers a range of tools to help self-directed investors plan, research and manage investing decisions their own way.
BMO Global Private Banking operates in Canada and the United States and is expanding to Hong Kong. We deliver a planning and advice-based value proposition to mass affluent, high net worth and ultra-high net worth clients, and we offer a comprehensive range of financial services and solutions.
BMO Global Asset Management is a global investment organization providing investment solutions to institutional, retail and high net worth investors around the world. Our BMO Mutual Funds and BMO Exchange Traded Funds (ETF) businesses offer clients innovative investment solutions across a range of channels. BMO Institutional Trust Services provides record-keeping and administrative services to defined benefit and defined contribution pension plan sponsors.
BMO Insurance operates as BMO Life Insurance, which focuses on creditor insurance, and BMO Life Assurance, which concentrates on life insurance and annuity products and services.
This Private Client Group section contains forward-looking statements.
Please see the Caution Regarding Forward-Looking Statements.
| | | | |
| BMO Financial Group 194th Annual Report 2011 | | | 53 | |
MANAGEMENT’S DISCUSSION AND ANALYSIS
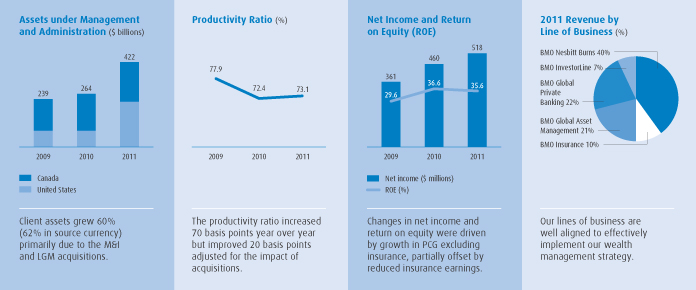
2011 Group Objectives and Achievements
Deliver a great client experience with a strong focus on financial planning.
| Ÿ | | Launched Retirement Savings Outlook, an innovative online tool that helps our clients determine how much money they will need for retirement, and whether or not their current retirement savings will meet their goals. |
| Ÿ | | Introduced new programs, resources and support for our sales force to promote more effective retirement and financial planning discussions with clients. |
| Ÿ | | Achieved continued success with Take Charge of Your Retirement, a program that includes tools and client events encouraging clients to explore how their financial and non-financial retirement goals can be met. |
Leverage our high level of internal collaboration across wealth management businesses and BMO Financial Group.
| Ÿ | | Developed an enhanced creditor insurance offering with P&C, resulting in increased insurance sales. |
| Ÿ | | Achieved significant ongoing success with joint deal teams across full-service investing, private banking, retail and commercial banking and insurance to better address the complex financial needs of our clients. |
| Ÿ | | Continued to increase referral volumes across BMO Financial Group to seamlessly address our clients’ specific wealth management needs. |
Invest for future growth by focusing on innovative products and services and widening our geographic reach.
| Ÿ | | As a result of the M&I acquisition, we have almost doubled our U.S. private banking footprint. With the acquisition of M&I and LGM, our global asset management business is now one of the 100 largest investment managers worldwide as measured by assets under management. By continuing to provide an exceptional client experience, we are building a solid foundation for further expansion. |
| Ÿ | | In the United States, we now have an established family of mutual funds, a large team of financial advisors and strong capabilities in institutional trust services, significantly enhancing our wealth management capabilities and channels. |
| Ÿ | | Strengthened our presence in China, as well as globally, by adding to our infrastructure, expanding our footprint and exploring new opportunities to address current and potential clients’ specific wealth management needs. These opportunities include a referral agreement with Agricultural Bank of China. |
| Ÿ | | Expanded our ETF family of lower-cost and risk-diversifying investment products to 44 funds to provide our clients with even wider access to innovative and industry-leading products and solutions. |
2012 Group Objectives
| | Ÿ | | Continue to execute against our focused strategy centred on the client experience. | |
| | Ÿ | | Successfully integrate and expand our U.S. wealth management businesses. | |
| | Ÿ | | Collaborate across BMO’s businesses to deliver high-quality financial products and services that meet the evolving needs of our clients. | |
| | |
| 54 | | BMO Financial Group 194th Annual Report 2011 |
Private Client Group Business Environment and Outlook
Economic growth in Canada and the United States slowed in 2011 and stock markets worldwide fell sharply in the latter half of the year. Excluding the impact of increased asset levels resulting from acquired businesses, the fall in the markets caused a reduction in our client asset levels and as a result, there was only modest growth in overall levels of related fee-based revenues year over year. Net interest income grew moderately year over year, constrained by historically low interest rates but benefiting from our acquisitions. Declines in long-term interest rates had a negative impact on our insurance results as lower rates resulted in an increase in policyholder liabilities.
Assuming that the current European debt and economic difficulties remain reasonably contained, the Canadian economy is expected to grow modestly in 2012, held back by a strong Canadian dollar and more restrictive fiscal policies. The U.S. economy is also expected to expand
modestly in 2012, supporting growth in personal and business loan demand. Monetary authorities are expected to maintain low interest rates until early 2013 in Canada and well into 2013 in the United States. The low interest rate environment will likely continue to put pressure on our net interest income. Client asset levels are dependent on the health of equity markets and would be expected to increase when markets improve.
We continue to expect that the market for the North American wealth management industry will continue to grow over the longer term, supported by changing demographics, particularly in the retirement, mass affluent and high net worth sectors. The integration of the M&I wealth management businesses increases the scale and scope of our U.S. operations and positions us to continue building our North American platform to promote new growth.
Private Client Group Financial Results
Private Client Group net income was $518 million, up $58 million or 13% from a year ago. PCG net income, excluding the insurance business, was $385 million, up $90 million or 31%, with growth across all of our businesses. Earnings from the acquired M&I wealth management businesses added US$10 million of net income, US$116 million of revenue and US$98 million of expense in 2011. The LGM acquisition added $15 million of revenue and $19 million of expense, with minimal effect on our 2011 net income. Insurance net income was $133 million, down $32 million or 19%, as growth in net premium revenue was more than offset by an unusually high $55 million charge in respect of reinsurance claims related to the earthquakes in Japan and New Zealand and the adverse effect of unfavourable long-term interest rate movements on policyholder liabilities relative to 2010.
Revenue of $2,559 million increased $314 million or 14%. Revenue in PCG, excluding insurance, increased by 18%, or 12% adjusted for the impact of the M&I and LGM acquisitions. There was revenue growth in all of our businesses, particularly in brokerage and mutual funds. Assets under management and administration of $422 billion grew by $158 billion, with the increase attributable to the M&I and LGM acquisitions. Revenue in our insurance business decreased 15%, primarily due to the impact of the earthquake-related reinsurance claims and the adverse effect of long-term interest rate movements as described above, partially offset by higher net premium revenue. The weaker U.S. dollar reduced revenue by $23 million or 1.0%.
Non-interest expense was $1,871 million, up 15% or 7.9% adjusted for the impact of the acquisitions, primarily due to higher revenue-based costs and strategic initiatives. The weaker U.S. dollar reduced expenses by $18 million or 1.1%. The productivity ratio increased 70 basis points but improved 20 basis points adjusting for the impact of acquisitions.
Net income in PCG U.S. businesses was US$43 million, up US$27 million from US$16 million a year ago. The M&I acquisition contributed US$10 million of the growth, with the remaining businesses contributing US$17 million.
Private Client Group(Canadian $ in millions, except as noted)
| | | | | | | | | | | | | | | | | | | | |
| | | | |
| | | | | | | | | | | | Change from 2010 | |
As at or for the
year ended October 31 | | 2011 | | | 2010 | | | 2009 | | | $ | | | % | |
Net interest income (teb) | | | 440 | | | | 365 | | | | 353 | | | | 75 | | | | 21 | |
Non-interest revenue | | | 2,119 | | | | 1,880 | | | | 1,659 | | | | 239 | | | | 13 | |
Total revenue (teb) | | | 2,559 | | | | 2,245 | | | | 2,012 | | | | 314 | | | | 14 | |
Provision for credit losses | | | 9 | | | | 7 | | | | 5 | | | | 2 | | | | 20 | |
Non-interest expense | | | 1,871 | | | | 1,625 | | | | 1,566 | | | | 246 | | | | 15 | |
Income before income taxes and non-controlling interest in subsidiaries | | | 679 | | | | 613 | | | | 441 | | | | 66 | | | | 11 | |
Income taxes (teb) | | | 161 | | | | 153 | | | | 80 | | | | 8 | | | | 6 | |
Net income | | | 518 | | | | 460 | | | | 361 | | | | 58 | | | | 13 | |
Adjusted net income | | | 528 | | | | 466 | | | | 364 | | | | 62 | | | | 13 | |
Net economic profit | | | 372 | | | | 332 | | | | 234 | | | | 40 | | | | 13 | |
Return on equity (%) | | | 35.6 | | | | 36.6 | | | | 29.6 | | | | | | | | (1.0 | ) |
Productivity ratio (teb) (%) | | | 73.1 | | | | 72.4 | | | | 77.9 | | | | | | | | 0.7 | |
Net interest margin on earning assets
(teb) (%) | | | 2.94 | | | | 2.81 | | | | 3.34 | | | | | | | | 0.13 | |
Average common equity | | | 1,436 | | | | 1,240 | | | | 1,200 | | | | 196 | | | | 16 | |
Average earning assets | | | 14,968 | | | | 12,981 | | | | 10,567 | | | | 1,987 | | | | 15 | |
Average loans and acceptances | | | 9,044 | | | | 7,768 | | | | 7,454 | | | | 1,276 | | | | 16 | |
Average deposits | | | 17,617 | | | | 16,467 | | | | 14,605 | | | | 1,150 | | | | 7 | |
Assets under administration | | | 271,620 | | | | 160,323 | | | | 139,446 | | | | 111,297 | | | | 69 | |
Assets under management | | | 150,176 | | | | 103,534 | | | | 99,128 | | | | 46,642 | | | | 45 | |
Full-time equivalent employees | | | 6,494 | | | | 4,768 | | | | 4,520 | | | | 1,726 | | | | 36 | |
U.S. Business Selected Financial Data(US$ in millions)
| | | | | | | | | | | | | | | | | | | | |
| | | | |
| | | | | | | | | | | | Change from 2010 | |
As at or for the year
ended October 31 | | 2011 | | | 2010 | | | 2009 | | | $ | | | % | |
Total revenue (teb) | | | 391 | | | | 243 | | | | 208 | | | | 148 | | | | 61 | |
Non-interest expense | | | 319 | | | | 213 | | | | 215 | | | | 106 | | | | 49 | |
Net income | | | 43 | | | | 16 | | | | (4 | ) | | | 27 | | | | +100 | |
Adjusted net income | | | 48 | | | | 18 | | | | (3 | ) | | | 30 | | | | +100 | |
Average earning assets | | | 2,225 | | | | 2,077 | | | | 2,251 | | | | 148 | | | | 7 | |
Average loans and acceptances | | | 2,033 | | | | 1,877 | | | | 2,106 | | | | 156 | | | | 8 | |
Average deposits | | | 2,338 | | | | 1,328 | | | | 1,196 | | | | 1,010 | | | | 76 | |
Net economic profit and adjusted results in this section are non-GAAP and are discussed in the Non-GAAP Measures section on page 94.
| | | | |
| BMO Financial Group 194th Annual Report 2011 | | | 55 | |
MANAGEMENT’S DISCUSSION AND ANALYSIS
BMO Capital Markets
BMO Capital Markets provides a broad range of products and services to help corporate, institutional and government clients achieve their ambitions. From 30 offices on five continents, including 17 in North America, BMO Capital Markets draws on expertise in areas including equity and debt underwriting, corporate lending and project financing, mergers and acquisitions, merchant banking, securitization, treasury and market risk management, foreign exchange, derivatives, debt and equity research and institutional sales and trading.
| | |
 | | “Our strategy remains to build a North American Capital Markets business with a unified approach to client coverage. This creates a stronger experience for our clients and moves us towards the goal of becoming their trusted advisor.” Tom Milroy Chief Executive Officer BMO Capital Markets |
Strengths and Value Drivers
| Ÿ | | A diversified, balanced portfolio of businesses that supports our well-established franchise. |
| Ÿ | | Acknowledged and growing expertise in North America and expanded distribution platform, providing an integrated cross-border market experience. |
| Ÿ | | International presence in select strategic areas and industry sectors. |
| Ÿ | | Top-tier equity research, sales and trading capabilities. |
Challenges
| Ÿ | | Ongoing market volatility and global economic uncertainty. |
| Ÿ | | Evolving regulatory requirements. |
Our Lines of Business
Investment and Corporate Banking services include strategic advice and execution on mergers and acquisitions, restructurings and recapitalizations, as well as valuation and fairness opinions. We provide capital-raising services through debt and equity underwriting, as well as a full range of loan and debt products, balance sheet management solutions and treasury management services. In support of our clients’ international business activities, we offer trade finance and risk mitigation services. We also provide a wide range of banking and other operating services to North American and international financial institutions.
Trading Products services include sales, trading and research activities. We offer integrated debt, foreign exchange, interest rate, credit, equity, securitization and commodities solutions to institutional, commercial and retail clients. In addition, we provide new product development, proprietary trading and origination services to our clients. We also supply efficient funding and liquidity management to our clients as well as BMO Financial Group.
Our Strategies
Build deeper client relationships to generate net income growth and strong return on equity, while maintaining an appropriate risk/return profile, specifically by:
| | Ÿ | | Building out our distribution platform, primarily in the United States; | |
| | Ÿ | | Aligning capital and capabilities with client opportunity; | |
| | Ÿ | | Focusing on strategic sectors, while building the capability to further extend the BMO Capital Markets offering. | |
Our Path to Differentiation
| | Ÿ | | Leading expertise and relationships in strategic sectors and products (such as Natural Resources, Research and Structured Products) that facilitate client acquisition. | |
| | Ÿ | | A market leading ability to serve U.S. mid-capitalization clients with an integrated offer and strong balance sheet. | |
| | Ÿ | | Successful, stable and trustworthy North American universal banking model. | |
| | Ÿ | | Strong risk management practices, facilitating optimal risk/return balance. | |
| | | | | | | | | | | | | | | | |
| | | Key Performance Metrics and Drivers | | 2011 | | | 2010 | | | 2009 | | | |
| | Net income ($ millions) | | | 920 | | | | 816 | | | | 870 | | | |
| | Trading Products revenue ($ millions) | | | 2,031 | | | | 2,040 | | | | 2,017 | | | |
| | Investment and Corporate Banking revenue ($ millions) | | | 1,310 | | | | 1,238 | | | | 1,068 | | | |
| | Equity underwriting participation (deals) (1) | | | 222 | | | | 213 | | | | 226 | | | |
| | Debt underwriting participation (deals) (1) | | | 190 | | | | 134 | | | | 115 | | | |
| | Average loans and acceptances ($ billions) (2) | | | 22.2 | | | | 25.4 | | | | 34.9 | | | |
| | Canadian equity research ranking (3) | | | #2 | | | | #2 | | | | #1 | | | |
| | Employee engagement index (%) (4) | | | 74 | | | | 71 | | | | 70 | | | |
| | (1) | Canadian corporate issuers in North America. |
| | (2) | Based on current loans. |
| | (3) | Brendan Wood International survey. |
| | (4) | Source: BMO Annual Employee Survey, conducted by Burke Inc., an independent research company. |
This BMO Capital Markets section contains forward-looking statements.
Please see the Caution Regarding Forward-Looking Statements.
| | |
| 56 | | BMO Financial Group 194th Annual Report 2011 |
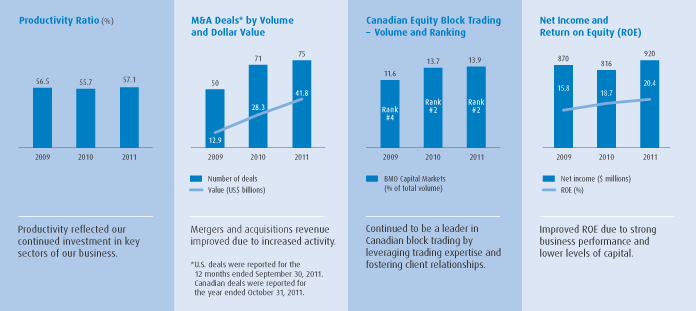
2011 Group Objectives and Achievements
Build out our distribution platform, primarily in the United States.
| Ÿ | | Strengthened our fixed income capabilities, including designation as Primary Dealer by the Federal Reserve Bank of New York, augmenting our U.S. Fixed Income business. |
| Ÿ | | Expanded our leveraged distribution platform including Institutional Bond and Loan sales and trading analysts. |
| Ÿ | | Integrated a new Global Securities Lending team. |
| Ÿ | | Continued to grow our U.S. listed equity options business, building a new sales and coverage team to provide better service to existing clients. |
Align capital and capabilities with client opportunity.
| Ÿ | | Continued to expand U.S. Equity Research and Sales & Trading capabilities, adding experienced senior talent in key regions. |
| Ÿ | | Extended Metals & Mining capabilities beyond North America, and hired additional leaders to support core client opportunities. |
| Ÿ | | Introduced a standardized client prioritization system for Investment and Corporate Banking business in Canada and the United States. |
Focus on strategic sectors, while building the capability to further extend BMO Capital Markets’ offering.
| Ÿ | | Expanded sector coverage in Investment and Corporate Banking and in Research in sectors such as Food & Consumer & Retail, Energy and Technology. |
| Ÿ | | Upgraded talent across target North American and global sectors. |
Other Achievements
| Ÿ | | Ranked in the top 2 for Canadian Equity Research according to Brendan Wood International’s annual survey of institutional investors for 31 consecutive years. |
| Ÿ | | Ranked 1st for Equity Trading in the 2011 Brendan Wood International Institutional Equity Study. |
| Ÿ | | Improved 4 places to 16th overall for U.S. Equity Research in the 2011 Greenwich Associates survey. |
| Ÿ | | Ranked #1 in Overall Research Quality and #1 in most used for research and most frequently cited for access to research personnel by fixed-income investors in the 2011 Greenwich Associates North American Fixed Income Study. |
| Ÿ | | Ranked tied for 5th overall, with 43 qualifying analysts and six awards, inThe Wall Street Journal’s “Best on the Street: 2011 Analyst Survey.” |
| Ÿ | | Ranked 1st in Interest Rate Derivatives market share by fixed-income investors in the 2011 Greenwich Associates North American Fixed Income Study. |
| Ÿ | | Ranked #1 by Canadian Energy Derivatives clients for understanding client needs, intense sales coverage, and best sales representatives among Canadian banks in the 2011 Greenwich Associates Energy Commodities Study. |
| Ÿ | | Ranked #1 by Canadian Interest Rate Derivatives fixed-income investors for creative ideas and market knowledge, and #2 in overall Quality and Franchise strength in the 2011 Greenwich Associates North American Fixed Income Study. |
| Ÿ | | Ranked as the Best Foreign Exchange Provider in North America in the 2011 Global Banking and Finance Review – Global Rankings. |
| Ÿ | | For the second year in a row, named World’s Best Metals and Mining Investment Bank byGlobal Finance magazine. |
| Ÿ | | Participated in 313 corporate and government debt transactions that raised $169 billion. Raised $31 billion through participation in 246 equity transactions. |
| Ÿ | | Advised on 75 completed mergers and acquisitions in North America with a value of US$41.8 billion. |
2012 Group Objectives
| | Ÿ | | Deliver a consistently great client experience through a unified coverage approach. |
| | Ÿ | | Continue to build out capabilities, particularly in the United States. |
| | Ÿ | | Develop our capabilities in sectors where we can differentiate ourselves in the market. |
| | | | |
| BMO Financial Group 194th Annual Report 2011 | | | 57 | |
MANAGEMENT’S DISCUSSION AND ANALYSIS
BMO Capital Markets Business Environment and Outlook
Fiscal 2011 saw improved results in BMO Capital Markets reflecting the strength and resilience of our core businesses. While the North American economy slowed in the first half of the year, conditions were more favourable for our investment banking business as mergers and acquisitions and underwriting activity improved. Notwithstanding tentative signs of improvement, the U.S. economy remained weak, suppressing corporate loan demand and lowering corporate banking revenues. Similarly, corporate banking revenues were also down in Canada, but the decrease was more muted due to relatively stronger economic activity and business investment. In addition, the performance of our trading products businesses was negatively impacted by the increased volatility and uncertainty arising from concerns about the European economy.
Looking forward, assuming that the effects of the European debt and economic difficulties are reasonably contained, we expect modest growth in Canada and the United States in 2012. The U.S. economy continues to be affected by depressed consumer confidence and weak housing markets. Canada’s still-strong trade ties with the United States suggest it would not be immune to a U.S. downturn, though flexible monetary and fiscal policies could cushion the blow. The weak economy and an uncertain global outlook should dissuade both the Bank of Canada and the Federal Reserve from raising interest rates until 2013. Our focus in 2012 will be on delivering strong returns on equity with stable, high-quality earnings. Growth in fiscal 2012 will depend on the performance of financial and commodity markets, as well as general economic activity and business confidence.
BMO Capital Markets Financial Results
BMO Capital Markets net income increased $104 million or 13% to $920 million, as revenue increases and a lower provision for credit losses were partially offset by increased expenses.
Revenue grew $63 million to $3,341 million, reflecting the strength and resilience of our businesses. The weaker U.S. dollar reduced revenue by $69 million.
Net interest income decreased $186 million or 13% from the prior year, reflecting lower trading net interest income due to a weaker market environment, and a decrease in corporate banking revenue due to lower asset levels and reduced spreads. Net interest margin decreased 21 basis points due to lower trading net interest income.
Non-interest revenue increased $249 million or 13%, driven by higher investment banking fees, particularly from mergers and acquisitions and debt underwriting. There was also an improvement in equity trading revenue. A decline in lending fees for the year was driven by lower lending volumes.
The provision for credit losses on an expected loss basis was $120 million, compared with $264 million in 2010.
Non-interest expense increased $82 million to $1,907 million, primarily due to increased employee costs, as we made strategic hires across key sectors to position our business for future growth. There were also higher professional fees and computer costs. The weaker U.S. dollar lowered expenses by $38 million. The group’s productivity ratio worsened from 55.7% to 57.1%, driven by the increase in expenses mentioned above. Results for the current period included a provision for prior periods’ income taxes in the U.S. segment in the first quarter of the year, as well as a recovery of prior periods’ income taxes in the third quarter.
Net income from U.S. operations decreased US$21 million to US$46 million, reflecting significantly lower trading revenue, partially offset by increases in mergers and acquisitions fees, debt underwriting fees, and revenues from our interest-rate-sensitive businesses. Non-interest expense increased as we continued to invest in strategic hiring. Income taxes were also higher due to a provision for prior periods’ income taxes as noted above.
BMO Capital Markets(Canadian $ in millions, except as noted)
| | | | | | | | | | | | | | | | | | | | |
| | | | | | | | | | | | Change from 2010 | |
| As at or for the year ended October 31 | | 2011 | | | 2010 | | | 2009 | | | $ | | | % | |
Net interest income (teb) | | | 1,208 | | | | 1,394 | | | | 1,527 | | | | (186 | ) | | | (13 | ) |
Non-interest revenue | | | 2,133 | | | | 1,884 | | | | 1,558 | | | | 249 | | | | 13 | |
Total revenue (teb) | | | 3,341 | | | | 3,278 | | | | 3,085 | | | | 63 | | | | 2 | |
Provision for credit losses | | | 120 | | | | 264 | | | | 146 | | | | (144 | ) | | | (55 | ) |
Non-interest expense | | | 1,907 | | | | 1,825 | | | | 1,744 | | | | 82 | | | | 4 | |
Income before income taxes and non-controlling interest in subsidiaries | | | 1,314 | | | | 1,189 | | | | 1,195 | | | | 125 | | | | 11 | |
Income taxes (teb) | | | 394 | | | | 373 | | | | 325 | | | | 21 | | | | 6 | |
Net income | | | 920 | | | | 816 | | | | 870 | | | | 104 | | | | 13 | |
Adjusted net income | | | 920 | | | | 817 | | | | 1,226 | | | | 103 | | | | 13 | |
Net economic profit | | | 423 | | | | 344 | | | | 272 | | | | 79 | | | | 23 | |
Return on equity (%) | | | 20.4 | | | | 18.7 | | | | 15.8 | | | | | | | | 1.7 | |
Productivity ratio (teb) (%) | | | 57.1 | | | | 55.7 | | | | 56.5 | | | | | | | | 1.4 | |
Net interest margin on earning assets (teb) (%) | | | 0.71 | | | | 0.92 | | | | 0.90 | | | | | | | | (0.21 | ) |
Average common equity | | | 4,271 | | | | 4,148 | | | | 5,218 | | | | 123 | | | | 3 | |
Average earning assets | | | 169,240 | | | | 152,076 | | | | 168,982 | | | | 17,164 | | | | 11 | |
Average loans and acceptances | | | 22,162 | | | | 25,437 | | | | 34,873 | | | | (3,275 | ) | | | (13 | ) |
Average deposits | | | 89,108 | | | | 80,401 | | | | 85,458 | | | | 8,707 | | | | 11 | |
Assets under administration | | | 20,076 | | | | 21,870 | | | | 27,418 | | | | (1,794 | ) | | | (8 | ) |
Assets under management | | | 2,942 | | | | 5,196 | | | | 6,969 | | | | (2,254 | ) | | | (43 | ) |
Full-time equivalent employees | | | 2,321 | | | | 2,040 | | | | 1,849 | | | | 281 | | | | 14 | |
U.S. Business Selected Financial Data(US$ in millions)
| | | | | | | | | | | | | | | | | | | | |
| | | | | | | | | | | | Change from 2010 | |
| As at or for the year ended October 31 | | 2011 | | | 2010 | | | 2009 | | | $ | | | % | |
Total revenue (teb) | | | 1,014 | | | | 993 | | | | 1,136 | | | | 21 | | | | 2 | |
Non-interest expense | | | 795 | | | | 726 | | | | 623 | | | | 69 | | | | 10 | |
Net income | | | 46 | | | | 67 | | | | 305 | | | | (21 | ) | | | (32 | ) |
Average earning assets | | | 60,317 | | | | 48,231 | | | | 56,151 | | | | 12,086 | | | | 25 | |
Average loans and acceptances | | | 4,589 | | | | 5,359 | | | | 7,424 | | | | (770 | ) | | | (14 | ) |
Average deposits | | | 35,074 | | | | 25,136 | | | | 30,061 | | | | 9,938 | | | | 40 | |
Net economic profit and adjusted results in this section are non-GAAP and are discussed in the Non-GAAP Measures section on page 94.
| | |
| 58 | | BMO Financial Group 194th Annual Report 2011 |
Corporate Services, including Technology and Operations
Corporate Services consists of the corporate units that provide enterprise-wide expertise and governance support in a variety of areas, including strategic planning, risk management, finance, legal and compliance, communications and human resources. Its operating results reflect the impact of certain securitization and asset-liability management activities, the elimination of taxable equivalent adjustments, the impact of our expected loss provisioning methodology, the results from certain impaired loan portfolios, the impact of certain fair value adjustments and integration and restructuring costs related to the acquisition of M&I.
Technology and Operations (T&O) manages, maintains and provides governance over information technology, operations services, real estate and sourcing for BMO Financial Group. T&O focuses on enterprise-wide priorities that improve service quality and efficiency to deliver an excellent customer experience.
Notable achievements during the year included:
| Ÿ | | advancing BMO’s vision of providing a great customer experience by supporting the delivery of new online banking capabilities for commercial customers (including foreign exchange and global cash management), opening a new integrated Canadian call centre, developing a new customer relationship management solution for our sales force and providing personal customers with MoneyLogic, an online tool that helps them manage their spending; |
| Ÿ | | implementing a new core banking system in China; and |
| Ÿ | | developing and launching a comprehensive strategy to integrate our acquired M&I operations in the United States. |
Financial Results
Operating results for T&O are included with Corporate Services for reporting purposes. However, the costs of T&O services are transferred to the three client operating groups, and only minor amounts are retained in T&O results. As such, results in this section largely reflect the corporate activities outlined above.
Corporate Services net loss for the year was $228 million, compared with a net loss of $320 million in 2010. The net loss on an adjusted basis was $267 million.
The amounts in the remainder of this Corporate Services, including Technology and Operations section are stated on an adjusted basis.
Net income improved $53 million from a year ago due to improved revenues and lower provisions for credit losses, partially offset by higher expenses. Revenue was $78 million better, primarily due to a lower group teb offset, partially offset by higher residual funding costs and costs associated with supplemental liquidity. Provisions for credit losses were $229 million lower due to a reduction in specific provisions charged to Corporate Services under BMO’s expected loss provisioning methodology. Expense was higher, primarily driven by higher technology investment spending, professional fees and employee costs.
Corporate Services, including Technology and Operations(Canadian $ in millions, except as noted)
| | | | | | | | | | | | | | | | | | | | |
| | | | | | | | | | | | Change
from 2010 | |
As at or for the
year ended October 31 | | 2011 | | | 2010 | | | 2009 | | | $ | | | % | |
Net interest income before
teb offset | | | (342 | ) | | | (437 | ) | | | (1,121 | ) | | | 95 | | | | 22 | |
Group teb offset | | | (220 | ) | | | (355 | ) | | | (247 | ) | | | 135 | | | | 38 | |
Net interest income (teb) | | | (562 | ) | | | (792 | ) | | | (1,368 | ) | | | 230 | | | | 29 | |
Non-interest revenue | | | 319 | | | | 219 | | | | 452 | | | | 100 | | | | 46 | |
Total revenue (teb) | | | (243 | ) | | | (573 | ) | | | (916 | ) | | | 330 | | | | 58 | |
Provision for (recovery of)
credit losses | | | (21 | ) | | | 152 | | | | 973 | | | | (173 | ) | | | (+100 | ) |
Non-interest expense | | | 428 | | | | 177 | | | | 232 | | | | 251 | | | | +100 | |
Income (loss) before income
taxes and non-controlling
interest in subsidiaries | | | (650 | ) | | | (902 | ) | | | (2,121 | ) | | | 252 | | | | 28 | |
Income taxes (recovery) (teb) | | | (495 | ) | | | (656 | ) | | | (1,005 | ) | | | 161 | | | | 24 | |
Non-controlling interest in
subsidiaries | | | 73 | | | | 74 | | | | 76 | | | | (1 | ) | | | (1 | ) |
Net income (loss) | | | (228 | ) | | | (320 | ) | | | (1,192 | ) | | | 92 | | | | 29 | |
Adjusted net income (loss) | | | (267 | ) | | | (320 | ) | | | (1,074 | ) | | | 53 | | | | 17 | |
Full-time equivalent
employees | | | 13,939 | | | | 10,437 | | | | 10,115 | | | | 3,502 | | | | 34 | |
|
U.S. Business Selected Financial Data(US$ in millions) | |
| | | | | | | | | | | | Change from 2010 | |
| As at or for the year ended October 31 | | 2011 | | | 2010 | | | 2009 | | | $ | | | % | |
Total revenue (teb) | | | (41 | ) | | | (160 | ) | | | (288 | ) | | | 119 | | | | 75 | |
Provision for credit losses | | | 189 | | | | 227 | | | | 767 | | | | (38 | ) | | | (17 | ) |
Non-interest expense | | | 167 | | | | (14 | ) | | | (3 | ) | | | 181 | | | | +100 | |
Income taxes (recovery) (teb) | | | (235 | ) | | | (146 | ) | | | (399 | ) | | | (89 | ) | | | (59 | ) |
Net income (loss) | | | (181 | ) | | | (245 | ) | | | (671 | ) | | | 64 | | | | 26 | |
Adjusted net income (loss) | | | (196 | ) | | | (245 | ) | | | (631 | ) | | | 49 | | | | 20 | |
As explained on page 45, BMO analyzes revenues on a teb basis at the client operating group level, with an offsetting adjustment in Corporate Services. Results reflect teb reductions in net interest income and related income taxes. The impact on net interest income is itemized in the table below.
As also explained on page 45, BMO’s practice is to charge loss provisions to the client operating groups each year, using an expected loss provisioning methodology based on each group’s share of expected credit losses. Corporate Services is generally charged (or credited) with differences between expected loss provisions charged to the client operating groups and provisions required under GAAP.
Adjusted results in this section are non-GAAP and are discussed in the Non-GAAP Measures section on page 94.
Financial Condition Review
Summary Balance Sheet($ millions)
| | | | | | | | | | | | | | | | | | | | |
| As at October 31 | | 2011 | | | 2010 | | | 2009 | | | 2008 | | | 2007 | |
Assets | | | | | | | | | | | | | | | | | | | | |
Cash and interest bearing deposits with banks | | | 23,594 | | | | 20,554 | | | | 13,295 | | | | 21,105 | | | | 22,890 | |
Securities | | | 131,346 | | | | 123,399 | | | | 110,813 | | | | 100,138 | | | | 98,277 | |
Securities borrowed or purchased under resale agreements | | | 37,970 | | | | 28,102 | | | | 36,006 | | | | 28,033 | | | | 37,093 | |
Net loans and acceptances | | | 206,498 | | | | 176,643 | | | | 167,829 | | | | 186,962 | | | | 164,095 | |
Other assets | | | 78,015 | | | | 62,942 | | | | 60,515 | | | | 79,812 | | | | 44,169 | |
| | | | 477,423 | | | | 411,640 | | | | 388,458 | | | | 416,050 | | | | 366,524 | |
| | | | | | | | | | | | | | | | | | | | |
| As at October 31 | | 2011 | | | 2010 | | | 2009 | | | 2008 | | | 2007 | |
Liabilities and Shareholders’
Equity | | | | | | | | | | | | | | | | | | | | |
Deposits | | | 302,932 | | | | 249,251 | | | | 236,156 | | | | 257,670 | | | | 232,050 | |
Other liabilities | | | 140,620 | | | | 135,933 | | | | 126,719 | | | | 134,761 | | | | 114,330 | |
Subordinated debt | | | 5,348 | | | | 3,776 | | | | 4,236 | | | | 4,315 | | | | 3,446 | |
Capital trust securities | | | 400 | | | | 800 | | | | 1,150 | | | | 1,150 | | | | 1,150 | |
Preferred share liability | | | – | | | | – | | | | – | | | | 250 | | | | 250 | |
Shareholders’ equity | | | 28,123 | | | | 21,880 | | | | 20,197 | | | | 17,904 | | | | 15,298 | |
| | | | 477,423 | | | | 411,640 | | | | 388,458 | | | | 416,050 | | | | 366,524 | |
| | | | |
| BMO Financial Group 194th Annual Report 2011 | | | 59 | |
MANAGEMENT’S DISCUSSION AND ANALYSIS
Overview
Total assets increased $65.8 billion from the prior year to $477.4 billion at October 31, 2011. This included $29.1 billion of loans as a result of the M&I acquisition. The weaker U.S. dollar decreased the translated value of U.S.-dollar-denominated assets by $3.9 billion. Including the acquired M&I assets, the increase was comprised of net loans and acceptances of $29.8 billion, other assets of $15.1 billion, securities borrowed or purchased under resale agreements of $9.9 billion, securities of $8.0 billion and cash and interest bearing deposits with banks of $3.0 billion.
Liabilities and shareholders’ equity increased $65.8 billion. This included $33.1 billion of deposits as a result of the M&I acquisition. Including the acquired M&I liabilities, the increase was comprised of deposits of $53.7 billion, an increase of $6.2 billion in shareholders’ equity, an increase of $4.7 billion in other liabilities and an increase of $1.6 billion in subordinated debt, partially offset by a $0.4 billion decline in capital trust securities.
Cash and Interest Bearing Deposits with Banks
Cash and interest bearing deposits with banks increased $3.0 billion to $23.6 billion in 2011, primarily reflecting increased balances held with the U.S. Federal Reserve due to U.S. deposit growth.
Securities($ millions)
| | | | | | | | | | | | | | | | | | | | |
| As at October 31 | | 2011 | | | 2010 | | | 2009 | | | 2008 | | | 2007 | |
Trading | | | 71,579 | | | | 71,710 | | | | 59,071 | | | | 66,032 | | | | 70,773 | |
Available-for-sale | | | 58,684 | | | | 50,543 | | | | 50,257 | | | | 32,115 | | | | 26,010 | |
Other | | | 1,083 | | | | 1,146 | | | | 1,485 | | | | 1,991 | | | | 1,494 | |
| | | | 131,346 | | | | 123,399 | | | | 110,813 | | | | 100,138 | | | | 98,277 | |
Securities increased $8.0 billion to $131.4 billion. Available-for-sale mortgage-backed securities increased $6.7 billion, including $5.0 billion from acquired businesses. Further details on the composition of securities are provided in Note 3 on page 122 of the financial statements.
Securities Borrowed or Purchased Under Resale Agreements
Securities borrowed or purchased under resale agreements increased $9.9 billion to $38.0 billion, mainly due to increased client demand.
Loans and Acceptances($ millions)
| | | | | | | | | | | | | | | | | | | | |
| As at October 31 | | 2011 | | | 2010 | | | 2009 | | | 2008 | | | 2007 | |
Residential mortgages | | | 54,454 | | | | 48,715 | | | | 45,524 | | | | 49,343 | | | | 52,429 | |
Consumer instalment and other personal | | | 59,445 | | | | 51,159 | | | | 45,824 | | | | 43,737 | | | | 33,189 | |
Credit cards | | | 2,251 | | | | 3,308 | | | | 2,574 | | | | 2,120 | | | | 4,493 | |
Businesses and governments | | | 84,953 | | | | 68,338 | | | | 68,169 | | | | 84,151 | | | | 62,650 | |
Customers’ liability under acceptances | | | 7,227 | | | | 7,001 | | | | 7,640 | | | | 9,358 | | | | 12,389 | |
Gross loans and acceptances | | | 208,330 | | | | 178,521 | | | | 169,731 | | | | 188,709 | | | | 165,150 | |
Allowance for credit losses | | | (1,832 | ) | | | (1,878 | ) | | | (1,902 | ) | | | (1,747 | ) | | | (1,055 | ) |
Net loans and acceptances | | | 206,498 | | | | 176,643 | | | | 167,829 | | | | 186,962 | | | | 164,095 | |
Net loans and acceptances increased $29.8 billion to $206.5 billion. Loans to businesses and governments increased $16.6 billion, which included $18.9 billion of acquired M&I loans. Utilization remains at below-normal levels. Given the ongoing economic uncertainty, borrowers are holding cash on their balance sheets and spending remains weak. Consumer instalment and other personal loans increased $8.3 billion, including $4.7 billion of acquired M&I loans and a $3.8 billion increase in auto loans and home equity loans. Residential mortgages increased $5.7 billion, including acquired M&I mortgages of $5.4 billion. These increases were partially offset by a reduction in credit card loans due mainly to securitization activity in April 2011.
Table 11 on page 106 provides a comparative summary of loans by geographic location and product. Table 13 on page 107 provides a comparative summary of net loans in Canada by province and industry. Loan quality is discussed on page 41 and 42 and further details on loans are provided in Notes 4, 5 and 8 to the financial statements, starting on page 126.
Other Assets
Other assets increased $15.1 billion to $78.0 billion. There was an increase of $5.9 billion in derivative financial instrument assets, with higher levels of interest rate swap contracts and equity contracts. The balance of other assets, which includes accounts receivable, prepaid expenses, tax receivable and pension assets, increased $6.4 billion, including $4.8 billion from our acquired M&I businesses. Goodwill and intangible assets also increased $2.8 billion, reflecting our acquisitions. Derivative instruments are detailed in Note 10 on page 138 of the financial statements.
Deposits($ millions)
| | | | | | | | | | | | | | | | | | | | |
| As at October 31 | | 2011 | | | 2010 | | | 2009 | | | 2008 | | | 2007 | |
Banks | | | 20,899 | | | | 19,435 | | | | 22,973 | | | | 30,346 | | | | 34,100 | |
Businesses and governments | | | 159,746 | | | | 130,773 | | | | 113,738 | | | | 136,111 | | | | 121,748 | |
Individuals | | | 122,287 | | | | 99,043 | | | | 99,445 | | | | 91,213 | | | | 76,202 | |
| | | | 302,932 | | | | 249,251 | | | | 236,156 | | | | 257,670 | | | | 232,050 | |
Deposits increased $53.7 billion to $302.9 billion. Deposits from businesses and governments, which account for 53% of total deposits, increased $29.0 billion. Of the $29.0 billion increase, $12.3 billion was from our acquired M&I business, with the remainder in wholesale and customer deposits. Deposits by individuals increased $23.2 billion, with $20.5 billion from our M&I acquisition. Deposits by banks, which account for 7% of total deposits, increased $1.5 billion, primarily due to higher wholesale deposits. Excluding acquisitions, total deposits increased $20.7 billion and were primarily used to fund trading and supplemental liquid assets. Further details on the composition of deposits are provided in Note 15 on page 148 of the financial statements and in the Liquidity and Funding Risk section on page 88.
Other Liabilities
Other liabilities increased $4.7 billion to $140.6 billion. Securities sold but not yet purchased increased $4.7 billion due to increased client activity. Derivative liabilities increased $3.4 billion due to higher levels of interest rate swap contracts. The remaining increase was in other liabilities. The $7.9 billion decrease in securities lent or sold under repurchase agreements related to client activities. Subordinated debt increased $1.6 billion due to an issuance during the second quarter of 2011. Further details on the composition of other liabilities are provided in Note 16 on page 149 of the financial statements.
Shareholders’ Equity
Shareholders’ equity increased $6.2 billion to $28.1 billion, largely reflecting the issuance of approximately 67 million common shares on the M&I acquisition at a value of $4.0 billion, a $0.3 billion issuance of preferred shares in the second quarter of 2011, a $1.5 billion increase in retained earnings, and a $0.2 billion decrease in accumulated other comprehensive loss. The bank’s Dividend Reinvestment and Share Purchase Plan is described on page 65 of the Enterprise-Wide Capital Management section. Our Consolidated Statement of Changes in Shareholders’ Equity on page 117 provides a summary of items that increase or reduce shareholders’ equity, while Note 20 on page 154 of the financial statements provides details on the components of and changes in share capital. Details of our enterprise-wide capital management practices and strategies can be found on page 61.
| | |
| 60 | | BMO Financial Group 194th Annual Report 2011 |
Enterprise-Wide Capital Management
Objective
BMO is committed to a disciplined approach to capital management that balances the interests and requirements of shareholders, regulators, depositors and rating agencies. Our objective is to maintain a strong capital position in a cost-effective structure that:
| Ÿ | | is appropriate given our target regulatory capital ratios and internal assessment of required economic capital; |
| Ÿ | | is consistent with our targeted credit ratings; |
| Ÿ | | underpins our operating groups’ business strategies; and |
| Ÿ | | builds depositor confidence and long-term shareholder value. |
Capital Management Framework
The principles and key elements of BMO’s capital management framework are outlined in our capital management corporate policy and in our annual capital plan, which includes the results of the Internal Capital Adequacy Assessment Process (ICAAP).
ICAAP is an integrated process that evaluates capital adequacy, and is used to establish capital targets and capital strategies that take into consideration the strategic direction and risk appetite of the organization. The ICAAP and capital plan are developed in conjunction with BMO’s annual business plan, promoting alignment between our business and risk strategies, regulatory and economic capital requirements, and capital availability. Capital adequacy is assessed by comparing capital supply (the amount of capital available to support losses) to capital demand (the capital required to support the risks underlying our business activities). Enterprise-wide stress testing and scenario analysis are also used to assess the impact of various stress conditions on BMO’s risk profile and capital requirements. The framework seeks to ensure that we are adequately capitalized given the risks we take, and supports the determination of limits, goals and performance measures that are used to manage balance sheet positions, risk levels and capital requirements at both the consolidated entity and line of business level. Assessments of actual and forecast capital adequacy are compared to the capital plan throughout the year, and the capital plan is updated as required, based on changes in our business activities, risk profile or operating environment.
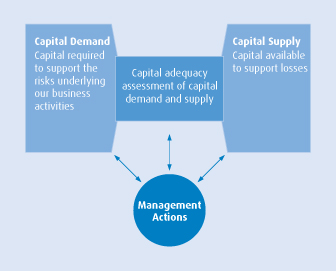
For further discussion of the risks that underlie our business activities, refer to the Enterprise-Wide Risk Management section on page 78.
BMO uses a combination of regulatory and economic capital to evaluate business performance and as the basis for strategic, tactical and transactional decision-making. By allocating capital to operating units and measuring their performance in relation to the capital necessary to support the risks in their business, we seek to optimize our risk-adjusted return to shareholders, while maintaining a well-capitalized position. This approach aims to protect our stakeholders from the risks inherent in our various businesses, while still allowing the flexibility to deploy resources to the high-return, strategic growth activities of our operating groups. Capital in excess of what is required to support our line of business activities is held in Corporate Services.
Governance
The Board of Directors and its Risk Review Committee provide ultimate oversight and approval of capital management, including our capital management corporate policy, capital plan and ICAAP results. They regularly review BMO’s capital position, capital adequacy assessments and key capital management activities. The Risk Management Committee and Capital Management Committee provide senior management oversight, and also review and discuss significant capital policies, issues and action items that arise in the execution of our enterprise-wide strategy. Finance and Risk Management are responsible for the design and implementation of the corporate policies and framework related to capital and risk management and the ICAAP. Our ICAAP operating processes are reviewed on an annual basis by our Corporate Audit division.
2011 Regulatory Capital Review
Regulatory capital requirements for the consolidated entity are currently determined on a Basel II basis. BMO primarily uses the Advanced Internal Ratings Based (AIRB) Approach to determine credit risk-weighted assets (RWA) in our portfolio, and the Standardized Approach to determine operational RWA. In the first quarter of 2011, the Office of the Superintendent of Financial Institutions Canada (OSFI) approved BMO’s application to adopt the AIRB Approach to determine credit RWA for our U.S. retail banking subsidiary BMO Bankcorp, Inc. Previously, BMO Bankcorp, Inc. had used the Standardized Approach to determine credit RWA. Credit RWA arising from our acquisition of M&I are determined using the Standardized Approach. BMO’s market RWA are primarily determined using the Internal Models Approach, but the Standardized Approach is used for some exposures.
The AIRB Approach is the most advanced of the approaches for determining credit risk capital requirements under Basel II. It utilizes sophisticated techniques to measure RWA at the borrower level based on sound risk management principles, including consideration of estimates of the probability of default, the likely loss given a default, exposure at default, term to maturity and the type of Basel Asset Class exposure. These risk parameters are determined using historical portfolio data supplemented by benchmarking, and are updated periodically. Validation procedures related to these parameters are in place and are enhanced periodically in order to appropriately quantify and differentiate risks so they reflect changes in economic and credit conditions.
Under the Standardized Approach, operational risk capital requirements are determined by the size and type of our lines of business. As defined under Basel II, gross income serves as a proxy for the size of the line of business and as an indicator of operational risk. Gross income is segmented into eight regulatory business lines by business type, and each segment amount is multiplied by a corresponding factor prescribed by the Basel II framework to determine its operational risk capital requirement. For further details on Basel II, refer to the Enterprise-Wide Risk Management section starting on page 78.
| | | | |
| BMO Financial Group 194th Annual Report 2011 | | | 61 | |
MANAGEMENT’S DISCUSSION AND ANALYSIS
BMO’s total RWA were $208.7 billion at October 31, 2011, up from $161.2 billion in 2010. The increase was primarily attributable to the impact of the M&I acquisition, which added approximately $45 billion of RWA, and the adoption of the AIRB Approach for the BMO Bankcorp, Inc. portfolio, excluding M&I. Corporate and commercial RWA and securitization RWA were also higher. The effect of a strengthening Canadian dollar on U.S.-dollar-denominated RWA partially offsets the effects of other increases in RWA. The table below provides a breakdown of our RWA by risk type.
Risk-Weighted Assets($ millions)
| | | | | | | | |
| As at October 31 | | 2011 | | | 2010 | |
Credit risk | | | 179,092 | | | | 136,290 | |
Market risk | | | 4,971 | | | | 5,217 | |
Operational risk | | | 24,609 | | | | 19,658 | |
Total RWA | | | 208,672 | | | | 161,165 | |
The adjacent table details the components of regulatory capital. Adjusted common shareholders’ equity is the most permanent form of capital. It is comprised of common shareholders’ equity less a deduction for goodwill, excess intangible assets and deductions for certain other items under Basel II. Adjusted Tier 1 capital is primarily comprised of adjusted common shareholders’ equity, preferred shares and innovative hybrid instruments. Our adjusted common shareholders’ equity and Tier 1 capital were $20.0 billion and $25.1 billion, respectively, at October 31, 2011, up from $16.5 billion and $21.7 billion, respectively, in 2010. The increase in adjusted common shareholders’ equity was primarily attributable to the issuance of common shares to M&I shareholders, as consideration for its acquisition, and internally generated capital. These were partially offset by higher Basel II capital deductions primarily related to the M&I acquisition and the adoption of the AIRB Approach to determine credit risk for BMO Bankcorp, Inc. Adjusted Tier 1 capital was also affected by the net impact of the issuance of preferred shares and redemption of innovative Tier 1 capital instruments during the year, as outlined below in Capital Management Activities.
Total capital includes Tier 1 and Tier 2 capital, net of certain deductions. Tier 2 capital is primarily comprised of subordinated debentures and a portion of the general allowance for credit losses. Deductions from Tier 2 capital primarily relate to our investments in insurance subsidiaries and other substantial investments. Total capital was $31.0 billion at October 31, 2011, up from $25.6 billion in 2010. This increase was primarily attributable to growth in common shareholders’ equity, as discussed above, and an increase in Tier 2 capital largely due to the issuance of subordinated debt during the year, as outlined below in Capital Management Activities.
Our objective is to maintain strong capital ratios that exceed regulatory requirements. The Common Equity Ratio, Tier 1 Capital Ratio and Total Capital Ratio are key measures of capital adequacy, and all remained strong in 2011.
The Common Equity Ratio and the Basel II Tier 1 Capital Ratio, Total Capital Ratio and Assets-to-Capital Multiple are the primary capital measures.
TheCommon Equity Ratio reflects common shareholders’ equity less capital adjustments, divided by RWA. This capital measure has been calculated by BMO following market and regulatory developments and a required version has been introduced under Basel III.
TheTier 1 Capital Ratio reflects Tier 1 capital divided by RWA.
TheTotal Capital Ratio reflects total capital divided by RWA.
TheAssets-to-Capital Multiple reflects total assets, including specified off-balance sheet items net of other specified deductions, divided by total capital.
Basel II Regulatory Capital($ millions)
| | | | | | | | |
| As at October 31 | | 2011 | | | 2010 | |
Gross common shareholders’ equity | | | 24,455 | | | | 18,753 | |
Goodwill and excess intangible assets | | | (3,585 | ) | | | (1,619 | ) |
Securitization-related deductions | | | (168 | ) | | | (165 | ) |
Expected loss in excess of allowance (AIRB Approach) | | | (205 | ) | | | – | |
Substantial investments and investments in insurance subsidiaries | | | (481 | ) | | | (427 | ) |
Adjusted common shareholders’ equity | | | 20,016 | | | | 16,542 | |
Non-cumulative preferred shares | | | 2,861 | | | | 2,571 | |
Innovative Tier 1 capital instruments | | | 2,156 | | | | 2,542 | |
Non-controlling interest in subsidiaries | | | 38 | | | | 23 | |
Adjusted Tier 1 capital | | | 25,071 | | | | 21,678 | |
Subordinated debt | | | 5,896 | | | | 3,776 | |
Trust subordinated notes | | | 800 | | | | 800 | |
Accumulated net after-tax unrealized gains on available-for-sale equity securities | | | 7 | | | | 10 | |
Eligible portion of general allowance for credit losses | | | 309 | | | | 292 | |
Total Tier 2 capital | | | 7,012 | | | | 4,878 | |
Securitization-related deductions | | | (31 | ) | | | (29 | ) |
Expected loss in excess of allowance (AIRB Approach) | | | (205 | ) | | | – | |
Substantial investments and investments in insurance subsidiaries | | | (855 | ) | | | (890 | ) |
Adjusted Tier 2 capital | | | 5,921 | | | | 3,959 | |
Total capital | | | 30,992 | | | | 25,637 | |
At October 31, 2011, the Common Equity Ratio was 9.59% and the Tier 1 Capital Ratio was 12.01%. The acquisition of M&I on July 5, 2011, reduced the Common Equity Ratio and Tier 1 Capital Ratio by 130 and 190 basis points, respectively. The remaining reductions in the overall ratios were due to items that affected both capital and RWA, as outlined above. The ratios were maintained at strong levels during 2011 in anticipation of pending regulatory capital changes and the adoption of International Financial Reporting Standards (IFRS), in order to maintain financial strength and flexibility as we continue to execute our growth strategy. Further details on the potential impact of proposed regulatory capital changes and the adoption of IFRS are provided in the next section.
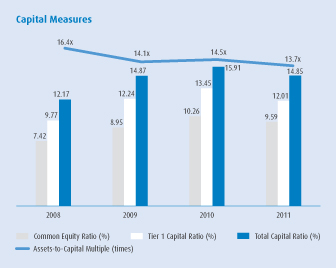
The Total Capital Ratio was 14.85% at October 31, 2011, down from 15.91% in 2010. The ratio decreased primarily due to the acquisition of M&I, partially offset by the issuance of subordinated debt during the year. Both the Tier 1 and Total Capital Ratios remain well above the current minimums of 7% and 10%, respectively, stipulated by OSFI for a well-capitalized financial institution.
| | |
| 62 | | BMO Financial Group 194th Annual Report 2011 |
BMO’s Assets-to-Capital Multiple was 13.7 at October 31, 2011, down from 14.5 in 2010. The multiple remains well below the current maximum permitted by OSFI.
BMO’s investments of capital in foreign operations are primarily denominated in U.S. dollars. Foreign exchange gains or losses on the translation of the investments in foreign operations to Canadian dollars are reported in shareholders’ equity, which, even when partially offset by the foreign exchange impact of U.S.-dollar-denominated RWA on Canadian-dollar-equivalent RWA, can create volatility in BMO’s capital ratios. To manage the impact of foreign exchange rate changes on BMO’s capital ratios to acceptable levels, we may partially or fully hedge this foreign exchange risk by partially or fully hedging BMO’s U.S.-dollar-denominated investments in foreign operations.
BMO conducts business through a variety of corporate structures, including subsidiaries and joint ventures. All of our subsidiaries must meet the regulatory and legislative requirements of the jurisdictions in which they operate. A framework is in place to provide subsidiaries and their parent entities with access to capital and funding to support their ongoing operations under both normal and stressed conditions.
Potential Impacts of Proposed Regulatory Capital Changes and Conversion to IFRS
The Basel III capital requirements have been issued in their substantially final form. OSFI has announced that it expects its minimum regulatory capital requirements to follow the Basel III transition plan and requirements, and that Canadian banks are to have in place and pursue internal capital plans and targets that will enable them to meet the Basel III regulatory capital requirements. OSFI expects that the combination of sound capital management practices and the international guidance on prudent retention of earnings will result in Canadian banks meeting the 2019 Basel III regulatory capital requirements early in the transition period.
Two new regulatory capital metrics have been introduced under Basel III, the Common Equity Ratio (which is defined on the preceding page) and the Leverage Ratio.
TheLeverage Ratio is defined as Tier 1 capital divided by the sum of on-balance sheet items and specified off-balance sheet items net of specified deductions.
The minimum capital ratio requirements under Basel III are higher than current Canadian requirements as established by OSFI under Basel II. Basel III significantly increases the quality of capital and RWA when compared to Basel II (Basel II and Basel III requirements are not directly comparable). The fully implemented Basel III requirements and the current OSFI Basel II requirements are summarized in the following table.
Regulatory Requirements(% of RWA)
| | | | | | | | | | | | | | | | |
| | | Common
Equity
Ratio | | | Tier 1
Capital
Ratio | | | Total
Capital
Ratio | | | Leverage
Ratio (2) | |
Basel III – Stated minimum requirements | | | 4.5 | | | | 6.0 | | | | 8.0 | | | | 3.0 | |
Plus: Capital Conservation buffer requirements (4) | | | 2.5 | | | | 2.5 | | | | 2.5 | | | | na | |
Effective Basel III requirements (1) | | | 7.0 | | | | 8.5 | | | | 10.5 | | | | 3.0 | |
OSFI Basel II – Current requirements | | | na | | | | 7.0 | | | | 10.0 | | | | na | (3) |
| | (1) | Does not include any applicable increases for banks that are systemically important either nationally or globally. The final requirements and transition periods will be established by OSFI. |
| | (2) | A 3% minimum Leverage Ratio has been proposed by the Basel Committee on Banking Supervision. It will be subject to analysis during a four-year parallel run test period, beginning January 1, 2013. Depending upon the results of the parallel run testing, there could be subsequent adjustments, which are targeted to be finalized in 2017, with the final Leverage Ratio requirement effective January 1, 2018. |
| | (3) | OSFI currently monitors the Assets-to-Capital Multiple, which is based on total capital. The proposed Basel III Leverage Ratio is based on Tier 1 capital. |
| | (4) | The Capital Conservation buffer does not include the counter-cyclical capital buffer of up to 2.5% of common shareholders’ equity, which may be required on a national basis by supervisors if they perceive credit growth resulting in systemic risk. If imposed, this additional buffer is effectively combined with the Capital Conservation buffer. |
na – not applicable
The minimum 4.5% Common Equity Ratio Capital requirement is augmented by the 2.5% common equity Capital Conservation buffer that can absorb losses during periods of stress. If a bank’s capital ratios fall within the range of this buffer, restrictions on earnings distributions (such as dividends, equity repurchases and discretionary compensation) would ensue, with the degree of such restrictions varying according to the position of the bank’s ratios within the buffer range.
In January 2011, the Basel Committee on Banking Supervision (BCBS) released guidance on non-viability contingent capital (NVCC). The guidance stipulates that in order to qualify as regulatory capital, a bank’s non-common share capital instruments must ensure that investors bear losses before taxpayers in the event its national authorities determine that the bank is non-viable and its rescue is in the public interest. OSFI issued guidance in August 2011, outlining NVCC requirements for instruments issued by Canadian financial institutions. All instruments issued after December 31, 2012 must meet these NVCC requirements to qualify as regulatory capital.
In February 2011, OSFI released guidance on the treatment that will apply to non-common share capital instruments that do not meet Basel III requirements, including NVCC requirements. Instruments that do not meet Basel III requirements will be subject to grandfathering provisions, and their recognition as regulatory capital will be phased out over a 10-year period beginning January 1, 2013. Using a base equal to the total value of such instruments outstanding as at January 1, 2013, their recognition is expected to be capped at 90% from January 1, 2013, with the cap reducing by one-tenth of the base in each subsequent year. Under the proposed rules, BMO’s existing innovative Tier 1 capital (BMO Capital Trust Securities and BMO Tier 1 Notes) and Tier 2 subordinated debt instruments will not qualify as regulatory capital once the rules are fully implemented. OSFI’s guidance also outlines the requirements for redemption of these regulatory capital instruments through a regulatory capital event. As announced earlier this year, BMO currently does not expect to redeem any of its outstanding regulatory capital instruments through a regulatory capital event.
In November 2011, the BCBS published rules prescribing additional capital requirements for global systemically important banks. Under the rules, 29 global systemically important banks have currently been identified and they, after a transition period from 2016 to 2019, will be subject to more stringent common equity capital requirements that exceed Basel III minimum requirements by 1% to 2.5% of RWA, depending on specific criteria. Although the identification of global systematically important banks will be an annual event, BMO does not meet the criteria that designate an institution as one of those global systemically important banks.
| | | | |
| BMO Financial Group 194th Annual Report 2011 | | | 63 | |
MANAGEMENT’S DISCUSSION AND ANALYSIS
BMO considers the Common Equity Ratio and the Tier 1 Capital Ratio to be the most important capital ratios under Basel III. Based on our analysis and assumptions and including the estimated impact of the adoption of IFRS in the calculation, BMO’s pro-forma Basel III Common Equity Ratio and Tier 1 Capital Ratio at October 31, 2011, would be 6.9% and 9.1%, respectively. The pro-forma calculations and statements in this section assume implementation at October 31, 2011, of announced Basel III regulatory capital requirements, which will be in effect January 2013, and include the impact of the adoption of IFRS. BMO’s pro-forma capital ratios position us well to meet Basel III capital requirements in the near term.
Under such Basel III pro-forma calculations, BMO’s adjusted common shareholders’ equity would decrease by approximately $4.4 billion from $20.0 billion to $15.6 billion as at October 31, 2011, and its adjusted Tier 1 capital would decrease by approximately $4.6 billion from $25.1 billion to $20.5 billion. The decrease is primarily a result of the impact of the adoption of IFRS on retained earnings, as well as new Basel III capital deductions and RWA treatment. These effects are partially offset by the discontinuance of certain current Basel II deductions from capital, which are instead converted to increases in RWA.
Based on such pro-forma calculations, RWA as at October 31, 2011 would increase by approximately $17.5 billion from $208.7 billion to $226.2 billion, primarily due to higher counterparty credit risk RWA ($12.6 billion) and, to a lesser extent, higher market risk RWA, as well as the conversion of certain current Basel II capital deductions to increases in RWA, as noted above. BMO’s pro-forma Tier 1 Capital Ratio, Total Capital Ratio and Leverage Ratio exceed Basel III minimum requirements.
The impacts of the changes associated with the adoption of IFRS are calculated based on our analysis as set out under Transition to International Financial Reporting Standards in the Future Changes in Accounting Policies – IFRS section. In calculating the Basel III Tier 1 Ratio and commenting on BMO’s Basel III Total Capital Ratio and Leverage Ratio, we assumed existing non-common share Tier 1 and Tier 2 capital instruments are fully included in regulatory capital. These instruments do not meet Basel III regulatory capital requirements, and will be subject to the grandfathering provisions previously noted. We expect to be able to refinance such capital as and when necessary to meet applicable non-common share capital requirements.
The pro-forma Basel III ratios do not reflect management actions that may be taken to mitigate the impact of the changes, the benefit of additional retained earnings growth over time that could be available to meet these requirements, or factors beyond the control of management.
A number of other potential regulatory changes are still being finalized. For example, regulators are assessing whether incremental capital requirements should be applied to banks that are systemically important in a national context and, in addition, a fundamental review of trading book capital requirements is continuing. These changes could affect the amount of capital that we hold or are required to hold to meet regulatory requirements.
BMO’s strong capital levels position us well for the implementation of both announced regulatory changes and changes associated with the adoption of IFRS in the coming years.
Economic Capital Review
Economic capital is a measure of our internal assessment of the risks underlying BMO’s business activities. It represents management’s estimation of the likely magnitude of economic losses that could occur should adverse situations arise, and allows returns to be measured on a basis that considers the risks taken. Economic capital is calculated for various types of risk – credit, market (trading and non-trading), operational and business – where measures are based on a time horizon of one year. For further discussion of these risks, refer to the Enterprise-Wide Risk Management section on page 78. Economic capital is a key element of our risk-based capital management and ICAAP framework.
Capital Management Activities
BMO issued approximately 67 million shares to M&I shareholders in consideration of the M&I acquisition in the third quarter of 2011. BMO also issued 6 million shares during the year under our Shareholder Dividend Reinvestment and Share Purchase Plan and for the exercise of stock options. BMO issued $290 million of 3.9% Preferred Shares – Series 25 on March 11, 2011, and redeemed $400 million of BMO Capital Trust Securities – Series B (BMO BOaTS – Series B) on December 31, 2010. In addition, on March 2, 2011, BMO issued $1.5 billion of 3.979% (subject to a rate reset on July 8, 2016) Series G Medium-Term Notes, First Tranche, of subordinated indebtedness, due in 2021, that qualifies as Tier 2 and total capital. On November 25, 2011, we announced our intention to redeem the $400 million BMO Capital Trust Securities – Series C (BMO BOaTS – Series C) on December 31, 2011. Further details are provided in Notes 18 and 20 on pages 151 and 154 of the financial statements.
Our normal course issuer bid expires on December 15, 2011. No common shares were repurchased under the program.
Dividends
BMO’s target dividend payout range over the medium term is 45% to 55% of net income available to common shareholders. The target is indicative of our confidence in our continued ability to increase earnings, and our strong capital position. BMO’s target dividend payout range seeks to provide shareholders with stable income, while ensuring sufficient earnings are retained to support anticipated business growth, fund strategic investments and provide continued support for depositors.
Dividends declared per common share in 2011 totalled $2.80. Annual dividends declared in 2011 represented 53.0% of net income available to common shareholders. Over the long term, BMO’s dividends are generally increased in line with trends in earnings per share growth.
| | |
| 64 | | BMO Financial Group 194th Annual Report 2011 |
At year end, BMO’s common shares provided a 4.75% annual dividend yield based on the year-end closing share price. On December 6, 2011, BMO announced that the Board of Directors declared a quarterly dividend on common shares of $0.70 per share, unchanged from both the prior quarter and a year ago.
Under our Shareholder Dividend Reinvestment and Share Purchase Plan (the Plan), we may offer a discount of up to 5% from the average market price (as defined in the Plan) on BMO common shares newly issued from treasury. In fiscal 2011, common shareholders who elected to reinvest dividends in common shares of BMO were issued shares from treasury without a discount from the average market price. Effective with the February 28, 2012 dividend payment, common shareholders who elect to reinvest dividends in common shares of BMO will receive a 2% discount from the average market price of the common shares (as defined in the Plan).
Eligible Dividends Designation
For the purposes of theIncome Tax Act(Canada) and any similar provincial and territorial legislation, BMO designates all dividends paid or deemed to be paid on both its common and preferred shares as “eligible dividends”, unless indicated otherwise.
Outstanding Shares and Securities Convertible into Common Shares
| | | | | | | | | | | | | | | | | | |
| | | Number of shares | | | | | Dividends declared per share | |
As at
November 24, 2011 | | or dollar amount | | | | | 2011 | | | 2010 | | | 2009 | |
Common shares | | | 639,083,000 | | | | | $ | 2.80 | | | $ | 2.80 | | | | $2.80 | |
Class B Preferred shares | | | | | | | | | | | | | | | |
Series 5 | | | $200,000,000 | | | | | $ | 1.33 | | | $ | 1.33 | | | | $1.33 | |
Series 13 | | | $350,000,000 | | | | | $ | 1.13 | | | $ | 1.13 | | | | $1.13 | |
Series 14 | | | $250,000,000 | | | | | $ | 1.31 | | | $ | 1.31 | | | | $1.31 | |
Series 15 | | | $250,000,000 | | | | | $ | 1.45 | | | $ | 1.45 | | | | $1.45 | |
Series 16 | | | $300,000,000 | | | | | $ | 1.30 | | | $ | 1.30 | | | | $1.30 | |
Series 18 | | | $150,000,000 | | | | | $ | 1.63 | | | $ | 1.63 | | | | $1.55 | |
Series 21 | | | $275,000,000 | | | | | $ | 1.63 | | | $ | 1.63 | | | | $1.11 | |
Series 23 | | | $400,000,000 | | | | | $ | 1.35 | | | $ | 1.35 | | | | $0.59 | |
Series 25 | | | $290,000,000 | | | | | $ | 0.69 | | | | – | | | | – | |
Convertible into common shares: | | | | | | | | | | | | | | | |
Class B Preferred shares(1) | | | | | | | | | | | | | | | |
Series 10 | | | US$300,000,000 | | | | | | US$1.49 | | | | US$1.49 | | | | US$1.49 | |
Stock options | | | | | | | | | | | | | | | | | | |
– vested | | | 9,139,000 | | | | | | | | | | | | | | | |
– nonvested | | | 7,674,000 | | | | | | | | | | | | | | | |
| | (1) | Convertible preferred shares may be exchanged for common shares on specific dates on a pro-rata basis based on 95% of the average trading price of common shares for the 20 days ending four days prior to the exchange date. |
| | Note 20 on page 154 of the financial statements includes details on share capital. |
This Enterprise-Wide Capital Management section contains forward-looking statements.
Please see the Caution Regarding Forward-Looking Statements.
Select Financial Instruments
At the request of the G7 finance ministers and central bank governors, The Financial Stability Forum (since re-established as the Financial Stability Board (FSB)) issued a report in April 2008 on enhancing market and institutional resilience. Among its recommendations, the report encouraged enhanced disclosure related to financial instruments that market participants had come to regard as carrying higher risk. We expanded our discussion of certain financial instruments in 2008 in keeping with these developments and we have continued to report on them, together with other financial instruments, to put exposures in context relative to our portfolio. We have also followed a practice of reporting on significant changes in our interim MD&A. In March 2011, the FSB published Thematic Review on Risk Disclosure Practices–Peer Review Report, which updates its views on disclosure practices. We continue to report in keeping with the spirit of the FSB recommendations.
Caution
Given continued uncertainty in the capital markets environment, our capital markets instruments could experience valuation gains and losses due to changes in market value. This section, Select Financial Instruments, contains forward-looking statements. Please see the Caution Regarding Forward-Looking Statements on page 29.
Consumer Loans
In Canada, our consumer loan portfolio totalled $89.8 billion at October 31, 2011 and is comprised of three main asset classes: residential mortgages (47%), instalment and other personal loans (51%) and credit card loans (2%).
In the United States, our consumer loan portfolio totalled US$22.3 billion and is also primarily comprised of three asset classes: residential first mortgages (36%), home equity products (36%) and indirect automobile loans (21%).
The following sections contain a discussion of our U.S. subprime mortgage loans, Alt-A mortgage loans and home equity products, portfolios that have been of increased investor interest in the economic
environment of the past few years. It also includes a discussion of repurchased mortgages. The U.S. mortgage market has been much more challenging than its Canadian counterpart.
In Canada, BMO does not have any subprime mortgage programs, nor do we purchase subprime mortgage loans from third-party lenders. We have a $25 billion Canadian home equity line of credit portfolio ($42 billion authorized). Of these lines of credit, one product line is offered only in first mortgage position and represents approximately 77% of the total portfolio. The portfolio is of high quality and only a low percentage of loans in the portfolio are 90 days or more in arrears.
In Canada, we do not have a mortgage program that we consider to be Alt-A. In the past, we may have chosen to not verify income or employment for certain customers when there were other strong qualifications that supported the creditworthiness of the loan as part of our credit adjudication process; however, this approach is no longer in use. We also have a Newcomers to Canada/non-resident mortgage program that permits limited income verification but has other strong qualification criteria. At October 31, 2011, there was approximately $3.9 billion ($3.0 billion in 2010) outstanding under this program. Only a low percentage of loans in the portfolio were 90 days or more in arrears at year end.
Subprime Mortgage Loans
In the United States, we have US$356 million (US$235 million excluding M&I) of first mortgage loan outstanding with subprime characteristics at the date of authorization. Approximately 4.2% of BMO’s U.S. first mortgage loan portfolio was 90 days or more in arrears at year end. The percentage of BMO’s U.S. subprime loans that are 90 days or more in arrears is higher than the comparable rate on BMO’s overall first mortgage portfolio, but the amount of such loans is not significant.
Home equity products are secured by the homeowner’s equity and rank subordinate to any existing first mortgage on the property. In the United States, we have a US$8.1 billion home equity loan portfolio (US$4.5 billion excluding M&I), which amounted to 4.0% of BMO’s total loan
| | | | |
| BMO Financial Group 194th Annual Report 2011 | | | 65 | |
MANAGEMENT’S DISCUSSION AND ANALYSIS
portfolio at October 31, 2011. Of the U.S. home equity loan portfolio, loans of US$281 million (US$250 million excluding M&I) were extended to customers with credit bureau scores below 620 and would be categorized as subprime loans. Only a low percentage of loans in the portfolio were 90 days or more in arrears.
Alt-A First Mortgage Loans
In the United States, Alt-A loans are generally considered to be loans for which borrower qualifications are subject to limited verification. Our U.S. loan portfolio had two loan programs that met this definition – the Easy Doc and No Doc programs. We discontinued offering the Easy Doc and No Doc programs in the third quarter of 2008. M&I also offered limited documentation loan programs that were considered Alt-A. Our Alt-A loan portfolio totalled US$1,354 million (US$724 million excluding M&I) at year end, and US$100 million or 7.4% of the portfolio was greater than 90 days in arrears. BMO also offered two limited documentation programs within the home equity loan portfolio in the United States, which would be categorized as Alt-A if they were in the first mortgage loan portfolio. M&I also offered home equity loans that would be considered Alt-A. As at October 31, 2011, there was US$800 million (US$556 million excluding M&I) outstanding under these programs, and loans 90 days or more in arrears totalled $27 million or 3.3%.
Mortgage Repurchases
From time to time, BMO Harris Bank sells residential mortgage loans originated within its branch network to the Federal Home Loan Mortgage Corporation (Freddie Mac), a corporation chartered by the United States federal government. Generally, mortgage loan purchasers, including Freddie Mac, have the right to require a mortgage loan seller to repurchase a loan when it is subsequently determined that the loan did not meet the terms and conditions of the purchase and sale agreement at the time of sale. Distress in the mortgage loan market has prompted purchasers such as Freddie Mac to increase their review of loans purchased to determine whether sellers are required to repurchase loans that did not meet the terms and conditions of the purchase and sale agreement at the time of sale. P&C U.S. received a total of 59 (41 in 2010) requests to repurchase mortgage loans totalling US$11.3 million in fiscal 2011 (US$7.2 million in fiscal 2010), of which approximately half were repurchased, one quarter were determined to have met the terms and conditions of the purchase and sale agreement and were not repurchased, and one quarter remain under discussion. At this time, we do not anticipate material losses from related future mortgage loan repurchase obligations.
Prior to its acquisition, M&I sold the majority of residential mortgages it originated into the secondary market. Unlike BMO Harris Bank, M&I sold these loans without retaining the servicing rights to several purchasers, including large network banks. At year end, there were 17 pending repurchase requests totalling US$3.8 million. In fiscal 2011, M&I repurchased 18 loans totalling US$3.1 million.
At this time, we do not anticipate material losses from related future mortgage loan repurchase obligations.
Leveraged Finance
Leveraged finance loans are defined by BMO as loans to private equity businesses and mezzanine financings where our assessment indicates a higher level of credit risk. BMO has exposure to leveraged finance loans, which represent less than 1% of our total assets, with $4.6 billion ($3.8 billion excluding M&I) outstanding as at October 31, 2011, up approximately $1.3 billion from a year ago (up $475 million excluding M&I). Of this amount, $146 million or 3.3% of leveraged finance loans were classified as impaired ($219 million or 6.6% in 2010).
Monoline Insurers and Credit Derivative Product Companies
At October 31, 2011, BMO’s direct exposure to companies that specialize in providing default protection amounted to $109 million in respect of the mark-to-market value of counterparty derivatives and $nil in respect of the mark-to-market value of traded credits ($121 million and $9 million in 2010). The cumulative adjustment for counterparty credit risk recorded against these exposures was $43 million ($40 million in 2010).
Certain credit derivative product counterparty exposures are discussed further in the Exposure to Other Select Financial Instruments section.
BMO-Sponsored Securitization Vehicles
BMO sponsors various vehicles that fund assets originated by either BMO (three bank securitization vehicles) or its customers (several Canadian customer securitization vehicles and one U.S. customer securitization vehicle). We earn fees for providing services related to the securitizations in the customer securitization vehicles, including liquidity, distribution and financial arrangement fees for supporting the ongoing operations of the vehicles. These fees totalled approximately $43 million in 2011 and $97 million in 2010. Further disclosure on the impact of IFRS on reporting requirements for these vehicles is provided on pages 73 to 76.
Bank Securitization Vehicles
Periodically, we sell loans to securitization vehicles for capital management purposes or to obtain alternate sources of funding. Gains on sales to the securitization vehicles, as well as revenues paid to us for servicing the loans sold, are recognized in income.
BMO has retained interests in our three bank securitization vehicles, as we sometimes choose to or are required to purchase subordinated interests or maintain cash deposits in the entities, and we have also recorded deferred purchase price amounts. These latter amounts represent the portion of gains on sales to securitization vehicles that have not been received in cash. Retained interests recorded as assets in our Consolidated Balance Sheet as at October 31, 2011 and 2010 in respect of the three bank securitization vehicles were $665 million and $527 million, respectively. In the event there are defaults on certain of the assets held by the vehicles, retained interests in those assets may not be fully recoverable and would then be written down. In addition, prepayments and changes in interest rates will affect the expected cash flows from the vehicles, which may result in partial write-downs of retained interests. During the years ended October 31, 2011 and 2010, there were no write-downs of retained interests in bank securitization vehicles.
The assets of two of the vehicles consist of Canadian residential mortgages and the third holds Canadian credit card loans transferred from BMO. Our investment in the asset-backed commercial paper (ABCP) of vehicles that hold residential mortgages was $162 million ($105 million in 2010). ABCP issued by the vehicles holding mortgages is rated R-1 (high) by DBRS Limited (DBRS) and P1 by Moody’s. We have provided $5.1 billion in liquidity facilities to the two vehicles that hold residential mortgages and no amounts had been drawn against these facilities at October 31, 2011. We have not provided liquidity facilities to the vehicle that holds credit card loans as it issues longer-term asset-backed securities and not ABCP. We hold subordinated notes issued by the credit card securitization vehicle with a face value of $372 million ($257 million in 2010). The asset-backed securities issued to third-party investors by the vehicle holding credit card loans are rated AAA by DBRS and Aaa by Moody’s. Further information on the impact of securitization activities on the consolidated financial statements is outlined in Note 8 on page 133 of the financial statements.
| | |
| 66 | | BMO Financial Group 194th Annual Report 2011 |
Canadian Customer Securitization Vehicles
The customer securitization vehicles we sponsor in Canada assist our customers with the securitization of their assets, providing them with an alternate source of funding. These vehicles provide clients with access to financing in the ABCP markets by allowing them to sell their assets into these vehicles, which then issue ABCP to investors to fund the purchases. In all cases, the sellers continue to service the transferred assets and are first to absorb any realized losses on the assets.
Our exposure to losses relates to our investment in ABCP issued by the vehicles, derivative contracts we have entered into with the vehicles and the liquidity support we provide through backstop liquidity facilities. We use our credit adjudication process in deciding whether to enter into these agreements just as we do when extending credit in the form of a loan.
BMO sometimes enters into derivative contracts with these vehicles to enable them to manage their exposures to interest rate and foreign exchange rate fluctuations. The fair value of such contracts at October 31, 2011 was $2 million, which was recorded as a derivative asset in our Consolidated Balance Sheet ($14 million in 2010).
Most customer securitization vehicles are funded in the market, while some are funded directly by BMO. BMO generally consolidates the accounts of the customer securitization vehicles where BMO provides the funding, as the majority of the gains or losses of those vehicles are expected to accrue to BMO. There were minimal levels of mortgage loans with subprime or Alt-A characteristics included in the total assets of the bank-funded vehicles at year end. No losses have been recorded on BMO’s exposure to these vehicles.
BMO’s investment in the ABCP of the market-funded vehicles totalled $170 million at October 31, 2011 ($46 million in 2010). No losses have been recorded on these investments.
BMO provided liquidity support facilities to the market-funded vehicles totalling $3.0 billion at October 31, 2011 ($3.0 billion in 2010). This amount comprised part of other credit instruments outlined in Note 5 on page 129 of the financial statements. All of these facilities remain undrawn. The assets of each of these market-funded customer securitization vehicles consist primarily of diversified pools of Canadian automobile receivables and Canadian residential mortgages. These two asset classes represent 74% (65% in 2010) of the aggregate assets of these vehicles. Included in these assets are $78 million ($210 million in 2010) of Canadian residential mortgage loans with subprime or Alt-A characteristics.
In the event we choose to or are required to terminate our relationship with a customer securitization vehicle, we would be obligated to hold any associated derivatives until their maturity. We would no longer receive fees for providing services relating to the securitizations, as previously described.
U.S. Customer Securitization Vehicle
We sponsor a U.S. ABCP multi-seller vehicle. This customer securitization vehicle assists our customers with the securitization of their assets to provide them with alternative sources of funding. The vehicle provides funding to diversified pools of portfolios through 64 (75 in 2010) individual securitization transactions with an average facility size of US$59.2 million. The size of the pools ranged from US$0.9 million to US$255 million at October 31, 2011. Residential mortgages classified as subprime or Alt-A comprise 0.3% of the portfolio.
Approximately 53% of the vehicle’s commitments have been rated by Moody’s or S&P, and 88% of those are rated A or higher. The vehicle holds exposures secured by a variety of asset classes, including mid-market corporate loans, commercial real estate and auto loans.
The vehicle’s commitments have reliance on 3.2% of European collateral. Exposure to Germany is the largest, at 1.2%. Exposure to Spain is 0.1%, and there is no exposure to Italy, Ireland, Greece or Portugal.
The vehicle had US$2.7 billion of commercial paper outstanding at October 31, 2011 (US$3.2 billion in 2010). The ABCP of the vehicle is rated A1 by S&P and P1 by Moody’s. BMO has not invested in the vehicle’s ABCP. BMO provides committed liquidity support facilities to the
vehicle. The amount of the facilities was US$3.8 billion at October 31, 2011 (US$3.8 billion in 2010), of which none has been drawn upon.
BMO is also a counterparty to derivative contracts with the vehicle that are used to manage its exposure to interest rates. The fair value of derivative contracts outstanding with the vehicle and recorded in our Consolidated Balance Sheet was a derivative asset of $4.7 million at October 31, 2011 ($2.2 million in 2010). BMO has not been required to consolidate the vehicle under Canadian GAAP, as the vehicle has issued an expected-loss note to a third party. The holder of the note consolidates the vehicle as the noteholder is exposed to the majority of expected losses.
In the event we choose to or are required to terminate our relationship with the vehicle, we would be required to settle any associated derivative contracts at their fair value and would no longer receive fees for the administration of the vehicle.
Credit Protection Vehicle
We also sponsor Apex Trust (Apex), a Canadian special purpose vehicle that comprises 12 tranches of diversified corporate credits, each of which has the benefit of first-loss protection. The 12 tranches in Apex have exposure to approximately 440 corporate credits that are diversified by geographic region and industry. Approximately 70% of the corporate credits are rated investment grade (25.2% rated higher than BBB and 44.7% rated BBB) and 30% are rated below investment grade. The ratings of the majority of the corporate credits stabilized in 2010, with the number on review for downgrade decreasing and the number on review for upgrade increasing, and that pattern continued in 2011.
Apex has issued $2.2 billion of notes (Apex Notes) with remaining terms of two and five years. BMO has hedged its exposure to its holdings of Apex Notes. After giving effect to these hedges, BMO has no net exposure through the Apex Notes to realized credit losses in the tranches.
In addition, a senior funding facility of $1.13 billion has been made available to Apex to fund collateral calls arising from changes in mark-to-market values of the underlying credit default swaps (CDS), with BMO providing $1.03 billion of that facility. We have hedged the first $515 million of loss exposure on our committed $1.03 billion exposure under the senior funding facility. As at October 31, 2011 and 2010, no amounts were advanced through BMO’s committed share of the senior facility.
BMO has entered into CDS contracts on the net notional positions in the structure with the swap counterparties and into offsetting swaps with the vehicle. As a result of these contracts, BMO has exposure to losses on the notional amount above the $3.33 billion total amount of Apex Notes and senior funding facility. Based on their notional values, the contracts will expire in 2012 (24%), 2013 (40%), 2014 (6%) and 2016 (30%).
Realized credit losses would only be incurred by Apex should losses on defaults on the underlying corporate credits exceed the first-loss protection on a tranche. As detailed below, a significant majority of Apex’s positions benefit from substantial first-loss protection. There was minimal change in the levels of first-loss protection in 2010 and 2011.
Two of the 12 tranches have lower levels of first-loss protection than the others. If losses were realized by Apex noteholders on the full notional amounts of $1,217 million in the two weakest tranches, BMO’s exposure would be $nil, given the hedges that are in place. Each of the other 10 tranches, which have a total net notional amount of $20.1 billion, is rated from A (low) to AAA and has significant first-loss protection, ranging from 12% to 29% with a weighted average of 23%. The longest-dated tranche matures in 2016 and has first-loss protection of 28%.
The net notional exposure of Apex to issuers in Greece, Italy and Spain represented 0.5%, 1.3% and 1.1%, respectively, of its total notional exposure. Net notional exposure to the other 12 countries that share the Euro currency was 14.1% of total notional exposure, of which 81% was rated investment grade by S&P (72% by Moody’s). The notional exposure to the remainder of Europe was 16.2% of total notional exposure with 70% rated investment grade by S&P (65% by Moody’s). The bank is well protected as a result of both first-loss protection and hedges that are in place, as described above.
| | | | |
| BMO Financial Group 194th Annual Report 2011 | | | 67 | |
MANAGEMENT’S DISCUSSION AND ANALYSIS
Structured Investment Vehicles
We have provided senior funding through a loan facility to two BMO London-managed structured investment vehicles (SIVs), Links Finance Corporation (Links) and Parkland Finance Corporation (Parkland). Our exposure to loss in the SIVs relates to the loan facility that was put in place in order to fund the repayment of the SIVs’ senior notes and the derivatives contracts we have entered into with the vehicles. We also hold subordinate capital notes of the SIVs with a carrying value of $nil.
The fair value of our derivatives contracts outstanding with the SIVs was recorded in our Consolidated Balance Sheet as a derivative asset of $19 million ($30 million in 2010). We earned investment management fees of $4 million in 2011 and $2 million in 2010 for managing these portfolios.
In the event we choose to or are required to terminate our relationship with these vehicles, any associated derivative contracts would be settled at their fair value.
We provide senior-ranked support for the funding of Links and Parkland through BMO loan facilities, permitting the SIVs to continue the strategy of selling assets in an orderly and value-sensitive manner.
At October 31, 2011, amounts drawn on the facilities totalled US$2.6 billion and€230 million (US$4.3 billion and€478 million in 2010) for Links and Parkland, respectively. The loan facilities totalled US$2.7 billion for Links and€260 million for Parkland at October 31, 2011. Advances under the loan facilities rank ahead of the SIVs’ subordinated capital notes. Consistent with the strategy of selling assets in an orderly manner, the pace of asset sales was measured throughout 2011. We anticipate that the SIVs will continue the strategy of selling assets in an orderly manner based upon market conditions. The total amount drawn under the loan facilities is primarily affected by the pace and price of asset sales and asset maturities. Amounts funded are expected to decrease from current levels based on these factors. We expect asset maturities and redemptions of US$595 million and€56 million in 2012, and US$523 million and€63 million in 2013. The remaining assets mature over time.
The par value of the assets held by Links and Parkland totalled US$3.3 billion and€337 million, respectively (US$5.3 billion and€624 million in 2010). The market value of the assets held by Links and Parkland, including hedges and cash equivalents, totalled US$2.6 billion and€285 million, respectively (US$4.4 billion and€551 million in 2010). During 2011, there were maturities and repayments of assets totalling US$766 million in Links and€85 million in Parkland, as well as asset sales of US$1.2 billion in Links and€182 million in Parkland. The SIVs’ capital noteholders will continue to bear the economic risk from actual losses up to the full amount of their investments. The book value of the subordinated capital notes in Links and Parkland at October 31, 2011 was US$440 million and€104 million, respectively. For both Links and Parkland, BMO believes that the first-loss protection provided by the subordinated capital notes continues to exceed future expected losses.
Links holds a portfolio of debt securities including subordinated commercial bank debt (45%) (of which 58% relate to European banks), collateralized bond obligations and collateralized loan obligations with underlying assets that are primarily corporate obligations (9%), residential mortgage-backed securities (19%) and commercial mortgage-backed securities (10%). Links has 60% of its assets invested in the United States, 38% in Europe and 2% in other countries. Approximately 35% of Links’ debt securities are rated Aa3 or better by Moody’s (45% in 2010) with 87% rated investment grade (88% in 2010). Approximately 27% are rated AA- or better by S&P (39% in 2010) with 89% rated investment grade (90% in 2010). Parkland has a higher proportion of highly-rated assets than Links. Parkland has 73% of its assets invested in Europe, 22% in the United States and the remainder in Australia and Canada. Certain of the debt securities it owns are on credit watch for a possible ratings downgrade.
Both Links and Parkland have European exposures. Neither vehicle has any direct credit exposure to issuers in Greece, Ireland, Italy, Portugal or Spain. Indirect exposure to issuers in these countries through
the SIVs’ CBO and CLO investments was approximately $13 million at October 31, 2011. The SIVs’ par value exposure to the Eurozone countries was $558 million, of which 44% was in France, 39% in the Netherlands, 16% in Germany and 1% in other countries. Approximately $422 million, or 76%, was in the form of bank subordinated debt. Approximately 95% of this debt was rated investment grade. The SIVs’ par value exposure to issuers in the remaining European countries was $899 million, of which 88% were in the United Kingdom, 5% in Switzerland, 5% in Denmark and 2% in other countries. Approximately $484 million, or 54%, was in the form of bank subordinated debt, of which approximately 95% was rated investment grade.
Exposure to Other Select Financial Instruments, including Collateralized Debt Obligations (CDOs) and Collateralized Loan Obligations (CLOs)
BMO’s trading and available-for-sale portfolios contain CDOs and CLOs, all of which are in run-off mode. Most of our CDOs and the majority of our CLOs are hedged with other large financial institutions. Unhedged CLO exposure was $337 million and the unhedged interest held in CDO exposure was minimal, with a $13 million carrying value. Hedged CDO exposure of $223 million had a carrying value of $63 million at year end, with $160 million recoverable on associated hedges with a financial institution that is rated BBB+ by S&P. Hedged CLO exposure of $891 million had a carrying value of $844 million at year end, with $47 million recoverable on associated hedges with a monoline insurer that is rated AA+ by S&P.
The underlying securities in the CDOs and CLOs consist of a wide range of corporate assets. The value of BMO’s interest in hedges with the counterparty rated BBB+ mentioned above is supported by collateral held, with the exception of relatively modest amounts as permitted under the counterparty agreement. For 2011 reporting, $363 million of CLOs with a market value of $337 million and credit ratings between AA- and AAA are deemed unhedged, as the CDS arrangements that were in place were with a counterparty that is no longer considered a going concern.
The portfolio also contains amounts in respect of CDS transactions referencing CDO instruments in which we do not have an interest. CDS protection of US$0.5 billion purchased from a credit derivative product company counterparty had a market value of $40 million (before deduction of $20 million of credit valuation adjustments) at year end, with a corresponding offset of US$0.5 billion in CDS protection provided to another financial institution in our role as intermediary. The credit rating of the credit derivative product company counterparty is Ba1 and the underlying security on the exposure consists of a pool of broadly diversified, single-name corporate and sovereign credits. The pool has 89 credits, of which 77% are investment grade, and has first-loss protection of 9.6%.
During the year, we closed CDS contracts referencing CDO instruments having a notional value of US$1 billion on which we had provided credit protection in our role as intermediary. We continue to hold the associated interest in the $1 billion of CDS protection from a credit
derivative product counterparty rated Caa1, which had a carrying value of $34 million (before deduction of $24 million of credit valuation adjustments) at year end.
European Balances
BMO’s direct exposures in Greece, Ireland, Italy, Portugal and Spain are primarily to banks for trade finance and trading products. Exposures remain modest at $203 million. In addition, our Irish subsidiary is required to maintain reserves with the Irish central bank. These totalled $163 million at the end of the year.
Our direct exposure to the other Eurozone countries (the other 12 countries that share a common euro currency) totalled approximately $5.1 billion, of which 91% was to counterparties in countries with a Moody’s/S&P rating of Aaa/AAA. Our direct exposure to the rest of Europe totalled approximately $4.8 billion, of which 98% was to
| | |
| 68 | | BMO Financial Group 194th Annual Report 2011 |
counterparties in countries with a Moody’s/S&P rating of Aaa/AAA. A significant majority of our sovereign exposure consists of short-term, tradeable cash products, while exposure to banks was comprised of short-term trading instruments, short-term debt, derivative positions and letters of credit and guarantees.
Details of these exposures are provided in the table below. In addition to the exposures shown in the table, we have exposure to European supranational institutions totalling $0.8 billion, predominantly in the form of short-term, tradeable cash products.
European Exposures by Country and Counterparty(Canadian $ in millions)
| | | | | | | | | | | | | | | | | | | | | | | | | | | | | | | | | | | | | | | | | | | | | | | | | | | | | | | | |
| As at October 31, 2011 | | Lending (1) | | | Securities (2) | | | Repo-style
transactions (3) | | | Derivatives (4) | | | | |
| Country | | Bank | | | Corporate | | | Sovereign (5) | | | Total | | | Bank | | | Corporate | | | Sovereign (5) | | | Total | | | Total | | | Bank | | | Corporate | | | Sovereign (5) | | | Total | | | Total
Exposure | |
GIIPS | | | | | | | | | | | | | | | | | | | | | | | | | | | | | | | | | | | | | | | | | | | | | | | | | | | | | | | | |
Greece | | | 3 | | | | – | | | | – | | | | 3 | | | | – | | | | – | | | | – | | | | – | | | | – | | | | – | | | | – | | | | – | | | | – | | | | 3 | |
Ireland (6) | | | – | | | | – | �� | | | – | | | | – | | | | – | | | | – | | | | – | | | | – | | | | – | | | | 13 | | | | – | | | | – | | | | 13 | | | | 13 | |
Italy | | | 1 | | | | – | | | | – | | | | 1 | | | | – | | | | 28 | | | | 10 | | | | 38 | | | | – | | | | 15 | | | | – | | | | – | | | | 15 | | | | 54 | |
Portugal | | | 21 | | | | 50 | | | | – | | | | 71 | | | | – | | | | – | | | | – | | | | – | | | | – | | | | – | | | | – | | | | – | | | | – | | | | 71 | |
Spain | | | 52 | | | | – | | | | – | | | | 52 | | | | – | | | | – | | | | – | | | | – | | | | – | | | | 10 | | | | – | | | | – | | | | 10 | | | | 62 | |
Total GIIPS | | | 77 | | | | 50 | | | | – | | | | 127 | | | | – | | | | 28 | | | | 10 | | | | 38 | | | | – | | | | 38 | | | | – | | | | – | | | | 38 | | | | 203 | |
Eurozone (excluding GIIPS) | | | | | | | | | | | | | | | | | | | | | | | | | | | | | | | | | | | | | | | | | | | | | | | | | | | | | | | | |
Austria | | | 90 | | | | – | | | | – | | | | 90 | | | | 14 | | | | 42 | | | | 199 | | | | 255 | | | | – | | | | 7 | | | | – | | | | – | | | | 7 | | | | 352 | |
Belgium | | | 126 | | | | 207 | | | | – | | | | 333 | | | | 67 | | | | – | | | | – | | | | 67 | | | | – | | | | 36 | | | | 6 | | | | 2 | | | | 44 | | | | 444 | |
Finland | | | – | | | | 5 | | | | – | | | | 5 | | | | – | | | | – | | | | 425 | | | | 425 | | | | – | | | | – | | | | – | | | | – | | | | – | | | | 430 | |
France | | | 61 | | | | – | | | | – | | | | 61 | | | | – | | | | – | | | | 884 | | | | 884 | | | | 2 | | | | 96 | | | | – | | | | – | | | | 96 | | | | 1,043 | |
Germany | | | 25 | | | | 102 | | | | – | | | | 127 | | | | – | | | | 4 | | | | 1,516 | | | | 1,520 | | | | 2 | | | | 65 | | | | – | | | | – | | | | 65 | | | | 1,714 | |
Luxembourg | | | 206 | | | | 40 | | | | – | | | | 246 | | | | – | | | | 4 | | | | – | | | | 4 | | | | – | | | | 5 | | | | 1 | | | | – | | | | 6 | | | | 256 | |
Netherlands | | | 42 | | | | 189 | | | | – | | | | 231 | | | | 29 | | | | 6 | | | | 520 | | | | 555 | | | | 2 | | | | 32 | | | | – | | | | – | | | | 32 | | | | 820 | |
Other (7) | | | 3 | | | | – | | | | – | | | | 3 | | | | – | | | | – | | | | – | | | | – | | | | – | | | | – | | | | – | | | | 2 | | | | 2 | | | | 5 | |
Total Eurozone
(excluding GIIPS) | | | 553 | | | | 543 | | | | – | | | | 1,096 | | | | 110 | | | | 56 | | | | 3,544 | | | | 3,710 | | | | 6 | | | | 241 | | | | 7 | | | | 4 | | | | 252 | | | | 5,064 | |
Rest of Europe | | | | | | | | | | | | | | | | | | | | | | | | | | | | | | | | | | | | | | | | | | | | | | | | | | | | | | | | |
Denmark | | | 277 | | | | – | | | | – | | | | 277 | | | | – | | | | – | | | | 1,134 | | | | 1,134 | | | | – | | | | 36 | | | | – | | | | – | | | | 36 | | | | 1,447 | |
Norway | | | 16 | | | | – | | | | – | | | | 16 | | | | 380 | | | | – | | | | 652 | | | | 1,032 | | | | – | | | | – | | | | – | | | | 24 | | | | 24 | | | | 1,072 | |
United Kingdom | | | 138 | | | | 343 | | | | – | | | | 481 | | | | 37 | | | | 40 | | | | 1,219 | | | | 1,296 | | | | 8 | | | | 230 | | | | 11 | | | | – | | | | 241 | | | | 2,026 | |
Other (7) | | | 114 | | | | 17 | | | | – | | | | 131 | | | | 1 | | | | – | | | | 3 | | | | 4 | | | | 10 | | | | 68 | | | | 24 | | | | – | | | | 92 | | | | 237 | |
Total rest of Europe | | | 545 | | | | 360 | | | | – | | | | 905 | | | | 418 | | | | 40 | | | | 3,008 | | | | 3,466 | | | | 18 | | | | 334 | | | | 35 | | | | 24 | | | | 393 | | | | 4,782 | |
Total all of Europe (8) | | | 1,175 | | | | 953 | | | | – | | | | 2,128 | | | | 528 | | | | 124 | | | | 6,562 | | | | 7,214 | | | | 24 | | | | 613 | | | | 42 | | | | 28 | | | | 683 | | | | 10,049 | |
| | (1) | Lending includes funded lending, trade finance and unfunded commitments of $715 million. |
| | (2) | Securities includes cash products, insurance investments and traded credit (equal to the net long value). |
| | (3) | Repo-style transactions are all with bank counterparties. Exposures are equal to the current gross exposure with collateral offsets. |
| | (4) | Derivatives amounts are marked-to-market, incorporating netting. Amounts are net of collateral offsets of $1.03 billion for counterparties where a Credit Support Annex is in effect. Total amount of collateral offsets was $1.03 billion. |
| (5) | Sovereign includes sovereign-backed bank cash products. |
| (6) | Excludes $163 million of reserves held by our Irish subsidiary at the Irish central bank. |
| (7) | Other includes countries with less than $200 million exposure. |
| (8) | For information on European exposures in our U.S. customer securitization vehicle and credit protection vehicle, please refer to page 67. For information on European exposures in our structured investment vehicles, please refer to page 68. Exposures in those vehicles are not reflected in the table. |
U.S. Regulatory Developments
On July 21, 2010, U.S. President Obama signed into law theDodd-Frank Wall Street Reform and Consumer Protection Act (the Dodd-Frank Act). The Act is broad in scope and the reforms include heightened consumer protection, regulation of the over-the-counter derivatives markets, restrictions on proprietary trading and sponsorship of private investment funds by banks (referred to as theVolcker Rule), imposition of heightened prudential standards and broader application of leverage and risk-based capital requirements. The reforms also include greater supervision of systemically significant payment, clearing or settlement systems, restrictions on interchange fees, and the creation of a new financial stability oversight council of regulators with the objective of increasing stability by monitoring systemic risks posed by financial services companies and their activities. Many provisions of the Dodd-Frank Act continue to be subject to rulemaking and will take effect over several years, making it difficult to anticipate at this time the overall impact on BMO or the financial services industry as a whole. As rulemaking evolves, we are continually monitoring developments to ensure we are well-positioned to respond to and implement any required changes. We anticipate an increase in regulatory compliance costs, and will be focused on managing the complexity and breadth of the regulatory changes.
The U.S. federal banking agencies and the Securities and Exchange Commission have jointly issued proposed rules to implement the Volcker Rule, which prohibits banking entities and their affiliates from certain proprietary trading and specified relationships with hedge funds and private equity funds. As currently proposed, the rule requires the implementation of a comprehensive compliance program and monitoring of certain quantitative risk metrics effective July 16, 2012. Banking entities must conform existing activities with the Volcker Rule by July 2014. In addition, under the Dodd-Frank Act, over-the-counter derivatives will be subject to a comprehensive regulatory regime. Certain derivatives will be required to be centrally cleared or traded on an exchange. Registration, reporting, business conduct and capital and margin requirements are also being finalized. BMO is currently assessing and preparing for the impact of these proposed rules on its operations.
The restrictions on interchange fees under the Dodd-Frank Act became effective on October 1, 2011, and are expected to lower P&C U.S. pre-tax net income on an annual basis by approximately US$40 million, after the mitigating effects of related management actions.
| | | | |
| BMO Financial Group 194th Annual Report 2011 | | | 69 | |
MANAGEMENT’S DISCUSSION AND ANALYSIS
Off-Balance Sheet Arrangements
BMO enters into a number of off-balance sheet arrangements in the normal course of operations.
Credit Instruments
In order to meet the financial needs of our clients, we use a variety of off-balance sheet credit instruments. These include guarantees and standby letters of credit, which represent our obligation to make payments to third parties on behalf of a customer if the customer is unable to make the required payments or meet other contractual requirements. We also write documentary and commercial letters of credit, which represent our agreement to honour drafts presented by a third party upon completion of specified activities. Commitments to extend credit are off-balance sheet arrangements that represent our commitment to customers to grant them credit in the form of loans or other financings for specific amounts and maturities, subject to meeting certain conditions.
There are a large number of credit instruments outstanding at any time. Our customers are broadly diversified and we do not anticipate events or conditions that would cause a significant number of our customers to fail to perform in accordance with the terms of the contracts. We use our credit adjudication process in deciding whether to enter into these arrangements, just as we do when extending credit in the form of a loan. We monitor off-balance sheet instruments to avoid undue concentrations in any geographic region or industry.
The maximum amount payable by BMO in relation to these credit instruments was approximately $75 billion at October 31, 2011 ($65 billion in 2010). However, this amount is not representative of our likely credit exposure or liquidity requirements for these instruments, as it does not take into account customer behaviour, which suggests that only a portion will utilize the facilities related to these instruments. It also does not take into account any amounts that could be recovered under recourse or collateralization provisions. Further information on these instruments can be found in Note 5 on page 129 of the financial statements.
For the credit commitments outlined in the preceding paragraphs, in the absence of an event that triggers a default, early termination by BMO may result in a breach of contract.
Variable Interest Entities (VIEs)
Our interests in VIEs are discussed primarily on pages 66 to 68 in the BMO-Sponsored Securitization Vehicles and Structured Investment Vehicles sections and on pages 71 to 72 in the Accounting for Variable Interest Entities section. A discussion of capital and funding trusts follows.
Capital and Funding Trusts
BMO Subordinated Notes Trust (SN Trust) was created to issue BMO Trust Subordinated Notes – Series A (SN Trust Notes – Series A), the proceeds of which were used to purchase a senior deposit note from BMO. As at October 31, 2011, $800 million of SN Trust Notes – Series A was outstanding. We hold all of the outstanding voting trust units in SN Trust and expect to do so at all times while the SN Trust Notes are outstanding. We are not required to consolidate SN Trust. BMO does not expect to terminate SN Trust while the SN Trust Notes are outstanding, unless SN Trust has sufficient funds to pay the redemption price on the SN Trust Notes and then only with the approval of OSFI. We provide a $30 million credit facility to SN Trust, of which $5 million had been drawn at October 31, 2011 ($5 million in 2010). We guarantee payment of the principal, interest, redemption price, if any, and any other amounts on the SN Trust Notes on a subordinated basis.
During 2009, BMO Capital Trust II (Trust II) was created to raise capital through the issuance of BMO Tier 1 Notes – Series A. As at October 31, 2011, $450 million of BMO Tier 1 Notes – Series A was outstanding. Trust II used the proceeds of the offering to purchase a senior deposit note from BMO. We are not required to consolidate Trust II.
Guarantees
Guarantees include contracts under which we may be required to make payments to a counterparty based on changes in the value of an asset, liability or equity security that the counterparty holds. Contracts under which we may be required to make payments if a third party does not perform according to the terms of a contract and contracts under which we provide indirect guarantees of indebtedness are also considered guarantees. In the normal course of business, we enter into a variety of guarantees, including standby letters of credit, backstop and other liquidity facilities and derivatives contracts or instruments (including, but not limited to, credit default swaps and written options), as well as indemnification agreements.
The maximum amount payable by BMO in relation to these guarantees was $62 billion at October 31, 2011 ($65 billion in 2010). However, this amount is not representative of our likely exposure, as it does not take into account customer behaviour, which suggests that only a portion of the guarantees will require payment. It also does not take into account any amounts that could be recovered through recourse and collateral provisions.
For a more detailed discussion of these agreements, please see Note 7 on page 132 of the financial statements.
Critical Accounting Estimates
The Notes to BMO’s October 31, 2011 Consolidated Financial Statements outline our significant accounting estimates. The following accounting estimates are considered particularly important, as they require significant judgments by management. We have established detailed policies and control procedures that are intended to ensure these judgments are well controlled, independently reviewed and consistently applied from period to period. We believe that our estimates of the value of BMO’s assets and liabilities are appropriate.
Acquisition of M&I
The bank recorded the assets acquired and liabilities assumed from M&I at their fair values on the date of acquisition. We followed our established procedures to determine the fair value of financial instruments such as securities and derivatives. See the Financial Instruments Measured at Fair Value section for further details. There were also other significant accounting estimates in the valuation of loans and deposits.
Loans
Significant judgment and assumptions were applied to determine the fair value of the M&I loan portfolio. Loans are either purchased performing loans or purchased credit impaired loans (PCI loans), both of which are recorded at fair value at the time of acquisition. This involves estimating the expected cash flows to be received and determining the discount rate applied to the cash flows from the loan portfolio. The timing and amount of cash flows include significant management judgment regarding key assumptions, including the probability of default, severity of loss, payment speeds and the valuation of collateral. All of these factors are inherently subjective and can result in significant changes in the cash flow estimates over the life of a loan. In determining the possible discount rates, we considered various factors including our cost to raise funds in the current market, the risk premium associated with the loans and the cost to service the portfolios.
Subsequent to the determination of the initial fair value, the purchased performing loans will be subject to the credit review processes
| | |
| 70 | | BMO Financial Group 194th Annual Report 2011 |
applied to bank originated loans. See Allowance for Credit Losses for further details.
PCI loans have experienced a deterioration of credit quality from origination to acquisition, and it is probable that the bank will be unable to collect all contractually required payments, including both principal and interest. Subsequent to the acquisition of a loan, we continue to estimate cash flows expected to be collected over the life of the loan. The measurement of expected cash flows involves assumptions and judgments consistent with those described above for determining the initial fair value. Changes in expected cash flows could result in the recognition of impairment or a recovery through provision for credit losses.
Deposits
M&I deposit liabilities were recorded at fair value at acquisition. The determination of fair value involves estimating the expected cash flows to be paid and determining the discount rate applied to the cash flows. The timing and amount of cash flows include significant management judgment regarding the likelihood of early redemption by the bank and the timing of withdrawal by the client. Discount rates were based on the prevailing rates paid by the bank on similar deposits at the date of acquisition.
Allowance for Credit Losses
The allowance for credit losses adjusts the value of loans to reflect their estimated realizable value. In assessing their estimated realizable value, we must rely on estimates and exercise judgment regarding matters for which the ultimate outcome is unknown. These include economic factors, developments affecting companies in particular industries and specific issues with respect to single borrowers. Changes in circumstances may cause future assessments of credit risk to be materially different from current assessments, which could require an increase or decrease in the allowance for credit losses.
One of our key performance measures is the provision for credit losses as a percentage of average net loans and acceptances. Over the past 10 years, for our Canadian peer group, the average annual ratio has ranged from a high of 1.24% in 2002 to a low of 0.17% in 2004.
This ratio varies with changes in the economy and credit conditions. If we were to apply these high and low ratios to average net loans and acceptances in 2011, our provision for credit losses would range from $2,314 million to $317 million. Our provision for credit losses in 2011 was $857 million.
Additional information on the process and methodology for determining the allowance for credit losses can be found in the discussion of credit risk on page 83 as well as in Note 4 on page 126 of the financial statements.
Financial Instruments Measured at Fair Value
BMO records securities and derivatives at their fair value. Fair value represents our estimate of the amount we would receive, or would have to pay in the case of a derivative liability, in a current transaction between willing parties. We employ a fair value hierarchy to categorize the inputs we use in valuation techniques to measure fair value. The extent of our use of quoted market prices (Level 1), internal models using observable market information (Level 2) and internal models without observable market information (Level 3) in the valuation of securities, derivative assets and derivative liabilities as at October 31, 2011, as well as a sensitivity analysis of our Level 3 financial instruments, is disclosed in Note 29 on page 171 of the financial statements.
Valuation models use general assumptions and market data, and therefore do not reflect the specific risks and other factors that would affect a particular instrument’s fair value. As a result, we incorporate certain adjustments when using internal models to establish fair values. These fair value adjustments take into account the estimated impact of credit risk, liquidity risk, valuation considerations, administrative costs and closeout costs. For example, the credit risk adjustment for derivative financial instruments incorporates credit risk into our determination of
fair values by taking into account factors such as the counterparty’s credit rating, the duration of the instrument and changes in credit spreads.
Valuation Product Control (VPC), a group independent of the trading lines of business, verifies the fair values at which financial instruments are recorded. For instruments that are valued using models, VPC identifies situations where valuation adjustments must be made to the model estimates to arrive at fair value.
The methodologies used for calculating these adjustments are reviewed on an ongoing basis to ensure that they remain appropriate. Significant changes in methodologies are made only when we believe that the change will result in better estimates of fair value.
Valuation Adjustments($ millions)
| | | | | | | | |
| As at October 31 | | 2011 | | | 2010 | |
Credit risk | | | 134 | | | | 109 | |
Liquidity risk | | | 21 | | | | 51 | |
Administrative costs | | | 10 | | | | 9 | |
Other | | | 60 | | | | 43 | |
| | | | 225 | | | | 212 | |
Valuation adjustments made to model estimates to arrive at fair value were higher in 2011. The decrease in the adjustment for credit risk was due to narrower relative credit spreads between our counterparties and BMO.
Accounting for Securitizations
When loans are securitized, we record a gain or loss on sale. In determining the gain or loss, management must estimate the net present value of expected future cash flows by relying on estimates of the amount of interest and fees that will be collected on the securitized assets, the yield to be paid to investors, the portion of the securitized assets that will be repaid before the scheduled maturity, credit losses, the fair value cost of servicing and the rate at which to discount these estimated future cash flows. Actual cash flows may differ significantly from those estimated by management. If management’s estimate of future cash flows were different, our gain on securitization recognized in income would also be different.
Additional information concerning accounting for securitizations, including a sensitivity analysis for key assumptions, is included in Note 8 on page 133 of the financial statements.
Accounting for Variable Interest Entities
In the normal course of business, BMO enters into arrangements with variable interest entities (VIEs). VIEs include entities for which the equity is considered insufficient to finance the entity’s activities or for which the equityholders do not have a controlling financial interest. We are required to consolidate VIEs if the investments we hold in these entities and/or the relationships we have with them result in us being exposed to a majority of their expected losses and/or being able to benefit from a majority of their expected residual returns.
We determine whether an entity is a VIE and whether BMO holds a variable interest in that VIE based primarily on quantitative analysis. We perform a variety of complex estimation processes involving qualitative and quantitative factors to calculate and analyze a VIE’s expected losses and expected residual returns. These processes involve estimating the future cash flows and performance of the VIE, analyzing the variability of those cash flows and allocating the expected losses and expected residual returns among the identified parties holding variable interests. The analysis enables us to identify the party that is exposed to a majority of the VIE’s expected losses and/or expected residual returns, and thus determine which party should consolidate the entity.
With respect to the credit protection vehicle Apex, the structured investment vehicles Links and Parkland and our U.S. multi-seller conduit, we will be required to consolidate these VIEs under IFRS effective November 1, 2010. Additional information regarding the accounting under IFRS can be found on page 73 in the Future Changes in Accounting Policies – IFRS section.
Under IFRS we are required to reconsider if consolidation is required when our obligation to absorb losses increases or we acquire
| | | | |
| BMO Financial Group 194th Annual Report 2011 | | | 71 | |
MANAGEMENT’S DISCUSSION AND ANALYSIS
decision-making abilities through contractual arrangements. Reconsideration events for our Canadian multi-seller conduits include the purchase by BMO of ABCP issued by the vehicles and the granting of additional liquidity facilities or credit enhancement. Since BMO regularly purchases and sells ABCP issued by our Canadian multi-seller conduits, we continually monitor our exposure to expected losses to ensure they do not approach consolidation thresholds.
Additional information concerning BMO’s involvement with variable interest entities is included on pages 71 and 72 as well as in Note 9 on page 136 of the financial statements.
Pension and Other Employee Future Benefits
BMO’s pension and other employee future benefits expense is calculated by our independent actuaries using assumptions determined by management. If actual experience differs from the assumptions used, pension and other employee future benefits expense could increase or decrease in future years. The expected rate of return on plan assets is a management estimate that significantly affects the calculation of pension expense. Our expected rate of return on plan assets is determined using the plan’s target asset allocation and estimated rates of return for each asset class. Estimated rates of return are based on expected returns from fixed-income securities, which take into consideration bond yields. An equity risk premium is then applied to estimate equity returns. Expected returns from other asset classes are established to reflect the risks of these asset classes relative to fixed-income and equity assets. The impact of changes in expected rates of return on plan assets is not significant for our other employee future benefits expense since only small amounts of assets are held in these plans.
Pension and other employee future benefits expense and obligations are also sensitive to changes in discount rates. We determine discount rates at each year end for our Canadian and U.S. plans using high-quality corporate bonds with terms matching the plans’ specific cash flows.
Additional information regarding our accounting for pension and other employee future benefits, including a sensitivity analysis for key assumptions, is included in Note 23 on page 158 of the financial statements.
Other Than Temporary Impairment
We have investments in securities issued or guaranteed by Canadian or U.S. governments, corporate debt and equity securities, mortgage-backed securities and collateralized mortgage obligations, which are classified as available-for-sale securities. We review available-for-sale and other securities at each quarter-end reporting period to identify and evaluate investments that show indications of possible impairment. An investment is considered impaired if an unrealized loss on the security represents impairment that is considered to be other than temporary. In making this assessment, we consider such factors as the type of investment, the length of time and extent to which its fair value has been below cost, the financial condition and near-term prospects of the issuer, and our intent and ability to hold the investment long enough to allow for any anticipated recovery. The decision to record a write-down, its amount and the period in which it is recorded could change if management’s assessment of those factors were different. We do not record impairment write-downs on debt securities when impairment is due to changes in market interest rates, since we expect to realize the full value of these investments by holding them until maturity or until they recover in value.
At the end of 2011, there were total unrealized losses of $52 million on securities for which cost exceeded fair value and an impairment write-down had not been recorded. Of this amount, $8 million related to securities for which cost had exceeded fair value for 12 months or more. These unrealized losses resulted from increases in market interest rates and not from deterioration in the creditworthiness of the issuer.
Additional information regarding our accounting for available-for-sale securities and other securities and the determination of fair value is included in Note 3 on page 122 of the financial statements.
Income Taxes
The provision for income taxes is calculated based on the expected tax treatment of transactions recorded in our Consolidated Statements of Income or Changes in Shareholders’ Equity. In determining the provision for income taxes, we interpret tax legislation in a variety of jurisdictions and make assumptions about the expected timing of the reversal of future tax assets and liabilities. If our interpretations differ from those of tax authorities or if the timing of reversals is not as expected, our provision for income taxes could increase or decrease in future periods. The amount of any such increase or decrease cannot be reasonably estimated.
Additional information regarding our accounting for income taxes is included in Note 24 on page 164 of the financial statements.
Goodwill and Intangible Assets
Goodwill is assessed for impairment at least annually. This assessment includes a comparison of the carrying value and the fair value of each group of businesses to verify that the fair value of the group is greater than its carrying value. If the carrying value were to exceed the fair value of the group, a more detailed goodwill impairment assessment would have to be undertaken. In determining fair value, we employ internal valuation models, such as discounted cash flow models, consistent with those used when we acquire businesses. These models are dependent on assumptions related to revenue growth, discount rates, synergies achieved on acquisition and the availability of comparable acquisition data. Changes in each of these assumptions would affect the determination of fair value for each of the business units in a different manner. Management must exercise judgment and make assumptions in determining fair value, and differences in judgments and assumptions could affect the determination of fair value and any resulting impairment write-down. At October 31, 2011, the estimated fair value of each of our groups of businesses was greater than its carrying value.
Intangible assets are amortized to income on either a straight-line or an accelerated basis over a period not exceeding 15 years, depending on the nature of the asset. There are no intangible assets with indefinite lives. We test intangible assets for impairment when circumstances indicate the carrying value may not be recoverable. No such impairment was identified for the years ended October 31, 2011, 2010 and 2009.
Additional information regarding the composition of goodwill and intangible assets is included in Note 13 on page 147 of the financial statements.
Insurance-Related Liabilities
Insurance claims and policy benefit liabilities represent current claims and estimates for future insurance policy benefits. Liabilities for life insurance contracts are determined using the Canadian Asset Liability Method, which incorporates best-estimate assumptions for mortality, morbidity, policy lapses, surrenders, future investment yields, policy dividends, administration costs and margins for adverse deviation. These assumptions are reviewed at least annually and updated to reflect actual experience and market conditions. The most significant impact on the valuation of a liability results from a change in the assumption for future investment yields. Future investment yields may be sensitive to variations in reinvestment interest rates and accordingly may affect the valuation of policy benefit liabilities. If the assumed yield were to increase by one percentage point, net income would increase by approximately $88 million. A reduction of one percentage point would lower net income by approximately $82 million.
Contingent Liabilities
BMO and its subsidiaries are involved in various legal actions in the ordinary course of business.
Contingent litigation loss provisions are recorded when it appears likely that BMO will incur a loss and the amount can be reasonably estimated. BMO’s management and internal and external experts are involved in assessing any such likelihood and estimating any amounts involved. The actual costs of resolving these claims may be substantially higher or lower than the amount of the provisions. Additional information regarding contingent liabilities can be found in Note 28 on page 170 of the financial statements.
| | |
| 72 | | BMO Financial Group 194th Annual Report 2011 |
Changes in Accounting Policies in 2011
There were no changes in accounting policies in 2011.
Future Changes in Accounting Policies – IFRS
Transition to International Financial Reporting Standards
Canadian public companies are required to prepare their financial statements in accordance with International Financial Reporting Standards (IFRS), as issued by the International Accounting Standards Board (IASB), for fiscal years beginning on or after January 1, 2011. For reporting periods commencing November 1, 2011, we will adopt IFRS as the basis for preparing our consolidated financial statements. We will report our financial results for the quarter ended January 31, 2012, prepared on an IFRS basis. We will also provide comparative data on an IFRS basis, including an opening balance sheet as at November 1, 2010 (transition date). Our preliminary opening balance sheet, as well as a summary of the expected impacts of the initial adoption of IFRS, is outlined below.
We have substantially completed our enterprise-wide project to transition to IFRS. We have completed the diagnostic review and assessment phase and the implementation and education phase of the project. We have also completed the development of controls and procedures necessary to restate our 2011 opening balance sheet and financial results on an IFRS basis and finalized our choices on the policy decisions available under IFRS. We have completed our preliminary restated opening balance sheet and we are in the process of completing the restatement of our 2011 financial results on an IFRS basis.
The main accounting changes that result from our adoption of IFRS are in the areas of pension and other employee future benefits, asset securitization, consolidation and accumulated other comprehensive loss on translation of foreign operations. The differences between BMO’s accounting policies and IFRS requirements associated with these areas, combined with our decisions on the optional exemptions from retroactive application of IFRS, will result in measurement and recognition differences on transition to IFRS. The net impact of these differences will be recorded in opening retained earnings, affecting shareholders’ equity, with the exception of the accumulated other comprehensive loss on translation of foreign operations, as this is already recorded in shareholders’ equity. These impacts will also extend to our capital ratios, with the exception of the change related to accumulated other comprehensive loss on translation of foreign operations, which will have no impact on our capital ratios.
The following information is provided to help readers of our financial statements to better understand the expected effects on our consolidated financial statements as a result of our adoption of IFRS. This information reflects our first-time adoption of transition elections under IFRS 1, the standard for first-time adoption, our accounting policy choices under IFRS and our preliminary restated opening balance sheet on an IFRS basis. The general principle under IFRS 1 is retroactive application, such that our opening balance sheet for the comparative year financial statements is to be restated as though BMO had always applied IFRS, with the net impact shown as an adjustment to opening retained earnings. However, IFRS 1 contains certain mandatory exceptions and permits certain optional exemptions from full retroactive application. In preparing our preliminary opening balance sheet in accordance with IFRS 1, we have applied certain of the optional exemptions and the mandatory exceptions from full retroactive application of IFRS as described below.
Exemptions from Full Retroactive Application Elected by BMO
BMO has elected to apply the following optional exemptions from full retroactive application:
| Ÿ | | Pension and other employee future benefits – We have elected to recognize all cumulative actuarial gains and losses, as at November 1, 2010, in opening retained earnings for all of our employee benefit plans. |
| Ÿ | | Business combinations – We have elected not to apply IFRS 3, the standard for accounting for business combinations, retroactively in accounting for business combinations that took place prior to November 1, 2010. |
| Ÿ | | Share-based payment transactions – We have elected not to go back and apply IFRS 2, the standard for accounting for share-based |
| | | payments, in accounting for equity instruments granted on or before November 7, 2002, and equity instruments granted after November 7, 2002, that have vested by the transition date. We have also elected not to go back and apply IFRS 2 in accounting for liabilities arising from cash-settled share-based payment transactions that were settled prior to the transition date. |
| Ÿ | | Cumulative translation differences – We have elected to reset the accumulated other comprehensive loss on translation of foreign operations to $nil at the transition date, with the adjustment recorded in opening retained earnings. |
| Ÿ | | Derecognition of financial assets and financial liabilities – We have elected to apply to our securitized loans the derecognition provisions of IAS 39, Financial Instruments: Recognition and Measurement prospectively in accounting for securitization transactions occurring on or after January 1, 2004. |
| Ÿ | | Designation of previously recognized financial instruments – We have elected to designate $3,477 million of Canada Mortgage Bonds as available-for-sale securities on the transition date. Available-for-sale securities are measured at fair value with unrealized gains and losses recorded in accumulated other comprehensive income (loss). These bonds were previously designated as held for trading and were measured at fair value with changes in fair value recorded in trading revenues. These bonds provided an economic hedge associated with the sale of the mortgages through a third-party securitization program under Canadian GAAP. Under IFRS, this economic hedge is no longer required as these mortgages will remain on our balance sheet. |
Mandatory Exceptions to Retroactive Application
BMO has applied the following mandatory exceptions to full retroactive application:
| Ÿ | | Hedge accounting – Only hedging relationships that satisfied the hedge accounting criteria of IFRS as of the transition date are recorded as hedges in our results under IFRS. |
| Ÿ | | Estimates – Hindsight was not used to create or revise estimates, and accordingly, the estimates previously made by BMO under Canadian GAAP are consistent with their application under IFRS. |
Accounting Policy Choices
BMO has selected the following accounting policies in the areas where IFRS provides alternative choices:
| Ÿ | | Pension and other employee future benefits – We have chosen to defer unrecognized market-related gains or losses on pension fund assets and the impact of changes in discount rates or of plan experience being different from management’s expectations on pension obligations (market-related amounts) on our balance sheet. We will amortize amounts in excess of 10% of our plan assets or benefit liability balances to pension expense over the expected remaining service period of active employees. This policy is consistent with our policy under current Canadian GAAP. The alternative choice available under IFRS was to record market-related amounts directly in equity. |
| Ÿ | | Merchant banking investments – We have chosen to designate certain investments at fair value through profit or loss. Subsequent changes in fair value will be recorded in income as they occur. Investments not designated at fair value through profit or loss will be recorded as either available-for-sale securities, equity-accounted investments or loans, depending on the characteristics of each investment. Under Canadian GAAP, we record all our merchant banking investments at fair value, with changes in fair value recorded in income as they occur. |
| Ÿ | | Joint venture investment – We have chosen to account for our joint venture investment using the proportionate consolidation method. This policy is consistent with our policy under current Canadian GAAP. The alternative choice available under IFRS was to account for joint venture investments using the equity method of accounting. |
| | | | |
| BMO Financial Group 194th Annual Report 2011 | | | 73 | |
MANAGEMENT’S DISCUSSION AND ANALYSIS
Reconciliation of Consolidated Balance Sheet under Canadian GAAP to Consolidated Balance Sheet under IFRS
The following is a reconciliation of our Consolidated Balance Sheet as reported in accordance with Canadian GAAP to the Preliminary Consolidated Balance Sheet we expect to report in accordance with IFRS as of November 1, 2010, the transition date. The net impact to shareholders’ equity as of October 31, 2011, as a result of the transition to IFRS, is not expected to be significantly different than the net impact to shareholders’ equity as of the transition date.
Consolidated Balance Sheet as at November 1, 2010
| | | | | | | | | | | | | | | | | | | | | | | | | | | | | | | | | | | | | | | | |
| (Canadian $ in millions) | | Canadian
GAAP
balances | | | Consolidation | | | Asset
securitization | | | Pension
and other
future
employee
benefits | | | Non-
controlling
interests | | | Translation
of net
foreign
operations | | | Reinsurance | | | Other | | | Total IFRS
adjustments | | | IFRS
balances | |
| | | | | | (a) | | | (b) | | | (c) | | | (d) | | | (e) | | | (f) | | | (g)–(r) | | | | | | | |
Assets | | | | | | | | | | | | | | | | | | | | | | | | | | | | | | | | | | | | | | | | |
Cash and cash equivalents | | | 17,368 | | | | 27 | | | | 65 | | | | – | | | | – | | | | – | | | | – | | | | – | | | | 92 | | | | 17,460 | |
Interest bearing deposits with banks | | | 3,186 | | | | – | | | | – | | | | – | | | | – | | | | – | | | | – | | | | – | | | | – | | | | 3,186 | |
Securities | | | 123,399 | | | | 6,638 | | | | (8,387 | ) | | | – | | | | – | | | | – | | | | – | | | | (141 | ) | | | (1,890 | ) | | | 121,509 | |
Securities borrowed or purchased under resale agreements | | | 28,102 | | | | – | | | | – | | | | – | | | | – | | | | – | | | | – | | | | – | | | | – | | | | 28,102 | |
Loans | | | 178,521 | | | | (1,975 | ) | | | 30,595 | | | | – | | | | – | | | | – | | | | – | | | | 90 | | | | 28,710 | | | | 207,231 | |
Allowance for credit losses | | | (1,878 | ) | | | 56 | | | | (138 | ) | | | – | | | | – | | | | – | | | | – | | | | (4 | ) | | | (86 | ) | | | (1,964 | ) |
Other assets | | | 62,942 | | | | (628 | ) | | | (34 | ) | | | (1,496 | ) | | | – | | | | – | | | | 873 | | | | 67 | | | | (1,218 | ) | | | 61,724 | |
Total assets | | | 411,640 | | | | 4,118 | | | | 22,101 | | | | (1,496 | ) | | | – | | | | – | | | | 873 | | | | 12 | | | | 25,608 | | | | 437,248 | |
Liabilities | | | | | | | | | | | | | | | | | | | | | | | | | | | | | | | | | | | | | | | | |
Deposits | | | 249,251 | | | | 2,687 | | | | (987 | ) | | | – | | | | – | | | | – | | | | – | | | | – | | | | 1,700 | | | | 250,951 | |
Other liabilities | | | 135,933 | | | | 201 | | | | 23,276 | | | | (277 | ) | | | (1,338 | ) | | | – | | | | 873 | | | | (4 | ) | | | 22,731 | | | | 158,664 | |
Subordinated debt | | | 3,776 | | | | 889 | | | | – | | | | – | | | | – | | | | – | | | | – | | | | – | | | | 889 | | | | 4,665 | |
Capital trust securities | | | 800 | | | | 445 | | | | – | | | | – | | | | – | | | | – | | | | – | | | | (59 | ) | | | 386 | | | | 1,186 | |
| | | | | | | | | | | | | | | | | | | | | | | | | | | | | | | | | | | | | | | | |
Shareholders’ Equity | | | | | | | | | | | | | | | | | | | | | | | | | | | | | | | | | | | | | | | | |
Share capital | | | 9,498 | | | | – | | | | – | | | | – | | | | – | | | | – | | | | – | | | | – | | | | – | | | | 9,498 | |
Contributed surplus | | | 92 | | | | – | | | | – | | | | – | | | | – | | | | – | | | | – | | | | (1 | ) | | | (1 | ) | | | 91 | |
Retained earnings | | | 12,848 | | | | (104 | ) | | | 37 | | | | (1,219 | ) | | | – | | | | (1,135 | ) | | | – | | | | (147 | ) | | | (2,568 | ) | | | 10,280 | |
Accumulated other comprehensive income (loss) | | | (558 | ) | | | – | | | | (225 | ) | | | – | | | | – | | | | 1,135 | | | | – | | | | 60 | | | | 970 | | | | 412 | |
Total shareholders’ equity | | | 21,880 | | | | (104 | ) | | | (188 | ) | | | (1,219 | ) | | | – | | | | – | | | | – | | | | (88 | ) | | | (1,599 | ) | | | 20,281 | |
Non-controlling interest in subsidiaries | | | – | | | | – | | | | – | | | | – | | | | 1,338 | | | | – | | | | – | | | | 163 | | | | 1,501 | | | | 1,501 | |
Total equity | | | 21,880 | | | | (104 | ) | | | (188 | ) | | | (1,219 | ) | | | 1,338 | | | | – | | | | – | | | | 75 | | | | (98 | ) | | | 21,782 | |
Total liabilities and shareholders’ equity | | | 411,640 | | | | 4,118 | | | | 22,101 | | | | (1,496 | ) | | | – | | | | – | | | | 873 | | | | 12 | | | | 25,608 | | | | 437,248 | |
The differences described in footnotes (a) through (f) below are considered significant for our opening balance sheet. The differences described in footnotes (g) through (r) are not considered individually significant.
The IFRS consolidation requirements primarily impact entities defined as variable interest entities (VIEs) under Canadian GAAP or special purpose entities (SPEs) under IFRS with which BMO has entered into arrangements in the normal course. Under Canadian GAAP, the conclusion as to whether an entity should be consolidated is determined by using three different models: voting rights, VIEs and qualifying special purpose entities (QSPEs). Under the voting rights model, ownership of the majority of the voting shares leads to consolidation, unless control does not rest with the majority owners. Under the VIE model, VIEs are consolidated if the investments we hold in these entities or the relationships we have with them result in our being exposed to the majority of their expected losses, being able to benefit from the majority of their expected returns, or both. Under the QSPE model, an entity that qualifies as a QSPE is not consolidated. Under IFRS, an entity is consolidated if it is controlled by the reporting company, as determined under the criteria contained in the IFRS consolidated and separate financial statements standard (IAS 27) and, where appropriate, SIC-12 (an interpretation of IAS 27). As with Canadian GAAP, ownership of the majority of the voting shares leads to consolidation, unless control does not rest with the majority owners. For an SPE, our analysis considers whether the activities of the SPE are conducted on our behalf, our exposure to the SPE’s risks and benefits, our decision-making powers over the SPE, and
whether these considerations demonstrate that we, in substance, control the SPE and therefore must consolidate it. There is no concept of a QSPE under IFRS.
Under IFRS we are required to consolidate our Canadian credit protection vehicle, our U.K. structured investment vehicles (SIVs), our U.S. customer securitization vehicle, BMO Capital Trust II and BMO Subordinated Notes Trust. Under Canadian GAAP, we are not required to consolidate these VIEs. For five of our eight Canadian customer securitization vehicles, the requirements for consolidation were not met under IFRS, a result that is consistent with the accounting treatment for the vehicles under Canadian GAAP.
Information on all our VIEs, including total assets, our exposure to loss and our assessment of the consolidation requirement under Canadian GAAP, is included in Note 9 on page 136 of the financial statements. Information on BMO Capital Trust II and BMO Subordinated Notes Trust is included in Notes 17 and 18 on pages 150 and 151 of the financial statements.
Securitization primarily involves the sale of loans originated by the bank to off-balance sheet entities or trusts (securitization programs). Under Canadian GAAP, we account for transfers of loans to our securitization programs and to third-party securitization programs as sales when control over the loans is given up and consideration other than notes issued by the securitization vehicle has been received. Under IFRS, financial assets are derecognized
| | |
| 74 | | BMO Financial Group 194th Annual Report 2011 |
only when substantially all risks and rewards have been transferred as determined under the derecognition criteria contained in the IFRS financial instruments standard (IAS 39). Control is only considered when substantially all risks and rewards have been neither transferred nor retained.
Under IFRS, credit card loans and mortgages sold through these securitization programs do not qualify for derecognition as we have determined that the transfer of these loans and mortgages has not resulted in the transfer of substantially all the risks and rewards. This has resulted in the associated assets and liabilities being recognized on our Consolidated Balance Sheet and the gains previously recognized in income under Canadian GAAP being reversed as a reduction to retained earnings as of the transition date. Under IFRS, the credit card loans and mortgages sold through our securitization vehicles and through the Canada Mortgage Bond program and to the National Housing Act Mortgage-Backed Securities program, will remain on our balance sheet. Under Canadian GAAP, the credit card loans and mortgages sold through these programs were removed from our balance sheet.
Under Canadian GAAP, mortgages converted into mortgage-backed securities that have not yet been sold to one of the securitization programs are recorded at fair value as available-for-sale securities, with all mark–to-market adjustments recorded in accumulated other comprehensive income (loss). Under IFRS, these mortgages are classified as loans and recorded at amortized cost; the associated mark-to-market adjustments recorded in accumulated other comprehensive income (loss) under Canadian GAAP are reversed on the November 1, 2011, transition date.
Additional information on our asset securitizations is included in Note 8 on page 133 of the financial statements.
| | (c) | Pension and other employee future benefits |
Actuarial gains and losses consist of market-related gains and losses on pension fund assets and the impact of changes in discount rates and other assumptions or of plan experience being different from management’s expectations for pension obligations. Under Canadian GAAP, these amounts are deferred and only amounts in excess of 10% of our plan asset or benefit liability balances are recorded in pension expense over the expected remaining service period of active employees. Under IFRS, we elected to recognize all cumulative actuarial gains and losses as at November 1, 2010, in opening retained earnings for all of our employee benefit plans.
| | (d) | Non-controlling interests |
Under Canadian GAAP, non-controlling interests in subsidiaries are reported as other liabilities. Under IFRS, non-controlling interests in subsidiaries are reported as equity. This difference will have no impact on our capital ratios or return on shareholders’ equity.
| | (e) | Translation of net foreign operations |
We have elected to reset the accumulated other comprehensive loss on translation of net foreign operations to $nil at the transition date, with the adjustment recorded in opening retained earnings. This difference will have no impact on our capital ratios or return on shareholders’ equity.
Under Canadian GAAP, reinsurance recoverables related to our life insurance business are offset against the related insurance liabilities. Under IFRS, reinsurance recoverables and insurance liabilities are presented on a gross basis on our balance sheet.
The differences described in footnotes (g) through (r) below are not considered individually significant for our opening balance sheet and have been quantified and presented in aggregate as Other in the table on the preceding page.
Under Canadian GAAP, impaired loans are written off in full when there is no realistic possibility of recovery, or to recoverable value if
collateral exists. Credit card loans are written off when principal or interest payments are 180 days past due. Consumer instalment loans, other personal loans and some small business loans are classified as impaired when principal and interest payments are 180 days past due and are normally written off when they are one year past due. Under IFRS, BMO will continue to write off loans on a basis consistent with the accounting under Canadian GAAP except that when estimated future recoveries on these written-off loans can reasonably be estimated on a portfolio basis, an asset equal to the present value of the future cash flows will be recognized under IFRS. This difference will not have a material impact on our opening retained earnings.
Under Canadian GAAP, gains or losses from sale-leaseback transactions are deferred and amortized over the lease term regardless of the type of lease that we enter into. Under IFRS, if the new lease is an operating lease and the sale took place at fair value, the resulting gains or losses from the sale-leaseback transaction are recognized immediately in income. This difference will not have a material impact on opening retained earnings on transition.
| | (i) | Stock-based compensation |
Under Canadian GAAP, for grants of stock options with graded vesting, such as an award that vests 25% per year over four years, an entity can elect to treat the grant as one single award or to treat each tranche (i.e. the 25% portion that vests each year) as a separate award with a different vesting period. BMO elected to treat these stock option grants as one single award under Canadian GAAP, and the fair value of the award was recognized on a straight-line basis over the vesting period. Under IFRS, each tranche must be treated as a separate award and the fair value of each tranche must be recognized over its respective vesting period. This difference will not have a material impact on our opening retained earnings.
| | (j) | Loan origination costs |
Under Canadian GAAP, loan origination costs are deferred and amortized over the term of the resulting loan. Under IFRS, only loan origination costs that are directly attributable and incremental to the origination of a loan can be deferred and amortized over the term of the resulting loan. This difference will result in a $41 million decrease in opening retained earnings on transition.
Under Canadian GAAP, it is BMO’s practice to expense transaction costs on deposit liabilities. Under IFRS, direct and incremental transaction costs on deposit liabilities are recorded as a reduction of their initial value and amortized over the term of the deposit liability. This difference will not have a material impact on our opening retained earnings.
| | (l) | Available-for-sale securities |
Under Canadian GAAP, available-for-sale securities are recorded at amortized cost if their sale is restricted. Under IFRS, available-for-sale securities are recorded at fair value even if their sale is restricted. This difference will not have a material impact on our opening retained earnings.
| | (m) | Premises and equipment |
Canadian GAAP does not require that significant components of premises and equipment be amortized separately. Under IFRS, significant components of premises and equipment are amortized separately. This difference will not have a material impact on opening retained earnings on transition.
| | (n) | Customer loyalty programs |
Under Canadian GAAP, we record revenues and expenses related to our reward programs on a net basis. Under IFRS, we are required to record revenues and expenses related to certain of our reward programs on a gross basis. This difference will not have a material impact on our opening retained earnings.
| | | | |
| BMO Financial Group 194th Annual Report 2011 | | | 75 | |
MANAGEMENT’S DISCUSSION AND ANALYSIS
We elected not to apply IFRS 3 retroactively to business combinations that took place prior to the transition date. Consequently, business combinations concluded prior to November 1, 2010, have not been restated and the carrying amount of goodwill under IFRS as of November 1, 2010, is equal to the carrying amount under Canadian GAAP as of that date.
For the acquisition of M&I that occurred in fiscal 2011, our comparative year, we will make the following adjustments:
Measurement of purchase price
Under Canadian GAAP, the purchase price is based on an average of the market price of the shares over a reasonable period before and after the date the terms of the acquisition are agreed to and announced. Under IFRS, the purchase price is based on the market price of the shares at the closing date of the transaction. As a result, goodwill and common shares will be increased by $142 million to reflect the remeasurement of the BMO common shares issued as consideration for the M&I acquisition.
Acquisition costs
Under Canadian GAAP, acquisition costs are capitalized and classified as goodwill. IFRS requires acquisition costs to be expensed. As a result, goodwill will be reduced by $82 million.
| | (p) | Merchant banking investments |
Under Canadian GAAP, our merchant banking investments are accounted for at fair value, with changes in fair value recorded in income as they occur. Under IFRS, we will elect as of the transition date to designate certain of these investments at fair value through profit or loss. Subsequent changes in fair value will be recorded in income as they occur. Merchant banking investments that we have not designated at fair value through profit or loss will be accounted for as either available-for-sale securities, investments accounted for using the equity method of accounting, or loans, depending on the characteristics of each investment. This difference will result in a $33 million decrease in opening retained earnings on transition.
| | (q) | Compound financial instruments |
Under Canadian GAAP, Capital Trust Securities Series B and C issued through BMO Capital Trust are classified as liabilities. Under IFRS, these Capital Trust Securities are classified as compound instruments comprising both a liability and equity component. The equity component is due to certain payment features in these instruments that do not create an unavoidable obligation to pay cash. This difference will not have a material impact on our opening retained earnings.
| | (r) | Translation of preferred shares issued by a foreign operation |
Under Canadian GAAP, preferred shares held by non-controlling interests in a self-sustaining foreign operation are translated at the current rate. IFRS requires that equity instruments of foreign operations be translated at the historical rate. This difference will not have a material impact on opening retained earnings on transition.
Impact of the Adoption of IFRS on our Future Earnings
We do not expect that the adoption of IFRS will have a significant impact on our future earnings, with the possible exception of volatility associated with the consolidation of our structured investment vehicles. BMO has elected to value the assets and liabilities of our structured investment vehicles at fair value as permitted under IFRS, with changes in fair value recorded in income as they occur. Changes in the fair value of the assets of the structured investment vehicles will be offset in part by changes in the fair value of the subordinated capital notes payable to third parties. We will have exposure to accounting losses when the fair value of the assets in a reporting period declines more than the fair value of the capital notes and exposure to accounting gains when the fair value of the assets recovers more than that of the capital notes. The impact on quar-
terly net income when results are restated on an IFRS basis for 2011 will be within a range of approximately a $100 million loss to a $100 million gain. The risk of volatility in net income is expected to reduce as the assets held by the structured investment vehicles mature and the loan is repaid. During fiscal 2011, the loans outstanding declined from $5.1 billion to $2.9 billion and total assets declined from $5.2 billion to $2.9 billion. Based on their par value, we expect that 18% of the assets will mature (or be redeemed) in fiscal 2012, 17% in fiscal 2013, 11% in fiscal 2014, 20% in fiscal 2015 and 34% between fiscal 2016 and 2028. BMO believes that the first-loss protection provided by the subordinated capital notes continues to exceed future expected losses, and as a result, any gains or losses recognized in earnings should offset
over time. Additional information on the SIVs is included in Note 9 on page 136 of the financial statements.
Future Replacement or Revision of Certain IFRS Standards
Financial Instruments
The IASB has released IFRS 9, a new standard for the classification and measurement of financial assets and financial liabilities. This is the first phase of a three-phase project to replace the current standard for accounting for financial instruments. The new standard specifies that financial assets are measured at either amortized cost or fair value on the basis of the reporting entity’s business model for managing the financial assets and the contractual cash flow characteristics of the financial assets. The classification and measurement of financial liabilities remain generally unchanged; however, fair value changes attributable to changes in the credit risk for financial liabilities designated at fair value through profit or loss are to be recorded in other comprehensive income unless the treatment would create or enlarge an accounting mismatch in profit or loss. These amounts are not subsequently reclassified to income but may be transferred within equity. The remaining change in the fair value of the liability continues to be recorded in income. The other phases of this project, which are currently under development, address impairment and hedge accounting. The IASB has tentatively decided that the effective date of this new standard will be deferred for two years from the originally proposed effective date, which will make it effective for BMO on November 1, 2015. We are assessing the impact of this new standard on our future financial results in conjunction with the completion of the other phases of the IASB’s financial instruments project.
Employee Benefits
The IASB has revised the standard on employee benefits. Under the new standard, service costs and net interest income (expense), which is calculated by applying the discount rate to the net-benefit asset (liability), are recorded in income. As a result, a funding deficit will result in interest expense and a funding surplus will result in interest income, reflecting the financing effect of the amount owed to or from the plan. Under the prior standard, interest income could be earned on a plan with a funding deficit if the expected return on assets exceeded the interest cost on the benefit liability. Actuarial gains and losses, consisting of market-related gains or losses on pension fund assets and the impact of changes in discount rates or assumptions or of plan experience being different from management’s expectations for pension obligations will be recognized immediately in equity and may no longer be deferred and amortized. This new standard is effective for BMO on November 1, 2013. We are currently assessing the impact of this revised standard on our future financial results.
Fair Value Measurement
The IASB has issued a new standard for fair value measurement that is effective for BMO’s interim and annual financial statements beginning on November 1, 2013. The standard provides a common definition of fair value and establishes a framework for measuring fair value. We do not expect this new standard to have an impact on how we determine fair value.
| | |
| 76 | | BMO Financial Group 194th Annual Report 2011 |
Consolidated Financial Statements
The IASB has issued a new standard on consolidation that replaces IAS 27, Consolidated and Separate Financial Statements and SIC-12, Consolidation – Special Purpose Entities. This new standard provides a single consolidation model that identifies control as the basis for consolidation for all types of entities. This new standard is effective for BMO on November 1, 2013. We are currently assessing the impact of this revised standard on our future financial results.
Investments in Associates and Joint Ventures
The IASB has amended IAS 28 to require that investments in joint ventures be accounted for using the equity method. This new standard is effective for BMO on November 1, 2013. This new standard will not have a significant impact on future financial results.
This Future Changes in Accounting Policies – IFRS section contains forward-looking statements. Please see the Caution Regarding Forward-Looking Statements.
Management’s Annual Report on Disclosure Controls and Procedures and Internal Control over Financial Reporting
Disclosure Controls and Procedures
Disclosure controls and procedures are designed to provide reasonable assurance that all relevant information is gathered and reported to senior management, including the President and Chief Executive Officer (CEO) and the Executive Vice-President and Chief Financial Officer (CFO), on a timely basis so that appropriate decisions can be made regarding public disclosure.
An evaluation of the effectiveness of the design and operation of our disclosure controls and procedures was conducted as at October 31, 2011, by BMO Financial Group’s management under the supervision of the CEO and the CFO. Based on this evaluation, the CEO and the CFO have concluded that, as at October 31, 2011, our disclosure controls and procedures, as defined in Canada by National Instrument 52-109, Certification of Disclosure in Issuers’ Annual and Interim Filings, and in the United States by Rule 13a-15(e) under theSecurities Exchange Act of 1934 (the Exchange Act), are effective.
Internal Control over Financial Reporting
Internal control over financial reporting is designed to provide reasonable assurance regarding the reliability of financial reporting and the preparation of financial statements in accordance with Canadian generally accepted accounting principles and the requirements of the Securities and Exchange Commission in the United States, as applicable. Management is responsible for establishing and maintaining adequate internal control over financial reporting for BMO Financial Group.
BMO’s internal control over financial reporting includes policies and procedures that: pertain to the maintenance of records that, in reasonable detail, accurately and fairly reflect the transactions and dispositions of the assets of BMO; provide reasonable assurance that transactions are recorded as necessary to permit preparation of the financial statements in accordance with Canadian generally accepted accounting principles and the requirements of the Securities and Exchange Commission in the
United States, as applicable, and that receipts and expenditures of BMO are being made only in accordance with authorizations by management and directors of BMO; and provide reasonable assurance regarding prevention or timely detection of the unauthorized acquisition, use or disposition of BMO’s assets that could have a material effect on the financial statements.
Because of its inherent limitations, internal control over financial reporting can provide only reasonable assurance and may not prevent or detect misstatements. Furthermore, projections of any evaluation of effectiveness to future periods are subject to the risk that controls may become inadequate because of changes in conditions, or that the degree of compliance with the policies or procedures may deteriorate.
BMO Financial Group’s management, under the supervision of the CEO and the CFO, has evaluated the effectiveness of our internal control over financial reporting using the framework and criteria established inInternal Control – Integrated Framework, issued by the Committee of Sponsoring Organizations of the Treadway Commission. Based on this evaluation, management has concluded that internal control over financial reporting was effective as at October 31, 2011.
BMO Financial Group’s auditors, KPMG LLP (Shareholders’ Auditors), an independent registered public accounting firm, has issued an audit report on our internal control over financial reporting. This audit report appears on page 113.
Changes in Internal Control over Financial Reporting
There were no changes in our internal control over financial reporting in fiscal 2011 that have materially affected, or are reasonably likely to materially affect, our internal control over financial reporting. The transition to International Financial Reporting Standards (IFRS) and the ongoing preparation of financial statements in accordance with IFRS did not materially change the bank’s internal control over financial reporting.
Shareholders’ Auditors’ Services and Fees
Pre-Approval Policies and Procedures
As part of BMO Financial Group’s corporate governance practices, the Board of Directors oversees the strict application of BMO’s corporate policy limiting the services provided by the Shareholders’ Auditors that are not related to their role as auditors. All services provided by the Shareholders’ Auditors are pre-approved by the Audit Committee as they arise, or through an annual pre-approval of amounts for specific types of services. All services comply with our Auditor Independence Policy, as well as professional standards and securities regulations governing auditor independence.
Shareholders’ Auditors’ Fees
Aggregate fees paid to the Shareholders’ Auditors during the fiscal years ended October 31, 2011 and 2010 were as follows:
| | | | | | | | |
| Fees ($ millions) (1) | | 2011 | | | 2010 | |
Audit fees | | | 13.8 | | | | 12.4 | |
Audit-related fees (2) | | | 0.8 | | | | 0.7 | |
Tax fees | | | – | | | | – | |
All other fees (3) | | | 0.2 | | | | – | |
Total | | | 14.8 | | | | 13.1 | |
| | (1) | The classification of fees is based on applicable Canadian securities laws and United States Securities and Exchange Commission definitions. |
| | (2) | Audit-related fees for 2011 and 2010 relate to fees paid for accounting advice, specified procedures on our Proxy Circular and other specified procedures. |
| | (3) | All other fees for 2011 and 2010 relate primarily to fees paid for reviews of compliance with regulatory requirements for financial information and reports on internal controls over services provided by various BMO Financial Group businesses. They also include costs of translation services. |
| | | | |
| BMO Financial Group 194th Annual Report 2011 | | | 77 | |
MANAGEMENT’S DISCUSSION AND ANALYSIS
Enterprise-Wide Risk Management
As a diversified financial services company active in banking, investment, insurance and wealth management services, we are exposed to a variety of risks that are inherent in carrying out our business activities. Having an integrated and disciplined approach to risk management is integral to our business. In order to achieve prudent and measured risk-taking, we are guided by an integrated risk management framework in our daily business activities and planning process. Enterprise Risk and Portfolio Management (ER&PM) develops our risk appetite, risk policies and limits, and provides independent review and oversight across the enterprise on risk-related issues.
| | |

| | “Effective risk management is seen as a defining characteristic of BMO, allowing us to continually deliver solid risk performance.” Surjit Rajpal Executive Vice-President and Chief Risk Officer BMO Financial Group |
Strengths and Value Drivers
| Ÿ | | Effective independent risk management practices and oversight. |
| Ÿ | | Comprehensive risk management framework and approach, addressing all risks in the organization. |
| Ÿ | | Strong risk culture and disciplined risk management approach. |
| Ÿ | | Continued improvement in the quality and performance of our credit portfolios, which are in line with our peers. |
| Ÿ | | Prudent risk management practices, including close monitoring of all problem portfolios to maximize recoveries. |
| Ÿ | | Effective engagement with our lines of business that allows us to appropriately understand and properly manage risk. |
Challenges
| Ÿ | | Volatile global economic conditions causing heightened uncertainty. |
| Ÿ | | Continuing integration of acquired businesses and harmonization of risk management practices. |
| Ÿ | | Increasing competitive pressures. |
| Ÿ | | Changing and increasingly complex regulatory environment. |
Our Functional Groups
Central Risk Group provides independent oversight and support in the establishment of enterprise-wide risk management policies, infrastructure and processes, as well as centralized management of operational risk groups across the enterprise.
Operating Group Risk Areas provide integrated risk oversight to our business groups in the management of risk in support of the execution of our business strategies.
Our Priorities
| | Ÿ | | Enhance the risk management function and ensure consistent practice across the enterprise. | |
| | Ÿ | | Continue to embed our strong risk culture throughout the enterprise, including our acquired businesses. | |
| | Ÿ | | Work with the operating groups to support sound business initiatives and growth within our risk appetite. | |
| | Ÿ | | Maximize the value of our impaired loans and effectively manage problem accounts. | |
| | Ÿ | | Maintain effective relationships with our regulators. | |
| | Ÿ | | Foster a high-performance culture that continually focuses on strengthening the capabilities of our risk management professionals. | |
Our Path to Differentiation
| | Ÿ | | Promote excellence in risk management as a defining characteristic of BMO, both internally and externally. | |
| | Ÿ | | Employ a three-lines-of-defence approach to risk management. This approach stipulates that operating groups own the risk in their operations as a first line of defence, that ER&PM and other Corporate Support areas provide independent oversight as a second line of defence, and that Corporate Audit provides a third line of defence. | |
| | Ÿ | | Within our independent oversight framework and the limits of our risk appetite, contribute to the enterprise’s customer focus. | |
| | Ÿ | | Encourage continuous learning by our risk professionals through designing and offering educational training programs in risk management. | |
| | Ÿ | | Provide leadership in the management of enterprise risk and emerging risk-related industry concerns. | |
| | | | | | | | | | | | | | | | | | | | | | | | | | | | |
| | | Key Performance
Indicators | | 2011 | | | 2010 | | | 2009 | | | |
| | | | | BMO | | | Peer
avg. (1) | | | BMO | | | Peer avg. | | | BMO | | | Peer avg. | | | |
| | Specific PCL as a % of average net loans and acceptances | | | 0.44 | | | | 0.41 | | | | 0.61 | | | | 0.54 | | | | 0.85 | | | | 0.68 | | | |
| | Adjusted specific PCL as a % of average net loans and acceptances | | | 0.45 | | | | 0.41 | | | | 0.61 | | | | 0.54 | | | | 0.85 | | | | 0.68 | | | |
| | Total PCL as a % of average net loans and acceptances | | | 0.46 | | | | 0.40 | | | | 0.61 | | | | 0.52 | | | | 0.88 | | | | 0.82 | | | |
| | Total PCL as a % of average net loans and acceptances, excluding purchased portfolios | | | 0.44 | | | | 0.40 | | | | 0.61 | | | | 0.52 | | | | 0.88 | | | | 0.82 | | | |
| (1) | Calculated based on available information and estimates used. |
Adjusted results in this Enterprise-Wide Risk management section are non-GAAP and are discussed in the Non-GAAP Measures section on page 94.
Text and tables presented in a blue-tinted font in the Enterprise-Wide Risk Management section of the MD&A form an integral part of the 2011 annual consolidated financial statements. They present required GAAP disclosures as set out by the Canadian Institute of Chartered Accountants (CICA) in CICA Handbook section 3862, Financial Instruments – Disclosures, which permits cross-referencing between the notes to the financial statements and the MD&A. See Note 1 on page 119 and Note 6 on page 129 of the financial statements.
| | |
| 78 | | BMO Financial Group 194th Annual Report 2011 |

2011 Group Objectives and Achievements
Manage risk effectively throughout the economic cycle.
| Ÿ | | Delivered strong credit performance with year-over-year improvements in credit losses. |
| Ÿ | | Quality of the credit portfolio remained stable against key measures and is comparable to peer group portfolios. |
| Ÿ | | Managed market risk positions without significant volatility. |
| Ÿ | | Reduced exposure to certain run-off portfolios. |
Bring a continuous improvement mindset to risk management capabilities and maintain a strong risk culture across the enterprise.
| Ÿ | | Reinforced our risk management framework across the enterprise, including the three-lines-of-defence approach. |
| Ÿ | | Enhanced our operational and model risk management capabilities and frameworks. |
| Ÿ | | Advanced our talent management strategy by developing rotational programs to increase the transfer of professionals between risk management and business groups. |
Maximize the value of our impaired loans and problem accounts.
| Ÿ | | Enhanced management resourcing and expanded roles to more effectively manage problem portfolios. |
| Ÿ | | Leveraged the expertise of our special assets management group to address certain stressed real estate assets. |
Increase the articulation of our risk appetite across our lines of business.
| Ÿ | | Continued to embed an understanding of our risk appetite across the enterprise and increase risk transparency. |
| Ÿ | | Worked with our operating groups to apply our enterprise-wide risk appetite to detailed business group-specific levels and integrated this level of application into our strategic plan. |
| Ÿ | | Developed a concise approach to our risk management principles that was communicated and rolled out across the enterprise. |
Our Approach to Risk Management
| | Ÿ | | Diversify. Limit tail risk | |
| | Ÿ | | Maintain strong capital and liquidity | |
Framework and Risks
As a diversified financial services company active in a number of businesses, we are exposed to a variety of risks that are inherent in carrying out our business activities. As such, having a disciplined and integrated approach to managing risk is integral to our operations. Our risk management framework is intended to provide appropriate and independent risk oversight across the enterprise and is essential to building competitive advantage and stability for our enterprise.
Our strong, disciplined approach to risk management has been effective in withstanding the volatility the global economy has continued to experience over the past year. As a result, we were able to deliver strong results, serve our customers well and maintain our solid reputation in the marketplace, despite economic challenges. Our prudent risk strategy and risk management infrastructure equipped us to manage the downturn effectively. We continue to build upon our robust risk management foundation and pursue continuous improvement, while actively benchmarking our capabilities against risk management
best practices. We believe that the steps we have taken and the initiatives we continue to pursue position us appropriately to move forward and execute our strategy.
Our enterprise-wide risk management framework consists of our operating model and our risk governance structure, both of which are underpinned by our strong risk culture. Our robust framework provides for the management of each individual risk type: credit and counterparty, market, liquidity and funding, and operational. Other risk categories are also recognized within the framework, including insurance, legal and regulatory, business, model, strategic, reputation and environmental.
Our framework is predicated on the three-lines-of-defence approach to the management of risk, which is fundamental to our operating model. The operating groups are the first line of defence in our management of risk. They own the risk in their operations and are responsible for pursuing suitable business opportunities within our risk
| | | | |
| BMO Financial Group 194th Annual Report 2011 | | | 79 | |
MANAGEMENT’S DISCUSSION AND ANALYSIS
appetite. Each operating group must ensure that it is acting within its delegated risk-taking authority, as set out in our corporate risk policies and limits. Limits are set for the operating groups, each of which has effective processes and controls in place to enable it to operate within these limits.
The second line of defence is provided by ER&PM along with other Corporate Support areas. These groups provide independent oversight and establish corporate risk management policies, infrastructure, processes and practices that address all significant risks across the enterprise.
The third line of defence is our Corporate Audit Group, which monitors the efficiency and effectiveness of controls across various functions within our operations, including control, risk management and governance processes that support the enterprise.
Risk Governance
The foundation of our enterprise-wide risk management framework is a governance structure that includes a robust committee structure and a comprehensive set of corporate policies, which are approved by the Board of Directors or its committees, as well as supporting corporate standards and operating guidelines. This enterprise-wide risk management framework is governed through a hierarchy of committees and individual responsibilities as outlined in the following diagram.
All elements of our risk management framework are reviewed on a regular basis by the Risk Review Committee of the Board of Directors (RRC) to provide effective guidance for the governance of our risk-taking activities. In each of our operating groups, management monitors governance activities, controls, and management processes and procedures. Management also oversees their effective operation within our overall risk management framework. Individual governance committees establish and monitor further comprehensive risk management limits, consistent with and subordinate to the board-approved limits.
Limits and Authorities
Our risk limits are shaped by our guiding risk principles and risk appetite, and are reviewed and approved annually by the Board of Directors and/or board and management committees:
| Ÿ | | Credit and Counterparty Risk – limits on country, industry, portfolio/product segments, group and single-name exposures; |
| Ÿ | | Market Risk – limits on Market Value Exposure and stress exposures; |
| Ÿ | | Liquidity and Funding Risk – limits on minimum levels of liquid assets and maximum levels of asset pledging, as well as guidelines approved by senior management for liability diversification and credit and liquidity requirements; and |
| Ÿ | | Insurance Risk – limits on policy exposure and reinsurance arrangements. |
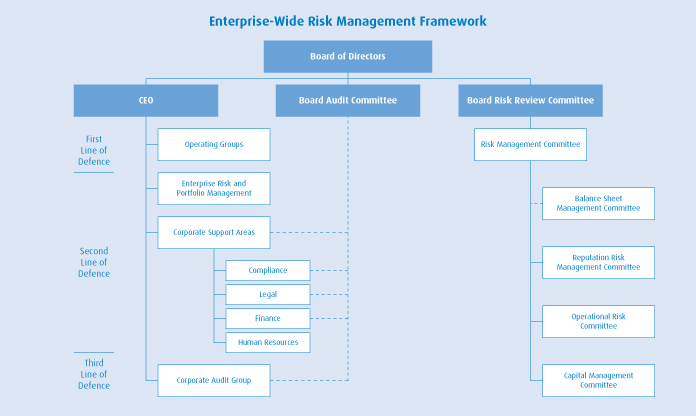
| | |
| 80 | | BMO Financial Group 194th Annual Report 2011 |
Board of Directors is responsible for the stewardship of BMO and supervising the management of BMO’s business and affairs. The board, either directly or through its committees, is responsible for oversight in the following areas: strategic planning, defining risk appetite, identification and management of risk, capital management, promoting a culture of integrity, governance, internal controls, succession planning and evaluation of senior management, communication, public disclosure and corporate governance.
Risk Review Committee of the Board of Directors (RRC) assists the board in fulfilling its oversight responsibilities in relation to BMO’s identification and management of risk, adherence to risk management corporate policies and procedures, and compliance with risk-related regulatory requirements.
Audit Committee of the Board of Directors assists the board in fulfilling its oversight responsibilities for the integrity of the bank’s financial reporting, effectiveness of the bank’s internal controls and performance of its internal and external audit functions.
President and Chief Executive Officer (CEO) is directly accountable to the board for all of BMO’s risk-taking activities. The CEO is supported by the Risk Management Committee and its sub-committees, as well as Enterprise Risk and Portfolio Management.
Chief Risk Officer (CRO) reports directly to the CEO and is responsible for providing independent review and oversight of enterprise-wide risks and leadership on risk issues, developing and maintaining a risk management framework and fostering a strong risk culture throughout the organization.
Risk Management Committee (RMC) is BMO’s senior risk committee. RMC reviews and discusses significant risk issues and action plans that arise in executing the enterprise-wide strategy. RMC provides risk oversight and governance at the highest levels of management. This committee is chaired by the CRO.
RMC Sub-committees have oversight responsibility for the risk and balance sheet impacts of management strategies, governance, risk measurement and contingency planning. RMC and its sub-committees provide oversight over the processes whereby the risks incurred across the enterprise are identified, measured, monitored and reported in accordance with policy guidelines and are held within delegated limits.
Enterprise Risk and Portfolio Management (ER&PM)provides independent oversight of the credit and counterparty, operational and market risk functions. It promotes consistency of risk management practices and standards across the enterprise. ER&PM facilitates a disciplined approach to risk-taking through the execution of independent transactional concurrence and portfolio management, policy formulation, risk reporting, stress testing, modelling, vetting and risk education responsibilities. This approach seeks to meet corporate objectives and to ensure that risks taken are consistent with BMO’s risk tolerance.
Operating Groups are responsible for managing risk within their respective areas. They exercise business judgment and seek to ensure that policies, processes and internal controls are in place and that significant risk issues are appropriately escalated to ER&PM.
The Board of Directors, based on recommendations from the RRC and the RMC, delegates the setting of risk limits to the President and CEO. The CEO then delegates more specific authorities to the CRO, who in turn delegates them to the Operating Group CROs. These delegated authorities allow the officers to set risk tolerances, approve geographic and industry sector exposure limits within defined parameters, and establish underwriting and inventory limits for trading and investment banking activities.
These delegated authorities are reviewed and approved annually by the Board of Directors on the recommendation of the RRC. The criteria whereby these authorities may be further delegated throughout the organization, as well as the requirements relating to documentation, communication and monitoring of delegated authorities, are set out in corporate policies and standards.
Risk Culture
At BMO, we believe that risk management is the responsibility of every employee within the organization. Our strong risk culture shapes the way we view and manage risk and is evident in the actions and behaviours of our employees and groups as they identify, interpret, discuss and make choices in the face of both opportunity and risk. Our strong risk culture encourages an engagement between ER&PM and the business groups that contributes to and enhances risk transparency through open and timely communication and sharing of information. This promotes an understanding of the risks inherent in our businesses, facilitates alignment of business strategies within the limits of our risk appetite and leads to sound business decision-making. We encourage the escalation of concerns regarding potential or emerging risks to senior management so that they can be evaluated and appropriately addressed. Additionally, we support a two-way rotation system that
allows employees to transfer between ER&PM and the business groups in order to effectively embed our strong risk culture across the organization.
To enhance our risk management capabilities and support the ongoing strengthening of our risk culture, we continue to add to our available learning opportunities and expand our delivery of risk training across the enterprise. Our educational programs are designed to foster a deep understanding of BMO’s capital and risk management frameworks across the enterprise, providing employees and management with the tools and awareness required to discharge their accountabilities for independent oversight regardless of their position in the organization. The principles that support our approach to risk management provide a consistent framework for our risk curriculum. This education strategy has been developed in partnership with our Institute for Learning, our risk management professionals, external risk experts and teaching professionals. Our credit training program, together with defined job descriptions, provides training and practice in sound risk management as a prerequisite to the granting of appropriate discretionary limits to qualified professionals.
Risk Principles
Risk-taking and risk management activities across the enterprise are guided by the following principles:
| Ÿ | | ER&PM provides independent oversight of risk-taking activities across the organization; |
| Ÿ | | management of risk is a responsibility at all levels of the organization, employing the three-lines-of-defence approach; |
| Ÿ | | ER&PM monitors our risk management framework to ensure that our risk profile is maintained within our established risk appetite and supported with adequate capital; |
| | | | |
| BMO Financial Group 194th Annual Report 2011 | | | 81 | |
MANAGEMENT’S DISCUSSION AND ANALYSIS
| Ÿ | | all material risks to which the enterprise is exposed are identified, measured, managed, monitored and reported; |
| Ÿ | | decision-making is based on a clear understanding of risk, accompanied by robust metrics and analysis; |
| Ÿ | | business activities are developed, approved and conducted within established risk limits and should generate a level of return appropriate to their risk profile; |
| Ÿ | | Economic Capital is used to measure and aggregate risk across all risk types and business activities to facilitate the incorporation of risk into the measurement of business returns; and |
| Ÿ | | compensation programs are designed and implemented to incorporate incentives that balance short-, medium- and long-term profit generation with the achievement of sustainable, non-volatile earnings growth, in line with our risk appetite. |
Risk Appetite
Our risk appetite identifies the amount and type of risk that we are willing to accept, given our guiding principles and our capital capacity. On an annual basis, senior management recommends our Risk Appetite Statement for approval by the RMC and the RRC. Our Risk Appetite Statement is defined in both quantitative and qualitative terms and, among other things, requires:
| Ÿ | | making decisions that are guided by principles of honesty, integrity and respect, as well as high ethical standards; |
| Ÿ | | taking risks that are transparent, understood, measured, monitored and managed; |
| Ÿ | | maintaining strong capital and liquidity and funding positions; |
| Ÿ | | subjecting new products and initiatives to a rigorous review and approval process to ensure their inherent risks are understood and can be effectively managed; |
| Ÿ | | providing adequate resources to ensure BMO’s risks are appropriately identified and understood; |
| Ÿ | | targeting a credit rating for the bank of AA– or better; |
| Ÿ | | minimizing exposure to low-probability tail event risks that could jeopardize the bank’s credit ratings, capital position or reputation; |
| Ÿ | | maintaining a diversified and above-average quality lending portfolio; |
| Ÿ | | Value at Risk (VaR) that is not outsized; |
| Ÿ | | business practices and policies that safeguard and protect our reputation at all times; and |
| Ÿ | | protecting the assets of BMO and BMO’s clients by maintaining a system of effective operational risk controls. |
Risk Review and Approval
Risk review and approval processes are established based on the nature, size and complexity of the risks involved. Generally, the process is a formal review and approval of various categories by either an individual or committee, independent of the originator. Delegated authorities and approvals by category are outlined below.
Portfolio transactions – Transactions are approved through risk assessment processes for all types of transactions, including dual signatory authorities for credit risk and transactional and position limits for market risk.
Structured transactions – New structured products and transactions with significant reputation, legal, accounting, regulatory or tax risk are reviewed by the Reputation Risk Management Committee or the Trading Products Risk Committee, as appropriate.
Investment initiatives – Documentation of risk assessments is formalized through our investment spending approval process, which is reviewed and approved by Corporate Support areas.
New products and services – Policies and procedures for the approval of new or modified products and services offered to our customers are reviewed and approved by Corporate Support areas, as well as other senior management committees including the Operational Risk Committee and Reputation Risk Management Committee, as appropriate.
Risk Reporting
Enterprise-level risk transparency and associated reporting are critical components of our framework and operating culture that help senior management, committees and the Board of Directors to effectively exercise their business management, risk management and oversight responsibilities. Internal reporting includes Enterprise Risk Chapters, which synthesize the key risks and associated metrics that the organization currently faces. The Enterprise Risk Chapters highlight our most significant risks, as well as top and emerging risks, to provide senior management and the Board of Directors with timely, actionable and forward-looking risk reporting on the significant risks our organization faces. This reporting includes material to facilitate assessments of these risks relative to our risk appetite and the relevant limits established within our framework, as well as information on emerging risks.
On a regular basis, reporting on risk is also provided to stakeholders, including regulators, external rating agencies and our shareholders, as well as to others in the investment community.
Risk-Based Capital Assessment
Two measures of risk-based capital are used by BMO. These are Economic Capital and Regulatory Capital. Both are aggregate measures of the risk that we undertake in pursuit of our financial targets. Our operating model provides for the direct management of each type of risk as well as the management of risks on an integrated basis. Economic Capital is our integrated internal measure of the risk underlying our business activities. It represents management’s estimate of the magnitude of economic losses that could occur if adverse situations arise, and allows returns to be adjusted for risks. Economic Capital is calculated for various types of risk – credit, market (trading and non-trading), operational and business – where measures are based on a time horizon of one year.
An enterprise-wide framework of scenario selection, analysis and stress testing assists in determining the relative magnitude of risks taken and the distribution of those risks across the enterprise’s operations under different conditions. Stress testing and scenario analysis measure the impact on our operations and capital of stressed but plausible operational, economic, credit and market events. Scenarios are designed in collaboration with our economists, risk management, finance and lines of business, based on historical or hypothetical events, a combination thereof, or significant economic developments. Economic variables derived from these scenarios are then applied to all significant and relevant risk-taking portfolios across the enterprise. As stipulated by the Basel II Accord, BMO also conducts stress testing of regulatory credit capital across all material portfolios using the Advanced Internal Ratings Based (AIRB) Approach calculation methodology.
We also conduct ongoing stress testing and scenario analysis designed to test BMO’s credit exposures to a specific industry, to several industries or to specific products that are highly correlated. These tests gauge the effect of various scenarios on default probabilities and loss rates in the portfolio under review. The results provide senior management with insight into the sensitivity of our exposures to the underlying risk characteristics of specific industries.
| | |
| 82 | | BMO Financial Group 194th Annual Report 2011 |
Credit and Counterparty Risk
|
Credit and counterparty risk is the potential for loss due to the failure of a borrower, endorser, guarantor or counterparty to repay a loan or honour another predetermined financial obligation. This is the most significant measurable risk that BMO faces. |
Credit and counterparty risk exists in every lending activity that BMO enters into, as well as in the sale of treasury and other capital markets products, the holding of investment securities and securitization activities. BMO’s robust and effective credit risk management begins with our experienced and skilled professional lending and credit risk officers, who operate in a dual control structure to authorize lending transactions. These individuals are subject to a rigorous lender qualification process and operate in a disciplined environment with clear delegation of decision-making authority, including individually delegated lending limits. Credit decision-making is conducted at the management level appropriate to the size and risk of each transaction in accordance with comprehensive corporate policies, standards and procedures governing the conduct of credit risk activities.
Credit risk is assessed and measured using risk-based parameters:
Exposure at Default (EAD)represents an estimate of the outstanding amount of a credit exposure at the time a default may occur. For off-balance sheet amounts and undrawn amounts, EAD includes an estimate of any further amounts that may be drawn at the time of default.
Loss Given Default (LGD)is the amount that may not be recovered in the event of a default, presented as a proportion of the exposure at default. LGD takes into consideration the amount and quality of any collateral held.
Probability of Default (PD)represents the likelihood that a credit obligation (loan) will not be repaid and will go into default. A PD is assigned to each account, based on the type of facility, the product type and customer characteristics. The credit history of the counterparty/portfolio and the nature of the exposure are taken into account in the determination of a PD.
Expected Loss (EL)is a measure representing the loss that is expected to occur in the normal course of business in a given period of time. EL is calculated as a function of Exposure at Default, Loss Given Default and Probability of Default.
Unexpected Loss (UL) is a measure of the amount by which actual losses may exceed expected loss in the normal course of business in a given period of time.
Under Basel II, there are three approaches available for the measurement of credit risk: Standardized, Foundation Internal Ratings Based and Advanced Internal Ratings Based (AIRB). We apply the AIRB Approach for calculations of credit risk in our portfolios, including portfolios of our subsidiary BMO Bankcorp, Inc. (now part of BMO Financial Corp.), for which we adopted the AIRB Approach as planned in 2011. The Standardized Approach is currently being used in the acquired M&I business, and plans are underway to adopt the AIRB Approach.
Risk Rating Systems
BMO’s risk rating systems are designed to assess and measure the risk of any exposure. The rating systems differ for the consumer and small business portfolios and the commercial and corporate portfolios.
Consumer and Small Business
The consumer and small business portfolios are made up of a diversified group of individual customer accounts and include residential mortgages, personal loans, and credit card and small business loans. These loans are managed in pools of homogeneous risk exposures. For these pools, credit risk models and decision support systems are developed using established statistical techniques and expert systems for underwriting and monitoring purposes. Adjudication models, behavioural scorecards, decision trees and expert knowledge are combined to produce optimal credit decisions in a centralized and automated environment. The characteristics of both the borrower and the credit obligation, along with past portfolio experience, are used to predict the credit performance of new accounts. These metrics are used to define the overall credit risk profile of the portfolio, predict future performance of existing accounts for ongoing credit risk management and determine both Economic Capital and Basel II regulatory capital. Every exposure is assigned risk parameters (PD, LGD and EAD) based on the performance of the pool, and these assignments are reviewed and updated monthly for changes. The PD risk profile of the AIRB Retail portfolio at October 31, 2011, was as follows:
| | | | | | | | |
| PD risk profile | | PD range | | | % of Retail EAD | |
Exceptionally low | | | £ 0.05% | | | | 39.8 | |
Very low | | | > 0.05% to 0.20% | | | | 22.6 | |
Low | | | > 0.20% to 0.75% | | | | 20.3 | |
Medium | | | > 0.75% to 7.0% | | | | 15.2 | |
High | | | > 7.0% to 99.9% | | | | 1.5 | |
Default | | | 100% | | | | 0.6 | |
Commercial and Corporate Lending
Within the commercial and corporate portfolios, we utilize an enterprise-wide risk rating framework that is applied to all of our sovereign, bank, corporate and commercial counterparties. This framework is consistent with the principles of Basel II, under which minimum regulatory capital requirements for credit risk are determined. One key element of this framework is the assignment of appropriate borrower risk ratings to help quantify potential credit risk. BMO’s risk rating framework establishes counterparty risk ratings using methodologies and rating criteria based on the specific risk characteristics of each counterparty. The resulting rating is then mapped to a probability of default over a one-year time horizon. As counterparties migrate between risk ratings, the probability of default associated with the counterparty changes.
We review our loans and acceptances on an ongoing basis to assess whether any loans should be classified as impaired and whether an allowance or write-off should be recorded. Future losses are estimated based on the expected proportion of the exposure that will be at risk if a counterparty default occurs, through an analysis of transaction-specific factors such as the nature and term of the credit obligation, collateral held and the seniority of our claim. For large corporate transactions, we also utilize unexpected loss models to assess the extent and correlation of risks before authorizing new exposures.
Material in blue-tinted font above is an integral part of the 2011 annual consolidated financial statements (see page 78).
| | | | |
| BMO Financial Group 194th Annual Report 2011 | | | 83 | |
MANAGEMENT’S DISCUSSION AND ANALYSIS
As evidenced in the table below, our internal risk rating system corresponds in a logical manner to those of the external rating agencies.
Borrower Risk Rating Scale
| | | | | | |
BMO rating | | Description of risk | | Moody’s Investors
Service implied
equivalent | | Standard & Poor’s
implied equivalent |
Investment grade | | | | |
I-1 to I-3 | | Undoubted to minimal | | Aaa to Aa3 | | AAA to AA- |
I-4 to I-5 | | Modest | | A1 to Baa1 | | A+ to BBB+ |
I-6 to I-7 | | Average | | Baa2 to Baa3 | | BBB to BBB- |
Non-investment grade | | | | |
S-1 to S-2 | | Acceptable | | Ba1 to Ba2 | | BB+ to BB |
S-3 to S-4 | | Marginal | | Ba3 to B1 | | BB- to B+ |
Watchlist | | | | | | |
P-1 | | Uncertain | | B2 | | B |
P-2 to P-3 | | Watchlist | | B3 to Ca | | B- to CC |
Default and impaired | | | | |
D-1 to D-2 | | Default/default and
impaired | | C | | D |
Policies and Standards
BMO’s credit risk management framework is built on governing principles defined in a series of corporate policies and standards, which flow through to more specific guidelines and procedures. These are reviewed on a regular basis to keep them current and consistent with BMO’s risk appetite. The structure, limits, collateral requirements, ongoing management, monitoring and reporting of our credit exposures are all governed by these credit risk management principles.
Credit Risk Governance
The RRC has oversight for the management of all risks faced by the enterprise, including credit risk. Operating practices include the ongoing monitoring of credit risk exposures and regular portfolio and sector reporting to the board and to senior management committees. Performing accounts are reviewed on a regular basis, with most commercial and corporate accounts reviewed at least annually. The credit review process provides an appropriate structure, including covenant monitoring for each account. The frequency of review is increased in accordance with the likelihood and size of potential credit losses, with deteriorating higher-risk situations referred to specialized account management groups for closer attention, when appropriate. Corporate Audit Group reviews and tests management processes and controls and samples credit transactions for adherence to credit terms and conditions, as well as to governing policies, standards and procedures. In addition, we carry out regular portfolio sector reviews, including stress testing and scenario analysis based on current, emerging or prospective risks.
Portfolio Management
BMO’s credit risk governance policies provide for an acceptable level of diversification. Limits are in place for several portfolio dimensions, including industry, country, product and single-name concentrations, as well as transaction-specific limits. At year end, our credit assets consisted of a well-diversified portfolio comprised of millions of clients, the majority of them consumers and small to medium-sized businesses.
BMO employs a number of measures to mitigate and manage credit risk. These measures include, but are not limited to, strong underwriting standards, qualified professional risk managers, a robust monitoring and review process, the redistribution of exposures, and the purchase or sale of insurance through guarantees or credit default swaps.
Total enterprise-wide outstanding credit exposures were $447 billion at October 31, 2011, comprised of $281 billion in Canada, $137 billion in the United States and $29 billion in other jurisdictions. Credit portfolio quality is discussed on page 41. Note 4 on page 126 of
the financial statements and Tables 11 to 19 on pages 106 to 109 provide details of BMO’s loan portfolios, impaired loans and provisions and allowances for credit losses. Our exposure to Europe by select European Countries is summarized in the Select Financial Instruments section on page 69.
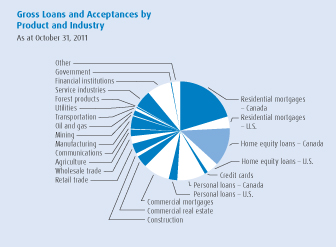
Collateral Management
Collateral is used for credit risk mitigation purposes and minimizes losses that would otherwise be incurred. Depending on the type of borrower, the assets available and the structure and term of the credit obligations, collateral can take various forms. Investment grade liquid securities are regularly pledged in support of treasury counterparty facilities. For corporate and commercial borrowers, collateral can take the form of pledges of the assets of a business, such as accounts receivable, inventory, machinery and real estate, or personal assets pledged in support of guarantees. On an ongoing basis, collateral is subject to regular valuation as prescribed in the relevant governing policies and standards, which incorporate set formulas for certain asset types in the context of current economic and market circumstances.
Allowance for Credit Losses
Across all loan portfolios, BMO employs a disciplined approach to provisioning and loan loss evaluation, with the prompt identification of problem loans being a key risk management objective. BMO maintains both specific and general allowances for credit losses. Specific allowances reduce the aggregate carrying value of credit assets for which there is evidence of deterioration in credit quality. We also maintain a general allowance in order to cover any impairment in the existing portfolio that cannot yet be associated with specific loans. Our approach to establishing and maintaining the general allowance is based on the guideline issued by our regulator, OSFI. The general allowance is reviewed on a quarterly basis and a number of factors are considered when determining the appropriate level of the general allowance. This includes a general allowance model that applies historical expected and unexpected loss rates, based on probabilities of default and loss given default parameters, to current balances. For business loans, these historical loss rates are associated with the underlying risk rating of the borrower, which is assigned at the time of loan origination, monitored on an ongoing basis and adjusted to reflect changes in underlying credit risk. These loss rates are further refined with regard to industry sector and credit product. For consumer loans, loss rates are based on historical loss experience for the different portfolios. Model results are then considered, along with the level of the existing allowance and management’s judgment regarding portfolio quality, business mix, and economic and credit market conditions, to determine the appropriate adjustment to the allowance.
Material in blue-tinted font above is an integral part of the 2011 annual consolidated financial statements (see page 78).
| | |
| 84 | | BMO Financial Group 194th Annual Report 2011 |
Market Risk
Market risk is the potential for adverse changes in the value of BMO’s assets and liabilities resulting from changes in market variables such as interest rates, foreign exchange rates, equity and commodity prices and their implied volatilities, and credit spreads, as well as the risk of credit migration and default.
BMO incurs market risk in its trading and underwriting activities and structural banking activities.
As part of our enterprise-wide risk management framework, we apply extensive governance and management processes to our market risk-taking activities. These include:
| Ÿ | | oversight by senior governance committees, including the Balance Sheet Management Committee, RMC and RRC; |
| Ÿ | | an Economic Capital process that incorporates market risk measures (market value exposures, stress testing); |
| Ÿ | | independent valuation of trading positions and measurement of market risk; |
| Ÿ | | a comprehensive set of policies and corporate standards; |
| Ÿ | | monitoring an extensive range of risk metrics as appropriate for the respective trading portfolios, including VaR, stress and scenario tests, risk sensitivities and operational metrics; |
| Ÿ | | a well-developed set of limits with appropriate monitoring, reporting and escalation of limit breaches; and |
| Ÿ | | a model risk management framework that enhances the integrity of modelled risks. |
Primary measures for structural market risk include Earnings Volatility (EV) and Market Value Exposure (MVE). These positions are summarized in the table on page 88. The primary measure for market risk in trading and underwriting activities is MVE.
BMO’s Market Risk group provides independent oversight of trading and underwriting portfolios with the goal of ensuring:
| Ÿ | | market risk of trading and underwriting activities is measured and modelled in compliance with corporate policies and standards; |
| Ÿ | | risk profiles of our trading and underwriting activities are maintained within our risk appetite, and are monitored and reported to traders, management, senior executives and board committees; |
| Ÿ | | proactive identification and reporting to management, senior executives and board committees of specific exposures or other factors that expose BMO to unusual, unexpected, inappropriate or otherwise not fully identified or quantified risks associated with market or traded credit exposures; and |
| Ÿ | | all individuals authorized to execute trading and underwriting activities on behalf of BMO are appropriately informed of BMO’s risk-taking governance, authority structure and procedures and processes, and are given access to and guidance on the relevant corporate policies and standards. |
Our Market Risk group also provides oversight of structural market risk, which is managed by BMO’s Corporate Treasury group and described on page 87 and 88.
Earnings Volatility (EV) is a measure of the adverse impact of potential changes in market parameters on the projected 12-month after-tax net income of a portfolio of assets, liabilities and off-balance sheet positions, measured at a 99% confidence level over a specified holding period.
Market Value Exposure (MVE) is a measure of the adverse impact of potential changes in market parameters on the market value of a portfolio of assets, liabilities and off-balance sheet positions, measured at a 99% confidence level over a specified holding period. The holding period considers current market conditions and composition of the portfolios to determine how long it would take to neutralize the market risk without adversely affecting market prices. For trading and underwriting activities, MVE is comprised of Value at Risk and Issuer Risk.
Value at Risk (VaR) is measured for specific classes of risk in BMO’s trading and underwriting activities: interest rate, foreign exchange rate, and equity and commodity prices and their implied volatilities. This measure calculates the maximum likely loss from portfolios, measured at a 99% confidence level over a specified holding period.
Issuer Risk arises in BMO’s trading and underwriting portfolios, and measures the adverse impact of credit spread, credit migration and default risks on the market value of fixed-income instruments and similar securities. Issuer risk is measured at a 99% confidence level over a specified holding period.
Trading and Underwriting Market Risk
To capture the multi-dimensional aspects of market risk effectively, a number of metrics are used, including VaR, stress testing, option sensitivities, position concentrations, market and notional values and revenue losses.
VaR and stress testing are estimates of portfolio risk, but have limitations. Among the limitations of VaR is the assumption that all positions can be liquidated within the assigned one-day holding period (ten-day holding period for regulatory calculations), which may not be the case in illiquid market conditions, and that historical data can be used as a proxy to predict future market events. Scenario analysis and probabilistic stress testing are performed daily to determine the impact of unusual and/or unexpected market changes on our portfolios. As well, historical and event stresses are tested on a weekly basis, including tests of scenarios such as the stock market crash of 1987 and the collapse of Lehman Brothers in 2008.Ad hoc analyses are run to examine our sensitivity to high-impact, low-probability hypothetical scenarios. Scenarios are amended, added or deleted to better reflect changes in underlying market conditions. The results are reported to the lines of business, RMC and RRC on a regular basis. Stress testing is limited by the number of scenarios that can be run, and by the fact that not all downside scenarios can be predicted and effectively modelled. Neither VaR nor stress testing is viewed as a predictor of the maximum amount of losses that could occur in any one day, because both measures are computed at prescribed confidence levels and their results could be exceeded in highly volatile market conditions. On a daily basis, exposures are aggregated by lines of business and risk type
Material in blue-tinted font above is an integral part of the 2011 annual consolidated financial statements (see page 78).
| | | | |
| BMO Financial Group 194th Annual Report 2011 | | | 85 | |
MANAGEMENT’S DISCUSSION AND ANALYSIS
and monitored against delegated limit levels, and the results are reported to the appropriate stakeholders. BMO has a robust governance process in place to ensure adherence to delegated market risk limits. Amounts exceeding established limits are communicated to senior management on a timely basis for resolution and appropriate action.
Within the Market Risk group, the Valuation Products Control group checks whether the valuations of all trading and underwriting portfolios within BMO are materially accurate by:
| Ÿ | | developing and maintaining valuation adjustment policies and procedures in accordance with regulatory requirements and GAAP; |
| Ÿ | | establishing official rate sources for valuation of mark-to-market portfolios; and |
| Ÿ | | providing an independent review of trading books where trader prices are used for valuation of mark-to-market portfolios. |
The Valuation Control processes include all over-the-counter and exchange-traded instruments that are booked within Capital Markets Trading Products portfolios. These include both trading and available-for-sale (AFS) securities. The Valuation Products Control group also performs an independent valuation of certain portfolios outside of Capital Markets Trading Products.
Trader valuations are reviewed to determine whether they align with an independent assessment of the market value of the portfolio. If the valuation differences exceed the prescribed tolerance threshold, a valuation adjustment is recorded in accordance with accounting policy and regulatory requirements. Prior to the final month-end general ledger close, meetings are held between staff from the lines of business, Market Risk, Capital Markets Finance and the Chief Accountant’s Group to review all valuation adjustments that are established by the Market Risk group.
The Valuation Steering Committee is BMO’s senior management valuation committee. It meets at least quarterly to address the more challenging valuation issues in BMO’s portfolios and acts as a key forum for discussing positions categorized as Level 3 and their inherent uncertainty.
At a minimum, the following are considered when determining appropriate valuation adjustments: credit valuation adjustments, closeout costs, uncertainty, administrative costs, liquidity and model risk. Also, a fair value hierarchy is used to categorize the inputs used in the valuation of securities, liabilities, derivative assets and derivative liabilities. Level 1 inputs consist of quoted market prices, Level 2 inputs consist of internal models that use observable market information and Level 3 inputs consist of internal models without observable market information. Details of Level 1, Level 2 and Level 3 fair value measurements can be found in Note 29 on page 171 of the financial statements.
Our models are used to determine market risk Economic Capital for each of our lines of business and to determine regulatory capital. For capital calculation purposes, longer holding periods and/or higher confidence levels are used than are employed in day-to-day risk management. Prior to use, models are subject to review under the Model Risk Corporate Standard by our Model Risk and Vetting group. The Model Risk Corporate Standard outlines minimum requirements for the identification, assessment, monitoring and management of models and model risk throughout the enterprise and is described on page 92.
We measure the market risk for trading and underwriting portfolios that meet regulatory criteria for trading book capital treatment using the Internal Models Approach. We also apply this approach in measuring the market risk for money market portfolios that are subject to AFS accounting rules under GAAP and are accorded banking book regulatory capital treatment. For trading and underwriting portfolios covered by the Internal Models Approach, VaR is computed using BMO’s Trading Book Value at Risk model. This is a Monte Carlo scenario simulation model, and its results are used for market risk management and
Total Trading and Underwriting MVE
Summary ($ millions)*
| | | | | | | | | | | | | | | | |
| | | | |
For the year ended October 31, 2011 (pre-tax Canadian equivalent) | | Year-end | | | Average | | | High | | | Low | |
Commodity VaR | | | (0.3 | ) | | | (0.2 | ) | | | (0.6 | ) | | | (0.1 | ) |
Equity VaR | | | (5.4 | ) | | | (4.7 | ) | | | (7.6 | ) | | | (3.4 | ) |
Foreign exchange VaR | | | (0.9 | ) | | | (2.8 | ) | | | (6.6 | ) | | | (0.1 | ) |
Interest rate VaR (mark-to-market) | | | (6.3 | ) | | | (10.0 | ) | | | (16.0 | ) | | | (5.8 | ) |
Diversification | | | 4.2 | | | | 6.6 | | | | nm | | | | nm | |
Trading market VaR | | | (8.7 | ) | | | (11.1 | ) | | | (17.1 | ) | | | (7.8 | ) |
Trading and underwriting issuer risk | | | (3.6 | ) | | | (4.3 | ) | | | (8.8 | ) | | | (2.8 | ) |
Total trading and underwriting MVE | | | (12.3 | ) | | | (15.4 | ) | | | (22.6 | ) | | | (11.1 | ) |
Interest rate VaR (AFS) | | | (11.3 | ) | | | (13.3 | ) | | | (19.9 | ) | | | (6.7 | ) |
| | | | |
For the year ended October 31, 2010 (1) (pre-tax Canadian equivalent) | | Year-end | | | Average | | | High | | | Low | |
Commodity VaR | | | (0.1 | ) | | | (0.4 | ) | | | (1.4 | ) | | | (0.1 | ) |
Equity VaR | | | (7.5 | ) | | | (6.5 | ) | | | (15.8 | ) | | | (3.1 | ) |
Foreign exchange VaR | | | (0.6 | ) | | | (4.4 | ) | | | (12.5 | ) | | | (0.3 | ) |
Interest rate VaR (mark-to-market) | | | (7.5 | ) | | | (10.4 | ) | | | (22.5 | ) | | | (5.7 | ) |
Diversification | | | 4.8 | | | | 8.6 | | | | nm | | | | nm | |
Trading market VaR | | | (10.9 | ) | | | (13.1 | ) | | | (23.1 | ) | | | (5.9 | ) |
Trading and underwriting issuer risk | | | (2.7 | ) | | | (2.6 | ) | | | (4.4 | ) | | | (1.6 | ) |
Total trading and underwriting MVE | | | (13.6 | ) | | | (15.7 | ) | | | (24.9 | ) | | | (8.6 | ) |
Interest rate VaR (AFS) | | | (7.4 | ) | | | (5.6 | ) | | | (8.8 | ) | | | (2.8 | ) |
* One-day measure using a 99% confidence level.
nm – not meaningful
| | (1) | For comparative purposes, fiscal 2010 results are shown consistent with the management delegated limit structure for fiscal 2011. |
reporting of exposures. The model computes one-day VaR results using a 99% confidence level and reflects the correlations between the different classes of market risk factors.
We use a variety of methods to verify the integrity of our risk models, including the application of backtesting against hypothetical losses. This process assumes there are no changes in the previous day’s closing positions and then isolates the effects of each day’s price movements against those closing positions. Models are validated by assessing how often the calculated hypothetical losses exceed the MVE measure over a defined period. Results of this testing confirm the reliability of our models. The correlations and volatility data that underpin our models are updated monthly, so that MVE measures reflect current levels of volatility.
Market risk exposures arising from trading and underwriting activities are summarized in the table above. The total trading and underwriting MVE yearly decrease was primarily due to more moderate interest rate risk along with reduced equity exposure. The Interest Rate VaR (AFS) increase over the year was mainly due to a change in risk methodology. This change, as previously disclosed, was made to the calculation of MVE for AFS positions to better align the risk methodology to that used for the mark-to-market positions within the trading book. Beginning in fiscal 2012, stressed VaR exposures as per the Basel II Market Risk Amendment requirements will be introduced within our reporting framework.
Material in blue-tinted font above is an integral part of the 2011 annual consolidated financial statements (see page 78).
| | |
| 86 | | BMO Financial Group 194th Annual Report 2011 |
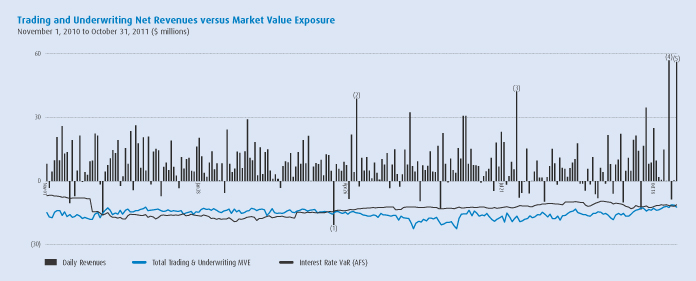
(1) April 15 – Primarily reflects credit valuation adjustments, daily net revenue ($20.7 million).
(2) April 29 – Primarily reflects normal trading activity and valuation adjustments, daily net revenue $38.9 million.
(3) July 29 – Primarily reflects normal trading activity and valuation adjustments, daily net revenue $42.3 million.
(4) Oct 26 – Primarily reflects normal trading activity and credit valuation adjustments, daily net revenue $56.9 million.
(5) Oct 31 – Primarily reflects normal trading activity and credit valuation adjustments, daily net revenue $56.2 million.

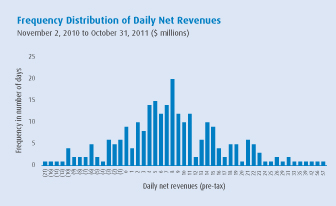
Trading revenues in the graphs include amounts from all trading and underwriting activities, whether accounted for as trading securities or AFS securities, as well as certain fees and commissions directly related to those activities.
Structural Market Risk
Structural market risk is comprised of interest rate risk arising from our banking activities (loans and deposits) and foreign exchange risk arising
from our foreign currency operations. Structural market risk is managed in support of high-quality earnings and maximization of sustainable product spreads. The RRC approves the market risk policy limits governing structural market risk and regularly reviews structural market risk positions. The Balance Sheet Management Committee and the RMC provide senior management oversight. BMO’s Corporate Treasury group is responsible for the ongoing management of structural market risk across the enterprise, with independent oversight provided by the Market Risk group.
Structural interest rate risk arises primarily from interest rate mismatches and product embedded options. Interest rate mismatch risk results from differences in the scheduled maturity, repricing dates or reference rates of assets, liabilities and derivatives. Product embedded option risk results from product features that allow customers to alter scheduled maturity or repricing dates. Product embedded options include loan prepayment and deposit redemption privileges and committed rates on unadvanced mortgages. The net interest rate mismatch, representing residual assets funded by common shareholders’ equity, is managed to a target duration, while product embedded options are managed to low risk levels. The net interest rate mismatch risk is primarily managed with interest rate swaps and securities. Product embedded option risk exposures are primarily managed through a dynamic hedging process.
Material in blue-tinted font above is an integral part of the 2011 annual consolidated financial statements (see page 78).
| | | | |
| BMO Financial Group 194th Annual Report 2011 | | | 87 | |
MANAGEMENT’S DISCUSSION AND ANALYSIS
Structural foreign exchange risk arises primarily from translation risk related to the net investment in our U.S. operations and from transaction risk associated with our U.S.-dollar-denominated net income.
Translation risk represents the impact changes in foreign exchange rates can have on the bank’s reported shareholders’ equity and capital ratios. When the Canadian dollar appreciates relative to the U.S. dollar, unrealized translation losses on our net investment in foreign operations, net of related hedging activities, are reported in other comprehensive income in shareholders’ equity. In addition, the Canadian dollar equivalent of U.S.-dollar-denominated RWA decreases. The reverse is true when the Canadian dollar depreciates relative to the U.S. dollar. Consequently, we hedge our net investment in foreign operations to ensure translation risk does not materially impact our capital ratios.
Transaction risk is managed by assessing at the start of each quarter whether to enter into foreign exchange forward contract hedges that are expected to partially offset the pre-tax effects of Canadian/U.S. dollar exchange rate fluctuations in the quarter on the expected U.S. dollar net income for the quarter. The Canadian dollar equivalent of BMO’s U.S.-dollar-denominated results is affected, favourably or unfavourably, by movements in the Canadian/U.S. dollar exchange rate. Rate movements affect future results measured in Canadian dollars and the impact on results is a function of the periods in which revenues, expenses and provisions for credit losses arise. If future results are consistent with the range of results for the past three years, each one cent increase (decrease) in the Canadian/U.S. dollar exchange rate, expressed in terms of how many Canadian dollars one U.S. dollar buys, would be expected to increase (decrease) the Canadian dollar equivalents of U.S.-dollar-denominated net income before income taxes for the year by between $6 million and $12 million. The acquisition of M&I increased U.S.-dollar-denominated earnings in the fourth quarter. If future results are consistent with results in the fourth quarter of 2011, each one cent increase (decrease) in the Canadian/U.S. dollar exchange rate would be expected to increase (decrease) net income before income taxes for the year by $17 million.
Structural MVE and EV measures both reflect holding periods of between one month and three months and incorporate the impact of correlation between market variables. Structural MVE and EV are summarized in the following table. Structural MVE increased from the prior year primarily due to growth in common shareholders’ equity, higher fixed-rate security balances and the inclusion of the assets from the acquired M&I business in the third quarter of 2011. Structural EV continues to be managed to low levels.
Structural Balance Sheet Market Value Exposure and Earnings Volatility($ millions)*
| | | | | | | | |
As at October 31 (Canadian equivalent) | | 2011 | | | 2010 | |
Market Value Exposure (pre-tax) | | | (685.9 | ) | | | (564.1 | ) |
12-month Earnings Volatility (after-tax) | | | (95.0 | ) | | | (63.8 | ) |
*Measured at a 99% confidence interval.
In addition to MVE and EV, we use simulations, sensitivity analysis, stress testing and gap analysis to measure and manage interest rate risk. The interest rate gap position is disclosed in Note 19 on page 152 of the financial statements.
Structural interest rate sensitivity to an immediate parallel increase or decrease of 100 and 200 basis points in the yield curve is disclosed in the table below. This sensitivity analysis is performed and disclosed by many financial institutions and facilitates comparison with our peer group. Economic value sensitivity increased from the prior year primarily due to growth in common shareholders’ equity, higher fixed-rate security balances and the inclusion of the assets from the acquired M&I business in the third quarter of 2011. Earnings sensitivities continue to be managed to low levels. The asset-liability profile at the end of the year results in a structural earnings benefit from interest rate increases and structural earnings exposure to interest rate decreases.
Structural Balance Sheet Interest Rate
Sensitivity(1) ($ millions)*
| | | | | | | | | | | | | | | | |
| Canadian equivalent | | As at October 31, 2011 | | | As at October 31, 2010 | |
| | | Economic
value
sensitivity pre-tax | | | 12-month
earnings
sensitivity after tax | | | Economic
value
sensitivity pre-tax | | | 12-month
earnings
sensitivity after tax | |
100 basis point increase | | | (614.3 | ) | | | 24.8 | | | | (380.5 | ) | | | 20.9 | |
100 basis point decrease | | | 441.8 | | | | (102.5 | ) | | | 322.3 | | | | (70.3 | ) |
200 basis point increase | | | (1,295.7 | ) | | | 69.3 | | | | (815.1 | ) | | | 33.4 | |
200 basis point decrease | | | 829.4 | | | | (63.3 | ) | | | 738.2 | | | | (12.8 | ) |
*Exposures are in brackets and benefits are represented by positive amounts.
| | (1) | Interest rate sensitivities associated with BMO’s insurance business are not reflected in the table above. For our insurance business, a 100 basis point increase in interest rates results in an increase in earnings after tax of $88 million and an increase in economic value before tax of $436 million ($77 million and $295 million, respectively, at October 31, 2010). A 100 basis point decrease in interest rates results in a decrease in earnings after tax of $82 million and a decrease in economic value before tax of $494 million ($71 million and $304 million, respectively, at October 31, 2010). The change in interest rate sensitivities from the prior year reflects the growth in the insurance business and lower interest rates. |
Models used to measure structural market risk project changes in interest and foreign exchange rates and predict how customers would likely react to the changes. For customer loans and deposits with scheduled maturity and repricing dates (such as mortgages and term deposits), our models measure how customers are likely to use embedded options to alter those scheduled terms. For customer loans and deposits without scheduled maturity and repricing dates (such as credit card loans and chequing accounts), our models assume a maturity profile that considers historical and forecasted trends in balances. These models have been developed using statistical analysis and are validated through regular model vetting, backtesting processes and ongoing dialogue with the lines of business. Models used to predict customer behaviour are also used in support of product pricing and performance measurement.
Liquidity and Funding Risk
|
Liquidity and funding risk is the potential for loss if BMO is unable to meet financial commitments in a timely manner at reasonable prices as they fall due. Financial commitments include liabilities to depositors and suppliers, and lending, investment and pledging commitments. |
Managing liquidity and funding risk is essential to maintaining the safety and soundness of the organization, depositor confidence and stability in earnings. It is BMO’s policy to ensure that sufficient liquid assets and funding capacity are available to meet financial commitments, even in times of stress.
BMO’s Liquidity and Funding Risk Management Framework is defined and managed under applicable corporate policies and standards.
Material in blue-tinted font above is an integral part of the 2011 annual consolidated financial statements (see page 78).
| | |
| 88 | | BMO Financial Group 194th Annual Report 2011 |
These policies and standards outline key management principles, liquidity and funding management metrics and related limits and guidelines, as well as roles and responsibilities for the management of liquidity and funding risk across the enterprise. An enterprise-wide contingency plan that can be used to facilitate effective management through a disruption is also in place.
The RRC oversees liquidity and funding risk and annually approves applicable policies, limits and the contingency plan and regularly reviews liquidity and funding positions. The RMC and Balance Sheet
Management Committee provide senior management oversight and also review and discuss significant liquidity and funding policies, issues and action items that arise in the execution of our strategy. The Corporate Treasury group recommends the framework, limits and guidelines, monitors compliance with policy requirements and assesses the impact of market events on liquidity requirements on an ongoing basis.
BMO subsidiaries include regulated and foreign entities, and therefore movements of funds between companies in the corporate group are subject to liquidity, funding and capital adequacy considerations of the subsidiaries, as well as tax and regulatory considerations. As such, liquidity and funding positions are managed on both a consolidated and key legal entity basis. Liquidity and funding risk management policies and limits are in place for key legal entities and positions are regularly reviewed at the legal entity level to ensure compliance with applicable requirements.
During fiscal 2011, global financial markets continued to experience challenges and uncertainty. There was continued economic weakness in several developed countries and sovereign debt concerns for some countries in Europe. Midway through the year, there was also potential risk that the U.S. government would not raise the U.S. debt ceiling, possibly leading to default and a negative impact on the economy. BMO’s liquidity and funding management framework and business mix were effective in ensuring that we maintained a strong liquidity position throughout the year, and continue to help ensure that we maintain a strong position.
Four of the measures we use to evaluate liquidity and funding risk are the customer deposits and capital-to-loans ratio, the level of core deposits, the net liquidity position and the liquidity ratio.
Our large and stable base of customer deposits, along with our strong capital base, is a source of strength. It supports the achievement of a strong liquidity position and reduces our reliance on wholesale funding. The ratio of customer deposits and capital to loans equalled 112.1% at the end of the year, up from 104.1% in the prior year.
Customer deposits include core deposits and larger fixed-rate customer deposits. Core deposits are comprised of customer operating and savings account deposits and smaller fixed-date deposits (less than or equal to $100,000). Canadian dollar core deposits totalled $105.6 billion at the end of the year, up from $98.6 billion in 2010, and U.S. dollar and other currency core deposits totalled US$72 billion at the end of the year, up from US$33.5 billion in 2010.The increase in our U.S. dollar and other currency core deposits reflects the M&I acquisition and investor preference for bank deposits. Larger fixed-date customer deposits totalled $17.0 billion at the end of the year, compared with $20.1 billion in 2010. Total deposits, which include both customer deposits and wholesale deposits, increased $53.7 billion during 2011 to $302.9 billion at the end of the year. The increase in total deposits primarily reflects the M&I acquisition, an increase in core deposits from organic business growth that was used to fund loan and security growth, and an increase in wholesale deposits to fund securities growth in our trading businesses.
Our funding philosophy requires that wholesale funding used to support loans and less liquid assets is longer term (typically maturing in
two to ten years) to better match the terms to maturity of these assets. Wholesale funding for liquid trading assets is generally shorter term (maturing in less than one year). Supplemental liquidity pools are funded with a mix of wholesale term funding to prudently balance the benefits of holding supplemental assets against funding costs.
Diversification of our wholesale funding sources is an important part of our overall liquidity management strategy. BMO has the ability to raise long-term funding through various platforms, including a European Note Issuance Program, Canadian and U.S. Medium-Term Note Programs, a Global Covered Bond Program, Canadian and U.S. mortgage securitizations, Canadian credit card securitizations, and Canadian and U.S. senior (unsecured) deposits. During 2011, BMO issued $18.9 billion of wholesale term funding in Canada and internationally. Total wholesale term funding outstanding was $67.4 billion at October 31, 2011, which included the $55.4 billion summarized in the table below and $12.0 billion of capital issuances. The mix and maturities of BMO’s wholesale term funding are outlined in the tables below. Additional information on deposit maturities can be found in Table 20 on page 110.
Long-term Wholesale Funding Sources($ millions)
| | | | | | | | | | | | | | | | | | | | |
| As at October 31 | | 2011 | | | 2010 | | | 2009 | | | 2008 | | | 2007 | |
Unsecured long-term wholesale funding | | | 20,510 | | | | 14,198 | | | | 21,756 | | | | 35,274 | | | | 21,628 | |
Secured long-term wholesale funding | | | 9,228 | | | | 5,883 | | | | 4,162 | | | | 4,396 | | | | – | |
Mortgage and credit card securitization issuances | | | 25,630 | | | | 26,906 | | | | 28,047 | | | | 25,077 | | | | 12,992 | |
| | | | 55,368 | | | | 46,897 | | | | 53,965 | | | | 64,747 | | | | 34,620 | |
Unsecured Long-term Wholesale Funding Maturities ($ millions)
| | | | | | | | | | | | | | | | | | | | | | | | | | | | |
As at
October 31,
2011 | | Less than
1
year | | | 1 to
2
years | | | 2 to
3
years | | | 3 to
4
years | | | 4 to
5
years | | | Over
5
years | | | Total | |
Unsecured
long-term
wholesale
funding | | | 2,780 | | | | 6,777 | | | | 1,831 | | | | 2,130 | | | | 4,300 | | | | 2,693 | | | | 20,510 | |
Secured
long-term
wholesale
funding | | | – | | | | 1,379 | | | | 1,993 | | | | 1,993 | | | | 1,495 | | | | 2,367 | | | | 9,228 | |
Mortgage and
credit card
securitization
issuances | | | 5,481 | | | | 7,568 | | | | 3,925 | | | | 2,450 | | | | 3,310 | | | | 2,897 | | | | 25,630 | |
| | | | 8,261 | | | | 15,724 | | | | 7,749 | | | | 6,573 | | | | 9,105 | | | | 7,957 | | | | 55,368 | |
The Net Liquidity Position represents the amount by which liquid assets exceed potential funding needs under a severe combined idiosyncratic and systemic stress scenario. Potential funding needs may arise from obligations to repay retail, commercial and wholesale deposits that are withdrawn or not renewed, fund drawdowns on available credit and liquidity lines, purchase collateral for pledging and fund asset growth and strategic investments. These needs are assessed under both severely stressed marketwide and enterprise-specific scenarios and a combination thereof. Liquid assets include unencumbered, high-quality assets that are marketable, can be pledged as security for borrowings, and can be converted to cash in a time frame that meets our liquidity and funding requirements. Liquid assets are held both in our trading businesses and in supplemental liquidity pools that are maintained for contingent liquidity risk management purposes.
The liquidity ratio is a measure reported by some banks. It provides a view of liquidity in the balance sheet and equals the sum of cash resources and securities as a percentage of total assets. BMO’s liquidity ratio was 32.5% at October 31, 2011, down from 35.0% in 2010, reflecting a higher level of loans due to the M&I acquisition. The ratio reflects a strong liquidity position. Cash and securities
Material in blue-tinted font above is an integral part of the 2011 annual consolidated financial statements (see page 78).
| | | | |
| BMO Financial Group 194th Annual Report 2011 | | | 89 | |
MANAGEMENT’S DISCUSSION AND ANALYSIS
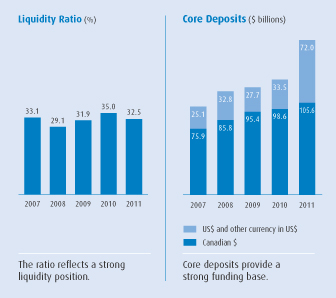
totalled $154.9 billion at the end of the year, compared with $144.0 billion in 2010.
In the ordinary course of business, a portion of cash, securities and securities borrowed or purchased under resale agreements is pledged as collateral to support trading activities and participation in clearing and payment systems, in Canada and abroad.As part of the Liquidity and Funding Risk Management Framework, a Pledging of Assets corporate policy is in place that sets out the framework and pledging limits for financial and non-financial assets. Pledged assets are considered encumbered for liquidity purposes.
At October 31, 2011, $40.1 billion of cash and securities and $18.2 billion of securities borrowed or purchased under resale agreements had been pledged, compared with $46.0 billion and $19.6 billion, respectively, in 2010. These changes were driven by trading activities. Additional information on cash and securities can be found in Table 5 on page 101 and in Notes 2 and 3 on page 122 of the financial statements.
The credit ratings assigned to BMO’s short-term and senior long-term debt securities by external rating agencies are important in the
raising of both capital and funding to support our business operations. Maintaining strong credit ratings allows us to access the capital markets at competitive pricing levels. BMO’s ratings are indicative of high-grade, high-quality issues. Should our credit ratings materially decrease, our cost of funds would likely increase significantly and our access to funding and capital through capital markets could be reduced. A material downgrade of our ratings could have additional consequences, including those set out in Note 10 on page 138 of the financial statements.
Credit Ratings
| | | | | | | | |
| As at October 31, 2011 | | | | | | | |
| Rating agency | | Short-term debt | | Senior long-
term debt | | Outlook | |
Moody’s | | P-1 | | Aa2 | | | Stable | |
S&P | | A-1 | | A+ | | | Stable | |
Fitch | | F1+ | | AA- | | | Stable | |
DBRS | | R-1 (high) | | AA | | | Stable | |
The adoption of IFRS in 2012 will result in certain loans that are currently reported off-balance sheet under Canadian GAAP being reported on-balance sheet, leading to lower but still strong customer deposits and capital-to-loans ratio and liquidity ratio in 2012.
In December 2010, the BCBS published its international framework for liquidity measurement, standards and monitoring. The framework contains two new liquidity measures, the Liquidity Coverage Ratio (LCR) and Net Stable Funding Ratio (NSFR), and five monitoring tools (contractual maturity mismatch, concentration of funding, available unencumbered assets, LCR by significant currency and market-related monitoring). The LCR is the ratio of the stock of high-quality liquid assets to stressed net cash outflows over a 30-day time period. The NSFR is the ratio of the available amount of stable funding (one-year or greater) to the required amount of stable funding. The LCR and NSFR measures are not yet finalized. An observation period for the LCR and NSFR is scheduled to commence on January 1, 2012 and final standards will be introduced on January 1, 2015 for the LCR and January 1, 2018 for the NSFR. The framework and conceptual approach BMO and the financial services industry typically use to manage liquidity and funding risk are consistent with the new regulatory approach; however, the regulatory factors used to determine the amount of liquid assets required to be held by banks are more conservative in the new approach.
Operational Risk
|
Operational risk is the potential for loss resulting from inadequate or failed internal processes or systems, human interactions or external events, but excludes business risk. |
BMO is exposed to potential losses arising from a variety of operational risks, including process failure, theft and fraud, regulatory non-compliance, business disruption, information security breaches and exposure related to outsourcing, as well as damage to physical assets. Operational risk is inherent in all our business activities, including the processes and controls used to manage credit risk, market risk and all other risks we face. While operational risk can never be fully eliminated, it can be managed to reduce exposure to financial loss, reputational harm or regulatory sanctions.
The three-lines-of-defence operating model establishes appropriate accountability for operational risk management. The operating groups are responsible for the day-to-day management of operational risk in a manner consistent with our enterprise-wide principles. Independent risk management oversight is provided by Operating Group CROs, Group Operational Risk Officers, Corporate Support areas and Enterprise Operational Risk Management. Operating Group CROs and Operational Risk Officers independently assess group operational risk profiles, identifying material exposures and potential weaknesses in controls, and
recommending appropriate mitigation strategies and actions. Corporate Support areas develop the tools and processes to independently manage specialized operational risks across the organization. Enterprise Operational Risk Management establishes the Operational Risk Management Framework and strategy as well as the necessary governance framework.
Operational Risk Management Framework (ORMF)
The ORMF defines the processes we use to identify, measure, manage, mitigate, monitor and report key operational risk exposures. A primary objective of the ORMF is to ensure that our operational risk profile is consistent with our risk appetite and supported by adequate capital. The key programs, methodologies and processes developed to support the framework are highlighted below. Enhancements to the ORMF are ongoing, giving due consideration to emerging industry and regulatory guidance as detailed in the Basel II Capital Accord.
Governance
Operational risk management is governed by a robust committee structure supported by a comprehensive set of policies, standards and
operating guidelines. Operational Risk Committee (ORC), a sub-committee of the RMC, is the main decision-making committee for all operational risk management matters and has oversight responsibility for operational risk strategy, management and governance. ORC
| | |
| 90 | | BMO Financial Group 194th Annual Report 2011 |
provides advice and guidance to the lines of business on operational risk assessments, measurement and mitigation, and related monitoring and change initiatives. ORC also oversees the development of policies, standards and operating guidelines that give effect to the governing principles of the ORMF. These governance documents incorporate industry best practices and are reviewed on a regular basis to ensure they are current and consistent with our risk appetite.
Risk and Control Assessment (RCA)
RCA is an established process used by our operating groups to identify the key risks associated with their businesses and the controls required for risk mitigation. The RCA process provides a forward-looking view of the impact of the business environment and internal controls on operating group risk profiles. On an aggregate basis, RCA results provide a consolidated view of operational risks relative to risk appetite.
Key Risk Indicators (KRIs)
Operating groups and Corporate Support areas identify KRIs related to their material risks. KRIs are used to monitor operational risk profiles and are linked to thresholds that trigger management action. KRIs provide an early indication of adverse changes in risk exposure.
Event Data Collection and Analysis
Internal loss data has been collected throughout the enterprise since 2004 and serves as an important means of measuring our operational risk exposure and identifying risk mitigation opportunities. Loss data is analyzed and benchmarked against external data and material trends are reported to senior management and the board on a regular basis. BMO is a member of the Operational Riskdata eXchange Association, an international association of banks that share loss data information anonymously to assist in risk identification, assessment and modelling.
Capital Quantification
BMO uses the Standardized Approach to determine Basel II regulatory capital requirements for operational risk. The Standardized Approach
processes and capital measures have been implemented at both the consolidated enterprise and applicable legal entity levels. BMO has made significant progress in developing a risk-sensitive capital model that is compliant with the Basel II Advanced Measurement Approach (AMA) requirements. The implementation of the AMA is a priority for the enterprise and will enable the quantification of operational risk capital using internal models and loss-based methodologies.
Stress Testing and Scenario Analysis
Stress testing measures the potential impact of plausible operational, economic, market and credit events on our operations and capital. Scenario analysis provides management with a better understanding of low-frequency, high-severity events and provides a gauge of enterprise preparedness for events that could create risks that exceed our risk appetite. Scenario analysis is used in the validation of operational risk capital under the AMA.
Reporting
Regular reporting of our enterprise operational risk profile to senior management and the board is an important element of our ORMF. Operational risk reporting enhances risk transparency and the proactive management of material operational risk exposures.
Business Continuity Management
Effective business continuity management is integral to our goal of ensuring that critical operations continue to function in the event of a business disruption, thereby minimizing any adverse effects on our clients.
Corporate Insurance Program
BMO’s corporate insurance program provides a second level of mitigation of certain operational risk exposures. We purchase insurance in amounts that are expected to provide adequate protection against unexpected material loss and where insurance is required by law, regulation or contractual agreement.
Insurance Risk
|
Insurance risk is the risk of loss due to actual experience being different from that assumed when an insurance product was designed and priced. Insurance risk exists in all our insurance businesses, including annuities and life, accident and sickness, and creditor insurance, as well as our reinsurance business. |
Insurance risk consists of:
| Ÿ | | Claims risk – The risk that the actual magnitude or frequency of claims will differ from the levels assumed in the pricing or underwriting process. Claims risk includes mortality risk, morbidity risk and natural catastrophe risk; |
| Ÿ | | Policyholder behaviour risk – The risk that the behaviour of policyholders relating to premium payments, withdrawals or loans, policy lapses and surrenders and other voluntary terminations will differ from the behaviour assumed in the pricing calculations; and |
| Ÿ | | Expense risk – The risk that actual expenses associated with acquiring and administering policies and claims processing will exceed the expected expenses assumed in pricing calculations. |
Insurance risk approval authority is delegated by the bank’s Board of Directors to senior management. A robust product approval process is a cornerstone for identifying, assessing and mitigating risks associated with new insurance products or changes to existing products. This process, combined with guidelines and practices for underwriting and claims management, promotes the effective identification, measurement and management of insurance risk. Reinsurance, which involves transactions that transfer insurance risk to independent reinsurance companies, is also used to manage our exposure to insurance risk by diversifying risk and limiting claims.
Insurance risk is monitored on a regular basis. Actuarial liabilities are estimates of the amounts required to meet insurance obligations. Liabilities are established in accordance with the standards of practice of the Canadian Institute of Actuaries and the CICA. The liabilities are validated through extensive internal and external reviews and audits. Assumptions underlying actuarial liabilities are regularly updated to reflect emerging actual experience. The Appointed Actuaries of our insurance subsidiaries are appointed by the boards of directors and have statutory responsibility for providing opinions on the adequacy of provisions for the policyholder liabilities, the solvency of the insurance companies and fairness of treatment of participating policyholders. In addition, the work of each Appointed Actuary is subject to an external, independent review by a qualified actuary every three years, in accordance with OSFI Guideline E-15.
The Board of Directors establishes approval authorities and limits and delegates these to the management teams of the insurance subsidiaries. The boards of directors of our insurance subsidiaries are responsible for the stewardship of their respective insurance companies. Through oversight and monitoring, the boards are responsible for determining that the insurance subsidiaries are managed and function in accordance with established insurance strategies and policies. ER&PM is responsible for providing risk management direction and independent oversight to the insurance businesses. This group also has the approval authority for activities that exceed delegated authorities and limits of the boards of the insurance companies, or that expose BMO to significant risk.
Our insurance subsidiaries provide independent evaluation and reporting of insurance risk exposures to their boards of directors and at the enterprise level, including reporting to both Private Client Group management and the RRC. Reporting includes an assessment of all risks facing the insurance subsidiaries, including top-line and emerging risks.
| | | | |
| BMO Financial Group 194th Annual Report 2011 | | | 91 | |
MANAGEMENT’S DISCUSSION AND ANALYSIS
Legal and Regulatory Risk
|
Legal and regulatory risk is the risk of not complying with laws, contractual agreements or other legal requirements, as well as regulatory requirements, regulatory changes or regulators’ expectations. Failure to properly manage legal and regulatory risk may result in litigation claims, financial losses, regulatory sanctions, an inability to execute our business strategies, and potential harm to our reputation. |
Legal and regulatory risk is inherent in almost everything we do, and we are held to strict compliance standards by government, regulators and other authorities. The financial services industry is highly regulated, and continues to receive heightened attention as new rules are proposed and enacted as part of worldwide regulatory reform initiatives.
Legal, Corporate and Compliance Group (LCCG) maintains enterprise-wide risk management frameworks to identify, measure, manage, monitor and report on legal and regulatory risk. The frameworks reflect the three-lines-of-defence operating model described previously. The operating groups and Corporate Support areas are responsible for the day-to-day management of their legal and regulatory risk in accordance with enterprise-wide policies. LCCG provides advice and independent risk management oversight through legal and compliance teams with designated operating group and corporate area responsibility. LCCG also
works closely with the operating groups and corporate areas to identify legal and regulatory requirements and potential risks, recommend mitigation strategies and actions, and oversee litigation involving BMO.
A Legislative Compliance Management (LCM) Framework has been established to identify, assess and properly manage legal and regulatory requirements, using a risk-based approach. Under the LCM, management in operating groups and Corporate Support areas maintains a system of compliance policies, procedures and controls. Separate monitoring activities are carried out under the direction of the Chief Compliance Officer (CCO), including the tracking of action plans to address identified gaps or deficiencies.
The General Counsel and the CCO report periodically on the effectiveness of legal and regulatory risk management to the Audit Committee of the board and to senior management.
BMO’s code of conduct,FirstPrinciples, outlines our commitment to high standards of ethics and integrity and is updated on an annual basis. One of the seven defining principles in the code is a commitment to follow both the letter and the spirit of the law. All directors and employees are required to complete annual training that tests their knowledge and understanding of their obligations under the code, and also covers topics such as anti-money laundering, privacy and anti-corruption practices.
Business Risk
|
Business risk arises from the specific business activities of a company and the effects these could have on its earnings. |
Business risk encompasses the potential causes of earnings volatility that are distinct from credit, market or operational risk factors. It identifies factors related to the risk that volumes will decrease or margins will shrink without the ability to compensate for this decline by cutting costs.
BMO faces many risks that are similar to those faced by non-financial firms, principally that our profitability, and hence value,
may be eroded by changes in the business environment or by failures of strategy or execution. Sources of these risks include, but are not limited to, changing client expectations, adverse business developments and relatively ineffective responses to industry changes.
Within BMO, each operating group is responsible for controlling its respective business risk by assessing, managing and mitigating the risks arising from changes in business volume and cost structure, among other factors.
Model Risk
|
Model risk is the potential loss due to the risk of a model not performing or capturing risk as designed. It also arises from the possibility of the use of an inappropriate model or the inappropriate use of a model. |
BMO uses models that range from the very simple to those that value complex transactions or involve sophisticated portfolio and capital management methodologies. These models are used to inform strategic decision-making and to assist in making daily lending, trading, underwriting, funding, investment and operational decisions. Models have also been developed to measure exposure to specific risks and to measure total risk on an integrated basis, using Economic Capital. We have strong controls over the development, implementation and application of these models.
BMO uses a variety of models, which can be grouped within six categories:
| Ÿ | | valuation models for the valuation of assets, liabilities or reserves; |
| Ÿ | | risk exposure models for measuring credit risk, market risk, liquidity risk and operational risk, which also address expected loss and its applications; |
| Ÿ | | capital and stress testing models for measuring capital, allocating capital and managing Regulatory Capital and Economic Capital; |
| Ÿ | | fiduciary models for asset allocation, asset optimization and portfolio management; |
| Ÿ | | major business strategy models to forecast the possible outcomes of new strategies in support of our business decision-making process; and |
| Ÿ | | models driven by regulatory and other stakeholder requirements. |
During the year, enhancements were made to our enterprise-wide Model Risk Management Framework and full implementation was achieved. Under the framework, model risk is managed on an end-to-end basis, with model owners engaging model users and both constituting a first line of defence.
The Model Risk Corporate Standard outlines minimum requirements for the development, identification, assessment, implementation, monitoring, management and reporting of models and model risk throughout the enterprise. Prior to use, all models require approval and an assessment of their model risk by the Model Risk and Vetting (MRV) group. All models are assigned a risk rating as part of the vetting process, which determines the frequency of ongoing review. In addition to regularly scheduled model validation and vetting, model risk monitoring and oversight activities are in place to confirm that models perform and are managed and used as expected, thereby increasing the likelihood of early detection of emerging issues.
The Model Risk Management Forum, a cross-functional group representing all key stakeholders (model users, model owners and the MRV group), meets regularly to provide input into the development, implementation and maintenance of the model risk management framework and the processes governing all models that are in use across the enterprise.
| | |
| 92 | | BMO Financial Group 194th Annual Report 2011 |
Strategic Risk
|
Strategic risk is the potential for loss due to fluctuations in the external business environment and/or failure to properly respond to these fluctuations due to inaction, ineffective strategies or poor implementation of strategies. |
Strategic risk arises from external risks inherent in the business environment within which BMO operates, as well as the risk of potential loss if BMO is unable to address those external risks effectively. While external strategic risks – including economic, political, regulatory, technological, social and competitive risks – cannot be controlled, the likelihood and magnitude of their impact can be mitigated through an effective strategic risk management process.
BMO’s Office of Strategic Management (OSM) oversees our governance and management processes for identifying, monitoring and mitigating strategic risk across the enterprise. A rigorous strategic management process incorporates a consistent approach to the
development of strategies and incorporates accurate and comprehensive financial information linked to financial commitments.
The OSM works with the lines of business and key corporate stakeholders during the strategy development process to promote consistency and adherence to strategic management standards. Included in this process is a review of the changing business environment within which each of our lines of business operates, including a review of broad industry trends and the actions of our competitors. Strategies are reviewed with the Management Committee and the Board of Directors annually in interactive sessions designed to challenge assumptions and strategies in the context of current and potential future business environments.
Performance objectives established through the strategic management process are regularly monitored and are reported upon quarterly, using both leading and lagging indicators of performance, so that strategies can be reviewed and adjusted when necessary. Regular strategic and financial updates are also monitored closely to identify any significant issues.
Reputation Risk
|
Reputation risk is the risk of a negative impact on BMO that results from a deterioration in stakeholders’ perception of BMO’s reputation. These potential impacts include revenue loss, litigation, regulatory sanction or additional oversight, declines in client loyalty and declines in BMO’s share price. |
BMO’s reputation is one of its most valuable assets. By protecting and maintaining our reputation, we can increase shareholder value, reduce our cost of capital and improve employee engagement.
Fostering a business culture in which integrity and ethical conduct are core values is key to effectively protecting and maintaining BMO’s reputation.
We believe that active, ongoing and effective management of reputation risk is best achieved by considering reputation risk issues in the course of strategy development, strategic and operational implementation and transactional or initiative decision-making. Reputation risk is also managed through our corporate governance practices, code of conduct and risk management framework.
All employees are responsible for conducting themselves in accordance withFirstPrinciples, BMO’s code of conduct, thus building and maintaining BMO’s reputation. The Reputation Risk Management Committee considers significant potential reputation risks to the enterprise, including those that require a review of complex credit and structured-finance transactions.
Environmental Risk
|
Environmental risk is the risk of loss or damage to BMO’s reputation resulting from environmental concerns related to BMO or its customers. Environmental risk is often associated with credit, operational and reputation risk. |
Environmental risk is addressed in our board-approved corporate sustainability policy. Environmental risk management activities are overseen by both the Corporate Sustainability and Environmental Sustainability groups, with support from our lines of business and other Corporate Support areas. Executive oversight of our environmental initiatives is provided by BMO’s Sustainability Council, comprised of executives representing the various areas of the organization. Senior management committees are provided with reports on our progress toward the objectives mandated by our environmental strategy, as appropriate. Our environmental policies and practices are outlined in detail in our annual Corporate Responsibility Report and Public Accountability Statement and on our Corporate Responsibility website.
Environmental risk covers a broad spectrum of issues, such as climate change, biodiversity and ecosystem health, pollution, waste and the unsustainable use of water and resources. We work with external stakeholders to understand the impact of our operations in the context of these issues, and we use this understanding to determine the consequences for our businesses.
In addition, specific line of business guidelines outline how environmental risks inherent in lending activities are managed. Environmental risks associated with lending transactions are managed within BMO’s credit and counterparty risk framework. Enhanced due diligence is applied to transactions with clients operating in environmentally sensitive industry sectors, and we adhere to the standards set out in the Equator Principles, a framework for evaluating environmental and social risk in project finance transactions based on the World Bank’s International Finance Corporation Performance Standards.
We have a robust Environmental Management System (EMS) in place to manage the environmental impact of our operations. Our goal is continual improvement in our environmental performance. As such, our EMS requires that we identify activities within our operations that have the potential to impact the environment, and establish objectives, targets and processes to mitigate or eliminate those impacts. It also requires that we monitor performance against stated objectives and take action to continually reduce the impact of our operational footprint on the environment.
We have achieved certification under the internationally recognized standard,ISO 14001 Environmental Management Systems, for our leased 19-floor office tower located at 55 Bloor Street West in Toronto and the Bank of Montreal Institute for Learning facility. We continue to apply our EMS across all our operations.
Caution
This Enterprise-Wide Risk Management section contains forward-looking statements. Please see the Caution Regarding Forward-Looking Statements.
| | | | |
| BMO Financial Group 194th Annual Report 2011 | | | 93 | |
MANAGEMENT’S DISCUSSION AND ANALYSIS
Non-GAAP Measures
Results and measures in this MD&A are presented on a GAAP basis. They are also presented on an adjusted basis that excludes the impact of certain items as set out in the adjacent table. Management assesses performance on both a reported and an adjusted basis and considers both bases to be useful in assessing underlying, ongoing business performance. Presenting results on both bases provides readers with an enhanced understanding of how management measures results. It also permits readers to assess the impact of the specified items on results for the periods presented and to better assess results excluding those items if they consider the items to not be reflective of ongoing results. As such, the presentation may facilitate readers’ analysis of trends, as well as comparisons with our competitors. Adjusted results and measures are non-GAAP and as such do not have standardized meaning under GAAP. They are unlikely to be comparable to similar measures presented by other companies and should not be viewed in isolation from or as a substitute for GAAP results. Details of adjustments are also set out in the Adjusting Items section on page 34.
Certain of the adjusting items relate to expenses that arise as a result of acquisitions, including the amortization of acquisition-related intangible assets, and are adjusted because the purchase decision may not consider the amortization of such assets to be a relevant expense. Certain other acquisition-related costs in respect of M&I have been designated as adjusting items due to the significance of the amounts and the fact that they can impact trend analysis, as some of these costs have been incurred with the intent to generate benefits in future periods.
Certain other items have also been designated as adjusting items due to their effects on trend analysis. They include charges related to the deterioration in the capital markets environment in 2009 (and prior years), changes in the general allowance and elevated severance costs in 2009.
Net economic profit (NEP) represents net income available to common shareholders before deduction for the after-tax impact of the amortization of acquisition-related intangible assets, less a charge for capital, and is considered an effective measure of added economic value. Adjusted NEP is computed in the same manner, using adjusted net income.
Pre-provision, pre-tax earnings is considered useful information as it provides a measure of performance that excludes the effects of credit losses and income taxes, which can at times mask performance because of their size and variability.
In fiscal 2011, adjusting items totalled a net charge of $15 million after tax, comprised of net income of $39 million in Corporate Services
and net charges of $54 million after tax recorded in the other operating groups. Adjusting items were charged or allocated to Corporate Services with the exception of the amortization of acquisition-related intangible assets, which was charged to the operating groups as follows: P&C Canada $9 million ($9 million after tax); P&C U.S. $49 million ($35 million after tax); and Private Client Group $12 million ($10 million after tax).
In fiscal 2010, there were no adjusting items other than a $36 million ($32 million after tax) charge for the amortization of acquisition-related intangible assets, which was charged to the operating groups as follows: P&C Canada $6 million ($6 million after tax); P&C U.S. $23 million ($19 million after tax); Private Client Group $6 million ($6 million after tax); and BMO Capital Markets $1 million ($1 million after tax).
In fiscal 2009, adjusting items totalled a net charge of $509 million after tax. Adjusting items charged to Corporate Services totalled $178 million ($119 million after tax) and included severance costs of $118 million ($80 million after tax) and an increase in the general allowance for credit losses of $60 million ($39 million after tax). Charges in respect of deterioration in the capital markets environment of $521 million ($355 million after tax) were charged entirely to BMO Capital Markets. A $43 million ($35 million after tax) charge in respect of the amortization of acquisition-related intangible assets was charged to the operating groups as follows: P&C Canada $4 million ($4 million after tax); P&C U.S. $34 million ($28 million after tax); Private Client Group $4 million ($3 million after tax); and BMO Capital Markets $1 million ($nil after tax).
In the fourth quarter of 2011, adjusting items totalled a net amount of $47 million after tax, comprised of a net loss of $72 million in Corporate Services and net charges of $25 million after tax recorded in the other operating groups. Adjusting items were charged to Corporate Services with the exception of the amortization of acquisition-related intangible assets, which was charged to the operating groups as follows: P&C Canada $3 million ($2 million after tax); P&C U.S. $25 million ($17 million after tax); and Private Client Group $6 million ($6 million after tax).
In the fourth quarter of 2010, there were no adjusting items other than an $11 million ($9 million after tax) charge for the amortization of acquisition-related intangible assets, which was charged to the operating groups as follows: P&C Canada $2 million ($2 million after tax); P&C U.S. $6 million ($5 million after tax); Private Client Group $2 million ($2 million after tax) and BMO Capital Markets $1 million ($nil after tax).
| | |
| 94 | | BMO Financial Group 194th Annual Report 2011 |
GAAP and Related Non-GAAP Results and Measures used in the MD&A
| | | | | | | | | | | | | | | | | | | | |
| (Canadian $ in millions, except as noted) | | 2011 | | | 2010 | | | 2009 | | | Q4 2011 | | | Q4 2010 | |
| | | | | |
Reported Results | | | | | | | | | | | | | | | | | | | | |
Revenue | | | 13,718 | | | | 12,210 | | | | 11,064 | | | | 3,881 | | | | 3,229 | |
Non-interest expense | | | (8,605 | ) | | | (7,590 | ) | | | (7,381 | ) | | | (2,425 | ) | | | (2,023 | ) |
Pre-provision, pre-tax earnings | | | 5,113 | | | | 4,620 | | | | 3,683 | | | | 1,456 | | | | 1,206 | |
Provision for credit losses | | | (857 | ) | | �� | (1,049 | ) | | | (1,603 | ) | | | (290 | ) | | | (253 | ) |
Provision for income taxes | | | (917 | ) | | | (687 | ) | | | (217 | ) | | | (250 | ) | | | (196 | ) |
Non-controlling interest in subsidiaries | | | (73 | ) | | | (74 | ) | | | (76 | ) | | | (19 | ) | | | (18 | ) |
Net income | | | 3,266 | | | | 2,810 | | | | 1,787 | | | | 897 | | | | 739 | |
| | | | | |
Reported Measures | | | | | | | | | | | | | | | | | | | | |
EPS ($) | | | 5.26 | | | | 4.75 | | | | 3.08 | | | | 1.34 | | | | 1.24 | |
Net income growth (%) | | | 16.2 | | | | 57.2 | | | | (9.7 | ) | | | 21.3 | | | | 14.2 | |
EPS growth (%) | | | 10.7 | | | | 54.2 | | | | (18.1 | ) | | | 8.1 | | | | 11.7 | |
Revenue growth (%) | | | 12.3 | | | | 10.4 | | | | 8.4 | | | | 20.2 | | | | 8.0 | |
Non-interest expense growth (%) | | | 13.4 | | | | 2.8 | | | | 7.1 | | | | 20.0 | | | | 13.7 | |
Productivity ratio (%) | | | 62.7 | | | | 62.2 | | | | 66.7 | | | | 62.5 | | | | 62.6 | |
Operating leverage (%) | | | (1.1 | ) | | | 7.6 | | | | 1.3 | | | | 0.2 | | | | (5.7 | ) |
Return on equity (%) | | | 15.3 | | | | 14.9 | | | | 9.9 | | | | 14.3 | | | | 15.1 | |
| | | | | |
Adjusting Items | | | | | | | | | | | | | | | | | | | | |
Charges to net interest income | | | | | | | | | | | | | | | | | | | | |
Hedge of foreign exchange risk on purchase of M&I | | | (20 | ) | | | – | | | | – | | | | – | | | | – | |
Recognition of a portion of the credit mark on the acquired M&I loan portfolio | | | 271 | | | | – | | | | – | | | | 271 | | | | – | |
Charges to non-interest revenue | | | | | | | | | | | | | | | | | | | | |
Deterioration in capital markets environment | | | – | | | | – | | | | (521 | ) | | | – | | | | – | |
| | | | | |
Charges to non-interest expense | | | | | | | | | | | | | | | | | | | | |
Costs of M&I integration and restructuring | | | (131 | ) | | | – | | | | – | | | | (53 | ) | | | – | |
Amortization of acquisition-related intangible assets | | | (70 | ) | | | (36 | ) | | | (43 | ) | | | (34 | ) | | | (11 | ) |
Severance costs | | | – | | | | – | | | | (118 | ) | | | – | | | | – | |
| | | | | |
Changes to provision for credit losses | | | | | | | | | | | | | | | | | | | | |
Specific provisions for credit losses on the acquired M&I loan portfolio | | | (18 | ) | | | – | | | | – | | | | (18 | ) | | | – | |
Increase in the general allowance on the acquired M&I loan portfolio | | | (80 | ) | | | – | | | | – | | | | (80 | ) | | | – | |
Decrease (increase) in the general allowance | | | 42 | | | | – | | | | (60 | ) | | | – | | | | – | |
| | | | | |
Income tax benefit (charge) related to the above | | | (9 | ) | | | 4 | | | | 233 | | | | (39 | ) | | | (2 | ) |
| | | | | |
After-Tax Impact of Adjusting Items | | | | | | | | | | | | | | | | | | | | |
Hedge of foreign exchange risk on purchase of M&I | | | (14 | ) | | | – | | | | – | | | | – | | | | – | |
Recognition of a portion of the credit mark on the acquired M&I loan portfolio | | | 167 | | | | – | | | | – | | | | 167 | | | | – | |
Deterioration in capital markets environment | | | – | | | | – | | | | (355 | ) | | | – | | | | – | |
Costs of M&I integration and restructuring | | | (84 | ) | | | – | | | | – | | | | (35 | ) | | | – | |
Amortization of acquisition-related intangible assets | | | (54 | ) | | | (32 | ) | | | (35 | ) | | | (25 | ) | | | (9 | ) |
Severance costs | | | – | | | | – | | | | (80 | ) | | | – | | | | – | |
Specific provisions for credit losses on the acquired M&I loan portfolio | | | (11 | ) | | | – | | | | – | | | | (11 | ) | | | – | |
Increase in the general allowance for credit losses on the acquired M&I loan portfolio | | | (49 | ) | | | – | | | | – | | | | (49 | ) | | | – | |
Decrease (increase) in the general allowance | | | 30 | | | | – | | | | (39 | ) | | | – | | | | – | |
Adjusting items in net income | | | (15 | ) | | | (32 | ) | | | (509 | ) | | | 47 | | | | (9 | ) |
EPS ($) | | | (0.03 | ) | | | (0.06 | ) | | | (0.21 | ) | | | 0.07 | | | | (0.02 | ) |
| | | | | |
Adjusted Results(1) | | | | | | | | | | | | | | | | | | | | |
Revenue | | | 13,467 | | | | 12,210 | | | | 11,585 | | | | 3,610 | | | | 3,229 | |
Non-interest expense | | | (8,404 | ) | | | (7,554 | ) | | | (7,220 | ) | | | (2,338 | ) | | | (2,012 | ) |
Pre-provision, pre-tax earnings | | | 5,063 | | | | 4,656 | | | | 4,365 | | | | 1,272 | | | | 1,217 | |
Provision for credit losses | | | (801 | ) | | | (1,049 | ) | | | (1,543 | ) | | | (192 | ) | | | (253 | ) |
Provision for income taxes | | | (908 | ) | | | (691 | ) | | | (450 | ) | | | (211 | ) | | | (198 | ) |
Non-controlling interest in subsidiaries | | | (73 | ) | | | (74 | ) | | | (76 | ) | | | (19 | ) | | | (18 | ) |
Adjusted net income | | | 3,281 | | | | 2,842 | | | | 2,296 | | | | 850 | | | | 748 | |
| | | | | |
Adjusted Measures(1) | | | | | | | | | | | | | | | | | | | | |
EPS ($) | | | 5.29 | | | | 4.81 | | | | 4.02 | | | | 1.27 | | | | 1.26 | |
Net income growth (%) | | | 15.5 | | | | 23.7 | | | | (5.8 | ) | | | 13.7 | | | | 8.5 | |
EPS growth (%) | | | 10.0 | | | | 19.7 | | | | (13.9 | ) | | | 0.8 | | | | 6.8 | |
Revenue growth (%) | | | 10.3 | | | | 5.4 | | | | 9.4 | | | | 11.8 | | | | 6.3 | |
Non-interest expense growth (%) | | | 11.3 | | | | 4.6 | | | | 5.4 | | | | 16.2 | | | | 13.7 | |
Productivity ratio (%) | | | 62.4 | | | | 61.9 | | | | 62.3 | | | | 64.8 | | | | 62.3 | |
Operating leverage (%) | | | (1.0 | ) | | | 0.8 | | | | 5.6 | | | | (4.4 | ) | | | (7.4 | ) |
Return on equity (%) | | | 15.3 | | | | 15.0 | | | | 12.9 | | | | 13.5 | | | | 15.3 | |
| | (1) | Adjusted results and measures are non-GAAP. The effects of all of the above adjusting items are recorded in Corporate Services, except the amortization of acquisition-related intangible assets, which applies to all groups, and the charges for the deterioration in the capital markets environment, which were included in BMO Capital Markets. |
| | The table above outlines non-GAAP measures used by BMO together with their closest GAAP counterparts. |
| | | | |
| BMO Financial Group 194th Annual Report 2011 | | | 95 | |
MANAGEMENT’S DISCUSSION AND ANALYSIS
2010 Financial Performance Review
The preceding discussions in the MD&A focused on our performance in 2011. This section summarizes our performance in fiscal 2010 relative to fiscal 2009. As noted on page 26, certain prior year data has been restated to conform to the presentation in 2011, including restatements arising from transfers between operating groups. Further information on restatements is provided on page 45.
Net income increased $1,023 million or 57% to $2,810 million in fiscal 2010 and earnings per share (EPS) increased $1.67 or 54% to $4.75. Adjusted net income increased $546 million or 24% to $2,842 million and adjusted EPS increased $0.79 or 20% to $4.81. Adjusting items are detailed on pages 34 and 95. Adjusted return on equity was 15.0%, up from 12.9% in 2009, primarily due to an increase of more than $1 billion in earnings available to common shareholders. Average common shareholders’ equity increased $1.1 billion from 2009 as we chose to increase equity to support investors’ and depositors’ confidence and provide greater functional and strategic flexibility.
Revenue increased $1,146 million or 10% in 2010 to $12,210 million. There was solid revenue growth in each of the operating groups except P&C U.S., where revenues were modestly higher on a U.S. dollar basis. Revenues in BMO Capital Markets in 2009 were elevated by favourable market conditions but were lowered by a charge of $521 million related to deterioration in the capital markets environment. There were no such charges in 2010. The weaker U.S. dollar lowered overall revenue growth by $365 million or 3.3 percentage points, while the net impact of acquired businesses increased revenue growth by $214 million or 1.9 percentage points. For the third consecutive year, there was solid growth in both BMO’s net interest income and non-interest revenue.
There was an improvement in the overall global economic environment during 2010, but conditions in some sectors remained challenging, particularly in the United States. BMO recorded $1,049 million of specific provisions for credit losses in 2010, with no change to the general allowance for credit losses. This compared to the $1,603 million provision recorded in 2009, which comprised specific provisions of $1,543 million and a $60 million increase in the general allowance.
Non-interest expense increased $209 million or 2.8% to $7,590 million. The net effect of businesses acquired in 2010 and 2009 increased expenses in 2010 relative to 2009 by $152 million (2.1%), excluding the impact of integration costs and the amortization of acquisition-related intangible assets. The weaker U.S. dollar reduced costs in 2010 by $213 million (2.9%). Higher performance-based compensation costs increased expenses by $117 million (1.6%), in line with improved revenues. Other employee compensation expense, which includes salaries and employee benefits, decreased $138 million or 4.5% from 2009, in part due to severance costs in 2009 and the weaker U.S. dollar in 2010. Adjusting for these items, other compensation expense increased. There were also increases in premises and equipment costs and other expenses, due largely to business acquisitions, higher initiative spending and the implementation of the harmonized sales tax in Ontario and British Columbia in July 2010. Employment levels increased in 2010 by 1,774 full-time equivalent employees or 4.9% to 37,947 full-time equivalent employees at October 31, 2010 due to acquisitions and continued investment in our businesses.
The provision for income taxes was $687 million in 2010, compared with $217 million in 2009. The effective tax rate in 2010 was 19.2%, compared with 10.5% in 2009. The higher effective tax rate in 2010 was mainly attributable to proportionately lower income from lower-tax-rate jurisdictions. There were also proportionately lower levels of recoveries of prior years’ income taxes and tax-exempt income.
Net income in P&C Canada rose $211 million or 15% from 2009 to $1,640 million. Revenue increased $543 million or 10% to $5,831 million. Results reflected volume growth in most products and improvements in net interest margin, as well as the impact of the inclusion of ten months of the results of the Diners Club business in
2010. There was strong revenue growth across personal banking, commercial banking and cards and payment services, with revenues in each growing by 9% or more. Non-interest expense increased $163 million or 5.8% to $2,985 million due to higher initiatives costs, the $45 million impact of the inclusion of the results of the Diners Club business and higher employee-related costs.
Net income in P&C U.S. decreased $105 million or 33% to $214 million in 2010. On a U.S. dollar basis, net income decreased $66 million or 24%. Revenue decreased $166 million to $1,429 million, but increased $6 million on a U.S. dollar basis. Non-interest expense decreased $39 million or 3.8% to $978 million, but increased $66 million or 7.6% on a U.S. dollar basis. Results were affected by acquisitions, integration costs, a valuation adjustment on our serviced mortgage portfolio and changes in the Visa litigation accrual. The acquisition of certain assets and liabilities of a Rockford, Illinois-based bank from the FDIC late in the second quarter of 2010 raised revenue and expenses. Loan spread improvement was more than offset by the effects of a reduction in commercial loan balances and deposit spread compression.
Net income in Private Client Group was $460 million, up $99 million or 27% from 2009. There was strong growth in net income in PCG, excluding insurance, and a modest decrease in insurance. Results in 2009 included a charge of $17 million ($11 million after tax) related to the decision to assist some of our U.S. clients by purchasing auction-rate securities from their accounts in the difficult capital markets environment, and a $23 million recovery of prior periods’ income taxes. Revenue of $2,245 million increased $233 million or 12%. The increase reflected revenue growth across all of our businesses due in part to increases in client assets under management and administration. Insurance revenues increased due in part to higher insurance premiums and the inclusion of a full year’s results of BMO Life Assurance, offset in part by the effects of unfavourable market movements on policyholder liabilities. Non-interest expense of $1,625 million increased $59 million or 3.7%, primarily due to higher revenue-based costs, in line with improved performance.
Net income in BMO Capital Markets decreased $54 million to $816 million. Results in 2009 were affected by charges of $521 million ($355 million after tax) related to deterioration in the capital markets environment. Revenue increased $193 million to $3,278 million in 2010. Revenue growth reflected the work we have undertaken in focusing on our core client base. Net interest income was lower due to reductions in returns from our interest-rate-sensitive businesses, which benefited from favourable market spreads in the prior year, and in corporate banking, primarily due to lower asset levels. Non-interest revenue increased as mergers and acquisitions and debt underwriting fees improved considerably, while equity underwriting fees decreased from elevated levels in the prior year. There were investment securities gains in 2010 compared to significant losses in the prior year. Trading revenues decreased in a less favourable trading environment. Provisions for credit losses were higher on an expected loss basis. Non-interest expense increased $81 million or 4.6% to $1,825 million due to increased employee costs, as we made strategic hires across our operations to position our business for future growth, and higher other expenses, including a litigation settlement.
Corporate Services net loss for the year was $320 million, compared with a net loss of $1,192 million in 2009. The improvement was attributable to an $821 million reduction in provisions for credit losses charged to Corporate Services under our expected loss provisioning methodology, and higher revenues. The improvement in revenues was primarily related to a decrease in the negative carry on certain asset-liability interest rate positions as a result of management actions and more stable market conditions, as well as the diminished impact in 2010 of funding activities undertaken in prior years that enhanced our strong liquidity position.
Adjusted results in this section are non-GAAP and are discussed in the Non-GAAP Measures section on page 94.
| | |
| 96 | | BMO Financial Group 194th Annual Report 2011 |
Review of Fourth Quarter Performance
Reported net income for the fourth quarter was $897 million, up 21% or $158 million from a year ago. Adjusted net income for the fourth quarter was $850 million, up 14% or $102 million from a year ago. Adjusted results for the quarter exclude: $107 million after-tax net benefit related to the acquired M&I loan portfolio; $53 million pre-tax ($35 million after tax) of integration costs; and $34 million pre-tax ($25 million after tax) of amortization of acquisition-related intangible assets. Summary income statements and data for the quarter and comparative quarters are outlined on page 99.
Amounts in the rest of this Review of Fourth Quarter Performance section are stated on an adjusted basis.
Net income growth reflected strong results in P&C U.S., benefiting from the inclusion of a full quarter of results of the acquired M&I business. Private Client Group net income growth was also good, reflecting higher net income in PCG excluding insurance. P&C Canada net income was modestly higher than a year ago, with the impact of volume growth offset in part by the effects of lower net interest margin in a low interest rate environment, and increased expenses due to higher initiative spending, as expected. BMO Capital Markets results were lower given a weaker market environment. Overall, we had strong revenue growth, higher provisions for credit losses and higher expenses related to the acquired M&I business.
Personal and Commercial Banking net income grew $128 million or 27%. P&C Canada net income increased $6 million or 1.6% to $427 million. Revenue increased $17 million or 1.1%, driven by volume growth across most products, partially offset by the impact of lower net interest margin due to lower deposit spreads in a low interest rate environment, competitive mortgage pricing and lower mortgage refinancing fees. Provisions for credit losses increased $6 million or 3.5% due to growth in the portfolio. Non-interest expense increased $22 million or 2.9% due to increased initiative spending and higher employee-related costs, partially offset by lower advertising costs.
P&C U.S. net income was US$171 million, up US$122 million, of which US$111 million was attributable to the acquired M&I business. Revenue of US$787 million increased US$424 million, of which US$419 million was attributable to the acquired business. The remaining US$5 million increase was due to the benefit of higher deposit balances and increased loan spreads, as a result of a favourable charge in the mix of loan balances, largely offset by deposit spread compression and lower fee revenue. Non-interest expense of US$451 million was US$193 million higher including the US$208 million impact of the acquired business. The remaining expenses were down US$15 million from a year ago, primarily due to lower integration expenses associated with the Rockford acquisition.
Private Client Group net income was $150 million, up $20 million or 16% from a year ago. The inclusion of a full quarter of earnings from the M&I wealth businesses added US$6 million to net income (US$10 million to adjusted net income), while the LGM acquisition resulted in a modest $3 million net loss. Revenue increased $106 million or 18% from the prior year. Private Client Group revenue, excluding insurance, increased as a result of higher client assets under management and administration. Revenue from the insurance business was down, primarily due to the adverse effect of unfavourable market movements.
BMO Capital Markets net income of $149 million decreased $66 million or 30% from a year ago. Reduced revenues and increased expenses more than offset the effect of a reduction in the provision for credit losses. Revenue decreased $131 million or 16% from the levels of a year ago, to $705 million, due to challenging market conditions. There was a significant reduction in trading revenue, primarily in interest rate trading revenues, which were down from the solid levels of a year ago. The trading environment was more challenging in the current quarter,
with high levels of market volatility. The challenging market conditions also led to lower mergers and acquisitions fees and reduced lending fees. Non-interest expense increased $25 million, primarily due to higher employee costs, as we continued to invest in strategic hiring across the business.
Corporate Services net income for the quarter was a net loss of $49 million, an improvement of $20 million from a year ago. Revenues were $29 million lower, mainly due to higher residual funding costs and costs associated with supplemental liquidity, partially offset by a lower group teb. Expenses were unchanged and provisions for credit losses were $78 million lower.
BMO’s revenue increased $381 million or 12% from a year ago. M&I contributed $515 million or 14%. There were increases in each of our operating groups, except BMO Capital Markets, with particularly strong growth in P&C U.S. The weaker U.S. dollar lowered overall revenue growth by $38 million or 1.2 percentage points.
Net interest income increased $259 million or 16% from a year ago, with significant growth in P&C U.S. BMO’s overall net interest margin decreased by 10 basis points year over year as lower net interest margins in P&C Canada and BMO Capital Markets more than offset higher net interest margins in P&C U.S. Average earning assets increased $76.4 billion or 23% relative to a year ago, and, when adjusted to exclude the impact of the weaker U.S. dollar, increased $81.8 billion. Average earning assets increased in large part due to the inclusion of a full quarter of balances from the acquired business in the fourth quarter, adding $35.9 billion to BMO’s average earning assets. The increase was also due to growth in each of the groups, with particularly strong growth in BMO Capital Markets.
Non-interest revenue increased $122 million or 7.5% from a year ago. Results included $174 million attributable to the acquired business, consisting primarily of investment management fees in Private Client Group, deposit and payment service charges in P&C U.S., and other revenue. There were higher securitization revenues and an associated reduction in credit card fees as there was an increase in securitizations of credit card loans in 2011. There was a significant decrease in BMO Capital Markets non-interest revenue due to a reduction in trading revenues in a challenging trading environment, lower mergers and acquisitions fees and reduced lending fees. In addition, trading revenues were lowered in 2010 by an accounting adjustment recorded in the fourth quarter.
Non-interest expense increased $326 million or 16% from a year ago to $2,338 million. This adjusted non-interest expense in the current quarter excludes $53 million of integration and restructuring costs relating to the acquired business and $34 million in respect of the amortization of acquisition-related intangible assets. The acquired business increased non-interest expense by $305 million. The weaker U.S. dollar reduced expense growth by $25 million or 1.2 percentage points. Operating leverage was negative 4.4% in the current quarter.
The specific provisions for credit losses in the fourth quarter of 2011 were $192 million or an annualized 43 basis points of average net loans and acceptances, compared with $253 million or 58 basis points in the fourth quarter of 2010.
The provision for income taxes of $211 million increased $13 million from the fourth quarter of 2010. The effective tax rate for the quarter was 19.5%, compared with 20.5% in the fourth quarter of 2010.
Adjusted results in this section are non-GAAP and are discussed in the Non-GAAP Measures section on page 94.
| | | | |
| BMO Financial Group 194th Annual Report 2011 | | | 97 | |
MANAGEMENT’S DISCUSSION AND ANALYSIS
Quarterly Earning Trends
BMO’s results and performance measures for the past eight quarters are outlined on page 99. Periodically, certain business lines and units within the business lines are transferred between client groups to more closely align BMO’s organizational structure with its strategic priorities. Comparative figures have been restated to conform to the current presentation. During the third quarter of 2011, approximately US$1.0 billion of impaired real estate secured assets, comprised primarily of commercial real estate loans, were transferred to Corporate Services from P&C U.S. Prior period loan balances, revenues and expenses have been restated to reflect the transfer. Approximately US$1.5 billion of similar assets acquired in the M&I transaction were also included in Corporate Services. See the 2011 Review of Operating Groups Performance section on page 44.
We have remained focused on our objectives and priorities and made good progress in embracing a culture that places the customer at the centre of everything we do. Economic conditions were at times challenging for some of our businesses in 2011, but overall conditions improved and we maintained our focus on our vision and strategy, while also reporting results in 2011 that were stronger than in 2010.
BMO’s quarterly earnings, revenue and expense are modestly affected by seasonal factors. Since our second fiscal quarter has 89 days and other quarters have 92 days, second-quarter results are lower relative to other quarters because there are three fewer calendar days, and thus fewer business days. The months of July (third quarter) and August (fourth quarter) are typically characterized by lower levels of capital markets activity, which has an effect on results in Private Client Group and BMO Capital Markets. The December holiday season also contributes to a slowdown in some activities; however, credit card purchases are particularly robust in that first-quarter period, as well as in the back-to-school period that falls in our fourth quarter.
Personal and Commercial Banking earnings and revenues have trended higher through 2011 and are strong.
P&C Canada has continued to offer attractive products and offerings to meet our customers’ needs, including BMO SmartSteps for Parents, BMO Mobile Banking, a new Online Banking for Business portal and BMO MoneyLogic. Customer loyalty improved in both personal and commercial segments and we continue to see increases in the average number of product categories used by both personal and commercial customers. We have strengthened our branch network, expanded our ABM network and added to our specialized sales force. P&C Canada benefited from strong volume growth in 2010 with favourable movements in market share in a number of key businesses. P&C Canada has performed well with generally increasing revenues and profitability, and good revenue increases in both personal and commercial businesses, driven by volume growth across most products and improved net interest margin. Results include the impact of the Diners Club North American franchise effective in the first quarter of 2010. Net income has generally trended higher in 2011, with revenue and expense growth moderating over the year.
P&C U.S. continues to build a customer-focused culture centred on understanding our customers and helping them achieve their financial goals. Results in 2010 were affected by acquisition integration costs. The 2010 economic environment led to a drop in loan utilization, which affected revenue growth and net income. Commencing in the second quarter of 2010, results reflect the acquisition of select assets and liabilities of a Rockford, Illinois-based bank in an FDIC-assisted transaction. Results improved significantly in 2011 after the acquisition of M&I late in the third quarter, and due to generally improving net interest margins throughout the year.
Private Client Group is focused on helping clients reach their goals by providing a comprehensive wealth management experience. Equity
markets regained strength at the end of 2009, and the momentum continued into 2010 as conditions in equity markets improved further, driving growth in revenue and net income. Results in recent quarters reflected growth in most businesses. The variability in the 2011 quarterly trend is due to reinsurance charges and the adverse effect of long-term interest rate movements in our insurance business. Commencing in the third quarter of 2011, Private Client Group results reflect the acquisition of LGM. The fourth quarter of 2011 includes a full quarter of earnings from the acquired M&I wealth management business. M&I in particular contributed to strong results for the year.
BMO Capital Markets continues to implement a strategy of building a North American capital markets business with a unified approach to client coverage, creating a better client experience. BMO Capital Markets has refocused its business with the goal of improving its risk-return profile and concentrating on core profitable client relationships. In 2010, results varied by quarter, with strong results in the second quarter and particularly weak net income in the third quarter. The prior year’s trading results also included accounting adjustments in our equity trading business in the fourth quarter. Results in the first quarter of 2011 were particularly strong, while second quarter results returned to normal levels and third quarter results benefited from tax recoveries related to prior periods. Results were down in the fourth quarter of 2011 due to a difficult market environment.
Corporate Services quarterly net income varies in large part because of our expected loss provisioning methodology, general provisions for credit losses and the impact of recording revenue, expenses and income taxes not attributed to the client operating groups. Results showed continued improvement throughout 2010 due to a decrease in provisions for credit losses and higher revenues. Results in the second quarter of 2011 also benefited from a decrease in provisions for credit losses, including a $42 million reduction in the general allowance, and higher revenues. The third quarter of 2011 was impacted by integration costs relating to the acquisition of M&I, as well as costs relating to the hedging of foreign exchange risk on the purchase. The most recent quarter saw positive net income and includes the after-tax net benefit of credit-related items in respect of the acquired M&I loan portfolio.
The U.S. dollar has generally weakened over the past two years. It weakened further in 2011 to levels close to parity, although the decrease in its value was less pronounced than in 2010. A weaker U.S. dollar lowers the translated value of U.S.-dollar-denominated revenues, expenses, provisions for credit losses, income taxes and net income. The effect of movements in exchange rates is sometimes muted by decisions to hedge their impact within a single quarter, which is explained on page 38.
BMO’s provisions for credit losses measured as a percentage of loans and acceptances were at elevated levels at the beginning of 2010. Provisions stabilized throughout 2010, and were reduced during 2011, reflecting an improving economy and credit environment, but were increased in the most recent quarter by the impact of the acquired M&I loan portfolio in Corporate Services, as mentioned above.
The effective income tax rate can vary, as it depends on the timing of resolution of certain tax matters, recoveries of prior periods’ income taxes and the relative proportion of earnings attributable to the different jurisdictions in which we operate. The effective rate was less stable in 2011 than in 2010.
This Quarterly Earnings Trends section contains forward-looking statements. Please see the Caution Regarding Forward-Looking Statements.
| | |
| 98 | | BMO Financial Group 194th Annual Report 2011 |
Summarized Statement of Income and Quarterly Financial Measures
| | | | | | | | | | | | | | | | | | | | | | | | | | | | | | | | | | | | | | | | | | | | |
| ($ millions) | | Oct. 31
2011 | | | July 31
2011 | | | April 30
2011 | | | Jan. 31
2011 | | | Oct. 31
2010 | | | July 31
2010 | | | April 30
2010 | | | Jan. 31
2010 | | | 2011 | | | 2010 | | | 2009 | |
Net interest income | | | 2,140 | | | | 1,692 | | | | 1,620 | | | | 1,627 | | | | 1,610 | | | | 1,571 | | | | 1,522 | | | | 1,532 | | | | 7,079 | | | | 6,235 | | | | 5,570 | |
Non-interest revenue | | | 1,741 | | | | 1,582 | | | | 1,597 | | | | 1,719 | | | | 1,619 | | | | 1,336 | | | | 1,527 | | | | 1,493 | | | | 6,639 | | | | 5,975 | | | | 5,494 | |
Total revenue | | | 3,881 | | | | 3,274 | | | | 3,217 | | | | 3,346 | | | | 3,229 | | | | 2,907 | | | | 3,049 | | | | 3,025 | | | | 13,718 | | | | 12,210 | | | | 11,064 | |
Provision for credit losses – specific | | | 210 | | | | 174 | | | | 187 | | | | 248 | | | | 253 | | | | 214 | | | | 249 | | | | 333 | | | | 819 | | | | 1,049 | | | | 1,543 | |
Provision for credit losses – general | | | 80 | | | | – | | | | (42 | ) | | | – | | | | – | | | | – | | | | – | | | | – | | | | 38 | | | | – | | | | 60 | |
Non-interest expense | | | 2,425 | | | | 2,111 | | | | 2,023 | | | | 2,046 | | | | 2,023 | | | | 1,898 | | | | 1,830 | | | | 1,839 | | | | 8,605 | | | | 7,590 | | | | 7,391 | |
Restructuring charge (reversal) | | | – | | | | – | | | | – | | | | – | | | | – | | | | – | | | | – | | | | – | | | | – | | | | – | | | | (10 | ) |
Income before provision for income taxes and non-controlling interest in subsidiaries | | | 1,166 | | | | 989 | | | | 1,049 | | | | 1,052 | | | | 953 | | | | 795 | | | | 970 | | | | 853 | | | | 4,256 | | | | 3,571 | | | | 2,080 | |
Provision for income taxes | | | 250 | | | | 178 | | | | 231 | | | | 258 | | | | 196 | | | | 107 | | | | 207 | | | | 177 | | | | 917 | | | | 687 | | | | 217 | |
Non-controlling interest in subsidiaries | | | 19 | | | | 18 | | | | 18 | | | | 18 | | | | 18 | | | | 19 | | | | 18 | | | | 19 | | | | 73 | | | | 74 | | | | 76 | |
Net income | | | 897 | | | | 793 | | | | 800 | | | | 776 | | | | 739 | | | | 669 | | | | 745 | | | | 657 | | | | 3,266 | | | | 2,810 | | | | 1,787 | |
Adjusted net income | | | 850 | | | | 843 | | | | 804 | | | | 784 | | | | 748 | | | | 678 | | | | 752 | | | | 664 | | | | 3,281 | | | | 2,842 | | | | 2,296 | |
| | | | | | | | | | | |
Operating group net income: | | | | | | | | | | | | | | | | | | | | | | | | | | | | | | | | | | | | | | | | | | | | |
Personal and Commercial Banking | | | 580 | | | | 524 | | | | 455 | | | | 497 | | | | 464 | | | | 476 | | | | 450 | | | | 464 | | | | 2,056 | | | | 1,854 | | | | 1,748 | |
Private Client Group | | | 144 | | | | 120 | | | | 101 | | | | 153 | | | | 129 | | | | 105 | | | | 115 | | | | 111 | | | | 518 | | | | 460 | | | | 361 | |
BMO Capital Markets | | | 149 | | | | 279 | | | | 235 | | | | 257 | | | | 214 | | | | 130 | | | | 260 | | | | 212 | | | | 920 | | | | 816 | | | | 870 | |
Corporate Services, including T&O | | | 24 | | | | (130 | ) | | | 9 | | | | (131 | ) | | | (68 | ) | | | (42 | ) | | | (80 | ) | | | (130 | ) | | | (228 | ) | | | (320 | ) | | | (1,192 | ) |
BMO Financial Group net income | | | 897 | | | | 793 | | | | 800 | | | | 776 | | | | 739 | | | | 669 | | | | 745 | | | | 657 | | | | 3,266 | | | | 2,810 | | | | 1,787 | |
| | | | | | | | | | | |
Information per Common Share ($) | | | | | | | | | | | | | | | | | | | | | | | | | | | | | | | | | | | | | | | | | | | | |
Dividends declared | | | 0.70 | | | | 0.70 | | | | 0.70 | | | | 0.70 | | | | 0.70 | | | | 0.70 | | | | 0.70 | | | | 0.70 | | | | 2.80 | | | | 2.80 | | | | 2.80 | |
Earnings | | | | | | | | | | | | | | | | | | | | | | | | | | | | | | | | | | | | | | | | | | | | |
Basic | | | 1.35 | | | | 1.28 | | | | 1.35 | | | | 1.31 | | | | 1.25 | | | | 1.13 | | | | 1.27 | | | | 1.12 | | | | 5.28 | | | | 4.78 | | | | 3.09 | |
Diluted | | | 1.34 | | | | 1.27 | | | | 1.34 | | | | 1.30 | | | | 1.24 | | | | 1.13 | | | | 1.26 | | | | 1.12 | | | | 5.26 | | | | 4.75 | | | | 3.08 | |
Adjusted earnings | | | | | | | | | | | | | | | | | | | | | | | | | | | | | | | | | | | | | | | | | | | | |
Basic | | | 1.27 | | | | 1.36 | | | | 1.35 | | | | 1.32 | | | | 1.26 | | | | 1.15 | | | | 1.29 | | | | 1.14 | | | | 5.31 | | | | 4.83 | | | | 4.03 | |
Diluted | | | 1.27 | | | | 1.36 | | | | 1.35 | | | | 1.32 | | | | 1.26 | | | | 1.14 | | | | 1.28 | | | | 1.13 | | | | 5.29 | | | | 4.81 | | | | 4.02 | |
Book value | | | 39.53 | | | | 37.89 | | | | 34.22 | | | | 34.21 | | | | 34.09 | | | | 33.13 | | | | 32.04 | | | | 32.51 | | | | 39.53 | | | | 34.09 | | | | 31.95 | |
Market price | | | | | | | | | | | | | | | | | | | | | | | | | | | | | | | | | | | | | | | | | | | | |
High | | | 61.40 | | | | 62.74 | | | | 63.94 | | | | 62.44 | | | | 63.46 | | | | 63.94 | | | | 65.71 | | | | 56.24 | | | | 63.94 | | | | 65.71 | | | | 54.75 | |
Low | | | 55.02 | | | | 59.31 | | | | 57.81 | | | | 56.17 | | | | 54.35 | | | | 55.75 | | | | 51.11 | | | | 49.78 | | | | 55.02 | | | | 49.78 | | | | 24.05 | |
Close | | | 58.89 | | | | 60.03 | | | | 62.14 | | | | 57.78 | | | | 60.23 | | | | 62.87 | | | | 63.09 | | | | 52.00 | | | | 58.89 | | | | 60.23 | | | | 50.06 | |
| | | | | | | | | | | |
Financial Measures (%) | | | | | | | | | | | | | | | | | | | | | | | | | | | | | | | | | | | | | | | | | | | | |
Five-year average annual total shareholder return | | | 1.9 | | | | 3.9 | | | | 4.4 | | | | 1.7 | | | | 5.9 | | | | 5.6 | | | | 7.2 | | | | 3.5 | | | | 1.9 | | | | 5.9 | | | | 1.8 | |
Dividend yield | | | 4.8 | | | | 4.7 | | | | 4.5 | | | | 4.8 | | | | 4.6 | | | | 4.5 | | | | 4.4 | | | | 5.4 | | | | 4.8 | | | | 4.6 | | | | 5.6 | |
Diluted earnings per share growth | | | 8.1 | | | | 12.4 | | | | 6.3 | | | | 16.1 | | | | 11.7 | | | | 16.5 | | | | +100 | | | | +100 | | | | 10.7 | | | | 54.2 | | | | (18.1 | ) |
Adjusted diluted earnings per share growth | | | 0.8 | | | | 19.3 | | | | 5.5 | | | | 16.8 | | | | 6.8 | | | | 8.6 | | | | 21.9 | | | | 54.8 | | | | 10.0 | | | | 19.7 | | | | (13.9 | ) |
Return on equity | | | 14.3 | | | | 14.7 | | | | 16.7 | | | | 15.7 | | | | 15.1 | | | | 13.7 | | | | 16.4 | | | | 14.3 | | | | 15.3 | | | | 14.9 | | | | 9.9 | |
Adjusted return on equity | | | 13.5 | | | | 15.6 | | | | 16.8 | | | | 15.9 | | | | 15.3 | | | | 13.9 | | | | 16.6 | | | | 14.4 | | | | 15.3 | | | | 15.0 | | | | 12.9 | |
Net economic profit growth | | | 13.2 | | | | 43.0 | | | | 11.3 | | | | 48.6 | | | | 40.8 | | | | +100 | | | | +100 | | | | +100 | | | | 25.8 | | | | +100 | | | | (+100 | ) |
Net income growth | | | 21.3 | | | | 18.5 | | | | 7.5 | | | | 18.1 | | | | 14.2 | | | | 20.1 | | | | +100 | | | | +100 | | | | 16.2 | | | | 57.2 | | | | (9.7 | ) |
Adjusted net income growth | | | 13.7 | | | | 24.4 | | | | 6.9 | | | | 18.1 | | | | 8.5 | | | | 11.1 | | | | 26.4 | | | | 64.9 | | | | 15.5 | | | | 23.7 | | | | (5.8 | ) |
Revenue growth | | | 20.2 | | | | 12.6 | | | | 5.5 | | | | 10.6 | | | | 8.0 | | | | (2.4 | ) | | | 14.8 | | | | 23.9 | | | | 12.3 | | | | 10.4 | | | | 8.4 | |
Adjusted revenue growth | | | 11.8 | | | | 12.9 | | | | 5.9 | | | | 10.6 | | | | 6.3 | | | | (2.6 | ) | | | 6.2 | | | | 12.5 | | | | 10.3 | | | | 5.4 | | | | 9.4 | |
Net interest margin on earning assets | | | 2.05 | | | | 1.78 | | | | 1.89 | | | | 1.82 | | | | 1.89 | | | | 1.88 | | | | 1.88 | | | | 1.85 | | | | 1.89 | | | | 1.88 | | | | 1.63 | |
Adjusted net interest margin on earning assets | | | 1.79 | | | | 1.79 | | | | 1.90 | | | | 1.82 | | | | 1.89 | | | | 1.88 | | | | 1.88 | | | | 1.85 | | | | 1.82 | | | | 1.88 | | | | 1.63 | |
Productivity ratio | | | 62.5 | | | | 64.5 | | | | 62.9 | | | | 61.2 | | | | 62.6 | | | | 65.3 | | | | 60.0 | | | | 60.8 | | | | 62.7 | | | | 62.2 | | | | 66.7 | |
Adjusted productivity ratio | | | 64.8 | | | | 62.2 | | | | 61.6 | | | | 60.9 | | | | 62.3 | | | | 65.0 | | | | 59.7 | | | | 60.5 | | | | 62.4 | | | | 61.9 | | | | 62.3 | |
Operating leverage | | | 0.2 | | | | 1.5 | | | | (5.0 | ) | | | (0.7 | ) | | | (5.7 | ) | | | (3.8 | ) | | | 17.9 | | | | 24.0 | | | | (1.1 | ) | | | 7.6 | | | | 1.3 | |
Adjusted operating leverage | | | (4.4 | ) | | | 4.9 | | | | (3.3 | ) | | | (0.7 | ) | | | (7.4 | ) | | | (4.1 | ) | | | 2.6 | | | | 12.5 | | | | (1.0 | ) | | | 0.8 | | | | 4.0 | |
Provision for credit losses as a % of average net loans and acceptances | | | 0.56 | | | | 0.38 | | | | 0.33 | | | | 0.56 | | | | 0.58 | | | | 0.50 | | | | 0.59 | | | | 0.79 | | | | 0.46 | | | | 0.61 | | | | 0.88 | |
Effective tax rate | | | 21.4 | | | | 18.0 | | | | 22.0 | | | | 24.5 | | | | 20.6 | | | | 13.4 | | | | 21.3 | | | | 20.8 | | | | 21.5 | | | | 19.2 | | | | 10.5 | |
Canadian/U.S. dollar average exchange rate ($) | | | 1.008 | | | | 0.963 | | | | 0.962 | | | | 1.007 | | | | 1.039 | | | | 1.045 | | | | 1.027 | | | | 1.059 | | | | 0.985 | | | | 1.043 | | | | 1.165 | |
Gross impaired loans and acceptances as a % of equity and allowance for credit losses (1) | | | 8.95 | | | | 7.97 | | | | 10.22 | | | | 11.47 | | | | 12.18 | | | | 12.13 | | | | 13.25 | | | | 13.89 | | | | 8.95 | | | | 12.18 | | | | 14.92 | |
Cash and securities-to-total assets | | | 32.5 | | | | 34.6 | | | | 35.9 | | | | 35.6 | | | | 35.0 | | | | 34.6 | | | | 35.8 | | | | 33.9 | | | | 32.5 | | | | 35.0 | | | | 31.9 | |
Common Equity Ratio | | | 9.59 | | | | 9.11 | | | | 10.67 | | | | 10.15 | | | | 10.26 | | | | 10.27 | | | | 9.83 | | | | 9.21 | | | | 9.59 | | | | 10.26 | | | | 8.95 | |
Tier 1 Capital Ratio | | | 12.01 | | | | 11.48 | | | | 13.82 | | | | 13.02 | | | | 13.45 | | | | 13.55 | | | | 13.27 | | | | 12.53 | | | | 12.01 | | | | 13.45 | | | | 12.24 | |
Total Capital Ratio | | | 14.85 | | | | 14.21 | | | | 17.03 | | | | 15.17 | | | | 15.91 | | | | 16.10 | | | | 15.69 | | | | 14.82 | | | | 14.85 | | | | 15.91 | | | | 14.87 | |
| | (1) | Effective the fourth quarter of 2010, the calculation excludes non-controlling interest in subsidiaries. Prior periods have been restated to reflect this change. |
In the opinion of Bank of Montreal management, information that is derived from unaudited financial information, including information as at and for the interim periods, includes all adjustments necessary for a fair presentation of such information. All such adjustments are of a normal and recurring nature. Financial ratios for interim periods are stated on an annualized basis where appropriate, and the ratios, as well as interim operating results, are not necessarily indicative of actual results for the full fiscal year.
Net economic profit and adjusted results in this table are non-GAAP and are discussed in the Non-GAAP Measures section on page 94.
| | | | |
| BMO Financial Group 194th Annual Report 2011 | | | 99 | |
SUPPLEMENTAL INFORMATION
Supplemental Information
Table 1: Shareholder Value
| | | | | | | | | | | | | | | | | | | | | | | | | | | | | | | | | | | | | | | | |
| As at or for the year ended October 31 | | 2011 | | | 2010 | | | 2009 | | | 2008 | | | 2007 | | | 2006 | | | 2005 | | | 2004 | | | 2003 | | | 2002 | |
Market Price per Common Share($) | | | | | | | | | | | | | | | | | | | | | | | | | | | | | | | | | | | | | | | | |
High | | | 63.94 | | | | 65.71 | | | | 54.75 | | | | 63.44 | | | | 72.75 | | | | 70.24 | | | | 62.44 | | | | 59.65 | | | | 50.26 | | | | 40.65 | |
Low | | | 55.02 | | | | 49.78 | | | | 24.05 | | | | 35.65 | | | | 60.21 | | | | 56.86 | | | | 53.05 | | | | 49.28 | | | | 37.79 | | | | 31.00 | |
Close | | | 58.89 | | | | 60.23 | | | | 50.06 | | | | 43.02 | | | | 63.00 | | | | 69.45 | | | | 57.81 | | | | 57.55 | | | | 49.33 | | | | 38.10 | |
| | | | | | | | | | |
Common Share Dividends | | | | | | | | | | | | | | | | | | | | | | | | | | | | | | | | | | | | | | | | |
Dividends declared per share ($) | | | 2.80 | | | | 2.80 | | | | 2.80 | | | | 2.80 | | | | 2.71 | | | | 2.26 | | | | 1.85 | | | | 1.59 | | | | 1.34 | | | | 1.20 | |
Dividends paid per share ($) | | | 2.80 | | | | 2.80 | | | | 2.80 | | | | 2.80 | | | | 2.63 | | | | 2.13 | | | | 1.80 | | | | 1.50 | | | | 1.29 | | | | 1.18 | |
Dividend payout ratio (%) | | | 53.0 | | | | 58.6 | | | | 90.6 | | | | 73.9 | | | | 64.8 | | | | 43.0 | | | | 39.1 | | | | 35.2 | | | | 38.2 | | | | 44.0 | |
Dividend yield (%) | | | 4.8 | | | | 4.6 | | | | 5.6 | | | | 6.5 | | | | 4.3 | | | | 3.3 | | | | 3.2 | | | | 2.8 | | | | 2.7 | | | | 3.1 | |
| | | | | | | | | | |
Total Shareholder Return(%) | | | | | | | | | | | | | | | | | | | | | | | | | | | | | | | | | | | | | | | | |
Five-year average annual return | | | 1.9 | | | | 5.9 | | | | 1.8 | | | | 0.9 | | | | 14.2 | | | | 19.1 | | | | 13.8 | | | | 18.9 | | | | 12.9 | | | | 7.9 | |
One-year return | | | 2.4 | | | | 26.4 | | | | 25.1 | | | | (27.9 | ) | | | (5.8 | ) | | | 24.1 | | | | 3.7 | | | | 20.0 | | | | 33.4 | | | | 16.2 | |
| | | | | | | | | | |
Common Share Information | | | | | | | | | | | | | | | | | | | | | | | | | | | | | | | | | | | | | | | | |
Number outstanding (in thousands) | | | | | | | | | | | | | | | | | | | | | | | | | | | | | | | | | | | | | | | | |
End of period | | | 639,000 | | | | 566,468 | | | | 551,716 | | | | 504,575 | | | | 498,563 | | | | 500,726 | | | | 500,219 | | | | 500,897 | | | | 499,632 | | | | 492,505 | |
Average basic | | | 591,253 | | | | 559,822 | | | | 540,294 | | | | 502,062 | | | | 499,950 | | | | 501,257 | | | | 500,060 | | | | 501,656 | | | | 496,208 | | | | 490,816 | |
Average diluted | | | 593,555 | | | | 563,125 | | | | 542,313 | | | | 506,697 | | | | 508,614 | | | | 511,173 | | | | 510,845 | | | | 515,045 | | | | 507,009 | | | | 499,464 | |
Number of shareholder accounts | | | 58,769 | | | | 36,612 | | | | 37,061 | | | | 37,250 | | | | 37,165 | | | | 38,360 | | | | 40,104 | | | | 41,438 | | | | 42,880 | | | | 44,072 | |
Book value per share ($) | | | 39.53 | | | | 34.09 | | | | 31.95 | | | | 32.02 | | | | 28.29 | | | | 28.89 | | | | 26.48 | | | | 24.20 | | | | 22.09 | | | | 21.07 | |
Total market value of shares ($ billions) | | | 37.6 | | | | 34.1 | | | | 27.6 | | | | 21.7 | | | | 31.4 | | | | 34.8 | | | | 28.9 | | | | 28.8 | | | | 24.6 | | | | 18.8 | |
Price-to-earnings multiple (based on diluted EPS) | | | 11.2 | | | | 12.7 | | | | 16.3 | | | | 11.4 | | | | 15.3 | | | | 13.5 | | | | 12.5 | | | | 13.1 | | | | 14.3 | | | | 14.2 | |
Price-to-adjusted earnings multiple (based on diluted adjusted EPS) | | | 11.1 | | | | 12.5 | | | | 12.5 | | | | 9.2 | | | | 11.6 | | | | 13.4 | | | | 12.9 | | | | 13.4 | | | | 13.7 | | | | 11.5 | |
Market-to-book value multiple | | | 1.49 | | | | 1.77 | | | | 1.57 | | | | 1.34 | | | | 2.23 | | | | 2.40 | | | | 2.18 | | | | 2.38 | | | | 2.23 | | | | 1.81 | |
Table 2: Summary Income Statement and Growth Statistics($ millions, except as noted)
| | | | | | | | | | | | | | | | | | | | | | | | | | | | |
| For the year ended October 31 | | 2011 | | | 2010 | | | 2009 | | | 2008 | | | 2007 | | | 5-year
CAGR (1) | | | 10-year
CAGR (1) | |
Income Statement | | | | | | | | | | | | | | | | | | | | | | | | | | | | |
Net interest income | | | 7,079 | | | | 6,235 | | | | 5,570 | | | | 5,072 | | | | 4,829 | | | | 8.4 | | | | 4.9 | |
Non-interest revenue | | | 6,639 | | | | 5,975 | | | | 5,494 | | | | 5,133 | | | | 4,520 | | | | 4.8 | | | | 4.6 | |
Total revenue | | | 13,718 | | | | 12,210 | | | | 11,064 | | | | 10,205 | | | | 9,349 | | | | 6.6 | | | | 4.8 | |
Provision for credit losses | | | 857 | | | | 1,049 | | | | 1,603 | | | | 1,330 | | | | 353 | | | | nm | | | | nm | |
Non-interest expense | | | 8,605 | | | | 7,590 | | | | 7,381 | | | | 6,894 | | | | 6,601 | | | | 6.3 | | | | 4.3 | |
Income before provision for income taxes and non-controlling interest in subsidiaries | | | 4,256 | | | | 3,571 | | | | 2,080 | | | | 1,981 | | | | 2,395 | | | | 4.3 | | | | 8.1 | |
Provision for (recovery of) income taxes | | | 917 | | | | 687 | | | | 217 | | | | (71 | ) | | | 189 | | | | 5.1 | | | | 6.7 | |
Non-controlling interest in subsidiaries | | | 73 | | | | 74 | | | | 76 | | | | 74 | | | | 75 | | | | (0.7 | ) | | | 14.7 | |
Net income | | | 3,266 | | | | 2,810 | | | | 1,787 | | | | 1,978 | | | | 2,131 | | | | 4.2 | | | | 8.8 | |
Year-over-year net income growth (%) | | | 16.2 | | | | 57.2 | | | | (9.7 | ) | | | (7.2 | ) | | | (20.0 | ) | | | na | | | | na | |
Adjusted net income | | | 3,281 | | | | 2,842 | | | | 2,296 | | | | 2,438 | | | | 2,806 | | | | 4.2 | | | | 8.1 | |
Year-over-year adjusted net income growth (%) | | | 15.5 | | | | 23.7 | | | | (5.8 | ) | | | (13.1 | ) | | | (4.8 | ) | | | na | | | | na | |
| | | | | | | |
Earnings per Share (EPS)($) | | | | | | | | | | | | | | | | | | | | | | | | | | | | |
Basic | | | 5.28 | | | | 4.78 | | | | 3.09 | | | | 3.79 | | | | 4.18 | | | | 0.1 | | | | 6.9 | |
Diluted | | | 5.26 | | | | 4.75 | | | | 3.08 | | | | 3.76 | | | | 4.11 | | | | 0.4 | | | | 7.1 | |
Year-over-year growth (%) | | | 10.7 | | | | 54.2 | | | | (18.1 | ) | | | (8.5 | ) | | | (20.2 | ) | | | na | | | | na | |
| | | | | | | |
Adjusted Diluted Earnings per share (Adjusted Diluted EPS)($) (2) | | | 5.29 | | | | 4.81 | | | | 4.02 | | | | 4.67 | | | | 5.43 | | | | 0.4 | | | | 6.4 | |
Year-over-year growth (%) | | | 10.0 | | | | 19.7 | | | | (13.9 | ) | | | (14.0 | ) | | | 4.8 | | | | na | | | | na | |
| | (1) | Compound annual growth rate (CAGR) expressed as a percentage. |
| | (2) | This is a non-GAAP measure. Refer to the Non-GAAP Measures section on page 94. |
nm – not meaningful
na – not applicable
Throughout this Supplemental Information section, certain amounts for years prior to 2004 have not been restated to reflect changes in accounting policies in 2006 as the changes were not significant.
| | |
| 100 | | BMO Financial Group 194th Annual Report 2011 |
Table 3: Returns on Equity and Assets($ millions, except as noted)
| | | | | | | | | | | | | | | | | | | | | | | | | | | | | | | | | | | | | | | | |
| For the year ended October 31 | | 2011 | | | 2010 | | | 2009 | | | 2008 | | | 2007 | | | 2006 | | | 2005 | | | 2004 | | | 2003 | | | 2002 | |
Net income | | | 3,266 | | | | 2,810 | | | | 1,787 | | | | 1,978 | | | | 2,131 | | | | 2,663 | | | | 2,396 | | | | 2,295 | | | | 1,781 | | | | 1,373 | |
Preferred dividends | | | 144 | | | | 136 | | | | 120 | | | | 73 | | | | 43 | | | | 30 | | | | 30 | | | | 31 | | | | 38 | | | | 35 | |
Net income available to common shareholders | | | 3,122 | | | | 2,674 | | | | 1,667 | | | | 1,905 | | | | 2,088 | | | | 2,633 | | | | 2,366 | | | | 2,264 | | | | 1,743 | | | | 1,338 | |
Average common shareholders’ equity | | | 20,452 | | | | 17,980 | | | | 16,865 | | | | 14,612 | | | | 14,506 | | | | 13,703 | | | | 12,577 | | | | 11,696 | | | | 10,646 | | | | 9,973 | |
Adjusted net income | | | 3,281 | | | | 2,842 | | | | 2,296 | | | | 2,438 | | | | 2,806 | | | | 2,676 | | | | 2,328 | | | | 2,243 | | | | 1,860 | | | | 1,487 | |
Return on equity (%) | | | 15.3 | | | | 14.9 | | | | 9.9 | | | | 13.0 | | | | 14.4 | | | | 19.2 | | | | 18.8 | | | | 19.4 | | | | 16.4 | | | | 13.4 | |
Adjusted return on equity (%) | | | 15.3 | | | | 15.0 | | | | 12.9 | | | | 16.2 | | | | 19.0 | | | | 19.3 | | | | 18.3 | | | | 18.9 | | | | 17.1 | | | | 14.6 | |
Return on average assets (%) | | | 0.74 | | | | 0.71 | | | | 0.41 | | | | 0.50 | | | | 0.59 | | | | 0.86 | | | | 0.81 | | | | 0.87 | | | | 0.67 | | | | 0.55 | |
Return on average assets available to common shareholders (%) | | | 0.70 | | | | 0.67 | | | | 0.38 | | | | 0.48 | | | | 0.58 | | | | 0.85 | | | | 0.80 | | | | 0.86 | | | | 0.66 | | | | 0.54 | |
Table 4: Summary Balance Sheet($ millions)
| | | | | | | | | | | | | | | | | | | | |
| As at October 31 | | 2011 | | | 2010 | | | 2009 | | | 2008 | | | 2007 | |
Assets | | | | | | | | | | | | | | | | | | | | |
Cash and cash equivalents | | | 19,626 | | | | 17,368 | | | | 9,955 | | | | 9,134 | | | | 3,650 | |
Interest bearing deposits with banks | | | 3,968 | | | | 3,186 | | | | 3,340 | | | | 11,971 | | | | 19,240 | |
Securities | | | 131,346 | | | | 123,399 | | | | 110,813 | | | | 100,138 | | | | 98,277 | |
Securities borrowed or purchased under resale agreements | | | 37,970 | | | | 28,102 | | | | 36,006 | | | | 28,033 | | | | 37,093 | |
Net loans and acceptances | | | 206,498 | | | | 176,643 | | | | 167,829 | | | | 186,962 | | | | 164,095 | |
Other assets | | | 78,015 | | | | 62,942 | | | | 60,515 | | | | 79,812 | | | | 44,169 | |
Total assets | | | 477,423 | | | | 411,640 | | | | 388,458 | | | | 416,050 | | | | 366,524 | |
Liabilities and Shareholders’ Equity | | | | | | | | | | | | | | | | | | | | |
Deposits | | | 302,932 | | | | 249,251 | | | | 236,156 | | | | 257,670 | | | | 232,050 | |
Other liabilities | | | 140,620 | | | | 135,933 | | | | 126,719 | | | | 134,761 | | | | 114,330 | |
Subordinated debt | | | 5,348 | | | | 3,776 | | | | 4,236 | | | | 4,315 | | | | 3,446 | |
Capital trust securities | | | 400 | | | | 800 | | | | 1,150 | | | | 1,150 | | | | 1,150 | |
Preferred share liability | | | – | | | | – | | | | – | | | | 250 | | | | 250 | |
Share capital | | | | | | | | | | | | | | | | | | | | |
Preferred | | | 2,861 | | | | 2,571 | | | | 2,571 | | | | 1,746 | | | | 1,196 | |
Common | | | 11,190 | | | | 6,927 | | | | 6,198 | | | | 4,708 | | | | 4,411 | |
Contributed surplus | | | 113 | | | | 92 | | | | 79 | | | | 69 | | | | 58 | |
Retained earnings | | | 14,275 | | | | 12,848 | | | | 11,748 | | | | 11,632 | | | | 11,166 | |
Accumulated other comprehensive loss | | | (316 | ) | | | (558 | ) | | | (399 | ) | | | (251 | ) | | | (1,533 | ) |
Total liabilities and shareholders’ equity | | | 477,423 | | | | 411,640 | | | | 388,458 | | | | 416,050 | | | | 366,524 | |
Average Daily Balances | | | | | | | | | | | | | | | | | | | | |
Net loans and acceptances | | | 186,600 | | | | 171,554 | | | | 182,097 | | | | 175,079 | | | | 165,783 | |
Assets | | | 443,649 | | | | 398,474 | | | | 438,548 | | | | 397,609 | | | | 360,575 | |
Table 5: Liquid Assets($ millions, except as noted)
| | | | | | | | | | | | | | | | | | | | |
| As at October 31 | | 2011 | | | 2010 | | | 2009 | | | 2008 | | | 2007 | |
Canadian Dollar Liquid Assets | | | | | | | | | | | | | | | | | | | | |
Deposits with other banks | | | 379 | | | | 672 | | | | 787 | | | | 1,842 | | | | 1,531 | |
Other cash resources | | | 5,693 | | | | 1,595 | | | | 2,411 | | | | 89 | | | | 1,981 | |
Securities | | | 88,406 | | | | 75,533 | | | | 74,249 | | | | 58,639 | | | | 57,206 | |
Total Canadian dollar liquid assets | | | 94,478 | | | | 77,800 | | | | 77,447 | | | | 60,570 | | | | 60,718 | |
U.S. Dollar and Other Currencies Liquid Assets | | | | | | | | | | | | | | | | | | | | |
Deposits with other banks | | | 21,173 | | | | 18,661 | | | | 9,305 | | | | 16,477 | | | | 19,209 | |
Other cash resources | | | (3,651 | ) | | | (374 | ) | | | 792 | | | | 2,697 | | | | 169 | |
Securities | | | 42,940 | | | | 47,866 | | | | 36,564 | | | | 41,499 | | | | 41,071 | |
Total U.S. dollar and other currencies liquid assets | | | 60,462 | | | | 66,153 | | | | 46,661 | | | | 60,673 | | | | 60,449 | |
Total Liquid Assets(1) | | | 154,940 | | | | 143,953 | | | | 124,108 | | | | 121,243 | | | | 121,167 | |
Cash and securities-to-total assets (%) | | | 32.5 | | | | 35.0 | | | | 31.9 | | | | 29.1 | | | | 33.1 | |
Pledged assets included in total liquid assets (2) | | | 40,586 | | | | 46,458 | | | | 34,511 | | | | 38,142 | | | | 30,369 | |
| | (1) | Includes liquid assets pledged as security for securities sold but not yet purchased, securities lent or sold under repurchase agreements and other secured liabilities. |
| | (2) | Includes reserves or minimum balances which some of our subsidiaries are required to maintain with central banks in their respective countries of operation. |
| | | | |
| BMO Financial Group 194th Annual Report 2011 | | | 101 | |
SUPPLEMENTAL INFORMATION
Table 6: Other Statistical Information
| | | | | | | | | | | | | | | | | | | | | | | | | | | | | | | | | | | | | | | | |
| As at or for the year ended October 31 | | 2011 | | | 2010 | | | 2009 | | | 2008 | | | 2007 | | | 2006 | | | 2005 | | | 2004 | | | 2003 | | | 2002 | |
Other Information | | | | | | | | | | | | | | | | | | | | | | | | | | | | | | | | | | | | | | | | |
Employees (1) | | | 47,180 | | | | 37,947 | | | | 36,173 | | | | 37,073 | | | | 35,827 | | | | 34,942 | | | | 33,785 | | | | 33,593 | | | | 33,993 | | | | 34,568 | |
Bank branches | | | | | | | | | | | | | | | | | | | | | | | | | | | | | | | | | | | | | | | | |
Canada | | | 920 | | | | 910 | | | | 900 | | | | 983 | | | | 977 | | | | 963 | | | | 968 | | | | 988 | | | | 970 | | | | 968 | |
United States | | | 688 | | | | 321 | | | | 290 | | | | 292 | | | | 243 | | | | 215 | | | | 208 | | | | 182 | | | | 168 | | | | 162 | |
Other | | | 3 | | | | 3 | | | | 5 | | | | 5 | | | | 4 | | | | 4 | | | | 4 | | | | 4 | | | | 4 | | | | 4 | |
Total | | | 1,611 | | | | 1,234 | | | | 1,195 | | | | 1,280 | | | | 1,224 | | | | 1,182 | | | | 1,180 | | | | 1,174 | | | | 1,142 | | | | 1,134 | |
Automated banking machines | | | | | | | | | | | | | | | | | | | | | | | | | | | | | | | | | | | | | | | | |
Canada | | | 2,155 | | | | 2,076 | | | | 2,030 | | | | 2,026 | | | | 1,978 | | | | 1,936 | | | | 1,952 | | | | 1,993 | | | | 2,023 | | | | 2,000 | |
United States | | | 1,366 | | | | 905 | | | | 636 | | | | 640 | | | | 583 | | | | 547 | | | | 539 | | | | 479 | | | | 439 | | | | 403 | |
Total | | | 3,521 | | | | 2,981 | | | | 2,666 | | | | 2,666 | | | | 2,561 | | | | 2,483 | | | | 2,491 | | | | 2,472 | | | | 2,462 | | | | 2,403 | |
| | | | | | | | | | |
Rates | | | | | | | | | | | | | | | | | | | | | | | | | | | | | | | | | | | | | | | | |
Average Canadian prime rate (%) | | | 3.00 | | | | 2.46 | | | | 2.70 | | | | 5.21 | | | | 6.08 | | | | 5.57 | | | | 4.30 | | | | 4.05 | | | | 4.69 | | | | 4.15 | |
Average U.S. prime rate (%) | | | 3.25 | | | | 3.25 | | | | 3.34 | | | | 5.69 | | | | 8.19 | | | | 7.76 | | | | 5.85 | | | | 4.17 | | | | 4.17 | | | | 4.79 | |
Canadian/U.S. dollar exchange rates ($) | | | | | | | | | | | | | | | | | | | | | | | | | | | | | | | | | | | | | | | | |
High | | | 1.06 | | | | 1.08 | | | | 1.30 | | | | 1.29 | | | | 1.19 | | | | 1.20 | | | | 1.27 | | | | 1.40 | | | | 1.59 | | | | 1.61 | |
Low | | | 0.94 | | | | 1.00 | | | | 1.03 | | | | 0.92 | | | | 0.95 | | | | 1.10 | | | | 1.16 | | | | 1.22 | | | | 1.30 | | | | 1.51 | |
Average | | | 0.99 | | | | 1.04 | | | | 1.16 | | | | 1.03 | | | | 1.09 | | | | 1.13 | | | | 1.21 | | | | 1.31 | | | | 1.44 | | | | 1.57 | |
End of year | | | 1.00 | | | | 1.02 | | | | 1.08 | | | | 1.20 | | | | 0.94 | | | | 1.12 | | | | 1.18 | | | | 1.22 | | | | 1.32 | | | | 1.56 | |
| | (1) | Reflects full-time equivalent number of employees, comprising full-time and part-time employees and adjustments for overtime hours. |
Table 7: Revenue and Revenue Growth($ millions, except as noted)
| | | | | | | | | | | | | | | | | | | | | | | | | | | | |
| For the year ended October 31 | | 2011 | | | 2010 | | | 2009 | | | 2008 | | | 2007 | | | 5-year
CAGR | | | 10-year
CAGR | |
Net Interest Income | | | 7,079 | | | | 6,235 | | | | 5,570 | | | | 5,072 | | | | 4,829 | | | | 8.4 | | | | 4.9 | |
Year-over-year growth (%) | | | 13.5 | | | | 11.9 | | | | 9.8 | | | | 5.0 | | | | 2.0 | | | | na | | | | na | |
| | | | | | | |
Net Interest Margin(1) | | | | | | | | | | | | | | | | | | | | | | | | | | | | |
Average earning assets | | | 374,390 | | | | 332,468 | | | | 341,848 | | | | 326,803 | | | | 304,471 | | | | 7.4 | | | | 6.3 | |
Net interest margin (%) | | | 1.89 | | | | 1.88 | | | | 1.63 | | | | 1.55 | | | | 1.59 | | | | na | | | | na | |
Adjusted net interest margin (%) | | | 1.82 | | | | 1.88 | | | | 1.63 | | | | 1.55 | | | | 1.59 | | | | na | | | | na | |
Canadian dollar net interest margin (%) | | | 2.04 | | | | 2.12 | | | | 1.78 | | | | 2.00 | | | | 2.12 | | | | na | | | | na | |
U.S. dollar and other currencies net interest margin (%) | | | 1.66 | | | | 1.47 | | | | 1.43 | | | | 0.92 | | | | 0.80 | | | | na | | | | na | |
| | | | | | | |
Non-Interest Revenue | | | | | | | | | | | | | | | | | | | | | | | | | | | | |
Securities commissions and fees | | | 1,186 | | | | 1,048 | | | | 973 | | | | 1,105 | | | | 1,145 | | | | 2.5 | | | | 4.8 | |
Deposit and payment service charges | | | 834 | | | | 802 | | | | 820 | | | | 756 | | | | 728 | | | | 2.7 | | | | 2.2 | |
Trading revenues (losses) | | | 571 | | | | 504 | | | | 723 | | | | 546 | | | | (487 | ) | | | (4.5 | ) | | | 1.5 | |
Lending fees | | | 577 | | | | 572 | | | | 556 | | | | 429 | | | | 406 | | | | 11.4 | | | | 5.1 | |
Card fees | | | 145 | | | | 233 | | | | 121 | | | | 291 | | | | 107 | | | | (18.2 | ) | | | (3.4 | ) |
Investment management and custodial fees | | | 495 | | | | 355 | | | | 344 | | | | 339 | | | | 322 | | | | 10.6 | | | | 4.0 | |
Mutual fund revenues | | | 633 | | | | 550 | | | | 467 | | | | 589 | | | | 576 | | | | 4.9 | | | | 9.7 | |
Securitization revenues | | | 821 | | | | 678 | | | | 929 | | | | 513 | | | | 296 | | | | 52.3 | | | | 9.5 | |
Underwriting and advisory fees | | | 512 | | | | 445 | | | | 397 | | | | 353 | | | | 528 | | | | 4.7 | | | | 8.2 | |
Securities gains (losses), other than trading | | | 172 | | | | 150 | | | | (354 | ) | | | (315 | ) | | | 247 | | | | 3.5 | | | | 3.4 | |
Foreign exchange, other than trading | | | 93 | | | | 93 | | | | 53 | | | | 80 | | | | 132 | | | | (1.9 | ) | | | (3.1 | ) |
Insurance income | | | 283 | | | | 321 | | | | 295 | | | | 237 | | | | 246 | | | | 5.0 | | | | 8.5 | |
Other revenues | | | 317 | | | | 224 | | | | 170 | | | | 210 | | | | 274 | | | | 4.9 | | | | 2.9 | |
Total non-interest revenue | | | 6,639 | | | | 5,975 | | | | 5,494 | | | | 5,133 | | | | 4,520 | | | | 4.8 | | | | 4.6 | |
Year-over-year growth (%) | | | 11.1 | | | | 8.8 | | | | 7.0 | | | | 13.6 | | | | (14.0 | ) | | | na | | | | na | |
Non-interest revenue as a % of total revenue | | | 48.4 | | | | 48.9 | | | | 49.7 | | | | 50.3 | | | | 48.3 | | | | na | | | | na | |
Total Revenue | | | 13,718 | | | | 12,210 | | | | 11,064 | | | | 10,205 | | | | 9,349 | | | | 6.6 | | | | 4.8 | |
Year-over-year total revenue growth (%) | | | 12.3 | | | | 10.4 | | | | 8.4 | | | | 9.2 | | | | (6.4 | ) | | | na | | | | na | |
Total Adjusted Revenue | | | 13,467 | | | | 12,210 | | | | 11,585 | | | | 10,593 | | | | 10,296 | | | | 6.2 | | | | 4.6 | |
Year-over-year total adjusted revenue growth (%) | | | 10.3 | | | | 5.4 | | | | 9.4 | | | | 2.9 | | | | 3.1 | | | | na | | | | na | |
| | (1) | Net interest margin is calculated based on average earning assets. |
na – not applicable
| | |
| 102 | | BMO Financial Group 194th Annual Report 2011 |
Table 8: Non-Interest Expense and Expense-to-Revenue Ratio($ millions, except as noted)
| | | | | | | | | | | | | | | | | | | | | | | | | | | | |
| For the year ended October 31 | | 2011 | | | 2010 | | | 2009 | | | 2008 | | | 2007 | | | 5-year
CAGR | | | 10-year
CAGR | |
Non-Interest Expense | | | | | | | | | | | | | | | | | | | | | | | | | | | | |
Employee compensation | | | | | | | | | | | | | | | | | | | | | | | | | | | | |
Salaries | | | 2,618 | | | | 2,285 | | | | 2,395 | | | | 2,149 | | | | 1,964 | | | | 6.6 | | | | 3.3 | |
Performance-based compensation | | | 1,560 | | | | 1,455 | | | | 1,338 | | | | 1,297 | | | | 1,275 | | | | 3.4 | | | | 4.8 | |
Employee benefits | | | 703 | | | | 624 | | | | 652 | | | | 530 | | | | 586 | | | | 3.3 | | | | 7.1 | |
Total employee compensation | | | 4,881 | | | | 4,364 | | | | 4,385 | | | | 3,976 | | | | 3,825 | | | | 5.0 | | | | 4.3 | |
Premises and equipment | | | | | | | | | | | | | | | | | | | | | | | | | | | | |
Rental of real estate | | | 351 | | | | 319 | | | | 306 | | | | 279 | | | | 257 | | | | 7.4 | | | | 10.1 | |
Premises, furniture and fixtures | | | 307 | | | | 269 | | | | 272 | | | | 255 | | | | 242 | | | | 5.9 | | | | 0.6 | |
Property taxes | | | 30 | | | | 28 | | | | 30 | | | | 29 | | | | 28 | | | | 3.1 | | | | (5.2 | ) |
Computers and equipment | | | 878 | | | | 727 | | | | 673 | | | | 678 | | | | 634 | | | | | | | | | (1) |
Total premises and equipment | | | 1,566 | | | | 1,343 | | | | 1,281 | | | | 1,241 | | | | 1,161 | | | | | | | | | (1) |
Other expenses | | | | | | | | | | | | | | | | | | | | | | | | | | | | |
Communications | | | 259 | | | | 229 | | | | 221 | | | | 202 | | | | 149 | | | | 14.6 | | | | 2.9 | |
Business and capital taxes | | | 51 | | | | 52 | | | | 44 | | | | 42 | | | | 47 | | | | (11.4 | ) | | | (6.7 | ) |
Professional fees | | | 503 | | | | 372 | | | | 362 | | | | 384 | | | | 301 | | | | 11.9 | | | | 5.7 | |
Travel and business development | | | 382 | | | | 343 | | | | 309 | | | | 328 | | | | 287 | | | | 8.6 | | | | 4.4 | |
Other | | | 732 | | | | 684 | | | | 586 | | | | 546 | | | | 484 | | | | 7.5 | | | | 5.5 | |
Total other expenses | | | 1,927 | | | | 1,680 | | | | 1,522 | | | | 1,502 | | | | 1,268 | | | | 8.6 | | | | 4.3 | |
Amortization of intangible assets | | | 231 | | | | 203 | | | | 203 | | | | 183 | | | | 188 | | | | | | | | | (1) |
Restructuring charge (reversal) | | | – | | | | – | | | | (10 | ) | | | (8 | ) | | | 159 | | | | nm | | | | nm | |
Total Non-Interest Expense | | | 8,605 | | | | 7,590 | | | | 7,381 | | | | 6,894 | | | | 6,601 | | | | 6.3 | | | | 4.3 | |
Year-over-year total non-interest expense growth (%) | | | 13.4 | | | | 2.8 | | | | 7.1 | | | | 4.4 | | | | 3.9 | | | | na | | | | na | |
Total Adjusted Non-Interest Expense | | | 8,404 | | | | 7,554 | | | | 7,220 | | | | 6,852 | | | | 6,516 | | | | 5.9 | | | | 4.1 | |
Year-over-year total adjusted non-interest expense growth (%) | | | 11.3 | | | | 4.6 | | | | 5.4 | | | | 5.1 | | | | 3.3 | | | | na | | | | na | |
Non-interest expense-to-revenue ratio (Productivity ratio) (%) | | | 62.7 | | | | 62.2 | | | | 66.7 | | | | 67.6 | | | | 70.6 | | | | na | | | | na | |
Adjusted non-interest expense-to-revenue ratio (Productivity ratio) (%) | | | 62.4 | | | | 61.9 | | | | 62.3 | | | | 64.7 | | | | 63.3 | | | | na | | | | na | |
| | | | | | | |
Government Levies and Taxes(2) | | | | | | | | | | | | | | | | | | | | | | | | | | | | |
Government levies other than income taxes | | | | | | | | | | | | | | | | | | | | | | | | | | | | |
Payroll levies | | | 203 | | | | 175 | | | | 171 | | | | 164 | | | | 165 | | | | 4.6 | | | | 3.2 | |
Property taxes | | | 30 | | | | 28 | | | | 30 | | | | 29 | | | | 28 | | | | 3.1 | | | | (5.2 | ) |
Provincial capital taxes | | | 44 | | | | 45 | | | | 35 | | | | 32 | | | | 37 | | | | (12.6 | ) | | | (7.3 | ) |
Business taxes | | | 7 | | | | 7 | | | | 9 | | | | 10 | | | | 10 | | | | (2.0 | ) | | | (2.7 | ) |
Harmonized sales tax, GST and other sales taxes (3) | | | 235 | | | | 146 | | | | 116 | | | | 142 | | | | 122 | | | | 12.9 | | | | 6.4 | |
Sundry taxes | | | 1 | | | | 1 | | | | 3 | | | | 3 | | | | 3 | | | | nm | | | | nm | |
Total government levies other than income taxes | | | 520 | | | | 402 | | | | 364 | | | | 380 | | | | 365 | | | | 4.8 | | | | 2.0 | |
Provision for (recovery of) income taxes | | | 917 | | | | 687 | | | | 217 | | | | (71 | ) | | | 189 | | | | 5.1 | | | | 6.7 | |
Total Government Levies and Taxes | | | 1,437 | | | | 1,089 | | | | 581 | | | | 309 | | | | 554 | | | | 5.0 | | | | 4.7 | |
Total government levies and taxes as a % of income available to pay government levies and taxes | | | 30.1 | | | | 27.4 | | | | 23.8 | | | | 13.1 | | | | 20.1 | | | | na | | | | na | |
Effective income tax rate | | | 21.5 | | | | 19.2 | | | | 10.5 | | | | (3.6 | ) | | | 7.9 | | | | na | | | | na | |
Adjusted effective income tax rate | | | 21.3 | | | | 19.2 | | | | 15.9 | | | | 6.0 | | | | 17.1 | | | | na | | | | na | |
| | (1) | In 2009, we adopted new accounting requirements for intangible assets and reclassified certain computer equipment from premises and equipment to intangible assets. Computer and equipment expense and the amortization of intangible assets were restated for 2007 and 2008. As such, five-year and ten-year growth rates for these expense categories are not meaningful. Together, computer and equipment expense and the amortization of intangible assets increased at a compound annual growth rate of 5.1% over five years and 5.5% over ten years. Together, total premises and equipment expense and the amortization of intangible assets increased at a compound annual growth rate of 5.7% over five years and 4.8% over ten years. |
| | (2) | Government levies are included in various non-interest expense categories. |
| | (3) | On July 1, 2010, the harmonized sales tax was implemented in both Ontario and British Columbia. This has increased the sales tax paid in these two jurisdictions. |
na – not applicable
nm – not meaningful
| | | | |
| BMO Financial Group 194th Annual Report 2011 | | | 103 | |
SUPPLEMENTAL INFORMATION
Table 9: Average Assets, Liabilities and Interest Rates($ millions, except as noted)
| | | | | | | | | | | | | | | | | | | | | | | | | | | | | | | | | | | | |
| | | | | | | | | 2011 | | | | | | | | | 2010 | | | | | | | | | 2009 | |
| For the year ended October 31 | | Average
balances | | | Average
interest
rate (%) | | | Interest
income/
expense | | | Average
balances | | | Average
interest
rate (%) | | | Interest
income/
expense | | | Average
balances | | | Average
interest
rate (%) | | | Interest
income/
expense | |
Assets | | | | | | | | | | | | | | | | | | | | | | | | | | | | | | | | | | | | |
Canadian Dollar | | | | | | | | | | | | | | | | | | | | | | | | | | | | | | | | | | | | |
Deposits with other banks | | | 658 | | | | 1.11 | | | | 7 | | | | 518 | | | | 0.71 | | | | 4 | | | | 823 | | | | 1.25 | | | | 10 | |
Securities | | | 82,975 | | | | 1.99 | | | | 1,653 | | | | 76,285 | | | | 1.93 | | | | 1,476 | | | | 66,347 | | | | 2.49 | | | | 1,651 | |
Securities borrowed or purchased under resale agreements | | | 14,409 | | | | 1.08 | | | | 156 | | | | 11,116 | | | | 0.22 | | | | 24 | | | | 15,773 | | | | 0.78 | | | | 123 | |
Loans | | | | | | | | | | | | | | | | | | | | | | | | | | | | | | | | | | | | |
Residential mortgages | | | 45,746 | | | | 3.59 | | | | 1,644 | | | | 41,465 | | | | 3.88 | | | | 1,609 | | | | 41,586 | | | | 3.65 | | | | 1,519 | |
Non-residential mortgages | | | 3,992 | | | | 5.07 | | | | 202 | | | | 3,771 | | | | 5.02 | | | | 189 | | | | 3,304 | | | | 5.28 | | | | 174 | |
Consumer instalment and other personal | | | 42,903 | | | | 4.18 | | | | 1,793 | | | | 37,719 | | | | 4.00 | | | | 1,507 | | | | 32,729 | | | | 4.12 | | | | 1,349 | |
Credit cards | | | 2,131 | | | | 12.00 | | | | 256 | | | | 2,729 | | | | 12.12 | | | | 331 | | | | 2,067 | | | | 12.69 | | | | 262 | |
Businesses and governments | | | 31,740 | | | | 5.85 | | | | 1,856 | | | | 30,153 | | | | 5.55 | | | | 1,673 | | | | 30,358 | | | | 5.98 | | | | 1,815 | |
Total loans | | | 126,512 | | | | 4.55 | | | | 5,751 | | | | 115,837 | | | | 4.58 | | | | 5,309 | | | | 110,044 | | | | 4.65 | | | | 5,119 | |
Other non-interest bearing assets | | | 90,658 | | | | | | | | | | | | 78,864 | | | | | | | | | | | | 64,989 | | | | | | | | | |
Total Canadian dollar | | | 315,212 | | | | 2.40 | | | | 7,567 | | | | 282,620 | | | | 2.41 | | | | 6,813 | | | | 257,976 | | | | 2.68 | | | | 6,903 | |
U.S. Dollar and Other Currencies | | | | | | | | | | | | | | | | | | | | | | | | | | | | | | | | | | | | |
Deposits with other banks | | | 29,965 | | | | 0.41 | | | | 123 | | | | 15,056 | | | | 0.46 | | | | 70 | | | | 16,487 | | | | 1.07 | | | | 176 | |
Securities | | | 41,126 | | | | 1.91 | | | | 784 | | | | 44,159 | | | | 1.49 | | | | 658 | | | | 41,627 | | | | 1.86 | | | | 776 | |
Securities borrowed or purchased under resale agreements | | | 22,890 | | | | 0.54 | | | | 124 | | | | 17,279 | | | | 0.50 | | | | 86 | | | | 24,759 | | | | 0.49 | | | | 121 | |
Loans | | | | | | | | | | | | | | | | | | | | | | | | | | | | | | | | | | | | |
Residential mortgages | | | 6,939 | | | | 4.62 | | | | 320 | | | | 5,476 | | | | 4.95 | | | | 271 | | | | 7,430 | | | | 5.25 | | | | 390 | |
Non-residential mortgages | | | 3,225 | | | | 7.03 | | | | 227 | | | | 3,417 | | | | 5.59 | | | | 191 | | | | 3,772 | | | | 5.88 | | | | 222 | |
Consumer instalment and other personal | | | 11,059 | | | | 4.14 | | | | 458 | | | | 10,294 | | | | 4.32 | | | | 444 | | | | 11,657 | | | | 4.70 | | | | 548 | |
Credit cards | | | 411 | | | | 4.65 | | | | 19 | | | | 293 | | | | 3.07 | | | | 9 | | | | 63 | | | | 11.48 | | | | 7 | |
Businesses and governments | | | 31,338 | | | | 4.12 | | | | 1,293 | | | | 28,822 | | | | 3.25 | | | | 936 | | | | 39,291 | | | | 3.64 | | | | 1,430 | |
Total loans | | | 52,972 | | | | 4.37 | | | | 2,317 | | | | 48,302 | | | | 3.83 | | | | 1,851 | | | | 62,213 | | | | 4.18 | | | | 2,597 | |
Other non-interest bearing assets | | | (18,516 | ) | | | | | | | | | | | (8,942 | ) | | | | | | | | | | | 35,486 | | | | | | | | | |
Total U.S. dollar and other currencies | | | 128,437 | | | | 2.61 | | | | 3,348 | | | | 115,854 | | | | 2.30 | | | | 2,665 | | | | 180,572 | | | | 2.03 | | | | 3,670 | |
Total All Currencies | | | | | | | | | | | | | | | | | | | | | | | | | | | | | | | | | | | | |
Total assets and interest income | | | 443,649 | | | | 2.46 | | | | 10,915 | | | | 398,474 | | | | 2.37 | | | | 9,478 | | | | 438,548 | | | | 2.41 | | | | 10,573 | |
| | | | | | | | | |
Liabilities | | | | | | | | | | | | | | | | | | | | | | | | | | | | | | | | | | | | |
Canadian Dollar | | | | | | | | | | | | | | | | | | | | | | | | | | | | | | | | | | | | |
Deposits | | | | | | | | | | | | | | | | | | | | | | | | | | | | | | | | | | | | |
Banks | | | 3,137 | | | | 0.34 | | | | 11 | | | | 2,846 | | | | (0.27 | ) | | | (8 | ) | | | 3,525 | | | | 0.16 | | | | 6 | |
Businesses and governments | | | 72,013 | | | | 1.69 | | | | 1,214 | | | | 66,088 | | | | 1.28 | | | | 848 | | | | 61,513 | | | | 2.08 | | | | 1,278 | |
Individuals | | | 78,357 | | | | 1.11 | | | | 870 | | | | 78,209 | | | | 1.32 | | | | 1,032 | | | | 76,676 | | | | 1.77 | | | | 1,355 | |
Total deposits | | | 153,507 | | | | 1.36 | | | | 2,095 | | | | 147,143 | | | | 1.27 | | | | 1,872 | | | | 141,714 | | | | 1.86 | | | | 2,639 | |
Subordinated debt and other interest bearing liabilities | | | 50,049 | | | | 1.71 | | | | 854 | | | | 42,444 | | | | 1.32 | | | | 561 | | | | 39,587 | | | | 1.98 | | | | 785 | |
Other non-interest bearing liabilities | | | 88,743 | | | | | | | | | | | | 72,795 | | | | | | | | | | | | 57,963 | | | | | | | | | |
Total Canadian dollar | | | 292,299 | | | | 1.01 | | | | 2,949 | | | | 262,382 | | | | 0.93 | | | | 2,433 | | | | 239,264 | | | | 1.43 | | | | 3,424 | |
U.S. Dollar and Other Currencies | | | | | | | | | | | | | | | | | | | | | | | | | | | | | | | | | | | | |
Deposits | | | | | | | | | | | | | | | | | | | | | | | | | | | | | | | | | | | | |
Banks | | | 18,144 | | | | 1.47 | | | | 267 | | | | 19,106 | | | | 1.26 | | | | 241 | | | | 23,589 | | | | 1.59 | | | | 374 | |
Businesses and governments | | | 71,849 | | | | 0.18 | | | | 131 | | | | 55,715 | | | | 0.19 | | | | 106 | | | | 65,298 | | | | 1.06 | | | | 691 | |
Individuals | | | 27,183 | | | | 0.54 | | | | 148 | | | | 19,999 | | | | 0.71 | | | | 142 | | | | 21,964 | | | | 1.53 | | | | 337 | |
Total deposits | | | 117,176 | | | | 0.47 | | | | 546 | | | | 94,820 | | | | 0.52 | | | | 489 | | | | 110,851 | | | | 1.26 | | | | 1,402 | |
Subordinated debt and other interest bearing liabilities | | | 34,643 | | | | 0.98 | | | | 341 | | | | 30,311 | | | | 1.06 | | | | 321 | | | | 35,918 | | | | 0.49 | | | | 177 | |
Other non-interest bearing liabilities | | | (23,678 | ) | | | | | | | | | | | (9,590 | ) | | | | | | | | | | | 33,453 | | | | | | | | | |
Total U.S. dollar and other currencies | | | 128,141 | | | | 0.69 | | | | 887 | | | | 115,541 | | | | 0.70 | | | | 810 | | | | 180,222 | | | | 0.88 | | | | 1,579 | |
Total All Currencies | | | | | | | | | | | | | | | | | | | | | | | | | | | | | | | | | | | | |
Total liabilities and interest expense | | | 420,440 | | | | 0.91 | | | | 3,836 | | | | 377,923 | | | | 0.86 | | | | 3,243 | | | | 419,486 | | | | 1.19 | | | | 5,003 | |
Shareholders’ equity | | | 23,209 | | | | | | | | | | | | 20,551 | | | | | | | | | | | | 19,062 | | | | | | | | | |
Total Liabilities, Interest Expense and Shareholders’ Equity | | | 443,649 | | | | 0.86 | | | | 3,836 | | | | 398,474 | | | | 0.81 | | | | 3,243 | | | | 438,548 | | | | 1.14 | | | | 5,003 | |
Net interest margin | | | | | | | | | | | | | | | | | | | | | | | | | | | | | | | | | | | | |
– based on earning assets | | | | | | | 1.89 | | | | | | | | | | | | 1.88 | | | | | | | | | | | | 1.63 | | | | | |
– based on total assets | | | | | | | 1.60 | | | | | | | | | | | | 1.56 | | | | | | | | | | | | 1.27 | | | | | |
Net interest income based on total assets | | | | | | | | | | | 7,079 | | | | | | | | | | | | 6,235 | | | | | | | | | | | | 5,570 | |
Adjusted net interest margin | | | | | | | | | | | | | | | | | | | | | | | | | | | | | | | | | | | | |
– based on earning assets | | | | | | | 1.82 | | | | | | | | | | | | 1.88 | | | | | | | | | | | | 1.63 | | | | | |
– based on total assets | | | | | | | 1.54 | | | | | | | | | | | | 1.56 | | | | | | | | | | | | 1.27 | | | | | |
Adjusted net interest income based on total assets | | | | | | | | | | | 6,828 | | | | | | | | | | | | 6,235 | | | | | | | | | | | | 5,570 | |
| | |
| 104 | | BMO Financial Group 194th Annual Report 2011 |
Table 10: Volume/Rate Analysis of Changes in Net Interest Income($ millions)
| | | | | | | | | | | | | | | | | | | | | | | | | | | | |
| | | | | | | | | | | 2011/2010 | | | | | | | | 2010/2009 | |
| | | | | Increase (decrease) due to change in | | | | | Increase (decrease) due to change in | |
| For the year ended October 31 | | | | Average
balance | | | Average
rate | | | Total | | | | | Average
balance | | | Average
rate | | | Total | |
Assets | | | | | | | | | | | | | | | | | | | | | | | | | | | | |
Canadian Dollar | | | | | | | | | | | | | | | | | | | | | | | | | | | | |
Deposits with other banks | | | | | 1 | | | | 3 | | | | 4 | | | | | | (4 | ) | | | (3 | ) | | | (7 | ) |
Securities | | | | | 129 | | | | 48 | | | | 177 | | | | | | 248 | | | | (422 | ) | | | (174 | ) |
Securities borrowed or purchased under resale agreements | | | | | 7 | | | | 124 | | | | 131 | | | | | | (37 | ) | | | (62 | ) | | | (99 | ) |
Loans | | | | | | | | | | | | | | | | | | | | | | | | | | | | |
Residential mortgages | | | | | 166 | | | | (132 | ) | | | 34 | | | | | | (5 | ) | | | 95 | | | | 90 | |
Non-residential mortgages | | | | | 11 | | | | 2 | | | | 13 | | | | | | 25 | | | | (10 | ) | | | 15 | |
Consumer instalment and other personal | | | | | 208 | | | | 79 | | | | 287 | | | | | | 206 | | | | (47 | ) | | | 159 | |
Credit cards | | | | | (72 | ) | | | (3 | ) | | | (75 | ) | | | | | 83 | | | | (15 | ) | | | 68 | |
Businesses and governments | | | | | 88 | | | | 95 | | | | 183 | | | | | | (12 | ) | | | (130 | ) | | | (142 | ) |
Total loans | | | | | 401 | | | | 41 | | | | 442 | | | | | | 297 | | | | (107 | ) | | | 190 | |
Other non-interest bearing assets | | | | | – | | | | – | | | | – | | | | | | – | | | | – | | | | – | |
Change in Canadian dollar interest income | | | | | 538 | | | | 216 | | | | 754 | | | | | | 504 | | | | (594 | ) | | | (90 | ) |
U.S. Dollar and Other Currencies | | | | | | | | | | | | | | | | | | | | | | | | | | | | |
Deposits with other banks | | | | | 70 | | | | (17 | ) | | | 53 | | | | | | (15 | ) | | | (91 | ) | | | (106 | ) |
Securities | | | | | (45 | ) | | | 171 | | | | 126 | | | | | | 48 | | | | (166 | ) | | | (118 | ) |
Securities borrowed or purchased under resale agreements | | | | | 27 | | | | 11 | | | | 38 | | | | | | (36 | ) | | | 1 | | | | (35 | ) |
Loans | | | | | | | | | | | | | | | | | | | | | | | | | | | | |
Residential mortgages | | | | | 72 | | | | (23 | ) | | | 49 | | | | | | (103 | ) | | | (16 | ) | | | (119 | ) |
Non-residential mortgages | | | | | (10 | ) | | | 46 | | | | 36 | | | | | | (21 | ) | | | (10 | ) | | | (31 | ) |
Consumer instalment and other personal | | | | | 33 | | | | (19 | ) | | | 14 | | | | | | (64 | ) | | | (40 | ) | | | (104 | ) |
Credit cards | | | | | 4 | | | | 6 | | | | 10 | | | | | | 28 | | | | (25 | ) | | | 3 | |
Businesses and governments | | | | | 81 | | | | 276 | | | | 357 | | | | | | (381 | ) | | | (113 | ) | | | (494 | ) |
Total loans | | | | | 180 | | | | 286 | | | | 466 | | | | | | (541 | ) | | | (204 | ) | | | (745 | ) |
Other non-interest bearing assets | | | | | – | | | | – | | | | – | | | | | | – | | | | – | | | | – | |
Change in U.S. dollar and other currencies interest income | | | | | 232 | | | | 451 | | | | 683 | | | | | | (544 | ) | | | (460 | ) | | | (1,004 | ) |
Total All Currencies | | | | | | | | | | | | | | | | | | | | | | | | | | | | |
Change in total interest income (a) | | | | | 770 | | | | 667 | | | | 1,437 | | | | | | (40 | ) | | | (1,054 | ) | | | (1,094 | ) |
| | | | | | | | |
Liabilities | | | | | | | | | | | | | | | | | | | | | | | | | | | | |
Canadian Dollar | | | | | | | | | | | | | | | | | | | | | | | | | | | | |
Deposits | | | | | | | | | | | | | | | | | | | | | | | | | | | | |
Banks | | | | | (1 | ) | | | 19 | | | | 18 | | | | | | (1 | ) | | | (12 | ) | | | (13 | ) |
Businesses and governments | | | | | 76 | | | | 290 | | | | 366 | | | | | | 95 | | | | (526 | ) | | | (431 | ) |
Individuals | | | | | 2 | | | | (164 | ) | | | (162 | ) | | | | | 27 | | | | (350 | ) | | | (323 | ) |
Total deposits | | | | | 77 | | | | 145 | | | | 222 | | | | | | 121 | | | | (888 | ) | | | (767 | ) |
Subordinated debt and other interest bearing liabilities | | | | | 100 | | | | 193 | | | | 293 | | | | | | 57 | | | | (281 | ) | | | (224 | ) |
Other non-interest bearing liabilities | | | | | – | | | | – | | | | – | | | | | | – | | | | – | | | | – | |
Change in Canadian dollar interest expense | | | | | 177 | | | | 338 | | | | 515 | | | | | | 178 | | | | (1,169 | ) | | | (991 | ) |
U.S. Dollar and Other Currencies | | | | | | | | | | | | | | | | | | | | | | | | | | | | |
Deposits | | | | | | | | | | | | | | | | | | | | | | | | | | | | |
Banks | | | | | (12 | ) | | | 38 | | | | 26 | | | | | | (71 | ) | | | (62 | ) | | | (133 | ) |
Businesses and governments | | | | | 31 | | | | (5 | ) | | | 26 | | | | | | (102 | ) | | | (483 | ) | | | (585 | ) |
Individuals | | | | | 51 | | | | (45 | ) | | | 6 | | | | | | (31 | ) | | | (164 | ) | | | (195 | ) |
Total deposits | | | | | 70 | | | | (12 | ) | | | 58 | | | | | | (204 | ) | | | (709 | ) | | | (913 | ) |
Other interest bearing liabilities | | | | | 46 | | | | (26 | ) | | | 20 | | | | | | (27 | ) | | | 171 | | | | 144 | |
Other non-interest bearing liabilities | | | | | – | | | | – | | | | – | | | | | | – | | | | – | | | | – | |
Change in U.S. dollar and other currencies interest expense | | | | | 116 | | | | (38 | ) | | | 78 | | | | | | (231 | ) | | | (538 | ) | | | (769 | ) |
Total All Currencies | | | | | | | | | | | | | | | | | | | | | | | | | | | | |
Change in total interest expense (b) | | | | | 293 | | | | 300 | | | | 593 | | | | | | (53 | ) | | | (1,707 | ) | | | (1,760 | ) |
Change in total net interest income (a – b) | | | | | 477 | | | | 367 | | | | 844 | | | | | | 13 | | | | 653 | | | | 666 | |
| | | | |
| BMO Financial Group 194th Annual Report 2011 | | | 105 | |
SUPPLEMENTAL INFORMATION
| Table 11: | | Net Loans and Acceptances – |
| | Segmented | | Information($ millions) |
| | | | | | | | | | | | | | | | | | | | | | | | | | | | | | | | | | | | | | | | | | | | | | | | | | | | | | | | | | | | | | |
| | | Canada | | | United States | | | Other countries | | | |
| As at October 31 | | 2011 | | | 2010 | | | 2009 | | | 2008 | | | 2007 | | | 2011 | | | 2010 | | | 2009 | | | 2008 | | | 2007 | | | 2011 | | | 2010 | | | 2009 | | | 2008 | | | 2007 | | | |
Consumer | | | | | | | | | | | | | | | | | | | | | | | | | | | | | | | | | | | | | | | | | | | | | | | | | | | | | | | | | | | | | | |
Residential mortgages (1) | | | 42,339 | | | | 41,481 | | | | 36,916 | | | | 38,490 | | | | 43,442 | | | | 7,963 | | | | 4,982 | | | | 6,160 | | | | 8,086 | | | | 5,948 | | | | – | | | | – | | | | – | | | | – | | | | – | | | |
Cards | | | 1,777 | | | | 3,056 | | | | 2,574 | | | | 2,117 | | | | 4,493 | | | | 474 | | | | 252 | | | | – | | | | 3 | | | | – | | | | – | | | | – | | | | – | | | | – | | | | – | | | |
Consumer instalment and other personal loans | | | 45,584 | | | | 41,112 | | | | 35,296 | | | | 31,633 | | | | 24,393 | | | | 13,802 | | | | 10,000 | | | | 10,477 | | | | 12,102 | | | | 8,795 | | | | – | | | | – | | | | – | | | | – | | | | – | | | |
Total consumer | | | 89,700 | | | | 85,649 | | | | 74,786 | | | | 72,240 | | | | 72,328 | | | | 22,239 | | | | 15,234 | | | | 16,637 | | | | 20,191 | | | | 14,743 | | | | – | | | | – | | | | – | | | | – | | | | – | | | |
Commercial and corporate | | | 49,544 | | | | 48,663 | | | | 46,062 | | | | 52,148 | | | | 51,548 | | | | 38,595 | | | | 19,148 | | | | 21,560 | | | | 31,827 | | | | 21,531 | | | | 7,738 | | | | 9,246 | | | | 10,090 | | | | 11,877 | | | | 4,843 | | | |
Total loans and acceptances, net of specific allowances | | | 139,244 | | | | 134,312 | | | | 120,848 | | | | 124,388 | | | | 123,876 | | | | 60,834 | | | | 34,382 | | | | 38,197 | | | | 52,018 | | | | 36,274 | | | | 7,738 | | | | 9,246 | | | | 10,090 | | | | 11,877 | | | | 4,843 | | | |
General allowance | | | (566 | ) | | | (595 | ) | | | (589 | ) | | | (579 | ) | | | (587 | ) | | | (752 | ) | | | (702 | ) | | | (717 | ) | | | (742 | ) | | | (311 | ) | | | – | | | | – | | | | – | | | | – | | | | – | | | |
Total net loans and acceptances | | | 138,678 | | | | 133,717 | | | | 120,259 | | | | 123,809 | | | | 123,289 | | | | 60,082 | | | | 33,680 | | | | 37,480 | | | | 51,276 | | | | 35,963 | | | | 7,738 | | | | 9,246 | | | | 10,090 | | | | 11,877 | | | | 4,843 | | | |
Table 12:Net Impaired Loans and Acceptances –
Segmented Information($ millions, except as noted) | | | |
| | | Canada | | | United States | | | Other countries | | | |
| As at October 31 | | 2011 | | | 2010 | | | 2009 | | | 2008 | | | 2007 | | | 2011 | | | 2010 | | | 2009 | | | 2008 | | | 2007 | | | 2011 | | | 2010 | | | 2009 | | | 2008 | | | 2007 | | | |
Consumer | | | | | | | | | | | | | | | | | | | | | | | | | | | | | | | | | | | | | | | | | | | | | | | | | | | | | | | | | | | | | | |
Residential mortgages | | | 178 | | | | 227 | | | | 236 | | | | 211 | | | | 112 | | | | 221 | | | | 220 | | | | 121 | | | | – | | | | – | | | | – | | | | – | | | | – | | | | – | | | | – | | | |
Consumer instalment and other personal loans | | | 101 | | | | 96 | | | | 97 | | | | 89 | | | | 54 | | | | 128 | | | | 79 | | | | 73 | | | | 91 | | | | – | | | | – | | | | – | | | | – | | | | – | | | | – | | | |
Total consumer | | | 279 | | | | 323 | | | | 333 | | | | 300 | | | | 166 | | | | 349 | | | | 299 | | | | 194 | | | | 91 | | | | – | | | | – | | | | – | | | | – | | | | – | | | | – | | | |
Commercial and corporate | | | 433 | | | | 372 | | | | 376 | | | | 374 | | | | 183 | | | | 1,108 | | | | 1,279 | | | | 1,673 | | | | 1,147 | | | | 211 | | | | 2 | | | | 40 | | | | 125 | | | | 49 | | | | 3 | | | |
Total impaired loans and acceptances, net of specific allowances | | | 712 | | | | 695 | | | | 709 | | | | 674 | | | | 349 | | | | 1,457 | | | | 1,578 | | | | 1,867 | | | | 1,238 | | | | 211 | | | | 2 | | | | 40 | | | | 125 | | | | 49 | | | | 3 | | | |
General allowance | | | (566 | ) | | | (595 | ) | | | (589 | ) | | | (579 | ) | | | (587 | ) | | | (752 | ) | | | (702 | ) | | | (717 | ) | | | (742 | ) | | | (311 | ) | | | – | | | | – | | | | – | | | | – | | | | – | | | |
Total net impaired loans and acceptances (NIL) | | | 146 | | | | 100 | | | | 120 | | | | 95 | | | | (238 | ) | | | 705 | | | | 876 | | | | 1,150 | | | | 496 | | | | (100 | ) | | | 2 | | | | 40 | | | | 125 | | | | 49 | | | | 3 | | | |
Condition Ratios | | | | | | | | | | | | | | | | | | | | | | | | | | | | | | | | | | | | | | | | | | | | | | | | | | | | | | | | | | | | | | |
Gross impaired loans and acceptances as a % of equity and allowance for credit losses (2) (4) | | | un | | | | un | | | | un | | | | un | | | | un | | | | un | | | | un | | | | un | | | | un | | | | un | | | | un | | | | un | | | | un | | | | un | | | | un | | | |
Gross impaired loans and acceptances as a % of equity and allowance for credit losses excluding purchased portfolios (2) (4) | | | un | | | | un | | | | un | | | | un | | | | un | | | | un | | | | un | | | | un | | | | un | | | | un | | | | un | | | | un | | | | un | | | | un | | | | un | | | |
NIL as a % of net loans and acceptances (3) | | | 0.11 | | | | 0.07 | | | | 0.10 | | | | 0.08 | | | | (0.19 | ) | | | 1.22 | | | | 2.62 | | | | 3.07 | | | | 0.97 | | | | (0.28 | ) | | | 0.03 | | | | 0.43 | | | | 1.24 | | | | 0.41 | | | | 0.06 | | | |
NIL as a % of net loans and acceptances (3) | | | | | | | | | | | | | | | | | | | | | | | | | | | | | | | | | | | | | | | | | | | | | | | | | | | | | | | | | | | | | | |
Consumer | | | 0.31 | | | | 0.38 | | | | 0.45 | | | | 0.42 | | | | 0.23 | | | | 1.59 | | | | 1.96 | | | | 1.17 | | | | 0.45 | | | | – | | | | – | | | | – | | | | – | | | | – | | | | – | | | |
Commercial and corporate | | | 0.87 | | | | 0.76 | | | | 0.82 | | | | 0.72 | | | | 0.36 | | | | 3.04 | | | | 6.78 | | | | 7.76 | | | | 3.60 | | | | 0.98 | | | | 0.03 | | | | 0.43 | | | | 1.24 | | | | 0.41 | | | | 0.06 | | | |
NIL as a % of net loans and acceptances excluding purchased portfolios (3) (4) | | | 0.11 | | | | 0.07 | | | | 0.10 | | | | 0.08 | | | | (0.19 | ) | | | 2.07 | | | | 2.66 | | | | 3.07 | | | | 0.97 | | | | (0.28 | ) | | | 0.03 | | | | 0.43 | | | | 1.24 | | | | 0.41 | | | | 0.06 | | | |
| | |
(1) Excludes residential mortgages classified as commercial corporate loans. (2) Effective in the fourth quarter 2010, the calculation excludes non-controlling interest in subsidiaries. Prior periods have been restated to reflect this change. In addition, geographic allocations are not available, as equity is not allocated on a country of risk basis. (3) Aggregate balances are net of specific and general allowances; the consumer and commercial and corporate categories are stated net of specific allowances only. (4) Ratio is presented including purchased portfolios and prior periods have been restated. The above ratios are also presented excluding purchased portfolios, to provide for better historical comparisons (refer to the Acquisition of Marshall and Ilsley section on page 3 for details). (5) Beginning with our 2009 reporting of net loans and acceptances by province, we changed the source of our data for the provincial distribution table. This change resulted in a shift in the provincial distribution to what we believe is a more accurate representation of our portfolio. In 2009, we restated 2008 data to reflect this change. Data for periods prior to 2008 were not restated and therefore are not comparable. (6) In 2009, the industry allocation of impaired loans for U.S. operations was revised to reclassify impairment of commercial mortgages to the commercial mortgages category. Previously | | commercial mortgages for U.S. operations were classified in applicable industry categories. Periods prior to 2009 have not been restated. (7) Beginning in 2008, our industry segmentation was improved to provide a split between government and financial institutions. For period prior to 2008, this segmentation was not available, and the financial institutions sector includes government loans. (8) Includes amounts returning to performing status, sales, repayments, the impact of foreign exchange, and offsets for consumer write-offs that are not recognized as formations. (9) Amounts for 2011 exclude $45 million related to Other Credit Instruments ($9 million for 2010) included in Other Liabilities. (10) Adjusted specific provision for credit losses exclude provisions related to the M&I purchased portfolio. un - unavailable Certain comparative figures in Table 12, 14 & 18 have been reclassified to conform with the current year’s presentation. |
| | |
| 106 | | BMO Financial Group 194th Annual Report 2011 |
| | | | | | | | | | | | | | | | | | | | |
| | | Total | |
| | | 2011 | | | 2010 | | | 2009 | | | 2008 | | | 2007 | |
| | | | | | | | | | | | | | | | | | | | |
| | | 50,302 | | | | 46,463 | | | | 43,076 | | | | 46,576 | | | | 49,390 | |
| | | 2,251 | | | | 3,308 | | | | 2,574 | | | | 2,120 | | | | 4,493 | |
| | | | 59,386 | | | | 51,112 | | | | 45,773 | | | | 43,735 | | | | 33,188 | |
| | | 111,939 | | | | 100,883 | | | | 91,423 | | | | 92,431 | | | | 87,071 | |
| | | | 95,877 | | | | 77,057 | | | | 77,712 | | | | 95,852 | | | | 77,922 | |
| | | 207,816 | | | | 177,940 | | | | 169,135 | | | | 188,283 | | | | 164,993 | |
| | | | (1,318 | ) | | | (1,297 | ) | | | (1,306 | ) | | | (1,321 | ) | | | (898 | ) |
| | | | 206,498 | | | | 176,643 | | | | 167,829 | | | | 186,962 | | | | 164,095 | |
| | | | | | | | | | | | | | | | | | | | |
| | | Total | |
| | | 2011 | | | 2010 | | | 2009 | | | 2008 | | | 2007 | |
| | | | | | | | | | | | | | | | | | | | |
| | | 399 | | | | 447 | | | | 357 | | | | 211 | | | | 112 | |
| | | | 229 | | | | 175 | | | | 170 | | | | 180 | | | | 54 | |
| | | 628 | | | | 622 | | | | 527 | | | | 391 | | | | 166 | |
| | | | 1,543 | | | | 1,691 | | | | 2,174 | | | | 1,570 | | | | 397 | |
| | | 2,171 | | | | 2,313 | | | | 2,701 | | | | 1,961 | | | | 563 | |
| | | | (1,318 | ) | | | (1,297 | ) | | | (1,306 | ) | | | (1,321 | ) | | | (898 | ) |
| | | | 853 | | | | 1,016 | | | | 1,395 | | | | 640 | | | | (335 | ) |
| | | | | | | | | | | | | | | | | | | | |
| | | 8.95 | | | | 12.18 | | | | 14.92 | | | | 12.15 | | | | 4.40 | |
| | | 8.34 | | | | 12.18 | | | | 14.92 | | | | 12.15 | | | | 4.40 | |
| | | 0.42 | | | | 0.57 | | | | 0.83 | | | | 0.34 | | | | (0.20 | ) |
| | | | | | | | | | | | | | | | | | | | |
| | | 0.56 | | | | 0.62 | | | | 0.58 | | | | 0.42 | | | | 0.19 | |
| | | | 1.65 | | | | 2.20 | | | | 2.80 | | | | 1.64 | | | | 0.51 | |
| | | | 0.43 | | | | 0.57 | | | | 0.83 | | | | 0.34 | | | | (0.20 | ) |
Table 13: Net Loans and Acceptances –
Segmented Information($ millions)
| | | | | | | | | | | | | | | | | | | | |
| As at October 31 | | 2011 | | | 2010 | | | 2009 | | | 2008 | | | 2007 | |
Net Loans and Acceptances by Province(5) | | | | | | | | | | | | | | | | | | | | |
Atlantic provinces | | | 8,643 | | | | 8,476 | | | | 7,227 | | | | 7,127 | | | | 5,314 | |
Quebec | | | 23,145 | | | | 22,194 | | | | 19,396 | | | | 21,346 | | | | 13,110 | |
Ontario | | | 55,699 | | | | 54,056 | | | | 50,079 | | | | 49,996 | | | | 71,160 | |
Prairie provinces | | | 26,130 | | | | 25,159 | | | | 22,877 | | | | 24,378 | | | | 19,002 | |
British Columbia and territories | | | 25,627 | | | | 24,427 | | | | 21,269 | | | | 21,541 | | | | 15,290 | |
Total net loans and acceptances in Canada | | | 139,244 | | | | 134,312 | | | | 120,848 | | | | 124,388 | | | | 123,876 | |
Net Commercial and Corporate Loans by Industry | | | | | | | | | | | | | | | | | | | | |
Commercial mortgages (6) | | | 18,063 | | | | 10,253 | | | | 9,284 | | | | 10,121 | | | | 8,994 | |
Commercial real estate | | | 7,953 | | | | 6,796 | | | | 6,648 | | | | 8,300 | | | | 6,532 | |
Construction (non-real estate) | | | 2,298 | | | | 1,802 | | | | 1,795 | | | | 1,857 | | | | 1,425 | |
Retail trade | | | 6,945 | | | | 5,751 | | | | 4,864 | | | | 5,269 | | | | 4,398 | |
Wholesale trade | | | 5,188 | | | | 3,174 | | | | 2,854 | | | | 3,849 | | | | 3,200 | |
Agriculture | | | 4,488 | | | | 3,839 | | | | 3,505 | | | | 3,769 | | | | 3,471 | |
Communications | | | 556 | | | | 932 | | | | 1,041 | | | | 1,404 | | | | 1,218 | |
Manufacturing | | | 8,560 | | | | 6,220 | | | | 7,006 | | | | 9,290 | | | | 7,238 | |
Mining | | | 640 | | | | 266 | | | | 1,049 | | | | 3,256 | | | | 1,522 | |
Oil and gas | | | 3,466 | | | | 3,678 | | | | 4,280 | | | | 6,199 | | | | 5,474 | |
Transportation | | | 1,865 | | | | 1,286 | | | | 1,386 | | | | 1,788 | | | | 1,467 | |
Utilities | | | 838 | | | | 1,101 | | | | 1,197 | | | | 1,591 | | | | 977 | |
Forest products | | | 498 | | | | 405 | | | | 696 | | | | 875 | | | | 767 | |
Service industries | | | 11,639 | | | | 8,605 | | | | 8,879 | | | | 9,613 | | | | 8,307 | |
Financial institutions | | | 16,462 | | | | 17,318 | | | | 17,867 | | | | 23,710 | | | | 16,393 | |
Government (7) | | | 636 | | | | 580 | | | | 601 | | | | 865 | | | | un | |
Other | | | 5,782 | | | | 5,051 | | | | 4,760 | | | | 4,096 | | | | 6,539 | |
| | | | 95,877 | | | | 77,057 | | | | 77,712 | | | | 95,852 | | | | 77,922 | |
Table 14:Net Impaired Loans and Acceptances –
Segmented Information($ millions) | |
| As at October 31 | | 2011 | | | 2010 | | | 2009 | | | 2008 | | | 2007 | |
Net Impaired Commercial and Corporate Loans | | | | | | | | | | | | | | | | | | | | |
Commercial mortgages (6) | | | 523 | | | | 436 | | | | 510 | | | | 38 | | | | 43 | |
Commercial real estate | | | 310 | | | | 453 | | | | 542 | | | | 460 | | | | 96 | |
Construction (non-real estate) | | | 28 | | | | 66 | | | | 9 | | | | 15 | | | | 5 | |
Retail trade | | | 68 | | | | 56 | | | | 40 | | | | 41 | | | | 9 | |
Wholesale trade | | | 17 | | | | 27 | | | | 48 | | | | 51 | | | | 24 | |
Agriculture | | | 96 | | | | 41 | | | | 100 | | | | 73 | | | | 18 | |
Communications | | | 7 | | | | 1 | | | | – | | | | – | | | | – | |
Manufacturing | | | 95 | | | | 115 | | | | 252 | | | | 275 | | | | 80 | |
Mining | | | 2 | | | | – | | | | – | | | | – | | | | – | |
Oil and gas | | | 2 | | | | 10 | | | | 44 | | | | 47 | | | | – | |
Transportation | | | 33 | | | | 26 | | | | 42 | | | | 27 | | | | 15 | |
Utilities | | | 2 | | | | 2 | | | | – | | | | 1 | | | | – | |
Forest products | | | 35 | | | | 71 | | | | 63 | | | | 16 | | | | 5 | |
Service industries | | | 82 | | | | 115 | | | | 142 | | | | 93 | | | | 58 | |
Financial institutions | | | 179 | | | | 217 | | | | 363 | | | | 244 | | | | 23 | |
Government (7) | | | – | | | | 2 | | | | – | | | | 3 | | | | un | |
Other | | | 64 | | | | 53 | | | | 19 | | | | 186 | | | | 21 | |
| | | | 1,543 | | | | 1,691 | | | | 2,174 | | | | 1,570 | | | | 397 | |
Table 15:Changes in Impaired Loans and
Allowance for Credit Losses($ millions) | |
| As at October 31 | | 2011 | | | 2010 | | | 2009 | | | 2008 | | | 2007 | |
Gross impaired loans and acceptances, beginning of year | | | 2,894 | | | | 3,297 | | | | 2,387 | | | | 720 | | | | 666 | |
Additions to impaired loans and acceptances | | | 1,225 | | | | 1,525 | | | | 2,690 | | | | 2,506 | | | | 588 | |
Reductions in impaired loans and acceptances (8) | | | (326 | ) | | | (712 | ) | | | (288 | ) | | | 131 | | | | (143 | ) |
Write-offs | | | (1,108 | ) | | | (1,216 | ) | | | (1,492 | ) | | | (970 | ) | | | (391 | ) |
Gross Impaired Loans and Acceptances, End of Year | | | 2,685 | | | | 2,894 | | | | 3,297 | | | | 2,387 | | | | 720 | |
Allowance for credit losses, beginning of year | | | 1,878 | | | | 1,902 | | | | 1,747 | | | | 1,055 | | | | 1,058 | |
Increases – specific allowances | | | 1,041 | | | | 1,201 | | | | 1,662 | | | | 1,239 | | | | 395 | |
Change in the general allowance | | | 21 | | | | (9 | ) | | | (15 | ) | | | 423 | | | | (7 | ) |
Write-offs | | | (1,108 | ) | | | (1,216 | ) | | | (1,492 | ) | | | (970 | ) | | | (391 | ) |
Allowance for Credit Losses, End of Year(9) | | | 1,832 | | | | 1,878 | | | | 1,902 | | | | 1,747 | | | | 1,055 | |
| | | | |
| BMO Financial Group 194th Annual Report 2011 | | | 107 | |
SUPPLEMENTAL INFORMATION
| Table 16: | | Changes in Allowance for Credit Losses – |
| | Segmented | | Information($ millions, except as noted) |
| | | | | | | | | | | | | | | | | | | | | | | | | | | | | | | | | | | | | | | | | | | | | | | | | | | | | | | | | | | | | | |
| | | Canada | | | United States | | | Other countries | | | |
| As at October 31 | | 2011 | | | 2010 | | | 2009 | | | 2008 | | | 2007 | | | 2011 | | | 2010 | | | 2009 | | | 2008 | | | 2007 | | | 2011 | | | 2010 | | | 2009 | | | 2008 | | | 2007 | | | |
Allowance for credit losses, beginning
of year | | | 852 | | | | 830 | | | | 708 | | | | 692 | | | | 651 | | | | 993 | | | | 1,011 | | | | 998 | | | | 362 | | | | 403 | | | | 42 | | | | 61 | | | | 41 | | | | 1 | | | | 4 | | | |
Provision for credit losses | | | 381 | | | | 485 | | | | 517 | | | | 340 | | | | 257 | | | | 477 | | | | 573 | | | | 1,065 | | | | 942 | | | | 99 | | | | (1 | ) | | | (9 | ) | | | 21 | | | | 48 | | | | (3 | ) | | |
Transfer of allowance | | | – | | | | 8 | | | | – | | | | – | | | | 5 | | | | – | | | | 28 | | | | – | | | | – | | | | 7 | | | | – | | | | – | | | | – | | | | – | | | | – | | | |
Recoveries | | | 81 | | | | 73 | | | | 58 | | | | 61 | | | | 53 | | | | 160 | | | | 110 | | | | 87 | | | | 53 | | | | 38 | | | | – | | | | – | | | | – | | | | – | | | | – | | | |
Write-offs | | | (501 | ) | | | (544 | ) | | | (451 | ) | | | (387 | ) | | | (274 | ) | | | (578 | ) | | | (670 | ) | | | (1,041 | ) | | | (576 | ) | | | (117 | ) | | | (29 | ) | | | (2 | ) | | | – | | | | (7 | ) | | | – | | | |
Other, including foreign exchange rate changes | | | (2 | ) | | | – | | | | (2 | ) | | | 2 | | | | – | | | | 2 | | | | (59 | ) | | | (98 | ) | | | 217 | | | | (68 | ) | | | – | | | | (8 | ) | | | (1 | ) | | | (1 | ) | | | – | | | |
Allowance for credit losses, end of year | | | 811 | | | | 852 | | | | 830 | | | | 708 | | | | 692 | | | | 1,054 | | | | 993 | | | | 1,011 | | | | 998 | | | | 362 | | | | 12 | | | | 42 | | | | 61 | | | | 41 | | | | 1 | | | |
Allocation of Write-offs by Market | | | | | | | | | | | | | | | | | | | | | | | | | | | | | | | | | | | | | | | | | | | | | | | | | | | | | | | | | | | | | | |
Consumer | | | (375 | ) | | | (430 | ) | | | (383 | ) | | | (303 | ) | | | (246 | ) | | | (289 | ) | | | (322 | ) | | | (302 | ) | | | (125 | ) | | | (43 | ) | | | – | | | | – | | | | – | | | | – | | | | – | | | |
Commercial and corporate | | | (126 | ) | | | (114 | ) | | | (68 | ) | | | (84 | ) | | | (28 | ) | | | (289 | ) | | | (348 | ) | | | (739 | ) | | | (451 | ) | | | (74 | ) | | | (29 | ) | | | (2 | ) | | | – | | | | (7 | ) | | | – | | | |
Allocation of Recoveries by Market | | | | | | | | | | | | | | | | | | | | | | | | | | | | | | | | | | | | | | | | | | | | | | | | | | | | | | | | | | | | | | |
Consumer | | | 80 | | | | 76 | | | | 57 | | | | 56 | | | | 50 | | | | 61 | | | | 61 | | | | 47 | | | | 35 | | | | 22 | | | | – | | | | – | | | | – | | | | – | | | | – | | | |
Commercial and corporate | | | 1 | | | | (3 | ) | | | 1 | | | | 5 | | | | 3 | | | | 99 | | | | 49 | | | | 40 | | | | 18 | | | | 16 | | | | – | | | | – | | | | – | | | | – | | | | – | | | |
Net write-offs as a % of average loans and acceptances (4) | | | un | | | | un | | | | un | | | | un | | | | un | | | | un | | | | un | | | | un | | | | un | | | | un | | | | un | | | | un | | | | un | | | | un | | | | un | | | |
Net write-offs as a % of average loans and acceptances excluding purchased portfolios (4) | | | un | | | | un | | | | un | | | | un | | | | un | | | | un | | | | un | | | | un | | | | un | | | | un | | | | un | | | | un | | | | un | | | | un | | | | un | | | |
| | | | |
Table 17:Allocation of Allowance for Credit Losses –
Segmented Information($ millions, except as noted) | | | | | | | | | | | | |
| | | Canada | | | United States | | | Other countries | | | |
| As at October 31 | | 2011 | | | 2010 | | | 2009 | | | 2008 | | | 2007 | | | 2011 | | | 2010 | | | 2009 | | | 2008 | | | 2007 | | | 2011 | | | 2010 | | | 2009 | | | 2008 | | | 2007 | | | |
Consumer | | | | | | | | | | | | | | | | | | | | | | | | | | | | | | | | | | | | | | | | | | | | | | | | | | | | | | | | | | | | | | |
Residential mortgages | | | 38 | | | | 42 | | | | 33 | | | | 13 | | | | 14 | | | | 34 | | | | 10 | | | | – | | | | – | | | | – | | | | – | | | | – | | | | – | | | | – | | | | – | | | |
Consumer instalment and other personal loans | | | 54 | | | | 47 | | | | 51 | | | | 2 | | | | 1 | | | | 5 | | | | – | | | | – | | | | – | | | | – | | | | – | | | | – | | | | – | | | | – | | | | – | | | |
Total consumer | | | 92 | | | | 89 | | | | 84 | | | | 15 | | | | 15 | | | | 39 | | | | 10 | | | | – | | | | – | | | | – | | | | – | | | | – | | | | – | | | | – | | | | – | | | |
Commercial and corporate | | | 153 | | | | 168 | | | | 157 | | | | 114 | | | | 90 | | | | 218 | | | | 272 | | | | 294 | | | | 256 | | | | 51 | | | | 12 | | | | 42 | | | | 61 | | | | 41 | | | | 1 | | | |
Off-balance sheet | | | – | | | | – | | | | – | | | | – | | | | – | | | | 45 | | | | 9 | | | | – | | | | – | | | | – | | | | – | | | | – | | | | – | | | | – | | | | – | | | |
Total specific allowances | | | 245 | | | | 257 | | | | 241 | | | | 129 | | | | 105 | | | | 302 | | | | 291 | | | | 294 | | | | 256 | | | | 51 | | | | 12 | | | | 42 | | | | 61 | | | | 41 | | | | 1 | | | |
General allowance | | | 566 | | | | 595 | | | | 589 | | | | 579 | | | | 587 | | | | 752 | | | | 702 | | | | 717 | | | | 742 | | | | 311 | | | | – | | | | – | | | | – | | | | – | | | | – | | | |
Allowance for credit losses | | | 811 | | | | 852 | | | | 830 | | | | 708 | | | | 692 | | | | 1,054 | | | | 993 | | | | 1,011 | | | | 998 | | | | 362 | | | | 12 | | | | 42 | | | | 61 | | | | 41 | | | | 1 | | | |
Coverage Ratios | | | | | | | | | | | | | | | | | | | | | | | | | | | | | | | | | | | | | | | | | | | | | | | | | | | | | | | | | | | | | | |
Allowance for credit losses as a % of gross impaired loans and acceptances (4) | | | | | | | | | | | | | | | | | | | | | | | | | | | | | | | | | | | | | | | | | | | | | | | | | | | | | | | | | | | | | | |
Total | | | 84.7 | | | | 89.5 | | | | 87.4 | | | | 88.2 | | | | 152.4 | | | | 58.9 | | | | 52.9 | | | | 46.8 | | | | 66.8 | | | | 138.2 | | | | 85.7 | | | | 52.2 | | | | 32.8 | | | | 45.6 | | | | 25.0 | | | |
Consumer | | | 24.8 | | | | 21.6 | | | | 20.1 | | | | 4.8 | | | | 8.3 | | | | 10.1 | | | | 3.2 | | | | – | | | | – | | | | – | | | | – | | | | – | | | | – | | | | na | | | | na | | | |
Commercial and corporate | | | 26.1 | | | | 31.1 | | | | 29.5 | | | | 23.4 | | | | 33.0 | | | | 19.4 | | | | 17.5 | | | | 14.9 | | | | 18.2 | | | | 19.5 | | | | 85.7 | | | | 51.2 | | | | 32.8 | | | | 45.5 | | | | 25.0 | | | |
Allowance for credit losses as a % of gross impaired loans and acceptances excluding purchased portfolios (4) | | | | | | | | | | | | | | | | | | | | | | | | | | | | | | | | | | | | | | | | | | | | | | | | | | | | | | | | | | | | | | |
Total | | | 84.7 | | | | 89.5 | | | | 87.4 | | | | 88.2 | | | | 152.4 | | | | 59.2 | | | | 52.9 | | | | 46.8 | | | | 66.8 | | | | 138.2 | | | | 85.7 | | | | 52.2 | | | | 32.8 | | | | 45.6 | | | | 25.0 | | | |
un – unavailable
na – not applicable
| | |
| 108 | | BMO Financial Group 194th Annual Report 2011 |
| | | | | | | | | | | | | | | | | | | | |
| | | Total | |
| | | 2011 | | | 2010 | | | 2009 | | | 2008 | | | 2007 | |
| | | 1,887 | | | | 1,902 | | | | 1,747 | | | | 1,055 | | | | 1,058 | |
| | | 857 | | | | 1,049 | | | | 1,603 | | | | 1,330 | | | | 353 | |
| | | – | | | | 36 | | | | – | | | | – | | | | 12 | |
| | | 241 | | | | 183 | | | | 145 | | | | 114 | | | | 91 | |
| | | (1,108 | ) | | | (1,216 | ) | | | (1,492 | ) | | | (970 | ) | | | (391 | ) |
| | | | – | | | | (67 | ) | | | (101 | ) | | | 218 | | | | (68 | ) |
| | | | 1,877 | | | | 1,887 | | | | 1,902 | | | | 1,747 | | | | 1,055 | |
| | | | | | | | | | | | | | | | | | | | |
| | | (664 | ) | | | (752 | ) | | | (685 | ) | | | (428 | ) | | | (289 | ) |
| | | (444 | ) | | | (464 | ) | | | (807 | ) | | | (542 | ) | | | (102 | ) |
| | | | | | | | | | | | | | | | | | | | |
| | | 141 | | | | 137 | | | | 104 | | | | 91 | | | | 72 | |
| | | 100 | | | | 46 | | | | 41 | | | | 23 | | | | 19 | |
| | |
|
0.5 |
| | | 0.6 | | | | 0.7 | | | | 0.5 | | |
|
0.1 |
|
| | | | 0.5 | | | | 0.6 | | | | 0.7 | | | | 0.5 | | | | 0.1 | |
| | | | | | | | | | | | | | | | | | | | |
| | | | | | Total | |
| | | 2011 | | | 2010 | | | 2009 | | | 2008 | | | 2007 | |
| | | | | | | | | | | | | | | | | | | | |
| | | 72 | | | | 52 | | | | 33 | | | | 13 | | | | 14 | |
| | | | 59 | | | | 47 | | | | 51 | | | | 2 | | | | 1 | |
| | | 131 | | | | 99 | | | | 84 | | | | 15 | | | | 15 | |
| | | 383 | | | | 482 | | | | 512 | | | | 411 | | | | 142 | |
| | | | 45 | | | | 9 | | | | – | | | | – | | | | – | |
| | | 559 | | | | 590 | | | | 596 | | | | 426 | | | | 157 | |
| | | | 1,318 | | | | 1,297 | | | | 1,306 | | | | 1,321 | | | | 898 | |
| | | | 1,877 | | | | 1,887 | | | | 1,902 | | | | 1,747 | | | | 1,055 | |
| | | | | | | | | | | | | | | | | | | | |
| | | | | | | | | | | | | | | | | | | | |
| | | | | | | | | | | | | | | | | | | | |
| | | 68.2 | | | | 64.9 | | | | 57.7 | | | | 73.2 | | | | 146.5 | |
| | | 17.3 | | | | 13.7 | | | | 13.7 | | | | 3.7 | | | | 8.3 | |
| | | | 19.9 | | | | 22.2 | | | | 19.1 | | | | 20.7 | | | | 26.3 | |
| | | | | | | | | | | | | | | | | | | | |
| | | | 69.2 | | | | 64.9 | | | | 57.7 | | | | 73.2 | | | | 146.5 | |
| Table 18: | | Provision for Credit Losses – Segmented Information($ millions) |
| | | | | | | | | | | | | | | | | | | | |
| For the year ended October 31 | | 2011 | | | 2010 | | | 2009 | | | 2008 | | | 2007 | |
Consumer | | | | | | | | | | | | | | | | | | | | |
Residential mortgages | | | 93 | | | | 107 | | | | 104 | | | | 5 | | | | 11 | |
Cards | | | 158 | | | | 194 | | | | 174 | | | | 154 | | | | 137 | |
Consumer instalment and other personal loans | | | 291 | | | | 329 | | | | 372 | | | | 178 | | | | 81 | |
Total consumer | | | 542 | | | | 630 | | | | 650 | | | | 337 | | | | 229 | |
Commercial and Corporate | | | | | | | | | | | | | | | | | | | | |
Commercial mortgages (2) | | | 91 | | | | 87 | | | | 114 | | | | 1 | | | | – | |
Commercial real estate | | | 56 | | | | 91 | | | | 277 | | | | 254 | | | | 14 | |
Construction (non-real estate) | | | 16 | | | | 48 | | | | 31 | | | | 2 | | | | 1 | |
Retail trade | | | 6 | | | | 22 | | | | 7 | | | | 10 | | | | 7 | |
Wholesale trade | | | (2 | ) | | | 9 | | | | 44 | | | | 3 | | | | 7 | |
Agriculture | | | 4 | | | | 8 | | | | 10 | | | | 2 | | | | 5 | |
Communications | | | (9 | ) | | | 8 | | | | 3 | | | | – | | | | – | |
Manufacturing | | | 31 | | | | 9 | | | | 237 | | | | 132 | | | | (9 | ) |
Mining | | | – | | | | – | | | | – | | | | – | | | | – | |
Oil and gas | | | – | | | | (1 | ) | | | 7 | | | | 27 | | | | – | |
Transportation | | | 6 | | | | 18 | | | | 32 | | | | 12 | | | | 4 | |
Utilities | | | – | | | | – | | | | – | | | | – | | | | – | |
Forest products | | | 2 | | | | (4 | ) | | | 17 | | | | 5 | | | | – | |
Service industries | | | 27 | | | | 59 | | | | 50 | | | | 33 | | | | 2 | |
Financial institutions | | | 35 | | | | 66 | | | | 62 | | | | 251 | | | | 40 | |
Government | | | – | | | | – | | | | 1 | | | | 2 | | | | un | |
Other | | | 14 | | | | (1 | ) | | | 1 | | | | (1 | ) | | | 3 | |
Total commercial and corporate | | | 277 | | | | 419 | | | | 893 | | | | 733 | | | | 74 | |
Total specific provisions | | | 819 | | | | 1,049 | | | | 1,543 | | | | 1,070 | | | | 303 | |
General provision for credit losses | | | 38 | | | | – | | | | 60 | | | | 260 | | | | 50 | |
Total provision for credit losses | | | 857 | | | | 1,049 | | | | 1,603 | | | | 1,330 | | | | 353 | |
Adjusted specific provision for credit losses (10) | | | 801 | | | | 1,049 | | | | 1,543 | | | | 1,070 | | | | 303 | |
|
Table 19:Specific Allowances for Credit Losses –
Segmented Information($ millions) | |
| As at October 31 | | 2011 | | | 2010 | | | 2009 | | | 2008 | | | 2007 | |
Commercial and Corporate Specific | | | | | | | | | | | | | | | | | | | | |
Allowances by Industry | | | | | | | | | | | | | | | | | | | | |
Commercial mortgages (2) | | | 45 | | | | 55 | | | | 29 | | | | – | | | | – | |
Commercial real estate | | | 102 | | | | 65 | | | | 76 | | | | 108 | | | | 25 | |
Construction (non-real estate) | | | 16 | | | | 40 | | | | 7 | | | | 4 | | | | 4 | |
Retail trade | | | 13 | | | | 12 | | | | 8 | | | | 6 | | | | 7 | |
Wholesale trade | | | 8 | | | | 23 | | | | 28 | | | | 14 | | | | 17 | |
Agriculture | | | 8 | | | | 17 | | | | 19 | | | | 9 | | | | 13 | |
Communications | | | – | | | | 1 | | | | – | | | | – | | | | – | |
Manufacturing | | | 37 | | | | 85 | | | | 129 | | | | 108 | | | | 35 | |
Mining | | | – | | | | – | | | | – | | | | – | | | | – | |
Oil and gas | | | 3 | | | | 2 | | | | 6 | | | | 25 | | | | – | |
Transportation | | | 9 | | | | 9 | | | | 21 | | | | 8 | | | | 5 | |
Utilities | | | – | | | | – | | | | – | | | | – | | | | – | |
Forest products | | | 14 | | | | 15 | | | | 22 | | | | 6 | | | | 2 | |
Service industries | | | 45 | | | | 51 | | | | 43 | | | | 23 | | | | 17 | |
Financial institutions | | | 63 | | | | 101 | | | | 113 | | | | 70 | | | | 10 | |
Government | | | 2 | | | | 2 | | | | 2 | | | | 2 | | | | un | |
Other | | | 18 | | | | 4 | | | | 9 | | | | 28 | | | | 7 | |
Total specific allowances for credit losses on commercial and corporate loans (2) | | | 383 | | | | 482 | | | | 512 | | | | 411 | | | | 142 | |
| | | | |
| BMO Financial Group 194th Annual Report 2011 | | | 109 | |
SUPPLEMENTAL INFORMATION
Table 20: Contractual Obligations($ millions)
| | | | | | | | | | | | | | | | | | | | | | | | |
| As at October 31, 2011 | | Less than one year | | | 1 to 3 years | | | 3 to 5 years | | | Over 5 years | | | No fixed maturity | | | Total | |
On-Balance Sheet Financial Instruments | | | | | | | | | | | | | | | | | | | | | | | | |
Deposits (1) | | | 104,848 | | | | 25,359 | | | | 13,666 | | | | 4,650 | | | | 150,108 | | | | 298,631 | |
Subordinated debt | | | 267 | | | | 474 | | | | 537 | | | | 6,304 | | | | – | | | | 7,582 | |
Capital trust securities | | | 413 | | | | – | | | | – | | | | – | | | | – | | | | 413 | |
Other financial liabilities | | | 50,141 | | | | 315 | | | | 436 | | | | 2,866 | | | | 314 | | | | 54,072 | |
| | (1) | Excludes interest payments and structured notes designated under the fair value option. |
The balances for on-balance sheet financial liabilities in the table above will not agree with those in our consolidated financial statements as this table incorporates all cash flows, on an undiscounted basis, including both principal and interest.
| | | | | | | | | | | | | | | | | | | | | | | | |
| As at October 31, 2011 | | Less than one year | | | 1 to 3 years | | | 3 to 5 years | | | Over 5 years | | | No fixed maturity | | | Total | |
Off-Balance Sheet Financial Instruments | | | | | | | | | | | | | | | | | | | | | | | | |
Commitments to extend credit (1) | | | 23,960 | | | | 17,775 | | | | 16,655 | | | | 1,288 | | | | – | | | | 59,678 | |
Operating leases | | | 277 | | | | 462 | | | | 349 | | | | 724 | | | | – | | | | 1,812 | |
Financial guarantee contracts (1) | | | 41,907 | | | | – | | | | – | | | | – | | | | – | | | | 41,907 | |
Purchase obligations (2) | | | 704 | | | | 759 | | | | 196 | | | | 55 | | | | – | | | | 1,714 | |
| | (1) | A large majority of these commitments expire without being drawn upon. As a result, the contractual amounts may not be representative of the funding likely to be required for these commitments. |
| | (2) | We have five significant outsourcing contracts. In 2011, we entered into a two-year contract with an external service provider for technology and payment processing services. In 2010, we entered into a seven-year contract with an external service provider for various credit card account portfolios processing and other services. In 2009, we entered into a seven-year contract with an external service provider to provide brokerage transactional processing and reporting of client information. In 2008, we entered into a 15-year contract with optional five-year renewals with an external service provider which grants us the right to issue Air Miles in Canada to our customers. In 2007, we entered into a seven-year contract with an external service provider for wholesale lockbox processing. All outsourcing contracts are cancellable with notice. |
Table 21: Capital Adequacy($ millions, except as noted)
| | | | | | | | | | | | | | | | | | | | | | |
| | | Basel II basis | | | | | Basel I
basis (1) | |
| As at October 31 | | 2011 | | | 2010 | | | 2009 | | | 2008 | | | | | 2007 | |
Tier 1 capital | | | | | | | | | | | | | | | | | | | | | | |
Common shareholders’ equity | | | 24,455 | | | | 18,753 | | | | 17,132 | | | | 15,974 | | | | | | 14,233 | |
Non-cumulative preferred shares (2) (3) | | | 2,861 | | | | 2,571 | | | | 2,571 | | | | 1,996 | | | | | | 1,446 | |
Innovative Tier 1 capital instruments (2) | | | 2,156 | | | | 2,542 | | | | 2,907 | | | | 2,486 | | | | | | 2,422 | |
Non-controlling interest in subsidiaries | | | 38 | | | | 23 | | | | 26 | | | | 39 | | | | | | 33 | |
Goodwill and excess intangible assets (4) | | | (3,585 | ) | | | (1,619 | ) | | | (1,569 | ) | | | (1,635 | ) | | | | | (1,140 | ) |
Accumulated net after-tax unrealized losses on available-for-sale equity securities | | | – | | | | – | | | | (2 | ) | | | (15 | ) | | | | | – | |
Net Tier 1 capital | | | 25,925 | | | | 22,270 | | | | 21,065 | | | | 18,845 | | | | | | 16,994 | |
Securitization-related deductions | | | (168 | ) | | | (165 | ) | | | (168 | ) | | | (115 | ) | | | | | na | |
Expected loss in excess of allowance (AIRB Approach) (5) | | | (205 | ) | | | – | | | | (61 | ) | | | – | | | | | | na | |
Substantial investments and investments in insurance subsidiaries (7) | | | (481 | ) | | | (427 | ) | | | (374 | ) | | | na | | | | | | na | |
Other deductions | | | – | | | | – | | | | – | | | | (1 | ) | | | | | na | |
Adjusted Tier 1 capital | | | 25,071 | | | | 21,678 | | | | 20,462 | | | | 18,729 | | | | | | 16,994 | |
Tier 2 capital | | | | | | | | | | | | | | | | | | | | | | |
Subordinated debt | | | 5,896 | | | | 3,776 | | | | 4,236 | | | | 4,175 | | | | | | 3,335 | |
Trust subordinated notes | | | 800 | | | | 800 | | | | 800 | | | | 800 | | | | | | 800 | |
Accumulated net after-tax unrealized gains on available-for-sale equity securities | | | 7 | | | | 10 | | | | – | | | | – | | | | | | 26 | |
Eligible portion of general allowance for credit losses (5) (6) | | | 309 | | | | 292 | | | | 296 | | | | 494 | | | | | | 898 | |
Total Tier 2 capital | | | 7,012 | | | | 4,878 | | | | 5,332 | | | | 5,469 | | | | | | 5,059 | |
First-loss protection | | | na | | | | na | | | | na | | | | na | | | | | | (85 | ) |
Securitization-related deductions | | | (31 | ) | | | (29 | ) | | | (7 | ) | | | (6 | ) | | | | | na | |
Expected loss in excess of allowance (AIRB Approach) (5) | | | (205 | ) | | | – | | | | (60 | ) | | | – | | | | | | na | |
Investments in non-consolidated subsidiaries and substantial investments (7) | | | (855 | ) | | | (890 | ) | | | (868 | ) | | | (871 | ) | | | | | (994 | ) |
Adjusted Tier 2 capital | | | 5,921 | | | | 3,959 | | | | 4,397 | | | | 4,592 | | | | | | 3,980 | |
Total capital | | | 30,992 | | | | 25,637 | | | | 24,859 | | | | 23,321 | | | | | | 20,974 | |
Risk-weighted assets | | | 208,672 | | | | 161,165 | | | | 167,201 | | | | 191,608 | | | | | | 178,687 | |
Capital ratios (%) | | | | | | | | | | | | | | | | | | | | | | |
Tier 1 Capital Ratio | | | 12.01 | | | | 13.45 | | | | 12.24 | | | | 9.77 | | | | | | 9.51 | |
Total Capital Ratio | | | 14.85 | | | | 15.91 | | | | 14.87 | | | | 12.17 | | | | | | 11.74 | |
Assets-to-capital multiple | | | 13.7 | | | | 14.5 | | | | 14.1 | | | | 16.4 | | | | | | 17.2 | |
| | (1) | Beginning in fiscal 2008, capital is calculated under the Basel II guidelines, whereas for all prior periods capital is calculated using the Basel I methodology. |
| | (2) | Non-cumulative preferred shares and Innovative Tier 1 capital instruments include amounts that are reflected as liabilities on the consolidated balance sheet, but are eligible for inclusion in the capital calculation for regulatory purposes. |
| | (3) | In 2007, OSFI approved the reclassification of preferred shares issued by a subsidiary from Tier 2 capital to Innovative Tier 1 capital. |
| | (4) | In addition to goodwill, intangible assets in excess of 5% of gross Tier 1 capital are deducted from Tier 1 capital. |
| | (5) | When expected loss as calculated under the Advanced Internal Ratings Based (AIRB) Approach exceeds total provisions, 50% of the difference is deducted from Tier 1 capital and 50% from Tier 2. When the expected loss is less than total provisions, the difference is |
| | added to Tier 2 capital. The general allowance related to credit risk measured under the Standardized Approach is included in Tier 2 capital, up to 1.25% of risk-weighted assets. |
| | (6) | Under Basel I, OSFI permits the inclusion of the lesser of the balance of the general allowance for credit losses and 0.875% of risk-weighted assets. |
| | (7) | Effective November 1, 2008, substantial investments are deducted 50% from Tier 1 capital and 50% from Tier 2 capital. Previously these investments were deducted from Tier 2 capital. Investments in insurance subsidiaries held prior to January 1, 2007 are deducted from Tier 2 capital. Effective 2012, these investments in insurance subsidiaries will be deducted 50% from Tier 1 capital and 50% from Tier 2 capital. In addition, incremental investments in insurance subsidiaries are immediately deducted 50% from Tier 1 capital and 50% from Tier 2 capital. |
| | |
| 110 | | BMO Financial Group 194th Annual Report 2011 |
Table 22: Risk-Weighted Assets($ millions)
| | | | | | | | | | | | | | | | | | | | | | | | | | | | | | | | |
| | | | | | Risk-weighted assets | | | | | | Risk-weighted assets | |
| As at October 31 | | Exposure
at Default | | | Standardized
Approach | | | Advanced
Approach | | | 2011 Total | | | Exposure
at Default | | | Standardized
Approach | | | Advanced
Approach | | | 2010 Total | |
Credit Risk | | | | | | | | | | | | | | | | | | | | | | | | | | | | | | | | |
Wholesale | | | | | | | | | | | | | | | | | | | | | | | | | | | | | | | | |
Corporate, including specialized lending | | | 129,111 | | | | 30,756 | | | | 36,894 | | | | 67,650 | | | | 93,446 | | | | 9,411 | | | | 32,336 | | | | 41,747 | |
Corporate small and medium-sized enterprises | | | 45,538 | | | | 760 | | | | 23,650 | | | | 24,410 | | | | 44,742 | | | | 6,784 | | | | 14,688 | | | | 21,472 | |
Sovereign | | | 68,239 | | | | – | | | | 668 | | | | 668 | | | | 60,521 | | | | – | | | | 653 | | | | 653 | |
Bank | | | 40,179 | | | | 4 | | | | 4,976 | | | | 4,980 | | | | 42,817 | | | | 204 | | | | 4,444 | | | | 4,648 | |
Retail | | | | | | | | | | | | | | | | | | | | | | | | | | | | | | | | |
Residential mortgages, excluding home equity line of credit | | | 52,450 | | | | 2,631 | | | | 6,267 | | | | 8,898 | | | | 47,181 | | | | 2,597 | | | | 1,615 | | | | 4,212 | |
Home equity line of credit | | | 46,534 | | | | 1,600 | | | | 6,881 | | | | 8,481 | | | | 34,998 | | | | 3,138 | | | | 1,886 | | | | 5,024 | |
Qualifying revolving retail | | | 39,301 | | | | – | | | | 5,410 | | | | 5,410 | | | | 31,197 | | | | – | | | | 5,469 | | | | 5,469 | |
Other retail, excluding small and medium-sized enterprises | | | 23,418 | | | | 1,935 | | | | 9,469 | | | | 11,404 | | | | 21,883 | | | | 4,544 | | | | 7,945 | | | | 12,489 | |
Retail small and medium-sized enterprises | | | 1,515 | | | | 93 | | | | 843 | | | | 936 | | | | 1,144 | | | | 116 | | | | 555 | | | | 671 | |
Equity | | | 1,736 | | | | – | | | | 1,098 | | | | 1,098 | | | | 1,249 | | | | – | | | | 997 | | | | 997 | |
Trading book | | | 67,340 | | | | 55 | | | | 6,804 | | | | 6,859 | | | | 58,466 | | | | – | | | | 7,947 | | | | 7,947 | |
Securitization | | | 38,267 | | | | – | | | | 13,565 | | | | 13,565 | | | | 40,633 | | | | 101 | | | | 13,342 | | | | 13,443 | |
Other credit risk assets – non-counterparty managed assets | | | 81,097 | | | | – | | | | 17,742 | | | | 17,742 | | | | 65,782 | | | | – | | | | 12,006 | | | | 12,006 | |
Scaling factor for credit risk assets under AIRB Approach (1) | | | – | | | | – | | | | 6,991 | | | | 6,991 | | | | – | | | | – | | | | 5,512 | | | | 5,512 | |
Total Credit Risk | | | 634,725 | | | | 37,834 | | | | 141,258 | | | | 179,092 | | | | 544,059 | | | | 26,895 | | | | 109,395 | | | | 136,290 | |
Market Risk | | | | | | | 2,013 | | | | 2,958 | | | | 4,971 | | | | | | | | 1,589 | | | | 3,628 | | | | 5,217 | |
Operational Risk | | | | | | | 24,609 | | | | – | | | | 24,609 | | | | | | | | 19,658 | | | | – | | | | 19,658 | |
Total Basel II Risk-Weighted Assets | | | | | | | 64,456 | | | | 144,216 | | | | 208,672 | | | | | | | | 48,142 | | | | 113,023 | | | | 161,165 | |
| | (1) | The scaling factor is applied to the risk-weighted assets amounts for credit risk under the AIRB Approach. |
Table 23: Average Deposits($ millions, except as noted)
| | | | | | | | | | | | | | | | | | | | | | | | |
| | | 2011 | | | 2010 | | | 2009 | |
| | | Average
balance | | | Average
rate paid (%) | | | Average
balance | | | Average
rate paid (%) | | | Average
balance | | | Average
rate paid (%) | |
Deposits Booked in Canada | | | | | | | | | | | | | | | | | | | | | | | | |
Demand deposits – interest bearing | | | 17,489 | | | | 0.41 | | | | 15,331 | | | | 0.24 | | | | 13,640 | | | | 0.34 | |
Demand deposits – non-interest bearing | | | 21,620 | | | | – | | | | 19,213 | | | | – | | | | 16,383 | | | | – | |
Payable after notice | | | 49,282 | | | | 0.53 | | | | 45,384 | | | | 0.29 | | | | 42,480 | | | | 0.48 | |
Payable on a fixed date | | | 89,469 | | | | 1.90 | | | | 87,208 | | | | 1.88 | | | | 89,155 | | | | 2.92 | |
Total deposits booked in Canada | | | 177,860 | | | | 1.14 | | | | 167,136 | | | | 1.08 | | | | 161,658 | | | | 1.76 | |
Deposits Booked in the United States and Other Countries | | | | | | | | | | | | | | | | | | | | | | | | |
Banks located in the United States and other countries | | | 7,648 | | | | 0.53 | | | | 8,022 | | | | 0.98 | | | | 9,327 | | | | 0.72 | |
Governments and institutions in the United States and other countries | | | 9,804 | | | | 0.54 | | | | 8,862 | | | | 0.51 | | | | 9,607 | | | | 1.08 | |
Other demand deposits | | | 4,497 | | | | 0.03 | | | | 3,114 | | | | 0.03 | | | | 7,847 | | | | 0.02 | |
Other deposits payable after notice or on a fixed date | | | 70,874 | | | | 0.73 | | | | 54,829 | | | | 0.78 | | | | 64,126 | | | | 1.59 | |
Total deposits booked in the United States and other countries | | | 92,823 | | | | 0.66 | | | | 74,827 | | | | 0.74 | | | | 90,907 | | | | 1.31 | |
Total average deposits | | | 270,683 | | | | 0.98 | | | | 241,963 | | | | 0.98 | | | | 252,565 | | | | 1.60 | |
As at October 31, 2011, 2010 and 2009: deposits by foreign depositors in our Canadian bank offices amounted to $18,237 million, $14,129 million and $14,392 million, respectively; total deposits payable after notice included $24,995 million, $24,340 million and $23,477 million, respectively, of chequing accounts that would have been classified as demand deposits under U.S. reporting requirements; and total deposits payable on a fixed date included $17,365 million, $15,844 million and $16,994 million, respectively, of federal funds purchased, commercial paper issued and other deposit liabilities.
These amounts would have been classified as short-term borrowings for U.S. reporting purposes.
Table 24: Unrealized Gains (Losses) on Available-for-Sale Securities($ millions)
| | | | | | | | | | | | | | | | | | | | | | | | | | | | |
| | | | | | | | | Unrealized gains (losses) (2) | |
| As at October 31 | | Amortized cost | | | Fair value (1) | | | 2011 | | | 2010 | | | 2009 | | | 2008 | | | 2007 | |
Canadian governments debt | | | 17,791 | | | | 18,122 | | | | 331 | | | | 322 | | | | 146 | | | | 30 | | | | – | |
U.S. governments debt | | | 8,051 | | | | 8,297 | | | | 246 | | | | 293 | | | | 70 | | | | 32 | | | | 8 | |
Mortgage-backed securities – Canada | | | 10,215 | | | | 10,500 | | | | 285 | | | | 284 | | | | 247 | | | | 87 | | | | 20 | |
Mortgage backed securities – United States | | | 5,022 | | | | 5,126 | | | | 104 | | | | 31 | | | | 28 | | | | 3 | | | | (6 | ) |
Corporate debt | | | 6,649 | | | | 6,790 | | | | 141 | | | | 116 | | | | 123 | | | | (255 | ) | | | (3 | ) |
Corporate equity | | | 1,304 | | | | 1,320 | | | | 16 | | | | 24 | | | | (6 | ) | | | (19 | ) | | | 26 | |
Other governments debt | | | 8,524 | | | | 8,529 | | | | 5 | | | | 29 | | | | 47 | | | | 1 | | | | – | |
Total available-for-sale securities | | | 57,556 | | | | 58,684 | | | | 1,128 | | | | 1,099 | | | | 655 | | | | (121 | ) | | | 45 | |
| | (1) | Available-for-sale securities are reflected in the balance sheet at fair value. Unrealized gains (losses) are included in other comprehensive income. |
| | (2) | Unrealized gains (losses) may be offset by related losses (gains) on liabilities or hedge contracts. |
| | | | |
| BMO Financial Group 194th Annual Report 2011 | | | 111 | |
Glossary of Financial Terms
Adjusted Earnings and Measures
present results adjusted to exclude the impact of certain items as set out in the Non-GAAP Measures section. Management considers both reported and adjusted results to be useful in assessing underlying ongoing business performance.
Allowance for Credit Lossesrepresents an amount deemed adequate by management to absorb credit-related losses on loans and acceptances and other credit instruments. Allowances for credit losses can be specific or general and are recorded on the balance sheet as a deduction from loans and acceptances or, as they relate to credit instruments, as other liabilities.
P 71, 84, 126
Assets under Administration and under Management refers to assets administered or managed by a financial institution that are beneficially owned by clients and therefore not reported on the balance sheet of the administering or managing financial institution.
Asset-Backed Commercial Paper (ABCP)is a short-term investment with a maturity that is typically less than 180 days. The commercial paper is backed by physical assets such as trade receivables, and is generally used for short-term financing needs.
Assets-to-Capital Multiple reflects total assets, including specified off-balance sheet items net of other specified deductions, divided by total capital.
P 62, 156
Average Earning Assetsrepresents the daily or monthly average balance of deposits with other banks and loans and securities, over a one-year period.
Bankers’ Acceptances (BAs)are bills of exchange or negotiable instruments drawn by a borrower for payment at maturity and accepted by a bank. BAs constitute a guarantee of payment by the bank and can be traded in the money market. The bank earns a “stamping fee” for providing this guarantee.
Basis Point is one one-hundredth of a percentage point.
Business Riskarises from the specific business activities of a company and the effects these could have on its earnings.
P 92
Common Equity Ratio reflects common shareholders’ equity less capital adjustments, divided by risk-weighted assets.
P 62, 156
Common Shareholders’ Equity is the most permanent form of capital.Adjusted common shareholders’ equity is comprised of common shareholders’ equity less capital adjustments.
Credit and Counterparty Riskis the potential for loss due to the failure of a borrower, endorser, guarantor or counterparty to repay a loan or honour another predetermined financial obligation.
P 83
Derivativesare contracts whose value is “derived” from movements in interest or foreign exchange rates, or equity or commodity prices. Derivatives allow for the transfer, modification or reduction of current or expected risks from changes in rates and prices.
Dividend Payout Ratio represents common share dividends as a percentage of net income available to common shareholders. It is computed by dividing dividends per share by basic earnings per share.
Earnings Per Share (EPS) is calculated by dividing net income, after deduction of preferred dividends, by the average number of common shares outstanding. Diluted EPS, which is our basis for measuring performance, adjusts for possible conversions of financial instruments into common shares if those conversions would reduce EPS. Adjusted EPS is calculated in the same manner, using adjusted net income.
P 34, 166
Earnings Volatility (EV)is a measure of the adverse impact of potential changes in market parameters on the projected 12-month after-tax net income of a portfolio of assets, liabilities and off-balance sheet positions, measured at a 99% confidence level over a specified holding period.
P 85
Economic Capital is our internal assessment of the risks underlying BMO’s business activities. It represents management’s estimate of the likely magnitude of economic losses that could occur if adverse situations arise, and allows returns to be measured on a basis that considers the risks taken. Economic capital is calculated for various types of risk – credit, market (trading and non-trading), operational and business – where measures are based on a time horizon of one year. Economic
capital is a key element of our risk-based capital management and ICAAP framework.
P 64, 82
Environmental Risk is the risk of loss or damage to BMO’s reputation resulting from environmental concerns related to BMO or its customers. Environmental risk is often associated with credit, operational and reputation risk.
P 93
Fair Value is the amount of consideration that would be agreed upon in an arm’s length transaction between knowledgeable, willing parties who are under no compulsion to act.
Forwards and Futures are contractual agreements to either buy or sell a specified amount of a
currency, commodity, interest-rate-sensitive financial instrument or security at a specific price and date in the future. Forwards are customized contracts transacted in the over-the-counter market. Futures are transacted in standardized amounts on regulated exchanges and are subject to daily cash margining.
P 138
General Allowance is maintained to cover impairment in the existing credit portfolio that cannot yet be associated with specific credit assets. Our approach to establishing and maintaining the general allowance is based on the guideline issued by our regulator, OSFI. The general allowance is reviewed on a quarterly basis and a number of factors are considered when determining its appropriate level. We employ a general allowance model that applies historical expected and unexpected loss rates, based on probabilities of default and loss given default parameters, to current balances.
P 41, 84, 126
Hedging is a risk management technique used to neutralize or manage interest rate, foreign currency, equity, commodity or credit exposures arising from normal banking activities.
Impaired Loans are loans for which there is no longer reasonable assurance of the timely collection of principal or interest.
Innovative Tier 1 Capital is a form of Tier 1 capital that can be included in calculating a bank’s Tier 1 Capital Ratio, Total Capital Ratio and Assets-to-Capital Multiple. Innovative Tier 1 capital cannot comprise more than 20% of net Tier 1 capital, at time of issue, with 15% qualifying as Tier 1 capital and the remaining 5% included in Tier 2 capital.
Insurance Risk is the risk of loss due to actual experience being different from that assumed when an insurance product was designed and priced. Insurance risk exists in all our insurance businesses, including annuities and life, accident and sickness, and creditor insurance, as well as our reinsurance business.
P 91
Issuer Risk arises in BMO’s trading and underwriting portfolios, and measures the adverse impact of credit spread, credit migration and default risks on the market value of
fixed-income instruments and similar securities. Issuer risk is measured at
a 99% confidence level over a specified holding period.
P 85
Legal and Regulatory Risk is the risk of not complying with laws, contractual agreements or other legal requirements, as well as regulatory requirements, regulatory changes or regulators’ expectations. Failure to properly manage legal and regulatory risk may result in litigation claims, financial losses, regulatory sanctions, an inability to execute our business strategies, and potential harm to our reputation.
P 92
Leverage Ratio is defined as Tier 1 capital divided by the sum of on-balance sheet items and specified off-balance sheet items net of specified deductions.
P 63
Liquidity and Funding Risk is the potential for loss if BMO is unable to meet financial commitments in a timely manner at reasonable prices as they fall due. Financial commitments include liabilities to depositors and suppliers, and lending, investment and pledging commitments.
P 88, 131
Mark-to-Market represents the valuation of securities and derivatives at market rates as of the balance sheet date, where required by accounting rules.
Market Risk is the potential for adverse changes in the value of BMO’s assets and liabilities resulting from changes in market variables such as interest rates, foreign exchange rates, equity and commodity prices and their implied volatilities, and credit spreads, as well as the risk of credit migration and default.
P 85, 131
Market Value Exposure (MVE)is a measure of the adverse impact of changes in market parameters on
| | |
| 182 | | BMO Financial Group 194th Annual Report 2011 |
the market value of a portfolio of assets, liabilities and off-balance sheet positions, measured at a 99% confidence level over a specified holding period. The holding period considers current market conditions and composition of the portfolios to determine how long it would take to neutralize the market risk without adversely affecting market prices. For trading and underwriting activities, MVE is comprised of Value at Risk and Issuer Risk.
P 85
Model Risk is the potential loss due to the risk of a model not performing or capturing risk as designed. It also arises from the possibility of the use of an inappropriate model or the inappropriate use of a model.
P 92
Net Economic Profit (NEP)represents net income available to common shareholders, before deduction for the after-tax impact of the amortization of acquisition-related intangible assets, less a charge for capital. Adjusted NEP is computed using adjusted net income. NEP is an effective measure of economic value added. NEP and adjusted NEP are non-GAAP measures.
P 35
Net Interest Income is comprised of earnings on assets, such as loans and securities, including interest and dividend income and BMO’s share of income from investments accounted for using the equity method of accounting, less interest expense paid on liabilities, such as deposits.
P 39
Net Interest Margin is the ratio of net interest income to earning assets, expressed as a percentage or in basis points. Net interest margin is sometimes computed using total assets.
P 39
Notional Amount refers to the principal used to calculate interest and other payments under derivative contracts. The principal amount does not change hands under the terms of a derivative contract, except in the case of cross-currency swaps.
Off-Balance Sheet Financial Instrumentsinclude a variety of financial arrangements offered to clients, which include credit derivatives, written put options, backstop liquidity facilities, standby letters of credit, performance guarantees, credit enhancements, commitments to extend credit, securities lending, documentary and commercial letters of credit, and other indemnifications.
Operating Leverage is the difference between revenue and expense growth rates. Adjusted operating
leverage is the difference between adjusted revenue and adjusted expense growth rates.
P 27
Operational Risk is the potential for loss resulting from inadequate or failed internal processes or systems, human interactions or external events, but excludes business risk.
P 90
Options are contractual agreements that convey to the buyer the right but not the obligation to either buy or sell a specified amount of a currency, commodity, interest-rate-sensitive financial instrument or security at a fixed future date or at any time within a fixed future period.
P 138
Productivity Ratio (or Expense-to- Revenue Ratio or Efficiency Ratio)is a key measure of productivity. It is calculated as non-interest expense divided by total revenues, expressed as a percentage. The adjusted productivity ratio is calculated in the same manner, utilizing adjusted revenue and expense.
P 43
Provision for Credit Lossesis a charge to income that represents an amount deemed adequate by management to fully provide for impairment in loans and acceptances and other credit instruments, given the composition of the portfolios, the probability of default, the economic environment and the allowance for credit losses already established.
P 41, 81, 126
Reputation Risk is the risk of a negative impact on BMO that results from a deterioration in stakeholders’ perception of BMO’s reputation. These potential impacts include revenue loss, litigation, regulatory sanction or additional oversight, declines in client loyalty and declines in BMO’s share price.
P 93
Return on Equity or Return on Common Shareholders’ Equity (ROE) is calculated as net income, less preferred dividends, as a percentage of average common shareholders’ equity. Common shareholders’ equity is comprised of common share capital, contributed surplus, accumulated other comprehensive income (loss) and retained earnings. Adjusted ROE is calculated using adjusted net income.
P 35
Securities Borrowed or Purchased under Resale Agreements are low-cost, low-risk instruments, often supported by the pledge of cash collateral, which arise from transactions that involve the borrowing or purchasing of securities.
Securities Lent or Sold under Repurchase Agreements are low-cost, low-risk liabilities, often supported by cash collateral, which arise from transactions that involve the lending or selling of securities.
Specific Allowances reduce the carrying value of specific credit assets to the amount we expect to recover if there is evidence of deterioration in credit quality.
P 41 84, 126
Strategic Risk is the potential for loss due to fluctuations in the external business environment and/or failure to properly respond to these fluctuations due to inaction, ineffective strategies or poor implementation of strategies.
P 93
Swaps are contractual agreements between two parties to exchange a series of cash flows. The various
swap agreements that we enter into are as follows:
| • | | Commodity swaps – counterparties generally exchange fixed and floating rate payments based on a notional value of a single commodity. |
| • | | Credit default swaps –one counterparty pays the other a fee in exchange for that other counterparty agreeing to make a payment if a credit event occurs, such as bankruptcy or failure to pay. |
| • | | Cross-currency interest rate swaps – fixed and floating rate interest payments and principal amounts are exchanged in different currencies. |
| • | | Cross-currency swaps – fixed rate interest payments and principal amounts are exchanged in different currencies. |
| • | | Equity swaps – counterparties exchange the return on an equity security or a group of equity securities for the return based on a fixed or floating interest rate or the return on another equity security or group of equity securities. |
| • | | Interest rate swaps – counterparties generally exchange fixed and floating rate interest payments based on a notional value in a single currency. |
P 138
Taxable Equivalent Basis (teb): Revenues of operating groups reflected in our MD&A are presented on a taxable equivalent basis (teb). The teb adjustment increases GAAP revenues and the provision for income taxes by an amount that would increase revenues on certain tax-exempt securities to a level that would incur tax at the statutory rate, to facilitate comparisons.
P 39
Tier 1 Capital is primarily comprised of regulatory common equity, preferred shares and Innovative Tier 1 capital.
Tier 1 Capital Ratio reflects Tier 1 capital divided by risk-weighted assets.
P 62, 156
Total Capital includes Tier 1 and Tier 2 capital, net of certain deductions. Tier 2 capital is primarily comprised of subordinated debentures and a portion of the general allowance for credit losses.
Total Capital Ratio reflects total capital divided by risk-weighted assets.
P 62, 156
Total Shareholder Return (TSR):The five-year average annual total shareholder return (TSR) represents the average annual total return earned on an investment in BMO common shares made at the beginning of a five-year period. The return includes the change in share price and assumes that dividends received were reinvested in additional common shares. The one-year TSR also assumes that dividends were reinvested in shares.
P 33
Trading-Related Revenues include net interest income and non-interest revenue earned from on- and off-balance sheet positions undertaken for trading purposes. The management of these positions typically includes marking them to market on a daily basis. Trading-related revenues include income (expense) and gains (losses) from both on-balance sheet instruments and interest rate, foreign exchange (including spot positions), equity, commodity and credit contracts.
P 41
Value at Risk (VaR) is measured for specific classes of risk in BMO’s trading and underwriting activities: interest rate, foreign exchange rate, equity and commodity prices and their implied volatilities. This measure calculates the maximum likely loss from portfolios, measured at a 99% confidence level over a specified holding period.
P 85
Variable Interest Entities (VIEs) include entities with equity that is considered insufficient to finance the entity’s activities or in which the equityholders do not have a controlling financial interest. We are required to consolidate VIEs if the investments we hold in these entities and/or the relationships we have with them result in us being exposed to the majority of their expected losses and/or being able to benefit from a majority of their expected residual returns, based on a calculation determined by standard setters.
P 70, 71, 136
| | | | |
| BMO Financial Group 194th Annual Report 2011 | | | 183 | |