MANAGEMENT’S DISCUSSION AND ANALYSIS
Management’s Discussion and Analysis
BMO’s Chief Executive Officer and its Chief Financial Officer have signed a statement outlining management’s responsibility for financial information in the annual consolidated financial statements and Management’s Discussion and Analysis (MD&A). The statement, which can be found on page 136, also explains the roles of the Audit and Conduct Review Committee and Board of Directors in respect of that financial information.
The MD&A comments on BMO’s operations and financial condition for the years ended October 31, 2016 and 2015. The MD&A should be read in conjunction with our consolidated financial statements for the year ended October 31, 2016. The MD&A commentary is as of December 6, 2016. Unless otherwise indicated, all amounts are stated in Canadian dollars and have been derived from financial statements prepared in accordance with International Financial Reporting Standards (IFRS) as issued by the International Accounting Standards Board. References to generally accepted accounting principles (GAAP) mean IFRS.
Since November 1, 2011, BMO’s financial results have been reported in accordance with IFRS. Results for years prior to 2011 have not been restated and are presented in accordance with Canadian GAAP as defined at that time (CGAAP). As such, certain growth rates and compound annual growth rates (CAGR) may not be meaningful. On November 1, 2013, BMO adopted several new and amended accounting pronouncements issued by the International Accounting Standards Board. The consolidated financial statements for comparative periods in the fiscal years 2013 and 2012 have been restated. Certain other prior year data has been reclassified to conform with the current year’s presentation. The adoption of new IFRS standards in 2015 only impacted our results prospectively. Prior periods have been reclassified for methodology changes and transfers of certain businesses between operating groups. See pages 45 and 46.
| | | | |
| | 27 | | Who We Are provides an overview of BMO Financial Group, explains the links between our financial objectives and our overall vision, and outlines “Reasons to Invest in BMO” along with relevant key performance data. |
| | 28 | | Enterprise-Wide Strategy outlines our enterprise-wide strategy and the context in which it is developed, as well as our progress in relation to our priorities. |
| | 30 | | Caution Regarding Forward-Looking Statements advises readers about the limitations and inherent risks and uncertainties of forward-looking statements. |
| | |
| | 30 | | Economic Developments and Outlook includes commentary on the Canadian, U.S. and international economies in 2016 and our expectations for 2017. |
| | 32 | | Value Measures reviews financial performance on the four key measures that assess or most directly influence shareholder return. It also includes explanations of non-GAAP measures, a reconciliation to their GAAP counterparts for the fiscal year, and a summary of adjusting items that are excluded from results to assist in the review of key measures and adjusted results. |
| | 32 | | Total Shareholder Return |
| | 33 | | Non-GAAP Measures |
| | 34 | | Summary Financial Results and Earnings per Share Growth |
| | 35 | | Return on Equity |
| | 35 | | Common Equity Tier 1 Ratio |
| | 36 | | 2016 Financial Performance Review provides a detailed review of BMO’s consolidated financial performance by major income statement category. It also includes a summary of the impact of changes in foreign exchange rates. |
| | 45 | | 2016 Operating Groups Performance Review outlines the strategies and key priorities of our operating groups and the challenges they face, along with their strengths and value drivers. It also includes a summary of their achievements in 2016, their focus for 2017, and a review of their financial performance for the year and the business environment in which they operate. |
| | 46 | | Summary |
| | 47 | | Personal and Commercial Banking |
| | 48 | | Canadian Personal and Commercial Banking |
| | 51 | | U.S. Personal and Commercial Banking |
| | 55 | | BMO Wealth Management |
| | 58 | | BMO Capital Markets |
| | 62 | | Corporate Services, including Technology and Operations |
| | 63 | | Review of Fourth Quarter 2016 Performance, 2015 Financial Performance Review andSummary Quarterly Earnings Trends provide commentary on results for relevant periods other than fiscal 2016. |
| | | | |
| | 68 | | | Financial Condition Review comments on our assets and liabilities by major balance sheet category. It includes a review of our capital adequacy and our approach to optimizing our capital position to support our business strategies and maximize returns to our shareholders. It also includes a review of off-balance sheet arrangements and certain select financial instruments. |
| | 68 | | | Summary Balance Sheet |
| | 70 | | | Enterprise-Wide Capital Management |
| | 77 | | | Select Financial Instruments |
| | 78 | | | Off-Balance Sheet Arrangements |
| | 79 | | | Enterprise-Wide Risk Management outlines our approach to managing key financial risks and other related risks we face. |
| | 80 | | | Overview |
| | 80 | | | Risks That May Affect Future Results |
| | 83 | | | Framework and Risks |
| | 88 | | | Credit and Counterparty Risk |
| | 95 | | | Market Risk |
| | 100 | | | Liquidity and Funding Risk |
| | 106 | | | Operational Risk |
| | 107 | | | Model Risk |
| | 109 | | | Insurance Risk |
| | 110 | | | Legal and Regulatory Risk |
| | 111 | | | Business Risk |
| | 111 | | | Strategic Risk |
| | 112 | | | Environmental and Social Risk |
| | 112 | | | Reputation Risk |
| | 113 | | | Accounting Matters and Disclosure and Internal Control reviews critical accounting estimates and changes in accounting policies in 2016 and for future periods. It also outlines our evaluation of disclosure controls and procedures and internal control over financial reporting, and provides an index of disclosures recommended by the Enhanced Disclosure Task Force. |
| | 113 | | | Critical Accounting Estimates |
| | 115 | | | Changes in Accounting Policies in 2016 |
| | 115 | | | Future Changes in Accounting Policies |
| | 117 | | | Transactions with Related Parties |
| | 118 | | | Shareholders’ Auditors’ Services and Fees |
| | 119 | | | Management’s Annual Report on Disclosure Controls and Procedures and Internal Control over Financial Reporting |
| | 120 | | | Enhanced Disclosure Task Force |
| | 122 | | | Supplemental Information presents other useful financial tables and more historical detail. |
Regulatory Filings
Our continuous disclosure materials, including our interim financial statements and interim MD&A, annual audited consolidated financial statements and annual MD&A, Annual Information Form and Notice of Annual Meeting of Shareholders and Management Proxy Circular, are available on our website at www.bmo.com/investorrelations, on the Canadian Securities Administrators’ website at www.sedar.com and on the EDGAR section of the SEC’s website at www.sec.gov. BMO’s Chief Executive Officer and its Chief Financial Officer certify the appropriateness and fairness of BMO’s annual and interim consolidated financial statements, MD&A and Annual Information Form, the effectiveness of BMO’s disclosure controls and procedures and the effectiveness of, and any material weaknesses relating to, BMO’s internal control over financial reporting.
| | |
| 26 | | BMO Financial Group 199th Annual Report 2016 |
Who We Are
Established in 1817, BMO Financial Group is a highly diversified financial services provider based in North America. With total assets of $688 billion and more than 45,000 employees, BMO provides a broad range of personal and commercial banking, wealth management and investment banking products and services to more than 12 million customers. We serve eight million customers across Canada through our Canadian personal and commercial arm, BMO Bank of Montreal. We also serve customers through our wealth management businesses: BMO Asset Management, BMO Nesbitt Burns, BMO Private Banking, BMO Insurance and BMO InvestorLine. BMO Capital Markets, our investment and corporate banking and trading products division, provides a full suite of financial products and services to North American and international clients. In the United States, BMO serves customers through BMO Harris Bank, based in the U.S. Midwest with more than two million retail, small business and commercial customers. BMO Financial Group conducts business through three operating groups: Personal and Commercial Banking, Wealth Management and BMO Capital Markets.
Our Financial Objectives
BMO’s medium-term financial objectives for certain important performance measures are set out below. We believe that we will deliver top-tier total shareholder return and meet our medium-term financial objectives by aligning our operations with, and executing on, our strategic priorities, along with our vision, as outlined on the following page. We consider top-tier returns to be top-quartile shareholder returns relative to our Canadian and North American peer group.
BMO’s business planning process is rigorous, sets ambitious goals and considers the prevailing economic conditions, our risk appetite, our customers’ evolving needs and the opportunities available across our lines of business. It includes clear and direct accountability for annual performance that is measured against both internal and external benchmarks and progress toward our strategic priorities.
Over the medium term, our financial objectives on an adjusted basis are to achieve average annual earnings per share (adjusted EPS) growth of 7% to 10%, earn an average annual return on equity (adjusted ROE) of 15% or more, generate average annual adjusted net operating leverage of 2% or more and maintain capital ratios that exceed regulatory requirements. These objectives are guideposts as we execute against our strategic priorities. In managing our operations and risk, we recognize that current profitability and the ability to meet these objectives in a single period must be balanced with the need to invest in our businesses for their future long-term health and growth prospects.
Our one-year adjusted EPS growth rate was 7.4% and our five-year average annual adjusted EPS growth rate was 8.2%, in line with our target growth range of 7% to 10%. Our annual adjusted operating leverage on a net revenue basis was 2.1%, in line with our target of 2% or more, reflecting our focus on improving efficiency. Our five-year average annual adjusted ROE of 14.3% was below our target of 15% or more. Higher capital requirements negatively impact ROE and as a result, our 15% ROE objective is ambitious and will take time to attain. BMO is well-capitalized with a Common Equity Tier 1 Ratio of 10.1%.
Reasons to Invest in BMO
| | • | | Strong, diversified businesses that continue to deliver robust earnings growth and long-term value for shareholders. | |
| | • | | Large North American commercial banking business with advantaged market share. |
| | • | | Well-established, highly profitable core banking business in Canada. |
| | • | | Diversified U.S. banking operations well-positioned to benefit from growth opportunities. |
| | • | | Award-winning wealth franchise with an active presence in markets across Canada, the United States, Europe and Asia. |
| | • | | Competitively advantaged Canadian and growing mid-cap focused U.S. capital markets business. |
| | • | | Well-capitalized with an attractive dividend yield. | |
| | • | | Committed to customer experience, measured through a disciplined loyalty program. | |
| | • | | Focus on efficiency through technology innovation, process enhancement and increased digitalization across channels. | |
| | • | | Adherence to strong business ethics and corporate governance standards, including sustainability principles that ensure we consider social, economic and environmental impacts as we pursue sustainable growth. | |
| | | | | | | | | | | | | | | | | | |
| | | As at and for the periods ended October 31, 2016 (%, except as noted) | | 1-year | | | 5-year* | | | 10-year* | | | | |
| | Average annual total shareholder return | | | 17.0 | | | | 12.5 | | | | 7.1 | | | | | |
| | Average growth in annual EPS | | | 5.3 | | | | 7.8 | | | | 4.8 | | | | | |
| | Average growth in annual adjusted EPS | | | 7.4 | | | | 8.2 | | | | 4.3 | | | | | |
| | Average annual ROE | | | 12.1 | | | | 13.9 | | | | 13.7 | | | | | |
| | Average annual adjusted ROE | | | 13.1 | | | | 14.3 | | | | 15.0 | | | | | |
| | Compound growth in annual dividends declared per share | | | 4.9 | | | | 4.0 | | | | 6.3 | | | | | |
| | Dividend yield** | | | 4.0 | | | | 4.2 | | | | 4.7 | | | | | |
| | Price-to-earnings multiple** | | | 12.3 | | | | 11.6 | | | | 12.6 | | | | | |
| | Market value/book value ratio** | | | 1.43 | | | | 1.52 | | | | 1.60 | | | | | |
| | Common Equity Tier 1 Ratio | | | 10.1 | | | | na | | | | na | | | | | |
| | * | 5-year and 10-year growth rates reflect growth based on CGAAP in 2006 and IFRS in 2011 and 2016, respectively. |
| | ** | 1-year measure as at October 31, 2016. 5-year and 10-year measures are the average of year-end values. |
na – not applicable
Adjusted results in this section are non-GAAP and are discussed in the Non-GAAP Measures section on page 33.
The Our Financial Objectives section above and the Enterprise-Wide Strategy and Economic Developments and Outlook sections that follow contain certain forward-looking statements. By their nature, forward-looking statements require us to make assumptions and are subject to inherent risks and uncertainties. Please refer to the Caution Regarding Forward-Looking Statements on page 30 of this MD&A for a discussion of such risks and uncertainties and the material factors and assumptions related to the statements set forth in such sections.
| | | | |
| BMO Financial Group 199th Annual Report 2016 | | | 27 | |
MANAGEMENT’S DISCUSSION AND ANALYSIS
Enterprise-Wide Strategy
Our Vision
To be the bank that defines great customer experience.
Our Strategy in Context
We aim to deliver top-tier total shareholder return and balance our commitments to financial performance, our customers and employees, the environment and the communities where we live and work.
Continually focused on our future, with 200 years of experience that helps us chart the course, we continue to navigate an increasingly complex world characterized by: mixed macroeconomic performance, evolving customer needs, rapid technology advances, competitive intensity and a dynamic regulatory environment. In the face of these shifts, our commitment to our customers is unwavering. Our brand promise –We’re here to help – and our vision inspire and guide what we do every day. We aim to help our customers feel valued, understood and confident in the financial decisions they make.
We are well positioned and feel confident about the future. We have a strong balance sheet and are well-capitalized. Our disciplined approach to risk is backed by a solid record of regulatory compliance. We have a diversified business mix that extends to key geographies and customer segments. Our employees are highly skilled and engaged. These elements are foundational to our sustained growth and help us deliver on our vision and brand promise.
Our commitment to stakeholders is evident in our focus on delivering an industry-leading customer experience, managing revenues and expenses to achieve our financial goals, and maintaining a prudent approach to risk management. We have made clear progress against our priorities with the foundation of a strong brand, more flexible technology platform, improved processes and transformed cost base.
We have a clear plan, aligned with our vision and anchored in five strategic priorities. We have made good progress on these priorities with select accomplishments outlined below, as well as in our group strategic priorities, detailed in the 2016 Operating Groups Performance Review, which starts on page 45.
Our 2016 Priorities and Progress
| 1. | Achieve industry-leading customer loyalty by delivering on our brand promise. |
| • | | Applied a focused approach to identifying and improving the experiences most important to our customers, recognizing changing customer behaviours and preferences: |
| | • | | Leveraged new data analytics capabilities to enhance and streamline customers’ experiences when interacting with us digitally. Improvements delivered to date created capacity across our sales force for additional advice-based conversations resulting in higher customer loyalty. |
| | • | | Introduced a new service to allow prospective customers to open a BMO bank account in under seven minutes using their smartphone. This first-of-its-kind in Canada account opening capability allows customers to quickly search, select and open an account with BMO using an intuitive, conversational interface. |
| • | | Completed a refresh of automated banking machines in Canada to improve digital functionality, including: intelligent touch screens; the ability to make multi-deposit transactions; envelope-free deposits with straight-through processing; and an instant on-screen view of scanned cheques and cash. |
| • | | In the United States, introduced two new Smart Branch locations, providing customers with the best of our innovative technologies in a unique, smaller format tailored to their needs. |
| • | | Received awards across our groups recognizing our commitment to customers and progress in delivering against our priorities, including: Best Commercial Bank in Canada (World Finance Magazine), Best Domestic Private Bank, U.S.(Global Financial Market Review), Best Trade Bank in Canada(Trade Finance Magazine), and for the seventh consecutive year, World’s Best Metals & Mining Investment Bank(Global Finance). |
| • | | Recognized as one of Canada’s Best Brands 2017 byCanadian Business. |
| 2. | Enhance productivity to drive performance and shareholder value. |
| • | | Aligned our physical, digital and telephone channels via a North American channels strategy to deliver a customer experience to meet our loyalty and efficiency objectives: |
| | • | | Continued to invest in capabilities to support increasing customer preference of completing transactions through digital channels, which now represent approximately 40% of total service transaction volume. |
| | • | | Enhanced our digital sales capabilities. Digital retail banking sales volumes in Canada are now equivalent to sales at over 115 branches. |
| | • | | Continued to roll out new branch formats offering smaller, more flexible and more cost-effective points of distribution across North America with a branch staffing mix strategy that supports and emphasizes the branch as a critical point for complex advice-based sales such as mortgages and investments. |
| • | | Disciplined expense management control in place, with positive operating leverage in 2016. |
| 3. | Accelerate deployment of digital technology to transform our business. |
| • | | Delivered new digital capabilities and offerings across businesses, demonstrating BMO’s commitment to leadership in digital banking: |
| | • | | Continued to make progress in re-engineering our technology architecture to be more customer-centric, faster, and more cost-effective. |
| | • | | Created personalized, intuitive applications for our customers, with increased speed-to-market, while enhancing risk management and boosting productivity. |
| | • | | Extended Apple Pay to our Canadian customers, allowing them to make secure purchases with their BMO credit and debit cards while using their iPhones. |
| | • | | In Canada, launched biometric security enhancements to select corporate card customers with MasterCard Identity Check™. Using the application, customers can verify their identity using facial recognition and fingerprints when making mobile and online purchases. |
| | • | | Launched a BMO debit card in Canada, enabling customers to make safe and secure contactless payments using Interac Flash. |
| | |
| 28 | | BMO Financial Group 199th Annual Report 2016 |
| • | | In partnership with Ryerson University’s DMZ, announced the launch of BMO Presents: The Next Big Idea in Fintech – a program to help discover Canada’s most innovative fintech companies with the idea of giving them market exposure and a chance to ultimately test their service through BMO. |
| • | | Leveraged our enhanced technology capabilities to change how work is completed, allowing us to improve pace and reduce delivery cost. For example, in six months we launched BMO SmartFolio®, an easy, affordable digital portfolio management service that aligns to individual investment objectives and provides clients with online access to investment solutions. |
| 4. | Leverage our consolidated North American platform and expand strategically in select global markets to deliver growth. |
| • | | Expanded our leading North American commercial banking franchise to better serve customers in Canada and the United States: |
| | • | | In Canada, maintained #2 market share for business loans up to $25 million with lending and deposit growth of 10% and 6%, respectively, in our commercial banking business. |
| | • | | Improved our processes and increased platform efficiency, enabling our sales force to spend more time with customers, while streamlining our product portfolio to support growing customer preference for digital banking. |
| | • | | On December 1, 2015, completed the acquisition of General Electric Capital Corporation’s Transportation Finance business, the largest provider of financing for the truck and trailer segment in North America, and rebranded it BMO Transportation Finance. |
| • | | Acquired Greene Holcomb Fisher, a boutique M&A advisory business based in Minneapolis. |
| • | | Extended our exchange traded fund (ETF) offering to clients in Europe and Asia, building on our #2 position in Canada in ETFs. |
| • | | Reorganized BMO’s Asset Management business to fully leverage the global reach and competitiveness of the business. |
| 5. | Ensure our strength in risk management underpins everything we do for our customers. |
| • | | Improved risk data and risk reporting through significant investment in streamlined data collection, more timely data, greater data coverage, report automation and heightened governance. |
| • | | Further enhanced stress testing and other data analysis and modelling. |
| • | | Maintained our risk culture through enhanced assessment and learning tools and communication processes. |
| • | | Responded to rising regulatory expectations, evidenced by improvements in stress testing, market risk measurement, anti-money laundering tools and processes and foundational risk management. |
| • | | Continued to develop the next generation of our risk infrastructure by integrating, automating and upgrading foundational capabilities for risk and data analysis and modelling of market, credit and operational risks. |
| | | | |
| BMO Financial Group 199th Annual Report 2016 | | | 29 | |
MANAGEMENT’S DISCUSSION AND ANALYSIS
Factors That May Affect Future Results
As noted in the following Caution Regarding Forward-Looking Statements, all forward-looking statements and information, by their nature, are subject to inherent risks and uncertainties, both general and specific, which may cause actual results to differ materially from the expectations expressed in any forward-looking statement. The Enterprise-Wide Risk Management section starting on page 79 describes a number of risks, including credit and counterparty, market, liquidity and funding, operational, model, insurance, legal and regulatory, business, strategic, environmental and social, and reputation risk. Should our risk management framework prove ineffective, there could be a material adverse impact on our financial position.
| | | | |
| | Caution Regarding Forward-Looking Statements Bank of Montreal’s public communications often include written or oral forward-looking statements. Statements of this type are included in this document, and may be included in other filings with Canadian securities regulators or the U.S. Securities and Exchange Commission, or in other communications. All such statements are made pursuant to the “safe harbor” provisions of, and are intended to be forward-looking statements under, the United StatesPrivate Securities Litigation Reform Act of 1995 and any applicable Canadian securities legislation. Forward-looking statements may involve, but are not limited to, comments with respect to our objectives and priorities for fiscal 2017 and beyond, our strategies or future actions, our targets, expectations for our financial condition or share price, and the results of or outlook for our operations or for the Canadian, U.S. and international economies. By their nature, forward-looking statements require us to make assumptions and are subject to inherent risks and uncertainties. There is significant risk that predictions, forecasts, conclusions or projections will not prove to be accurate, that our assumptions may not be correct, and that actual results may differ materially from such predictions, forecasts, conclusions or projections. We caution readers of this document not to place undue reliance on our forward-looking statements, as a number of factors could cause actual future results, conditions, actions or events to differ materially from the targets, expectations, estimates or intentions expressed in the forward-looking statements. The future outcomes that relate to forward-looking statements may be influenced by many factors, including but not limited to: general economic and market conditions in the countries in which we operate; weak, volatile or illiquid capital and/or credit markets; interest rate and currency value fluctuations; changes in monetary, fiscal, tax or economic policy; the level of competition in the geographic and business areas in which we operate; changes in laws or in supervisory expectations or requirements, including capital, interest rate and liquidity requirements and guidance; judicial or regulatory proceedings; the accuracy and completeness of the information we obtain with respect to our customers and counterparties; our ability to execute our strategic plans and to complete and integrate acquisitions, including obtaining regulatory approvals; critical accounting estimates and the effect of changes to accounting standards, rules and interpretations on these estimates; operational and infrastructure risks; changes to our credit ratings; political conditions, including changes relating to or affecting economic or trade matters; global capital markets activities; the possible effects on our business of war or terrorist activities; outbreaks of disease or illness that affect local, national or international economies; natural disasters and disruptions to public infrastructure, such as transportation, communications, power or water supply; technological changes; information and cyber security; and our ability to anticipate and effectively manage risks arising from all of the foregoing factors. We caution that the foregoing list is not exhaustive of all possible factors. Other factors and risks could adversely affect our results. For more information, please see the discussion in the Risks That May Affect Future Results section on page 80, and the sections related to credit and counterparty, market, liquidity and funding, operational, model, insurance, legal and regulatory, business, strategic, environmental and social, and reputation risk, which begin on page 88 and outline certain key factors and risks that may affect Bank of Montreal’s future results. Investors and others should carefully consider these factors and risks, as well as other uncertainties and potential events, and the inherent uncertainty of forward-looking statements. Bank of Montreal does not undertake to update any forward-looking statements, whether written or oral, that may be made from time to time by the organization or on its behalf, except as required by law. The forward-looking information contained in this document is presented for the purpose of assisting our shareholders in understanding our financial position as at and for the periods ended on the dates presented, as well as our strategic priorities and objectives, and may not be appropriate for other purposes. Assumptions about the performance of the Canadian and U.S. economies, as well as overall market conditions and their combined effect on our business, are material factors we consider when determining our strategic priorities, objectives and expectations for our business. In determining our expectations for economic growth, both broadly and in the financial services sector, we primarily consider historical economic data provided by the Canadian and U.S. governments and their agencies. See the Economic Developments and Outlook section of this document. | | |
Economic Developments and Outlook
Economic Developments in 2016 and Outlook for 2017
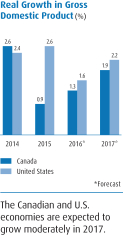
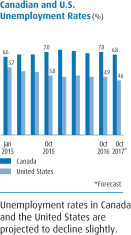
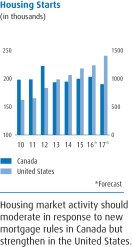
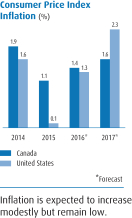
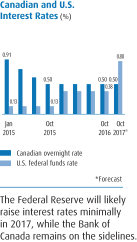
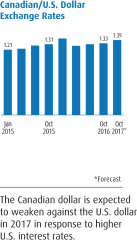
Looking back to 2016, the Canadian economy grew slowly, impacted by lower levels of investment in the oil industry and a temporary disruption in output from the Alberta oil sands, caused by wildfires. Slower job growth kept the unemployment rate near 7% this year. The uneven global expansion has dampened business confidence and spending. There was weaker momentum in the United States, China, the Eurozone and the United Kingdom, with the potential fallout from the Brexit referendum threatening to upset business confidence in the latter two regions. Consequently, exports, Canada’s major engine of growth in the past two years, shifted into a lower gear in 2016. However, this was partially offset by growth in consumer spending, an increase in infrastructure spending by the federal government, and further expansion in housing markets. Record home sales and accelerating prices in Vancouver pushed the government of British Columbia to impose a property transfer tax on purchases by foreign buyers to prevent further overheating, while the federal government announced measures to curb mortgage lending, as well as foreign investment in residential real estate. Looking forward to 2017, our current prediction is for Canadian real GDP growth to improve from an estimated 1.3% in 2016 to 1.9% in 2017. We expect that economic recovery will be driven by expansionary federal fiscal policy, an expected increase in oil prices, and a pickup in exports in response to firmer U.S. demand and a still-low Canadian dollar. Growth in residential mortgages is expected to slow to around 5% in 2017, while consumer credit should continue to expand by close to 3%. Growth in business loans is projected to moderate to around 6% next year, given the decline in capital expenditures in the resource sector. Long-term interest rates fell in 2016 in response to steady policies by the Bank of Canada, modest economic growth and low inflation. The yield on10-year government notes reached record lows below 1% in the summer of 2016, before turning up in anticipation of tighter Federal Reserve policy. The Bank of Canada is expected to keep its policy rate unchanged at 0.5% in 2017.
| | |
| 30 | | BMO Financial Group 199th Annual Report 2016 |
Growth in the U.S. economy slowed in 2016, reflecting low levels of exports, a reduction in oil production and a decrease in spending in the agriculture sector prompted by low crop prices. Investment was dampened by uncertainty related to slowing growth in the global economy, the Brexit referendum and the U.S. presidential election. Although job growth moderated this year, the unemployment rate has fallen to pre-recession levels. Rising household wealth and incomes supported consumer spending, while record-low mortgage rates and less restrictive lending standards encouraged a recovery in housing markets. Real growth in U.S. GDP is currently projected to improve from an estimated 1.6% in 2016 to 2.2% in 2017. An upturn in business spending, notably in the energy industry, should complement continued strength in consumer spending and housing markets. Fiscal policy should also turn more expansionary in response to the president-elect’s proposals to reduce personal income and business taxes, and to increase infrastructure spending. Growth in consumer credit and residential mortgages is currently expected to remain healthy in 2017, supported by rising consumer confidence and continued low interest rates, and business loan growth is also expected to hold firm. The Federal Reserve will likely raise its policy rates minimally in 2017, as inflation pressures are expected to remain moderate.
Following modest economic growth in recent years, the pace of expansion in the U.S. Midwest region, which includes the six contiguous states within the BMO footprint, is expected to improve from an estimated 1.6% in 2016 to 1.8% in 2017 in response to increases in agricultural production, a recovering housing market and generally expansionary fiscal policies. However, the region will likely see lower growth than the national economy as a result of slower population growth, low levels of exports due to the strength of the U.S. dollar, and a levelling off in automotive production after several years of rapid growth.
This Economic Developments and Outlook section contains forward-looking statements. Please see the Caution Regarding Forward-Looking Statements.
Note: Data points are averages for the month, quarter or year, as appropriate. References to years are calendar years.
| | | | |
| BMO Financial Group 199th Annual Report 2016 | | | 31 | |
MANAGEMENT’S DISCUSSION AND ANALYSIS
Value Measures
Total Shareholder Return
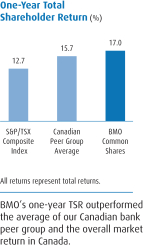
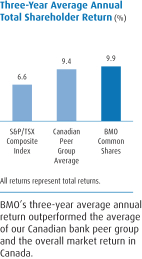
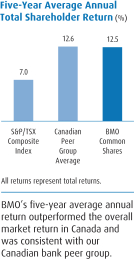
The average annual total shareholder return (TSR) is a key measure of shareholder value, and confirms that our strategic priorities drive value creation for our shareholders. Our one-year TSR of 17.0% and our three-year average annual TSR of 9.9% were strong, and both outperformed the corresponding averages of our Canadian bank peer group and the overall market return in Canada. Our five-year average annual TSR of 12.5% also outperformed the overall market return in Canada, and was consistent with our Canadian bank peer group.
The table below summarizes dividends paid on BMO common shares over the past five years and the movements in BMO’s share price. An investment of $1,000 in BMO common shares made at the beginning of fiscal 2012 would have been worth $1,802 at October 31, 2016, assuming reinvestment of dividends, for a total return of 80.2%.
On December 6, 2016, BMO announced that the Board of Directors had declared a quarterly dividend on common shares of $0.88 per share, up $0.02 per share or 2% from the prior quarter and up $0.04 per share or 5% from a year ago. The dividend is payable on February 28, 2017 to shareholders of record on February 1, 2017. We have increased our quarterly dividend declared four times over the past two years from $0.80 per common share for the first quarter of 2015. Dividends paid over a ten-year period have increased at an average annual compound rate of 4.7%.
Theaverage annual total shareholder return (TSR) represents the average annual total return earned on an investment in BMO common shares made at the beginning of a fixed period. The return includes the change in share price and assumes that dividends received were reinvested in additional common shares.
Total Shareholder Return
| | | | | | | | | | | | | | | | | | | | | | | | | | | | |
| For the year ended October 31 | | 2016 | | | 2015 | | | 2014 | | | 2013 | | | 2012 | | | 3-year CAGR (1) | | | 5-year CAGR (1) | |
Closing market price per common share ($) | | | 85.36 | | | | 76.04 | | | | 81.73 | | | | 72.62 | | | | 59.02 | | | | 5.5 | | | | 7.7 | |
Dividends paid ($ per share) | | | 3.36 | | | | 3.20 | | | | 3.04 | | | | 2.92 | | | | 2.80 | | | | 4.8 | | | | 3.7 | |
Dividend yield (%) | | | 4.0 | | | | 4.3 | | | | 3.8 | | | | 4.0 | | | | 4.8 | | | | nm | | | | nm | |
Increase (decrease) in share price (%) | | | 12.3 | | | | (7.0 | ) | | | 12.5 | | | | 23.0 | | | | 0.2 | | | | nm | | | | nm | |
Total annual shareholder return (%) (2) | | | 17.0 | | | | (3.0 | ) | | | 17.1 | | | | 28.8 | | | | 5.2 | | | | 9.9 | | | | 12.5 | |
| | (1) | Compound annual growth rate (CAGR) expressed as a percentage. |
| | (2) | Total annual shareholder return assumes reinvestment of quarterly dividends and therefore does not equal the sum of dividend and share price returns in the table. |
| | |
| 32 | | BMO Financial Group 199th Annual Report 2016 |
Non-GAAP Measures
Results and measures in this MD&A are presented on a GAAP basis. They are also presented on an adjusted basis that excludes the impact of certain items as set out in the following table. Results and measures that exclude the impact of Canadian/U.S. dollar exchange rate movements on our U.S. segment are non-GAAP measures (please see the Foreign Exchange section on page 37 for a discussion of the effects of changes in exchange rates on our results). Management assesses performance on a reported basis and on an adjusted basis and considers both to be useful in assessing underlying ongoing business performance. Presenting results on both bases provides readers with a better understanding of how management assesses results. It also permits readers to assess the impact of certain specified items on results for the periods presented and to better assess results excluding those items if they consider the items not to be reflective of ongoing results. As such, the presentation may facilitate readers’ analysis of trends, as well as comparisons with our competitors. Except as otherwise noted, management’s discussion of changes in adjusted results in this MD&A applies equally to changes in the corresponding reported results. Adjusted results and measures are non-GAAP and as such do not have standardized meaning under GAAP. They are unlikely to be comparable to similar measures presented by other companies and should not be viewed in isolation from or as a substitute for GAAP results.
| | | | | | | | | | | | |
| (Canadian $ in millions, except as noted) | | 2016 | | | 2015 | | | 2014 | |
| | | |
Reported Results | | | | | | | | | | | | |
Revenue (1) | | | 21,087 | | | | 19,389 | | | �� | 18,223 | |
Insurance claims, commissions and changes in policy benefit liabilities (CCPB) (1) | | | (1,543 | ) | | | (1,254 | ) | | | (1,505 | ) |
Revenue, net of CCPB | | | 19,544 | | | | 18,135 | | | | 16,718 | |
Provision for credit losses | | | (815 | ) | | | (612 | ) | | | (561 | ) |
Non-interest expense | | | (12,997 | ) | | | (12,182 | ) | | | (10,921 | ) |
Income before income taxes | | | 5,732 | | | | 5,341 | | | | 5,236 | |
Provision for income taxes | | | (1,101 | ) | | | (936 | ) | | | (903 | ) |
Net Income | | | 4,631 | | | | 4,405 | | | | 4,333 | |
Diluted EPS ($) | | | 6.92 | | | | 6.57 | | | | 6.41 | |
| | | |
Adjusting Items (Pre-tax)(2) | | | | | | | | | | | | |
Acquisition integration costs (3) | | | (104 | ) | | | (53 | ) | | | (20 | ) |
Amortization of acquisition-related intangible assets (4) | | | (160 | ) | | | (163 | ) | | | (140 | ) |
Cumulative accounting adjustment (5) | | | (85 | ) | | | – | | | | – | |
Restructuring costs (6) | | | (188 | ) | | | (149 | ) | | | – | |
Adjusting items included in reported pre-tax income | | | (537 | ) | | | (365 | ) | | | (160 | ) |
| | | |
Adjusting Items (After tax)(2) | | | | | | | | | | | | |
Acquisition integration costs (3) | | | (71 | ) | | | (43 | ) | | | (16 | ) |
Amortization of acquisition-related intangible assets (4) | | | (124 | ) | | | (127 | ) | | | (104 | ) |
Cumulative accounting adjustment (5) | | | (62 | ) | | | – | | | | – | |
Restructuring costs (6) | | | (132 | ) | | | (106 | ) | | | – | |
Adjusting items included in reported net income after tax | | | (389 | ) | | | (276 | ) | | | (120 | ) |
Impact on diluted EPS ($) | | | (0.60 | ) | | | (0.43 | ) | | | (0.18 | ) |
| | | |
Adjusted Results | | | | | | | | | | | | |
Revenue (1) | | | 21,171 | | | | 19,391 | | | | 18,223 | |
Insurance claims, commissions and changes in policy benefit liabilities (CCPB) (1) | | | (1,543 | ) | | | (1,254 | ) | | | (1,505 | ) |
Revenue, net of CCPB | | | 19,628 | | | | 18,137 | | | | 16,718 | |
Provision for credit losses | | | (815 | ) | | | (612 | ) | | | (561 | ) |
Non-interest expense | | | (12,544 | ) | | | (11,819 | ) | | | (10,761 | ) |
Income before income taxes | | | 6,269 | | | | 5,706 | | | | 5,396 | |
Provision for income taxes | | | (1,249 | ) | | | (1,025 | ) | | | (943 | ) |
Net Income | | | 5,020 | | | | 4,681 | | | | 4,453 | |
Diluted EPS ($) | | | 7.52 | | | | 7.00 | | | | 6.59 | |
Adjusted results and measures in this table are non-GAAP amounts or non-GAAP measures.
| | (1) | Effective the first quarter of 2015, insurance claims, commissions and changes in policy benefit liabilities (CCPB) are reported separately. They were previously reported as a reduction in insurance revenue in non-interest revenue. Prior period amounts and ratios have been reclassified. |
| | (2) | Adjusting items are included in Corporate Services with the exception of the amortization of acquisition-related intangible assets, which is charged to the operating groups, and acquisition integration costs related to F&C Asset Management plc (F&C), which are charged to Wealth Management. |
| | (3) | Acquisition integration costs related to F&C are charged to Wealth Management. Acquisition integration costs related to BMO Transportation Finance are charged to Corporate Services, since the acquisition impacts both Canadian and U.S. P&C businesses. Acquisition integration costs are primarily recorded in non-interest expense. |
| | (4) | These expenses are included in the non-interest expense of the operating groups. Before and after-tax amounts for each operating group are provided on pages 47, 49, 53, 56 and 60. |
| | (5) | Cumulative accounting adjustment recognized in other non-interest revenue related to foreign currency translation that largely impacted prior periods. |
| | (6) | Restructuring charge in 2016, as we accelerate the use of technology to enhance customer experience and focus on driving operational efficiencies. Restructuring charge in 2015, primarily due to restructuring to drive operational efficiencies. Restructuring costs are recorded in non-interest expense. |
| | | | |
| BMO Financial Group 199th Annual Report 2016 | | | 33 | |
MANAGEMENT’S DISCUSSION AND ANALYSIS
| | |
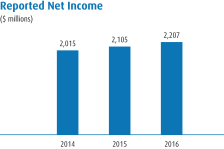
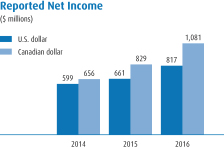
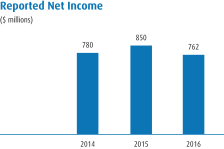
Summary Financial Results and Earnings per Share Growth The year-over-year percentage change in earnings per share (EPS) and in adjusted EPS are our key measures for analyzing earnings growth. All references to EPS are to diluted EPS, unless otherwise indicated. EPS was $6.92, up $0.35 or 5% from $6.57 in 2015. Adjusted EPS was $7.52, up $0.52 or 7% from $7.00 in 2015. Our five-year average annual adjusted EPS growth rate was 8.2%, in line with our current medium-term objective of achieving average annual adjusted EPS growth of 7% to 10%. EPS growth primarily reflected increased earnings. Reported net income available to common shareholders was 5% higher over the one-year period and 54% higher over the five-year period, while the average number of diluted common shares outstanding was relatively unchanged over the one-year period and increased 6% over the five-year period. Net income was $4,631 million in 2016, up $226 million or 5% from the previous year. Adjusted net income excludes restructuring costs, the amortization of acquisition-related intangible assets, acquisition integration costs and a cumulative accounting adjustment related to foreign currency translation that largely impacted prior periods. Adjusted net income was $5,020 million, up $339 million or 7%. Reported and adjusted net income growth reflects the benefit of strong BMO Capital Markets results, the BMO Transportation Finance acquisition, solid organic business growth in the P&C businesses and operating leverage. Results were lower in Wealth Management largely due to the prior year benefit of a gain on sale, as well as a write-down of an equity investment net of a gain on its subsequent sale in 2016, and lower insurance results. Corporate Services results were also lower. The impact of the stronger U.S. dollar increased adjusted net income by $60 million or 1%. On a reported and adjusted basis, there was good revenue growth in 2016. Higher revenue exceeded incremental costs, contributing to growth in net income. In 2016, provisions for credit losses increased by $203 million to $815 million and the effective income tax rate increased from 17.5% to 19.2%. Canadian P&C reported net income increased $102 million or 5% to $2,207 million, due to continued revenue growth as a result of higher balances and increased non-interest revenue, partially offset by higher expenses and provisions for credit losses. Expenses increased primarily due to continued investment in the business, net of disciplined expense management. Canadian P&C results are discussed in the operating group review on page 48. U.S. P&C reported net income increased $252 million or 30% to $1,081 million and adjusted net income, which excludes the amortization of acquisition-related intangible assets, increased $249 million or 28% to $1,131 million. On a U.S. dollar basis, reported net income increased $156 million or 24% to $817 million and adjusted net income increased $151 million or 22% to $854 million primarily due to the acquired BMO Transportation Finance business, which contributed approximately 14% to both revenue and expenses in the year, and organic growth. U.S. P&C results are discussed in the operating group review on page 51. Wealth Management reported net income was $762 million, compared to $850 million a year ago and adjusted net income, which excludes the amortization of acquisition-related intangible assets and acquisition integration costs, was $863 million, compared to $955 million a year ago. Reported net income in traditional wealth was $540 million, compared to $610 million a year ago and adjusted net income in traditional wealth was $641 million compared to $715 million a year ago, as solid underlying growth was more than offset by the prior year benefits of a gain on the sale of BMO’s U.S. retirement services business, as well as a write-down of an equity investment net of a gain on its subsequent sale in 2016. Net income in insurance was $222 million, compared to $240 million a year ago, primarily due to higher benefits from actuarial assumptions and asset-liability management changes in the prior year, partially offset by growth in the underlying businesses. Wealth Management results are discussed in the operating group review on page 55. BMO Capital Markets reported net income increased $239 million or 23% to $1,268 million, reflecting improved trading revenue performance, strong mergers and acquisitions advisory activity and higher lending revenues, partially offset by lower net securities gains. Higher revenue was partially offset by higher expenses and loan loss provisions. Operating leverage was positive 9.0% year over year. BMO Capital Markets results are discussed in the operating group review on page 58. Corporate Services reported net loss for the year was $687 million, compared to a reported net loss of $408 million a year ago. Reported results in both years include a restructuring charge and acquisition integration costs. The adjusted net loss for the year was $452 million, compared to an adjusted net loss of $296 million a year ago. Both reported and adjusted results declined due to lower revenue driven by a recovery under a legal settlement in the prior year, lower impaired real estate gains and lower purchase accounting revenue, partially offset by higher credit recoveries in the current year. Reported expenses increased primarily due to higher acquisition integration costs related to the acquired BMO Transportation Finance business and higher restructuring costs in the current year, and reported revenue was lower due to a cumulative accounting adjustment related to foreign currency translation that largely impacted prior periods. Corporate Services results are discussed in the operating group review on page 62. Changes to reported and adjusted net income for each of our operating groups are discussed in more detail in the 2016 Operating Groups Performance Review, which starts on page 45. | | 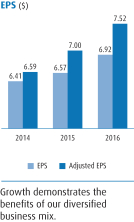
|
Earnings per share (EPS) is calculated by dividing net income attributable to bank shareholders, after the deduction of preferred dividends, by the average number of common shares outstanding. Diluted EPS, which is our basis for measuring performance, adjusts for possible conversions of financial instruments into common shares if those conversions would reduce EPS, and is more fully explained in Note 24 on page 194 of the financial statements. Adjusted EPS is calculated in the same manner using adjusted net income.
Adjusted results in this section are non-GAAP and are discussed in the Non-GAAP Measures section on page 33.
| | |
| 34 | | BMO Financial Group 199th Annual Report 2016 |
| | |
Return on Equity Increased capital expectations for banks internationally have resulted in increased levels of common shareholders’ equity over the last several years which, all else being equal, negatively impacts return on equity (ROE). ROE was 12.1% in 2016 and adjusted ROE was 13.1%, compared with 12.5% and 13.3%, respectively, in 2015. ROE declined in 2016 primarily due to growth in common equity exceeding growth in income. There was an increase of $219 million or 5% in net income available to common shareholders and $332 million or 7% in adjusted net income available to common shareholders in 2016. Average common shareholders’ equity increased $2.9 billion or 8% from 2015, primarily due to increased retained earnings and the impact of the stronger U.S. dollar on our investments in foreign operations. The reported return on tangible common equity (ROTCE) was 15.3%, compared with 15.8% in 2015 and adjusted ROTCE was 16.1%, compared with 16.4% in 2015. Book value per share increased 6% from the prior year to $59.56, given the increase in shareholders’ equity. | | 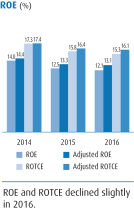
|
Return on common shareholders’ equity (ROE) is calculated as net income, less non-controlling interest in subsidiaries and preferred dividends, as a percentage of average common shareholders’ equity. Common shareholders’ equity is comprised of common share capital, contributed surplus, accumulated other comprehensive income (loss) and retained earnings. Adjusted ROE is calculated using adjusted net income rather than net income. Return on tangible common equity (ROTCE) is calculated as net income available to common shareholders adjusted for amortization of intangibles as a percentage of average tangible common equity. Tangible common equity is calculated as common shareholders’ equity less goodwill and acquisition-related intangible assets, net of related deferred tax liabilities. Adjusted ROTCE is calculated using adjusted net income rather than net income. ROTCE is commonly used in the North American banking industry and is meaningful because it measures the performance of businesses consistently, whether they were acquired or developed organically. | |
| |
Return on Equity and Return on Tangible Common Equity (1)
| | | | | | | | | | | | | | | | | | | | |
(Canadian $ in millions, except as noted) For the year ended October 31 | | 2016 | | | 2015 | | | 2014 | | | 2013 | | | 2012 | |
Reported net income | | | 4,631 | | | | 4,405 | | | | 4,333 | | | | 4,195 | | | | 4,156 | |
Attributable to non-controlling interest in subsidiaries | | | (9 | ) | | | (35 | ) | | | (56 | ) | | | (65 | ) | | | (74 | ) |
Preferred dividends | | | (150 | ) | | | (117 | ) | | | (120 | ) | | | (120 | ) | | | (136 | ) |
Net income available to common shareholders (A) | | | 4,472 | | | | 4,253 | | | | 4,157 | | | | 4,010 | | | | 3,946 | |
After-tax amortization of acquisition-related intangibles | | | 124 | | | | 127 | | | | 104 | | | | 89 | | | | 96 | |
Net income available to common shareholders after adjusting for amortization of acquisition-related intangible assets (B) | | | 4,596 | | | | 4,380 | | | | 4,261 | | | | 4,099 | | | | 4,042 | |
After-tax impact of other adjusting items | | | 265 | | | | 149 | | | | 16 | | | | (61 | ) | | | (193 | ) |
Adjusted net income available to common shareholders (C) | | | 4,861 | | | | 4,529 | | | | 4,277 | | | | 4,038 | | | | 3,849 | |
Average common shareholders’ equity (D) | | | 36,997 | | | | 34,135 | | | | 29,680 | | | | 26,956 | | | | 24,863 | |
Return on equity (%) (= A/D) | | | 12.1 | | | | 12.5 | | | | 14.0 | | | | 14.9 | | | | 15.9 | |
Adjusted return on equity (%) (= C/D) | | | 13.1 | | | | 13.3 | | | | 14.4 | | | | 15.0 | | | | 15.5 | |
Average tangible common equity (E) | | | 30,101 | | | | 27,666 | | | | 24,595 | | | | 22,860 | | | | 20,798 | |
Return on tangible common equity (%) (= B/E) | | | 15.3 | | | | 15.8 | | | | 17.3 | | | | 17.9 | | | | 19.4 | |
Adjusted return on tangible common equity (%) (= C/E) | | | 16.1 | | | | 16.4 | | | | 17.4 | | | | 17.7 | | | | 18.5 | |
| | (1) | Certain comparative figures have been reclassified to conform with the current year’s presentation. |
Adjusted results in this section are non-GAAP and are discussed in the Non-GAAP Measures section on page 33.
| | |
Common Equity Tier 1 Ratio BMO’s Common Equity Tier 1 (CET1) Ratio reflects a well-capitalized position relative to the risk in our business. Our CET1 Ratio was 10.1% at October 31, 2016, compared to 10.7% at October 31, 2015. The CET1 Ratio decreased by 60 basis points from the end of fiscal 2015 due to increased risk-weighted assets (RWA), largely from the Basel I Capital floor and business growth, and the acquisition of the BMO Transportation Finance business in the first quarter, which reduced the ratio by approximately 60 basis points, partially offset by capital growth. | | 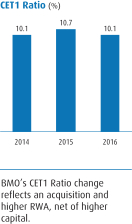 |
Common Equity Tier 1 (CET1) Ratio is calculated as CET1 capital, which is comprised of common shareholders’ equity less deductions for goodwill, intangible assets, pension assets, certain deferred tax assets and other items, divided by risk-weighted assets for CET1. | |
| |
| |
| |
| |
| | | | |
| BMO Financial Group 199th Annual Report 2016 | | | 35 | |
MANAGEMENT’S DISCUSSION AND ANALYSIS
2016 Financial Performance Review
This section provides a review of our enterprise financial performance for 2016 that focuses on the Consolidated Statement of Income included in our consolidated financial statements, which begin on page 139. A review of our operating groups’ strategies and performance follows the enterprise review. A summary of the enterprise financial performance for 2015 appears on page 64.
Highlights
| | • | | Net income was $4,631 million in 2016, up $226 million or 5% from the previous year. Adjusted net income was $5,020 million, up $339 million or 7%. Reported and adjusted net income growth reflects the benefit of strong BMO Capital Markets results, the BMO Transportation Finance acquisition, solid organic business growth in the P&C businesses and operating leverage. Results were lower in Wealth Management, largely due to the prior year benefit of a gain on sale, as well as the write-down of an equity investment net of a gain on its subsequent sale in 2016, and lower insurance results. Corporate Services results were also lower. The impact of the stronger U.S. dollar increased adjusted net income by $60 million or 1%. |
| | • | | On a net revenue basis(1), revenue increased $1,409 million or 8% in 2016 to $19,544 million, and adjusted revenue increased $1,491 million or 8% to $19,628 million. Adjusted revenue excludes a cumulative accounting adjustment in the amount of $85 million recognized in 2016. Revenue growth reflects the benefits of our diversified business mix and successful execution against our strategic priorities. The increase was mainly due to revenue growth in the P&C businesses, which benefited from the acquired BMO Transportation Finance business and organic growth, and in BMO Capital Markets, with a decrease in Wealth Management and Corporate Services. The impact of the stronger U.S. dollar increased adjusted net revenue by $345 million or 2%. |
| | • | | Reported non-interest expense increased $815 million or 7% to $12,997 million in 2016. Adjusted non-interest expense increased $725 million or 6% to $12,544 million. Adjusted non-interest expense excludes acquisition integration costs, the amortization of acquisition-related intangible assets and restructuring costs. Reported and adjusted expenses increased primarily due to the impact of the acquired BMO Transportation Finance business, business growth and investment and the stronger U.S. dollar, partially offset by the benefits of divestitures. | |
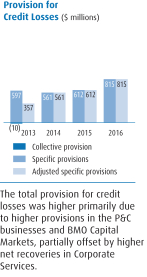
| | • | | Provisions for credit losses totalled $815 million in the current year, up from $612 million in 2015, as higher provisions in the P&C businesses and BMO Capital Markets were partially offset by higher net recoveries in Corporate Services. | |
| | • | | The effective income tax rate in 2016 was 19.2%, compared with 17.5% in 2015. The adjusted effective income tax rate(2) was 19.9%, compared with 18.0% in 2015. The higher reported and adjusted effective tax rate was attributable to a higher proportion of income from higher tax rate jurisdictions and lower tax-exempt income from securities. | |
| | (1) | See page 38 for a description of net revenue. |
| | (2) | The adjusted rate is computed using adjusted net income rather than reported net income in the determination of income subject to tax. |
Adjusted results in this section are non-GAAP and are discussed in the Non-GAAP Measures section on page 33.
| | |
| 36 | | BMO Financial Group 199th Annual Report 2016 |
Foreign Exchange
The U.S. dollar was stronger compared to the Canadian dollar at October 31, 2016 than it was at October 31, 2015. At October 31, 2016, the Canadian dollar traded at $1.3411 per U.S. dollar, compared to $1.3075 per U.S. dollar at October 31, 2015. BMO’s U.S.-dollar-denominated assets and liabilities are translated at year-end rates. The average exchange rate over the course of 2016, which is used in the translation of BMO’sU.S.-dollar-denominated revenues and expenses, was higher in 2016 than in 2015. Consequently, the Canadian dollar equivalents of BMO’sU.S.-dollar-denominated net income, revenues, expenses, recovery of (provision for) credit losses and income taxes in 2016 increased relative to the preceding year. The table below indicates average Canadian/U.S. dollar exchange rates in 2016, 2015 and 2014 and the impact of changes in the average rates on our U.S. segment results.
Changes in the exchange rate will affect future results measured in Canadian dollars and the impact on those results is a function of the periods in which revenues, expenses and provisions for (recoveries of) credit losses arise. If future results are consistent with results in 2016, each one cent increase (decrease) in the Canadian/U.S. dollar exchange rate, expressed in terms of how many Canadian dollars one U.S. dollar buys, would be expected to increase (decrease) the Canadian dollar equivalent of our U.S. segment net income before income taxes for the year by $11 million in the absence of hedging transactions. References in this MD&A to the impact of the U.S. dollar do not include the U.S.-dollar-denominated amounts recorded outside of BMO’s U.S. segment.
Economically, our U.S. dollar income stream was largely unhedged to changes in foreign exchange rates during the year. During 2016, we hedged a portion of the forecasted BMO Capital Markets U.S. dollar net income. These hedges are subject to mark-to-market accounting, which resulted in a $3 million after tax loss in 2016 that was recorded in our BMO Capital Markets business. We regularly determine whether to execute hedging transactions to mitigate the impact of foreign exchange rate movements on net income.
See the Enterprise-Wide Capital Management section on page 70 for a discussion of the impact that changes in foreign exchange rates can have on our capital position.
Changes in foreign exchange rates will also affect accumulated other comprehensive income primarily from the translation of our investment in foreign operations. Each one cent increase (decrease) in the Canadian/U.S. dollar exchange rate, expressed in terms of how many Canadian dollars one U.S. dollar buys, would be expected to increase (decrease) the translation of the unhedged portion of our investment in foreign operations by $150 million.
Effects of Changes in Exchange Rates on BMO’s Reported and Adjusted Results
| | | | | | | | |
| (Canadian $ in millions, except as noted) | | 2016 vs. 2015 | | | 2015 vs. 2014 | |
Canadian/U.S. dollar exchange rate (average) | | | | | | | | |
2016 | | | 1.3251 | | | | | |
2015 | | | 1.2550 | | | | 1.2550 | |
2014 | | | | | | | 1.0937 | |
| | |
Effects on reported results | | | | | | | | |
Increased net interest income | | | 204 | | | | 409 | |
Increased non-interest revenue | | | 144 | | | | 351 | |
Increased revenues | | | 348 | | | | 760 | |
Increased provision for credit losses | | | (3 | ) | | | (5 | ) |
Increased expenses | | | (265 | ) | | | (598 | ) |
Increased income taxes | | | (20 | ) | | | (33 | ) |
Increased reported net income before impact of hedges | | | 60 | | | | 124 | |
Hedging losses in current year after tax | | | (3 | ) | | | (21 | ) |
Increased reported net income | | | 57 | | | | 103 | |
| | |
Effects on adjusted results | | | | | | | | |
Increased net interest income | | | 204 | | | | 409 | |
Increased non-interest revenue | | | 144 | | | | 351 | |
Increased revenues | | | 348 | | | | 760 | |
Increased provision for credit losses | | | (11 | ) | | | (15 | ) |
Increased expenses | | | (253 | ) | | | (578 | ) |
Increased income taxes | | | (21 | ) | | | (34 | ) |
Increased adjusted net income before impact of hedges | | | 63 | | | | 133 | |
Hedging losses in current year after tax | | | (3 | ) | | | (21 | ) |
Increased adjusted net income | | | 60 | | | | 112 | |
Caution
This Foreign Exchange section contains forward-looking statements. Please see the Caution Regarding Forward-Looking Statements.
Adjusted results in this section are non-GAAP and are discussed in the Non-GAAP Measures section on page 33.
| | | | |
| BMO Financial Group 199th Annual Report 2016 | | | 37 | |
MANAGEMENT’S DISCUSSION AND ANALYSIS
Revenue(1)
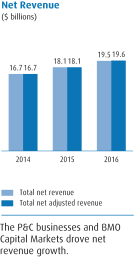
Revenue increased $1,698 million or 9% in 2016 to $21,087 million. On a basis that nets insurance claims, commissions and changes in policy benefit liabilities (CCPB) against insurance revenue (net revenue), reported revenue increased $1,409 million or 8% to $19,544 million.
Adjusted revenue differs from reported revenue largely due to a cumulative accounting adjustment in the amount of $85 million recognized in 2016 in other non-interest revenue, related to foreign currency translation, largely impacting prior periods. Adjusted revenue, net of CCPB, increased $1,491 million or 8% to $19,628 million, including a $345 million or 2% impact of the stronger U.S. dollar. Reported and adjusted revenue increased due to revenue growth in the P&C businesses, which benefited from the acquired BMO Transportation Finance business and organic growth, and in BMO Capital Markets, with a decrease in Wealth Management and Corporate Services.
BMO analyzes revenue at the consolidated level based on GAAP revenues as reported in the consolidated financial statements, and on an adjusted basis. Consistent with our Canadian peer group, we analyze revenue on a taxable equivalent basis (teb) at the operating group level. The teb adjustments for 2016 totalled $510 million, down from $524 million in 2015.
Canadian P&C revenue increased $328 million or 5% to $6,968 million as a result of higher balances and increased non-interest revenue.
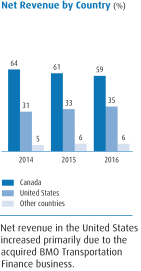
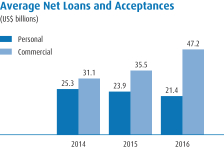
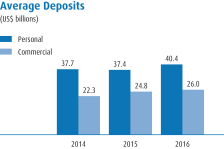
U.S. P&C revenue increased $1,033 million or 29% on a Canadian dollar basis and increased $628 million or 22% on a U.S. dollar basis, primarily due to the benefit of the acquired BMO Transportation Finance business, as well as organic loan and deposit growth.
Wealth Management revenue, net of CCPB, was $4,345 million, compared to $4,509 million in the prior year. Revenue in traditional wealth was $3,923 million, compared to $4,057 million a year ago, as solid underlying growth in our spread-based and fee-based revenue was more than offset by the prior year benefits of a gain on the sale of BMO’s U.S. retirement services business, the impact of divestitures and the write-down of an equity investment net of a gain on its subsequent sale in 2016. There was underlying growth in our insurance businesses, although net insurance revenue decreased, primarily due to higher beneficial actuarial assumptions and asset-liability management changes in the prior year.
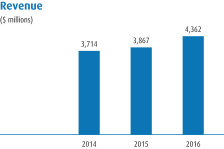
BMO Capital Markets revenue increased $495 million or 13% to $4,362 million, reflecting improved trading revenue performance, strong mergers and acquisitions advisory activity, higher lending revenues and the impact of the stronger U.S. dollar, partially offset by lower net securities gains.
Corporate Services reported revenue declined $283 million and adjusted revenue declined $201 million. Both reported and adjusted revenue declined due to above-trend revenue in the prior year, which included a recovery under a legal settlement, as well as lower impaired real estate gains and lower purchase accounting revenue in the current year.
| (1) | Commencing in 2015, insurance claims, commissions and changes in policy benefit liabilities are reported separately. They were previously reported as a reduction in insurance revenue in non-interest revenue. Prior period amounts and ratios have been reclassified. Insurance can experience variability arising from fluctuations in the fair value of insurance assets and the related liabilities. The investments which support actuarial liabilities are predominantly fixed income assets recorded at fair value with changes in the fair values recorded in insurance revenue in the Consolidated Statement of Income. These fair value changes are largely offset by changes in the fair value of policy benefit liabilities, the impact of which is reflected in insurance claims, commissions and changes in policy benefit liabilities. The discussion of revenue on a net basis reduces this variability in the results, which allows for a better discussion of operating results. For additional discussion of insurance claims, commissions and changes in policy benefit liabilities, see page 41. |
Taxable equivalent basis (teb) Revenues of operating groups are presented in our MD&A on a taxable equivalent basis (teb). Revenue and the provision for income taxes are increased on tax-exempt securities to an equivalent before-tax basis to facilitate comparisons of income between taxable and tax-exempt sources. This adjustment is offset in Corporate Services.
Revenue and Adjusted Revenue(1)
| | | | | | | | | | | | | | | | | | | | |
(Canadian $ in millions, except as noted) For the year ended October 31 | | 2016 | | | 2015 | | | 2014 | | | 2013 | | | 2012 | |
Net interest income | | | 9,872 | | | | 8,763 | | | | 8,292 | | | | 8,487 | | | | 8,749 | |
Year-over-year growth (%) | | | 13 | | | | 6 | | | | (2 | ) | | | (3 | ) | | | 17 | |
Non-interest revenue | | | 11,215 | | | | 10,626 | | | | 9,931 | | | | 8,343 | | | | 8,354 | |
Year-over-year growth (%) | | | 6 | | | | 7 | | | | 19 | | | | – | | | | 10 | |
Total revenue | | | 21,087 | | | | 19,389 | | | | 18,223 | | | | 16,830 | | | | 17,103 | |
Cdn./U.S. dollar translation effect | | | 345 | | | | 732 | | | | 320 | | | | 87 | | | | 99 | |
Year-over-year growth (%) | | | 9 | | | | 6 | | | | 8 | | | | (2 | ) | | | 14 | |
Impact of Cdn./U.S. dollar translation effect (%) | | | 2 | | | | 4 | | | | 2 | | | | 1 | | | | 1 | |
Adjusted net interest income | | | 9,872 | | | | 8,764 | | | | 8,292 | | | | 7,830 | | | | 7,970 | |
Year-over-year growth (%) | | | 13 | | | | 6 | | | | 6 | | | | (2 | ) | | | 10 | |
Adjusted non-interest revenue | | | 11,299 | | | | 10,627 | | | | 9,931 | | | | 8,309 | | | | 8,070 | |
Year-over-year growth (%) | | | 6 | | | | 7 | | | | 20 | | | | 3 | | | | 6 | |
Total adjusted revenue (2) | | | 21,171 | | | | 19,391 | | | | 18,223 | | | | 16,139 | | | | 16,040 | |
Year-over-year growth (%) | | | 9 | | | | 6 | | | | 13 | | | | 1 | | | | 8 | |
Total adjusted revenue, net of CCPB (2) | | | 19,628 | | | | 18,137 | | | | 16,718 | | | | 15,372 | | | | 14,866 | |
Cdn./U.S. dollar translation effect | | | 345 | | | | 732 | | | | 320 | | | | 78 | | | | 85 | |
Year-over-year growth (%) | | | 8 | | | | 8 | | | | 9 | | | | 3 | | | | 8 | |
Impact of Cdn./U.S. dollar translation effect (%) | | | 2 | | | | 4 | | | | 2 | | | | 1 | | | | 1 | |
| | (1) | Commencing in the first quarter of 2015, insurance claims, commissions and changes in policy benefit liabilities (CCPB) are reported separately. They were previously reported as a reduction in insurance revenue in non-interest revenue. Prior period amounts and ratios have been reclassified. |
| | (2) | Adjusted revenue for 2012 and 2013 excludes the portion of the credit mark recorded in net interest income on the purchased performing loan portfolio and income or losses from run-off structured credit activities recorded in non-interest revenue, which are recorded in Corporate Services. |
Adjusted results in this section are non-GAAP and are discussed in the Non-GAAP Measures section on page 33.
| | |
| 38 | | BMO Financial Group 199th Annual Report 2016 |
Net Interest Income
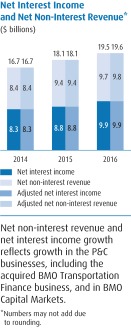
Net interest income increased $1,109 million or 13% to $9,872 million in 2016. Net interest income increased 10%, excluding the impact of the stronger U.S. dollar, due to the acquired BMO Transportation Finance business and organic volume growth.
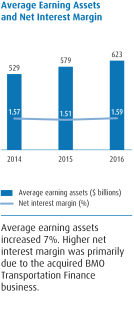
BMO’s overall net interest margin increased 8 basis points to 1.59%. Net interest margin excluding trading increased 3 basis points from the prior year. Higher net interest margin was primarily due to the acquired BMO Transportation Finance business.
Average earning assets increased by $43.3 billion or 7% to $622.7 billion, or increased $30.8 billion or 5%, excluding the impact of the stronger U.S. dollar, due to organic loan growth and the acquired BMO Transportation Finance business.
The main drivers of BMO’s overall net interest margin are the individual group margins, changes in the magnitude of each operating group’s average earning assets and changes in net interest income in Corporate Services. Changes are discussed in the 2016 Operating Groups Performance Review section starting on page 45.
Table 5 on page 126 and Table 6 on page 127 provide further details on net interest income and net interest margin.
Net interest income is comprised of earnings on assets, such as loans and securities, including interest and dividend income, less interest expense paid on liabilities, such as deposits.
Net interest margin is the ratio of net interest income to average earning assets, expressed as a percentage or in basis points.
Change in Net Interest Income, Average Earning Assets and Net Interest Margin
| | | | | | | | | | | | | | | | | | | | | | | | | | | | | | | | | | | | | | | | | | | | |
| | | Net interest income (teb) | | | | | | Average earning assets | | | | | | Net interest margin | |
(Canadian $ in millions, except as noted) For the year ended October 31 | | | | | Change | | | | | | | | | Change | | | | | | (in basis points) | |
| | 2016 | | | 2015 | | | % | | | | | | 2016 | | | 2015 | | | % | | | | | | 2016 | | | 2015 | | | Change | |
Canadian P&C | | | 5,060 | | | | 4,806 | | | | 5 | | | | | | | | 199,526 | | | | 189,505 | | | | 5 | | | | | | | | 254 | | | | 254 | | | | – | |
U.S. P&C | | | 3,528 | | | | 2,836 | | | | 24 | | | | | | | | 97,447 | | | | 81,965 | | | | 19 | | | | | | | | 362 | | | | 346 | | | | 16 | |
Personal and Commercial Banking (P&C) | | | 8,588 | | | | 7,642 | | | | 12 | | | | | | | | 296,973 | | | | 271,470 | | | | 9 | | | | | | | | 289 | | | | 282 | | | | 7 | |
Wealth Management | | | 614 | | | | 565 | | | | 9 | | | | | | | | 25,898 | | | | 23,784 | | | | 9 | | | | | | | | 237 | | | | 238 | | | | (1 | ) |
BMO Capital Markets | | | 1,509 | | | | 1,332 | | | | 13 | | | | | | | | 254,461 | | | | 238,916 | | | | 7 | | | | | | | | 59 | | | | 56 | | | | 3 | |
Corporate Services | | | (839 | ) | | | (776 | ) | | | (8 | ) | | | | | | | 45,400 | | | | 45,301 | | | | – | | | | | | | | nm | | | | nm | | | | nm | |
Total BMO reported | | | 9,872 | | | | 8,763 | | | | 13 | | | | | | | | 622,732 | | | | 579,471 | | | | 7 | | | | | | | | 159 | | | | 151 | | | | 8 | |
U.S P&C (US$ in millions) | | | 2,663 | | | | 2,260 | | | | 18 | | | | | | | | 73,569 | | | | 65,319 | | | | 13 | | | | | | | | 362 | | | | 346 | | | | 16 | |
nm – not meaningful
Adjusted results in this section are non-GAAP and are discussed in the Non-GAAP Measures section on page 33.
| | | | |
| BMO Financial Group 199th Annual Report 2016 | | | 39 | |
MANAGEMENT’S DISCUSSION AND ANALYSIS
Non-Interest Revenue
Non-interest revenue, which comprises all revenue other than net interest income, increased $589 million or 6% to $11,215 million in 2016. On a basis that is net of CCPB, non-interest revenue increased $300 million or 3% to $9,672 million. Excluding the impact of the stronger U.S. dollar,non-interest revenue net of CCPB increased $159 million or 2%.
Adjusted non-interest revenue largely excludes a cumulative accounting adjustment in the amount of $85 million pre-tax recognized in 2016 in other non-interest revenue, related to foreign currency translation, largely impacting prior periods. Adjusted non-interest revenue, net of CCPB, increased $383 million or 4% to $9,756 million. Reported and adjusted non-interest revenue increased due to good performance in the P&C businesses, including the benefit of the acquired BMO Transportation Finance business, and in BMO Capital Markets, as well as the impact of the stronger U.S. dollar.
Trading revenues increased $205 million and are discussed in the Trading-Related Revenues section that follows.
Lending fees increased $122 million, due to growth in the P&C businesses loan portfolio, lending activity in BMO Capital Markets and the impact of the stronger U.S. dollar.
Underwriting and advisory fees increased $114 million, due to growth in activity levels, primarily in mergers and acquisitions and equity underwriting, and the impact of the stronger U.S. dollar. Deposit and payment service charges increased $64 million, due to growth in both Canadian and U.S. P&C and the impact of the stronger U.S. dollar.
Securities commissions and fees increased $23 million. These revenues consist largely of brokerage commissions within Wealth Management, which account for about two-thirds of the total, and institutional equity trading commissions within BMO Capital Markets. The increase is due to higher client activity in BMO Capital Markets and the stronger U.S. dollar, partially offset by lower securities commissions in Wealth Management.
Investment management and custodial fees remained essentially unchanged from last year, as business growth and the impact of the stronger U.S. dollar were offset by the impact of divestitures. Mutual fund revenue decreased $13 million from strong results a year ago. Both investment management and custodial fees and mutual fund revenue were also negatively impacted by the lower Canadian equity markets on average and the impact of the weaker British pound compared to the prior year.
Insurance revenue increased $261 million from a year ago, largely due to lower long-term interest rates increasing the fair value of insurance investments and underlying business growth, partially offset by lower reinsurance premiums. The increase in insurance revenue was largely offset by higher insurance claims, commissions and changes in policy benefit liabilities, as discussed on page 41. Given the extent to which insurance revenue can vary and that this variability is largely offset in CCPB, we generally focus on analyzing revenue net of CCPB. Insurance revenue, net of CCPB, decreased $28 million as growth in the underlying business was more than offset by prior year benefits from higher actuarial assumption changes and above-trend changes in our investment portfolio to improve asset-liability management.
Securities gains, other than trading, decreased $87 million due to lower net securities gains in BMO Capital Markets and Corporate Services.
Investments in associates and joint ventures decreased $67 million primarily due to the write-down of an equity investment net of a gain on its subsequent sale in 2016.
Other non-interest revenue, which includes various sundry amounts, decreased $28 million due to the prior year gain on sale of BMO’s U.S. retirement services business, the cumulative accounting adjustment related to foreign currency translation and a recovery under a legal settlement in the prior year, largely offset by lease revenue from the acquired BMO Transportation Finance business.
Card fees and Foreign exchange, other than trading were relatively consistent year over year.
Table 3 on page 124 provides further details on revenue and revenue growth.
Non-Interest Revenue(1)
| | | | | | | | | | | | | | | | |
| (Canadian $ in millions) | | | | | | | | Change from 2015 | |
| For the year ended October 31 | | 2016 | | | 2015 | | | 2014 | | | (%) | |
Securities commissions and fees | | | 924 | | | | 901 | | | | 894 | | | | 3 | |
Deposit and payment service charges | | | 1,141 | | | | 1,077 | | | | 1,002 | | | | 6 | |
Trading revenues | | | 1,192 | | | | 987 | | | | 949 | | | | 21 | |
Lending fees | | | 859 | | | | 737 | | | | 680 | | | | 17 | |
Card fees | | | 461 | | | | 460 | | | | 462 | | | | – | |
Investment management and custodial fees | | | 1,556 | | | | 1,552 | | | | 1,286 | | | | – | |
Mutual fund revenues | | | 1,364 | | | | 1,377 | | | | 1,065 | | | | (1 | ) |
Underwriting and advisory fees | | | 820 | | | | 706 | | | | 744 | | | | 16 | |
Securities gains, other than trading | | | 84 | | | | 171 | | | | 162 | | | | (51 | ) |
Foreign exchange, other than trading | | | 162 | | | | 172 | | | | 179 | | | | (6 | ) |
Insurance revenue (1) | | | 2,023 | | | | 1,762 | | | | 2,008 | | | | 15 | |
Investments in associates and joint ventures | | | 140 | | | | 207 | | | | 169 | | | | (32 | ) |
Other | | | 489 | | | | 517 | | | | 331 | | | | (5 | ) |
Total BMO reported (1) | | | 11,215 | | | | 10,626 | | | | 9,931 | | | | 6 | |
BMO reported, net of CCPB | | | 9,672 | | | | 9,372 | | | | 8,426 | | | | 3 | |
Total BMO adjusted (1) | | | 11,299 | | | | 10,627 | | | | 9,931 | | | | 6 | |
BMO adjusted, net of CCPB | | | 9,756 | | | | 9,373 | | | | 8,426 | | | | 4 | |
Insurance revenue, net of CCPB | | | 480 | | | | 508 | | | | 503 | | | | (6 | ) |
| | (1) | Commencing in the first quarter of 2015, insurance claims, commissions and changes in policy benefit liabilities (CCPB) are reported separately. They were previously reported as a reduction in insurance revenue in non-interest revenue. Prior period amounts and ratios have been reclassified. |
Adjusted results in this section are non-GAAP and are discussed in the Non-GAAP Measures section on page 33.
| | |
| 40 | | BMO Financial Group 199th Annual Report 2016 |
Trading-Related Revenues
Trading-related revenues are dependent on, among other things, the volume of activities undertaken for clients who enter into transactions with BMO to mitigate their risks or to invest. BMO earns a spread or profit on the net sum of its client positions by profitably managing, within prescribed limits, the overall risk of the net positions. On a limited basis, BMO also earns revenue from principal trading positions.
Interest and non-interest trading-related revenues increased $272 million or 27%. Excluding the impact of the stronger U.S. dollar and the result of hedging a portion of U.S. net income, trading-related revenues increased $258 million or 25%. The following amounts exclude the impact of the stronger U.S. dollar. Interest rate trading-related revenues increased $234 million or 55%, primarily due to increased client activity across most businesses, partially offset by the impact of the disposition of our municipal bond trading business in October 2015. Foreign exchange trading-related revenues were down $15 million or 4%, driven by decreased client activity. Equities trading-related revenues decreased $12 million or 2%, reflecting modestly lower activity with corporate and investor clients. Commodities trading-related revenues increased $7 million or 12% due to increased client hedging activity in energy products.
The Market Risk section on page 95 provides more information on trading-related revenues.
Trading-related revenues include net interest income and non-interest revenue earned from on and off-balance sheet positions undertaken for trading purposes. The management of these positions typically includes marking them to market on a daily basis. Trading-related revenues also include income (expense) and gains (losses) from both on-balance sheet instruments and interest rate, foreign exchange (including spot positions), equity, commodity and credit contracts.
Interest and Non-Interest Trading-Related Revenues(1)
| | | | | | | | | | | | | | | | |
(Canadian $ in millions) (taxable equivalent basis) | | | | | | | | | | | Change from 2015 | |
| For the year ended October 31 | | 2016 | | | 2015 | | | 2014 | | | (%) | |
Interest rates | | | 663 | | | | 422 | | | | 325 | | | | 57 | |
Foreign exchange | | | 349 | | | | 364 | | | | 356 | | | | (4 | ) |
Equities | | | 629 | | | | 638 | | | | 626 | | | | (1 | ) |
Commodities | | | 66 | | | | 56 | | | | 46 | | | | 17 | |
Other (2) | | | 25 | | | | 6 | | | | 13 | | | | +100 | |
Total (teb) | | | 1,732 | | | | 1,486 | | | | 1,366 | | | | 17 | |
Teb offset | | | 441 | | | | 467 | | | | 433 | | | | (6 | ) |
Reported total | | | 1,291 | | | | 1,019 | | | | 933 | | | | 27 | |
Reported as: | | | | | | | | | | | | | | | | |
Net interest income | | | 540 | | | | 499 | | | | 417 | | | | 8 | |
Non-interest revenue – trading revenues | | | 1,192 | | | | 987 | | | | 949 | | | | 21 | |
Total (teb) | | | 1,732 | | | | 1,486 | | | | 1,366 | | | | 17 | |
Teb offset | | | 441 | | | | 467 | | | | 433 | | | | (6 | ) |
Reported total, net of teb offset | | | 1,291 | | | | 1,019 | | | | 933 | | | | 27 | |
Adjusted net interest income, net of teb offset | | | 99 | | | | 32 | | | | (16 | ) | | | +100 | |
Adjusted non-interest revenue – trading revenues | | | 1,192 | | | | 987 | | | | 949 | | | | 21 | |
Adjusted total, net of teb offset | | | 1,291 | | | | 1,019 | | | | 933 | | | | 27 | |
| | (1) | Trading-related revenues are presented on a taxable equivalent basis. |
| | (2) | Includes nominal revenues from run-off structured credit activities and hedging exposures in BMO’s structural balance sheet. |
Adjusted results in this section are non-GAAP and are discussed in the Non-GAAP Measures section on page 33.
Insurance Claims, Commissions and Changes in Policy Benefit Liabilities
Insurance claims, commissions and changes in policy benefit liabilities (CCPB) were $1,543 million in 2016, up $289 million from $1,254 million in 2015 due to lower long-term interest rates increasing the fair value of policy benefit liabilities and the impact of growth in the underlying business, partially offset by decreased reinsurance liabilities. The increase was largely offset in revenue, as discussed on page 38. Given the extent to which insurance revenue can vary and that this variability is largely offset in CCPB, we generally focus on analyzing revenue net of CCPB.
| | | | |
| BMO Financial Group 199th Annual Report 2016 | | | 41 | |
MANAGEMENT’S DISCUSSION AND ANALYSIS
Provision for Credit Losses
The provision for credit losses (PCL) was $815 million in the current year, up from $612 million in 2015. There was no net change to the collective allowance in the year. The increase in PCL was due to higher provisions in the P&C businesses and BMO Capital Markets, partially offset by higher net recoveries in Corporate Services.
PCL as a percentage of average net loans and acceptances was 0.23% in 2016, up from 0.19% in 2015.
On an operating group basis, most of our provisions relate to Personal and Commercial Banking. In Canadian P&C, PCL increased by $46 million to $542 million in 2016, reflecting higher provisions in both the consumer and commercial portfolios. U.S. P&C PCL was $257 million, up $138 million from 2015, largely reflecting higher commercial provisions, mainly due to the acquired BMO Transportation Finance business. BMO Capital Markets recorded provisions of $81 million, an increase of $55 million from the prior year, mainly due to higher oil and gas provisions. Corporate Services net recoveries of $74 million increased $38 million from the prior year.
On a geographic basis, the majority of our provisions relate to our Canadian loan portfolio. Specific PCL in Canada and other countries (excluding the United States) was $547 million, compared to $498 million in 2015. Specific PCL in the United States was $268 million, up from $114 million in 2015. Note 4 on page 153 of the consolidated financial statements provides PCL information on a geographic basis. Table 15 on page 134 provides further PCL segmentation information.
Provision for Credit Losses
| | | | | | | | | | | | |
(Canadian $ in millions, except as noted) For the year ended October 31 | | 2016 | | | 2015 | | | 2014 | |
New specific provisions | | | 1,386 | | | | 1,278 | | | | 1,413 | |
Reversals of previously established allowances | | | (228 | ) | | | (210 | ) | | | (228 | ) |
Recoveries of loans previously written off | | | (343 | ) | | | (456 | ) | | | (624 | ) |
Provision for credit losses (PCL) | | | 815 | | | | 612 | | | | 561 | |
PCL as a % of average net loans and acceptances (annualized) | | | 0.23 | | | | 0.19 | | | | 0.19 | |
Provision for Credit Losses by Operating Group | |
(Canadian $ in millions) For the year ended October 31 | | 2016 | | | 2015 | | | 2014 | |
Canadian P&C | | | 542 | | | | 496 | | | | 528 | |
U.S. P&C (1) | | | 257 | | | | 119 | | | | 177 | |
Personal and Commercial Banking | | | 799 | | | | 615 | | | | 705 | |
Wealth Management | | | 9 | | | | 7 | | | | (3 | ) |
BMO Capital Markets | | | 81 | | | | 26 | | | | (18 | ) |
Corporate Services, including T&O (1) | | | | | | | | | | | | |
Impaired real estate loans | | | (16 | ) | | | 28 | | | | 21 | |
Interest on impaired loans | | | – | | | | 17 | | | | 26 | |
Purchased credit impaired loans | | | (58 | ) | | | (86 | ) | | | (252 | ) |
Purchased performing loans (1) | | | – | | | | 5 | | | | 82 | |
Provision for credit losses | | | 815 | | | | 612 | | | | 561 | |
| | (1) | Beginning in the first quarter of 2016, the reduction in the credit mark that is reflected in net interest income and the provision for credit losses on the purchased performing portfolio are being recognized in U.S. P&C, consistent with the accounting for the acquisition of BMO Transportation Finance, and given that these amounts have reduced substantially in size. Results for prior periods have not been reclassified. |
Certain comparative figures have been reclassified to conform with the current year’s presentation.
Adjusted results in this section are non-GAAP and are discussed in the Non-GAAP Measures section on page 33.
| | |
| 42 | | BMO Financial Group 199th Annual Report 2016 |
Non-Interest Expense
Non-interest expense increased $815 million or 7% to $12,997 million in 2016.
Adjusted non-interest expense excludes restructuring costs, the amortization of acquisition-related intangible assets and acquisition integration costs. Restructuring costs were $188 million in 2016 as we accelerate the use of technology to enhance customer experience and focus on achieving operational efficiencies. Restructuring costs were $149 million in 2015 primarily due to restructuring to achieve operational efficiencies. The amortization of acquisition-related intangible assets was $160 million, $163 million and $140 million in 2016, 2015 and 2014, respectively. Acquisition integration costs were $104 million, $53 million and $20 million in 2016, 2015 and 2014, respectively.
Adjusted non-interest expense increased $725 million or 6% to $12,544 million or 4% excluding the impact of the stronger U.S. dollar. Reported and adjusted expenses increased primarily due to the impact of the acquired BMO Transportation Finance business and business growth and investment, partially offset by the benefits of divestitures and our focus on disciplined expense management.
The dollar and percentage changes in expense by category are outlined in the Non-Interest Expense and Adjusted Non-Interest Expense table. Table 4 on page 125 provides more detail on expenses and expense growth.
Performance-based compensation on a reported basis increased $176 million or 8%, and on an adjusted basis increased $161 million or 8%, due to improved performance across most operating groups, the impact of the stronger U.S. dollar and the acquired BMO Transportation Finance business. Other employee compensation, which includes salaries, benefits and severance, on a reported basis increased $125 million or 3% and on an adjusted basis increased $59 million or 1%, due to the impact of the acquired BMO Transportation Finance business, partially offset by divestitures.
Premises and equipment costs on a reported basis increased $256 million or 12% and on an adjusted basis increased $227 million or 11%, primarily due to higher costs related to technology investments, as well as higher real estate-related costs and the impact of the stronger U.S. dollar. Other expenses on a reported basis increased $258 million or 9% and other expenses on an adjusted basis increased $278 million or 10%, primarily due to the acquired BMO Transportation Finance business and the impact of the stronger U.S. dollar.
BMO’s reported efficiency ratio improved 120 basis points to 61.6% and the adjusted efficiency ratio improved 170 basis points to 59.2% in 2016. On a net revenue basis, the reported efficiency ratio improved 70 basis points to 66.5% and the adjusted efficiency ratio improved 130 basis points to 63.9% in 2016. All operating groups have shown improvements in efficiency and operating leverage, with the exception of Wealth Management.
Canadian P&C, BMO’s largest operating segment, improved its reported efficiency ratio by 70 basis points to 49.6%, resulting from revenue growth and disciplined expense management.
U.S. P&C’s reported efficiency ratio improved 360 basis points to 62.5% and its adjusted efficiency ratio improved 320 basis points to 61.0%, due to organic revenue growth and disciplined expense management, as well as the acquired BMO Transportation Finance business.
Wealth Management’s reported efficiency ratio, on a net revenue basis, increased 230 basis points to 76.8%. The adjusted efficiency ratio, on a net revenue basis, increased 240 basis points to 73.9%, primarily due to the prior year benefits of a gain on sale of BMO’s U.S. retirement services business in 2015 and the write-down of an equity investment net of a gain on its subsequent sale in 2016.
BMO Capital Markets reported efficiency ratio improved 510 basis points to 59.1%, due to strong revenue growth and disciplined expense management.
On a net revenue basis(1), reported operating leverage was positive 1.1% and adjusted operating leverage was positive 2.1% year over year, in line with our medium-term objective of generating above 2% average annual adjusted net operating leverage and our ongoing focus on improving efficiency by driving revenue growth and maintaining disciplined cost management.
| (1) | This ratio is calculated excluding insurance claims, commissions and changes in policy benefit liabilities (CCPB). |
The efficiency ratio (orexpense-to-revenue ratio) is a measure of productivity. It is calculated as non-interest expense divided by total revenue (on a taxable equivalent basis in the operating groups), expressed as a percentage. Theadjusted efficiency ratio is calculated in the same manner, utilizing adjusted revenue and expense.
Contribution to Growth in Non-Interest Expense and Adjusted Non-Interest Expense(%)
| | | | | | | | | | | | |
| For the year ended October 31 | | 2016 | | | 2015 | | | 2014 | |
Significant businesses acquired | | | 3.2 | | | | 2.3 | | | | 1.5 | |
Canadian/U.S. dollar translation effect, excluding acquisitions | | | 2.1 | | | | 5.4 | | | | 2.5 | |
Other | | | 0.8 | | | | 2.1 | | | | 6.3 | |
Total adjusted non-interest expense growth | | | 6.1 | | | | 9.8 | | | | 10.3 | |
Impact of adjusting items | | | 0.6 | | | | 1.7 | | | | (3.5 | ) |
Total non-interest expense growth | | | 6.7 | | | | 11.5 | | | | 6.8 | |
| | | | |
| BMO Financial Group 199th Annual Report 2016 | | | 43 | |
MANAGEMENT’S DISCUSSION AND ANALYSIS
Non-Interest Expense and Adjusted Non-Interest Expense
| | | | | | | | | | | | | | | | |
(Canadian $ in millions, except as noted) For the year ended October 31 | | 2016 | | | 2015 | | | 2014 | | | Change from 2015 (%) | |
Performance-based compensation | | | 2,248 | | | | 2,087 | | | | 1,939 | | | | 8 | |
Other employee compensation (1) | | | 4,894 | | | | 4,835 | | | | 4,294 | | | | 1 | |
Total employee compensation | | | 7,142 | | | | 6,922 | | | | 6,233 | | | | 3 | |
Premises and equipment | | | 2,357 | | | | 2,130 | | | | 1,908 | | | | 11 | |
Other | | | 2,761 | | | | 2,519 | | | | 2,378 | | | | 10 | |
Amortization of intangible assets | | | 284 | | | | 248 | | | | 242 | | | | 15 | |
Total adjusted non-interest expense | | | 12,544 | | | | 11,819 | | | | 10,761 | | | | 6 | |
Adjusting items | | | 453 | | | | 363 | | | | 160 | | | | 24 | |
Total non-interest expense | | | 12,997 | | | | 12,182 | | | | 10,921 | | | | 7 | |
Non-interest expense growth (%) | | | 6.7 | | | | 11.5 | | | | 6.8 | | | | na | |
Adjusted non-interest expense growth (%) | | | 6.1 | | | | 9.8 | | | | 10.3 | | | | na | |
| | (1) | Includes restructuring costs in 2016 and 2015. |
Efficiency Ratio by Group (teb) (%)
| | | | | | | | | | | | |
| For the year ended October 31 | | 2016 | | | 2015 | | | 2014 | |
Efficiency Ratio | | | | | | | | | | | | |
Canadian P&C | | | 49.6 | | | | 50.3 | | | | 49.7 | |
U.S. P&C | | | 62.5 | | | | 66.1 | | | | 65.9 | |
Wealth Management | | | 56.6 | | | | 58.3 | | | | 53.2 | |
BMO Capital Markets | | | 59.1 | | | | 64.2 | | | | 63.3 | |
Total BMO | | | 61.6 | | | | 62.8 | | | | 59.9 | |
Total BMO, net of CCPB | | | 66.5 | | | | 67.2 | | | | 65.3 | |
Adjusted Efficiency Ratio | | | | | | | | | | | | |
Canadian P&C | | | 49.6 | | | | 50.2 | | | | 49.6 | |
U.S. P&C | | | 61.0 | | | | 64.2 | | | | 63.6 | |
Wealth Management | | | 54.5 | | | | 55.9 | | | | 51.7 | |
Wealth Management, net of CCPB | | | 73.9 | | | | 71.5 | | | | 71.9 | |
BMO Capital Markets | | | 59.0 | | | | 64.2 | | | | 63.2 | |
Total BMO | | | 59.2 | | | | 60.9 | | | | 59.1 | |
Total BMO, net of CCPB | | | 63.9 | | | | 65.2 | | | | 64.4 | |
Adjusted results in this section are non-GAAP and are discussed in the Non-GAAP Measures section on page 33.
Provision for Income Taxes
The provision for income taxes reflected in the Consolidated Statement of Income is based upon transactions recorded in income, regardless of when such transactions are subject to taxation by tax authorities, with the exception of the repatriation of retained earnings from foreign subsidiaries, as outlined in Note 23 on page 192 of the consolidated financial statements.
Management assesses BMO’s consolidated results and associated provisions for income taxes on a GAAP basis. We assess the performance of the operating groups and associated income taxes on a taxable equivalent basis and report accordingly.
The provision for income taxes was $1,101 million in 2016, compared with $936 million in 2015. The reported effective tax rate in 2016 was 19.2%, compared with 17.5% in 2015. The adjusted provision for income taxes(1) was $1,249 million in 2016, compared with $1,025 million in 2015. The adjusted effective tax rate in 2016 was 19.9%, compared with 18.0% in 2015. The change in the reported and adjusted tax rates from year to year was attributable to a higher proportion of income from higher tax rate jurisdictions and lower tax-exempt income from securities. On a teb basis, the reported effective tax rate for the year was 25.8%, compared with 24.9% a year ago. On a teb basis, the adjusted effective tax rate for the year was 25.9%, compared with 24.9% a year ago.
BMO partially hedges, for accounting purposes, the foreign exchange risk arising from its foreign operations by funding the investments in the corresponding foreign currency. A gain or loss on hedging and an unrealized gain or loss on translation of foreign operations is charged or credited to shareholders’ equity. For income tax purposes, a gain or loss on the hedging activities results in an income tax charge or credit in the current period that is charged or credited to shareholders’ equity, while the associated unrealized gain or loss on the foreign operations does not incur income taxes until the investments are liquidated. The income tax charge/benefit arising from a hedging gain/loss is a function of the fluctuations in exchange rates from period to period. Hedging of foreign operations has given rise to an income tax expense in shareholders’ equity of $10 million for the year, compared with an income tax recovery of $167 million in 2015. Refer to the Consolidated Statement of Changes in Equity on page 142 of the consolidated financial statements for further details.
Changes in tax rates and tax policy can have an impact on our earnings. See the discussion in the Critical Accounting Estimates section on page 113 of the impact that a reduction in U.S. income tax rates would have on our net deferred tax asset, income and the CET1 Ratio.
Table 4 on page 125 details the $1,864 million of total government levies and taxes incurred by BMO in 2016. The increase from $1,651 million in 2015 was primarily due to a higher provision for income taxes.
| (1) | The adjusted rate is computed using adjusted net income rather than reported net income in the determination of income subject to tax. |
Adjusted results in this section are non-GAAP and are discussed in the Non-GAAP Measures section on page 33.
| | |
| 44 | | BMO Financial Group 199th Annual Report 2016 |
2016 Operating Groups Performance Review
This section includes an analysis of the financial results of our operating groups and descriptions of their businesses, strategies, strengths, challenges, key value drivers, achievements and outlooks.
Canadian Personal and Commercial Banking (Canadian P&C) (pages 48 to 50)
Reported net income was $2,207 million in 2016, an increase of $102 million or 5% from 2015. Adjusted net income was $2,209 million, an increase of $100 million or 5%.
U.S. Personal and Commercial Banking (U.S. P&C) (pages 51 to 54)
Reported net income was $1,081 million in 2016, an increase of $252 million or 30% from 2015. Adjusted net income was $1,131 million, an increase of $249 million or 28%. On a U.S. dollar basis, reported net income increased $156 million or 24% to $817 million and adjusted net income increased $151 million or 22% to $854 million from 2015.
Wealth Management(pages 55 to 57)
Reported net income was $762 million in 2016, a decrease of $88 million or 10% from 2015. Adjusted net income was $863 million, a decrease of $92 million or 10%.
BMO Capital Markets (BMO CM)(pages 58 to 61)
Reported net income was $1,268 million in 2016, an increase of $239 million or 23% from 2015. Adjusted net income was $1,269 million, an increase of $238 million or 23%.
Corporate Services, including Technology and Operations(page 62 to 63)
Reported net loss was $687 million in 2016, compared with a net loss of $408 million in 2015. Adjusted net loss was $452 million, compared with an adjusted net loss of $296 million in 2015.
Allocation of Results
The basis for the allocation of results geographically and among operating groups is outlined in Note 26 on page 197 of the financial statements. Certain prior year data has been restated, as explained on the following page, which also provides further information on the allocation of results.
| | |
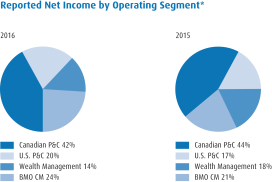 | | 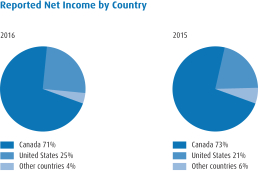 |
| | | |
* Percentages determined excluding results in Corporate Services. | | |
Adjusted results in this section are non-GAAP and are discussed in the Non-GAAP Measures section on page 33.
| | | | |
| BMO Financial Group 199th Annual Report 2016 | | | 45 | |
MANAGEMENT’S DISCUSSION AND ANALYSIS
Contributions to Revenue, Expenses, Net Income and Average Assets by Operating Group and by Location
| | | | | | | | | | | | | | | | | | | | | | | | | | | | | | | | | | | | | | | | | | | | | | | | | | | | | | | | | | | | | | | | | | | | | | | | | | | | |
(Canadian $ in
millions, except as
noted) For the year ended October 31 | | Personal and Commercial Banking | | | | | | Wealth Management | | | | | | BMO Capital Markets | | | | | | Corporate Services | | | | | | Total Consolidated | |
| | 2016 | | | 2015 | | | 2014 | | | | | | 2016 | | | 2015 | | | 2014 | | | | | | 2016 | | | 2015 | | | 2014 | | | | | | 2016 | | | 2015 | | | 2014 | | | | | | 2016 | | | 2015 | | | 2014 | |
Operating Groups Relative Contribution to BMO’s Performance(%) | | | | | | | | | | | | | | | | | | | | | | | | | | | | | | | | | | | | | |
Revenue | | | 55.1 | | | | 52.9 | | | | 52.5 | | | | | | | | 27.9 | | | | 29.7 | | | | 29.3 | | | | | | | | 20.7 | | | | 19.9 | | | | 20.4 | | | | | | | | (3.7 | ) | | | (2.5 | ) | | | (2.2 | ) | | | | | | | 100 | | | | 100 | | | | 100 | |
Expenses | | | 48.9 | | | | 47.0 | | | | 48.2 | | | | | | | | 25.7 | | | | 27.6 | | | | 26.0 | | | | | | | | 19.8 | | | | 20.4 | | | | 21.5 | | | | | | | | 5.6 | | | | 5.0 | | | | 4.3 | | | | | | | | 100 | | | | 100 | | | | 100 | |
Net income | | | 71.0 | | | | 66.6 | | | | 61.6 | | | | | | | | 16.5 | | | | 19.3 | | | | 18.0 | | | | | | | | 27.4 | | | | 23.4 | | | | 24.8 | | | | | | | | (14.9 | ) | | | (9.3 | ) | | | (4.4 | ) | | | | | | | 100 | | | | 100 | | | | 100 | |
Adjusted net income | | | 66.5 | | | | 63.9 | | | | 61.2 | | | | | | | | 17.2 | | | | 20.4 | | | | 18.9 | | | | | | | | 25.3 | | | | 22.0 | | | | 24.1 | | | | | | | | (9.0 | ) | | | (6.3 | ) | | | (4.2 | ) | | | | | | | 100 | | | | 100 | | | | 100 | |
Average assets | | | 44.4 | | | | 43.1 | | | | 44.6 | | | | | | | | 4.3 | | | | 4.4 | | | | 4.2 | | | | | | | | 42.9 | | | | 43.6 | | | | 43.7 | | | | | | | | 8.4 | | | | 8.9 | | | | 7.5 | | | | | | | | 100 | | | | 100 | | | | 100 | |
Total Revenue | | | | | | | | | | | | | | | | | | | | | | | | | | | | | | | | | | | | | | | | | | | | | | | | | | | | | | | | | | | | | | | | | | | | | | | | | |
Canada | | | 6,967 | | | | 6,640 | | | | 6,404 | | | | | | | | 4,009 | | | | 3,279 | | | | 3,739 | | | | | | | | 2,624 | | | | 2,292 | | | | 2,243 | | | | | | | | (752 | ) | | | (447 | ) | | | (374 | ) | | | | | | | 12,848 | | | | 11,764 | | | | 12,012 | |
United States | | | 4,649 | | | | 3,615 | | | | 3,157 | | | | | | | | 840 | | | | 1,016 | | | | 788 | | | | | | | | 1,539 | | | | 1,379 | | | | 1,261 | | | | | | | | (181 | ) | | | (108 | ) | | | (39 | ) | | | | | | | 6,847 | | | | 5,902 | | | | 5,167 | |
Other countries | | | 1 | | | | 1 | | | | 2 | | | | | | | | 1,039 | | | | 1,468 | | | | 811 | | | | | | | | 199 | | | | 196 | | | | 210 | | | | | | | | 153 | | | | 58 | | | | 21 | | | | | | | | 1,392 | | | | 1,723 | | | | 1,044 | |
| | | | 11,617 | | | | 10,256 | | | | 9,563 | | | | | | | | 5,888 | | | | 5,763 | | | | 5,338 | | | | | | | | 4,362 | | | | 3,867 | | | | 3,714 | | | | | | | | (780 | ) | | | (497 | ) | | | (392 | ) | | | | | | | 21,087 | | | | 19,389 | | | | 18,223 | |
Total Net Revenue | | | | | | | | | | | | | | | | | | | | | | | | | | | | | | | | | | | | | | | | | | | | | | | | | | | | | | | | | | | | | | | | | | | | | | | | | |
Canada | | | 6,967 | | | | 6,640 | | | | 6,404 | | | | | | | | 2,721 | | | | 2,655 | | | | 2,509 | | | | | | | | 2,624 | | | | 2,292 | | | | 2,243 | | | | | | | | (752 | ) | | | (447 | ) | | | (374 | ) | | | | | | | 11,560 | | | | 11,140 | | | | 10,782 | |
United States | | | 4,649 | | | | 3,615 | | | | 3,157 | | | | | | | | 840 | | | | 1,016 | | | | 788 | | | | | | | | 1,539 | | | | 1,379 | | | | 1,261 | | | | | | | | (181 | ) | | | (108 | ) | | | (39 | ) | | | | | | | 6,847 | | | | 5,902 | | | | 5,167 | |
Other countries | | | 1 | | | | 1 | | | | 2 | | | | | | | | 784 | | | | 838 | | | | 536 | | | | | | | | 199 | | | | 196 | | | | 210 | | | | | | | | 153 | | | | 58 | | | | 21 | | | | | | | | 1,137 | | | | 1,093 | | | | 769 | |
| | | | 11,617 | | | | 10,256 | | | | 9,563 | | | | | | | | 4,345 | | | | 4,509 | | | | 3,833 | | | | | | | | 4,362 | | | | 3,867 | | | | 3,714 | | | | | | | | (780 | ) | | | (497 | ) | | | (392 | ) | | | | | | | 19,544 | | | | 18,135 | | | | 16,718 | |
Total Expenses | | | | | | | | | | | | | | | | | | | | | | | | | | | | | | | | | | | | | | | | | | | | | | | | | | | | | | | | | | | | | | | | | | | | | | | | | |
Canada | | | 3,459 | | | | 3,339 | | | | 3,187 | | | | | | | | 2,000 | | | | 1,970 | | | | 1,824 | | | | | | | | 1,225 | | | | 1,168 | | | | 1,184 | | | | | | | | 383 | | | | 251 | | | | 97 | | | | | | | | 7,067 | | | | 6,728 | | | | 6,292 | |
United States | | | 2,903 | | | | 2,390 | | | | 2,075 | | | | | | | | 762 | | | | 818 | | | | 721 | | | | | | | | 1,141 | | | | 1,116 | | | | 970 | | | | | | | | 287 | | | | 336 | | | | 325 | | | | | | | | 5,093 | | | | 4,660 | | | | 4,091 | |
Other countries | | | – | | | | – | | | | – | | | | | | | | 573 | | | | 569 | | | | 295 | | | | | | | | 210 | | | | 199 | | | | 195 | | | | | | | | 54 | | | | 26 | | | | 48 | | | | | | | | 837 | | | | 794 | | | | 538 | |
| | | | 6,362 | | | | 5,729 | | | | 5,262 | | | | | | | | 3,335 | | | | 3,357 | | | | 2,840 | | | | | | | | 2,576 | | | | 2,483 | | | | 2,349 | | | | | | | | 724 | | | | 613 | | | | 470 | | | | | | | | 12,997 | | | | 12,182 | | | | 10,921 | |
Net Income | | | | | | | | | | | | | | | | | | | | | | | | | | | | | | | | | | | | | | | | | | | | | | | | | | | | | | | | | | | | | | | | | | | | | | | | | |
Canada | | | 2,206 | | | | 2,104 | | | | 2,011 | | | | | | | | 555 | | | | 497 | | | | 498 | | | | | | | | 1,016 | | | | 848 | | | | 812 | | | | | | | | (498 | ) | | | (249 | ) | | | (44 | ) | | | | | | | 3,279 | | | | 3,200 | | | | 3,277 | |
United States | | | 1,081 | | | | 829 | | | | 659 | | | | | | | | 56 | | | | 127 | | | | 58 | | | | | | | | 259 | | | | 178 | | | | 235 | | | | | | | | (255 | ) | | | (184 | ) | | | (119 | ) | | | | | | | 1,141 | | | | 950 | | | | 833 | |
Other countries | | | 1 | | | | 1 | | | | 1 | | | | | | | | 151 | | | | 226 | | | | 224 | | | | | | | | (7 | ) | | | 3 | | | | 27 | | | | | | | | 66 | | | | 25 | | | | (29 | ) | | | | | | | 211 | | | | 255 | | | | 223 | |
| | | | 3,288 | | | | 2,934 | | | | 2,671 | | | | | | | | 762 | | | | 850 | | | | 780 | | | | | | | | 1,268 | | | | 1,029 | | | | 1,074 | | | | | | | | (687 | ) | | | (408 | ) | | | (192 | ) | | | | | | | 4,631 | | | | 4,405 | | | | 4,333 | |
Adjusted Net Income | | | | | | | | | | | | | | | | | | | | | | | | | | | | | | | | | | | | | | | | | | | | | | | | | | | | | | | | | | | | | | | | | | | | | | | | | |
Canada | | | 2,208 | | | | 2,108 | | | | 2,015 | | | | | | | | 545 | | | | 512 | | | | 508 | | | | | | | | 1,016 | | | | 848 | | | | 811 | | | | | | | | (333 | ) | | | (143 | ) | | | (44 | ) | | | | | | | 3,436 | | | | 3,325 | | | | 3,290 | |
United States | | | 1,131 | | | | 882 | | | | 711 | | | | | | | | 75 | | | | 150 | | | | 80 | | | | | | | | 260 | | | | 180 | | | | 237 | | | | | | | | (198 | ) | | | (186 | ) | | | (119 | ) | | | | | | | 1,268 | | | | 1,026 | | | | 909 | |
Other countries | | | 1 | | | | 1 | | | | 1 | | | | | | | | 243 | | | | 293 | | | | 255 | | | | | | | | (7 | ) | | | 3 | | | | 27 | | | | | | | | 79 | | | | 33 | | | | (29 | ) | | | | | | | 316 | | | | 330 | | | | 254 | |
| | | | 3,340 | | | | 2,991 | | | | 2,727 | | | | | | | | 863 | | | | 955 | | | | 843 | | | | | | | | 1,269 | | | | 1,031 | | | | 1,075 | | | | | | | | (452 | ) | | | (296 | ) | | | (192 | ) | | | | | | | 5,020 | | | | 4,681 | | | | 4,453 | |
Average Assets | | | | | | | | | | | | | | | | | | | | | | | | | | | | | | | | | | | | | | | | | | | | | | | | | | | | | | | | | | | | | | | | | | | | | | | | | |
Canada | | | 207,965 | | | | 197,160 | | | | 190,490 | | | | | | | | 21,367 | | | | 19,907 | | | | 18,368 | | | | | | | | 167,035 | | | | 160,158 | | | | 142,437 | | | | | | | | 23,788 | | | | 24,974 | | | | 19,406 | | | | | | | | 420,155 | | | | 402,199 | | | | 370,701 | |
United States | | | 105,907 | | | | 88,873 | | | | 74,357 | | | | | | | | 5,340 | | | | 4,888 | | | | 4,055 | | | | | | | | 113,472 | �� | | | 106,540 | | | | 97,228 | | | | | | | | 35,299 | | | | 34,174 | | | | 25,261 | | | | | | | | 260,018 | | | | 234,475 | | | | 200,901 | |
Other countries | | | 52 | | | | 49 | | | | 39 | | | | | | | | 3,935 | | | | 4,352 | | | | 2,557 | | | | | | | | 22,766 | | | | 23,238 | | | | 19,659 | | | | | | | | 196 | | | | 78 | | | | 71 | | | | | | | | 26,949 | | | | 27,717 | | | | 22,326 | |
| | | | 313,924 | | | | 286,082 | | | | 264,886 | | | | | | | | 30,642 | | | | 29,147 | | | | 24,980 | | | | | | | | 303,273 | | | | 289,936 | | | | 259,324 | | | | | | | | 59,283 | | | | 59,226 | | | | 44,738 | | | | | | | | 707,122 | | | | 664,391 | | | | 593,928 | |
How BMO Reports Operating Group Results
Periodically, certain business lines and units within the business lines are transferred between client and corporate support groups to more closely align BMO’s organizational structure with its strategic priorities. In addition, revenue and expense allocations are updated to better align with current experience. Results for prior periods are restated to conform to the current presentation.
Corporate Services results prior to 2016 reflected certain items in respect of the 2011 purchased loan portfolio, including recognition of the reduction in the credit mark that is reflected in net interest income over the term of the purchased loans and provisions and recoveries of credit losses on the purchased portfolio. Beginning in the first quarter of 2016, the reduction in the credit mark that is reflected in net interest income and the provision for credit losses on the purchased performing portfolio are being recognized in U.S. P&C, consistent with the accounting for the acquisition of BMO Transportation Finance, and given that these amounts have reduced substantially in size. Results for prior periods have not been reclassified. Recoveries or provisions on the 2011 purchased credit impaired portfolio continue to be recognized in Corporate Services. Purchased loan accounting impacts related to BMO Transportation Finance are recognized in U.S. P&C.
Also effective in the first quarter of 2016, income from equity investments has been reclassified from net interest income to non-interest revenue in Canadian P&C, Wealth Management and Corporate Services. Results for prior periods have been reclassified. Restructuring costs and acquisition and integration costs that impact more than one operating group are also included in Corporate Services.
Starting in the first quarter of 2015, insurance claims, commissions and changes in policy benefit liabilities (CCPB) are reported separately. They were previously reported as a reduction in insurance revenue in non-interest revenue. Prior period amounts and ratios have been reclassified.
BMO analyzes revenue at the consolidated level based on GAAP revenue reflected in the consolidated financial statements rather than on a taxable equivalent basis (teb), which is consistent with our Canadian peer group. Like many banks, we analyze revenue on a teb basis at the operating group level. Revenue and the provision for income taxes are increased on tax-exempt securities to an equivalent before-tax basis to facilitate comparisons of income between taxable and tax-exempt sources. The offset to the group teb adjustments is reflected in Corporate Services revenue and income tax provisions.
Adjusted results in this section are non-GAAP and are discussed in the Non-GAAP Measures section on page 33.
| | |
| 46 | | BMO Financial Group 199th Annual Report 2016 |
Personal and Commercial Banking
| | | | | | | | | | | | | | | | | | | | | | | | | | | | | | | | | | | | | | | | | | | | |
(Canadian $ in millions, except as noted) As at or for the year ended October 31 | | Canadian P&C | | | | | | U.S. P&C | | | | | | Total P&C | |
| | 2016 | | | 2015 | | | 2014 | | | | | | 2016 | | | 2015 | | | 2014 | | | | | | 2016 | | | 2015 | | | 2014 | |
Net interest income (teb) | | | 5,060 | | | | 4,806 | | | | 4,654 | | | | | | | | 3,528 | | | | 2,836 | | | | 2,484 | | | | | | | | 8,588 | | | | 7,642 | | | | 7,138 | |
Non-interest revenue | | | 1,908 | | | | 1,834 | | | | 1,752 | | | | | | | | 1,121 | | | | 780 | | | | 673 | | | | | | | | 3,029 | | | | 2,614 | | | | 2,425 | |
Total revenue (teb) | | | 6,968 | | | | 6,640 | | | | 6,406 | | | | | | | | 4,649 | | | | 3,616 | | | | 3,157 | | | | | | | | 11,617 | | | | 10,256 | | | | 9,563 | |
Provision for credit losses | | | 542 | | | | 496 | | | | 528 | | | | | | | | 257 | | | | 119 | | | | 177 | | | | | | | | 799 | | | | 615 | | | | 705 | |
Non-interest expense | | | 3,459 | | | | 3,339 | | | | 3,181 | | | | | | | | 2,903 | | | | 2,390 | | | | 2,081 | | | | | | | | 6,362 | | | | 5,729 | | | | 5,262 | |
Income before income taxes | | | 2,967 | | | | 2,805 | | | | 2,697 | | | | | | | | 1,489 | | | | 1,107 | | | | 899 | | | | | | | | 4,456 | | | | 3,912 | | | | 3,596 | |
Provision for income taxes (teb) | | | 760 | | | | 700 | | | | 682 | | | | | | | | 408 | | | | 278 | | | | 243 | | | | | | | | 1,168 | | | | 978 | | | | 925 | |
Reported net income | | | 2,207 | | | | 2,105 | | | | 2,015 | | | | | | | | 1,081 | | | | 829 | | | | 656 | | | | | | | | 3,288 | | | | 2,934 | | | | 2,671 | |
Amortization of acquisition-related intangible assets (1) | | | 2 | | | | 4 | | | | 4 | | | | | | | | 50 | | | | 53 | | | | 52 | | | | | | | | 52 | | | | 57 | | | | 56 | |
Adjusted net income | | | 2,209 | | | | 2,109 | | | | 2,019 | | | | | | | | 1,131 | | | | 882 | | | | 708 | | | | | | | | 3,340 | | | | 2,991 | | | | 2,727 | |
Key Performance Metrics and Drivers | | | | | | | | | | | | | | | | | | | | | | | | | | | | | | | | | | | | | | | | | | | | |
Net income growth (%) | | | 4.9 | | | | 4.4 | | | | 11.2 | | | | | | | | 30.4 | | | | 26.5 | | | | 11.1 | | | | | | | | 12.1 | | | | 9.8 | | | | 11.2 | |
Adjusted net income growth (%) | | | 4.8 | | | | 4.4 | | | | 11.2 | | | | | | | | 28.2 | | | | 24.7 | | | | 9.5 | | | | | | | | 11.7 | | | | 9.7 | | | | 10.8 | |
Revenue growth (%) | | | 5.0 | | | | 3.7 | | | | 6.4 | | | | | | | | 28.6 | | | | 14.5 | | | | 5.3 | | | | | | | | 13.3 | | | | 7.3 | | | | 6.0 | |
Non-interest expense growth (%) | | | 3.5 | | | | 5.0 | | | | 4.2 | | | | | | | | 21.5 | | | | 14.8 | | | | 7.5 | | | | | | | | 11.0 | | | | 8.9 | | | | 5.5 | |
Adjusted non-interest expense growth (%) | | | 3.6 | | | | 4.9 | | | | 4.2 | | | | | | | | 22.2 | | | | 15.5 | | | | 8.3 | | | | | | | | 11.2 | | | | 9.0 | | | | 5.7 | |
Return on equity (%) | | | | | | | | | | | | | | | | | | | | | | | | | | | | | | | | | | | 15.9 | | | | 16.1 | | | | 16.7 | |
Adjusted return on equity (%) | | | | | | | | | | | | | | | | | | | | | | | | | | | | | | | | | | | 16.2 | | | | 16.5 | | | | 17.1 | |
Operating leverage (teb) (%) | | | 1.5 | | | | (1.3 | ) | | | 2.2 | | | | | | | | 7.1 | | | | (0.3 | ) | | | (2.2 | ) | | | | | | | 2.3 | | | | (1.6 | ) | | | 0.5 | |
Adjusted operating leverage (teb) (%) | | | 1.4 | | | | (1.2 | ) | | | 2.2 | | | | | | | | 6.4 | | | | (1.0 | ) | | | (3.0 | ) | | | | | | | 2.1 | | | | (1.7 | ) | | | 0.3 | |
Efficiency ratio (teb) (%) | | | 49.6 | | | | 50.3 | | | | 49.7 | | | | | | | | 62.5 | | | | 66.1 | | | | 65.9 | | | | | | | | 54.8 | | | | 55.9 | | | | 55.0 | |
Adjusted efficiency ratio (teb) (%) | | | 49.6 | | | | 50.2 | | | | 49.6 | | | | | | | | 61.0 | | | | 64.2 | | | | 63.6 | | | | | | | | 54.1 | | | | 55.2 | | | | 54.2 | |
Net interest margin on average earning assets (teb) (%) | | | 2.54 | | | | 2.54 | | | | 2.54 | | | | | | | | 3.62 | | | | 3.46 | | | | 3.64 | | | | | | | | 2.89 | | | | 2.82 | | | | 2.84 | |
Average common equity | | | | | | | | | | | | | | | | | | | | | | | | | | | | | | | | | | | 20,221 | | | | 17,848 | | | | 15,410 | |
Average earning assets | | | 199,526 | | | | 189,505 | | | | 183,406 | | | | | | | | 97,447 | | | | 81,965 | | | | 68,312 | | | | | | | | 296,973 | | | | 271,470 | | | | 251,718 | |
Average net loans and acceptances | | | 205,813 | | | | 195,183 | | | | 188,796 | | | | | | | | 90,752 | | | | 74,500 | | | | 61,646 | | | | | | | | 296,565 | | | | 269,683 | | | | 250,442 | |
Average deposits | | | 142,132 | | | | 132,767 | | | | 124,926 | | | | | | | | 87,881 | | | | 78,032 | | | | 65,635 | | | | | | | | 230,013 | | | | 210,799 | | | | 190,561 | |
Assets under administration | | | 25,439 | | | | 22,848 | | | | 24,150 | | | | | | | | 159,448 | | | | 126,513 | | | | 123,082 | | | | | | | | 184,887 | | | | 149,361 | | | | 147,232 | |
Full-time equivalent employees | | | 14,776 | | | | 15,697 | | | | 15,795 | | | | | | | | 7,503 | | | | 7,606 | | | | 7,835 | | | | | | | | 22,279 | | | | 23,303 | | | | 23,630 | |
| | (1) | Before tax amounts of $71 million in 2016, $73 million in 2015 and $75 million in 2014 are included in non-interest expense. |
The Personal and Commercial Banking (P&C) operating group represents the sum of our two retail and business banking operating segments, Canadian Personal and Commercial Banking (Canadian P&C) and U.S. Personal and Commercial Banking (U.S. P&C). The combined P&C banking business net income of $3,288 million and adjusted net income of $3,340 million were both up 12% from the prior year. These operating segments are reviewed separately in the sections that follow.
Adjusted results in this section are non-GAAP and are discussed in the Non-GAAP Measures section on page 33.
| | | | |
| BMO Financial Group 199th Annual Report 2016 | | | 47 | |
MANAGEMENT’S DISCUSSION AND ANALYSIS
Canadian Personal and Commercial Banking
| | |
Canadian Personal and Commercial Banking provides a full range of financial products and services to eight million customers. We’re here to help our customers make the right financial decisions as they do business with us seamlessly across our channels: getting advice from our bankers at their places of business or ours, in over 900 branches, on their mobile devices, online, over the telephone, and at nearly 3,300 automated banking machines across the country. Cameron Fowler Group Head Canadian Personal and Commercial Banking, BMO Financial Group | |  |
| | |
Lines of Business | | |
| | |
Personal Bankingprovides customers with a wide range of products and services, including chequing and savings accounts, credit cards, mortgages, creditor insurance and everyday financial and investment advice. Our employees are focused on providing all of our customers with an exceptional experience every time they interact with us. | | Commercial Bankingprovides small business and commercial banking customers with a broad suite of commercial products and services, including business deposit accounts, commercial credit cards, business loans and commercial mortgages, cash management solutions, foreign exchange and specialized banking programs. Our Commercial bankers partner with our customers to help them grow and manage their business. |
Strengths and Value Drivers
| • | | Highly engaged team of dedicated employees focused on providing a personalized banking experience, anticipating customers’ needs and finding new ways to help. |
| • | | Strong commercial banking business, as evidenced by BMO’s number two ranking in Canadian market share for business loans up to $25 million. |
| • | | Largest MasterCard card issuer in Canada for both retail and commercial cards. |
| • | | Strong cards rewards program with World Elite Travel and World Elite CashBack, also Canada’s leading issuer of AIR MILES®. |
| • | | Consistently applied credit risk management practices that provide customers with reliable access to appropriate financing solutions. |
| • | | Proud to be the official bank of the Canadian defence community, serving the unique needs of Canadian military members and their families since 2008. |
Strategy and Key Priorities
Our strategy is focused on capturing key growth and loyalty opportunities while capitalizing on the shift to digital channels to achieve greater efficiency.
Continue our focus on customer loyalty and growth
2016 Achievements
| • | | Achieved strong employee engagement survey results, particularly around customer focus, demonstrating our employees’ commitment to continuing to deliver a great customer experience. |
| • | | Developed analytics capabilities to pinpoint and quickly solve customer irritants, improving the interaction experience of our customers. |
| • | | Launched a data platform to help our front-line sales team make better personal connections through relevant, needs-based customer conversations. |
| • | | Continued to enhance our fraud recovery and personal estate processes, making our customers’ involvement easier for them in the moments that really matter. |
Personal banking
| • | | Achieved personal lending and deposit growth of 4% and 8%, respectively. |
| • | | Increased our share of wallet with products that continue to meet the needs of our customers. |
| • | | Ran effective campaigns on key offerings ranging from home financing to Everyday Banking, helping to increase our new-to-BMO customer base by 7%. |
| • | | Completed the upgrade of automated banking machines that offer enhanced functionality, including intelligent touch screens and envelope-free deposits. |
| • | | Grew our mix of advice-based roles, strengthening our ability to engage with customers on the financial issues important to them, when and how they choose to interact. |
Commercial banking
| • | | Achieved commercial lending and deposit growth of 10% and 6%, respectively. |
| • | | Simplified our product portfolio with the launch of five new Business Banking Plans, all with benefits and features aligned to our customers’ growing preference for digital banking. |
| • | | Improved our processes and increased platform efficiencies, allowing our sales force to spend more time directly engaged with customers. |
| • | | Named as the Best Commercial Bank in Canada for the second consecutive year byWorld Finance Magazine at its 2016 Banking Awards in recognition of our strong regional and industry focus, as well as our commitment to building customer relationships and providing innovative solutions. |
| • | | Recently received our fifth consecutive gold-level certification in Progressive Aboriginal Relations from the Canadian Council for Aboriginal Business. |
| | |
| 48 | | BMO Financial Group 199th Annual Report 2016 |
2017 Focus
| • | | Continue to focus on improving customer loyalty by deepening relationships. In personal banking, deliver a leading customer experience leveraging new digital channels and existing networks. In commercial banking, target opportunities through diversification and product expansion. |
Accelerate our digital strategy
2016 Achievements
| • | | Continued to grow digital channel sales volume, up almost 11% from the prior year, and now equivalent to the total sales volume in more than 115 branches. |
| • | | Introduced a new mobile capability that allows current and prospective customers to open an account in minutes using their smartphones. |
| • | | Launched biometric security enhancements for a number of corporate card customers with MasterCard Identity Check, enabling customers to verify their identity using facial recognition and fingerprints when making mobile and online purchases. |
| • | | Introduced Apple Pay, allowing customers to make easy and secure purchases with their BMO credit and debit cards. |
2017 Focus
| • | | Accelerate our digital capabilities to deliver a seamless customer experience. |
Continued to ensure strong risk leadership and operating discipline
2016 Achievements
| • | | Achieved an average provision for credit losses of 26 basis points (as a percentage of total loans and acceptances), in line with historical trends. |
| • | | Grew our well-diversified and geographically dispersed commercial lending book in line with our risk appetite. |
| • | | Continued to invest in robust anti-money laundering capabilities to protect customers and address verification/disclosure requirements. |
| • | | Enhanced processes, capabilities and systems to help front-line employees make relevant and timely offers to our customers within the limits of our risk appetite. |
2017 Focus
| • | | Continue strengthening risk management practices and enhancing automation capabilities while delivering a great customer experience. |
Canadian P&C
| | | | | | | | | | | | |
(Canadian $ in millions, except as noted) As at or for the year ended October 31 | | 2016 | | | 2015 | | | 2014 | |
Net interest income | | | 5,060 | | | | 4,806 | | | | 4,654 | |
Non-interest revenue | | | 1,908 | | | | 1,834 | | | | 1,752 | |
Total revenue (teb) | | | 6,968 | | | | 6,640 | | | | 6,406 | |
Provision for credit losses | | | 542 | | | | 496 | | | | 528 | |
Non-interest expense | | | 3,459 | | | | 3,339 | | | | 3,181 | |
Income before income taxes | | | 2,967 | | | | 2,805 | | | | 2,697 | |
Provision for income taxes | | | 760 | | | | 700 | | | | 682 | |
Reported net income | | | 2,207 | | | | 2,105 | | | | 2,015 | |
Amortization of acquisition-related intangible assets (1) | | | 2 | | | | 4 | | | | 4 | |
Adjusted net income | | | 2,209 | | | | 2,109 | | | | 2,019 | |
Key Performance Metrics and Drivers | |
Personal revenue | | | 4,553 | | | | 4,415 | | | | 4,238 | |
Commercial revenue | | | 2,415 | | | | 2,225 | | | | 2,168 | |
Net income growth (%) | | | 4.9 | | | | 4.4 | | | | 11.2 | |
Revenue growth (%) | | | 5.0 | | | | 3.7 | | | | 6.4 | |
Non-interest expense growth (%) | | | 3.5 | | | | 5.0 | | | | 4.2 | |
Adjusted non-interest expense growth (%) | | | 3.6 | | | | 4.9 | | | | 4.2 | |
Operating leverage (%) | | | 1.5 | | | | (1.3 | ) | | | 2.2 | |
Adjusted operating leverage (%) | | | 1.4 | | | | (1.2 | ) | | | 2.2 | |
Efficiency ratio (%) | | | 49.6 | | | | 50.3 | | | | 49.7 | |
Net interest margin on average earning assets (%) | | | 2.54 | | | | 2.54 | | | | 2.54 | |
Average earning assets | | | 199,526 | | | | 189,505 | | | | 183,406 | |
Average net loans and acceptances | | | 205,813 | | | | 195,183 | | | | 188,796 | |
Average deposits | | | 142,132 | | | | 132,767 | | | | 124,926 | |
Full-time equivalent employees | | | 14,776 | | | | 15,697 | | | | 15,795 | |
| | (1) | Before tax amounts of $3 million in 2016, $5 million in 2015 and $4 million in 2014 are included in non-interest expense. |
| | | | |
| BMO Financial Group 199th Annual Report 2016 | | | 49 | |
MANAGEMENT’S DISCUSSION AND ANALYSIS
Financial Review
Canadian P&C reported net income was $2,207 million, up $102 million or 5% from a year ago. Adjusted net income, which excludes the amortization of acquisition-related intangible assets, increased $100 million or 5% to $2,209 million.
Revenue increased $328 million or 5% to $6,968 million. Revenue increased $138 million or 3% in our personal banking business and $190 million or 9% in our commercial banking business, mainly driven by higher balances and increased non-interest revenue in both businesses.
Net interest margin was stable at 2.54%.
Provisions for credit losses increased $46 million or 9% to $542 million, due to higher provisions in both the consumer and commercial portfolios.
Non-interest expense was $3,459 million, up $120 million or 4% from a year ago, primarily due to continued investment in the business, net of disciplined expense management. Adjusted operating leverage was consistently positive throughout the year, demonstrating the benefits of revenue growth and actions we took related to containing expenses.
Average net loans and acceptances increased $10.6 billion or 5% from a year ago to $205.8 billion. Total personal lending balances (excluding retail cards) increased 4% year over year, with solid residential mortgage growth partially offset by declines in indirect auto loans. Credit card balances were consistent with the prior year in both retail and corporate cards. Commercial loan balances (excluding corporate cards) increased 10% year over year, with growth across a number of industry sectors.
Average deposits increased $9.4 billion or 7% to $142.1 billion. Personal deposit balances increased 8%, driven by strong growth in term and primary chequing accounts. Commercial deposit growth was broad-based, with balances growing 6% year over year.
Business Environment, Outlook and Challenges
The Canadian economy is expected to improve modestly in 2017, in response to firmer U.S. demand for exports, ongoing low interest rates, the low Canadian dollar, an anticipated increase in oil prices and federal fiscal stimulus. The jobless rate is expected to decline modestly.
In the Canadian personal banking sector, retail operating deposits are projected to grow by approximately 6% in 2017, slightly higher than the rate of growth in personal income. Credit card loan balances are expected to continue to grow around 4%, reflecting the effects of a trend in customer preferences toward prime-based lines of credit. Residential mortgage growth is expected to slow to around 5% in 2017.
In the commercial banking sector, growth in commercial operating deposits and short-term business credit is expected to ease moderately to approximately 6% in 2017, in the context of an expected recovery in resource prices and improving economic conditions.
We expect to generate growth by increasing our customer share of wallet and products per customer while improving sales force productivity and targeting commercial opportunities across geographic regions, market segments and industry sectors. We will continue to operate within the limits of our risk appetite. Our effective governance framework is expected to position us well as information security needs increase and high regulatory expectations continue. Ongoing expansion of digital capabilities will improve efficiency: in 2016, we saw the number of digital transactions overtake branch transactions and this, along with our steadfast commitment to a customer-first approach, is expected to help us reinforce and deepen customer loyalty.
The Canadian economic environment in 2016 and outlook for 2017 are discussed in more detail in the Economic Developments and Outlook section on page 30.
Caution
This Canadian P&C Banking section contains forward-looking statements. Please see the Caution Regarding Forward-Looking Statements.
Adjusted results in this section are non-GAAP and are discussed in the Non-GAAP Measures section on page 33.
| | |
| 50 | | BMO Financial Group 199th Annual Report 2016 |
U.S. Personal and Commercial Banking
| | | | |
| We’re here to help our more than two million customers feel confident in their financial decisions. Our retail and small and mid-sized business banking customers are served through nearly 600 branches, contact centres, online and mobile banking platforms and more than 1,300 automated banking machines across eight states. Our commercial banking customers are offered in-depth specific industry knowledge, as well as strategic capital markets solutions. | |  |
Alexandra Dousmanis-Curtis Group Head U.S. Retail and Business Banking | | David R. Casper President and Chief Executive Officer BMO Harris Bank N.A. and Group Head Commercial Banking | |
| | |
Lines of Business | | |
| | |
Personal Bankingoffers a broad range of products and services to individuals, as well as small and mid-sized business customers, including deposits, mortgages, consumer credit, business lending, credit cards and other banking services. | | Commercial Banking provides business customers with a broad range of banking products and services, including lending, deposits, treasury management and risk management. |
Strengths and Value Drivers
| • | | Rich heritage of 170 years in the U.S. Midwest, with a deep commitment to our communities and helping our customers succeed. |
| • | | Strong, experienced leadership team that knows how to compete and perform in our markets. |
| • | | Unique, differentiated platform for profitable growth with attractive branch footprint and top-tier deposit market share in key U.S. Midwest markets. |
| • | | Large-scale, relationship-based national commercial banking business centred in the U.S. Midwest, complemented by in-depth industry knowledge in select sectors. |
| • | | Comprehensive and integrated risk management and compliance framework to manage within our risk appetite and respond to regulatory expectations. A risk culture that is evident in every aspect of the way we operate across the business. |
Strategy and Key Priorities
We aim to grow our business and be a leader in our markets by creating a differentiated, intuitive customer experience and advising our customers on a wide range of financial topics, leveraging our brand reputation, local presence and high-performance teams.
Deliver a great customer experience to a loyal, profitable and growing customer base
2016 Achievements
| • | | Further improved customer loyalty as measured by a key industry metric in both our commercial and retail banking segments, by optimizing service delivery, improving our product offering and enhancing our digital solutions. |
| • | | Improved retail net customer acquisition by 30% year over year. Retail deposits grew by 9% across all products, while commercial net customer acquisition improved by 3% year over year. |
| • | | Increased deposit market share in our core footprint to 6.5%, which includes Illinois, Wisconsin, Missouri, Kansas, Indiana and Minnesota. Maintained second place rankings in the Chicago and Wisconsin areas. |
2017 Focus
| • | | Continue to build market share and expand into high opportunity segments, grow customer share of wallet and drive customer acquisition through enhanced value proposition, while focusing on consistent service delivery and developing expert bankers. |
Continue to transform our Personal Banking business by improving our products and channel capabilities to meet our customers’ evolving needs
2016 Achievements
| • | | Introduced a new competitive credit card suite, which includes lower interest rates, EMV-enabled (Europay, MasterCard and Visa) chip cards, a refined points program and premium rewards. |
| • | | Launched a customer insight tool to generate intuitive and meaningful individualized offers and services to help deepen customer relationships. |
| • | | Continued our multi-year strategy to improve efficiency and enhance the digital customer experience, including the launch of our new home equity origination system and investments in Smart Branch technology. |
2017 Focus
| • | | Build digital capabilities to align to customer behaviour and market demand, accelerate the modernization of our physical footprint and enhance our product offering. |
| | | | |
| BMO Financial Group 199th Annual Report 2016 | | | 51 | |
MANAGEMENT’S DISCUSSION AND ANALYSIS
Continue to deliver local access and industry expertise to clients across a broad geographic footprint through a proven and effective commercial operating model
2016 Achievements
| • | | The acquisition of BMO Transportation Finance added an industry-leading business with an established client base to our already well-diversified and robust commercial business. |
| • | | Opened a new commercial office in Dallas, building on the presence of the BMO Transportation Finance team. Expanded into two new high-growth commercial real estate segments – seniors’ housing facilities and hotel finance. |
| • | | Continued to deepen customer relationships in our treasury management services business, driving a 15% year-over-year increase in fee income, and introduced a new U.S. Enterprise Wire Payment system to deliver a flexible, faster and more efficient platform for our customers. |
| • | | Deployed a dedicated cross-border service contact group to improve client relationships and deliver an integrated cross-bank client service experience. |
2017 Focus
| • | | Continue to deepen market share in our flagship businesses, grow revenue by investing in higher-growth markets, increase speed of delivery and optimize operational and credit processes, while delivering comprehensive customer solutions. |
Continue our strong risk leadership and operating discipline
2016 Achievements
| • | | Achieved good revenue growth while controlling expenses and continuing to operate within our risk appetite and risk culture, all within the context of a low interest rate environment and moderate economic growth. |
| • | | Actively managed risks and regulatory compliance by maintaining a solid foundation of effective operational risk controls. |
| • | | Maintained robust anti-money laundering capabilities to protect our customers. |
2017 Focus
| • | | Focus on effectively controlling potential risks related to new digital capabilities to safeguard customer identity and personal information. |
| | |
| 52 | | BMO Financial Group 199th Annual Report 2016 |
U.S. P&C
| | | | | | | | | | | | |
(Canadian $ equivalent in millions, except as noted) As at or for the year ended October 31 | | 2016 | | | 2015 | | | 2014 | |
Total revenue (teb) (1) | | | 4,649 | | | | 3,616 | | | | 3,157 | |
Reported net income | | | 1,081 | | | | 829 | | | | 656 | |
Adjusted net income | | | 1,131 | | | | 882 | | | | 708 | |
Net income growth (%) | | | 30.4 | | | | 26.5 | | | | 11.1 | |
Adjusted net income growth (%) | | | 28.2 | | | | 24.7 | | | | 9.5 | |
Revenue growth (%) | | | 28.6 | | | | 14.5 | | | | 5.3 | |
Non-interest expense growth (%) | | | 21.5 | | | | 14.8 | | | | 7.5 | |
Adjusted non-interest expense growth (%) | | | 22.2 | | | | 15.5 | | | | 8.3 | |
| | | | | | | | | | | | |
| (US$ in millions, except as noted) | | | | | | | | | |
Net interest income (teb) (1) | | | 2,663 | | | | 2,260 | | | | 2,271 | |
Non-interest revenue | | | 846 | | | | 621 | | | | 615 | |
Total revenue (teb) (1) | | | 3,509 | | | | 2,881 | | | | 2,886 | |
Provision for credit losses (1) | | | 194 | | | | 95 | | | | 162 | |
Non-interest expense | | | 2,191 | | | | 1,904 | | | | 1,902 | |
Income before income taxes | | | 1,124 | | | | 882 | | | | 822 | |
Provision for income taxes (teb) | | | 307 | | | | 221 | | | | 223 | |
Reported net income | | | 817 | | | | 661 | | | | 599 | |
Amortization of acquisition-related intangible assets (2) | | | 37 | | | | 42 | | | | 47 | |
Adjusted net income | | | 854 | | | | 703 | | | | 646 | |
Key Performance Metrics and Drivers (US$ basis) | | | | | | | | | | | | |
Net income growth (%) | | | 23.6 | | | | 10.3 | | | | 3.5 | |
Adjusted net income growth (%) | | | 21.6 | | | | 8.7 | | | | 2.1 | |
Revenue growth (%) | | | 21.8 | | | | (0.2 | ) | | | (1.6 | ) |
Non-interest expense growth (%) | | | 15.1 | | | | 0.1 | | | | 0.6 | |
Adjusted non-interest expense growth (%) | | | 15.7 | | | | 0.7 | | | | 1.4 | |
Operating leverage (teb) (%) | | | 6.7 | | | | (0.3 | ) | | | (2.2 | ) |
Adjusted operating leverage (teb) (%) | | | 6.1 | | | | (0.9 | ) | | | (3.0 | ) |
Efficiency ratio (teb) (%) | | | 62.5 | | | | 66.1 | | | | 65.9 | |
Adjusted efficiency ratio (teb) (%) | | | 61.0 | | | | 64.2 | | | | 63.6 | |
Net interest margin on average earning assets (teb) (%) | | | 3.62 | | | | 3.46 | | | | 3.64 | |
Average earning assets | | | 73,569 | | | | 65,319 | | | | 62,443 | |
Average net loans and acceptances | | | 68,514 | | | | 59,353 | | | | 56,351 | |
Average deposits | | | 66,343 | | | | 62,152 | | | | 60,008 | |
Full-time equivalent employees | | | 7,503 | | | | 7,606 | | | | 7,835 | |
| | (1) | Beginning in the first quarter of 2016, the reduction in the credit mark that is reflected in net interest income and the provision for credit losses on the purchased performing loan portfolio are being recognized in U.S. P&C, consistent with the accounting for the acquisition of BMO Transportation Finance, and given that these amounts have reduced substantially in size. Results for prior periods have not been reclassified. |
| | (2) | Before tax amounts of $52 million in 2016, $55 million in 2015 and $67 million in 2014 are included in non-interest expense. |
Financial Review
U.S. P&C reported net income of $1,081 million increased $252 million or 30% from a year ago. Adjusted net income, which excludes the amortization of acquisition-related intangible assets, was $1,131 million, up $249 million or 28%. Revenue grew $1,033 million or 29% to $4,649 million. All amounts in the remainder of this section are on a U.S. dollar basis.
Reported net income of $817 million increased $156 million or 24% from a year ago. Adjusted net income of $854 million increased $151 million or 22% primarily due to the acquired BMO Transportation Finance business, which contributed approximately 14% to both revenue and expenses in the year, and organic growth.
Revenue of $3,509 million increased $628 million or 22%, primarily due to the benefit of the acquired BMO Transportation Finance business, as well as organic loan and deposit growth, improvements in deposit spreads and higher commercial lending and treasury management fees, net of loan spread compression and lower mortgage banking revenue.
In our commercial banking business, revenue increased $623 million or 43% to $2,085 million, reflecting the acquired BMO Transportation Finance business, strong organic loan and deposit volume growth and higher lending and treasury management fees, net of loan spread compression.
In our personal banking business, revenue increased $5 million to $1,424 million, primarily due to increased deposit spreads and volumes, partially offset by declines in loan volumes and spreads, including the planned reduction in the indirect auto portfolio, and lower mortgage banking revenue.
Net interest margin increased by 16 basis points to 3.62%, driven by higher deposit spreads and volumes, the acquired BMO Transportation Finance business, and the recognition of the credit mark on the purchased performing portfolio previously recognized in Corporate Services, net of loan spread compression.
Provisions for credit losses of $194 million increased $99 million or 104% from a year ago, largely reflecting higher commercial provisions, mainly due to the acquired BMO Transportation Finance business.
| | | | |
| BMO Financial Group 199th Annual Report 2016 | | | 53 | |
MANAGEMENT’S DISCUSSION AND ANALYSIS
Non-interest expense of $2,191 million increased $287 million or 15% and adjusted non-interest expense of $2,139 million increased $290 million or 16%, largely due to the acquired BMO Transportation Finance business.
Average net loans and acceptances increased $9.2 billion or 15% to $68.5 billion, due to BMO Transportation Finance and organic commercial loan growth, partially offset by declines in personal loan volumes, as noted above.
Average deposits of $66.3 billion increased $4.2 billion or 7%, driven by growth in both personal and commercial volumes. Chequing volumes increased $2.6 billion or 7%.
Business Environment, Outlook and Challenges
U.S. P&C has a significant footprint in eight states, primarily concentrated in six contiguous states in the U.S. Midwest region (Illinois, Wisconsin, Indiana, Minnesota, Missouri and Kansas).
The U.S. economy is expected to improve moderately in 2017, in response to an upturn in business spending, continued strength in consumer spending and housing markets and expansionary fiscal policy. The pace of expansion in the U.S. Midwest region should remain modest at around 1.6% in 2016 and 1.8% in 2017, compared with 1.9% in 2015, with continuing low levels of exports and manufacturing output due to the strong U.S. dollar and slowing growth in the global economy. Uncertainties related to the Brexit referendum and the U.S. election have dampened business spending. However, under a new administration, fiscal policy looks to become more stimulative in 2017, supporting economic growth. Industry-wide commercial loan growth is expected to improve if business investment picks up in the absence of any meaningful increase in uncertainty related to possible protectionist measures. Resilient consumer demand and steady automobile production is expected to support growth in the region in 2017. A growing number of household formations should prolong the upturn in home sales and residential mortgage demand.
The U.S. Midwest banking environment continues to be highly competitive, with a low interest rate environment, global economic headwinds and moderate economic growth, posing challenges for the banking industry. As a result, we remain committed to a customer-focused growth strategy as we offer new product suites, enhanced digital capabilities and credit processes, while at the same time deepening our relationships with our current customers, expanding into under-served markets and striving to deliver an integrated cross-bank client experience. As we look forward, we expect that the anticipated uptrend in interest rates, improvement in labour markets and positive consumer metrics will help us sustain the organic momentum in our deposit and loan growth. We will continue to actively manage risks and regulatory compliance through a comprehensive and integrated oversight and control structure.
The U.S. economic environment in 2016 and the outlook for 2017 are discussed in more detail in the Economic Developments and Outlook section on page 30.
Caution
This U.S. P&C Banking section contains forward-looking statements. Please see the Caution Regarding Forward-Looking Statements.
Adjusted results in this section are non-GAAP and are discussed in the Non-GAAP Measures section on page 33.
| | |
| 54 | | BMO Financial Group 199th Annual Report 2016 |
BMO Wealth Management
| | | | |
| BMO’s wealth business serves a full range of client segments, from mainstream to ultra-high net worth and institutional, with a broad offering of wealth management products and services including insurance. BMO Wealth Management is a global business with an active presence in markets across Canada, the United States, Europe and Asia. | |  |
Joanna Rotenberg Group Head BMO Wealth Management(1) | | Gilles Ouellette Group Head, BMO Asset Management and Vice-Chair, International, BMO Financial Group(1) | |
| | |
| | |
Lines of Business BMO Nesbitt Burns,our full-service investing business in Canada, offers comprehensive and client-focused investment, and wealth advisory services that leverage strong financial planning capabilities, as well as Canada’s first bank-owned digital portfolio management platform, BMO SmartFolio®. BMO InvestorLineis an online investing service that offers clients two ways to invest: our top-ranked self-directed service, which provides tools to help investors make independent investment decisions; or adviceDirect™, which provides investors with online advice and investment recommendations for their portfolios. BMO’s Private Bankingbusinesses operate in Canada, the United States, Hong Kong and Singapore, offering a comprehensive range of financial services and solutions to high net worth and ultra-high net worth clients and, under BMO Harris Financial Advisors, to mass affluent clients in the United States. | | BMO Asset Managementis a globally significant asset management organizationthat provides investment management, trust and custody services to institutional, retail and high net worth investors around the world. BMO Insuranceoperates in Canada and internationally. In Canada,
we manufacture life insurance, accident and sickness insurance, and annuity products that are marketed both to brokers and directly to individuals. Our creditor insurance division markets group creditor insurance, and internationally, we provide reinsurance solutions. |
Strengths and Value Drivers
| • | | Planning and advice-based approach that integrates investment, insurance, specialized wealth management and core banking solutions. |
| • | | Team of highly skilled wealth professionals committed to providing a great client experience. |
| • | | Prestigious brand that is broadly recognized and trusted. |
| • | | Strong presence in North America, globally in asset management and in private banking in select markets, including Europe and Asia. |
| • | | Diversified portfolio of digital investment solution platforms ranging from self-directed investing to professional money management. |
| • | | Access to BMO’s broad client base and distribution networks. |
| • | | Strong risk management framework to enable us to operate within our risk appetite and respond to heightened regulatory expectations. |
Strategy and Key Priorities
We aim to be the wealth management solutions provider that defines great client experience. Our strategy is to deliver on our clients’ wealth management needs now and into the future by enhancing the client experience, while focusing on innovation and productivity, increasing collaboration across BMO and maintaining a strong risk management framework.
Enhance our clients’ experience and deliver on their evolving wealth management needs
2016 Achievements
| • | | Launched BMO SmartFolio®, Canada’s first bank-owned digital portfolio management platform, to provide an easy and affordable “hands-free” personal investing solution to our clients. |
| • | | Improved our financial planning capabilities to better help clients create robust financial plans through enhanced training, the addition of financial planning professionals, as well as enhancements to financial planning software. |
| • | | Launched new exchange traded funds (ETFs) in both Europe and Asia, and solidified our position as the #2 ETF provider in Canada. |
| • | | Expanded wealth offerings, solutions and programs for targeted growth demographics, such as millennials and women investors. |
| • | | Launched the BMO Women in Leadership Fund, the first impact investing mutual fund by a Canadian bank. |
| • | | Established a team of specialist professionals focused on providing services for our clients with cross-border financial needs. |
| • | | Continued to improve our lending capabilities in the ultra-high net worth segment. |
| • | | Received a number of awards, including Best Online Brokerage for BMO InvestorLine (Morningstar), Best Private Client Investment Platform for CTC | myCFO (Private Asset Management Magazine), Best New ETF Issuer and Best New Fixed Income ETF for BMO Global Asset Management EMEA (ETF.com) and Best Domestic Private Bank for BMO Private Banking (Global Financial Market Review). |
2017 Focus
| • | | Invest in market-leading product innovations and wealth planning solutions tailored to meeting clients’ evolving needs. |
Drive productivity and simplify processes to improve the client experience
2016 Achievements
| • | | Improved our data analytics capabilities to increase the capacity and efficiency of our sales force. |
| | (1) | Prior to November 1, 2016, Joanna Rotenberg was Head, Personal Wealth and Gilles Ouellette was Group Head, Wealth Management. |
| | | | |
| BMO Financial Group 199th Annual Report 2016 | | | 55 | |
MANAGEMENT’S DISCUSSION AND ANALYSIS
| • | | Enhanced the onboarding and online client experience. |
| • | | Streamlined our organizational structure to increase collaboration and realize operational efficiencies across and within our businesses. |
2017 Focus
| • | | Continue to improve productivity through digitalization and process transformation. |
Meet our clients’ needs through increased collaboration
2016 Achievements
| • | | Focused on strengthening collaboration across BMO in order to offer our clients holistic solutions that meet their financial needs at every stage of their lives. Clients benefit from access to a broader suite of services, including traditional banking services, through a more efficient operating and client-service model. |
| • | | Continued to onboard, train and expand our sales professional teams in strategically important segments. |
| • | | Embarked on a multi-year digitalization program. |
| • | | Continued to enhance our integrated global Asset Management operating platform to better serve our clients. |
2017 Focus
| • | | Increase collaboration within BMO Wealth Management and across the bank to deliver exceptional client experience. |
Maintain strong risk management and compliance practices
2016 Achievements
| • | | Effectively managed the risks across our business and responded to heightened regulatory expectations. |
| • | | Grew our lending book in line with our risk appetite and our streamlined lending processes. |
| • | | Continued to enhance anti-money laundering tools and processes to protect our customers, including the implementation of technology improvements focused on transaction monitoring and “Know your Customer” processes. |
2017 Focus
| • | | Continue to invest in a strong risk management and compliance framework to operate within our risk appetite and respond to heightened regulatory expectations. |
Wealth Management
| | | | | | | | | | | | |
(Canadian $ in millions, except as noted) As at or for the year ended October 31 | | 2016 | | | 2015 | | | 2014 | |
Net interest income | | | 614 | | | | 565 | | | | 537 | |
Non-interest revenue (1) | | | 5,274 | | | | 5,198 | | | | 4,801 | |
Total revenue (1) | | | 5,888 | | | | 5,763 | | | | 5,338 | |
Insurance claims, commissions and changes in policy benefit liabilities (CCPB) (1) | | | 1,543 | | | | 1,254 | | | | 1,505 | |
Revenue, net of CCPB | | | 4,345 | | | | 4,509 | | | | 3,833 | |
Provision for (recovery of) credit losses | | | 9 | | | | 7 | | | | (3 | ) |
Non-interest expense | | | 3,335 | | | | 3,357 | | | | 2,840 | |
Income before income taxes | | | 1,001 | | | | 1,145 | | | | 996 | |
Provision for income taxes | | | 239 | | | | 295 | | | | 216 | |
Reported net income | | | 762 | | | | 850 | | | | 780 | |
Acquisition integration costs (2) | | | 30 | | | | 37 | | | | 16 | |
Amortization of acquisition-related intangible assets (3) | | | 71 | | | | 68 | | | | 47 | |
Adjusted net income | | | 863 | | | | 955 | | | | 843 | |
Key Performance Metrics and Drivers | | | | | | | | | | | | |
Traditional Wealth businesses net income | | | 540 | | | | 610 | | | | 494 | |
Traditional Wealth businesses adjusted net income | | | 641 | | | | 715 | | | | 557 | |
Insurance net income | | | 222 | | | | 240 | | | | 286 | |
Net income growth (%) | | | (10.2 | ) | | | 8.9 | | | | (5.7 | ) |
Adjusted net income growth (%) | | | (9.6 | ) | | | 13.3 | | | | (1.3 | ) |
Revenue growth (%) (1) | | | 2.2 | | | | 8.0 | | | | 26.6 | |
Revenue growth, net of CCPB (%) (1) | | | (3.6 | ) | | | 17.6 | | | | 11.2 | |
Non-interest expense growth (%) | | | (0.6 | ) | | | 18.2 | | | | 20.8 | |
Adjusted non-interest expense growth (%) | | | (0.4 | ) | | | 16.9 | | | | 19.1 | |
Return on equity (%) | | | 12.4 | | | | 14.8 | | | | 18.4 | |
Adjusted return on equity (%) | | | 14.1 | | | | 16.6 | | | | 19.9 | |
Operating leverage, net of CCPB (%) (1) | | | (3.0 | ) | | | (0.6 | ) | | | (9.6 | ) |
Adjusted operating leverage, net of CCPB (%) | | | (3.2 | ) | | | 0.7 | | | | (7.9 | ) |
Efficiency ratio, net of CCPB (%) (1) | | | 76.8 | | | | 74.5 | | | | 74.1 | |
Adjusted efficiency ratio (%) | | | 54.5 | | | | 55.9 | | | | 51.7 | |
Adjusted efficiency ratio, net of CCPB (%) | | | 73.9 | | | | 71.5 | | | | 71.9 | |
Net interest margin on average earning assets (%) | | | 2.37 | | | | 2.38 | | | | 2.54 | |
Average common equity | | | 6,078 | | | | 5,688 | | | | 4,181 | |
Average earning assets | | | 25,898 | | | | 23,784 | | | | 21,169 | |
Average net loans and acceptances | | | 16,458 | | | | 14,550 | | | | 12,943 | |
Average deposits | | | 29,931 | | | | 27,377 | | | | 24,912 | |
Assets under administration | | | 469,694 | | | | 465,742 | | | | 414,547 | |
Assets under management | | | 405,695 | | | | 397,959 | | | | 379,606 | |
Full-time equivalent employees | | | 6,357 | | | | 6,497 | | | | 6,649 | |
U.S. Business Select Financial Data (US$ in millions) | | | | | | | | | | | | |
Total revenue | | | 629 | | | | 806 | | | | 720 | |
Non-interest expense | | | 575 | | | | 652 | | | | 658 | |
Reported net income | | | 39 | | | | 99 | | | | 53 | |
Adjusted net income | | | 54 | | | | 118 | | | | 73 | |
Average earning assets | | | 3,446 | | | | 3,242 | | | | 3,028 | |
Average net loans and acceptances | | | 3,200 | | | | 2,965 | | | | 2,654 | |
Average deposits | | | 5,602 | | | | 6,010 | | | | 5,834 | |
| | (1) | Commencing in the first quarter of 2015, insurance claims, commissions and changes in policy benefit liabilities (CCPB) are reported separately. They were previously reported as a reduction in insurance revenue in non-interest revenue. Prior period amounts and ratios have been reclassified. |
| | (2) | F&C acquisition integration costs before tax amounts of $38 million in 2016, $46 million in 2015 and $20 million in 2014 are included in non-interest expense. |
| | (3) | Before tax amounts of $88 million in each of 2016 and 2015 and $62 million in 2014 are included in non-interest expense. |
| | |
| 56 | | BMO Financial Group 199th Annual Report 2016 |
Financial Review
Wealth Management reported net income was $762 million, compared to $850 million a year ago. Adjusted net income, which excludes the amortization of acquisition-related intangible assets and acquisition integration costs, was $863 million, compared to $955 million a year ago.
Traditional wealth reported net income was $540 million, compared to $610 million a year ago. Adjusted net income in traditional wealth was $641 million, compared to $715 million a year ago, as solid underlying growth was more than offset by the prior year benefits of a gain on the sale of BMO’s U.S. retirement services business, as well as a write-down of an equity investment net of a gain on its subsequent sale in 2016. Net income in insurance was $222 million, compared to $240 million a year ago, primarily due to higher actuarial benefits in the prior year and above-trend benefits a year ago from changes in our investment portfolio to improve asset-liability management, partially offset by growth in the underlying business.
Revenue was $5,888 million, up $125 million or 2% from a year ago. Revenue, net of CCPB, was $4,345 million, down $164 million or 4% compared to $4,509 million a year ago. Revenue in traditional wealth was $3,923 million, compared to $4,057 million a year ago, as solid underlying growth in our spread-based and fee-based revenue was more than offset by the prior year benefits of a gain on the sale of BMO’s U.S. retirement services business, the impact of divestitures, and a write-down of an equity investment net of a gain on its subsequent sale in 2016. Insurance revenue, net of CCPB, was $422 million, compared to $452 million a year ago, due to the factors noted above. The stronger U.S. dollar increased revenue by $44 million or 1%. The weaker British pound reduced revenue by $23 million.
The provision for credit losses was $9 million, compared to $7 million a year ago.
Non-interest expense was $3,335 million, down $22 million or 1%. Adjusted non-interest expense was $3,209 million, down $14 million, as the impact of divestitures and the weaker British pound was partially offset by the impact of the stronger U.S. dollar and continued investment in the business. The stronger U.S. dollar increased adjusted non-interest expense by $40 million or 2%. The weaker British pound reduced non-interest expense by $21 million.
Assets under management and administration grew by $12 billion or 1% from a year ago to $875 billion, primarily driven by market appreciation.
Business Environment, Outlook and Challenges
Canadian and U.S. stock markets experienced declines in early 2016, resulting in an unfavourable investment climate and low levels of client trading activity, before slowly rebounding in the second half of the year. Financial markets have driven the British pound to a three-decade low due to uncertainty related to the potential fallout from the Brexit referendum, which is impacting our operations in the United Kingdom. Long-term interest rates in the United States and Canada declined in 2016 in response to steady policies by the Federal Reserve and Bank of Canada, modest economic growth and low inflation, putting pressure on our brokerage net interest income. Interest rates subsequently turned up at year end in anticipation of tighter Federal Reserve policy and signs of firmer economic growth.
Canadian economic growth is expected to improve modestly to 1.9% and U.S. economic growth is expected to improve to 2.2% in fiscal 2017, and we anticipate that a sustained level of higher activity in equity markets in 2017 will continue to positively affect both transaction volumes and asset levels. Long-term interest rates in the United States and Canada are expected to rise only moderately, leading to minimal expected impact on our insurance business. We are also anticipating greater fee transparency for mutual funds and investment management and advisory services and that could result in downward fee pressure for these products and services.
We expect that changing demographics, particularly in the retirement, mass affluent and high net worth sectors, will continue to drive the wealth management industry over the longer term. Tailoring our offering for key client segments, enhancing our team-based client service model to provide a holistic approach that supports clients as they move through different life stages and keeping pace with advances in technology, are ways in which we can continue to meet our clients’ evolving needs.
The Canadian and U.S. economic environment in 2016 and the outlook for 2017 are discussed in more detail in the Economic Developments and Outlook section on page 30.
Caution
This Wealth Management section contains forward-looking statements. Please see the Caution Regarding Forward-Looking Statements.
Adjusted results in this section are non-GAAP and are discussed in the Non-GAAP Measures section on page 33.
| | | | |
| BMO Financial Group 199th Annual Report 2016 | | | 57 | |
MANAGEMENT’S DISCUSSION AND ANALYSIS
BMO Capital Markets
| | | | |
BMO Capital Markets is a North American-based financial services provider offering a complete range of products and services to corporate, institutional and government clients. BMO Capital Markets has approximately 2,400 professionals in 30 locations around the world, including 16 offices in North America. | | 
|
Patrick Cronin Group Head BMO Capital Markets(1) | | Darryl White Chief Operating Officer BMO Financial Group(1) | |
| | |
Lines of Business | | |
| | |
Investment and Corporate Banking offers clients debt and equity capital-raising services, as well as loan origination and syndication, balance sheet management solutions and treasury management services. We provide strategic advice on mergers and acquisitions, restructurings and recapitalizations, as well as valuation and fairness opinions. We also offer trade finance and risk mitigation services to support the international business activities of our clients, and we provide a wide range of banking and other operating services tailored to North American and international financial institutions. | | Trading Products offers research and access to global markets for institutional, corporate and retail clients through an integrated suite of sales and trading solutions that include debt, foreign exchange, interest rate, credit, equity, securitization and commodities. We also offer new product development and origination services, as well as risk management (derivatives) advice and services to hedge against fluctuations in a variety of key inputs, including interest rates and commodities prices. In addition, we provide funding and liquidity management to our clients. |
Strengths and Value Drivers
| • | | Unified coverage and integrated distribution across our North American platform and complementary global footprint, delivering a seamless and exceptional client experience. |
| • | | Innovative ideas and tailored solutions delivered through a comprehensive coverage team, dedicated to anticipating, understanding and meeting client needs. |
| • | | Top-ranked Canadian equity and fixed income economic research, sales and trading capabilities with deep expertise in core sectors. |
| • | | Strong first-line-of-defence risk management and regulatory and compliance capabilities, enabling effective decision-making in support of our strategic priorities. |
| • | | Well-diversified platform and business mix, by sector, geography, product and currency, positioning BMO well in several key markets and over the long term. |
Strategy and Key Priorities
BMO Capital Markets aims to be a lead North American investment bank enabling clients to achieve their goals. We offer an integrated platform, differentiated by innovative ideas and unified coverage.
Continue to maintain our leadership position in Canada through our top-tier coverage team
2016 Achievements
| • | | Continued to win key mandates in core Canadian industries, including: as sole advisor on a $1.9 billion disposition by Paramount Resources, the largest non-oil sands upstream energy transaction of 2016; as advisor to Bell Canada Enterprises (BCE) on its pending $3.9 billion acquisition of Manitoba Telecom Services Inc.; and as lead of the largest unsecured operating line transaction in Canadian REIT history with RioCan. |
| • | | Ranked #1 (tied) as a 2016 Greenwich Quality Leader in Overall Canadian Fixed Income, Canadian Fixed Income Sales, Canadian Fixed Income Research and Canadian Fixed Income Trading by Greenwich Associates. |
| • | | Ranked #2 as a 2016 Greenwich Share Leader for Canadian Equity Trading Share by Greenwich Associates. |
| • | | Ranked #2 (tied) as a 2016 Greenwich Share Leader for Overall Canadian Fixed Income Market Share by Greenwich Associates. |
| • | | Ranked #1 (tied) by its clients as a Prime Broker in Canada in the 2016 Global Custodian Prime Brokerage Survey. |
| • | | Named Best House in Canada for Structured Products at the 2016 Americas Structured Products & Derivatives Awards. |
| • | | Named Bank of the Year at the annual Canadian Dealmakers Awards. |
2017 Focus
| • | | Continue to maintain market leadership in Canada by deepening our client relationships and driving incremental market share growth. |
| | (1) | Prior to November 1, 2016, Patrick Cronin was Chief Operating Officer, BMO Capital Markets and Darryl White was Group Head, BMO Capital Markets. |
| | |
| 58 | | BMO Financial Group 199th Annual Report 2016 |
Continue to drive performance in our U.S. platform with a focused strategy and selectively grow our U.S. corporate bank where we are competitively advantaged
2016 Achievements
| • | | Continued to leverage our full-service capabilities to gain competitive advantage against our U.S. mid-market and boutique competitors. |
| • | | Acquired U.S. boutique M&A advisory business Greene Holcomb Fisher, complementing our existing M&A practice and aligning with our strategy of focusing in the mid-cap market space. |
| • | | Ranked #3 by Ivy Exec as Best Large Investment Bank To Work For. |
| • | | Continued to expand our lending and advisory mandates, including as financial advisor to Stone Canyon on its $2.4 billion acquisition of BWAY, as the joint lead arranger, joint bookrunner and administrative agent for Jones Lang LaSalle Incorporated’s US$2.75 billion Senior Credit Facility, and as financial advisor to Inland Real Estate Corporation on its US$2.3 billion sale to real estate funds managed by DRA Advisors LLC. |
| • | | Closed 33 U.S. M&A transactions this year, up 22% from the prior year, with a total deal volume of $14 billion. |
| • | | Continued to win significant cross-border mandates, including acting as financial advisor to Spectra Energy on its combination with Enbridge, the largest M&A deal in Canadian history, creating the largest energy infrastructure company in North America with an enterprise value of $165 billion. |
2017 Focus
| • | | Continue to leverage our key strategic investments to increase growth from our U.S. platform, and selectively grow our U.S. corporate bank where we are competitively advantaged. |
Leverage our strong North American capabilities and presence in select international markets
2016 Achievements
| • | | Built our presence in the Supranational Sub-sovereign Agency (SSA) market. Named a Coming Force in SSA Banking at the 2016 GlobalCapital Bond Awards and won key mandates, including acting as bookrunner and sole swap provider on a US$2.5 billion 5-year Fixed Rate Note deal by the International Finance Corporation. |
| • | | Continued to expand lending and advisory mandates globally in the metals and mining sector, such as acting as financial advisor to Ivanhoe Mines in partnership with Zijin Mining on the co-development of the Kamoa, the world’s largest, undeveloped, high-grade copper discovery, in the Democratic Republic of Congo. |
| • | | Named World’s Best Metals & Mining Investment Bank for the seventh consecutive year byGlobal Finance. |
| • | | Issued BMO’s first Formosa bond in Taiwan, a $262 million U.S.-dollar-denominated 30-year structured note. |
| • | | Named Best Bank for the Canadian Dollar for the sixth consecutive year byFX Week magazine. |
| • | | Named Best Trade Bank in Canada at the 2016Trade Finance Magazine Company Awards. |
| • | | Named Best Forex Provider in North America for the sixth consecutive year byGlobal Banking and Finance Review. |
2017 Focus
| • | | Continue to leverage our strong North American and global capabilities to deepen our presence and strategic relationships in select international markets. |
Continue to enhance our first-line-of-defence risk management, regulatory and compliance practices
2016 Achievements
| • | | Continued to enhance our supervisory, risk management and regulatory compliance infrastructure and processes to further strengthen our control environment. |
| • | | Developed first-line capabilities that provide incremental oversight of key risks across our businesses. |
| • | | Further strengthened our first-line capabilities for implementing new regulations, managed our operations effectively during a period of significant changes in the regulatory environment and achieved compliance with key regulations by their effective date. |
2017 Focus
| • | | Continue to enhance our first-line-of-defence risk management and compliance practices to manage our operations effectively during an ongoing period of significant change in the regulatory environment. |
| | | | |
| BMO Financial Group 199th Annual Report 2016 | | | 59 | |
MANAGEMENT’S DISCUSSION AND ANALYSIS
BMO Capital Markets
| | | | | | | | | | | | |
(Canadian $ in millions, except as noted) As at or for the year ended October 31 | | 2016 | | | 2015 | | | 2014 | |
Net interest income (teb) | | | 1,509 | | | | 1,332 | | | | 1,175 | |
Non-interest revenue | | | 2,853 | | | | 2,535 | | | | 2,539 | |
Total revenue (teb) | | | 4,362 | | | | 3,867 | | | | 3,714 | |
Provision for (recovery of) credit losses | | | 81 | | | | 26 | | | | (18 | ) |
Non-interest expense | | | 2,576 | | | | 2,483 | | | | 2,349 | |
Income before income taxes | | | 1,705 | | | | 1,358 | | | | 1,383 | |
Provision for income taxes (teb) | | | 437 | | | | 329 | | | | 309 | |
Reported net income | | | 1,268 | | | | 1,029 | | | | 1,074 | |
Amortization of acquisition-related intangible assets (1) | | | 1 | | | | 2 | | | | 1 | |
Adjusted net income | | | 1,269 | | | | 1,031 | | | | 1,075 | |
Key Performance Metrics and Drivers | | | | | | | | | | | | |
Trading Products revenue | | | 2,670 | | | | 2,412 | | | | 2,257 | |
Investment and Corporate Banking revenue | | | 1,692 | | | | 1,455 | | | | 1,457 | |
Net income growth (%) | | | 23.3 | | | | (4.2 | ) | | | 3.5 | |
Revenue growth (%) | | | 12.8 | | | | 4.1 | | | | 9.8 | |
Non-interest expense growth (%) | | | 3.8 | | | | 5.7 | | | | 12.7 | |
Return on equity (%) | | | 16.2 | | | | 14.8 | | | | 19.1 | |
Operating leverage (teb) (%) | | | 9.0 | | | | (1.6 | ) | | | (2.9 | ) |
Efficiency ratio (teb) (%) | | | 59.1 | | | | 64.2 | | | | 63.3 | |
Net interest margin on average earning assets (teb) (%) | | | 0.59 | | | | 0.56 | | | | 0.53 | |
Average common equity | | | 7,394 | | | | 6,538 | | | | 5,422 | |
Average earning assets | | | 254,461 | | | | 238,916 | | | | 222,471 | |
Average assets | | | 303,273 | | | | 289,936 | | | | 259,324 | |
Average net loans and acceptances | | | 46,109 | | | | 37,113 | | | | 29,701 | |
Average deposits | | | 150,068 | | | | 141,038 | | | | 133,181 | |
Full-time equivalent employees | | | 2,362 | | | | 2,184 | | | | 2,267 | |
U.S. Business Select Financial Data(US$ in millions) | | | | | | | | | | | | |
Total revenue (teb) | | | 1,162 | | | | 1,099 | | | | 1,154 | |
Non-interest expense | | | 861 | | | | 890 | | | | 887 | |
Reported net income | | | 196 | | | | 142 | | | | 216 | |
Average earning assets | | | 78,774 | | | | 76,630 | | | | 79,958 | |
Average assets | | | 85,651 | | | | 84,872 | | | | 88,902 | |
Average net loans and acceptances | | | 15,068 | | | | 11,034 | | | | 9,547 | |
Average deposits | | | 52,459 | | | | 55,942 | | | | 57,754 | |
| | (1) | Before tax amounts of $1 million in 2016, $2 million in 2015 and $3 million in 2014 are included in non-interest expense. |
Financial Review
BMO Capital Markets reported net income increased $239 million or 23% to $1,268 million from the prior year. Adjusted net income, which excludes the amortization of acquisition-related intangible assets, was $1,269 million, an increase of $238 million or 23%. Strong revenue performance was partially offset by higher expenses and higher loan loss provisions. Return on equity of 16.2% increased from 14.8% in the prior year due to higher net income, partially offset by higher allocated capital.
Revenue increased $495 million or 13% to $4,362 million from the prior year. Excluding the impact of the stronger U.S. dollar, revenue increased $422 million or 11%, reflecting improved trading revenue performance, strong mergers and acquisitions advisory activity and higher lending revenue, partially offset by lower net securities gains and the sale of our municipal bond trading business.
Trading Products revenue increased $258 million or 11% from the prior year. Excluding the impact of the stronger U.S. dollar, revenue increased $218 million or 9%, driven by higher trading revenue from improved client activity, particularly in interest rate trading, and higher securities commissions, partially offset by lower net securities gains.
Investment and Corporate Banking revenue increased $237 million or 16% from the prior year. Excluding the impact of the stronger U.S. dollar, revenue increased $204 million or 14%, as higher investment banking revenue, primarily from strong mergers and acquisitions advisory activity, and higher corporate banking revenue driven by loan growth were partially offset by lower net securities gains.
Provision for credit losses was $55 million higher from the prior year, mainly due to higher oil and gas provisions.
Non-interest expense increased $93 million or 4% to $2,576 million. Excluding the impact of the stronger U.S. dollar, non-interest expense increased $33 million or 1%, reflecting our continued focus on disciplined expense management and the sale of our municipal bond trading business.
Average assets of $303.3 billion increased $13.3 billion from the prior year, including an $8.6 billion increase as a result of the stronger U.S. dollar. Higher levels of reverse repos and net loans and acceptances due to increases in corporate banking activity were partially offset by decreases in securities, cash and derivative financial asset balances.
BMO Capital Markets participated in 1,152 new global issues in 2016, comprised of 577 corporate debt deals, 322 government debt deals and 253 equity transactions, which raised $4.0 billion.
| | |
| 60 | | BMO Financial Group 199th Annual Report 2016 |
Business Environment, Outlook and Challenges
In fiscal 2016, global economic conditions continued to present an uncertain landscape, with volatility related to the Brexit referendum and the U.S. election, interest rates that remain at historically low levels, sharp movements in oil and some commodities prices, and diverging positions among central banks around the world. While challenging market conditions persist, BMO Capital Markets’ strategy remains constant and our performance in fiscal 2016 reflected our balanced, diversified and client-focused business model, as well as our disciplined approach to risk management. We continue to concentrate on our strategy, with the United States as our largest market opportunity for growth, and we maintain our focus on enhancing our control environment.
Looking ahead to fiscal 2017, we expect economic growth in the United States to be sustained and healthy. Canadian economic growth is expected to improve modestly, supported by anticipated firming in U.S. demand for exports, higher oil prices and a Canadian dollar that remains weak against the U.S. dollar. We expect continued growth in many of our businesses, in the context of overall growth in the global economy and constructive market conditions, and despite synthetic equity arrangement rules (SEA Rules) that were passed into law in Canada. The effect of the SEA Rules will be to increase our effective tax rate and negatively impact our earnings in fiscal 2017. For additional discussion, see the Legal and Regulatory Risk section on page 110.
The Canadian and U.S. economic environment in 2016 and the outlook for 2017 are discussed in more detail in the Economic Developments and Outlook section on page 30.
Caution
This BMO Capital Markets section contains forward-looking statements. Please see the Caution Regarding Forward-Looking Statements.
Adjusted results in this section are non-GAAP and are discussed in the Non-GAAP Measures section on page 33.
| | | | |
| BMO Financial Group 199th Annual Report 2016 | | | 61 | |
MANAGEMENT’S DISCUSSION AND ANALYSIS
Corporate Services, including Technology and Operations
Corporate Services consists of Corporate Support Areas (CSAs), including Technology and Operations (T&O). CSAs provide enterprise-wide expertise and governance support in a variety of areas, including strategic planning, risk management, finance, legal and regulatory compliance, marketing, communications and human resources. T&O manages, maintains and provides governance over information technology, operations services, real estate and procurement for BMO Financial Group.
The costs of these CSA services are largely transferred to the three client operating groups (P&C, WM and BMO CM), with remaining amounts retained in Corporate Services results. As such, Corporate Services results largely reflect the impact of residual treasury and asset-liability management activities, the elimination of taxable equivalent adjustments, the results from certain impaired real estate secured assets, certain purchased loan accounting impacts, residual unallocated expenses, certain acquisition integration costs, restructuring costs and adjustments to the collective allowance for credit losses.
Corporate Services focuses on enterprise-wide priorities related to maintaining a sound risk and control environment and efficiency while supporting our businesses in meeting their customer experience objectives. Notable achievements during the year included:
| • | | Invested in our cyber defence capability and monitoring mechanisms, to respond to and manage cyber security threats. |
| • | | Continued to enhance our Risk Management Framework by implementing enhanced procedures that have strengthened our internal governance and controls over key risk processes and improved the monitoring and performance of models. |
| • | | Met regulatory expectations: continued delivery of programs such as automating and upgrading foundational capabilities for risk and data analysis; as well as successfully met the requirements of the Comprehensive Capital Analysis and Review and the Heightened Standards guidelines for large banks established by the Office of the Comptroller of the Currency. |
| • | | Enhanced Anti-Money Laundering Program: integrating risk assessment team for North America; enhanced quality control and self-testing functions were implemented for regulatory reporting functions; and robotics automation is being piloted to eliminate manual processes for cheque retrievals. |
| • | | Leveraged data to better serve our customers: building enterprise-level data solutions to help us intuitively anticipate customer needs, including the launch of a customer insight tool in the United States and the launch of a data platform in Canada to help our front-line sales team make better personal connections with our customers. |
| • | | Accelerated the deployment of a unified digital experience across channels and products. |
Financial Review
Corporate Services reported net loss for the year was $687 million, compared with a reported net loss of $408 million a year ago. Reported results in both years included a restructuring charge and acquisition integration costs. The adjusted net loss for the year was $452 million, compared with an adjusted net loss of $296 million a year ago. Both reported and adjusted results declined due to lower revenue, driven by a recovery under a legal settlement in the prior year, lower impaired real estate gains and lower purchase accounting revenue, partially offset by higher credit recoveries in the current year. Reported expenses increased primarily due to higher acquisition integration costs related to the acquired BMO Transportation Finance business and higher restructuring costs in the current year, and reported revenue was lower due to a cumulative accounting adjustment related to foreign currency translation that largely impacted prior periods.
Corporate Services, including Technology and Operations
| | | | | | | | | | | | |
(Canadian $ in millions, except as noted) As at or for the year ended October 31 | | 2016 | | | 2015 | | | 2014 | |
Net interest income before group teb offset (1) | | | (329 | ) | | | (252 | ) | | | (82 | ) |
Group teb offset | | | (510 | ) | | | (524 | ) | | | (476 | ) |
Net interest income (teb) (1) | | | (839 | ) | | | (776 | ) | | | (558 | ) |
Non-interest revenue | | | 59 | | | | 279 | | | | 166 | |
Total revenue (teb) (1) | | | (780 | ) | | | (497 | ) | | | (392 | ) |
Recovery of credit losses (1) | | | (74 | ) | | | (36 | ) | | | (123 | ) |
Non-interest expense | | | 724 | | | | 613 | | | | 470 | |
Loss before income taxes | | | (1,430 | ) | | | (1,074 | ) | | | (739 | ) |
Recovery of income taxes (teb) | | | (743 | ) | | | (666 | ) | | | (547 | ) |
Reported net loss | | | (687 | ) | | | (408 | ) | | | (192 | ) |
Acquisition integration costs (2) | | | 41 | | | | 6 | | | | – | |
Cumulative accounting adjustment (3) | | | 62 | | | | – | | | | – | |
Restructuring costs (4) | | | 132 | | | | 106 | | | | – | |
Adjusted net loss | | | (452 | ) | | | (296 | ) | | | (192 | ) |
Adjusted total revenue (teb) (1) | | | (696 | ) | | | (495 | ) | | | (392 | ) |
Adjusted recovery of credit losses (1) | | | (74 | ) | | | (36 | ) | | | (123 | ) |
Adjusted non-interest expense | | | 469 | | | | 459 | | | | 470 | |
Adjusted net loss | | | (452 | ) | | | (296 | ) | | | (192 | ) |
Full-time equivalent employees | | | 14,236 | | | | 14,369 | | | | 14,232 | |
U.S. Business Select Financial Data (US$ in millions) | | | | | | | | | | | | |
Total revenue (teb) (1) | | | (135 | ) | | | (85 | ) | | | (32 | ) |
Recovery of credit losses (1) | | | (81 | ) | | | (79 | ) | | | (120 | ) |
Non-interest expense | | | 219 | | | | 272 | | | | 298 | |
Recovery of income taxes (teb) (1) | | | (77 | ) | | | (131 | ) | | | (103 | ) |
Reported net loss | | | (196 | ) | | | (147 | ) | | | (107 | ) |
Adjusted total revenue (teb) (1) | | | (135 | ) | | | (85 | ) | | | (32 | ) |
Adjusted recovery of credit losses (1) | | | (56 | ) | | | (30 | ) | | | (117 | ) |
Adjusted non-interest expense | | | 120 | | | | 228 | | | | 298 | |
Adjusted net loss | | | (150 | ) | | | (148 | ) | | | (106 | ) |
| | |
| 62 | | BMO Financial Group 199th Annual Report 2016 |
Corporate Services Provision for Credit Losses
| | | | | | | | | | | | |
(Canadian $ in millions) As at or for the year ended October 31 | | 2016 | | | 2015 | | | 2014 | |
Impaired real estate loans | | | (16 | ) | | | 28 | | | | 21 | |
Interest on impaired loans | | | – | | | | 17 | | | | 26 | |
Purchased credit impaired loans | | | (58 | ) | | | (86 | ) | | | (252 | ) |
Purchased performing loans | | | – | | | | 5 | | | | 82 | |
Recovery of credit losses (1) | | | (74 | ) | | | (36 | ) | | | (123 | ) |
Average loans and acceptances | | | 96 | | | | 242 | | | | 452 | |
Year-end loans and acceptances | | | 80 | | | | 182 | | | | 306 | |
| | (1) | Beginning in the first quarter of 2016, the reduction in the credit mark that is reflected in net interest income and the provision for credit losses on the purchased performing portfolio are being recognized in U.S. P&C, consistent with the accounting for the acquisition of BMO Transportation Finance, and given that these amounts have reduced substantially in size. Results for prior periods have not been reclassified. |
| | (2) | Acquisition integration costs related to the acquisition of BMO Transportation Finance are primarily included in non-interest expense. |
| | (3) | Cumulative accounting adjustment recognized in other non-interest revenue related to foreign currency translation that largely impacted prior periods. |
| | (4) | Restructuring charges before tax amounts of: $188 million in 2016 as we accelerate the use of technology to enhance customer experience and focus on driving operational efficiencies; and $149 million in 2015, primarily due to restructuring to drive operational efficiencies, are included in non-interest expense. |
Adjusted results in this table are non-GAAP amounts or non-GAAP measures. Please see the Non-GAAP Measures section.
Review of Fourth Quarter 2016 Performance
Reported net income was $1,345 million for the fourth quarter of 2016, up $131 million or 11% from the prior year. Adjusted net income was $1,395 million, up $131 million or 10% from the prior year. Adjusted results for the quarter exclude the amortization of acquisition-related intangible assets of $37 million ($29 million after-tax), which were charged to the non-interest expense of the operating groups, and acquisition integration costs of $31 million ($21 million after-tax), which were primarily recorded in non-interest expense. Acquisition integration costs related to F&C were charged to Wealth Management and acquisition integration costs related to the acquired BMO Transportation Finance business were charged to Corporate Services.
Reported EPS of $2.02 was up $0.19 or 10% and adjusted EPS of $2.10 was up $0.20 or 11% from the prior year. Return on equity was 13.8% and adjusted return on equity was 14.4%.
Summary income statements and data for the quarter and comparative quarters are outlined on page 67.
The combined P&C banking business net income of $878 million and adjusted net income of $891 million increased 14%. Canadian P&C net income increased 5% reflecting good operating performance with higher balances across most products and increased non-interest revenue, partially offset by higher expenses and higher provisions for credit losses. U.S. P&C reported net income increased 38% on a Canadian dollar basis and 37% on a U.S. dollar basis. U.S. P&C adjusted net income increased 35% on a Canadian dollar basis and 34% on a U.S. dollar basis. Reported and adjusted U.S. P&C net income benefited from the acquired BMO Transportation Finance business and continued good growth in commercial lending. Wealth Management reported net income was $279 million compared to $243 million in the prior year. Wealth Management adjusted net income was $302 million compared to $271 million, up 11% from the prior year. Traditional wealth reported net income increased 8% and adjusted net income increased 5% largely reflecting improved market conditions and growth across most of our businesses. From a year-over-year growth perspective, a gain on sale of an investment in the fourth quarter of 2016 was offset by a gain on sale net of a legal provision in the prior year. Insurance net income increased primarily due to the impact of business growth and favourable market movements in the fourth quarter of 2016. BMO Capital Markets net income increased 65% driven by strong revenue performance. Corporate Services reported and adjusted results declined primarily due to lower revenue driven by a recovery under a legal settlement in the prior year, above-trend expenses and lower credit recoveries.
Total revenue of $5,278 million increased $296 million or 6% from the fourth quarter a year ago. Total revenue, net of CCPB, of $5,199 million increased $482 million or 10%. Canadian P&C revenue increased 5% due to higher balances across most products and increased non-interest revenue. U.S. P&C revenue increased 25% on a Canadian dollar and U.S. dollar basis primarily due to the benefit of the acquired BMO Transportation Finance business, as well as higher organic loan and deposit volumes, increased deposit spreads and fee income, net of loan spread compression. Traditional wealth revenue decreased as business growth and improved Canadian and U.S. equity markets were more than offset by the impact of higher gains in the prior year, lower revenue due to divestitures and the impact of the weaker British pound. Net insurance revenue increased mainly due to the impact of favourable market movements in the fourth quarter of 2016 and business growth. BMO Capital Markets revenue increased 27% with higher revenue in Investment and Corporate Banking due to strong merger and acquisition advisory activity, higher revenue from equity and debt underwriting, corporate lending and net securities gains. Trading Products revenue increased due to higher trading revenue from improved client activity, and higher equity issuances. Corporate Services revenue declined from above-trend revenue in the prior year, which included a recovery under a legal settlement.
Net interest income of $2,498 million increased $187 million or 8% from a year ago due to the benefits of the acquired BMO Transportation Finance business and organic volume growth. BMO’s overall net interest margin increased by 4 basis points to 1.57%. Net interest margin excluding trading increased 7 basis points from the prior year primarily due to the acquired BMO Transportation Finance business, higher deposit balances and in U.S. P&C higher deposit spreads. Average earning assets increased $33.9 billion or 6% to $631.4 billion, due to organic loan growth and the acquired BMO Transportation Finance business.
Non-interest revenue increased $295 million or 12% on a net revenue basis to $2,701 million, primarily due to higher revenue from underwriting and advisory fees, trading revenue and a gain on sale of an equity investment sold in the fourth quarter, partially offset by lower other non-interest revenue. Other non-interest revenue includes lease revenue from the acquired BMO Transportation Finance business, which was more than offset by the prior year benefits from a gain on sale of BMO’s U.S. retirement services business and a recovery under a legal settlement.
Adjusted results in this section are non-GAAP and are discussed in the Non-GAAP Measures section on page 33.
| | | | |
| BMO Financial Group 199th Annual Report 2016 | | | 63 | |
MANAGEMENT’S DISCUSSION AND ANALYSIS
The total provision for credit losses was $174 million, an increase of $46 million from the prior year due to higher provisions in Canadian and U.S. P&C and lower net recoveries in Corporate Services. There was no net change to the collective allowance in the quarter.
Insurance claims, commissions and changes in policy benefit liabilities (CCPB) were $79 million in the fourth quarter of 2016, down $186 million from $265 million in the fourth quarter of 2015 due to the impact of lower annuity premiums and reinsurance liabilities, partially offset by lower increases in long-term interest rates which resulted in a smaller decrease in the fair value of policy benefit liabilities compared to the fourth quarter of 2015. The decrease was largely offset in revenue.
Non-interest expense of $3,323 million increased $230 million or 7% from the fourth quarter a year ago. Adjusted non-interest expense excludes acquisition integration costs and the amortization of acquisition-related intangible assets. Adjusted non-interest expense increased $223 million or 7% to $3,255 million. Reported and adjusted expenses increased largely due to the impact of the acquired BMO Transportation Finance business, increased technology costs and higher employee-related expenses, partially offset by the impact of divestitures.
The provision for income taxes of $357 million increased $75 million from the fourth quarter of 2015. The effective tax rate for the quarter was 21.0%, compared with 18.8% a year ago. The adjusted provision for income taxes of $375 million increased $80 million from a year ago. The adjusted effective tax rate was 21.2% in the fourth quarter of 2016, compared with 18.9% a year ago. The higher reported and adjusted tax rate in the fourth quarter of 2016 relative to the fourth quarter of 2015 was primarily due to a higher proportion of income from higher tax-rate jurisdictions and lower tax-exempt income from securities. On a teb basis, the reported effective tax rate for the quarter was 26.3%, compared with 24.9% a year ago. On a teb basis, the adjusted effective tax rate for the quarter was 26.3%, compared with 24.7% a year ago.
Adjusted results in this section are non-GAAP and are discussed in the Non-GAAP Measures section on page 33.
2015 Financial Performance Review
The preceding discussions in the MD&A focused on our performance in fiscal 2016. This section summarizes our performance in fiscal 2015 relative to fiscal 2014. As noted on page 26, certain prior year data has been reclassified to conform to the presentation in 2016, including restatements arising from transfers between operating groups. Further information on restatements is provided on page 46.
Net Income
Net income increased $72 million or 2% to $4,405 million in 2015 and EPS increased $0.16 or 2% to $6.57. Adjusted net income excludes acquisition integration costs, the amortization of acquisition-related intangible assets and restructuring costs. Adjusted net income increased $228 million or 5% to $4,681 million and adjusted EPS increased $0.41 or 6% to $7.00, reflecting solid revenue growth. Higher net revenue exceeded incremental costs, contributing to growth in net income. There were higher provisions for credit losses and a slightly higher effective income tax rate.
Return on Equity
Return on equity and adjusted return on equity were 12.5% and 13.3%, respectively, in 2015, compared with 14.0% and 14.4%, respectively, in 2014. ROE declined in 2015 primarily due to growth in common equity exceeding growth in income. There was an increase of $96 million in earnings ($252 million in adjusted earnings) available to common shareholders. Average common shareholders’ equity increased $4.5 billion from 2014 primarily due to the impact of the stronger U.S. dollar on our investments in foreign operations and increased retained earnings.
Revenue
Revenue, net of CCPB, increased $1,417 million or 8% to $18,135 million in 2015. Adjusted revenue excludes a minor adjustment related to BMO Transportation Finance acquisition costs. Adjusted net revenue increased $1,419 million or 8% to $18,137 million. Revenue growth reflects the benefits of our diversified business mix and successful execution against our strategic priorities. The impact of the stronger U.S. dollar increased adjusted net revenue growth by $732 million or 4%. The remaining increase was mainly due to revenue growth in Canadian P&C and Wealth Management.
Insurance Claims, Commissions and Changes in Policy Benefit Liabilities
Insurance claims, commissions and changes in policy benefit liabilities were $1,254 million in 2015, down $251 million from $1,505 million in 2014 when lower long-term interest rates increased the fair value of policy benefit liabilities to a greater extent, partially offset by increased reinsurance liabilities and the impact of growth in the underlying business. The decline was largely offset in revenue.
Provisions for Credit Losses
The provision for credit losses was $612 million in 2015, up from $561 million in 2014, primarily due to lower recoveries in Corporate Services and higher provisions in BMO Capital Markets, partially offset by reduced provisions in the P&C businesses.
Non-Interest Expense
Non-interest expense increased $1,261 million or 12% to $12,182 million in 2015. Adjusted non-interest expense excludes acquisition integration costs, the amortization of acquisition-related intangible assets and restructuring costs. Adjusted non-interest expense increased $1,058 million or 10% to $11,819 million, of which approximately 6% was due to the stronger U.S. dollar, 2% was due to the inclusion of F&C results for two additional quarters relative to the prior year, and 2% was due to business growth.
Provision for Income Taxes
The provision for income taxes was $936 million in 2015, compared with $903 million in 2014. The reported effective tax rate in 2015 was 17.5%, compared with 17.2% in 2014. The adjusted provision for income taxes was $1,025 million in 2015(1), compared with $943 million in 2014. The adjusted effective tax rate in 2015 was 18.0%, compared with 17.5% in 2014. The change in the tax rate from year to year is attributable to a lower proportion of income from lower tax rate jurisdictions.
| (1) | The adjusted rate is completed using adjusted net income rather than net income in the determination of income subject to tax. |
| | |
| 64 | | BMO Financial Group 199th Annual Report 2016 |
Canadian P&C
Reported net income was $2,105 million in 2015, up $90 million or 4% from 2014, with improved performance in the second half of the year. Adjusted net income, which excludes the amortization of acquisition-related intangible assets, was $2,109 million, up $90 million or 4%. Revenue increased $234 million or 4% to $6,640 million as a result of higher balances and increased non-interest revenue, with a stable net interest margin. Revenue increased $177 million or 4% in our personal banking business as a result of higher balances and increased non-interest revenue. In our commercial banking business, revenue increased $57 million or 3%, mainly driven by higher balances. Our credit performance improved in 2015, as provisions for credit losses declined $32 million or 6% to $496 million, due to lower provisions in both the consumer and commercial portfolios. Non-interest expense was $3,339 million, up $158 million or 5% from 2014, primarily due to continued investment in the business, net of expense management, and higher costs associated with a changing business and regulatory environment.
U.S. P&C
Reported net income of $829 million increased $173 million or 26% from 2014. Adjusted net income, which excludes the amortization of acquisition-related intangible assets, was $882 million, up $174 million or 25%. Revenue grew $459 million or 15% to $3,616 million. All amounts in the remainder of this section are on a U.S. dollar basis.
Reported net income of $661 million increased $62 million or 10% from 2014. Adjusted net income, which excludes the amortization of acquisition-related intangible assets, of $703 million increased $57 million or 9%. Revenue remained stable at $2,881 million as higher balances and increased mortgage banking revenue offset the effects of lower net interest margin. In our commercial banking business, revenue increased $9 million or 1% to $1,462 million, reflecting strong loan volume growth, primarily in the commercial and industrial loan portfolio, partially offset by the impact of spread compression due to a competitive environment. In our personal banking business, revenue decreased by $14 million or 1% to $1,419 million, primarily due to declines in loan balances and spreads and reduced fees from deposits and credit cards, partially offset by increased mortgage banking revenue and chequing balance growth. Provisions for credit losses of $95 million in 2015 improved by $67 million or 41%, primarily due to lower provisions in both the consumer and commercial loan portfolios. Non-interest expense of $1,904 million remained stable. Adjusted non-interest expense of $1,849 million increased $14 million, or less than 1%, due to a continued focus on expense management while making selective investments in the business.
Wealth Management
Reported net income was $850 million in 2015, up $70 million or 9% from 2014. Adjusted net income, which excludes the amortization of acquisition-related intangible assets and acquisition integration costs, was $955 million, up $112 million or 13%. Traditional wealth reported net income was $610 million, up $116 million or 23%. Adjusted net income in traditional wealth was $715 million, up $158 million or 28% from a year ago, due to growth from the businesses, a gain on sale of BMO’s U.S. retirement services business, as well as the benefit from the full year contribution from the acquired F&C business. Net income in insurance was $240 million compared to $286 million a year ago, primarily due to higher taxes in the current year and higher actuarial benefits in the prior year. Revenue, net of CCPB, was $4,509 million, up $676 million or 18% from the prior year. Revenue in traditional wealth was $4,057 million, up $687 million or 20% primarily due to growth in client assets, including the full year contribution from the acquired F&C business. Insurance revenue, net of CCPB, was $452 million compared to $463 million a year ago, due to higher actuarial benefits in the prior year. The stronger U.S. dollar increased revenue, net of CCPB, by $133 million or 4%. Non-interest expense was $3,357 million, up $517 million or 18%. Adjusted non-interest expense was $3,223 million, up $465 million or 17%, of which 4% was due to the stronger U.S. dollar, 9% was due to the inclusion of F&C results for two additional quarters and 4% was primarily due to higher revenue-based costs.
BMO Capital Markets
Reported net income decreased $45 million or 4% to $1,029 million in 2015, as the benefit of the stronger U.S. dollar was more than offset by higher provisions compared to net recoveries in the prior year. Adjusted net income, which excludes the amortization of acquisition-related intangible assets, was $1,031 million, a decrease of $44 million or 4%. Revenue increased $153 million or 4% to $3,867 million. Excluding the impact of the stronger U.S. dollar, revenue was stable year over year as higher trading revenues, including the prior year unfavourable impact of implementing a funding valuation adjustment, and higher lending revenues were offset by lower investment banking fees and reduced securities gains. Trading Products revenue increased $155 million or 7%, and increased 3% excluding the impact of the stronger U.S. dollar, reflecting higher trading revenues related to client trading activity. Investment and Corporate Banking revenue was consistent with the prior year, and decreased 5% excluding the impact of the stronger U.S. dollar as growth in lending revenue was more than offset by lower investment banking client activity and reduced securities gains. Provision for credit losses was $44 million higher due to higher provisions compared with net recoveries in the prior year. Non-interest expense increased $134 million or 6% to $2,483 million, and decreased $10 million excluding the impact of the stronger U.S. dollar, primarily due to lower employee-related expenses, partially offset by higher support costs related to a changing business and regulatory environment.
Corporate Services
Corporate Services reported net loss was $408 million in 2015, compared with a reported net loss of $192 million in 2014. Reported results in 2015 included certain acquisition integration costs and a $106 million charge, primarily due to restructuring. The adjusted net loss was $296 million, compared with an adjusted net loss of $192 million in 2014. Excluding the impact of the group teb adjustment on revenue and taxes, results were lower mainly due to lower purchased loan portfolio revenues and lower credit recoveries. Adjusted non-interest expense was down modestly.
Adjusted results in this section are non-GAAP and are discussed in the Non-GAAP Measures section on page 33.
| | | | |
| BMO Financial Group 199th Annual Report 2016 | | | 65 | |
MANAGEMENT’S DISCUSSION AND ANALYSIS
Summary Quarterly Earnings Trends
BMO’s results and performance measures for the past eight quarters are outlined on page 67.
Periodically, certain business lines and units within the business lines are transferred between client operating groups to more closely align BMO’s organizational structure and its strategic priorities. Comparative figures have been restated to conform to the current presentation.
Over the past two years, we have remained focused on executing our strategic priorities. Economic conditions have remained challenging in Canada, hampered by weak investment in the oil industry and a slower U.S. economy. Growth in the U.S. economy was healthy in 2015 but slowed in 2016, reflecting low levels of exports, a reduction in oil production and decreased agriculture sector spending.
Seasonality
BMO’s quarterly earnings, revenue and expense are modestly affected by seasonal factors. Since our second fiscal quarter has 89 days (90 in a leap year) and other quarters have 92 days, second-quarter results are lower relative to other quarters because there are fewer calendar days, and thus fewer business days. The fourth quarter can have a higher level of expenses. The December holiday season also contributes to a slowdown in some activities.
Canadian P&C
Canadian P&C delivered solid net income performance in the second half of 2015, continuing into 2016. Despite higher provisions for credit losses in 2016, up from below-trend provisions in the second half of 2015, year-over-year net income growth and operating leverage were both positive in each quarter of 2016. Revenue growth has been driven by higher balances and non-interest revenue, with relatively stable net interest margins. Expenses have grown as a result of continued investment in the business, net of an ongoing focus on expense management.
U.S. P&C
Results improved in 2015 as a result of balance sheet growth, and disciplined expense management in a challenging interest rate environment. Growth in 2016 largely reflected the results of the acquired BMO Transportation Finance business and also organic revenue growth and good expense management, partially offset by higher credit losses. The U.S. dollar generally has strengthened significantly since the beginning of 2015, contributing to growth in the Canadian dollar equivalents of U.S. P&C’s results.
Wealth Management
Wealth Management’s results in 2015 reflected good momentum. Results in 2016 were impacted by lower Canadian equity markets on average in 2016 compared to the prior year, despite markets slowly rebounding in the second half of the year. The fourth quarter of 2015 benefited from a gain on the sale of our U.S. retirement services business, the second quarter of 2016 included an investment write-down and the fourth quarter of 2016 included a gain on sale of an equity investment. Quarterly results in the insurance businesses have been subject to variability, resulting primarily from impacts of interest rates and equity markets, as well as methodology and actuarial assumptions changes.
BMO Capital Markets
BMO Capital Markets’ results have reflected good momentum, from softer results in the first quarter of 2015 to strong results in 2016. Strong overall performance has been driven by steady revenue growth in our Trading Products business, strong growth in the second half of 2016 in our Investment and Corporate Banking business and a tightened expense and efficiency focus, resulting in positive operating leverage in each of the five most recent quarters.
Provisions for Credit Losses
BMO’s PCL measured as a percentage of loans and acceptances has generally been relatively stable, with some quarter-to-quarter variability, and decreased in the fourth quarter of 2016 due to lower new specific provisions and higher reversals and recoveries, after experiencing increases in the second and third quarters of 2016 primarily due to higher oil and gas provisions.
Corporate Services
Reported and adjusted results can vary from quarter to quarter. Reported results in 2015 and 2016 each included a restructuring charge and acquisition integration costs. The reported results in 2016 also included a cumulative accounting adjustment related to foreign currency translation that largely impacted prior periods. Results are impacted in part by the variability associated with benefits from the purchased loan portfolio. Beginning in the first quarter of 2016, the reduction in the credit mark that is reflected in net interest income and the provision for credit losses on the purchased performing portfolio are being recognized in U.S. P&C, consistent with the accounting for the acquisition of BMO Transportation Finance and given that these amounts have reduced substantially in size. Results for prior periods have not been reclassified.
Foreign Exchange
The U.S. dollar strengthened significantly in 2015 with further modest strengthening in 2016, despite a slight weakening in the second quarters of 2015 and 2016. A stronger U.S. dollar increases the translated value of our U.S.-dollar-denominated revenues, expenses, provisions for (recoveries of) credit losses, income taxes and net income. It also reduces our return on equity.
Provision for Income Taxes
The effective income tax rate can vary, as it depends on the timing of resolution of certain tax matters, recoveries of prior periods’ income taxes and the relative proportion of earnings attributable to the different jurisdictions in which we operate.
This Summary Quarterly Earnings Trends section contains forward-looking statements. Please see the Caution Regarding Forward-Looking Statements.
In the opinion of Bank of Montreal management, information that is derived from unaudited financial information, including information as at and for the interim periods, includes all adjustments necessary for a fair presentation of such information. All such adjustments are of a normal and recurring nature. Financial ratios for interim periods are stated on an annualized basis, where appropriate, and the ratios, as well as interim operating results, are not necessarily indicative of actual results for the full fiscal year.
Adjusted results in this section are non-GAAP and are discussed in the Non-GAAP Measures section on page 33.
| | |
| 66 | | BMO Financial Group 199th Annual Report 2016 |
Summarized Statement of Income and Quarterly Financial Measures
| | | | | | | | | | | | | | | | | | | | | | | | | | | | | | | | |
| (Canadian $ in millions, except as noted) | | Q4-2016 | | | Q3-2016 | | | Q2-2016 | | | Q1-2016 | | | Q4-2015 | | | Q3-2015 | | | Q2-2015 | | | Q1-2015 | |
Net interest income | | | 2,498 | | | | 2,474 | | | | 2,420 | | | | 2,480 | | | | 2,311 | | | | 2,227 | | | | 2,060 | | | | 2,165 | |
Non-interest revenue | | | 2,780 | | | | 3,159 | | | | 2,681 | | | | 2,595 | | | | 2,671 | | | | 2,599 | | | | 2,466 | | | | 2,890 | |
Total revenue | | | 5,278 | | | | 5,633 | | | | 5,101 | | | | 5,075 | | | | 4,982 | | | | 4,826 | | | | 4,526 | | | | 5,055 | |
Insurance claims, commissions and changes in policy benefit liabilities (CCPB) | | | 79 | | | | 691 | | | | 407 | | | | 366 | | | | 265 | | | | 218 | | | | 24 | | | | 747 | |
Revenue, net of CCPB | | | 5,199 | | | | 4,942 | | | | 4,694 | | | | 4,709 | | | | 4,717 | | | | 4,608 | | | | 4,502 | | | | 4,308 | |
Provision for credit losses – specific (see below) | | | 174 | | | | 257 | | | | 201 | | | | 183 | | | | 128 | | | | 160 | | | | 161 | | | | 163 | |
Provision for (recovery of) credit losses – collective | | | – | | | | – | | | | – | | | | – | | | | – | | | | – | | | | – | | | | – | |
Non-interest expense | | | 3,323 | | | | 3,092 | | | | 3,312 | | | | 3,270 | | | | 3,093 | | | | 2,971 | | | | 3,112 | | | | 3,006 | |
Income before provision for income taxes | | | 1,702 | | | | 1,593 | | | | 1,181 | | | | 1,256 | | | | 1,496 | | | | 1,477 | | | | 1,229 | | | | 1,139 | |
Provision for income taxes | | | 357 | | | | 348 | | | | 208 | | | | 188 | | | | 282 | | | | 285 | | | | 230 | | | | 139 | |
Reported net income (see below) | | | 1,345 | | | | 1,245 | | | | 973 | | | | 1,068 | | | | 1,214 | | | | 1,192 | | | | 999 | | | | 1,000 | |
Acquisition integration costs (1) | | | 21 | | | | 19 | | | | 16 | | | | 15 | | | | 17 | | | | 6 | | | | 10 | | | | 10 | |
Amortization of acquisition-related intangible assets (2) | | | 29 | | | | 31 | | | | 31 | | | | 33 | | | | 33 | | | | 32 | | | | 31 | | | | 31 | |
Cumulative accounting adjustment (3) | | | – | | | | – | | | | – | | | | 62 | | | | – | | | | – | | | | – | | | | – | |
Restructuring costs (4) | | | – | | | | – | | | | 132 | | | | – | | | | – | | | | – | | | | 106 | | | | – | |
Adjusted net income (see below) | | | 1,395 | | | | 1,295 | | | | 1,152 | | | | 1,178 | | | | 1,264 | | | | 1,230 | | | | 1,146 | | | | 1,041 | |
Operating group reported net income | | | | | | | | | | | | | | | | | | | | | | | | | | | | | | | | |
Canadian P&C reported net income | | | 592 | | | | 561 | | | | 525 | | | | 529 | | | | 561 | | | | 556 | | | | 485 | | | | 503 | |
Amortization of acquisition-related intangible assets (2) | | | – | | | | 1 | | | | – | | | | 1 | | | | 1 | | | | 1 | | | | 1 | | | | 1 | |
Canadian P&C adjusted net income | | | 592 | | | | 562 | | | | 525 | | | | 530 | | | | 562 | | | | 557 | | | | 486 | | | | 504 | |
U.S. P&C reported net income | | | 286 | | | | 277 | | | | 267 | | | | 251 | | | | 208 | | | | 222 | | | | 207 | | | | 192 | |
Amortization of acquisition-related intangible assets (2) | | | 13 | | | | 12 | | | | 12 | | | | 13 | | | | 14 | | | | 13 | | | | 13 | | | | 13 | |
U.S. P&C adjusted net income | | | 299 | | | | 289 | | | | 279 | | | | 264 | | | | 222 | | | | 235 | | | | 220 | | | | 205 | |
Wealth Management reported net income | | | 279 | | | | 201 | | | | 134 | | | | 148 | | | | 243 | | | | 210 | | | | 238 | | | | 159 | |
Acquisition integration costs (1) | | | 7 | | | | 9 | | | | 5 | | | | 9 | | | | 11 | | | | 6 | | | | 10 | | | | 10 | |
Amortization of acquisition-related intangible assets (2) | | | 16 | | | | 17 | | | | 19 | | | | 19 | | | | 17 | | | | 17 | | | | 17 | | | | 17 | |
Wealth Management adjusted net income | | | 302 | | | | 227 | | | | 158 | | | | 176 | | | | 271 | | | | 233 | | | | 265 | | | | 186 | |
BMO Capital Markets reported net income | | | 396 | | | | 321 | | | | 291 | | | | 260 | | | | 241 | | | | 272 | | | | 296 | | | | 220 | |
Amortization of acquisition-related intangible assets (2) | | | – | | | | 1 | | | | – | | | | – | | | | 1 | | | | 1 | | | | – | | | | – | |
BMO Capital Markets adjusted net income | | | 396 | | | | 322 | | | | 291 | | | | 260 | | | | 242 | | | | 273 | | | | 296 | | | | 220 | |
Corporate Services reported net income | | | (208 | ) | | | (115 | ) | | | (244 | ) | | | (120 | ) | | | (39 | ) | | | (68 | ) | | | (227 | ) | | | (74 | ) |
Acquisition integration costs (1) | | | 14 | | | | 10 | | | | 11 | | | | 6 | | | | 6 | | | | – | | | | – | | | | – | |
Cumulative accounting adjustment (3) | | | – | | | | – | | | | – | | | | 62 | | | | – | | | | – | | | | – | | | | – | |
Restructuring costs (4) | | | | | | | | | | | 132 | | | | – | | | | – | | | | – | | | | 106 | | | | – | |
Corporate Services adjusted net income | | | (194 | ) | | | (105 | ) | | | (101 | ) | | | (52 | ) | | | (33 | ) | | | (68 | ) | | | (121 | ) | | | (74 | ) |
Information per Common Share($) | | | | | | | | | | | | | | | | | | | | | | | | | | | | | | | | |
Dividends declared | | | 0.86 | | | | 0.86 | | | | 0.84 | | | | 0.84 | | | | 0.82 | | | | 0.82 | | | | 0.80 | | | | 0.80 | |
Basic earnings per share | | | 2.03 | | | | 1.87 | | | | 1.46 | | | | 1.59 | | | | 1.83 | | | | 1.81 | | | | 1.49 | | | | 1.47 | |
Diluted earnings per share | | | 2.02 | | | | 1.86 | | | | 1.45 | | | | 1.58 | | | | 1.83 | | | | 1.80 | | | | 1.49 | | | | 1.46 | |
Adjusted diluted earnings per share | | | 2.10 | | | | 1.94 | | | | 1.73 | | | | 1.75 | | | | 1.90 | | | | 1.86 | | | | 1.71 | | | | 1.53 | |
Book value | | | 59.56 | | | | 58.06 | | | | 55.57 | | | | 59.61 | | | | 56.31 | | | | 55.36 | | | | 51.65 | | | | 52.98 | |
Market price | | | | | | | | | | | | | | | | | | | | | | | | | | | | | | | | |
High | | | 87.92 | | | | 85.50 | | | | 82.56 | | | | 80.05 | | | | 78.50 | | | | 79.43 | | | | 80.76 | | | | 84.39 | |
Low | | | 81.62 | | | | 79.82 | | | | 68.65 | | | | 69.39 | | | | 64.01 | | | | 71.27 | | | | 73.12 | | | | 72.87 | |
Close | | | 85.36 | | | | 83.70 | | | | 81.74 | | | | 75.22 | | | | 76.04 | | | | 72.98 | | | | 78.82 | | | | 72.93 | |
Financial Measures(%) | | | | | | | | | | | | | | | | | | | | | | | | | | | | | | | | |
Dividend yield | | | 4.0 | | | | 4.1 | | | | 4.1 | | | | 4.5 | | | | 4.3 | | | | 4.5 | | | | 4.1 | | | | 4.4 | |
Return on equity | | | 13.8 | | | | 13.0 | | | | 10.1 | | | | 10.9 | | | | 12.9 | | | | 13.6 | | | | 11.4 | | | | 11.8 | |
Adjusted return on equity | | | 14.4 | | | | 13.5 | | | | 12.1 | | | | 12.1 | | | | 13.5 | | | | 14.0 | | | | 13.2 | | | | 12.3 | |
Net interest margin on average earning assets | | | 1.57 | | | | 1.58 | | | | 1.61 | | | | 1.58 | | | | 1.53 | | | | 1.52 | | | | 1.48 | | | | 1.51 | |
Efficiency ratio, net of CCPB | | | 63.9 | | | | 62.6 | | | | 70.6 | | | | 69.4 | | | | 65.6 | | | | 64.5 | | | | 69.1 | | | | 69.8 | |
Adjusted efficiency ratio | | | 61.7 | | | | 53.7 | | | | 60.0 | | | | 62.1 | | | | 60.8 | | | | 60.5 | | | | 64.3 | | | | 58.4 | |
Adjusted efficiency ratio, net of CCPB | | | 62.6 | | | | 61.2 | | | | 65.2 | | | | 66.8 | | | | 64.2 | | | | 63.4 | | | | 64.7 | | | | 68.5 | |
Operating leverage, net of CCPB | | | 2.8 | | | | 3.2 | | | | (2.2 | ) | | | 0.5 | | | | 1.6 | | | | 1.5 | | | | (8.5 | ) | | | (7.5 | ) |
Adjusted operating leverage, net of CCPB | | | 2.9 | | | | 3.8 | | | | (0.8 | ) | | | 2.8 | | | | 1.8 | | | | 1.4 | | | | (2.0 | ) | | | (6.8 | ) |
PCL as a % of average net loans and acceptances | | | 0.19 | | | | 0.29 | | | | 0.23 | | | | 0.21 | | | | 0.15 | | | | 0.20 | | | | 0.20 | | | | 0.21 | |
Effective tax rate | | | 21.0 | | | | 21.9 | | | | 17.6 | | | | 15.0 | | | | 18.8 | | | | 19.3 | | | | 18.8 | | | | 12.2 | |
Adjusted effective tax rate | | | 21.2 | | | | 22.0 | | | | 19.6 | | | | 16.2 | | | | 18.9 | | | | 19.4 | | | | 19.8 | | | | 12.6 | |
Canadian/U.S. dollar as at exchange rate ($) | | | 1.3411 | | | | 1.3056 | | | | 1.2548 | | | | 1.4006 | | | | 1.3075 | | | | 1.3080 | | | | 1.2064 | | | | 1.2711 | |
Canadian/U.S. dollar average exchange rate ($) | | | 1.3216 | | | | 1.3029 | | | | 1.3016 | | | | 1.3737 | | | | 1.3191 | | | | 1.2671 | | | | 1.2412 | | | | 1.1923 | |
Cash and securities-to-total assets | | | 27.1 | | | | 27.3 | | | | 26.7 | | | | 26.4 | | | | 27.8 | | | | 29.3 | | | | 30.0 | | | | 30.1 | |
Capital Ratios(%) (5) | | | | | | | | | | | | | | | | | | | | | | | | | | | | | | | | |
Common Equity Tier 1 (CET1) Ratio | | | 10.1 | | | | 10.0 | | | | 9.7 | | | | 10.0 | | | | 10.7 | | | | 10.4 | | | | 10.2 | | | | 10.1 | |
Tier 1 Capital Ratio | | | 11.6 | | | | 11.2 | | | | 11.0 | | | | 11.3 | | | | 12.3 | | | | 11.7 | | | | 11.4 | | | | 11.4 | |
Total Capital Ratio | | | 13.6 | | | | 13.3 | | | | 13.1 | | | | 13.4 | | | | 14.4 | | | | 13.7 | | | | 13.5 | | | | 13.4 | |
Leverage Ratio | | | 4.2 | | | | 4.0 | | | | 3.9 | | | | 4.0 | | | | 4.2 | | | | 3.9 | | | | 3.8 | | | | 3.8 | |
| | (1) | Acquisition integration costs before tax are included in non-interest expense. Wealth Management amounts of: $10 million in Q4-2016; $10 million in Q3-2016; $6 million in Q2-2016; $12 million in Q1-2016; $13 million in Q4-2015; $9 million in Q3-2015; $11 million in Q2-2015 and $13 million in Q1-2015. Corporate Services amounts of: $21 million in Q4-2016; $17 million in Q3-2016; $18 million in Q2-2016; $10 million in Q1-2016; $7 million in Q4-2015, and $nil in each of Q3-2015, Q2-2015 and Q1-2015. |
| | (2) | Amortization of acquisition-related intangible assets was charged to the non-interest expense of the operating groups. Canadian P&C amounts of: $1 million in Q4-2016; $1 million in Q3-2016; $nil in Q2-2016; $1 million in Q1-2016 and $2 million in Q4-2015; and $1 million in each of Q3-2015, Q2-2015 and Q1-2015. US P&C amounts of: $17 million in Q4-2016; $16 million in Q3-2016; $17 million in Q2-2016; $18 million in Q1-2016; $18 million in Q4-2015; $16 million in Q3-2015; and $17 million in each of Q2-2015 and Q1-2015. BMO Wealth Management amounts of: $19 million in Q4-2016; $22 million in Q3-2016; $23 million in Q2-2016; $24 million in Q1-2016; and $22 million in each of Q4-2015, Q3-2015, Q2-2015 and Q1-2015. BMO Capital Markets amounts of: $nil in Q4-2016; $1 million in Q3-2016; $nil in each of Q2-2016 and Q1-2016; $1 million in each of Q4-2015 and Q3-2015; and $nil in each of Q2-2015 and Q1-2015. |
| | (3) | Cumulative accounting adjustment recognized in other non-interest revenue related to foreign currency translation that largely impacted prior periods. |
| | (4) | Restructuring charges before tax amounts included in non-interest expense in Corporate Services of $188 million in Q2-2016 and $149 million in Q2-2015. |
| | (5) | Comparative figures are as amended for Q1-2016, Q2-2016 and Q3-2016 capital ratios, other than the Leverage Ratio. |
Adjusted results in this table are non-GAAP and are discussed in the Non-GAAP Measures section on page 33.
| | | | |
| BMO Financial Group 199th Annual Report 2016 | | | 67 | |
MANAGEMENT’S DISCUSSION AND ANALYSIS
Financial Condition Review
Summary Balance Sheet
| | | | | | | | | | | | | | | | | | | | |
(Canadian $ in millions) As at October 31 | | 2016 | | | 2015 | | | 2014 | | | 2013 | | | 2012 | |
Assets | | | | | | | | | | | | | | | | | | | | |
Cash and interest bearing deposits with banks | | | 36,102 | | | | 47,677 | | | | 34,496 | | | | 32,607 | | | | 26,256 | |
Securities | | | 149,985 | | | | 130,918 | | | | 143,319 | | | | 135,800 | | | | 129,441 | |
Securities borrowed or purchased under resale agreements | | | 66,646 | | | | 68,066 | | | | 53,555 | | | | 39,799 | | | | 47,011 | |
Net loans | | | 358,730 | | | | 322,717 | | | | 292,160 | | | | 270,822 | | | | 245,827 | |
Other assets | | | 76,472 | | | | 72,503 | | | | 65,129 | | | | 58,016 | | | | 76,149 | |
Total assets | | | 687,935 | | | | 641,881 | | | | 588,659 | | | | 537,044 | | | | 524,684 | |
Liabilities and Shareholders’ Equity | | | | | | | | | | | | | | | | | | | | |
Deposits | | | 473,372 | | | | 438,169 | | | | 393,088 | | | | 368,369 | | | | 325,235 | |
Other liabilities | | | 167,796 | | | | 159,383 | | | | 155,254 | | | | 133,500 | | | | 165,813 | |
Subordinated debt | | | 4,439 | | | | 4,416 | | | | 4,913 | | | | 3,996 | | | | 4,093 | |
Shareholders’ equity | | | 42,304 | | | | 39,422 | | | | 34,313 | | | | 30,107 | | | | 28,108 | |
Non-controlling interest in subsidiaries | | | 24 | | | | 491 | | | | 1,091 | | | | 1,072 | | | | 1,435 | |
Total liabilities and shareholders’ equity | | | 687,935 | | | | 641,881 | | | | 588,659 | | | | 537,044 | | | | 524,684 | |
Overview
Total assets increased $46.1 billion from the prior year to $687.9 billion, including a $7.3 billion increase due to the stronger U.S. dollar, excluding the impact on derivative financial assets. Total liabilities increased $43.6 billion from October 31, 2015, including a $7.0 billion increase due to the stronger U.S. dollar, excluding the impact on derivative financial liabilities. Shareholders’ equity increased $2.9 billion from October 31, 2015.
Cash and Interest Bearing Deposits with Banks
Cash and interest bearing deposits with banks decreased $11.6 billion due to reduced balances held with central banks from a high level at the end of the prior year.
Securities
| | | | | | | | | | | | | | | | | | | | |
(Canadian $ in millions) As at October 31 | | 2016 | | | 2015 | | | 2014 | | | 2013 | | | 2012 | |
Trading | | | 84,458 | | | | 72,460 | | | | 85,022 | | | | 75,159 | | | | 70,109 | |
Available-for-sale | | | 55,663 | | | | 48,006 | | | | 46,966 | | | | 53,710 | | | | 57,340 | |
Held-to-maturity | | | 8,965 | | | | 9,432 | | | | 10,344 | | | | 6,032 | | | | 875 | |
Other | | | 899 | | | | 1,020 | | | | 987 | | | | 899 | | | | 1,117 | |
Total securities | | | 149,985 | | | | 130,918 | | | | 143,319 | | | | 135,800 | | | | 129,441 | |
Securities increased $19.1 billion, primarily reflecting increases in trading securities in BMO Capital Markets, higher available-for-sale securities related mainly to treasury activities, and a $1.5 billion impact from the stronger U.S. dollar.
Securities Borrowed or Purchased Under Resale Agreements
Securities borrowed or purchased under resale agreements decreased $1.4 billion, driven by client activities in BMO Capital Markets.
Net Loans
| | | | | | | | | | | | | | | | | | | | |
(Canadian $ in millions) As at October 31 | | 2016 | | | 2015 | | | 2014 | | | 2013 | | | 2012 | |
Residential mortgages | | | 112,277 | | | | 105,918 | | | | 101,013 | | | | 96,392 | | | | 84,211 | |
Non-residential mortgages | | | 11,376 | | | | 10,981 | | | | 10,738 | | | | 11,745 | | | | 12,939 | |
Consumer instalment and other personal | | | 64,680 | | | | 65,598 | | | | 64,143 | | | | 63,640 | | | | 61,436 | |
Credit cards | | | 8,101 | | | | 7,980 | | | | 7,972 | | | | 7,870 | | | | 7,814 | |
Businesses and governments | | | 164,221 | | | | 134,095 | | | | 110,028 | | | | 92,840 | | | | 81,133 | |
Gross loans | | | 360,655 | | | | 324,572 | | | | 293,894 | | | | 272,487 | | | | 247,533 | |
Allowance for credit losses | | | (1,925 | ) | | | (1,855 | ) | | | (1,734 | ) | | | (1,665 | ) | | | (1,706 | ) |
Total net loans | | | 358,730 | | | | 322,717 | | | | 292,160 | | | | 270,822 | | | | 245,827 | |
Net loans increased $36.0 billion, including a $3.5 billion increase due to the stronger U.S. dollar. The remainder of the increase was primarily due to a $27.3 billion increase in businesses and governments loans across all operating groups, including the acquired BMO Transportation Finance business, which added $10.6 billion, as well as a $6.1 billion increase in residential mortgages, primarily in Canadian P&C.
Table 7 on page 128 provides a comparative summary of loans by geographic location and product. Table 9 on page 129 provides a comparative summary of net loans in Canada by province and industry. Loan quality is discussed on pages 90 and 91 and further details on loans are provided in Notes 4, 6 and 25 on pages 153, 159 and 195 of the consolidated financial statements.
| | |
| 68 | | BMO Financial Group 199th Annual Report 2016 |
Other Assets
Other assets includes derivative financial assets, customers’ liability under acceptances, premises and equipment, goodwill and intangible assets, current and deferred tax assets, accounts receivable and prepaid expenses. The balance increased $4.0 billion, primarily due to a $1.7 billion increase in customers’ liability under acceptances and a $0.9 billion increase in derivative financial assets. Derivative financial assets increased $0.9 billion, primarily due to an increase in the fair value of foreign exchange contracts and the strengthening U.S. dollar, partially offset by a decrease in the fair value of interest rate contracts. Further details on derivative financial assets are provided in Note 8 on page 161 of the consolidated financial statements.
Deposits
| | | | | | | | | | | | | | | | | | | | |
(Canadian $ in millions) As at October 31 | | 2016 | | | 2015 | | | 2014 | | | 2013 | | | 2012 | |
Banks | | | 34,271 | | | | 32,609 | | | | 21,282 | | | | 20,591 | | | | 18,102 | |
Businesses and governments | | | 276,214 | | | | 258,144 | | | | 236,100 | | | | 222,346 | | | | 187,996 | |
Individuals | | | 162,887 | | | | 147,416 | | | | 135,706 | | | | 125,432 | | | | 119,137 | |
Total deposits | | | 473,372 | | | | 438,169 | | | | 393,088 | | | | 368,369 | | | | 325,235 | |
Certain comparative figures have been reclassified to conform with the current year’s presentation.
Deposits increased $35.2 billion, including an increase of $5.8 billion due to the stronger U.S. dollar. The remainder of the increase reflects higher levels of wholesale and customer deposits, largely driven by a $14.2 billion increase in deposits by business and governments, a $14.1 billion increase in deposits by individuals and a $1.1 billion increase in deposits by banks. The increase in total deposits of $35.2 billion is in line with the total loans increase of $36.0 billion. Further details on the composition of deposits are provided in Note 13 on page 171 of the consolidated financial statements and in the Liquidity and Funding Risk section on page 100.
Other Liabilities
Other liabilities includes derivative financial liabilities, securities lent or sold under repurchase agreements, securities sold but not yet purchased, acceptances, securitization and structured entities liabilities, accounts payable and other accrued expenses. The balance increased $8.4 billion, primarily due to a $3.9 billion increase in securities sold but not yet purchased and a $3.8 billion increase in treasury-related activities, partially offset by a $4.4 billion decrease in derivative financial liabilities. Derivative financial liabilities decreased $4.4 billion due to the decline in the fair value of foreign exchange, commodity and interest rate contracts. Further details on the composition of other liabilities are provided in Note 14 on page 172 of the consolidated financial statements.
Subordinated Debt
Subordinated debt increased $23 million. Further details on the composition of subordinated debt are provided in Note 15 on page 173 of the consolidated financial statements.
Equity
| | | | | | | | | | | | | | | | | | | | |
(Canadian $ in millions) As at October 31 | | 2016 | | | 2015 | | | 2014 | | | 2013 | | | 2012 | |
Share capital | | | | | | | | | | | | | | | | | | | | |
Preferred shares | | | 3,840 | | | | 3,240 | | | | 3,040 | | | | 2,265 | | | | 2,465 | |
Common shares | | | 12,539 | | | | 12,313 | | | | 12,357 | | | | 12,003 | | | | 11,957 | |
Contributed surplus | | | 294 | | | | 299 | | | | 304 | | | | 315 | | | | 213 | |
Retained earnings | | | 21,205 | | | | 18,930 | | | | 17,237 | | | | 15,087 | | | | 13,456 | |
Accumulated other comprehensive income | | | 4,426 | | | | 4,640 | | | | 1,375 | | | | 437 | | | | 17 | |
Total shareholders’ equity | | | 42,304 | | | | 39,422 | | | | 34,313 | | | | 30,107 | | | | 28,108 | |
Non-controlling interest in subsidiaries | | | 24 | | | | 491 | | | | 1,091 | | | | 1,072 | | | | 1,435 | |
Total equity | | | 42,328 | | | | 39,913 | | | | 35,404 | | | | 31,179 | | | | 29,543 | |
Total equity increased $2.4 billion. Total shareholders’ equity increased $2.9 billion due to a $2.3 billion increase in retained earnings and a $0.6 billion increase in preferred shares. Non-controlling interest in subsidiaries decreased $0.5 billion due to the redemption of $450 million of Capital Trust Securities.
The increase in share capital is driven by the issuance of preferred shares, as well as the issuance of common shares under the Shareholder Dividend Reinvestment and Share Purchase Plan (DRIP) and Stock Option Plan. BMO’s DRIP is described in the Enterprise-Wide Capital Management section that follows. Our Consolidated Statement of Changes in Equity on page 142 provides a summary of items that increase or reduce shareholders’ equity, while Note 16 on page 174 of the consolidated financial statements provides details on the components of and changes in share capital. Details on our enterprise-wide capital management practices and strategies can be found on the following page.
| | | | |
| BMO Financial Group 199th Annual Report 2016 | | | 69 | |
MANAGEMENT’S DISCUSSION AND ANALYSIS
Enterprise-Wide Capital Management
Capital Management
Objective
BMO is committed to a disciplined approach to capital management that balances the interests and requirements of shareholders, regulators, depositors and rating agencies. Our objective is to maintain a strong capital position in a cost-effective structure that:
| • | | is appropriate given our target regulatory capital ratios and internal assessment of required economic capital; |
| • | | is consistent with our target credit ratings; |
| • | | underpins our operating groups’ business strategies; and |
| • | | supports depositor, investor and regulator confidence, while building long-term shareholder value. |
Capital Management Framework

The principles and key elements of BMO’s capital management framework are outlined in our Capital Management Corporate Policy and in our annual capital plan, which includes the results of our Internal Capital Adequacy Assessment Process (ICAAP).
ICAAP is an integrated process that uses stress testing and other tools to evaluate capital adequacy on both a regulatory and an economic capital basis, and is used to establish capital targets and capital strategies that take into consideration the strategic direction and risk appetite of the enterprise. The capital plan is developed considering the results of our ICAAP and in conjunction with our annual business plan, promoting alignment between our business and risk strategies, regulatory and economic capital requirements and the availability of capital. Enterprise-wide stress testing and scenario analysis are used to assess the impact of various stress conditions on BMO’s risk profile and capital requirements. The framework seeks to ensure that we are adequately capitalized given the risks we take and under stress, and supports the determination of limits, goals and performance measures that are used to manage balance sheet positions, risk levels and capital requirements at both the consolidated entity and operating group levels. Assessments of actual and forecast capital adequacy are compared to the capital plan throughout the year, and our plans are updated as required, based on changes in our business activities, risk profile or operating environment.
BMO uses a combination of regulatory and economic capital to evaluate business performance and considers capital implications in its strategic, tactical and transactional decision-making. By allocating our capital to operating groups, creating and monitoring capital limits and metrics and measuring their performance in relation to such capital allocations, limits and metrics, we seek to optimize our risk-adjusted return to shareholders, while maintaining a well-capitalized position. This approach aims to protect our stakeholders from the risks inherent in our various businesses, while still allowing the flexibility to deploy resources to support the strategic growth activities of our operating groups.
For further discussion of the risks underlying our business activities, refer to the Enterprise-Wide Risk Management section on page 79.
Governance
The Board of Directors, either directly or in conjunction with its Risk Review Committee, provides ultimate oversight and approval of capital management, including our Capital Management Corporate Policy framework, capital plan and capital adequacy assessments. The Board regularly reviews BMO’s capital position and key capital management activities, and the Risk Review Committee reviews the ICAAP-determined capital adequacy assessment results. The Balance Sheet and Capital Management Committee provides senior management oversight, including the review and discussion of significant capital management policies, issues and activities and, along with the Risk Management Committee, the capital required to support the execution of our enterprise-wide strategy. Finance and Risk Management are responsible for the design and implementation of the corporate policies and framework related to capital and risk management and the ICAAP. Corporate Audit Division, as the third line of defence, verifies our adherence to controls and highlights opportunities to strengthen our process.
Regulatory Capital Requirements
Regulatory capital requirements for BMO are determined in accordance with the Capital Adequacy Requirements (CAR) Guideline of the Office of the Superintendent of Financial Institutions Canada (OSFI), which includes a Basel I capital floor. The minimum capital ratios contained in the CAR Guideline are a 4.5% Common Equity Tier 1 (CET1) Ratio, 6% Tier 1 Capital Ratio and 8% Total Capital Ratio, which are calculated using a nine-year transitional phase-out of non-qualifying capital instruments ending in 2022. OSFI has expected banks to attain a target CET1 Ratio of at least 8% (4.5% minimum plus 3.5% Capital Conservation Buffer, including a 1% Domestic Systemically Important Bank(D-SIB) Common Equity Surcharge) since January 31, 2016, also referred to as the“all-in” requirements as, except for the Credit Valuation Adjustment (CVA) capital charge mentioned below, there is no five-year transitional phase-in of regulatory adjustments.
| | |
| 70 | | BMO Financial Group 199th Annual Report 2016 |
The fully implemented 2019 requirements and the OSFI“all-in” capital requirements are summarized in the following table.
| | | | | | | | | | | | | | | | |
| (% of risk-weighted assets) | | Common Equity Tier 1 Ratio (1) | | | Tier 1 Capital Ratio | | | Total Capital Ratio | | | Leverage
Ratio (2) | |
2019 minimum capital requirements | | | 4.5 | | | | 6.0 | | | | 8.0 | | | | 3.0 | |
Plus: Capital Conservation Buffer, including the D-SIB Common Equity Surcharge (1) | | | 3.5 | | | | 3.5 | | | | 3.5 | | | | na | |
OSFI requirements (3) | | | 8.0 | | | | 9.5 | | | | 11.5 | | | | 3.0 | |
| | (1) | The minimum 4.5% CET1 Ratio requirement is augmented by the 3.5% Capital Conservation Buffer which can absorb losses during periods of stress. The Capital Conservation Buffer for BMO includes the addition of the 1% Common Equity Surcharge for D-SIBs. If a bank’s capital ratios fall within the range of this combined buffer, restrictions on discretionary distributions of earnings (such as dividends, equity repurchases and discretionary compensation) would ensue, with the degree of such restrictions varying according to the position of the bank’s ratios within the buffer range. |
| | (2) | A 3% minimum Leverage Ratio has been established by the Basel Committee on Banking Supervision (BCBS). It will be subject to monitoring and analysis during a four-year parallel run test period, which began on January 1, 2013. Depending upon the results of the parallel run testing, there could be subsequent adjustments, which are targeted to be finalized in 2017, with the final Leverage Ratio requirement effective January 1, 2018. |
| | (3) | OSFI’s requirements are the published capital requirements D-SIBs must meet in 2016 to avoid being subject to restrictions on discretionary distributions of earnings. |
na – not applicable
Regulatory Capital Ratios
|
TheCommon Equity Tier 1 Ratio reflects CET1 capital divided by CET1 capital RWA. TheTier 1 Capital Ratio reflects Tier 1 capital divided by Tier 1 capital RWA. TheTotal Capital Ratio reflects Total capital divided by Total capital RWA. TheLeverage Ratio is defined as Tier 1 capital divided by the sum of on-balance sheet items and specified off-balance sheet items, net of specified adjustments. |
Regulatory Capital Elements
Common equity is the most permanent form of capital. CET1 capital is comprised of common shareholders’ equity less deductions for goodwill, intangible assets, defined benefit pension assets, certain deferred tax assets and certain other items. Additional Tier 1 capital primarily consists of preferred shares and innovative hybrid instruments, less certain regulatory deductions. Tier 1 capital is comprised of CET1 capital and Additional Tier 1 capital. Tier 2 capital is primarily comprised of subordinated debentures and may include a portion of the collective and individual allowances for credit losses, less certain regulatory deductions. Total capital includes Tier 1 and Tier 2 capital.
OSFI’s CAR Guideline also requires the implementation of Basel Committee on Banking Supervision (BCBS) guidance on non-viability contingent capital (NVCC). NVCC provisions require the conversion of the capital instruments into a variable number of common shares in the event that OSFI announces that the bank is, or is about to become, non-viable or if a federal or provincial government in Canada publicly announces that the bank has accepted or agreed to accept a capital injection, or equivalent support, to avoid non-viability.
Under OSFI’s CAR Guideline, non-common share capital instruments that do not meet Basel III requirements, including NVCC requirements, are to be grandfathered and phased out over a nine-year period that began on January 1, 2013. OSFI also outlines the requirements for redemption of these regulatory capital instruments due to a regulatory capital event.
Risk-Weighted Assets
Risk-Weighted Assets (RWA) measure a bank’s exposures, weighted for their relative risk and calculated in accordance with OSFI’s regulatory capital rules. RWA is calculated for credit, market (trading) and operational risk categories based on OSFI’s prescribed rules.
BMO primarily uses the Advanced Internal Ratings Based (AIRB) Approach to determine credit RWA in our portfolio. Credit RWA arising from certain Canadian and U.S. portfolios are determined using the Standardized Approach. The AIRB Approach utilizes sophisticated techniques to measure RWA at the exposure level based on sound risk management principles, including estimates of the probability of default, the downturn loss given default and exposure at default risk parameters, term to maturity and asset class type prescribed by the OSFI rules. These risk parameters are determined using historical portfolio data supplemented by benchmarking, and are updated periodically. Validation procedures related to these parameters are in place, and are enhanced periodically to appropriately quantify and differentiate risks so they reflect changes in economic and credit conditions.
BMO’s market risk RWA are primarily determined using the more advanced Internal Models Approach, but the Standardized Approach is used for some exposures.
BMO uses the Advanced Measurement Approach (AMA), a risk-sensitive capital model, along with the Standardized Approach under OSFI rules, to determine capital requirements for operational risk.
For institutions using advanced approaches for credit risk or operational risk, there is a capital floor as prescribed in OSFI’s CAR Guideline. In calculating regulatory capital ratios, there is a requirement to increase RWA when an amount calculated under the Basel I rules (covering both RWA and capital deductions) is higher than a similar calculation under the risk-sensitive Basel III rules. As discussed below, the capital floor was operative for the bank during 2016 and as such, our total RWA reflected its impact.
OSFI advised banks the Credit Valuation Adjustment (CVA) risk capital charge for Canadian banks would be phased in beginning the first quarter of 2014. In 2016, the CVA risk capital charge applicable to CET1 was 64% of the fully implemented charge, and is expected to increase to 72% in 2017.
Capital Regulatory Developments
Capital Requirements
There are a number of regulatory capital changes, some finalized and some under development, which will put upward pressure on the amount of capital we are required to hold over time. The nature of these changes is outlined below.
In December 2015, OSFI advised Canadian banks that it will be increasing the regulatory capital requirements for residential mortgages and home equity lines of credit. The update will be tied to increases in local property prices and/or to house prices that are high relative to borrower incomes. Final changes were released in October 2016 and implemented effective November 1, 2016.
| | | | |
| BMO Financial Group 199th Annual Report 2016 | | | 71 | |
MANAGEMENT’S DISCUSSION AND ANALYSIS
In January 2016, the BCBS issued the final framework for market risk capital requirements, which aims to promote consistent implementation of market risk standards across jurisdictions for implementation in 2019.
In December 2015, the BCBS issued an updated proposal on the Standardized Approach for Credit Risk, which is currently in the consultation phase and expected to be finalized by early 2017. In March 2016, the BCBS issued a consultative document on Constraints on the Use of Internal Model Approaches aimed at reducing complexity, improving comparability and addressing variability in capital requirements for credit risk by placing constraints on the use of advanced approach (AIRB) models. This includes removing the option of a models-based approach for certain exposures, use of “input” floors for certain model parameters, and specifying parameters for some models-based approaches. The document also discusses a potential capital “output” floor based on the new Standardized Approach for Credit Risk. We expect the proposals to be finalized by the BCBS in late 2016 or early 2017.
In March 2016, the BCBS proposed a new approach to the calculation of regulatory operational risk capital requirements, known as the Standardized Measurement Approach (SMA), which will replace AMA. The SMA is expected to be finalized in early 2017. It is less risk-sensitive than the AMA, but is intended to promote comparability of risk-based capital measures as well as reduce model complexity.
In April 2016, the BCBS issued the final standard for Interest Rate Risk in the Banking Book, which included a Pillar 2 supervisory approach, enhanced expectations for management and oversight and new disclosure requirements effective the first quarter of fiscal 2018.
In October 2016, the BCBS issued a discussion paper on regulatory treatment of accounting provisions, related to IFRS 9, as well as a consultative document on interim approach and transitional arrangements. As a response to the changes in the accounting standards, the BCBS has set up a task force to analyze the impact of applying the new expected credit loss (ECL) accounting standards on regulatory capital, and consider possible regulatory capital policy options, including whether any transitional arrangement is warranted to allow banks time to adjust to the new accounting provisioning standards. Consultation is currently underway and a quantitative impact study will be conducted.
In October 2016, the BCBS published its final standard on the regulatory capital treatment of banks’ investments in Total Loss Absorbing Capacity (TLAC) instruments of Global Systemically Important Banks (G-SIBs). The aim of the standard is to reduce contagion in the banking system. The final standard requires that banks deduct G-SIB TLAC holdings that exceed certain thresholds from their Tier 2 capital.
Taxpayer Protection and Bank Recapitalization Regime
In June 2016, legislation required to implement a bail-in regime was passed by the Canadian government to enhance Canada’s bank resolution capabilities in line with similar international efforts. The Canadian government will be proposing regulations that will outline the detailed approach. OSFI will also issue guidelines that set the minimum Higher Loss Absorbency (HLA) level banks will need to maintain. The Canadian government and OSFI are expected to consult on regulations and minimum HLA level, with implementation of the new regime expected at a later date. The change could increase funding costs depending on the final rules. We expect a suitable transition period to issue sufficient qualifying bail-in debt to comply with bail-in HLA requirements.
2016 Regulatory Capital Review
BMO is well-capitalized, with capital ratios that exceed OSFI’s published requirements for large Canadian banks, including the 1%D-SIB Common Equity Surcharge implemented in 2016. Our CET1 Ratio was 10.1% at October 31, 2016, compared to 10.7% at October 31, 2015. The CET1 Ratio decreased by 60 basis points from the end of fiscal 2015 due to increased RWA largely from the Basel I Capital floor and business growth, the acquisition of the BMO Transportation Finance business in the first quarter, which reduced the ratio by approximately 60 basis points, partially offset by capital growth.
Our Tier 1 Capital and Total Capital Ratios were 11.6% and 13.6%, respectively, at October 31, 2016, compared to 12.3% and 14.4%, respectively, at October 31, 2015. The decrease in the Tier 1 Capital Ratio was due mainly to the factors impacting the CET1 Ratio discussed above, partially offset by the issuance of preferred shares. The decrease in the Total Capital Ratio was mainly due to the factors impacting the Tier 1 Ratio and the redemptions of non-NVCC-qualifying subordinated notes, partially offset by the issuance of NVCC-qualifying subordinated notes.
BMO’s Leverage Ratio was 4.2% at October 31, 2016, unchanged from October 31, 2015, and in excess of the 3% minimum requirement established by OSFI.
BMO’s investments in foreign operations are primarily denominated in U.S. dollars. The foreign exchange impact ofU.S.-dollar-denominated RWA andU.S.-dollar-denominated capital deductions may result in variability in the bank’s capital ratios. BMO may offset the impact of foreign exchange movements on its capital ratios and did so during 2016. Any such activities could also impact our book value and return on equity.
BMO conducts business through a variety of corporate structures, including subsidiaries and joint ventures. A framework is in place for subsidiaries to appropriately manage their funding and capital.
Capital ratios are impacted by deferred tax assets. Given our net U.S. deferred tax asset, a 5% decrease in the U.S. Federal income tax rate (from 35% to 30%) would reduce our net deferred tax asset by approximately $230 million, which would result in a one-time corresponding income tax charge.
As a bank holding company with total consolidated assets of US$50 billion or more, our subsidiary BMO Financial Corp. (BFC) is subject to the Federal Reserve Board’s (FRB) annual Comprehensive Capital Analysis and Review (CCAR) and Dodd-Frank Act stress testing (DFAST) requirements. The CCAR is an annual exercise by the FRB to assess whether the largest bank holding companies operating in the United States have sufficient capital to continue operations throughout times of economic and financial stress and that they have robust, forward-looking capital-planning processes that account for their unique risks. DFAST (a complementary exercise to CCAR) is a forward-looking component conducted by the FRB and financial companies supervised by the FRB to help assess whether institutions have sufficient capital to absorb losses and support operations during adverse economic conditions. The FRB conducted its CCAR assessment and announced its decision not to object to BFC’s capital plan in June 2016. BFC and its bank subsidiary BMO Harris Bank N.A. (BHB) also disclosed their results under the DFAST supervisory severely adverse scenario. Under DFAST, BFC also executesmid-cycle company-run stress tests. BFC submitted its DFAST stress tests to the FRB and disclosed the results in October 2016. BFC’s post stress capital ratios were above the applicable regulatory minimum capital ratios.
| | |
| 72 | | BMO Financial Group 199th Annual Report 2016 |
Regulatory Capital(All-in basis (1))
| | | | | | | | |
(Canadian $ in millions) As at October 31 | | 2016 | | | 2015 | |
Common Equity Tier 1 capital: instruments and reserves | | | | | | | | |
Directly issued qualifying common share capital plus related stock surplus | | | 12,833 | | | | 12,612 | |
Retained earnings | | | 21,205 | | | | 18,930 | |
Accumulated other comprehensive income (and other reserves) | | | 4,426 | | | | 4,640 | |
Goodwill and other intangibles (net of related tax liability) | | | (8,040 | ) | | | (7,752 | ) |
Other common equity Tier 1 capital deductions | | | (2,265 | ) | | | (2,802 | ) |
Common Equity Tier 1 capital (CET1) | | | 28,159 | | | | 25,628 | |
Additional Tier 1 capital: instruments | | | | | | | | |
Directly issued qualifying Additional Tier 1 instruments plus related stock surplus | | | 2,750 | | | | 2,150 | |
Directly issued capital instruments subject to phase-out from Additional Tier 1 | | | 1,540 | | | | 1,987 | |
Additional Tier 1 instruments (and CET1 instruments not otherwise included) issued by subsidiaries and held by third parties (amount allowed in group AT1) | | | – | | | | 9 | |
of which: instruments issued by subsidiaries subject to phase-out | | | – | | | | 9 | |
Total regulatory adjustments applied to Additional Tier 1 capital | | | (213 | ) | | | (358 | ) |
Additional Tier 1 capital (AT1) | | | 4,077 | | | | 3,788 | |
Tier 1 capital (T1 = CET1 + AT1) | | | 32,236 | | | | 29,416 | |
Tier 2 capital: instruments and provisions | | | | | | | | |
Directly issued qualifying Tier 2 instruments plus related stock surplus | | | 3,266 | | | | 1,034 | |
Directly issued capital instruments subject to phase-out from Tier 2 | | | 1,873 | | | | 3,548 | |
Tier 2 instruments (and CET1 and AT1 instruments not included) issued by subsidiaries and held by third parties (amount allowed in group Tier 2) | | | – | | | | 46 | |
of which: instruments issued by subsidiaries subject to phase-out | | | – | | | | 46 | |
Collective allowances | | | 538 | | | | 590 | |
Total regulatory adjustments to Tier 2 capital | | | (51 | ) | | | (50 | ) |
Tier 2 capital (T2) | | | 5,626 | | | | 5,168 | |
Total capital (TC = T1 + T2) | | | 37,862 | | | | 34,584 | |
| | (1) | “All-in” regulatory capital assumes that all Basel III regulatory adjustments are applied effective January 1, 2013, and that the capital value of instruments that no longer qualify as regulatory capital under Basel III rules is being phased out at a rate of 10% per year from January 1, 2013 to January 1, 2022. |
Our CET1 capital and Tier 1 capital were $28.2 billion and $32.2 billion, respectively, at October 31, 2016, up from $25.6 billion and $29.4 billion, respectively, at October 31, 2015. CET1 capital increased mainly due to retained earnings growth. The increase in Tier 1 capital since October 31, 2015 was attributable to the growth in CET1 capital and the issuance of preferred shares, partially offset by the Additional Tier 1 instrument redemption, as outlined below in the Capital Management Activities section.
Total capital was $37.9 billion at October 31, 2016, up from $34.6 billion at October 31, 2015, attributable to the growth in Tier 1 capital mentioned above and the issuance of NVCC-qualifying subordinated notes, partially offset by the redemptions of non-NVCC-qualifying subordinated notes.
| | | | |
| BMO Financial Group 199th Annual Report 2016 | | | 73 | |
MANAGEMENT’S DISCUSSION AND ANALYSIS
Changes in Risk-Weighted Assets
Total RWA were $277.6 billion at October 31, 2016, up from $239.7 billion at October 31, 2015. Credit Risk RWA (CET1 basis) were $222.5 billion at October 31, 2016, up from $200.4 billion at October 31, 2015. The increase was largely due to business growth, the acquisition of the BMO Transportation Finance business and foreign exchange movement, partially offset by model and methodology changes and book quality improvement. Market Risk RWA were $9.0 billion at October 31, 2016, down from $10.3 billion at October 31, 2015, attributable to a decrease in risk and changes in methodologies. Operational Risk RWA were $30.5 billion at October 31, 2016, up from $28.5 billion at October 31, 2015, largely due to growth in the bank’s average gross income. The RWA from the Basel I capital floor were $15.6 billion at October 31, 2016, up from $0.5 billion at October 31, 2015, primarily due to changes in methodology and models, and business growth.
Risk-Weighted Assets
| | | | | | | | |
(Canadian $ in millions) As at October 31 | | 2016 | | | 2015 | |
Credit Risk | | | | | | | | |
Wholesale | | | | | | | | |
Corporate, including specialized lending | | | 104,488 | | | | 91,489 | |
Corporate small and medium-sized enterprises | | | 33,755 | | | | 31,954 | |
Sovereign | | | 1,976 | | | | 1,765 | |
Bank | | | 4,486 | | | | 3,902 | |
Retail | | | | | | | | |
Residential mortgages, excluding home equity line of credit | | | 8,115 | | | | 8,427 | |
Home equity line of credit | | | 6,135 | | | | 7,889 | |
Qualifying revolving retail | | | 5,110 | | | | 4,569 | |
Other retail, excluding small and medium-sized enterprises | | | 11,934 | | | | 11,053 | |
Retail small and medium-sized enterprises | | | 7,696 | | | | 1,968 | |
Equity | | | 1,403 | | | | 1,369 | |
Trading book | | | 9,675 | | | | 8,415 | |
Securitization | | | 1,878 | | | | 2,456 | |
Other credit risk assets – non-counterparty managed assets | | | 16,197 | | | | 16,255 | |
Scaling factor for credit risk assets under AIRB Approach (1) | | | 9,651 | | | | 8,874 | |
Total Credit Risk | | | 222,499 | | | | 200,385 | |
Market Risk | | | 8,962 | | | | 10,262 | |
Operational Risk | | | 30,502 | | | | 28,538 | |
CET1 Capital Risk-Weighted Assets before Capital Floor | | | 261,963 | | | | 239,185 | |
Basel I Capital Floor (2) | | | 15,599 | | | | 504 | |
CET1 Capital Risk-Weighted Assets | | | 277,562 | | | | 239,689 | |
Tier 1 Capital Risk-Weighted Assets before CVA and Capital Floor | | | 261,963 | | | | 239,185 | |
Additional CVA adjustment, prescribed by OSFI, for Tier 1 Capital | | | 380 | | | | 286 | |
Basel I Capital Floor (2) | | | 15,219 | | | | 218 | |
Tier 1 Capital Risk-Weighted Assets | | | 277,562 | | | | 239,689 | |
Total Capital Risk-Weighted Assets before CVA and Capital Floor | | | 261,963 | | | | 239,185 | |
Additional CVA adjustment, prescribed by OSFI, for Total Capital | | | 705 | | | | 531 | |
Basel I Capital Floor (2) | | | 14,894 | | | | – | |
Total Capital Risk-Weighted Assets | | | 277,562 | | | | 239,716 | |
| | (1) | The scaling factor is applied to the RWA amounts for credit risk under the AIRB Approach. |
| | (2) | Comparative figures have been amended. |
Economic Capital
Economic Capital is an expression of the enterprise’s capital demand requirement relative to the bank’s view of the economic risks in its underlying business activities. It represents management’s estimation of the likely magnitude of economic losses that could occur across several different risk types and allows returns to be measured on a consistent basis across such risks. Economic loss is the loss in economic or market value incurred over a specified time horizon at the defined confidence level, relative to the expected loss over the same time horizon. Economic Capital is calculated for various types of risk, including credit, market (trading and non-trading), operational and business, based on a one-year time horizon using a defined confidence level.
| | |
| 74 | | BMO Financial Group 199th Annual Report 2016 |
Economic Capital and RWA by Operating Group and Risk Type
(As at October 31, 2016)

*Basel I capital floor RWA are included in Corporate Services.
Capital Management Activities
On December 1, 2015, we announced our intention, and subsequently obtained the approval of OSFI and the Toronto Stock Exchange (TSX), to initiate a normal course issuer bid (NCIB) to purchase up to 15 million of BMO’s common shares on the TSX for the purpose of cancellation. During fiscal 2016, we did not purchase any shares under our NCIB share repurchase program. The current NCIB is set to expire on January 31, 2017.
During 2016, BMO issued 3.2 million common shares through the Shareholder Dividend Reinvestment and Share Purchase Plan (DRIP) and the exercise of stock options.
During 2016, BMO completed the following Tier 1 and Tier 2 capital instrument issuances, redemptions, and conversions.
Share Issuances, Redemptions and Conversions
| | | | | | | | | | | | |
As at October 31, 2016 (in millions) | | Issuance or redemption date | | | Number of shares | | | Amount | |
Common shares issued | | | | | | | | | | | | |
Stock options exercised | | | | | | | 2.1 | | | $ | 136 | |
DRIP issuance | | | | | | | 1.1 | | | $ | 90 | |
| | | |
Tier 1 Capital (1) | | | | | | | | | | | | |
Conversion of Non-Cumulative 5-Year Rate Reset Class B Preferred Shares, Series 25 | | | August 25, 2016 | | | | (2.2 | ) | | $ | (54 | ) |
Issuance of Non-Cumulative 5-Year Floating Rate Class B Preferred Shares, Series 26 (2) | | | August 25, 2016 | | | | 2.2 | | | $ | 54 | |
Issuance of Non-Cumulative 5-Year Rate Reset Class B Preferred Shares, Series 38 | | | October 21, 2016 | | | | 24 | | | $ | 600 | |
Redemption of BMO Capital Trust Securities – Series E | | | December 31, 2015 | | | | | | | $ | (450 | ) |
| | | |
Tier 2 Capital (1) | | | | | | | | | | | | |
Issuance of Series H Medium-Term Notes, Second Tranche | | | December 8, 2015 | | | | | | | $ | 1,000 | |
Issuance of Series I Medium-Term Notes, First Tranche | | | May 31, 2016 | | | | | | | $ | 1,250 | |
Redemption of Series D Medium-Term Notes, First Tranche | | | April 21, 2016 | | | | | | | $ | (700 | ) |
Redemption of Series G Medium-Term Notes, First Tranche | | | July 8, 2016 | | | | | | | $ | (1,500 | ) |
| | (1) | For further details on subordinated debt and share capital, see Notes 15 and 16 on pages 173 and 174, respectively, of the consolidated financial statements. |
| | (2) | Issuance of Non-Cumulative 5-Year Floating Rate Class B Preferred Shares, Series 26 upon conversion of Series 25. |
If an NVCC trigger event were to occur, our NVCC capital instruments, Non-Cumulative5-Year Rate Reset Class B Preferred Shares Series 27, Series 29, Series 31, Series 33, Series 36 and Series 38, Non-Cumulative Perpetual Class B Preferred Shares Series 35, and Medium-Term Notes Series H First Tranche and Second Tranche, and Series I First Tranche, would be converted into BMO common shares pursuant to automatic conversion formulas with a conversion price based on the greater of: (i) a floor price of $5.00, and (ii) the current market price of our common shares at the time of the trigger event (10-day weighted average). Based on a floor price of $5.00, these NVCC capital instruments would convert into approximately $1.5 billion BMO common shares, assuming no accrued interest and no declared and unpaid dividends.
Further details are provided in Notes 15 and 16 on pages 173 and 174 of the consolidated financial statements.
| | | | |
| BMO Financial Group 199th Annual Report 2016 | | | 75 | |
MANAGEMENT’S DISCUSSION AND ANALYSIS
Outstanding Shares and Securities Convertible into Common Shares
| | | | | | | | | | | | | | | | | | | | |
| | | Number of shares or dollar amount (in millions) | | | | | | Dividends declared per share | |
| As at November 30, 2016 | | | | | | 2016 | | | 2015 | | | 2014 | |
Common shares | | | 648 | | | | | | | $ | 3.40 | | | $ | 3.24 | | | | $3.08 | |
Class B Preferred shares | | | | | | | | | | | | | | | | | |
Series 13 (1) | | | – | | | | | | | | – | | | $ | 0.56 | | | | $1.13 | |
Series 14 | | $ | 250 | | | | | | | $ | 1.31 | | | $ | 1.31 | | | | $1.31 | |
Series 15 | | $ | 250 | | | | | | | $ | 1.45 | | | $ | 1.45 | | | | $1.45 | |
Series 16 (2) | | $ | 157 | | | | | | | $ | 0.85 | | | $ | 0.85 | | | | $0.85 | |
Series 17 (2) | | $ | 143 | | | | | | | $ | 0.53 | | | $ | 0.60 | | | | $0.64 | |
Series 18 (3) | | | – | | | | | | | | – | | | | – | | | | $0.41 | |
Series 21 (4) | | | – | | | | | | | | – | | | | – | | | | $0.81 | |
Series 23 (5) | | | – | | | | | | | | – | | | $ | 0.34 | | | | $1.35 | |
Series 25 (6) | | $ | 236 | | | | | | | $ | 0.84 | | | $ | 0.98 | | | | $0.98 | |
Series 26 (6) | | $ | 54 | | | | | | | $ | 0.10 | | | | – | | | | – | |
Series 27 | | $ | 500 | | | | | | | $ | 1.00 | | | $ | 1.00 | | | | $0.59 | |
Series 29 | | $ | 400 | | | | | | | $ | 0.98 | | | $ | 0.98 | | | | $0.46 | |
Series 31 | | $ | 300 | | | | | | | $ | 0.95 | | | $ | 0.95 | | | | $0.31 | |
Series 33 | | $ | 200 | | | | | | | $ | 0.95 | | | $ | 0.45 | | | | – | |
Series 35 | | $ | 150 | | | | | | | $ | 1.25 | | | $ | 0.41 | | | | – | |
Series 36 | | $ | 600 | | | | | | | $ | 65.03 | | | | – | | | | – | |
Series 38 | | $ | 600 | | | | | | | | – | | | | – | | | | – | |
Medium-Term Notes | | | | | | | | | | | | | | | | | |
Series H – First Tranche (7) | | $ | 1,000 | | | | | | | | na | | | | na | | | | na | |
Series H – Second Tranche (7) | | $ | 1,000 | | | | | | | | na | | | | na | | | | na | |
Series I – First Tranche (7) | | $ | 1,250 | | | | | | | | na | | | | na | | | | na | |
Stock options | | | | | | | | | | | | | | | | | | | | |
Vested | | | 5.5 | | | | | | | | | | | | | | | | | |
Non-vested | | | 4.2 | | | | | | | | | | | | | | | | | |
| | (2) | In August 2013, approximately 5.7 million Series 16 Preferred Shares were converted into Series 17 Preferred Shares on a one-for-one basis. |
| | (3) | Redeemed in February 2014. |
| | (5) | Redeemed in February 2015. |
| | (6) | In August 2016, approximately 2.2 million Series 25 Preferred Shares were converted into Series 26 Preferred Shares. |
| | (7) | Note 15 on page 173 of the financial statements includes details on the Series H Medium-Term Notes, First Tranche and Second Tranche, and Series I Medium-Term Notes, First Tranche. |
na – not applicable
Note 16 on page 174 of the financial statements includes details on share capital.
Dividends
Dividends declared per common share in fiscal 2016 totalled $3.40. Annual dividends declared represented 50.4% of reported net income and 46.3% of adjusted net income available to common shareholders on a last twelve months basis.
Our target dividend payout range (common share dividends as a percentage of net income available to shareholders, less preferred share dividends, based on earnings over the last twelve months) is 40% to 50%, providing shareholders with a competitive dividend yield. BMO’s target dividend payout range seeks to provide shareholders with stable income, while ensuring sufficient earnings are retained to support anticipated business growth, fund strategic investments and provide for a sound capital level.
At year end, BMO’s common shares provided a 4.0% annual dividend yield based on the year-end closing share price and dividends declared in the last four quarters. On December 6, 2016, BMO announced that the Board of Directors had declared a quarterly dividend on common shares of $0.88 per share, up $0.02 per share or 2% from the prior quarter and up $0.04 per share or 5% from a year ago. The dividend is payable on February 28, 2017 to shareholders of record on February 1, 2017.
Common shareholders may elect to have their cash dividends reinvested in common shares of BMO in accordance with the DRIP. In the first and second quarters of 2016, common shares to supply the DRIP were purchased on the open market. In the third and fourth quarters of 2016, common shares were issued from treasury without discount. In the first quarter of 2017, common shares to supply the dividend reinvestment feature of the DRIP were issued from treasury at a 2% discount from their then-current market price.
Eligible Dividends Designation
For the purposes of theIncome Tax Act (Canada) and any similar provincial and territorial legislation, BMO designates all dividends paid or deemed to be paid on both its common and preferred shares as “eligible dividends”, unless indicated otherwise.
This Enterprise-Wide Capital Management section contains forward-looking statements. Please see the Caution Regarding Forward-Looking Statements.
| | |
| 76 | | BMO Financial Group 199th Annual Report 2016 |
Select Financial Instruments
The Financial Stability Board (FSB) issued a report in 2012 encouraging enhanced disclosure related to financial instruments that market participants had come to regard as carrying higher risk. An index of the disclosures recommended by the Enhanced Disclosure Task Force of the FSB and where these disclosures appear in our Annual Report or Supplementary Financial Information is provided on page 120.
Consumer Loans
In Canada, our Consumer Lending portfolio is comprised of three main asset classes: real estate secured lending (including residential mortgages and home equity products), instalment and other personal loans (including indirect automobile loans) and credit card loans. We do not have any subprime or Alt-A mortgage or home equity loan programs, nor do we purchase subprime or Alt-A loans from third-party lenders.
In the United States, the Consumer Lending portfolio is primarily comprised of three asset classes: residential first mortgages, home equity products and indirect automobile loans. We have a small portfolio of first mortgage and home equity loans outstanding that had subprime or Alt-A characteristics at the date of authorization (e.g., low credit score or limited documentation). These programs have been discontinued. Balances outstanding and amounts in arrears 90 days or more at year end were not significant.
In both Canada and the United States, consumer lending products are underwritten to prudent standards relative to credit scores, loan-to-value ratios and capacity assessment. Our lending practices consider the ability of our borrowers to repay and the underlying collateral value.
Additional discussion on the Consumer Lending portfolio related to the Greater Vancouver Area and Greater Toronto Area housing markets, as well as consumer leverage, is provided in the Top and Emerging Risks That May Affect Future Results section on page 80.
Leveraged Finance
Leveraged finance loans are defined by BMO as loans to private equity businesses and mezzanine financings where our assessment indicates a higher level of credit risk. BMO has exposure to leveraged finance loans, which represent 1.8% of our total assets, with $12.5 billion outstanding at October 31, 2016 (1.6% and $10.4 billion, respectively, in 2015). Of this amount, $387 million or 3.1% of leveraged finance loans were classified as impaired ($351 million or 3.4% in 2015).
BMO-Sponsored Securitization Vehicles
BMO sponsors various vehicles that fund assets originated by either BMO (which are then securitized through a bank securitization vehicle) or its customers (which are then securitized through several Canadian customer securitization vehicles and one U.S. customer securitization vehicle). We earn fees for providing services related to the customer securitization vehicles, including liquidity, distribution and financial arrangement fees for supporting the ongoing operations of the vehicles. These fees totalled approximately $92 million in 2016 and $89 million in 2015.
Canadian Customer Securitization Vehicles
The customer securitization vehicles we sponsor in Canada provide our customers with access to financing either directly from BMO or in the asset-backed commercial paper (ABCP) markets. Customers sell their assets into these vehicles, which then issue ABCP to either investors or BMO to fund the purchases. In all cases, the sellers remain responsible for the servicing of the transferred assets and are first to absorb any losses realized on the assets.
Our exposure to potential losses relates to our investment in ABCP issued by the vehicles, derivative contracts we have entered into with the vehicles and the liquidity support we provide to ABCP purchased by investors. We use our credit adjudication process in deciding whether to enter into these arrangements, just as we do when extending credit in the form of a loan.
Two of these customer securitization vehicles are funded in the market, while a third is funded directly by BMO. BMO does not control these entities and therefore they are not consolidated. Further information on the consolidation of customer securitization vehicles is provided in Note 7 on page 159 of the financial statements. No losses were recorded on any of BMO’s exposures to these vehicles in 2016 and 2015.
The market-funded vehicles had a total of $4.4 billion of ABCP outstanding at October 31, 2016 ($3.7 billion in 2015). The ABCP of themarket-funded vehicles is rated R-1(high) by DBRS and P1 by Moody’s. BMO’s holding of ABCP, as distribution agent, of the market-funded vehicles totalled $14 million at October 31, 2016 ($21 million in 2015).
BMO provided liquidity support facilities for the market-funded vehicles totalling $5.8 billion at October 31, 2016 ($5.0 billion in 2015). This amount comprised part of our commitments outlined in Note 25 on page 195 of the financial statements. All of these facilities remain undrawn. The assets of each of these market-funded customer securitization vehicles consist primarily of diversified pools of Canadian automobile-related receivables and Canadian insured residential mortgages. These two asset classes represent 87% (86% in 2015) of the aggregate assets of these vehicles.
U.S. Customer Securitization Vehicle
We sponsor a U.S. ABCP multi-seller vehicle that we consolidate under IFRS. This customer securitization vehicle assists our customers with the securitization of their assets to provide them with alternative sources of funding. The vehicle provides funding to diversified pools of portfolios through 28 (28 in 2015) individual securitization transactions with an average facility size of US$105 million (US$174 million in 2015). The size of the pools ranged from US$10 million to US$600 million at October 31, 2016 (US$1 million to US$700 million in 2015).
The vehicle holds exposures secured by a variety of asset classes, including mid-market corporate loans, student loans and automobile loans.
The vehicle had US$2.9 billion of commercial paper outstanding at October 31, 2016 (US$4.1 billion in 2015). The ABCP of the vehicle is rated A1 by S&P and P1 by Moody’s. BMO has not invested in the vehicle’s ABCP. BMO provides committed liquidity support facilities to the vehicle, with the undrawn amount totalling US$4.7 billion at October 31, 2016 (US$5.4 billion in 2015).
| | | | |
| BMO Financial Group 199th Annual Report 2016 | | | 77 | |
MANAGEMENT’S DISCUSSION AND ANALYSIS
Sectors of Interest: Oil and Gas, Mining
Our risks related to the oil and gas sector are further outlined in the Top and Emerging Risks That May Affect Future Results section on page 80. As at October 31, 2016, BMO’s oil and gas outstanding loans were $8.0 billion or 2.1% of total loans, up approximately $1.3 billion from a year ago. Of this amount, $453 million of oil and gas sector loans were classified as impaired ($102 million in 2015). The majority of oil and gas lending is to exploration and development companies at 59%, followed by pipelines at 30%, services at 9% and manufacturing and refining at 2%.
As at October 31, 2016, BMO’s loans in respect of the mining sectors were $1.9 billion or 0.5% of total loans, up approximately $0.6 billion from a year ago. Of this amount, $3 million of mining sector loans were classified as impaired ($4 million in 2015).
Caution
This Select Financial Instruments section contains forward-looking statements. Please see the Caution Regarding Forward-Looking Statements.
Off-Balance Sheet Arrangements
BMO enters into a number of off-balance sheet arrangements in the normal course of operations.
Credit Instruments
In order to meet the financial needs of our clients, we use a variety of off-balance sheet credit instruments. These include guarantees and standby letters of credit, which represent our obligation to make payments to third parties on behalf of a customer if the customer is unable to make the required payments or meet other contractual requirements. We also write documentary and commercial letters of credit, which represent our agreement to honour drafts presented by a third party upon completion of specified activities. Commitments to extend credit are off-balance sheet arrangements that represent our commitment to customers to grant them credit in the form of loans or other financings for specific amounts and maturities, subject to meeting certain conditions.
There are a large number of credit instruments outstanding at any time. Our customers are broadly diversified and we do not anticipate events or conditions would cause a significant number of our customers to fail to perform in accordance with the terms of their contracts with us. We use our credit adjudication process in deciding whether to enter into these arrangements, just as we do when extending credit in the form of a loan. We monitor off-balance sheet instruments to avoid undue concentrations in any geographic region or industry.
The maximum amount payable by BMO in relation to these credit instruments was approximately $146 billion at October 31, 2016 ($124 billion in 2015). However, this amount is not representative of our likely credit exposure or liquidity requirements for these instruments, as it does not take into account customer behaviour, which suggests that only a portion of our customers will utilize the facilities related to these instruments. It also does not take into account any amounts that could be recovered under recourse and collateral provisions. Further information on these instruments can be found in Note 25 on page 195 of the financial statements.
For the credit commitments outlined in the preceding paragraphs, in the absence of an event that triggers a default, early termination by BMO may result in a breach of contract.
Structured Entities (SEs)
Our interests in SEs are discussed primarily on page 77 in the BMO-Sponsored Securitization Vehicles section and in Note 7 on page 159 of the financial statements. Under IFRS, we consolidate our bank securitization vehicles, U.S. customer securitization vehicle, and certain capital and funding vehicles. We do not consolidate our Canadian customer securitization vehicles, structured finance vehicles, certain capital and funding vehicles, and various BMO managed and non-BMO managed investment funds.
Guarantees
Guarantees include contracts under which we may be required to make payments to a counterparty based on changes in the value of an asset, liability or equity security that the counterparty holds. Contracts under which we may be required to make payments if a third party does not perform according to the terms of a contract and contracts under which we provide indirect guarantees of indebtedness are also considered guarantees. In the normal course of business, we enter into a variety of guarantees, including standby letters of credit, backstop and other liquidity facilities and derivatives contracts or instruments (including, but not limited to, credit default swaps), as well as indemnification agreements.
The maximum amount payable by BMO in relation to these guarantees was $24 billion at October 31, 2016 ($30 billion in 2015). However, this amount is not representative of our likely exposure, as it does not take into account customer behaviour, which suggests that only a portion of the guarantees will require us to make any payments. It also does not take into account any amounts that could be recovered under recourse and collateral provisions.
For a more detailed discussion of these arrangements, please see Note 25 on page 195 of the financial statements.
Caution
This Off-Balance Sheet Arrangements section contains forward-looking statements. Please see the Caution Regarding Forward-Looking Statements.
| | |
| 78 | | BMO Financial Group 199th Annual Report 2016 |
Enterprise-Wide Risk Management
| | |
As a diversified financial services company actively providing banking, wealth management, capital market and insurance services, we are exposed to a variety of risks that are inherent in carrying out our business activities. A disciplined and integrated approach to managing risk is therefore fundamental to the success of our operations. Our risk management framework provides independent risk oversight across the enterprise and is essential to building competitive advantage. Surjit Rajpal Chief Risk Officer BMO Financial Group | |  |
Strengths and Value Drivers
| • | | Disciplined approach to risk-taking. |
| • | | Comprehensive and consistent risk frameworks to address all material risk types. |
| • | | Risk appetite and metrics integrated into strategic planning and the ongoing management of businesses and risks. |
| • | | Sustained mindset of continuous improvement to drive consistency and efficiency in the management of risk. |
Challenges
| • | | The heightened pace, volume and complexity of regulatory requirements. |
| • | | Balancing risk and return in an uncertain economic and geopolitical environment. |
| • | | The evolving technology improvements required to meet customer expectations and the need to anticipate and respond to cyber and competitive threats. |
Priorities
| • | | Address increased complexity by streamlining risk management activities and by simplifying processes and implementing consistent practices across different business lines. |
| • | | Support greater integration of risk considerations in business processes and decisions, while managing change and complexity through more dynamic assessment and monitoring of the risks. |
| • | | Continue to enhance our risk management infrastructure through greater integration of our systems, data models and business and risk management processes to enhance the ongoing alignment of critical elements. |
2016 Achievements
| • | | Improved risk data and risk reporting through significant investment in streamlined data collection, more timely data, greater data coverage, report automation and heightened governance. |
| • | | Further enhanced stress testing and other data analysis and modelling. |
| • | | Maintained our risk culture through enhanced assessment and learning tools and communication processes. |
| • | | Responded to rising regulatory expectations, evidenced by improvements in stress testing, market risk measurement, anti-money laundering tools and processes and foundational risk management. |
| • | | Continued to develop the next generation of our risk infrastructure by integrating, automating and upgrading foundational capabilities for risk and data analysis and modelling of market, credit and operational risks. |
Text and tables presented in a blue-tinted font in the Enterprise-Wide Risk Management section of the MD&A form an integral part of the 2016 annual consolidated financial statements. They present required disclosures as set out by the International Accounting Standards Board in IFRS 7,Financial Instruments – Disclosures, which permits cross-referencing between the notes to the financial statements and the MD&A. See Note 1 on page 144 and Note 5 on page 156 of the financial statements.
Adjusted results in this Enterprise-Wide Risk Management section are non-GAAP and are discussed in the Non-GAAP Measures section on page 33.
| | | | |
| BMO Financial Group 199th Annual Report 2016 | | | 79 | |
MANAGEMENT’S DISCUSSION AND ANALYSIS
Overview
At BMO, we believe that risk management is every employee’s responsibility. We are guided by five key perspectives on risk that drive our approach to managing risk across the enterprise.
Our Approach to Risk Management
| | • | | Diversify. Limit tail risk | |
| | • | | Maintain strong capital and liquidity | |
Our integrated and disciplined approach to risk management is fundamental to the success of our operations. All elements of our risk management framework work together in support of prudent and measured risk-taking, while striking an appropriate balance between risk and return. Our Enterprise Risk and Portfolio Management (ERPM) group develops our risk appetite, risk policies and limits, and provides independent review and oversight across the enterprise on risk-related issues to achieve prudent and measured risk-taking that is integrated with our business strategy.
Risks That May Affect Future Results
Top and Emerging Risks That May Affect Future Results
We are exposed to a variety of continually changing risks that have the potential to affect our business and financial condition. An essential mandate of our risk management process is to proactively identify, assess, monitor and manage a broad spectrum of top and emerging risks. Our top and emerging risk identification process consists of several forums for discussion with the Board, senior management and business thought leaders, combining both bottom-up and top-down approaches to considering risk. Our assessment of top and emerging risks is used to develop action plans and stress tests of our exposure to certain events.
In 2016, particular attention was given to the following top and emerging risks:
Weakening Global Trade
Global trade is at risk due to anti-globalization sentiment undermining the multilateral open trading world that has supported Western growth in recent decades. Weak global growth, previously at risk due to concerns outside of North America, such as European debt, China’s economic transition and regional conflicts, is now at additional risk due to widespread anti-globalization sentiment and the resultant political uncertainty and threat to trade. The Brexit vote, the rise of European nationalist parties and the support for protectionism in the 2016 U.S. election have in common the trend to populist and closed nationalism/regionalism that may harm world trade and thus growth. The short-term impact is through volatility spikes in capital markets – the longer-term effect may be to further reduce North American growth and weaken credit quality in exposed sectors.
BMO benefits from an integrated North American strategy in diverse industries and geographies, with limited direct lending exposure outside the region and with a footprint that partially acts as a natural hedge to commodity price and foreign exchange movements, wherein price declines/rises often have offsetting impacts across different North American regions and industries. While we are primarily a North American bank, our core customers and our international strategy depend on trade and growth. We actively monitor sources of global growth and continually assess our portfolio and business strategies against developments. We stress test our portfolios, business plans and capital adequacy against severely adverse scenarios arising from shocks inside and outside North America and develop contingency plans and mitigation strategies to react to and offset such possible adverse political and/or economic developments. It is, however, difficult to successfully anticipate and mitigate the potential economic and financial consequences of such unprecedented events which could adversely affect economic growth.
Further information on our direct and indirect European exposures is provided in the European Exposures section on page 93.
Information and Cyber Security Risk
Information security is integral to BMO’s business activities, brand and reputation. BMO faces heightened information security risks given our significant use of the internet and reliance on advanced digital technologies, particularly the mobile and online banking platforms that serve our customers. The risks we face include the threat of hacking, identity theft and corporate espionage, as well as the possibility of denial of service resulting from efforts targeted at causing system failure and service disruption. In order to better protect our customers, BMO and its service providers proactively invest in people and technology to improve our capabilities to prevent, detect, respond to and manage cyber security threats. To remain resilient in the face of cyber-attacks in a rapidly evolving threat landscape, we evaluate the effectiveness of our key controls through testing, reviewing best practices and benchmarking externally, and we work with cyber security experts and suppliers to improve our controls, bolster our internal resources and enhance our technological capabilities.
Greater Vancouver Area and Greater Toronto Area Housing Markets and Consumer Leverage
Rapid price increases have occurred over a sustained period of time in the Greater Vancouver Area (GVA) and the Greater Toronto Area (GTA). In addition, overall household debt levels in Canada are elevated, raising concerns that the rapid price increases in the GVA and GTA could lead to higher delinquencies if economic conditions deteriorated or interest rates rose sharply. Moreover, if indebted households are forced to sell their home during an economic downturn, housing prices could correct lower, further weakening the economy and putting additional strain on household finances. While recent government and regulatory actions on real estate transactions and financing are expected to reduce pricing pressure, they have raised concerns about a correction in housing prices and construction. It is still too early to gauge the interaction and impact of the recent changes, but the strong economic growth in these regions supports the current and expected low delinquency rates for real estate loans in both regions and may lead to a more balanced supply/demand situation and more measured price changes. Our prudent lending practices give us confidence in our portfolio. Further, our stress tests analysis suggests that even significant price declines and recessionary economic conditions would still lead to manageable losses.
| | |
| 80 | | BMO Financial Group 199th Annual Report 2016 |
Protracted Low Oil Prices
Sustained low oil and gas prices have challenged many companies in the sector and have resulted in wide-ranging actions by affected companies to reinforce operational efficiency and balance-sheet strength by reducing costs, pacing capital expenditures, improving productivity, limiting capital outflows, selling non-core assets and raising equity. The industry continues to work through changes required to operate in a new regime of lower oil prices, but as significant adjustment has already occurred and oil prices have returned from extreme lows, the stress has reduced. In Alberta, there continues to be a consumer impact from higher unemployment, which will take longer to recover from and will continue to weigh on the province.
Within the BMO footprint, low oil prices have resulted in quite different outcomes for other sectors and regions by reducing the Canadian dollar and input costs for many consumers and businesses. Benefits of the lower oil price and Canadian dollar had earlier shown through in an upturn of Canadian manufacturing output and non-oil exports. While there was some softening in these areas during the first half of 2016, we expect those positive trends to reassert themselves into 2017. Overall, lower oil prices are a net positive for global and U.S. demand, and for Canadian non-energy exports.
Business Disruptors
The financial services industry is undergoing rapid change, as technology enables non-traditional new entrants to compete in certain segments of the banking market, in some cases with reduced regulation. New entrants may use new technologies, advanced data and analytic tools, lower cost to serve, reduced regulatory burden and/or faster processes to challenge traditional banks. For example, new business models have been observed in retail payments, consumer and commercial lending, foreign exchange and low-cost investment advisory services. While we closely monitor business disruptors, we also continue to adapt by making investments, including improving our mobile banking capabilities, building new branch formats, and refining our decisioning and analytic tools and partnering, where appropriate, to bring customer solutions to market. We further mitigate this risk by providing our customers with access to banking services across different channels, focusing on improving customer loyalty and trust, using our own advanced data and analytical tools and leveraging current and future partnerships. However, matching the pace of innovation exhibited by new and differently-situated competitors may require us and policy-makers to adapt at a greater pace.
Other Factors That May Affect Future Results
General Economic and Market Conditions in the Countries in which We Conduct Business
We conduct business in Canada, the United States and a number of other countries. Factors such as the general health of capital and/or credit markets, including liquidity, level of business activity, volatility and stability, could have a material impact on our business. As well, interest rates, foreign exchange rates, consumer saving and spending, housing prices, consumer borrowing and repayment, business investment, trade policies and agreements, government spending and the rate of inflation affect the business and economic environments in which we operate. Therefore, the amount of business we conduct in a specific geographic region and its local economic and business conditions may have an effect on our overall revenue and earnings. For example, elevated consumer debt and housing price appreciation in some Canadian regions could create a vulnerability to higher credit losses for the bank in the event of a general economic downturn or other negative catalyst.
Regulatory Requirements
The financial services industry is highly regulated, and we have experienced changes and increased complexity in regulatory requirements as governments and regulators around the world continue major reforms intended to strengthen the stability of the financial system and protect key markets and participants. As a result, there is the potential for higher capital requirements and increased regulatory and compliance costs, which could lower our returns and affect our growth. We monitor such developments, and other potential changes such as reforms of the U.S. financial regulatory system or the potential impacts of a United Kingdom withdrawal from the European Union, so that BMO is well-positioned to respond to and implement any required changes. We continue to strive to put our customers first as a mitigant to compliance and consumer protection issues. Failure to comply with applicable legal and regulatory requirements may result in litigation, financial losses, regulatory sanctions, enforcement actions, an inability to execute our business strategies, a decline in investor and customer confidence and harm to our reputation. Refer to the Legal and Regulatory Risk and Enterprise-Wide Capital Management sections on pages 110 and 70 for a more complete discussion of our legal and regulatory risk.
Fiscal, Tax, Monetary, Trade and Interest Rate Policies
Our earnings are affected by fiscal, tax, monetary, trade, regulatory and other economic policies in Canada, the United States and other jurisdictions. Such policies may have the effect of increasing or reducing competition, profitability and uncertainty in the markets. Such policies may also adversely or positively affect our customers and counterparties in the countries in which we operate, contributing to a greater risk of default by these customers and counterparties. As well, expectations in the bond and money markets related to inflation and central bank monetary policy have an effect on the level of interest rates. Changes in market expectations and monetary policy are difficult to anticipate and predict. Fluctuations in interest rates and exchange rates that result from these changes can have an impact on our earnings and valuation. Refer to the Market Risk section on page 95 for a more complete discussion of our interest rate risk exposures and page 99 for a discussion of our foreign exchange risk. Changes in tax rates and tax policy can also have an impact on our earnings and, as discussed in the Critical Accounting Estimates section on page 113, a reduction in income tax rates could lower the value of our net deferred tax asset. A 5% decrease in the U.S. Federal tax rate (from 35% to 30%) would reduce our net deferred tax asset by approximately $230 million, which would result in a one-time corresponding income tax charge. In addition, however, each 5% decrease in the U.S. Federal tax rate would also increase our annual net income by approximately $75 million. Tax laws may change as a result of efforts by Canadian and foreign governments to address tax positions taken by multinational enterprises, and taxing authorities have committed more resources to the auditing of multinational enterprises, contributing to the potential for variability in our effective tax rate. Our ability to do business in multiple countries and the ability of our customers to do business in and trade between multiple countries are both important to our profitability; diversification and restrictions that lessen these abilities could have adverse effects.
| | | | |
| BMO Financial Group 199th Annual Report 2016 | | | 81 | |
MANAGEMENT’S DISCUSSION AND ANALYSIS
Acquisitions and Strategic Plans
We conduct thorough due diligence before completing an acquisition. However, it is possible that we could make an acquisition that subsequently does not perform in line with our financial or strategic objectives or expectations. Our ability to successfully complete an acquisition may be subject to regulatory and shareholder approvals and we may not be able to determine when, if or on what terms, the necessary approvals will be granted. Changes in the competitive and economic environment, as well as other factors, may result in lower revenue, while higher than anticipated integration costs and failure to realize expected cost savings after an acquisition could also adversely affect our earnings. Integration costs may increase as a result of higher regulatory costs related to an acquisition, unanticipated costs that were not identified in the due diligence process or demands on management time that are more significant than anticipated, as well as unexpected delays in implementing certain plans that in turn lead to delays in achieving full integration. Our post-acquisition performance is also contingent on retaining the clients and key employees of acquired companies and on integrating key systems and processes without disruption, and there can be no assurance that we will always succeed in doing so.
Our financial performance is influenced by our ability to execute strategic plans developed by management. If these strategic plans are not met with success or if there is a change in these strategic plans, our earnings could grow at a slower pace or decline. In addition, our ability to execute our strategic plans is dependent to a large extent on our ability to attract, develop and retain key executives, and there is no assurance we will continue to be able to do so.
Level of Competition
The level of competition among financial services companies is high and is increasingly not based on price. Non-financial companies have increasingly been offering products and services traditionally provided by banks. Customer loyalty and retention can be influenced by a number of factors, including service levels, prices for products and services, delivery platforms, ease of product and services availability, a positive customer experience, our reputation and the actions of our competitors. International differences in laws and regulations enacted by regulatory authorities may provide advantages to our international competitors that could affect our ability to compete. Changes in these factors or any subsequent loss of market share could adversely affect our earnings.
Currency Rates
The Canadian dollar equivalents of our revenues, expenses, assets and liabilities denominated in currencies other than the Canadian dollar are subject to fluctuations in the value of the Canadian dollar relative to those currencies. Changes in the value of the Canadian dollar relative to the U.S. dollar could affect the earnings of our small business, corporate and commercial clients in Canada. A strengthening of the U.S. dollar could increase the value of our U.S.-dollar-denominated RWA and capital deductions, lowering our capital ratios. A decline in the U.S. dollar reduces the strength of our U.S. operation’s contribution to BMO’s Canadian dollar profitability. Refer to the Foreign Exchange section on page 37, the Enterprise-Wide Capital Management section on page 70 and the Market Risk section on page 95 for a more complete discussion of our foreign exchange risk exposures.
Changes to Our Credit Ratings, Capital and Funding Markets
Credit ratings are important to our ability to raise both capital and funding in order to support our business operations. Maintaining strong credit ratings allows us to access capital markets at competitive pricing. Should our credit ratings experience a material downgrade, our cost of funding would likely increase significantly and our access to funding and capital through capital markets could be reduced. The potential risks to which wholesale creditors are exposed due to bail-in proposals in Canada and subsequent legislation may also affect the cost and availability of funding. Market-making activities have also been reduced globally in response to regulatory changes. Reduced market liquidity could impact the valuation of bank securities and the availability and pricing of bank funding. A material downgrade of our ratings could also have other consequences, including those set out in Note 8 on page 161 of the financial statements.
Operational and Infrastructure Risks
As a large enterprise conducting business in multiple jurisdictions, we are exposed to many operational risks that can have a significant impact. Such risks include the risk of fraud by employees, third-party service providers or others, unauthorized transactions by employees and operational or human error, including process breakdowns or control failures. Given the large volume of transactions we process on a daily basis and the complexity and speed of our business, certain errors may be repeated or compounded before they are discovered and rectified. Shortcomings or failures of our internal processes, employees or systems, or of services and products provided by third parties, including any of our financial, accounting or other data processing systems, could lead to financial loss or restatements and damage our reputation. In addition, despite the contingency plans we or our third-party service providers have in place, our ability to conduct business may be adversely affected by a disruption to the infrastructure that supports both our operations and the communities in which we do business, including but not limited to disruption caused by public health emergencies or terrorist acts.
Legal Proceedings
We are subject to litigation arising in the ordinary course of business. The unfavourable resolution of any such litigation could have a material adverse effect on our financial results. Damage to our reputation could also result, harming our future business prospects. Information about certain legal and regulatory proceedings we currently face is provided in Note 25 on page 195 of the financial statements.
Critical Accounting Estimates and Accounting Standards
We prepare our financial statements in accordance with International Financial Reporting Standards (IFRS). Changes that the International Accounting Standards Board makes from time to time to these standards, which govern the preparation of our financial statements, can be difficult to anticipate and may materially affect how we record and report our financial results. Significant accounting policies and future changes in accounting policies are discussed in Note 1 on page 144 of the financial statements.
The application of IFRS requires management to make significant judgments and estimates, sometimes relying on financial and statistical models, that can affect the amounts and dates on which certain assets, liabilities, revenues and expenses are recorded in our financial statements, as well as their recorded values. In making these judgments and estimates, we rely on the best information available at the time. However, it is possible that circumstances may change, that new information may become available or that our models are imprecise.
| | |
| 82 | | BMO Financial Group 199th Annual Report 2016 |
Our financial results could be affected for the period during which any such new information or change in circumstances became apparent, and the extent of the impact could be significant. More information is included in the discussion of Critical Accounting Estimates on page 113.
Accuracy and Completeness of Customer and Counterparty Information
When deciding whether to extend credit or enter into other transactions with customers or counterparties, we may rely on information provided by or on behalf of those customers and counterparties, including audited financial statements and other financial information. We may also rely on representations made by customers and counterparties that the information they provide is accurate and complete. We conduct appropriate due diligence on such customer information and, where practical and economical, we engage valuation and other experts or sources of information to assist with assessing collateral and other customer risks. Our financial results could be adversely affected if the financial statements, collateral value or other financial information provided by customers or counterparties are materially misleading.
This Risks That May Affect Future Results section and the remainder of this Enterprise-Wide Risk Management section contain forward-looking statements.
Other factors beyond our control that may affect our future results are noted in the Caution Regarding Forward-Looking Statements on page 30.
We caution that the preceding discussion of risks that may affect future results is not exhaustive.
Framework and Risks
Enterprise-Wide Risk Management Framework
Our enterprise-wide risk management framework operates at all levels of the bank and consists of our three-lines-of-defence operating model and our risk appetite framework, underpinned by our risk governance structure, and our strong risk culture.
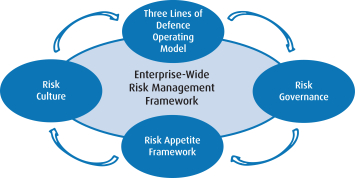
Risk Types
Our enterprise-wide risk management framework provides for the robust management of individual risk types that could have a material impact on our business. These risk types are shown below grouped according to the degree to which they lend themselves to management via quantitative analysis versus those risks primarily managed more through qualitative techniques. More detail on each of these risk types is provided starting on page 88.

We leverage our enterprise-wide risk management framework, including our policy framework and corresponding risk limits or risk tolerance guidance, to manage each of these risk types within our risk appetite through our first and second line business and risk management processes. As discussed below, management oversight of risk types is provided by management and Board committees and is supported by a control framework.
Risk Principles
Within the framework, risk-taking and risk management activities across the enterprise are guided by our Risk Principles:
| • | | management of risk is a responsibility at all levels of the organization; |
| • | | material risks to which the enterprise is exposed are identified, measured, managed, monitored and reported; |
| • | | risk identification and measurement incorporate both qualitative and quantitative elements, including views of risk relative to the external operating environment, as well as stress testing and scenario analysis; |
| | | | |
| BMO Financial Group 199th Annual Report 2016 | | | 83 | |
MANAGEMENT’S DISCUSSION AND ANALYSIS
| • | | decision-making is based on a common understanding of risk, accomplished by robust metrics and analysis and sustained through active monitoring and key controls; and |
| • | | an economic capital methodology is employed to measure and aggregate risk for all quantifiable risk types and across all business activities in order to facilitate the consistent incorporation of risk into business returns. |
Three Lines of Defence
Our risk management framework is anchored in the three-lines-of-defence approach to managing risk, which is fundamental to our operating model, as described below:
| • | | Our businesses are the bank’sfirst line of defence. They are accountable for the risks arising from their businesses, activities and exposures. They are expected to pursue business opportunities within our established risk appetite and to identify, understand, measure, manage, mitigate and report all risks in or arising from their businesses, activities and exposures. The first line discharges its responsibility by using risk management and reporting methodologies and processes developed by the business and by Enterprise Risk and Portfolio Management (ERPM) group and other Corporate Support Areas (CSAs), and may rely on CSAs or other service providers to help discharge these responsibilities. Businesses are responsible for establishing appropriate internal controls in accordance with our risk management framework and for monitoring the efficacy of such controls. Such processes and controls help ensure businesses act within their delegated risk-taking authority and risk limits, as set out in corporate policies and our risk appetite framework. |
| • | | Thesecond line of defence is comprised of the ERPM group and other CSAs. The second line provides independent oversight, effective challenge and independent assessment of risks and risk management practices, including transaction, product and portfolio risk management decisions, processes and controls in the first line of defence. The second line may establish enterprise-wide risk management policies, infrastructure, processes, methodologies and practices that the first and second lines use to identify, assess, manage and monitor risks across the enterprise. While the first line is responsible for identifying, managing and reporting on the risks in its businesses, the second line independently identifies, assesses, quantifies, monitors, manages and reports on significant risks across the enterprise on an aggregate basis. |
| • | | Corporate Audit Division is thethird line of defence. It provides an independent assessment of the effectiveness of internal controls within the enterprise, including controls that support our risk management and governance processes. |
Risk Culture
At BMO, we believe that risk management is the responsibility of every employee within the organization. This key tenet shapes and influences our corporate culture and is evident in the actions and behaviours of our employees and leaders as they identify, interpret and discuss risks, and make decisions that balance risks and opportunities and seek to optimize risk-adjusted returns. Our senior management plays a critical role in fostering a strong risk culture among all employees by communicating this responsibility effectively, by the example of their own actions and by establishing and enforcing compensation plans and other incentives that are designed to drive desired behaviours. Our risk culture is deeply rooted within our policies, business processes, risk management frameworks, risk appetite, limits and tolerances, capital management and compensation practices, and is evident in every aspect of the way we operate across the enterprise. We actively solicit feedback on the effectiveness of our risk culture, including through standardized and anonymous employee surveys.
Our risk culture is grounded in a “Being BMO” risk management approach that encourages openness, constructive challenge and personal accountability. “Being BMO” values include integrity and the responsibility to make tomorrow better and “Being BMO” behaviours include balancing risk and opportunity, taking ownership and following through on commitments, and speaking up and being candid. Timely and transparent sharing of information is also essential in engaging stakeholders in key decisions and strategy discussions, thereby bringing rigour and discipline to our decision-making. This not only leads to the timely identification, escalation and resolution of issues, but also encourages open communication, independent challenge and an understanding of the key risks faced by our organization, so that our employees are equipped and empowered to make decisions and take action in a coordinated and consistent manner, supported by a strong monitoring and control framework. Our governance and leadership forums, committee structures, learning curriculums and proactive communication also reinforce and foster our risk culture.
Certain elements of our risk culture that are embedded throughout the enterprise include:
| • | | Risk appetite – promotes a clear understanding of the most prevalent risks that our businesses face and facilitates alignment of business strategies with our risk appetite, and provides a control and early warning framework through our key risk metrics, thereby leading to sound business decision-making and execution, supported by a strong monitoring framework. |
| • | | Communication and escalation channels – encourage engagement and sharing of information between ERPM and the operating groups, leading to greater transparency and open and effective communication. We also foster a culture that encourages the escalation of concerns associated with potential or emerging risks to senior management so that they can be evaluated and appropriately addressed. |
| • | | Compensation philosophy – pay is aligned with prudent risk-taking so that compensation and other incentives reward the appropriate use of capital and respect for the rules and principles in our enterprise-wide risk management framework, and do not encourage excessive risk-taking. Our risk managers have input into the design of incentive programs which may affect risk-taking and provide input into the performance assessment of employees who take material risks or who are responsible for losses or events creating an unexpected risk of loss. |
| • | | Training and education – our programs are designed to foster a deep understanding of BMO’s capital and risk management frameworks across the enterprise, providing employees and management with the tools and awareness they need to fulfill their responsibilities for independent oversight, regardless of their position in the organization. Our education strategy has been developed in partnership with BMO’s Institute for Learning, our risk management professionals, external risk experts and teaching professionals. |
| • | | Rotation programs – two-way rotation allows employees to transfer between ERPM and the operating groups, thereby effectively embedding our strong risk culture across the enterprise and ensuring many of our risk management professionals have a practical grounding in our business activities. |
| | |
| 84 | | BMO Financial Group 199th Annual Report 2016 |
Risk Governance
Our enterprise-wide risk management framework is founded on a governance approach that includes a robust committee structure and a comprehensive set of corporate policies and limits, each of which is approved by the Board of Directors or its committees, as well as specific corporate standards and operating procedures. Our corporate policies outline frameworks and objectives for every significant risk type, so that risks to which the enterprise is exposed are appropriately identified, managed, measured, monitored, mitigated and reported in accordance with our risk appetite. Specific policies govern our key risks, such as credit, market, liquidity and funding, model, and operational risks. This enterprise-wide risk management framework is governed at all levels through a hierarchy of committees and individual responsibilities, as outlined in the diagram below.
Our risk management framework is reviewed on a regular basis by the Risk Review Committee of the Board of Directors to thereby guide our risk-taking activities. In each of our operating groups, management, as the first line of defence, is responsible for governance activities, controls, effective implementation and operation of our risk management processes and procedures to ensure effective risk management. ERPM, as the second line of defence, oversees effective implementation and operation of our risk processes and procedures with a view to aligning effective outcomes consistent with our overall risk management framework. Individual governance committees establish and monitor further risk management limits, consistent with and in furtherance of Board-approved limits.
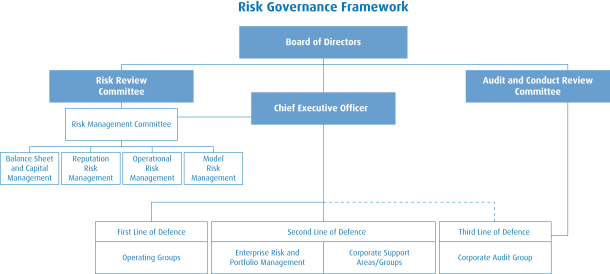
In addition to the enterprise-level risk governance framework, appropriate risk governance frameworks, including our three lines of defence, are in place in all our material businesses and entities:
Board of Directors is responsible for supervising the management of the business and affairs of BMO. The Board, either directly or through its committees, is responsible for oversight in the following areas: strategic planning, defining risk appetite, the identification and management of risk, capital management, fostering a culture of integrity, internal controls, succession planning and evaluation of senior management, communication, public disclosure and corporate governance.
Risk Review Committee of the Board of Directors (RRC) assists the Board in fulfilling its oversight responsibilities in relation to BMO’s identification and management of risk as well as our risk culture, adherence to risk management corporate policies and procedures, compliance with risk-related regulatory requirements and the evaluation of the Chief Risk Officer, including input into succession planning for the CRO. Our risk management framework is reviewed on a regular basis by the RRC in order to provide guidance for the governance of our risk-taking activities.
Audit and Conduct Review Committee of the Board of Directors assists the Board in fulfilling its oversight responsibilities for the integrity of BMO’s financial reporting, the effectiveness of BMO’s internal controls and the performance of its internal and external audit functions.
Chief Executive Officer (CEO) is directly accountable to the Board for all of BMO’s risk-taking activities. The CEO is supported by the CRO and the rest of ERPM.
Chief Risk Officer (CRO) reports directly to the CEO and is head of ERPM and chair of RMC. The CRO is responsible for providing independent review and oversight of enterprise-wide risks and leadership on risk issues, developing and maintaining a risk management framework and fostering a strong risk culture across the enterprise.
Risk Management Committee (RMC) is BMO’s senior risk committee. RMC reviews and discusses significant risk issues and action plans that arise in executing the enterprise-wide strategy. RMC provides risk oversight and governance at the highest levels of management. This committee is chaired by the CRO and its members include the heads of our operating groups, the CEO and the CFO.
RMC Sub-Committees have oversight responsibility for the risk implications and balance sheet impacts of management strategies, governance practices, risk measurement, model risk management and contingency planning. RMC and its sub-committees provide oversight of the processes whereby the risks assumed across the enterprise are identified, measured, managed, monitored and reported in accordance with policy guidelines, and are held within limits and risk tolerances.
Enterprise Risk and Portfolio Management (ERPM), as the risk management second line of defence, provides comprehensive risk management oversight. It promotes consistency in risk management practices and standards across the enterprise. ERPM supports a disciplined approach to risk-taking in fulfilling its responsibilities for independent transactional approval and portfolio management, policy formulation, risk reporting, stress testing, modelling, vetting and risk education. This approach seeks to meet enterprise objectives and to verify that any risks assumed are consistent with BMO’s risk appetite.
Operating Groups are responsible for identifying, measuring, managing, monitoring and reporting risk within their respective lines of business. They exercise business judgment and seek to ensure that effective policies, processes and internal controls are in place and that significant risk issues are reviewed with ERPM. Individual governance committees and ERPM establish and monitor further risk management limits that are consistent with and subordinate to the Board-approved limits.
| | | | |
| BMO Financial Group 199th Annual Report 2016 | | | 85 | |
MANAGEMENT’S DISCUSSION AND ANALYSIS
Risk Appetite Framework
Our Risk Appetite Framework consists of our Risk Appetite Statement, key risk metrics and corporate policies, standards and guidelines, including the related limits, concentration levels and controls defined therein. Our risk appetite defines the amount of risk that BMO is willing to assume given our guiding principles and capital capacity, and thus supports sound business initiatives, appropriate returns and targeted growth. Our risk appetite is integrated into our strategic and capital planning processes and performance management system. On an annual basis, senior management recommends our Risk Appetite Statement and key risk metrics to the RMC and the Board of Directors for approval. Our Risk Appetite Statement is articulated and applied consistently across the enterprise, with key enterprise businesses and entities developing their own risk appetite statements within this framework. Among other things, our risk appetite requires:
| • | | that everything we do is guided by principles of honesty, integrity and respect, as well as high ethical standards; |
| • | | taking only those risks that are transparent, understood, measured, monitored and managed; |
| • | | maintaining strong capital, liquidity and funding positions that meet or exceed regulatory requirements and the expectations of the market; |
| • | | that new products and initiatives are subject to rigorous review and approval, and that new acquisitions provide a good strategic, financial and cultural fit, and have a high likelihood of creating value for our shareholders; |
| • | | setting capital limits based on our risk appetite and strategy and having our lines of business optimize risk-adjusted returns within those limits; |
| • | | maintaining a robust recovery framework that enables an effective and efficient response in a severe crisis; |
| • | | using Economic Capital, regulatory capital and stress testing methodologies to understand our risks and guide our risk-return assessments; |
| • | | targeting an investment grade credit rating at a level that allows competitive access to funding; |
| • | | limiting exposure to low-frequency, high-severity events that could jeopardize BMO’s credit ratings, capital or liquidity position or reputation; |
| • | | incorporating risk measures and risk-adjusted returns into our performance management system, including an assessment of performance against our risk appetite and return objectives in compensation decisions; |
| • | | maintaining effective policies, procedures, guidelines, compliance standards and controls, training and management that will guide the business practices and risk-taking activities of all employees so that they are able to optimize risk-adjusted returns and adhere to all legal and regulatory obligations, thus protecting BMO’s reputation; and |
| • | | protecting the assets of BMO and BMO’s clients by maintaining a system of prudent risk limits and strong operational risk controls. |
Risk Limits
Our risk limits are shaped by our risk principles, reflect our risk appetite, and inform our business strategies and decisions. In particular, we consider risk diversification, exposure to loss and risk-adjusted returns when setting limits. These limits are reviewed and approved by the Board of Directors and/or management committees and include:
| • | | Credit and Counterparty Risk – limits on group and single-name exposures and material country, industry, and portfolio/product segments; |
| • | | Market Risk – limits on economic value and earnings exposures to stress scenarios and significant movements; |
| • | | Liquidity and Funding Risk – limits on minimum levels of liquid assets and maximum levels of asset pledging and wholesale funding, as well as guidelines related to liability diversification, financial condition, earnings at risk and economic value exposure; |
| • | | Insurance Risk – limits on policy exposure and reinsurance arrangements; and |
| • | | Model Risk – limits on model approval and modification exceptions, material deficiency extensions, and scheduled review extensions. |
The Board of Directors, after considering recommendations from the RRC and the RMC, annually reviews and approves key risk limits and in turn delegates overall authority for them to the CEO. The CEO then delegates more specific authorities to the senior executives of the operating groups (first line of defence), who are responsible for the management of risk in their respective areas, and to the CRO (second line of defence). These delegated authorities allow the officers to set risk tolerances, approve geographic and industry sector exposure limits within defined parameters, and establish underwriting and inventory limits for trading and investment banking activities. The criteria whereby more specific authorities may be delegated across the organization, as well as the requirements relating to documentation, communication and monitoring of those specific delegated authorities, are set out in corporate policies and standards.
Risk Identification, Review and Approval
Risk identification is an essential step in recognizing the key inherent risks that we face, understanding the potential for loss and then acting to mitigate this potential. A Risk Register is maintained to comprehensively identify and manage key risks, supporting the implementation of the bank’s Risk Appetite Framework and assisting in identifying the primary risk categories for which Economic Capital is reported and stress capital consumption is estimated. Our enterprise-wide and targeted (industry/portfolio specific or ad-hoc) stress testing processes have been developed to assist in identifying and evaluating these risks. Risk review and approval processes are established based on the nature, size and complexity of the risks involved. Generally, this involves a formal review and approval by either an individual or a committee, independent of the originator. Delegated authorities and approvals by category are outlined below.
Portfolio transactions – transactions are approved through risk assessment processes for all types of transactions at all levels of the enterprise, which include operating group recommendations and ERPM approval of credit risk, and transactional and position limits for market risk.
Structured transactions – new structured products and transactions with significant legal, regulatory, accounting, tax or reputation risk are reviewed by the Reputation Risk Management Committee or the Trading Products Risk Committee, as appropriate, and are reviewed by our operational risk management process if they involve structural or operational complexity which may create operational risk.
Investment initiatives – documentation of risk assessments is formalized through our investment spending approval process, which is reviewed and approved by CSAs.
New products and services – policies and procedures for the approval of new or modified products and services offered to our customers are the responsibility of the first line of defence, including appropriate senior business leaders, and are reviewed and approved by subject matter experts and senior managers in CSAs, as well as by other senior management committees, including the Operational Risk Committee and Reputation Risk Management Committee, as appropriate.
| | |
| 86 | | BMO Financial Group 199th Annual Report 2016 |
Risk Monitoring
Enterprise-level risk transparency and monitoring and associated reporting are critical components of our risk management framework and corporate culture that allow senior management, committees and the Board of Directors to exercise their business management, risk management and oversight responsibilities at the enterprise, operating group and key legal entity levels. Internal reporting includes a synthesis of the key risks and associated metrics that the enterprise currently faces. Our reporting highlights our most significant risks, including assessments of our top and emerging risks, to provide the Board of Directors, its committees and any other appropriate executive and senior management committees with timely, actionable and forward-looking risk reporting. This reporting includes supporting metrics and materials to facilitate assessment of these risks relative to our risk appetite and the relevant limits established within our Risk Appetite Framework.
On a regular basis, reporting on risk issues is also provided to stakeholders, including regulators, external rating agencies and our shareholders, as well as to others in the investment community.
Risk-Based Capital Assessment
Two measures of risk-based capital are used by BMO: Economic Capital and Regulatory Capital. Both are aggregate measures of the risk that we take on in pursuit of our financial targets and enable us to evaluate returns on a risk-adjusted basis. Our operating model provides for the direct management of each type of risk, as well as the management of all material risks on an integrated basis. Measuring the economic profitability of transactions or portfolios incorporates a combination of both expected and unexpected losses to assess the extent and correlation of risk before authorizing new exposures. Both expected and unexpected loss measures for a transaction or a portfolio reflect current market conditions and, as appropriate, its credit quality. Risk-based capital methods and material models are reviewed at least annually and, if appropriate, recalibrated or revalidated. Our risk-based capital models provide a forward-looking estimate of the loss in economic or market value incurred over a specified time horizon at the defined confidence level, relative to the expected loss over the same time horizon.
Stress Testing
Stress testing is a key element of our risk and capital management frameworks. It is integrated in our enterprise and group risk appetite statements and embedded in our management processes. To evaluate our risks, we regularly test a range of scenarios varying in frequency, severity and complexity in our businesses and portfolios and across the enterprise. In addition, we also participate in regulatory stress tests in multiple jurisdictions. Governance of the stress testing framework resides with senior management, including the Enterprise Stress Testing Steering Committee. This committee is comprised of business, risk and finance executives and is accountable for the oversight of BMO’s enterprise stress testing and for reviewing and challenging associated scenarios and stress test results. Stress testing and enterprise-wide scenarios associated with the Internal Capital Adequacy Assessment Process (ICAAP), including recommended actions that the organization could take to manage the impact of the stress event, are established by senior management and presented to the Board of Directors. Stress testing associated with the Comprehensive Capital Analysis and Review (CCAR) and the Dodd-Frank Capital Stress Test (DFAST) – which are U.S. regulatory requirements for our key U.S. subsidiaries – is subject to entity-specific governance.
Quantitative models and qualitative approaches are utilized to assess the impact of changes in the macroeconomic environment on our income statement and balance sheet and the resilience of our capital over a forecast horizon. Models used for stress testing are approved and governed through the Model Risk Management framework and are used as tools to better understand our risks as well as test our capital adequacy.
Enterprise Stress Testing
Enterprise stress testing supports our internal capital adequacy assessment and target-setting through analysis of the potential effects of low-frequency, high-severity events on our balance sheet, earnings, liquidity and capital positions. Scenario selection is a multi-step process that considers the enterprise’s material and idiosyncratic risks and the potential impact of new or emerging risks on our risk profile, as well as the macroeconomic environment. Scenarios may be defined by senior management or regulators, and the economic impacts are established by our Economics group. The Economics group does this by translating the scenarios into macroeconomic and market variables that include but are not limited to GDP growth, yield curve estimates, unemployment, real estate prices, stock index growth and changes in corporate profits. These macroeconomic variables are used to drive our stress loss models and the qualitative assessments that determine our estimated stress impacts. The scenarios are used by our operating, risk and finance groups to assess a broad range of financial impacts which could arise under such a stress and the ordinary course and extraordinary actions anticipated in response to stress.
Stress test results, including mitigating actions, are benchmarked and challenged by relevant business units and senior management, including the Enterprise Stress Testing Steering Committee.
Targeted Portfolio and Ad Hoc Stress Testing
Our stress testing framework integrates stress testing at the line of business, portfolio, industry, geography and product level and embeds it in strategy, business planning and decision-making. Targeted portfolio, industry and geographic analysis is conducted by risk management and by the business to test risk appetite, limits, concentration and strategy. Ad hoc stress testing is conducted in response to changing economic or market conditions and to test business strategies.
| | | | |
| BMO Financial Group 199th Annual Report 2016 | | | 87 | |
MANAGEMENT’S DISCUSSION AND ANALYSIS
Credit and Counterparty Risk
|
Credit and counterparty risk is the potential for loss due to the failure of a borrower, endorser, guarantor or counterparty to repay a loan or honour another predetermined financial obligation. |
Credit and counterparty risk underlies every lending activity that BMO enters into, and also arises in the holding of investment securities, transactions related to trading and other capital markets products and activities related to securitization. Credit risk is the most significant measurable risk BMO faces. Proper management of credit risk is essential to our success, since the failure to effectively manage credit risk could have an immediate and significant impact on our earnings, financial condition and reputation.
Credit and Counterparty Risk Governance
The objective of our credit risk management framework is to ensure all material credit risks to which the enterprise is exposed are identified, measured, managed, monitored and reported. The Risk Review Committee (RRC) of the Board of Directors has oversight of the management of all material risks faced by the enterprise, including the credit risk management framework. BMO’s credit risk management framework incorporates governing principles which are defined in a series of corporate policies and standards, and which flow through to more specific operating procedures. These are reviewed on a regular basis and modified when necessary to keep them current and consistent with BMO’s risk appetite. The structure, limits, collateral requirements, monitoring, reporting and ongoing management of our credit exposures are all governed by these credit risk management principles.
Lending officers in the operating groups are responsible for recommending credit decisions based on the completion of appropriate due diligence, and they assume accountability for the risks. Credit officers in ERPM approve these credit decisions and are accountable for providing both an objective assessment of the lending recommendations and independent oversight of the risks assumed by the lending officers. All of these experienced and skilled individuals are subject to a rigorous lending qualification process and operate in a disciplined environment with clear delegation of decision-making authority, including individually delegated lending limits, which are reviewed annually. The Board annually reviews our Credit Risk Management Policy and delegates to the CEO key exposure limits for further specific delegation to senior officers. Credit decision-making is conducted at the management level appropriate to the size and risk of each transaction in accordance with comprehensive corporate policies, standards and procedures governing the conduct of activities in which credit risk arises. Corporate Audit Division reviews and tests management processes and controls and samples credit transactions in order to assess adherence to credit terms and conditions, as well as to governing policies, standards and procedures.
All credit risk exposures are subject to regular monitoring. Performing accounts are reviewed on a regular basis, with most commercial and corporate accounts reviewed at least annually. The frequency of review increases in accordance with the likelihood and size of potential credit losses, with deteriorating higher-risk situations referred to specialized account management groups for closer attention, when appropriate. In addition, regular portfolio and sector reviews are carried out, including stress testing and scenario analysis based on current, emerging or prospective risks. Reporting is provided at least quarterly to RRC and senior management committees in order to keep them informed of credit risk developments in our portfolios, including changes in credit risk concentrations, watchlist accounts, impaired loans, allowances for credit losses, negative credit migration and significant emerging credit risk issues, and to facilitate any measures that they may decide to take, when necessary.
Counterparty credit risk (CCR) is the risk that a counterparty to a transaction could default or deteriorate in creditworthiness before the final settlement of funds. Unlike credit risk for a loan, when only the lending bank faces the risk of a direct loss, CCR creates a bilateral risk of loss because the market value of a transaction can be positive or negative to either counterparty. CCR exposures are subject to the same credit oversight, limit framework and approval process as outlined above. However, given the nature of risk, CCR is also monitored through the market risk framework and many are collateralized. In order to reduce the bank’s CCR, the bank will often use a designated clearing house or central counterparty (CCP) that intermediates between counterparties for contracts in financial markets. CCPs aim to mitigate the risk through the use of margin requirements (both initial and variation) and a default management process, including a default fund and other resources.
Credit and Counterparty Risk Management
Collateral Management
Collateral is used for credit and/or counterparty risk mitigation purposes to minimize losses that would otherwise be incurred in the event of a default. Depending on the type of borrower, the assets available and the structure and term of the credit obligations, collateral can take various forms. For corporate and commercial borrowers, collateral can take the form of pledges of the assets of a business, such as accounts receivable, inventory, machinery and real estate, or personal assets pledged in support of guarantees. Where possible, we may enter into legally enforceable netting agreements for on-balance sheet credit exposures. In our securities financing transaction business (including repurchase agreements and securities lending), we take eligible financial collateral that we control and can readily liquidate.
On a periodic basis, collateral is subject to regular revaluation specific to asset type. For loans, the value of collateral is initially established at the time of origination, and the frequency of revaluation is dependent on the type of collateral. Credit officers in ERPM provide independent oversight of collateral documentation and valuation. For collateral in the form of investor-owned commercial real estate, a full external appraisal of the property is obtained at the time of loan origination, except where the loan is below a specified threshold amount, in which case an internal evaluation and a site inspection are conducted. Internal evaluation methods may consider tax assessments, purchase prices, real estate listings or realtor opinions. The case for an updated appraisal is reviewed annually, with consideration given to the borrower risk rating, existing tenants and lease contracts, as well as current market conditions. In the event a loan is classified as impaired, depending on its size, a current external appraisal, evaluation or restricted use appraisal is obtained and updated every 12 months while the loan is classified as impaired. In Canada, residential real estate that has a loan-to-value (LTV) ratio of less than 80%, an external property appraisal is routinely obtained at the time of loan origination. In certain low LTV ratio cases, BMO may use an external service provided by Canada Mortgage and Housing Corporation to assist in determining whether a full property appraisal is necessary. For high LTV ratio in Canada (greater than 80%) insured mortgages, BMO obtains the value of the property and the default insurer confirms the value.
Collateral for our trading counterparty exposures is primarily comprised of cash and high-quality liquid securities (U.S. and Canadian treasury securities, U.S. agency securities and Canadian provincial government securities) that are monitored and revalued on a daily basis. Collateral is
Material presented in a blue-tinted font above is an integral part of the 2016 annual consolidated financial statements (see page 79).
| | |
| 88 | | BMO Financial Group 199th Annual Report 2016 |
obtained under the contractual terms of standardized industry documentation. With limited exceptions, we utilize the International Swaps and Derivatives Association Inc. (ISDA) Master Agreement with a Credit Support Annex to document our collateralized trading relationships with our counterparties for over-the-counter (OTC) derivatives that are not centrally cleared. Credit Support Annexes entitle a party to demand collateral (or other credit support) when its OTC derivatives exposure to the other party exceeds an agreed amount (threshold). Collateral transferred can include an independent amount (initial margin) and/or variation margin. Credit Support Annexes contain, among other things, provisions setting out acceptable collateral types and how they are to be valued (discounts are often applied to the market values), as well as thresholds, whether or not the collateral can be re-pledged by the recipient and how interest is to be calculated.
To document our contractual securities financing relationships with our counterparties, we utilize master repurchase agreements for repurchase transactions and, for securities lending transactions, we utilize master securities lending agreements.Many G20 jurisdictions are implementing new regulations which will require certain counterparties with significant OTC derivatives exposures to post or collect prescribed types and amounts of collateral for uncleared OTC derivatives transactions. See Legal and Regulatory Risk – Derivatives Reform on page 111.
Portfolio Management
BMO’s credit risk governance policies require an acceptable level of diversification. Limits may be specified for several portfolio dimensions, including industry, specialty segments (e.g., hedge funds and leveraged lending), country, product and single-name concentrations. At year end, our credit assets consisted of a well-diversified portfolio comprised of millions of clients, the majority of them consumers and small to medium-sized businesses. The diversification of our credit exposure may be supplemented by the purchase or sale of credit protection through guarantees, insurance or credit default swaps.
Wrong-way Risk
Wrong-way risk occurs when exposure to a counterparty is highly correlated with the credit quality of collateral or some other intended mitigant of the risk related to that counterparty. There is specific wrong-way risk, which arises when the counterparty and the market risk factors affecting that mitigant display a high correlation, and general wrong-way risk, which arises when the credit quality of the counterparty, for non-specific reasons, is highly correlated with macroeconomic or other factors that affect the value of the mitigant. Our procedures require that specific wrong-way risk be identified in transactions and accounted for in the assessment of risk. Stress testing of replacement risk is conducted monthly and can be used to identify existing or emerging concentrations of general wrong-way risk in our portfolios.
Credit and Counterparty Risk Measurement
We quantify credit risk at both the individual borrower or counterparty and the portfolio level. In order to limit earnings volatility, manage expected credit losses and minimize unexpected losses, credit risk is assessed and measured using the following risk-based parameters:
Exposure at Default (EAD) represents an estimate of the outstanding amount of a credit exposure at the time a default may occur. For off-balance sheet amounts and undrawn amounts, EAD includes an estimate of any further amounts that may be drawn at the time of default.
Loss Given Default (LGD) is a measure of our economic loss, such as the amount that may not be recovered in the event of a default, presented as a proportion of the exposure at default.
Probability of Default (PD) represents the likelihood that a borrower or counterparty will go into default over a one-year time horizon, estimated at a high confidence level.
Expected Loss (EL) is a measure representing the loss that is expected to occur in the normal course of business in a given period of time. EL is calculated as a function of EAD, LGD and PD.
For inclusion in regulatory capital calculations, OSFI permits three approaches for the measurement of credit risk: Standardized, Foundation Internal Ratings Based and Advanced Internal Ratings Based (AIRB). Subject to a Basel I Floor, we apply the AIRB Approach for the measurement of credit risk in most of our portfolios, including portfolios of our subsidiary BMO Financial Corp. The Basel III Standardized Approach is currently being used for regulatory capital calculations related to the acquired Marshall & Isley Corporation and GE Transportation Finance portfolios, and to a few other immaterial exposures. We continue to transition these portfolios to the AIRB Approach.
Risk Rating Systems
BMO’s risk rating systems are designed to assess and measure the risk of any exposure. The rating systems differ for retail (consumer and small business) and wholesale (corporate, commercial and sovereign) portfolios.
Credit risk measures are validated and back-tested regularly – quarterly in the case of retail models and annually in the case of wholesale models.Please refer to pages 108 and 109 for a discussion of our model risk mitigation processes.
Retail (Consumer and Small Business)
The retail portfolios are comprised of a diversified group of individual customer accounts and include residential mortgages, personal loans, credit cards and small business loans. These loans are managed in pools of homogeneous risk exposures. For these pools, decision support systems are developed using established statistical techniques and expert systems for underwriting and monitoring purposes. Adjudication models, behavioural scorecards, decision trees and expert knowledge are combined to produce optimal credit decisions in a centralized and automated environment.
The retail risk rating system assesses the borrower’s risk based on a narrow range of likely expected conditions, primarily more recent in nature, including delinquency, loan-to-value ratio and loan utilization rate. Product lines within each of the retail risk areas are separately modelled so that the risk-based parameters capture the distinct nature of each product. A final segmentation then sorts each exposure within a product line into homogeneous pools of retail risk that reflect common risk-based parameters. Each pool is assigned a unique combination of PD, LGD and EAD parameters that captures its segment-specific credit risk.
The retail risk rating system is designed to generate estimates of the value of credit risk parameters as accurately as possible but is subject to uncertainty. During the calibration process, adjustments are made at the parameter level for each segment to account for this uncertainty. The retail
Material presented in a blue-tinted font above is an integral part of the 2016 annual consolidated financial statements (see page 79).
| | | | |
| BMO Financial Group 199th Annual Report 2016 | | | 89 | |
MANAGEMENT’S DISCUSSION AND ANALYSIS
parameters are tested quarterly, and are calibrated on an annual basis to incorporate additional data points in the parameter estimation process, ensuring that the most recent experience is incorporated.
Retail Credit Probability of Default Bands by Risk Rating
| | |
| Risk profile | | Probability of default band |
Exceptionally low | | £ 0.05% |
Very low | | > 0.05% to 0.20% |
Low | | > 0.20% to 0.75% |
Medium | | > 0.75% to 7.00% |
High | | > 7.00% to 99.99% |
Default | | 100% |
Wholesale (Corporate, Commercial and Sovereign)
Within wholesale portfolios, we utilize an enterprise-wide risk rating framework that is applied to all of our sovereign, bank, corporate and commercial counterparties. One key element of this framework is the assignment of appropriate borrower or counterparty risk ratings (BRRs). A suite of general and sector-specific risk rating models have been developed within each asset class in order to capture the key quantitative and qualitative risk factors associated with borrowers in different industries and portfolios. Risk ratings are assigned using the appropriate internal model. BRRs are assessed and assigned at the time of loan origination and reviewed at least annually. More frequent reviews are conducted for borrowers with weaker risk ratings, borrowers that trigger a review through a rating change or that experience covenant breaches, and borrowers requiring or requesting changes to credit facilities. The assigned ratings are mapped to a PD over a one-year time horizon. As a borrower migrates between risk ratings, the PD associated with the borrower changes.
BMO employs a master scale with 14 BRRs above default, and PDs are assigned to each grade within an asset class to reflect thelong-run average ofone-year default rates. PD estimates are updated periodically based on internal default experience over a period of more than five years that covers at least one full economic cycle, supplemented by external benchmarking, as applicable.
BMO also assigns an LGD estimate to each separate facility provided to a borrower at the time of origination. An LGD estimate is a measure of the potential economic loss that would be incurred for a facility if the borrower were to default during a period of economic distress. The LGD estimate provides an inverse measure of the protection against loss afforded by the assigned collateral, as applicable, and considers the supporting structural elements of the facility, including seniority, margin arrangements, and product and sectoral characteristics. LGD models have been developed for each asset class using internal data that covers a period of more than seven years, and results are benchmarked using external data, when necessary.
As demonstrated in the table below, our internal risk rating system corresponds in a logical manner to those of external rating agencies.
Wholesale Borrower Risk Rating Scale
| | | | | | |
| BMO rating | | Moody’s Investors Service implied equivalent | | Standard & Poor’s
implied equivalent | |
Acceptable | | | | |
I-1 to I-3 | | Aaa to Aa3 | | | AAA to AA- | |
I-4 to I-5 | | A1 to Baa1 | | | A+ to BBB+ | |
I-6 to I-7 | | Baa2 to Baa3 | | | BBB to BBB- | |
S-1 to S-2 | | Ba1 to Ba2 | | | BB+ to BB | |
S-3 to S-4 | | Ba3 to B1 | | | BB- to B+ | |
Watchlist | | | | | | |
P-1 to P-3 | | B2 to Ca | | | B to CC | |
Default/Impaired | | | | |
T1, D-1 to D-4 | | C | | | D | |
Credit Quality Information
Portfolio Review
Total enterprise-wide credit exposure was $681 billion at October 31, 2016, comprised of $388 billion in Canada, $264 billion in the United States and $29 billion in other jurisdictions.This represents an increase of $59 billion or 9% from the prior year. Additional information can be found in Note 5 on page 156 of the financial statements.
BMO’s loan book continues to be well-diversified by industry and geographic region. Gross loans and acceptances increased by $38 billion or 11% from the prior year to $374 billion at October 31, 2016. The geographic mix of our Canadian and U.S. portfolios was relatively consistent with the prior year, and represented 64.5% and 32.6% of total loans, respectively, compared with 66.6% and 30.1% in 2015. The consumer loan portfolio represented 49.5% of the total portfolio, a decrease from 53.4% in 2015. Business and government loans represented 50.5% of the total portfolio, up from 46.6% in 2015. Our loan portfolio is well-diversified by industry and we continue to proactively monitor industry sectors that we consider warrant closer attention, including Canadian consumer loans and U.S. and Canadian direct and indirect oil and gas exposures.
Further details on our loan book, including detailed breakdowns by industry and geographic region, can be found in Tables 7 to 15 on pages 128 to 134 and in Note 5 on page 156 of the financial statements. Details related to our credit exposures are discussed in Note 4 on page 153 of the financial statements.
Material presented in a blue-tinted font above is an integral part of the 2016 annual consolidated financial statements (see page 79).
| | |
| 90 | | BMO Financial Group 199th Annual Report 2016 |
Real Estate Secured Lending
Residential mortgage and home equity line of credit (HELOC) exposures continue to be of interest in the current environment. BMO regularly performs stress testing on its residential mortgage and HELOC portfolios to evaluate the potential effects of high-impact events. These stress tests incorporate scenarios ranging from moderately to severely adverse. The credit losses forecast in these tests vary with the severity of the scenario and are considered to be manageable.
Provision for Credit Losses (PCL)
Total PCL was $815 million in the current year, up 33% from $612 million in 2015. Detailed discussions of our PCL, including historical trends in PCL, are provided on page 42, in Table 15 on page 134 and in Note 4 on page 153 of the financial statements.
Gross Impaired Loans (GIL)
Total GIL increased by $373 million or 19% from 2015 to $2,332 million in 2016, with increases in both Canada and the United States, due to an increase in oil and gas impaired loans and the impact of the stronger U.S. dollar. GIL as a percentage of gross loans and acceptances also increased over the prior year from 0.58% in 2015 to 0.62% in 2016.
Factors contributing to the change in GIL are outlined in the table below. Loans classified as impaired during the year increased from $1,921 million in 2015 to $2,512 million in 2016, in part due to an increase in oil and gas impaired formations. On a geographic basis, the United States accounted for the majority of impaired loan formations, comprising 56.8% of total formations in 2016, compared with 55.6% in 2015. Detailed breakdowns of impaired loans by geographic region and industry can be found in Table 11 on page 130 and in Note 4 on page 153 of the financial statements.
Changes in Gross Impaired Loans and Acceptances (1)
| | | | | | | | | | | | |
(Canadian $ in millions, except as noted) For the year ended October 31 | | 2016 | | | 2015 | | | 2014 | |
GIL, beginning of year | | | 1,959 | | | | 2,048 | | | | 2,544 | |
Classified as impaired during the year | | | 2,512 | | | | 1,921 | | | | 2,142 | |
Transferred to not impaired during the year | | | (577 | ) | | | (556 | ) | | | (669 | ) |
Net repayments | | | (869 | ) | | | (700 | ) | | | (1,059 | ) |
Amounts written off | | | (706 | ) | | | (704 | ) | | | (801 | ) |
Recoveries of loans and advances previously written off | | | – | | | | – | | | | – | |
Disposals of loans | | | (34 | ) | | | (252 | ) | | | (220 | ) |
Foreign exchange and other movements | | | 47 | | | | 202 | | | | 111 | |
GIL, end of year | | | 2,332 | | | | 1,959 | | | | 2,048 | |
GIL as a % of gross loans and acceptances | | | 0.62 | | | | 0.58 | | | | 0.67 | |
| | (1) | GIL excludes purchased credit impaired loans. |
Allowance for Credit Losses (ACL)
Across all loan portfolios, BMO employs a disciplined approach to provisioning and loan loss evaluation, with the prompt identification of problem loans being a key risk management objective. BMO maintains both specific and collective allowances for credit losses. Specific allowances reduce the aggregate carrying value of credit assets for which there is evidence of deterioration in credit quality. BMO also maintains a collective allowance in order to cover any impairment in the existing loan portfolio that cannot yet be associated with individually identified loans. Our approach to establishing and maintaining the collective allowance is based on the requirements of IFRS, in conjunction with guidelines issued by our regulator, OSFI. Our collective allowance methodology groups loans on the basis of similar credit risk characteristics, and applies quantitative and qualitative factors to determine the appropriate level for the collective allowance. The quantitative component of the methodology measures expected long-run losses based on the PD, LGD and EAD risk parameters used in the models we employ to estimate risk-based capital. For commercial and corporate loans, key determinants of incurred but not identified losses include the underlying risk rating of the borrower, industry sector, credit product and amount and quality of collateral held. For consumer and small business loans, exposures are pooled based on similar risk characteristics and the levels of incurred but not identified losses are determined based on the long-run default and historical loss experience of each pool. The qualitative component of the methodology reflects management’s judgment with respect to current and near-term macroeconomic and business conditions, portfolio-specific considerations, credit quality trends, changes in lending practices and model factors. We review the collective allowance on a quarterly basis.
BMO maintains the allowance for credit losses at a level that we consider adequate to absorb credit-related losses. As at October 31, 2016, our ACL was $2,114 million, comprised of specific allowances of $432 million and a collective allowance of $1,682 million. This includes specific allowances of $27 million and a collective allowance of $162 million related to undrawn commitments and letters of credit that are considered other credit instruments and recorded in other liabilities. Total ACL increased year over year by $62 million, in part due to the impact of the stronger U.S. dollar. Our coverage ratios remain adequate, with specific ACL as a percentage of GIL at 17.4%.
The collective allowance increased by $22 million from 2015 to $1,682 million in 2016. The collective allowance remains adequate and at year end represented 0.76% of credit risk-weighted assets.
Factors contributing to the change in ACL are outlined in the following table. Further details on changes in ACL by country and portfolio can be found in Tables 12 and 13 on page 132 and in Note 4 on page 153 of the financial statements.
| | | | |
| BMO Financial Group 199th Annual Report 2016 | | | 91 | |
MANAGEMENT’S DISCUSSION AND ANALYSIS
Changes in Allowance for Credit Losses(1)
| | | | | | | | | | | | |
(Canadian $ in millions, except as noted) For the year ended October 31 | | 2016 | | | 2015 | | | 2014 | |
Specific ACL, beginning of year | | | 392 | | | | 424 | | | | 485 | |
Specific PCL (charge to income statement) | | | 815 | | | | 612 | | | | 561 | |
Recoveries of amounts written off in previous years | | | 343 | | | | 456 | | | | 624 | |
Write-offs | | | (1,047 | ) | | | (1,065 | ) | | | (1,149 | ) |
Foreign exchange and other movements | | | (71 | ) | | | (35 | ) | | | (97 | ) |
Specific ACL, end of year | | | 432 | | | | 392 | | | | 424 | |
Collective ACL, beginning of year | | | 1,660 | | | | 1,542 | | | | 1,485 | |
Collective PCL (charge to income statement) | | | – | | | | – | | | | – | |
Foreign exchange and other movements | | | 22 | | | | 118 | | | | 57 | |
Collective ACL, end of year | | | 1,682 | | | | 1,660 | | | | 1,542 | |
Total ACL | | | 2,114 | | | | 2,052 | | | | 1,966 | |
Comprised of: | | | | | | | | | | | | |
Loans | | | 1,925 | | | | 1,855 | | | | 1,734 | |
Specific allowance for other credit instruments | | | 27 | | | | 35 | | | | 50 | |
Collective allowance for other credit instruments | | | 162 | | | | 162 | | | | 182 | |
Specific ACL as a % of GIL (2) | | | 17.4 | | | | 18.2 | | | | 18.3 | |
| | (1) | Includes allowances related to other credit instruments that are included in other liabilities. |
| | (2) | Ratio excludes specific allowances for other credit instruments that are included in other liabilities. |
| | |
| 92 | | BMO Financial Group 199th Annual Report 2016 |
European Exposures
BMO’s geographic exposures are subject to a country risk management framework that incorporates economic and political assessments and management of exposure within limits based on product, entity and the country of ultimate risk. We closely monitor our European exposures, and our risk management processes incorporate stress tests as appropriate to assess our potential risk. Our exposure to European countries, as at October 31, 2016, including Greece, Ireland, Italy, Portugal and Spain (GIIPS), is set out in the tables that follow.
The table below outlines total net portfolio exposures for funded lending, securities (inclusive of credit default swap (CDS) activity), repo-style transactions and derivatives. Funded lending is detailed by counterparty type, as well as by total commitments compared to the funded amount, in the table on page 94.
European Exposure by Country and Counterparty(1)
| | | | | | | | | | | | | | | | | | | | | | | | | | | | | | | | | | | | | | | | | | | | | | | | | | | | |
(Canadian $ in millions) As at October 31, 2016 | | Funded lending (2) | | | | | | Securities (3)(4) | | | | | | Repo-style transactions and derivatives (5)(6) | | | | | | Total net
exposure | |
| Country | | Total | | | | | | Bank | | | Corporate | | | Sovereign | | | Total | | | | | | Bank | | | Corporate | | | Sovereign | | | Total | | | | | |
GIIPS | | | | | | | | | | | | | | | | | | | | | | | | | | | | | | | | | | | | | | | | | | | | | | | | | | | | |
Greece | | | – | | | | | | | | – | | | | – | | | | – | | | | – | | | | | | | | – | | | | – | | | | – | | | | – | | | | | | | | – | |
Ireland (7) | | | 25 | | | | | | | | – | | | | – | | | | – | | | | – | | | | | | | | 299 | | | | 55 | | | | – | | | | 354 | | | | | | | | 379 | |
Italy | | | – | | | | | | | | – | | | | – | | | | – | | | | – | | | | | | | | 2 | | | | 3 | | | | – | | | | 5 | | | | | | | | 5 | |
Portugal | | | – | | | | | | | | – | | | | – | | | | – | | | | – | | | | | | | | – | | | | – | | | | – | | | | – | | | | | | | | – | |
Spain | | | 53 | | | | | | | | 6 | | | | – | | | | – | | | | 6 | | | | | | | | 1 | | | | – | | | | – | | | | 1 | | | | | | | | 60 | |
Total – GIIPS | | | 78 | | | | | | | | 6 | | | | – | | | | – | | | | 6 | | | | | | | | 302 | | | | 58 | | | | – | | | | 360 | | | | | | | | 444 | |
Eurozone (excluding GIIPS) | | | | | | | | | | | | | | | | | | | | | | | | | | | | | | | | | | | | | | | | | | | | | | | | | | | | |
France | | | 111 | | | | | | | | 76 | | | | 1 | | | | 171 | | | | 248 | | | | | | | | 43 | | | | – | | | | 16 | | | | 59 | | | | | | | | 418 | |
Germany | | | 133 | | | | | | | | – | | | | 33 | | | | 1,173 | | | | 1,206 | | | | | | | | 49 | | | | 5 | | | | 9 | | | | 63 | | | | | | | | 1,402 | |
Luxembourg | | | 291 | | | | | | | | – | | | | – | | | | – | | | | – | | | | | | | | – | | | | 36 | | | | – | | | | 36 | | | | | | | | 327 | |
Netherlands | | | 502 | | | | | | | | 388 | | | | 14 | | | | 135 | | | | 537 | | | | | | | | 9 | | | | 40 | | | | – | | | | 49 | | | | | | | | 1,088 | |
Other (8) | | | 27 | | | | | | | | – | | | | – | | | | 101 | | | | 101 | | | | | | | | 2 | | | | 3 | | | | 7 | | | | 12 | | | | | | | | 140 | |
Total – Eurozone (excluding GIIPS) | | | 1,064 | | | | | | | | 464 | | | | 48 | | | | 1,580 | | | | 2,092 | | | | | | | | 103 | | | | 84 | | | | 32 | | | | 219 | | | | | | | | 3,375 | |
Rest of Europe | | | | | | | | | | | | | | | | | | | | | | | | | | | | | | | | | | | | | | | | | | | | | | | | | | | | |
Denmark | | | 11 | | | | | | | | 304 | | | | – | | | | 50 | | | | 354 | | | | | | | | 2 | | | | – | | | | – | | | | 2 | | | | | | | | 367 | |
Norway | | | 135 | | | | | | | | 653 | | | | – | | | | – | | | | 653 | | | | | | | | – | | | | – | | | | – | | | | – | | | | | | | | 788 | |
Sweden | | | 59 | | | | | | | | 108 | | | | – | | | | 242 | | | | 350 | | | | | | | | 3 | | | | – | | | | – | | | | 3 | | | | | | | | 412 | |
United Kingdom | | | 543 | | | | | | | | 68 | | | | 57 | | | | 313 | | | | 438 | | | | | | | | 1,294 | | | | 143 | | | | 9 | | | | 1,446 | | | | | | | | 2,427 | |
Other (8) | | | 133 | | | | | | | | – | | | | – | | | | – | | | | – | | | | | | | | 58 | | | | 9 | | | | – | | | | 67 | | | | | | | | 200 | |
Total – Rest of Europe | | | 881 | | | | | | | | 1,133 | | | | 57 | | | | 605 | | | | 1,795 | | | | | | | | 1,357 | | | | 152 | | | | 9 | | | | 1,518 | | | | | | | | 4,194 | |
Total – All of Europe(9) | | | 2,023 | | | | | | | | 1,603 | | | | 105 | | | | 2,185 | | | | 3,893 | | | | | | | | 1,762 | | | | 294 | | | | 41 | | | | 2,097 | | | | | | | | 8,013 | |
| | | | | | | |
| As at October 31, 2015 | | Funded lending (2) | | | | | | Securities (3) | | | | | | Repo-style transactions and derivatives (5)(6) | | | | | | Total net
exposure | |
| Country | | Total | | | | | | Bank | | | Corporate | | | Sovereign | | | Total | | | | | | Bank | | | Corporate | | | Sovereign | | | Total | | | | | |
Total – GIIPS | | | 73 | | | | | | | | – | | | | – | | | | – | | | | – | | | | | | | | 8 | | | | 24 | | | | – | | | | 32 | | | | | | | | 105 | |
Total – Eurozone (excluding GIIPS) | | | 640 | | | | | | | | 535 | | | | 14 | | | | 1,801 | | | | 2,350 | | | | | | | | 93 | | | | 36 | | | | 8 | | | | 137 | | | | | | | | 3,127 | |
Total – Rest of Europe | | | 523 | | | | | | | | 1,217 | | | | 49 | | | | 946 | | | | 2,212 | | | | | | | | 736 | | | | 16 | | | | 1 | | | | 753 | | | | | | | | 3,488 | |
Total – All of Europe (9) | | | 1,236 | | | | | | | | 1,752 | | | | 63 | | | | 2,747 | | | | 4,562 | | | | | | | | 837 | | | | 76 | | | | 9 | | | | 922 | | | | | | | | 6,720 | |
| | (1) | BMO has the following indirect exposures to Europe as at October 31, 2016: |
| | – | Collateral of€427 million to support trading activity in securities (€13 million from GIIPS) and€70 million of cash collateral held. |
| | – | Guarantees of $1.2 billion ($28 million to GIIPS). |
| | (2) | Funded lending includes loans. |
| | (3) | Securities include cash products, insurance investments and traded credit. |
| | (4) | BMO’s total net notional CDS exposure (embedded as part of the securities exposure in this table) to Europe was $258 million, with no net single-name* CDS exposure to GIIPS countries as at October 31, 2016 (*includes a net position of $162 million (bought protection) on a CDS Index, of which 19% is comprised of GIIPS domiciled entities). |
| | (5) | Repo-style transactions are primarily with bank counterparties for which BMO holds collateral ($9.6 billion for Europe as at October 31, 2016). |
| | (6) | Derivatives amounts are marked-to-market, incorporating transaction netting where master netting agreements with counterparties have been entered into, and collateral offsets for counterparties where a Credit Support Annex is in effect. |
| | (7) | Does not include Irish subsidiary reserves we are required to maintain with the Irish Central Bank of $108 million as at October 31, 2016. |
| | (8) | Includes countries with less than $300 million net exposure, with $15 million exposure to the Russian Federation as at October 31, 2016. |
| | (9) | Of our total net direct exposure to Europe, approximately 57% was to counterparties in countries with a rating of Aaa/AAA from at least one of Moody’s and S&P. |
| | | | |
| BMO Financial Group 199th Annual Report 2016 | | | 93 | |
MANAGEMENT’S DISCUSSION AND ANALYSIS
European Lending Exposure by Country and Counterparty(9)
| | | | | | | | | | | | | | | | | | | | | | | | | | | | | | | | | | | | |
| | | Lending (2) | |
(Canadian $ in millions) Country | | Funded lending as at October 31, 2016 | | | | | | As at October 31, 2016 | | | | | | As at October 31, 2015 | |
| | Bank | | | Corporate | | | Sovereign | | | | | | Commitments | | | Funded | | | | | | Commitments | | | Funded | |
GIIPS | | | | | | | | | | | | | | | | | | | | | | | | | | | | | | | | | | | | |
Greece | | | – | | | | – | | | | – | | | | | | | | – | | | | – | | | | | | | | – | | | | – | |
Ireland (7) | | | – | | | | 25 | | | | – | | | | | | | | 126 | | | | 25 | | | | | | | | 27 | | | | 8 | |
Italy | | | – | | | | – | | | | – | | | | | | | | – | | | | – | | | | | | | | 2 | | | | 2 | |
Portugal | | | – | | | | – | | | | – | | | | | | | | – | | | | – | | | | | | | | – | | | | – | |
Spain | | | 43 | | | | 10 | | | | – | | | | | | | | 80 | | | | 53 | | | | | | | | 75 | | | | 63 | |
Total – GIIPS | | | 43 | | | | 35 | | | | – | | | | | | | | 206 | | | | 78 | | | | | | | | 104 | | | | 73 | |
Eurozone (excluding GIIPS) | | | | | | | | | | | | | | | | | | | | | | | | | | | | | | | | | | | | |
France | | | 111 | | | | – | | | | – | | | | | | | | 155 | | | | 111 | | | | | | | | 64 | | | | 30 | |
Germany | | | 19 | | | | 113 | | | | 1 | | | | | | | | 207 | | | | 133 | | | | | | | | 79 | | | | 72 | |
Luxembourg | | | 81 | | | | 210 | | | | – | | | | | | | | 409 | | | | 291 | | | | | | | | 328 | | | | 159 | |
Netherlands | | | 56 | | | | 446 | | | | – | | | | | | | | 661 | | | | 502 | | | | | | | | 346 | | | | 245 | |
Other (8) | | | 10 | | | | 17 | | | | – | | | | | | | | 27 | | | | 27 | | | | | | | | 231 | | | | 134 | |
Total – Eurozone (excluding GIIPS) | | | 277 | | | | 786 | | | | 1 | | | | | | | | 1,459 | | | | 1,064 | | | | | | | | 1,048 | | | | 640 | |
Rest of Europe | | | | | | | | | | | | | | | | | | | | | | | | | | | | | | | | | | | | |
Denmark | | | 11 | | | | – | | | | – | | | | | | | | 11 | | | | 11 | | | | | | | | 6 | | | | 6 | |
Norway | | | 26 | | | | 109 | | | | – | | | | | | | | 200 | | | | 135 | | | | | | | | 26 | | | | 26 | |
Sweden | | | 8 | | | | 51 | | | | – | | | | | | | | 202 | | | | 59 | | | | | | | | 150 | | | | 13 | |
United Kingdom | | | 76 | | | | 467 | | | | – | | | | | | | | 808 | | | | 543 | | | | | | | | 459 | | | | 387 | |
Other (8) | | | 29 | | | | 104 | | | | – | | | | | | | | 215 | | | | 133 | | | | | | | | 137 | | | | 91 | |
Total – Rest of Europe | | | 150 | | | | 731 | | | | – | | | | | | | | 1,436 | | | | 881 | | | | | | | | 778 | | | | 523 | |
Total – All of Europe(9) | | | 470 | | | | 1,552 | | | | 1 | | | | | | | | 3,101 | | | | 2,023 | | | | | | | | 1,930 | | | | 1,236 | |
Refer to footnotes in the table on page 93.
Derivative Transactions
The following table represents the notional amounts of our over-the-counter (OTC) derivative contracts, comprised of those which are centrally cleared and settled through a designated clearing house or central counterparty and those which are non-centrally cleared. Designated clearing houses and central counterparties are established under the supervision of central banks or other similar regulatory authorities and, as financial market infrastructure, must satisfy certain financial resilience requirements. Generally speaking, to centrally clear, BMO acquires a membership in the central counterparty and, in addition to providing collateral to protect the central counterparty against BMO risk, BMO is at risk as a member for its contribution to a default fund and may be called on to make additional contributions, or to provide other support in the event another member defaults.
The notional amounts of our derivatives represent the amount to which a rate or price is applied in order to calculate the amount of cash that must be exchanged under the contract. Notional amounts do not represent assets or liabilities and therefore are not recorded in our Consolidated Balance Sheet. The fair values of OTC derivative contracts are recorded in our Consolidated Balance Sheet.
Over-the-Counter Derivatives(1) (Notional amounts)
| | | | | | | | | | | | | | | | | | | | | | | | | | | | | | | | |
| (Canadian $ in millions) | | Non-centrally cleared | | | | | | Centrally cleared | | | | | | Total | |
| As at October 31 | | 2016 | | | 2015 | | | | | | 2016 | | | 2015 | | | | | | 2016 | | | 2015 | |
Interest Rate Contracts | | | | | | | | | | | | | | | | | | | | | | | | | | | | | | | | |
Swaps | | | 575,523 | | | | 690,375 | | | | | | | | 2,151,178 | | | | 2,269,412 | | | | | | | | 2,726,701 | | | | 2,959,787 | |
Forward rate agreements | | | 1,288 | | | | 2,563 | | | | | | | | 429,219 | | | | 430,181 | | | | | | | | 430,507 | | | | 432,744 | |
Purchased options | | | 29,508 | | | | 21,344 | | | | | | | | – | | | | – | | | | | | | | 29,508 | | | | 21,344 | |
Written options | | | 43,921 | | | | 24,154 | | | | | | | | – | | | | – | | | | | | | | 43,921 | | | | 24,154 | |
Total interest rate contracts | | | 650,240 | | | | 738,436 | | | | | | | | 2,580,397 | | | | 2,699,593 | | | | | | | | 3,230,637 | | | | 3,438,029 | |
Foreign Exchange Contracts | | | | | | | | | | | | | | | | | | | | | | | | | | | | | | | | |
Cross-currency swaps | | | 89,354 | | | | 76,083 | | | | | | | | – | | | | – | | | | | | | | 89,354 | | | | 76,083 | |
Cross-currency interest rate swaps | | | 382,666 | | | | 339,467 | | | | | | | | – | | | | – | | | | | | | | 382,666 | | | | 339,467 | |
Forward foreign exchange contracts | | | 409,189 | | | | 393,098 | | | | | | | | – | | | | – | | | | | | | | 409,189 | | | | 393,098 | |
Purchased options | | | 29,876 | | | | 28,297 | | | | | | | | – | | | | – | | | | | | | | 29,876 | | | | 28,297 | |
Written options | | | 30,405 | | | | 28,960 | | | | | | | | – | | | | – | | | | | | | | 30,405 | | | | 28,960 | |
Total foreign exchange contracts | | | 941,490 | | | | 865,905 | | | | | | | | – | | | | – | | | | | | | | 941,490 | | | | 865,905 | |
Commodity Contracts | | | | | | | | | | | | | | | | | | | | | | | | | | | | | | | | |
Swaps | | | 13,603 | | | | 11,929 | | | | | | | | – | | | | – | | | | | | | | 13,603 | | | | 11,929 | |
Purchased options | | | 6,828 | | | | 6,172 | | | | | | | | – | | | | – | | | | | | | | 6,828 | | | | 6,172 | |
Written options | | | 4,672 | | | | 4,103 | | | | | | | | – | | | | – | | | | | | | | 4,672 | | | | 4,103 | |
Total commodity contracts | | | 25,103 | | | | 22,204 | | | | | | | | – | | | | – | | | | | | | | 25,103 | | | | 22,204 | |
Equity Contracts | | | 58,313 | | | | 47,114 | | | | | | | | – | | | | – | | | | | | | | 58,313 | | | | 47,114 | |
Credit Default Swaps | | | | | | | | | | | | | | | | | | | | | | | | | | | | | | | | |
Purchased | | | 1,730 | | | | 4,365 | | | | | | | | 1,303 | | | | 1,054 | | | | | | | | 3,033 | | | | 5,419 | |
Written | | | 793 | | | | 9,154 | | | | | | | | 188 | | | | – | | | | | | | | 981 | | | | 9,154 | |
Total credit default swaps | | | 2,523 | | | | 13,519 | | | | | | | | 1,491 | | | | 1,054 | | | | | | | | 4,014 | | | | 14,573 | |
Total | | | 1,677,669 | | | | 1,687,178 | | | | | | | | 2,581,888 | | | | 2,700,647 | | | | | | | | 4,259,557 | | | | 4,387,825 | |
| (1) | Certain comparative figures have been reclassified to conform with the current year’s presentation. |
| | |
| 94 | | BMO Financial Group 199th Annual Report 2016 |
Market Risk
Market risk is the potential for adverse changes in the value of BMO’s assets and liabilities resulting from changes in market variables such as interest rates, foreign exchange rates, equity and commodity prices and their implied volatilities, and credit spreads, and includes the risk of credit migration and default in our trading book.
BMO incurs market risk in its trading and underwriting activities and structural banking activities. The magnitude and importance of these activities to the enterprise, along with the relative uncertainty of daily changes in market variables, require a strong and balanced market risk structure that incorporates appropriate and reliable governance, management and measurement. The bank continued to enhance its three-lines-of-defence framework in all areas of Market Risk management in 2016.
Trading and Underwriting Market Risk Governance
As part of our enterprise-wide risk management framework, we apply comprehensive governance and management processes to our market risk-taking activities. The RRC has oversight of the management of market risk and approves the market risk Corporate Policy, along with limits governing market risk exposures. The RMC, which recommends the market risk Corporate Policy for approval, regularly reviews and discusses significant market risk issues and positions, and provides senior management oversight. These committees are informed of specific risk exposures or other factors that could expose BMO to unusual, unexpected, inappropriate or otherwise not fully identified or quantified risks associated with market or traded credit exposures, as well as other relevant market risk issues. In addition, all individuals authorized to conduct trading and underwriting activities on behalf of BMO are appropriately notified of BMO’s risk-taking governance, authority structure, procedures and processes, are given guidance on the relevant corporate policies and standards, and are required to adhere to those policies and standards and to trade and maintain exposures within specified limits and risk tolerances.
Trading and Underwriting Market Risk Management
We have an independent and professional market risk oversight group that identifies, measures, and limits the market risk inherent in the bank. We monitor an extensive range of risk metrics, including Value at Risk (VaR), Stressed Value at Risk (SVaR), stress and scenario tests, risk sensitivities and operational metrics. We apply a comprehensive set of limits to these metrics with appropriate monitoring, reporting, and escalation of limit breaches. Risk profiles of our trading and underwriting activities are maintained within our risk appetite and supporting limits, and are monitored and reported to traders, management, senior executives and Board committees. Further key controls include the independent valuation of financial assets and liabilities, as well as compliance with our model risk management framework to mitigate model risk.
BMO’s Market Risk group also provides oversight of structural market risk, which is managed by BMO’s Corporate Treasury group and described on page 98.
Valuation Product Control
Within the Market Risk group, the Valuation Product Control (VPC) group is responsible for the independent valuation of all trading and available-for-sale (AFS) portfolios within Capital Markets Trading Products and Corporate Treasury, to confirm that they are materially accurate by:
| • | | developing and maintaining valuation adjustment policies and procedures in accordance with regulatory requirements and IFRS; |
| • | | establishing official rate sources for valuation of all portfolios; and |
| • | | providing an independent review of portfolios where prices supplied by traders are used for valuation. |
Trader valuations are reviewed to determine whether they align with an independent assessment of the market value of the related portfolio. If a valuation difference exceeds the prescribed tolerance threshold, a valuation adjustment is recorded in accordance with our accounting policy and regulatory requirements. Prior to the final month-end general ledger close, the Valuation Operating Committee, comprised of key stakeholders from the lines of business, Market Risk, Capital Markets Finance, Corporate Treasury and the Chief Accountant’s Group, reviews all valuation adjustments that are proposed by the VPC group.
The Valuation Steering Committee is BMO’s senior management valuation committee. It meets at least monthly to address the more challenging material valuation issues related to BMO’s portfolios, approves valuation adjustments and methodology changes, and acts as a key forum for discussing positions categorized as Level 3 inputs for financial reporting purposes and their inherent uncertainty.
At a minimum, the following are considered when determining appropriate valuation adjustments: credit valuation adjustments, closeout costs, uncertainty, funding valuation adjustments, liquidity and model risk. A fair value hierarchy is used to categorize the inputs used in the valuation of securities, liabilities, derivative assets and derivative liabilities. Level 1 inputs consist of quoted market prices, Level 2 inputs consist of models that use observable market information and Level 3 inputs consist of results from models for which observable market information is not available. Details of Level 1, Level 2 and Level 3 fair value measurements can be found in Note 17 on page 177 of the financial statements.
Trading and Underwriting Market Risk Measurement
To capture, measure, and control the multi-dimensional aspects of market risk effectively, a number of metrics and techniques are used, including VaR, SVaR, stress testing, sensitivities, position concentrations, notional values, and revenue losses.
Value at Risk (VaR) is measured for specific classes of risk in BMO’s trading and underwriting activities related to interest rates, foreign exchange rates, credit spreads, equity and commodity prices and their implied volatilities. This measure calculates the maximum loss likely to be experienced in the trading and underwriting portfolios, measured at a 99% confidence level over a specified holding period.
Stressed Value at Risk (SVaR) is measured for specific classes of risk in BMO’s trading and underwriting activities related to interest rates, foreign exchange rates, credit spreads, equity and commodity prices and their implied volatilities, where model inputs are calibrated to historical data from a period of significant financial stress. This measure calculates the maximum loss likely to be experienced in the trading and underwriting portfolios, measured at a 99% confidence level over a specified holding period.
Material presented in a blue-tinted font above is an integral part of the 2016 annual consolidated financial statements (see page 79).
| | | | |
| BMO Financial Group 199th Annual Report 2016 | | | 95 | |
MANAGEMENT’S DISCUSSION AND ANALYSIS
Although it is a valuable indicator of risk, VaR should always be viewed in the context of its limitations. Among these limitations is the assumption that all positions can be liquidated within the assigned one-day holding period (ten-day holding period for regulatory calculations), which may not be the case in illiquid market conditions, and that historical data can be used as a proxy to forecast future market events. Generally, market liquidity horizons are reviewed for suitability and updated where appropriate for relevant risk metrics. Scenario analysis and probabilistic stress testing are performed daily to determine the potential impact of unusual and/or unexpected market changes on our portfolios. As well, historical and event stresses are tested on a weekly basis, including tests of scenarios such as the stock market crash of 1987 and the collapse of Lehman Brothers in 2008. Targeted portfolio and risks or other ad-hoc analyses are conducted to examine our sensitivity to low-frequency, high-severity hypothetical scenarios. Scenarios are amended, added or removed to better reflect changes in underlying market conditions. The results are reported to the lines of business, the RMC and the RRC on a regular basis. Stress testing is limited by the fact that not all downside scenarios can be predicted and effectively modelled. Neither VaR nor stress testing should be viewed as a definitive predictor of the maximum amount of losses that could occur in any one day, because these measures are based on models and estimates (such as confidence levels) and their results could be exceeded in highly volatile market conditions. On a daily basis, exposures are aggregated by lines of business and risk type and monitored against delegated limit levels, and the results are reported to the appropriate stakeholders. BMO has a robust governance process in place designed to ensure adherence to delegated market risk limits. Amounts exceeding those limits are reported to senior management on a timely basis for resolution and appropriate action.
In addition, we measure the market risk for trading and underwriting portfolios that meet regulatory criteria for trading book capital treatment using the Internal Models Approach. For trading and underwriting portfolios covered by the Internal Models Approach, VaR is computed using BMO’s Trading Book VaR model. This is a Monte Carlo scenario simulation model, and its results are used for market risk management and reporting of exposures. The model computes one-day VaR results using a 99% confidence level, and those results reflect the historical correlations between the different classes of market risk factors. We also apply this approach in measuring the market risk for portfolios that are accorded banking book regulatory capital treatment.
We use a variety of methods to verify the integrity of our risk models, including the application of back-testing against hypothetical losses. This process assumes there are no changes in the previous day’s closing positions and then isolates the effects of each day’s price movements against those closing positions. Models are validated by assessing how often the calculated hypothetical losses exceed the VaR measure over a defined period. This testing is aligned with defined regulatory expectations, and its results confirm the reliability of our models. The volatility data and correlations that underpin our models are updated monthly, so that VaR measures reflect current conditions.
Our models are used to determine market risk Economic Capital for each of our lines of business and to determine regulatory capital. For capital calculation purposes, the longer holding periods and/or higher confidence levels that are used are not necessarily the same as those employed in day-to-day risk management. Under the Model Risk Corporate Policy, models are subject to validation by our Model Risk Validation group prior to use. The Model Risk Corporate Policy outlines minimum requirements for the identification, assessment, monitoring and management of models and model risk across the enterprise, and is described on page 107.
The end of the year calculation of Total Trading VaR decreased year over year, while Total Trading Stressed VaR increased. Average fiscal 2016 daily/weekly calculations for both figures ended within 10% of the average of fiscal 2015. Over the year, methodology changes had the largest effects on average Interest Rate VaR for both VaR and SVaR, where there was a large increase, and on average Credit VaR, where there was a significant decrease. Equity and foreign exchange VaR figures were affected by lower exposures.
Total Trading Value at Risk (VaR) Summary(1)
| | | | | | | | | | | | | | | | | | | | |
As at or for the year ended October 31 (pre-tax Canadian $ equivalent in millions) | | 2016 | | | 2015 | |
| | Year-end | | | Average | | | High | | | Low | | | Year-end | |
Commodity VaR | | | (0.7 | ) | | | (0.5 | ) | | | (1.4 | ) | | | (0.3 | ) | | | (0.4 | ) |
Equity VaR | | | (4.5 | ) | | | (6.1 | ) | | | (9.9 | ) | | | (3.1 | ) | | | (6.9 | ) |
Foreign exchange VaR | | | (1.8 | ) | | | (1.0 | ) | | | (3.3 | ) | | | (0.3 | ) | | | (2.6 | ) |
Interest rate VaR | | | (10.3 | ) | | | (10.2 | ) | | | (16.2 | ) | | | (5.6 | ) | | | (10.5 | ) |
Credit VaR | | | (2.0 | ) | | | (2.5 | ) | | | (5.0 | ) | | | (1.4 | ) | | | (2.7 | ) |
Diversification | | | 9.3 | | | | 8.7 | | | | nm | | | | nm | | | | 9.8 | |
Total Trading VaR | | | (10.0 | ) | | | (11.6 | ) | | | (18.8 | ) | | | (6.5 | ) | | | (13.3 | ) |
|
| Total Trading Stressed Value at Risk (SVaR) Summary(1)(2) | |
As at or for the year ended October 31 (pre-tax Canadian $ equivalent in millions) | | 2016 | | | 2015 | |
| | Year-end | | | Average | | | High | | | Low | | | Year-end | |
Commodity SVaR | | | (1.4 | ) | | | (1.1 | ) | | | (2.0 | ) | | | (0.6 | ) | | | (0.7 | ) |
Equity SVaR | | | (18.7 | ) | | | (14.3 | ) | | | (20.8 | ) | | | (9.2 | ) | | | (17.6 | ) |
Foreign exchange SVaR | | | (3.2 | ) | | | (1.5 | ) | | | (4.7 | ) | | | (0.3 | ) | | | (2.2 | ) |
Interest rate SVaR | | | (23.1 | ) | | | (14.6 | ) | | | (24.6 | ) | | | (7.1 | ) | | | (10.4 | ) |
Credit SVaR | | | (6.5 | ) | | | (6.0 | ) | | | (10.1 | ) | | | (2.8 | ) | | | (5.2 | ) |
Diversification | | | 25.8 | | | | 17.3 | | | | nm | | | | nm | | | | 15.0 | |
Total Trading SVaR | | | (27.1 | ) | | | (20.2 | ) | | | (27.1 | ) | | | (14.4 | ) | | | (21.1 | ) |
| | (1) | One-day measure using a 99% confidence interval. Losses are in brackets and benefits are presented as positive numbers. |
| | (2) | Stressed VaR is produced weekly. |
nm – not meaningful
Material presented in a blue-tinted font above is an integral part of the 2016 annual consolidated financial statements (see page 79).
| | |
| 96 | | BMO Financial Group 199th Annual Report 2016 |
Trading Net Revenue
The charts below present daily net revenues plotted against total trading and AFS VaR, along with a representation of daily net revenue distribution. During the current year, the largest loss occurred on February 11, and was the result of normal trading activity and valuation adjustments. The largest gain occurred on May 31, and was primarily due to normal trading and underwriting activity.
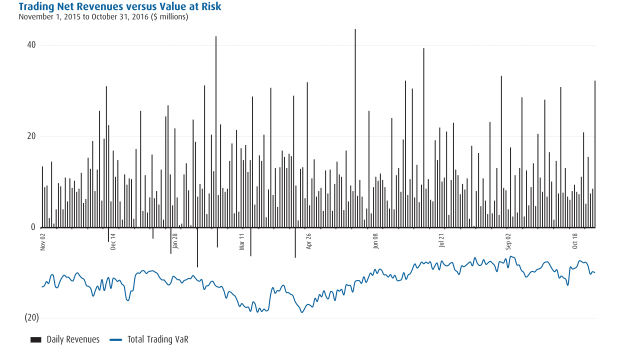
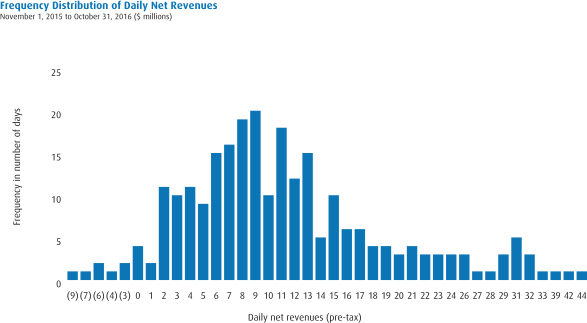
| | | | |
| BMO Financial Group 199th Annual Report 2016 | | | 97 | |
MANAGEMENT’S DISCUSSION AND ANALYSIS
Linkages between Balance Sheet Items and Market Risk Disclosures
The table below presents items reported in our Consolidated Balance Sheet that are subject to market risk, comprised of balances that are subject to either traded risk or non-traded risk measurement techniques.
| | | | | | | | | | | | | | | | | | | | | | | | | | | | | | | | | | | | | | |
| | | As at October 31, 2016 | | | | | | As at October 31, 2015 | | | |
| | | | | | Subject to market risk | | | | | | | | | | | | Subject to market risk | | | | | | |
| (Canadian $ in millions) | | Consolidated Balance Sheet | | | Traded risk (1) | | | Non-traded risk (2) | | | Not subject to
market risk | | | | | | Consolidated Balance Sheet | | | Traded risk (1) | | | Non-traded risk (2) | | | Not subject to
market risk | | | Main risk factors fornon-traded
risk balances |
Assets Subject to Market Risk | | | | | | | | | | | | | | | | | | | | | | | | | | | | | | | | | | | | | | |
Cash and cash equivalents | | | 31,653 | | | | – | | | | 31,653 | | | | – | | | | | | | | 40,295 | | | | – | | | | 40,295 | | | | – | | | Interest rate |
Interest bearing deposits with banks | | | 4,449 | | | | 258 | | | | 4,191 | | | | – | | | | | | | | 7,382 | | | | 1,212 | | | | 6,170 | | | | – | | | Interest rate |
Securities | | | | | | | – | | | | – | | | | – | | | | | | | | | | | | | | | | | | | | | | | |
Trading | | | 84,458 | | | | 76,297 | | | | 8,161 | | | | – | | | | | | | | 72,460 | | | | 65,066 | | | | 7,394 | | | | – | | | Interest rate, credit
spread, equity |
Available-for-sale | | | 55,663 | | | | – | | | | 55,663 | | | | – | | | | | | | | 48,006 | | | | – | | | | 48,006 | | | | – | | | Interest rate, credit
spread |
Held-to-maturity | | | 8,965 | | | | – | | | | 8,965 | | | | – | | | | | | | | 9,432 | | | | – | | | | 9,432 | | | | – | | | Interest rate |
Other | | | 899 | | | | – | | | | 899 | | | | – | | | | | | | | 1,020 | | | | – | | | | 1,020 | | | | – | | | Equity |
Securities borrowed or purchased under resale agreements | | | 66,646 | | | | – | | | | 66,646 | | | | – | | | | | | | | 68,066 | | | | – | | | | 68,066 | | | | – | | | Interest rate |
Loans (net of allowance for credit losses) | | | 358,730 | | | | – | | | | 358,730 | | | | – | | | | | | | | 322,717 | | | | – | | | | 322,717 | | | | – | | | Interest rate,
foreign exchange |
Derivative instruments | | | 39,183 | | | | 37,571 | | | | 1,612 | | | | – | | | | | | | | 38,238 | | | | 35,924 | | | | 2,314 | | | | – | | | Interest rate,
foreign exchange |
Customers’ liability under acceptances | | | 13,021 | | | | – | | | | 13,021 | | | | – | | | | | | | | 11,307 | | | | – | | | | 11,307 | | | | – | | | Interest rate |
Other assets | | | 24,268 | | | | – | | | | 9,149 | | | | 15,119 | | | | | | | | 22,958 | | | | – | | | | 8,195 | | | | 14,763 | | | Interest rate |
Total Assets | | | 687,935 | | | | 114,126 | | | | 558,690 | | | | 15,119 | | | | | | | | 641,881 | | | | 102,202 | | | | 524,916 | | | | 14,763 | | | |
Liabilities Subject to Market Risk | | | | | | | | | | | | | | | | | | | | | | | | | | | | | | | | | | | | | | |
Deposits | | | 473,372 | | | | 11,604 | | | | 461,768 | | | | – | | | | | | | | 438,169 | | | | 9,429 | | | | 428,740 | | | | – | | | Interest rate,
foreign exchange |
Derivative instruments | | | 38,227 | | | | 36,132 | | | | 2,095 | | | | – | | | | | | | | 42,639 | | | | 39,907 | | | | 2,732 | | | | – | | | Interest rate,
foreign exchange |
Acceptances | | | 13,021 | | | | – | | | | 13,021 | | | | – | | | | | | | | 11,307 | | | | – | | | | 11,307 | | | | – | | | Interest rate |
Securities sold but not yet purchased | | | 25,106 | | | | 25,106 | | | | – | | | | – | | | | | | | | 21,226 | | | | 21,226 | | | | – | | | | – | | | |
Securities lent or sold under repurchase agreements | | | 40,718 | | | | – | | | | 40,718 | | | | – | | | | | | | | 39,891 | | | | – | | | | 39,891 | | | | – | | | Interest rate |
Other liabilities | | | 50,724 | | | | – | | | | 50,401 | | | | 323 | | | | | | | | 44,320 | | | | – | | | | 44,218 | | | | 102 | | | Interest rate |
Subordinated debt | | | 4,439 | | | | – | | | | 4,439 | | | | – | | | | | | | | 4,416 | | | | – | | | | 4,416 | | | | – | | | Interest rate |
Total Liabilities | | | 645,607 | | | | 72,842 | | | | 572,442 | | | | 323 | | | | | | | | 601,968 | | | | 70,562 | | | | 531,304 | | | | 102 | | | |
| | (1) | Primarily comprised of BMO’s balance sheet items that are subject to the trading and underwriting risk management framework and fair valued through profit or loss. |
| | (2) | Primarily comprised of BMO’s balance sheet items that are subject to the structural balance sheet and insurance risk management framework, or are available-for-sale securities. |
Certain comparative figures have been reclassified to conform to the current year’s presentation.
Structural (Non-Trading) Market Risk
Structural market risk is comprised of interest rate risk arising from our banking activities (loans and deposits) and foreign exchange risk arising from our foreign currency operations.
Structural Market Risk Governance
The RRC has oversight of the management of structural market risk, annually approves the structural market risk plan and limits, and regularly reviews structural market risk positions. The RMC and the Balance Sheet and Capital Management Committee (BSCMC) regularly review structural market risk positions and provide senior management oversight.
In addition to Board-approved limits on earnings at risk and economic value sensitivities due to changes in interest rates, more granular management limits are in place to guide day-to-day management of this risk. BMO’s Corporate Treasury group is responsible for the ongoing management of structural market risk across the enterprise, with independent oversight provided by the Market Risk group.
Structural Market Risk Measurement
Interest Rate Risk
Structural interest rate risk arises when changes in interest rates affect the cash flows, earnings and values of assets and liabilities related to our banking activities. The objective of structural interest rate risk management is to maintain high-quality earnings and maximize sustainable product spread, while managing the risk to the economic value of our assets due to changes in interest rates.
Structural interest rate risk is primarily comprised of interest rate mismatch risk, product embedded option risk, and risk related to consumer behaviour.
Interest rate mismatch risk arises when there are differences in the scheduled maturities, repricing dates or reference rates of assets, liabilities and derivatives. The net interest rate mismatch, representing residual assets funded by common shareholders’ equity, is managed to a target profile through interest rate swaps and securities.
Material presented in a blue-tinted font above is an integral part of the 2016 annual consolidated financial statements (see page 79).
| | |
| 98 | | BMO Financial Group 199th Annual Report 2016 |
Product embedded option risk arises when product features allow customers to alter cash flows, such as scheduled maturity or repricing dates, usually in response to changes in market conditions. Product embedded options include loan prepayments, deposit redemption privileges and committed rates on unadvanced mortgages. Product embedded option hedging programs may be used to manage this risk to low levels.
Structural interest rate risk is measured using simulations, earnings sensitivity and economic value sensitivity analysis, stress testing and gap analysis, in addition to other traditional risk metrics.
|
Earnings Sensitivity is a measure of the impact of potential changes in interest rates on the projected 12-month pre-tax net income of a
portfolio of assets, liabilities and off-balance sheet positions in response to prescribed parallel interest rate movements. |
|
Economic Value Sensitivity is a measure of the impact of potential changes in interest rates on the market value of a portfolio of assets,
liabilities and off-balance sheet positions in response to prescribed parallel interest rate movements. |
The models used to measure structural interest rate risk project changes in interest rates and predict how customers would likely react to these changes. For customer loans and deposits with scheduled maturity and repricing dates (such as mortgages and term deposits), our models measure the extent to which customers are likely to use embedded options to alter those scheduled terms. For customer loans and deposits without scheduled maturity and repricing dates (such as credit card loans and chequing accounts), we measure our exposure using models that adjust for elasticity in product pricing and reflect historical and forecasted trends in balances. The results of these structural market risk models by their nature have inherent uncertainty, as they reflect potential anticipated pricing and customer behaviours, which may differ from actual experience. These models have been developed using statistical analysis and are validated and periodically updated through regular model validation, back-testing processes and ongoing dialogue with the lines of business. Models developed to predict customer behaviour are also used in support of product pricing.All models are subject to our model risk management framework described in more detail on page 107.
Structural interest rate earnings and economic value sensitivity to an immediate parallel increase or decrease of 100 basis points in the yield curve are disclosed in the following table. The interest rate gap position is disclosed in Note 19 on page 183 of the financial statements.
During the 2016 fiscal year, we introduced a new Canadian deposit model which reflects greater value for, and earnings on, client deposits as rates rise and the impact of minimum modelled client deposit rates as rates fall. There were no other significant changes in our structural market risk management framework during the year.
Structural economic value exposure to rising interest rates primarily reflects a lower market value for fixed-rate loans. Structural economic value sensitivity to falling interest rates primarily reflects the impact of minimum modelled client deposit rates. Structural economic value exposure to rising interest rates increased relative to October 31, 2015, primarily owing to an increase in fixed rate asset holdings, partially offset by the introduction of the new deposit model noted above. The structural economic value benefit to falling interest rates decreased relative to October 31, 2015, primarily due to the impact of minimum modelled client deposit rates in the new model, partially offset by an increase in fixed rate assets. Structural earnings sensitivity quantifies the potential impact of interest rate changes on structural balance sheet revenues over the next twelve months. Structural earnings exposure to falling interest rates primarily reflects the risk of fixed and floating rate loans repricing at lower rates and the more limited ability to reduce deposit pricing as rates fall. Structural earnings benefit to rising interest rates primarily reflects the benefit of widening deposit spreads as interest rates rise. The decrease in benefit to rising rates relative to October 31, 2015 is primarily owing to the increase in fixed rate asset holdings noted above. The increase in the exposure to falling rates relative to October 31, 2015 primarily reflects the greater extent to which U.S. short-term interest rates can now fall after the increase in U.S. rates during the 2016 fiscal year.
Structural Balance Sheet Interest Rate Sensitivity(1) (2) (3) (4) (5)
| | | | | | | | | | | | | | | | |
| | | As at October 31, 2016 | | | As at October 31, 2015 | |
| (Canadian $ in millions) | | Economic value
sensitivity (Pre-tax) | | | Earnings sensitivity over the next 12 months (Pre-tax) | | | Economic value
sensitivity (Pre-tax) | | | Earnings sensitivity over the next 12 months (Pre-tax) | |
100 basis point increase | | | (680.2 | ) | | | 149.0 | | | | (647.6 | ) | | | 220.7 | |
100 basis point decrease | | | 7.3 | | | | (168.9 | ) | | | 107.3 | | | | (95.3 | ) |
| | (1) | We began reporting our structural earnings sensitivities on a pre-tax basis beginning in Q1-2016. Positions for fiscal 2015 have been restated for comparative purposes. |
| | (2) | Earnings and value sensitivities to falling interest rates assume Canadian and U.S. central banks do not decrease overnight interest rates below nil. The scenarios with decreasing interest rates therefore limit the decrease in both Canadian and U.S. short-term interest rates to 50 basis points for shorter terms (2015 – 50 basis points for CAD and 25 basis points for U.S.). Longer-term interest rates do not decrease below the assumed level of short-term interest rates. |
| | (3) | Certain non-trading AFS holdings are managed under the bank’s trading risk framework. |
| | (4) | Losses are in brackets and benefits are presented as positive numbers. |
| | (5) | For BMO’s Insurance businesses, a 100 basis point increase in interest rates at October 31, 2016, results in an increase in earnings before tax of $90 million and an increase in economic value before tax of $623 million ($94 million and $511 million, respectively, at October 31, 2015). A 100 basis point decrease in interest rates at October 31, 2016, results in a decrease in earnings before tax of $87 million and a decrease in economic value before tax of $744 million ($93 million and $612 million, respectively, at October 31, 2015). These impacts are not reflected in the table above. |
Foreign Exchange Risk
Structural foreign exchange risk arises primarily from translation risk related to the net investment in our U.S. operations and from transaction risk associated with our U.S.-dollar-denominated net income.
Translation risk represents the impact that changes in foreign exchange rates can have on BMO’s reported shareholders’ equity and capital ratios. BMO may enter into arrangements to offset the impact of foreign exchange movements on its capital ratios and did so during the 2016 fiscal year.Please see the Enterprise-Wide Capital Management section on page 70 for further information.
Transaction risk represents the impact that fluctuations in the Canadian/U.S. dollar exchange rate may have on the Canadian dollar equivalent of BMO’s U.S.-dollar-denominated financial results. Exchange rate fluctuations will affect future results measured in Canadian dollars and the impact on those results is a function of the periods during which revenues, expenses and provisions for credit losses arise. Hedging positions may be taken to partially offset the pre-tax effects of Canadian/U.S. dollar exchange rate fluctuations on financial results. If future results are consistent with results in 2016, each one cent increase (decrease) in the Canadian/U.S. dollar exchange rate would be expected to increase (decrease) adjusted net income before income taxes for the year by $12 million, in the absence of hedging transactions.Refer to the Foreign Exchange section on page 37 for a more complete discussion of the effects of changes in exchange rates on the bank’s results.
Material presented in a blue-tinted font above is an integral part of the 2016 annual consolidated financial statements (see page 79).
| | | | |
| BMO Financial Group 199th Annual Report 2016 | | | 99 | |
MANAGEMENT’S DISCUSSION AND ANALYSIS
Liquidity and Funding Risk
|
Liquidity and funding risk is the potential for loss if BMO is unable to meet financial commitments in a timely manner at reasonable prices as they fall due. Financial commitments include liabilities to depositors and suppliers, and lending, investment and pledging commitments. |
Managing liquidity and funding risk is essential to maintaining the safety and soundness of the enterprise, depositor confidence and earnings stability. It is BMO’s policy to ensure that sufficient liquid assets and funding capacity are available to meet financial commitments, even in times of stress.
Liquidity and Funding Risk Governance
The Corporate Treasury group and the operating groups are, as the first line of defence, responsible for the ongoing management of liquidity and funding risk across the enterprise. BMO’s Corporate Treasury group is responsible for identifying, understanding, managing, mitigating, monitoring and reporting on BMO’s liquidity and funding risks. The Corporate Treasury group develops and recommends the Liquidity and Funding Risk Management Framework and the related risk appetite, limits and guidelines, monitors compliance with policy requirements and assesses the impact of market events on liquidity requirements on an ongoing basis.
Enterprise Market Risk Management, as the second line of defence, provides oversight, independent risk assessment and effective challenge of liquidity and funding management, frameworks, policies, limits, monitoring and reporting across the organization. The RMC and BSCMC provide senior management oversight and also review and discuss significant liquidity and funding policies, issues and action items that arise in the pursuit of our strategic priorities. The RRC provides oversight of the management of liquidity and funding risk, annually approves applicable policies, limits and the contingency plan, and regularly reviews liquidity and funding positions.
Liquidity and Funding Risk Management
BMO’s Liquidity and Funding Risk Management Framework is defined and authorized under Board-approved corporate policies and management-approved standards. These policies and standards outline key management principles, liquidity and funding metrics and related limits and guidelines, as well as roles and responsibilities for the management of liquidity and funding risk across the enterprise.
BMO has robust limits and guidelines in place in order to manage liquidity and funding risk. Limits establish the enterprise-level risk appetite for our key Net Liquidity Position (NLP) measure, secured and unsecured funding appetite, for both trading and structural activities, and risk appetite for enterprise pledging activity. Guidelines establish the tolerance for concentrations of maturities, requirements for diversifying counterparty liabilities and limits for business pledging activity. Guidelines are also in place to establish the size and type of uncommitted and committed credit and liquidity facilities that may be outstanding in order to confirm that liquidity and funding risk is appropriately managed. An enterprise-wide contingency plan that will facilitate effective management in the event of a disruption is also in place. Early warning indicators identified in the contingency plan are regularly monitored in order to detect any early signs of growing liquidity risk in the market or risks specific to BMO.
BMO legal entities include regulated and foreign subsidiaries and branches, and as a result, movements of funds between entities in the corporate group are subject to, among other things, the liquidity, funding and capital adequacy requirements of the entities. As such, liquidity and funding positions are managed on both a consolidated and key legal entity basis. Liquidity and funding risk management policies and limits are in place for key legal entities which are informed by the legal and regulatory requirements that apply to each entity, and positions are regularly reviewed at the legal entity level to confirm compliance with applicable requirements.
BMO employs funds transfer pricing and liquidity transfer pricing practices to help ensure that the appropriate economic signals for the pricing of products for customers are provided to the lines of business and to assess the performance of each business. These practices capture both the cost of funding assets and the value of deposits under normal operating conditions, as well as the cost of supplemental liquid assets held to meet contingent liquidity requirements.
Liquidity and Funding Risk Measurement
A key component of liquidity risk management is the measurement of liquidity risk under stress. BMO uses our NLP as a key measure of liquidity risk. The NLP represents the amount by which liquid assets exceed potential funding needs under a severe combined enterprise-specific and systemic stress scenario. Potential funding needs may arise from obligations to repay retail, commercial and wholesale deposits that are withdrawn or not renewed or to fund drawdowns on available credit and liquidity lines, or from the requirement to pledge collateral due to ratings downgrades or as a result of market volatility, as well as the continuing need to fund assets and strategic investments. Potential funding needs are quantified by applying factors to various business activities based on management’s view of the relative level of liquidity risk related to each activity. These factors vary by depositor classification (e.g., retail, small business, non-financial corporate or wholesale counterparties) and deposit type (e.g., insured, uninsured, operational or non-operational deposits), as well as by commitment type (e.g., uncommitted or committed credit or liquidity facilities by counterparty type). The stress scenario also considers the time horizon over which liquid assets can be monetized and the related valuation and margin haircuts that may occur as a result of market stress. These funding needs are assessed under severe systemic and enterprise-specific stress scenarios and a combination thereof. BMO focuses on maintaining an NLP sufficient to withstand each scenario.
Stress testing results are compared against BMO’s stated risk tolerance and are considered in management decisions on setting limits, guidelines and internal liquidity transfer pricing, and they also help to shape the design of business plans and contingency plans. The Liquidity and Funding Risk Management Framework is integrated with enterprise-wide stress testing.
In addition to the NLP, we regularly monitor positions in relation to the limits and guidelines noted in the Liquidity and Funding Risk Management section above. These include required regulatory metrics such as the Liquidity Coverage Ratio (LCR) and Net Cumulative Cash Flow (NCCF).
Material presented in a blue-tinted font above is an integral part of the 2016 annual consolidated financial statements (see page 79).
| | |
| 100 | | BMO Financial Group 199th Annual Report 2016 |
Unencumbered Liquid Assets
Unencumbered liquid assets include high-quality assets that are marketable, can be pledged as security for borrowings, and can be converted to cash in a time frame that meets our liquidity and funding requirements. Liquid assets are primarily held in our trading businesses, as well as in supplemental liquidity pools that are maintained for contingent liquidity risk management purposes.The liquidity value recognized for different asset classes under our management framework is subject to haircuts reflecting management’s view of the liquidity value of those assets in a severe stress scenario. Liquid assets in the trading businesses include cash on deposit with central banks and short-term deposits with other financial institutions, highly-rated debt and equity securities and short-term reverse repurchase agreements. Supplemental liquidity pool assets are predominantly comprised of cash on deposit with central banks and securities and short-term reverse repurchase agreements of highly-rated Canadian federal and provincial and U.S. federal government and agency debt. Substantially all supplemental liquidity pool assets meet the definition of high-quality liquid assets under Basel III. Approximately 75% of the supplemental liquidity pool is held at the parent bank level in Canadian- and U.S.-dollar-denominated assets, with the majority of the remaining supplemental liquidity pool held at BMO Harris Bank in U.S.-dollar-denominated assets. The size of the supplemental liquidity pool is integrated with our measurement of liquidity risk. To meet local regulatory requirements, certain of our legal entities maintain their own minimum liquidity positions. There may be legal and regulatory restrictions on our ability to use liquid assets held at one legal entity to support the liquidity requirements of another legal entity.
In the ordinary course of business, BMO may encumber a portion of cash and securities holdings as collateral in support of trading activities and our participation in clearing and payment systems in Canada and abroad. In addition, BMO may receive liquid assets as collateral and may re-pledge these assets in exchange for cash or as collateral in support of trading activities. Net unencumbered liquid assets, defined as on-balance sheet assets such as BMO-owned cash and securities and securities borrowed or purchased under resale agreements, plus other off-balance sheet eligible collateral received, less collateral encumbered, totalled $197.7 billion at October 31, 2016, compared with $188.5 billion at October 31, 2015. The increase in unencumbered liquid assets was primarily due to higher security balances and the impact of the stronger U.S. dollar. Net unencumbered liquid assets are primarily held at the parent bank level, at our U.S. legal entity BMO Harris Bank, and in our broker/dealer operations. In addition to liquid assets, BMO has access to the Bank of Canada’s lending assistance programs, the Federal Reserve Bank discount window in the United States and European Central Bank standby liquidity facilities. We do not consider central bank facilities to be a source of available liquidity when assessing the strength of BMO’s liquidity position.
In addition to cash and securities holdings, BMO may also pledge other assets, including mortgages and loans, to raise long-term secured funding.As part of the Liquidity and Funding Risk Management Framework, a Pledging of Assets Corporate Policy is in place that sets out the framework and pledging limits for financial and non-financial assets.
BMO’s total encumbered assets and unencumbered liquid assets are summarized in the table below. See Note 25 on page 195 of the financial statements for further information on pledged assets.
Liquid Assets
| | | | | | | | | | | | | | | | | | | | | | | | |
| | | As at October 31, 2016 | | | As at October 31, 2015 | |
| (Canadian $ in millions) | | Carrying
value/on- balance sheet
assets(1) | | | Other cash and
securities received | | | Total gross assets(2) | | | Encumbered
assets | | | Net unencumbered
assets(3) | | | Net unencumbered assets (3) | |
Cash and cash equivalents | | | 31,653 | | | | – | | | | 31,653 | | | | 1,957 | | | | 29,696 | | | | 38,063 | |
Deposits with other banks | | | 4,449 | | | | – | | | | 4,449 | | | | – | | | | 4,449 | | | | 7,382 | |
Securities and securities borrowed or purchased under resale agreements | | | | | | | | | | | | | | | | | | | | | | | | |
Sovereigns / Central banks / Multilateral development banks | | | 117,320 | | | | 18,621 | | | | 135,941 | | | | 77,576 | | | | 58,365 | | | | 48,573 | |
Mortgage-backed securities and collateralized mortgage obligations | | | 20,937 | | | | 1,290 | | | | 22,227 | | | | 2,481 | | | | 19,746 | | | | 18,356 | |
Corporate debt | | | 19,188 | | | | 7,869 | | | | 27,057 | | | | 3,202 | | | | 23,855 | | | | 22,444 | |
Corporate equity | | | 59,186 | | | | 19,420 | | | | 78,606 | | | | 37,431 | | | | 41,175 | | | | 35,400 | |
Total securities and securities borrowed or purchased under resale agreements | | | 216,631 | | | | 47,200 | | | | 263,831 | | | | 120,690 | | | | 143,141 | | | | 124,773 | |
NHA mortgage-backed securities (reported as loans at amortized cost) (4) | | | 22,952 | | | | – | | | | 22,952 | | | | 2,516 | | | | 20,436 | | | | 18,245 | |
Total liquid assets | | | 275,685 | | | | 47,200 | | | | 322,885 | | | | 125,163 | | | | 197,722 | | | | 188,463 | |
Other eligible assets at central banks (not included above) (5) | | | 109,656 | | | | – | | | | 109,656 | | | | 398 | | | | 109,258 | | | | 109,939 | |
Undrawn credit lines granted by central banks | | | – | | | | – | | | | – | | | | – | | | | – | | | | – | |
Total liquid assets and other sources | | | 385,341 | | | | 47,200 | | | | 432,541 | | | | 125,561 | | | | 306,980 | | | | 298,402 | |
| | (1) | The carrying values outlined in this table are consistent with the carrying values reported in BMO’s balance sheet as at October 31, 2016. |
| | (2) | Gross assets include on-balance sheet and off-balance sheet assets. |
| | (3) | Net unencumbered liquid assets are defined as on-balance sheet assets, such as BMO-owned cash and securities and securities borrowed or purchased under resale agreements, plus other off-balance sheet eligible collateral received, less encumbered assets. |
| | (4) | Under IFRS, NHA mortgage-backed securities that include mortgages owned by BMO as the underlying collateral are classified as loans. Unencumbered NHA mortgage-backed securities have liquidity value and are included as liquid assets under BMO’s Liquidity and Funding Management Framework. This amount is shown as a separate line item, NHA mortgage-backed securities. |
| | (5) | Represents loans currently lodged at central banks that could potentially be used to access central bank funding. Loans available for pledging as collateral do not include other sources of additional liquidity that may be realized from the loan portfolio, including incremental securitization, covered bond issuances and Federal Home Loan Bank (FHLB) advances. |
Material presented in a blue-tinted font above is an integral part of the 2016 annual consolidated financial statements (see page 79).
| | | | |
| BMO Financial Group 199th Annual Report 2016 | | | 101 | |
MANAGEMENT’S DISCUSSION AND ANALYSIS
Asset Encumbrance
| | | | | | | | | | | | | | | | | | | | |
| | | Total gross
assets (1) | | | Encumbered (2) | | | Net unencumbered | |
(Canadian $ in millions) As at October 31, 2016 | | | Pledged as collateral | | | Other encumbered | | | Other unencumbered (3) | | | Available as collateral (4) | |
Cash and deposits with other banks | | | 36,102 | | | | – | | | | 1,957 | | | | 11 | | | | 34,134 | |
Securities (5) | | | 286,783 | | | | 95,584 | | | | 27,622 | | | | 9,075 | | | | 154,502 | |
Loans and acceptances | | | 335,778 | | | | 57,308 | | | | 398 | | | | 168,814 | | | | 109,258 | |
Other assets | | | | | | | | | | | | | | | | | | | | |
Derivative instruments | | | 39,183 | | | | – | | | | – | | | | 39,183 | | | | – | |
Customers’ liability under acceptances | | | 13,021 | | | | – | | | | – | | | | 13,021 | | | | – | |
Premises and equipment | | | 2,147 | | | | – | | | | – | | | | 2,147 | | | | – | |
Goodwill | | | 6,381 | | | | – | | | | – | | | | 6,381 | | | | – | |
Intangible assets | | | 2,178 | | | | – | | | | – | | | | 2,178 | | | | – | |
Current tax assets | | | 906 | | | | – | | | | – | | | | 906 | | | | – | |
Deferred tax assets | | | 3,101 | | | | – | | | | – | | | | 3,101 | | | | – | |
Other assets | | | 9,555 | | | | – | | | | – | | | | 9,555 | | | | – | |
Total other assets | | | 76,472 | | | | – | | | | – | | | | 76,472 | | | | – | |
Total assets | | | 735,135 | | | | 152,892 | | | | 29,977 | | | | 254,372 | | | | 297,894 | |
| | | |
| | | Total gross
assets (1) | | | Encumbered (2) | | | Net unencumbered | |
(Canadian $ in millions) As at October 31, 2015 | | | Pledged as collateral | | | Other encumbered | | | Other unencumbered (3) | | | Available as collateral (4) | |
Cash and deposits with other banks | | | 47,677 | | | | – | | | | 2,232 | | | | 397 | | | | 45,048 | |
Securities (5) | | | 261,968 | | | | 94,367 | | | | 24,583 | | | | 8,302 | | | | 134,716 | |
Loans and acceptances | | | 300,883 | | | | 43,928 | | | | 1,594 | | | | 145,422 | | | | 109,939 | |
Other assets | | | | | | | | | | | | | | | | | | | | |
Derivative instruments | | | 38,238 | | | | – | | | | – | | | | 38,238 | | | | – | |
Customers’ liability under acceptances | | | 11,307 | | | | – | | | | – | | | | 11,307 | | | | – | |
Premises and equipment | | | 2,285 | | | | – | | | | – | | | | 2,285 | | | | – | |
Goodwill | | | 6,069 | | | | – | | | | – | | | | 6,069 | | | | – | |
Intangible assets | | | 2,208 | | | | – | | | | – | | | | 2,208 | | | | – | |
Current tax assets | | | 561 | | | | – | | | | – | | | | 561 | | | | – | |
Deferred tax assets | | | 3,162 | | | | – | | | | – | | | | 3,162 | | | | – | |
Other assets | | | 8,673 | | | | – | | | | – | | | | 8,673 | | | | – | |
Total other assets | | | 72,503 | | | | – | | | | – | | | | 72,503 | | | | – | |
Total assets | | | 683,031 | | | | 138,295 | | | | 28,409 | | | | 226,624 | | | | 289,703 | |
| | (1) | Gross assets include on-balance sheet and off-balance sheet assets. |
| | (2) | Pledged as collateral refers to the portion of on-balance sheet assets and other cash and securities that is pledged through repurchase agreements, securities lent, derivative contracts, minimum required deposits at central banks and requirements associated with participation in clearing houses and payment systems. Other encumbered assets include assets that are restricted for legal or other reasons, such as restricted cash and short sales. |
| | (3) | Other unencumbered assets include select liquid asset holdings that management believes are not readily available to support BMO’s liquidity requirements. These include cash and securities of $9.1 billion as at October 31, 2016, which include securities held at BMO’s insurance subsidiary, significant equity investments, and certain investments held at our merchant banking business. Other unencumbered assets also include mortgages and loans that may be securitized to access secured funding. |
| | (4) | Loans included as available as collateral represent loans currently lodged at central banks that could potentially be used to access central bank funding. Loans available for pledging as collateral do not include other sources of additional liquidity that may be realized from the loan portfolio, including incremental securitization, covered bond issuances and FHLB advances. |
| | (5) | Includes securities, securities borrowed or purchased under resale agreements and NHA mortgage-backed securities (reported as loans at amortized cost). |
Certain comparative figures have been reclassified to conform with the current year’s presentation.
BMO’s Liquidity Coverage Ratio (LCR) is summarized in the table on the following page. The average month-end LCR for the quarter ended October 31, 2016 of 131% is calculated as the ratio of the stock of High-Quality Liquid Assets (HQLA) to total net stressed cash outflows over the next 30 calendar days. The average LCR ratio is up from 130% last year mainly due to the decrease in net cash outflows. While banks are required to maintain an LCR greater than 100% in normal conditions, banks are also expected to be able to utilize HQLA in a period of stress, which may result in an LCR of less than 100% during that period. BMO’s HQLA are primarily comprised of cash, highly-rated debt issued or backed by governments, highly-rated covered bonds and non-financial corporate debt and non-financial equities that are part of a major stock index. Net cash flows include outflows from deposits, secured and unsecured wholesale funding, commitments and potential collateral requirements, offset by permitted inflows from loans, securities lending activities and other non-HQLA debt maturing over a 30-day horizon. OSFI-prescribed weights are applied to cash flows and HQLA to arrive at the weighted values and the LCR. The LCR is only one measure of a bank’s liquidity position and does not fully capture all of the bank’s liquid assets or the funding alternatives that may be available in a period of stress. BMO’s total liquid assets are shown in the Liquid Assets table on page 101.
| | |
| 102 | | BMO Financial Group 199th Annual Report 2016 |
Liquidity Coverage Ratio
| | | | | | | | |
| | | For the quarter ended October 31, 2016 | |
(Canadian $ in billions, except as noted) | | Total unweighted value (average)(1) (2) | | | Total weighted value (average)(2) (3) | |
High-Quality Liquid Assets | | | | | | | | |
Total high-quality liquid assets (HQLA) | | | * | | | | 132.3 | |
Cash Outflows | | | | | | | | |
Retail deposits and deposits from small business customers, of which: | | | 152.5 | | | | 9.1 | |
Stable deposits | | | 88.5 | | | | 2.7 | |
Less stable deposits | | | 64.0 | | | | 6.4 | |
Unsecured wholesale funding, of which: | | | 142.5 | | | | 80.2 | |
Operational deposits (all counterparties) and deposits in networks of cooperative banks | | | 55.8 | | | | 13.9 | |
Non-operational deposits (all counterparties) | | | 56.2 | | | | 35.8 | |
Unsecured debt | | | 30.5 | | | | 30.5 | |
Secured wholesale funding | | | * | | | | 15.9 | |
Additional requirements, of which: | | | 126.8 | | | | 24.6 | |
Outflows related to derivatives exposures and other collateral requirements | | | 12.4 | | | | 4.8 | |
Outflows related to loss of funding on debt products | | | 2.6 | | | | 2.6 | |
Credit and liquidity facilities | | | 111.8 | | | | 17.2 | |
Other contractual funding obligations | | | 1.2 | | | | – | |
Other contingent funding obligations | | | 331.3 | | | | 6.0 | |
Total cash outflows | | | * | | | | 135.8 | |
Cash Inflows | | | | | | | | |
Secured lending (e.g. reverse repos) | | | 104.3 | | | | 18.2 | |
Inflows from fully performing exposures | | | 10.0 | | | | 6.8 | |
Other cash inflows | | | 10.1 | | | | 10.1 | |
Total cash inflows | | | 124.4 | | | | 35.1 | |
| | |
| | | | | | Total adjusted value(4) | |
Total HQLA | | | | | | | 132.3 | |
Total net cash outflows | | | | | | | 100.7 | |
Liquidity Coverage Ratio (%) | | | | | | | 131 | |
| | |
| For the quarter ended October 31, 2015 | | | | | Total adjusted value (4) | |
Total HQLA | | | | | | | 134.6 | |
Total net cash outflows | | | | | | | 103.6 | |
Liquidity Coverage Ratio (%) | | | | | | | 130 | |
* Disclosure is not required under the LCR disclosure standard.
| | (1) | Unweighted values are calculated at market value (for HQLA) or as outstanding balances maturing or callable within 30 days (for inflows and outflows). |
| | (2) | Averages are calculated based on month-end values during the quarter. |
| | (3) | Weighted values are calculated after the application of the weights prescribed under the OSFI Liquidity Adequacy Requirements (LAR) Guideline for HQLA and cash inflows and outflows. |
| | (4) | Adjusted values are calculated based on total weighted values after applicable caps as defined by the LAR Guideline. |
Funding Strategy
Our funding philosophy requires that secured and unsecured wholesale funding used to support loans and less liquid assets must be of a term (typically maturing in two to ten years) which will support the effective term to maturity of these assets. Wholesale secured and unsecured funding for liquid trading assets is generally shorter term (maturing in one year or less), is aligned with the liquidity of the assets being funded, and is subject to limits on aggregate maturities that are permitted across different time periods. Supplemental liquidity pools are funded with a mix of wholesale term funding.
BMO maintains a large and stable base of customer deposits that, in combination with our strong capital base, is a source of strength. It supports the maintenance of a sound liquidity position and reduces our reliance on wholesale funding. Customer deposits totalled $284.5 billion at the end of the year, up from $261.9 billion in 2015, primarily due to deposit growth and the impact of the stronger U.S. dollar. BMO also receives deposits in support of certain trading activities, receives non-marketable deposits from corporate and institutional customers, and issues retail structured notes. These deposits and notes totalled $49.4 billion as at October 31, 2016.
Total wholesale funding outstanding, largely consisting of negotiable marketable securities, was $170.3 billion at October 31, 2016, with $52.7 billion sourced as secured funding and $117.6 billion sourced as unsecured funding. Wholesale funding outstanding increased from $159.5 billion at October 31, 2015, primarily due to wholesale funding issuances and the impact of the stronger U.S. dollar. The mix and maturities of BMO’s wholesale term funding are outlined in the table below. Additional information on deposit maturities can be found in Note 29 on page 202 of the financial statements. BMO maintains a sizeable portfolio of unencumbered liquid assets, totalling $197.7 billion as at October 31, 2016, that can be monetized to meet potential funding requirements, as described in the Unencumbered Liquid Assets section above.
Diversification of our wholesale funding sources is an important part of our overall liquidity management strategy. BMO’s wholesale funding activities are well-diversified by jurisdiction, currency, investor segment, instrument and maturity profile. BMO maintains ready access to long-term wholesale funding through various borrowing programs, including a European Note Issuance Program, Canadian, Australian and U.S. Medium-Term Note programs, Canadian and U.S. mortgage securitizations, Canadian credit card and home equity line of credit securitizations, covered bonds, and Canadian and U.S. senior unsecured deposits.
Material presented in a blue-tinted font above is an integral part of the 2016 annual consolidated financial statements (see page 79).
| | | | |
| BMO Financial Group 199th Annual Report 2016 | | | 103 | |
MANAGEMENT’S DISCUSSION AND ANALYSIS
BMO’s wholesale funding plan seeks to ensure sufficient funding capacity is available to execute business strategies. The funding plan considers expected maturities, as well as asset and liability growth projected for our businesses in our forecasting and planning process, and assesses funding needs in relation to available potential funding sources. The funding plan is reviewed annually by the RRC and is regularly updated to incorporate actual results and updated forecast information.
Wholesale Funding Maturities(1)
| | | | | | | | | | | | | | | | | | | | | | | | | | | | | | | | |
(Canadian $ in millions) As at October 31, 2016 | | Less than 1 month | | | 1 to 3 months | | | 3 to 6 months | | | 6 to 12 months | | | Subtotal
less than
1 year | | | 1 to 2 years | | | Over 2 years | | | Total | |
Deposits from banks | | | 5,457 | | | | 358 | | | | 202 | | | | 69 | | | | 6,086 | | | | 28 | | | | 181 | | | | 6,295 | |
Certificates of deposit and commercial paper | | | 14,282 | | | | 20,511 | | | | 9,978 | | | | 9,679 | | | | 54,450 | | | | 810 | | | | – | | | | 55,260 | |
Bearer deposit notes | | | 917 | | | | 678 | | | | 2,297 | | | | 952 | | | | 4,844 | | | | 500 | | | | – | | | | 5,344 | |
Asset-backed commercial paper (ABCP) | | | 1,516 | | | | 1,882 | | | | 570 | | | | – | | | | 3,968 | | | | – | | | | – | | | | 3,968 | |
Senior unsecured medium-term notes | | | 1,180 | | | | 2,245 | | | | 600 | | | | 6,553 | | | | 10,578 | | | | 12,029 | | | | 20,269 | | | | 42,876 | |
Senior unsecured structured notes (2) | | | 1 | | | | – | | | | – | | | | 5 | | | | 6 | | | | 38 | | | | 2,149 | | | | 2,193 | |
Covered bonds and securitizations | | | | | | | | | | | | | | | | | | | | | | | | | | | | | | | | |
Mortgage and HELOC securitizations | | | – | | | | 684 | | | | 430 | | | | 1,520 | | | | 2,634 | | | | 2,563 | | | | 12,908 | | | | 18,105 | |
Covered bonds | | | – | | | | 2,682 | | | | – | | | | – | | | | 2,682 | | | | 533 | | | | 16,563 | | | | 19,778 | |
Credit card securitizations | | | – | | | | 1,058 | | | | 77 | | | | – | | | | 1,135 | | | | 693 | | | | 2,475 | | | | 4,303 | |
Subordinated debt (3) | | | – | | | | 466 | | | | 100 | | | | – | | | | 566 | | | | – | | | | 5,100 | | | | 5,666 | |
Other (4) | | | – | | | | – | | | | 671 | | | | 4,694 | | | | 5,365 | | | | 1,173 | | | | – | | | | 6,538 | |
Total | | | 23,353 | | | | 30,564 | | | | 14,925 | | | | 23,472 | | | | 92,314 | | | | 18,367 | | | | 59,645 | | | | 170,326 | |
Of which: | | | | | | | | | | | | | | | | | | | | | | | | | | | | | | | | |
Secured | | | 1,516 | | | | 6,306 | | | | 1,748 | | | | 6,214 | | | | 15,784 | | | | 4,962 | | | | 31,946 | | | | 52,692 | |
Unsecured | | | 21,837 | | | | 24,258 | | | | 13,177 | | | | 17,258 | | | | 76,530 | | | | 13,405 | | | | 27,699 | | | | 117,634 | |
Total (5) | | | 23,353 | | | | 30,564 | | | | 14,925 | | | | 23,472 | | | | 92,314 | | | | 18,367 | | | | 59,645 | | | | 170,326 | |
| | (1) | Wholesale unsecured funding primarily includes funding raised through the issuance of marketable, negotiable instruments. Wholesale funding excludes repo transactions and bankers’ acceptances, which are disclosed in the contractual maturity table in Note 29 on page 202 of the financial statements, and excludes ABCP issued by certain ABCP conduits that is not consolidated for financial reporting purposes. |
| | (2) | Primarily issued to institutional investors. |
| | (3) | Includes certain subordinated debt instruments reported as deposits or other liabilities for accounting purposes. Subordinated debt is reported in this table in accordance with recommended Enhanced Disclosure Task Force disclosures. |
| | (4) | Refers to Federal Home Loan Bank (FHLB) advances. |
| | (5) | Total wholesale funding consists of Canadian-dollar-denominated funding of $54.1 billion and U.S.-dollar and other foreign-denominated funding of $116.2 billion as at October 31, 2016. |
| | |
| 104 | | BMO Financial Group 199th Annual Report 2016 |
Regulatory Developments
The Net Stable Funding Ratio (NSFR) was finalized by the Basel Committee on Banking Supervision in 2015 and is expected to come into force on January 1, 2018. The NSFR is a regulatory measure that assesses the assumed stability of a bank’s funding profile in relation to the assumed liquidity value of a bank’s assets. OSFI is expected to issue a consultative paper outlining the domestic implementation of the NSFR during 2016. We are assessing the impact of this change, which could increase funding costs in certain of our businesses depending on the final rules, and we are preparing to comply with and report on this pending regulatory requirement.
Credit Ratings
The credit ratings assigned to BMO’s short-term and senior long-term debt securities by external rating agencies are important in the raising of both capital and funding to support our business operations. Maintaining strong credit ratings allows us to access capital markets at competitive pricing levels. Should our credit ratings experience a downgrade, our cost of funding would likely increase significantly and our access to funding and capital through capital markets could be reduced. A material downgrade of our ratings could also have other consequences, including those set out in Note 8 on page 161 of the financial statements.
The credit ratings assigned to BMO’s senior debt by rating agencies are indicative of high-grade, high-quality issues. Standard & Poor’s (S&P) and Fitch have a stable outlook. Moody’s and DBRS have a negative outlook pending further details on the government’s approach to implementing a bail-in regime for Canada’s domestic systemically important banks.
| | | | | | | | |
| As at October 31, 2016 | | | | | | |
| Rating agency | | Short-term debt | | Senior long-
term debt | | Subordinated
debt – NVCC | | Outlook |
Moody’s | | P-1 | | Aa3 | | Baa1 | | Negative |
S&P | | A-1 | | A+ | | BBB | | Stable |
Fitch | | F1+ | | AA- | | na | | Stable |
DBRS | | R-1 (high) | | AA | | A (low) | | Negative |
na – not applicable
| | | | |
| BMO Financial Group 199th Annual Report 2016 | | | 105 | |
MANAGEMENT’S DISCUSSION AND ANALYSIS
Operational Risk
Operational risk is the potential for loss resulting from inadequate or failed internal processes or systems, human interactions or external events, but excludes business risk, credit risk and market risk.
BMO is exposed to potential losses arising from a variety of operational risks, including process and control failure, theft and fraud, regulatory non-compliance, business disruption, information security breaches, cyber threats and exposure related to outsourcing, as well as damage to physical assets. Operational risk is inherent in all our business and banking activities, including the processes and controls used to manage our risks. While operational risk can never be fully eliminated, it can be managed to reduce exposure to financial loss, reputational harm and regulatory sanctions.
Consistent with the management of risk across the organization, we employ the three-lines-of-defence approach to operational risk. Operational risk management is executed by business units as the first line of defence, overseen by ERPM Operational Risk Management (ORM) and other CSAs as the second line of defence, governed by a robust committee structure and supported by a comprehensive set of policies, standards and operating guidelines. The Corporate Audit Division (CAD), as the third line of defence, verifies our adherence to controls and highlights opportunities to strengthen our process.
Operational Risk Governance
The Operational Risk Committee (ORC), a sub-committee of the Risk Management Committee (RMC), is the main oversight and governance committee for all operational risk management matters. As part of its governance responsibilities, the ORC provides effective challenge to the policies, standards, operating guidelines, methodologies and tools that give effect to the governing principles of the Operational Risk Management Framework (ORMF). These governance documents are reviewed on a regular basis to ensure they incorporate sound practices and are consistent with our risk appetite. Regular analysis and reporting of our enterprise operational risk profile to the various committees (ORC, RMC and RRC) are important elements of our risk governance framework. Enterprise reporting provides an integrated view of top and emerging risks, trends in loss data, capital consumption, key risk indicators and operating group portfolio profiles. We continue to invest in our reporting platforms to support timely and comprehensive reporting capabilities that enhance risk transparency and facilitate the proactive management of operational risk exposures.
Operational Risk Management
The operating groups, as the first line of defence, are accountable for the day-to-day management of operational risk, with the CROs of businesses providing governance and oversight for their respective units and CSAs providing additional governance and oversight. Independent risk management oversight is provided by the ERPM Operational Risk Management function (ERPM ORM), which is responsible for operational risk strategy, policies, management and governance. ERPM ORM establishes and maintains the Operational Risk Management Framework (ORMF), which defines the processes used by the first line of defence to identify, measure, manage, mitigate, monitor and report key operational risk exposures, losses and near miss operational risk events with significant potential impact. The ORMF also defines the processes by which the ERPM ORM team, as the second line of defence, develops, communicates, supports, monitors and assesses the first line in its management of operational risk. Operational Risk Officers (OROs) within ERPM ORM are utilized to independently assess group operational risk profiles, identify material exposures and potential weaknesses in processes and controls, and recommend appropriate mitigation strategies and actions.
The key programs, methodologies and processes in the ORMF are highlighted below:
| • | | Risk Control Assessment (RCA) is an established process used by our operating groups to identify the key risks associated with their businesses and the controls required for risk mitigation. The RCA process provides a forward-looking view of the impact of the business environment and internal controls on operating group risk profiles, enabling the proactive prevention, mitigation and management of risk. On an aggregate basis, RCA results also provide an enterprise-level view of operational risks relative to risk appetite, so that key risks can be appropriately identified, documented, managed and mitigated. |
| • | | Process Risk Assessment (PRA) provides a deeper view by identifying key risks and controls in our important business processes, which may span multiple business units. The PRA process enables a greater understanding of our key processes, which facilitates more effective oversight and appropriate risk mitigation. |
| • | | BMO’s initiative assessment and approval process is used to assess, document and approve qualifying initiatives when new business, services and products are developed or existing services and products are enhanced. The process seeks to ensure that due diligence, approval, monitoring and reporting requirements are appropriately addressed at all levels of the organization. |
| • | | Key Risk Indicators (KRIs) provide an early indication of any adverse changes in risk exposure. Operating Groups and CSAs identify metrics related to their material operational risks. These KRIs are used in monitoring operational risk profiles and their overall relation to our risk appetite, are subject to review and challenge by the ERPM ORM team, and are linked to thresholds that trigger management action. |
| • | | Internal loss data serves as an important means of assessing our operational risk exposure and identifying opportunities for future risk prevention measures. In this assessment, internal loss data is analyzed and benchmarked against external data. Material trends are regularly reported to the ORC, RMC and RRC to enable preventative and corrective action to be taken where appropriate. BMO is a member of the Operational Risk Data Exchange Association, the American Bankers Association and other international and national associations of banks that share loss data information anonymously to assist in risk identification, assessment and modelling. |
| • | | BMO’s operational risk management training programs seek to ensure that our employees are qualified and equipped to execute the ORMF strategy consistently, effectively and efficiently. |
| • | | Effective business continuity management provides us with the capability to maintain, manage and recover critical operations and processes in the event of a business disruption, thereby minimizing any adverse effects on our customers and other stakeholders. |
| • | | BMO’s Corporate Risk & Insurance team provides a second level of mitigation for certain operational risk exposures. We purchase insurance where required by law, regulation or contractual agreement, and where it is economically attractive and practicable to mitigate our risks, to provide adequate protection against unexpected material loss. |
| | |
| 106 | | BMO Financial Group 199th Annual Report 2016 |
Executing our ORMF strategy also involves continuing to strengthen our risk culture by promoting greater awareness and understanding of operational risk within our lines of defence through training and communication as well as the day-to-day execution and oversight of the ORMF, including the identification, management, monitoring, mitigation and reporting of operational risks. We continue to invest in resources to further strengthen our second line of defence support and oversight of the first line. A primary objective of the ORMF is to ensure that our operational risk profile is consistent with our risk appetite and supported by adequate capital.
Operational Risk Capital and Stress Testing
BMO currently uses the Advanced Measurement Approach (AMA), a risk-sensitive capital model, to determine both economic and regulatory capital requirements for managing operational risk. The AMA Capital Model uses a loss distribution approach along with the four elements required to support the measurement of our operational risk exposure. Internal and external loss data are used as inputs to the AMA Capital Model and, based on shared attributes, are grouped into cells which include operating group, business activity or event type. Minimum enterprise operational risk capital is determined at a specific upper confidence limit of the enterprise total loss distribution (99.9% quantile for regulatory capital and 99.95% quantile for Economic Capital). Business environment and internal control factors are used for post-modelling adjustments, and these are subject to regular review in order to identify and understand risk drivers and to confirm consistency in application across the organization. Scenarios are used to verify the distributions and correlations used to model capital, to provide management with a better understanding of low-frequency, high-severity events and to assess enterprise preparedness for events that could create risks that exceed our risk appetite. We also use scenario analysis as part of our stress testing program, which measures the potential impact of plausible operational, economic, market and credit events on our operations and capital, and allows us to manage tail risk exposure and to confirm the adequacy of our operational risk capital.
Regulatory Developments
The Basel Committee on Banking Supervision has proposed a new approach to the calculation of regulatory operational risk capital requirements, known as the Standardized Measurement Approach (SMA). The SMA is expected to be finalized in early 2017. It is less risk-sensitive but is intended to promote comparability of risk-based capital measures, as well as reduce model complexity. We are assessing the potential impact of the SMA on our capital requirements and we continue to monitor industry and regulatory developments. While the impact is uncertain at this time, SMA has the potential to increase BMO’s operational risk capital requirements. For additional discussion on regulatory developments related to capital management, please refer to the Enterprise-Wide Capital Management section starting on page 70.
Model Risk
Model risk is the potential for adverse consequences following from decisions based on incorrect or misused model results. These adverse consequences can include financial loss, poor business decision-making or damage to reputation.
Models are quantitative tools that apply statistical, economic and other quantitative techniques and assumptions to process input data into quantitative estimates. BMO uses models ranging from very simple models that produce straightforward estimates to highly sophisticated models that value complex transactions or provide a broad range of forward-looking estimates.
The results from these models are used to inform business, risk and capital management decision-making and to assist in making daily lending, trading, underwriting, funding, investment and operational decisions. For example, BMO uses models as a core risk management tool to measure exposure to specific risks through stress testing, to value and price transactions, to evaluate credit, market and operational risk regulatory capital requirements and to measure risks on an integrated basis using Economic Capital.
Quantitative tools provide important insights and are effective when used within a framework that controls and mitigates model risk. In addition to applying judgment to evaluate the reliability of model results, BMO mitigates model risk by maintaining strong controls over the development, validation, implementation and use of models across all model categories. BMO also takes steps to ensure that qualitative model overlays and non-statistical approaches to evaluating risks are intuitive, experience-based, well-documented and subject to effective challenge by those with sufficient expertise and knowledge to provide reasonable results.
| | | | |
| BMO Financial Group 199th Annual Report 2016 | | | 107 | |
MANAGEMENT’S DISCUSSION AND ANALYSIS
Model Risk Management
Risk is inherent in models because model results are estimates that rely on statistical techniques and data to simulate reality. Model risk also arises from potential misuse. Model risk is governed at BMO by the enterprise-wide Model Risk Management Framework, which covers the model life cycle.
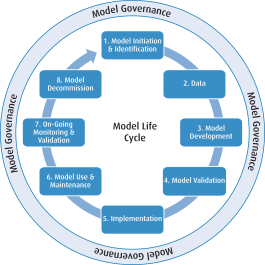
This framework sets out an end-to-end approach to model risk governance across the model life cycle and helps to confirm that model risk remains aligned with BMO’s enterprise-wide risk appetite. The framework includes BMO’s Model Risk Corporate Policy, Model Risk Corporate Standard and Model Risk Guidelines, which outline explicit principles for managing model risk, detail model risk processes and define the roles and responsibilities of all stakeholders across the model life cycle. Model owners, developers and users are the first line of defence, Model Validation and the Model Governance group are the second line of defence, and the Corporate Audit Division is the third line of defence.
The Model Governance group is responsible for the administration of the Model Risk Management Framework, the effectiveness of our model processes and the overall management of model risk. The Model Risk Management Committee, a cross-functional group representing all key stakeholders across the enterprise (model owners, users, developers and validators and the Model Governance group) and a sub-committee of the RMC, meets regularly to help direct the bank’s use of models, to oversee the development, implementation and maintenance of the Model Risk Management Framework, provide effective challenge and discuss requirements for governing the enterprise’s models.
Model Development and Validation
Models are developed, implemented and used to meet specific business objectives, including applicable regulatory requirements. Model owners, in consultation with model developers and other stakeholders, determine the design, objectives, intended use and desired functionality of models, and have overall responsibility for ensuring that every model complies with BMO’s policies and approved terms of use. Model developers assist the model owners by proposing model solutions, identifying data availability and limitations, and developing and implementing models that address their intended purposes. They do so by engaging model owners and other key stakeholders in the development and implementation processes, and by evaluating and documenting alternatives and model characteristics, outputs, strengths and weaknesses. Our independent Model Validation group reviews the development documentation, results and analysis generated by the model development teams to evaluate whether a proposed model is conceptually and statistically sound, achieves its objectives and is fit for its intended use without creating material model risk. Observations are made for the guidance of model owners, users and developers, remediation of material deficiencies may be required and, unless an exception is obtained in accordance with BMO’s policy, approval from the Model Validation group is required before a model can be used. Where a methodology or quantitative tool is not considered to be materially reliant on advanced statistical techniques or does not otherwise meet the definition of a model, the developers and users of such methodology or tool are nevertheless expected to provide appropriate documentation and ensure effective independent review and challenge by knowledgeable BMO employees and managers.
Model Use and Monitoring
Model owners and other model users are accountable for the appropriate use of models for business decision-making and for the proper care and maintenance of models throughout the model life cycle. The development and validation processes provide guidance to ensure that models can be used effectively within an appropriate range of use, that model limitations are known and that model risk mitigants are implemented. When in use, models are subject to ongoing monitoring, including outcomes analysis and periodic reviews. Ongoing monitoring and outcomes analysis are part of the evaluation process that confirms the continuing validity and adequate performance of each model over time. These techniques and other controls are applied to mitigate potential issues and to help ensure continuing acceptable model performance. All models in use are subject to periodic scheduled reviews, with the frequency based on a model’s risk rating, and to earlier reviews if business judgment, triggers or other ongoing monitoring tools indicate that a model’s performance may be inadequate. Scheduled reviews require the model owners and developers to assess a model’s continuing suitability for use, and such assessment is subject to independent review by the Model Validation group.
Model Validation, Outcomes Analysis and Back-Testing
Once models are validated, approved and in use, they are subject to regular validation which includes ongoing monitoring and outcomes analysis. As a key component of the outcomes analysis, back-testing compares model results against actual observed outcomes. This analysis serves to confirm the validity and performance of each model over time, and helps to ensure that appropriate controls are in place to address identified issues and enhance a model’s overall performance.
| | |
| 108 | | BMO Financial Group 199th Annual Report 2016 |
All models used within BMO are subject to validation and ongoing monitoring and are used in accordance with our Model Risk Management framework. These include a wide diversity of models ranging from stress loss, market, credit and operational risks to valuation to anti-money laundering models. We highlight a few key applications of this framework below:
Credit Risk – The Credit Risk Model Validation Guidelines are an important support for BMO’s Model Risk Corporate Policy. These guidelines include clear and detailed requirements for the back-testing of all credit risk rating models.
The process for back-testing the Probability of Default (PD) model computations includes comparing PD estimates generated by credit risk models against the actual or realized default rates across all obligor ratings. This process also includes examining statistical evidence to confirm that default rates accurately capture sampling variability over time.
The comprehensive validation of a risk rating system involves various prescribed tests and analyses that measure discriminatory power, calibration and dynamic properties, with support from migration analysis. Additional tests or analyses are used to validate borrower risk rating grades and probability of default results.
As with any analysis, judgment is applied in determining which of the various factors, such as data limitations, might affect the overall relevance of a given validation approach or interpretation of statistical analysis. Similar back-testing is applied to the Loss Given Default (LGD) and Exposure at Default (EAD) model computations.
Annual validations of all material models in use are conducted to confirm they perform as intended and that they continue to be fit for use. An annual validation includes a qualitative and quantitative assessment conducted by model developers, which is reviewed and effectively challenged by the Model Validation group, with all conclusions reported to senior management.
Trading and Underwriting Market Risk – All internal models used in determining regulatory capital and Economic Capital for trading and underwriting market risk have their Value at Risk (VaR) results back-tested regularly. The bank’s internal VaR model is back-tested daily, and the one-day 99% confidence level VaR at the local and consolidated BMO levels is compared against the realized theoretical Profit & Loss (P&L) calculation, which is the daily change in portfolio value that would occur if the portfolio composition remained unchanged. If the theoretical P&L result is negative and its absolute value is greater than the previous day’s VaR, a back-testing exception occurs. Each exception is investigated, explained and documented, and the back-testing results are reviewed by the Board and our regulators. This process monitors the quality and accuracy of the internal VaR model results and assists in refining overall risk measurement procedures.
Structural Market Risk – Back-testing of our structural market risk models is performed monthly and reported quarterly. For products with a scheduled term, such as mortgages and term deposits, the model forecasts of prepayments or redemptions are compared against the actual outcomes observed. For products without a scheduled term, such as credit card loans and chequing accounts, the modelled balance run-off profiles are compared against actual balance trends.
The variances between model forecasts and the actual outcomes experienced are measured against pre-defined risk materiality thresholds. To ensure variances are within the tolerance range, actions such as model review and parameter recalibration are taken. Performance is assessed by analyzing model overrides and tests conducted during model development, such as back-testing and sensitivity testing.
Insurance Risk
Insurance risk is the potential for loss as a result of actual experience being different from that assumed when an insurance product was designed and priced. It generally entails the inherent unpredictability that can arise from assuming long-term policy liabilities or from the uncertainty of future events. Insurance risk is inherent in all our insurance products, including annuities and life, accident and sickness, and creditor insurance, as well as in our reinsurance business.
Insurance risk consists of:
| • | | Claims risk – the risk that the actual magnitude or frequency of claims will differ from those assumed in the pricing or underwriting process, including mortality risk, morbidity risk, longevity risk and catastrophe risk; |
| • | | Policyholder behaviour risk – the risk that the behaviour of policyholders related to premium payments, withdrawals or loans, policy lapses and surrenders, and other voluntary terminations will differ from the behaviour assumed in the pricing calculations; and |
| • | | Expense risk – the risk that actual expenses associated with acquiring and administering policies and processing claims will exceed the expenses assumed in the pricing calculations. |
BMO’s risk governance practices provide effective independent oversight and control of risk within the insurance business. BMO’s Insurance Risk Management Framework comprises the identification, assessment, management and reporting of risks. The framework includes: the risk appetite statement and key risk metrics; insurance risk policies and processes, including limits; capital requirements; stress testing; risk reports; and the Own Risk and Solvency Assessment. All of these are overseen by internal risk committees and the BMO Life Assurance and BMO Life Insurance Boards of Directors. The Insurance Risk Management Committee for BMO Insurance oversees and reports on risk management activities on a quarterly basis to the insurance companies’ Boards of Directors. Senior management within the various lines of business is responsible for managing insurance risk, with oversight provided by the CRO, BMO Insurance, who reports to the CRO, Wealth Management.
A robust product approval process is the cornerstone of the insurance risk management framework for identifying, assessing and mitigating risks associated with new insurance products or changes to existing products. This process, along with guidelines and practices for underwriting and claims management, promotes the effective identification, measurement and management of insurance risk. Reinsurance, which involves transactions that transfer insurance risk to independent reinsurance companies, is also used to manage our exposure to insurance risk by diversifying risk and limiting claims.
| | | | |
| BMO Financial Group 199th Annual Report 2016 | | | 109 | |
MANAGEMENT’S DISCUSSION AND ANALYSIS
Legal and Regulatory Risk
Legal and regulatory risk is the potential for loss or harm that arises from legislation, contracts, non-contractual rights and obligations, and disputes. This includes the risks of failing to: comply with the law (in letter or in spirit) or maintain standards of care; implement legislative or regulatory requirements; enforce or comply with contractual terms; assert non-contractual rights; effectively manage disputes; or act in a manner so as to maintain our reputation.
BMO’s success relies in part on our ability to manage our exposure to legal and regulatory risk prudently. The financial services industry is highly regulated, and we anticipate intense ongoing scrutiny from our supervisors in the oversight process and strict enforcement of regulatory requirements as governments and regulators around the world continue with reforms intended to strengthen the stability of the financial system. Banks globally continue to be subject to fines and penalties for a number of regulatory and conduct issues. As rulemaking and supervisory expectations evolve, we monitor developments to enable BMO to respond to and implement any required changes.
Under the direction of the General Counsel, the Legal and Compliance Group (LCG) maintains enterprise-wide frameworks that identify, measure, manage, monitor and report on legal and regulatory risk. LCG also works with operating groups and other CSAs to identify legal and regulatory requirements, trends and potential risks, recommend mitigation strategies and actions, and oversee litigation involving BMO. Another area of focus for legal and compliance risk management and operating groups is the oversight of fiduciary risk related to BMO’s businesses that provide products or services giving rise to fiduciary duties to clients. Of particular importance are policies and practices that address the responsibilities of a business to a client, including service requirements and expectations, client suitability determinations, and disclosure obligations and communications.
Physical protection, as well as the safeguarding of our employees, customers, information and assets from criminal risk, is a top priority. Criminal risk includes acts by employees against BMO, acts by external parties against BMO and acts by external parties using BMO to engage in unlawful conduct such as fraud, theft, violence, cyber-crime, bribery, and corruption. BMO has transformed its management of criminal risk through the implementation of a robust Criminal Risk Management Framework, which is designed to prevent, detect, respond to and report on criminal risk using a three-lines-of-defence approach and through enhanced centralized management and oversight.
As governments globally seek to curb corruption to counter its negative effects on political stability, sustainable economic development, international trade and investment and in other areas, BMO’s Anti-Corruption Office, through its global program and framework, has articulated the key principles and activities required to oversee compliance withanti-corruption legislation in jurisdictions where BMO operates, including providing guidance so that corrupt practices can be identified and avoided and that allegations of corrupt activity can be rigorously investigated.
International regulators continue to focus on anti-money laundering and other related measures, heightening their expectations concerning the quality and efficacy of anti-money laundering and related programs and penalizing institutions that fail to meet these expectations. Under the direction of the Chief Anti-Money Laundering Officer, the Anti-Money Laundering Office is responsible for the governance, oversight and assessment of the principles and procedures designed to help ensure compliance with regulatory requirements and risk parameters related to anti-money laundering, anti-terrorist financing and sanctions measures.
All of these frameworks reflect the three-lines-of-defence operating model described previously. The operating groups and CSAs manage day-to-day risks by complying with corporate policies and standards, while LCG teams specifically aligned with each of the operating groups provide advice and independent legal and regulatory risk management oversight.
Heightened regulatory and supervisory scrutiny has a significant impact on how we conduct business. Working with the operating groups and other CSAs, LCG continues to diligently assess and analyze the implications of regulatory changes. We devote substantial resources to implementing the systems and processes required to comply with new regulations while helping meet BMO customers’ needs and demands.
We continue to respond to other global regulatory developments, including capital and liquidity requirements under the Basel Committee on Banking Supervision (BCBS) global standards (Basel III), which we expect will put upward pressure on the amount of capital we are required to hold over time. Other global regulatory developments include over-the-counter (OTC) derivatives reform, consumer protection measures and specific financial reforms, such as theDodd-Frank Wall Street Reform and Consumer Protection Act (Dodd-Frank). For additional discussion on regulatory developments relating to capital management and liquidity and funding risk, please refer to the Enterprise-Wide Capital Management section starting on page 70 and the Liquidity and Funding Risk section starting on page 100. For additional discussion regarding the impact of certain potential fiscal policy changes on our results, please see Critical Accounting Estimates – Income Taxes and Deferred Tax Assets on page 114.
Bank Resolution and Bail-in – In June 2016, legislation required to implement a bail-in regime was passed by the Canadian government to enhance Canada’s bank resolution capabilities in line with international efforts. For additional discussion on the bail-in regime, please refer to the Enterprise-Wide Capital Management section starting on page 70.
Housing Market Reforms – In October 2016, the federal government announced preventative measures for the housing market in Canada, including standardizing eligibility criteria for high- and low-ratio insured mortgages, launching a consultation process with market participants on lender risk sharing of loan losses on insured mortgages that default, and addressing tax fairness through changes to the capital gains tax exemption on the sale of a principal residence. We are assessing the impact of these measures on our operations.
Federal Budget – The Federal budget was tabled in March 2016. On October 25, 2016, the federal government introduced Bill C-29,Budget Implementation Act, 2016, No. 2. If enacted, the Bill will affect the banking industry in Canada through amendments to theBank Act. The proposed amendments will consolidate the consumer provisions under theBank Act to create a comprehensive federal financial consumer protection framework for banks and respond to a trilogy of Supreme Court of Canada cases (referred to as Marcotte) by enhancing federal paramountcy over consumer protection with respect to banking products and services.
Financial Reforms – Dodd-Frank reforms include heightened consumer protection, revised regulation of the OTC derivatives markets, heightened prudential standards, broader application of leverage and risk-based capital requirements, and restrictions (theVolcker Rule) on proprietary trading and the ownership and sponsorship of private investment funds by banks and their affiliates. We have completed a significant review of our operations and now have policies and systems in place to assess, monitor and report onVolcker Rule compliance across the enterprise. U.S. regulators have extended until July 21, 2017 the date by which banking entities must cause their investments in and relationships with “legacy” private investment funds established before December 31, 2013 to conform with theVolcker Rule. We are implementing a plan to comply with such requirements.
| | |
| 110 | | BMO Financial Group 199th Annual Report 2016 |
FBO Rule – In February 2014, the Federal Reserve Board finalized the Foreign Banking Organizations (FBO) Rule, which implements the Dodd-Frank enhanced prudential standards for the U.S. operations of non-U.S. banks, such as BMO. The FBO Rule establishes new requirements relating to an intermediate holding company structure, risk-based capital and leverage requirements, capital stress testing requirements, U.S. risk management and risk governance, liquidity risk management and liquidity stress testing frameworks. In December 2014, BMO submitted to the Federal Reserve Board our implementation plan for meeting these requirements by the effective date of July 1, 2016. In accordance with the FBO Rule, BMO certified our compliance with the FBO Rule requirements to the Federal Reserve Board in July 2016.
Risk Governance Framework – In September 2014, the Office of the Comptroller of the Currency issued guidelines that establish heightened standards for large national banks with average total consolidated assets of US$50 billion or more, which includes BMO Harris Bank N.A. The guidelines set out minimum standards for the design and implementation of a bank’s risk governance framework and minimum standards for oversight of that framework by a bank’s board of directors. The framework must ensure a bank’s risk profile is easily distinguished and separate from that of its parent for risk management purposes. A bank’s board of directors is responsible for informed oversight of, and providing credible challenge to, management’s risk management recommendations and decisions. We have implemented a plan to comply with these guidelines.
Derivatives Reform – Under Dodd-Frank, most OTC derivatives transactions are now subject to a comprehensive regulatory regime. Certain derivatives transactions are now required to be centrally cleared and executed on an electronic platform and are subject to reporting and business conduct requirements. In a number of jurisdictions, OTC derivatives transactions must now be reported to designated trade repositories. Capital and margin requirements for derivatives are currently being considered by international regulators, and margin requirements for non-centrally cleared derivatives have been adopted in a number of jurisdictions, including Canada, Europe and the United States. Margin rules will require the exchange of variation margin and initial margin, both of which are designed to secure performance on non-centrally cleared derivatives transactions between covered entities. BMO will be subject to variation margin rules beginning March 1, 2017 and initial margin rules beginning no earlier than September 1, 2018 and no later than September 1, 2019. The U.S. Securities and Exchange Commission (SEC) has adopted rules for security-based swap dealers and other participants in the security-based swap market, including registration requirements. The date or dates for registration, which depend on additional SEC rulemaking, have not been set. BMO is preparing for the impact of these rules and requirements.
Synthetic Equity Arrangement Rules – In June 2016, the synthetic equity arrangement rules (SEA Rules) were passed into law in Canada. The SEA Rules would, in certain circumstances, deny any deduction for dividends that are paid or become payable after April 2017. We expect that the effect of the SEA Rules will be to increase our effective tax rate and negatively impact our earnings in fiscal 2017.
DOL Fiduciary Rule – In April 2016, the U.S. Department of Labor issued a fiduciary conflict of interest rule that will apply to certain sales and investment activities previously not treated as fiduciary. The rule will require changes to service delivery and compensation models for brokers, banks, investment advisers, insurance companies and consultants that work with individual retirement accounts and employee benefit plans. BMO is implementing plans to comply with this rule.
The General Counsel and the Chief Compliance Officer (CCO) regularly report to the ACRC of the Board and senior management on the effectiveness of our Enterprise Compliance Program (ECP) which, using a risk-based approach, identifies, assesses and manages compliance with applicable legal and regulatory requirements. The ECP directs operating groups and CSAs to maintain compliance policies, procedures and controls to meet these requirements. Under the direction of the CCO, LCG identifies and reports on gaps and deficiencies, and tracks remedial action plans. The Chief Anti-Money Laundering Officer also regularly reports to the ACRC.
All BMO employees must complete annual legal and regulatory training on topics such as anti-corruption, anti-money laundering and privacy. This is done in conjunction with our Code of Conduct training, which tests employees’ knowledge and understanding of how they are required to behave as employees of BMO.
Business Risk
Business risk arises from the specific business activities of an enterprise and the effects these could have on its earnings.
Business risk encompasses the potential causes of earnings volatility that are distinct from credit, market or operational risk factors. The management of business risk identifies and addresses factors related to the risk that volumes will decrease or margins will shrink without the company having the ability to compensate for this decline by cutting costs.
BMO faces many risks that are similar to those faced by non-financial firms, principally that our profitability, and hence value, may be eroded by changes in the business environment or by failures of strategy or execution. Sources of these risks include, but are not limited to, changing client expectations, adverse business developments and relatively ineffective responses to industry changes.
Within BMO, each operating group is responsible for controlling its respective business risk by assessing, managing and mitigating the risks arising from changes in business volumes and cost structures, among other factors.
Strategic Risk
Strategic risk is the potential for loss due to fluctuations in the external business environment and/or the failure to properly respond to these fluctuations as a result of inaction, ineffective strategies or poor implementation of strategies.
Strategic risk arises from external risks inherent in the business environment within which BMO operates, as well as the potential for loss if BMO is unable to address those external risks effectively. While external strategic risks – including economic, geopolitical, regulatory, technological, social and competitive risks – cannot be controlled, the likelihood and magnitude of their impact can be mitigated through an effective strategic risk management framework, and certain of these risks, including economic, geopolitical and regulatory risks, can be assessed through stress testing.
BMO’s Office of Strategic Management (OSM) oversees our strategic planning processes and works with the lines of business, along with ERPM, Finance and other CSAs, to identify, monitor and mitigate strategic risk across the enterprise. Our rigorous strategic management framework encourages a consistent approach to the development of strategies and incorporates information linked to financial commitments.
| | | | |
| BMO Financial Group 199th Annual Report 2016 | | | 111 | |
MANAGEMENT’S DISCUSSION AND ANALYSIS
The OSM works with the lines of business and key corporate stakeholders during the strategy development process to promote consistency and adherence to strategic management standards, including a consideration of the results of stress testing as an input into strategic decision-making, as appropriate. The potential impacts of changes in the business environment, such as broad industry trends and the actions of competitors, are considered as part of this process and inform strategic decisions within each of our lines of business. Enterprise and group strategies are reviewed with the Executive Committee and the Board of Directors annually in interactive sessions that challenge assumptions and strategies in the context of current and potential future business environments.
Performance objectives established through the strategic management process are monitored regularly and reported upon quarterly, using both leading and lagging indicators of performance, so that strategies can be reviewed and adjusted where necessary. Regular strategic and financial updates are also monitored closely, in order to identify any significant emerging risk issues.
Environmental and Social Risk
Environmental and social risk is the potential for loss or damage to BMO’s reputation resulting from environmental or social concerns related to BMO or its customers. Environmental and social risk is often associated with credit, operational and reputation risk.
In order to manage our business responsibly, we consider the impact of our decisions on our various stakeholders. This commitment is embedded in our Board-approved Code of Conduct. We also expect our suppliers to behave in a responsible manner. Our expectations from suppliers – our standards for integrity, fair dealing and sustainability – are outlined in BMO’s Supplier Code of Conduct. Environmental and social risk management activities are overseen by the Environmental, Social and Governance (ESG) group and the Environmental Sustainability (ES) group, with support from our lines of business and other CSAs. BMO’s Sustainability Council, which is comprised of senior leaders from business and CSAs across our organization, provides insight and guidance for our environmental and social initiatives.
Environmental and social risk covers a broad spectrum of issues, such as climate change, biodiversity, ecosystem health, pollution, waste and the unsustainable use of water and other resources, as well as risks to the livelihoods, health, human rights and cultural heritage of communities. We work with external stakeholders to understand the impact of our operations and financing decisions in the context of these issues, and we apply this understanding in order to determine the consequences for our businesses. As part of our enterprise risk management framework, we evaluate the environmental and social impact of our clients’ operations, as well as the impact of their industry sectors. Environmental and social risks associated with credit transactions are managed within BMO’s credit and counterparty risk management framework. BMO has also developed and implemented specific financing guidelines on environmental and social risk for specific lines of business. Enhanced due diligence is applied to transactions with clients operating in environmentally sensitive industry sectors, such as forestry or mining, and we avoid doing business with borrowers who have poor environmental and social risk management track records.
BMO applies the Equator Principles and the World Bank/International Finance Corporation environmental and social screening process to assess and manage environmental and social risk in project finance transactions. These principles have been integrated into our credit risk management framework. We are a long-time signatory and participant of the Carbon Disclosure Project – a global initiative which assembles and publishes corporate disclosure on greenhouse gas emissions and climate change.
BMO is a signatory to the UN Principles for Responsible Investment, a framework designed to encourage sustainable investing through the integration of ESG issues into investment, decision-making and ownership practices. BMO’s Canadian operations joined the Responsible Investment Association in 2016.
The ESG group is responsible for coordinating the development and maintenance of an enterprise-wide strategy that meets BMO’s overarching environmental and social responsibilities. The ES group is responsible for establishing and maintaining an environmental management system that is aligned with ISO 14001, and for setting objectives and targets related to the bank’s own operations. This includes our Environmental Policy which was updated in 2016. BMO’s operating groups (Procurement and Strategic Sourcing, and Corporate Real Estate) are responsible for putting the appropriate operating procedures in place.
To keep informed of emerging issues, we participate in global forums with our peers, maintain an open dialogue with our internal and external stakeholders, and continuously monitor and evaluate policy and legislative changes in the jurisdictions where we operate. We publicly report our environmental and social performance and targets in our annual Environmental, Social and Governance (ESG) Report and Public Accountability Statement (PAS), and on our Corporate Responsibility website. Selected environmental and social indicators in the ESG Report and PAS are assured by a third party.
Reputation Risk
Reputation risk is the potential for a negative impact on BMO that results from the deterioration of BMO’s reputation. Potential negative impacts include revenue loss, a decline in customer loyalty, litigation, regulatory sanctions or additional regulatory oversight, and a decline in BMO’s share price.
BMO’s reputation is built on our commitment to high standards of business conduct and ethics, and is one of our most valuable assets. By protecting and maintaining our reputation, we safeguard our brand, increase shareholder value, reduce our cost of capital, improve employee engagement and maintain customer loyalty.
We believe that active, ongoing and effective management of reputation risk is best achieved by considering reputation risk issues in the course of strategy development, strategic and operational implementation, and transactional or initiative decision-making, as well as in day-to-day decision-making.
BMO’s Code of Conduct provides our employees and directors with guidance on the behaviour that is expected of them, so that they can make the right choice in decisions that affect their work. The Code of Conduct is the foundation of our ethical culture, and we continually reinforce the principles it sets out for our employees in order to minimize risks to our reputation that may result from poor decisions or behaviour.
Reputation risk is also managed through our corporate governance practices and enterprise risk management framework. BMO’s Reputation Risk Management Committee reviews instances of significant or heightened reputation risk to BMO.
| | |
| 112 | | BMO Financial Group 199th Annual Report 2016 |
Accounting Matters and Disclosure and Internal Control
Critical Accounting Estimates
The most significant assets and liabilities for which we must make estimates include: allowance for credit losses; financial instruments measured at fair value; pension and other employee future benefits; impairment of securities; provisions for income taxes and deferred tax assets; goodwill and intangible assets; purchased loans; insurance-related liabilities; and provisions including legal reserves. We make judgments in assessing whether substantially all risks and rewards have been transferred in respect of transfers of financial assets and whether we control SEs. These judgments are discussed in Notes 6 and 7, respectively, on page 159 of the financial statements. Note 17 on page 177 of the financial statements discusses the judgments made in determining the fair value of financial instruments. If actual results were to differ from the estimates we make, the impact would be recorded in future periods. We have established detailed policies and control procedures that are intended to ensure the judgments we make in determining the estimates are well controlled, independently reviewed and consistently applied from period to period. We believe that our estimates of the fair value of BMO’s assets and liabilities are appropriate.
For a more detailed discussion of the use of estimates, please see Note 1 on page 144 of the financial statements.
Allowance for Credit Losses
The allowance for credit losses represents our best estimate of probable credit losses in the portfolio of loans and acceptances. This requires significant judgment regarding key assumptions, including the probability of default, severity of loss, the timing of future cash flows and the valuation of collateral. One of our key performance measures is the provision for credit losses as a percentage of average net loans and acceptances. Over the 10 years prior to 2016, our average annual ratio has ranged from a high of 0.88% in 2009 to a low of 0.19% in 2015. This ratio varies with changes in the economy and credit conditions. If we were to apply these high and low ratios to average net loans and acceptances in 2016, our provision for credit losses would range from $680 million to $3,148 million and our allowance for credit losses would range from $1,979 million to $4,447 million. Our provision for credit losses in 2016 was $815 million and our allowance for credit losses at October 31, 2016 was $2,114 million. Additional information on the process and methodology for determining the allowance for credit losses can be found in the discussion of Credit and Counterparty Risk on page 88 as well as in Note 4 on page 153 of the financial statements.
Financial Instruments Measured at Fair Value
BMO records a number of items at fair value, including its trading and available-for-sale securities, derivatives, securities lent and certain assets and liabilities designated under the fair value option. Fair value represents our estimate of the amount we would receive, or would be required to pay in the case of a liability, in a current transaction between willing parties. We employ a fair value hierarchy to categorize the inputs we use in valuation techniques to measure fair value. The extent of our use of quoted market prices (Level 1), internal models using observable market information (Level 2) and internal models without observable market information (Level 3) in the valuation of securities, derivative assets and derivative liabilities as at October 31, 2016, as well as a sensitivity analysis of our Level 3 financial instruments, is disclosed in Note 17 on page 177 of the financial statements.
Our valuation models use general assumptions and market data, and therefore do not reflect the specific risks and other factors that could affect a particular instrument’s fair value. Valuation Product Control (VPC), a group independent of the trading lines of business, verifies the fair values at which financial instruments are recorded. For instruments that are valued using models, VPC identifies situations where valuation adjustments must be made to the model estimates to arrive at fair value. As a result, we incorporate certain adjustments when using internal models to establish fair values. These fair value adjustments take into account the estimated impact of credit risk, liquidity risk and other items, including closeout costs. For example, the credit risk adjustment for derivative financial instruments incorporates credit risk into our determination of fair values by taking into account factors such as the counterparty’s credit rating, the duration of the instrument and changes in credit spreads. We also incorporate an estimate of the implicit funding costs borne by BMO for over-the-counter derivative positions (the funding valuation adjustment).
The methodologies used for calculating these adjustments are reviewed on an ongoing basis to ensure that they remain appropriate. Significant changes in methodologies are made only when we believe that a change will result in better estimates of fair value.
Valuation Adjustments
| | | | | | | | |
(Canadian $ in millions) As at October 31 | | 2016 | | | 2015 | |
Credit risk | | | 92 | | | | 100 | |
Funding risk | | | 60 | | | | 60 | |
Liquidity risk | | | 43 | | | | 57 | |
Total | | | 195 | | | | 217 | |
The impact of tighter credit spreads was largely offset by lower interest rates, resulting in a modest decline in credit risk. Liquidity risk declined due to lower uncertainty in independent market data sources.
Pension and Other Employee Future Benefits
Our pension and other employee future benefits expense is calculated by our independent actuaries using assumptions determined by management. If actual experience were to differ from the assumptions used, the difference would be recognized in other comprehensive income.
Pension and other employee future benefits expense and the related obligations are sensitive to changes in discount rates. We determine discount rates at each year end for all our plans using high-quality corporate bonds with terms matching the plans’ specific cash flows.
Additional information regarding our accounting for pension and other employee future benefits, including a sensitivity analysis for key assumptions, is included in Note 22 on page 188 of the financial statements.
| | | | |
| BMO Financial Group 199th Annual Report 2016 | | | 113 | |
MANAGEMENT’S DISCUSSION AND ANALYSIS
Impairment of Securities
We have investments in securities issued or guaranteed by Canadian, U.S. and other governments, corporate debt and equity securities, mortgage-backed securities and collateralized mortgage obligations, which are classified as either available-for-sale securities, held-to-maturity securities or other securities. We review held-to-maturity, available-for-sale and other securities at each quarter-end reporting period to identify and evaluate investments that show indications of possible impairment. An investment is considered impaired if there is objective evidence that the estimated future cash flows will be reduced. We consider evidence such as delinquency or default, bankruptcy, restructuring or other evidence of deterioration in the creditworthiness of the issuer, or the absence of an active market. The decision to record a write-down, its amount and the period in which it is recorded could change if management’s assessment of those factors were to differ. We do not record impairment write-downs on debt securities when impairment is due to changes in market rates, if future contractual cash flows associated with the debt security are still expected to be recovered.
At the end of 2016, total unrealized losses related to available-for-sale securities for which cost exceeded fair value and an impairment write-down had not been recorded were $135 million ($152 million in 2015). Of this amount, $36 million related to available-for-sale securities for which cost had exceeded fair value for 12 months or more ($5 million in 2015). These unrealized losses resulted from changes in market interest rates and not from deterioration in the creditworthiness of the issuer.
Additional information regarding our accounting for available-for-sale securities, held-to-maturity securities and other securities and the determination of fair value is included in Note 3 on page 149 and Note 17 on page 177 of the financial statements.
Income Taxes and Deferred Tax Assets
The provision for income taxes is calculated based on the expected tax treatment of transactions recorded in our Consolidated Statements of Income or Changes in Equity. In determining the provision for income taxes, we interpret tax legislation in a variety of jurisdictions, and record our best estimate of the amount required to settle tax obligations. We also make assumptions about the expected timing of the reversal of deferred tax assets and liabilities. If our interpretations and assumptions differ from those of tax authorities or if the timing of reversals is not as expected, our provision for income taxes could increase or decrease in future periods. The amount of any such increase or decrease cannot be reasonably estimated.
Deferred tax assets are recognized only when it is probable that sufficient taxable profit will be available in future periods against which deductible temporary differences may be utilized. We are required to assess whether it is probable that our deferred income tax asset will be realized prior to its expiration and, based on all available evidence, determine if any portion of our deferred income tax asset should not be recognized. The factors used to assess the probability of realization are our past experience of income and capital gains, our forecast of future net income before taxes, available tax planning strategies that could be implemented to realize the deferred income tax asset, and the remaining expiration period of tax loss carryforwards. Changes in our assessment of these factors could increase or decrease our provision for income taxes in future periods.
If income tax rates increase or decrease in future periods in a jurisdiction, our provision for income taxes for future periods will increase or decrease accordingly. Furthermore, our deferred tax assets and liabilities will increase or decrease as income tax rates increase or decrease, respectively, and will result in an income tax impact. For example, a 5% decrease in the U.S. Federal tax rate (from 35% to 30%) would reduce our net deferred tax asset by approximately $230 million, which would result in a one-time corresponding income tax charge. In addition, however, each 5% decrease in the U.S. Federal tax rate would also increase our annual net income by approximately $75 million.
In fiscal 2016, we were reassessed by the Canada Revenue Agency (CRA) for additional income taxes in an amount of approximately $76 million in respect of certain 2011 Canadian corporate dividends. In its reassessment, the CRA denied dividend deductions on the basis that the dividends were received as part of a “dividend rental arrangement.” The dividends to which the reassessment relates were received in transactions similar to those addressed in the 2015 Canadian Federal Budget, which introduced prospective rules that apply as of May 1, 2017 for existing arrangements. We remain of the view that our tax filing position was appropriate and intend to challenge the reassessment. If our challenge is unsuccessful, the additional tax expense would negatively impact our net income. For a discussion of the synthetic equity arrangement rules which were passed into law in Canada, see the Legal and Regulatory Risk section on page 110.
Additional information regarding our accounting for income taxes is included in Note 23 on page 192 of the financial statements.
Goodwill and Intangible Assets
Goodwill is assessed for impairment at least annually. This assessment includes a comparison of the carrying value and the recoverable amount of each business unit to verify that the recoverable amount of the business unit is greater than its carrying value. If the carrying value were to exceed the recoverable amount of the business unit, an impairment calculation would be performed. The recoverable amount of an asset is the higher of its fair value less costs to sell and its value in use.
Fair value less costs to sell was used to perform the impairment test in all periods. In determining fair value less costs to sell, we employ a discounted cash flow model, consistent with that used when we acquire businesses. This model is dependent on assumptions related to revenue growth, discount rates, synergies achieved on acquisition and the availability of comparable acquisition data. Changes in any of these assumptions would affect the determination of fair value for each of our business units in a different manner. Management must exercise judgment and make assumptions in determining fair value, and differences in judgments and assumptions could affect the determination of fair value and any resulting impairment write-down. At October 31, 2016, the estimated fair value of each of our business units was greater than its carrying value.
Definite-lived intangible assets are amortized to income on either a straight-line or an accelerated basis over a period not exceeding 15 years, depending on the nature of the asset. We test definite-lived intangible assets for impairment when circumstances indicate the carrying value may not be recoverable. During the year ended October 31, 2016, we recorded $nil in impairment of definite-lived intangibles ($1 million in 2015).
Indefinite life intangible assets are tested annually for impairment. If any intangible assets are determined to be impaired, we write them down to their recoverable amount, the higher of value in use and fair value less costs to sell, when this is less than the carrying value. No such impairment was identified for the years ended October 31, 2016 and 2015. Additional information regarding the composition of goodwill and intangible assets is included in Note 11 on page 169 of the financial statements.
| | |
| 114 | | BMO Financial Group 199th Annual Report 2016 |
Purchased Loans
Acquired loans are identified as either purchased performing loans or purchased credit impaired loans (PCI loans), both of which are recorded at fair value at the time of acquisition. The determination of fair value involves estimating the expected cash flows to be received and determining the discount rate to be applied to those cash flows from the loan portfolio. In determining the discount rate, we consider various factors, including our cost to raise funds in the current market, the risk premium associated with the loans and the cost to service the portfolios.
PCI loans are those where the timely collection of principal and interest is no longer reasonably assured as at the date of acquisition. We regularly evaluate what we expect to collect on PCI loans. Changes in expected cash flows could result in the recognition of impairment or a recovery through the provision for credit losses. Estimating the timing and amount of cash flows requires significant management judgment regarding key assumptions, including the probability of default, severity of loss, timing of payment receipts and valuation of collateral. All of these factors are inherently subjective and can result in significant changes in cash flow estimates over the term of a loan.
The purchased performing loans are subject to the same credit review processes we apply to loans we originate. We also assess the portfolio to ensure the remaining credit mark is adequate to cover probable credit losses in the portfolio. This requires judgment regarding assumptions, including the probability of default, severity of loss, timing of future cash flows, and valuation of collateral and estimated life of the loans.
Additional information regarding purchased loans is provided in Note 4 on page 153 of the financial statements.
Insurance-Related Liabilities
Insurance claims and policy benefit liabilities represent current claims and estimates of future insurance policy obligation liabilities. Liabilities for life insurance contracts are determined using the Canadian Asset Liability Method, which incorporates best-estimate assumptions for mortality, morbidity, policy lapses, surrenders, future investment yields, policy dividends, administration costs and margins for adverse deviation. These assumptions are reviewed at least annually and updated to reflect actual experience and market conditions. The most significant impact on the valuation of these liabilities would be the result of a change in the assumption for future investment yields. If the assumed yield were to increase by one percentage point, net income would increase by approximately $66 million. A reduction of one percentage point would lower net income by approximately $64 million. See the Insurance Risk section on page 109 for further discussion of the impact of changing rates on insurance earnings.
Provisions
BMO and its subsidiaries are involved in various legal actions in the ordinary course of business.
Provisions are recorded at the best estimate of the amount required to settle any obligation related to these legal actions as at the balance sheet date, taking into account the risks and uncertainties surrounding the obligation. Factors included in making the assessment include a case-by-case assessment of specific facts and circumstances, our past experience and the opinions of legal experts. Management and internal and external experts are involved in estimating any amounts that may be required. The actual costs of resolving these claims may be substantially higher or lower than the amount of the provisions.
Additional information regarding provisions is provided in Note 25 on page 195 of the financial statements.
Transfers of Financial Assets and Consolidation of Structured Entities
We sell Canadian mortgage loans to third-party Canadian securitization programs, including the Canadian Mortgage Bond program, and directly to third-party investors under the National Housing Act Mortgage-Backed Securities program. We assess whether substantially all of the risks and rewards of the loans have been transferred to determine if they qualify for derecognition. Since we continue to be exposed to substantially all of the prepayment, interest rate and/or credit risk associated with the securitized loans, they do not qualify for derecognition. We continue to recognize the loans and recognize the related cash proceeds as secured financing in our Consolidated Balance Sheet. Additional information concerning the transfer of financial assets is included on page 77, as well as in Note 6 on page 159 of the financial statements.
In the normal course of business, BMO enters into arrangements with SEs. We are required to consolidate SEs if we determine that we control the SEs. We control an SE when we have power over the entity, exposure or rights to variable returns from our investment and the ability to exercise power to affect the amount of our returns. Additional information concerning BMO’s interests in SEs is included on page 77, as well as in Note 7 on page 159 of the financial statements.
Caution
This Critical Accounting Estimates section contains forward-looking statements. Please see the Caution Regarding Forward-Looking Statements.
Changes in Accounting Policies in 2016
There were no changes in our accounting policies in 2016.
Future Changes in Accounting Policies
BMO monitors the potential changes to IFRS proposed by the International Accounting Standards Board (IASB) and analyzes the effect that any such changes to the standards may have on BMO’s financial reporting and accounting policies. New standards and amendments to existing standards that will be effective for BMO in the future are described in Note 1 on page 144 of the financial statements.
Adoption of IFRS 9 Financial Instruments
In July 2014, the IASB issued IFRS 9Financial Instruments (IFRS 9), which addresses impairment, classification, measurement, and hedge accounting. At the direction of our regulator, OSFI, IFRS 9 is effective for the bank for the fiscal year beginning November 1, 2017. Additional guidance relating to the adoption of IFRS 9 has been provided by OSFI in itsGuideline – IFRS 9 Financial Instruments and Disclosures (OSFI Guideline). The OSFI Guideline is consistent with the guidance provided by the Basel Committee on Banking Supervision (BCBS). Additional information and accounting policies concerning IFRS 9 are discussed below, as well as in Note 1 on page 144 of the financial statements.
| | | | |
| BMO Financial Group 199th Annual Report 2016 | | | 115 | |
MANAGEMENT’S DISCUSSION AND ANALYSIS
Impairment
The impairment provisions of IFRS 9 are expected to have the largest impact on the bank and will result in the earlier recognition of provisions for
credit losses, with the initial increase to the collective allowance on adoption of the standard recorded in retained earnings. The new standard is expected to increase the variability of the provision for credit losses.
IFRS 9 introduces a new single expected credit loss (ECL) impairment model for all financial assets and certain off-balance sheet loan commitments and guarantees. The new ECL model will result in an allowance for credit losses being recorded on financial assets regardless of whether there has been an actual loss event. The most significant impact will be on the loan portfolio. The expected credit loss model requires the recognition of credit losses based on the expected lifetime losses on loans that are either credit impaired or have experienced a significant increase in credit risk since origination, and 12 months of expected losses for all other loans. The expected loss calculations are required to incorporate forward-looking macroeconomic information in determining the final provision. We do not expect significant changes to the accounting related to the specific loan loss allowance or the specific provision for credit losses.
Key Impairment Modelling Concepts
We will leverage our existing enterprise-wide risk management framework wherever allowable under IFRS 9. Certain key modelling concepts, their application under IFRS 9 and key differences from existing regulatory frameworks are discussed below.
The expected credit loss concept already exists in regulatory and stress testing frameworks. As the objectives of these various frameworks differ, the manner in which the expected credit losses are calculated also differs. The ECL is calculated as a function of the probability of default (PD), the exposure at default (EAD) and the loss given default (LGD), with the timing of the loss also considered.
The PD represents the likelihood that a loan will not be repaid and will go into default in either a 12-month or lifetime horizon. The PD for each individual instrument will incorporate a consideration of past events, current market conditions and reasonable and supportable information about future economic conditions. The bank is developing IFRS 9 specific PD models.
The EAD represents an estimate of the outstanding amount of credit exposure at the time a default may occur. For off-balance sheet and undrawn amounts, EAD includes an estimate of any further amounts to be drawn at the time of default. For IFRS 9, EAD models will be adjusted for a 12-month or lifetime horizon and for macroeconomic factors where appropriate.
The LGD is the amount that may not be recovered in the event of default. LGD takes into consideration the amount and quality of any collateral held. The bank will be using its existing LGD models adjusted to meet the IFRS 9 requirements.
The IFRS 9 terms used above differ from those used in calculating our expected losses for regulatory purposes as follows:
| | | | |
| | | Regulatory Capital | | IFRS 9 |
| PD | | • Through the cycle 12-month loss view • The definition of default is generally 90 days past due except for credit cards, which uses 180 days past due | | • Point-in-time 12-month or lifetime horizon based on past experience, current conditions and reasonable supportable forward-looking information • Default definition consistent with regulatory capital |
| EAD | | • Includes expected draws prior to default and cannot be lower than current outstanding | | • Represents the expected exposure across a 12-month or lifetime horizon adjusted for economic conditions and can be lower than the current outstanding |
| LGD | | • Downturn LGD based on a severe economic downturn • Certain regulatory floors apply • Includes direct and indirect costs associated with collection | | • Expected LGD based on 12-month or lifetime horizon adjusted for reasonable supportable forward-looking information where appropriate • No regulatory floors • Only direct costs included |
| Other | | | | • Lifetime losses are discounted back from point of default to the balance sheet date |
Impacts on Governance and Controls
We will be realigning certain internal control practices to address the new requirements of IFRS 9. The two largest areas of impact will be on the development of future economic scenarios and the determination of a significant increase in credit risk. We will establish a governance framework to ensure that the economic scenarios that are developed are reasonable and supportable and take into consideration all reasonably available information about possible future events. Additionally, we will develop a process to monitor our credit practices and portfolio composition to ensure that the definition of a significant increase in credit risk remains appropriate.
We will ensure that all impacted internal controls will be updated in accordance with our internal policies and procedures relating to internal control over financial reporting. All controls will be tested and evaluated for effectiveness in accordance with the criteria established inInternal Control – Integrated Framework, issued by the Committee of Sponsoring Organizations of the Treadway Commission in May 2013.
Impacts on Capital Planning
IFRS 9 is expected to have an impact on our reported capital as a result of any adjustment recorded in retained earnings on adoption of the standard and the anticipated increased responsiveness of the allowance to changes in the credit profile going forward. OSFI and the BCBS have not yet finalized their approach to incorporating into the calculation of our capital ratios any adjustments recorded on transition to IFRS 9. The BCBS has issued itsConsultative Document on the Regulatory treatment of accounting provisions – interim approaches and transitional arrangements with comments due in January of 2017 to address this issue. To ensure timely and appropriate consideration of capital management issues, the bank has established an IFRS 9 Steering Committee which includes representatives from the bank’s capital management team. We are in the process of determining the impact of IFRS 9 adoption on both the financial statements and capital planning.
| | |
| 116 | | BMO Financial Group 199th Annual Report 2016 |
Classification and Measurement
The new standard requires that we classify debt instruments based on our business model for managing the assets and the contractual cash flow characteristics of the asset. The business model test determines classification based on the business purpose for holding the asset. Generally, debt instruments will be measured at fair value through profit and loss unless certain conditions are met that permit fair value through other comprehensive income (FVOCI) or amortized cost. Debt instruments that have contractual cash flows representing only payments of principal and interest will be eligible for classification as FVOCI or amortized cost. Gains and losses recorded in other comprehensive income for debt instruments will be recognized in profit or loss on disposal.
Equity instruments would generally be measured at fair value through profit and loss unless we elect to measure at fair value through other comprehensive income. This will result in unrealized gains and losses on equity instruments currently classified as available-for-sale equity securities being recorded in income going forward. Currently, these unrealized gains and losses are recognized in other comprehensive income. Should we elect to record equity instruments at fair value through other comprehensive income, gains and losses would never be recognized in income.
Hedging
IFRS 9 introduces a new hedge accounting model that expands the scope of hedged items and risks eligible for hedge accounting and aligns hedge accounting more closely with risk management. The new model no longer specifies quantitative measures for effectiveness testing and does not permit hedge de-designation. IFRS 9 includes a policy choice that would allow the bank to continue to apply the existing hedge accounting rules. We are currently assessing whether we will adopt the IFRS 9 hedge requirements, or retain the existing requirements.
Leases
In January 2016, the IASB issued IFRS 16Leases (IFRS 16), which provides guidance for leases that will require lessees to recognize a liability for the present value of future lease liabilities and record a corresponding asset on the balance sheet. There are minimal changes to lessor accounting. IFRS 16 is effective for our fiscal year beginning November 1, 2019. Early adoption is permitted, provided IFRS 15Revenue from Contracts with Customers has been adopted. We are currently assessing the impact of the standard on our future financial results.
Revenue
In April 2016, the IASB issued amendments to IFRS 15Revenue from Contracts with Customers (IFRS 15), which provides additional clarity on revenue recognition related to identifying performance obligations, application guidance on principal versus agent and licenses of intellectual property. We will be adopting IFRS 15 effective for our fiscal year beginning November 1, 2018. We are currently assessing the impact of the standard on our future financial results.
Transactions with Related Parties
In the ordinary course of business, we provide banking services to our key management personnel on the same terms that we offer to our preferred customers for those services. Key management personnel are defined as those persons having authority and responsibility for planning, directing and/or controlling the activities of an entity, being the directors and the most senior executives of the bank. We provide banking services to our joint ventures and equity-accounted investees on the same terms offered to our customers for these services.
Details of our investments in joint arrangements and associates and the compensation of key management personnel are disclosed in Note 28 on page 201 of the financial statements. We also offer employees a subsidy on annual credit card fees.
| | | | |
| BMO Financial Group 199th Annual Report 2016 | | | 117 | |
MANAGEMENT’S DISCUSSION AND ANALYSIS
Shareholders’ Auditors’ Services and Fees
Review of Shareholders’ Auditors
The Audit and Conduct Review Committee (ACRC) is responsible for the appointment, compensation and oversight of the shareholders’ auditors and conducts an annual assessment of the performance and effectiveness of the shareholders’ auditors, considering factors such as: (i) the quality of services provided by the shareholders’ auditors’ engagement team during the audit period; (ii) the relevant qualifications, experience and geographical reach to serve BMO Financial Group; (iii) the quality of communications received from the shareholders’ auditors; and (iv) the independence, objectivity and professional skepticism of the shareholders’ auditors.
The ACRC believes that it has robust review processes in place to monitor audit quality and oversee the work of the shareholders’ auditors, including the lead audit partner, which include:
| • | | annually reviewing the audit plan in two separate meetings, including a consideration of the impact of business risks on the audit plan and an assessment of the reasonableness of the audit fee; |
| • | | reviewing qualifications of their senior engagement team members; |
| • | | monitoring the execution of the audit plan of the shareholders’ auditors, with emphasis on the more complex and risky areas of the audit; |
| • | | reviewing and evaluating the audit findings, including in camera sessions; |
| • | | evaluating audit quality and performance, including recent Canadian Public Accountability Board (CPAB) and Public Company Accounting Oversight Board (PCAOB) inspection reports on the shareholders’ auditors and their peer firms; |
| • | | at a minimum, holding quarterly meetings with the ACRC Chair and the lead audit partner to discuss audit issues independently of management; and |
| • | | performing a comprehensive review of the shareholders’ auditors every five years, and performing an annual review between comprehensive reviews, conducted following the guidelines set out by the Chartered Professional Accountants of Canada (CPA of Canada) and the CPAB. |
In 2016, the annual review of the shareholders’ auditors was completed. Input was sought from ACRC members, management and corporate audit on areas such as communication effectiveness, industry insights and audit performance. In 2015, the ACRC completed a periodic comprehensive review of the shareholders’ auditors. The comprehensive review was based on the recommendations of the CPA of Canada and the CPAB. These reviews focused on: (i) the independence, objectivity and professional skepticism of the shareholders’ auditors; (ii) the quality of the engagement team; and (iii) the quality of communications and interactions with the shareholders’ auditors. As a result of these reviews, the ACRC was satisfied with the performance of the shareholders’ auditors.
Independence of the shareholders’ auditors is overseen by the ACRC in accordance with our Auditor Independence Policy. The ACRC also ensures that the lead audit partner rotates out of that role after five consecutive years and does not return to that role for a further five years.
Pre-Approval Policies and Procedures
As part of BMO Financial Group’s corporate governance practices, the ACRC oversees the application of our policy limiting the services provided by the shareholders’ auditors that are not related to their role as auditors. The ACRC pre-approves the types of services (permitted services) that can be provided by the shareholders’ auditors, as well as the annual audit plan, which includes fees for specific types of services. For permitted services that are not included in the pre-approved annual audit plan, approval to proceed with the engagement is obtained and the services to be provided are presented to the ACRC for ratification at its next meeting. All services must comply with our Auditor Independence policy, as well as professional standards and securities regulations governing auditor independence.
Shareholders’ Auditors’ Fees
Aggregate fees paid to the shareholders’ auditors during the fiscal years ended October 31, 2016 and 2015 were as follows:
| | | | | | | | |
(Canadian $ in millions) Fees (1) | | 2016 | | | 2015 | |
Audit fees | | | 17.6 | | | | 17.1 | |
Audit-related fees (2) | | | 2.5 | | | | 2.2 | |
Tax fees | | | – | | | | 0.1 | |
All other fees (3) | | | 2.7 | | | | 2.3 | |
Total | | | 22.8 | | | | 21.7 | |
| | | | |
| | (1) | | The classification of fees is based on applicable Canadian securities laws and U.S. Securities and Exchange Commission definitions. |
| | (2) | | Audit-related fees for 2016 and 2015 relate to fees paid for accounting advice, specified procedures on our Proxy Circular and other specified procedures. |
| | (3) | | All other fees for 2016 and 2015 relate primarily to fees paid for reviews of compliance with regulatory requirements for financial information and reports on internal controls over services provided by various BMO Financial Group businesses. They also include the costs of translation services. |
| | |
| 118 | | BMO Financial Group 199th Annual Report 2016 |
Management’s Annual Report on Disclosure Controls and Procedures
and Internal Control over Financial Reporting
Disclosure Controls and Procedures
Disclosure controls and procedures are designed to provide reasonable assurance that all relevant information is gathered and reported to senior management, including the Chief Executive Officer (CEO) and the Chief Financial Officer (CFO), on a timely basis so that appropriate decisions can be made regarding public disclosure.
As at October 31, 2016, under the supervision of the CEO and the CFO, Bank of Montreal’s management evaluated the effectiveness of the design and operation of our disclosure controls and procedures, as defined in Canada byNational Instrument 52-109, Certification of Disclosure in Issuers’ Annual and Interim Filings, and in the United States by Rule 13a-15(e) under theSecurities Exchange Act of 1934 (the Exchange Act). Based on this evaluation, the CEO and the CFO have concluded that our disclosure controls and procedures were effective, as at October 31, 2016.
Internal Control over Financial Reporting
Internal control over financial reporting is a process designed under the supervision of the bank’s CEO and CFO, in order to provide reasonable assurance regarding the reliability of financial reporting and the preparation of financial statements in accordance with IFRS and the requirements of the Securities and Exchange Commission (SEC) in the United States, as applicable. Management is responsible for establishing and maintaining adequate internal control over financial reporting for Bank of Montreal.
Bank of Montreal’s internal control over financial reporting includes policies and procedures that:
| | (i) | pertain to the maintenance of records that, in reasonable detail, accurately and fairly reflect the transactions and dispositions of the assets of Bank of Montreal; |
| | (ii) | are designed to provide reasonable assurance that transactions are recorded as necessary to permit preparation of the financial statements in accordance with IFRS and the requirements of the SEC in the United States, as applicable, and that receipts and expenditures of Bank of Montreal are being made only in accordance with authorizations by management and directors of Bank of Montreal; and |
| | (iii) | are designed to provide reasonable assurance that any unauthorized acquisition, use or disposition of Bank of Montreal’s assets which could have a material effect on the financial statements is prevented or detected in a timely manner. |
Because of its inherent limitations, internal control over financial reporting can provide only reasonable assurance and may not prevent or detect misstatements. Furthermore, projections of any evaluation of effectiveness to future periods are subject to the risk that controls may become inadequate because of changes in conditions, or that the degree of compliance with the related policies and procedures may deteriorate.
Bank of Montreal’s management, under the supervision of the CEO and the CFO, has evaluated the effectiveness of internal control over financial reporting using the framework and criteria established inInternal Control – Integrated Framework, issued by the Committee of Sponsoring Organizations of the Treadway Commission in May 2013 (2013 COSO Framework). Based on this evaluation, management has concluded that internal control over financial reporting was effective as at October 31, 2016.
At the request of Bank of Montreal’s Audit and Conduct Review Committee, KPMG LLP (shareholders’ auditors), an independent registered public accounting firm, has conducted an audit of the effectiveness of our internal control over financial reporting. The audit report states in its conclusion that, in KPMG’s opinion, Bank of Montreal maintained, in all material respects, effective internal control over financial reporting as at October 31, 2016, in accordance with the criteria established in the 2013 COSO Framework. This audit report appears on page 138.
Changes in Internal Control over Financial Reporting
There were no changes in our internal control over financial reporting in fiscal 2016 that have materially affected, or are reasonably likely to materially affect, the adequacy and effectiveness of our internal control over financial reporting.
| | | | |
| BMO Financial Group 199th Annual Report 2016 | | | 119 | |
MANAGEMENT’S DISCUSSION AND ANALYSIS
Enhanced Disclosure Task Force
On October 29, 2012, the Enhanced Disclosure Task Force (EDTF) of the Financial Stability Board published its first report, Enhancing the Risk Disclosures of Banks. We support the recommendations issued by the EDTF for the provision of high-quality, transparent risk disclosures.
Disclosures related to the EDTF recommendations are detailed below.
| | |
General |
| 1 | | Present all risk-related information in the Annual Report, Supplementary Financial Information and Supplementary Regulatory Capital Disclosure, and provide an index for easy navigation. |
| | Annual Report: Risk-related information is presented in the Enterprise-Wide Risk Management section on pages 79 to 112. An index for the MD&A is provided on page 26. An index for the notes to the financial statements is provided on page 144. |
| | Supplementary Financial Information: An index is provided in our Supplementary Financial Information. |
| 2 | | Define the bank’s risk terminology and risk measures and present key parameters used. |
| | Annual Report: Specific risk definitions and key parameters underpinning BMO’s risk reporting are provided on pages 88 to 112. A glossary of financial terms (including risk terminology) can be found on pages 206 to 207. |
| 3 | | Discuss top and emerging risks for the bank. |
| | Annual Report: BMO’s top and emerging risks are discussed on pages 80 to 83. |
| 4 | | Outline plans to meet new key regulatory ratios once the applicable rules are finalized. |
| | Annual Report: We outline BMO’s plans to meet new regulatory ratios on pages 70 to 73 and 105. |
Risk Governance |
| 5 | | Summarize the bank’s risk management organization, processes, and key functions. |
| | Annual Report: BMO’s risk management organization, processes and key functions are summarized on pages 83 to 87. |
| 6 | | Describe the bank’s risk culture. |
| | Annual Report: BMO’s risk culture is described on page 84. |
| 7 | | Describe key risks that arise from the bank’s business model and activities. |
| | Annual Report: A diagram of BMO’s risk exposure by operating segment is provided on page 75. |
| 8 | | Describe the use of stress testing within the bank’s risk governance and capital frameworks. |
| | Annual Report: BMO’s stress testing process is described on page 87. |
Capital Adequacy and Risk-Weighted Assets (RWA) |
| 9 | | Provide minimum Pillar 1 capital requirements. |
| | Annual Report: Pillar 1 capital requirements are described on pages 70 to 73. |
| | Supplementary Financial Information: Regulatory capital is disclosed on page 35. |
| 10 | | Summarize information contained in the composition of capital templates adopted by the Basel Committee. |
| | Annual Report: An abridged version of the regulatory capital template is provided on page 73. |
| | Supplementary Financial Information: Pillar 3 disclosure is provided on pages 35 to 37 and 39. A Main Features template can be found on BMO’s website at www.bmo.com under Investor Relations and Regulatory Filings. |
| 11 | | Present a flow statement of movements in regulatory capital, including changes in Common Equity Tier 1, Additional Tier 1, and Tier 2 capital. |
| | Supplementary Financial Information: Regulatory capital flow statement is provided on page 40. |
| 12 | | Discuss capital planning within a more general discussion of management’s strategic planning. |
| | Annual Report: BMO’s capital planning process is discussed under Capital Management Framework on page 70. |
| 13 | | Provide granular information to explain how RWA relate to business activities. |
| | Annual Report: A diagram of BMO’s risk exposure, including RWA by operating group, is provided on page 75. |
| 14 | | Present a table showing the capital requirements for each method used for calculating RWA. |
| | Annual Report: Regulatory capital requirement, as a percentage of RWA, is outlined on page 71. Information about significant models used to determine RWA is provided on pages 89 to 90. |
| | Supplementary Financial Information: A table showing RWA by model approach and by risk type is provided on page 39. |
| 15 | | Tabulate credit risk in the banking book for Basel asset classes. |
| | Supplementary Financial Information: Wholesale and retail credit exposures by internal rating grades are provided on page 47. |
| 16 | | Present a flow statement that reconciles movements in RWA by credit risk and market risk. |
| | Supplementary Financial Information: RWA flow statements are provided on page 41, with a reconciliation on page 38. |
| 17 | | Describe the bank’s Basel validation and back-testing process. |
| | Annual Report: BMO’s Basel validation and back-testing process for credit and market risk is described on pages 108 to 109. |
| | Supplementary Financial Information: A table showing Exposure at Default and RWA by model approach and asset class is provided on page 39. A table showing estimated and actual loss parameters is provided on page 49. |
| | |
| 120 | | BMO Financial Group 199th Annual Report 2016 |
| | |
Liquidity |
| 18 | | Describe how the bank manages its potential liquidity needs and the liquidity reserve held to meet those needs. |
| | Annual Report: BMO’s potential liquidity needs and the liquidity reserve held to meet those needs are described on pages 100 to 101. |
Funding |
| 19 | | Summarize encumbered and unencumbered assets in a table by balance sheet category. |
| | Annual Report: An Asset Encumbrance table is provided on page 102. Additional collateral requirements in the event of downgrades by rating agencies are disclosed in Note 8 on page 164 of the financial statements. |
| | Supplementary Financial Information: The Asset Encumbrance table by currency is provided on page 34. |
| 20 | | Tabulate consolidated total assets, liabilities and off-balance sheet commitments by remaining contractual maturity. |
| | Annual Report: A Contractual Maturity table is presented in Note 29 on pages 202 to 205 of the financial statements. |
| 21 | | Discuss the bank’s sources of funding and describe the bank’s funding strategy. |
| | Annual Report: BMO’s sources of funding and funding strategy are described on pages 103 to 104. A table showing the composition and maturity of wholesale funding is provided on page 104. |
Market Risk |
| 22 | | Provide a breakdown of balance sheet positions into trading and non-trading market risk measures. |
| | Annual Report: A table linking balance sheet items to market risk measures is provided on page 98. |
| 23 | | Provide qualitative and quantitative breakdowns of significant trading and non-trading market risk measures. |
| | Annual Report: Trading market risk exposures are described and quantified on pages 95 to 97. Structural (non-trading) market risk exposures are described and quantified on pages 98 to 99. |
| 24 | | Describe significant market risk measurement model validation procedures and back-testing and how these are used to enhance the parameters of the model. |
| | Annual Report: Market risk measurement model validation procedures and back-testing for trading market risk and structural (non-trading) market risk are described on pages 108 to 109. |
| 25 | | Describe the primary risk management techniques employed by the bank to measure and assess the risk of loss beyond reported risk measures. |
| | Annual Report: The use of stress testing, scenario analysis and stressed VaR for market risk management is described on pages 95 to 97. |
Credit Risk |
| 26 | | Provide information about the bank’s credit risk profile. |
| | Annual Report: Information about BMO’s credit risk profile is provided on pages 90 to 92 and in Notes 4 and 5 on pages 153 to 158 of the financial statements. Supplementary Financial Information: Tables detailing credit risk information are provided on pages 20 to 30 and 43 to 50. |
| 27 | | Describe the bank’s policies related to impaired loans and renegotiated loans. |
| | Annual Report: Impaired and renegotiated loan policies are described in Note 4 on pages 153 and 155, respectively, of the financial statements. |
| 28 | | Provide reconciliations of impaired loans and the allowance for credit losses. |
| | Annual Report: Continuity schedules for gross impaired loans and allowance for credit losses are provided on pages 91 to 92 and in Note 4 on pages 154 to 155 of the financial statements. |
| 29 | | Provide a quantitative and qualitative analysis of the bank’s counterparty credit risk that arises from its derivative transactions. |
| | Annual Report: Quantitative disclosures on collateralization agreements for over-the-counter (OTC) derivatives are provided on page 94 and qualitative disclosures are provided on pages 88 to 89. Supplementary Financial Information: Quantitative disclosures for OTC derivatives are provided on page 33. |
| 30 | | Provide a discussion of credit risk mitigation. |
| | Annual Report: A discussion of BMO’s credit and counterparty risk management is provided on pages 88 to 89. Collateral management discussions are provided on pages 88 to 89 and in Note 8 on pages 164 and 166 and in Note 25 on page 196 of the financial statements. Supplementary Financial Information: The exposures covered by credit risk mitigation table is provided on page 43. |
Other Risks |
| 31 | | Describe other risks and discuss how each is identified, governed, measured and managed. |
| | Annual Report: A diagram illustrating the risk governance process that supports BMO’s risk culture is provided on page 83. Other risks are discussed on pages 106 to 112. |
| 32 | | Discuss publicly known risk events related to other risks, where material or potentially material loss events have occurred. |
| | Annual Report: Other risks are discussed on pages 106 to 112. |
| | | | |
| BMO Financial Group 199th Annual Report 2016 | | | 121 | |
SUPPLEMENTAL INFORMATION
Supplemental Information
Certain comparative figures have been reclassified to conform to the current period’s presentation and for changes in accounting policies. Refer to Note 1 of the consolidated financial statements. In addition, since November 1, 2011, BMO’s financial statements have been reported in accordance with IFRS. Results for years prior to 2011 have not been restated and are presented in accordance with Canadian GAAP as defined at that time (CGAAP).
As a result of these changes, certain growth rates and compound annual growth rates (CAGR) may not be meaningful.
Adjusted results in this section are non-GAAP measures. Refer to the Non-GAAP Measures section on page 33.
Table 1: Shareholder Value and Other Statistical Information
| | | | | | | | | | | | | | | | | | | | | | | | | | | | | | | | | | | | | | | | |
| As at or for the year ended October 31 | | 2016 | | | 2015 | | | 2014 | | | 2013 | | | 2012 | | | 2011 | | | 2010 | | | 2009 | | | 2008 | | | 2007 | |
Market Price per Common Share($) | | | | | | | | | | | | | | | | | | | | | | | | | | | | | | | | | | | | | | | | |
High | | | 87.92 | | | | 84.39 | | | | 85.71 | | | | 73.90 | | | | 61.29 | | | | 63.94 | | | | 65.71 | | | | 54.75 | | | | 63.44 | | | | 72.75 | |
Low | | | 68.65 | | | | 64.01 | | | | 67.04 | | | | 56.74 | | | | 53.15 | | | | 55.02 | | | | 49.78 | | | | 24.05 | | | | 35.65 | | | | 60.21 | |
Close | | | 85.36 | | | | 76.04 | | | | 81.73 | | | | 72.62 | | | | 59.02 | | | | 58.89 | | | | 60.23 | | | | 50.06 | | | | 43.02 | | | | 63.00 | |
| | | | | | | | | | |
Common Share Dividends | | | | | | | | | | | | | | | | | | | | | | | | | | | | | | | | | | | | | | | | |
Dividends declared per share ($) | | | 3.40 | | | | 3.24 | | | | 3.08 | | | | 2.94 | | | | 2.82 | | | | 2.80 | | | | 2.80 | | | | 2.80 | | | | 2.80 | | | | 2.71 | |
Dividend payout ratio (%) | | | 49.0 | | | | 49.2 | | | | 47.8 | | | | 47.5 | | | | 46.0 | | | | 57.1 | | | | 58.6 | | | | 90.6 | | | | 73.9 | | | | 64.8 | |
Dividend yield (%) | | | 4.0 | | | | 4.3 | | | | 3.8 | | | | 4.0 | | | | 4.8 | | | | 4.8 | | | | 4.6 | | | | 5.6 | | | | 6.5 | | | | 4.3 | |
Dividends declared ($ millions) | | | 2,191 | | | | 2,087 | | | | 1,991 | | | | 1,904 | | | | 1,820 | | | | 1,690 | | | | 1,571 | | | | 1,530 | | | | 1,409 | | | | 1,354 | |
| | | | | | | | | | |
Total Shareholder Return(%) | | | | | | | | | | | | | | | | | | | | | | | | | | | | | | | | | | | | | | | | |
Five-year average annual return | | | 12.5 | | | | 9.5 | | | | 15.5 | | | | 17.0 | | | | 4.2 | | | | 1.9 | | | | 5.9 | | | | 1.8 | | | | 0.9 | | | | 14.2 | |
Three-year average annual return | | | 9.9 | | | | 13.5 | | | | 16.7 | | | | 11.5 | | | | 10.8 | | | | 17.4 | | | | 4.5 | | | | (5.3 | ) | | | (5.6 | ) | | | 6.6 | |
One-year return | | | 17.0 | | | | (3.0 | ) | | | 17.1 | | | | 28.8 | | | | 5.2 | | | | 2.4 | | | | 26.4 | | | | 25.1 | | | | (27.9 | ) | | | (5.8 | ) |
| | | | | | | | | | |
Common Share Information | | | | | | | | | | | | | | | | | | | | | | | | | | | | | | | | | | | | | | | | |
Number outstanding (in thousands) | | | | | | | | | | | | | | | | | | | | | | | | | | | | | | | | | | | | | | | | |
End of year | | | 645,761 | | | | 642,583 | | | | 649,050 | | | | 644,130 | | | | 650,730 | | | | 639,000 | | | | 566,468 | | | | 551,716 | | | | 504,575 | | | | 498,563 | |
Average basic | | | 644,049 | | | | 644,916 | | | | 645,860 | | | | 648,476 | | | | 644,407 | | | | 591,403 | | | | 559,822 | | | | 540,294 | | | | 502,062 | | | | 499,950 | |
Average diluted | | | 646,148 | | | | 647,162 | | | | 648,475 | | | | 649,806 | | | | 648,615 | | | | 607,068 | | | | 563,125 | | | | 542,313 | | | | 506,697 | | | | 508,614 | |
Number of shareholder accounts | | | 52,087 | | | | 53,481 | | | | 55,610 | | | | 56,241 | | | | 59,238 | | | | 58,769 | | | | 36,612 | | | | 37,061 | | | | 37,250 | | | | 37,165 | |
Book value per share ($) | | | 59.56 | | | | 56.31 | | | | 48.18 | | | | 43.22 | | | | 39.41 | | | | 36.76 | | | | 34.09 | | | | 31.95 | | | | 32.02 | | | | 28.29 | |
Total market value of shares ($ billions) | | | 55.1 | | | | 48.9 | | | | 53.0 | | | | 46.8 | | | | 38.4 | | | | 37.6 | | | | 34.1 | | | | 27.6 | | | | 21.7 | | | | 31.4 | |
Price-to-earnings multiple | | | 12.3 | | | | 11.6 | | | | 12.8 | | | | 11.8 | | | | 9.7 | | | | 12.2 | | | | 12.7 | | | | 16.3 | | | | 11.4 | | | | 15.3 | |
Price-to-adjusted earnings multiple | | | 11.4 | | | | 10.9 | | | | 12.4 | | | | 11.7 | | | | 9.9 | | | | 11.5 | | | | 12.5 | | | | 12.5 | | | | 9.2 | | | | 11.6 | |
Market-to-book value multiple | | | 1.43 | | | | 1.35 | | | | 1.70 | | | | 1.66 | | | | 1.47 | | | | 1.49 | | | | 1.77 | | | | 1.57 | | | | 1.34 | | | | 2.23 | |
| | | | | | | | | | |
Balances($ millions) | | | | | | | | | | | | | | | | | | | | | | | | | | | | | | | | | | | | | | | | |
As at assets | | | 687,935 | | | | 641,881 | | | | 588,659 | | | | 537,044 | | | | 524,684 | | | | 500,575 | | | | 411,640 | | | | 388,458 | | | | 416,050 | | | | 366,524 | |
Average daily assets | | | 707,122 | | | | 664,391 | | | | 593,928 | | | | 555,431 | | | | 543,931 | | | | 469,934 | | | | 398,474 | | | | 438,548 | | | | 397,609 | | | | 360,575 | |
Average daily net loans and acceptances | | | 357,708 | | | | 320,081 | | | | 292,098 | | | | 266,107 | | | | 246,129 | | | | 215,414 | | | | 171,554 | | | | 182,097 | | | | 175,079 | | | | 165,783 | |
| | | | | | | | | | |
Return on Equity and Assets | | | | | | | | | | | | | | | | | | | | | | | | | | | | | | | | | | | | | | | | |
Return on equity (%) | | | 12.1 | | | | 12.5 | | | | 14.0 | | | | 14.9 | | | | 15.9 | | | | 15.1 | | | | 14.9 | | | | 9.9 | | | | 13.0 | | | | 14.4 | |
Adjusted return on equity (%) (1) | | | 13.1 | | | | 13.3 | | | | 14.4 | | | | 15.0 | | | | 15.5 | | | | 16.0 | | | | 15.0 | | | | 12.9 | | | | 16.2 | | | | 19.0 | |
Return on average assets (%) | | | 0.65 | | | | 0.66 | | | | 0.72 | | | | 0.74 | | | | 0.75 | | | | 0.65 | | | | 0.71 | | | | 0.41 | | | | 0.50 | | | | 0.59 | |
Adjusted return on average assets (%) (1) | | | 0.71 | | | | 0.70 | | | | 0.74 | | | | 0.75 | | | | 0.73 | | | | 0.68 | | | | 0.71 | | | | 0.52 | | | | 0.61 | | | | 0.78 | |
Return on average risk-weighted assets (%) | | | 1.71 | | | | 1.84 | | | | 1.85 | | | | 1.93 | | | | 1.96 | | | | 1.70 | | | | 1.74 | | | | 0.97 | | | | 1.07 | | | | 1.20 | |
Adjusted return on average risk-weighted assets (%) (1) | | | 1.85 | | | | 1.96 | | | | 1.91 | | | | 1.94 | | | | 1.92 | | | | 1.79 | | | | 1.76 | | | | 1.25 | | | | 1.32 | | | | 1.58 | |
Average equity to average total assets (%) | | | 0.05 | | | | 0.05 | | | | 0.05 | | | | 0.05 | | | | 0.05 | | | | 0.04 | | | | 0.05 | | | | 0.04 | | | | 0.04 | | | | 0.04 | |
| | | | | | | | | | |
Other Statistical Information | | | | | | | | | | | | | | | | | | | | | | | | | | | | | | | | | | | | | | | | |
Employees (2) | | | | | | | | | | | | | | | | | | | | | | | | | | | | | | | | | | | | | | | | |
Canada | | | 29,643 | | | | 30,669 | | | | 30,587 | | | | 30,303 | | | | 30,797 | | | | 31,351 | | | | 29,821 | | | | 29,118 | | | | 29,529 | | | | 28,944 | |
United States | | | 14,147 | | | | 14,316 | | | | 14,845 | | | | 14,694 | | | | 14,963 | | | | 15,184 | | | | 7,445 | | | | 6,732 | | | | 7,256 | | | | 6,595 | |
Other | | | 1,444 | | | | 1,368 | | | | 1,346 | | | | 634 | | | | 512 | | | | 440 | | | | 363 | | | | 323 | | | | 288 | | | | 288 | |
Total | | | 45,234 | | | | 46,353 | | | | 46,778 | | | | 45,631 | | | | 46,272 | | | | 46,975 | | | | 37,629 | | | | 36,173 | | | | 37,073 | | | | 35,827 | |
Bank branches | | | | | | | | | | | | | | | | | | | | | | | | | | | | | | | | | | | | | | | | |
Canada | | | 942 | | | | 939 | | | | 934 | | | | 933 | | | | 930 | | | | 920 | | | | 910 | | | | 900 | | | | 983 | | | | 977 | |
United States | | | 576 | | | | 592 | | | | 615 | | | | 626 | | | | 638 | | | | 688 | | | | 321 | | | | 290 | | | | 292 | | | | 243 | |
Other | | | 4 | | | | 4 | | | | 4 | | | | 4 | | | | 3 | | | | 3 | | | | 3 | | | | 5 | | | | 5 | | | | 4 | |
Total | | | 1,522 | | | | 1,535 | | | | 1,553 | | | | 1,563 | | | | 1,571 | | | | 1,611 | | | | 1,234 | | | | 1,195 | | | | 1,280 | | | | 1,224 | |
Automated banking machines | | | | | | | | | | | | | | | | | | | | | | | | | | | | | | | | | | | | | | | | |
Canada | | | 3,285 | | | | 3,442 | | | | 3,016 | | | | 2,900 | | | | 2,596 | | | | 2,235 | | | | 2,076 | | | | 2,030 | | | | 2,026 | | | | 1,978 | |
United States | | | 1,314 | | | | 1,319 | | | | 1,322 | | | | 1,325 | | | | 1,375 | | | | 1,366 | | | | 905 | | | | 636 | | | | 640 | | | | 583 | |
Total | | | 4,599 | | | | 4,761 | | | | 4,338 | | | | 4,225 | | | | 3,971 | | | | 3,601 | | | | 2,981 | | | | 2,666 | | | | 2,666 | | | | 2,561 | |
2010 and prior based on CGAAP.
2011 has not been restated to reflect the new IFRS standards adopted in 2014. The adoption of new IFRS standards in 2015 only impacted our results prospectively.
| | (1) | The impact of adjusting items (net of tax) was an increase to net income as follows: 2011 – $161 million; 2010 – $32 million; 2009 – $509 million; 2008 – $461 million; 2007 – $675 million. Details on the adjusting items can be found in the 2011 to 2007 Management’s Discussion and Analysis. |
| | (2) | Reflects full-time equivalent number of employees, comprising full-time and part-time employees and adjustments for overtime hours. |
| | |
| 122 | | BMO Financial Group 199th Annual Report 2016 |
Table 2: Summary Income Statement and Growth Statistics
| | | | | | | | | | | | | | | | | | | | | | | | | | | | |
($ millions, except as noted) For the year ended October 31 | | 2016 | | | 2015 | | | 2014 | | | 2013 | | | 2012 | | | 5-year
CAGR | | | 10-year
CAGR | |
Income Statement – Reported Results | | | | | | | | | | | | | | | | | | | | | | | | | | | | |
Net interest income | | | 9,872 | | | | 8,763 | | | | 8,292 | | | | 8,487 | | | | 8,749 | | | | 5.7 | | | | 7.6 | |
Non-interest revenue | | | 11,215 | | | | 10,626 | | | | 9,931 | | | | 8,343 | | | | 8,354 | | | | 8.1 | | | | 7.8 | |
Revenue | | | 21,087 | | | | 19,389 | | | | 18,223 | | | | 16,830 | | | | 17,103 | | | | 7.0 | | | | 7.7 | |
Insurance claims, commissions and changes in policy benefit liabilities (CCPB) (1) | | | 1,543 | | | | 1,254 | | | | 1,505 | | | | 767 | | | | 1,174 | | | | 6.7 | | | | 37.6 | |
Revenue, net of CCPB | | | 19,544 | | | | 18,135 | | | | 16,718 | | | | 16,063 | | | | 15,929 | | | | 7.0 | | | | 6.9 | |
Provision for credit losses | | | 815 | | | | 612 | | | | 561 | | | | 587 | | | | 764 | | | | nm | | | | nm | |
Non-interest expense | | | 12,997 | | | | 12,182 | | | | 10,921 | | | | 10,226 | | | | 10,135 | | | | 8.3 | | | | 7.4 | |
Income before provision for income taxes | | | 5,732 | | | | 5,341 | | | | 5,236 | | | | 5,250 | | | | 5,030 | | | | 7.5 | | | | 5.2 | |
Provision for income taxes | | | 1,101 | | | | 936 | | | | 903 | | | | 1,055 | | | | 874 | | | | nm | | | | 4.4 | |
Net income | | | 4,631 | | | | 4,405 | | | | 4,333 | | | | 4,195 | | | | 4,156 | | | | 8.3 | | | | 5.4 | |
Attributable to bank shareholders | | | 4,622 | | | | 4,370 | | | | 4,277 | | | | 4,130 | | | | 4,082 | | | | 8.7 | | | | 5.7 | |
Attributable to non-controlling interest in subsidiaries | | | 9 | | | | 35 | | | | 56 | | | | 65 | | | | 74 | | | | nm | | | | nm | |
Net income | | | 4,631 | | | | 4,405 | | | | 4,333 | | | | 4,195 | | | | 4,156 | | | | 8.3 | | | | 5.7 | |
| | | | | | | |
Income Statement – Adjusted Results | | | | | | | | | | | | | | | | | | | | | | | | | | | | |
Net interest income | | | 9,872 | | | | 8,764 | | | | 8,292 | | | | 7,830 | | | | 7,970 | | | | 6.4 | | | | 7.6 | |
Non-interest revenue | | | 11,299 | | | | 10,627 | | | | 9,931 | | | | 8,309 | | | | 8,070 | | | | 8.2 | | | | 7.8 | |
Revenue | | | 21,171 | | | | 19,391 | | | | 18,223 | | | | 16,139 | | | | 16,040 | | | | 7.3 | | | | 7.7 | |
Insurance claims, commissions and changes in policy benefit liabilities (CCPB) (1) | | | 1,543 | | | | 1,254 | | | | 1,505 | | | | 767 | | | | 1,174 | | | | 6.7 | | | | 37.6 | |
Revenue, net of CCPB | | | 19,628 | | | | 18,137 | | | | 16,718 | | | | 15,372 | | | | 14,866 | | | | 7.4 | | | | 7.0 | |
Provision for credit losses | | | 815 | | | | 612 | | | | 561 | | | | 357 | | | | 470 | | | | nm | | | | nm | |
Non-interest expense | | | 12,544 | | | | 11,819 | | | | 10,761 | | | | 9,755 | | | | 9,410 | | | | 8.2 | | | | 7.1 | |
Income before provision for income taxes | | | 6,269 | | | | 5,706 | | | | 5,396 | | | | 5,260 | | | | 4,986 | | | | 8.4 | | | | 6.0 | |
Provision for income taxes | | | 1,249 | | | | 1,025 | | | | 943 | | | | 1,037 | | | | 927 | | | | 12.5 | | | | 5.3 | |
Adjusted net income | | | 5,020 | | | | 4,681 | | | | 4,453 | | | | 4,223 | | | | 4,059 | | | | 8.9 | | | | 6.2 | |
Attributable to bank shareholders | | | 5,011 | | | | 4,646 | | | | 4,397 | | | | 4,158 | | | | 3,985 | | | | 8.9 | | | | 6.2 | |
Attributable to non-controlling interest in subsidiaries | | | 9 | | | | 35 | | | | 56 | | | | 65 | | | | 74 | | | | nm | | | | nm | |
Adjusted net income | | | 5,020 | | | | 4,681 | | | | 4,453 | | | | 4,223 | | | | 4,059 | | | | 8.9 | | | | 6.2 | |
| | | | | | | |
Earnings per Share (EPS)($) | | | | | | | | | | | | | | | | | | | | | | | | | | | | |
Basic | | | 6.94 | | | | 6.59 | | | | 6.44 | | | | 6.19 | | | | 6.13 | | | | 7.2 | | | | 2.8 | |
Diluted | | | 6.92 | | | | 6.57 | | | | 6.41 | | | | 6.17 | | | | 6.10 | | | | 7.4 | | | | 3.0 | |
Adjusted diluted | | | 7.52 | | | | 7.00 | | | | 6.59 | | | | 6.21 | | | | 5.95 | | | | 8.1 | | | | 3.8 | |
| | | | | | | |
Year-over-Year Growth-Based Statistical Information(%) | | | | | | | | | | | | | | | | | | | | | | | | | | | | |
Net income growth | | | 5.1 | | | | 1.7 | | | | 3.3 | | | | 0.9 | | | | 33.5 | | | | na | | | | na | |
Adjusted net income growth | | | 7.2 | | | | 5.1 | | | | 5.4 | | | | 4.1 | | | | 23.9 | | | | na | | | | na | |
Diluted EPS growth | | | 5.3 | | | | 2.5 | | | | 3.9 | | | | 1.1 | | | | 26.0 | | | | na | | | | na | |
Adjusted diluted EPS growth | | | 7.4 | | | | 6.2 | | | | 6.1 | | | | 4.4 | | | | 16.7 | | | | na | | | | na | |
Five-year and ten-year CAGR based on CGAAP in 2006 and IFRS in 2011 and 2016.
The adoption of new IFRS standards in 2015 only impacted our results prospectively.
| | (1) | Beginning in 2015, insurance claims, commissions and changes in policy benefit liabilities (CCPB) are reported separately. They were previously reported as a reduction in insurance revenue in non-interest revenue. Prior period amounts and ratios have been reclassified. |
nm – not meaningful
na – not applicable
| | | | |
| BMO Financial Group 199th Annual Report 2016 | | | 123 | |
SUPPLEMENTAL INFORMATION
Table 3: Revenue and Revenue Growth
| | | | | | | | | | | | | | | | | | | | | | | | | | | | |
($ millions, except as noted) For the year ended October 31 | | 2016 | | | 2015 | | | 2014 | | | 2013 | | | 2012 | | | 5-year
CAGR | | | 10-year
CAGR | |
Net Interest Income | | | 9,872 | | | | 8,763 | | | | 8,292 | | | | 8,487 | | | | 8,749 | | | | 5.7 | | | | 7.6 | |
Year-over-year growth (%) | | | 12.7 | | | | 5.7 | | | | (2.3 | ) | | | (3.0 | ) | | | 17.1 | | | | na | | | | na | |
| | | | | | | |
Adjusted Net Interest Income | | | 9,872 | | | | 8,764 | | | | 8,292 | | | | 7,830 | | | | 7,970 | | | | 6.4 | | | | 7.6 | |
Year-over-year growth (%) | | | 12.6 | | | | 5.7 | | | | 5.9 | | | | (1.8 | ) | | | 10.0 | | | | na | | | | na | |
| | | | | | | |
Net Interest Margin(1) | | | | | | | | | | | | | | | | | | | | | | | | | | | | |
Average earning assets | | | 622,732 | | | | 579,471 | | | | 528,786 | | | | 485,191 | | | | 461,018 | | | | 9.0 | | | | 9.1 | |
Net interest margin (%) | | | 1.59 | | | | 1.51 | | | | 1.57 | | | | 1.75 | | | | 1.90 | | | | na | | | | na | |
Adjusted net interest margin (%) | | | 1.59 | | | | 1.51 | | | | 1.57 | | | | 1.61 | | | | 1.73 | | | | na | | | | na | |
Canadian dollar net interest margin (%) | | | 1.60 | | | | 1.62 | | | | 1.68 | | | | 1.76 | | | | 1.82 | | | | na | | | | na | |
U.S. dollar and other currencies net interest margin (%) | | | 1.56 | | | | 1.38 | | | | 1.41 | | | | 1.74 | | | | 2.01 | | | | na | | | | na | |
| | | | | | | |
Non-Interest Revenue | | | | | | | | | | | | | | | | | | | | | | | | | | | | |
Securities commissions and fees | | | 924 | | | | 901 | | | | 894 | | | | 821 | | | | 825 | | | | (5.3 | ) | | | (1.3 | ) |
Deposit and payment service charges | | | 1,141 | | | | 1,077 | | | | 1,002 | | | | 916 | | | | 929 | | | | 6.5 | | | | 4.6 | |
Trading revenues | | | 1,192 | | | | 987 | | | | 949 | | | | 849 | | | | 1,025 | | | | 16.8 | | | | 5.2 | |
Lending fees | | | 859 | | | | 737 | | | | 680 | | | | 603 | | | | 544 | | | | 7.7 | | | | 9.8 | |
Card fees | | | 461 | | | | 460 | | | | 462 | | | | 461 | | | | 441 | | | | (7.7 | ) | | | 1.5 | |
Investment management and custodial fees | | | 1,556 | | | | 1,552 | | | | 1,286 | | | | 1,003 | | | | 967 | | | | 25.7 | | | | 18.0 | |
Mutual fund revenues | | | 1,364 | | | | 1,377 | | | | 1,065 | | | | 828 | | | | 665 | | | | 16.6 | | | | 10.6 | |
Underwriting and advisory fees | | | 820 | | | | 706 | | | | 744 | | | | 652 | | | | 600 | | | | 9.9 | | | | 7.2 | |
Securities gains, other than trading | | | 84 | | | | 171 | | | | 162 | | | | 285 | | | | 152 | | | | nm | | | | nm | |
Foreign exchange, other than trading | | | 162 | | | | 172 | | | | 179 | | | | 172 | | | | 153 | | | | 4.5 | | | | 4.7 | |
Insurance revenue (2) | | | 2,023 | | | | 1,762 | | | | 2,008 | | | | 1,212 | | | | 1,509 | | | | 7.6 | | | | 21.7 | |
Investments in associates and joint ventures | | | 140 | | | | 207 | | | | 169 | | | | 190 | | | | 188 | | | | nm | | | | nm | |
Other revenues | | | 489 | | | | 517 | | | | 331 | | | | 351 | | | | 356 | | | | 7.0 | | | | 7.0 | |
| | | | | | | |
Total Non-Interest Revenue | | | 11,215 | | | | 10,626 | | | | 9,931 | | | | 8,343 | | | | 8,354 | | | | 8.1 | | | | 7.8 | |
Year-over-year growth (%) | | | 5.5 | | | | 7.0 | | | | 19.0 | | | | (0.1 | ) | | | 10.1 | | | | na | | | | na | |
Non-interest revenue as a % of total revenue | | | 53.2 | | | | 54.8 | | | | 54.5 | | | | 49.6 | | | | 48.8 | | | | na | | | | na | |
| | | | | | | |
Adjusted Non-Interest Revenue | | | 11,299 | | | | 10,627 | | | | 9,931 | | | | 8,309 | | | | 8,070 | | | | 8.2 | | | | 7.8 | |
Year-over-year adjusted non-interest revenue growth (%) | | | 6.3 | | | | 7.0 | | | | 19.5 | | | | 3.0 | | | | 6.0 | | | | na | | | | na | |
Adjusted non-interest revenue as a % of total adjusted revenue | | | 53.4 | | | | 54.8 | | | | 54.5 | | | | 51.5 | | | | 50.3 | | | | na | | | | na | |
| | | | | | | |
Total Revenue | | | 21,087 | | | | 19,389 | | | | 18,223 | | | | 16,830 | | | | 17,103 | | | | 7.0 | | | | 7.7 | |
Year-over-year total revenue growth (%) | | | 8.8 | | | | 6.4 | | | | 8.3 | | | | (1.6 | ) | | | 13.6 | | | | na | | | | na | |
| | | | | | | |
Total Revenue, net of CCPB(2) | | | 19,544 | | | | 18,135 | | | | 16,718 | | | | 16,063 | | | | 15,929 | | | | 7.0 | | | | 6.9 | |
Year-over-year total revenue growth, net of CCPB (%) | | | 7.8 | | | | 8.5 | | | | 4.1 | | | | 0.8 | | | | 14.2 | | | | na | | | | na | |
| | | | | | | |
Total Adjusted Revenue | | | 21,171 | | | | 19,391 | | | | 18,223 | | | | 16,139 | | | | 16,040 | | | | 7.3 | | | | 7.7 | |
Year-over-year total adjusted revenue growth (%) | | | 9.2 | | | | 6.4 | | | | 12.9 | | | | 0.6 | | | | 7.9 | | | | na | | | | na | |
| | | | | | | |
Total Adjusted Revenue, net of CCPB(2) | | | 19,628 | | | | 18,137 | | | | 16,718 | | | | 15,372 | | | | 14,866 | | | | 7.4 | | | | 7.0 | |
Year-over-year total adjusted revenue growth, net of CCPB (%) | | | 8.2 | | | | 8.5 | | | | 8.7 | | | | 3.4 | | | | 8.2 | | | | na | | | | na | |
Five-year and ten-year CAGR based on CGAAP in 2006 and IFRS in 2011 and 2016.
The adoption of new IFRS standards in 2015 only impacted our results prospectively.
| | (1) | Net interest margin is calculated based on average earning assets. |
| | (2) | Beginning in 2015, insurance claims, commissions and changes in policy benefit liabilities (CCPB) are reported separately. They were previously reported as a reduction in insurance revenue in non-interest revenue. Prior period amounts and ratios have been reclassified. |
na – not applicable
nm – not meaningful
| | |
| 124 | | BMO Financial Group 199th Annual Report 2016 |
Table 4: Non-Interest Expense and Expense-to-Revenue Ratio
| | | | | | | | | | | | | | | | | | | | | | | | | | | | |
($ millions, except as noted) For the year ended October 31 | | 2016 | | | 2015 | | | 2014 | | | 2013 | | | 2012 | | | 5-year
CAGR | | | 10-year
CAGR | |
Non-Interest Expense | | | | | | | | | | | | | | | | | | | | | | | | | | | | |
Employee compensation | | | | | | | | | | | | | | | | | | | | | | | | | | | | |
Salaries | | | 4,082 | | | | 3,910 | | | | 3,388 | | | | 3,259 | | | | 3,148 | | | | 9.1 | | | | 7.9 | |
Performance-based compensation | | | 2,278 | | | | 2,102 | | | | 1,946 | | | | 1,686 | | | | 1,657 | | | | 7.9 | | | | 5.6 | |
Employee benefits | | | 1,022 | | | | 1,069 | | | | 908 | | | | 897 | | | | 808 | | | | 10.5 | | | | 5.5 | |
Total employee compensation | | | 7,382 | | | | 7,081 | | | | 6,242 | | | | 5,842 | | | | 5,613 | | | | 8.9 | | | | 6.8 | |
Premises and equipment | | | | | | | | | | | | | | | | | | | | | | | | | | | | |
Rental of real estate | | | 486 | | | | 462 | | | | 415 | | | | 416 | | | | 400 | | | | 6.1 | | | | 7.1 | |
Premises, furniture and fixtures | | | 337 | | | | 287 | | | | 261 | | | | 377 | | | | 368 | | | | 1.6 | | | | 3.9 | |
Property taxes | | | 42 | | | | 39 | | | | 39 | | | | 37 | | | | 36 | | | | 6.9 | | | | 5.0 | |
Computers and equipment (1) | | | 1,528 | | | | 1,349 | | | | 1,193 | | | | 1,003 | | | | 1,071 | | | | 11.7 | | | | 8.0 | |
Total premises and equipment (1) | | | 2,393 | | | | 2,137 | | | | 1,908 | | | | 1,833 | | | | 1,875 | | | | 8.7 | | | | nm | |
Other expenses | | | | | | | | | | | | | | | | | | | | | | | | | | | | |
Amortization of intangible assets (1) | | | 444 | | | | 411 | | | | 382 | | | | 346 | | | | 331 | | | | 14.0 | | | | nm | |
Communications | | | 294 | | | | 314 | | | | 289 | | | | 291 | | | | 301 | | | | 2.5 | | | | 8.4 | |
Business and capital taxes | | | 42 | | | | 45 | | | | 39 | | | | 39 | | | | 46 | | | | (3.7 | ) | | | (7.6 | ) |
Professional fees | | | 523 | | | | 595 | | | | 622 | | | | 527 | | | | 593 | | | | (3.5 | ) | | | 6.2 | |
Travel and business development | | | 646 | | | | 605 | | | | 542 | | | | 514 | | | | 491 | | | | 11.1 | | | | 9.8 | |
Other | | | 1,273 | | | | 994 | | | | 897 | | | | 834 | | | | 885 | | | | 10.0 | | | | 9.6 | |
Total other expenses | | | 3,222 | | | | 2,964 | | | | 2,771 | | | | 2,551 | | | | 2,647 | | | | 6.6 | | | | 9.4 | |
Total Non-Interest Expense | | | 12,997 | | | | 12,182 | | | | 10,921 | | | | 10,226 | | | | 10,135 | | | | 8.3 | | | | 7.4 | |
Year-over-year total non-interest expense growth (%) | | | 6.7 | | | | 11.5 | | | | 6.8 | | | | 0.9 | | | | 15.9 | | | | na | | | | na | |
Total Adjusted Non-Interest Expense | | | 12,544 | | | | 11,819 | | | | 10,761 | | | | 9,755 | | | | 9,410 | | | | 8.2 | | | | 7.1 | |
Year-over-year total adjusted non-interest expense growth (%) | | | 6.1 | | | | 9.8 | | | | 10.3 | | | | 3.7 | | | | 3.7 | | | | na | | | | na | |
Non-interest expense-to-revenue ratio (Efficiency ratio) (%) | | | 61.6 | | | | 62.8 | | | | 59.9 | | | | 60.8 | | | | 59.3 | | | | na | | | | na | |
Adjusted non-interest expense-to-revenue ratio (Adjusted Efficiency ratio) (%) | | | 59.2 | | | | 60.9 | | | | 59.1 | | | | 60.4 | | | | 58.7 | | | | na | | | | na | |
Efficiency ratio, net of CCPB (2) | | | 66.5 | | | | 67.2 | | | | 65.3 | | | | 63.7 | | | | 63.6 | | | | na | | | | na | |
Adjusted efficiency ratio, net of CCPB (2) | | | 63.9 | | | | 65.2 | | | | 64.4 | | | | 63.5 | | | | 63.3 | | | | na | | | | na | |
| | | | | | | |
Government Levies and Taxes(3) | | | | | | | | | | | | | | | | | | | | | | | | | | | | |
Government levies other than income taxes | | | | | | | | | | | | | | | | | | | | | | | | | | | | |
Payroll levies | | | 324 | | | | 312 | | | | 252 | | | | 249 | | | | 250 | | | | 9.8 | | | | 7.2 | |
Property taxes | | | 42 | | | | 39 | | | | 39 | | | | 37 | | | | 36 | | | | 6.9 | | | | 5.0 | |
Provincial capital taxes | | | 30 | | | | 33 | | | | 27 | | | | 30 | | | | 37 | | | | (7.2 | ) | | | (9.9 | ) |
Business taxes | | | 9 | | | | 10 | | | | 9 | | | | 7 | | | | 9 | | | | 5.1 | | | | 1.5 | |
Harmonized sales tax, GST and other sales taxes | | | 355 | | | | 319 | | | | 273 | | | | 262 | | | | 249 | | | | 8.6 | | | | 11.2 | |
Sundry taxes | | | 3 | | | | 2 | | | | 2 | | | | 1 | | | | 2 | | | | nm | | | | nm | |
Total government levies other than income taxes | | | 763 | | | | 715 | | | | 602 | | | | 586 | | | | 583 | | | | 8.0 | | | | 6.5 | |
Provision for income taxes | | | 1,101 | | | | 936 | | | | 903 | | | | 1,055 | | | | 874 | | | | nm | | | | 4.4 | |
Total Government Levies and Taxes | | | 1,864 | | | | 1,651 | | | | 1,505 | | | | 1,641 | | | | 1,457 | | | | 5.9 | | | | 5.2 | |
Total government levies and taxes as a % of income available to pay government levies and taxes | | | 24.4 | | | | 23.1 | | | | 25.0 | | | | 28.7 | | | | 26.6 | | | | na | | | | na | |
Effective income tax rate (%) | | | 19.2 | | | | 17.5 | | | | 17.2 | | | | 20.1 | | | | 17.4 | | | | na | | | | na | |
Adjusted effective income tax rate (%) | | | 19.9 | | | | 18.0 | | | | 17.5 | | | | 19.7 | | | | 18.6 | | | | na | | | | na | |
Five-year and ten-year CAGR based on CGAAP in 2006 and IFRS in 2011 and 2016.
The adoption of new IFRS standards in 2015 only impacted our results prospectively.
| | (1) | In 2009, we adopted new accounting requirements for intangible assets and reclassified certain computer equipment from premises and equipment to intangible assets. Computer and equipment expense and the amortization of intangible assets were restated, but not for years prior to 2007. As such, ten-year growth rates for these expense categories are not meaningful. Together, computer and equipment expense and the amortization of intangible assets increased at a compound annual growth rate of 10.1% over ten years. Together, total premises and equipment expense and the amortization of intangible assets increased at a compound annual growth rate of 8.5% over ten years. |
| | (2) | This ratio is calculated excluding insurance claims, commissions and changes in policy benefit liabilities (CCPB). |
| | (3) | Government levies are included in various non-interest expense categories. |
na – not applicable
nm – not meaningful
| | | | |
| BMO Financial Group 199th Annual Report 2016 | | | 125 | |
SUPPLEMENTAL INFORMATION
Table 5: Average Assets, Liabilities and Interest Rates
| | | | | | | | | | | | | | | | | | | | | | | | | | | | | | | | | | | | |
| | | | | | | | | 2016 | | | | | | | | | 2015 | | | | | | | | | 2014 | |
($ millions, except as noted) For the year ended October 31 | | Average
balances | | | Average
interest
rate (%) | | | Interest
income/
expense | | | Average
balances | | | Average
interest
rate (%) | | | Interest
income/
expense | | | Average
balances | | | Average
interest
rate (%) | | | Interest
income/
expense | |
Assets | | | | | | | | | | | | | | | | | | | | | | | | | | | | | | | | | | | | |
Canadian Dollar | | | | | | | | | | | | | | | | | | | | | | | | | | | | | | | | | | | | |
Deposits with other banks | | | 2,016 | | | | 1.12 | | | | 23 | | | | 1,984 | | | | 1.04 | | | | 21 | | | | 1,632 | | | | 1.52 | | | | 25 | |
Securities | | | 84,099 | | | | 1.12 | | | | 944 | | | | 90,322 | | | | 1.16 | | | | 1,050 | | | | 94,234 | | | | 1.14 | | | | 1,073 | |
Securities borrowed or purchased under resale agreements | | | 34,906 | | | | 0.70 | | | | 245 | | | | 29,617 | | | | 0.82 | | | | 242 | | | | 23,027 | | | | 1.03 | | | | 238 | |
Loans | | | | | | | | | | | | | | | | | | | | | | | | | | | | | | | | | | | | |
Residential mortgages | | | 99,280 | | | | 2.63 | | | | 2,615 | | | | 94,119 | | | | 2.83 | | | | 2,663 | | | | 90,134 | | | | 3.08 | | | | 2,779 | |
Non-residential mortgages | | | 6,281 | | | | 3.37 | | | | 212 | | | | 6,176 | | | | 3.71 | | | | 229 | | | | 6,276 | | | | 4.08 | | | | 256 | |
Personal and credit cards | | | 56,211 | | | | 4.73 | | | | 2,661 | | | | 55,219 | | | | 4.89 | | | | 2,699 | | | | 55,719 | | | | 5.13 | | | | 2,860 | |
Businesses and governments | | | 49,136 | | | | 3.59 | | | | 1,766 | | | | 43,427 | | | | 3.94 | | | | 1,710 | | | | 40,250 | | | | 4.29 | | | | 1,726 | |
Total loans | | | 210,908 | | | | 3.44 | | | | 7,254 | | | | 198,941 | | | | 3.67 | | | | 7,301 | | | | 192,379 | | | | 3.96 | | | | 7,261 | |
Total Canadian dollar | | | 331,929 | | | | 2.55 | | | | 8,466 | | | | 320,864 | | | | 2.68 | | | | 8,614 | | | | 311,272 | | | | 2.88 | | | | 8,957 | |
U.S. Dollar and Other Currencies | | | | | | | | | | | | | | | | | | | | | | | | | | | | | | | | | | | | |
Deposits with other banks | | | 41,821 | | | | 0.48 | | | | 200 | | | | 48,031 | | | | 0.35 | | | | 169 | | | | 38,815 | | | | 0.41 | | | | 157 | |
Securities | | | 57,820 | | | | 1.31 | | | | 760 | | | | 54,733 | | | | 1.20 | | | | 655 | | | | 53,921 | | | | 1.15 | | | | 620 | |
Securities borrowed or purchased under resale agreements | | | 54,210 | | | | 0.59 | | | | 319 | | | | 44,010 | | | | 0.38 | | | | 168 | | | | 32,629 | | | | 0.32 | | | | 109 | |
Loans | | | | | | | | | | | | | | | | | | | | | | | | | | | | | | | | | | | | |
Residential mortgages | | | 8,630 | | | | 3.52 | | | | 304 | | | | 8,631 | | | | 3.39 | | | | 293 | | | | 7,753 | | | | 3.37 | | | | 261 | |
Non-residential mortgages | | | 4,672 | | | | 2.28 | | | | 106 | | | | 4,619 | | | | 2.51 | | | | 116 | | | | 4,860 | | | | 2.48 | | | | 121 | |
Personal and credit cards | | | 15,771 | | | | 3.32 | | | | 524 | | | | 17,071 | | | | 3.19 | | | | 545 | | | | 15,812 | | | | 3.32 | | | | 524 | |
Businesses and governments | | | 105,953 | | | | 3.61 | | | | 3,823 | | | | 79,678 | | | | 3.26 | | | | 2,598 | | | | 61,402 | | | | 3.46 | | | | 2,123 | |
Total loans | | | 135,026 | | | | 3.52 | | | | 4,757 | | | | 109,999 | | | | 3.23 | | | | 3,552 | | | | 89,827 | | | | 3.37 | | | | 3,029 | |
Total U.S. dollar and other currencies | | | 288,877 | | | | 2.09 | | | | 6,036 | | | | 256,773 | | | | 1.77 | | | | 4,544 | | | | 215,192 | | | | 1.82 | | | | 3,915 | |
Other non-interest bearing assets | | | 86,316 | | | | | | | | | | | | 86,754 | | | | | | | | | | | | 67,464 | | | | | | | | | |
Total All Currencies | | | | | | | | | | | | | | | | | | | | | | | | | | | | | | | | | | | | |
Total assets and interest income | | | 707,122 | | | | 2.05 | | | | 14,502 | | | | 664,391 | | | | 1.98 | | | | 13,158 | | | | 593,928 | | | | 2.17 | | | | 12,872 | |
Liabilities | | | | | | | | | | | | | | | | | | | | | | | | | | | | | | | | | | | | |
Canadian Dollar | | | | | | | | | | | | | | | | | | | | | | | | | | | | | | | | | | | | |
Deposits | | | | | | | | | | | | | | | | | | | | | | | | | | | | | | | | | | | | |
Banks | | | 9,492 | | | | 0.25 | | | | 24 | | | | 10,158 | | | | 0.52 | | | | 53 | | | | 6,307 | | | | 0.51 | | | | 32 | |
Businesses and governments | | | 98,004 | | | | 1.12 | | | | 1,097 | | | | 94,438 | | | | 1.17 | | | | 1,102 | | | | 97,199 | | | | 1.38 | | | | 1,342 | |
Individuals | | | 101,402 | | | | 0.75 | | | | 757 | | | | 94,031 | | | | 0.88 | | | | 832 | | | | 89,007 | | | | 0.97 | | | | 863 | |
Total deposits | | | 208,898 | | | | 0.90 | | | | 1,878 | | | | 198,627 | | | | 1.00 | | | | 1,987 | | | | 192,513 | | | | 1.16 | | | | 2,237 | |
Securities sold but not yet purchased and securities lent or sold (1) | | | 37,017 | | | | 1.45 | | | | 537 | | | | 40,637 | | | | 1.63 | | | | 661 | | | | 40,713 | | | | 1.74 | | | | 710 | |
Subordinated debt and other interest bearing liabilities | | | 25,598 | | | | 2.38 | | | | 609 | | | | 25,713 | | | | 2.96 | | | | 760 | | | | 24,712 | | | | 3.11 | | | | 769 | |
Total Canadian dollar | | | 271,513 | | | | 1.11 | | | | 3,024 | | | | 264,977 | | | | 1.29 | | | | 3,408 | | | | 257,938 | | | | 1.44 | | | | 3,716 | |
U.S. Dollar and Other Currencies | | | | | | | | | | | | | | | | | | | | | | | | | | | | | | | | | | | | |
Deposits | | | | | | | | | | | | | | | | | | | | | | | | | | | | | | | | | | | | |
Banks | | | 26,896 | | | | 0.55 | | | | 148 | | | | 21,626 | | | | 0.27 | | | | 59 | | | | 20,665 | | | | 0.23 | | | | 47 | |
Businesses and governments | | | 178,848 | | | | 0.47 | | | | 845 | | | | 167,544 | | | | 0.32 | | | | 540 | | | | 143,738 | | | | 0.34 | | | | 491 | |
Individuals | | | 54,081 | | | | 0.24 | | | | 131 | | | | 47,671 | | | | 0.20 | | | | 95 | | | | 41,675 | | | | 0.22 | | | | 90 | |
Total deposits | | | 259,825 | | | | 0.43 | | | | 1,124 | | | | 236,841 | | | | 0.29 | | | | 694 | | | | 206,078 | | | | 0.30 | | | | 628 | |
Securities sold but not yet purchased and securities lent or sold (1) | | | 50,791 | | | | 0.31 | | | | 159 | | | | 41,792 | | | | 0.20 | | | | 85 | | | | 33,650 | | | | 0.21 | | | | 72 | |
Subordinated debt and other interest bearing liabilities | | | 7,192 | | | | 4.50 | | | | 322 | | | | 5,749 | | | | 3.61 | | | | 208 | | | | 4,901 | | | | 3.34 | | | | 164 | |
Total U.S. dollar and other currencies | | | 317,808 | | | | 0.51 | | | | 1,606 | | | | 284,382 | | | | 0.35 | | | | 987 | | | | 244,629 | | | | 0.35 | | | | 864 | |
Other non-interest bearing liabilities | | | 77,546 | | | | | | | | | | | | 78,130 | | | | | | | | | | | | 59,139 | | | | | | | | | |
Total All Currencies | | | | | | | | | | | | | | | | | | | | | | | | | | | | | | | | | | | | |
Total liabilities and interest expense | | | 666,867 | | | | 0.69 | | | | 4,630 | | | | 627,489 | | | | 0.70 | | | | 4,395 | | | | 561,706 | | | | 0.82 | | | | 4,580 | |
Shareholders’ equity | | | 40,255 | | | | | | | | | | | | 36,902 | | | | | | | | | | | | 32,222 | | | | | | | | | |
Total Liabilities, Interest Expense and Shareholders’ Equity | | | 707,122 | | | | 0.65 | | | | 4,630 | | | | 664,391 | | | | 0.66 | | | | 4,395 | | | | 593,928 | | | | 0.77 | | | | 4,580 | |
Net interest margin | | | | | | | | | | | | | | | | | | | | | | | | | | | | | | | | | | | | |
– based on earning assets | | | | | | | 1.59 | | | | | | | | | | | | 1.51 | | | | | | | | | | | | 1.57 | | | | | |
– based on total assets | | | | | | | 1.40 | | | | | | | | | | | | 1.32 | | | | | | | | | | | | 1.40 | | | | | |
Net interest income based on total assets | | | | | | | | | | | 9,872 | | | | | | | | | | | | 8,763 | | | | | | | | | | | | 8,292 | |
Adjusted net interest margin | | | | | | | | | | | | | | | | | | | | | | | | | | | | | | | | | | | | |
– based on earning assets | | | | | | | 1.59 | | | | | | | | | | | | 1.51 | | | | | | | | | | | | 1.57 | | | | | |
– based on total assets | | | | | | | 1.40 | | | | | | | | | | | | 1.32 | | | | | | | | | | | | 1.40 | | | | | |
Adjusted net interest income based on total assets | | | | | | | | | | | 9,872 | | | | | | | | | | | | 8,764 | | | | | | | | | | | | 8,292 | |
| | (1) | For the years ended October 31, 2016, 2015 and 2014, the maximum amount of securities lent or sold under repurchase agreements at any month end amounted to $67,169 million, $57,385 million and $50,138 million, respectively. |
| | |
| 126 | | BMO Financial Group 199th Annual Report 2016 |
Table 6: Volume/Rate Analysis of Changes in Net Interest Income
| | | | | | | | | | | | | | | | | | | | | | | | | | | | | | | | |
| | | | | | | | | | | | 2016/2015 | | | | | | | | | 2015/2014 | |
| | | | | | Increase (decrease) due to change in | | | | | | Increase (decrease) due to change in | |
($ millions) For the year ended October 31 | | | | | Average
balance | | | Average
rate | | | Total | | | | | | Average
balance | | | Average
rate | | | Total | |
Assets | | | | | | | | | | | | | | | | | | | | | | | | | | | | | | | | |
Canadian Dollar | | | | | | | | | | | | | | | | | | | | | | | | | | | | | | | | |
Deposits with other banks | | | | | | | – | | | | 2 | | | | 2 | | | | | | | | 5 | | | | (9 | ) | | | (4 | ) |
Securities | | | | | | | (72 | ) | | | (34 | ) | | | (106 | ) | | | | | | | (45 | ) | | | 21 | | | | (24 | ) |
Securities borrowed or purchased under resale agreements | | | | | | | 43 | | | | (40 | ) | | | 3 | | | | | | | | 68 | | | | (64 | ) | | | 4 | |
Loans | | | | | | | | | | | | | | | | | | | | | | | | | | | | | | | | |
Residential mortgages | | | | | | | 146 | | | | (194 | ) | | | (48 | ) | | | | | | | 123 | | | | (238 | ) | | | (115 | ) |
Non-residential mortgages | | | | | | | 4 | | | | (21 | ) | | | (17 | ) | | | | | | | (4 | ) | | | (23 | ) | | | (27 | ) |
Personal and credit cards | | | | | | | 48 | | | | (86 | ) | | | (38 | ) | | | | | | | (26 | ) | | | (135 | ) | | | (161 | ) |
Businesses and governments | | | | | | | 225 | | | | (169 | ) | | | 56 | | | | | | | | 136 | | | | (153 | ) | | | (17 | ) |
Total loans | | | | | | | 423 | | | | (470 | ) | | | (47 | ) | | | | | | | 229 | | | | (549 | ) | | | (320 | ) |
Change in Canadian dollar interest income | | | | | | | 394 | | | | (542 | ) | | | (148 | ) | | | | | | | 257 | | | | (601 | ) | | | (344 | ) |
U.S. Dollar and Other Currencies | | | | | | | | | | | | | | | | | | | | | | | | | | | | | | | | |
Deposits with other banks | | | | | | | (22 | ) | | | 53 | | | | 31 | | | | | | | | 37 | | | | (25 | ) | | | 12 | |
Securities | | | | | | | 37 | | | | 68 | | | | 105 | | | | | | | | 10 | | | | 24 | | | | 34 | |
Securities borrowed or purchased under resale agreements | | | | | | | 39 | | | | 112 | | | | 151 | | | | | | | | 37 | | | | 23 | | | | 60 | |
Loans | | | | | | | | | | | | | | | | | | | | | | | | | | | | | | | | |
Residential mortgages | | | | | | | – | | | | 11 | | | | 11 | | | | | | | | 30 | | | | 2 | | | | 32 | |
Non-residential mortgages | | | | | | | 1 | | | | (11 | ) | | | (10 | ) | | | | | | | (6 | ) | | | 1 | | | | (5 | ) |
Personal and credit cards | | | | | | | (41 | ) | | | 20 | | | | (21 | ) | | | | | | | 42 | | | | (21 | ) | | | 21 | |
Businesses and governments | | | | | | | 857 | | | | 368 | | | | 1,225 | | | | | | | | 632 | | | | (156 | ) | | | 476 | |
Total loans | | | | | | | 817 | | | | 388 | | | | 1,205 | | | | | | | | 698 | | | | (174 | ) | | | 524 | |
Change in U.S. dollar and other currencies interest income | | | | | | | 871 | | | | 621 | | | | 1,492 | | | | | | | | 782 | | | | (152 | ) | | | 630 | |
Total All Currencies | | | | | | | | | | | | | | | | | | | | | | | | | | | | | | | | |
Change in total interest income (a) | | | | | | | 1,265 | | | | 79 | | | | 1,344 | | | | | | | | 1,039 | | | | (753 | ) | | | 286 | |
| | | | | | | | |
Liabilities | | | | | | | | | | | | | | | | | | | | | | | | | | | | | | | | |
Canadian Dollar | | | | | | | | | | | | | | | | | | | | | | | | | | | | | | | | |
Deposits | | | | | | | | | | | | | | | | | | | | | | | | | | | | | | | | |
Banks | | | | | | | (4 | ) | | | (25 | ) | | | (29 | ) | | | | | | | 19 | | | | 1 | | | | 20 | |
Businesses and governments | | | | | | | 42 | | | | (47 | ) | | | (5 | ) | | | | | | | (38 | ) | | | (202 | ) | | | (240 | ) |
Individuals | | | | | | | 65 | | | | (140 | ) | | | (75 | ) | | | | | | | 49 | | | | (80 | ) | | | (31 | ) |
Total deposits | | | | | | | 103 | | | | (212 | ) | | | (109 | ) | | | | | | | 30 | | | | (281 | ) | | | (251 | ) |
Securities sold but not yet purchased and securities lent or sold | | | | | | | (59 | ) | | | (65 | ) | | | (124 | ) | | | | | | | (1 | ) | | | (47 | ) | | | (48 | ) |
Subordinated debt and other interest bearing liabilities | | | | | | | (3 | ) | | | (148 | ) | | | (151 | ) | | | | | | | 31 | | | | (40 | ) | | | (9 | ) |
Change in Canadian dollar interest expense | | | | | | | 41 | | | | (425 | ) | | | (384 | ) | | | | | | | 60 | | | | (368 | ) | | | (308 | ) |
U.S. Dollar and Other Currencies | | | | | | | | | | | | | | | | | | | | | | | | | | | | | | | | |
Deposits | | | | | | | | | | | | | | | | | | | | | | | | | | | | | | | | |
Banks | | | | | | | 14 | | | | 75 | | | | 89 | | | | | | | | 2 | | | | 10 | | | | 12 | |
Businesses and governments | | | | | | | 37 | | | | 268 | | | | 305 | | | | | | | | 81 | | | | (31 | ) | | | 50 | |
Individuals | | | | | | | 13 | | | | 23 | | | | 36 | | | | | | | | 13 | | | | (8 | ) | | | 5 | |
Total deposits | | | | | | | 64 | | | | 366 | | | | 430 | | | | | | | | 96 | | | | (29 | ) | | | 67 | |
Securities sold but not yet purchased and securities lent or sold | | | | | | | 18 | | | | 56 | | | | 74 | | | | | | | | 17 | | | | (4 | ) | | | 13 | |
Subordinated debt and other interest bearing liabilities | | | | | | | 52 | | | | 63 | | | | 115 | | | | | | | | 28 | | | | 15 | | | | 43 | |
Change in U.S. dollar and other currencies interest expense | | | | | | | 134 | | | | 485 | | | | 619 | | | | | | | | 141 | | | | (18 | ) | | | 123 | |
Total All Currencies | | | | | | | | | | | | | | | | | | | | | | | | | | | | | | | | |
Change in total interest expense (b) | | | | | | | 175 | | | | 60 | | | | 235 | | | | | | | | 201 | | | | (386 | ) | | | (185 | ) |
Change in total net interest income (a - b) | | | | | | | 1,090 | | | | 19 | | | | 1,109 | | | | | | | | 838 | | | | (367 | ) | | | 471 | |
| | | | |
| BMO Financial Group 199th Annual Report 2016 | | | 127 | |
SUPPLEMENTAL INFORMATION
Table 7: Net Loans and Acceptances – Segmented Information(1) (2) (4) (5) (6) (7)
| | | | | | | | | | | | | | | | | | | | | | | | | | | | | | | | | | | | | | | | | | | | | | | | | | | | | | | | | | | | | | | | |
| ($ millions) | | Canada | | | United States | | | Other countries | | | | |
| As at October 31 | | 2016 | | | 2015 | | | 2014 | | | 2013 | | | 2012 | | | 2016 | | | 2015 | | | 2014 | | | 2013 | | | 2012 | | | 2016 | | | 2015 | | | 2014 | | | 2013 | | | 2012 | | | | |
Consumer | | | | | | | | | | | | | | | | | | | | | | | | | | | | | | | | | | | | | | | | | | | | | | | | | | | | | | | | | | | | | | | | |
Residential mortgages | | | 103,558 | | | | 96,975 | | | | 92,972 | | | | 88,677 | | | | 76,729 | | | | 8,686 | | | | 8,905 | | | | 7,980 | | | | 7,646 | | | | 7,416 | | | | – | | | | – | | | | – | | | | – | | | | – | | | | | |
Credit cards | | | 7,541 | | | | 7,427 | | | | 7,476 | | | | 7,413 | | | | 7,381 | | | | 560 | | | | 553 | | | | 496 | | | | 457 | | | | 433 | | | | – | | | | – | | | | – | | | | – | | | | – | | | | | |
Consumer instalment and other personal loans | | | 50,368 | | | | 49,181 | | | | 48,955 | | | | 49,195 | | | | 47,955 | | | | 13,974 | | | | 16,098 | | | | 15,088 | | | | 14,364 | | | | 13,419 | | | | 215 | | | | 206 | | | | 1 | | | | – | | | | – | | | | | |
Total consumer | | | 161,467 | | | | 153,583 | | | | 149,403 | | | | 145,285 | | | | 132,065 | | | | 23,220 | | | | 25,556 | | | | 23,564 | | | | 22,467 | | | | 21,268 | | | | 215 | | | | 206 | | | | 1 | | | | – | | | | – | | | | | |
Total businesses and governments | | | 79,443 | | | | 69,772 | | | | 63,896 | | | | 57,967 | | | | 53,069 | | | | 98,371 | | | | 75,430 | | | | 56,389 | | | | 45,842 | | | | 42,955 | | | | 10,555 | | | | 10,975 | | | | 11,145 | | | | 8,954 | | | | 5,748 | | | | | |
Total loans and acceptances, net of specific allowances | | | 240,910 | | | | 223,355 | | | | 213,299 | | | | 203,252 | | | | 185,134 | | | | 121,591 | | | | 100,986 | | | | 79,953 | | | | 68,309 | | | | 64,223 | | | | 10,770 | | | | 11,181 | | | | 11,146 | | | | 8,954 | | | | 5,748 | | | | | |
Collective allowance | | | (893 | ) | | | (857 | ) | | | (795 | ) | | | (791 | ) | | | (705 | ) | | | (789 | ) | | | (803 | ) | | | (747 | ) | | | (694 | ) | | | (755 | ) | | | – | | | | – | | | | – | | | | – | | | | – | | | | | |
Total net loans and acceptances | | | 240,017 | | | | 222,498 | | | | 212,504 | | | | 202,461 | | | | 184,429 | | | | 120,802 | | | | 100,183 | | | | 79,206 | | | | 67,615 | | | | 63,468 | | | | 10,770 | | | | 11,181 | | | | 11,146 | | | | 8,954 | | | | 5,748 | | | | | |
|
Table 8: Net Impaired Loans and Acceptances –
Segmented Information(3) (7) | |
| ($ millions) | | Canada | | | United States | | | Other countries | | | | |
| As at October 31 | | 2016 | | | 2015 | | | 2014 | | | 2013 | | | 2012 | | | 2016 | | | 2015 | | �� | 2014 | | | 2013 | | | 2012 | | | 2016 | | | 2015 | | | 2014 | | | 2013 | | | 2012 | | | | |
Consumer | | | | | | | | | | | | | | | | | | | | | | | | | | | | | | | | | | | | | | | | | | | | | | | | | | | | | | | | | | | | | | | | |
Residential mortgages | | | 144 | | | | 159 | | | | 168 | | | | 157 | | | | 182 | | | | 175 | | | | 173 | | | | 303 | | | | 369 | | | | 335 | | | | – | | | | – | | | | – | | | | – | | | | – | | | | | |
Consumer instalment and other personal loans | | | 121 | | | | 117 | | | | 136 | | | | 100 | | | | 64 | | | | 345 | | | | 316 | | | | 309 | | | | 274 | | | | 275 | | | | – | | | | – | | | | – | | | | – | | | | – | | | | | |
Total consumer | | | 265 | | | | 276 | | | | 304 | | | | 257 | | | | 246 | | | | 520 | | | | 489 | | | | 612 | | | | 643 | | | | 610 | | | | – | | | | – | | | | – | | | | – | | | | – | | | | | |
Businesses and governments | | | 298 | | | | 220 | | | | 247 | | | | 253 | | | | 377 | | | | 843 | | | | 613 | | | | 507 | | | | 944 | | | | 1,271 | | | | 1 | | | | 4 | | | | 4 | | | | 3 | | | | 25 | | | | | |
Total impaired loans and acceptances, net of specific allowances | | | 563 | | | | 496 | | | | 551 | | | | 510 | | | | 623 | | | | 1,363 | | | | 1,102 | | | | 1,119 | | | | 1,587 | | | | 1,881 | | | | 1 | | | | 4 | | | | 4 | | | | 3 | | | | 25 | | | | | |
Condition Ratios(1) | | | | | | | | | | | | | | | | | | | | | | | | | | | | | | | | | | | | | | | | | | | | | | | | | | | | | | | | | | | | | | | | |
NIL as a % of net loans and acceptances (3) (4) (8) | | | 0.23 | | | | 0.22 | | | | 0.26 | | | | 0.25 | | | | 0.34 | | | | 1.13 | | | | 1.10 | | | | 1.43 | | | | 2.38 | | | | 3.03 | | | | 0.01 | | | | 0.04 | | | | 0.04 | | | | 0.03 | | | | 0.43 | | | | | |
NIL as a % of net loans and acceptances (3) (4) (5) | | | | | | | | | | | | | | | | | | | | | | | | | | | | | | | | | | | | | | | | | | | | | | | | | | | | | | | | | | | | | | | | |
Consumer | | | 0.16 | | | | 0.18 | | | | 0.20 | | | | 0.18 | | | | 0.19 | | | | 2.26 | | | | 1.94 | | | | 2.63 | | | | 2.90 | | | | 2.90 | | | | – | | | | – | | | | – | | | | – | | | | – | | | | | |
Businesses and governments | | | 0.38 | | | | 0.32 | | | | 0.39 | | | | 0.44 | | | | 0.71 | | | | 0.86 | | | | 0.82 | | | | 0.92 | | | | 2.12 | | | | 3.08 | | | | 0.01 | | | | 0.04 | | | | 0.04 | | | | 0.03 | | | | 0.43 | | | | | |
| | (1) | Certain balances for fiscal 2012 were restated in 2013 to conform to the current period’s presentation. | |
| | (2) | Aggregate Net Loans and Acceptances balances are net of collective allowances, and all specific allowances excluding those related to off-balance sheet instruments and undrawn commitments. The Consumer and Business and governments Net Loans and Acceptances balances are stated net of specific allowances only (excluding those related to off-balance sheet instruments and undrawn commitments). | |
| | (3) | Net Impaired Loans balances are net of specific allowances, excluding off-balance sheet instruments and undrawn commitments. | |
| | (4) | Ratios are presented including purchased portfolios and prior periods have been restated. | |
| | (5) | Certain ratios for 2013 and 2012 were restated in 2014 to conform to the current period’s presentation. | |
| | (6) | Fiscal 2013 and 2012 balances were reclassified in 2014 to conform to the current period’s presentation. | |
| | (7) | Certain balances for fiscal 2014 and 2013 were restated in 2015 to conform to the current period’s presentation. | |
| | (8) | Certain ratios for 2015, 2014, 2013 and 2012 were restated in 2016 to conform to the current period’s presentation. | |
| | |
| 128 | | BMO Financial Group 199th Annual Report 2016 |
| | | | | | | | | | | | | | | | | | | | |
| | | Total | |
| | | 2016 | | | 2015 | | | 2014 | | | 2013 | | | 2012 | |
| | | | | | | | | | | | | | | | | | | | |
| | | 112,244 | | | | 105,880 | | | | 100,952 | | | | 96,323 | | | | 84,145 | |
| | | 8,101 | | | | 7,980 | | | | 7,972 | | | | 7,870 | | | | 7,814 | |
| | | | 64,557 | | | | 65,485 | | | | 64,044 | | | | 63,559 | | | | 61,374 | |
| | | 184,902 | | | | 179,345 | | | | 172,968 | | | | 167,752 | | | | 153,333 | |
| | | | 188,369 | | | | 156,177 | | | | 131,430 | | | | 112,763 | | | | 101,772 | |
| | | 373,271 | | | | 335,522 | | | | 304,398 | | | | 280,515 | | | | 255,105 | |
| | | | (1,682 | ) | | | (1,660 | ) | | | (1,542 | ) | | | (1,485 | ) | | | (1,460 | ) |
| | | | 371,589 | | | | 333,862 | | | | 302,856 | | | | 279,030 | | | | 253,645 | |
| |
| | | Total | |
| | | 2016 | | | 2015 | | | 2014 | | | 2013 | | | 2012 | |
| | | | | | | | | | | | | | | | | | | | |
| | | 319 | | | | 332 | | | | 471 | | | | 526 | | | | 517 | |
| | | | 466 | | | | 433 | | | | 445 | | | | 374 | | | | 339 | |
| | | 785 | | | | 765 | | | | 916 | | | | 900 | | | | 856 | |
| | | | 1,142 | | | | 837 | | | | 758 | | | | 1,200 | | | | 1,673 | |
| | | | 1,927 | | | | 1,602 | | | | 1,674 | | | | 2,100 | | | | 2,529 | |
| | | | | | | | | | | | | | | | | | | | |
| | | | 0.52 | | | | 0.48 | | | | 0.55 | | | | 0.75 | | | | 1.00 | |
| | | | | | | | | | | | | | | | | | | | |
| | | 0.42 | | | | 0.43 | | | | 0.53 | | | | 0.54 | | | | 0.56 | |
| | | | 0.61 | | | | 0.54 | | | | 0.58 | | | | 1.07 | | | | 1.67 | |
Table 9: Net Loans and Acceptances – Segmented Information(1) (2) (3) (4)
| | | | | | | | | | | | | | | | | | | | |
($ millions) As at October 31 | | 2016 | | | 2015 | | | 2014 | | | 2013 | | | 2012 | |
Net Loans and Acceptances by Province | | | | | | | | | | | | | | | | | | | | |
Atlantic provinces | | | 13,740 | | | | 13,361 | | | | 13,065 | | | | 11,244 | | | | 11,801 | |
Quebec | | | 38,272 | | | | 36,486 | | | | 35,647 | | | | 33,746 | | | | 35,650 | |
Ontario | | | 98,448 | | | | 89,460 | | | | 84,498 | | | | 80,726 | | | | 69,014 | |
Prairie provinces | | | 46,430 | | | | 43,612 | | | | 42,043 | | | | 38,825 | | | | 34,431 | |
British Columbia and territories | | | 43,127 | | | | 39,579 | | | | 37,251 | | | | 37,920 | | | | 33,533 | |
Total net loans and acceptances in Canada | | | 240,017 | | | | 222,498 | | | | 212,504 | | | | 202,461 | | | | 184,429 | |
Net Businesses and Governments Loans by Industry | | | | | | | | | | | | | | | | | | | | |
Commercial real estate | | | 24,114 | | | | 20,597 | | | | 17,636 | | | | 17,606 | | | | 18,720 | |
Construction (non-real estate) | | | 3,563 | | | | 3,544 | | | | 3,101 | | | | 2,934 | | | | 2,539 | |
Retail trade | | | 16,859 | | | | 14,096 | | | | 12,580 | | | | 10,229 | | | | 9,084 | |
Wholesale trade | | | 12,157 | | | | 10,243 | | | | 8,281 | | | | 7,345 | | | | 6,821 | |
Agriculture | | | 10,951 | | | | 9,891 | | | | 9,155 | | | | 8,380 | | | | 7,312 | |
Communications | | | 895 | | | | 815 | | | | 831 | | | | 729 | | | | 513 | |
Manufacturing | | | 18,689 | | | | 16,187 | | | | 13,612 | | | | 11,250 | | | | 9,870 | |
Mining | | | 1,862 | | | | 1,309 | | | | 1,085 | | | | 959 | | | | 662 | |
Oil and gas | | | 7,930 | | | | 6,667 | | | | 5,943 | | | | 3,908 | | | | 3,466 | |
Transportation | | | 10,694 | | | | 3,735 | | | | 2,532 | | | | 2,152 | | | | 2,109 | |
Utilities | | | 2,692 | | | | 1,984 | | | | 1,670 | | | | 1,309 | | | | 1,170 | |
Forest products | | | 889 | | | | 859 | | | | 587 | | | | 631 | | | | 592 | |
Service industries | | | 35,481 | | | | 28,384 | | | | 22,114 | | | | 18,321 | | | | 14,992 | |
Financial institutions | | | 35,977 | | | | 31,220 | | | | 24,096 | | | | 19,019 | | | | 15,113 | |
Government | | | 1,394 | | | | 1,874 | | | | 2,076 | | | | 1,719 | | | | 1,295 | |
Other | | | 4,222 | | | | 4,772 | | | | 6,131 | | | | 6,272 | | | | 7,514 | |
| | | | 188,369 | | | | 156,177 | | | | 131,430 | | | | 112,763 | | | | 101,772 | |
Table 10: Net Impaired Loans and Acceptances – Segmented Information(2) (5)
| | | | | | | | | | | | | | | | | | | | |
($ millions) As at October 31 | | 2016 | | | 2015 | | | 2014 | | | 2013 | | | 2012 | |
Net Impaired Businesses and Governments Loans | | | | | | | | | | | | | | | | | | | | |
Commercial real estate | | | 60 | | | | 87 | | | | 159 | | | | 379 | | | | 803 | |
Construction (non-real estate) | | | 45 | | | | 83 | | | | 84 | | | | 32 | | | | 51 | |
Retail trade | | | 13 | | | | 55 | | | | 38 | | | | 74 | | | | 68 | |
Wholesale trade | | | 51 | | | | 47 | | | | 35 | | | | 64 | | | | 58 | |
Agriculture | | | 221 | | | | 129 | | | | 103 | | | | 118 | | | | 131 | |
Communications | | | 1 | | | | 13 | | | | 59 | | | | – | | | | 5 | |
Manufacturing | | | 106 | | | | 102 | | | | 100 | | | | 74 | | | | 126 | |
Mining | | | 2 | | | | 3 | | | | 2 | | | | 5 | | | | 5 | |
Oil and gas | | | 408 | | | | 100 | | | | 1 | | | | 30 | | | | 1 | |
Transportation | | | 88 | | | | 30 | | | | 7 | | | | 23 | | | | 41 | |
Utilities | | | 12 | | | | 14 | | | | – | | | | – | | | | 6 | |
Forest products | | | 7 | | | | 9 | | | | 13 | | | | 19 | | | | 24 | |
Service industries | | | 82 | | | | 107 | | | | 145 | | | | 246 | | | | 263 | |
Financial institutions | | | 39 | | | | 48 | | | | 9 | | | | – | | | | – | |
Government | | | 6 | | | | – | | | | 2 | | | | 61 | | | | 68 | |
Other | | | 1 | | | | 10 | | | | 1 | | | | 75 | | | | 23 | |
| | | | 1,142 | | | | 837 | | | | 758 | | | | 1,200 | | | | 1,673 | |
| | (1) | Certain balances for fiscal 2012 were restated in 2013 to conform to the current period’s presentation. |
| | (2) | Fiscal 2013 and 2012 balances were reclassified in 2014 to conform to the current period’s presentation. |
| | (3) | Fiscal 2014 Canadian regional balances were reclassified in 2015 to conform to the current period’s presentation. |
| | (4) | Aggregated Net Loans and Acceptances are net of collective allowances, and all specific allowances excluding those related to off-balance sheet instruments and undrawn commitments. The Consumer and Business and governments Net Loans and Acceptances balances are stated net of specific allowances (excluding those related to off-balance sheet instruments and undrawn commitments) only. |
| | (5) | Net Impaired Loans balances are net of specific allowances, excluding off-balance sheet instruments and undrawn commitments. |
| | | | |
| BMO Financial Group 199th Annual Report 2016 | | | 129 | |
SUPPLEMENTAL INFORMATION
Table 11: Changes in Gross Impaired Loans –
Segmented Information(5)
| | | | | | | | | | | | | | | | | | | | | | | | | | | | | | | | | | | | | | | | | | | | | | | | | | | | | | | | | | | | | | | | |
| ($ millions) | | Canada | | | United States | | | Other countries | | | | |
| As at October 31 | | 2016 | | | 2015 | | | 2014 | | | 2013 | | | 2012 | | | 2016 | | | 2015 | | | 2014 | | | 2013 | | | 2012 | | | 2016 | | | 2015 | | | 2014 | | | 2013 | | | 2012 | | | | |
Gross impaired loans and acceptances (GIL), beginning of year | | | | | | | | | | | | | | | | | | | | | | | | | | | | | | | | | | | | | | | | | | | | | | | | | | | | | | | | | | | | | | | | |
Consumer | | | 359 | | | | 398 | | | | 348 | | | | 338 | | | | 371 | | | | 557 | | | | 678 | | | | 702 | | | | 646 | | | | 388 | | | | – | | | | – | | | | – | | | | – | | | | – | | | | | |
Businesses and governments | | | 282 | | | | 344 | | | | 406 | | | | 548 | | | | 586 | | | | 757 | | | | 623 | | | | 1,081 | | | | 1,401 | | | | 1,326 | | | | 4 | | | | 5 | | | | 7 | | | | 43 | | | | 14 | | | | | |
Total GIL, beginning of year | | | 641 | | | | 742 | | | | 754 | | | | 886 | | | | 957 | | | | 1,314 | | | | 1,301 | | | | 1,783 | | | | 2,047 | | | | 1,714 | | | | 4 | | | | 5 | | | | 7 | | | | 43 | | | | 14 | | | | | |
Additions to impaired loans and acceptances | | | | | | | | | | | | | | | | | | | | | | | | | | | | | | | | | | | | | | | | | | | | | | | | | | | | | | | | | | | | | | | | |
Consumer | | | 631 | | | | 617 | | | | 643 | | | | 584 | | | | 533 | | | | 473 | | | | 526 | | | | 529 | | | | 637 | | | | 764 | | | | – | | | | – | | | | – | | | | – | | | | – | | | | | |
Businesses and governments | | | 453 | | | | 231 | | | | 285 | | | | 294 | | | | 352 | | | | 953 | | | | 542 | | | | 685 | | | | 931 | | | | 1,416 | | | | 2 | | | | 5 | | | | – | | | | 3 | | | | 36 | | | | | |
Total additions | | | 1,084 | | | | 848 | | | | 928 | | | | 878 | | | | 885 | | | | 1,426 | | | | 1,068 | | | | 1,214 | | | | 1,568 | | | | 2,180 | | | | 2 | | | | 5 | | | | – | | | | 3 | | | | 36 | | | | | |
Reductions to impaired loans and acceptances (1) | | | | | | | | | | | | | | | | | | | | | | | | | | | | | | | | | | | | | | | | | | | | | | | | | | | | | | | | | | | | | | | | |
Consumer | | | (452 | ) | | | (479 | ) | | | (431 | ) | | | (416 | ) | | | (386 | ) | | | (282 | ) | | | (432 | ) | | | (321 | ) | | | (243 | ) | | | (45 | ) | | | – | | | | – | | | | – | | | | – | | | | – | | | | | |
Businesses and governments | | | (245 | ) | | | (151 | ) | | | (224 | ) | | | (274 | ) | | | (314 | ) | | | (450 | ) | | | (239 | ) | | | (859 | ) | | | (973 | ) | | | (880 | ) | | | (4 | ) | | | (5 | ) | | | (2 | ) | | | (36 | ) | | | (6 | ) | | | | |
Total reductions due to net repayments and other | | | (697 | ) | | | (630 | ) | | | (655 | ) | | | (690 | ) | | | (700 | ) | | | (732 | ) | | | (671 | ) | | | (1,180 | ) | | | (1,216 | ) | | | (925 | ) | | | (4 | ) | | | (5 | ) | | | (2 | ) | | | (36 | ) | | | (6 | ) | | | | |
Write-offs | | | | | | | | | | | | | | | | | | | | | | | | | | | | | | | | | | | | | | | | | | | | | | | | | | | | | | | | | | | | | | | | |
Consumer | | | (182 | ) | | | (177 | ) | | | (162 | ) | | | (158 | ) | | | (180 | ) | | | (163 | ) | | | (215 | ) | | | (232 | ) | | | (338 | ) | | | (461 | ) | | | – | | | | – | | | | – | | | | – | | | | – | | | | | |
Businesses and governments | | | (110 | ) | | | (142 | ) | | | (123 | ) | | | (162 | ) | | | (76 | ) | | | (251 | ) | | | (169 | ) | | | (284 | ) | | | (278 | ) | | | (461 | ) | | | – | | | | (1 | ) | | | – | | | | (3 | ) | | | (1 | ) | | | | |
Total write-offs | | | (292 | ) | | | (319 | ) | | | (285 | ) | | | (320 | ) | | | (256 | ) | | | (414 | ) | | | (384 | ) | | | (516 | ) | | | (616 | ) | | | (922 | ) | | | – | | | | (1 | ) | | | – | | | | (3 | ) | | | (1 | ) | | | | |
Gross impaired loans and acceptances, end of year | | | | | | | | | | | | | | | | | | | | | | | | | | | | | | | | | | | | | | | | | | | | | | | | | | | | | | | | | | | | | | | | |
Consumer | | | 356 | | | | 359 | | | | 398 | | | | 348 | | | | 338 | | | | 585 | | | | 557 | | | | 678 | | | | 702 | | | | 646 | | | | – | | | | – | | | | – | | | | – | | | | – | | | | | |
Businesses and governments | | | 380 | | | | 282 | | | | 344 | | | | 406 | | | | 548 | | | | 1,009 | | | | 757 | | | | 623 | | | | 1,081 | | | | 1,401 | | | | 2 | | | | 4 | | | | 5 | | | | 7 | | | | 43 | | | | | |
Total GIL, end of year | | | 736 | | | | 641 | | | | 742 | | | | 754 | | | | 886 | | | | 1,594 | | | | 1,314 | | | | 1,301 | | | | 1,783 | | | | 2,047 | | | | 2 | | | | 4 | | | | 5 | | | | 7 | | | | 43 | | | | | |
Condition Ratios | | | | | | | | | | | | | | | | | | | | | | | | | | | | | | | | | | | | | | | | | | | | | | | | | | | | | | | | | | | | | | | | |
GIL as a % of Gross Loans (2) | | | | | | | | | | | | | | | | | | | | | | | | | | | | | | | | | | | | | | | | | | | | | | | | | | | | | | | | | | | | | | | | |
Consumer | | | 0.22 | | | | 0.23 | | | | 0.27 | | | | 0.24 | | | | 0.26 | | | | 2.52 | | | | 2.18 | | | | 2.87 | | | | 3.12 | | | | 3.03 | | | | – | | | | – | | | | – | | | | – | | | | – | | | | | |
Businesses and governments | | | 0.48 | | | | 0.40 | | | | 0.54 | | | | 0.68 | | | | 1.00 | | | | 1.03 | | | | 1.01 | | | | 1.10 | | | | 2.34 | | | | 3.28 | | | | 0.02 | | | | 0.04 | | | | 0.04 | | | | 0.10 | | | | 0.91 | | | | | |
Total Loans and Acceptances | | | 0.31 | | | | 0.29 | | | | 0.35 | | | | 0.37 | | | | 0.47 | | | | 1.31 | | | | 1.30 | | | | 1.62 | | | | 2.60 | | | | 3.20 | | | | 0.02 | | | | 0.04 | | | | 0.04 | | | | 0.10 | | | | 0.91 | | | | | |
GIL as a % of equity and allowance for credit losses (3) (4) (5) | | | un | | | | un | | | | un | | | | un | | | | un | | | | un | | | | un | | | | un | | | | un | | | | un | | | | un | | | | un | | | | un | | | | un | | | | un | | | | | |
| | (1) | Includes amounts returning to performing status, sales, repayments, the impact of foreign exchange, and offsets for consumer write-offs that are not recognized as formations. |
| | (2) | Certain balances and ratios for fiscal 2012 were restated in 2013 to conform to the current period’s presentation. |
| | (3) | Ratios are presented including purchased portfolios and prior periods have been restated. |
| | (4) | Certain ratios for 2013 and 2012 were restated in 2014 to conform to the current period’s presentation. |
| | (5) | GIL excludes Purchased Credit Impaired Loans. |
un – unavailable
| | |
| 130 | | BMO Financial Group 199th Annual Report 2016 |
| | | | | | | | | | | | | | | | | | | | |
| | | Total | |
| | | 2016 | | | 2015 | | | 2014 | | | 2013 | | | 2012 | |
| | | | | |
| | | | | | | | | | | | | | | | | | | | |
| | | 916 | | | | 1,076 | | | | 1,050 | | | | 984 | | | | 759 | |
| | | | 1,043 | | | | 972 | | | | 1,494 | | | | 1,992 | | | | 1,926 | |
| | | | 1,959 | | | | 2,048 | | | | 2,544 | | | | 2,976 | | | | 2,685 | |
| | | | | | | | | | | | | | | | | | | | |
| | | | | |
| | | 1,104 | | | | 1,143 | | | | 1,172 | | | | 1,221 | | | | 1,297 | |
| | | | 1,408 | | | | 778 | | | | 970 | | | | 1,228 | | | | 1,804 | |
| | | | 2,512 | | | | 1,921 | | | | 2,142 | | | | 2,449 | | | | 3,101 | |
| | | | | | | | | | | | | | | | | | | | |
| | | (734 | ) | | | (911 | ) | | | (752 | ) | | | (659 | ) | | | (431 | ) |
| | | | (699 | ) | | | (395 | ) | | | (1,085 | ) | | | (1,283 | ) | | | (1,200 | ) |
| | | | (1,433 | ) | | | (1,306 | ) | | | (1,837 | ) | | | (1,942 | ) | | | (1,631 | ) |
| | | | | | | | | | | | | | | | | | | | |
| | | (345 | ) | | | (392 | ) | | | (394 | ) | | | (496 | ) | | | (641 | ) |
| | | | (361 | ) | | | (312 | ) | | | (407 | ) | | | (443 | ) | | | (538 | ) |
| | | | (706 | ) | | | (704 | ) | | | (801 | ) | | | (939 | ) | | | (1,179 | ) |
| | | | | |
| | | | | | | | | | | | | | | | | | | | |
| | | 941 | | | | 916 | | | | 1,076 | | | | 1,050 | | | | 984 | |
| | | | 1,391 | | | | 1,043 | | | | 972 | | | | 1,494 | | | | 1,992 | |
| | | | 2,332 | | | | 1,959 | | | | 2,048 | | | | 2,544 | | | | 2,976 | |
| | | | | | | | | | | | | | | | | | | | |
| | | | | | | | | | | | | | | | | | | | |
| | | 0.51 | | | | 0.51 | | | | 0.62 | | | | 0.63 | | | | 0.64 | |
| | | | 0.74 | | | | 0.67 | | | | 0.74 | | | | 1.32 | | | | 1.95 | |
| | | | 0.62 | | | | 0.58 | | | | 0.67 | | | | 0.91 | | | | 1.17 | |
| | | | 5.25 | | | | 4.67 | | | | 5.49 | | | | 7.68 | | | | 9.46 | |
| | | | |
| BMO Financial Group 199th Annual Report 2016 | | | 131 | |
SUPPLEMENTAL INFORMATION
Table 12: Changes in Allowance for Credit Losses –
Segmented Information(3)
| | | | | | | | | | | | | | | | | | | | | | | | | | | | | | | | | | | | | | | | | | | | | | | | | | | | | | | | | | | | | | | | |
| ($ millions) | | Canada | | | United States | | | Other countries | | | | |
| As at October 31 | | 2016 | | | 2015 | | | 2014 | | | 2013 | | | 2012 | | | 2016 | | | 2015 | | | 2014 | | | 2013 | | | 2012 | | | 2016 | | | 2015 | | | 2014 | | | 2013 | | | 2012 | | | | |
Allowance for credit losses (ACL), beginning of year | | | | | | | | | | | | | | | | | | | | | | | | | | | | | | | | | | | | | | | | | | | | | | | | | | | | | | | | | | | | | | | | |
Consumer | | | 614 | | | | 615 | | | | 602 | | | | 518 | | | | 464 | | | | 393 | | | | 333 | | | | 278 | | | | 291 | | | | 270 | | | | – | | | | – | | | | – | | | | – | | | | – | | | | | |
Businesses and governments | | | 388 | | | | 371 | | | | 433 | | | | 450 | | | | 468 | | | | 657 | | | | 646 | | | | 653 | | | | 659 | | | | 797 | | | | – | | | | 1 | | | | 4 | | | | 18 | | | | 12 | | | | | |
Total ACL, beginning of year | | | 1,002 | | | | 986 | | | | 1,035 | | | | 968 | | | | 932 | | | | 1,050 | | | | 979 | | | | 931 | | | | 950 | | | | 1,067 | | | | – | | | | 1 | | | | 4 | | | | 18 | | | | 12 | | | | | |
Provision for credit losses | | | | | | | | | | | | | | | | | | | | | | | | | | | | | | | | | | | | | | | | | | | | | | | | | | | | | | | | | | | | | | | | |
Consumer | | | 403 | | | | 412 | | | | 436 | | | | 521 | | | | 543 | | | | (31 | ) | | | 122 | | | | 202 | | | | 262 | | | | 401 | | | | – | | | | – | | | | – | | | | – | | | | – | | | | | |
Businesses and governments | | | 180 | | | | 149 | | | | 97 | | | | 133 | | | | 90 | | | | 263 | | | | (70 | ) | | | (172 | ) | | | (327 | ) | | | (267 | ) | | | – | | | | (1 | ) | | | (2 | ) | | | (2 | ) | | | (3 | ) | | | | |
Total provision for credit losses | | | 583 | | | | 561 | | | | 533 | | | | 654 | | | | 633 | | | | 232 | | | | 52 | | | | 30 | | | | (65 | ) | | | 134 | | | | – | | | | (1 | ) | | | (2 | ) | | | (2 | ) | | | (3 | ) | | | | |
Recoveries | | | | | | | | | | | | | | | | | | | | | | | | | | | | | | | | | | | | | | | | | | | | | | | | | | | | | | | | | | | | | | | | |
Consumer | | | 102 | | | | 111 | | | | 99 | | | | 81 | | | | 91 | | | | 87 | | | | 151 | | | | 102 | | | | 95 | | | | 125 | | | | – | | | | – | | | | – | | | | – | | | | – | | | | | |
Businesses and governments | | | 14 | | | | 13 | | | | 15 | | | | (1 | ) | | | 4 | | | | 140 | | | | 181 | | | | 408 | | | | 597 | | | | 626 | | | | – | | | | – | | | | – | | | | – | | | | – | | | | | |
Total recoveries | | | 116 | | | | 124 | | | | 114 | | | | 80 | | | | 95 | | | | 227 | | | | 332 | | | | 510 | | | | 692 | | | | 751 | | | | – | | | | – | | | | – | | | | – | | | | – | | | | | |
Write-offs | | | | | | | | | | | | | | | | | | | | | | | | | | | | | | | | | | | | | | | | | | | | | | | | | | | | | | | | | | | | | | | | |
Consumer | | | (511 | ) | | | (521 | ) | | | (500 | ) | | | (507 | ) | | | (563 | ) | | | (175 | ) | | | (232 | ) | | | (242 | ) | | | (347 | ) | | | (492 | ) | | | – | | | | – | | | | – | | | | – | | | | – | | | | | |
Businesses and governments | | | (110 | ) | | | (143 | ) | | | (122 | ) | | | (160 | ) | | | (76 | ) | | | (251 | ) | | | (168 | ) | | | (285 | ) | | | (280 | ) | | | (461 | ) | | | – | | | | (1 | ) | | | – | | | | (3 | ) | | | (1 | ) | | | | |
Total write-offs | | | (621 | ) | | | (664 | ) | | | (622 | ) | | | (667 | ) | | | (639 | ) | | | (426 | ) | | | (400 | ) | | | (527 | ) | | | (627 | ) | | | (953 | ) | | | – | | | | (1 | ) | | | – | | | | (3 | ) | | | (1 | ) | | | | |
Other, including foreign exchange rate changes | | | | | | | | | | | | | | | | | | | | | | | | | | | | | | | | | | | | | | | | | | | | | | | | | | | | | | | | | | | | | | | | |
Consumer | | | (13 | ) | | | (3 | ) | | | (22 | ) | | | (11 | ) | | | (17 | ) | | | (20 | ) | | | 19 | | | | (7 | ) | | | (23 | ) | | | (13 | ) | | | – | | | | – | | | | – | | | | – | | | | – | | | | | |
Businesses and governments | | | (1 | ) | | | (2 | ) | | | (52 | ) | | | 11 | | | | (36 | ) | | | (16 | ) | | | 68 | | | | 42 | | | | 4 | | | | (36 | ) | | | 1 | | | | 1 | | | | (1 | ) | | | (9 | ) | | | 10 | | | | | |
Total Other, including foreign exchange rate changes | | | (14 | ) | | | (5 | ) | | | (74 | ) | | | – | | | | (53 | ) | | | (36 | ) | | | 87 | | | | 35 | | | | (19 | ) | | | (49 | ) | | | 1 | | | | 1 | | | | (1 | ) | | | (9 | ) | | | 10 | | | | | |
ACL, end of year | | | | | | | | | | | | | | | | | | | | | | | | | | | | | | | | | | | | | | | | | | | | | | | | | | | | | | | | | | | | | | | | |
Consumer | | | 595 | | | | 614 | | | | 615 | | | | 602 | | | | 518 | | | | 254 | | | | 393 | | | | 333 | | | | 278 | | | | 291 | | | | – | | | | – | | | | – | | | | – | | | | – | | | | | |
Businesses and governments | | | 471 | | | | 388 | | | | 371 | | | | 433 | | | | 450 | | | | 793 | | | | 657 | | | | 646 | | | | 653 | | | | 659 | | | | 1 | | | | – | | | | 1 | | | | 4 | | | | 18 | | | | | |
Total ACL, end of year | | | 1,066 | | | | 1,002 | | | | 986 | | | | 1,035 | | | | 968 | | | | 1,047 | | | | 1,050 | | | | 979 | | | | 931 | | | | 950 | | | | 1 | | | | – | | | | 1 | | | | 4 | | | | 18 | | | | | |
Allocation of Write-offs by Market | | | | | | | | | | | | | | | | | | | | | | | | | | | | | | | | | | | | | | | | | | | | | | | | | | | | | | | | | | | | | | | | |
Consumer | | | (511 | ) | | | (521 | ) | | | (500 | ) | | | (507 | ) | | | (563 | ) | | | (175 | ) | | | (232 | ) | | | (242 | ) | | | (347 | ) | | | (492 | ) | | | – | | | | – | | | | – | | | | – | | | | – | | | | | |
Businesses and governments | | | (110 | ) | | | (143 | ) | | | (122 | ) | | | (160 | ) | | | (76 | ) | | | (251 | ) | | | (168 | ) | | | (285 | ) | | | (280 | ) | | | (461 | ) | | | – | | | | (1 | ) | | | – | | | | (3 | ) | | | (1 | ) | | | | |
Allocation of Recoveries by Market | | | | | | | | | | | | | | | | | | | | | | | | | | | | | | | | | | | | | | | | | | | | | | | | | | | | | | | | | | | | | | | | |
Consumer | | | 102 | | | | 111 | | | | 99 | | | | 81 | | | | 91 | | | | 87 | | | | 151 | | | | 102 | | | | 95 | | | | 125 | | | | – | | | | – | | | | – | | | | – | | | | – | | | | | |
Businesses and governments | | | 14 | | | | 13 | | | | 15 | | | | (1 | ) | | | 4 | | | | 140 | | | | 181 | | | | 408 | | | | 597 | | | | 626 | | | | – | | | | – | | | | – | | | | – | | | | – | | | | | |
Net write-offs as a % of average loans and acceptances (1) (2) | | | un | | | | un | | | | un | | | | un | | | | un | | | | un | | | | un | | | | un | | | | un | | | | un | | | | un | | | | un | | | | un | | | | un | | | | un | | | | | |
Table 13: Allocation of Allowance for Credit Losses –
Segmented Information(4)
| | | | | | | | | | | | | | | | | | | | | | | | | | | | | | | | | | | | | | | | | | | | | | | | | | | | | | | | | | | | | | | | |
| ($ millions) | | Canada | | | United States | | | Other countries | | | | |
| As at October 31 | | 2016 | | | 2015 | | | 2014 | | | 2013 | | | 2012 | | | 2016 | | | 2015 | | | 2014 | | | 2013 | | | 2012 | | | 2016 | | | 2015 | | | 2014 | | | 2013 | | | 2012 | | | | |
Consumer | | | | | | | | | | | | | | | | | | | | | | | | | | | | | | | | | | | | | | | | | | | | | | | | | | | | | | | | | | | | | | | | |
Residential mortgages | | | 15 | | | | 17 | | | | 20 | | | | 27 | | | | 36 | | | | 18 | | | | 21 | | | | 41 | | | | 42 | | | | 30 | | | | – | | | | – | | | | – | | | | – | | | | – | | | | | |
Consumer instalment and other personal loans | | | 76 | | | | 66 | | | | 74 | | | | 64 | | | | 55 | | | | 47 | | | | 47 | | | | 25 | | | | 17 | | | | 7 | | | | – | | | | – | | | | – | | | | – | | | | – | | | | | |
Total consumer | | | 91 | | | | 83 | | | | 94 | | | | 91 | | | | 91 | | | | 65 | | | | 68 | | | | 66 | | | | 59 | | | | 37 | | | | – | | | | – | | | | – | | | | – | | | | – | | | | | |
Businesses and governments | | | 82 | | | | 62 | | | | 97 | | | | 153 | | | | 172 | | | | 166 | | | | 144 | | | | 116 | | | | 137 | | | | 129 | | | | 1 | | | | – | | | | 1 | | | | 4 | | | | 18 | | | | | |
Off-balance sheet | | | – | | | | – | | | | – | | | | – | | | | – | | | | 27 | | | | 35 | | | | 50 | | | | 41 | | | | 29 | | | | – | | | | – | | | | – | | | | – | | | | – | | | | | |
Total specific allowances | | | 173 | | | | 145 | | | | 191 | | | | 244 | | | | 263 | | | | 258 | | | | 247 | | | | 232 | | | | 237 | | | | 195 | | | | 1 | | | | – | | | | 1 | | | | 4 | | | | 18 | | | | | |
Collective allowance | | | 893 | | | | 857 | | | | 795 | | | | 791 | | | | 705 | | | | 789 | | | | 803 | | | | 747 | | | | 694 | | | | 755 | | | | – | | | | – | | | | – | | | | – | | | | – | | | | | |
Allowance for credit losses | | | 1,066 | | | | 1,002 | | | | 986 | | | | 1,035 | | | | 968 | | | | 1,047 | | | | 1,050 | | | | 979 | | | | 931 | | | | 950 | | | | 1 | | | | – | | | | 1 | | | | 4 | | | | 18 | | | | | |
Coverage Ratios | | | | | | | | | | | | | | | | | | | | | | | | | | | | | | | | | | | | | | | | | | | | | | | | | | | | | | | | | | | | | | | | |
Specific allowance for credit losses as a % of gross impaired loans and acceptances (GIL) (1) (5) | | | | | | | | | | | | | | | | | | | | | | | | | | | | | | | | | | | | | | | | | | | | | | | | | | | | | | | | | | | | | | | | |
Total | | | 23.5 | | | | 22.6 | | | | 25.7 | | | | 32.4 | | | | 29.7 | | | | 14.5 | | | | 16.1 | | | | 14.0 | | | | 11.0 | | | | 8.1 | | | | 50.0 | | | | – | | | | 20.0 | | | | 57.1 | | | | 41.9 | | | | | |
Consumer | | | 25.6 | | | | 23.1 | | | | 23.6 | | | | 26.1 | | | | 26.9 | | | | 11.1 | | | | 12.2 | | | | 9.7 | | | | 8.4 | | | | 5.7 | | | | – | | | | – | | | | – | | | | – | | | | – | | | | | |
Businesses and governments | | | 21.6 | | | | 22.0 | | | | 28.2 | | | | 37.7 | | | | 31.4 | | | | 16.5 | | | | 19.0 | | | | 18.6 | | | | 12.7 | | | | 9.2 | | | | 50.0 | | | | – | | | | 20.0 | | | | 57.1 | | | | 41.9 | | | | | |
| | (1) | Ratios are presented including purchased portfolios and prior periods have been restated. |
| | (2) | Certain balances and ratios for fiscal 2012 were restated in 2013 to conform to the current period’s presentation. |
| | (3) | Fiscal 2013 and 2012 balances were reclassified in 2014 to conform to the current period’s presentation. |
| | (4) | Certain balances for fiscal 2014 and 2013 were restated in 2015 to conform to the current period’s presentation. |
| | (5) | Ratios excludes specific allowances for Other Credit Instruments, which are included in Other Liabilities. |
un – unavailable
| | |
| 132 | | BMO Financial Group 199th Annual Report 2016 |
| | | | | | | | | | | | | | | | | | | | |
| | | Total | |
| | | 2016 | | | 2015 | | | 2014 | | | 2013 | | | 2012 | |
| | | | | | | | | | | | | | | | | | | | |
| | | 1,007 | | | | 948 | | | | 880 | | | | 809 | | | | 734 | |
| | | | 1,045 | | | | 1,018 | | | | 1,090 | | | | 1,127 | | | | 1,277 | |
| | | | 2,052 | | | | 1,966 | | | | 1,970 | | | | 1,936 | | | | 2,011 | |
| | | | | | | | | | | | | | | | | | | | |
| | | 372 | | | | 534 | | | | 638 | | | | 783 | | | | 944 | |
| | | | 443 | | | | 78 | | | | (77 | ) | | | (196 | ) | | | (180 | ) |
| | | | 815 | | | | 612 | | | | 561 | | | | 587 | | | | 764 | |
| | | | | | | | | | | | | | | | | | | | |
| | | 189 | | | | 262 | | | | 201 | | | | 176 | | | | 216 | |
| | | | 154 | | | | 194 | | | | 423 | | | | 596 | | | | 630 | |
| | | | 343 | | | | 456 | | | | 624 | | | | 772 | | | | 846 | |
| | | | | | | | | | | | | | | | | | | | |
| | | (686 | ) | | | (753 | ) | | | (742 | ) | | | (854 | ) | | | (1,055 | ) |
| | | | (361 | ) | | | (312 | ) | | | (407 | ) | | | (443 | ) | | | (538 | ) |
| | | | (1,047 | ) | | | (1,065 | ) | | | (1,149 | ) | | | (1,297 | ) | | | (1,593 | ) |
| | | | | | | | | | | | | | | | | | | | |
| | | (33 | ) | | | 16 | | | | (29 | ) | | | (34 | ) | | | (30 | ) |
| | | | (16 | ) | | | 67 | | | | (11 | ) | | | 6 | | | | (62 | ) |
| | | | (49 | ) | | | 83 | | | | (40 | ) | | | (28 | ) | | | (92 | ) |
| | | | | | | | | | | | | | | | | | | | |
| | | 849 | | | | 1,007 | | | | 948 | | | | 880 | | | | 809 | |
| | | | 1,265 | | | | 1,045 | | | | 1,018 | | | | 1,090 | | | | 1,127 | |
| | | | 2,114 | | | | 2,052 | | | | 1,966 | | | | 1,970 | | | | 1,936 | |
| | | | | | | | | | | | | | | | | | | | |
| | | (686 | ) | | | (753 | ) | | | (742 | ) | | | (854 | ) | | | (1,055 | ) |
| | | (361 | ) | | | (312 | ) | | | (407 | ) | | | (443 | ) | | | (538 | ) |
| | | | | | | | | | | | | | | | | | | | |
| | | 189 | | | | 262 | | | | 201 | | | | 176 | | | | 216 | |
| | | | 154 | | | | 194 | | | | 423 | | | | 596 | | | | 630 | |
| | | | 0.19 | | | | 0.19 | | | | 0.18 | | | | 0.20 | | | | 0.30 | |
| | | | | | | | | | | | | | | | | | | | |
| | | Total | |
| | | 2016 | | | 2015 | | | 2014 | | | 2013 | | | 2012 | |
| | | | | | | | | | | | | | | | | | | | |
| | | 33 | | | | 38 | | | | 61 | | | | 69 | | | | 66 | |
| | | | 123 | | | | 113 | | | | 99 | | | | 81 | | | | 62 | |
| | | 156 | | | | 151 | | | | 160 | | | | 150 | | | | 128 | |
| | | 249 | | | | 206 | | | | 214 | | | | 294 | | | | 319 | |
| | | | 27 | | | | 35 | | | | 50 | | | | 41 | | | | 29 | |
| | | 432 | | | | 392 | | | | 424 | | | | 485 | | | | 476 | |
| | | | 1,682 | | | | 1,660 | | | | 1,542 | | | | 1,485 | | | | 1,460 | |
| | | | 2,114 | | | | 2,052 | | | | 1,966 | | | | 1,970 | | | | 1,936 | |
| | | | | | | | | | | | | | | | | | | | |
| | | | | | | | | | | | | | | | | | | | |
| | | 17.4 | | | | 18.2 | | | | 18.3 | | | | 17.5 | | | | 15.0 | |
| | | 16.6 | | | | 16.5 | | | | 14.9 | | | | 14.3 | | | | 13.0 | |
| | | | 17.9 | | | | 19.8 | | | | 22.0 | | | | 19.7 | | | | 16.0 | |
| | | | |
| BMO Financial Group 199th Annual Report 2016 | | | 133 | |
SUPPLEMENTAL INFORMATION
Table 14: Specific Allowances for Credit Losses –
Segmented Information(2)
| | | | | | | | | | | | | | | | | | | | |
($ millions) As at October 31 | | 2016 | | | 2015 | | | 2014 | | | 2013 | | | 2012 | |
Businesses and Governments Specific Allowances by Industry | | | | | | | | | | | | | | | | | | | | |
Commercial real estate | | | 13 | | | | 17 | | | | 13 | | | | 46 | | | | 79 | |
Construction (non-real estate) | | | 4 | | | | 8 | | | | 16 | | | | 26 | | | | 22 | |
Retail trade | | | 12 | | | | 23 | | | | 8 | | | | 13 | | | | 17 | |
Wholesale trade | | | 31 | | | | 19 | | | | 10 | | | | 25 | | | | 6 | |
Agriculture | | | 19 | | | | 6 | | | | 8 | | | | 9 | | | | 11 | |
Communications | | | 1 | | | | 9 | | | | – | | | | – | | | | 1 | |
Manufacturing | | | 36 | | | | 38 | | | | 33 | | | | 36 | | | | 67 | |
Mining | | | 1 | | | | 1 | | | | 10 | | | | 3 | | | | – | |
Oil and gas | | | 45 | | | | 2 | | | | – | | | | 1 | | | | 2 | |
Transportation | | | 9 | | | | 5 | | | | 2 | | | | 4 | | | | 2 | |
Utilities | | | 3 | | | | – | | | | – | | | | – | | | | 1 | |
Forest products | | | 1 | | | | 2 | | | | 9 | | | | 11 | | | | 15 | |
Service industries | | | 50 | | | | 33 | | | | 100 | | | | 59 | | | | 75 | |
Financial institutions | | | 10 | | | | 3 | | | | 2 | | | | 29 | | | | 8 | |
Government | | | – | | | | – | | | | – | | | | 1 | | | | 1 | |
Other | | | 14 | | | | 40 | | | | 3 | | | | 31 | | | | 12 | |
Total specific allowances for credit losses on businesses and governments loans (1) | | | 249 | | | | 206 | | | | 214 | | | | 294 | | | | 319 | |
Table 15: Provision for Credit Losses –
Segmented Information(2)
| | | | | | | | | | | | | | | | | | | | |
($ millions) For the year ended October 31 | | 2016 | | | 2015 | | | 2014 | | | 2013 | | | 2012 | |
Consumer | | | | | | | | | | | | | | | | | | | | |
Residential mortgages | | | 24 | | | | 11 | | | | 77 | | | | 129 | | | | 132 | |
Cards | | | 264 | | | | 272 | | | | 268 | | | | 305 | | | | 355 | |
Consumer instalment and other personal loans | | | 246 | | | | 225 | | | | 251 | | | | 313 | | | | 387 | |
Total consumer | | | 534 | | | | 508 | | | | 596 | | | | 747 | | | | 874 | |
Businesses and Governments | | | | | | | | | | | | | | | | | | | | |
Commercial real estate | | | (16 | ) | | | (37 | ) | | | (141 | ) | | | (185 | ) | | | (108 | ) |
Construction (non-real estate) | | | 15 | | | | – | | | | 7 | | | | 36 | | | | (14 | ) |
Retail trade | | | 13 | | | | 8 | | | | 1 | | | | (4 | ) | | | – | |
Wholesale trade | | | 11 | | | | 19 | | | | 29 | | | | 10 | | | | (16 | ) |
Agriculture | | | 56 | | | | 3 | | | | 15 | | | | 8 | | | | 4 | |
Communications | | | 2 | | | | 13 | | | | – | | | | (6 | ) | | | (5 | ) |
Manufacturing | | | 29 | | | | 67 | | | | 44 | | | | 2 | | | | 25 | |
Mining | | | 20 | | | | 2 | | | | 7 | | | | 2 | | | | (1 | ) |
Oil and gas | | | 105 | | | | 25 | | | | – | | | | – | | | | – | |
Transportation | | | 56 | | | | (4 | ) | | | 10 | | | | (9 | ) | | | 5 | |
Utilities | | | 3 | | | | – | | | | – | | | | – | | | | – | |
Forest products | | | (1 | ) | | | – | | | | (1 | ) | | | 3 | | | | 7 | |
Service industries | | | 21 | | | | (29 | ) | | | 80 | | | | (37 | ) | | | 23 | |
Financial institutions | | | (7 | ) | | | 8 | | | | (34 | ) | | | (15 | ) | | | (29 | ) |
Government | | | – | | | | (2 | ) | | | (3 | ) | | | (6 | ) | | | – | |
Other | | | (26 | ) | | | 31 | | | | (49 | ) | | | 51 | | | | (4 | ) |
Total businesses and governments | | | 281 | | | | 104 | | | | (35 | ) | | | (150 | ) | | | (113 | ) |
Total specific provisions | | | 815 | | | | 612 | | | | 561 | | | | 597 | | | | 761 | |
Collective provision for credit losses | | | – | | | | – | | | | – | | | | (10 | ) | | | 3 | |
Total provision for credit losses | | | 815 | | | | 612 | | | | 561 | | | | 587 | | | | 764 | |
Performance Ratios (%) | | | | | | | | | | | | | | | | | | | | |
PCL-to-average net loans and acceptances (3) (4) | | | 0.23 | | | | 0.19 | | | | 0.19 | | | | 0.22 | | | | 0.31 | |
PCL-to-segmented average net loans and acceptances (4) | | | | | | | | | | | | | | | | | | | | |
Consumer | | | 0.21 | | | | 0.30 | | | | 0.37 | | | | 0.49 | | | | 0.62 | |
Businesses and governments | | | 0.25 | | | | 0.05 | | | | (0.06 | ) | | | (0.18 | ) | | | (0.15 | ) |
Specific PCL-to-average net loans and acceptances | | | 0.23 | | | | 0.19 | | | | 0.19 | | | | 0.23 | | | | 0.31 | |
| | (1) | Amounts for 2016 exclude specific allowances of $1 million related to Other Credit Instruments (2015 – $4 million, 2014 – $23 million, 2013 – $21 million, 2012 – $19 million) included in Other Liabilities. |
| | (2) | Fiscal 2013 and 2012 balances were reclassified in 2014 to conform to the current period’s presentation. |
| | (3) | Ratios are presented including purchased portfolios and prior periods have been restated. |
| | (4) | Certain balances and ratios for fiscal 2012 were restated in 2013 to conform to the current period’s presentation. |
| | |
| 134 | | BMO Financial Group 199th Annual Report 2016 |
Table 16: Risk-Weighted Assets
| | | | | | | | | | | | | | | | | | | | | | | | | | | | | | | | | | | | | | | | | | | | | | | | |
| | | Basel III | |
| | | Exposure at Default | | | Risk-weighted assets | | | Exposure at Default | | | Risk-weighted assets | |
($ millions) As at October 31 | | Standardized
Approach | | | Advanced
Approach | | | 2016 Total | | | Standardized Approach | | | Advanced Approach (2) | | | 2016 Total | | | Standardized
Approach | | | Advanced
Approach | | | 2015 Total | | | Standardized Approach | | | Advanced
Approach (2) | | | 2015 Total | |
Credit Risk | | | | | | | | | | | | | | | | | | | | | | | | | | | | | | | | | | | | | | | | | | | | | | | | |
Wholesale | | | | | | | | | | | | | | | | | | | | | | | | | | | | | | | | | | | | | | | | | | | | | | | | |
Corporate, including specialized lending | | | 22,074 | | | | 242,454 | | | | 264,528 | | | | 22,154 | | | | 82,334 | | | | 104,488 | | | | 19,583 | | | | 218,409 | | | | 237,992 | | | | 19,260 | | | | 72,229 | | | | 91,489 | |
Corporate small andmedium-sized enterprises | | | – | | | | 64,409 | | | | 64,409 | | | | – | | | | 33,755 | | | | 33,755 | | | | – | | | | 64,525 | | | | 64,525 | | | | – | | | | 31,954 | | | | 31,954 | |
Sovereign | | | 122 | | | | 87,124 | | | | 87,246 | | | | 64 | | | | 1,912 | | | | 1,976 | | | | 172 | | | | 75,324 | | | | 75,496 | | | | 94 | | | | 1,671 | | | | 1,765 | |
Bank | | | 264 | | | | 40,734 | | | | 40,998 | | | | 264 | | | | 4,222 | | | | 4,486 | | | | 344 | | | | 34,964 | | | | 35,308 | | | | 341 | | | | 3,561 | | | | 3,902 | |
Retail | | | | | | | | | | | | | | | | | | | | | | | | | | | | | | | | | | | | | | | | | | | | | | | | |
Residential mortgages, excluding home equity line of credit | | | 2,594 | | | | 99,076 | | | | 101,670 | | | | 1,349 | | | | 6,766 | | | | 8,115 | | | | 3,425 | | | | 104,031 | | | | 107,456 | | | | 1,740 | | | | 6,687 | | | | 8,427 | |
Home equity line of credit | | | 431 | | | | 39,177 | | | | 39,608 | | | | 306 | | | | 5,829 | | | | 6,135 | | | | 592 | | | | 42,665 | | | | 43,257 | | | | 416 | | | | 7,473 | | | | 7,889 | |
Qualifying revolving retail | | | – | | | | 34,016 | | | | 34,016 | | | | – | | | | 5,110 | | | | 5,110 | | | | – | | | | 32,109 | | | | 32,109 | | | | – | | | | 4,569 | | | | 4,569 | |
Other retail, excluding small and medium-sized enterprises | | | 2,395 | | | | 35,154 | | | | 37,549 | | | | 1,567 | | | | 10,367 | | | | 11,934 | | | | 2,557 | | | | 20,638 | | | | 23,195 | | | | 1,624 | | | | 9,429 | | | | 11,053 | |
Retail small and medium-sized enterprises | | | 7,135 | | | | 4,064 | | | | 11,199 | | | | 5,427 | | | | 2,269 | | | | 7,696 | | | | 277 | | | | 2,890 | | | | 3,167 | | | | 210 | | | | 1,758 | | | | 1,968 | |
Equity | | | – | | | | 2,122 | | | | 2,122 | | | | – | | | | 1,403 | | | | 1,403 | | | | – | | | | 1,965 | | | | 1,965 | | | | – | | | | 1,369 | | | | 1,369 | |
Trading book | | | 261 | | | | 145,411 | | | | 145,672 | | | | 261 | | | | 9,414 | | | | 9,675 | | | | 165 | | | | 150,876 | | | | 151,041 | | | | 165 | | | | 8,250 | | | | 8,415 | |
Securitization | | | – | | | | 23,269 | | | | 23,269 | | | | – | | | | 1,878 | | | | 1,878 | | | | – | | | | 29,178 | | | | 29,178 | | | | – | | | | 2,456 | | | | 2,456 | |
Other credit risk assets – non-counterparty managed assets | | | – | | | | 24,328 | | | | 24,328 | | | | – | | | | 16,197 | | | | 16,197 | | | | – | | | | 20,329 | | | | 20,329 | | | | – | | | | 16,255 | | | | 16,255 | |
Scaling factor for credit risk assets under AIRB Approach (1) | | | – | | | | – | | | | – | | | | – | | | | 9,651 | | | | 9,651 | | | | – | | | | – | | | | – | | | | – | | | | 8,874 | | | | 8,874 | |
Total Credit Risk | | | 35,276 | | | | 841,338 | | | | 876,614 | | | | 31,392 | | | | 191,107 | | | | 222,499 | | | | 27,115 | | | | 797,903 | | | | 825,018 | | | | 23,850 | | | | 176,535 | | | | 200,385 | |
Market Risk | | | – | | | | – | | | | – | | | | 1,211 | | | | 7,751 | | | | 8,962 | | | | – | | | | – | | | | – | | | | 1,142 | | | | 9,120 | | | | 10,262 | |
Operational Risk | | | – | | | | – | | | | – | | | | 4,982 | | | | 25,520 | | | | 30,502 | | | | – | | | | – | | | | – | | | | 4,033 | | | | 24,505 | | | | 28,538 | |
Common Equity Tier 1 (CET 1) Capital Risk-Weighted Assets before Capital Floor | | | 35,276 | | | | 841,338 | | | | 876,614 | | | | 37,585 | | | | 224,378 | | | | 261,963 | | | | 27,115 | | | | 797,903 | | | | 825,018 | | | | 29,025 | | | | 210,160 | | | | 239,185 | |
Basel I Capital Floor | | | | | | | | | | | | | | | – | | | | 15,599 | | | | 15,599 | | | | | | | | | | | | | | | | – | | | | 504 | | | | 504 | |
Common Equity Tier 1 (CET 1) Capital Risk-Weighted Assets | | | | | | | | | | | | | | | 37,585 | | | | 239,977 | | | | 277,562 | | | | | | | | | | | | | | | | 29,025 | | | | 210,664 | | | | 239,689 | |
Tier 1 Capital Risk-Weighted Assets before Credit Valuation Adjustment (CVA) and Capital Floor | | | | | | | | | | | | | | | | | | | 224,378 | | | | 261,963 | | | | | | | | | | | | | | | | | | | | 210,160 | | | | 239,185 | |
Additional CVA adjustment, prescribed by OSFI, for Tier 1 Capital | | | – | | | | – | | | | – | | | | – | | | | 380 | | | | 380 | | | | – | | | | – | | | | – | | | | – | | | | 286 | | | | 286 | |
Basel I Capital Floor | | | – | | | | – | | | | – | | | | – | | | | 15,219 | | | | 15,219 | | | | – | | | | – | | | | – | | | | – | | | | 218 | | | | 218 | |
Tier 1 Capital Risk-Weighted Assets | | | | | | | | | | | | | | | 37,585 | | | | 239,977 | | | | 277,562 | | | | | | | | | | | | | | | | 29,025 | | | | 210,664 | | | | 239,689 | |
Total Capital Risk-Weighted Assets before CVA and Capital Floor | | | | | | | | | | | | | | | | | | | 224,378 | | | | 261,963 | | | | | | | | | | | | | | | | – | | | | 210,160 | | | | 239,185 | |
Additional CVA adjustment, prescribed by OSFI, for Total Capital | | | – | | | | – | | | | – | | | | – | | | | 705 | | | | 705 | | | | – | | | | – | | | | – | | | | – | | | | 531 | | | | 531 | |
Basel I Capital Floor | | | – | | | | – | | | | – | | | | – | | | | 14,894 | | | | 14,894 | | | | – | | | | – | | | | – | | | | – | | | | – | | | | – | |
Total Capital Risk-Weighted Assets | | | | | | | | | | | | | | | 37,585 | | | | 239,977 | | | | 277,562 | | | | | | | | | | | | | | | | 29,025 | | | | 210,691 | | | | 239,716 | |
| | (1) | The scaling factor is applied to the risk-weighted assets amounts for credit risk under the AIRB Approach. |
| | (2) | Comparative figures have been amended. |
Table 17: Average Deposits
| | | | | | | | | | | | | | | | | | | | | | | | |
| | | 2016 | | | 2015 | | | 2014 | |
| ($ millions, except as noted) | | Average
balance | | | Average
rate paid (%) | | | Average
balance | | | Average
rate paid (%) | | | Average
balance | | | Average
rate paid (%) | |
Deposits Booked in Canada | | | | | | | | | | | | | | | | | | | | | | | | |
Demand deposits – interest bearing | | | 19,493 | | | | 0.33 | | | | 18,910 | | | | 0.36 | | | | 16,469 | | | | 0.45 | |
Demand deposits – non-interest bearing | | | 37,296 | | | | – | | | | 31,762 | | | | – | | | | 26,702 | | | | – | |
Payable after notice | | | 77,231 | | | | 0.44 | | | | 76,458 | | | | 0.57 | | | | 76,903 | | | | 0.70 | |
Payable on a fixed date | | | 136,821 | | | | 1.35 | | | | 120,764 | | | | 1.35 | | | | 118,094 | | | | 1.44 | |
Total deposits booked in Canada | | | 270,841 | | | | 0.83 | | | | 247,894 | | | | 0.86 | | | | 238,168 | | | | 0.97 | |
Deposits Booked in the United States and Other Countries | | | | | | | | | | | | | | | | | | | | | | | | |
Banks located in the United States and other countries (1) | | | 26,209 | | | | 0.55 | | | | 23,952 | | | | 0.36 | | | | 19,374 | | | | 0.34 | |
Governments and institutions in the United States and other countries | | | 6,867 | | | | 0.36 | | | | 6,804 | | | | 0.24 | | | | 4,216 | | | | 0.19 | |
Other demand deposits | | | 17,346 | | | | 0.02 | | | | 16,109 | | | | 0.01 | | | | 12,744 | | | | 0.02 | |
Other deposits payable after notice or on a fixed date | | | 147,460 | | | | 0.40 | | | | 140,709 | | | | 0.31 | | | | 124,089 | | | | 0.38 | |
Total deposits booked in the United States and other countries | | | 197,882 | | | | 0.38 | | | | 187,574 | | | | 0.29 | | | | 160,423 | | | | 0.35 | |
Total average deposits | | | 468,723 | | | | 0.64 | | | | 435,468 | | | | 0.62 | | | | 398,591 | | | | 0.72 | |
As at October 31, 2016, 2015 and 2014: deposits by foreign depositors in our Canadian bank offices amounted to $52,834 million, $37,477 million and $30,622 million, respectively; total deposits payable after notice included $30,122 million, $29,104 million and $33,109 million, respectively, of chequing accounts that would have been classified as demand deposits under U.S. reporting requirements; and total deposits payable on a fixed date included $35,460 million, $25,926 million and $17,738 million, respectively, of federal funds purchased, commercial paper issued and other deposit liabilities. These amounts would have been classified as short-term borrowings for U.S. reporting purposes.
| | (1) | Includes regulated and central banks. |
Certain comparative figures have been reclassified to conform with the current year’s presentation.
| | | | |
| BMO Financial Group 199th Annual Report 2016 | | | 135 | |
GLOSSARY OF FINANCIAL TERMS
Glossary of Financial Terms
Adjusted Earnings and Measures present results adjusted to exclude the impact of certain items, as set out in the Non-GAAP Measures section. Management considers both reported and adjusted results to be useful in assessing underlying ongoing business performance.
Allowance for Credit Losses represents an amount deemed adequate by management to absorb credit-related losses on loans and acceptances and other credit instruments. Allowances for credit losses can be specific or collective and are recorded on the balance sheet as a deduction from loans and acceptances or, as they relate to credit instruments, as other liabilities.
Pages 91, 113, 153
Assets under Administration and under Management refers to assets administered or managed by a financial institution that are beneficially owned by clients and therefore not reported on the balance sheet of the administering or managing financial institution.
Asset-Backed Commercial Paper (ABCP) is a short-term investment. The commercial paper is backed by physical assets such as trade receivables, and is generally used for short-term financing needs.
Pages 77, 104
Average Earning Assets represents the daily or monthly average balance of deposits with other banks and loans and securities, over a one-year period.
Bankers’ Acceptances (BAs) are bills of exchange or negotiable instruments drawn by a borrower for payment at maturity and accepted by a bank. BAs constitute a guarantee of payment by the bank and can be traded in the money market. The bank earns a “stamping fee” for providing this guarantee.
Basis Point is one one-hundredth of a percentage point.
Business Risk arises from the specific business activities of an enterprise and the effects these could have on its earnings.
Page 111
Collective Allowance is maintained to cover impairment in the existing portfolio for loans that have not yet been individually identified as impaired. Our approach to establishing and maintaining the collective allowance is based on the requirements of IFRS, considering guidelines issued by our regulator, OSFI. The collective allowance is assessed on a quarterly basis and a number of factors are considered when determining its level, including the long-run expected loss amount and management’s credit judgment with respect to current macroeconomic and portfolio conditions.
Pages 42, 91, 154
Common Equity Tier 1 (CET1) capitalis comprised of common shareholders’ equity less deductions for goodwill, intangible assets, defined benefit pension assets, certain deferred tax assets and certain other items.
Pages 71, 184
Common Equity Tier 1 Ratio reflects CET1 capital divided by risk-weighted assets for CET1.
Pages 35, 71, 73, 185
Common Shareholders’ Equity is the most permanent form of capital. For regulatory capital purposes, common shareholders’ equity is comprised of common shareholders’ equity, net of capital deductions.
Corporate Support Areas (CSAs) provide enterprise-wide expertise and governance in a variety of areas including Technology and Operations (T&O), strategic planning, risk management, finance, legal and regulatory compliance, marketing, communications and human resources.
Pages 62, 84
Credit and Counterparty Risk is the potential for loss due to the failure of a borrower, endorser, guarantor or counterparty to repay a loan or honour another predetermined financial obligation.
Pages 88, 156
Derivatives are contracts with a value that is “derived” from movements in interest or foreign exchange rates, equity or commodity prices or other indices. Derivatives allow for the transfer, modification or reduction of current or expected risks from changes in rates and prices.
Dividend Payout Ratio represents common share dividends as a percentage of net income available to common shareholders. It is computed by dividing dividends per share by basic earnings per share.
Earnings Per Share (EPS) is calculated by dividing net income attributable to bank shareholders, after the deduction of preferred dividends, by the average number of common shares outstanding. Diluted EPS, which is our basis for measuring performance, adjusts for possible conversions of financial instruments into common shares if those conversions would reduce EPS. Adjusted EPS is calculated in the same manner using adjusted net income.
Pages 34, 194
Earnings Sensitivity is a measure of the impact of potential changes in interest rates on the projected12-month pre-tax net income of a portfolio of assets, liabilities andoff-balance sheet positions in response to prescribed parallel interest rate movements.
Page 99
Economic Capital is an expression of the enterprise’s capital demand requirement relative to the bank’s
view of the economic risks in its underlying business activities. It represents management’s estimation of the likely magnitude of economic losses that could occur across several different risk types and allows returns to be measured on a consistent basis across such risks. Economic Capital is calculated for various types of risk, including credit, market (trading and non-trading), operational and business, based on a one-year time horizon using a defined confidence level.
Pages 74, 87
Economic Value Sensitivity is a measure of the impact of potential changes in interest rates on the market value of a portfolio of assets, liabilities and off-balance sheet positions in response to prescribed parallel interest rate movements.
Page 99
Efficiency Ratio (or Expense-to- Revenue Ratio) is a key measure of productivity. It is calculated as non-interest expense divided by total revenue, expressed as a percentage. The adjusted efficiency ratio is calculated in the same manner, utilizing adjusted total revenue and non-interest expense.
Page 43
Environmental and Social Risk is the potential for loss or damage to BMO’s reputation resulting from environmental or social concerns related to BMO or its customers. Environmental and social risk is often associated with credit, operational and reputation risk.
Page 112
Fair Value is the amount of consideration that would be agreed upon in an arm’s-length transaction between knowledgeable, willing parties who are under no compulsion to act.
Forwards and Futures are contractual agreements to either buy or sell a specified amount of a currency, commodity, interest-rate-sensitive financial instrument or security at a specified price and date in the future. Forwards are customized contracts transacted in the over-the-counter market. Futures are transacted in standardized amounts on regulated exchanges and are subject to daily cash margining.
Page 161
Hedging is a risk management technique used to neutralize, manage or offset interest rate, foreign currency, equity, commodity or credit exposures arising from normal banking activities.
Impaired Loans are loans for which there is no longer reasonable assurance of the timely collection of principal or interest.
Innovative Tier 1 Capital is a form of Tier 1 capital issued by structured entities that can be included in calculating a bank’s Tier 1 Capital Ratio,
Total Capital Ratio and Leverage Ratio. Under Basel III, Innovative Tier 1 Capital is non-qualifying and is part of the grandfathered capital being phased out between 2013 and 2022.
Insurance Risk is the potential for loss as a result of actual experience being different from that assumed when an insurance product was designed and priced. It generally entails the inherent unpredictability that can arise from assuming long-term policy liabilities or from the uncertainty of future events. Insurance risk is inherent in all our insurance products, including annuities and life, accident and sickness, and creditor insurance, as well as in our reinsurance business.
Page 109
Legal and Regulatory Risk is the potential for loss or harm that arises from legislation, contracts, non-contractual rights and obligations, and disputes. This includes the risks of failing to: comply with the law (in letter or in spirit) or maintain standards of care; implement legislative or regulatory requirements; enforce or comply with contractual terms; assert non-contractual rights; effectively manage disputes; or act in a manner so as to maintain our reputation.
Page 110
Leverage Ratio is defined as Tier 1 capital divided by the sum of on-balance sheet items and specified off-balance sheet items, net of specified adjustments.
Page 71
Liquidity and Funding Risk is the potential for loss if BMO is unable to meet financial commitments in a timely manner at reasonable prices as they fall due. Financial commitments include liabilities to depositors and suppliers, and lending, investment and pledging commitments.
Pages 100, 158
Market Risk is the potential for adverse changes in the value of BMO’s assets and liabilities resulting from changes in market variables such as interest rates, foreign exchange rates, equity and commodity prices and their implied volatilities, and credit spreads, and includes the risk of credit migration and default in our trading book.
Pages 95, 158
Mark-to-Market represents the valuation of financial instruments at market rates as of the balance sheet date, where required by accounting rules.
Model Risk is the potential for adverse consequences following from decisions based on incorrect or misused model outputs. These adverse consequences can include financial loss, poor business decision-making or damage to reputation.
Page 107
| | |
| 206 | | BMO Financial Group 199th Annual Report 2016 |
Net Interest Income is comprised of earnings on assets, such as loans and securities, including interest and dividend income and BMO’s share of income from investments accounted for using the equity method of accounting, less interest expense paid on liabilities, such as deposits.
Page 39
Net Interest Margin is the ratio of net interest income to average earning assets, expressed as a percentage or in basis points. Net interest margin is sometimes computed using total assets.
Page 39
Net Non-Interest Revenue is non-interest revenue, net of insurance claims, commissions and changes in policy benefit liabilities.
Notional Amount refers to the principal amount used to calculate interest and other payments under derivative contracts. The principal amount does not change hands under the terms of a derivative contract, except in the case of cross-currency swaps.
Off-Balance Sheet Financial Instruments consist of a variety of financial arrangements offered to clients, which include credit derivatives, written put options, backstop liquidity facilities, standby letters of credit, performance guarantees, credit enhancements, commitments to extend credit, securities lending, documentary and commercial letters of credit, and other indemnifications.
Office of the Superintendent of Financial Institutions Canada (OSFI) is the government agency responsible for regulating banks, insurance companies, trust companies, loan companies and pension plans in Canada.
Operating Leverage is the difference between revenue and expense growth rates. Adjusted operating leverage is the difference between adjusted revenue and adjusted expense growth rates.
Page 43
Operational Risk is the potential for loss resulting from inadequate or failed internal processes or systems, human interactions or external events, but excludes business risk, credit risk and market risk.
Page 106
Options are contractual agreements that convey to the purchaser the right but not the obligation to either buy or sell a specified amount of a currency, commodity, interest-rate-sensitive financial instrument or security at a fixed future date or at any time within a fixed future period.
Page 161
Provision for Credit Losses is a charge to income that represents an amount deemed adequate by management to fully provide for impairment in a portfolio of loans and acceptances and other credit instruments, given the composition of the portfolio, the probability of
default, the economic environment and the allowance for credit losses already established.
Pages 42, 91, 154
Reputation Risk is the potential for a negative impact on BMO that results from the deterioration of BMO’s reputation. Potential negative impacts include revenue loss, a decline in customer loyalty, litigation, regulatory sanctions or additional regulatory oversight, and a decline in BMO’s share price.
Page 112
Return on Equity or Return on Common Shareholders’ Equity (ROE) is calculated as net income, less non-controlling interest in subsidiaries and preferred dividends, as a percentage of average common shareholders’ equity. Common shareholders’ equity is comprised of common share capital, contributed surplus, accumulated other comprehensive income (loss) and retained earnings. Adjusted ROE is calculated using adjusted net income rather than net income.
Page 35
Return on Tangible Common Equity (ROTCE) is calculated as net income available to common shareholders adjusted for amortization of intangibles as a percentage of average tangible common equity. Adjusted ROTCE is calculated using adjusted net income rather than net income.
Page 35
Risk-Weighted Assets (RWA) measure a bank’s exposures, weighted for their relative risk and calculated in accordance with OSFI’s regulatory capital rules. RWA is calculated for credit, market (trading) and operational risk categories based on OSFI’s prescribed rules.
Page 71
Securities Borrowed or Purchased under Resale Agreements are low-cost, low-risk instruments, often supported by the pledge of cash collateral, which arise from transactions that involve the borrowing or purchasing of securities.
Securities Lent or Sold under Repurchase Agreements are low-cost, low-risk liabilities, often supported by cash collateral, which arise from transactions that involve the lending or selling of securities.
Securitization is the practice of selling pools of contractual debts, such as residential mortgages, commercial mortgages, auto loans and credit card debt obligations, to third parties.
Page 159
Specific Allowances reduce the carrying value of individually identified impaired loans to the amount we expect to recover if there is evidence of deterioration in credit quality.
Pages 91, 153
Strategic Risk is the potential for loss due to fluctuations in the external business environment and/
or the failure to properly respond to these fluctuations as a result of inaction, ineffective strategies or poor implementation of strategies.
Page 111
Stressed Value at Risk (SVaR) is measured for specific classes of risk in BMO’s trading and underwriting activities related to interest rates, foreign exchange rates, credit spreads, equity and commodity prices and their implied volatilities, where model inputs are calibrated to historical data from a period of significant financial stress. This measure calculates the maximum loss likely to be experienced in the trading and underwriting portfolios, measured at a 99% confidence level over a specified holding period.
Pages 95, 96
Structured Entities (SEs) include entities for which voting or similar rights are not the dominant factor in determining control of the entity. We are required to consolidate an SE if we control the entity by having power over the entity, exposure to variable returns as a result of our involvement and the ability to exercise power to affect the amount of our returns.
Pages 78, 159
Swaps are contractual agreements between two parties to exchange a series of cash flows. The various swap agreements that we enter into are as follows:
• Commodity swaps – counterparties generally exchange fixed and floating rate payments based on a notional value of a single commodity.
• Credit default swaps – one counterparty pays the other a fee in exchange for that other counterparty agreeing to make a payment if a credit event occurs, such as bankruptcy or failure to pay.
• Cross-currency interest rate swaps – fixed and/or floating rate interest payments and principal amounts are exchanged in different currencies.
• Cross-currency swaps – fixed rate interest payments and principal amounts are exchanged in different currencies.
• Equity swaps – counterparties exchange the return on an equity security or a group of equity securities for the return based on a fixed or floating interest rate or the return on another equity security or group of equity securities.
• Interest rate swaps – counterparties generally exchange fixed and floating rate interest payments based on a notional value in a single currency.
Page 161
Tangible Common Equity is calculated as common shareholders’ equity less goodwill and acquisition- related intangible assets, net of related deferred tax liabilities.
Page 35
Taxable Equivalent Basis (teb): Revenues of operating groups are presented in our MD&A on a taxable equivalent basis (teb). Revenue and the provision for income taxes are increased on tax-exempt securities to an equivalent before-tax basis to facilitate comparisons of income between taxable and tax-exempt sources.
Pages 38, 198
Tier 1 Capital is comprised of CET1 capital, preferred shares and innovative hybrid instruments, less certain regulatory deductions.
Pages 71, 184
Tier 1 Capital Ratio reflects Tier 1 capital divided by Tier 1 capital risk-weighted assets.
Pages 71, 185
Total Capital includes Tier 1 and Tier 2 capital.Tier 2 capital is primarily comprised of subordinated debentures and may include a portion of the collective and individual allowances for credit losses, less certain regulatory deductions.
Pages 71, 185
Total Capital Ratio reflects Total capital divided by Total capital risk-weighted assets.
Pages 71, 185
Total Shareholder Return: The three-year and five-year average annual total shareholder return (TSR) represents the average annual total return earned on an investment in BMO common shares made at the beginning of a three-year and five-year period, respectively. The return includes the change in share price and assumes that dividends received were reinvested in additional common shares. The one-year TSR also assumes that dividends were reinvested in shares.
Page 32
Trading-Related Revenues include net interest income and non-interest revenue earned from on- and off-balance sheet positions undertaken for trading purposes. The management of these positions typically includes marking them to market on a daily basis. Trading-related revenues also include income (expense) and gains (losses) from both on-balance sheet instruments and interest rate, foreign exchange (including spot positions), equity, commodity and credit contracts.
Page 41
Value at Risk (VaR) is measured for specific classes of risk in BMO’s trading and underwriting activities related to interest rates, foreign exchange rates, credit spreads, equity and commodity prices and their implied volatilities. This measure calculates the maximum loss likely to be experienced in the trading and underwriting portfolios, measured at a 99% confidence level over a specified holding period.
Pages 95, 96
| | | | |
| BMO Financial Group 199th Annual Report 2016 | | | 207 | |