Registration Statement No. 333-217200
Filed Pursuant to Rule 433

Introducing MLPs, BMLP & The Dorsey Wright MLP Index 1 Brought to you by REX Shares & Nasdaq Dorsey Wright October 24 th , 2019

Speakers 2 Scott Acheychek President at REX Shares Michael Tanney Director at Magnus Financial Group LLC Ben Jones Senior Analyst at Nasdaq Dorsey Wright

What is an MLP? 3 Sponsor General Partner 100% MLP Limited Partner 98% LP Public Unit Holders Minimum Quarterly Distribution Source: Royal Bank of Canada, Latham & Watkins Minimum Quarterly Distribution – a specified minimum level of distribution made each quarter Incentive Distribution Right – the general partner’s right to an increasing share of cash distributions as certain cash distribu tion benchmarks for the limited partners are achieved Operating Company 100% Assets Lenders 2% GP Incentive Distribution Rights MLP Structure • An MLP is a partnership that is publicly traded and listed on a national securities exchange. • An MLP generally has two classes of partners: Limited Partners (LPs) and General Partner (GP) • Limited Partners (LPs) • Have a passive interest with limited rights • Are entitled to cash distributions • When LP interests are issued, it provides equity capital to grow the MLP • General Partner (GP) • Manages the partnership • Typically retains 2% of the ownership of the MLP What is a Master Limited Partnership (MLP)?

MLP Distributions 4 • To avoid being treated as a corporation for U.S. federal income tax purposes, the MLP must generate 90% of its income from qualifying sources, which tend to be in energy or real estate related businesses • MLPs typically distribute most or all of their available cash to unit holders • This is a requirement found in the partnership agreement • Not a tax requirement or securities law requirement • Unlike for example, Real Estate Investment Trusts • MLPs typically are treated as flow - through entities • Distributions are not classified as dividends • Do not pay corporate level federal tax • Must distribute a minimum quarterly distribution from cash flow under the partnership agreement • However, each of the MLP’s partners will be required to report their share of the MLP’s income, gains, losses, deductions and credits Sample Incentive Distribution Rights Table Quarterly Distribution Target Percentage Interest in Distributions Unitholders General Partner Minimum Quarterly Distribution $1.50 98% 2% First Target Distribution up to $2.00 98% 2% Second Target Distribution above $2.00 up to $2.50 85% 15% Third Target Distribution above $2.50 up to $3.00 75% 25% Greater than Third Target Distribution above $3.00 50% 50% MLP Distributions Source: RBC, Latham & Watkins

MLP Industry Concentration 5 • Currently there are 80 MLPs, of which 76% operate in the energy sector • The Oil, Gas & Consumable Fuels MLPs represent 71% of all MLPs and 84% of total MLP market capitalization • Originally deriving income from energy and real estate related services, the qualifying income definition for an MLP now includes gains from: • Industrial carbon dioxide • Alcohol and biodiesel fuel mixture transportation and storage • Alternative fuels • Neat alcohol other than alcohol derived from petroleum, natural gas, or coal or having a proof of less than 190 • Gas • Coal • Neat Biodiesel MLP Industry Information Source: Bloomberg as of September 30, 2019 MLP Sector By Market Capitalization

Direct vs Indirect Investment in MLPs 6 Exchange Traded Note Closed - end fund 1 , exchange traded fund with more than 25% of assets in MLPs Closed - end fund, mutual fund, exchange traded fund with less than 25% of assets in MLPs Master Limited Partnership Tax Structure Senior Unsecured Debt, But Taxed as Derivative Corporation or Trust Regulated Investment Company Partnership Exchange Traded Yes Yes, but not typically Mutual Funds Yes 2 , but not typically Mutual Funds Yes Liquidity Daily Daily Daily 2 Daily Sales Charge No No Yes No Annual Expense Yes Yes Yes No Investment Universe MLP Index MLPs & MLP Affiliates MLPs & MLP Affiliates MLP Principal Investment 100% index match At least 90% index match At least 80% in publicly traded MLP equity & debt 100% in MLP Passively Managed Yes Yes No No Redemption Cost Yes Yes Yes No Potential Risk Factors Market Risk, Credit Risk 3 Market Risk and Manager Risk Market Risk and Manager Risk Market Risk and Lack of Diversification Tracks an Index Yes Yes No No Tracking Error net of Fees No Yes n/a n/a Taxation on Distributions Ordinary Income Return of Capital & Dividend Income 4 Return of Capital, Ordinary Income & Dividend Income Cost Basis Adjustment & Pass - Through Income Entity Level Tax None Prevailing Corporate Tax Rate None None Federal Tax Reporting Form 1099 Form 1099 Form 1099 Schedule K - 1 Generate UBTI 5 No No No Yes Indirect Investment Direct Investment Source: Royal Bank of Canada, Latham & Watkins, Robert W. Baird & Co., Office of the Comptroller of the Currency and Fidelity 1. Closed End Funds are investment structures that invest in a portfolio of securities and are managed. They are “closed” in the sense that capital does not regularly flow into them when investors buy shares, and it does not flow out when investors sell shares. 2. Closed End Funds are an investment structure with shares typically traded in the open market, like stocks or ETFs. 3. Credit Risk – probability that the issuer of a security will default 4. Cost Basis Adjustment – return of capital payments are a reduction to the investor’s cost basis in the MLP 5. UBTI – Unrelated Business Taxable Income or income tax on an investor’s allocable share of the MLP’s income
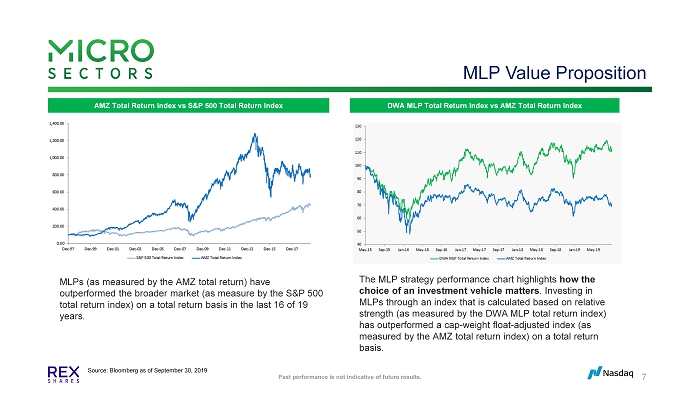
MLP Value Proposition 7 AMZ Total Return Index vs S&P 500 Total Return Index DWA MLP Total Return Index vs AMZ Total Return Index MLPs (as measured by the AMZ total return) have outperformed the broader market (as measure by the S&P 500 total return index) on a total return basis in the last 16 of 19 years. The MLP strategy performance chart highlights how the choice of an investment vehicle matters . Investing in MLPs through an index that is calculated based on relative strength (as measured by the DWA MLP total return index) has outperformed a cap - weight float - adjusted index (as measured by the AMZ total return index) on a total return basis. Source: Bloomberg as of September 30, 2019 Past performance is not indicative of future results.

The Dorsey Wright Difference 8 U.S. MLP Universe Market Cap & Liquidity Screens Dorsey Wright Relative Strength Methodology Select 15 MLPs with Highest Relative Strength Equal Weighted Dorsey Wright MLP Index The Dorsey Wright MLP Index
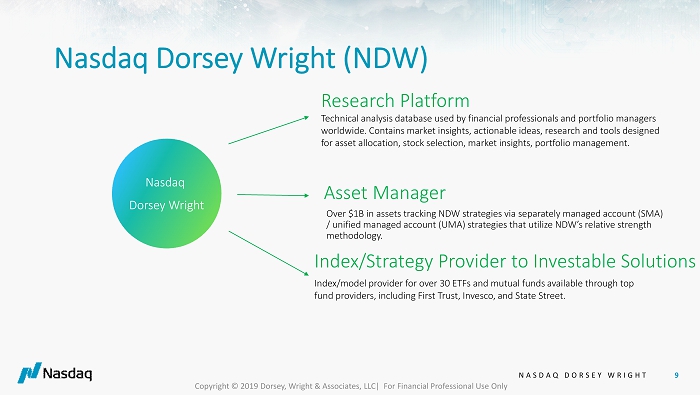
| • | NDW offers three different types of services – Research (through the online Research Platform), Asset Management, Index/Strategy Provider to Investable Solutions. |
NASDAQ DORSEY WRIGHT 9 Nasdaq Dorsey Wright (NDW) Asset Manager Over $1B in assets tracking NDW strategies via separately managed account (SMA) / unified managed account (UMA) strategies that utilize NDW’s relative strength methodology. Research Platform Technical analysis database used by financial professionals and portfolio managers worldwide. Contains market insights, actionable ideas, research and tools designed for asset allocation, stock selection, market insights, portfolio management. Index/Strategy Provider to Investable Solutions Index/model provider for over 30 ETFs and mutual funds available through top fund providers, including First Trust, Invesco, and State Street. Nasdaq Dorsey Wright Copyright © 2019 Dorsey, Wright & Associates, LLC| For Financial Professional Use Only

NDW has a leading market presence. We are known as a leading brand for momentum strategies, as well as being an advisor-centric firm, providing solutions catered to helping the financial advisors through our research tool kit and model or investment solutions. Notable client firms include Wells Fargo, Morgan Stanley, Raymond James, just to name a few, and we work with various ETF and ETN issuers.
NASDAQ DORSEY WRIGHT 10 Research Platform • Leading brand for momentum strategies • Advisor centric research tool - kit and solutions • Models provide scalable solutions for the advisor Some Notable Client Firms Notable Partner Firms NDW’s Leading Market Presence Research Platform & Clients Copyright © 2019 Dorsey, Wright & Associates, LLC| For Financial Professional Use Only
The Opportunity - MLPs are known for providing income and low correlated exposure to US equity markets. However, the sector has faced some headwinds – interest rates? Oil prices? That said, we are beginning to see the MLP sector start to participate to the upside, using one of our indicators - MLP Fund Bullish Percent. While the sector has been beat up, we have seen a growing percentage of MLP funds move back to buy signals.
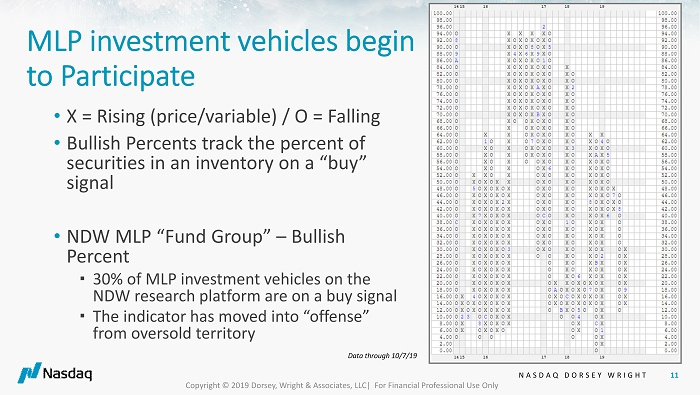
X = Rising (price/variable) / O = Falling
Bullish Percents track the percentage of securities in an inventory on a “buy” signal
30% of MLP funds on the NDW research platform are on a buy signal
The indicator has moved into “offense” from oversold territory
NASDAQ DORSEY WRIGHT 11 MLP investment vehicles begin to Participate • X = Rising (price/variable) / O = Falling • Bullish Percents track the percent of securities in an inventory on a “buy” signal • NDW MLP “Fund Group” – Bullish Percent ▪ 30% of MLP investment vehicles on the NDW research platform are on a buy signal ▪ The indicator has moved into “offense” from oversold territory Copyright © 2019 Dorsey, Wright & Associates, LLC| For Financial Professional Use Only Data through 10/7/19

| • | NDW’s investment process, which allows us to create our game plan, is based on the Point and Figure methodology. |
| • | Trend Analysis – direction of move |
| • | Relative Strength – magnitude of move |
| • | The combination of the two is how we evaluate the markets, and it’s also based on supply and demand by using market price as our primary input |
NASDAQ DORSEY WRIGHT 12 Trend Analysis Measuring Direction of Movement Relative Strength Measuring Magnitude of Movement The DWA Evaluation Process Supply & Demand Copyright © 2019 Dorsey, Wright & Associates, LLC| For Financial Professional Use Only Our Game Plan: The Point & Figure Methodology
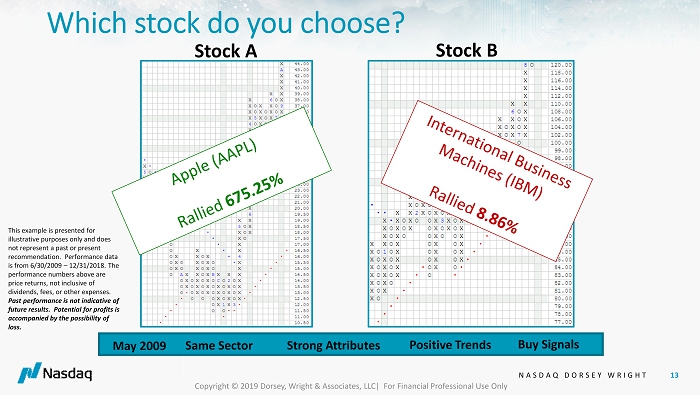
Why do we use relative strength to analyze markets or opportunities? Good example – stock a vs. stock b. Similar characteristics (text on slide) – May 2009 – same sector, strong attributes, positive trends, and were both on point and figure buy signals. Use relative strength to determine which one to own.
NASDAQ DORSEY WRIGHT 13 Stock A Stock B May 2009 Same Sector Strong Attributes Positive Trends Buy Signals This example is presented for illustrative purposes only and does not represent a past or present recommendation. Performance data is from 6/30/2009 – 12/31/2018. The performance numbers above are price returns, not inclusive of dividends, fees, or other expenses. Past performance is not indicative of future results. Potential for profits is accompanied by the possibility of loss. Which stock do you choose? Copyright © 2019 Dorsey, Wright & Associates, LLC| For Financial Professional Use Only
NASDAQ DORSEY WRIGHT 14 Relative Strength Copyright © 2019 Dorsey, Wright & Associates, LLC| For Financial Professional Use Only

| • | Relative Strength provides us with a process of ranking investments – sectors, stocks, ETFs, asset classes, and MLPs. There are other areas in life where we see benefits of a ranking process – NCAA College Basketball. Going back to 1985, you can see that the win loss record of the higher seeded teams in the tournament versus the lower seeded teams is quite significant. |
| • | The top 3 seeds have an average winning percentage of 72%. |
| • | The bottom 3 seeds have an average winning percentage of 7%. |
| • | The last seed (worst ranked) team has only won one game. |
NASDAQ DORSEY WRIGHT 15 • The top 3 seeds have an average winning percentage of 72%. • The bottom 3 seeds have an average winning percentage of 7%. • The last seed (worst ranked) team has only won one game. Copyright © 2019 Dorsey, Wright & Associates, LLC| For Financial Professional Use Only Benefits of a Ranking Process - Sports

The Relative Strength calculation that we employ does not go beyond basic arithmetic, and the end result is nothing more than a ranking system. Think about it like ranking your favorite sports team. Every sport has a ranking system – from golf to tennis to baseball to football – and they are all based upon the same philosophy. The better a player or team performs, the higher they are in the rankings. When they start to lose, they begin to fall in the rankings. We can effect the same type of ranking system based upon how an investment performs relative to others. The more it outperforms the alternatives, the stronger it is for purposes of this analysis. When it begins to lose that strength, it falls in ranking.
The actual relative strength calculation is very simple. We take the price of one investment (stock, ETF, Mutual Fund, Index, etc.) and divide it by another. This number is then multiplied by 100, and then plotted on a Point & Figure chart like those you have just learned about.
NASDAQ DORSEY WRIGHT 16 • All major sports have a ranking system. The Point & Figure Relative Strength tool is the ranking system we use for stocks or ETFs. Daily Relative Strength Calculation : Investment A X 100 = Relative Strength Investment B Reading • This reading is plotted on a Point & Figure chart , the relative strength signal then confirms whether Investment A or Investment B represents the stronger trend (i.e. the potential winner of a game). Relative Strength Calculation Copyright © 2019 Dorsey, Wright & Associates, LLC| For Financial Professional Use Only

Here’s an example of point and figure relative strength – Bank of America versus the equal weighted S&P 500. stock vs. market. Stock versus the average S&P 500 stock. We take the closing price of BAC divided by the closing price of the market, and then track it on a PnF basis. Buy in X’s (BX) = strongest condition, Buy in O’s (BO) = strong but weakening, Sell in O’s (SO) = weakest condition, and Sell in X’s (SX) = weak but strengthening.
(Go over chart) – Chart is on a buy signal, favoring BAC since March 23, 2012. The chart provides an objective way to view the confirmation of relative strength between two securities.
NASDAQ DORSEY WRIGHT 17 Market Relative Strength This example is presented for illustrative purposes only and does not represent a past or present recommendation. The performance numbers are price returns, not inclusive of dividends, fees, or other expenses. Investors cannot invest directly in an Index like the SPX or SPXEWI. These indexes have no fees. Past performance is not indicative of future results. Potential for profits is accompanied by the possibility of loss Bank of America (BAC) vs. S&P Equal Weighted Index (SPXEWI) With Negative RS… (11/12/08 – 3/12/09) BAC: - 65.59% SPXEWI: - 10.70% SPX: - 11.92% With Positive RS… (3/12/09 – 8/10/10) BAC: 132.99% SPXEWI: 79.68% SPX: 49.33% With Negative RS. . . (8/10/10 – 3/23/12) BAC: - 27.73% SPXEWI: 25.84% SPX: 24.62% With Positive RS… (3/23/12 – 09/11/19) BAC: 199.09% SPXEWI: 111.24% SPX: 114.80% vs. Copyright © 2019 Dorsey, Wright & Associates, LLC| For Financial Professional Use Only
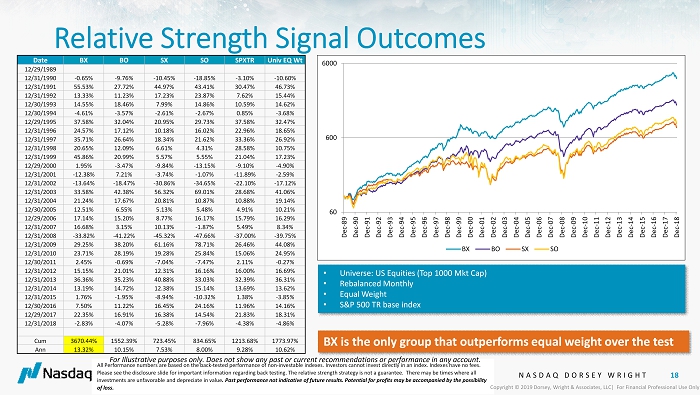
So why Point and Figure Relative Strength RS? Because through research and experience, we have seen PnF RS work over time. Based on a study performed by John Lewis, Portfolio Manager at NDW, the strongest stocks often outperform the market as well as the weaker stocks. In the study, we looked at the top 1000 market cap stocks, compared the stocks to the market, and evaluated the RS monthly. Created four portfolios based on the RS Conditions (BX, BO, SX, SO). BX is the only group that outperforms EW over the time period.
NASDAQ DORSEY WRIGHT 18 Relative Strength Signal Outcomes Date BX BO SX SO SPXTR Univ EQ Wt 12/29/1989 12/31/1990 - 0.65% - 9.76% - 10.45% - 18.85% - 3.10% - 10.60% 12/31/1991 55.53% 27.72% 44.97% 43.41% 30.47% 46.73% 12/31/1992 13.33% 11.23% 17.23% 23.87% 7.62% 15.44% 12/30/1993 14.55% 18.46% 7.99% 14.86% 10.59% 14.62% 12/30/1994 - 4.61% - 3.57% - 2.61% - 2.67% 0.85% - 3.68% 12/29/1995 37.58% 32.04% 20.95% 29.73% 37.58% 32.47% 12/31/1996 24.57% 17.12% 10.18% 16.02% 22.96% 18.65% 12/31/1997 35.71% 26.64% 18.34% 21.62% 33.36% 26.92% 12/31/1998 20.65% 12.09% 6.61% 4.31% 28.58% 10.75% 12/31/1999 45.86% 20.99% 5.57% 5.55% 21.04% 17.23% 12/29/2000 1.95% - 3.47% - 9.84% - 13.15% - 9.10% - 4.90% 12/31/2001 - 12.38% 7.21% - 3.74% - 1.07% - 11.89% - 2.59% 12/31/2002 - 13.64% - 18.47% - 30.86% - 34.65% - 22.10% - 17.12% 12/31/2003 33.58% 42.38% 56.32% 69.01% 28.68% 41.06% 12/31/2004 21.24% 17.67% 20.81% 10.87% 10.88% 19.14% 12/30/2005 12.51% 6.55% 5.13% 5.48% 4.91% 10.21% 12/29/2006 17.14% 15.20% 8.77% 16.17% 15.79% 16.29% 12/31/2007 16.68% 3.15% 10.13% - 1.87% 5.49% 8.34% 12/31/2008 - 33.82% - 41.22% - 45.32% - 47.66% - 37.00% - 39.75% 12/31/2009 29.25% 38.20% 61.16% 78.71% 26.46% 44.08% 12/31/2010 23.71% 28.19% 19.28% 25.84% 15.06% 24.95% 12/30/2011 2.45% - 0.69% - 7.04% - 7.47% 2.11% - 0.27% 12/31/2012 15.15% 21.01% 12.31% 16.16% 16.00% 16.69% 12/31/2013 36.36% 35.23% 40.88% 33.03% 32.39% 36.31% 12/31/2014 13.19% 14.72% 12.38% 15.14% 13.69% 13.62% 12/31/2015 1.76% - 1.95% - 8.94% - 10.32% 1.38% - 3.85% 12/30/2016 7.50% 11.22% 16.45% 24.16% 11.96% 14.16% 12/29/2017 22.35% 16.91% 16.38% 14.54% 21.83% 18.31% 12/31/2018 - 2.83% - 4.07% - 5.28% - 7.96% - 4.38% - 4.86% Cum 3670.44% 1552.39% 723.45% 834.65% 1213.68% 1773.97% Ann 13.32% 10.15% 7.53% 8.00% 9.28% 10.62% All Performance numbers are based on the back - tested performance of non - investable indexes. Investors cannot invest directly in an index. Indexes have no fees. Please see the disclosure slide for important information regarding back testing. The relative strength strategy is not a gua ran tee. There may be times where all investments are unfavorable and depreciate in value . Past performance not indicative of future results. Potential for profits may be accompanied by the possibility of loss. 60 600 6000 Dec-89 Dec-90 Dec-91 Dec-92 Dec-93 Dec-94 Dec-95 Dec-96 Dec-97 Dec-98 Dec-99 Dec-00 Dec-01 Dec-02 Dec-03 Dec-04 Dec-05 Dec-06 Dec-07 Dec-08 Dec-09 Dec-10 Dec-11 Dec-12 Dec-13 Dec-14 Dec-15 Dec-16 Dec-17 Dec-18 BX BO SX SO • Universe: US Equities (Top 1000 Mkt Cap) • Rebalanced Monthly • Equal Weight • S&P 500 TR base index BX is the only group that outperforms equal weight over the test For Illustrative purposes only. Does not show any past or current recommendations or performance in any account. Copyright © 2019 Dorsey, Wright & Associates, LLC| For Financial Professional Use Only
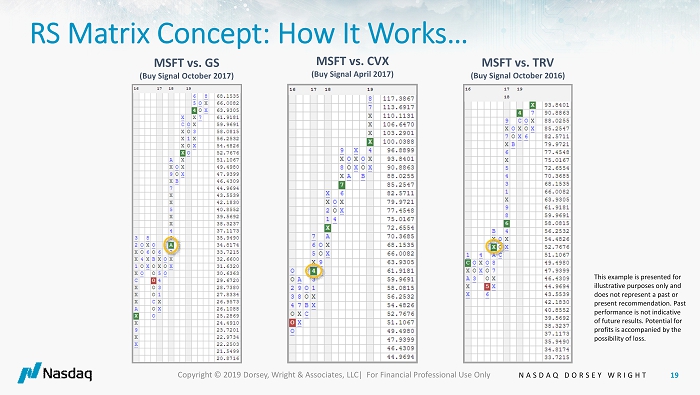
For the majority of our models, as well as the DWAMLP index, we use a Relative Strength Matrix to track all the RS charts and their various conditions. How does this work? Take a stock, let’s say MSFT, and compare it to a universe of stocks. Compare MSFT on an Pnf RS basis then tally up the number of buy signals, or wins like a sports ranking.
NASDAQ DORSEY WRIGHT 19 RS Matrix Concept: How It Works… MSFT vs. GS (Buy Signal October 2017) MSFT vs. CVX (Buy Signal April 2017) MSFT vs. TRV (Buy Signal October 2016) This example is presented for illustrative purposes only and does not represent a past or present recommendation. Past performance is not indicative of future results. Potential for profits is accompanied by the possibility of loss. Copyright © 2019 Dorsey, Wright & Associates, LLC| For Financial Professional Use Only

The result is a Relative Strength matrix. Stocks at top of ranking are the strongest. Stocks at bottom of ranking are the weakest. The relative strength of a given inventory can be aggregated by using a Relative Strength Matrix. The Matrix takes every member of the inventory and compares it, on a relative strength chart, versus every other member of the inventory.
What you obtain is the picture to the right, where each box represents a relative strength chart and is marked with the four potential RS combinations listed below.
NASDAQ DORSEY WRIGHT 20 Strongest Weakest The Relative Strength Matrix Tool allows us to compare multiple securities versus one another at the same time on a relative strength basis. It then ranks them from best to worst, according to the number of RS buy signals each accumulates. RS Matrix Concept Rankings as of 9/20/19 Copyright © 2019 Dorsey, Wright & Associates, LLC| For Financial Professional Use Only • The relative strength of a given inventory can be aggregated by using a Relative Strength Matrix. • The Matrix takes every member of the inventory and compares it, on a relative strength chart, versus every other member of the inventory. • What you obtain is the picture to the right, where each box represents a relative strength chart and is marked with the four potential RS combinations listed below. For Illustrative purposes only. Does not show any past or current recommendations or performance.
NASDAQ DORSEY WRIGHT 21 DWA MLP Select TM Index Copyright © 2019 Dorsey, Wright & Associates, LLC| For Financial Professional Use Only

The process behind the DWA MLP Select Index is simple, yet robust. We take a universe of MLPs and then rank the MLPs by relative strength. Here’s an example of the RS Matrix, applied to a universe of MLPs.
NASDAQ DORSEY WRIGHT 22 Copyright © 2019 Dorsey, Wright & Associates, LLC| For Financial Professional Use Only Strongest Weakest Rank MLPs by Relative Strength • The relative strength of a given group of securities can be aggregated by using a Relative Strength Matrix. The Matrix takes every member of the inventory and compares it, on a relative strength chart, versus every other member of the inventory. What you obtain is the picture below, where each box represents a relative strength chart and is marked with the four potential RS combinations listed on the slide above. MLP Universe Market Cap & Liquidity Screens Rank by Relative Strength Monthly Select Top 15 MLPs (equal weight) DWA MLP Select Index For Illustrative purposes only. Does not show any past or current recommendations or performance.
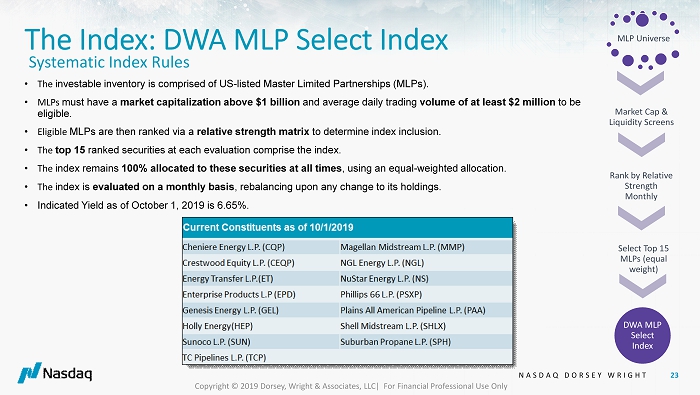
(Read over the rules. – in more depth) The investable inventory is comprised of USlisted Master Limited Partnerships (MLPs).
MLPs must have amarket capitalization above $1 billionand average daily tradingvolume of at least $2 millionto be eligible.
Eligible MLPs are then ranked via arelative strength matrixto determine index inclusion.
Thetop 15ranked securities at each evaluation comprise the index. The index remains100% invested at all times, using an equal-weighted allocation.
The index isevaluated on a monthly basis, rebalancing upon any change to its holdings.
Indicated Yield as of October 1, 2019 is 6.65%.
Take an inventory of MLPs, screen for liquidity (mkt cap and volume), then compare and
rank on an RS Matrix (like the one we just looked at). The highest ranked 15 securities are selected and equally weighted. The ranking is reviewed on a monthly basis.
The goal of the index is to allocate to the strongest MLPs within the universe. Many of the holdings have similar technical setups (Speaker Notes – This refers to a technical analysis term; ie: positive trend, ie: etc. ) PSXP and CQP. 53.33% of the holdings are in a positive trend and 60% are on a PnF buy signal.
Since inception, the DWAMLPT has managed to outperform the AMZX. DWAMLPT up 14.92% / AMZ.TR down -28.16%
NASDAQ DORSEY WRIGHT 23 Copyright © 2019 Dorsey, Wright & Associates, LLC| For Financial Professional Use Only The Index: DWA MLP Select Index • The investable inventory is comprised of US - listed Master Limited Partnerships (MLPs). • MLPs must have a market capitalization above $1 billion and average daily trading volume of at least $2 million to be eligible. • Eligible MLPs are then ranked via a relative strength matrix to determine index inclusion. • The top 15 ranked securities at each evaluation comprise the index. • The index remains 100% allocated to these securities at all times , using an equal - weighted allocation. • The index is evaluated on a monthly basis , rebalancing upon any change to its holdings. • Indicated Yield as of October 1, 2019 is 6.65%. Systematic Index Rules MLP Universe Market Cap & Liquidity Screens Rank by Relative Strength Monthly Select Top 15 MLPs (equal weight) DWA MLP Select Index
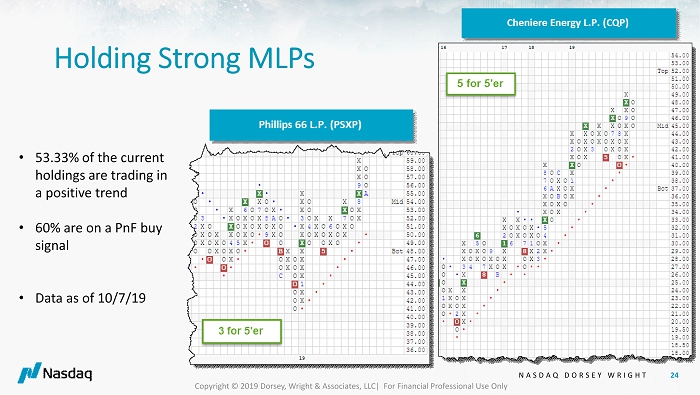
The goal of the index is to allocate to the strongest MLPs within the universe. Many of the holdings have similar technical setups (Speaker Notes – This refers to a technical analysis term; ie: positive trend, ie: etc. ) PSXP and CQP. 53.33% of the holdings are in a positive trend and 60% are on a PnF buy signal.
NASDAQ DORSEY WRIGHT 24 Holding Strong MLPs • 53.33% of the current holdings are trading in a positive trend • 60% are on a PnF buy signal • Data as of 10/7/19 Copyright © 2019 Dorsey, Wright & Associates, LLC| For Financial Professional Use Only

Since inception, the DWAMLPT has managed to outperform the AMZX. DWAMLPT up 14.92% / AMZ.TR down -28.16%
NASDAQ DORSEY WRIGHT 25 Copyright © 2019 Dorsey, Wright & Associates, LLC| For Financial Professional Use Only • Comparison graph since inception of DWAMLPT (5/01/2015) DWAMLPT vs AMZX • DWA MLP Select Total Return Index (DWAMLPT) vs Alerian MLP Total Return Index (AMZ.TR)
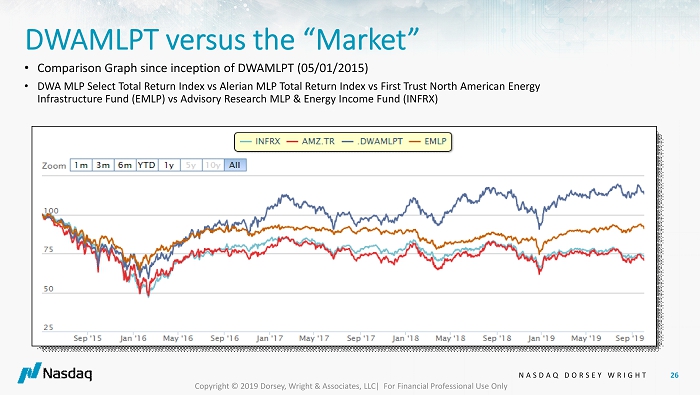
The index has also provided competitive returns against MLP linked funds. INFRX – down -26.22% / EMLP – down -7.40% since DWAMLPT’s inception. Through 9/30/19
NASDAQ DORSEY WRIGHT 26 Copyright © 2019 Dorsey, Wright & Associates, LLC| For Financial Professional Use Only DWAMLPT versus the “Market” • Comparison Graph since inception of DWAMLPT (05/01/2015) • DWA MLP Select Total Return Index vs Alerian MLP Total Return Index vs First Trust North American Energy Infrastructure Fund (EMLP) vs Advisory Research MLP & Energy Income Fund (INFRX)
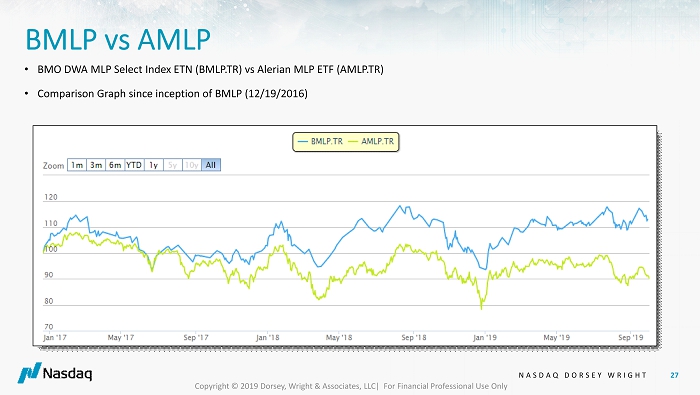
The ETN, which tracks the index, is up 11.65% since inception, while the Alerian MLP ETF TR (AMLP) is down -23.60%.
NASDAQ DORSEY WRIGHT 27 Copyright © 2019 Dorsey, Wright & Associates, LLC| For Financial Professional Use Only BMLP vs AMLP • Comparison Graph since inception of BMLP (12/19/2016) • BMO DWA MLP Select Index ETN (BMLP.TR) vs Alerian MLP ETF (AMLP.TR)

So where does The MLP Select Index fit in a portfolio? One way to incorporate the index ETN is in a tactical income portfolio, and make it part of a sleeve to enhance other strategies that are either fixed income or extremely correlated to traditional equity benchmarks, like the S&P 500.
NASDAQ DORSEY WRIGHT 28 Tactical Income Portfolio Tactical Income Portfolio Fixed Income (Taxable/Tax Free) Covered Write Portfolio BMO DWA MLP Select Index ETN Equity Income The BMO DWA MLP Select Index ETN can be used to enhance a tactical income portfolio. Copyright © 2019 Dorsey, Wright & Associates, LLC| For Financial Professional Use Only

| • | IS |
| • | A means for identifying market leadership |
| • | Anadaptive, tacticalrisk management tool |
| • | Based upon objective inputs (i.e.,price,supply & demand) |
| • | Designed to participate in long-term themes of strength |
| • | NOT |
| • | A market forecasting “black box” |
| • | A static, strategic indexing strategy |
| • | Reliant upon subjective inputs (i.e., gut feel or manipulated valuations) |
| • | Designed to target exact tops or bottoms in securities |
NASDAQ DORSEY WRIGHT 29 Let’s Talk Expectations • A means for identifying market leadership • An adaptive, tactical risk management tool • Based upon objective inputs (i.e., price, supply & demand) • Designed to participate in long - term themes of strength • A market forecasting “black box” • A static, strategic indexing strategy • Reliant upon subjective inputs (i.e., gut feel or manipulated valuations) • Designed to target exact tops or bottoms in securities What it is… What it is NOT … Copyright © 2019 Dorsey, Wright & Associates, LLC| For Financial Professional Use Only

Relative Strength investing may not work or outperform every day, month, year, however, it has been shown to work over time…
NASDAQ DORSEY WRIGHT 30 Copyright © 2019 Dorsey, Wright & Associates, LLC| For Financial Professional Use Only There is no “one thing” that is better at all times, but there are many things that have proven to work over time.
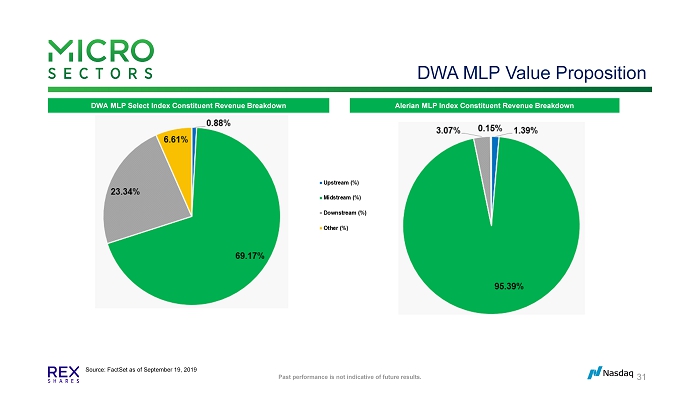
DWA MLP Value Proposition 31 DWA MLP Select Index Constituent Revenue Breakdown Alerian MLP Index Constituent Revenue Breakdown Source: FactSet as of September 19, 2019 Past performance is not indicative of future results.
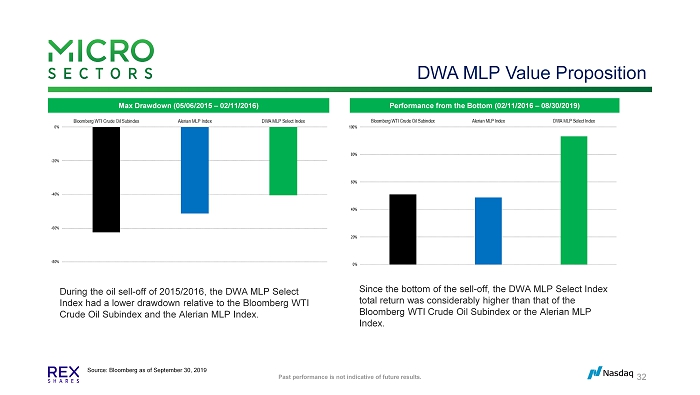
DWA MLP Value Proposition 32 Max Drawdown (05/06/2015 – 02/11/2016) Performance from the Bottom (02/11/2016 – 08/30/2019) During the oil sell - off of 2015/2016, the DWA MLP Select Index had a lower drawdown relative to the Bloomberg WTI Crude Oil Subindex and the Alerian MLP Index. Since the bottom of the sell - off, the DWA MLP Select Index total return was considerably higher than that of the Bloomberg WTI Crude Oil Subindex or the Alerian MLP Index. Source: Bloomberg as of September 30, 2019 Past performance is not indicative of future results.
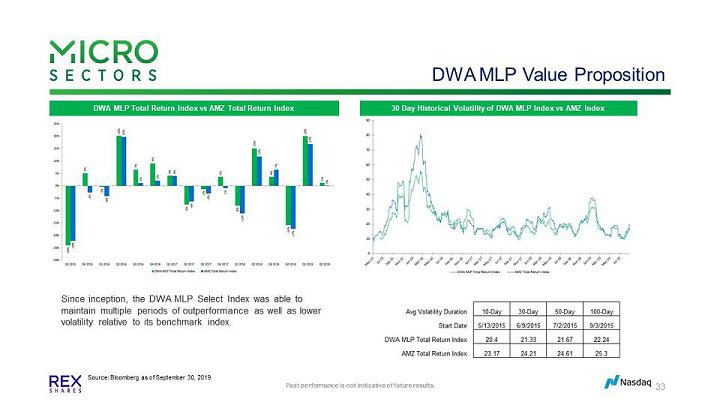
XXXXXX 33 DWA MLP Total Return Index vs AMZ Total Return Index 30 Day Historical Volatility of DWA MLP Index vs AMZ Index Source: Bloomberg as of September 30, 2019 Since inception, the DWA MLP Select Index was able to maintain multiple periods of outperformance as well as lower volatility relative to its benchmark index. Past performance is not indicative of future results.

Bank of Montreal Overview 34 $23.0 B 3 F’18 Net Revenue $5.7 B 3 F’18 Adjusted Net Income $774 B 2 Total Assets 48,000+ Employees 2 $62.3 B 2 Market Capitalization 9 th largest bank in North America 4 Among the Top 10 Safest banks in North America 5 Personal & Commercial Banking • BMO Bank of Montreal over 900 branches & over 3,300 ATMs across Canada 2 • BMO Harris Bank over 570 branches & access to more than 40,000 ATMs nationwide 2 Wealth Management • Global business with over $800B AUM/AUA 2 • Full service and direct brokerage, mutual funds, institutional asset management, private banking and insurance • Full range of wealth management client segments from mainstream to ultra - high net worth BMO Capital Markets • Investment & Corporate Banking • Trading Products Aa 2 Credit rating 6 27% 19% 57% Operating Groups 1 1. Percentage of FY2018 net revenue 2. As at September 30, 2019. All dollar figures in CAD$. 3. All figures in CAD$, as of September 30, 2019 4. Source: Bloomberg as of September 30, 2019; total assets (reported) most recent filing 5. Source: Global Finance, November 2018 6. Moody’s Senior Unsecured Debt credit rating as September 30, 2019
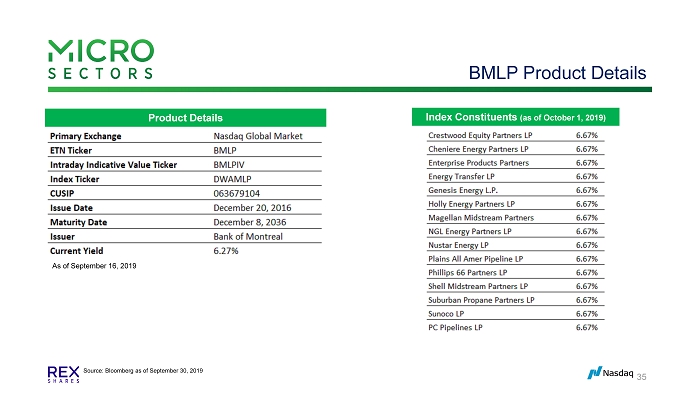
BMLP Product Details 35 Product Details Index Constituents (as of October 1, 2019) Source: Bloomberg as of September 30, 2019 As of September 16, 2019

XXXXXX 36 BMLP vs 10 Year Treasury Source: Bloomberg as of September 30, 2019 Past performance is not indicative of future results.

MicroSectors Overview 37 Launched in 2018, MicroSectors™ is the business line of REX Shares, which focuses on partnering with banks to launch innovative ETNs. REX Shares is an ETP architect that specializes in creating and distributing unique products to the marketplace. What is an Exchange Traded Notes (ETN) • An ETN is structured as a senior unsecured debt obligation of an issuing entity What are the Structural Advantages of ETNs? • ETFs generally hold 20+ stocks • ETNs require a minimum of 10 equity index constituents • Allows for a more targeted exposure • Advantages of MLP ETN • Offers 100% participation in an MLP index subject to product fees • Reduce slippage • No tax deferral on distributions or cost basis reduction • No Schedule K - 1 What is MicroSectors? Who is REX Shares? What is BMLP? • An ETN linked to the Dorsey Wright MLP Select Index • Issued by Bank of Montreal which has a credit rating of Aa 2 by Moody’s and A+ 2 by Standard & Poor’s Source: 1 & 2. Senior Unsecured Debt credit rating as of 09/30/2019
Important Additional Information 38 Risk Considerations An investment in the ETNs involves risks, including possible loss of principal, and are not suitable for all investors. Holde rs may receive less than the principal amount of the ETNs at maturity, call or upon redemption. The ETNs are riskier than ordinary unsecured debt securities and have no principal protect ion . The ETNs are unsecured debt obligations of the issuer, Bank of Montreal, and are not, either directly or indirectly, an obligation of or guaranteed by any third party. Hold ers will not receive any fixed periodic interest payments on the ETNs. Although the ETNs are listed on a national securities exchange, a trading market for the ETNs may not continue for the ter m of the ETNs. BMO is not required to maintain any listing of the ETNs on any exchange or quotation system. The ETNs may be repurchased by BMO at its option. In the event that we call any ETNs, the call settlement amount may be significantly less than the stated principal amount of the ETNs or the price at which a holder purchased the ETNs. Holders must offer the applicable minimum redemption amount of ETNs to BMO for the offer for redemption to be considered. Significant aspects of the tax treatment of the ETNs are uncertain . You should carefully review the offering documents relating to the ETNs, and in particular, the risk factors set forth therein, prior to making an investment decision. Disclaimer Certain information contained herein has been taken from publicly available sources. Neither BMO nor its affiliates has made any independent investigation as to the accuracy, reliability or completeness of information obtained from such publicly available sources. Neither BMO nor its affiliates assu mes any obligation to correct or update these materials, except as required by applicable law. These materials do not contain all information that may be required to evaluate, and do no t constitute a recommendation with respect to BMLP or any other matter. This presentation has been prepared solely for informational purposes only. The recipient should not construe the contents of th is presentation as legal, tax, accounting or investment advice or a recommendation. The recipient should consult its own counsel and tax and financial advisors as to legal and relat ed matters concerning the matters described herein. This presentation does not purport to be all - inclusive or to contain all of the information that the recipient may require. BMO Capital Markets is a trade name used by BMO Financial Group for the wholesale banking businesses of Bank of Montreal, BMO Ha rris Bank N.A. (member FDIC), Bank of Montreal Ireland p.l.c , and Bank of Montreal (China) Co. Ltd and the institutional broker dealer businesses of BMO Capital Markets Corp. (Member SI PC) in the U.S., BMO Nesbitt Burns Inc. (Member Canadian Investor Protection Fund) in Canada and Asia, BMO Capital Markets Limited (authorised and regulat ed by the Financial Conduct Authority) in Europe and Australia. ®Registered trademark of Bank of Montreal in the United States, Canada and elsewhere. ™Trademark of Bank of Montreal in the U nit ed States and Canada. Bank of Montreal, the issuer of the ETNs, has filed a registration statement (including a pricing supplement, prospectus supp lem ent and prospectus) with the SEC about the offering to which this presentation relates. Please read those documents and the other documents relating to this offering that Bank of M ont real has filed with the SEC for more complete information about Bank of Montreal and this offering. These documents may be obtained without cost by visiting EDGAR on the S EC Website at www.sec.gov. Alternatively, Bank of Montreal, any agent or any dealer participating in this offering will arrange to send the pricing supplement, the prospectus sup plement and the prospectus if so requested by calling toll - free at 1 - 877 - 369 - 5412. .
NASDAQ DORSEY WRIGHT 39 Disclosures Dorsey, Wright & Associates, LLC, a Nasdaq Company, is a registered investment advisory firm. Registration does not imply any le vel of skill or training. Some performance information presented is the result of back - tested performance. Back - tested performance is hypothetical (it do es not reflect trading in actual accounts) and is provided for informational purposes to illustrate the effects of the strategy during a specific period. Back - tested performance results have certain limitations. Back - testing pe rformance differs from actual performance because it is achieved through retroactive application of a model investment methodology designed with the benefit of hindsight. Performance results (both backtested and model performance) do not represent the impact of material economic and market factors might have on an investment advisor’s decision making process if the advisor were actually managing client money. Dorsey, Wright & Associates, LL C (collectively, with is parent company and affiliates “DWA”) believes the data used in the testing to be from credible, reliable sources, however; DWA makes no representation or warranties of any kind as to the accuracy of s uch data. The relative strength strategy is NOT a guarantee. There may be times where all investments and strategies are unfavorable a nd depreciate in value. Relative Strength is a measure of price momentum based on historical price activity. Relative Strength is not predictive and there is no assurance that forecasts based on relative strength can be rel ied upon to be successful or outperform any index, asset, or strategy. Unless otherwise stated, returns of the strategies do not include all fees or other transaction costs. Management and other exp enses can have a material impact on performance when compounded over time. Past performance, hypothetical or actual, does not guarantee future results. In all securities trading there is a potential for loss as well as profit. It should not be assumed that recommendations made in the future will be profitable or will equal the performance as shown. Investors should have long - term financial objectives. The information contained herein has been prepared without regard to any particular investor’s investment objectives, financi al situation, and needs. Accordingly, investors should not act on any recommendation (express or implied) or information in this material without obtaining specific advice from their financial advisors and should not rely on information herein as the primary basis for their investment decisions. Information contained herein is based on data obtained from recognized statistical services, issuer reports or communications, or other sources believed to b e r eliable (“information providers”). However, such information has not been verified by DWA or the information provider and DWA and the information providers make no representations or warranties or take any responsibility a s t o the accuracy or completeness of any recommendation or information contained herein. DWA and the information provider accept no liability to the recipient whatsoever whether in contract, in tort, for negligence, or ot herwise for any direct, indirect, consequential, or special loss of any kind arising out of the use of this document or its contents or of the recipient relying on any such recommendation or information (except insofar as any statuto ry liability cannot be excluded). Any statements nonfactual in nature constitute only current opinions, which are subject to change without notice. Neither the information nor any opinion expressed shall constitute an off er to sell or a solicitation or an offer to buy any securities, commodities or exchange traded products. This document does not purport to be complete description of the securities or commodities, markets or development s t o which reference is made. Each investor should carefully consider the investment objectives, risks and expenses of any security prior to investing. Bef ore investing in a security investors should obtain and carefully read the relevant prospectus and documents the issuer has filed with the SEC. Bank of Montreal, the issuer of the ETNs, has filed a registration statement (including a pricing supplement, prospectus supp lem ent and prospectus) with the SEC about the offering to which this presentation relates. Please read those documents and the other documents relating to this offering that Bank of Montreal has filed with the SEC for more compl ete information about Bank of Montreal and this offering. These documents may be obtained without cost by visiting EDGAR on the SEC Website at www.sec.gov. Alternatively, Bank of Montreal, any agent or any dealer pa rti cipating in this offering will arrange to send the pricing supplement, the prospectus supplement and the prospectus if so requested by calling toll - free at 1 - 877 - 369 - 5412. Copyright © 2019 Dorsey, Wright & Associates, LLC| For Financial Professional Use Only

Dorsey Wright MLP Index ETN
Introducing MLPs, BMLP & the Dorsey Wright MLP Index Webinar
As of October 24th, 2019
Speaker: Scott Acheychek –President of REX Shares
Speaker:Ben Jones – Senior Analystof Nasdaq Dorsey Wright
Speaker:Michael Tanney –Director of Magnus Financial Group LLP
Ben Jones:
Cover Slide: Introducing MLPs, BMLP & The Dorsey Wright MLP Index
Slide 2: Speaker intros
Scott:
Thanks Ben. I’m thrilled to be here and I’m thankful for Nasdaq Dorsey Wright’s support of this unique index and for helping us spread the word about BMLP. I’d also like to thank Michael Tanney from Magnus Financial Group for participating here as well. Magnus is a pretty incredible RIA. They are fully independent, manage money themselves but also help advise FA’s as well.
My name is Scott Acheychek, I’m the President of REX Shares, we are the marketing agent for BMLP and created the MicroSectors brand, which I’ll explain in more detail later.
Slide 3: What is an MLP?
Scott:
So let’s get started with a quick MLP review. A Master Limited Partnership; more commonly known asan MLP,is a partnership which gains the liquidity of a publicly traded security, like a stock, while maintaining the tax benefits of a partnership.
| 1 |
The MLP structure provides a tax advantage to the business and to the shareholders. MLPs do not pay tax at the company level and distribute the majority of their cash flow to the unitholders.
The first MLP was founded in 1981 by the Apache Petroleum Company, and shortly thereafter many other energy MLPs were formed, followed by real estate MLPs, amusement park MLPS, and arguably the most famous MLP, the Boston Celtics. For the right business, this was an ideal structure.
However, Congress put an end to the growing types of companies utilizing the MLP structure with the Revenue Act of 1987, which stated that an MLP must earn at least 90% of its gross income from qualifying sources, which is limited to transportation, processing, storage, and production of natural resources and minerals.
Back to the slide. As you can see, MLPs generally have two classes of partners: Limited Partners and the General Partners.
The general partner is the one who manages the MLP, they run the day-to-day operations. And they typically receive a 2% stake in the Master Limited Partnership.
The limited partners are the investors who purchase the MLP shares, or MLP interests. When sold to the public, these shares provide capital for the MLP to operate, buy equipment, scale, etc. For providing this capital, the limited partners receive periodic distributions, and participate in any upside value. Remember,MLPs do not pay tax at the company level so they distribute the majority of their cash flow to these LPs.
Of course, throughout this presentation, I’m going to discuss the tax issues at a high, general level. Any investors should of course speak to their own tax advisers about how the relevant rules apply to their own circumstances.
Let’s go to the next slide.
Slide 4: MLP Distributions: LP vs GP
Scott:
As we mentioned, An MLP must generate 90% of its income from qualifying sources, which are limited to natural resources, commodities, or real estate related businesses. MLPs are required to distribute all of their available cash to unit holders. This requirement is found in the partnership agreement; it is not a tax requirement or securities law requirement.
The key here is the tax set up which offers a significant advantage for MLPs as they are not subject to taxation at the corporate level and then again as income tax for unitholders. In addition, deductions like depreciation also pass through to the LPs.
Since MLPs are flow-through entities their distributions are not classified as dividends but rather return of capital which reduces an investor’s cost basis in the MLP and a portion is considered taxable income. The exact numbers can be found in an MLP’s K-1.
| 2 |
All the items that go into calculating tax—income, deductions, gains, losses and credits—are divided up among the unitholders as if they had earned the income themselves. You pay tax on your share of the partnership’s taxable income, as determined by all the items on the K-1.
Additionally, often investors would like to invest in MLPs through their individual retirement accounts (IRAs) or other qualified retirement accounts. MLP investments held in an IRA or similar account are likely to be subject to “unrelated business income tax” (UBIT). UBIT is imposed on tax-exempt entities, including retirement plans, that earn “unrelated business income” (UBI)—income from a business that is not related to the purpose of their tax exemption. Because MLPs are pass-through entities, tax-exempt unitholders (e.g., your IRA) are treated as directly “earning” the MLP’s business income and are taxed on it. The first $1,000 of UBI can be deducted, so only IRAs with net income over that amount will have to pay tax. The tax rate is the highest corporate rate, 35%.
On to what the MLP market looks like today.
Slide 5: MLP Industry Concentration
Scott:
Currently there are about 80 MLPs in the United States of which 76% operate in the energy sector. The Oil, Gas & Consumable Fuels MLPs represent 71% of all MLPs and 84% of total MLP market capitalization.
Within the energy sector, the main segments are broken down as upstream, midstream, and downstream.
For upstream, think Exploration & Production. What is known as closest to the well.
For Midstream, it’s transportation, marketing, and storage.
For downstream, it’s refining, processing, and distribution. Downstream is closest to your car or house in terms of its energy needs.
Originally deriving income from energy and real estate related services, the qualifying income definition for an MLP now includes gains from: industrial carbon dioxide, alcohol and biodiesel fuel mixture transportation and storage, alternative fuels, neat alcohol derived from alcohol, gas, coal and neat biodiesel.
So now that we’ve broken down what an MLP is, how they work. how does one invest in MLPs?
| 3 |
Slide 6: Direct vs Indirect Investment in MLPs
Scott:
We created this slide to illustrate key differences between MLP direct investments, funds with 25% or more in MLP exposure, funds with less than 25% exposure, and ETNs, or Exchange Traded Notes.
Similar to investing in an individual stock, there are risks involved in individual MLP picking as well such as lack of diversification, concentration, and for federal tax reporting you become the LP so receiving K-1’s.
The options one can pick from to gain broader exposure to MLPs are Exchange Traded Notes, the closed-end or ETF structure with more than 25% of assets in an MLP, or the closed-end structure with less than 25% of assets in MLPs. There are many similarities between them. All three are exchange traded, all provide daily liquidity, and all avoid K-1s.
However, the key difference with the two fund structures with more or less than 25% exposure is important. If a fund has MLP exposure but can keep it less than 25% then that fund avoids a layer of corporate taxes that the fund with > 25% MLP exposure has to deal with. The downside for the <25% structure is that historically the dividends are lower because of the less than full exposure to MLPs.
The exchange-traded note has a couple of key differentiators versus both fund structures as well. First, and most important to understand, is that ETNs are debt instruments issued by a bank, which means you have credit risk relating to the issuing bank. On the other hand, a key benefit here is that there is no tracking error. The ETN provides investors the return of the index without slippage (this is because an ETN is obligated to provide investors the return in their offering document, net of a management fee or similar fee, but unlike an ETF, doesn’t pass through any additionally expenses to investors. ETFs on the other hand pass through all expenses to its shareholders, are required to pay a dividend and are therefore more likely to have slippage between the return on the underlying index and the ETF.
The ETN also maintains a full 100% exposure to MLPs in indices like the Dorsey Wright MLP select index.
So now, let’s bring it all together and show the MLP value proposition.
| 4 |
Slide 7: MLP Value Proposition
Scott:
Two charts here break down the historical performance of MLPs.
The first chart on the left is of the Alerian MLP Index historically compared to the S&P 500 on a total return basis. The Alerian index is important because it was the first real time index for MLPs, launched in 2006. We will go into more detail about the Alerian index later but the important thing to know is that it is a midstream index meaning its constituents earn the majority of their cash flow from midstream activities involving energy commodities.
In addition to outperforming the S&P during this time frame, this midstream MLP index has outperformed the broader equity market on a total return basis in 16 of the last 19 years as well.
Now when you look at the chart on the right, you see how the Alerian index has compared to the Dorsey Wright MLP Index from its inception and you can see there has been significant outperformance by the Dorsey Wright MLP index on a total return basis.
The important takeaway about the Dorsey Wright index, and Ben will go into much more detail on this, is that the MLP universe is not limited to just Midstream. The Dorsey Wright index on a monthly basis chooses 15 MLPs that are the best performers in terms of relative strength across all energy or real estate MLPs. So the Dorsey Wright index can choose up, mid or downstream. I believe the frequent reconstitutions & the ability to broadly select MLPs is a key reason why it has outperformed the Alerian index since spring of 2015. Of course, past performance is no indication of future results.
Looking at that chart, you’ll see it outperformed during oil’s sell off from mid 2015 to early 2016 and then again on the recovery.
And with that, I would like to ask our friend Michael a few questions about how he looks at the MLP space, how he considers picking favorites or an index based approach and more. Michael, thanks for joining us. First, please tell the audience about yourself and your firm, Magnus Financial Group.
Michael:
I’m Michael Tanney, a director at Magnus Financial Group, a RIA headquartered in New York City with over $2.5B in assets.
Scott:
How do you Describe Master Limited Partnerships to clients?
| 5 |
Michael:
Master Limited Partnerships can offer investors tax-advantaged income and a growing stream of distributions. Given the growth in the domestic energy business, many think you can’t go wrong investing in, what some like to call, low-risk, tollroad infrastructure enterprises. While easy to comprehend and it sounds catchy, I don’t like the toll road comparison.
Do toll roads presently use dynamic pricing to change user rates based on demand? Do the two cities connected by the toll road constantly move locations and thus change the length of the journey?
Changes in the energy business are extremely difficult to predict. What looks like a treasure today, could turn into garbage tomorrow. The research process is complicated and time-consuming.
There are many important recent trends affecting MLPs. The first two that come to mind are:
1. Previously economically unfeasible gas and oil deposits are now profitable and the use of new technology has created market disruption such as fracking and horizontal drilling. Exploitation of shale deposits using fracking and horizontal drilling.
2. Thermal coal plants are in less demand with the advent of new technology. The US is now a coal exporter. Natural gas production has a smaller amount of appeal for many because it’s less expensive and creates a small carbon footprint.
To go back to the commonly used tollroad line. I prefer to tell clients that nearly all of the United States’ critical energy infrastructure is directly dependent upon the products that MLPs deliver.
Scott:
What is your approach to investing in Master Limited Partnerships?
Michael:
I consider many important factors in the MLP investment process. I’ve looked at separately managed accounts as well as individual names. At the end of the day, I strongly prefer to maintain exposure to the sector through exchange-traded-products.
When looking at the exchange-traded-products, there are some key metrics I like to monitor.
1. How spread out are the risk factors and opportunities in the basket of companies? If you dig deep enough, you often find risks that are offsetting. For example, if a propane distributor is squeezed because of a spike in propane prices, the partnership that processes gas benefits from higher prices of propane. Ideally, by owning both, you partially hedge the risk within portfolios.
2. Another important metric is diversification by type of business, growth prospects, partnership structure, business model, and type of energy product.
3. Lastly, I like to have exposure across the energy supply chain to provide the best possible diversification and attempt to minimize risk.
Additional benefits to accessing Master Limited Partnerships in an exchange-traded-product include the ability to locate in retirement accounts and no K1s for the investor to chase and the accountants to charge them extra to process.
| 6 |
Scott:
What is your expectation for investment returns in Master Limited Partnerships?
Michael:
Performance of Master Limited Partnerships does not exist in a vacuum. Returns are correlated to outcomes in other financial markets such as high-yield debt, real estate investment trusts, energy-related equities, US Treasury bonds, and the overall stock market.
I generally expect MLPs to offer a return to be roughly equal to their distributions, plus a distribution growth factor. Said differently, my expectation is for about half the return to come from distributions and the rest to come from price appreciation attributable to distribution growth.
At the end of the day, while no expectation of returns can ever be guaranteed, for MLPs or any other investment, incorporating master limited partnerships into a well-diversified portfolio using exchange-traded-products offers my clients the potential for tax-enhanced compounded returns in all different types of accounts, without incurring substantial single company risk.
At Magnus Financial Group we have a rigorous investment decision making process that is underpinned by our client’s best interests.
As an advisor, I love working at Magnus in this type of environment, because I have the full support of the firm. If you walk around our office, you’ll feel a constant buzz of excitement as we continue our rapid growth in terms of client assets and number of advisors. Please connect with me on LinkedIn and send a message if you are interested in learning more!
Scott:
Thanks Michael. That was great. We really appreciate your insights. Now I’d like to hand it over to Ben Jones from Dorsey Wright so he can take a deeper dive into the Dorsey Wright MLP index and how relative strength has performed in this space. Ben…….
DORSEY WRIGHT SLIDES BY BEN
Scott:
Thanks Ben, that was a great review of the MLP space. I’d like to highlight some major components from Ben’s deep dive.
| 7 |
Slide 8: DWA MLP Value Proposition
Scott:
As we mentioned earlier in the webinar, the majority of the MLP space operates in the energy sector, which is comprised of three main segments: upstream, midstream, and downstream.
We also mentioned, the upstream segment focuses mostly on exploration, well drilling, machinery rentals, and oil and gas production. The midstream segment is focused mostly on pipelines, transportation, storage and the marketing of oil and gas. And the downstream segment is focused mostly on refining, marketing and distribution, and the processing of oil and gas.
Volatility also goes in that order as well. Historically upstream is the most volatile as E&P is typically the most sensitive to oil prices. Midstream is typically less volatile than upstream but still faces commodity price risk. Imagine if a pipeline is transporting oil from a field that has a cost of production around $50. I would guess that the oil producer may consider sending less oil through that pipeline if prices fell substantially below $50 or even slightly lower but for an extended period of time. Downstream is at the end of those pipelines, they are typically the least volatile of the three as they are closest to the consumer and turn raw material like oil or natural gas into higher valued products such as fuels or petrochemicals which make them historically less sensitive to oil price volatility.
Most MLP indices, including the Alerian MLP index, limits themselves to midstream exposure, and we don’t see that as a true representation of the MLP space.
As you can see in the revenue breakdown of the holdings in the Alerian and Dorsey Wright index from September, the Alerian index has an approximate 96% of its revenue derived from midstream, while the DW Index has about a 70% allocation to midstream with a roughly 23% allocation to Downstream.
Historically, this has meant lower volatility to go along with its outperformance for the Dorsey Wright Index vs Alerian and therefore for the products tracking those indexes.
| 8 |
Slide 32: DWA MLP Value Proposition
Scott:
One thing we get asked a lot is how did the Dorsey Wright index compare to Alerian during the oil sell off when Oil went from the 60’s to high 20’s and how has it performed since.
The Dorsey Wright index was not immune to the price pressure oil faced but it was able to outperform the Alerian index during this time. In fact it outperformed by over 20%.
Then from that oil bottom to the end of August of this year, it outperformed by about 40%.
Slide 33: DWA MLP Value Proposition
Scott:
Again, on this slide, we show quarterly performance of Alerian versus Dorsey Wright and historical volatility of the two indices.
The left side here shows pretty consistent historical outperformance as illustrated by the quarterly returns of both indices since 2015.
Now on the right hand side, we’ve broken down the 10, 30, 50, and 100 day average volatility of both indices and have found that in all four of those averages, the DWA MLP index has had lower historic volatility than the Alerian MLP Index.
The key question is how does it outperform with less vol? It goes back to two things: not being limited to just midstream. By being able to access downstream MLPs, which have been historically less volatile, and by the frequency of the Dorsey Wright reconstitutions and the equal weighting nature of the index.
Every single month this index filters out the companies with weaker performance and chooses just the 15 best performing MLPs, based on the relative strength methodology. The Dorsey Wright MLP index is an equal weighted index, which allows for high relative strength performing small MLPs, subject to a 1bn minimum aum, to have the same weighting as larger MLPs. Unlike the Dorsey Wright MLP Index, the Alerian index is market cap weight and therefore primary relies on the large cap names getting larger.
By having an index that can make frequent substitutions could make a product linked to it have tracking error or slippage but because BMLP is an ETN, it has no tracking error, no slippage, net of fees. More on that in a bit.
| 9 |
Slide 34: Bank of Montreal Overview
Scott:
The note issuer for BMLP, the Dorsey Wright MLP Index ETNs is the Bank of Montreal. We decided to partner with them a few years ago on a suite of leveraged and inverse ETNs related to FANG, Big Banks and Big Oil. More recently, we started marketing BMLP.
Bank of Montreal is among the top ten largest banks in North America, with an Aa2 credit rating from Moody’s. BMO has been a great partner for us and we believe they make an excellent choice as an ETN issuer.
Slide 35: BMLP Product Details
Scott:
And here is a snapshot of BMLP, with all its product information and current positions as of the last rebalance, which occurred at the beginning of the month.
BMLP is yielding 6.27% as of September 16th.
On the next slide, we show BMLP’s yield relative to the ten year.
Slide 36: BMLP vs 10 Year Treasury
Scott:
Keep in mind this is just the yield and doesn’t factor into any BMLP share price performance. The historical performance slides were based on total return, which means price return and yield. As you can see, BMLP has historically handily yielder more than the 10 year treasury alternative.
| 10 |
Slide 37: MicroSectors Overview
Scott:
Last but not least, I’d like to go over MicroSectors a bit more in detail.
Launched in 2018, MicroSectors™ is the business line of REX Shares, which focuses on partnering with banks on ETNs. REX Shares is an ETP architect that specializes in creating and distributing unique products to the marketplace.
We are thrilled to partner with BMO and Nasdaq Dorsey Wright on BMLP. We think it makes a very great case for MLP Index or Exchange Traded Product allocations in this space.
If you’d like to find out more information, please feel free to go to Microsectors.com or email us at info@rexshares.com
Thanks again Ben, Michael.
* * *
Bank of Montreal, the issuer of the ETNs, has filed a registration statement (including a prospectus) with the SEC for the offering to which this presentation relates. Before you invest, you should read the prospectus in that registration statement and the other documents that Bank of Montreal has filed with the SEC for more complete information about Bank of Montreal and this offering. You may obtain these documents free of charge by visiting the SEC’s website at http://www.sec.gov. Alternatively, Bank of Montreal will arrange to send to you the prospectus (as supplemented by the prospectus supplement and product supplement) if you request it by calling the issuer’s agent toll-free at 1-877-369-5412.
11