
Exhibit 99.2 2nd QUARTER 2019 EARNINGS August 6, 2019
IMPORTANT DISCLOSURES No Offer or Solicitation Communications in this presentation do not constitute an offer to sell or the solicitation of an offer to buy any securities or a solicitation of any vote or approval with respect to the proposed transaction or otherwise, nor shall there be any sale of securities in any jurisdiction in which such offer, solicitation or sale would be unlawful prior to registration or qualification under the securities laws of any such jurisdiction. Communication in this presentation do not constitute a notice of redemption with respect to or an offer to purchase or sell (or the solicitation of an offer to purchase or sell) any preferred stock of Carrizo Oil & Gas, Inc. Additional Information and Where to Find It In connection with the proposed transaction, Callon Petroleum Company (“Callon”) and Carrizo intend to file materials with the Securities and Exchange Commission (the “SEC”), including a Registration Statement on Form S-4 of Callon (the “Registration Statement”) that will include a joint proxy statement of Callon and Carrizo that also constitutes a prospectus of Callon. After the Registration Statement is declared effective by the SEC, Callon and Carrizo intend to mail a definitive proxy statement/prospectus to stockholders of Callon and shareholders of Carrizo. This presentation is not a substitute for the joint proxy statement/prospectus or the Registration Statement or for any other document that Callon or Carrizo may file with the Securities and Exchange Commission (the “SEC”) and send to Callon’s stockholders and/or Carrizo’s shareholders in connection with the proposed transaction. INVESTORS AND SECURITY HOLDERS OF CALLON AND CARRIZO ARE URGED TO READ THE REGISTRATION STATEMENT AND JOINT PROXY STATEMENT/PROSPECTUS, AS EACH MAY BE AMENDED OR SUPPLEMENTED FROM TIME TO TIME, AND OTHER RELEVANT DOCUMENTS FILED BY CALLON AND CARRIZO WITH THE SEC CAREFULLY WHEN THEY BECOME AVAILABLE BECAUSE THEY WILL CONTAIN IMPORTANT INFORMATION ABOUT CALLON, CARRIZO AND THE PROPOSED TRANSACTION. Investors will be able to obtain free copies of the Registration Statement and joint proxy statement/prospectus, as each may be amended from time to time, and other relevant documents filed by Callon and Carrizo with the SEC (when they become available) through the website maintained by the SEC at www.sec.gov. Copies of documents filed with the SEC by Callon will be available free of charge from Callon’s website at www.callon.com under the “Investors” tab or by contacting Callon’s Investor Relations Department at (281) 589-5200 or IR@callon.com. Copies of documents filed with the SEC by Carrizo will be available free of charge from Carrizo’s website at www.carrizo.com under the “Investor Relations” tab or by contacting Carrizo’s Investor Relations Department at (713) 328-1055 or IR@carrizo.com. Participants in the Proxy Solicitation Callon, Carrizo and their respective directors and certain of their executive officers and other members of management and employees may be deemed, under SEC rules, to be participants in the solicitation of proxies from Callon’s stockholders and Carrizo’s shareholders in connection with the proposed transaction. Information regarding the executive officers and directors of Callon is included in its definitive proxy statement for its 2019 annual meeting filed with the SEC on March 27, 2019. Information regarding the executive officers and directors of Carrizo is included in its definitive proxy statement for its 2019 annual meeting filed with the SEC on April 2, 2019. Additional information regarding the persons who may be deemed participants and their direct and indirect interests, by security holdings or otherwise, will be set forth in the Registration Statement and joint proxy statement/prospectus and other materials when they are filed with the SEC in connection with the proposed transaction. Free copies of these documents may be obtained as described in the paragraphs above. Cautionary Statement Regarding Forward-Looking Information Certain statements in this news release concerning the proposed transaction, including any statements regarding the expected timetable for completing the proposed transaction, the results, effects, benefits and synergies of the proposed Carrizo transaction, future opportunities for the combined company, future financial performance and condition, guidance and any other statements regarding Callon’s or Carrizo’s future expectations, beliefs, plans, objectives, financial conditions, assumptions or future events or performance that are not historical facts are “forward-looking” statements based on assumptions currently believed to be valid. Forward-looking statements are all statements other than statements of historical facts. The words “anticipate,” “believe,” “ensure,” “expect,” “if,” “intend,” “estimate,” “probable,” “project,” “forecasts,” “predict,” “outlook,” “aim,” “will,” “could,” “should,” “would,” “potential,” “may,” “might,” “anticipate,” “likely” “plan,” “positioned,” “strategy,” and similar expressions or other words of similar meaning, and the negatives thereof, are intended to identify forward-looking statements. The forward- looking statements are intended to be subject to the safe harbor provided by Section 27A of the Securities Act of 1933, Section 21E of the Securities Exchange Act of 1934 and the Private Securities Litigation Reform Act of 1995. These forward-looking statements involve significant risks and uncertainties that could cause actual results to differ materially from those anticipated, including, but not limited to, failure to obtain the required votes of Callon’s stockholders or Carrizo’s shareholders to approve the transaction and related matters; whether any redemption of Carrizo’s preferred stock will be necessary or will occur prior to the closing of the transaction; the risk that a condition to closing of the proposed transaction may not be satisfied, that either party may terminate the merger agreement or that the closing of the proposed transaction might be delayed or not occur at all; potential adverse reactions or changes to business or employee relationships, including those resulting from the announcement or completion of the transaction; the diversion of management time on transaction-related issues; the ultimate timing, outcome and results of integrating the operations of Callon and Carrizo; the effects of the business combination of Callon and Carrizo, including the combined company’s future financial condition, results of operations, strategy and plans; the ability of the combined company to realize anticipated synergies in the timeframe expected or at all; changes in capital markets and the ability of the combined company to finance operations in the manner expected; regulatory approval of the transaction; the effects of commodity prices; and the risks of oil and gas activities. Expectations regarding business outlook, including changes in revenue, pricing, capital expenditures, cash flow generation, strategies for our operations, oil and natural gas market conditions, legal, economic and regulatory conditions, and environmental matters are only forecasts regarding these matters.

IMPORTANT DISCLOSURES (CONTINUED) Additional factors that could cause results to differ materially from those described above can be found in Callon’s Annual Report on Form 10-K for the year ended December 31, 2018 and in its subsequent Quarterly Reports on Form 10-Q for the quarter ended March 31, 2019 and quarter ended June 30, 2019, each of which is on file with the SEC and available from Callon’s website at www.callon.com under the “Investors” tab, and in other documents Callon files with the SEC, and in Carrizo’s Annual Report on Form 10-K for the year ended December 31, 2018 and in its subsequent Quarterly Reports on Form 10-Q for the quarter ended March 31, 2019 and June 30, 2019, each of which is on file with the SEC and available from Carrizo’s website at www.carrizo.com under the “Investor Relations” tab, and in other documents Carrizo files with the SEC. All forward-looking statements speak only as of the date they are made and are based on information available at that time. Neither Callon nor Carrizo assumes any obligation to update forward-looking statements to reflect circumstances or events that occur after the date the forward-looking statements were made or to reflect the occurrence of unanticipated events except as required by federal securities laws. As forward-looking statements involve significant risks and uncertainties, caution should be exercised against placing undue reliance on such statements. Supplemental Non-GAAP Financial Measures This presentation includes non-GAAP measures, such as Adjusted EBITDA, Net Debt to LTM Adjusted EBITDA, Net Debt to LQA Adjusted EBITDA, Total Liquidity, Discretionary Cash Flow and other measures identified as non- GAAP. Management also uses EBITDAX, which reflects EBITDA plus exploration and abandonment expense. Reconciliations are available in the Appendix. Adjusted EBITDA is a supplemental non-GAAP financial measure that is used by management and external users of our financial statements, such as industry analysts, investors, lenders and rating agencies. We define adjusted earnings before interest, income taxes, depreciation, depletion and amortization (“Adjusted EBITDA”) as net income (loss) before interest expense, income taxes, depreciation, depletion and amortization, asset retirement obligation accretion expense, (gains) losses on derivative instruments excluding net settled derivative instruments, impairment of oil and natural gas properties, non-cash equity based compensation, and other operating expenses. Management believes Adjusted EBITDA is useful because it allows it to more effectively evaluate our operating performance and compare the results of our operations from period to period and against our peers without regard to our financing methods or capital structure. We exclude the items listed above from net income in arriving at Adjusted EBITDA because these amounts can vary substantially from company to company within our industry depending upon accounting methods and book values of assets, capital structures and the method by which the assets were acquired. Adjusted EBITDA should not be considered as an alternative to, or more meaningful than, net income as determined in accordance with GAAP or as an indicator of our operating performance or liquidity. Certain items excluded from Adjusted EBITDA are significant components in understanding and assessing a company’s financial performance, such as a company’s cost of capital and tax structure, as well as the historic costs of depreciable assets, none of which are components of Adjusted EBITDA. Our presentation of Adjusted EBITDA should not be construed as an inference that our results will be unaffected by unusual or non-recurring items. Net Debt to Last Twelve Months (“LTM”) Adjusted EBITDA and Net Debt to Last Quarter Annualized (“LQA”) Adjusted EBITDA are non-GAAP measures. The Company defines Net Debt to LTM Adjusted EBITDA as the sum of total long-term debt less unrestricted cash and cash equivalents (as determined under U.S. GAAP), divided by the Company’s Adjusted EBITDA inclusive of annual pro-forma results from its acquisitions and disposition completed over the last twelve month period. The Company defines Net Debt to LQA Adjusted EBITDA as the sum of total long-term debt less unrestricted cash and cash equivalents (as determined under U.S. GAAP), divided by the Company’s current quarter annualized Adjusted EBITDA inclusive of pro-forma results from its disposition completed in the current period. The Company presents these metrics to help evaluate its capital structure, financial leverage, and forward-looking cash profile. The Company believes that that these metrics are widely used by industry professionals, research and credit analysts, and lending and rating agencies in the evaluation of total leverage. Discretionary Cash Flow (“DCF”) is defined by the Company as net cash provided by operating activities before changes in working capital and payments to settle asset retirement obligations and vested liability share-based awards. The Company has included this information because changes in operating assets and liabilities relate to the timing of cash receipts and disbursements, which the company may not control and the cashflow effect may not be reflected the period in which the operating activities occurred. We believe discretionary cash flow is a comparable metric against other companies in the industry and is a widely accepted financial indicator of an oil and natural gas company’s ability to generate cash for the use of internally funding their capital development program and to service or incur debt. Discretionary cash flow is not a measure of a company’s financial performance under GAAP and should not be considered as an alternative to net cash provided by operating activities (as defined under GAAP), or as a measure of liquidity, or as an alternative to net income.
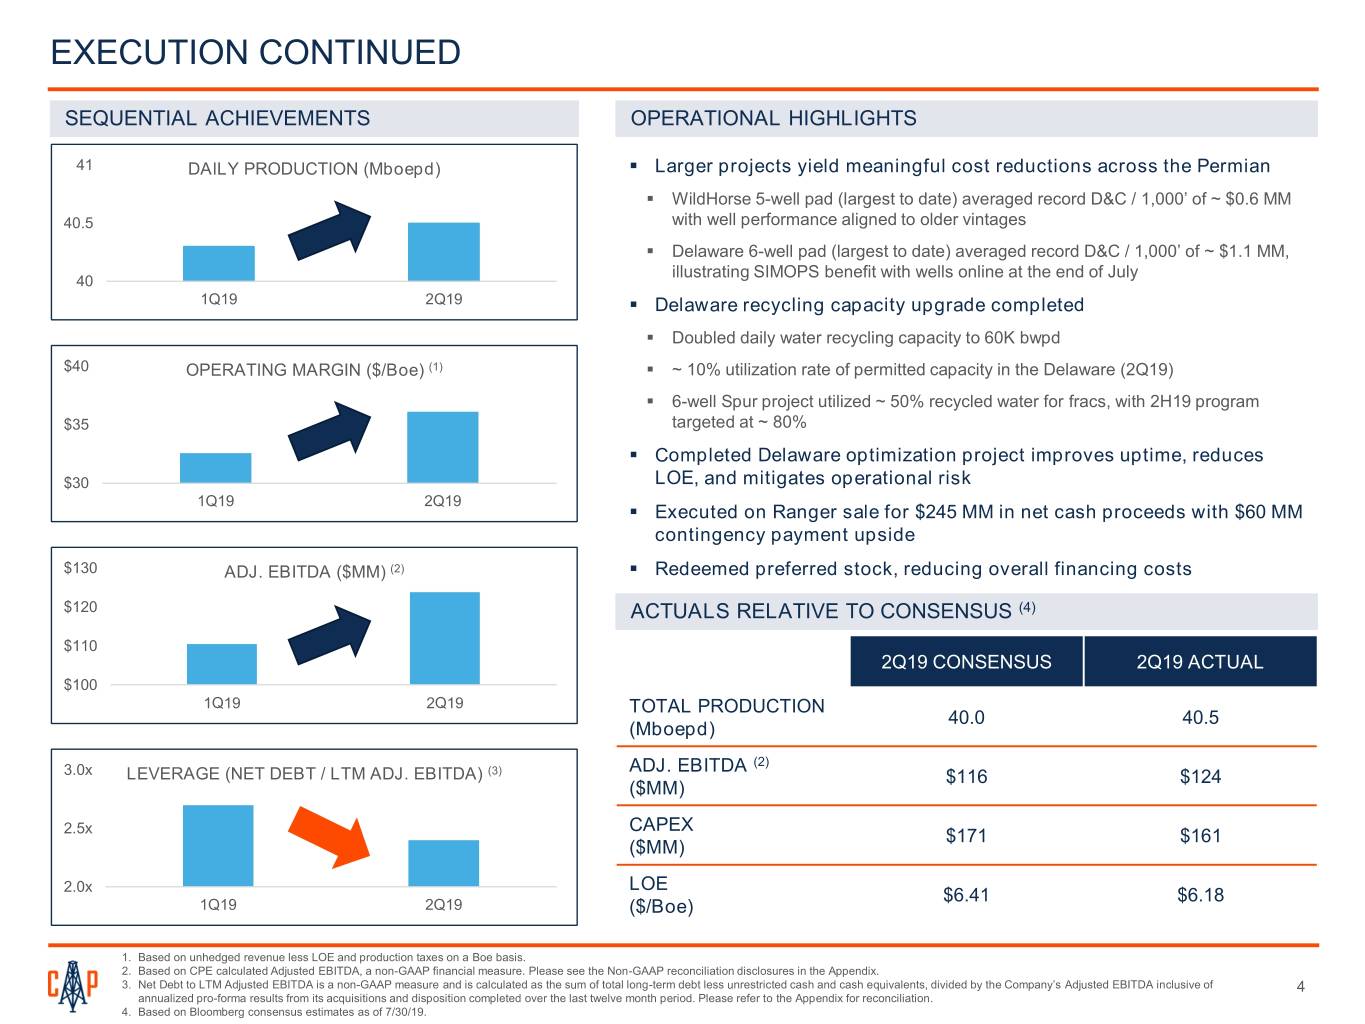
EXECUTION CONTINUED SEQUENTIAL ACHIEVEMENTS OPERATIONAL HIGHLIGHTS 41 DAILY PRODUCTION (Mboepd) . Larger projects yield meaningful cost reductions across the Permian . WildHorse 5-well pad (largest to date) averaged record D&C / 1,000’ of ~ $0.6 MM 40.5 with well performance aligned to older vintages . Delaware 6-well pad (largest to date) averaged record D&C / 1,000’ of ~ $1.1 MM, illustrating SIMOPS benefit with wells online at the end of July 40 1Q19 2Q19 . Delaware recycling capacity upgrade completed . Doubled daily water recycling capacity to 60K bwpd $40 OPERATING MARGIN ($/Boe) (1) . ~ 10% utilization rate of permitted capacity in the Delaware (2Q19) . 6-well Spur project utilized ~ 50% recycled water for fracs, with 2H19 program $35 targeted at ~ 80% . Completed Delaware optimization project improves uptime, reduces $30 LOE, and mitigates operational risk 1Q19 2Q19 . Executed on Ranger sale for $245 MM in net cash proceeds with $60 MM contingency payment upside $130 ADJ. EBITDA ($MM) (2) . Redeemed preferred stock, reducing overall financing costs $120 ACTUALS RELATIVE TO CONSENSUS (4) $110 2Q19 CONSENSUS 2Q19 ACTUAL $100 1Q19 2Q19 TOTAL PRODUCTION 40.0 40.5 (Mboepd) ADJ. EBITDA (2) 3.0x LEVERAGE (NET DEBT / LTM ADJ. EBITDA) (3) $116 $124 ($MM) CAPEX 2.5x $171 $161 ($MM) LOE 2.0x $6.41 $6.18 1Q19 2Q19 ($/Boe) 1. Based on unhedged revenue less LOE and production taxes on a Boe basis. 2. Based on CPE calculated Adjusted EBITDA, a non-GAAP financial measure. Please see the Non-GAAP reconciliation disclosures in the Appendix. 3. Net Debt to LTM Adjusted EBITDA is a non-GAAP measure and is calculated as the sum of total long-term debt less unrestricted cash and cash equivalents, divided by the Company’s Adjusted EBITDA inclusive of 4 annualized pro-forma results from its acquisitions and disposition completed over the last twelve month period. Please refer to the Appendix for reconciliation. 4. Based on Bloomberg consensus estimates as of 7/30/19.
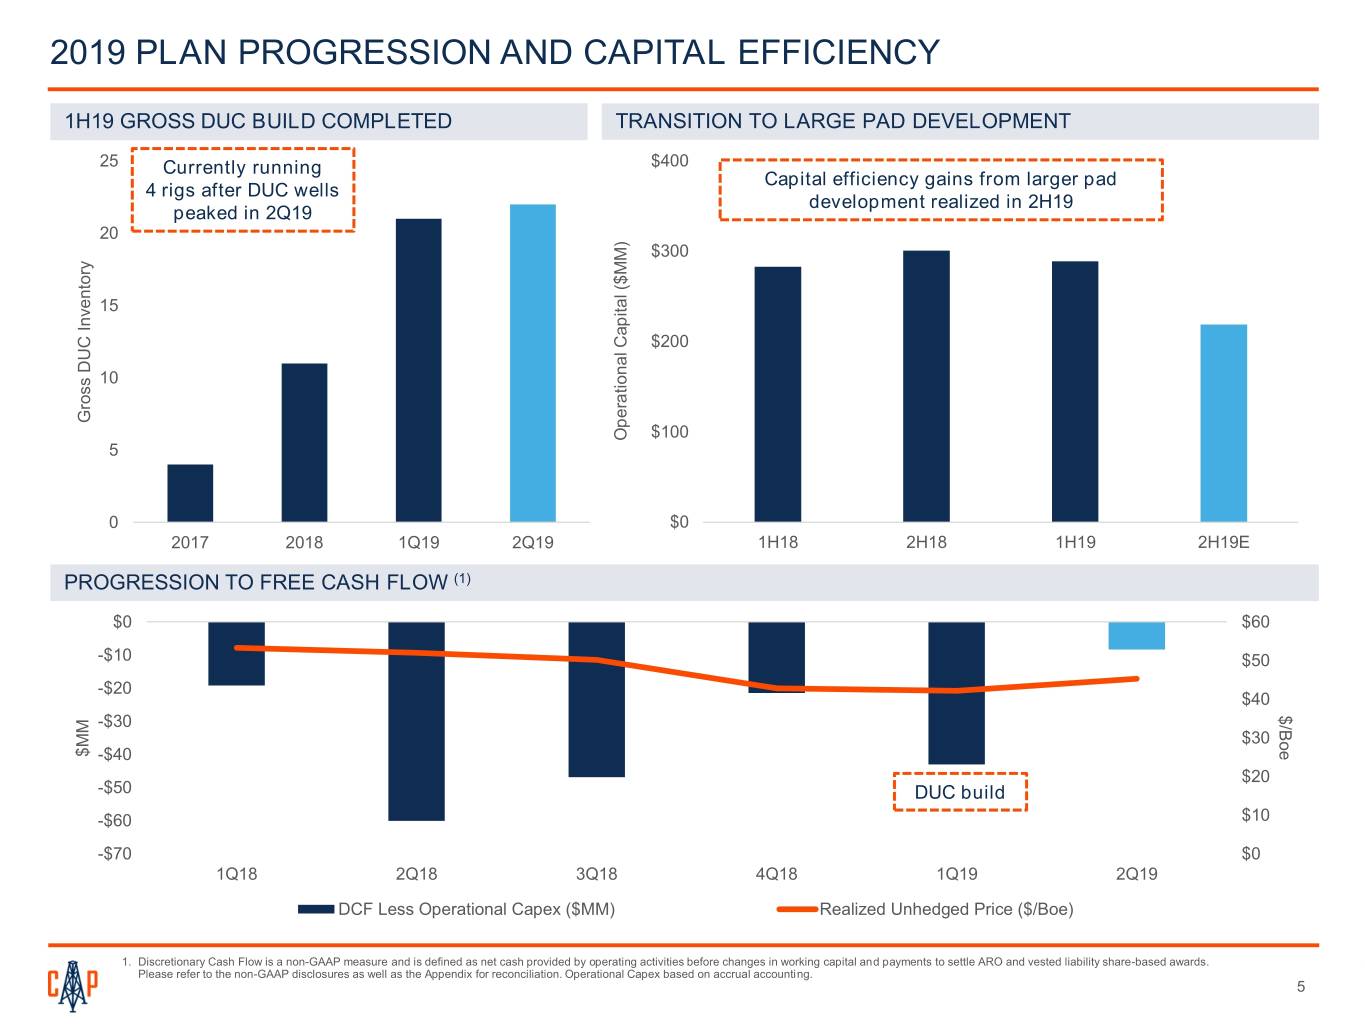
2019 PLAN PROGRESSION AND CAPITAL EFFICIENCY 1H19 GROSS DUC BUILD COMPLETED TRANSITION TO LARGE PAD DEVELOPMENT 25 Currently running $400 Capital efficiency gains from larger pad 4 rigs after DUC wells development realized in 2H19 peaked in 2Q19 20 $300 15 $200 10 Gross DUC Inventory DUC Gross Operational Capital ($MM) CapitalOperational $100 5 0 $0 2017 2018 1Q19 2Q19 1H18 2H18 1H19 2H19E PROGRESSION TO FREE CASH FLOW (1) $0 $60 -$10 $50 -$20 $40 $/ -$30 Boe $30 $MM -$40 $20 -$50 DUC build -$60 $10 -$70 $0 1Q18 2Q18 3Q18 4Q18 1Q19 2Q19 DCF Less Operational Capex ($MM) Realized Unhedged Price ($/Boe) 1. Discretionary Cash Flow is a non-GAAP measure and is defined as net cash provided by operating activities before changes in working capital and payments to settle ARO and vested liability share-based awards. Please refer to the non-GAAP disclosures as well as the Appendix for reconciliation. Operational Capex based on accrual accounting. 5
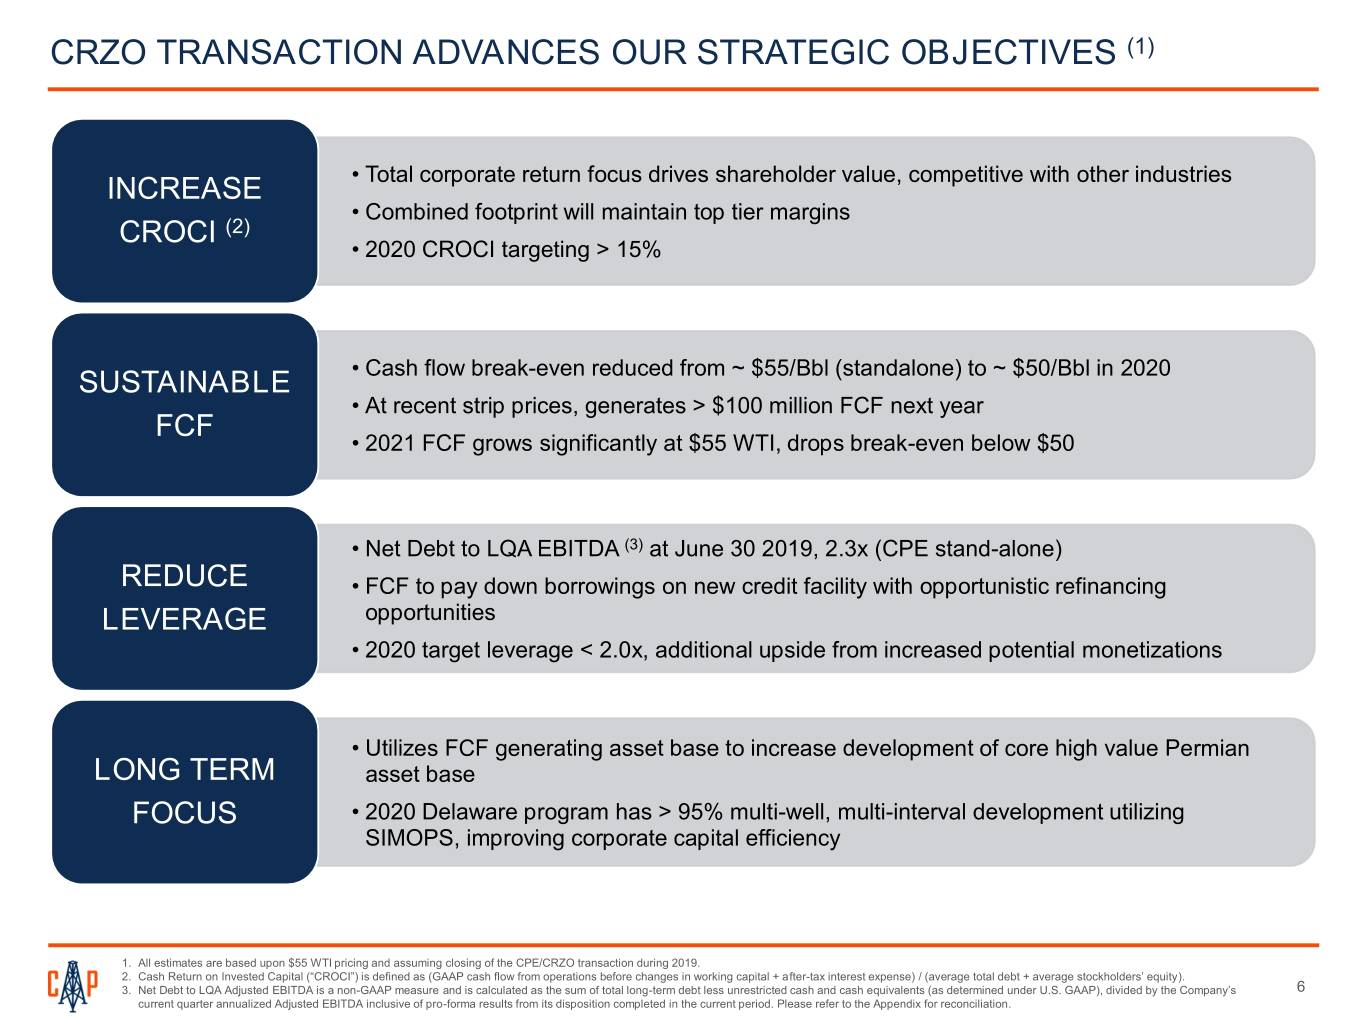
CRZO TRANSACTION ADVANCES OUR STRATEGIC OBJECTIVES (1) INCREASE • Total corporate return focus drives shareholder value, competitive with other industries • Combined footprint will maintain top tier margins CROCI (2) • 2020 CROCI targeting > 15% SUSTAINABLE • Cash flow break-even reduced from ~ $55/Bbl (standalone) to ~ $50/Bbl in 2020 • At recent strip prices, generates > $100 million FCF next year FCF • 2021 FCF grows significantly at $55 WTI, drops break-even below $50 • Net Debt to LQA EBITDA (3) at June 30 2019, 2.3x (CPE stand-alone) REDUCE • FCF to pay down borrowings on new credit facility with opportunistic refinancing LEVERAGE opportunities • 2020 target leverage < 2.0x, additional upside from increased potential monetizations • Utilizes FCF generating asset base to increase development of core high value Permian LONG TERM asset base FOCUS • 2020 Delaware program has > 95% multi-well, multi-interval development utilizing SIMOPS, improving corporate capital efficiency 1. All estimates are based upon $55 WTI pricing and assuming closing of the CPE/CRZO transaction during 2019. 2. Cash Return on Invested Capital (“CROCI”) is defined as (GAAP cash flow from operations before changes in working capital + after-tax interest expense) / (average total debt + average stockholders’ equity). 3. Net Debt to LQA Adjusted EBITDA is a non-GAAP measure and is calculated as the sum of total long-term debt less unrestricted cash and cash equivalents (as determined under U.S. GAAP), divided by the Company’s 6 current quarter annualized Adjusted EBITDA inclusive of pro-forma results from its disposition completed in the current period. Please refer to the Appendix for reconciliation.

“TEXAS STRONG”: CREATING THE PREMIER OILY MID-CAP COMPANY CAPITAL EFFICIENT OIL-WEIGHTED RETURNS CENTRALIZED IN TEXAS FCF YIELD COMPETITIVE ACROSS SECTORS AND PEERS DELAWARE - ATTRACTIVE FINANCIAL PROFILE WITH DELEVERAGING UPSIDE PERMIAN PERMIAN 2020E Capital Allocation: OPERATIONAL FLEXIBILITY AND PRICE ~50% DIVERSIFCATION PRO FORMA OVERVIEW 2Q19 production mboepd (1) 106.1 MIDLAND 2020E rigs ~ 9 - LTM Adj. EBITDA (2Q19) (2) $1.2 billion (LTM) YE18 SEC PV-10 ~ $7.0 billion FORD EAGLE YE18 SEC PD PV-10 ~ $4.4 billion 2020E Capital Allocation: PERMIAN 2020E Capital Allocation: Enterprise Value (3) ~ $4.9 billion ~25% ~25% ~200,000 Net Acres 1. Based on CPE actuals and CRZO pre-released guidance. 2. Based on CPE actuals and 2Q19 CRZO consensus estimates as of 7/31/19. 3. Based on 8/5/19 prices, 2Q19 CPE net debt and 1Q19 CRZO net debt, plus preferred. 7
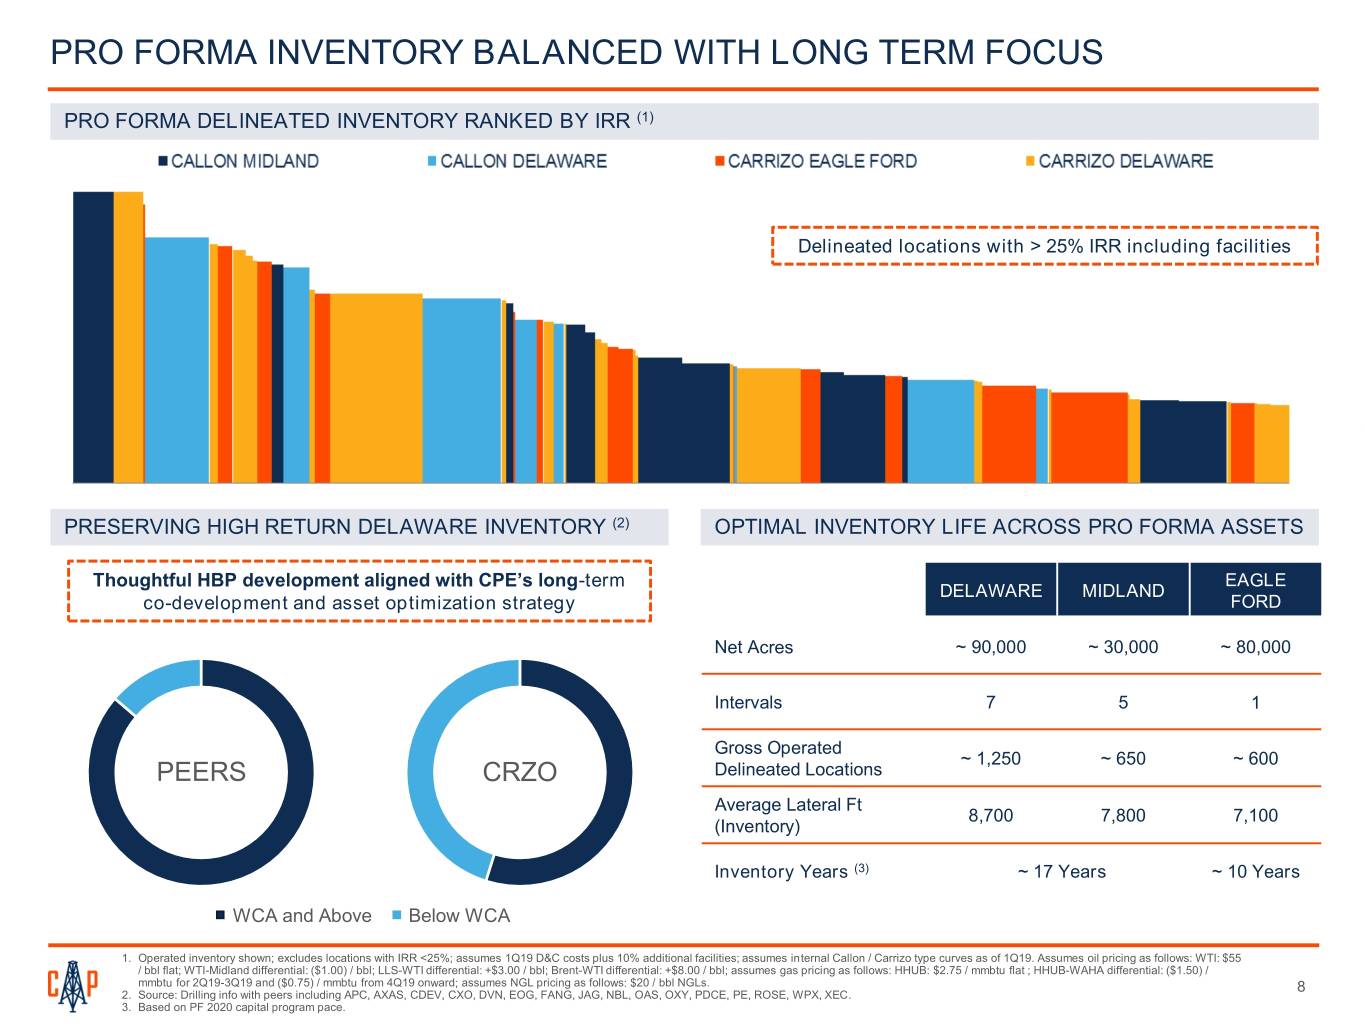
PRO FORMA INVENTORY BALANCED WITH LONG TERM FOCUS PRO FORMA DELINEATED INVENTORY RANKED BY IRR (1) Delineated locations with > 25% IRR including facilities PRESERVING HIGH RETURN DELAWARE INVENTORY (2) OPTIMAL INVENTORY LIFE ACROSS PRO FORMA ASSETS Thoughtful HBP development aligned with CPE’s long-term EAGLE DELAWARE MIDLAND co-development and asset optimization strategy FORD Net Acres ~ 90,000 ~ 30,000 ~ 80,000 Intervals 7 5 1 Gross Operated ~ 1,250 ~ 650 ~ 600 PEERS CRZO Delineated Locations Average Lateral Ft 8,700 7,800 7,100 (Inventory) Inventory Years (3) ~ 17 Years ~ 10 Years WCA and Above Below WCA 1. Operated inventory shown; excludes locations with IRR <25%; assumes 1Q19 D&C costs plus 10% additional facilities; assumes internal Callon / Carrizo type curves as of 1Q19. Assumes oil pricing as follows: WTI: $55 / bbl flat; WTI-Midland differential: ($1.00) / bbl; LLS-WTI differential: +$3.00 / bbl; Brent-WTI differential: +$8.00 / bbl; assumes gas pricing as follows: HHUB: $2.75 / mmbtu flat ; HHUB-WAHA differential: ($1.50) / mmbtu for 2Q19-3Q19 and ($0.75) / mmbtu from 4Q19 onward; assumes NGL pricing as follows: $20 / bbl NGLs. 8 2. Source: Drilling info with peers including APC, AXAS, CDEV, CXO, DVN, EOG, FANG, JAG, NBL, OAS, OXY, PDCE, PE, ROSE, WPX, XEC. 3. Based on PF 2020 capital program pace.

LEADING SOUTHERN DELAWARE WELL PERFORMANCE (1) SOUTHERN DELAWARE WCA WELLS ACROSS PEERS WCA RESULTS BY OPERATOR (2017+) (2) 100% 90% 80% 70% 60% 50% 40% 30% 20% CPE Well Count and Production Distribution Plot P(x) Plot Distribution Production and Count Well 10% CRZO 0% Average 6 Month Cumulative Production Boe (20:1 Oil Gas Conversion) 20,000 18,000 16,000 Boe 14,000 12,000 10,000 8,000 (20:1 Conversion)(20:1 6,000 4,000 Average 6 Month Cumulative 6 Month Average 2,000 0 Peer 1 Peer 2 CRZO CPE Peer 3 Peer 4 Peer 5 Peer 6 Peer 7 Peer 8 Peer 9 Peer Peer 10 11 1. Source: All well data sourced from drilling info with wells drilled and completed by operator. 2. P50 represents the average well performance by each operator for Wolfcamp A wells brought online in the Southern Delaware from 2017-current and have at least 6 months of publicly available production data. 9
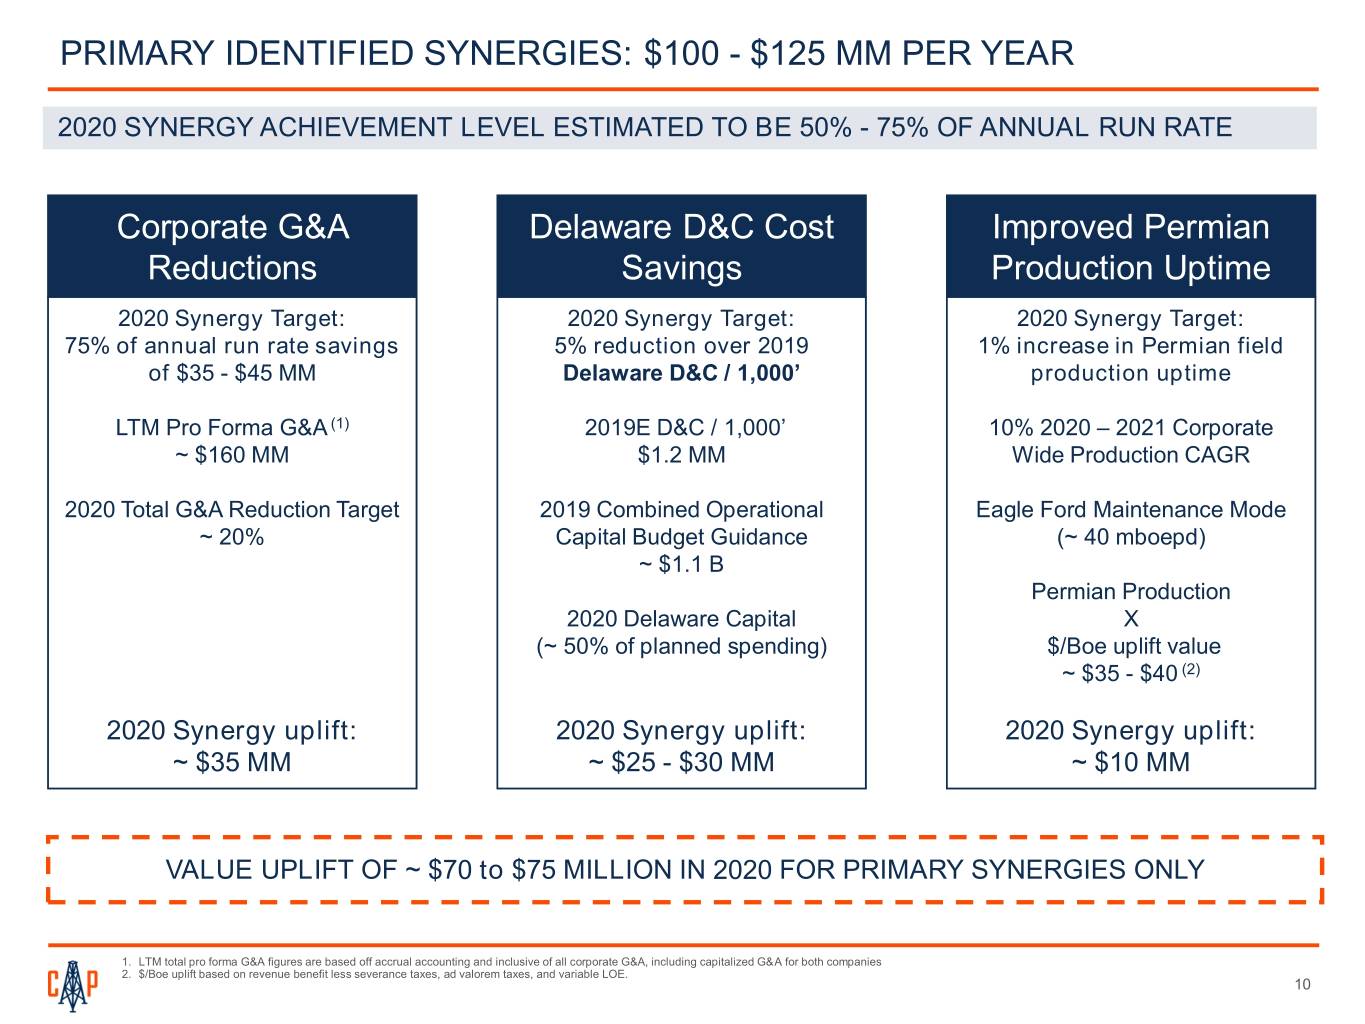
PRIMARY IDENTIFIED SYNERGIES: $100 - $125 MM PER YEAR 2020 SYNERGY ACHIEVEMENT LEVEL ESTIMATED TO BE 50% - 75% OF ANNUAL RUN RATE Corporate G&A Delaware D&C Cost Improved Permian Reductions Savings Production Uptime 2020 Synergy Target: 2020 Synergy Target: 2020 Synergy Target: 75% of annual run rate savings 5% reduction over 2019 1% increase in Permian field of $35 - $45 MM Delaware D&C / 1,000’ production uptime LTM Pro Forma G&A (1) 2019E D&C / 1,000’ 10% 2020 – 2021 Corporate ~ $160 MM $1.2 MM Wide Production CAGR 2020 Total G&A Reduction Target 2019 Combined Operational Eagle Ford Maintenance Mode ~ 20% Capital Budget Guidance (~ 40 mboepd) ~ $1.1 B Permian Production 2020 Delaware Capital X (~ 50% of planned spending) $/Boe uplift value ~ $35 - $40 (2) 2020 Synergy uplift: 2020 Synergy uplift: 2020 Synergy uplift: ~ $35 MM ~ $25 - $30 MM ~ $10 MM VALUE UPLIFT OF ~ $70 to $75 MILLION IN 2020 FOR PRIMARY SYNERGIES ONLY 1. LTM total pro forma G&A figures are based off accrual accounting and inclusive of all corporate G&A, including capitalized G&A for both companies 2. $/Boe uplift based on revenue benefit less severance taxes, ad valorem taxes, and variable LOE. 10
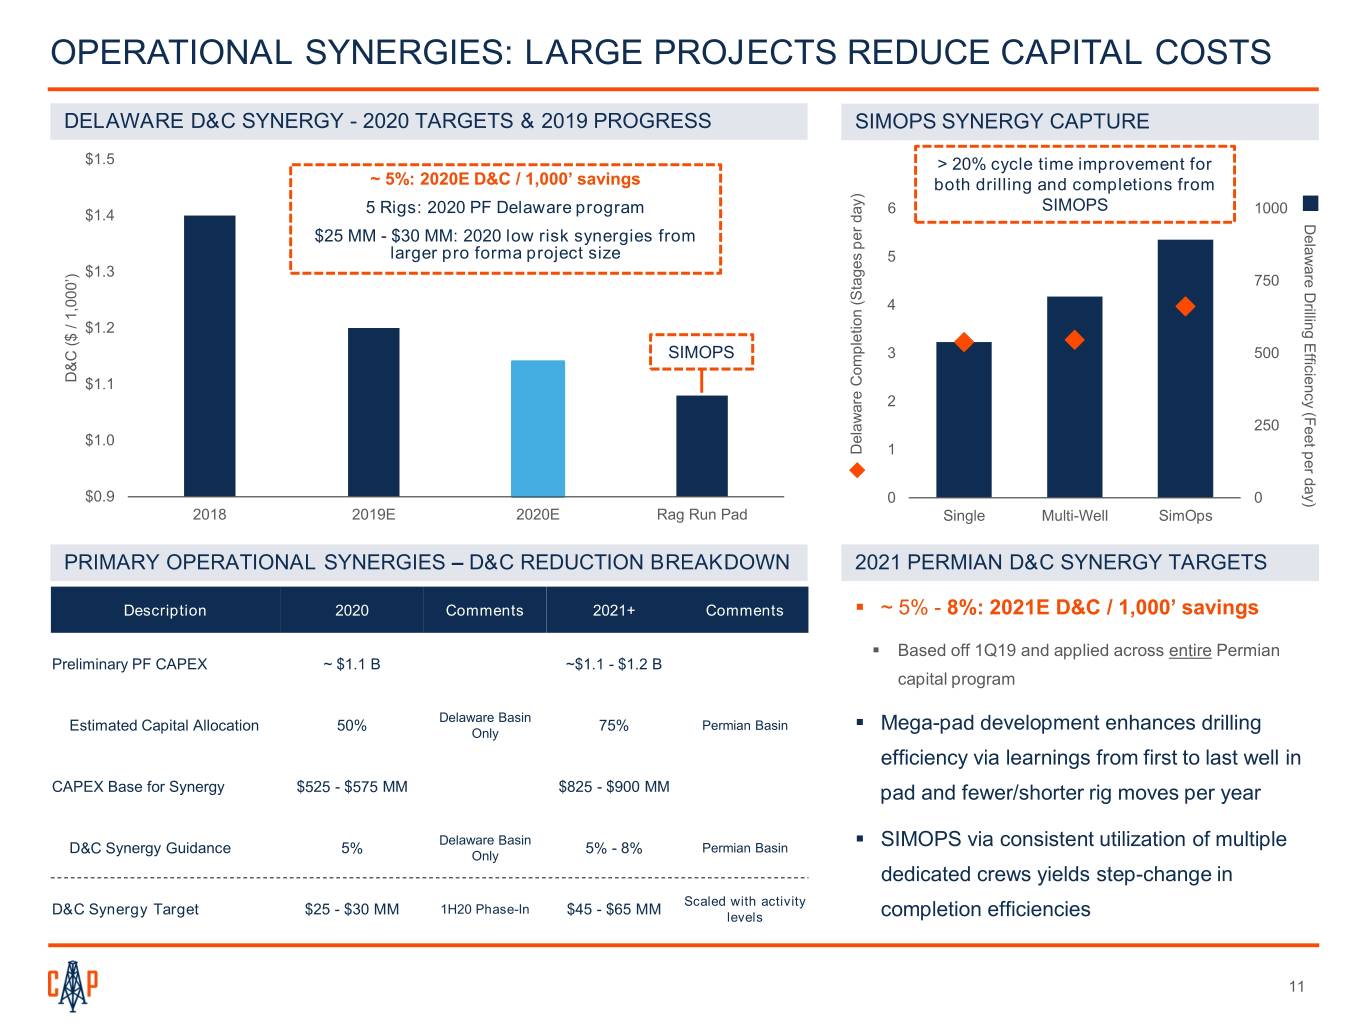
OPERATIONAL SYNERGIES: LARGE PROJECTS REDUCE CAPITAL COSTS DELAWARE D&C SYNERGY - 2020 TARGETS & 2019 PROGRESS SIMOPS SYNERGY CAPTURE $1.5 > 20% cycle time improvement for ~ 5%: 2020E D&C / 1,000’ savings both drilling and completions from SIMOPS $1.4 5 Rigs: 2020 PF Delaware program 6 1000 DelawareDrilling Efficiency (Feet perday) $25 MM - $30 MM: 2020 low risk synergies from larger pro forma project size 5 $1.3 750 4 $1.2 SIMOPS 3 500 D&C ($ 1,000’) /($ D&C $1.1 2 250 $1.0 Delaware Completion (Stages per day) per (Stages Completion Delaware 1 $0.9 0 0 2018 2019E 2020E Rag Run Pad Single Multi-Well SimOps PRIMARY OPERATIONAL SYNERGIES – D&C REDUCTION BREAKDOWN 2021 PERMIAN D&C SYNERGY TARGETS Description 2020 Comments 2021+ Comments . ~ 5% - 8%: 2021E D&C / 1,000’ savings . Based off 1Q19 and applied across entire Permian Preliminary PF CAPEX ~ $1.1 B ~$1.1 - $1.2 B capital program Delaware Basin Estimated Capital Allocation 50% 75% Permian Basin . Mega-pad development enhances drilling Only efficiency via learnings from first to last well in CAPEX Base for Synergy $525 - $575 MM $825 - $900 MM pad and fewer/shorter rig moves per year Delaware Basin D&C Synergy Guidance 5% 5% - 8% Permian Basin . SIMOPS via consistent utilization of multiple Only dedicated crews yields step-change in Scaled with activity D&C Synergy Target $25 - $30 MM 1H20 Phase-In $45 - $65 MM levels completion efficiencies 11
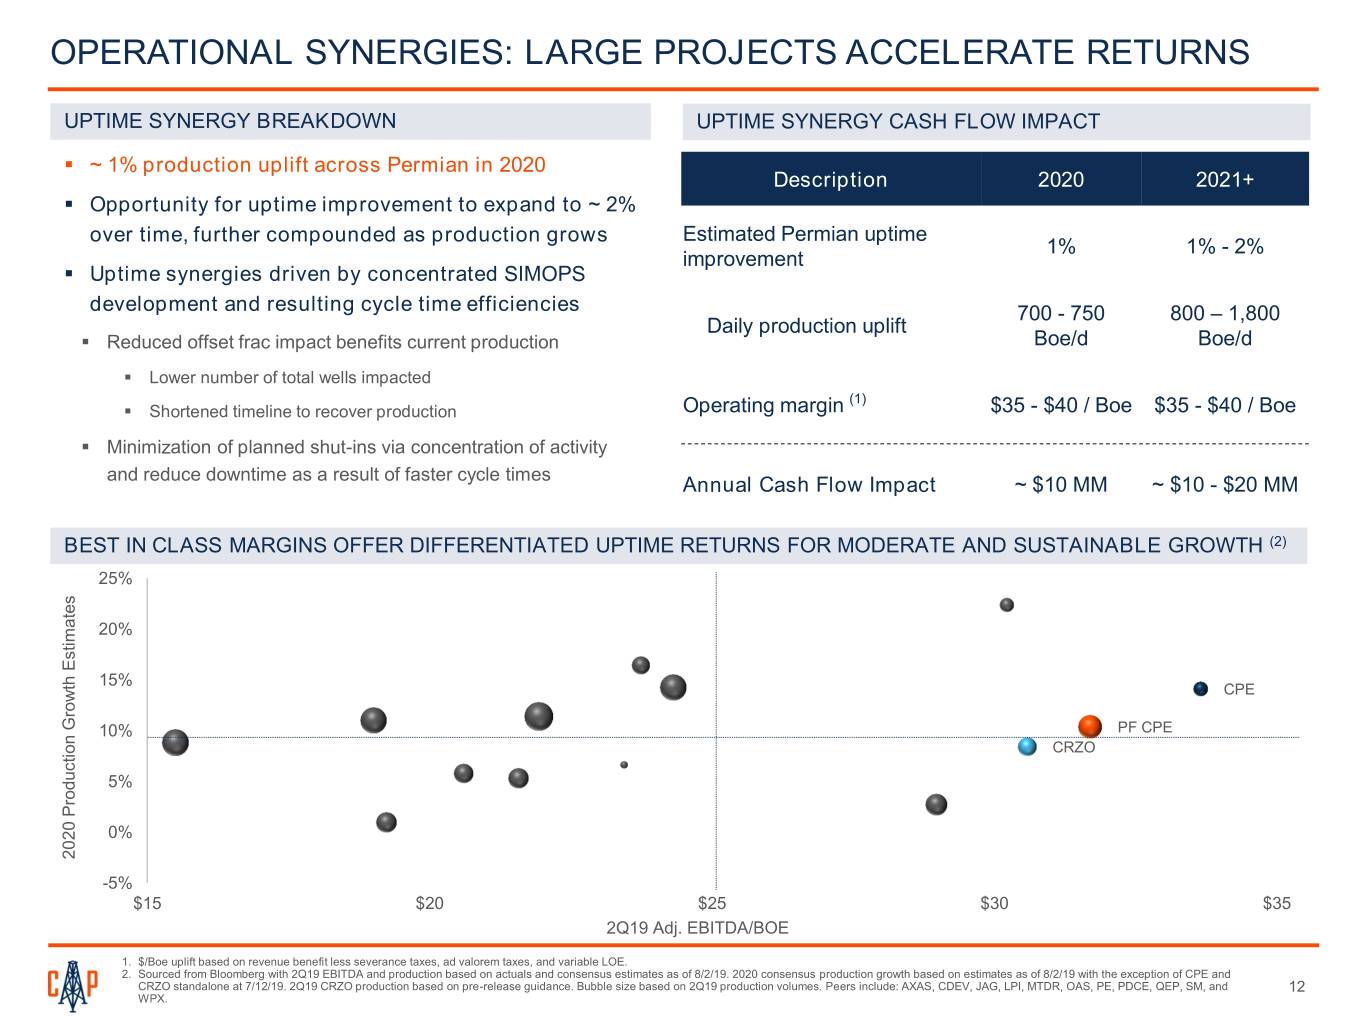
OPERATIONAL SYNERGIES: LARGE PROJECTS ACCELERATE RETURNS UPTIME SYNERGY BREAKDOWN UPTIME SYNERGY CASH FLOW IMPACT . ~ 1% production uplift across Permian in 2020 Description 2020 2021+ . Opportunity for uptime improvement to expand to ~ 2% over time, further compounded as production grows Estimated Permian uptime 1% 1% - 2% improvement . Uptime synergies driven by concentrated SIMOPS development and resulting cycle time efficiencies 700 - 750 800 – 1,800 Daily production uplift . Reduced offset frac impact benefits current production Boe/d Boe/d . Lower number of total wells impacted (1) . Shortened timeline to recover production Operating margin $35 - $40 / Boe $35 - $40 / Boe . Minimization of planned shut-ins via concentration of activity and reduce downtime as a result of faster cycle times Annual Cash Flow Impact ~ $10 MM ~ $10 - $20 MM BEST IN CLASS MARGINS OFFER DIFFERENTIATED UPTIME RETURNS FOR MODERATE AND SUSTAINABLE GROWTH (2) 25% JAG US Equity 20% MTDR US Equity 15% PE US Equity CPE PDCE US Equity WPX US Equity 10% PF CPE SM US Equity CRZO CDEV US Equity AXAS US Equity 5% QEP US Equity OAS US Equity LPI US Equity 0% 2020 Production Growth Estimates ProductionGrowth 2020 -5% $15 $20 $25 $30 $35 2Q19 Adj. EBITDA/BOE 1. $/Boe uplift based on revenue benefit less severance taxes, ad valorem taxes, and variable LOE. 2. Sourced from Bloomberg with 2Q19 EBITDA and production based on actuals and consensus estimates as of 8/2/19. 2020 consensus production growth based on estimates as of 8/2/19 with the exception of CPE and CRZO standalone at 7/12/19. 2Q19 CRZO production based on pre-release guidance. Bubble size based on 2Q19 production volumes. Peers include: AXAS, CDEV, JAG, LPI, MTDR, OAS, PE, PDCE, QEP, SM, and 12 WPX.

RISK MANAGEMENT AMID MACRO UNCERTAINTY RISK MANAGEMENT PHILOSOPHY MARKETING EFFORTS DIVERSIFY PRICING EXPOSURE . Hedge strategy 45 2Q21: ~ 40 mb/d gross CPE 40 Permian volumes linked to . Target 40 – 60% of production with focus on protecting cash flow MEH/International pricing . Link risk management tools to physical delivery points to avoid 35 dislocation 30 . Mix of collars and puts strategy provides upside participation 25 . Marketing strategy 20 . < 40% Midland pricing exposure (excluding CRZO Eagle Ford) 15 . Oil sales agreements are into local onshore markets and do not 10 rely on export capacity Gross CPE Volumes Linked to LinkedVolumes CPE Gross MEH/International Pricing (Mb/d) PricingMEH/International . Gas marketing agreements align the interest of buyer with CPE 5 for surety of movement 0 1Q20 1Q20 3Q20 2Q21 HISTORICAL OIL HEDGE POSITIONS 40,000 Swaps 3-Way Collar 2-Way Collar Def Prem Put Put Spread Unhedged Volumes 35,000 30,000 /d 25,000 Bbl 20,000 15,000 Cumulative 10,000 5,000 0 1Q18 2Q18 3Q18 4Q18 1Q19 2Q19 13
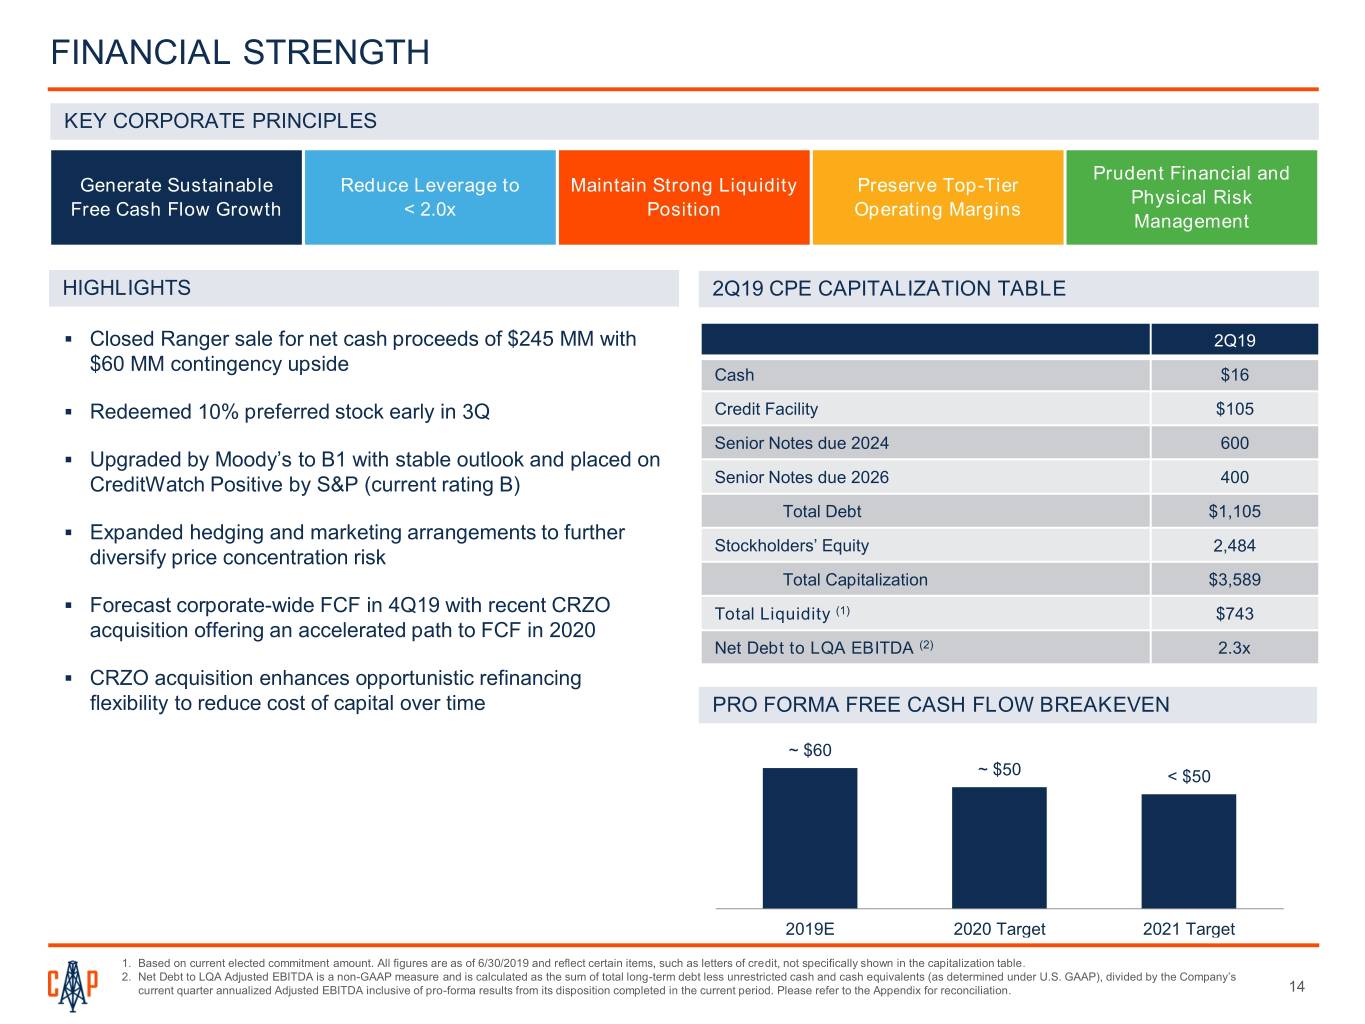
FINANCIAL STRENGTH KEY CORPORATE PRINCIPLES Prudent Financial and Generate Sustainable Reduce Leverage to Maintain Strong Liquidity Preserve Top-Tier Physical Risk Free Cash Flow Growth < 2.0x Position Operating Margins Management HIGHLIGHTS 2Q19 CPE CAPITALIZATION TABLE . Closed Ranger sale for net cash proceeds of $245 MM with 2Q19 $60 MM contingency upside Cash $16 . Redeemed 10% preferred stock early in 3Q Credit Facility $105 Senior Notes due 2024 600 . Upgraded by Moody’s to B1 with stable outlook and placed on CreditWatch Positive by S&P (current rating B) Senior Notes due 2026 400 Total Debt $1,105 . Expanded hedging and marketing arrangements to further Stockholders’ Equity 2,484 diversify price concentration risk Total Capitalization $3,589 . Forecast corporate-wide FCF in 4Q19 with recent CRZO Total Liquidity (1) $743 acquisition offering an accelerated path to FCF in 2020 Net Debt to LQA EBITDA (2) 2.3x . CRZO acquisition enhances opportunistic refinancing flexibility to reduce cost of capital over time PRO FORMA FREE CASH FLOW BREAKEVEN ~ $60 ~ $50 < $50 2019E 2020 Target 2021 Target 1. Based on current elected commitment amount. All figures are as of 6/30/2019 and reflect certain items, such as letters of credit, not specifically shown in the capitalization table. 2. Net Debt to LQA Adjusted EBITDA is a non-GAAP measure and is calculated as the sum of total long-term debt less unrestricted cash and cash equivalents (as determined under U.S. GAAP), divided by the Company’s current quarter annualized Adjusted EBITDA inclusive of pro-forma results from its disposition completed in the current period. Please refer to the Appendix for reconciliation. 14

COMBINATION ACCELERATES STRATEGIC PATH Relentless Pursuit of Capital Efficiency Differentiated Oil and • Clear economic benefits of scaled development model Gas Investment across portfolio Combining Repeatable • Sustainable “life of field” development of substantial Growth with Leading inventory Full-Cycle Cost of Supply • Balance of cash conversion cycle times Sustainable Free Cash Flow Growth • Preservation of leading cash margins • Rationalization of corporate costs • Combination of relatively mature production profiles • Double-digit production growth within cash flow Improved Financial Profile • Accelerated free cash flow for near-term debt reduction • Large, diversified asset base with opportunities for pruning • Visibility to improved cost of capital 15
APPENDIX
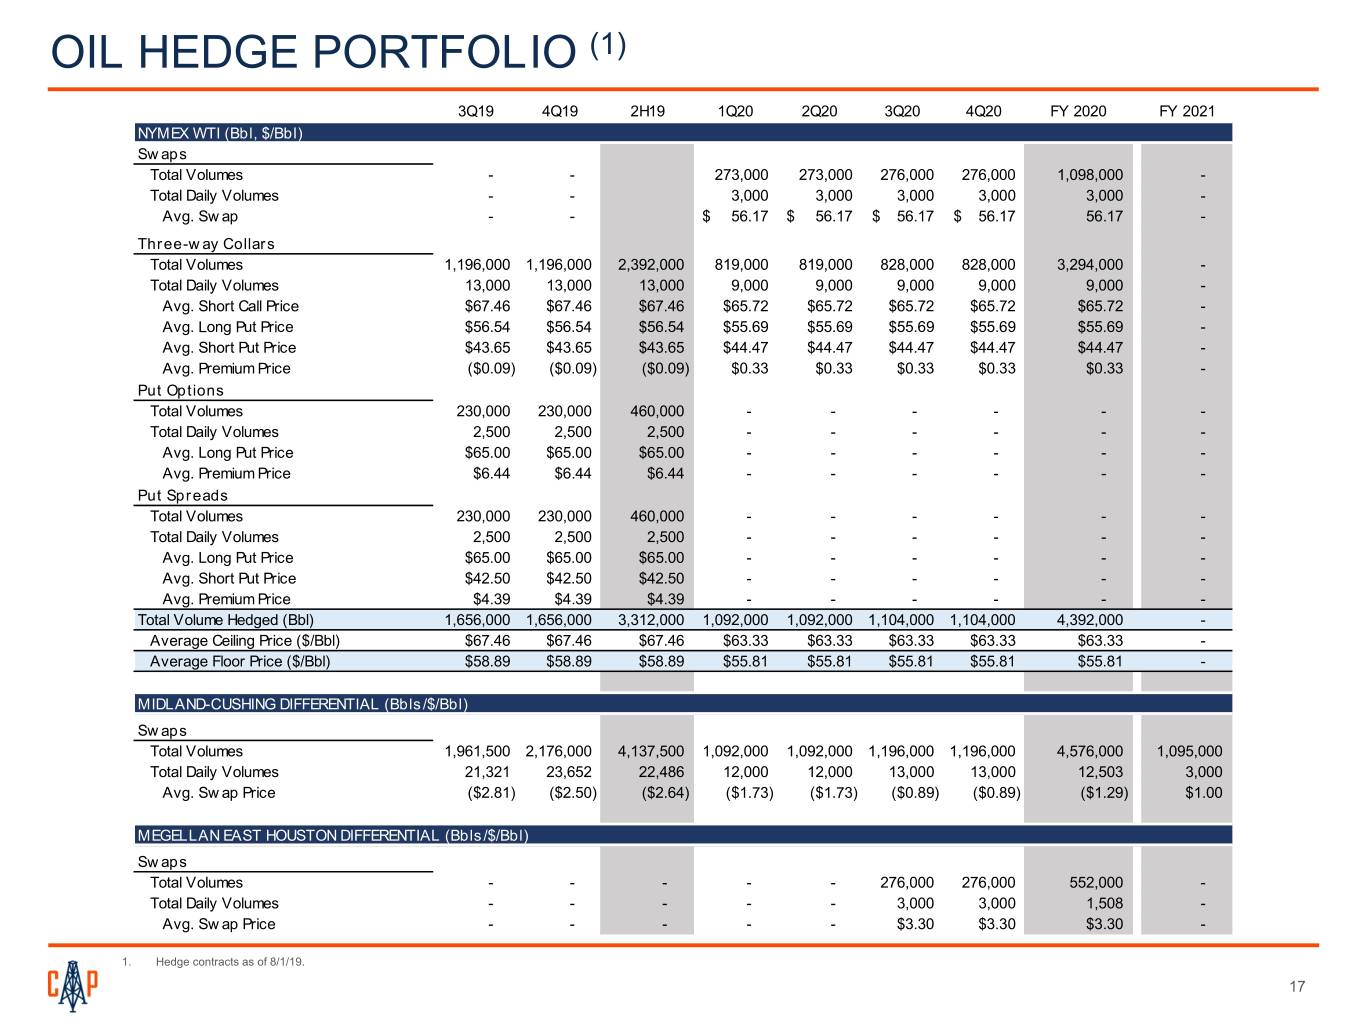
OIL HEDGE PORTFOLIO (1) 3Q19 4Q19 2H19 1Q20 2Q20 3Q20 4Q20 FY 2020 FY 2021 NYMEX WTI (Bbl, $/Bbl) Swaps Total Volumes - - 273,000 273,000 276,000 276,000 1,098,000 - Total Daily Volumes - - 3,000 3,000 3,000 3,000 3,000 - Avg. Sw ap - - $ 56.17 $ 56.17 $ 56.17 $ 56.17 56.17 - Three-way Collars Total Volumes 1,196,000 1,196,000 2,392,000 819,000 819,000 828,000 828,000 3,294,000 - Total Daily Volumes 13,000 13,000 13,000 9,000 9,000 9,000 9,000 9,000 - Avg. Short Call Price $67.46 $67.46 $67.46 $65.72 $65.72 $65.72 $65.72 $65.72 - Avg. Long Put Price $56.54 $56.54 $56.54 $55.69 $55.69 $55.69 $55.69 $55.69 - Avg. Short Put Price $43.65 $43.65 $43.65 $44.47 $44.47 $44.47 $44.47 $44.47 - Avg. Premium Price ($0.09) ($0.09) ($0.09) $0.33 $0.33 $0.33 $0.33 $0.33 - Put Options Total Volumes 230,000 230,000 460,000 - - - - - - Total Daily Volumes 2,500 2,500 2,500 - - - - - - Avg. Long Put Price $65.00 $65.00 $65.00 - - - - - - Avg. Premium Price $6.44 $6.44 $6.44 - - - - - - Put Spreads Total Volumes 230,000 230,000 460,000 - - - - - - Total Daily Volumes 2,500 2,500 2,500 - - - - - - Avg. Long Put Price $65.00 $65.00 $65.00 - - - - - - Avg. Short Put Price $42.50 $42.50 $42.50 - - - - - - Avg. Premium Price $4.39 $4.39 $4.39 - - - - - - Total Volume Hedged (Bbl) 1,656,000 1,656,000 3,312,000 1,092,000 1,092,000 1,104,000 1,104,000 4,392,000 - Average Ceiling Price ($/Bbl) $67.46 $67.46 $67.46 $63.33 $63.33 $63.33 $63.33 $63.33 - Average Floor Price ($/Bbl) $58.89 $58.89 $58.89 $55.81 $55.81 $55.81 $55.81 $55.81 - MIDLAND-CUSHING DIFFERENTIAL (Bbls/$/Bbl) Swaps Total Volumes 1,961,500 2,176,000 4,137,500 1,092,000 1,092,000 1,196,000 1,196,000 4,576,000 1,095,000 Total Daily Volumes 21,321 23,652 22,486 12,000 12,000 13,000 13,000 12,503 3,000 Avg. Sw ap Price ($2.81) ($2.50) ($2.64) ($1.73) ($1.73) ($0.89) ($0.89) ($1.29) $1.00 MEGELLAN EAST HOUSTON DIFFERENTIAL (Bbls/$/Bbl) Swaps Total Volumes - - - - - 276,000 276,000 552,000 - Total Daily Volumes - - - - - 3,000 3,000 1,508 - Avg. Sw ap Price - - - - - $3.30 $3.30 $3.30 - 1. Hedge contracts as of 8/1/19. 17
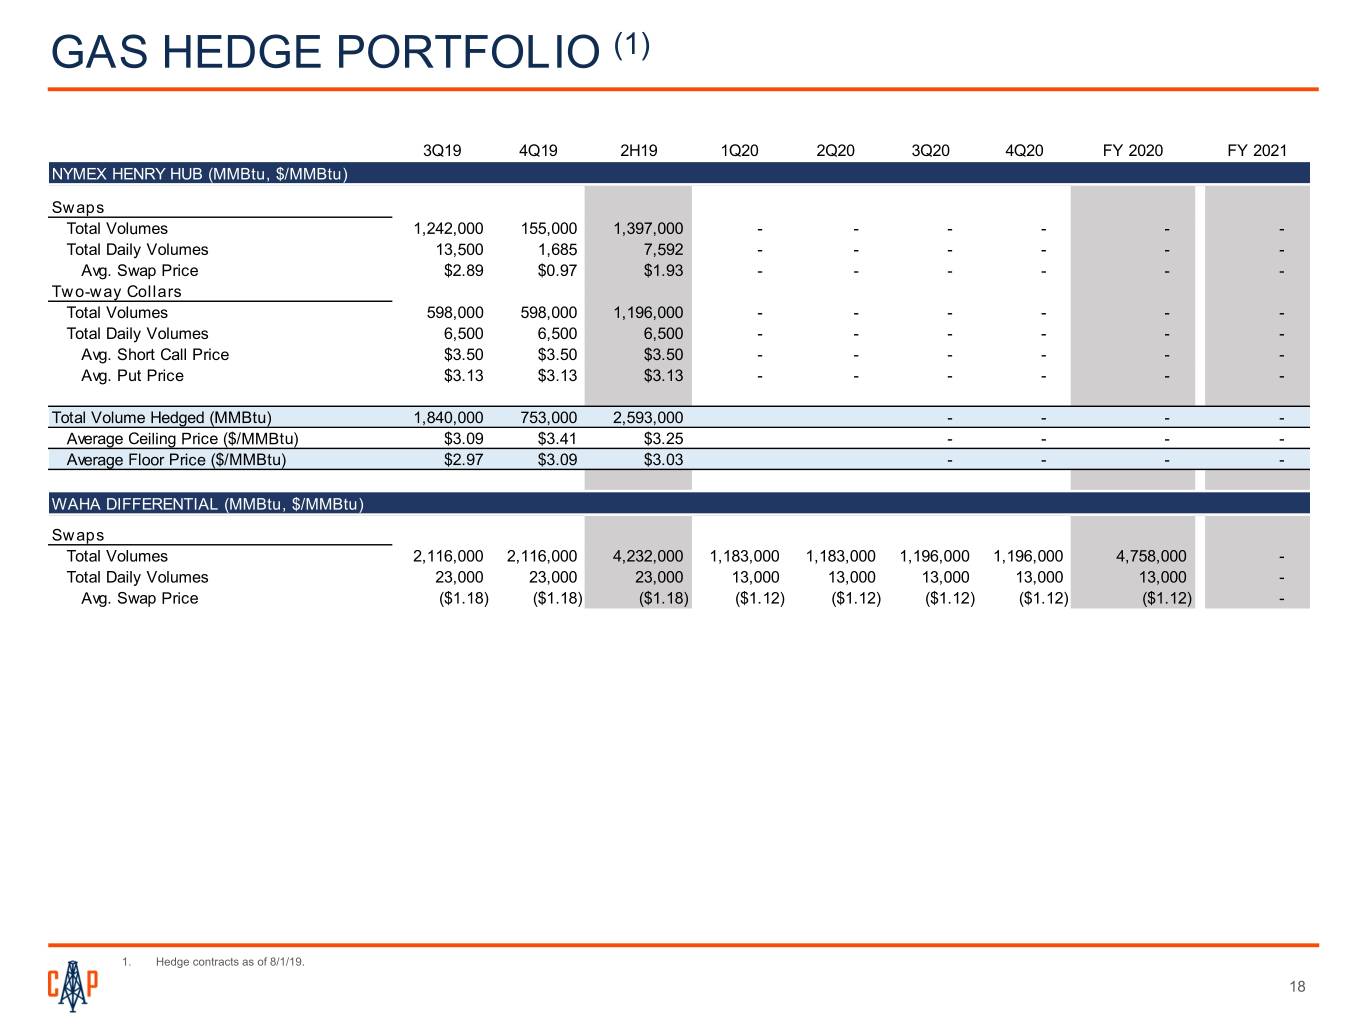
GAS HEDGE PORTFOLIO (1) 3Q19 4Q19 2H19 1Q20 2Q20 3Q20 4Q20 FY 2020 FY 2021 NYMEX HENRY HUB (MMBtu, $/MMBtu) Swaps Total Volumes 1,242,000 155,000 1,397,000 - - - - - - Total Daily Volumes 13,500 1,685 7,592 - - - - - - Avg. Swap Price $2.89 $0.97 $1.93 - - - - - - Two-way Collars Total Volumes 598,000 598,000 1,196,000 - - - - - - Total Daily Volumes 6,500 6,500 6,500 - - - - - - Avg. Short Call Price $3.50 $3.50 $3.50 - - - - - - Avg. Put Price $3.13 $3.13 $3.13 - - - - - - Total Volume Hedged (MMBtu) 1,840,000 753,000 2,593,000 - - - - Average Ceiling Price ($/MMBtu) $3.09 $3.41 $3.25 - - - - Average Floor Price ($/MMBtu) $2.97 $3.09 $3.03 - - - - WAHA DIFFERENTIAL (MMBtu, $/MMBtu) Swaps Total Volumes 2,116,000 2,116,000 4,232,000 1,183,000 1,183,000 1,196,000 1,196,000 4,758,000 - Total Daily Volumes 23,000 23,000 23,000 13,000 13,000 13,000 13,000 13,000 - Avg. Swap Price ($1.18) ($1.18) ($1.18) ($1.12) ($1.12) ($1.12) ($1.12) ($1.12) - 1. Hedge contracts as of 8/1/19. 18
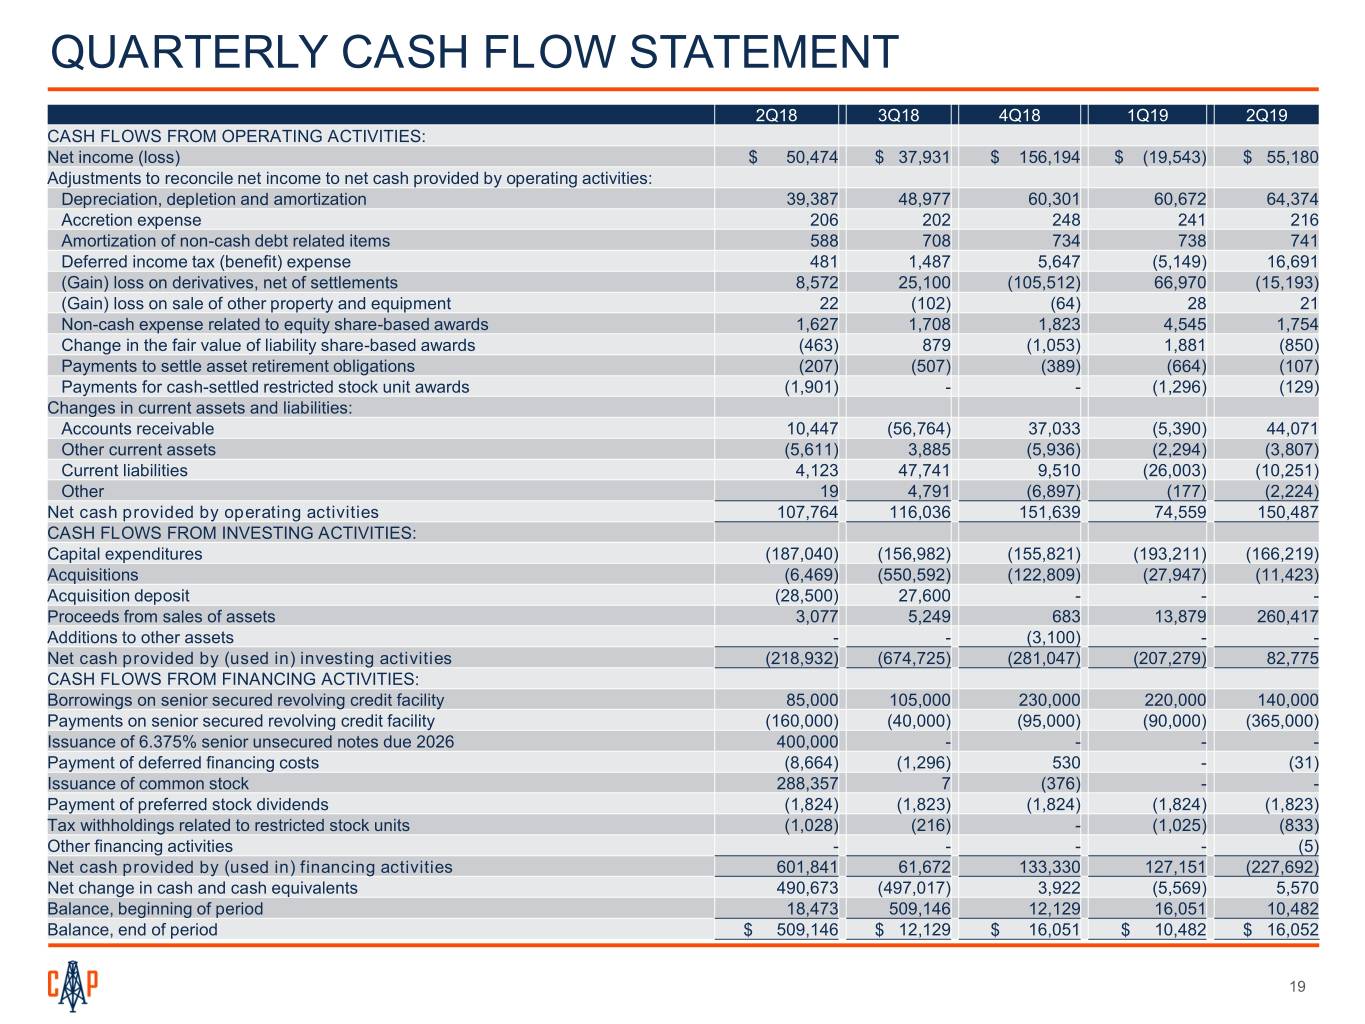
QUARTERLY CASH FLOW STATEMENT 2Q18 3Q18 4Q18 1Q19 2Q19 CASH FLOWS FROM OPERATING ACTIVITIES: Net income (loss) $ 50,474 $ 37,931 $ 156,194 $ (19,543) $ 55,180 Adjustments to reconcile net income to net cash provided by operating activities: Depreciation, depletion and amortization 39,387 48,977 60,301 60,672 64,374 Accretion expense 206 202 248 241 216 Amortization of non-cash debt related items 588 708 734 738 741 Deferred income tax (benefit) expense 481 1,487 5,647 (5,149) 16,691 (Gain) loss on derivatives, net of settlements 8,572 25,100 (105,512) 66,970 (15,193) (Gain) loss on sale of other property and equipment 22 (102) (64) 28 21 Non-cash expense related to equity share-based awards 1,627 1,708 1,823 4,545 1,754 Change in the fair value of liability share-based awards (463) 879 (1,053) 1,881 (850) Payments to settle asset retirement obligations (207) (507) (389) (664) (107) Payments for cash-settled restricted stock unit awards (1,901) - - (1,296) (129) Changes in current assets and liabilities: Accounts receivable 10,447 (56,764) 37,033 (5,390) 44,071 Other current assets (5,611) 3,885 (5,936) (2,294) (3,807) Current liabilities 4,123 47,741 9,510 (26,003) (10,251) Other 19 4,791 (6,897) (177) (2,224) Net cash provided by operating activities 107,764 116,036 151,639 74,559 150,487 CASH FLOWS FROM INVESTING ACTIVITIES: Capital expenditures (187,040) (156,982) (155,821) (193,211) (166,219) Acquisitions (6,469) (550,592) (122,809) (27,947) (11,423) Acquisition deposit (28,500) 27,600 - - - Proceeds from sales of assets 3,077 5,249 683 13,879 260,417 Additions to other assets - - (3,100) - - Net cash provided by (used in) investing activities (218,932) (674,725) (281,047) (207,279) 82,775 CASH FLOWS FROM FINANCING ACTIVITIES: Borrowings on senior secured revolving credit facility 85,000 105,000 230,000 220,000 140,000 Payments on senior secured revolving credit facility (160,000) (40,000) (95,000) (90,000) (365,000) Issuance of 6.375% senior unsecured notes due 2026 400,000 - - - - Payment of deferred financing costs (8,664) (1,296) 530 - (31) Issuance of common stock 288,357 7 (376) - - Payment of preferred stock dividends (1,824) (1,823) (1,824) (1,824) (1,823) Tax withholdings related to restricted stock units (1,028) (216) - (1,025) (833) Other financing activities - - - - (5) Net cash provided by (used in) financing activities 601,841 61,672 133,330 127,151 (227,692) Net change in cash and cash equivalents 490,673 (497,017) 3,922 (5,569) 5,570 Balance, beginning of period 18,473 509,146 12,129 16,051 10,482 Balance, end of period $ 509,146 $ 12,129 $ 16,051 $ 10,482 $ 16,052 19
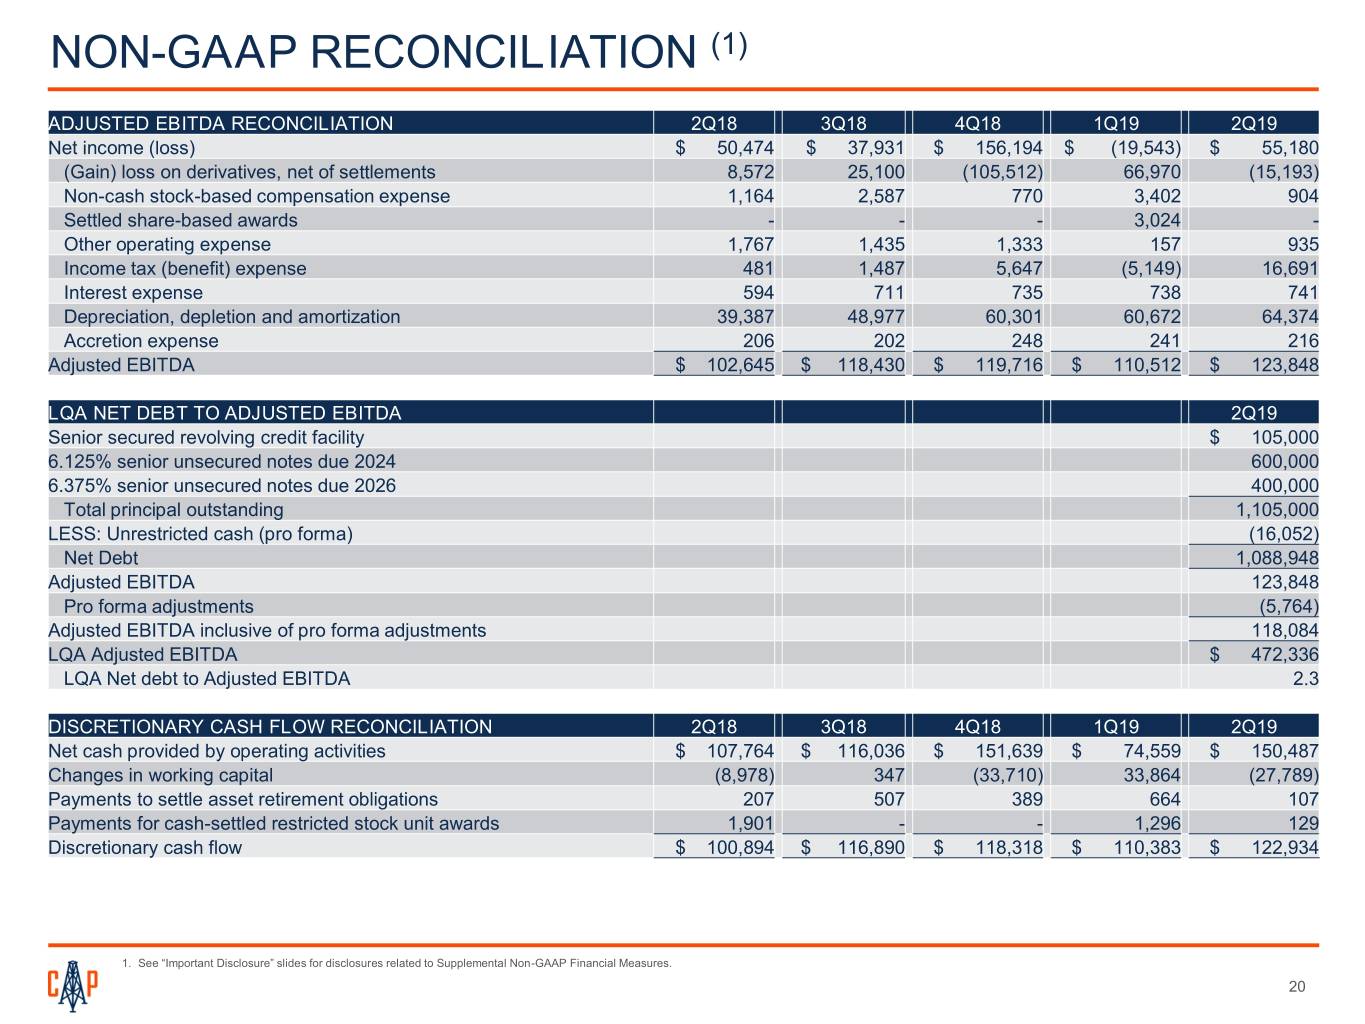
NON-GAAP RECONCILIATION (1) ADJUSTED EBITDA RECONCILIATION 2Q18 3Q18 4Q18 1Q19 2Q19 Net income (loss) $ 50,474 $ 37,931 $ 156,194 $ (19,543) $ 55,180 (Gain) loss on derivatives, net of settlements 8,572 25,100 (105,512) 66,970 (15,193) Non-cash stock-based compensation expense 1,164 2,587 770 3,402 904 Settled share-based awards - - - 3,024 - Other operating expense 1,767 1,435 1,333 157 935 Income tax (benefit) expense 481 1,487 5,647 (5,149) 16,691 Interest expense 594 711 735 738 741 Depreciation, depletion and amortization 39,387 48,977 60,301 60,672 64,374 Accretion expense 206 202 248 241 216 Adjusted EBITDA $ 102,645 $ 118,430 $ 119,716 $ 110,512 $ 123,848 LQA NET DEBT TO ADJUSTED EBITDA 2Q19 Senior secured revolving credit facility $ 105,000 6.125% senior unsecured notes due 2024 600,000 6.375% senior unsecured notes due 2026 400,000 Total principal outstanding 1,105,000 LESS: Unrestricted cash (pro forma) (16,052) Net Debt 1,088,948 Adjusted EBITDA 123,848 Pro forma adjustments (5,764) Adjusted EBITDA inclusive of pro forma adjustments 118,084 LQA Adjusted EBITDA $ 472,336 LQA Net debt to Adjusted EBITDA 2.3 DISCRETIONARY CASH FLOW RECONCILIATION 2Q18 3Q18 4Q18 1Q19 2Q19 Net cash provided by operating activities $ 107,764 $ 116,036 $ 151,639 $ 74,559 $ 150,487 Changes in working capital (8,978) 347 (33,710) 33,864 (27,789) Payments to settle asset retirement obligations 207 507 389 664 107 Payments for cash-settled restricted stock unit awards 1,901 - - 1,296 129 Discretionary cash flow $ 100,894 $ 116,890 $ 118,318 $ 110,383 $ 122,934 1. See “Important Disclosure” slides for disclosures related to Supplemental Non-GAAP Financial Measures. 20


