FORM 6-K
SECURITIES AND EXCHANGE COMMISSION
Washington, D.C. 20549
Report of Foreign Private Issuer
Pursuant to Rule 13a-16 or 15d-16
of the Securities Exchange Act of 1934
For the month of November, 2002
CSR Limited
(Translation of registrant’s name into English)
9 Help Street, Chatswood NSW 2067 AUSTRALIA
(Address of principal executive offices)
Indicate by check mark whether the registrant files or will file annual reports under cover Form 20-F or Form 40-F.
Form 20-F. ý Form 40-F..o
Indicate by check mark whether the registrant by furnishing the information contained in this Form is also thereby furnishing the information to the Commission pursuant to Rule 12g3-2(b) under the Securities Exchange Act of 1934.
Yes ..o. No ý
If “Yes” is marked, indicate below the file number assigned to the registrant in connection with Rule 12g3-2(b): 82- ________
CSR LIMITED
RESULTS FOR THE HALF YEAR ENDED 30 SEPTEMBER
Signatures
Pursuant to the requirements of the Securities Exchange Act of 1934, the registrant has duly caused this report to be signed on its behalf by the undersigned, thereunto duly authorized.
|
|
|
|
| CSR Limited |
|
| (Registrant) |
|
|
|
| By: | /s/ Luke Keighery |
|
| Luke Keighery |
|
| Manager, Investor Services |
Date 19 November, 2002

CSR LIMITED EARNINGS PER SHARE UP 17.2%
CSR Limited today announced that operating profit after tax (PAT) for the half year ended 30 September 2002 (HYES02) was A$319.4 million, up 15.3% on the previous corresponding period. Earnings per share (EPS) rose 17.2% to 34.1 cents.
Earnings before interest and tax (EBIT) was up 5.3% to A$541 million. Trading revenue was down 2.0% to A$3,638 million. EBIT/sales margins rose from 13.8% to 14.9%. Excluding the impact of a higher Australian dollar on US$ earnings, EBIT was up 10.5% and revenue was up 2.6%.
Other highlights
Measure |
| HYES02 result |
| Increase |
|
EBITDA |
| A$761m |
| 3% |
|
EBITDA/sales |
| 20.9% |
| 1.0 pp |
|
Net operating cash flow |
| A$554m |
| 2% |
|
Free cash flow* |
| A$479m |
| 33% |
|
Return on funds employed (ROFE)** # |
| 17.0% |
| 2.5 pp |
|
Return on equity (ROE)# |
| 14.3% |
| 1.6 pp |
|
Shareholder value added was again positive and up significantly on the previous year.
The heavy building materials businesses performed well, contributing 70% of CSR group EBIT. The US subsidiary, Rinker Materials Corporation (“Rinker”) delivered another solid result, with EBIT up 3% to US$176 million, although the stronger Australian dollar meant A$ EBIT fell 5% to A$320 million. Despite a tougher economic environment, all the major Rinker segments lifted US$ EBIT, apart from Concrete Pipe & Products. Construction Materials (Australia & Asia) delivered a very strong 81% increase EBIT, to A$59 million, due to improved margin management and operational improvement cost savings.
Building Products (Australia, NZ & Asia) EBIT was up 32% to A$63 million, helped by strong domestic housing activity. Aluminium EBIT rose 11% to A$61 million due mainly to lower costs. Sugar EBIT fell 25% on lower world prices, which impacted the milling business - although EBIT from the downstream businesses - mainly sugar refining and ethanol - rose 28%.
Directors declared an unchanged interim dividend of 11 cents per share, payable on 16 December. Franking increased to 70%, from 40% for the previous interim dividend.
Financial position
The group’s balance sheet remained very strong with net debt at end September of A$2,311 million, following the acquisition of Kiewit Materials Company, up from A$2,130 million a year earlier. Gearing (net debt / net debt plus equity) was 35.2% from 34.0%. Interest cover was 11.8 times, up from 8.0 times.
Overview
“This is another very pleasing result which reflects the strength of the group’s market positions and the hard work we have put in to improve our base businesses,” said CEO & Managing Director Peter Kirby. “Rinker’s position in Florida, and in high growth southern US states, helped offset the impact of a weak non-residential sector which hit the concrete pipe and products business particularly hard. In Australia, improvements in Construction Materials, bricks and roofing, and the downstream sugar businesses, also contributed strongly.”
* EBITDA after deducting tax and net interest paid, operating capital and change in working capital
** Excluding acquisition of Kiewit Materials Company, acquired 26 September 2002 # on a 12 month basis
CSR Limited ABN 90 000 001 276. Corporate and Investor Relations Group
Level 3, 9 Help Street, Chatswood NSW 2067, Locked Bag 6, Chatswood NSW 2057, Australia
Telephone (02) 9235 8171 Facsimile (02) 9235 8140 E-mail investorrelations@csr.com.au
Mr Kirby said Rinker’s US acquisitions are also performing well overall - in line with expectations and ahead of the weighted average cost of capital. Integration of the Arizona-based Kiewit, acquired in late September, is proceeding to schedule and earnings expectations have been affirmed. Operational improvement measures are well underway as part of the post-acquisition management plan.
“In Australia, internal initiatives to improve margin management and customer service in Construction Materials significantly lifted profit. The business is improving but it is still not earning its cost of capital,” said Mr Kirby. “Further price increases were implemented in October.
“Building Products benefited from the lift in residential housing in Australia. The lag effect seen earlier this year, attributed to issues with the availability of home warranty insurance, has largely been resolved. Bricks and roofing introduced several initiatives to lift profits, including lower production costs and price increases.
“Sugar was impacted by the decline in world prices, but this was partly offset by the improvement in refining. The ethanol business is poised to benefit from any moves to encourage the use of environmentally-friendly motor fuels. CSR Distilleries is supplying BP’s successful ethanol trial in Brisbane, where motorists have responded very favourably to the 10% ethanol fuel blend. We are optimistic about prospects in this area. The sugar industry meanwhile is working together on a major restructuring and efficiency program to help restore Australia’s productivity advantages over other sugar producers.”
Business Performance
• Rinker sales rose 4% to US$1,119 million. EBITDA was up 4% to US$256 million. US$ EBITDA/sales margins increased slightly to 22.9%. US$ ROFE for the 12 months to September was 16.9% from 15.6%. Comparable $US sales (adjusted for acquisitions and divestments in the year to September) rose 3% and EBIT rose 1%.
Price increases ranged from marginal to 5.0%. Volumes rose in all major businesses except Concrete Pipe & Products:
• Aggregates EBIT US$56 million, up 24%. Volumes up 19%.
• Concrete, Block & Asphalt EBIT US$37 million, up 5%. Concrete volumes up 8%.
• Cement EBIT US$42 million, up 11%. Volumes up 2%.
• Concrete Pipe & Products EBIT US$41 million, down 24%. Volumes down 8%. The business was impacted by the substantial fall in non-residential building.
Gypsum Supply profit increased 9% on increased volumes. The small Polypipe and Prestress businesses also continued to suffer from the non-residential construction downturn. Prestress EBIT was breakeven. The pipeline rehabilitation business was sold during the half.
• Construction Materials EBIT rose 81% on an 8% lift in sales. ROFE (12 month basis) was 11.1% from 4.7%. EBITDA/sales margin was 15.9%, up from 11.9%. The Tianjin Readymix quarry and concrete business in China continued to improve.
• Building Products EBIT was up 32% on a 17% lift in sales. ROFE (12 months basis) was 19.5%. EBITDA/sales margin was 17.3% from 16.2%. Installation of the SAP computer system was completed in plasterboard and insulation. Production started at the new roof tile plant at Rosehill, Sydney.
• Aluminium EBIT was A$61 million, up 11%. Aluminium prices were 7% lower on average and the A$ was stronger but profits were underpinned by hedging and lower alumina costs.
• Sugar EBIT fell 25% to A$59 million. Average raw sugar prices were down 27%. Harvested cane volumes were up 10%. Distilleries EBIT was down due to lower fertiliser sales as a result of the drought but export sales were stronger. Refining EBIT was A$12 million, up from A$7 million.
CSR Limited ABN 90 000 001 276. Corporate and Investor Relations Group
Level 3, 9 Help Street, Chatswood NSW 2067, Locked Bag 6, Chatswood NSW 2057, Australia
Telephone (02) 9235 8171 Facsimile (02) 9235 8140 E-mail investorrelations@csr.com.au
Strategy
Almost three quarters of CSR group EBIT now comes from heavy building materials (primarily aggregates, premix concrete, cement and concrete pipe & products). Group strategy since 1998 has been to grow internationally in this sector, whilst concurrently working to separate the remaining assets, in a way that has delivered value for shareholders.
“The logical next step in our strategy is to complete the separation of the heavy building materials assets through a demerger,” said Mr Kirby.
“For some time now we have been carefully examining the various separation options. We believe a demerger will be the best option for shareholders. The new demerger legislation means that we can now do this without shareholders incurring substantial tax penalties. Accordingly we are moving forward with a demerger proposal which would involve splitting the group into two listed Australian companies. We are completing our own due diligence process, aiming to propose to shareholders a demerger to take effect in the first half of next year.
The demerger would mean the formation of a focused, heavy building materials group Rinker Group Ltd (“Rinker Group”). It would be spun off from CSR Limited and would comprise US subsidiary Rinker Materials Corporation and the Readymix and Humes businesses (Australia & Asia).
“Based on historical performance, both Rinker Group and CSR would have substantial free cash flows. We expect both companies to receive investment grade credit ratings, and to be listed in the ASX Top 50 and Top 100 stocks respectively,” said Mr Kirby.
“We anticipate that Rinker Group will be one of the top 10 heavy building materials stocks in the world and a disciplined, top quartile performer in its sector,” he said. “Rinker Group is expected to be a growth stock - able to participate more effectively in the global consolidation of the industry. With around 85% of earnings from Rinker Materials in the US, over time we would expect it to be re-rated by investors, more in line with its US peers.
“CSR Limited would return to its roots as a diversified, Australian company, holding some of the strongest and best known household brands in the country. It will comprise three businesses - CSR Building Products, Aluminium and CSR Sugar - each of which is a leader in its industry. A demerger will allow these businesses to focus more effectively on their respective strengths and to pursue value-adding, low risk growth options which have previously ranked as a lesser priority for the CSR group.
“CSR Limited is expected to be a highly franked stock, appealing to yield driven investors. It has been a strong generator of cash and of shareholder value – that is, earning above its cost of capital – for many years.
“A demerger will facilitate choice for the different types of shareholders – that is, those who prefer Rinker Group’s growth characteristics and those who prefer CSR’s higher, franked yields. We expect both companies to be well-regarded and to prove attractive to these respective shareholders.”
Mr Kirby will lead the company through the demerger process. Upon completion of the demerger, he will hand over his role to David Clarke, current chief executive of Rinker Materials and Alec Brennan, current CSR group deputy managing director, who will become chief executives of Rinker Group and CSR respectively.
CSR group chairman John Morschel said Mr Kirby would then remain with the group for up to four months as an advisor, to assist in the critical phase of demerger implementation.
“Since joining the company in January 1998, Mr Kirby has played the key role in transforming the CSR group from a poorly-regarded Australian conglomerate into a respected international building materials group. “In that time, EPS growth has averaged 22% p.a. compound, EBIT has doubled and return on equity has risen from 6.1% in 1997 to the 14.3% we announced today,” said Mr Morschel. “On behalf of the Board, I would like to thank him for his enormous contribution and wish him all the best for the future post the demerger.”
CSR Limited ABN 90 000 001 276. Corporate and Investor Relations Group
Level 3, 9 Help Street, Chatswood NSW 2067, Locked Bag 6, Chatswood NSW 2057, Australia
Telephone (02) 9235 8171 Facsimile (02) 9235 8140 E-mail investorrelations@csr.com.au
All current CSR group non-executive directors are expected to join the boards of one or other of the two companies. Mr Morschel will become chairman of Rinker Group. Ian Blackburne, currently a CSR non-executive director and former CEO and managing director of Caltex Australia, will become CSR chairman.
Mr Kirby said that subject to the necessary approvals as outlined above, the demerger should be concluded prior to the middle of next year. “We are confident that a demerger will add further value for our shareholders, although we recognize that the nature of demergers is such that this may take time to be realized,” he said.
Outlook for the second half
There are indications that the US economy is bottoming. However, the short term outlook is for a further softening. Overall, US construction activity for calendar 2003 is forecast to be down about 1.1%, according to the US economic forecaster McGraw Hill Construction–Dodge.
Rinker is expecting an improved second half, compared with the previous year, due to the addition of Kiewit. The base business is expected to be relatively flat. The exposure to the high growth southern states and strong road spending under the federal TEA-21 program should help offset declining non-residential activity. Price increases for aggregate and concrete are forecast to be slightly ahead of inflation. Rinker’s short-term focus is on bedding down the important Kiewit acquisition.
In Australia, BIS Shrapnel forecasts a 2% increase in total construction during the year to March 2003. Commercial activity is expected to improve, with housing declining in the second half in line with lower approvals. We expect housing starts over the year to be around 142,000, from 152,000 last year.
The developing boom in Australian engineering construction is expected to benefit Construction Materials. Major projects are currently being tendered, although commencement is not generally expected during the current year. Further price increases are being implemented.
Around 74% of Building Products’ sales are related to housing but the business should also benefit from any uplift in commercial activity, which represents 21% of sales. We expect the result to be ahead of YEM02.
Aluminium profit should be slightly above last year, due to hedging of both the currency and the metal price.
Sugar prices are now at a 14-month high, but with much of the current season’s crop already priced at lower levels, it will have a limited impact on current year results. Crop volumes are up over 15% on YEM02. These factors are expected to at least offset the usual small loss in the second half due to seasonal factors. Low cost growth initiatives are also underway to improve the overall stability of returns.
“The CSR group has lifted its forecasts for the current year’s trading profit. We now expect a small improvement over last year’s underlying earnings – that is, excluding demerger costs and the A$41 million one-off tax refund benefit. Kiewit is not expected to contribute to after-tax profit this year after goodwill charges, but it is contributing as expected to EBIT. However we are cautiously optimistic that the improvement in Construction Materials, ongoing work to lift the base business performance across the group and further operational improvement cost savings will offset the effects of a higher A$, low sugar prices, and the expected softening in US construction.
“Our priorities will be the successful implementation of the demerger, to further improve the performance of the base business and to pursue value-adding, bolt-on growth opportunities as they arise. As always, our commitment remains to further deliver value for our shareholders, and it is our expectation that we will continue to do so in the year ahead.”
For further information, please call Peter Kirby on 61 2 9235 8095 or Debra Stirling on 61 2 9235 8040 or 0419 476 546
19 NOVEMBER 2002 |
| C&IR 04/03 |
CSR Limited ABN 90 000 001 276. Corporate and Investor Relations Group
Level 3, 9 Help Street, Chatswood NSW 2067, Locked Bag 6, Chatswood NSW 2057, Australia
Telephone (02) 9235 8171 Facsimile (02) 9235 8140 E-mail investorrelations@csr.com.au
CSR half yearly report
for the six months ended 30 September 2002
Contents
Directors’ report | |
|
|
| |
|
|
| |
| |
|
|
| |
|
|
| |
|
|
| |
|
|
| |
|
|
| |
|
|
| |
| |
| |
| |
| |
| |
| |
Company overview
Operating profit after tax (PAT) for the half year ended 30 September 2002 was A$319.4 million, up 15.3% on the previous corresponding period. Earnings per share rose 17.2% to 34.1 cents.
Earnings before interest and tax (EBIT) was up 5.3% to A$541 million. Trading revenue was down 2.0% to A$3,638 million. EBIT/sales margins rose from 13.8% to 14.9%. Excluding the impact of a higher Australian dollar on US$ earnings, EBIT was up 10.5% and revenue was up 2.6%.
Other half year highlights included:
• Earnings before interest, tax, depreciation and amortisation (EBITDA) rose 3% to A$761 million
• EBITDA/sales rose from 19.9% to 20.9%
• Net operating cash flow rose 2% to A$554 million
• Free cash flow* rose 33% to A$479 million
• Return on funds employed (ROFE)** # rose from 14.5% to 17%
• Return on equity (ROE) # rose from 12.7% to 14.3%
Shareholder value added was again positive and up significantly on the previous year.
This result reflects the strength of the group’s market positions and the work done on improving base businesses. Rinker’s position in Florida, and in high growth southern US states, helped offset the impact of a weak non-residential sector which hit the concrete pipe and products business particularly hard. In Australia, improvements in Construction Materials, bricks and roofing, and the downstream sugar businesses, also contributed strongly.
The heavy building materials businesses performed well, contributing 70% of CSR group EBIT. The US subsidiary, Rinker Materials Corporation (“Rinker”) delivered another solid result, with EBIT up 3% to US$176 million, although the stronger Australian dollar meant A$ EBIT fell 5% to A$320 million. Despite a tougher economic environment, all the major Rinker segments lifted US$ EBIT, apart from Concrete Pipe & Products. Construction Materials (Australia & Asia) delivered a very strong 81% increase EBIT, to A$59 million, due to improved margin management and operational improvement cost savings.
Building Products (Australia, NZ & Asia) EBIT was up 32% to A$63 million, helped by strong domestic housing activity. Aluminium EBIT rose 11% to A$61 million due mainly to lower costs. Sugar EBIT fell 25% on lower world prices, which impacted the milling business - although EBIT from the downstream businesses – mainly sugar refining and ethanol - rose 28%.
Financial position
The group’s balance sheet remained very strong with net debt at end September of A$2,311 million, following the acquisition of Kiewit Materials Company, up from A$2,130 million a year earlier. Gearing (net debt / net debt plus equity) was 35.2% from 34.0%. Interest cover was 11.8 times, up from 8.0 times.
Directors declared an unchanged interim dividend of 11 cents per share, payable on 16 December. Franking increased to 70%, from 40% for the previous interim dividend.
Overview
Rinker’s US acquisitions are performing well overall - in line with expectations and ahead of the weighted average cost of capital. Integration of the Arizona-based Kiewit, acquired in late September, is proceeding to schedule and earnings expectations have been affirmed. Operational improvement measures are well underway as part of the post-acquisition management plan.
* EBITDA after deducting tax and net interest paid, operating capital and change in working capital
** Excluding acquisition of Kiewit Materials Company, acquired 26 September 2002 # on a 12 month basis
In Australia, internal initiatives to improve margin management and customer service in Construction Materials significantly lifted profit. The business is improving but it is still not earning its cost of capital. Further price increases were implemented in October.
Building Products benefited from the lift in residential housing in Australia. The lag effect seen earlier this year, attributed to issues with the availability of home warranty insurance, has largely been resolved. Bricks and roofing introduced several initiatives to lift profits, including lower production costs and price increases.
Sugar was impacted by the decline in world prices, but this was partly offset by the improvement in refining. The ethanol business is poised to benefit from any moves to encourage the use of environmentally-friendly motor fuels. CSR Distilleries is supplying BP’s successful ethanol trial in Brisbane, where motorists have responded very favourably to the 10% ethanol fuel blend. The prospects in this area look optimistic. The sugar industry meanwhile is working together on a major restructuring and efficiency program to help restore Australia’s productivity advantages over other sugar producers.
Business Performance
• Rinker sales rose 4% to US$1,119 million. EBITDA was up 4% to US$256 million. US$ EBITDA/sales margins increased slightly to 22.9%. US$ ROFE for the 12 months to September was 16.9% from 15.6%. Comparable $US sales (adjusted for acquisitions and divestments in the year to September) rose 3% and EBIT rose 1%.
Price increases ranged from marginal to 5.0%. Volumes rose in all major businesses except Concrete Pipe & Products:
• Aggregates EBIT US$56 million, up 24%. Volumes up 19%.
• Concrete, Block & Asphalt EBIT US$37 million, up 5%. Concrete volumes up 8%.
• Cement EBIT US$42 million, up 11%. Volumes up 2%.
• Concrete Pipe & Products EBIT US$41 million, down 24%. Volumes down 8%. The business was impacted by the substantial fall in non-residential building.
Gypsum Supply profit increased 9% on increased volumes. The small Polypipe and Prestress businesses also continued to suffer from the non-residential construction downturn. Prestress EBIT was breakeven. The pipeline rehabilitation business was sold during the half.
• Construction Materials EBIT rose 81% on an 8% lift in sales. ROFE (12 month basis) was 11.1% from 4.7%. EBITDA/sales margin was 15.9%, up from 11.9%. The Tianjin Readymix quarry and concrete business in China continued to improve.
• Building Products EBIT was up 32% on a 17% lift in sales. ROFE (12 months basis) was 19.5%. EBITDA/sales margin was 17.3% from 16.2%. Installation of the SAP computer system was completed in plasterboard and insulation. Production started at the new roof tile plant at Rosehill, Sydney.
• Aluminium EBIT was A$61 million, up 11%. Aluminium prices were 7% lower on average and the A$ was stronger but profits were underpinned by hedging and lower alumina costs.
• Sugar EBIT fell 25% to A$59 million. Average raw sugar prices were down 27%. Harvested cane volumes were up 10%. Distilleries EBIT was down due to lower fertiliser sales as a result of the drought but export sales were stronger. Refining EBIT was A$12 million, up from A$7 million.
Strategy & demerger proposal
Almost three quarters of CSR group EBIT now comes from heavy building materials (primarily aggregates, premix concrete, cement and concrete pipe & products). Group strategy since 1998 has been to grow internationally in this sector, whilst concurrently working to separate the remaining assets, in a way that has delivered value for shareholders.
The logical next step in the strategy is to complete the separation of the heavy building materials assets through a demerger.
2
For some time now CSR has been carefully examining the various separation options. The company expects that a demerger will be the best option for shareholders. The new demerger legislation means that this can be done without shareholders incurring substantial tax penalties. Accordingly CSR is moving forward with a demerger proposal which would involve splitting the group into two listed Australian companies. CSR’s due diligence process is continuing, with the aim of putting a demerger proposal to shareholders, which would take effect in the first half of next year.
The demerger would mean the formation of a focused, heavy building materials group – Rinker Group Ltd (“Rinker Group”). It would be spun off from CSR Limited and would comprise US subsidiary Rinker Materials Corporation and the Readymix and Humes businesses (Australia & Asia).
Based on historical performance, both Rinker Group and CSR would have substantial free cash flows. Both companies are expected to receive investment grade credit ratings and to be listed in the ASX Top 50 and Top 100 stocks respectively.
Rinker Group would be one of the top 10 heavy building materials stocks in the world and a disciplined, top quartile performer in its sector. Rinker Group is expected to be a growth stock - able to participate more effectively in the global consolidation of the industry. With around 85% of earnings from Rinker Materials in the US, over time we would expect it to be re-rated by investors, more in line with its US peers.
CSR Limited would return to its roots as a diversified, Australian company, holding some of the strongest and best-known household brands in the country. It will be comprised of three businesses - CSR Building Products, Aluminium and CSR Sugar, each of which is a leader in its industry. Both Building Products and Sugar have long term performance records which rank them leaders in their respective Australian industries, while Aluminium has delivered returns well above its cost of capital for many years.
A demerger will allow these businesses to focus more effectively on their respective strengths and to pursue value-adding, low risk growth options which have previously ranked as a lesser priority for the CSR group.
CSR Limited is expected to be a highly franked stock appealing to yield driven investors. It has been a strong generator of cash and of shareholder value – that is, earning above its cost of capital.
A demerger will facilitate choice for the different types of shareholders – that is, those who prefer Rinker Group’s growth characteristics and those who prefer CSR’s higher, franked yields. It is expected that both companies will be well-regarded and prove attractive to these respective shareholders.
Managing director Peter Kirby will lead the company through the demerger process. Upon completion of the demerger, he will hand over his role to David Clarke, current chief executive of Rinker Materials and Alec Brennan, currently CSR group deputy managing director, who will become chief executive of Rinker Group and CSR Limited respectively.
CSR group chairman John Morschel said Mr Kirby would then remain with the group for up to four months as an advisor, to assist in the critical phase of demerger implementation.
Since joining the company in January 1998, Mr Kirby has played the key role in transforming the CSR group from a poorly-regarded Australian conglomerate into a respected international building materials group. In that time, EPS growth has averaged 22% p.a. compound, EBIT has doubled and return on equity has risen from 6.1% in 1997 to the current rate of 14.3%.
All current CSR group non-executive directors are expected to join the boards of one or other of the two companies. Mr Morschel will become chairman of Rinker Group. Ian Blackburne, currently a CSR non-executive director and former CEO and managing director of Caltex Australia , will become CSR chairman.
Subject to the necessary approvals as outlined above, the demerger should be concluded prior to the middle of next year.
3
Outlook for the second half
There are indications that the US economy is bottoming. However, the short term outlook is for a further softening. Overall, US construction activity for calendar 2003 is forecast to be down about 1.1%, according to the US economic forecaster McGraw Hill Construction–Dodge.
Rinker is expecting an improved second half, compared with the previous year, due to the addition of Kiewit. The base business is expected to be relatively flat. The exposure to the high growth southern states and strong road spending under the federal TEA-21 program should help offset declining non-residential activity. Price increases for aggregate and concrete are forecast to be slightly ahead of inflation. Rinker’s short-term focus is on bedding down the important Kiewit acquisition.
In Australia, BIS Shrapnel forecasts a 2% increase in total construction during the year to March 2003. Commercial activity is expected to improve, with housing declining in the second half in line with lower approvals. Housing starts over the year are expected to be around 142,000, from 152,000 last year.
The developing boom in Australian engineering construction is expected to benefit Construction Materials. Major projects are currently being tendered, although commencement is not generally expected during the current year. Further price increases are being implemented.
Around 74% of Building Products’ sales are related to housing but the business should also benefit from any uplift in commercial activity, which represents 21% of sales. The result should be ahead of the last financial year.
Aluminium profit should be slightly above last year, due to hedging of both the currency and the metal price.
Sugar prices are now at a 14-month high, but with much of the current season’s crop already priced at lower levels, it will have a limited impact on current year results. Crop volumes are up over 15% on the last financial year. These factors are expected to at least offset the usual small loss in the second half due to seasonal factors. Low cost growth initiatives are also underway to improve the overall stability of returns.
The CSR group has lifted its forecasts for the current year’s trading profit. There is now a small improvement expected over last year’s underlying earnings – that is, excluding demerger costs and the A$41 million one-off tax refund benefit. Kiewit is not expected to contribute to after-tax profit this year after goodwill charges, but it is contributing as expected to EBIT. However CSR is cautiously optimistic that the improvement in Construction Materials, ongoing work to lift the base business performance across the group and further operational improvement cost savings will offset the effects of a higher A$, low sugar prices, and the expected softening in US construction.
The group’s priority will be the successful implementation of the demerger, to further improve the performance of the base business and to pursue value-adding, bolt-on growth opportunities as they arise. The commitment remains to further deliver value for shareholders, and it is expected that the group will continue to so in the year ahead.
4
United States of America
Performance summary
• Trading revenue A$2,030 million, down 4% (US$1,119 million, up 4%). Results in $A adversely impacted by exchange rate movements.
• Earnings before interest and tax (EBIT) A$320 million, down 5% (US$176 million, up 3%).
• Earnings before interest, tax, depreciation and amortisation (EBITDA) A$464 million, down 4% (US$256 million, up 4%).
• Profit margin (EBIT/trading revenue) 15.7%, down from 15.8%.
Features
• Federal infrastructure spending and residential construction increased, largely offsetting a significant downturn in commercial construction.
• Rinker successfully completed the US$540 million acquisition of Kiewit Materials Company, a major integrated aggregate, concrete and asphalt company which has the leading market position in Arizona and excellent opportunities for further growth.
• Costs were reduced through ongoing operational improvements, although insurance, health and pension costs increased.
• The commissioning of Rinker’s third new highly-automated large scale concrete pipe plant – in Houston, Texas – reduced costs, replacing less efficient operations.
Business strategy
• To be a leading supplier of materials for the building and construction industry in North America with a particular focus on heavy building materials, growing in selected geographic markets.
• Key objectives
• Growth, by improving the underlying businesses and through acquisition
• Being number 1 or 2 in all our regional markets
• Overall cost leadership
• Aggressive downturn management
• Finding and keeping talented people, with a high performance ethic
• Providing a safe and environmentally sound workplace.
Progress against priorities
• Grow through bolt-on acquisitions and, if opportunities present, major acquisitions; investigate new geographic markets: In September, Rinker acquired Kiewit Materials Company.
• Reduce costs through operational improvement: Operational cost savings totalled A$33 million.
• Improve safety and environment performance: Lost time injury and medical treatment injury frequency rates, and environmental incidents, fell.
Australia and Asia
Performance summary
• Trading revenue A$512 million, up 8%.
• EBIT A$59 million, up 81%.
• EBITDA A$82 million, up 44%.
• Profit margin 11.4%, up from 6.8%.
5
Features
• Activity levels improved in the housing, commercial and civil construction sectors.
• Price increases introduced earlier this year helped to lift profit margins.
• Improved operational efficiencies reduced costs across the business.
Business strategy
• To ensure that the business is earning above its cost of capital at all stages of the construction cycle.
• To improve customer service, logistics, production capacity, and to be the supplier of choice.
• To develop incremental, value-adding growth opportunities in Australia and China.
Progress against priorities
• Restore profit levels above the cost of capital. More disciplined management of profit margins. Lift prices: Price increases in concrete and quarries helped lift profit levels. The business is improving but is still not earning its cost of capital.
• Localise the businesses, focusing on customers: We have localised the business by reorganising it into 62 cells or business units. Cell managers are now much more accountable for results in their businesses.
• Improve safety and environment performance: The lost time injury frequency rate increased, although medical treatment injury frequency rates decreased. Environmental incidents fell.
Australia, New Zealand and Asia
Performance summary
• Trading revenue A$462 million, up 17%.
• EBIT A$63 million, up 32%.
• EBITDA A$80 million, up 25%.
• Profit margin 13.7%, up from 12.1%.
Features
• Returns improved in line with stronger activity in the new homes, alterations and commercial construction sectors.
• Competitive conditions continued, although there are some signs of prices in our markets increasing.
• SAP computer systems are being installed across all businesses.
• We are investing in e-commerce to enable customers to efficiently access product and accounts data.
• Business renamed from Building Materials to better reflect its market focus.
Business strategy
• Provide high quality, price competitive products to the building industry, utilising our customer-focused channels of distribution.
• Improve efficiencies and output to meet growth in market demand, while introducing innovative new products in all businesses.
• Search for value-adding growth opportunities in Australia and Asia.
Progress against priorities
• Increase effectiveness of our sales force and servicing of our customers: Each business has focused on sales planning and margin analysis. They are also identifying opportunities to cross sell products to customers.
• Closely manage pricing, while maintaining market share: Each business has implemented pricing strategies, very closely monitored by the management team.
• Tightly control operating capital: Operating capital continued to be controlled tightly.
• Improve safety and environment performance: The lost time injury frequency rate increased, although medical treatment injury frequency rates fell. Environmental incidents remain at low levels.
6
Australia and New Zealand
Performance summary
• Trading revenue A$420 million, down 17%.
• EBIT A$59 million, down 25%.
• EBITDA A$ 77 million, down 21%.
• Profit margin 14.1%, down from 15.7%.
Features
• Returns declined with a significant decrease in world sugar prices, relative to the previous corresponding period. This impacts on expected Queensland Sugar Limited pool prices.
• CSR milled 9.6 million tonnes of sugar cane (up 10%), producing 1.4 million tonnes of sugar (up 9%).
• The refined sugar business (50% CSR) improved, due to higher sales volumes and profit margins. Ethanol returns fell slightly, due to higher molasses prices and lower fertiliser volumes.
• CSR is actively monitoring the current debate on ethanol as a fuel extender. We are well placed to take advantage of opportunities that may arise, depending on the outcome of the current government review.
Business strategy
To create value for all stakeholders by reshaping the Australian sugar industry, which will be achieved through:
• creating a high performance way of doing things across the industry structure in our mill regions (including effective regional industry boards)
• driving a sugarcane productivity initiative that will deliver a 20% sustainable improvement in sugar yield, involving working with growers, harvesters and others to optimise harvesting and sugarcane transport systems
• pursuing growth opportunities – particularly in green energy such as increased electricity cogeneration and the use of ethanol as a fuel extender.
Progress against priorities
• Obtain commitment and cooperation from others in the Australian sugar industry for productivity initiatives: Regional industry boards have been established. The productivity initiative is being implemented.
• Get renewable energy projects under way: Progress is being made on various opportunities for energy initiatives. Potential ethanol projects require regulatory clarification.
• Improve safety and environment performance: Lost time injury and medical treatment injury frequency rates decreased. Environmental incidents also fell.
Australia
Performance summary
• Trading revenue was A$215 million, down 3%.
• EBIT A$61 million, up 11%.
• EBITDA A$72 million, up 9%.
• Profit margin 28.5%, up from 24.9%.
Features
• Value added billet and slab sales increased by 15% over the corresponding period last year.
• Demand for aluminium increased in line with slow growth in the global economy, but continuing production surplus weighed on the world price.
• The world price of aluminium averaged US$1,353 a tonne over the half year, down 7% on the previous corresponding period.
7
• A project to expand production capacity of the Tomago smelter by 15% commenced. Gove Aluminium Finance (GAF; CSR 70%) has an option to participate in this project, which has a low investment cost per tonne of additional annual capacity.
Business strategy
• Focus on operational improvements aimed at productivity, cost reduction and revenue enhancement.
• Continue to sell all of GAF’s share of production from the Tomago smelter, principally to long term customers in Japan and other Asian countries.
• Continue to hedge to reduce GAF’s exposures to movements in the world aluminium price and to movements in the US$:A$ exchange rate.
Progress against priorities
• Continue to manage CSR’s aluminium investment to achieve the best outcome for shareholders: The business has performed well in a period of low world aluminium prices.
• Continue to hedge the world market aluminium price and US$ revenue: Hedging continues to provide a base level of profitability and to reduce volatility of earnings.
8
Directors of CSR Limited at any time during the half-year ended 30 September 2002, or since that date, are shown below. Unless otherwise stated, they have each been a director from 1 April 2002, up to and including the date of this report.
John Arthur, John Ballard, Ian Blackburne, Alec Brennan, David Clarke, Carolyn Hewson, Peter Kirby, John Morschel, and John Wylie.
Signed in accordance with a resolution of the directors.
Peter Kirby
Managing director
Sydney, 19 November 2002
9
Half-year ended 30 September (A$ million unless indicated) |
| 2002 |
| 2001 |
| % change |
|
|
|
|
|
|
|
|
|
For the half-year |
|
|
|
|
|
|
|
|
|
|
|
|
|
|
|
Total revenue |
| 3725.0 |
| 3771.9 |
| -1 |
|
|
|
|
|
|
|
|
|
Trading revenue |
| 3638.4 |
| 3711.8 |
| -2 |
|
|
|
|
|
|
|
|
|
Profit from ordinary activities before finance, and income tax (EBIT) |
| 541.0 |
| 513.9 |
| 5 |
|
|
|
|
|
|
|
|
|
Profit from ordinary activities before finance, income tax, and depreciation & amortisation (EBITDA) |
| 761.2 |
| 739.0 |
| 3 |
|
|
|
|
|
|
|
|
|
Net profit |
| 319.4 |
| 277.0 |
| 15 |
|
|
|
|
|
|
|
|
|
Net cash from operating activities |
| 554.1 |
| 545.4 |
| 2 |
|
|
|
|
|
|
|
|
|
Capital investment |
| 1142.3 |
| 278.0 |
| 311 |
|
|
|
|
|
|
|
|
|
Per share [A cents] |
|
|
|
|
|
|
|
|
|
|
|
|
|
|
|
Earnings |
| 34.1 |
| 29.1 |
| 17 |
|
|
|
|
|
|
|
|
|
Dividend (declared) |
| 11.0 |
| 11.0 |
| — |
|
|
|
|
|
|
|
|
|
Key measures |
|
|
|
|
|
|
|
|
|
|
|
|
|
|
|
EBIT/Trading revenue [%] |
| 14.9 |
| 13.8 |
|
|
|
|
|
|
|
|
|
|
|
Return on funds employed (excluding Kiewit) [%] (last twelve months) |
| 17.0 |
| 14.5 |
|
|
|
|
|
|
|
|
|
|
|
Interest cover [times] |
| 11.8 |
| 8.0 |
|
|
|
|
|
|
|
|
|
|
|
Gearing at 30 September (including Kiewit acquisition) |
|
|
|
|
|
|
|
|
|
|
|
|
|
|
|
Net debt: equity plus net debt [%] |
| 35.2 |
| 34.0 |
|
|
|
|
|
|
|
|
|
|
|
Net debt: equity [%] |
| 54.3 |
| 51.4 |
|
|
|
10
Australian Stock Exchange Limited
Half yearly report
CSR Limited
ABN 90 000 001 276
For the half-year ended 30 September 2002
For announcement to the market
Item |
|
|
|
|
| A$ million |
|
|
|
|
|
|
|
|
|
1.1 |
| Revenues from ordinary activities |
| down 1% to |
| 3725.0 |
|
|
|
|
|
|
|
|
|
1.22 |
| Profit from ordinary activities after tax attributable to members |
| up 15% to |
| 319.4 |
|
|
|
|
|
|
|
|
|
2.5(d) |
| Profit from extraordinary items after tax attributable to members |
|
|
| — |
|
|
|
|
|
|
|
|
|
1.11 |
| Net profit attributable to members |
| up 15% to |
| 319.4 |
|
|
|
|
|
|
|
|
|
|
| Interim dividend per share: |
|
|
|
|
|
15.6 |
| Current half-year |
| 11 cents |
| (seventy percent franked at 30% tax rate) |
|
|
|
|
|
|
|
|
|
15.7 |
| Previous corresponding half-year |
| 11 cents |
| (forty percent franked at 30% tax rate) |
|
|
|
|
|
|
|
|
|
15.2 |
| Registrable transfers received by 29 November 2002 up to the times specified in the Listing Rules and SCH Business Rules will be registered before entitlements to the dividend are determined. |
|
|
|
|
|
This half yearly report should be read in conjunction with the financial report for the year ended 31 March 2002.
11
Consolidated statement of financial performance
Half-year ended 30 September (A$ million) |
| 2002 |
| 2001 |
| ||
|
|
|
|
|
| ||
1.1 |
| Revenues from ordinary activities |
| 3725.0 |
| 3771.9 |
|
|
|
|
|
|
|
|
|
1.2 |
| Expenses from ordinary activities |
| (3207.1 | ) | (3272.0 | ) |
|
|
|
|
|
|
|
|
1.3 |
| Borrowing costs |
| (54.9 | ) | (70.2 | ) |
|
|
|
|
|
|
|
|
1.4 |
| Share of associate entities net profit [see item 16.7] |
| 28.9 |
| 21.4 |
|
|
|
|
|
|
|
|
|
1.5 |
| Profit from ordinary activities before income tax |
| 491.9 |
| 451.1 |
|
|
|
|
|
|
|
|
|
1.6 |
| Income tax on ordinary activities |
| 159.6 |
| 162.9 |
|
|
|
|
|
|
|
|
|
1.7 |
| Profit from ordinary activities after income tax |
| 332.3 |
| 288.2 |
|
|
|
|
|
|
|
|
|
1.8 |
| Profit from extraordinary items after income tax |
| — |
| — |
|
|
|
|
|
|
|
|
|
1.9 |
| Net profit |
| 332.3 |
| 288.2 |
|
|
|
|
|
|
|
|
|
1.10 |
| Net profit attributable to outside equity interests |
| 12.9 |
| 11.2 |
|
|
|
|
|
|
|
|
|
1.11 |
| Net profit attributable to members |
| 319.4 |
| 277.0 |
|
|
|
|
|
|
|
|
|
|
| Non-Owner Transaction Changes in Equity |
|
|
|
|
|
|
|
|
|
|
|
|
|
1.12 |
| Increase (decrease) in revaluation reserves |
| — |
| — |
|
|
|
|
|
|
|
|
|
1.13 |
| Net exchange differences recognised in equity |
| (43.0 | ) | 32.7 |
|
|
|
|
|
|
|
|
|
1.14 |
| Other revenue, expense and initial adjustments recognised directly in equity |
| — |
| — |
|
|
|
|
|
|
|
|
|
1.15 |
| Adjustment from AASB 1044 transitional provisions (refer page 23) |
| (143.7 | ) | — |
|
|
|
|
|
|
|
|
|
1.16 |
| Total transactions and adjustments recognised directly in equity (item 1.12 to 1.15) |
| (186.7 | ) | 32.7 |
|
|
|
|
|
|
|
|
|
1.17 |
| Total changes in equity not resulting from transactions with owners as owners |
| 132.7 |
| 309.7 |
|
|
|
|
|
|
|
|
|
|
| Earnings per security [A cents] |
|
|
|
|
|
|
|
|
|
|
|
|
|
1.18 |
| Basic EPS |
| 34.1 |
| 29.1 |
|
|
|
|
|
|
|
|
|
1.19 |
| Diluted EPS |
| 34.0 |
| 28.9 |
|
|
|
|
|
|
|
|
|
|
| Total interest expense |
| 51.5 |
| 72.1 |
|
|
|
|
|
|
|
|
|
|
| Less capitalised interest (item 1.28) |
| — |
| (1.2 | ) |
|
|
|
|
|
|
|
|
|
| Funding costs |
| 2.2 |
| 1.3 |
|
|
|
|
|
|
|
|
|
|
| Foreign exchange loss (gain) |
| 1.2 |
| (2.0 | ) |
|
|
|
|
|
|
|
|
|
| Borrowing costs (item 1.3) |
| 54.9 |
| 70.2 |
|
|
|
|
|
|
|
|
|
|
| Interest income (item 1.24) |
| (5.8 | ) | (7.4 | ) |
|
|
|
|
|
|
|
|
|
| Net finance expense |
| 49.1 |
| 62.8 |
|
12
Half-year ended 30 September (A$ million) |
| 2002 |
| 2001 |
| % change |
| ||
|
|
|
|
|
|
|
|
|
|
|
| Profit from ordinary activities attributable to members |
|
|
|
|
|
|
|
|
|
|
|
|
|
|
|
|
|
1.20 |
| Profit from ordinary activities after income tax (item 1.7) |
| 332.3 |
| 288.2 |
| 15 |
|
|
|
|
|
|
|
|
|
|
|
1.21 |
| Less outside equity interests |
| 12.9 |
| 11.2 |
| 15 |
|
|
|
|
|
|
|
|
|
|
|
1.22 |
| Profit from ordinary activities after tax, attributable to members |
| 319.4 |
| 277.0 |
| 15 |
|
|
|
|
|
|
|
|
|
|
|
|
| Revenues and Expenses from ordinary activities |
|
|
|
|
|
|
|
|
|
|
|
|
|
|
|
|
|
1.23 |
| Revenue from sales or services |
| 3638.4 |
| 3711.8 |
| -2 |
|
|
|
|
|
|
|
|
|
|
|
1.24 |
| Interest revenue |
| 5.8 |
| 7.4 |
| -22 |
|
|
|
|
|
|
|
|
|
|
|
1.25 |
| Other revenue |
| 80.8 |
| 52.7 |
| 53 |
|
|
|
|
|
|
|
|
|
|
|
1.26 |
| Details of relevant expenses |
|
|
|
|
|
|
|
|
| Cost of sales |
| (2281.6 | ) | (2368.7 | ) | -4 |
|
|
| Warehouse and distribution costs |
| (508.7 | ) | (495.9 | ) | 3 |
|
|
| Selling costs |
| (104.5 | ) | (95.1 | ) | 10 |
|
|
| Administration and other costs |
| (272.6 | ) | (275.0 | ) | -1 |
|
|
| Other expenses (non trading) |
| (39.7 | ) | (37.3 | ) | 6 |
|
|
|
|
|
|
|
|
|
|
|
|
| Included in above is total depreciation and amortisation of |
| (220.2 | ) | (225.1 | ) | -2 |
|
|
|
|
|
|
|
|
|
|
|
1.27 |
| Depreciation and amortisation excluding amortisation of intangibles (see item 2.1 and 2.2) |
| (180.5 | ) | (182.8 | ) | -1 |
|
|
|
|
|
|
|
|
|
|
|
|
| Capitalised Outlays |
|
|
|
|
|
|
|
|
|
|
|
|
|
|
|
|
|
1.28 |
| Borrowing costs capitalised in asset values |
| — |
| 1.2 |
| -100 |
|
|
|
|
|
|
|
|
|
|
|
1.29 |
| Outlays capitalised in intangibles (unless arising from an acquisition of a business) |
| — |
| — |
| — |
|
|
|
|
|
|
|
|
|
|
|
|
| Consolidated Retained Profits |
|
|
|
|
|
|
|
|
|
|
|
|
|
|
|
|
|
1.30 |
| Retained profits at the beginning of the financial period |
| 1602.3 |
| 1273.9 |
| 26 |
|
|
|
|
|
|
|
|
|
|
|
1.31 |
| Net profit attributable to members (item 1.11) |
| 319.4 |
| 277.0 |
| 15 |
|
|
|
|
|
|
|
|
|
|
|
1.32 |
| Net transfers to reserves |
| (2.7 | ) | — |
|
|
|
|
|
|
|
|
|
|
|
|
|
1.33 |
| Net effect of adoption of AASB1044 – product liability |
| (143.7 | ) | — |
|
|
|
|
|
|
|
|
|
|
|
|
|
1.33 |
| Net effect of adoption of AASB1044 – dividend provision |
| 121.7 |
| — |
|
|
|
|
|
|
|
|
|
|
|
|
|
1.34 |
| Dividends paid |
| (121.8 | ) | (102.6 | ) | 19 |
|
|
|
|
|
|
|
|
|
|
|
1.35 |
| Retained profits at 30 September |
| 1775.2 |
| 1448.3 |
| 23 |
|
|
|
|
|
|
|
|
|
|
|
|
| Intangible and extraordinary items |
|
|
|
|
|
|
|
|
|
|
|
|
|
|
|
|
|
2.1 |
| Amortisation of goodwill |
| 34.7 |
| 36.9 |
| -6 |
|
|
|
|
|
|
|
|
|
|
|
|
| less income tax expense |
| 5.2 |
| 6.0 |
| -13 |
|
|
|
|
|
|
|
|
|
|
|
|
| less outside equity interests |
| — |
| — |
|
|
|
|
|
|
|
|
|
|
|
|
|
|
| Net amortisation of goodwill |
| 29.5 |
| 30.9 |
| -5 |
|
|
|
|
|
|
|
|
|
|
|
2.2 |
| Amortisation of other intangibles |
| 5.0 |
| 5.4 |
| -7 |
|
|
|
|
|
|
|
|
|
|
|
|
| less income tax expense |
| 1.7 |
| 1.8 |
| -6 |
|
|
|
|
|
|
|
|
|
|
|
|
| less outside equity interests |
| — |
| — |
|
|
|
|
|
|
|
|
|
|
|
|
|
|
| Net amortisation of other intangibles |
| 3.3 |
| 3.6 |
| -8 |
|
|
|
|
|
|
|
|
|
|
|
2.3 |
| Total net amortisation of intangibles |
| 32.8 |
| 34.5 |
| -5 |
|
|
|
|
|
|
|
|
|
|
|
2.4/2.5 |
| Total extraordinary items for half-years ended 30 September 2002 and 2001 are nil. |
|
|
|
|
|
|
|
|
|
|
|
|
|
|
|
|
|
3 |
| Not applicable |
|
|
|
|
|
|
|
13
Consolidated statement of financial position
|
| (A$ million) |
| As at |
| As at |
| As at |
|
|
|
|
|
|
|
|
|
|
|
|
| Current assets |
|
|
|
|
|
|
|
4.1 |
| Cash |
| 166.6 |
| 156.6 |
| 213.7 |
|
4.2 |
| Receivables |
| 1244.7 |
| 988.0 |
| 1206.5 |
|
4.4 |
| Inventories |
| 582.7 |
| 572.5 |
| 632.4 |
|
4.6 |
| Other current assets |
| 40.5 |
| 25.5 |
| 38.3 |
|
|
|
|
|
|
|
|
|
|
|
4.7 |
| Total current assets |
| 2034.5 |
| 1742.6 |
| 2090.9 |
|
|
|
|
|
|
|
|
|
|
|
|
| Non-current assets |
|
|
|
|
|
|
|
4.8 |
| Receivables |
| 46.8 |
| 50.9 |
| 54.8 |
|
4.9 |
| Investments accounted for using the equity method |
| 332.4 |
| 316.6 |
| 320.6 |
|
4.10 |
| Other financial assets |
| 45.3 |
| 40.2 |
| 89.9 |
|
4.11 |
| Inventories |
| 129.0 |
| 129.2 |
| 114.5 |
|
4.14 |
| Property, plant and equipment (net) |
| 4294.1 |
| 4137.9 |
| 4352.6 |
|
4.15 |
| Intangibles (net) |
| 1737.1 |
| 1111.6 |
| 1223.7 |
|
4.16 |
| Deferred income tax assets |
| 321.7 |
| 283.0 |
| 329.5 |
|
4.17 |
| Other non-current assets |
| 145.1 |
| 138.7 |
| 135.5 |
|
|
|
|
|
|
|
|
|
|
|
4.18 |
| Total non-current assets |
| 7051.5 |
| 6208.1 |
| 6621.1 |
|
|
|
|
|
|
|
|
|
|
|
4.19 |
| Total assets |
| 9086.0 |
| 7950.7 |
| 8712.0 |
|
|
|
|
|
|
|
|
|
|
|
|
| Current liabilities |
|
|
|
|
|
|
|
4.20 |
| Payables |
| 847.8 |
| 745.3 |
| 855.3 |
|
4.21 |
| Interest-bearing liabilities |
| 272.9 |
| 104.0 |
| 73.4 |
|
4.22 |
| Income tax liabilities |
| 113.3 |
| 17.3 |
| 138.0 |
|
4.23 |
| Provisions |
| 293.7 |
| 352.6 |
| 377.1 |
|
|
|
|
|
|
|
|
|
|
|
4.25 |
| Total current liabilities |
| 1527.7 |
| 1219.2 |
| 1443.8 |
|
|
|
|
|
|
|
|
|
|
|
|
| Non-current liabilities |
|
|
|
|
|
|
|
4.26 |
| Payables |
| 41.1 |
| 43.2 |
| 52.1 |
|
4.27 |
| Interest-bearing liabilities |
| 2204.9 |
| 1790.7 |
| 2269.8 |
|
4.28 |
| Deferred income tax liabilities |
| 573.4 |
| 519.6 |
| 524.2 |
|
4.29 |
| Provisions |
| 480.2 |
| 273.6 |
| 280.3 |
|
|
|
|
|
|
|
|
|
|
|
4.31 |
| Total non-current liabilities |
| 3299.6 |
| 2627.1 |
| 3126.4 |
|
|
|
|
|
|
|
|
|
|
|
4.32 |
| Total liabilities |
| 4827.3 |
| 3846.3 |
| 4570.2 |
|
|
|
|
|
|
|
|
|
|
|
4.33 |
| Net assets |
| 4258.7 |
| 4104.4 |
| 4141.8 |
|
|
|
|
|
|
|
|
|
|
|
|
| Equity |
|
|
|
|
|
|
|
4.34 |
| Contributed equity |
| 2146.7 |
| 2139.4 |
| 2164.9 |
|
4.35 |
| Reserves |
| 240.8 |
| 281.1 |
| 419.5 |
|
4.36 |
| Retained profits |
| 1775.2 |
| 1602.3 |
| 1448.3 |
|
4.37 |
| Equity attributable to members of CSR Limited |
| 4162.7 |
| 4022.8 |
| 4032.7 |
|
|
|
|
|
|
|
|
|
|
|
4.38 |
| Outside equity interests in controlled entities |
| 96.0 |
| 81.6 |
| 109.1 |
|
|
|
|
|
|
|
|
|
|
|
4.39 |
| Total equity |
| 4258.7 |
| 4104.4 |
| 4141.8 |
|
|
|
|
|
|
|
|
|
| |
4.40 | CSR has no preference shares on issue |
|
|
|
|
|
|
| |
|
|
|
|
|
|
|
|
| |
5 | Exploration and evaluation expenditure capitalised:- Not material |
|
|
|
|
|
|
| |
|
|
|
|
|
|
|
|
| |
6 | Development properties:- Not material |
|
|
|
|
|
|
| |
14
Consolidated statement of cash flows
|
| Half-year ended 30 September (A$ million) |
| 2002 |
| 2001 |
|
|
|
|
|
|
|
|
|
|
| Cash flows from operating activities |
|
|
|
|
|
7.1 |
| Receipts from customers |
| 3632.5 |
| 3639.0 |
|
7.2 |
| Payments to suppliers and employees |
| (3090.1 | ) | (3080.0 | ) |
7.3 |
| Dividends and distributions from associate entities |
| 22.2 |
| 17.7 |
|
7.4 |
| Other dividends received |
| 2.2 |
| 1.6 |
|
7.5 |
| Interest received |
| 6.6 |
| 7.5 |
|
7.7 |
| Income taxes paid |
| (19.3 | ) | (40.4 | ) |
7.9 |
| Net cash from operating activities |
| 554.1 |
| 545.4 |
|
|
|
|
|
|
|
|
|
|
| Cash flows from investing activities |
|
|
|
|
|
7.10 |
| Purchase of property, plant, equipment and other non-current assets |
| (147.3 | ) | (193.4 | ) |
7.11 |
| Proceeds from sale of property, plant, equipment and other non-current assets |
| 58.0 |
| 39.4 |
|
7.12 |
| Purchase of controlled entities and businesses net of cash acquired |
| (962.2 | ) | (85.0 | ) |
7.13 |
| Proceeds from sale of interest in controlled entities and businesses |
| 33.7 |
| 13.0 |
|
7.14 |
| Loans and receivables advanced |
| (1.5 | ) | (0.8 | ) |
7.15 |
| Loans and receivables repaid |
| 2.8 |
| 11.2 |
|
7.17 |
| Net cash used in investing activities |
| (1016.5 | ) | (215.6 | ) |
|
|
|
|
|
|
|
|
|
| Cash flows from financing activities |
|
|
|
|
|
7.18 |
| Proceeds from issue of shares |
| 14.0 |
| 18.7 |
|
7.18 |
| Share buyback |
| (6.7 | ) | (178.7 | ) |
7.19 |
| Proceeds from borrowings |
| 638.0 |
| 26.1 |
|
7.21 |
| Dividends paid |
| (121.0 | ) | (114.0 | ) |
7.22 |
| Interest and other finance costs paid |
| (52.0 | ) | (72.1 | ) |
7.22 |
| Hedging of foreign operations |
| — |
| 2.7 |
|
7.23 |
| Net cash from (used in financing activities) |
| 472.3 |
| (317.3 | ) |
7.24 |
| Net increase in cash held |
| 9.9 |
| 12.5 |
|
7.25 |
| Net cash at beginning of the financial period |
| 156.6 |
| 199.5 |
|
7.26 |
| Effects of exchange rate changes |
| 0.1 |
| 1.2 |
|
7.27 |
| Net cash at 30 September |
| 166.6 |
| 213.2 |
|
|
| Non-cash financing and investing activities - nil |
|
|
|
|
|
|
|
|
|
|
|
|
|
|
| Reconciliation of Net cash |
|
|
|
|
|
|
| Reconciliation of net cash at the end of the period (as shown in the consolidated statement of cash flows) to the related items in the statement of financial position is as follows. |
|
|
|
|
|
8.1 |
| Cash at banks and on hand |
| 82.5 |
| 71.7 |
|
8.2 |
| Short-term loans and deposits |
| 84.1 |
| 142.0 |
|
|
|
|
| 166.6 |
| 213.7 |
|
8.3 |
| Bank overdrafts |
| — |
| (0.5 | ) |
8.5 |
| Net cash at 30 September |
| 166.6 |
| 213.2 |
|
15
Consolidated statement of financial performance information
|
| Half-year ended 30 September (A$ million unless indicated) |
| 2002 |
| 2001 |
| % Change |
| ||||
|
|
|
|
|
|
|
|
|
| ||||
|
| Ratios |
|
|
|
|
|
|
| ||||
|
|
|
|
|
|
|
|
|
| ||||
9.1 |
| Profit before tax/revenue (%) |
| 13.2 |
| 12.0 |
|
|
| ||||
|
| Profit from ordinary activities before income tax (item 1.5) as a percentage of revenue from ordinary activities (item 1.1) |
|
|
|
|
|
|
| ||||
|
|
|
|
|
|
|
|
|
| ||||
9.2 |
| Profit after tax/equity (%) |
|
|
|
|
|
|
| ||||
|
| Net profit attributable to members (item 1.11) as a percentage of equity (similarly attributable) at the end of the half-year (item 4.37) |
| 7.7 |
| 6.9 |
|
|
| ||||
|
|
|
|
|
|
|
|
|
| ||||
10.1 |
| Earnings per share (calculated in accordance with AASB 1027) |
|
|
|
|
|
|
| ||||
|
|
|
|
|
|
|
|
|
|
| |||
|
| a | Basic earnings per share (A cents) |
| 34.1 |
| 29.1 |
| 17 |
| |||
|
|
|
|
|
|
|
|
|
|
| |||
|
| b | Diluted earnings per share (A cents) |
| 34.0 |
| 28.9 |
| 18 |
| |||
|
|
|
|
|
|
|
|
|
|
| |||
|
| c | Weighted average number of ordinary shares used in calculation of basic earnings per share (millions) |
| 936.5 |
| 953.3 |
| -2 |
| |||
|
|
|
|
|
|
|
|
|
|
| |||
|
|
| Weighted average number of potential shares issued due to dilutive options |
| 3.1 |
| 5.8 |
|
|
| |||
|
|
|
|
|
|
|
|
|
|
| |||
|
|
| Weighted average number of ordinary shares used in calculation of diluted earnings per share (millions) |
| 939.6 |
| 959.1 |
| -2 |
| |||
|
|
|
|
|
|
|
|
|
|
| |||
|
| d | Net profit used in calculating basic and diluted earnings per share |
| 319.4 |
| 277.0 |
| 15 |
| |||
|
|
|
|
|
|
|
|
|
|
| |||
|
| e | The 2002 options were issued at a price above current market price and are therefore not considered to be dilutive. |
|
|
|
|
|
|
| |||
|
|
|
|
|
|
|
|
|
| ||||
11.1 |
| Net tangible asset backing per ordinary share (A$) |
| 2.83 |
| 3.18 |
| -11 |
| ||||
|
|
|
|
|
|
|
|
|
| ||||
12 |
| Discontinuing Operations - see section 19 |
|
|
|
|
|
|
| ||||
|
|
|
|
|
|
|
|
|
| ||||
13 |
| Control gained over entities having material effect |
|
|
|
|
|
|
| ||||
|
| No controlled entities were acquired during the period which affected net profit by more than 5% compared with the previous corresponding half-year. |
|
|
|
|
|
|
| ||||
|
|
|
|
|
|
|
|
|
| ||||
14 |
| Loss of controlled entities having material effect |
|
|
|
|
|
|
| ||||
|
|
|
|
|
|
|
|
|
| ||||
|
| No controlled entities were disposed of during the period which affected net profit by more than 5% compared with the previous corresponding half-year. |
|
|
|
|
|
|
| ||||
|
|
|
|
|
|
|
|
|
| ||||
|
| Dividends: |
|
|
|
|
|
|
| ||||
|
|
|
|
|
|
|
|
|
| ||||
15.1 |
| An interim ordinary dividend was declared on 19 November 2002 and is payable on 16 December 2002. |
|
|
|
|
|
|
| ||||
|
|
|
|
|
|
|
|
|
| ||||
15.2 |
| Registrable transfers received by CSR’s external share registrar, Computershare Investor Services Pty Limited, on 29 November 2002 up to the times specified in the Listing Rules and SCH Business Rules will be registered before entitlements to the dividend are determined. |
|
|
|
|
|
|
| ||||
|
|
|
|
|
|
|
|
|
| ||||
|
| Share register: | Computershare Investor Services Pty Limited |
|
|
|
|
|
|
| |||
|
|
|
|
|
|
|
|
|
| ||||
|
| Amount per share |
|
|
|
|
|
|
| ||||
15.6 |
| current half-year: | 11 cents (seventy percent franked at 30% tax rate) |
|
|
|
|
|
|
| |||
|
| As the unfranked part of this dividend derives from the foreign dividend account, no withholding tax is payable by non-resident holders or by nominee holders on behalf of non-resident beneficiaries. |
|
|
|
|
|
|
| ||||
|
|
|
|
|
|
|
|
|
| ||||
15.7 |
| previous corresponding half-year: | 11 cents (forty percent franked at 30% tax rate) |
|
|
|
|
|
|
| |||
|
|
|
|
|
|
|
|
|
| ||||
15.11 |
| CSR does not have any preference shares on issue |
|
|
|
|
|
|
| ||||
|
|
|
|
|
|
|
|
|
| ||||
15.13 |
| Total ordinary interim dividend |
| 103.2 |
| 102.3 |
|
|
| ||||
|
| The 2002 dividend was declared on 19 November 2002 and in accordance with new accounting standard AASB1044 which CSR adopted early (see page 23) was not included in the financial statements for half-year ended 30 September 2002. The dividend reinvestment plan remains suspended until further notice. |
|
|
|
|
|
|
| ||||
|
|
|
|
|
|
|
|
|
| ||||
|
| Investments accounted for using the equity method |
|
|
|
|
|
|
| ||||
|
|
|
|
|
|
|
|
|
| ||||
|
| Details of aggregate share of profits (losses) of associate entities: |
|
|
|
|
|
|
| ||||
16.1 |
| Profit from ordinary activities before income tax |
| 40.0 |
| 30.1 |
|
|
| ||||
16.2 |
| Income tax expense |
| 11.1 |
| 8.7 |
|
|
| ||||
16.3 |
| Profit from ordinary activities after income tax |
| 28.9 |
| 21.4 |
|
|
| ||||
16.4 |
| Extraordinary items net of tax |
| — |
| — |
|
|
| ||||
16.5 |
| Net profit |
| 28.9 |
| 21.4 |
|
|
| ||||
16.6 |
| Outside equity interest |
| — |
| — |
|
|
| ||||
16.7 |
| Share associate entities net profit |
| 28.9 |
| 21.4 |
|
|
| ||||
|
|
|
|
|
|
|
|
|
| ||||
|
| Material interests in entities which are not controlled entities: |
|
|
|
|
|
|
| ||||
17.1 |
| CSR Limited and its controlled entities have an interest which is material from its viewpoint, in the following equity accounted associated entities: |
|
|
|
|
|
|
| ||||
|
|
|
|
|
|
|
|
|
| ||||
|
|
| Australian Cement Holdings Pty Ltd |
|
|
|
|
|
|
| |||
|
|
|
|
|
|
|
|
|
|
| |||
|
|
| Percentage of issued capital held at 30 September |
| 50.0 |
| 50.0 |
|
|
| |||
|
|
|
|
|
|
|
|
|
|
| |||
|
|
| Contribution to net profit (item 1.9) |
| 12.9 |
| 12.2 |
|
|
| |||
|
|
|
|
|
|
|
|
|
|
| |||
|
|
| New Zealand Sugar Company Limited |
|
|
|
|
|
|
| |||
|
|
|
|
|
|
|
|
|
|
| |||
|
|
| Percentage of issued capital held at 30 September |
| 50.0 |
| 50.0 |
|
|
| |||
|
|
|
|
|
|
|
|
|
|
| |||
|
|
| Contribution to net profit (item 1.9) |
| 3.9 |
| 2.9 |
|
|
| |||
|
|
|
|
|
|
|
|
|
|
| |||
|
|
| Sugar Australia joint venture |
|
|
|
|
|
|
| |||
|
|
|
|
|
|
|
|
|
|
| |||
|
|
| Percentage of ownership interest held at 30 September |
| 50.0 |
| 50.0 |
|
|
| |||
|
|
|
|
|
|
|
|
|
|
| |||
|
|
| Contribution to net profit (item 1.9) (1) |
| 7.1 |
| 3.3 |
|
|
| |||
(1) CSR Limited as a joint venturer incurred a tax expense of A$2.1 million (2001 A$1.0 million) as a result of this profit. This expense is included under item 1.6 but excluded from item 16.2 and 17.1.
17.3 |
| CSR Limited and its controlled entities do not have any other material interests. |
|
|
|
|
|
|
|
16
18 Issued and quoted securities
Category of securities |
| Number |
| Number |
| Issue |
| Paid-up |
|
ORDINARY SHARES |
|
|
|
|
|
|
|
|
|
|
|
|
|
|
|
|
|
|
|
Fully paid shares(a) |
|
|
|
|
|
|
|
|
|
|
|
|
|
|
|
|
|
|
|
On issue/quoted at 31 March 2002 |
| 935 834 472 |
| 935 834 472 |
|
|
|
|
|
|
|
|
|
|
|
|
|
|
|
Movements during the half-year |
|
|
|
|
|
|
|
|
|
Partly to fully paid(b) |
| 10 000 |
| 10 000 |
| 4.21 |
| 4.21 |
|
Conversion of options |
| 2 867 166 |
| 2 867 166 |
| 4.13 |
| 4.13 |
|
Universal Share/Option Plan(c) |
| 670 800 |
| 670 800 |
| 3.18 |
| 3.18 |
|
Share buyback(d) |
| (1 100 000 | ) | (1 100 000 | ) | 6.05 | (k) | 6.05 | (k) |
|
|
|
|
|
|
|
|
|
|
Issued/quoted during the half-year |
| 2 447 966 |
| 2 447 966 |
|
|
|
|
|
|
|
|
|
|
|
|
|
|
|
On issue/quoted at 30 September 2002 |
| 938 282 438 |
| 938 282 438 |
|
|
|
|
|
|
|
|
|
|
|
|
|
|
|
Movements after the half-year |
|
|
|
|
|
|
|
|
|
Partly to fully paid(b) |
| 7 000 |
| 7 000 |
| 4.02 |
| 4.02 |
|
Conversion of options |
| 5 000 |
| 5 000 |
| 4.47 |
| 4.47 |
|
|
|
|
|
|
|
|
|
|
|
On issue/quoted at 19 November 2002 |
| 938 294 438 |
| 938 294 438 |
|
|
|
|
|
|
|
|
|
|
|
|
|
|
|
Partly paid shares(b) |
|
|
|
|
|
|
|
|
|
|
|
|
|
|
|
|
|
|
|
On issue at 31 March 2002 |
| 517 000 |
|
|
| 4.76 |
| 0.10 |
|
Partly to fully paid |
| (10 000 | ) |
|
| 4.21 |
| 4.21 |
|
|
|
|
|
|
|
|
|
|
|
On issue at 30 September 2002 |
| 507 000 |
|
|
| 4.77 |
| 0.10 |
|
|
|
|
|
|
|
|
|
|
|
Movements after the half-year |
|
|
|
|
|
|
|
|
|
Partly to fully paid |
| (7 000 | ) |
|
| 4.02 |
| 4.02 |
|
|
|
|
|
|
|
|
|
|
|
On issue at 19 November 2002 |
| 500 000 |
|
|
| 4.78 |
| 0.10 |
|
|
|
|
|
|
|
|
|
|
|
Options(e) |
|
|
|
|
|
|
|
|
|
On issue at 31 March 2002 |
| 12 693 334 |
|
|
|
|
|
|
|
|
|
|
|
|
|
|
|
|
|
1998 issue (g) |
| 2 825 000 |
|
|
| 3.86 |
|
|
|
converted to fully paid shares |
| (1 325 000 | ) |
|
| 3.86 |
|
|
|
lapsed |
| — |
|
|
|
|
|
|
|
remaining |
| 1 500 000 |
|
|
| 3.86 |
|
|
|
|
|
|
|
|
|
|
|
|
|
1998 issue (h) |
| 1 350 000 |
|
|
| 3.86 |
|
|
|
converted to fully paid shares |
| — |
|
|
| — |
| 0.01 |
|
lapsed |
| — |
|
|
| — |
|
|
|
remaining |
| 1 350 000 |
|
|
| 3.86 |
| 0.01 |
|
|
|
|
|
|
|
|
|
|
|
1999 issue (g) |
| 1 903 334 |
|
|
| 4.33 |
|
|
|
converted to fully paid shares |
| (1 277 166 | ) |
|
| 4.35 |
|
|
|
lapsed |
| (5 000 | ) |
|
| — |
|
|
|
remaining |
| 621 168 |
|
|
| 4.29 |
|
|
|
|
|
|
|
|
|
|
|
|
|
2000 issue (g) |
| 150 000 |
|
|
| 4.04 |
|
|
|
converted to fully paid shares |
| (50 000 | ) |
|
| 4.04 |
|
|
|
lapsed |
| — |
|
|
| — |
|
|
|
remaining |
| 100 000 |
|
|
| 4.04 |
|
|
|
|
|
|
|
|
|
|
|
|
|
2000 issue (i) |
| 2 815 000 |
|
|
| 4.50 |
|
|
|
converted to fully paid shares |
| (215 000 | ) |
|
| 4.51 |
|
|
|
lapsed |
| (10 000 | ) |
|
| — |
|
|
|
remaining |
| 2 590 000 |
|
|
| 4.50 |
|
|
|
|
|
|
|
|
|
|
|
|
|
2001 issue (i) |
| 3 650 000 |
|
|
| 6.96 |
|
|
|
converted to fully paid shares |
| — |
|
|
| — |
|
|
|
lapsed |
| (15 000 | ) |
|
| — |
|
|
|
remaining |
| 3 635 000 |
|
|
| 6.96 |
|
|
|
|
|
|
|
|
|
|
|
|
|
2002 issued (i)(j) |
| 720 000 |
|
|
| 6.39 |
|
|
|
converted to fully paid shares |
| — |
|
|
| — |
|
|
|
lapsed |
| — |
|
|
| — |
|
|
|
remaining |
| 720 000 |
|
|
| 6.39 |
|
|
|
|
|
|
|
|
|
|
|
|
|
On issue at 30 September 2002 |
| 10 516 168 |
|
|
|
|
|
|
|
|
|
|
|
|
|
|
|
|
|
Movements after half-year |
|
|
|
|
|
|
|
|
|
1998 lapsed |
| (25 000 | ) |
|
| 3.86 |
|
|
|
2000 lapsed |
| (40 000 | ) |
|
| 4.47 |
|
|
|
2000 converted to fully paid shares |
| (5 000 | ) |
|
| 4.47 |
|
|
|
2001 lapsed |
| (230 000 | ) |
|
| 7.00 |
|
|
|
|
|
|
|
|
|
|
|
|
|
On issue at 19 November 2002 |
| 10 216 168 |
|
|
|
|
|
|
|
17
a Ordinary fully paid shares are listed on the Australian and London stock exchanges and are traded in sponsored American Depositary Receipt form on the over-the-counter market in the United States. Fully paid ordinary shares carry one vote per share and the right to dividends.
b Ordinary shares were issued between 1986 and 1990 under the now superseded Executive Share/Option Plan. The shares are partly paid to A$0.10, are entitled to one-thirtieth of the dividend, and have no voting rights. Issue prices ranged between A$3.00 and A$5.35 per share.
c. Ordinary fully paid shares were issued in September 2002 under the employee Universal Share/Option Plan. For tax reasons, shares cannot be sold by participants within three years of allotment, unless they finish their employment with the company. Offers of fully paid shares were made to all eligible employees (6,477). 3,354 accepted the offer, subscribing for 100 shares and receiving a further 100 shares at no cost.
d. On 1 June 2001 CSR commenced a twelve month share buyback of up to 10% of its fully paid shares. A total of 23.8 million shares were repurchased under the buyback.
e. The holders of the options do not have any right, by virtue of the options, to participate in any share or other interest issue of CSR or any other body corporate, but the amount payable on exercise or number of shares issued may be varied as a result of pro rata rights or bonus issues.
f. The issue price is the CSR share market price at the time of each issue, hence no cost was recognised in the statement of financial performance.
g. Options issued under the Executive Share Option Plan approved at the 1998 annual general meeting. Options have been issued in 1998 and 1999 and June 2000 and are eligible for conversion progressively over varying periods as from mid 2000 to mid 2005. The conversion of each portion of options to shares is conditional on the percentage growth in the cumulative value of a notional investment in CSR exceeding the growth of an equivalent investment in the ASX All Industrials Accumulation Index, measured over defined periods. Options are issued at the CSR share market price at the time of issue. The obligation to pay this amount is deferred until these options are exercised or lapse.
h. Options issued to Rinker Materials Corporation executives are on the same basis as set out in Note g. above, except that the options are paid to A$0.01 with the balance of the issue price payable when the options are exercised.
i. Options issued under the Executive Share Option Plan approved at the 1998 annual general meeting and amended at the 2000 annual general meeting. Options have been issued in August 2000, December 2000, June 2001, August 2001, December 2001 and June 2002 and are eligible for conversion progressively over varying periods as from mid 2003 to mid 2007. The conversion of options to shares is conditional on the percentage growth in the cumulative value of a notional investment in CSR exceeding the growth of an equivalent investment in the ASX All Industrials Accumulation Index (including manufacturing and industrial organisations, but excluding such companies as banks, finance, insurance, investment, financial services, media, property trusts, telecommunications, leisure and tourism), measured over defined periods. Options are issued at the CSR share market price at the time of issue. The obligation to pay this amount is deferred until these options are exercised or lapse.
j. In June 2002 720,000 options were offered to 7 executives.
k. Average price of shares bought back over the period.
18
Half-year ended 30 September |
| External Revenue |
| Internal Revenue |
| Total Revenue (3) |
| ||||||||||
(A$ million except percentages) |
| 2002 |
| 2001 |
| 2002 |
| 2001 |
| 2002 |
| % |
| 2001 |
| % |
|
Rinker Materials |
|
|
|
|
|
|
|
|
|
|
|
|
|
|
|
|
|
Aggregates |
| 313.4 |
| 293.0 |
| 199.3 |
| 189.0 |
| 512.7 |
| 14 |
| 482.0 |
| 13 |
|
Cement |
| 133.3 |
| 154.1 |
| 157.6 |
| 151.4 |
| 290.9 |
| 8 |
| 305.5 |
| 8 |
|
Concrete, Block, Asphalt |
| 751.8 |
| 752.3 |
|
|
|
|
| 751.8 |
| 20 |
| 752.3 |
| 20 |
|
Concrete pipe and products |
| 462.2 |
| 531.9 |
|
|
|
|
| 462.2 |
| 12 |
| 531.9 |
| 14 |
|
Other |
| 416.8 |
| 408.5 |
|
|
|
|
| 416.8 |
| 12 |
| 408.5 |
| 11 |
|
Eliminations |
| — |
| — |
| (356.9 | ) | (340.4 | ) | (356.9 | ) | (10 | ) | (340.4 | ) | -9 |
|
Total Rinker Materials Corporation |
| 2,077.5 |
| 2,139.8 |
| — |
| — |
| 2,077.5 |
| 56 |
| 2,139.8 |
| 57 |
|
Construction Materials |
| 516.9 |
| 478.9 |
|
|
|
|
| 516.9 |
| 14 |
| 478.9 |
| 13 |
|
Building Products |
| 463.7 |
| 396.2 |
|
|
|
|
| 463.7 |
| 12 |
| 396.2 |
| 10 |
|
Sugar - milling |
| 387.8 |
| 468.3 |
|
|
|
|
| 387.8 |
| 10 |
| 468.3 |
| 12 |
|
Sugar - other |
| 34.9 |
| 39.3 |
|
|
|
|
| 34.9 |
| 1 |
| 39.3 |
| 1 |
|
Aluminium |
| 215.7 |
| 222.4 |
|
|
|
|
| 215.7 |
| 6 |
| 222.4 |
| 6 |
|
Segment Total |
| 3,696.5 |
| 3,744.9 |
| — |
| — |
| 3,696.5 |
| 99 |
| 3,744.9 |
| 99 |
|
Corporate |
| — |
| — |
| — |
| — |
|
|
|
|
|
|
|
|
|
Unallocated Items (2) |
| 22.7 |
| 19.6 |
|
|
|
|
| 22.7 |
| 1 |
| 19.6 |
| 1 |
|
Group Total |
| 3,719.2 |
| 3,764.5 |
| — |
| — |
| 3,719.2 |
| 100 |
| 3,764.5 |
| 100 |
|
Interest Revenue |
| 5.8 |
| 7.4 |
|
|
|
|
| 5.8 |
|
|
| 7.4 |
|
|
|
Total |
| 3,725.0 |
| 3,771.9 |
| — |
| — |
| 3,725.0 |
|
|
| 3,771.9 |
|
|
|
Half-year ended 30 September |
| Profit from ordinary activities before income tax |
| Total assets(5) |
| ||||||||||||
(A$ million except percentages) |
| 2002 |
| % |
| 2001 |
| % |
| 2002 |
| % |
| 2001 |
| % |
|
Rinker Materials |
|
|
|
|
|
|
|
|
|
|
|
|
|
|
|
|
|
Aggregates |
| 102.4 |
| 19 |
| 89.6 |
| 17 |
| 1,260.4 |
| 15 |
| 1,424.0 |
| 17 |
|
Cement |
| 75.7 |
| 14 |
| 73.7 |
| 14 |
| 784.3 |
| 9 |
| 869.8 |
| 11 |
|
Concrete, Block, Asphalt |
| 67.2 |
| 12 |
| 69.5 |
| 14 |
| 776.4 |
| 9 |
| 853.0 |
| 11 |
|
Concrete pipe and products |
| 74.7 |
| 14 |
| 106.1 |
| 21 |
| 886.1 |
| 10 |
| 1,018.8 |
| 13 |
|
Other (1) |
| (0.5 | ) | — |
| (4.1 | ) | (1 | ) | 1,709.1 |
| 20 |
| 668.4 |
| 8 |
|
Eliminations |
| — |
| — |
| — |
| — |
| (55.1 | ) | (1 | ) | (41.1 | ) | (1 | ) |
Total Rinker Materials Corporation (4) |
| 319.5 |
| 59 |
| 334.8 |
| 65 |
| 5,361.2 |
| 62 |
| 4,792.9 |
| 59 |
|
Construction Materials |
| 58.6 |
| 11 |
| 32.3 |
| 6 |
| 963.3 |
| 11 |
| 979.3 |
| 12 |
|
Building Products |
| 63.2 |
| 12 |
| 47.9 |
| 9 |
| 785.0 |
| 9 |
| 767.0 |
| 9 |
|
Sugar - milling |
| 41.9 |
| 8 |
| 65.7 |
| 13 |
| 779.0 |
| 9 |
| 872.2 |
| 11 |
|
Sugar - other |
| 17.4 |
| 3 |
| 13.6 |
| 3 |
| 185.1 |
| 2 |
| 187.5 |
| 2 |
|
Aluminium |
| 61.1 |
| 11 |
| 55.2 |
| 11 |
| 400.2 |
| 5 |
| 407.7 |
| 5 |
|
Segment Total |
| 561.7 |
| 104 |
| 549.5 |
| 107 |
| 8,473.8 |
| 98 |
| 8,006.6 |
| 98 |
|
Corporate |
| (16.0 | ) | (3 | ) | (16.1 | ) | (3 | ) | 123.9 |
| 2 |
| 162.2 |
| 2 |
|
Unallocated Items |
| (4.7 | ) | (1 | ) | (19.5 | ) | (4 | ) |
|
|
|
|
|
|
|
|
Group Total |
| 541.0 |
| 100 |
| 513.9 |
| 100 |
| 8,597.7 |
| 100 |
| 8,168.8 |
| 100 |
|
Borrowing costs less interest revenue |
| (49.1 | ) |
|
| (62.8 | ) |
|
|
|
|
|
|
|
|
|
|
Cash |
|
|
|
|
|
|
|
|
| 166.6 |
|
|
| 213.7 |
|
|
|
Tax Assets |
|
|
|
|
|
|
|
|
| 321.7 |
|
|
| 329.5 |
|
|
|
Total |
| 491.9 |
|
|
| 451.1 |
|
|
| 9,086.0 |
|
|
| 8,712.0 |
|
|
|
(1) Includes A$1168.2 million of assets acquired from Kiewit on 26 September 2002.
(2) Includes profit (loss) on major asset sales, product liability charges, discontinued operations and certain rationalisation costs.
(3) Excludes net profit from associates.
(4) Profit from ordinary activities before tax increased from US$170.4 million in 2001 to US$176.3 million in 2002.
(5) Excludes intragroup.
19
19 Comments by directors
i. Basis of financial report preparation. This Half Yearly Report is a general purpose financial report prepared in accordance with the Accounting Standard AASB 1029 “Interim Financial Reporting” and the Listing Rules of the Australian Stock Exchange Limited. It should be read in conjunction with the last Annual Report and announcements to the market made by the company during the half-year in accordance with the company’s continuous disclosure obligations arising under the Corporations Act 2001 and Listing Rule 3.1. The financial statements in this report are “condensed financial statements” as defined in AASB 1029 “Interim Financial Reporting”. This report does not include all the notes of the type normally included in an annual financial report.
ii. Material factors affecting revenue and expenses of CSR Limited and its controlled entities for the half-year ended 30 September 2002 are included on pages 1 - 9.
iii. There has been no event since the end of the half-year which has had a material effect on the matters already reported except as noted in (iv) below.
iv. Subsequent Events – Demerger proposal. On 19 November 2002 the CSR board announced it was moving forward with a demerger proposal that involves splitting the CSR group into two listed Australian companies. Under the proposal, Rinker Materials Corporation and the Readymix and Humes businesses would be demerged from the CSR group. The de-merged businesses would not be materially different from those indicated in the segment analysis on page 22. The aim is to propose to shareholders a demerger to take effect in the first half of next year.
v. Subsequent Events – Change in Tax Legislation. Legislation to allow groups, comprising a parent entity and its Australian resident wholly-owned entities, to elect to consolidate and be treated as a single entity for income tax purposes was substantively enacted on 21 October 2002. This legislation, which includes both mandatory and elective elements, is applicable to the company. In accordance with Accounting Standards, the financial effect of the legislation has not been brought to account in the financial statements for the half year ended 30 September 2002. At the date of this report the directors have not completed the assessment of the financial effect, if any, the legislation may have on the company and, accordingly, the directors have not made a decision to elect to be taxed as a single entity.
vi. The directors anticipate that the final dividend to be paid mid 2003, and the interim dividend to be paid late 2003 will be partially franked.
vii. Except as described in (ix) below, the accounting standards, policies, estimation methods and measurement bases used in this report are the same as those used in the last annual report.
viii. Except as described in (ix) below, there have been no revisions in estimates of amounts reported in previous interim periods.
ix. Rounding of amounts to nearest A$0.1 million. Unless otherwise shown, the amounts have been rounded to the nearest tenth of a million dollars and are shown by ‘A$ million’. CSR Limited is a company of the kind referred to in Australian Securities and Investments Commission Class Order 98/100 issued 10 July 1998.
x. Adoption of AASB1044. In CSR’s financial report for the year ended 31 March 2002 directors foreshadowed the potential effect of a new accounting standard, AASB1044 “Provisions, Contingent Liabilities and Contingent Assets” (“AASB1044”). The directors have now considered the effect of AASB1044 and have resolved to apply the new standard for CSR’s financial year commencing 1 April 2002, even though the standard is not required to be adopted until annual reporting periods beginning on or after 1 July 2002. The adoption of AASB1044 affects the timing of recording CSR’s dividend provision and increases the amount of the product liability provision (as indicated in our 2002 financial report), as discussed below.
Dividends. CSR will now only recognise as a liability those dividends declared on or before the reporting date. Previously, dividends declared after the reporting date but before the time of completion of the financial report were recognised as a liability at the reporting date. As a result of adoption of AASB1044, the consolidated entity’s provision for dividend as at 1 April 2002 reduced by $121.7 million and retained profits increased by $121.7 million.
Product Liability. AASB1044 imposes new requirements for the determination of uncertain liabilities, including providing significant additional guidance on the measurement of such liabilities as well as on discounting provisions to their present value using a rate which is lower than that previously used by CSR. In accordance with AASB1044, CSR has recognised as a provision the present value of anticipated compensation payments and legal costs arising from product liability claims by discounting at a pre-tax rate that reflects the current market assessment of the time value of money and risks specific to those liabilities.
As a result of the adoption of AASB1044, CSR’s product liability provision as at 1 April 2002 increased by A$205.2 million, the corresponding deferred income tax asset increased by A$61.5 million and retained profits decreased by A$143.7 million. This change in the product liability provision does not reflect any material change in CSR’s underlying product liability risk profile nor does it include any potential benefits from settlements with insurers.
An increase in the provision of A$6.0 million (A$4.2 million after associated income tax benefit) has been recognised as an expense in the statement of financial performance for the six months ended 30 September 2002. CSR’s directors are of the view that it is impracticable to restate the comparative financial information for the corresponding prior half year as if AASB 1044 had always been applied, however they do not believe that the impact on that statement of financial performance would have been material.
A description of the nature of the product liability present obligation, uncertainties about future sacrifices, major assumptions and details of any related settlements with insurers are provided under Litigation on page 25.
20
Half-year ended 30 September (A$ million) |
| 2002 |
| 2001 |
| |
|
|
|
|
|
| |
ADDITIONAL INFORMATION |
|
|
|
|
| |
|
|
|
|
|
| |
1 | Income tax |
|
|
|
|
|
|
|
|
|
|
|
|
| The actual income tax expense charged against profit differs from the prima facie income tax expense calculated on the profit before tax at the current income tax rate. The major items responsible for the difference are: |
|
|
|
|
|
|
|
|
|
|
|
|
| Non-tax deductible depreciation and amortisation |
| 8.3 |
| 8.0 |
|
| Non-tax deductible other expenditure |
| 1.1 |
| 1.0 |
|
| Asset disposals, write-downs and other restructuring costs |
| (5.9 | ) | (1.3 | ) |
| Asia trading (gains) losses not recognised |
| (0.6 | ) | (0.5 | ) |
| Non-assessable associate entities’ income |
| (6.8 | ) | (5.7 | ) |
| Research and development concession |
| (0.1 | ) | (0.2 | ) |
| Income tax (over) under provided in previous years |
| (2.5 | ) | 3.8 |
|
| Overseas tax differential |
| 20.9 |
| 21.1 |
|
| Other items |
| (2.4 | ) | 1.4 |
|
|
| 12.0 |
| 27.6 |
| |
2 Gearing analysis
(A$ million except ratios) |
| 30 September 2002 |
| 31 March 2002 |
| 30 September 2001 |
|
Borrowings |
|
|
|
|
|
|
|
Short-term debt |
| 26.2 |
| 40.2 |
| 43.2 |
|
Current maturities of long-term debt |
| 246.7 |
| 63.8 |
| 30.2 |
|
Long-term debt |
| 2204.9 |
| 1790.7 |
| 2269.8 |
|
|
|
|
|
|
|
|
|
Total borrowings |
| 2477.8 |
| 1894.7 |
| 2343.2 |
|
|
|
|
|
|
|
|
|
Cash and short-term lending |
|
|
|
|
|
|
|
Cash at banks and on hand |
| 82.5 |
| 68.2 |
| 71.7 |
|
Short-term lending |
| 84.1 |
| 88.4 |
| 142.0 |
|
|
|
|
|
|
|
|
|
Total cash and short-term lending |
| 166.6 |
| 156.6 |
| 213.7 |
|
|
|
|
|
|
|
|
|
Net debt |
| 2311.2 |
| 1738.1 |
| 2129.5 |
|
Total shareholders’ equity |
| 4258.7 |
| 4104.4 |
| 4141.8 |
|
|
|
|
|
|
|
|
|
Gearing ratios |
|
|
|
|
|
|
|
Net debt: equity plus net debt (%) |
| 35.2 |
| 29.7 |
| 34.0 |
|
Net debt: equity (%) |
| 54.3 |
| 42.3 |
| 51.4 |
|
21
3 Litigation
CSR Limited and/or certain subsidiaries (CSR) were involved in mining asbestos and manufacturing and marketing products containing asbestos in Australia, and exporting asbestos to the United States. As a result of these activities, CSR has been named as a defendant in litigation in Australia and the United States.
In Australia, claims for asbestos induced injury have been made by employees and ex-employees of CSR, by others such as contractors and transporters and by users of products containing asbestos. As at 30 September 2002, there were 594 such claims pending.
In the United States, claims for damages are being made by people who allege exposure to asbestos fibre liberated either during the manufacture of products containing asbestos or in the installation or use of those products. As at 30 September 2002, there were 2,718 such claims pending.
CSR has been settling claims since 1989. As at 30 September 2002, CSR had resolved 128,000 claims in the United States, including resolution of 80,000 claims in mass settlements in West Virginia, Texas and Mississippi, and 1,248 claims in Australia.
There are uncertainties surrounding litigation in each of the United States and Australia. The incidence of asbestos related disease, the propensity of claimants to make formal demands on CSR, the amount of those demands and the presence of other defendants in litigation involving CSR impact the number and value of claims made against CSR.
CSR has recognised as a provision for product liability the best estimate of the consideration required to settle the present obligation for anticipated compensation payments and legal costs as at the reporting date. In determining the provision, CSR has obtained independent expert advice in relation to the future incidence of asbestos related claims in each of the United States and Australia. Those assessments have projected CSR’s claims experience into the future using various modelling techniques that take into account a range of possible outcomes. The present value of the liabilities is estimated by discounting the estimated cash flows using the pre-tax rate that reflects the current market assessment of the time value of money and risks specific to those liabilities.
CSR has commenced proceedings in New Jersey against a number of insurers who issued policies to CSR during the years 1979 to 1986. In those proceedings CSR seeks indemnity for US asbestos claims and certain other relief. Those proceedings are being pursued by CSR as speedily as possible.
At 30 September 2002 a provision of A$333.8 million has been made for all known claims and probable future claims but not for such claims as cannot presently be reliably measured. CSR cannot determine with certainty the amount of its ultimate liability with respect to asbestos related claims or the future impact on its financial condition. However, taking into account the provision already included in CSR’s financial statements, the status of proceedings in CSR’s insurance litigation and current claims management experience, the directors are of the opinion that asbestos litigation in the United States and Australia will not have a material adverse impact on its financial condition.
Other contingent liabilities
CSR Limited acts as an authorised self-insurer in New South Wales, Queensland, Victoria, South Australia, Western Australia, and the Australian Capital Territory for workers’ compensation insurance, as does Rinker Materials Corporation and certain of its controlled entities in California, Nevada, New Mexico and Washington. Adequate provision has been made for all known claims and probable future claims that can be reliably measured.
22
4 CSR financial dates
2002 |
|
|
19 November |
| Half-year profit and interim dividend announced |
25 November |
| Shares begin trading ex dividend |
29 November |
| Record date for interim dividend |
16 December |
| Interim dividend paid, and |
|
|
|
2003 (Indicative dates) | ||
31 March |
| Year end |
20 May |
| Profit and final dividend announced |
30 May |
| Shares begin trading ex dividend |
5 June |
| Record date for final dividend |
18 June |
| Annual report released and Notice of Meeting and Proxy Form mailed |
3 July |
| Final dividend paid |
15 July |
| Proxy returns close (10.00 am Sydney) |
17 July |
| Annual general meeting |
30 September |
| Half-year end |
COMPLIANCE STATEMENT
1. This report has been prepared under accounting policies which comply with accounting standards as defined in the Corporations Act 2001.
2. This report and the financial statements prepared under the Corporations Act 2001 use the same accounting policies.
3. This report does give a true and fair view of the matters disclosed.
4. The financial statements contained within this report have been subject to review by a registered auditor.
5. The independent review report is attached.
6. The entity has a formally constituted audit committee.
Peter Kirby |
Managing director |
|
Sydney, 19 November 2002 |
23
CSR LIMITED
ABN 90 000 001 276
Declaration by directors on the financial statements and notes thereto set out on pages 11 to 26
The directors declare that the financial statements and notes thereto:
(a) comply with Accounting Standards;
(b) give a true and fair view of the financial position and performance of the consolidated entity;
(c) are, in the directors’ opinion, in accordance with the Corporations Act 2001.
In the directors’ opinion, there are reasonable grounds to believe that the company will be able to pay its debts as
and when they become due and payable.
Signed in accordance with a resolution of the directors made pursuant to s.303(5) of the Corporations Act 2001.
Peter Kirby |
Managing director |
|
Sydney, 19 November 2002 |
24
INDEPENDENT REVIEW REPORT TO THE MEMBERS
OF CSR LIMITED
Scope
We have reviewed the attached financial report of CSR Limited in the form of Appendix 4B of the Australian Stock Exchange (ASX) Listing Rules, including the directors’ declaration, for the half-year ended 30 September 2002, but excluding the following sections:
a) material factors affecting the revenues and expenses of the consolidated entity for the current period (pages 1-9); and
b) compliance statement (page 26).
The financial report includes the consolidated financial statements of the consolidated entity comprising the company and the entities it controlled at the end of the half-year or from time to time during the half-year. The company’s directors are responsible for the financial report. We have performed an independent review of the financial report in order to state whether, on the basis of the procedures described, anything has come to our attention that would indicate that the financial report is not presented fairly in accordance with Accounting Standard AASB 1029 “Interim Financial Reporting” and other mandatory professional reporting requirements in Australia, statutory requirements and ASX Listing Rules as they relate to Appendix 4B, so as to present a view which is consistent with our understanding of the consolidated entity’s financial position, and performance as represented by the results of its operations and its cash flows, and in order for the company to meet its obligations to lodge the financial report with the Australian Securities and Investments Commission and the ASX.
Our review has been conducted in accordance with Australian Auditing Standards applicable to review engagements. A review is limited primarily to inquiries of the entity’s personnel and analytical procedures applied to the financial data. These procedures do not provide all the evidence that would be required in an audit, thus the level of assurance provided is less than given in an audit. We have not performed an audit and, accordingly, we do not express an audit opinion.
Statement
Based on our review, which is not an audit, we have not become aware of any matter that makes us believe that the half-year financial report of CSR Limited is not in accordance with:
(a) the Corporations Act 2001, including:
(i) giving a true and fair view of the consolidated entity’s financial position as at 30 September 2002 and of its performance for the half-year ended on that date; and
(ii) complying with Accounting Standard AASB 1029 “Interim Financial Reporting” and the Corporations Regulations 2001; and
(b) other mandatory professional reporting requirements in Australia and ASX Listing Rules as they relate to Appendix 4B.
| DELOITTE TOUCHE TOHMATSU |
|
|
|
|
| H B McHutchison |
| Partner |
| Chartered Accountants |
|
|
|
|
Sydney, 19 November 2002 |
|
The liability of Deloitte Touche Tohmatsu is limited by, and to the extent of, the Accountants’ Scheme under the Professional Standards Act 1994 (NSW).
25

Good morning and welcome to everyone here this morning and to all of you listening on the webcast.
I would like to introduce our management team….
• Graeme Pettigrew…Chief Executive Building Products (Aust, NZ & Asia)
• Karl Watson Junior, Chief Executive of Construction Materials (Aust & Asia)
• Ian McMaster…Chief Executive Sugar
• Warren Saxelby, Chief Financial Officer
• Alec Brennan…our Deputy Managing Director, and
• David Clarke, Chief Executive of our US subsidiary Rinker Materials Corporation (“Rinker”).
• I will talk about the demerger proposal later but you may know that — assuming the demerger goes ahead — David has just been appointed Chief Executive of Rinker Group, and Alec Brennan has been appointed Chief Executive of CSR Limited.
• Both of them are well known to you and both companies will be in very good hands. I myself will be staying on to lead CSR through the demerger process, until some time next year, before moving on to other things. Let me say that a demerger will be the culmination of the strategy we have been pursuing here for the past five years, and I will be pleased to have completed what I set out to do five years ago.
1

Here’s the outline for today, but first, let’s look at the results…
2
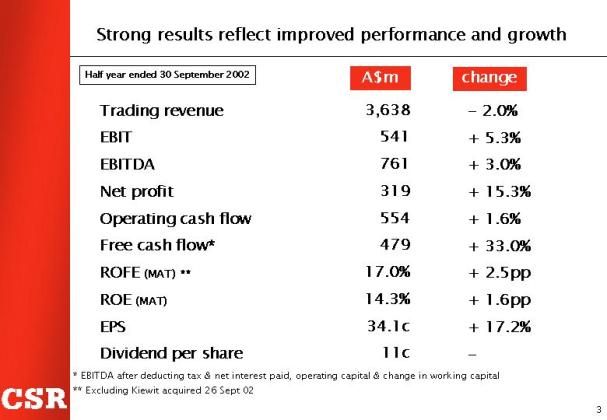
• CSR achieved another strong result overall.
• Trading revenue is the only negative here — but if we ignore fluctuations in the exchange rate, it is up 3%.
• EBIT & EBITDA is up, with higher profits from Construction Materials and Building Products offsetting the fall in Sugar.
• Net profit is up a strong 15% — helped by lower tax payments.
• While Operating Cash Flow is up only 2%, Free Cash Flow is up 33% — due mainly to lower capex & interest.
• Return on funds employed and Return on Equity are still pulling ahead and we are now positioned above most of our international peers.
• ROE has been a particular target for us, and I am pleased to say that both measures have more than doubled in the past five years.
• Earnings per share is up 17%.
• The interim dividend is 11 cents per share. Franking is higher (versus 12 months ago) at 70% and the unfranked portion will again be paid from CSR’s Foreign Dividend Account, so overseas shareholders receive the dividend free of withholding tax.
3
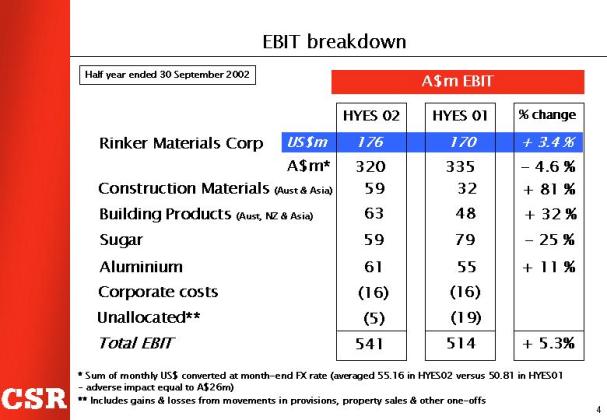
• Looking at the individual businesses, Rinker was up 3.4% in US$, but the stronger Australian dollar meant a fall in A$ earnings.
• Strong results from aggregates, concrete and cement — particularly in Florida — offset poor results from Polypipe and Prestress, and the decline in Concrete Pipe & Products…due largely to the fall in non-residential construction activity.
• Construction Materials performed very strongly. Karl Watson and his team have done a great job managing margins and getting prices up…Although they know there is still a way to go for the business to earn its cost of capital.
• Building Products also did well, helped by stronger residential construction activity.
• Sugar was down 25%, mainly on lower world prices, and Aluminium was up 11%, mainly on higher volumes.
• Corporate costs were steady and Unallocated was a A$5 million loss.
4

• This shows how the unallocated line is made up…
• As you may know, we work hard to keep the business results very clean, so all the major asset sales and one offs come in here.
• I will talk later about changes to the product liability provision due to the new accounting standard — which took effect in April — but the $9 million accretion cost follows this change.
• This is partly offset by a $3 million currency gain on the provision, so the net asbestos cost this half is $6 million.
• We expect a regular annual charge of around $20 million going forward — subject to long term interest rate and currency fluctuations. It will be posted each half year.
• The “other” category includes strategy costs of about $2 million, some small asset sales, a superannuation top up and provisions.
5

• This chart details the change in EBIT.
• The green bar at the top shows EBIT of A$514m for the HYES01. The green bar at the bottom shows EBIT for this half year of A$541m — up 5.3%.
• If we eliminate the restructuring and one-offs last year, we get a comparable EBIT (the yellow bar) of A$534 m.
• The blue bars show positive movements : A small increase in volume, dwarfed by A$55m from pricing. Our OIP cost savings generated A$48m this half.
• The red bars show the negatives — the exchange rate was up 9% on last year. Sugar was also a negative. Cost inflation continues — but is largely offset by OIP savings. The A$17m for Other covers higher health, insurance and pension costs — some of which we hope may be one-offs…..
• This brings us to a comparable EBIT of A$538m.
6
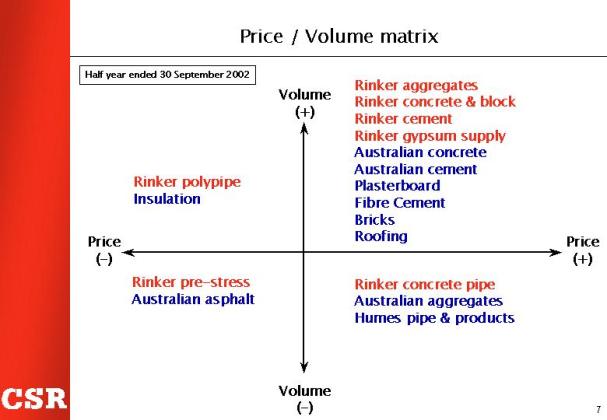
• This shows the movement in price and volume for our products during the half — compared with 12 months earlier.
• Rinker’s aggregates, concrete and cement businesses were strong, although the price increase in cement was less than 1% due to lower import prices. Aggregate prices overall rose 1.5%.
• In Australia, concrete and aggregate prices were up 12 and 9 per cent respectively.
• Price rises for Australian plasterboard and concrete pipes — both here and in the US — were minimal.
• Roof tile prices are still lower than they were 10 years ago. We have announced a significant price increase from December.
7
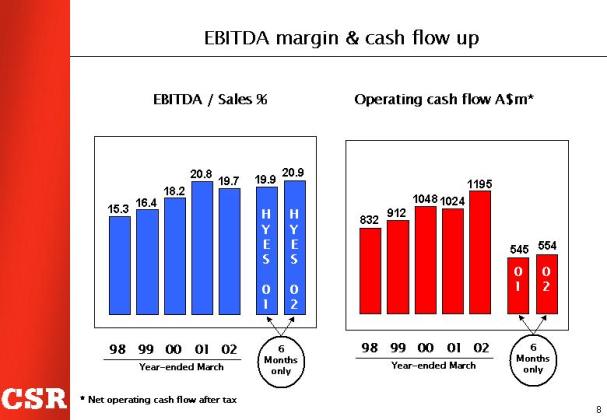
• The EBITDA to sales margin increased one point to 20.9% and operating cash flow continued its upward trend.
• Cash generation is one of the great strengths of CSR.
8

• The return on funds employed also continues to improve — although it does bounce around with acquisitions.
• ROE is again up strongly.
9
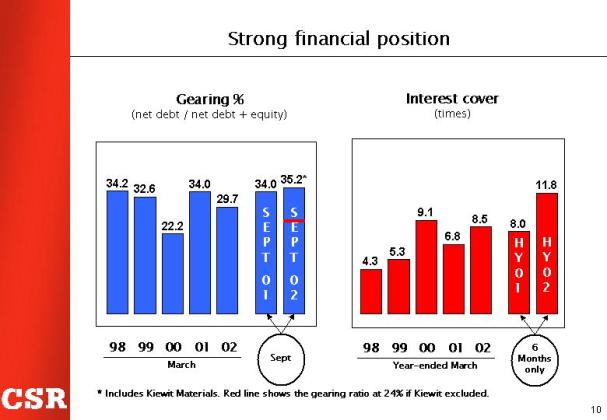
• CSR’s financial position is strong.
• Gearing is up due to the acquisition of Kiewit.
• Without Kiewit it would be about 24%.
• We expect it to be down to 33% or so by full year end.
• Interest cover of almost 12 times is extremely comfortable.
10

• Operating capex continues to be well-managed, at around 60% of depreciation.
• Of the A$1.1 billion in development capex, Kiewit represents almost A$1 billion.
• The other major project is the A$25 million rooftile plant in Sydney.
11

• As we advised in November 2000 and again in the current Annual Report, the new accounting standard AASB1044 requires an adjustment to product liability provisions .
• The lower discount rate we are required to use has the major effect on the provision, which we have increased to $338 million.
• We have adopted the new standard effective 1 April this year.
• The change involves a prior period adjustment — so you will see it in retained earnings, but not in the profit line.
• Importantly, the increased provision does not reflect any change in underlying asbestos payments — nor does it reflect any insurance recoveries we are expecting.
12
• Now to individual business performance…
13
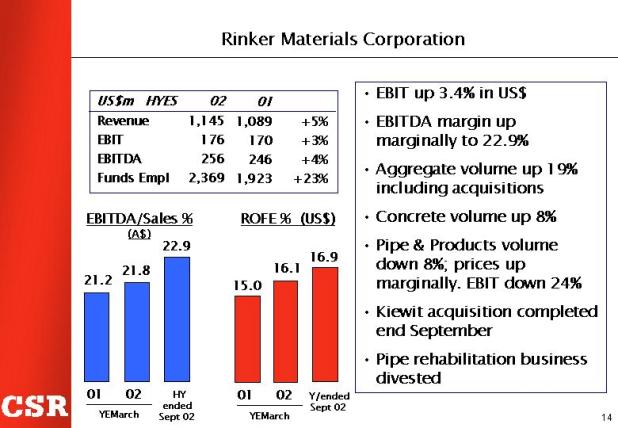
• In US$ Rinker again performed well helped by the strength of our market positions, particularly in Florida.
• The turnaround in Nevada is particularly pleasing after many years of profitless volume. Nevada just passed a referendum for a US$2.6 billion road and transportation spending program over the next 25 years.
• The Kiewit acquisition was settled late in September and is performing very strongly to date. The post-acquisition management program is well underway, Kiewit management seem to be very comfortable with the Rinker culture and the outlook for this business is looking very positive.
• The acquisitions are generally performing very well but this is not universal….The pipe rehabilitation business is one area which has not performed. It was sold during the half at around written-down book value.
14
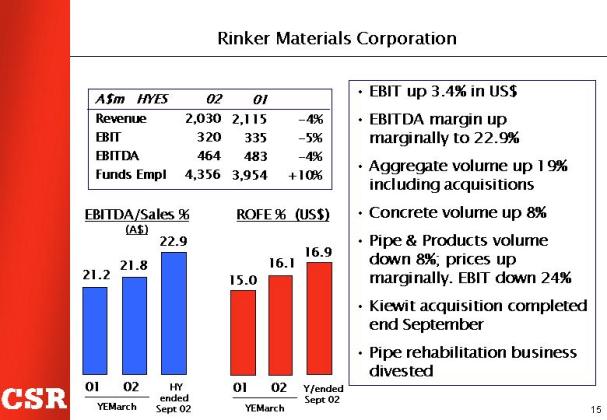
In A$ with the exchange rate impact the results do not look as good.
15
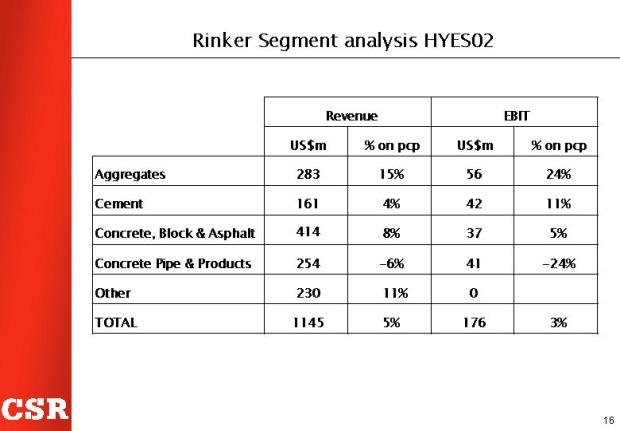
• This gives you a breakdown of the Rinker business segments by revenue and EBIT.
• Other than Concrete Pipe & Products all major businesses performed well.
16

• This chart shows how the US acquisitions made since March 1998 are performing.
• Their EBITDA margin is improving and is ahead of Rinker as a whole.
• That’s partly a mix issue but another way of looking at it is that those acquisitions provided 47% of Rinker’s total shareholder value-added (SVA) during the half. They represent 45% of total funds employed.
• Two-thirds of them had positive SVA during the half, and all the major acquisitions are SVA positive: Florida Crushed Stone, South Central (American Limestone and the Cemex quarries) and Wilson Concrete.
17

• Construction Materials better performance is all about improved margin management.
• Prices of concrete and aggregate were increased in April.
• To hold those increases, we lost some market share, but we are working hard to recover that — primarily through improved customer service.
• A further price increase took effect in October and is again gradually rolling out through the business.
• Cement prices have also increased around 5%.
• In China, Tianjin Readymix is performing well and continuing to improve.
• Humes concrete pipe & products profit also improved as costs were cut and prices increased slightly.
18

• Building Products performed well, lifting EBIT 32% on a 17% sales increase.
• Margins were higher across the board.
• Residential construction during the period rose 27% relative to 12 months earlier. Commercial construction was 2% higher. [Source: HIA, based on work done].
• Prices increased in most products — but the rises were small.
• Insulation was disappointing although a price increase is underway.
• The new Rosehill tile plant commenced production and is expected to lift output by 20% and cut costs by 15%.
19
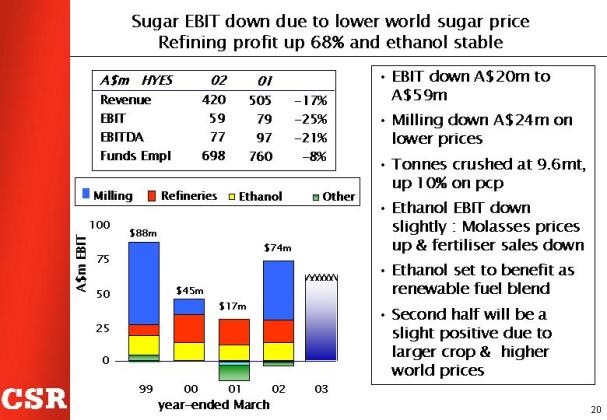
• Sugar was down on lower world prices, but the downstream refining business improved significantly, up 68%.
• Ethanol EBIT dropped slightly on lower fertiliser sales due to the drought .
• Ethanol may benefit as a fuel blend if governments move to encourage industry in that regard.
• The second half result is often a loss due to the timing of the sugar milling season, but this year, the current higher world prices — around 7 US cents a pound — together with a bigger crop than expected — should mean a small profit in the second half.
20

• Aluminium profit was up in the first half due to lower alumina costs and some additional sales
• Full year profit will be slightly ahead of last year’s $110 million EBIT
• Hedging continues to ensure good returns — and we are well covered for the next two to three years
• We also have good growth opportunities in this business — the high return AP-22 project, to which we must commit by November 2003 — and a possible fourth potline, which is now being assessed.
21

Now to strategy….
We announced today that we are moving ahead with demerger plans. We are continuing with our due diligence, aiming to give shareholders a demerger proposal — which, if approved, would be completed by mid-2003.
22
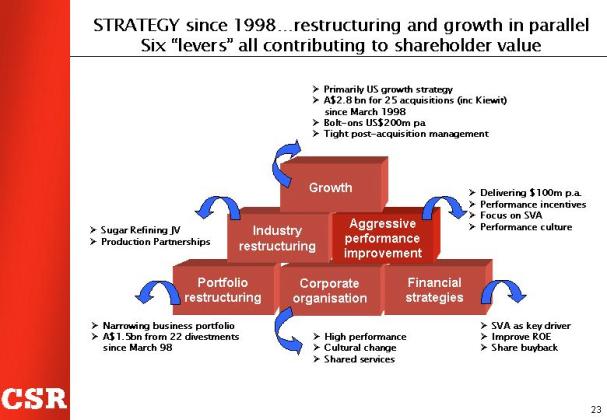
• For those of you familiar with the strategy we have pursued over the past five years, demerger plans will not be a surprise.
• Our strategy has been very clear and consistent.
• We have used six strategy levers to transform CSR into a major international heavy building materials group — and to deliver top quartile returns to our shareholders.
•We have been restructuring and expanding simultaneously…..
23
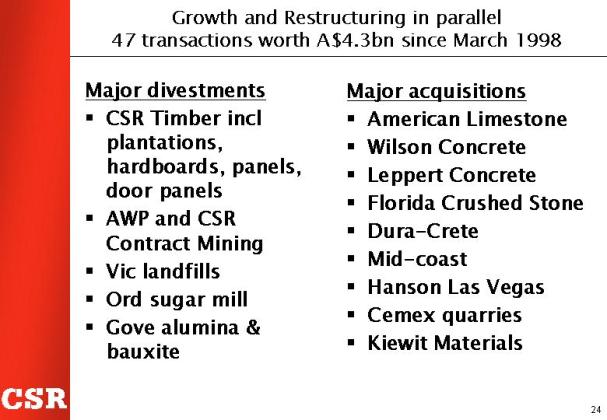
• With 22 divestments and 25 acquisitions since
• 1998…
• A total of 47 transactions…..worth $4.3 billion…
• All of the acquisitions have been in heavy building materials — and all by Rinker in the US
• Along the way we attempted a trade sale of our sugar business but we could not conclude a deal….
24
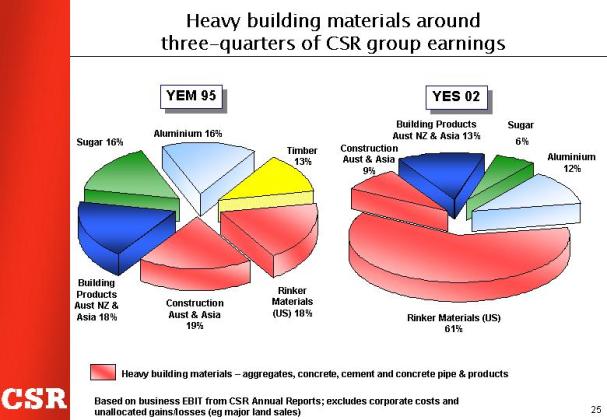
• The result of all this is that around three quarters of CSR group EBIT now comes from heavy building materials…
• Which is made up of Rinker Materials Corporation in the US — and the Readymix and Humes concrete pipe business in Australia and Asia.
25
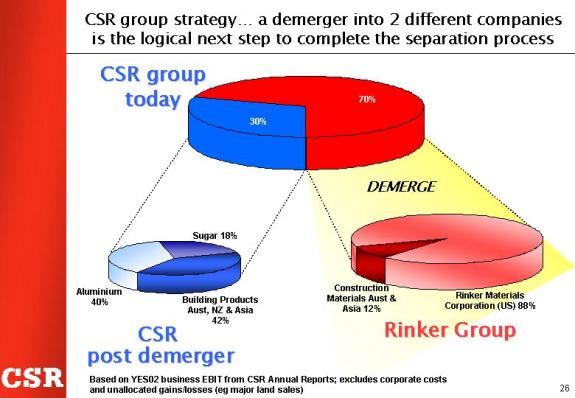
•The logical next step to complete this separation process is through a demerger. •The new demerger laws make it much more attractive for our shareholders. We expect the best outcome for shareholders will be achieved by demerging the heavy building materials assets out of CSR…..forming a new company called Rinker Group Ltd (“Rinker Group”). •CSR Limited will then comprise • the Building Products business – which is the leading manufacturer of building products in Australia • our Aluminium interest – which holds a 25% stake in the Tomago aluminium smelter near Newcastle, and • CSR Sugar, which is among the largest and most efficient sugar cane milling businesses in the world.
|
26

• You then have two very different companies, appealing to different investors.
• Rinker Group would be one of the top 10 building materials groups in the world.
• We would expect it to be a growth stock, continuing to expand strongly in heavy building materials -- especially in the US.
• We expect CSR to be a higher-yielding, diversified company with a history of stable earnings and holding some of the best-known household brands in the country….CSR too will have growth opportunities…and I’ll come to those a little later.
267
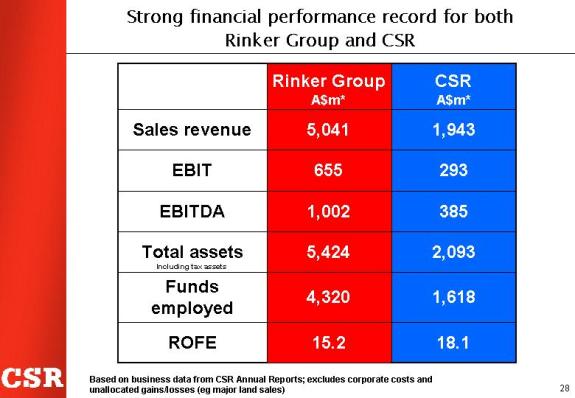
This slide gives you the respective financial positions….
They are both strong companies. The return on funds employed is well over the cost of capital in both.
28

Ø A key rationale for the demerger is focus – both companies can concentrate on a much narrower range of businesses, and focus on their respective strengths
Ø Their dividend policy and capital management will fit better with their individual business strategies, and…
Ø They can more effectively pursue growth options…
Ø Rinker Group has over a billion dollars in EBITDA -- but a demerger would also provide access to equity capital if needed
Ø CSR meanwhile has identified value-adding growth opportunities – which up to now, have been a lower priority for the CSR group.
29

• Both Rinker Group and CSR are now at a point where they can, and would benefit greatly, from standing on their own two feet :
• Rinker Group – particularly with Kiewit -- has the critical mass to reach major investor thresholds
• Kiewit is an important US western stronghold and gives the group critical mass as a national player in the US, and
•Construction Materials in Australia is now performing
• The CSR businesses meanwhile have largely been ignored by investors. But they have significantly improved performance :
• e.g Building Products is now delivering twice the ROFE it was 5 years ago, from a similar number of housing starts
• There are opportunities now for growth and to deliver further performance improvement -- they require focus and possibly some capital.
30
•Moving now to Rinker Group…
•It will be an Australian company, headquartered in Sydney.
•We expect it to be well within the Top 50 companies on the ASX .
31

There are significant benefits for Rinker Group as a focused, stand-alone company.
We expect it will adopt a dividend and capital policy more in line with its international building materials peers – and more suited to its growth strategy.
The performance history of the Rinker Group companies over the past five years is very strong compared to its peers – but this has not been fully reflected in the CSR share price.
The demerger creates an opportunity for a re-rating, more in line with US peers.
32
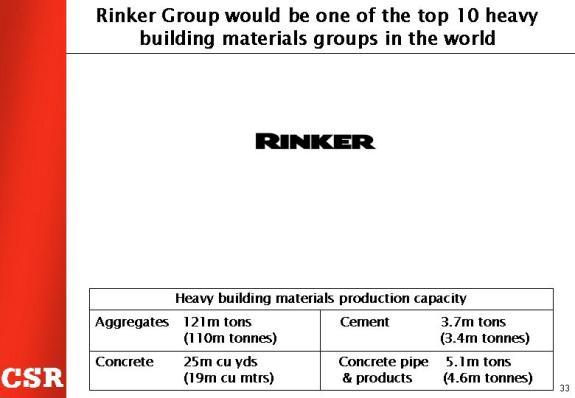
This slide shows Rinker’s production capacity.
33

It has strong market positions.
This slide shows the market positions of Rinker Materials Corporation in the US – and Construction Materials’ in Australia.
Readymix also has the leading market share in Tianjin, China.
34
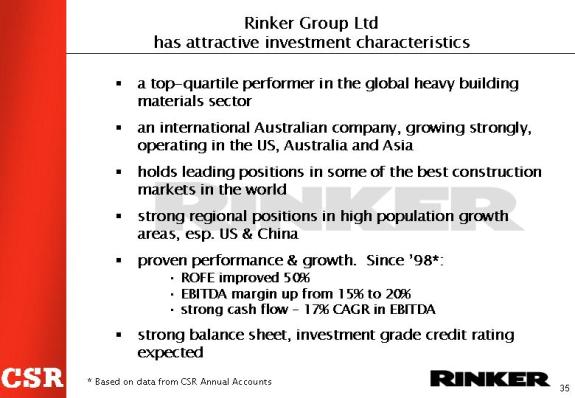
• The Rinker Group performance over the past five years shows that:
• ROFE has improved by 50% and
• the EBITDA to sales margin has gone from 15% to 20%
35

This slide shows Rinker Group’s performance record…
Revenue has grown 12% pa compound since 98 and EBIT has more than doubled.
36
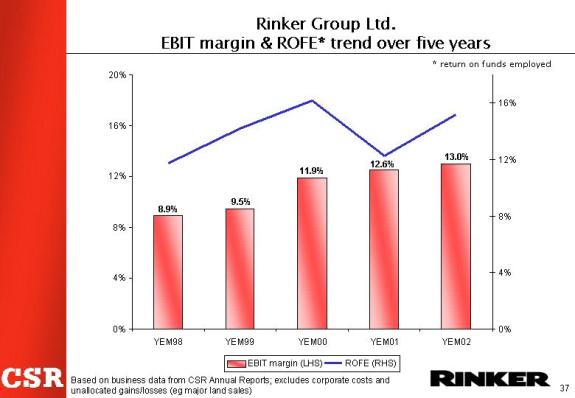
ROFE and EBIT margin have also grown.
37
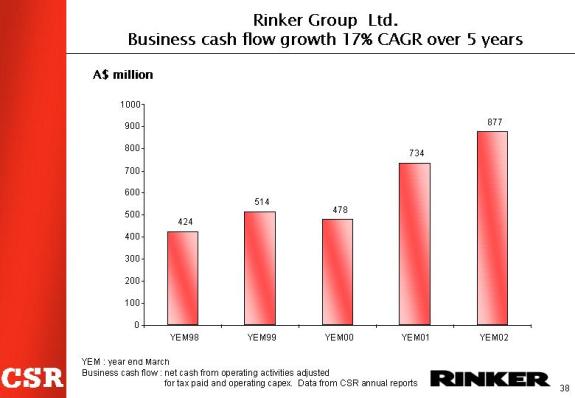
Cash flow growth is also very strong – with a compound annual growth rate of 17% over the past 5 years.
38
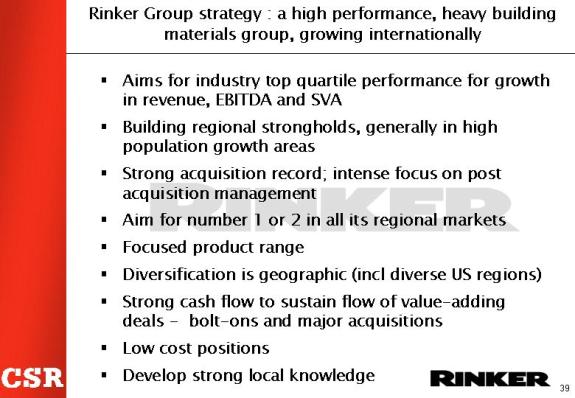
This strategy has been consistently pursued since 1998, particularly by Rinker Materials in the US.
It is all about building strong local positions in regional markets – primarily in high population growth areas – and being a low cost operator, focused on shareholder value.
The result is a very strong performance over the past five years -- continuing to build shareholder value every year. With sound, consistent management that record should continue.
39
And now to CSR….
40

A demerger will allow CSR to drive better returns, further participate in industry rationalisation and to pursue good growth opportunities.
41
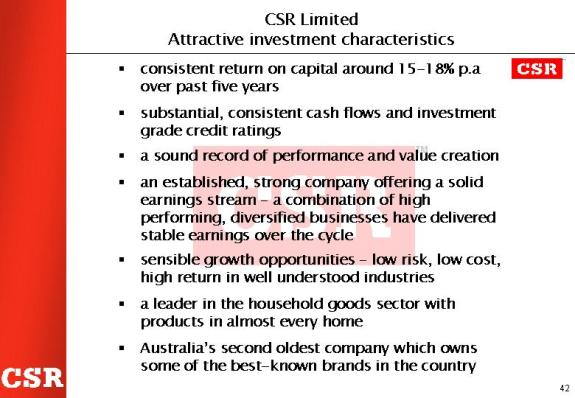
Combined, the three businesses have a history of solid, consistent earnings across the cycle – with strong cash flows and a consistent return on capital of 15-18% per annum.
There are sensible, low risk growth opportunities available….
42
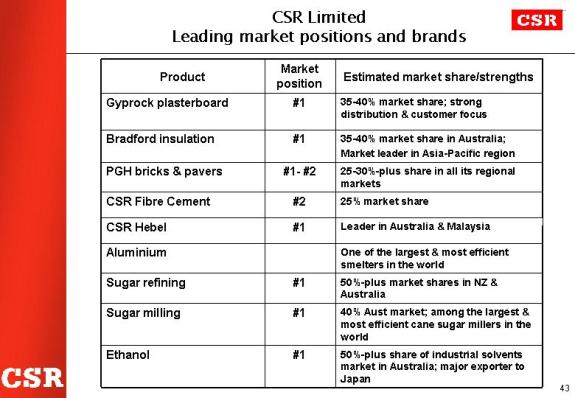
•CSR products have strong market positions.
•Most of them are number one in their markets.
43
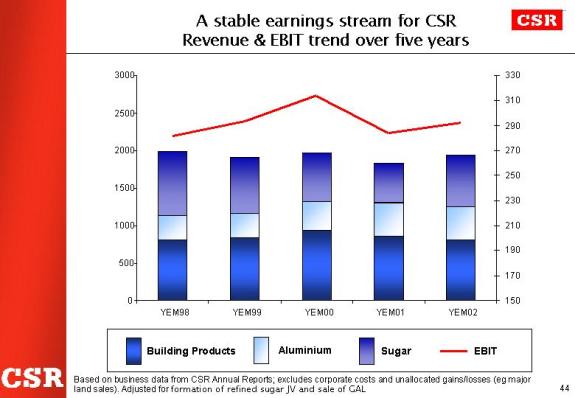
•You can see the stability of revenue and earnings for the three businesses since 1998.
44
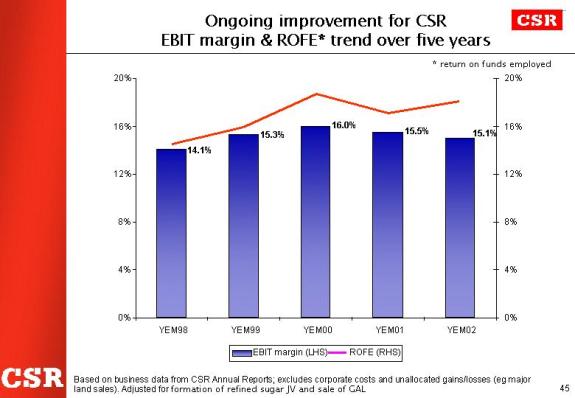
•It has solid EBIT margins and a strong and improving ROFE ….
45

Cash flow is also very stable.
So the combination of the three businesses has stabilised cash flow and returns.
46
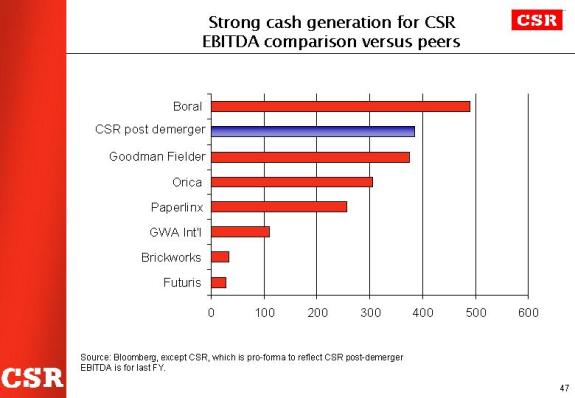
Here you can see the cash flows measured against peer companies.
47
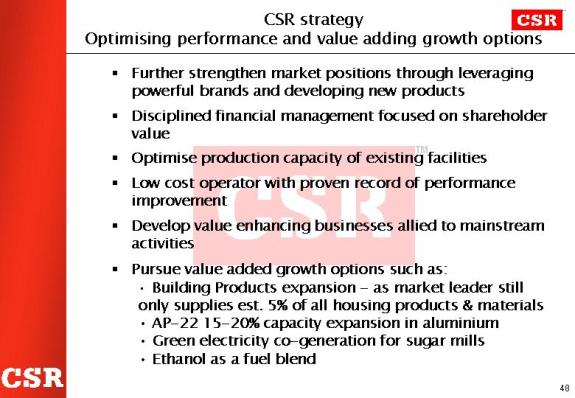
The CSR strategy will be primarily about optimising existing brands and positions.
Maximising the performance of existing operations and maintaining low cost positions.
With a proven reputation for disciplined financial management, CSR will pursue value-added growth opportunities allied to the existing businesses – relatively low cost, low risk, high return investments.
Like the 15-20% expansion to the Tomago aluminium smelter and the production of green electricity in the CSR Sugar Mills in north Queensland…..
48

• In summary, a demerger of Rinker Group is the opportunity to form two strong but different companies – each with attractive investment characteristics.
• It is in line with the strategy we have been pursuing since 1998 and is the logical next step to complete the separation process
• Perhaps most important…...the key to this whole proposal is that it creates two strong companies – we expect one in the ASX Top 50, the other in the Top 100 - and each with a history of substantial cash flows, expected investment grade credit ratings, and growth opportunities.
• We are confident it will be value-adding for shareholders but it may take time
• If the demerger goes to plan, we would expect it to be completed by mid-2003.
49
• And now to the Outlook…
50
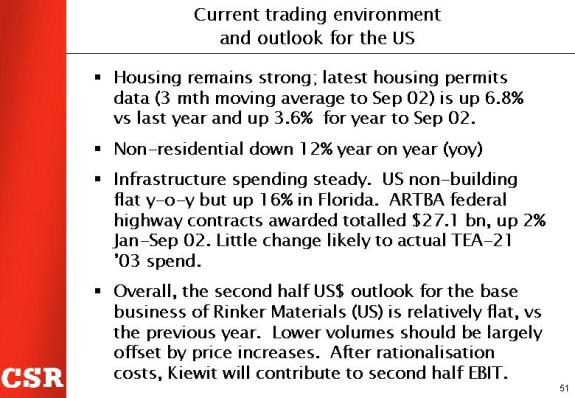
In the US, housing is holding up well but non-residential continues to fall. Contract values in September were down 24% year on year.
There are no real indications that non-residential is about to turn, although tourism data – at least in Florida and Las Vegas -- is fast recovering.
Occupancy rates in both areas are now at 90%. That’s only 2% down on year ago levels.
Road funding contracts are up 2% for the year to date. Activity remains strong in Florida, Las Vegas and Arizona.
We expect Rinker’s second half to be up on last year : a flat result for Rinker’s base business with Kiewit adding to EBIT -- after rationalisation and integration costs.
|
51
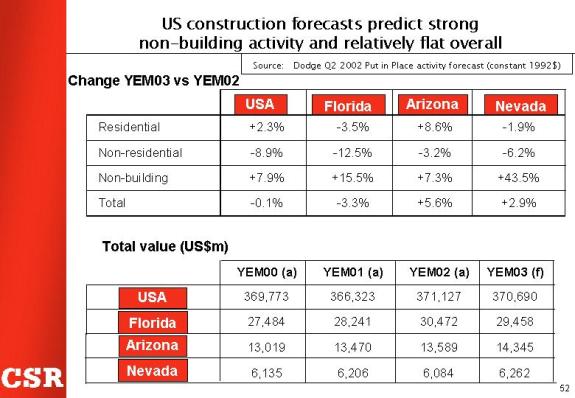
• This chart shows the Dodge forecast for US construction spending for the year to March in our major states.
• The overall picture is pretty flat.
52
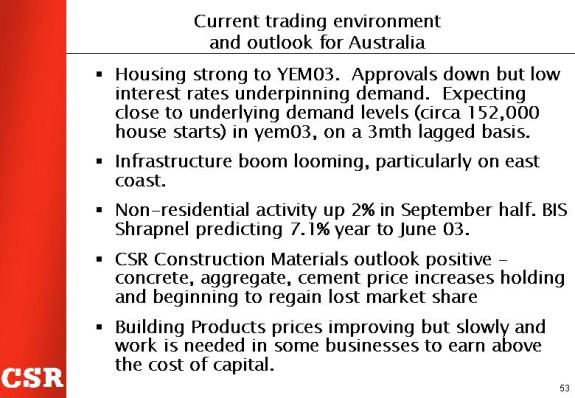
• The picture in Australia is positive, although housing will begin dropping off in line with approvals from January.
• Price increases should lift margins, particularly in businesses like insulation and Construction Materials.
• Construction Materials expects the usual 55-45% first half-second half profit split to be closer to to 52%-48% this year, as price and volume increases largely offset the Christmas-January break.
• Sugar and aluminium we covered earlier.
53
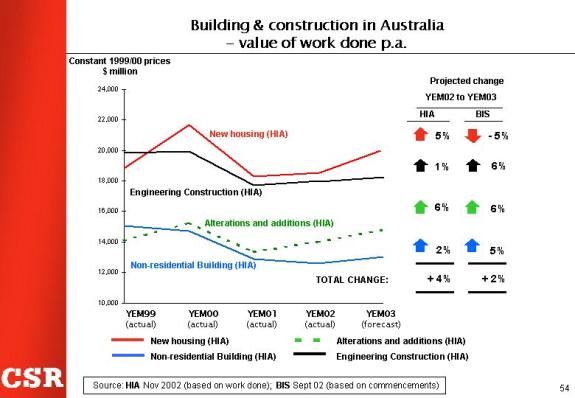
• This shows forecasts from the HIA and BIS-Shrapnel for our current year.
• Our estimates fall somewhere in between the two forecasts.
54
• So overall we had another very strong result this half, and continued to deliver on our objectives.
• The picture is also fairly positive for the second half, and we have lifted our previous forecasts slightly.
• Trading profit, excluding demerger costs and last year’s one-off tax refund, should be slightly ahead of last year.
• The group’s main priorities will be to proceed with the demerger opportunity, bed down Kiewit and continue to lift margins in under-performing businesses – at least to the point where they are adding shareholder value.
• It will be a very busy time for all of us!
55