Exhibit 99.2
Interim results – Supplemental Materials
Half year ended 31 December 2012
SIMS METAL MANAGEMENT
Daniel W. Dienst, Group Chief Executive Officer Rob Larry, Group Chief Financial Officer
22 February 2013
Disclaimer
SIMS METAL MANAGEMENT
Cautionary Statements Regarding Forward-Looking Information
This presentation may contain forward-looking statements, including statements about Sims Metal Management’s financial condition, results of operations, earnings outlook and prospects. Forward-looking statements are typically identified by words such as “plan,” “believe,” “expect,” “anticipate,” “intend,” “outlook,” “estimate,” “forecast,” “project” and other similar words and expressions.
These forward-looking statements involve certain risks and uncertainties. Our ability to predict results or the actual effects of our plans and strategies is subject to inherent uncertainty. Factors that may cause actual results or earnings to differ materially from these forward-looking statements include those discussed and identified in filings we make with the Australian Securities Exchange and the United States Securities and Exchange Commission (“SEC”), including the risk factors described in the Company’s Annual Report on Form 20-F, which we filed with the SEC on 12 October 2012.
Because these forward-looking statements are subject to assumptions and uncertainties, actual results may differ materially from those expressed or implied by these forward-looking statements. You are cautioned not to place undue reliance on these statements, which speak only as of the date of this release.
All subsequent written and oral forward-looking statements concerning the matters addressed in this release and attributable to us or any person acting on our behalf are expressly qualified in their entirety by the cautionary statements contained or referred to in this release. Except to the extent required by applicable law or regulation, we undertake no obligation to update these forward-looking statements to reflect events or circumstances after the date of this release.
All references to currencies, unless otherwise stated, reflect measures in Australian dollars.
2
Appendices
SIMS METAL MANAGEMENT
A. Financial Results Details
B. Progress Towards Strategic Goals
C. Macroeconomic Analytics
D. Summary of Restated Financial Statements
3
Sunset Park, NY – Municipal Recycling
Appendix A)
Financial Results Details
SIMS METAL MANAGEMENT
4
Financial Overview
SIMS METAL MANAGEMENT
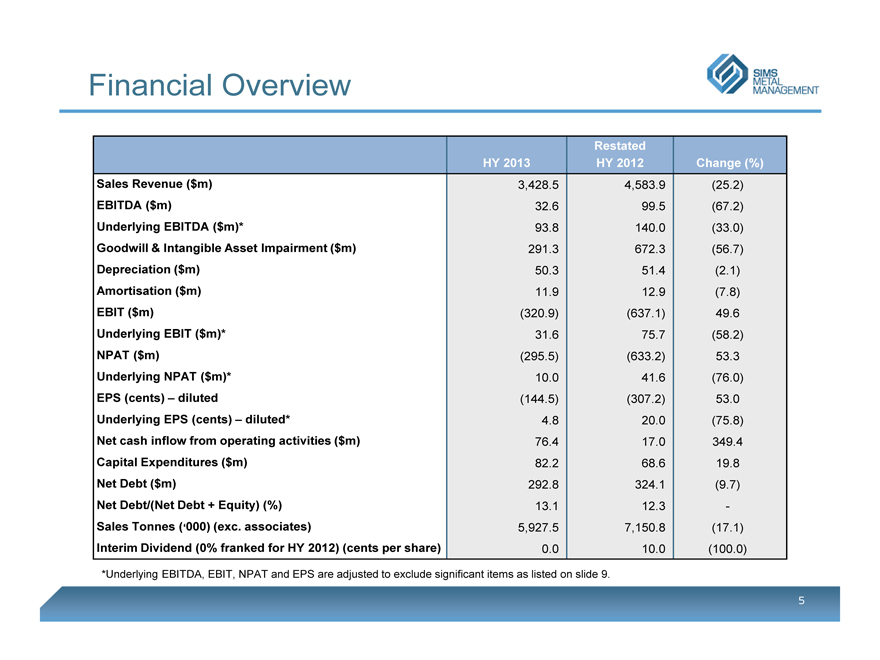
HY 2013 Restated HY 2012 Change (%)
Sales Revenue ($m) 3,428.5 4,583.9 (25.2)
EBITDA ($m) 32.6 99.5 (67.2)
Underlying EBITDA ($m)* 93.8 140.0 (33.0)
Goodwill & Intangible Asset Impairment ($m) 291.3 672.3 (56.7)
Depreciation ($m) 50.3 51.4 (2.1)
Amortisation ($m) 11.9 12.9 (7.8)
EBIT ($m) (320.9) (637.1) 49.6
Underlying EBIT ($m)* 31.6 75.7 (58.2)
NPAT ($m) (295.5) (633.2) 53.3
Underlying NPAT ($m)* 10.0 41.6 (76.0)
EPS (cents) – diluted (144.5) (307.2) 53.0
Underlying EPS (cents) – diluted* 4.8 20.0 (75.8)
Net cash inflow from operating activities ($m) 76.4 17.0 349.4
Capital Expenditures ($m) 82.2 68.6 19.8
Net Debt ($m) 292.8 324.1 (9.7)
Net Debt/(Net Debt + Equity) (%) 13.1 12.3 -
Sales Tonnes (‘000) (exc. associates) 5,927.5 7,150.8 (17.1)
Interim Dividend (0% franked for HY 2012) (cents per share) 0.0 10.0 (100.0)
*Underlying EBITDA, EBIT, NPAT and EPS are adjusted to exclude significant items as listed on slide 9.
5
Sales Revenue by Region
SIMS METAL MANAGEMENT
HY 2013
23.7%
16.7%
59.6%
Australasia
North America
Europe
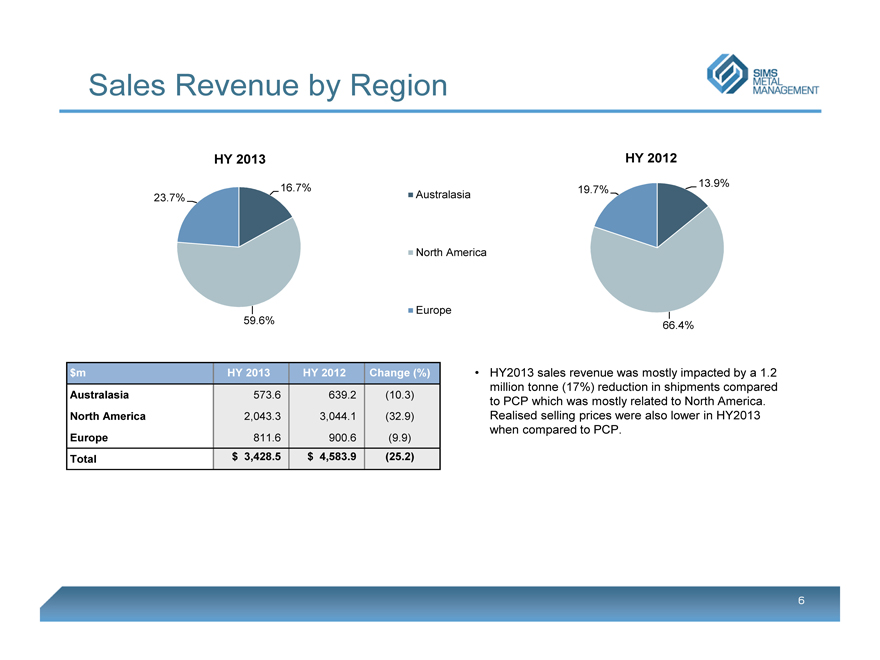
$m HY 2013 HY 2012 Change (%)
Australasia 573.6 639.2 (10.3)
North America 2,043.3 3,044.1 (32.9)
Europe 811.6 900.6 (9.9)
Total $ 3,428.5 $ 4,583.9 (25.2)
HY 2012
19.7%
13.9%
66.4%
• HY2013 sales revenue was mostly impacted by a 1.2 million tonne (17%) reduction in shipments compared to PCP which was mostly related to North America. Realised selling prices were also lower in HY2013 when compared to PCP.
6
Sales Revenue by Product
SIMS METAL MANAGEMENT
HY 2013
15.3%
19.2%
13.3%
4.4%
47.0%
0.8%
Ferrous Trading
Non Ferrous Shred Recovery
Ferrous Brokerage
Non Ferrous Trading/Brokerage
Recycling Solutions
Manufacturing/JVs
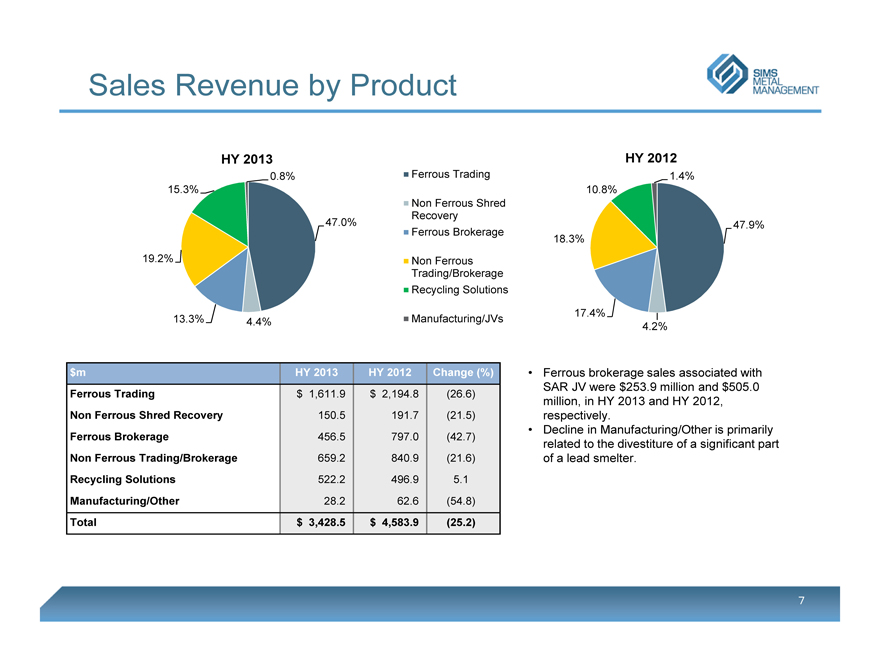
$m HY 2013 HY 2012 Change (%)
Ferrous Trading $ 1,611.9 $ 2,194.8 (26.6)
Non Ferrous Shred Recovery 150.5 191.7 (21.5)
Ferrous Brokerage 456.5 797.0 (42.7)
Non Ferrous Trading/Brokerage 659.2 840.9 (21.6)
Recycling Solutions 522.2 496.9 5.1
Manufacturing/Other 28.2 62.6 (54.8)
Total $ 3,428.5 $ 4,583.9 (25.2)
HY 2012
10.8%
18.3%
17.4%
4.2%
47.9%
1.4%
• Ferrous brokerage sales associated with SAR JV were $253.9 million and $505.0 million, in HY 2013 and HY 2012, respectively.
• Decline in Manufacturing/Other is primarily related to the divestiture of a significant part of a lead smelter.
7 |
|
EBITA (pre-goodwill & intangible asset impairment) by Region
SIMS METAL MANAGEMENT
($’s in millions)
$50 $40 $30 $20 $10 $0
-$10
-$20
-$30
15.7
41.2
9.1
(0.3)
(11.9)
(25.7)
(1.9)
(5.0)
(2.7)
(12.9)
HY 2013
HY 2012
Australiasia North America Europe Corporate Amortisation of intangibles
Restated
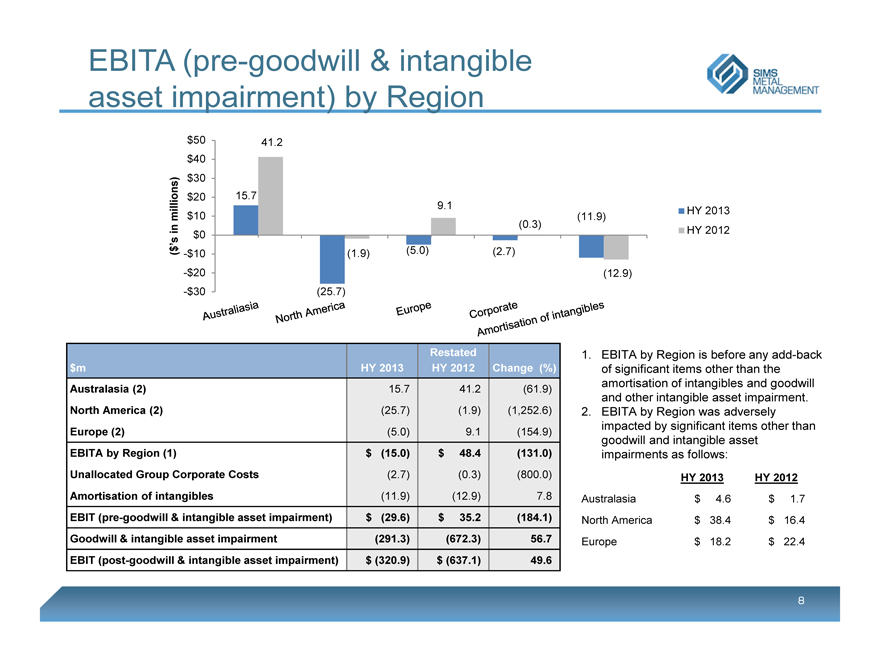
$m HY 2013 HY 2012 Change (%)
Australasia (2) 15.7 41.2 (61.9)
North America (2) (25.7) (1.9) (1,252.6)
Europe (2) (5.0) 9.1 (154.9)
EBITA by Region (1) $ (15.0) $ 48.4 (131.0)
Unallocated Group Corporate Costs (2.7) (0.3) (800.0)
Amortisation of intangibles (11.9) (12.9) 7.8
EBIT (pre-goodwill & intangible asset impairment) $ (29.6) $ 35.2 (184.1)
Goodwill & intangible asset impairment (291.3) (672.3) 56.7
EBIT (post-goodwill & intangible asset impairment) $ (320.9) $ (637.1) 49.6
1. EBITA by Region is before any add-back of significant items other than the amortisation of intangibles and goodwill and other intangible asset impairment.
2. EBITA by Region was adversely impacted by significant items other than goodwill and intangible asset impairments as follows:
HY 2013 HY 2012
Australasia $ 4.6 $ 1.7 North America $ 38.4 $ 16.4 Europe $ 18.2 $ 22.4
8
Significant Items by Region
SIMS METAL MANAGEMENT
North Group After-Tax
Australasia America Europe Corporate Pre-Tax Total Total
$m HY 2013
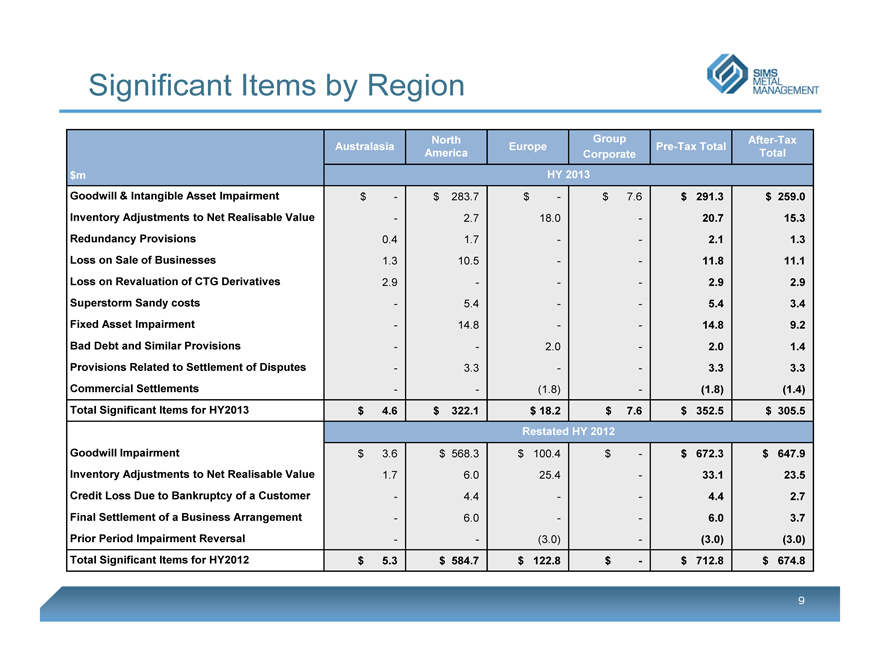
Goodwill & Intangible Asset Impairment $— $ 283.7 $— $ 7.6 $ 291.3 $ 259.0
Inventory Adjustments to Net Realisable Value — 2.7 18.0 — 20.7 15.3
Redundancy Provisions 0.4 1.7 — — 2.1 1.3
Loss on Sale of Businesses 1.3 10.5 — — 11.8 11.1
Loss on Revaluation of CTG Derivatives 2.9 — — — 2.9 2.9
Superstorm Sandy costs — 5.4 — — 5.4 3.4
Fixed Asset Impairment — 14.8 — — 14.8 9.2
Bad Debt and Similar Provisions — — 2.0 — 2.0 1.4
Provisions Related to Settlement of Disputes — 3.3 — — 3.3 3.3
Commercial Settlements — — (1.8) — (1.8) (1.4)
Total Significant Items for HY2013 $ 4.6 $ 322.1 $ 18.2 $ 7.6 $ 352.5 $ 305.5
Restated HY 2012
Goodwill Impairment $ 3.6 $ 568.3 $ 100.4 $— $ 672.3 $ 647.9
Inventory Adjustments to Net Realisable Value 1.7 6.0 25.4 — 33.1 23.5
Credit Loss Due to Bankruptcy of a Customer — 4.4 — — 4.4 2.7
Final Settlement of a Business Arrangement — 6.0 — — 6.0 3.7
Prior Period Impairment Reversal — — (3.0) — (3.0) (3.0)
Total Significant Items for HY2012 $ 5.3 $ 584.7 $ 122.8 $— $ 712.8 $ 674.8
9
EBITA (pre-goodwill & intangible asset impairment) by Product
SIMS METAL MANAGEMENT
($’s in millions)
$60 $50 $40 $30 $20 $10 $0
-$10
12.9
47.7
8.8
5.8
18.3
29.5
14.5
31.0
5.2
-6.0
HY 2013
HY 2012
Restated
Fe Trading Fe Brokerage NF Trading/Brokerage Recycling Solutions Mfg/JV’s/Other
$m HY 2013 HY 2012 Change (%)
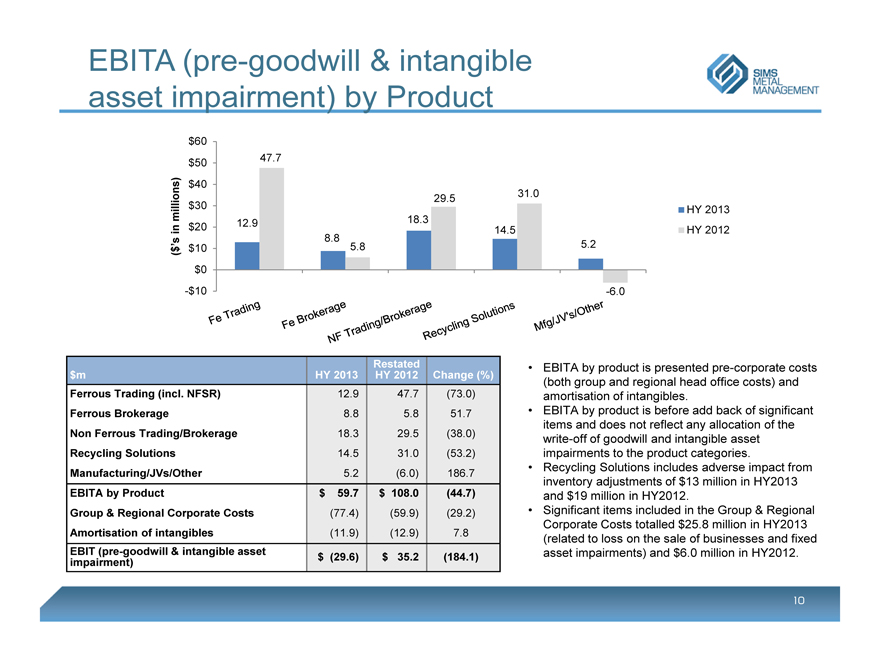
Ferrous Trading (incl. NFSR) 12.9 47.7 (73.0)
Ferrous Brokerage 8.8 5.8 51.7
Non Ferrous Trading/Brokerage 18.3 29.5 (38.0)
Recycling Solutions 14.5 31.0 (53.2)
Manufacturing/JVs/Other 5.2 (6.0) 186.7
EBITA by Product $ 59.7 $ 108.0 (44.7)
Group & Regional Corporate Costs (77.4) (59.9) (29.2)
Amortisation of intangibles (11.9) (12.9) 7.8
EBIT (pre-goodwill & intangible asset
impairment) $ (29.6) $ 35.2 (184.1)
• EBITA by product is presented pre-corporate costs (both group and regional head office costs) and amortisation of intangibles.
• EBITA by product is before add back of significant items and does not reflect any allocation of the write-off of goodwill and intangible asset impairments to the product categories.
• Recycling Solutions includes adverse impact from inventory adjustments of $13 million in HY2013 and $19 million in HY2012.
• Significant items included in the Group & Regional Corporate Costs totalled $25.8 million in HY2013 (related to loss on the sale of businesses and fixed asset impairments) and $6.0 million in HY2012.
10
Intake Volumes by Region
SIMS METAL MANAGEMENT
HY 2013
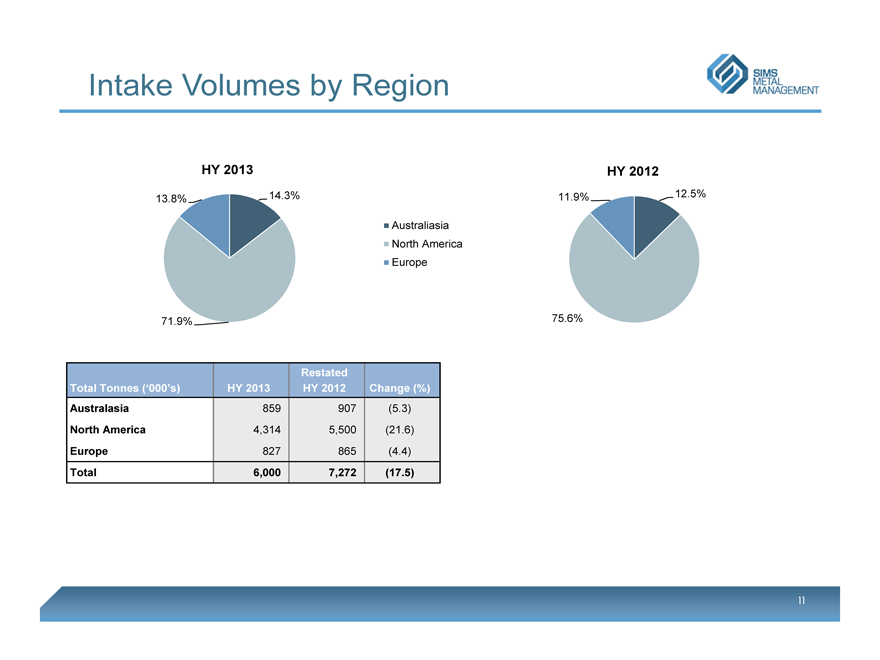
13.8%
71.9%
14.3%
Australiasia North America Europe
Restated
Total Tonnes (‘000’s) HY 2013 HY 2012 Change (%)
Australasia 859 907 (5.3)
North America 4,314 5,500 (21.6)
Europe 827 865 (4.4)
Total 6,000 7,272 (17.5)
HY 2012
11.9%
75.6%
12.5%
11
Intake Volumes by Product
SIMS METAL MANAGEMENT
HY 2013
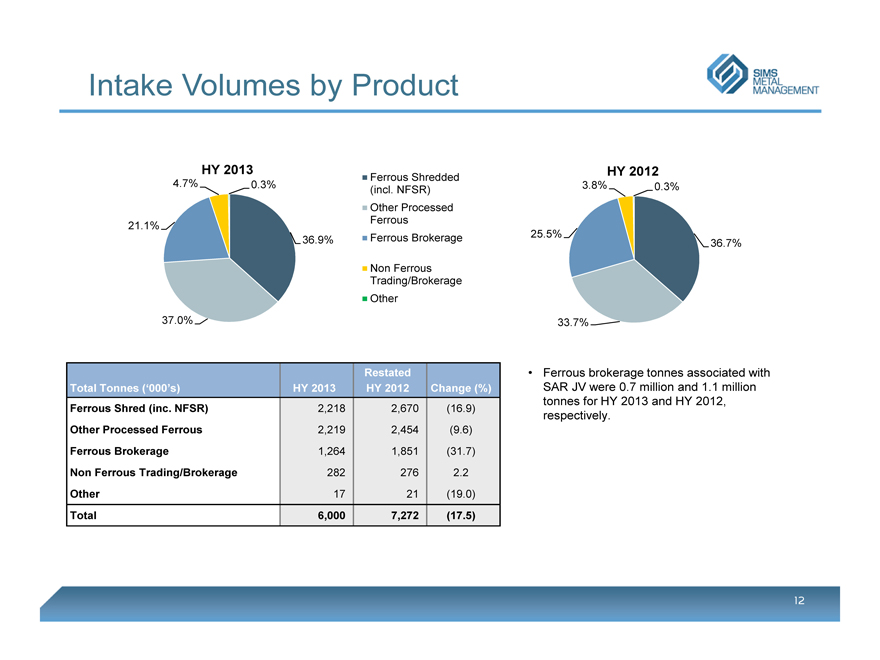
4.7%
21.1%
37.0%
36.9%
0.3%
Ferrous Shredded (incl. NFSR) Other Processed Ferrous Ferrous Brokerage
Non Ferrous Trading/Brokerage Other
Restated
Total Tonnes (‘000’s) HY 2013 HY 2012 Change (%)
Ferrous Shred (inc. NFSR) 2,218 2,670 (16.9)
Other Processed Ferrous 2,219 2,454 (9.6)
Ferrous Brokerage 1,264 1,851 (31.7)
Non Ferrous Trading/Brokerage 282 276 2.2
Other 17 21 (19.0)
Total 6,000 7,272 (17.5)
HY 2012
3.8%
25.5%
33.7%
36.7%
0.3%
• Ferrous brokerage tonnes associated with SAR JV were 0.7 million and 1.1 million tonnes for HY 2013 and HY 2012, respectively.
12
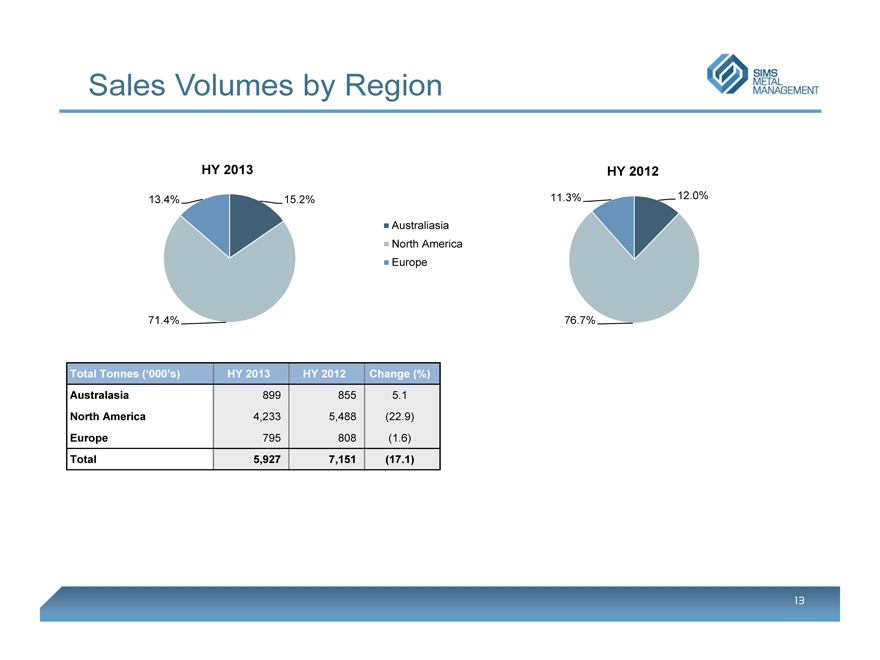
Sales Volumes by Region
SIMS METAL MANAGEMENT
HY 2013
13.4%
71.4%
15.2%
Australiasia North America Europe
Total Tonnes (‘000’s) HY 2013 HY 2012 Change (%)
Australasia 899 855 5.1
North America 4,233 5,488 (22.9)
Europe 795 808 (1.6)
Total 5,927 7,151 (17.1)
HY 2012
11.3%
76.7%
12.0%
13
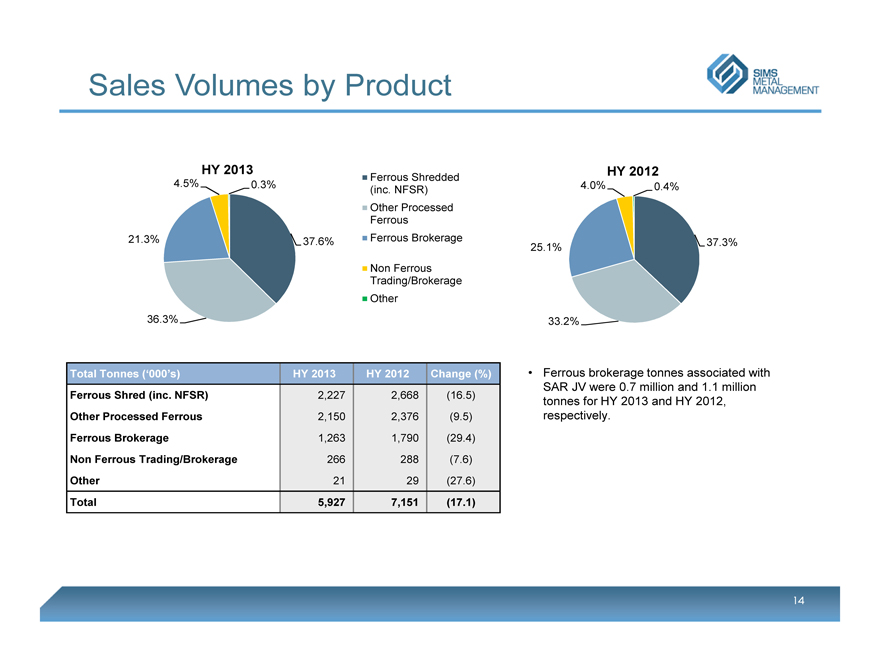
Sales Volumes by Product
SIMS METAL MANAGEMENT
HY 2013
4.5%
21.3%
36.3%
37.6%
0.3%
Ferrous Shredded (inc. NFSR) Other Processed Ferrous Ferrous Brokerage
Non Ferrous Trading/Brokerage Other
Total Tonnes (‘000’s) HY 2013 HY 2012 Change (%)
Ferrous Shred (inc. NFSR) 2,227 2,668 (16.5)
Other Processed Ferrous 2,150 2,376 (9.5)
Ferrous Brokerage 1,263 1,790 (29.4)
Non Ferrous Trading/Brokerage 266 288 (7.6)
Other 21 29 (27.6)
Total 5,927 7,151 (17.1)
HY 2012
4.0%
25.1%
33.2%
37.3%
0.4%
• Ferrous brokerage tonnes associated with SAR JV were 0.7 million and 1.1 million tonnes for HY 2013 and HY 2012, respectively.
14
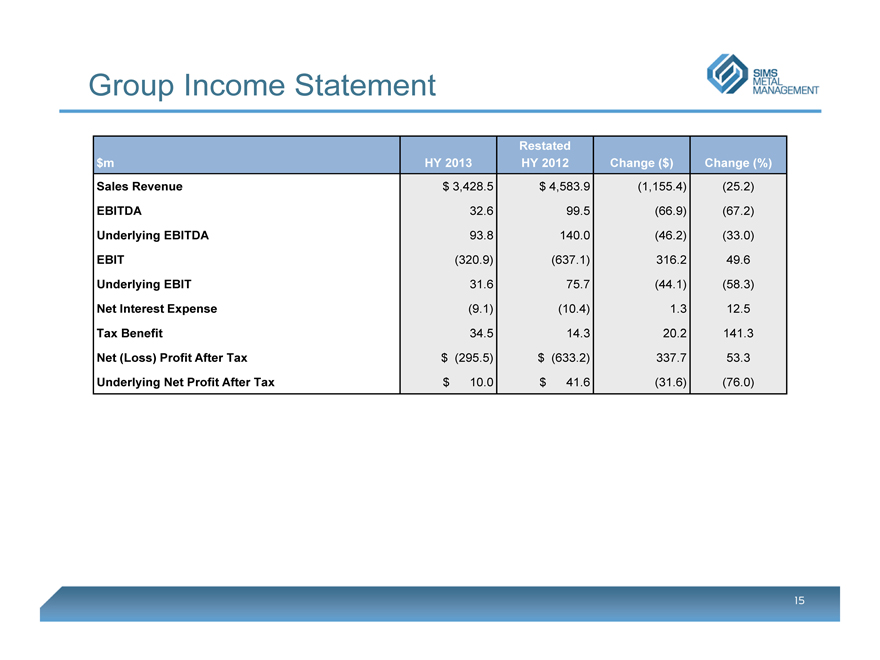
Group Income Statement
SIMS METAL MANAGEMENT
Restated
$m HY 2013 HY 2012 Change ($) Change (%)
Sales Revenue $ 3,428.5 $ 4,583.9 (1,155.4) (25.2)
EBITDA 32.6 99.5 (66.9) (67.2)
Underlying EBITDA 93.8 140.0 (46.2) (33.0)
EBIT (320.9) (637.1) 316.2 49.6
Underlying EBIT 31.6 75.7 (44.1) (58.3)
Net Interest Expense (9.1) (10.4) 1.3 12.5
Tax Benefit 34.5 14.3 20.2 141.3
Net (Loss) Profit After Tax $ (295.5) $ (633.2) 337.7 53.3
Underlying Net Profit After Tax $ 10.0 $ 41.6 (31.6) (76.0)
15
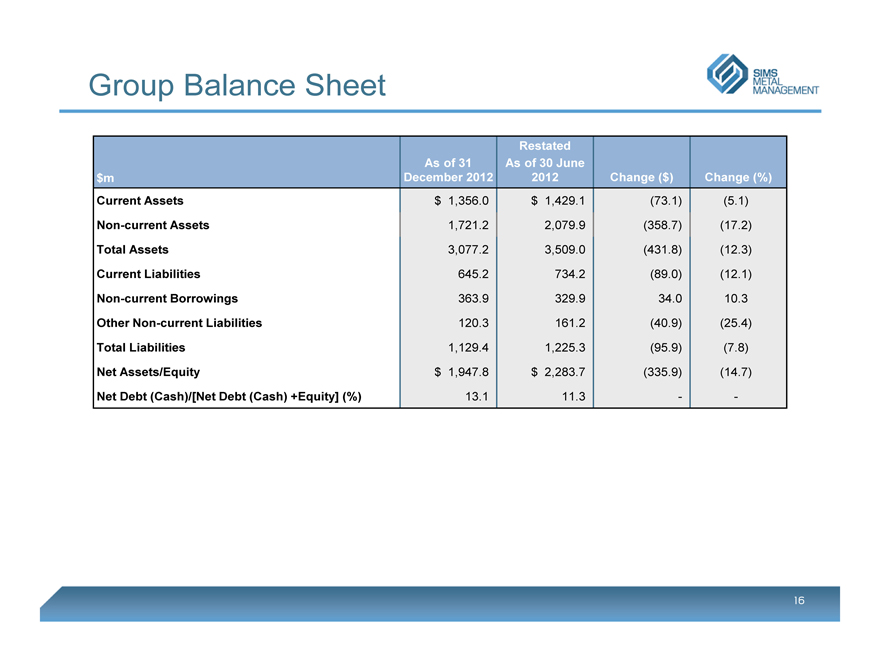
Group Balance Sheet
SIMS METAL MANAGEMENT
Restated
As of 31 As of 30 June
$m December 2012 2012 Change ($) Change (%)
Current Assets $ 1,356.0 $ 1,429.1 (73.1) (5.1)
Non-current Assets 1,721.2 2,079.9 (358.7) (17.2)
Total Assets 3,077.2 3,509.0 (431.8) (12.3)
Current Liabilities 645.2 734.2 (89.0) (12.1)
Non-current Borrowings 363.9 329.9 34.0 10.3
Other Non-current Liabilities 120.3 161.2 (40.9) (25.4)
Total Liabilities 1,129.4 1,225.3 (95.9) (7.8)
Net Assets/Equity $ 1,947.8 $ 2,283.7 (335.9) (14.7)
Net Debt (Cash)/[Net Debt (Cash) +Equity] (%) 13.1 11.3 — —
16
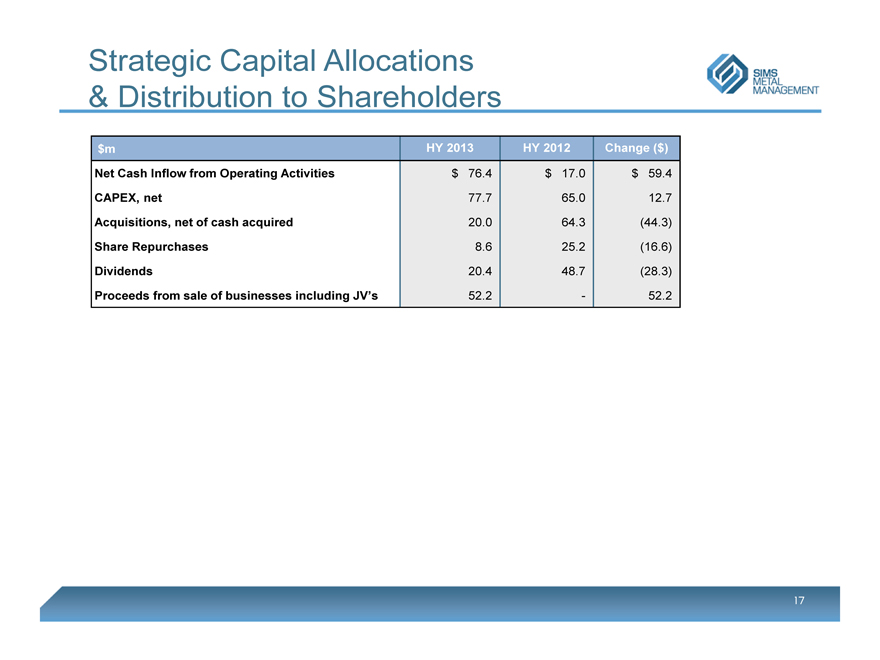
Strategic Capital Allocations
& Distribution to Shareholders
SIMS METAL MANAGEMENT
$m HY 2013 HY 2012 Change ($)
Net Cash Inflow from Operating Activities $ 76.4 $ 17.0 $ 59.4
CAPEX, net 77.7 65.0 12.7
Acquisitions, net of cash acquired 20.0 64.3 (44.3)
Share Repurchases 8.6 25.2 (16.6)
Dividends 20.4 48.7 (28.3)
Proceeds from sale of businesses including JV’s 52.2 — 52.2
17
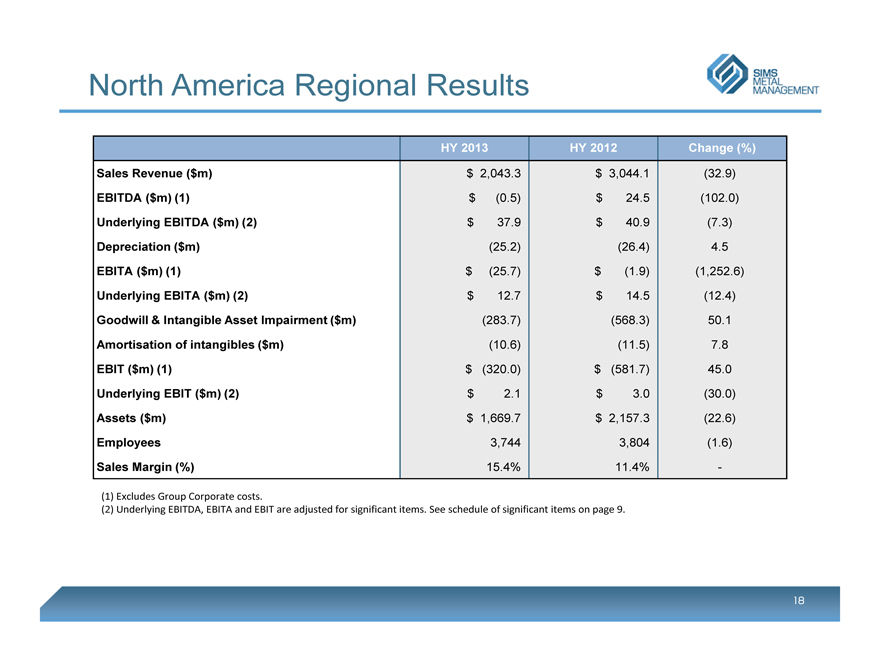
North America Regional Results
SIMS METAL MANAGEMENT
HY 2013 HY 2012 Change (%)
Sales Revenue ($m) $ 2,043.3 $ 3,044.1 (32.9)
EBITDA ($m) (1) $ (0.5) $ 24.5 (102.0)
Underlying EBITDA ($m) (2) $ 37.9 $ 40.9 (7.3)
Depreciation ($m) (25.2) (26.4) 4.5
EBITA ($m) (1) $ (25.7) $ (1.9) (1,252.6)
Underlying EBITA ($m) (2) $ 12.7 $ 14.5 (12.4)
Goodwill & Intangible Asset Impairment ($m) (283.7) (568.3) 50.1
Amortisation of intangibles ($m) (10.6) (11.5) 7.8
EBIT ($m) (1) $ (320.0) $ (581.7) 45.0
Underlying EBIT ($m) (2) $ 2.1 $ 3.0 (30.0)
Assets ($m) $ 1,669.7 $ 2,157.3 (22.6)
Employees 3,744 3,804 (1.6)
Sales Margin (%) 15.4% 11.4% —
(1) Excludes Group Corporate costs.
(2) Underlying EBITDA, EBITA and EBIT are adjusted for significant items. See schedule of significant items on page 9.
18
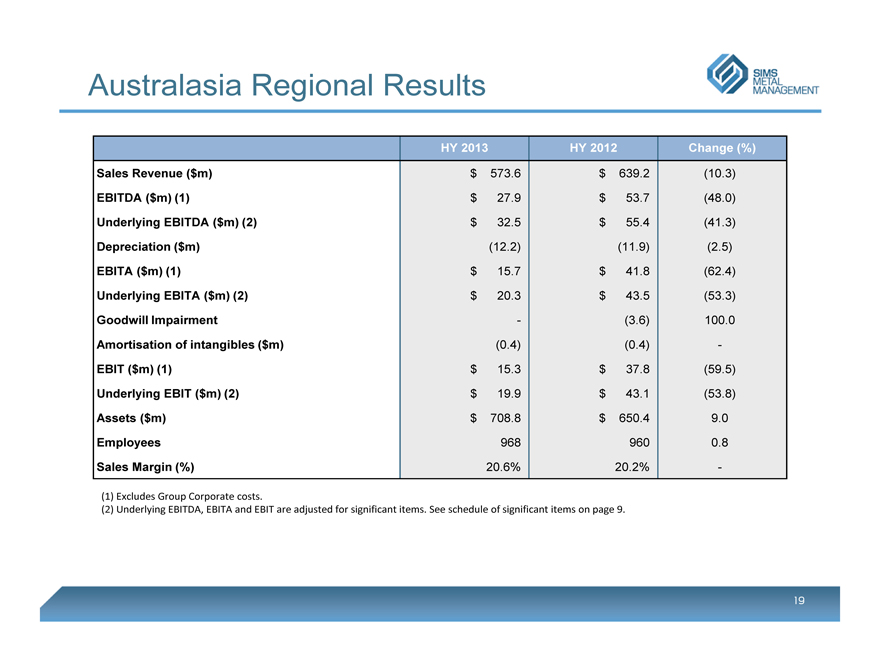
Australasia Regional Results
SIMS METAL MANAGEMENT
HY 2013 HY 2012 Change (%)
Sales Revenue ($m) $ 573.6 $ 639.2 (10.3)
EBITDA ($m) (1) $ 27.9 $ 53.7 (48.0)
Underlying EBITDA ($m) (2) $ 32.5 $ 55.4 (41.3)
Depreciation ($m) (12.2) (11.9) (2.5)
EBITA ($m) (1) $ 15.7 $ 41.8 (62.4)
Underlying EBITA ($m) (2) $ 20.3 $ 43.5 (53.3)
Goodwill Impairment — (3.6) 100.0
Amortisation of intangibles ($m) (0.4) (0.4) —
EBIT ($m) (1) $ 15.3 $ 37.8 (59.5)
Underlying EBIT ($m) (2) $ 19.9 $ 43.1 (53.8)
Assets ($m) $ 708.8 $ 650.4 9.0
Employees 968 960 0.8
Sales Margin (%) 20.6% 20.2% —
(1) Excludes Group Corporate costs.
(2) Underlying EBITDA, EBITA and EBIT are adjusted for significant items. See schedule of significant items on page 9.
19
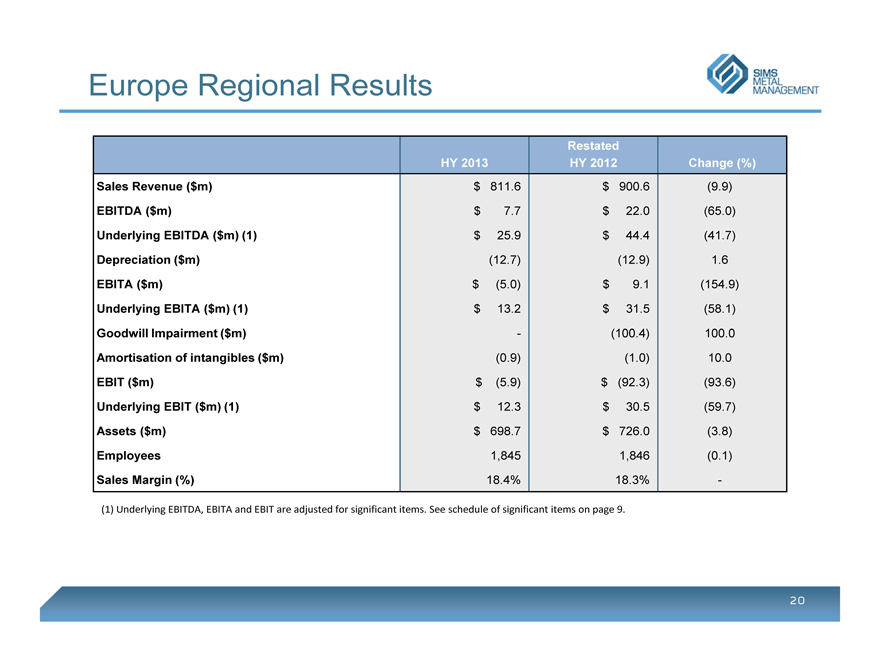
Europe Regional Results
SIMS METAL MANAGEMENT
Restated
HY 2013 HY 2012 Change (%)
Sales Revenue ($m) $ 811.6 $ 900.6 (9.9)
EBITDA ($m) $ 7.7 $ 22.0 (65.0)
Underlying EBITDA ($m) (1) $ 25.9 $ 44.4 (41.7)
Depreciation ($m) (12.7) (12.9) 1.6
EBITA ($m) $ (5.0) $ 9.1 (154.9)
Underlying EBITA ($m) (1) $ 13.2 $ 31.5 (58.1)
Goodwill Impairment ($m) — (100.4) 100.0
Amortisation of intangibles ($m) (0.9) (1.0) 10.0
EBIT ($m) $ (5.9) $ (92.3) (93.6)
Underlying EBIT ($m) (1) $ 12.3 $ 30.5 (59.7)
Assets ($m) $ 698.7 $ 726.0 (3.8)
Employees 1,845 1,846 (0.1)
Sales Margin (%) 18.4% 18.3% —
(1) Underlying EBITDA, EBITA and EBIT are adjusted for significant items. See schedule of significant items on page 9.
20
Appendix B)
Progress Towards Strategic Goals
SIMS METAL MANAGEMENT
Progress towards strategic goals
SIMS METAL MANAGEMENT
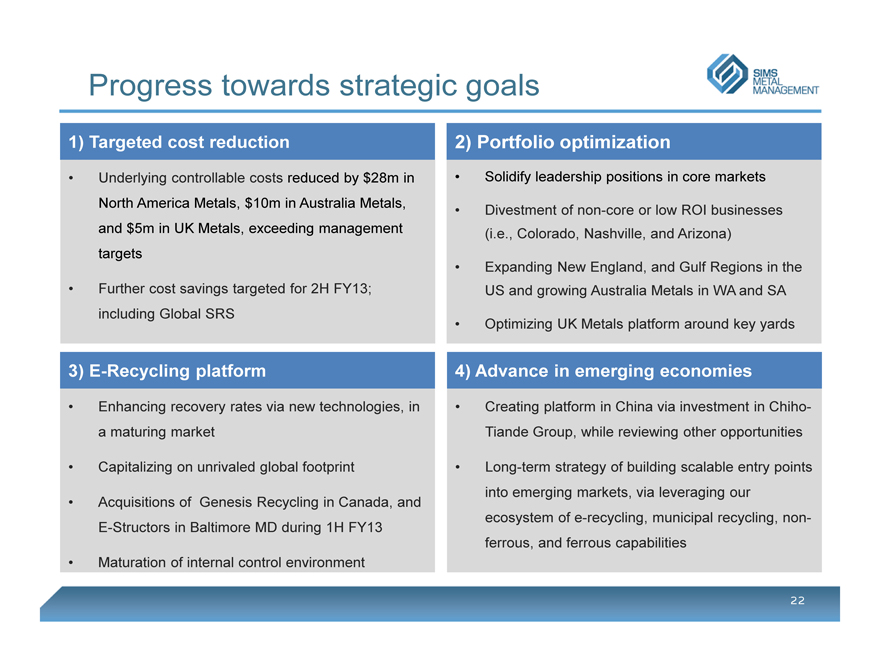
1) Targeted cost reduction
• Underlying controllable costs reduced by $28m in North America Metals, $10m in Australia Metals, and $5m in UK Metals, exceeding management targets
• Further cost savings targeted for 2H FY13; including Global SRS
2) Portfolio optimization
• Solidify leadership positions in core markets
• Divestment of non-core or low ROI businesses
(i.e., Colorado, Nashville, and Arizona)
• Expanding New England, and Gulf Regions in the US and growing Australia Metals in WA and SA
• Optimizing UK Metals platform around key yards
3) E-Recycling platform
• Enhancing recovery rates via new technologies, in a maturing market
• Capitalizing on unrivaled global footprint
• Acquisitions of Genesis Recycling in Canada, and E-Structors in Baltimore MD during 1H FY13
• Maturation of internal control environment
4) Advance in emerging economies
• Creating platform in China via investment in Chiho-Tiande Group, while reviewing other opportunities
• Long-term strategy of building scalable entry points into emerging markets, via leveraging our ecosystem of e-recycling, municipal recycling, non-ferrous, and ferrous capabilities
22
1) Targeted cost reductions achieved . . .
SIMS METAL MANAGEMENT
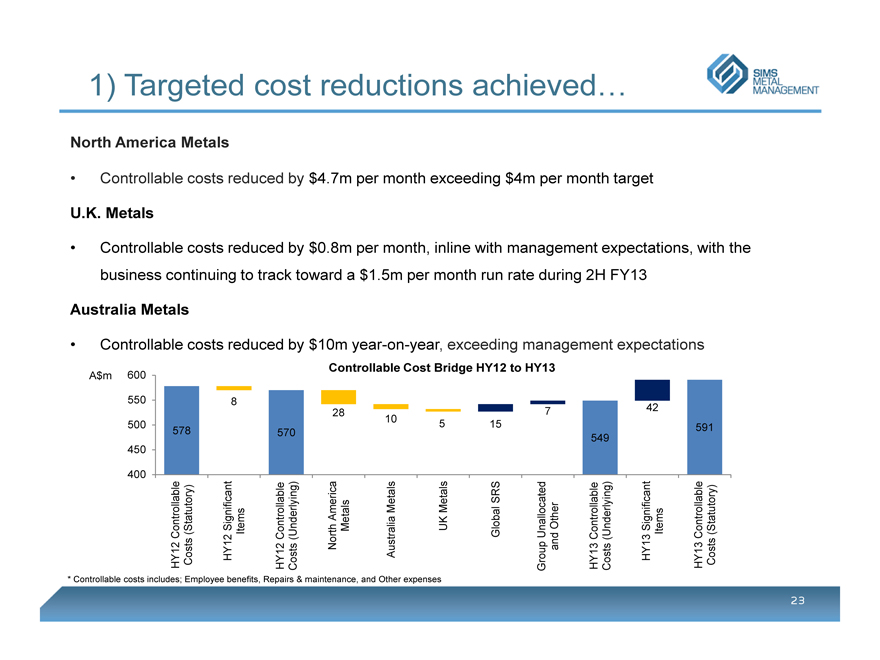
North America Metals
• Controllable costs reduced by $4.7m per month exceeding $4m per month target
U.K. Metals
• Controllable costs reduced by $0.8m per month, inline with management expectations, with the business continuing to track toward a $1.5m per month run rate during 2H FY13
Australia Metals
• Controllable costs reduced by $10m year-on-year, exceeding management expectations
Controllable Cost Bridge HY12 to HY13
A$m
600 550 500 450 400
578
8
570
28
10
5
15
7
549
42
591
HY12 Controllable Costs (Statutory)
HY12 Significant Items
HY12 Controllable Costs (Underlying)
North America Metals
Australia Metals
UK Metals
Global SRS
Group Unallocated and Other
HY13 Controllable Costs (Underlying)
HY13 Significant Items
HY13 Controllable Costs (Statutory)
* Controllable costs includes; Employee benefits, Repairs & maintenance, and Other expenses
23
1) . . .with further cost reductions identified
SIMS METAL MANAGEMENT
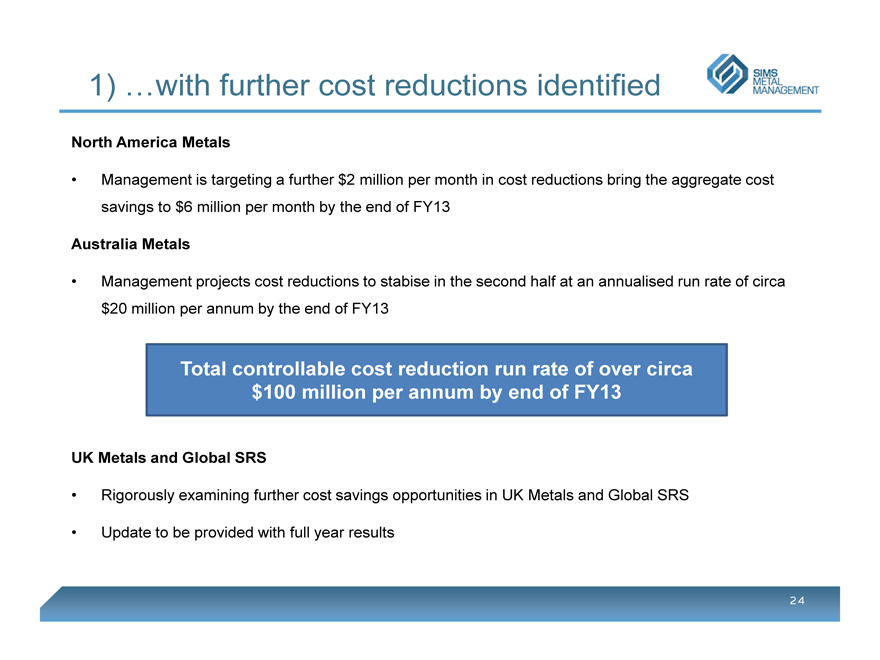
North America Metals
• Management is targeting a further $2 million per month in cost reductions bring the aggregate cost savings to $6 million per month by the end of FY13
Australia Metals
• Management projects cost reductions to stabise in the second half at an annualised run rate of circa $20 million per annum by the end of FY13
Total controllable cost reduction run rate of over circa $100 million per annum by end of FY13
UK Metals and Global SRS
• Rigorously examining further cost savings opportunities in UK Metals and Global SRS
• Update to be provided with full year results
24
2) Asset portfolio optimization
SIMS METAL MANAGEMENT
North America Metals
• Directing capital to the highest returning assets, with emphasis towards “brown water” (river) and “blue water” (export) facilities in scrap rich regions where we can achieve a leadership position, source control, and solid ROI’s through the cycle
• Growing footprint in the Gulf, New England, and Texas & Oklahoma
• Acquisition of shredder and feeder yards in the Gulf Region
• Development of New England metals recycling footprint with a greenfield facility in Rhode Island to be completed in September 2013
• Freeing up capital by monetizing less strategic, lower returning assets
• Divestment of Colorado and Arizona metals recycling assets, and Nashville JV interest
• Reduced controllable costs and shuttered negative returning businesses
Australia and New Zealand Metals
• Expanding operations in Western Australia and recently acquired a metals recycling in South Australia
UK Metals
• Re-alignment of processing and commercial activities underway
Playing to our strengths and monetizing our weaknesses
25
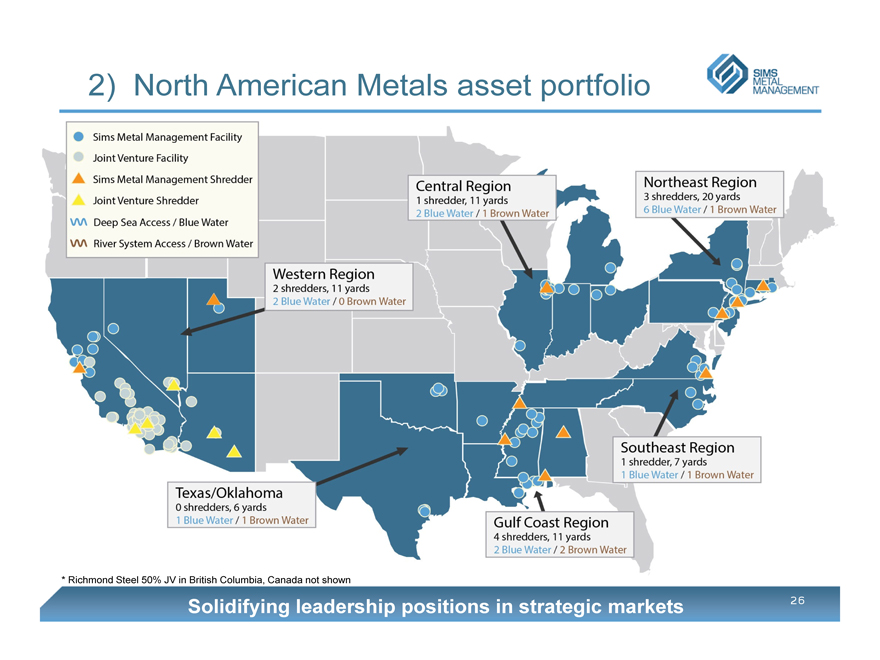
2) North American Metals asset portfolio
SIMS METAL MANAGEMENT
Sims Metal Management Facility
Joint Venture Facility
Sims Metal Management Shredder
Joint Venture Shredder
Deep Sea Access / Blue Water
River System Access / Brown Water
Western Region
2 shredders, 11 yards
2 Blue Water / 0 Brown Water
Central Region
1 shredder, 11 yards
2 Blue Water / 1 Brown Water
Northeast Region
3 shredders, 20 yards
6 Blue Water / 1 Brown Water
Texas/Oklahoma
0 shredders, 6 yards
1 Blue Water / 1 Brown Water
Gulf Coast Region
4 shredders, 11 yards
2 Blue Water / 2 Brown Water
Southeast Region
1 shredder, 7 yards
1 Blue Water / 1 Brown Water
Northeast Region
3 shredders, 20 yards
6 Blue Water / 1 Brown Water
* Richmond Steel 50% JV in British Columbia, Canada not shown
Solidifying leadership positions in strategic markets
26
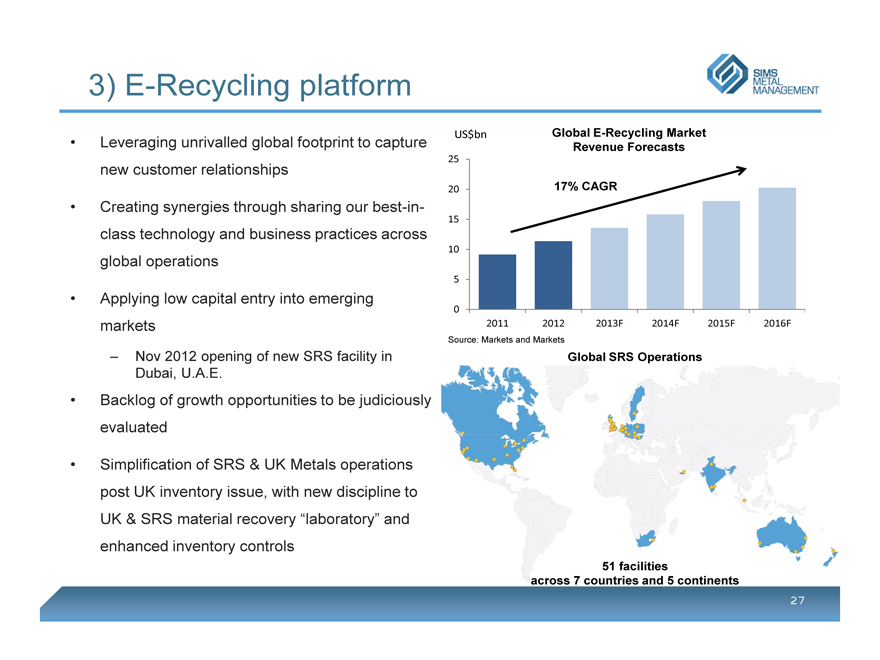
3) E-Recycling platform
SIMS METAL MANAGEMENT
• Leveraging unrivalled global footprint to capture new customer relationships
• Creating synergies through sharing our best-in-class technology and business practices across global operations
• Applying low capital entry into emerging markets
– Nov 2012 opening of new SRS facility in Dubai, U.A.E.
• Backlog of growth opportunities to be judiciously evaluated
• Simplification of SRS & UK Metals operations post UK inventory issue, with new discipline to UK & SRS material recovery “laboratory” and enhanced inventory controls
US$bn
25 20 15 10 5 0
Global E-Recycling Market Revenue Forecasts
17% CAGR
2011 2012 2013F 2014F 2015F 2016F
Source: Markets and Markets
Global SRS Operations
51 facilities
across 7 countries and 5 continents
27
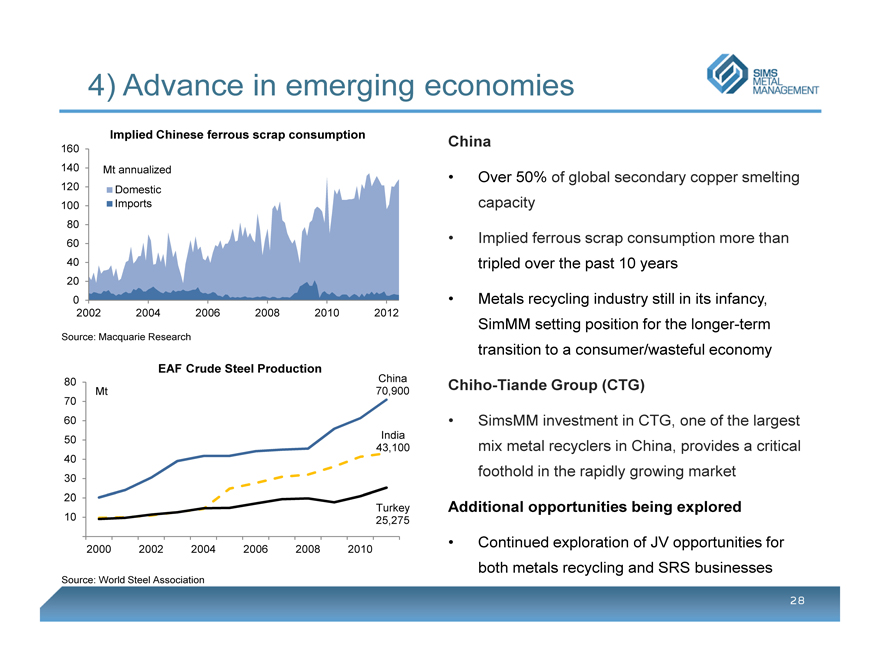
4) Advance in emerging economies
SIMS METAL MANAGEMENT
Implied Chinese ferrous scrap consumption
160 140 120 100 80 60 40 20 0
Mt annualized
Domestic Imports
2002
2004 2006 2008 2010 2012
Source: Macquarie Research
EAF Crude Steel Production
80 70 60 50 40 30 20 10
Mt
China 70,900
India 43,100
Turkey 25,275
2000 2002 2004 2006 2008 2010
Source: World Steel Association
China
• Over 50% of global secondary copper smelting capacity
• Implied ferrous scrap consumption more than tripled over the past 10 years
• Metals recycling industry still in its infancy, SimMM setting position for the longer-term transition to a consumer/wasteful economy
Chiho-Tiande Group (CTG)
• SimsMM investment in CTG, one of the largest mix metal recyclers in China, provides a critical foothold in the rapidly growing market
Additional opportunities being explored
• Continued exploration of JV opportunities for both metals recycling and SRS businesses
28
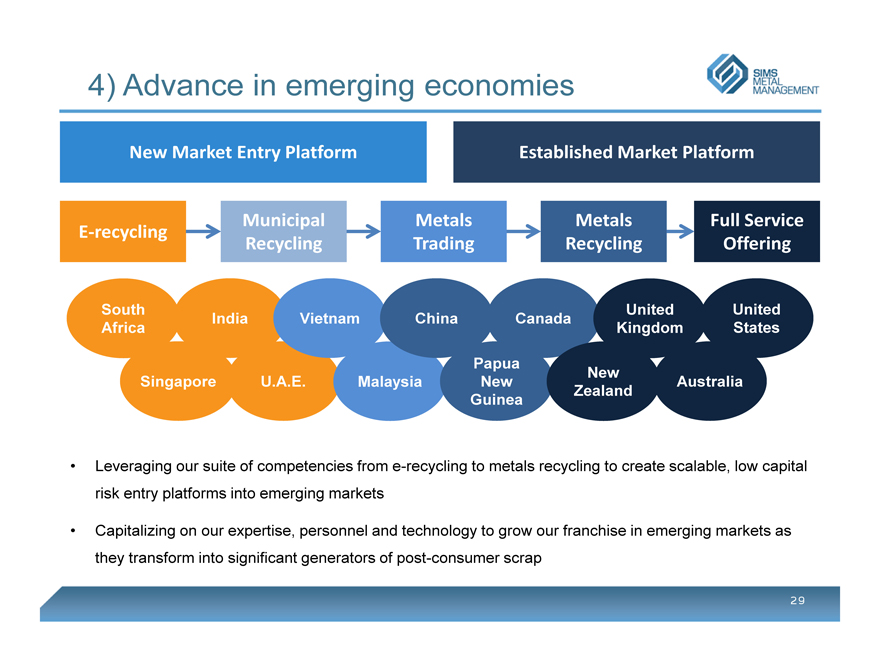
4) Advance in emerging economies
SIMS METAL MANAGEMENT
New Market Entry Platform
Established Market Platform
E-recycling
Municipal Recycling
Metals Trading
Metals
Recycling
Full Service Offering
South Africa
India
Vietnam
China
Canada
United Kingdom
United States
Singapore
U.A.E.
Malaysia
Papua New Guinea
New Zealand
Australia
• Leveraging our suite of competencies from e-recycling to metals recycling to create scalable, low capital risk entry platforms into emerging markets
• Capitalizing on our expertise, personnel and technology to grow our franchise in emerging markets as they transform into significant generators of post-consumer scrap
29
Claremont Terminal, NJ – Metals Recycling
Appendix C)
Macroeconomic Analytics
SIMS METAL MANAGEMENT
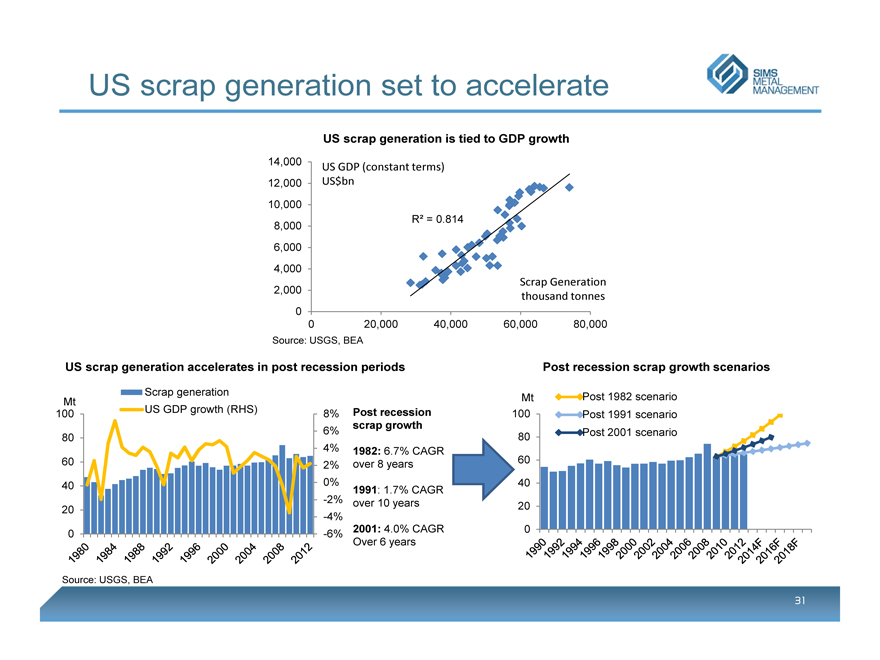
US scrap generation set to accelerate
SIMS METAL MANAGEMENT
US scrap generation is tied to GDP growth
14,000 12,000 10,000 8,000 6,000 4,000 2,000 0
US GDP (constant terms) US$bn
R2 = 0.814
0
20,000
40,000
60,000
80,000
Scrap Generation thousand tonnes
Source: USGS, BEA
US scrap generation accelerates in post recession periods
Mt 100
80 60 40 20 0
Scrap generation US GDP growth (RHS)
8% 6% 4% 2% 0% -2% -4% -6%
Source: USGS, BEA
Post recession scrap growth
1982: 6.7% CAGR over 8 years
1991: 1.7% CAGR over 10 years
2001: 4.0% CAGR Over 6 years
Mt 100
80 60 40 20 0
Post recession scrap growth scenarios
Post 1982 scenario Post 1991 scenario Post 2001 scenario
Source: USGS, BEA
31
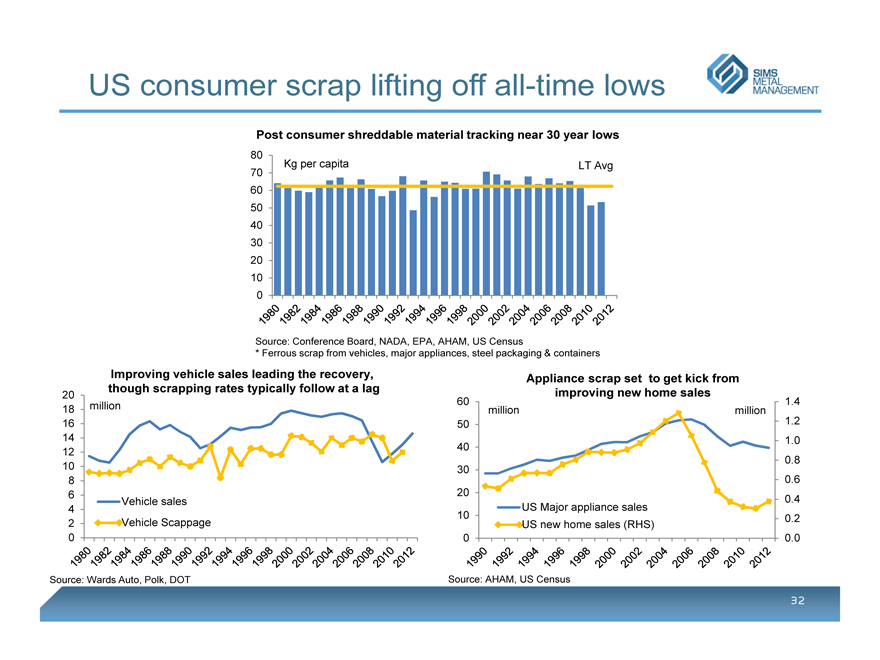
US consumer scrap lifting off all-time lows
SIMS METAL MANAGEMENT
Post consumer shreddable material tracking near 30 year lows
80 70 60 50 40 30 20 10 0
Kg per capita
LT Avg
Source: Conference Board, NADA, EPA, AHAM, US Census
* Ferrous scrap from vehicles, major appliances, steel packaging & containers
Improving vehicle sales leading the recovery, though scrapping rates typically follow at a lag
20 18 16 14 12 10 8 6 4 2 0
million
Vehicle sales
Vehicle Scappage
Source: Wards Auto, Polk, DOT
60 50 40 30 20 10 0
Appliance scrap set to get kick from improving new home sales
million
US Major appliance sales US new home sales (RHS)
million
1.4
1.2
1.0
0.8
0.6
0.4
0.2
0.0
Source: AHAM, US Census
32
US consumer activity key to scrap recovery
SIMS METAL MANAGEMENT
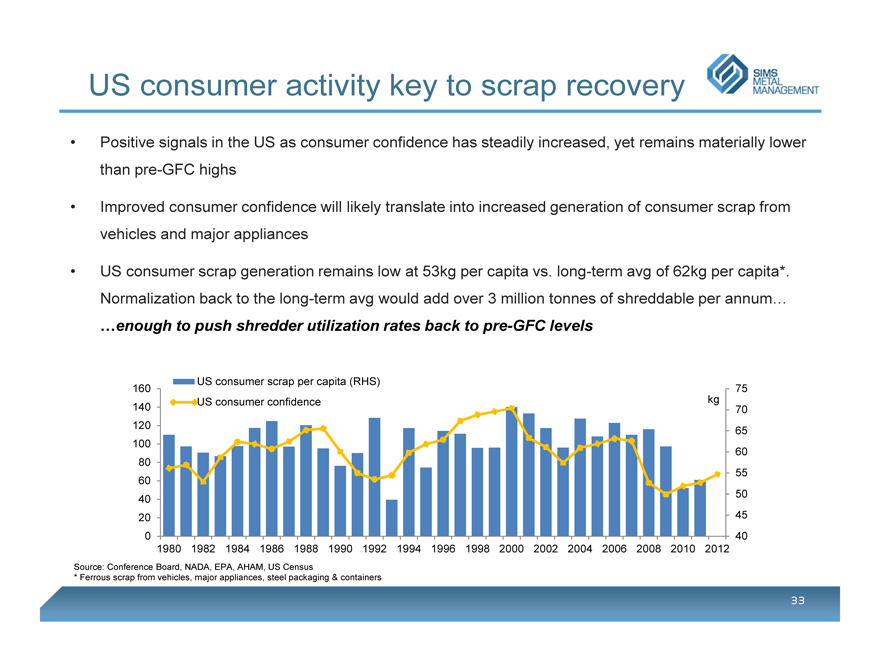
• Positive signals in the US as consumer confidence has steadily increased, yet remains materially lower than pre-GFC highs
• Improved consumer confidence will likely translate into increased generation of consumer scrap from vehicles and major appliances
• US consumer scrap generation remains low at 53kg per capita vs. long-term avg of 62kg per capita*. Normalization back to the long-term avg would add over 3 million tonnes of shreddable per annum… …enough to push shredder utilization rates back to pre-GFC levels
160 140 120 100 80 60 40 20 0
US consumer scrap per capita (RHS)
US consumer confidence
1980 1982 1984 1986 1988 1990 1992 1994 1996 1998 2000 2002 2004 2006 2008 2010 2012
kg
75 70 65 60 55 50 45 40
Source: Conference Board, NADA, EPA, AHAM, US Census
* Ferrous scrap from vehicles, major appliances, steel packaging & containers
33
US shredding capacity moderating
SIMS METAL MANAGEMENT
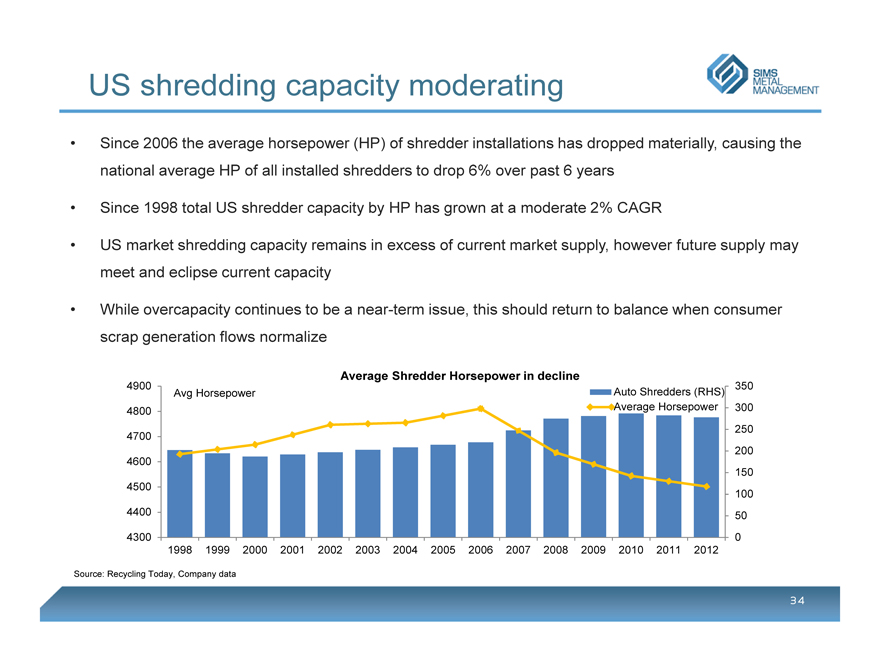
• Since 2006 the average horsepower (HP) of shredder installations has dropped materially, causing the national average HP of all installed shredders to drop 6% over past 6 years
• Since 1998 total US shredder capacity by HP has grown at a moderate 2% CAGR
• US market shredding capacity remains in excess of current market supply, however future supply may meet and eclipse current capacity
• While overcapacity continues to be a near-term issue, this should return to balance when consumer scrap generation flows normalize
4900
4800
4700
4600
4500
4400
4300
Avg Horsepower
Average Shredder Horsepower in decline
Auto Shredders (RHS) Average Horsepower
350 300 250 200 150 100 50 0
1998 1999 2000 2001 2002 2003 2004 2005 2006 2007 2008 2009 2010 2011 2012
Source: Recycling Today, Company data
34
Increasing global demand for scrap
SIMS METAL MANAGEMENT
EAF Steel Production (ex-China)
400 300 200 100
EAF Production
% of total
50% 40% 30% 20% 10% 0%
2000 2002 2004 2006 2008 2010
EAF as % of total steel production
70% 60% 50% 40% 30% 20% 10% 0%
1975 1980 1985 1990 1995 2000 2005 2010 2011
United States
France
Germany
China
Source: World Steel Association
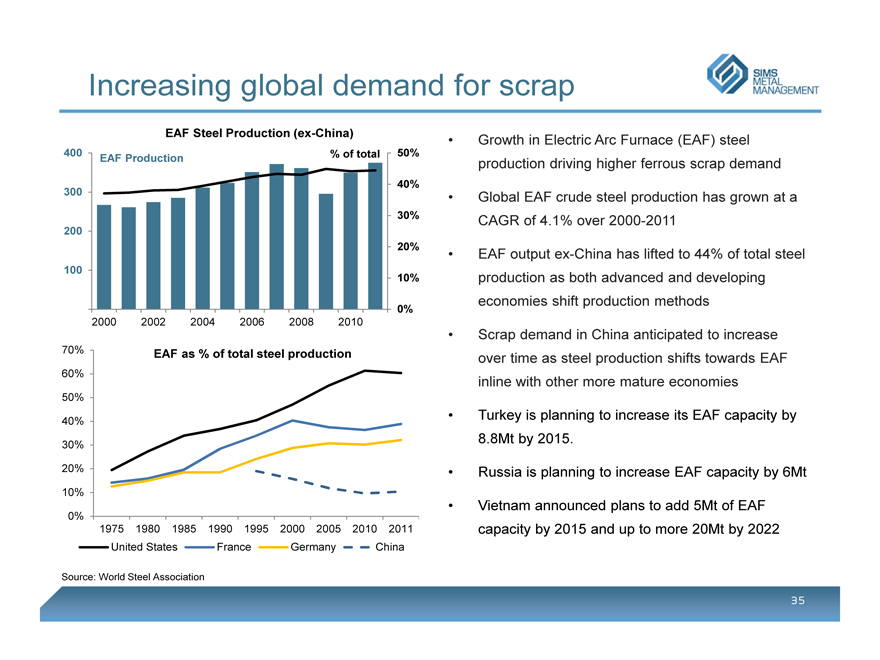
• Growth in Electric Arc Furnace (EAF) steel production driving higher ferrous scrap demand
• Global EAF crude steel production has grown at a CAGR of 4.1% over 2000-2011
• EAF output ex-China has lifted to 44% of total steel production as both advanced and developing economies shift production methods
• Scrap demand in China anticipated to increase over time as steel production shifts towards EAF inline with other more mature economies
• Turkey is planning to increase its EAF capacity by
8.8Mt by 2015.
• Russia is planning to increase EAF capacity by 6Mt
• Vietnam announced plans to add 5Mt of EAF capacity by 2015 and up to more 20Mt by 2022
35
North Haven, CT – Metals Recycling
Appendix D)
Summary of Restated Financial Statements
SIMS METAL MANAGEMENT
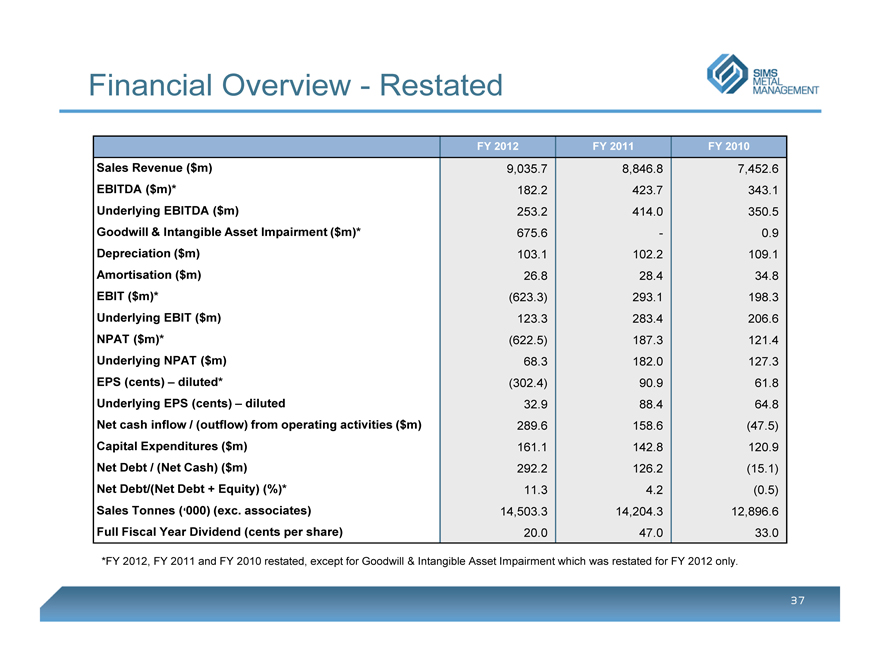
Financial Overview - Restated
SIMS METAL MANAGEMENT
FY 2012
FY 2011
FY 2010
Sales Revenue ($m)
9,035.7
8,846.8
7,452.6
EBITDA ($m)*
182.2
423.7
343.1
Underlying EBITDA ($m)
253.2
414.0
350.5
Goodwill & Intangible Asset Impairment ($m)*
675.6
-
0.9
Depreciation ($m)
103.1
102.2
109.1
Amortisation ($m)
26.8
28.4
34.8
EBIT ($m)*
(623.3)
293.1
198.3
Underlying EBIT ($m)
123.3
283.4
206.6
NPAT ($m)*
(622.5)
187.3
121.4
Underlying NPAT ($m)
68.3
182.0
127.3
EPS (cents) – diluted*
(302.4)
90.9
61.8
Underlying EPS (cents) – diluted
32.9
88.4
64.8
Net cash inflow / (outflow) from operating activities ($m)
289.6
158.6
(47.5)
Capital Expenditures ($m)
161.1
142.8
120.9
Net Debt / (Net Cash) ($m)
292.2
126.2
(15.1)
Net Debt/(Net Debt + Equity) (%)*
11.3
4.2
(0.5)
Sales Tonnes (‘000) (exc. associates)
14,503.3
14,204.3
12,896.6
Full Fiscal Year Dividend (cents per share)
20.0
47.0
33.0
*FY 2012, FY 2011 and FY 2010 restated, except for Goodwill & Intangible Asset Impairment which was restated for FY 2012 only.
37
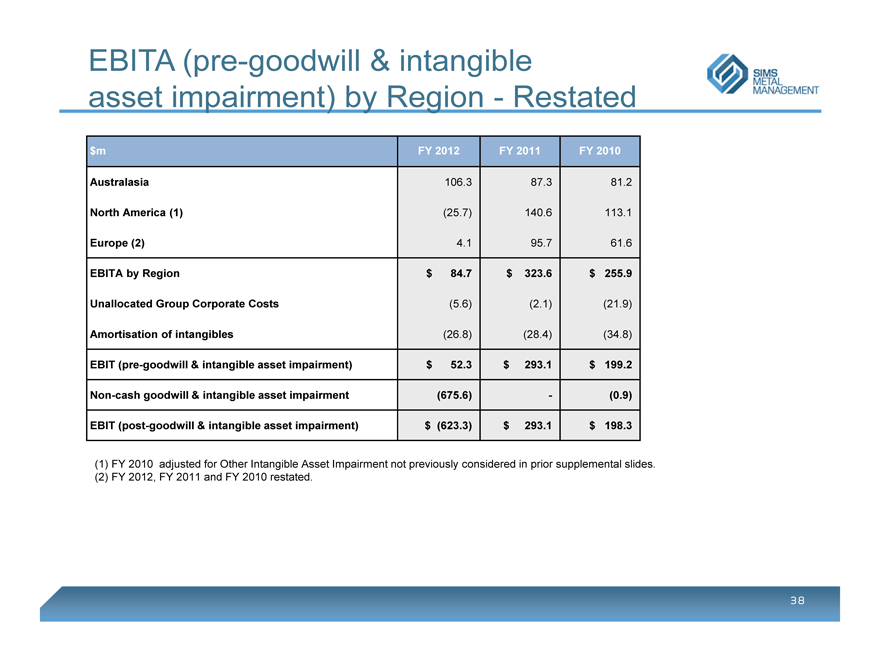
EBITA (pre-goodwill & intangible asset impairment) by Region — Restated
SIMS METAL MANAGEMENT
$m
FY 2012
FY 2011
FY 2010
Australasia
106.3
87.3
81.2
North America (1)
(25.7)
140.6
113.1
Europe (2)
4.1
95.7
61.6
EBITA by Region
$84.7
$323.6
$255.9
Unallocated Group Corporate Costs
(5.6)
(2.1)
(21.9)
Amortisation of intangibles
(26.8)
(28.4)
(34.8)
EBIT (pre-goodwill & intangible asset impairment)
$52.3
$293.1
$199.2
Non-cash goodwill & intangible asset impairment
(675.6)
-
(0.9)
EBIT (post-goodwill & intangible asset impairment)
$(623.3)
$293.1
$198.3
(1) FY 2010 adjusted for Other Intangible Asset Impairment not previously considered in prior supplemental slides.
(2) FY 2012, FY 2011 and FY 2010 restated.
38
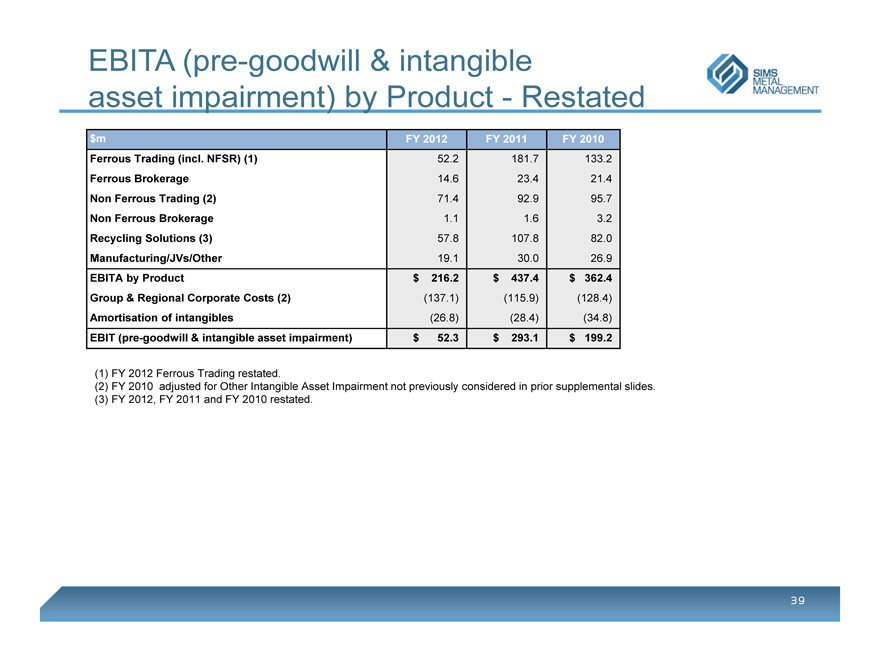
EBITA (pre-goodwill & intangible asset impairment) by Product – Restated
SIMS METAL MANAGEMENT
$m
FY 2012
FY 2011
FY 2010
Ferrous Trading (incl. NFSR) (1)
52.2
181.7
133.2
Ferrous Brokerage
14.6
23.4
21.4
Non Ferrous Trading (2)
71.4
92.9
95.7
Non Ferrous Brokerage
1.1
1.6
3.2
Recycling Solutions (3)
57.8
107.8
82.0
Manufacturing/JVs/Other
19.1
30.0
26.9
EBITA by Product
$216.2
$437.4
$362.4
Group & Regional Corporate Costs (2)
(137.1)
(115.9)
(128.4)
Amortisation of intangibles
(26.8)
(28.4)
(34.8)
EBIT (pre-goodwill & intangible asset impairment)
$52.3
$293.1
$199.2
(1) FY 2012 Ferrous Trading restated.
(2) FY 2010 adjusted for Other Intangible Asset Impairment not previously considered in prior supplemental slides.
(3) FY 2012, FY 2011 and FY 2010 restated.
39

Intake Volumes by Region & Product — Restated
SIMS METAL MANAGEMENT
Total Tonnes (‘000’s)
FY 2012
Australasia
1,791
North America
10,908
Europe*
1,687
Total
14,386
Total Tonnes (‘000’s)
FY 2012
Ferrous Shred (inc. NFSR)*
5,021
Other Processed Ferrous
5,146
Ferrous Brokerage
3,613
Non Ferrous Trading/Brokerage
559
Other*
47
Total
14,386
*FY 2012 restated.
40
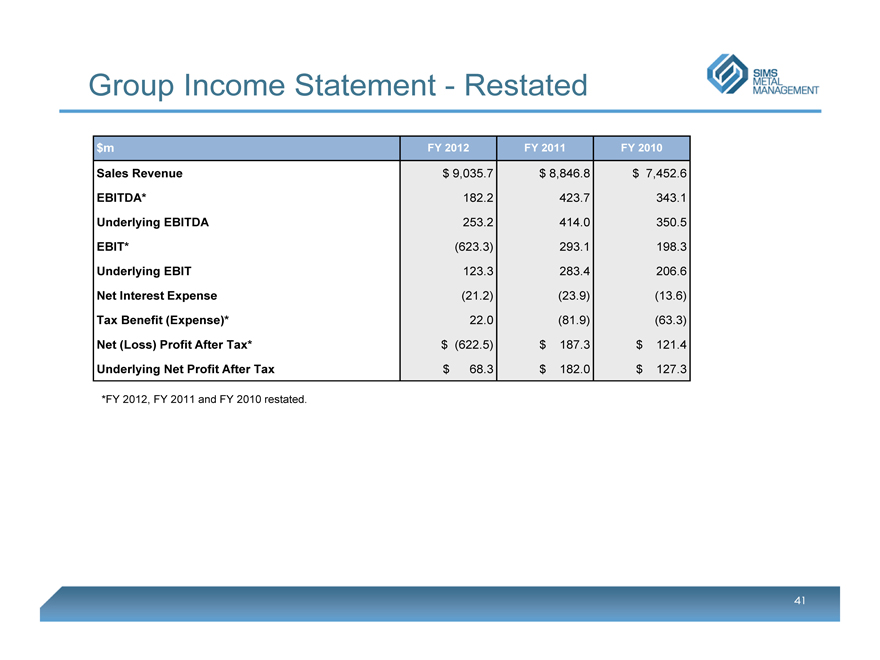
Group Income Statement - Restated
SIMS METAL MANAGEMENT
$m
FY 2012
FY 2011
FY 2010
Sales Revenue
$9,035.7
$8,846.8
$7,452.6
EBITDA*
182.2
423.7
343.1
Underlying EBITDA
253.2
414.0
350.5
EBIT*
(623.3)
293.1
198.3
Underlying EBIT
123.3
283.4
206.6
Net Interest Expense
(21.2)
(23.9)
(13.6)
Tax Benefit (Expense)*
22.0
(81.9)
(63.3)
Net (Loss) Profit After Tax*
$(622.5)
$187.3
$121.4
Underlying Net Profit After Tax
$68.3
$182.0
$127.3
*FY 2012, FY 2011 and FY 2010 restated.
41
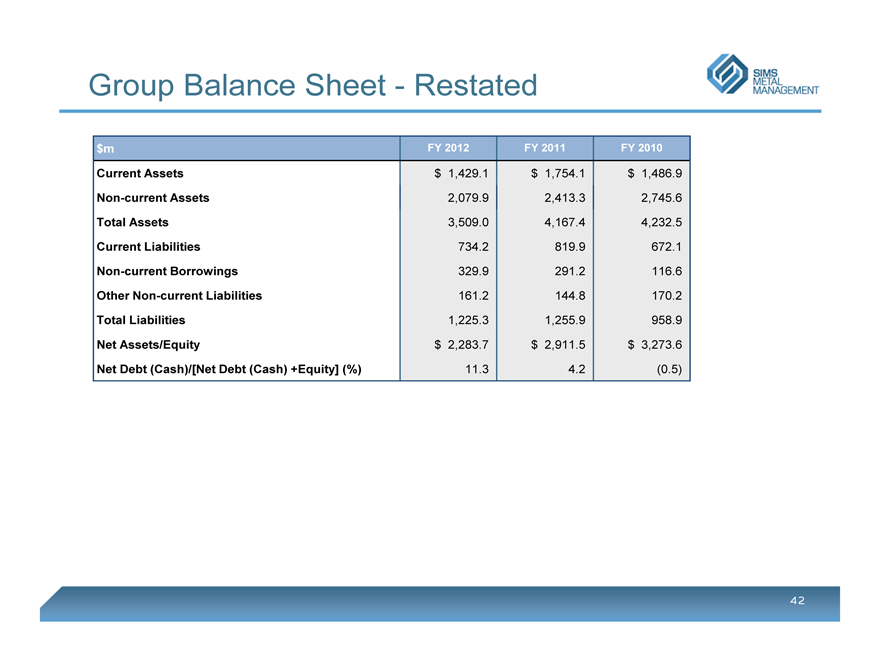
Group Balance Sheet - Restated
SIMS METAL MANAGEMENT
$m
FY 2012
FY 2011
FY 2010
Current Assets
$1,429.1
$1,754.1
$1,486.9
Non-current Assets
2,079.9
2,413.3
2,745.6
Total Assets
3,509.0
4,167.4
4,232.5
Current Liabilities
734.2
819.9
672.1
Non-current Borrowings
329.9
291.2
116.6
Other Non-current Liabilities
161.2
144.8
170.2
Total Liabilities
1,225.3
1,255.9
958.9
Net Assets/Equity
$2,283.7
$2,911.5
$3,273.6
Net Debt (Cash)/[Net Debt (Cash) +Equity] (%)
11.3
4.2
(0.5)
42
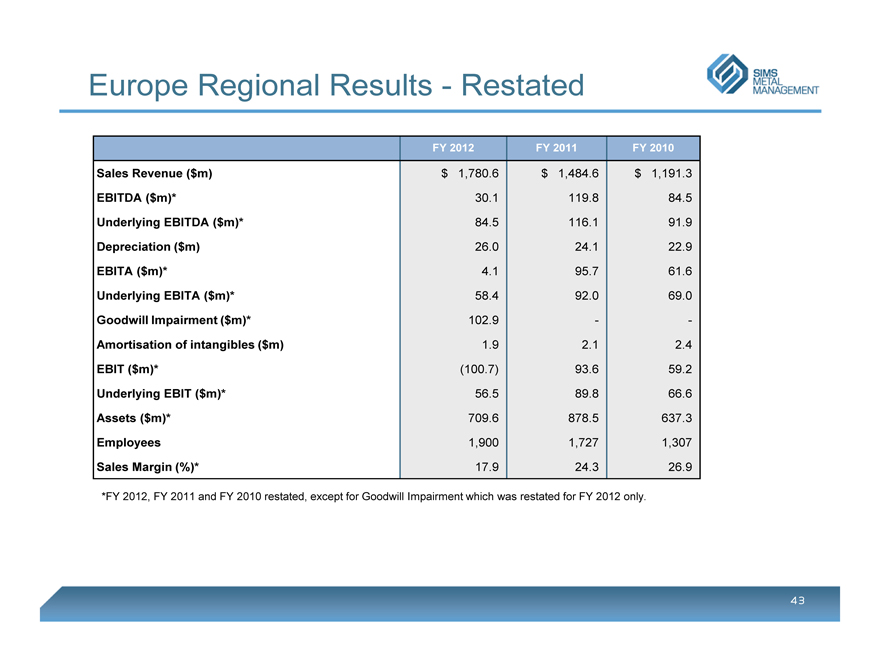
Europe Regional Results - Restated
SIMS METAL MANAGEMENT
FY 2012
FY 2011
FY 2010
Sales Revenue ($m)
$1,780.6
$1,484.6
$1,191.3
EBITDA ($m)*
30.1
119.8
84.5
Underlying EBITDA ($m)*
84.5
116.1
91.9
Depreciation ($m)
26.0
24.1
22.9
EBITA ($m)*
4.1
95.7
61.6
Underlying EBITA ($m)*
58.4
92.0
69.0
Goodwill Impairment ($m)*
102.9
-
-
Amortisation of intangibles ($m)
1.9
2.1
2.4
EBIT ($m)*
(100.7)
93.6
59.2
Underlying EBIT ($m)*
56.5
89.8
66.6
Assets ($m)*
709.6
878.5
637.3
Employees
1,900
1,727
1,307
Sales Margin (%)*
17.9
24.3
26.9
*FY 2012, FY 2011 and FY 2010 restated, except for Goodwill Impairment which was restated for FY 2012 only.
43
SIMS METAL MANAGEMENT
Prepared for Today
Positioned for Tomorrow
44