Exhibit 99.2

| | | | | | | | | | |
| | | | |
| | FINANCIAL RESULTS | | | 2 | | | | | |
| | CHAIRMAN’S REVIEW | | | 4 | | | | | |
| | OPERATIONAL & FINANCIAL REVIEW | | | 6 | | | | | |
| | GLOBAL OPERATIONS | | | 6 | | | | | |
| | GROUP OVERVIEW | | | 8 | | | | | |
| | NORTH AMERICA | | | 10 | | | | | |
| | EUROPE | | | 12 | | | | | |
| | AUSTRALASIA | | | 14 | | | | | |
| | SUSTAINABILITY | | | 16 | | | | | |
| | FINANCIAL REVIEW | | | 20 | | | | | |
| | CORPORATE GOVERNANCE STATEMENT | | | 22 | | | | | |
| | DIRECTORS’ REPORT | | | 33 | | | | | |
| | BOARD OF DIRECTORS | | | 36 | | | | | |
| | REMUNERATION REPORT | | | 38 | | | | | |
| | FINANCIAL STATEMENTS | | | 57 | | | | | |
| | OTHER INFORMATION | | | 121 | | | | | |
| | DIRECTORS’ DECLARATION | | | 120 | | | | | |
| | INDEPENDENT AUDITOR’S REPORT | | | 121 | | | | | |
| | AUDITOR’S INDEPENDENT DECLARATION | | | 122 | | | | | |
| | ANNUAL FINANCIAL REPORT EXTRACTS | | | 123 | | | | | |
| | SHAREHOLDER INFORMATION | | | 127 | | | | | |
| | FIVE YEAR TREND SUMMARY | | | 128 | | | | | |
| | CORPORATE DIRECTORY | | | IBC | | | | | |
PREPARED FOR TODAY.
POSITIONED FOR TOMORROW.
Sims Metal Management is the world’s largest listed metal and electronics recycler with approximately 270 facilities and 6,400 employees globally. Our mission is to drive the highest possible returns for shareholders through lowest cost material processing and best-in-class trading platforms. Our commitment to employees is to create a zero-harm workplace, while being exemplary community members and responsible stewards of the environment.
Financial Results
| | | | | | | | | | | | |
| YEAR ENDED 30 JUNE (A$m) | | FY 2013 | | | FY 2012
Restated | | | Change (%) | |
Sales Revenue | | | 7,193.0 | | | | 9,035.7 | | | | (20.4) | |
EBITDA | | | (41.5) | | | | 182.2 | | | | (122.8) | |
Underlying EBITDA1 | | | 191.4 | | | | 253.4 | | | | (24.5) | |
Goodwill & Intangible Asset Impairment | | | 304.4 | | | | 675.6 | | | | (54.9) | |
Depreciation | | | 101.1 | | | | 103.1 | | | | (1.9) | |
Amortisation | | | 22.4 | | | | 26.8 | | | | (16.4) | |
EBIT | | | (469.4) | | | | (623.3) | | | | (24.7) | |
Underlying EBIT1 | | | 67.9 | | | | 123.5 | | | | (45.0) | |
Net Interest Expense | | | (17.6) | | | | (21.2) | | | | (17.0) | |
Tax Benefit | | | 20.9 | | | | 22.0 | | | | (5.0) | |
Underlying Tax (Expense)1 | | | (33.2) | | | | (28.3) | | | | 17.3 | |
NPAT | | | (466.1) | | | | (622.5) | | | | (25.1) | |
Underlying NPAT1 | | | 17.1 | | | | 74.0 | | | | (76.9) | |
EPS (cents per share) – Diluted | | | (228.1) | | | | (302.4) | | | | (24.6) | |
Underlying EPS (cents per share) – Diluted1 | | | 8.3 | | | | 35.6 | | | | (76.7) | |
Full Fiscal Year Dividend (cents per share) | | | 0.0 | | | | 20.0 | | | | (100.0) | |
Total Assets | | | 2,916.8 | | | | 3,509.0 | | | | (16.9) | |
Total Liabilities | | | 988.0 | | | | 1,225.3 | | | | (19.4) | |
Net Assets | | | 1,928.8 | | | | 2,283.7 | | | | (15.5) | |
Net Debt | | | 153.8 | | | | 292.2 | | | | (47.4) | |
Net Debt/(Net Debt + Equity) (%) | | | 7.4 | | | | 11.3 | | | | NMF | |
Net Tangible Assets | | | 1,664.9 | | | | 1,710.8 | | | | (2.7) | |
Net Tangible Assets per share (A$ per share) | | | 8.15 | | | | 8.35 | | | | (2.4) | |
Net Cash Inflow From Operating Activities | | | 297.3 | | | | 289.6 | | | | 2.7 | |
Capital Expenditures | | | 149.0 | | | | 161.1 | | | | (7.5) | |
Net Cash Outflow From Investing Activities | | | (118.8) | | | | (342.6) | | | | (65.3) | |
Net Cash Inflows (Outflows) From | | | | | | | | | | | | |
Operating & Investing Activities | | | 178.5 | | | | (53.0) | | | | NMF | |
Employees | | | 6,393 | | | | 6,678 | | | | (4.3) | |
Intake Tonnes (‘000) | | | 12,453 | | | | 14,386 | | | | (13.4) | |
Sales Tonnes (‘000) | | | 12,786 | | | | 14,503 | | | | (11.8) | |
| 1 | Underlying excludes goodwill and other intangible asset impairments, and all other significant items |
NMF = Not meaningful percentage change
FY 2013 ANNOUNCEMENTS
23 AUGUST 2012
Sims Metal Management (SMM) announced underlying profit after tax of $74 million, excluding significant items, for the year ended 30 June 2012.
3 DECEMBER 2012
SMM announced the sale of its Metal Recycling assets in Arizona to the Company’s JV partner SA Recycling for uS$35 million.
19 DECEMBER 2012
SMM announced a trading update.
21 JANUARY 2013
SMM announced it had identified the carrying value of inventory in its UK business had been overstated, and that a Special Committee had been formed to investigate the cause and scope of the issue.
15 FEBRUARY 2013
SMM issued the conclusion of the Special Committee investigation into UK issues, previously announced 21 January 2013. the Special Committee determined a $78 million write-down of inventory would be taken. no other control issues existed at sites outside of the UK, and corrective actions are being implemented.
15 FEBRUARY 2013
SMM announced impairment charges related to goodwill and other intangible assets of $354 million. $291 million of the charge relating to north America Metals to be recorded in the FY2013 result, with $63 million of the impairment relating to UK Metals and UK SRS, to be reflected in the restatement of results for prior periods.
22 FEBRUARY 2013
SMM announced underlying profit after tax of $10 million, excluding significant items, for the half year ended 31 December 2012.
22 FEBRUARY 2013
SMM announced the retirement of Group CEO Daniel W. Dienst, effective 30 June 2013.
20 MARCH 2013
SMM announced CEO europe and Global SRS Graham Davy had left the Company, effective immediately.
15 MAY 2013
SMM announced UK restructuring charges of $115 million.

C H A I R M A N’S R E V I E W
Chairman’s Review

GEOFFREY N BRUNSDON
The past year was a challenging one for the Company as it continued to face weak commodity markets and intense competition for raw materials. At the same time we have been managing significant organisational change.
In all the markets in which we operate, we have been reducing costs and improving operational efficiency. We made a number of divestments of under-performing and non-core assets in the united States and Australia, as well as a substantial restructure of the united Kingdom (UK) operations. The positive impact of these initiatives are intended to deliver considerable value in FY14 and will position us to take advantage of increased volumes as economic activity in our key markets recover.
FINANCIAL PERFORMANCE
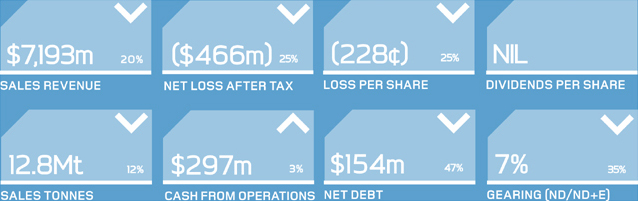
Sales revenue of $7.2 billion in FY13 compared with $9.0 billion in the prior year. The decrease in sales revenue was as a result of a combination of lower average ferrous and non-ferrous scrap prices as well as lower sales volumes, which decreased 12% on the prior year to 12.8 million tonnes.
Underlying earnings before interest, tax, depreciation and amortisation (EBITDA) of $191 million was 24% lower than FY12, primarily due to weak business conditions, which led to intensified competition for the limited supply of raw materials. In Europe especially, lower non-ferrous and precious metal prices negatively impacted our e-recycling business (SRS), compressing margins. These adverse impacts were partially offset in FY13 by improving sales margins in North America and lower underlying controllable costs of $45 million versus FY12.
Cash flow from operating activities of $297 million in FY13 was higher by $8 million versus FY12, highlighting the significant cash generating capacity of the business. Strong cash flows assisted in materially reducing net debt, which declined by $138 million, to $154 million, bringing gearing to 7.4% of total capitalisation as at 30 June 2013.
Maintaining low gearing is a focus of the Company, especially in tough economic times as currently exists in our industry. The Group’s strong cash flow and low gearing provides the capacity to fund ongoing operational requirements of the business, as well as potential increased working capital requirements, as and when industry conditions improve.
The Company’s FY13 financial results were considerably impacted by a number of adverse significant items totaling $537 million ($483 million after-tax). Goodwill impairment charges of $292 million made up just over half of these charges, principally relating to our business in North America. Impairments associated with our inventory write down in the UK and subsequent organisational changes also contributed materially to significant items. Statutory net profit after tax (NPAT), inclusive of significant items, was a loss of $466 million. Excluding significant items, underlying NPAT was $17 million, 77% lower than FY12.
SAFETY
Safety remains the Company’s first priority from which all operational activities must take their lead. During FY13, over 100,000 safety conversations were undertaken, recorded and analysed across all regions. Safety-based training also comprises a substantial part of the nearly 280,000 hours of employee training delivered annually across the Group. While we achieved a promising 9% reduction in the total injury frequency rate during FY13, compositionally LTI and MTI frequency rates increased to 3.6 from 2.8, and to 12.7 from 11.1 in FY13 respectively. This trend is not acceptable, and the Board and management remain committed to our unrelenting focus on safety.
UK SPECIAL COMMITTEE
During the first half of FY13, senior management and the Board identified a breakdown in the Company’s internal control environment in the UK, leading to a significant overstatement of the value of inventories at two UK-based facilities. In response, the Board formed a Special Committee to investigate the root cause of this breakdown, take rapid remedial action, and oversee disciplinary actions where required. Following the investigation, the Special Committee was able to conclude that the control breakdown, and conditions which allowed the overstatement to occur, were isolated to the UK. Substantial progress has been made in the implementation of the Group’s standard inventory controls across the UK business. The effectiveness of the recently strengthened control environment in the UK will be subject to detailed internal audit review during FY14.
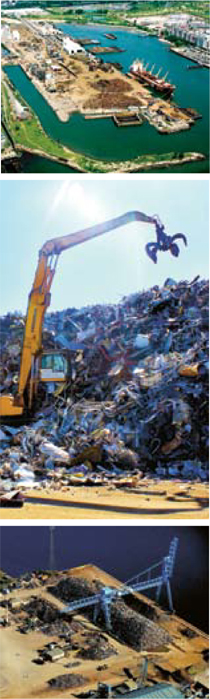
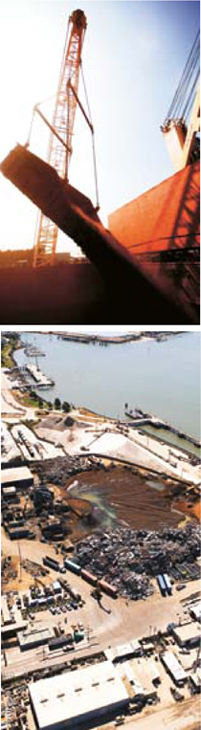
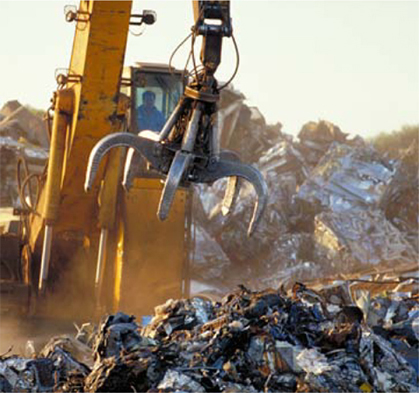
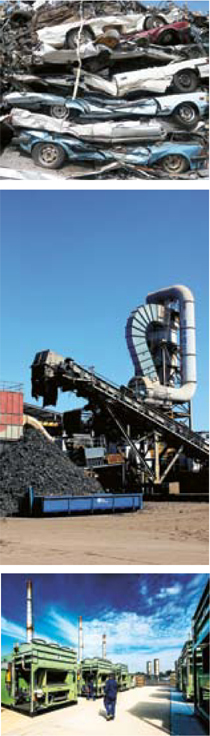
ABOVE CLAREMONT TERMINAL,
NEW JERSEY, US – METALS RECYCLING
MIDDLEST MARY’S, NEW SOUTH WALES, AUSTRALIA – METALS RECYCLING
BELOW NEWPORT, UK – METALS RECYCLING
MANAGEMENT TRANSITION
The past year was also a period of substantial management change. After leading the organisation since the merger of Sims Group and Metal Management in 2008, we announced, in February 2013, the retirement of Daniel Dienst as Group CEO, effective 30 June 2013. Following Mr Dienst’s retirement, the Company has been managed through an executive group known as our Global Leadership Team, chaired by myself and including non-executive director Jim Thompson and the leaders of all the Company’s key operations. We continue our international search for a new CEO.
Additionally, in the second half of FY13, new management teams were selected to lead the Global SRS and UK Metals Recycling businesses.
At the Board level, I was pleased to announce the appointment of Robert Bass as a new independent non-executive director, effective 10 September 2013. Mr Bass was a partner at Deloitte & Touche from 1982, and Vice Chairman Deloitte LLP from 2006, until his retirement in June 2012. I am delighted to have Bob serve on the Board, and bring with him his broad commercial experience and financial credentials.
STRATEGY AND OUTLOOK
Leading indicators for scrap generation in our key market of the United States continue to show improvement across new vehicle and major appliance sales, as well as broader US consumer confidence. While these signals are encouraging, they have yet to translate into the generation of higher levels of scrap metal, and the competition for available material remains high. We expect this condition may persist until a more substantial improvement in employment aggregate numbers is seen, and consumer confidence levels rebound beyond what are still historically low levels.
In Europe, economic growth in the UK and Germany continues to track at anemic levels. While it may appear that the worst of the EU financial crisis has passed, we remain mindful from recent experience in the US of the lag which can occur between initial economic recovery and sustainable recovery that impacts scrap generation.
Australia has continued to out-perform other developed economies since the 2009 global financial crisis. However, we are cognisant of the turn of the commodity cycle and the impact on the heavily mining-dependent Australian economy.
Under these uncertain economic conditions, it is critical that the Company manages the aspects of the business within its control. To this end, the Company remains committed to maintaining capital discipline and balance sheet strength, continued attention to reducing controllable costs, and streamlining the business to focus on our higher returning assets. While we expect near-term challenges to persist, we believe we are better prepared and positioned to deal with them.

GEOFFREY N BRUNSDON
CHAIRMAN


| | | | | | | | |
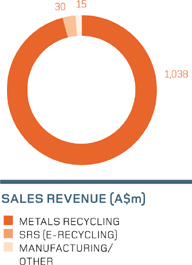
| | | | | | | | AUSTRALASIA SALES TONNES: 1.8Mt in FY13 METAL RECYCLING: 48 facilities, with 5 shredders 9 joint venture facilities, with 2 shredders SIMS RECYCLING SOLUTIONS: 10 facilities TOTAL EMPLOYEES: 984 |
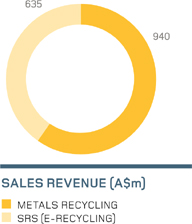
EUROPE SALES TONNES: 1.6Mt in FY13 METAL RECYCLING: 37 facilities, with 3 shredders SIMS RECYCLING SOLUTIONS: 16 facilities TOTAL EMPLOYEES: 1,718 | | | | |
| | | | | Largest metals recycling firm in Australia, with operations extending into New Zealand and Papua New Guinea. FY13 investments in the Australian Metals business include the acquisition of a ferrous metal business in South Australia, a capital upgrade of the St Mary’s facility in New South Wales, and the installation of a downstream non-ferrous extraction system in Victoria. Additional steps were taken to divest non-core manufacturing assets, with the commitment to close the Melbourne-based lead smelting operation. Only a small aluminium smelting operation remains in the manufacturing division. |
Second largest metals recycling firm in the UK, with strategic deep water export capabilities. Controllable cost reductions remained a focus of the UK Metals recycling business throughout FY13. Headcount in the UK Metals business was reduced by 12% with two of five shredders idled and several small yards closed. Initial business review in the European SRS operations has led to action to restructure material flow, reduce headcount, accelerate inventory turnover and close low returning facilities. European SRS headcount reduced by 8% in FY13. | | | | |

O P E R A T I O N A L & F I N A N C I A L R E V I E W
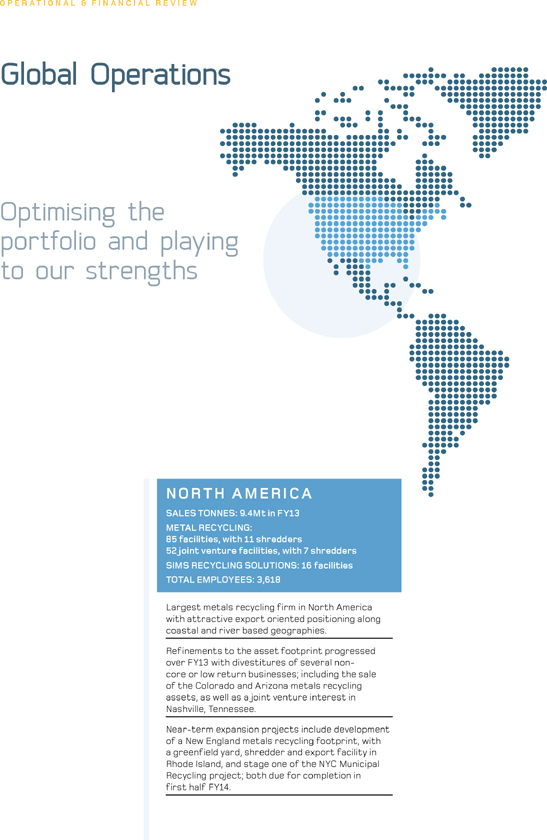
North America
OUR BUSINESS
METALS RECYCLING
North America’s largest metals recycling firm, with over 130 wholly owned and joint venture facilities, specialising in the collection, processing and trading of post-consumer and post-industrial ferrous and non-ferrous scrap metal. export oriented asset positioning along coastal and river based geographies, leveraging emerging market steel making and non-ferrous secondary metals smelting demand.
RECYCLING SOLUTIONS
Sixteen e-recycling facilities across the united States and Canada, specialising in environmentally responsible solutions for the disposal of post-consumer electronic products, including It assets recycled for commercial customers.
RESULTS AT A GLANCE
| | | | | | | | | | | | |
| A$m | | FY 2013 | | | FY 2012 | | | Change (%) | |
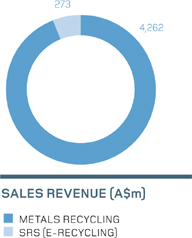
| Revenue | | | 4,534.6 | | | | 6,027.0 | | | | (24.8 | ) |
| EBITDA1 | | | 104.4 | | | | 75.1 | | | | 39.0 | |
| EBIT1 | | | 36.7 | | | | (1.5 | ) | | | – | |
| Sales Volumes (Mt) | | | 9.377 | | | | 11.080 | | | | (15.4 | ) |
| Sales Margin (%) | | | 15.4 | | | | 11.7 | | | | – | |
|
1 Underlying excludes goodwill and other intangible asset impairments, all other significant items, and unallocated group corporate costs | |
PERFORMANCE
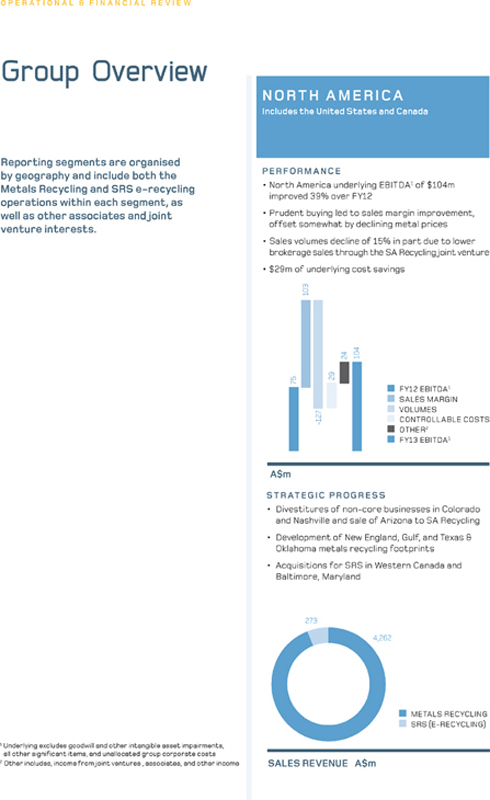
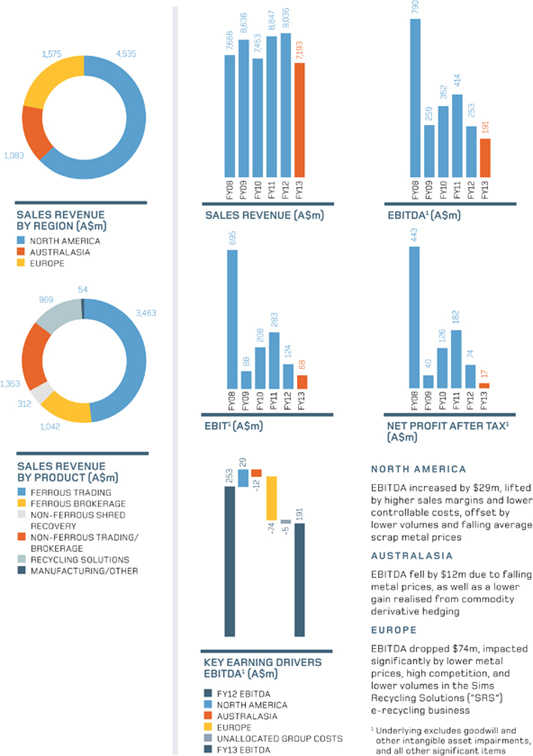
Sales revenue for the North America region of $4,534.6 million was down 25% on FY12, due to a mix of lower sales tonnes and declines in ferrous and non-ferrous metal prices. Sales volumes slowed significantly in the first half of FY13 due to softer demand in export markets for ferrous scrap metal. The impact of weaker offshore demand during the period contributed to a decline in ferrous brokerage volumes.
Underlying EBITDA of $104.4 million was up 39% on FY12, attributable to increased sales margins and lower underlying controllable costs. Correspondingly, underlying EBITDA margins rose to 2.3% from 1.3% in FY12. Underlying controllable cost savings within the North American Metals business were $48.4 million during FY13. These cost savings are expected to be sustainable at this level until intake volumes change materially. Total controllable cost savings for North America were offset slightly by increased costs from small bolt-on acquisitions made by SRS of Genesis Recycling in British Columbia, Canada and E-Structors in Baltimore, Maryland during FY13.
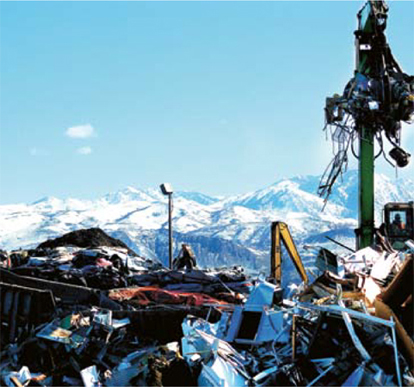
OPPOSITE PAGE SALT LAKE CITY,
UTAH – METAL RECYCLING
ABOVE CLAREMONT TERMINAL,
NEW JERSEY – METALS RECYCLING
BELOW REDWOOD CITY, CALIFORNIA – METAL RECYCLING
STRATEGIC PROGRESS
Refinements to the North American asset footprint progressed over FY13 with the divestitures of several non-core or low return businesses. These sales included the divestitures of the Colorado and Arizona metals recycling assets, as well as a joint venture interest in Nashville, Tennessee. The Arizona metals recycling assets were sold into the Company’s joint venture, SA Recycling (“SAR”), in order to better leverage SAR’s strong asset footprint in Southern California, Arizona and Nevada.
Capital from these asset sales is being invested in projects anticipated to have higher returns. Near-term projects include the development of a New England metals recycling footprint, with a greenfield yard, shredder and export facility in Rhode Island, and stage one of the NYC Municipal Recycling project; both due to be completed in the first half of FY14.
Subsequent to 30 June 2013, additional divestments have taken place to drive higher returns on the North American asset portfolio. The divestitures in FY14 have related to non-core businesses and included Aerospace Metals, a business focused on the recycling of titanium alloys and high temperature metals; as well as the Birmingham, Alabama shredder and an associated yard, due to limited synergies with the Group’s Gulf and Mississippi river system based assets.
MARKET OUTLOOK
Underlying fundamentals for scrap generation showed improvement in the US during FY13 though scrap generation tends to lag the fundamentals. Consumer confidence, a key leading indicator for consumer scrap creation, reached a five year high in June 2013. Correspondingly, auto and major household appliances sales also increased. New auto sales in the US reached an annualized rate of 15.9 million vehicles in June, up 10% year-over-year. US manufacturer’s shipments of major appliances were up 7% year-to-date in June. Due to the severity of the 2009 US recession and persistently lower employment aggregates post global financial crisis (“GFC”), auto scrapping rates are expected to lag new auto sales. Scrap from auto and major appliances combine to account for 50% to 70% of source material for metal shredders in the US.
Despite improving macro-economic data, installed processing capacity in the US scrap industry remains in excess of scrap generation available for processing, resulting in aggressive competition for scrap intake. Some signals of industry capacity rationalisation are beginning to emerge. A trend has begun to develop amongst metals recycling firms, both in the US and other markets, to address industry overcapacity through cost reductions and facility rationalisation. While these developments are positive for the industry, at present the challenges of excess capacity still persist.
O P E R A T I O N A L & F I N A N C I A L R E V I E W
Europe
OUR BUSINESS
METALS RECYCLING
One of the UK’s largest metals recycling firms, with over 35 wholly owned facilities, specialising in the collection, processing and trading of post-consumer and post-industrial ferrous and non-ferrous scrap metal.
RECYCLING SOLUTIONS
Sixteen e-recycling facilities across the United Kingdom, Sweden, Belgium, the Netherlands, Germany, Poland, the Czech Republic, Hungary, Austria and Croatia, specialising in environmentally responsible solutions for the disposal of post-consumer electronic products, including IT assets recycled for commercial customers.
RESULTS AT A GLANCE
| | | | | | | | | | | | |
| A$m | | FY 2013 | | | FY 2012 | | | Change (%) | |
Revenue | | | 1,575.3 | | | | 1,780.6 | | | | (11.5 | ) |
EBITDA1 | | | 10.2 | | | | 84.0 | | | | (87.9 | ) |
EBIT1 | | | (19.2 | ) | | | 56.1 | | | | (134.2 | ) |
Sales Volumes (Mt) | | | 1.645 | | | | 1.651 | | | | (0.4 | ) |
Sales Margin (%) | | | 14.2 | | | | 17.9 | | | | – | |
|
1 Underlying excludes goodwill and other intangible asset impairments, and all other significant items | |
PERFORMANCE
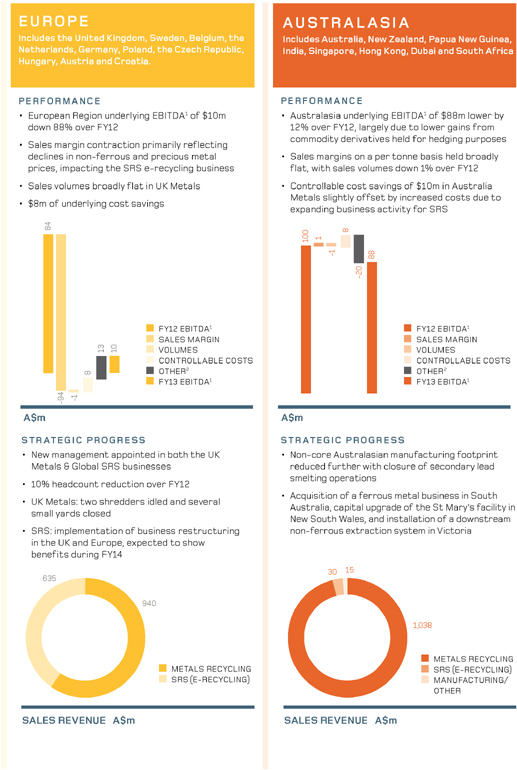
Sales revenue for the Europe region of $1,575.3 million was down 12% on FY12, due to lower sales volumes and lower commodities prices. UK Metals Recycling sales volumes were broadly flat compared to the prior year at 1.65 million tonnes.
Underlying EBITDA of $10.2 million was down 88% relative to FY12, due to several factors including: 1) sustained weak scrap generation in the UK which elevated competition across both the traditional metals recycling and the SRS e-recycling businesses, 2) lower non-ferrous and precious metal prices which decreased metal recovery margins in the SRS business, and 3) negative impact from lower average ferrous scrap metal prices causing sales margins to decline in the UK Metals business. Underlying controllable cost savings in the UK Metals business were $1.3 million in FY13.

OPPOSITE PAGE NEWPORT, UK –
METALS RECYCLING
ABOVE PETERBOROUGH, UK –
METALS RECYCLING
BELOW NEWPORT, UK – SRS E-RECYCLING
UK SPECIAL COMMITTEE
On 21 January 2013, the Board formed a Special Committee to investigate inventory write-downs in the UK. As a result of the findings of the Special Committee, substantial progress has been made in the implementation of the Group’s standard inventory controls in the UK operations. The operation of the control environment will be subject to detailed internal audit review during FY14.
STRATEGIC PROGRESS
Towards the end of the second half of FY13, business reviews were completed under the direction of Group management which resulted in inventory and asset write-downs, and costs related to restructuring actions in the UK operations. The implementation of the findings of the business review led to a contraction of the UK Metals operations, including headcount reductions and consolidation of shredding activities at Newport into nearby Avonmouth. In total, headcount in the UK Metals business was reduced by 13% during FY13 with two shredders idled and several small yards closed. Furthermore, the UK SRS business is being repositioned towards a lower working capital and higher turnover model, while looking at additional strategies to further decrease operational costs. Headcount was reduced in the UK SRS operations by 16%, with the majority of these reductions taking place in the second half of FY13. Management believes initial restructuring actions have stabilised the business and should lead to improved outcomes in FY14.
Complimenting these actions, at the end of FY13 new management was appointed for both the UK Metals and Global SRS businesses as management realignment separated these businesses to enhance operational focus. The new management teams will continue to examine further cost saving opportunities across the European businesses as a priority during FY14.
MARKET OUTLOOK
Economic conditions in the UK and Europe remained extremely challenging during FY13. Consumer confidence in the UK persisted near post GFC lows for the majority of the year, with GDP growth continuing to languish at anemic levels. Low scrap arisings intensified competition for raw materials for the UK Metals Recycling business, placing pressure on margins. Operations at several of the Company’s small inefficient feeder yards have been consolidated. The idling of two shredders, and shifting material to the remaining three shredders, is expected to result in higher utilisation rates for active operations. Further to the actions already taken, the new UK Metals management team appointed at the end of FY13, is conducting a detailed review of the business to respond to these market challenges.
O P E R A T I O N A L & F I N A N C I A L R E V I E W
Australasia
OUR BUSINESS
METALS RECYCLING
Australia’s and New Zealand’s leading metals recycling firm, with over 55 wholly owned and joint venture facilities, specialising in the collection, processing and trading of post-consumer and post-industrial ferrous and non-ferrous scrap metal.
RECYCLING SOLUTIONS
Ten e-recycling facilities across Australia, New Zealand, Singapore, India, Dubai, and South Africa, specialising in environmentally responsible solutions for the disposal of post-consumer electronic products, including IT assets recycled for commercial customers.
MANUFACTURING AND OTHER
As of 30 June 2013, the manufacturing division is composed solely of a small aluminium smelting facility. Also included within Australasia is a 16% interest in China-based metals recycling firm CTG and a 50% interest in Australian renewable energy company LMS Energy Pty Ltd.
RESULTS AT A GLANCE
| | | | | | | | | | | | |
| | | | |
| A$m | | FY 2013 | | | FY 2012 | | | Change (%) | |
| Revenue | | | 1,083.1 | | | | 1,228.1 | | | | (11.8 | ) |
| EBITDA1 | | | 87.7 | | | | 99.5 | | | | (11.8 | ) |
| EBIT | | | 61.7 | | | | 74.6 | | | | (17.2 | ) |
| Sales Volumes (Mt) | | | 1.764 | | | | 1.772 | | | | (0.5 | ) |
| Sales Margin (%) | | | 23.9 | | | | 21.1 | | | | – | |
|
1 Underlying excludes goodwill and other intangible asset impairments, and all other significant items | |
PERFORMANCE
Sales revenue for the Australasia region of $1,083.1 million was down 12% on FY12, due to lower ferrous and non-ferrous scrap metal prices, while sales volume remained broadly unchanged. Underlying EBITDA of $87.7 million was down 12% compared to FY12, primarily due to lower gains from commodity derivatives held for hedging purposes in FY13.
Underlying EBITDA margins held steady at 8.1% due to the offsetting compression in revenue and underlying EBITDA. Underlying controllable cost reductions in the Australia Metals Recycling business were $10.0 million for FY13. These cost savings are expected to be sustainable at this rate based on current activity levels.
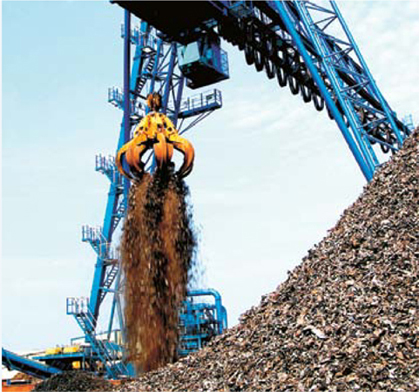
OPPOSITE PAGE BROOKLYN, VICTORIA – METAL RECYCLING
ABOVE CAR BODY STACK – METALS RECYCLING
MIDDLE ST MARY’S – NEW SOUTH WALES, METALS RECYCLING
BELOW HAMPTON PARK – SOUTH AUSTRALIA, LMS ENERGY
JOINT VENTURES AND ASSOCIATES
With 20 operating projects in Australia, the Company’s joint venture LMS Energy Pty Ltd (LMS), generated in excess of 340,000 megawatt hours in FY13, the equivalent to power approximately 50,000 homes. Moreover, LMS generated over 340,000 Large-Scale Generation Certificates, and abated an estimated 2,000,000 tonnes (CO2e) of carbon during FY13.
Earnings from the Company’s 16% ownership stake in China-based metals recycling firm Chiho-Tiande Group (CTG) were impacted by net losses at CTG for the six month period ending 30 June 2013. Due to net losses, and a corresponding decline in the CTG share price, the Company took a charge of $14.9 million to record impairment in the CTG investment, and incurred $21.3 million of charges related to the write-down of derivatives held in CTG and equity accounted losses in FY13.
STRATEGIC PROGRESS
Refinements to the Australasia asset footprint continued to occur over FY13. Further investments were made into the Australian Metals business with the acquisition of a ferrous metal business in South Australia, a capital upgrade of the St Mary’s facility in New South Wales, and the installation of a downstream non-ferrous extraction system in Victoria.
Additionally, steps were taken to further contract the Australian manufacturing operations including the commitment to close the non-core lead smelting operation. Only a small aluminium smelting facility in Melbourne, Australia currently remains in the manufacturing division.
MARKET OUTLOOK
Business activity driving scrap generation in Australia continues to track below mid-cycle levels. Consumer sentiment fell for the second consecutive year in FY13 and GDP growth began to slow due to a decline in commodity prices and mining activity. Key drivers of scrap generation, manufacturing and construction, remain severely depressed. Australian manufacturing PMI data for July 2013 indicated its 25th consecutive month in contraction territory, while Australian construction PMI data in June 2013 entered its 37th uninterrupted month of contraction. The Australian management team has responded to these challenges by reducing operating shifts and headcount, and temporarily idling yards where necessary.
O P E R A T I O N A L & F I N A N C I A L R E V I E W
Sustainability
HIGHLIGHTS
ENVIRONMENT
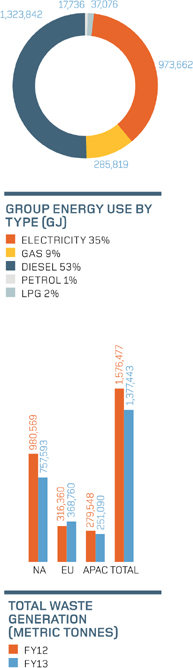
Waste generation reduced by 13% over FY12 to 1.38 million tonnes, related to significant waste reductions in Australasia and North America.
HEALTH AND SAFETY
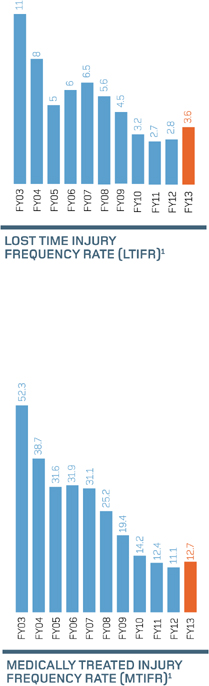
Group LTIFR increased from 2.8 in FY12 to 3.6 in FY13 and MTIFR from 11.1 in FY12 to 12.7 in FY13.
PEOPLE AND DIVERSITY
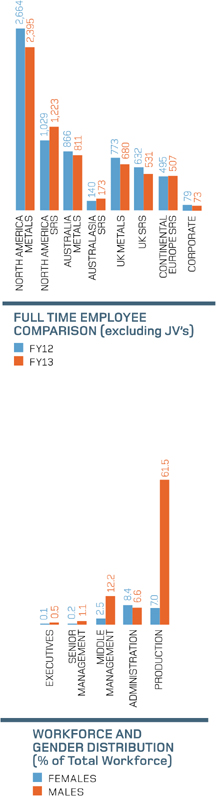
Encouring diversity among its workforce saw the percentage number of females employed by the Group lift from 17% to 18%.
COMMUNITY ENGAGEMENT
The Company has a particular focus on engaging with people in the localities of its operations, and sponsors hundreds of projects each year.
The sustainability agenda is crucial to how we measure and manage all the non-financial components of our activities. Our workforce has a strong affinity with these issues, realising the importance they play in how we conduct ourselves as a public company.
| | | | | | | | | | | | | | |
| | | | | |
| KEY PARAMETERS/ REGION | | FY13 | | | FY12 | | | CHANGE% | | | TREND |
Energy Use (GJ) | | | | | | | | | | | | | | |
North America Total | | | 1,597,189 | | | | 1,746,250 | | | | -9 | | | i |
Europe and UK Total | | | 520,407 | | | | 465,577 | | | | 12 | | | h |
Asia Pacific Total | | | 520,538 | | | | 517,318 | | | | 1 | | | h |
Group Total | | | 2,638,134 | | | | 2,729,145 | | | | -3 | | | i |
CO2 Emissions (tCO2 e) | | | | | | | | | | | | | | |
North America Total | | | 142,162 | | | | 153,681 | | | | -7 | | | i |
Europe and UK Total | | | 48,307 | | | | 42,108 | | | | 15 | | | h |
Asia Pacific Total | | | 63,188 | | | | 60,426 | | | | 5 | | | h |
Group Total | | | 253,657 | | | | 256,215 | | | | -1 | | | i |
Scope 1 | | | 111,131 | | | | 117,886 | | | | -6 | | | i |
Scope 2 | | | 142,526 | | | | 138,329 | | | | 3 | | | h |
Water Consumption (Mega Litres) | | | | | | | | | | | | | | |
North America Total | | | 527.8 | | | | 652.6 | | | | -19 | | | i |
Europe and UK Total | | | 141.6 | | | | 101.3 | | | | 40 | | | h |
Asia Pacific Total | | | 82.5 | | | | 105.0 | | | | -21 | | | i |
Group Total | | | 751.9 | | | | 858.9 | | | | -12 | | | i |
Waste Generation (Tonnes) | | | | | | | | | | | | | | |
North America Total | | | 757,593 | | | | 980,569 | | | | -23 | | | i |
Europe and UK Total | | | 368,760 | | | | 316,360 | | | | 17 | | | h |
Asia Pacific Total | | | 251,090 | | | | 279,548 | | | | -10 | | | i |
Group Total | | | 1,377,443 | | | | 1,576,477 | | | | -13 | | | i |
Key OH&S Indicators | | | | | | | | | | | | | | |
Group LTIFR (LTIx1,000,000/exposed hours) | | | 3.6 | | | | 2.8 | | | | 29 | | | h |
Group MTIFR (MTIx1,000,000/exposed hours) | | | 12.7 | | | | 11.1 | | | | 14 | | | h |
Number of employees | | | | | | | | | | | | | | |
Male | | | 5,243 | | | | 5,518 | | | | -5 | | | i |
Female | | | 1,150 | | | | 1,160 | | | | -1 | | | i |
Group Total | | | 6,393 | | | | 6,678 | | | | -4 | | | i |
Training | | | | | | | | | | | | | | |
Group Total Hours (Corporate training only) | | | 277,142 | | | | 259,519 | | | | 7 | | | h |
ENVIRONMENT
ENERGY, FUEL AND ELECTRICITY
The total energy use of the Group for FY13 was 2,638,134 GJ, a 3% decrease compared to FY12. This was in part due a decrease in total annual production, as well as continued energy efficiency measures. Overall energy usage profile remained unchanged from FY12, with diesel fuel as the highest component at 53% followed by electricity at 35%. Gas accounted for a total of 9%, with LPG and petrol at 2% and 1% respectively. The Company continually seeks to reduce energy use and find alternative energy sources where operationally and financially viable. Notable projects in FY13 include:
North America: A significant upgrade of mobile equipment to new units, comprising Tier 4 diesel engines combined with other initiatives resulted in a greater than 20% reduction in weighted average hourly diesel consumption in the replaced equipment.
Europe: The UK continued its program of replacing its forklift fleet with highly efficient hybrid units, promising fuel efficiencies of between 30% to 38%. Newly installed management systems also provide real-time data, improving idle time and better fuel use management.
Australasia: With shredders accounting for the majority of electricity usage, work continued to improve efficiency in these units, including improved magnetic and air separation systems.
CARBON FOOTPRINT
The Company’s Environmental and Carbon Emissions Policies set the global framework and expectations for energy and carbon reduction efforts, which apply to all activities. Energy consumed by our operations results in the emission of carbon, either directly from the conversion of fuel in our equipment, such as mobile plant, trucks and smelting (Scope 1) or indirectly through the use of externally produced electricity (Scope 2).
Total Group CO2 emissions for FY13 were 253,657 tonnes, down 1% compared to FY12. A small increase in Scope 2 (3%) was offset by a larger decrease in Scope 1 (6%). Electricity was the largest contributor at 54%, followed by diesel at 39%, gas at 5%, with minor contributions from petrol and LPG at 1% each.
Currently, the Company is not subject to the Australian carbon tax and an impost on carbon remains off the federal US policy agenda. The UK operations are affected by the CRC Energy Efficiency Scheme, under which carbon offsets must be purchased annually to offset our energy profile. At the present time, these credits are issued at a fixed cost by the UK government at £12/tonne of CO2e emitted. The stated policy intention is to move to a free carbon market, at which point the Company would need to engage in trading of carbon offsets.
GREEN ENERGY
Our affiliated renewable energy company LMS generated in excess of 340,000MWh of renewable energy during FY13, or close to half of what was consumed by the entire Sims Metal Management Group. This resulted in the creation of a similar amount of Large-Scale Generation Certificates, also known previously as Renewable Energy Certificates. Combined, the renewable energy projects of LMS abated an estimated 2,000,000 tonnes of CO2e during FY13 as LMS continued its expansion of renewable energy facilities.
WATER USE
The Company’s total water consumption profile is relatively small, particularly when compared to industry peers. The majority of our operations are collection yards, where a relatively minor supply of potable water is required for human consumption and ablution. Where water is used for processing purposes, storm water is harvested, where possible, within the facility’s boundaries. Global consumption continued to decrease with 752 Mega litres used, down 12% from 859 Mega litres in FY12.
WASTE GENERATION AND MANAGEMENT
During FY13, the Company generated 1.38 million tonnes of non-usable waste, down 13% on FY12. This was mainly related to significant waste reductions in Australasia and North America, partially offset by increases in Europe from residual waste generated through new plastics and glass recovery processes. Of total waste, 99.4% was non-hazardous, primarily from metal shredding and mostly used for beneficial landfill applications. A small proportion of waste (0.6%) is classified as hazardous, a slight increase on FY12 due to statutory reclassifications of some waste materials.
The Company continues to invest in sophisticated separation technologies. These recover miniscule metallic elements from our processing lines, separating re-usable waste for use in the construction industry, and further refining the extraction of pure and valuable plastics polymers for re-use. Our recently commissioned CRT glass recovery process, in which the hitherto problematic leaded and optical glass component in televisions and monitors is mechanically processed, cleaned and separated in a high volume environment, produces decontaminated high specification glass.
O P E R A T I O N A L & F I N A N C I A L R E V I E W
Sustainability
| 1 | Calculated as the medically treated injuries multiplied by 1 million and divided by the hours worked |
HEALTH AND SAFETY
Safety remains the Company’s first priority from which all other operational activities must take their lead. undertaking all tasks in a safe manner is a non-negotiable work condition and an integral responsibility of every employee, contractor and visitor. During FY13, a total of 104,146 safety conversations were undertaken, recorded and analysed across all regions, the vast majority reflecting positive safety behaviour. These, as well as observed unsafe acts and near misses, provide a valuable insight into where potential issues can arise, allowing us to focus our training and safety delivery accordingly. Every employee can access this information, benefiting from safety experiences across the Group. Considerable training is provided to support these efforts, accounting for a substantial part of the nearly 280,000 hours of corporate training delivered in FY13.
Despite all these efforts, we experienced an unfortunate reversal of our consistent historical decrease in safety statistics in FY13. Group LTIFR increased from 2.8 in FY12 to 3.6 in FY13 and MTIFR from 11.1 in FY12 to 12.7 in FY13. While the overall severity of injuries decreased, this trend is not acceptable. Hence, we will continue to build on our leadership, training and systems to achieve the crucial transformation of where a culture of looking after yourself and your work colleagues is second nature, and any incident is an unacceptable occurrence.
Further enhancing the Company-wide safety framework, each region continues to implement and pursue initiatives of specific relevance to its safety journey. Specific regional safety initiatives included:
North America Metals: SAAFE – “Safe Acts Are For Everyone”, continues to be the main safety platform for strong integration of safety measures into all aspects of operational activities. Several areas were targeted for improvement in FY13, including expanding the use of Operational Behavioural Audits (OBA’s) and specifically targeting higher risk operational activities. The use of “Controlled Access” in shredder stockpile areas was introduced, with all non-essential worker access being restricted and requiring escort. Of particular focus was the use of behavioural tools, OBA’s, Incident Investigation, Hazard Identification and reporting, as well as improving the quality of root cause analysis and associated corrective actions.
UK Metals and SRS Global: The SimsMMway, the core safety platform, was expanded to include all aspects of SHEC as well as including our previously introduced “Take Five”, a simple reminder to all employees of taking 5 SHEC issues on board and doing something about them. Documentation was also significantly shortened to make it more accessible and with an increased focus on outcomes. In line with these revisions, all Annual Site Safety Plans were also revised to include all aspects of SHEC. In respect of SRS Global, the 5S program was successfully introduced, showing immediate benefits to housekeeping and an associated drop in slips, trips and fall injuries.
Australia and New Zealand Metals: The development and implementation of a National Injury Management Manual was undertaken, with associated training of supervisors and yard managers. There was also a specific focus to improve the quality of OBA’s and FY13 saw the introduction of a national Safety Observational Behavioural competency training package for supervisors and managers. The Rapid Induct Management system used for safety induction of contractors was further enhanced to enable a more thorough and automated process to manage all contractors that enter our yards.
| | |
 | | PEOPLE AND DIVERSITY DIVERSITY AND RETENTION During FY13, the Company undertook significant restructuring efforts reducing its overall workforce from 6,678 to 6,393 employees, excluding JV operations. Despite these changes, we remained focused on encouraging diversity among our workforce. In FY13, the percentage number of females employed increased to 18.0% from 17.4% the prior year. While the Company overall remains predominately male, because of our industrial nature, females account for more than 55% of our administration sector. Staff leaving voluntarily fell slightly to 16.4% from 18.1% in FY12, while redundancies increased to 8.3% from 5.3% due to our business restructuring activities. TRAINING AND DEVELOPMENT Training and development is a significant contributor to the Company’s ability to attract new talent, while at the same improving the skills and knowledge of our dedicated workforce. During FY13, 277,142 hours of specialist training were delivered, in addition to on-the-job training and general skills improvement. Management training covered subjects such as leadership and strategy, time management, and innovation to name a few. At a technical level, training centred on enhancement skills, such as commodities trading, metal theft and finance. Additionally, mandatory training on anti-corruption and information security, and Code of Conduct training was undertaken. COMMUNITY ENGAGEMENT As the world’s largest listed metals and electronics recycler, the Company’s knowledge of how to preserve and re-use materials is sought by governments, environmental groups and NGO’s alike. We work closely with governments on a range of issues from how levels of recycling in the community can be increased, to what is technically and economically feasible for the conservation of rare compounds used in high tech applications. At the NGO level, the Company works with a range of environmental advocacy groups, including the Baykeeper, Clean up the World and the Total Environment Centre. The Company is also a prominent member of the Bureau of International Recycling (BIR), Institute of Scrap Recycling Industries (ISRI), British Metal Recycling Association (BMRA) and the Australian Council of Recycling (ACOR), as well as many other organisations that seek to engage government, the press and community on issues related to the importance of recycling and waste reduction. The Company has a particular focus on engaging with people in the localities of our operations. There are hundreds of projects each year, ranging from sponsoring local events, to allowing the emergency services to practice fire and car rescue scenarios as well as helping people in distress or need. The following examples are a small selection of such local engagement: North America: Sims Metal Management was approached by Mayor Corey Booker in Newark, New Jersey, to support “Jewellery for a Cause”. Guns used in crimes are shredded and melted down, made into jewellery and sold to fund anti-crime charities in the City of Newark. Europe: Sims Metal Management UK was instrumental in getting the UK government to introduce new legislation banning all cash transactions for scrap to combat metal theft and was also the first UK company to introduce cashless transactions. Australasia: In Queensland, the Company supports the Oxley Creek Catchment Association, participating in a range of community events, including native species tree planting, rubbish removal, weed clearing and water sampling with the help of Watson Road Primary School children. |
O P E R AT I O N A L & F I N AN C I A L R E V I E W
Financial Review
REVENUE
Sales revenue of $7,193.0 million in FY13 was down 20% compared to FY12. The decrease in sales revenue was due to lower average ferrous and non-ferrous scrap prices as well as lower sales volumes which decreased 12% versus FY12.
EARNINGS
Statutory NPAT was a loss of $466.1 million. underlying NPAT was $17.1 million, 77% lower than FY12. The principal difference between the statutory and underlying results is accounted for by goodwill impairment charges taken primarily in the first half of FY13. Statutory EBITDA for FY13 was a loss of $41.5 million, 123% lower than FY12. Underlying EBITDA of $191.4 million was 24% lower than FY12. The decline in underlying EBITDA was primarily due to weak business conditions, especially in Europe, leading to intensified competition for the limited supply of unprocessed raw materials. Additionally, lower non-ferrous and precious metal prices negatively impacted the global SRS e-recycling business, decreasing the value of processed material and compressing margins.These adverse impacts were partially offset by improving sales margins in North America and lower underlying controllable costs of $44.9 million versus FY12.
RECONCILIATION OF STATUTORY NPAT TO EBITDA
| | | | | | | | |
| A$m | | FY13 | | | FY12 | |
Net Loss after tax | | | (466.1 | ) | | | (622.5 | ) |
Goodwill and intangible impairment charges | | | 304.4 | | | | 618.1 | |
Impairment of goodwill in jointly controlled entity | | | – | | | | 57.5 | |
Depreciation and amortisation | | | 123.5 | | | | 129.9 | |
Interest expense, net | | | 17.6 | | | | 21.2 | |
Income tax benefit | | | (20.9 | ) | | | (22.0 | ) |
EBITDA | | | (41.5 | ) | | | 182.2 | |
Depreciation and amortisation declined by $6.4 million to $123.5 million, while net interest expense decreased by $3.6 million to $17.6 million in FY13. The reduction in net interest expense reflects the decline in net debt during the period.
Statutory loss per share decreased to a loss of 228.1 cents from a loss of 302.4 cents in FY12. Underlying earnings per share decreased by 77% to 8.3 cents. Net debt as at 30 June 2013 was $153.8 million, a reduction of $138.4 million from 30 June 2012.
The Company’s dividend policy is to distribute 45% to 55% of NPAT, subject to the Board’s discretion. In the absence of statutory NPAT, after looking through goodwill impairment, the Company determined not to pay a final dividend for FY13. The Company’s dividend policy remains unchanged.
CASH FLOW AND BORROWINGS
Cash flow from operating activities of $297.3 million in FY13 increased by $7.7 million versus FY12 due to lower working capital, and lower net interest and tax payments.
Working capital decreased compared with 30 June 2012. Inventory and trade and other receivables decreased by $266.7 million and $67.5 million respectively, while trade and other payables decreased by $131.1 million.
Capital expenditures were $149.0 million during FY13. Significant capital projects included:
| • | | New England metals recycling footprint build out of three greenfield facilities centered around Providence, Rhode Island including: a non-ferrous yard at Fields Point, a yard and shredder in Johnston, and an export facility at Providence port. All facilities are due to be fully operational in first half FY14. |
| • | | NYC Municipal Recycling, with the Brooklyn based facility scheduled to be complete in first half FY14. |
Net debt decreased by $138.4 million, to $153.8 million, bringing gearing to 7.4% of total capitalisation as at 30 June 2013. Net debt equals total borrowings minus cash balances and reflects total borrowings as if borrowings were reduced by cash balances as a pro forma measurement as follows:
| | | | | | | | |
| | | AS AT 30 JUNE | |
| A$m | | 2013 | | | 2012 | |
Total borrowings | | | 200.7 | | | | 343.6 | |
Less: cash and cash equivalents | | | (46.9 | ) | | | (51.4) | |
Net debt | | | 153.8 | | | | 292.2 | |
Plus: total equity | | | 1,928.8 | | | | 2,283.7 | |
Total capital | | | 2,082.6 | | | | 2,575.9 | |
| | |
Gearing ratio | | | 7.4% | | | | 11.3% | |
The Group’s strong cash flow and balance sheet position provides the capacity to fund the ongoing operational requirements of the business, as well as potential increased working capital requirements as and when underlying business conditions improve. In response to current weak global economic growth, maintaining low gearing is a focus of the Company.
RECONCILIATION OF STATUTORY RESULTS TO UNDERLYING RESULTS
FOR THE YEARS ENDED 30 JUNE 2013 AND 2012
| | | | | | | | | | | | | | | | | | | | | | | | |
| | | EBITDA1 | | | EBIT | | | NPAT | |
| | | FY13 | | | FY12 | | | FY13 | | | FY12 | | | FY13 | | | FY12 | |
| | | A$m | | | A$m | | | A$m | | | A$m | | | A$m | | | A$M | |
Statutory Results | | | (41.5 | ) | | | 182.2 | | | | (469.4 | ) | | | (623.3 | ) | | | (466.1 | ) | | | (622.5 | ) |
| | | | | | |
Significant items: | | | | | | | | | | | | | | | | | | | | | | | | |
Goodwill impairment | | | N/A2 | | | | N/A2 | | | | 292.2 | | | | 617.3 | | | | 261.9 | | | | 601.6 | |
Other intangible asset impairment | | | N/A2 | | | | N/A2 | | | | 12.2 | | | | 0.8 | | | | 8.9 | | | | 0.5 | |
Impairment of goodwill in a jointly controlled entity | | | – | | | | N/A2 | | | | – | | | | 57.5 | | | | – | | | | 50.8 | |
Impairment of investment in CTG | | | 14.9 | | | | – | | | | 14.9 | | | | – | | | | 14.9 | | | | – | |
Fixed asset impairment | | | 61.2 | | | | – | | | | 61.2 | | | | – | | | | 54.7 | | | | – | |
Write-down of equipment spares | | | 5.1 | | | | – | | | | 5.1 | | | | – | | | | 5.1 | | | | – | |
Natural disaster expenses, net of insurance recoveries | | | 4.3 | | | | (2.7 | ) | | | 4.3 | | | | (2.7 | ) | | | 2.7 | | | | (1.8 | ) |
Impairment of a loan receivable | | | 4.8 | | | | – | | | | 4.8 | | | | – | | | | 3.0 | | | | – | |
UK inventory write-downs | | | 63.9 | | | | 48.0 | | | | 63.9 | | | | 48.0 | | | | 63.9 | | | | 41.3 | |
Inventory adjustments to net realisable value | | | 6.0 | | | | 21.3 | | | | 6.0 | | | | 21.3 | | | | 4.9 | | | | 13.9 | |
Write-down of CTG derivatives and equity accounted losses | | | 21.3 | | | | 1.2 | | | | 21.3 | | | | 1.2 | | | | 21.3 | | | | 1.2 | |
Lease settlements/onerous leases | | | 13.1 | | | | – | | | | 13.1 | | | | – | | | | 9.7 | | | | – | |
Redundancies | | | 7.3 | | | | 9.9 | | | | 7.3 | | | | 9.9 | | | | 5.0 | | | | 6.6 | |
Settlement of disputes with third parties | | | 4.7 | | | | 12.8 | | | | 4.7 | | | | 12.8 | | | | 4.7 | | | | 7.9 | |
Final settlement of a business arrangement | | | – | | | | 7.9 | | | | – | | | | 7.9 | | | | – | | | | 4.9 | |
Share-based compensation expense related to former CEO3 | | | 3.4 | | | | – | | | | 3.4 | | | | – | | | | 2.1 | | | | – | |
Yard closure/dilapidations | | | 8.5 | | | | – | | | | 8.5 | | | | – | | | | 7.2 | | | | – | |
Credit losses | | | 2.9 | | | | 4.4 | | | | 2.9 | | | | 4.4 | | | | 2.0 | | | | 2.7 | |
Pension plan special charges | | | – | | | | 3.0 | | | | – | | | | 3.0 | | | | – | | | | 1.9 | |
Transaction and other legal costs | | | 3.1 | | | | 2.5 | | | | 3.1 | | | | 2.5 | | | | 2.4 | | | | 1.8 | |
Loss on sale of business divisions | | | 10.1 | | | | – | | | | 10.1 | | | | – | | | | 10.0 | | | | – | |
Commercial settlements | | | (3.3 | ) | | | (1.4 | ) | | | (3.3 | ) | | | (1.4 | ) | | | (2.7 | ) | | | (1.1 | ) |
Loss/(gain) on sale of jointly controlled assets and entities | | | 1.6 | | | | (35.7 | ) | | | 1.6 | | | | (35.7 | ) | | | 1.5 | | | | (35.7 | ) |
Underlying results4 | | | 191.4 | | | | 253.4 | | | | 67.9 | | | | 123.5 | | | | 17.1 | | | | 74.0 | |
| 1 | EBITDA is a measurement of non-conforming financial information. |
| 2 | N/A indicates that EBITDA is calculated to exclude impairment of goodwill and other identified intangible assets in the presentation of both the statutory and underlying results. |
| 3 | Represents expense associated with good leaver determination for the former CEO with respect to long-term incentive plans. |
| 4 | Underlying result is a non-IFRS measure that is presented to provide an understanding of the underlying performance of the Group. The measure excludes the impacts of impairments, disposals as well as items that are subject to significant variability from one period to the next. The non-IFRS financial information is unaudited however the reconciling items above (before tax) have been extracted from the audited financial statements. |
C O R P O R A T E G O V E R N A N C E S T A T E M E N T
The directors and management of Sims Metal Management (the “Company” or the “Group”) are committed to operating the Company’s business ethically and in a manner consistent with high standards of corporate governance. The directors consider the establishment and implementation of sound corporate governance practices to be a fundamental part of promoting investor confidence and creating value for shareholders, through prudent risk management and a culture which encourages ethical conduct, accountability and sound business practices. The Corporate Governance Statement of the Company for the 2013 financial year has been prepared with reference to the Australian Securities Exchange (ASX) Corporate Governance Principles and Recommendations (including 2010 Amendments) (Recommendations). The Company has complied with the Recommendations.
PRINCIPLE 1: LAY SOLID FOUNDATIONS FOR MANAGEMENT AND OVERSIGHT
1.1 BOARD OF DIRECTORS
The board is responsible for the corporate governance and overall performance of the Company and the Group and for providing strategic guidance for the Group. The responsibilities of the board encompass the setting of key objectives, monitoring performance and ensuring the Group’s internal control, risk management and reporting procedures are adequate and effective.
1.2 THE ROLE AND RESPONSIBILITIES OF THE BOARD AND SENIOR EXECUTIVES
The role and responsibilities of the board are formally set out in its charter. The board charter identifies the functions reserved for the board and those delegated to senior executives.
The board’s key responsibilities include:
| – | overall corporate governance of the Group, including oversight of its control and accountability systems; |
| – | appointing, removing and appraising the performance of the Group Chief Executive Officer (CEO); |
| – | monitoring performance of senior management and the implementation of strategy, and ensuring appropriate resources are available; |
| – | enhancing and protecting the reputation of the Company by reviewing and ratifying systems of risk management and internal compliance and control, codes of conduct, and legal compliance; and |
| – | approving and monitoring the progress of major capital expenditure, capital management, acquisitions and divestitures, and financial and other reporting. |
The board has delegated general authority to manage the businesses of the Company to the CEO, who in turn may delegate functions to other senior management. However, the CEO remains answerable to the board and must comply with any limits on his authority established by the board from time to time. Effective 1 July 2013 the board has created a Global Leadership Team to serve in lieu of the CEO while a search is accomplished to appoint a new CEO.
Letters of appointment have been provided to all non-executive directors, covering responsibilities, time commitments, performance evaluation, indemnity and insurance arrangements, and induction and development. The responsibilities and terms of employment of certain senior executives of the Group are also set out in formal contracts of employment.
1.3 PERFORMANCE EVALUATION OF SENIOR EXECUTIVES
Annual performance objectives are set each financial year for all senior executives of the Group. These performance objectives include both financial and non-financial measures. A year-end appraisal is conducted to assess performance against the executive’s personal priorities and the responsibilities and demands of their role. The outcome of the performance review process is reflected in training and development/executive coaching programs, as needed, and succession planning for each executive, as well as an annual remuneration review. For the 2013 financial year, annual performance reviews were completed in August 2013, in accordance with the process disclosed.
The Remuneration Report on pages 38 to 56 contains further information regarding the process for evaluating the performance of senior executives for the purpose of determining their fixed and variable remuneration.
1.4 EXECUTIVE INDUCTION PROGRAMS
Senior executives are able to attend formal induction programs which provide an overview of the Group, and its key policies and processes. Meetings are arranged with other senior executives in the Group to brief the new executives on the Group’s businesses, strategic objectives, risk management practices and other information necessary to meet the requirements of their roles. Site visits are also arranged to familiarise the executives with the Group’s operations and key operating personnel.
A copy of the board charter is available from the corporate governance section on the Company’s website.
PRINCIPLE 2: STRUCTURE THE BOARD TO ADD VALUE
2.1 COMPOSITION OF THE BOARD
The board charter sets out the composition of the board and relevant criteria for assessing the independence of directors.
The board currently comprises nine non-executive directors. The CEO, the one executive director, retired on 30 June 2013 and a replacement is to be appointed. Mr Robert Bass was appointed a non-executive director on 10 September 2013. Details of board members, including their skills, experience, qualifications and terms in office, are set out on pages 36 and 37.
2.2 BOARD ACCESS TO INFORMATION AND INDEPENDENT ADVICE
A director may, at the Company’s expense and subject to prior approval of the Chairperson, obtain independent professional advice relating to his or her duties and obligations as a board member. Board committees may also seek such independent professional advice. To the extent required to enable them to carry out their duties, all directors and board committees also have access to Company information and records and may consult senior management as required.
2.3 INDEPENDENCE OF DIRECTORS
The board charter states that board members shall be considered independent if they do not have any of the relationships identified in Box 2.1 of the Recommendations, and have been determined by the board to be independent, as defined in and to the extent required by the applicable rules of the United States Securities and Exchange Commission (SEC), the listing standards of the New York Stock Exchange, Inc. (NYSE) and other applicable laws and regulations, as they may be amended from time to time.
Having regard to these criteria, the board has determined that Mrs Heather Ridout and Messrs Gerald Morris, Norman Bobins, Christopher Renwick, Geoffrey Brunsdon, Jim Thompson, and John DiLacqua were independent non-executive directors of the Company during the 2013 financial year, and that recently appointed Mr Robert Bass is an independent non-executive director. Mr Daniel Dienst, the former CEO, was an executive director of the Company during the 2013 financial year.
Mr Tom Sato, a non-executive director, is not considered to be an independent director of the Company as a result of his association with Mitsui & Co., Ltd, which, through its affiliates, owns an 18% shareholding in the Company.
In accordance with Recommendation 2.1, the board has a majority of directors who are independent.
The independence of the directors is regularly reviewed. In accordance with the board charter, all directors must disclose to the board any actual or perceived conflicts of interest, whether of a direct or indirect nature, of which the director becomes aware and which the director reasonably believes may compromise the reputation or performance of the Company.
2.4 CHAIRPERSON
Mr Geoffrey Brunsdon, an independent non-executive director, has held the position of Chairperson of the board since 1 March 2012.
The roles of CEO of the Company and Chairperson of the board are separate, and the Chairperson must not also be the CEO. The Chairperson is responsible for the leadership of the board, establishing the agenda for board meetings, ensuring the board is effective, and chairing board and shareholders’ meetings.
2.5 BOARD PROCESSES
The board charter provides that the board shall meet at least four times per year, and otherwise as it considers necessary. The board met nine times during the 2013 financial year, including three times for full briefing sessions. Details of directors’ attendances at board meetings in the 2013 financial year are reported on page 33.
To assist directors in enhancing their understanding of the Company’s business, directors are briefed from time to time by members of the executive team on divisional performance and key operational and strategic issues, financial matters, risk management, market conditions, compliance and governance. The directors are also provided with an explanation of those proposed activities of the Group which require board approval.
The Group Company Secretary is responsible for ensuring that board procedures and policies are followed, and provides advice to the board on corporate governance and regulatory matters. All directors have unrestricted access to the advice and services of the Group Company Secretary.
2.6 BOARD COMMITTEES
The board has established five board committees to assist in the execution of board functions. Each committee has a written charter which is approved by the board and reviewed periodically. The charters of each of the board committees are available on the Company’s website.
Membership of the board committees is set out in the biographies of directors on pages 36 and 37.
Details of directors’ attendance at each committee meeting in the 2013 financial year are set out on page 33.
To enable each of the committees to discharge its responsibilities adequately and effectively, each committee has the authority to retain advisers and external legal counsel as required.
Each committee reports to the board and, following preparation of the minutes of each committee meeting, provides the board with copies of those minutes at the next occasion the board meets.
2.7 NOMINATION/GOVERNANCE COMMITTEE
The Nomination/Governance (Nom/Gov) Committee is responsible for recommending nominees for membership of the board in accordance with the committee’s Policy and Procedures for the Selection and Appointment of New Directors and the Re-election of Incumbent Directors. The Nom/Gov Committee also assesses necessary and desirable competencies of board members.
The Nom/Gov Committee is also responsible for reviewing the corporate governance procedures of the Company and recommending changes to the board as appropriate; developing a plan for board succession, including the succession of the Chairperson of the board and the CEO of the Company, and monitoring succession plans for the Company’s management levels and key resources; and establishing procedures for and overseeing the evaluation of the board.

C O R P O R A T E G O V E R N A N C E S T A T E M E N T
When considering the mix of skills and diversity which the board is looking to achieve in its membership, the Nom/Gov Committee takes into account the need to have members with relevant industry experience; expertise in particular fields such as financial, human resources and health & safety; and the broad skillset and experience required to effectively serve on the board of a global organisation.
The Nom/Gov Committee has a formal charter, a copy of which is available from the corporate governance section on the Company’s website, approved by the board.
COMPOSITION
The Nom/Gov Committee shall comprise at least three directors of the Company, with a majority being independent. The current members of the Nom/Gov Committee are Mrs Heather Ridout and Messrs Norman Bobins (Chairperson), Gerald Morris, and Christopher Renwick, all being independent non-executive directors. Mr Daniel Dienst, the former CEO, was a member of the Nom/Gov Committee during the 2013 financial year. The board may appoint additional directors to the Nom/Gov Committee or remove and replace members of the Nom/Gov Committee by resolution. The Nom/Gov Committee Chairperson shall not be the Chairperson of the board.
MEETINGS OF THE NOMINATION/GOVERNANCE COMMITTEE
The committee charter provides that the Nom/Gov Committee shall meet at least twice each year on a formal basis and additionally as circumstances may require. The Nom/Gov Committee met four times during the 2013 financial year. Details of attendance at meetings of the Nom/Gov Committee are set out on page 33.
2.8 BOARD PERFORMANCE EVALUATION
The Nom/Gov Committee is responsible for establishing procedures and overseeing the evaluation of the board. A formal performance evaluation was conducted involving the directors self-assessing the collective performance of the board. As part of the review process, directors were also asked to assess the board’s composition and structure, and any areas where the effectiveness of the board could be improved. The results of the evaluation, and individual committee assessments, were independently documented and will form the basis for the development of appropriate action plans under the guidance of the Nom/Gov Committee for the 2014 financial year.
2.9 RETIREMENT AND RE-ELECTION OF DIRECTORS
The Nom/Gov Committee considers and nominates to the board candidates for election as directors. The Company’s constitution requires that non-executive directors appointed by the board during the year must offer themselves for election by shareholders at the next Annual General Meeting of the Company. In addition, a non-executive director may not serve without seekingre-election beyond the third Annual General Meeting following the meeting at which the director was last elected or re-elected, or three years, whichever is longer. At least one director, other than the CEO, must retire at each Annual General Meeting. Retiring directors may offer themselves for re-election by the shareholders. The board does not impose a predetermined restriction on the tenure of directors as it considers that this restriction may result in the loss of vital experience and expertise.
2.10 DIRECTOR EDUCATION
A new board member orientation process has been established to provide new directors with an understanding of, and insight into, the industry, Company, management and control environment of the Group. As part of this process, directors receive orientation materials, meet with key senior executives and are given the opportunity to conduct site visits at significant operational facilities. Directors may, from time to time, depending on their particular needs, experience and interests, undertake external education seminars and programs at the expense, and with the approval, of the Company. As part of on-going director education, board meetings are held at various Group locations from time to time during the year which provides directors the opportunity to observe activities at each of the businesses.
PRINCIPLE 3: PROMOTE ETHICAL AND RESPONSIBLE DECISION-MAKING
3.1 CODE OF CONDUCT
The Company’s Code of Conduct applies to all directors, officers and employees of the Group. It underpins Sims Metal Management’s commitment to integrity, fair dealing and compliance with the law in its business affairs, and sets out expected standards of conduct with respect to all stakeholders, including fellow employees, customers, suppliers, shareholders and the community.
The Code of Conduct is designed to encourage ethical and appropriate behaviour by all Group personnel, and addresses a wide range of responsibilities to stakeholders, including conflicts of interest, security of information, use of Company assets and resources, discrimination and harassment, occupational health and safety, and the prohibition of corrupt conduct and the consequences in the event thereof.
The Code of Conduct encourages employees to raise any matters of concern without fear of retribution. The Company has implemented the Sims Metal Management Hotline to enable employees, customers, contractors and the like to report misconduct or unethical behaviour within the Group to an external third party. The Company also conducts employee education and compliance programs on a regular basis to help ensure compliance with various laws around the world.
3.2 ANTI-CORRUPTION CODE
In addition to the Code of Conduct, the Company has adopted an Anti-Corruption Code which has been developed to aid employees, agents, contractors, consultants and partners in ensuring that they comply at all times with applicable anti-corruption laws and policies. Among other matters, the Code of Conduct sets out the Company’s policy in relation to conflicts of interests, gifts and hospitality, relationships with governments and political contributions.
Copies of the Company’s Code of Conduct and Anti-Corruption Code are available from the corporate governance section on the Company’s website.
3.3 DEALING IN COMPANY SECURITIES
Directors and employees of the Group are bound by the Company’s policy on dealing in the securities of the Company. Under the policy, directors, senior executives and other ‘designated persons’ may only buy or sell Company securities during the period 24 hours to 28 days after the release of the Company’s yearly and half-yearly results announcements and the filing of the Company’s Form 20-F with the SEC, or during such period following the conclusion of the Company’s Annual General Meeting, or during the currency of any capital raising prospectus issued by the Company or takeover bid for the Company.
A copy of the Company’s policy titled ‘Dealing in Sims Metal Management Limited Securities’ is available from the corporate governance section on the Company’s website.
3.4 DIVERSITY
Sims Metal Management recognises the value and advantages of having a diversified workforce that reflects the diversity of the communities in which it operates. Accordingly, the Company has adopted a Workplace Diversity Policy, a copy of which can be found on the Company’s website. This policy is designed to support the Company’s organisational core values of respect, integrity and teamwork. The board has responsibility for establishing and monitoring the Company’s overall diversity strategy and policy. The board’s Nom/Gov Committee has responsibility for monitoring the effectiveness of this policy to the extent it relates to board diversity and for reviewing and recommending any updates to this policy as deemed necessary. The board’s Remuneration Committee has an overarching role to establish measurable objectives for achieving diversity, and to assess annually, both the objectives and the Company’s progress in achieving them. The following table shows the objectives in relation to gender diversity that were established for the 2013 financial year and the progress made towards achieving them.
| | | | |
| OBJECTIVE | | PROGRESS |
| 1. | | In accordance with the Global Gender Diversity Plan (Diversity Plan), deliver leadership diversity training to global managers/supervisors. | | Achieved and ongoing. |
| 2. | | Increase female participation at the Senior Management and Executive levels. | | Progress made. The percentage of female participation at the Senior Management level increased from 12% in the 2012 financial year to 14% in the 2013 financial year. The percentage of female participation at the Executive level was 11%, the same as the previous year. |
| 3. | | Following the appointment of a female director in calendar 2011 consider, as retirements permit, appointing at least one further female director within the ensuing two calendar years. | | The reduction in Board size has meant no additional female directors have been appointed in calendars 2012 and 2013. As director retirements permit, further consideration will be given to such an appointment. |
| 4. | | Consider age, cultural and ethnicity issues within the context of the Diversity Plan. | | Action underway in the 2013 financial year. |
| 5. | | Conduct a review of benefits and workplace practices to identify and remove diversity biases, including evaluating current diversity friendly benefits such as maternity leave, and considering additional programs like mentoring and flexible working arrangements for appropriate roles. | | Action underway in the 2013 financial year. |
| 6. | | Establish diversity objectives as part of an executive’s short term incentive personal priorities. | | To achieve by the 2014 financial year. |
| 7. | | Increase the percentage of women recruited into our management trainee, graduate and cadet programs to 25%. | | To achieve by the 2014 financial year. |
As at the end of the 2013 financial year, the proportion of women employees in the whole organisation and in senior executive positions was 18% and 11% respectively. There is one female director on the Company’s board.
C O R P O R A T E G O V E R N A N C E S T A T E M E N T
PRINCIPLE 4: SAFEGUARD INTEGRITY IN FINANCIAL REPORTING
The Chairman and the Group Chief Financial Officer (CFO) have stated in writing to the board in respect of the 2013 financial year:
| – | that the Company’s financial reports present a true and fair view, in all material respects, of the Company’s financial condition and operational results and are in accordance with relevant accounting standards; and |
| – | with the exception of the matters referred to below, that the above statement is founded on a sound system of risk management and internal compliance and control which implements the policies adopted by the board and that the Company’s risk management and internal compliance and control system is operating efficiently and effectively in all material respects. |
During the 2013 financial year the Company restated its prior financial statements for the 2010, 2011 and 2012 financial years due to inventory misstatements in the United Kingdom (UK). In the restatement, the Company identified three material weaknesses within internal controls over financial reporting in the following areas: segregation of duties within the inventory cycle of the UK operations were improper; UK management did not maintain effective period end controls; and UK management failed to perform proper valuation analyses on its inventories.
As at 30 June 2013, the Company has reassessed the internal controls over financial reporting. The Company determined that the material weaknesses relating to segregation of duties within the inventory cycle and the period end controls, both related to the UK operations, have been fully remediated. The material weakness related to inventory valuation in the UK SRS business has also been remediated as of period end by the implementation of new controls. However, those controls were not operating for a sufficient period of time before 30 June 2013 to consider the material weakness closed. Additionally, a new material weakness arose in aggregation across the Group relating to period end management review of journal entries. Management has planned remediation of the material weakness that relates to manual journal entry review through specific delegation of responsibility for reviewing manual journal entries during the 2014 financial year.
4.1 RISK, AUDIT & COMPLIANCE COMMITTEE
The Risk, Audit & Compliance (RAC) Committee assists the board in fulfilling its responsibility to oversee the quality and integrity of accounting, auditing and reporting practices of the Company. In particular, the primary role of the RAC Committee is to assist the board in fulfilling its corporate governance and oversight responsibilities in relation to the Company’s accounting and financial reporting, internal control structure, risk management systems (including the review of risk mitigation, which includes commercial insurance coverage), internal and external audit functions, and compliance with legal and regulatory requirements.
The RAC Committee has a formal charter approved by the board. The RAC Committee reports to the board on all matters relevant to the RAC Committee’s role and responsibilities. The specific functions of the RAC Committee are set out in its charter and include:
| – | reviewing and assessing the internal and external reporting of financial information; |
| – | assessing management processes supporting the integrity and reliability of the Company’s financial and management reporting systems and its external reporting; |
| – | overseeing the relationship with and performance of the external auditor and assessing the independence of the external auditor; and |
| – | overseeing the performance of the internal audit function. |
The RAC Committee charter establishes a framework for the RAC Committee’s relationship with the internal and external auditor, and a policy has been adopted for the selection and appointment of the external auditor and for rotation of external audit engagement partners.
A copy of the RAC Committee charter is available from the corporate governance section on the Company’s website.
4.2 COMPOSITION
The RAC Committee charter provides for the RAC Committee to have at least three members, all of whom must be non-executive independent directors. The current members of the RAC Committee are Mrs Heather Ridout and Messrs Gerald Morris (Chairperson), Geoffrey Brunsdon, John DiLacqua, and Robert Bass, all of whom are non-executive independent directors. Further, all members must be financially literate, and at least one member must have accounting or related financial management expertise. These requirements are satisfied. Under the RAC Committee charter, a director may not be both the Chairperson of the RAC Committee and the Chairperson of the board.
4.3 MEETINGS OF THE RAC COMMITTEE
In accordance with its charter, the RAC Committee is required to meet at least four times each year on a formal basis, and holds additional meetings as necessary. Meetings are attended by invitation by the other directors, the CEO, the CFO, other members of management, including the General Counsel, internal auditors and the external auditor, PricewaterhouseCoopers (PwC). The RAC Committee met seven times during the 2013 financial year. Details of attendance at meetings of the RAC Committee are set out on page 33.
4.4 EXTERNAL AUDITOR
The external auditor is responsible for planning and carrying out the audit of the Group’s annual financial reports and reviewing the Group’s half-yearly financial reports. The auditor provides a written confirmation to the Company of its independence in connection with the Company’s financial reports for each half-year and financial year.
The external auditor, PwC, was appointed in 1991. The lead external audit engagement partner at PwC is next due for rotation after the 2017 financial year.
The RAC Committee may meet with the external auditor without management being present at any time during each financial year. The external auditor is also provided with the opportunity, on request, to meet with the board of directors without management being present.
The Company has adopted a policy titled “Procedures for the Selection and Appointment of the External Auditors and for the Rotation of External Audit Engagement Partners”, a copy of which is available from the corporate governance section on the Company’s website.
4.5 INTERNAL AUDITORS
The RAC Committee has the responsibility for overseeing the development and execution of the internal audit plan. The Vice President of Internal Audit reports directly to the RAC Chairperson. The RAC Committee can appoint, hire, and reassign the Vice President of Internal Audit with a recommendation to the board.
PRINCIPLE 5: MAKE TIMELY AND BALANCED DISCLOSURE
5.1 CONTINUOUS DISCLOSURE
The Company is committed to ensuring that the market and its shareholders are provided with complete and timely information. The Company has adopted a Market Disclosure Policy, supplemented by specific procedures, to ensure that it complies with the continuous disclosure obligations imposed by the ASX, and with its disclosure obligations under the rules and regulations of the SEC and the NYSE. A copy of the policy is available from the corporate governance section on the Company’s website.
The Company has formed a Disclosure Committee which, during the 2013 financial year, comprised the CEO (as Chairperson), the CFO and the Group Company Secretary. The committee has a formal charter approved by the board. The primary role of the committee is to manage the Company’s compliance with its continuous disclosure obligations by implementing reporting processes and controls and determining guidelines for the release of disclosable information.
The Group Company Secretary has been appointed as the person responsible for communications with the ASX, SEC and NYSE, which includes overseeing and co-ordinating information disclosure to the ASX, SEC and NYSE.
All announcements provided to the ASX are posted on the Company’s website as soon as practicable after release to the market.
5.2 COMMENTARY ON FINANCIAL RESULTS AND PERIODIC DISCLOSURE
Sims Metal Management strives to provide investors with sufficient information to make an informed assessment of the Company’s activities and results. Results announcements and media/analyst presentations are released to the ASX, SEC and NYSE and made available on the Company’s website. The Annual Report contains an operating and financial review to assist shareholders in evaluating the Company’s operating results, business strategies, prospects and financial position.
PRINCIPLE 6: RESPECT THE RIGHTS OF SHAREHOLDERS
6.1 COMMUNICATION WITH SHAREHOLDERS
The Company has adopted a statement on communication with shareholders which is designed to promote effective communication with shareholders and to encourage informed shareholder participation at the Annual General Meeting. A copy of the statement is available from the corporate governance section on the Company’s website.
Where practical, the Company uses technology to facilitate communication with shareholders. The Company’s website includes links to announcements to the ASX and copies of the annual and half-yearly reports, notices of meetings, presentations and other information released to the market. By registering with the Company’s registrar, shareholders can receive email notifications when the Company makes an announcement to the ASX, including the release of financial reports. Sims Metal Management’s Annual Report currently remains one of the principal means of communicating with shareholders. The Company also files an annual report on Form 20-F with the SEC.
The Company continues to review and enhance its website and to consider other ways to utilise technology to improve shareholder communication. Webcasts of results briefings allow access by all interested parties.
6.2 SHAREHOLDER MEETINGS
Shareholders have the opportunity to raise matters with the members of the board at the Company’s Annual General Meeting. The external audit firm Group lead partner in charge of the Sims Metal Management audit also attends the Annual General Meeting and is available to answer questions from shareholders on audit-related matters.
PRINCIPLE 7: RECOGNISE AND MANAGE RISK
7.1 RISK MANAGEMENT FRAMEWORK
The board recognises that the effective management of risk is essential to achieving the Group’s objectives of maximising Group performance and creating long-term shareholder value while meeting its commitments to other stakeholders, including its employees, customers and the wider community.
C O R P O R A T E G O V E R N A N C E S T A T E M E N T
The Company has adopted a Risk Management Policy and a statement on internal compliance and control systems.
The board is responsible for ensuring that there are adequate policies in place with respect to risk management. The board and senior management are responsible for determining the level of risks acceptable to Sims Metal Management.
To help ensure all risks relevant to the Company are considered, a systematic approach to risk identification is followed. Identifiable risk areas which are considered include:
| – | maintaining a safe work environment for the Company’s employees; |
| – | the safeguarding and efficient use of assets; |
| – | management of human resources; |
| – | ensuring the Company complies with its environmental obligations; |
| – | achieving established objectives and goals; |
| – | the reliability and integrity of financial and operational information; |
| – | compliance with internal policies and procedures; |
| – | compliance with laws and regulations; and |
| – | changes in the Company’s internal and external environments. |
Further details of risks that the Company believes are material to its business operations are referred to in its annual report on 20-F filed with the SEC, a copy of which is available on the Company’s website.
Measures of consequence and likelihood have been determined and are used on a consistent basis.
The Company’s primary risk assessment process comprises a comprehensive annual risk review.
The board is responsible, on the recommendations of the RAC Committee, for ensuring that there are adequate policies in place in relation to internal control systems over financial reporting. The board places considerable importance on maintaining a strong internal control environment. The internal control system is based upon written procedures, policies, guidelines, job descriptions and organisational structures that provide an appropriate division of responsibility. It also relies upon the careful selection and training of key personnel.
Internal control systems are reviewed on an ongoing basis to ensure that the systems are updated to reflect changes in Sims Metal Management’s operations and the environment in which the Company operates. The Company has detailed written documentation covering critical areas. Internal Audit carries out regular systematic monitoring of control activities and reports to the RAC Committee and senior management. In the 2013 financial year, the Company validated its internal controls over financial reporting as required under the Sarbanes-Oxley Act of 2002. During the 2013 financial year the Company concluded that there were three material weaknesses in internal controls over financial reporting that contributed to a requirement to restate its financial statements for the 2010, 2011 and 2012 financial years.
An internal audit plan is prepared, with input from the RAC Committee and senior management, annually by the Vice President of Internal Audit. This annual internal audit plan takes into consideration the findings of an annual risk assessment report prepared by senior management. The RAC Committee approves this annual internal audit plan.
Sustainability reporting is part of, and is integrated into, the Group’s risk management framework. The CEO has overall responsibility for Group sustainability matters, and a number of initiatives have been implemented to better enable the Group to measure, monitor and report on its sustainability performance.
SAFETY, HEALTH, ENVIRONMENT & COMMUNITY COMMITTEE
The board has established a Safety, Health, Environment & Community (SHEC) Committee.
The primary role of the SHEC Committee is to provide additional focus and advice to the board on key SHEC issues and to assist the board to fulfil and discharge its SHEC obligations.
The SHEC Committee shall comprise at least three directors of the Company, of whom at least one shall be independent. The SHEC Committee is composed of Mrs Heather Ridout and Messrs Jim Thompson (Chairperson), Christopher Renwick, and Tom Sato. Mr Daniel Dienst, the former CEO, was a member of the SHEC Committee during the 2013 financial year.
The SHEC charter provides that the SHEC Committee shall meet at least four times each year and as required. The SHEC Committee met four times during the 2013 financial year. Details of attendance at meetings of the SHEC Committee are set out on page 33.
FINANCE & INVESTMENT COMMITTEE
The board has established a Finance & Investment (FIC) Committee. The primary role of the FIC Committee is to review, advise and report to the board on the management of the Company’s financial resources and invested assets, shareholder dividend policy and shareholder dividends, the Company’s capital plan and capital position, debt levels, hedging policies and other financial matters. The FIC Committee also reviews broad investment policies and guidelines for the Group and makes recommendations to the board.
The FIC Committee shall comprise at least three directors of the Company, of whom at least one shall be independent. The FIC Committee is composed of Messrs John DiLacqua (Chairperson), Geoffrey Brunsdon, Tom Sato, Norman Bobins, and Jim Thompson. Mr Daniel Dienst, the former CEO, was a member of the FIC Committee during the 2013 financial year.
The FIC charter provides that the FIC Committee shall meet at least twice each year and as required. The FIC Committee met thirteen times during the 2013 financial year. Details of attendance at meetings of the FIC Committee are set out on page 33.
FINANCIAL REPORTING AND INTERNAL CONTROLS
The board has responsibility for reviewing and ratifying internal compliance and control systems.
The RAC Committee reviews the effectiveness and adequacy of internal control processes relating to financial reporting on a regular basis and reports its findings to the board.
Management assumes the primary responsibility for implementing internal controls and for the internal control environment. In accordance with the Company’s policy, each regional President and regional Chief Financial Officer reports every six months to the CEO and the CFO and, if any exceptions, to the RAC Committee, on the operation and effectiveness of key internal controls. Any identified deficiencies in internal controls are followed up and addressed by division management.
In addition, the Company maintains an internal audit function to conduct internal audits and reviews of the Group’s operations.
The RAC Committee reviews the reports from the internal audit function on a regular basis, monitors its scope and resources, and approves the annual internal audit plan.
The Company monitors its control system on a continual basis and, where appropriate, enhances internal control processes to improve their effectiveness.
7.2 RISK MANAGEMENT ASSURANCE
The Chairperson and the CFO have stated in writing to the board in respect of the 2013 financial year that the Company’s financial reports present a true and fair view, in all material respects, of the Company’s financial condition and operational results and are in accordance with relevant accounting standards.
The board has also received a written statement of assurance from the Chairperson and the CFO that, in respect of the 2013 financial year, to the best of their knowledge and belief:
| 1. | the declaration provided in accordance with section 295A of theCorporations Act 2001 is founded on a sound system of risk management and internal compliance and control which, in all material respects, implements the policies adopted by the board; and |
| 2. | the Group’s risk management and internal compliance and control system for the financial year is operating effectively in all material respects in relation to financial reporting risks. |
Due to the geographic spread of the Group’s operations and the extensive delegation of authority and responsibility granted to senior business unit management, the Chairperson and the CFO, when attesting to the adequacy of the Company’s risk management and internal compliance and control system, rely significantly upon internal audit and the control certification reports received from each regional President and regional Chief Financial Officer regarding compliance with the various risk management, compliance and internal control policies and procedures in the region for which each is responsible.
PRINCIPLE 8: REMUNERATE FAIRLY AND RESPONSIBLY
8.1 REMUNERATION COMMITTEE
The primary role of the Remuneration Committee (Remco) is to support and advise the board on the implementation and maintenance of coherent, fair and responsible remuneration policies at Sims Metal Management which are observed and which enable it to attract and retain executives and directors who will create value for shareholders of the Company.
Remco has responsibility for, among other things, reviewing and making recommendations to the board on the:
| – | remuneration and incentive performance packages of the CEO and direct reports to the CEO; |
| – | Company’s recruitment, retention and termination policies and procedures; |
| – | introduction and application of equity-based schemes, including allocations; and |
| – | level of annual fees paid to the non-executive directors. |
8.2 COMPOSITION
Remco shall comprise at least three directors of the Company, with a majority being independent. The Remco Chairperson is appointed by the board, and must be independent. Remco is composed of five independent non-executive directors, Mrs Heather Ridout and Messrs Christopher Renwick (Chairperson), Gerald Morris, Jim Thompson, and Geoffrey Brunsdon. The board may appoint additional directors to Remco or remove and replace members of Remco by resolution.
8.3 MEETINGS OF THE REMUNERATION COMMITTEE
Remco has a charter, which provides for Remco to meet at least twice each year on a formal basis and additionally as circumstances may require. Remco met seven times during the 2013 financial year. Details of attendance at meetings of Remco are set out on page 33.
A copy of the Remco charter is available from the corporate governance section on the Company’s website.
C O R P O R A T E G O V E R N A N C E S T A T E M E N T
8.4 DIRECTORS’ REMUNERATION
The Remuneration Report sets out the total remuneration of non-executive and executive directors of the Company. Each of the non-executive directors is entitled to a fee for serving as a director of the Company and an additional fee for serving as Chairperson of a board committee. These fees are inclusive of any compulsory superannuation contributions (where applicable) and any retirement benefits. In general, no additional fees are payable to non-executive directors for other services performed outside the scope of their ordinary duties as a director or committee member.
The maximum aggregate remuneration of non-executive directors is determined by a resolution of shareholders and is then divided between the directors as agreed by the board. The amount of aggregate remuneration sought to be approved by shareholders, and the manner in which it is apportioned among non-executive directors, is reviewed annually by Remco and recommendations are then made to the board. The board considers advice as to the fees paid to non-executive directors of comparable companies when undertaking the annual review process. When considered appropriate to do so, it will also obtain advice from external consultants.
8.5 REMUNERATION REPORT
The Company’s remuneration policy and procedures in respect of senior executives of the Company and Group are discussed in its Remuneration Report for the 2013 financial year, which is set out on pages 38 to 56.
The Company’s statement prohibiting designated persons from entering into transactions in products associated with Company securities which operate to limit the economic risk of their security holding in the Company over unvested entitlements under any Company equity incentive plans may be found in the Company’s policy titled ‘Dealing in Sims Metal Management Limited Securities’, available from the corporate governance section on the Company’s website.
ASX CORPORATE GOVERNANCE COUNCIL’S CORPORATE GOVERNANCE PRINCIPLES AND RECOMMENDATIONS
| | | | | | |
| | | | | REFERENCE | | COMPLY |
Principle 1: Lay solid foundations for management and oversight | | |
| | | |
1.1 | | Establish and disclose the functions reserved to the board and those delegated to senior executives | | 1.1, 1.2 | | ü |
| | | |
1.2 | | Disclose the process for evaluating the performance of senior executives | | 1.3, Remuneration Report | | ü |
| | | |
1.3 | | Provide the information indicated in the Guide to reporting on Principle 1 | | website, 1.1– 1.4 | | ü |
Principle 2: Structure the board to add value | | |
| | | |
2.1 | | A majority of the board should be independent directors | | 2.3 | | ü |
| | | |
2.2 | | The chair should be an independent director | | 2.4 | | ü |
| | | |
2.3 | | The roles of chair and CEO should not be exercised by the same individual | | 2.4 | | ü |
| | | |
2.4 | | The board should establish a nomination committee | | 2.6, 2.7, 2.9 | | ü |
| | | |
2.5 | | Disclose the process for evaluating the performance of the board, its committees and individual directors | | 2.8, 2.10 | | ü |
| | | |
2.6 | | Provide the information indicated in the Guide to reporting on Principle 2 | | website, Directors’ Report,
2.1–2.10 | | ü |
Principle 3: Promote ethical and responsible decision-making | | |
| | | |
3.1 | | Establish a code of conduct and disclose the code or a summary of the code as to the practices necessary to maintain confidence in the company’s integrity, the practices necessary to take into account their legal obligations and the reasonable expectations of their stakeholders, and the responsibility and accountability of individuals for reporting and investigating reports of unethical practices | | 3.1, 3.2 | | ü |
| | | |
3.2 | | Establish a policy concerning diversity and disclose the policy or a summary of that policy. The policy should include requirements for the board to establish measurable objectives for achieving gender diversity and for the board to assess annually both the objectives and progress in achieving them. | | 3.4 | | ü |
| | | |
3.3 | | Disclose in each annual report the measurable objectives for achieving gender diversity set by the board in accordance with the diversity policy and progress towards achieving them. | | 3.4 | | ü |
| | | |
3.4 | | Disclose in each annual report the proportion of women employees in the whole organisation, women in senior executive positions and women on the board. | | 3.4 | | ü |
| | | |
3.5 | | Provide the information indicated in the Guide to reporting on Principle 3 | | website, 3.1–3.4 | | ü |
| | | | | | |
| | | | | REFERENCE | | COMPLY |
Principle 4: Safeguard integrity in financial reporting | | |
| | | |
4.1 | | The board should establish an audit committee | | 4.1 | | ü |
| | | |
4.2 | | The audit committee should be structured to consist only of non-executive directors, a majority of independent directors and an independent chair (who is not chair of the board), and to have at least three members | | 4.2 | | ü |
| | | |
4.3 | | The audit committee should have a formal charter | | 4.1 | | ü |
| | | |
4.4 | | Provide the information indicated in the Guide to reporting on Principle 4 | | website, 4.1–4.4 | | ü |
Principle 5: Make timely and balanced disclosure | | |
| | | |
5.1 | | Establish and disclose written policies designed to ensure compliance with ASX Listing Rule disclosure requirements and to ensure accountability at a senior executive level for that compliance | | 5.1, 5.2 | | ü |
| | | |
5.2 | | Provide the information indicated in the Guide to reporting on Principle 5 | | website, 5.1, 5.2 | | ü |
Principle 6: Respect the rights of shareholders | | |
| | | |
6.1 | | Design and disclose a communications policy for promoting effective communication with shareholders and encouraging their participation at general meetings | | 6.1, 6.2 | | ü |
| | | |
6.2 | | Provide the information indicated in the Guide to reporting on Principle 6 | | website, 6.1, 6.2 | | ü |
Principle 7: Recognise and manage risk | | |
| | | |
7.1 | | Establish policies for the oversight and management of material business risks and disclose a summary of those policies | | 7.1 | | ü |
| | | |
7.2 | | The board should require management to design and implement the risk management and internal control system to manage the company’s material business risks and report to it on whether those risks are being managed effectively and should disclose that management has reported to it as to the effectiveness of the company’s management of its material business risks | | 7.1, 7.2 | | ü |
| | | |
7.3 | | The board should disclose whether it has received assurance from the CEO and CFO that the declaration provided in accordance with section 295A of the Corporations Act is founded on a sound system of risk management and internal control which is operating effectively in all material respects in relation to financial reporting risks | | 7.2 | | ü |
| | | |
7.4 | | Provide the information indicated in the Guide to reporting on Principle 7 | | website, 7.1, 7.2 | | ü |
Principle 8: Remunerate fairly and responsibly | | |
| | | |
8.1 | | The board should establish a remuneration committee | | 8.1 | | ü |
| | | |
8.2 | | The remuneration committee should be structured to consist of a majority of independent directors and an independent chair, and to have at least three members | | 8.2 | | ü |
| | | |
8.3 | | Clearly distinguish the structure of non-executive director remuneration from that of executive directors and senior executives | | 8.4, Remuneration Report | | ü |
| | | |
8.4 | | Provide the information indicated in the Guide to reporting on Principle 8 | | website, 8.1–8.5 | | ü |
| | | | | | |
Directors’ Report | | | 33 | |
Consolidated Income Statements for the year ended 30 June 2013 | | | 57 | |
Consolidated Statements of Comprehensive Income for the year ended 30 June 2013 | | | 58 | |
Consolidated Statements of Financial Position as at 30 June 2013 | | | 59 | |
Consolidated Statements of Changes in Equity for the year ended 30 June 2013 | | | 60 | |
Consolidated Statements of Cash Flows for the year ended 30 June 2013 | | | 61 | |
| |
Notes to the Consolidated Financial Statements | | | | |
1. | | Summary of significant accounting policies | | | 62 | |
2. | | Prior period restatement | | | 74 | |
3. | | Financial risk management | | | 75 | |
4. | | Critical accounting estimates and judgements | | | 78 | |
5. | | Earnings per share | | | 79 | |
6. | | Segment information | | | 79 | |
7. | | Revenue | | | 82 | |
8. | | Other income and expenses | | | 82 | |
9. | | Income taxes | | | 84 | |
10. | | Trade and other receivables | | | 86 | |
11. | | Inventory | | | 87 | |
12. | | Other financial assets and liabilities | | | 88 | |
13. | | Property, plant and equipment | | | 91 | |
14. | | Goodwill | | | 92 | |
15. | | Other intangible assets | | | 94 | |
16. | | Trade and other payables | | | 95 | |
17. | | Borrowings | | | 95 | |
18. | | Provisions | | | 95 | |
19. | | Retirement benefit obligations | | | 96 | |
20. | | Contributed equity | | | 98 | |
21. | | Retained earnings/(deficit) and reserves | | | 99 | |
22. | | Dividends | | | 100 | |
23. | | Contingencies | | | 101 | |
24. | | Commitments | | | 101 | |
25. | | Share ownership plans | | | 102 | |
26. | | Key management personnel disclosures | | | 105 | |
27. | | Remuneration of auditors | | | 108 | |
28. | | Business acquisitions and disposals | | | 109 | |
29. | | Subsidiaries | | | 110 | |
30. | | Investments in associates and jointly controlled entities | | | 114 | |
31. | | Related party transactions | | | 116 | |
32. | | Parent entity financial information | | | 116 | |
33. | | Cash flow information | | | 117 | |
34. | | Assets/liabilities classified as held for sale | | | 119 | |
35. | | Events occurring after the balance sheet date | | | 119 | |
| |
Directors’ Declaration | | | 120 | |
Independent auditor’s report to the members of Sims Metal Management Limited | | | 121 | |
Auditor’s Independence Declaration | | | 122 | |
Annual Financial Report Extracts Presented in US Dollars | | | 123 | |
Shareholder Information | | | 127 | |
Five Year Trend Summary | | | 128 | |
D I R E C T O R S’ R E P O R T
Your Directors present their report on the consolidated entity (referred to hereafter as the “Group”) consisting of Sims Metal Management Limited (the “Company”) and the entities it controlled at the end of, or during, the year ended 30 June 2013 (“FY13” or “financial year”).
PRINCIPAL ACTIVITIES
The principal activities of the Group are (1) the buying, processing and selling of ferrous and non-ferrous recycled metals and (2) the provision of environmentally responsible solutions for the disposal of post-consumer electronic products, including IT assets recycled for commercial customers. The Group offers fee-for-service business opportunities in the environmentally responsible recycling of negative value materials including refrigerators, electrical and electronic equipment. The Group’s principal activities remain unchanged from the previous financial year.
OPERATING AND FINANCIAL REVIEW
A review of the operations of the Group during the financial year and the results of those operations are set out in the Chairman’s Review on pages 4 and 5 and the Operational and Financial Review on pages 6 to 21.
NAMES AND PARTICULARS OF DIRECTORS
The names of the Directors of the Company during the financial year and up to the date of this report together with their qualifications and experience are provided on pages 36 and 37.
COMPANY SECRETARIES
Frank Moratti B Comm, LLB, MBA (Executive)
Mr Moratti was appointed to the position of Company Secretary in 1997. Before joining the Company, he held positions of assistant company secretary/legal counsel in a number of publicly listed companies over a period of some 12 years and, prior to that, worked as a solicitor with a major legal practice.
Scott Miller BS, MS, JD, PE
Mr Miller was appointed to the position of Company Secretary in 2008. Since joining the Company in 1997, Mr Miller has held positions as legal counsel and manager for environmental affairs for North American operations. Before joining the Company, he held positions at an environmental mediation firm, as an attorney with a major legal practice and as a consulting engineer.
DIRECTORS’ MEETINGS
The following table shows the actual board and committee meetings held during the financial year and the number of meetings attended by each Director.
| | | | | | | | | | | | | | | | | | | | | | | | |
| | | BOARD OF
DIRECTORS | | | RISK, AUDIT &
COMPLIANCE
COMMITTEE | | | SAFETY, HEALTH,
ENVIRONMENT & COMMUNITY
COMMITTEE | | | REMUNERATION
COMMITTEE | | | FINANCE &
INVESTMENT
COMMITTEE | | | NOMINATION/
GOVERNANCE
COMMITTEE | |
Meetings held | | | 9 | | | | 7 | | | | 4 | | | | 7 | | | | 13 | | | | 4 | |
G Brunsdon | | | 9 | | | | 7 | | | | | | | | 7 | | | | 13 | | | | | |
D Dienst | | | 9 | | | | | | | | 4 | | | | | | | | 12 | | | | 4 | |
N Bobins | | | 8 | | | | | | | | | | | | | | | | 13 | | | | 4 | |
J DiLacqua | | | 8 | | | | 7 | | | | | | | | | | | | 13 | | | | | |
JM Feeney1 | | | 3 | | | | 3 | | | | | | | | 4 | | | | | | | | 3 | |
G Morris | | | 9 | | | | 7 | | | | | | | | 7 | | | | | | | | 4 | |
C Renwick2 | | | 9 | | | | | | | | 4 | | | | 3 | | | | | | | | 4 | |
H Ridout3 | | | 9 | | | | 3 | | | | 4 | | | | 3 | | | | | | | | 1 | |
M Sukagawa4 | | | 8 | | | | 3 | | | | 3 | | | | | | | | 10 | | | | 3 | |
T Sato5 | | | 1 | | | | | | | | 1 | | | | | | | | 2 | | | | | |
J Thompson6 | | | 9 | | | | | | | | 1 | | | | 7 | | | | 13 | | | | | |
P Varello7 | | | 4 | | | | | | | | | | | | 4 | | | | | | | | 3 | |
| 1 | Mr Feeney retired from the Board of Directors and the Risk, Audit & Compliance Committee, Remuneration Committee and Nomination/ Governance Committee on 15 November 2012. |
| 2 | Mr Renwick was appointed to the Remuneration Committee on 15 November 2012. |
| 3 | Mrs Ridout was appointed to the Risk, Audit & Compliance Committee and Remuneration Committee on 15 November 2012, and the Nomination/ Governance Committee on 17 May 2013. |
| 4 | Mr Sukagawa retired from the Board of Directors and the Risk, Audit & Compliance Committee, Safety, Health, Environment & Community Committee, Finance & Investment Committee and Nomination/Governance Committee on 1 April 2013. |
| 5 | Mr Sato was appointed to the Board of Directors and the Safety, Health, Environment & Community Committee and Finance & Investment Committee on 1 April 2013. |
| 6 | Mr Thompson was appointed to the Safety, Health, Environment & Community Committee on 15 November 2012. |
| 7 | Mr Varello retired from the Board of Directors and the Remuneration Committee and Nomination/Governance Committee on 15 November 2012. |

D I R E C T O R S’ R E P O R T
DIRECTORS’ INTERESTS
As at the date of this report, the interests of the Directors in the shares, options, or performance rights of the Company are set forth below. Shares owned by each Director are either in the form of ordinary shares or American Depositary Shares (“ADS”).
| | | | | | | | |
| | | SHARES | | | OPTIONS
OVER SHARES | |
G Brunsdon | | | 22,057 | | | | – | |
N Bobins (ADS) | | | 54,600 | | | | – | |
J DiLacqua (ADS) | | | – | | | | – | |
G Morris (ADS) | | | 20,000 | | | | 82,000 | |
C Renwick | | | 13,144 | | | | – | |
H Ridout | | | – | | | | – | |
T Sato | | | – | | | | – | |
J Thompson (ADS) | | | 12,000 | | | | – | |
DIVIDENDS
Since the end of the financial year, the Directors have determined that no dividend will be paid for the year ended 30 June 2013.
SIGNIFICANT CHANGES IN THE STATE OF AFFAIRS
On 30 June 2013, Daniel W Dienst retired as an Executive Director and Group CEO. Effective 1 July 2013, the Board created a Global Leadership Team to serve in lieu of the Group CEO while the search for a new CEO is accomplished. The Board continues to evaluate candidates for the role and has narrowed the field to external candidates. The Board expects to announce an appointment by the end of the first quarter of FY14.
There were no other significant changes in the state of affairs of the Group during the financial year not otherwise disclosed elsewhere in this report.
SIGNIFICANT EVENTS AFTER THE BALANCE SHEET DATE
The Directors are not aware of any items, transactions or events of a material or unusual nature that have arisen since the end of the financial year which will significantly affect, or may significantly affect, the operations of the Group, the results of those operations or the state of affairs of the Group in subsequent financial years.
LIKELY DEVELOPMENTS
Information as to the likely developments in the operations of the Group is set out in the Chairman’s Review on pages 4 and 5 and the Operational and Financial Review on pages 6 to 21.
Further information on likely developments in the operations of the Group and the expected results of operations in subsequent financial years have not been included in this annual financial report because the Directors believe it would be likely to result in unreasonable prejudice to the Group.
ENVIRONMENTAL REGULATION
The Group is subject to environmental regulations and reporting requirements in Australia as well as other countries in which it operates. The Group has operating licenses and consents in place at each of its operating sites as prescribed by relevant environmental laws and regulations in each respective location and comprehensive environmental management systems and audit procedures to support compliance.
The Group’s Australian operations are not captured under the Australian Carbon Tax, but are subject to the reporting requirements of both theEnergy Efficiency Opportunities Act 2006 (“EEO Act”) and theNational Greenhouse and Energy Reporting Act 2007 (“NGER Act”).
The EEO Act requires the Group to assess the energy usage of its Australian operations, including the identification, investigation and evaluation of energy saving opportunities, and to report publicly on the assessments undertaken, including intended actions by the Group. The Group continues to meet its obligations under the EEO Act.
The NGER Act requires the Group to report its annual greenhouse emissions and energy use of its Australian operations and the Group has implemented systems and processes for the collection and calculation of the data required so as to prepare and submit the relevant report to the Greenhouse and Energy Data Officer annually.
Previously, the Group was also required to report under the Victorian Government’sEnvironment and Resource Efficiency Plan, but this reporting requirement was withdrawn in February 2013 due to duplication with the Federal Government’s reporting requirements under the EEO Act and NGER Act.
There have been no significant known breaches of the Group’s license conditions or any environmental regulations to which it is subject.
INSURANCE AND INDEMNIFICATION OF OFFICERS
During the financial year, the Company had contracts in place insuring all Directors and executives of the Company (and/or any subsidiary companies in which it holds greater than 50% of the voting shares), including Directors in office at the date of this report and those who served on the board during the year, against liabilities that may arise from their positions within the Company and its controlled entities, except where the liabilities arise out of conduct involving a lack of good faith. The Directors have not included details of the nature of the liabilities covered or the amount of the premium paid as such disclosure is prohibited under the terms of the contracts.
SHARE OPTIONS AND RIGHTS
Unissued shares
As of the date of this report, there are 7,009,037 share options outstanding and 4,209,101 rights outstanding in relation to the Company’s ordinary shares. Refer to Note 25 of the consolidated financial statements for further details of the options and rights outstanding as at 30 June 2013. Option and right holders do not have any right, by virtue of the option or right, to participate in any share issue of the Company.
Shares issued as a result of the exercise of options and vesting of rights
During the financial year, there were no ordinary shares issued upon the exercise of share options and there were 404,594 ordinary shares issued in connection with the vesting of rights. Refer to Note 25 of the consolidated financial statements for further details of shares issued pursuant to share-based awards. Subsequent to the end of the financial year and up to the date of this report, 4,894 ordinary shares were issued in connection with vesting of rights.
NON-AUDIT SERVICES
The Company may decide to employ its external auditor (PricewaterhouseCoopers) on assignments additional to their statutory audit duties where the auditor’s expertise and experience with the Company and/or the Group are important.
Details of the amounts paid or payable to the auditor for audit and non-audit services provided during the financial year are set out in Note 27 of the consolidated financial statements.
The Board has considered the position and, in accordance with advice received from the Risk, Audit & Compliance Committee, is satisfied that the provision of the non-audit services is compatible with the general standard of independence for auditors imposed by theCorporations Act 2001. The Directors are satisfied that the provision of non-audit services by the auditor, as set forth in Note 27 of the consolidated financial statements, did not compromise the auditor independence requirements of theCorporations Act 2001 for the following reasons:
| • | | All non-audit services have been reviewed by the Risk, Audit & Compliance Committee to ensure they do not impact the impartiality and objectivity of the auditor; and |
| • | | None of the services undermine the general principles relating to auditor independence as set out inAPES 110 Code of Ethics for Professional Accountants. |
A copy of the auditor’s independence declaration as required under section 307C of theCorporations Act 2001 is set out on page 122.
ROUNDING OF AMOUNTS
The Company is of a kind referred to in Class Order 98/100, issued by the Australian Securities and Investments Commission, relating to the “rounding off” of amounts in the financial statements. Amounts in the financial statements have been rounded off in accordance with that Class Order to the nearest tenth of a million dollars, unless otherwise indicated.
D I R E C T O R S’ R E P O R T
BOARD OF DIRECTORS
Geoffrey N Brunsdon B Comm (age 55)
Chairperson and Independent non-executive director
| | |
 | | Mr Brunsdon was appointed as a director in November 2009, appointed Deputy Chairperson in September 2011 and appointed Chairperson of the Company on 1 March 2012. He is a member of the Risk, Audit & Compliance Committee, the Remuneration Committee and the Finance & Investment Committee. Until June 2009, Mr Brunsdon was Managing Director and Head of Investment Banking of Merrill Lynch International (Australia) Limited. He is Chairman of ING Private Equity Access Limited (since 2004), APN Funds Management Limited (since November 2009), and MetLife Insurance Limited (since April 2011) and a member of the Takeovers Panel. He was a member of the listing committee of the Australian Securities Exchange between 1993 and 1997 and was a director of Sims Group Limited between 1999 and 2007. He is a Fellow of the Institute of Chartered Accountants, a Fellow of the Financial Services Institute of Australia and a Fellow of the Institute of Company Directors. Mr Brunsdon is also a director of several non-profit |
| organisations, including Redkite (supporting families who have children with cancer), the Wentworth Group of Concerned Scientists and Purves Environmental Custodians. |
Norman R Bobins BS, MBA (age 70)
Independent non-executive director
| | |
| |
 | | Mr Bobins was appointed as a director in March 2008. He is Chairperson of the Nomination/Governance Committee, and is a member of the Finance & Investment Committee. Mr Bobins was formerly a director of Metal Management, Inc (since 2006). He is the Chairman of Norman Bobins Consulting LLC (since 2008). From May 2007 until October 2007, Mr Bobins was the Chairman of the Board of LaSalle Bank Corporation. From 2002 to 2007, he was President and Chief Executive Officer of LaSalle Bank Corporation. From 2006-2007, he was President and Chief Executive Officer of ABN AMRO North America. From 2002-2007, Mr Bobins was Senior Executive Vice President at ABN AMRO Bank N.V., the Dutch parent of LaSalle Bank Corporation. He is the Non-Executive Chairman of The Private Bank and Trust Company. Mr Bobins is also a director of AGL Resources, Inc AAR CORP, and Aviv REIT, Inc. He earned his BS from the University of Wisconsin and his MBA from the University of Chicago. |
John T DiLacqua MBA (age 61)
Independent non-executive director
| | |
| |
 | | Mr DiLacqua was appointed as a director in September 2011. He is Chairperson of the Finance & Investment Committee, and is a member of the Risk, Audit & Compliance Committee. Mr DiLacqua was formerly a director of Metal Management, Inc (since June 2001), and was a director of Sims Metal Management Limited between March and November 2008. He was the Executive Chairman of Envirosource, Inc from May 2004 to December 2004 and had served as President and Chief Executive Officer of Envirosource from January 1999 to May 2004. From October 1997 to December 1998, Mr DiLacqua served as President of the US Ferrous Operations of Philip Metals, Inc, and, prior to that, from May 1994, as the President of Luria Brothers. He is a graduate of Temple University and received an MBA from Carnegie Mellon University. Mr DiLacqua is a Certified Public Accountant. |
Gerald E Morris BA (age 81)
Independent non-executive director
| | |
| |
 | | Mr Morris was appointed as a director in March 2008. He is Chairperson of the Risk, Audit & Compliance Committee, and is a member of the Remuneration Committee and the Nomination/Governance Committee. Mr Morris was formerly a director (since January 2004) of Metal Management, Inc He previously served as President and CEO of Intalite International N.V., as Chairman and director of Beacon Trust Company, and as a director of Metals USA, Inc, Rexel, Inc and Tivoli Industries, Inc, and as trustee of the Blanchard Group of Funds. He earned his BA from the University of Connecticut. Mr Morris is a Certified Public Accountant. |
Christopher J Renwick AM, FAIM, FAIE, FTSE – BA, LLB (age 70)
Independent non-executive director
| | |
| |
 | | Mr Renwick was appointed as a director in June 2007. He is Mitsui & Co., Ltd’s designated independent director. Mr Renwick is Chairperson of the Remuneration Committee, and is a member of the Safety, Health, Environment & Community Committee and the Nomination/Governance Committee. Mr Renwick was employed with the Rio Tinto Group for over 35 years, rising, in 1997, to Chief Executive, Rio Tinto Iron Ore, a position he held until his retirement in 2004. He has previously served as Chairman and director of Coal and Allied Industries Limited (2004 to 2011), Chairman of the Rio Tinto Aboriginal Fund (2004 to 2011) and director of Downer EDI Limited (2004 to 2010). Mr Renwick is a director of South East Regional Touring Opera Company Limited, a “not-for-profit” public company limited by guarantee, which operates as “Melbourne Opera”. |
Heather Ridout AO BEc (Hons) (age 59)
Independent non-executive director
| | |
| |
 | | Mrs Ridout was appointed as a director in September 2011. She is a member of the Safety, Health, Environment & Community Committee, the Remuneration Committee, the Risk, Audit & Compliance Committee and the Nomination/Governance Committee. Mrs Ridout was formerly the Chief Executive Officer of the Australian Industry Group from 2004 until her retirement in April 2012. She is a member of the Board of the Reserve Bank of Australia (since December 2011), and is a director of Australian Securities Exchange Limited (since August 2012) and Chair of the AustralianSuper Trustee Board, the largest industry fund in Australia. Mrs Ridout also serves on the Board of the Climate Change Authority, an independent body established to provide advice on the Australian Government’s policies for reducing carbon pollution. She has an economics degree, with honours, from the University of Sydney. |
Tamotsu (Tom) Sato BA (age 61)
Non-independent non-executive director
| | |
| |
 | | Mr Sato was appointed as a director in April 2013. He is Mitsui & Co., Ltd’s designated director. Mr Sato is a member of the Finance & Investment Committee and the Safety, Health, Environment & Community Committee. He joined Mitsui in 1975 and has held various positions within that company including Executive Director of Mitsui Coal Holdings (2002-2004), Senior Vice President of Mitsui Singapore (2006-2009) and, most recently, since May 2009 until his retirement in March 2013, President & CEO of Mitsui Raw Materials Development based in New York. |
James T Thompson BS (age 63)
Independent non-executive director
| | |
| |
 | | Mr Thompson was appointed as a director in November 2009. He is Chairperson of the Safety, Health, Environment & Community Committee, and is a member of the Finance & Investment Committee and the Remuneration Committee. Mr Thompson was, from 2004 until his retirement in 2007, Executive Vice President Commercial for The Mosaic Company, one of the world’s largest fertiliser companies, with sales of US$11 billion and some 8,000 employees, which is publicly traded on the New York Stock Exchange. Prior to that, he was engaged for 30 years in the steel industry from 1974–2004 in various roles at Cargill, Inc of Minnesota, United States, leading to the position of President of Cargill Steel Group from 1996–2004. During that period, Mr Thompson also served for a time as Co-Chairman of the North Star BlueScope Steel joint venture, and was a member of various industry boards, including AISI (American Iron and Steel Institute), SMA (Steel Manufacturers Institute) and MSCI (Metals Service Center Institute). He is currently a |
| director of Hawkins, Inc and serves on the Board of Visitors of the University of Wisconsin School of Education. Mr Thompson has a BS from the University of Wisconsin Madison. |
Robert J Bass MBA (age 64)
Independent non-executive director
| | |
| |
 | | Mr Bass was appointed as a director on 10 September 2013. He is a member of the Risk, Audit & Compliance Committee. Mr Bass was formerly a partner at Deloitte & Touche from 1982, and Vice Chairman Deloitte LLP from 2006, until his retirement in June 2012. He practiced at that firm for 39 years and was Lead Client Service Partner responsible for the development, planning, management, administration and delivery of services, including audits of consolidated financial statements, to multinational clients in a variety of industries. Mr Bass is currently a director of Groupon, Inc (since June 2012) and NewPage Holdings Inc (since December 2012) and is Chairman of the Audit Committee of both companies. He is a graduate of Emory University and received an MBA from Columbia University. He is a Certified Public Accountant, New York and Connecticut, and a member of the American Institute of Certified Public Accountants, New York, and Connecticut State Societies of Certified Public Accountants. |
Mr Feeney retired on 15 November 2012 having served as an independent non-executive director since September 1991.
Mr Varello retired on 15 November 2012 having served as an independent non-executive director since November 2005.
Mr Sukagawa retired on 1 April 2013 having served as a non-independent non-executive director since November 2009.
Mr Dienst retired on 30 June 2013 having served as Executive Director and Group Chief Executive Officer since March 2008.
D I R E C T O R S’ R E P O R T
REMUNERATION REPORT
REMARKS BY THE CHAIRMAN OF THE REMUNERATION COMMITTEE
Dear Shareholder,
We are pleased to present our Remuneration Report for FY13.
This year was another challenging year for the Company and our industry. As a result, performance against our Return on
Controlled Capital Employed (ROCCE) target was not achieved at the Group level or by any of the businesses except one, resulting in short-term incentive (STI) awards under the STI Plan being significantly below target. Similarly, no performance rights vested under the Company’s long-term incentive (LTI) Plan because relative total shareholder return (TSR) was below the median against our TSR peer group.
Mr Daniel Dienst, our Group CEO, retired on 30 June 2013 and entered into a consulting agreement with the Company. Mr Dienst received no severance payment and no payment in lieu of notice. Details of his STI, LTI and the consulting agreement are provided in this report.
During the year, the Remuneration Committee commissioned an independent review of the LTI Plan. Based upon the outcomes of this review, and in response to feedback from shareholders and proxy advisors, the Committee will be making some changes to the operation of the LTI Plan in FY14.
The changes involve increasing the percentage of the LTI grant that is subject to performance hurdles from one-half to two-thirds of the Senior Executives’ LTI award. In doing so, an additional performance hurdle related to earnings per share (EPS) will be introduced. Furthermore, commencing with the FY14 LTI grants, the re-test mechanism will be removed for the performance rights. The Board believes that this new structure adds further rigour to the LTI Plan and is more aligned with shareholder expectations and Australian market practice. It will also further incentivise Senior Executives to focus on both earnings and shareholder value creation.
In light of Company performance, none of the Senior Executives will receive a salary increase for FY14. In addition, the Board resolved to reduce Non-Executive Director fees by 10% for FY14.
We welcome and value your feedback as we continue to find ways to improve communications with our shareholders.
Yours sincerely,

Christopher Renwick
Remuneration Committee Chair
RemCoChair@simsmm.com
The Directors of Sims Metal Management Limited present the Remuneration Report for the Company and the Group for FY13. The information provided in this Remuneration Report has been audited.
The Remuneration Report is set out as follows:
| | | | | | |
| SECTION | | DESCRIPTION | | PAGE # | |
| A | | Senior Executive remuneration snapshot | | | 39 | |
| B | | Remuneration governance framework | | | 41 | |
| C | | Senior Executive remuneration policy | | | 43 | |
| D | | Senior Executive remuneration framework | | | 44 | |
| E | | Remuneration outcomes for Senior Executives during FY13, including discussion of the linkage between ‘at-risk’ remuneration and Company performance | | | 48 | |
| F | | Senior Executive contracts | | | 51 | |
| G | | Share-based payment disclosures | | | 53 | |
| H | | Non-Executive Director remuneration | | | 55 | |
A. SENIOR EXECUTIVE REMUNERATION SNAPSHOT
Due to our global scale, our remuneration practices must take into account local market practice, particularly in our largest jurisdiction of the United States where we compete for much of our talent and business. Our executive remuneration framework consists of fixed remuneration, short-term incentives and long-term incentives. As noted in the Chairman’s letter, we will be changing the long-term incentive structure for FY14.
The Company’s remuneration philosophy is designed to provide remuneration that:
| • | | attracts, motivates and retains the best and brightest of its senior executive, leadership and staff positions; |
| • | | drives the Company’s business strategy; and |
| • | | aligns reward opportunities with shareholder interests. |
Sims Metal Management Limited and its joint ventures operate in more than 270 locations across five continents. Given our global scale, it is imperative that our remuneration practices take into account local market practice, particularly in our largest jurisdiction of the United States where we compete for much of our talent and business. In doing so, we endeavour to achieve simplicity and transparency in remuneration design, whilst also balancing competitive market practice in the United States, United Kingdom and Australia. Of the five members of our senior management team (the Senior Executives) for FY13, three were based in the United States, one was based in Australia and one was based in the United Kingdom.
Remuneration outcomes for FY13
Each year our Senior Executive remuneration levels are benchmarked against a peer group by Mercer (the Board’s external remuneration adviser). In light of our global operations, the benchmarking peer group includes industry-related companies of a relative size, footprint and complexity to Sims Metal Management Limited.
| | |
| REMUNERATION COMPONENT | | OUTCOME |
| Fixed remuneration | | • Adjustments were made to Senior Executive fixed remuneration levels, taking into account market data provided by Mercer, the scope of the role and Senior Executive performance. |
| Short-term incentive (STI) | | • STI payments were significantly lower than target. Performance against our key financial measure, Return on Controlled Capital Employed (ROCCE), was below threshold at the Group level and for all businesses except one. Only New Zealand Metals achieved threshold. • The Group CEO received one third of his target STI opportunity while the other Senior Executives received an STI award from zero to 35% of their respective target STI opportunities for FY13 depending upon ROCCE and individual performance. |
| Long-term incentive (LTI) | | • No performance rights vested during the yearas the Company’s TSR performance was below the median against its TSR peer group. • Options vested during the yearin accordance with the terms of their agreement. No options were exercised during the year because the Company’s share price did not exceed the exercise price. |
D I R E C T O R S’ R E P O R T
Changes in the remuneration structure for FY14
During the year, the Remuneration Committee (Committee) commissioned Mercer to perform an independent review of the LTI Plan with the objective of ensuring that the Plan is competitive, aligned with shareholder expectations, and driving the Company’s business strategy. As a result of the review, and taking into account the feedback received from shareholders and proxy advisors, the below changes will be incorporated into the LTI Plan for FY14:
| | | | | | |
| CHANGE | | DESCRIPTION OF CHANGE |
| Change in instruments, | | • | | The FY14 LTI award will be granted as: |
| | | |
| hurdles and weightings | | | | – | | One third in performance rights subject to a relative TSR hurdle |
| | | |
| | | | – | | One third in performance rights subject to an EPS hurdle |
| | | |
| | | | – | | One third in options where the Company’s share price needs to exceed the exercise price before the Senior Executive can realise any value |
| | |
| | | • | | Further detail on the operation of the relative TSR and EPS hurdle will be disclosed in the FY14 Remuneration Report. |
| Removal of re-test mechanism | | • | | The Committee has removed the re-test mechanism on the performance rights. Accordingly, none of the LTI grants in FY14 and beyond will be eligible for re-testing. |
The Board believes these changes add further rigour to the LTI Plan because two-thirds of the LTI award (the performance rights) will now be subject to performance hurdles, compared to one-half previously. In addition, the one-third of the LTI award granted as options will only deliver value to the Senior Executives if the Company’s share price exceeds the exercise price subsequent to vesting.
The combination of hurdles means that in order to realise full vesting, the Senior Executives must have performed at a level that resulted in the Company’s achieving TSR performance at the 75th percentile compared to an industry-based peer group, as well as achieving an EPS hurdle. Further, the Senior Executives will receive no value from their options unless the Company’s share price exceeds the option exercise price. The focus on absolute share price growth, relative shareholder value creation and earnings growth makes for a rigorous LTI Plan.
Non-Executive Directors and Senior Executives covered in this report
The Remuneration Report is focused on the Company’s Key Management Personnel (KMP) consisting of the below Non-Executive Directors and Senior Executives.
| | |
| NAME | | POSITION |
Non-Executive Directors | | |
| Geoffrey N Brunsdon | | Chairman and Independent Non-Executive Director |
| Norman R Bobins | | Independent Non-Executive Director |
| John T DiLacqua | | Independent Non-Executive Director |
| J Michael Feeney | | Independent Non-Executive Director (retired 15 November 2012) |
| Gerald E Morris | | Independent Non-Executive Director |
| Christopher J Renwick | | Independent Non-Executive Director |
| Heather Ridout | | Independent Non-Executive Director |
| Tom Sato | | Non-Independent Non-Executive Director (commenced 1 April 2013) |
| M Paul Sukagawa | | Non-Independent Non-Executive Director (retired 1 April 2013) |
| James T Thompson | | Independent Non-Executive Director |
| Paul J Varello | | Independent Non-Executive Director (retired 15 November 2012) |
|
| Senior Executives (including the Executive Director and Group CEO) |
| Daniel W Dienst | | Executive Director and Group Chief Executive Officer (retired 30 June 2013) |
| Graham Davy | | Chief Executive Officer – European Metals and Sims Recycling Solutions (SRS) (left the Company on 19 March 2013) |
| Robert Kelman | | President – North America Metals (NAM) |
| Robert C Larry | | Group Chief Financial Officer |
| Darron McGree | | Managing Director Australia and New Zealand Metals |
Actual Remuneration Outcomes
There is a strong correlation between incentive pay and Company performance. Cash bonuses were significantly lower than target because threshold performance against the ROCCE measure was not achieved at the Group level or by any of the businesses except one. No performance rights vested since the Company’s TSR performance was below the median of the TSR peer group. In addition, no options were exercised because the Company’s share price did not exceed the exercise price.
In order to provide additional transparency, outlined below is the actual remuneration received by the Senior Executives during FY13. For comparative purposes, the targeted remuneration is also shown. Total target remuneration is consistent with the Company’s remuneration philosophy and is competitively positioned in the market (benchmarked against Mercer’s market data).
The statutory remuneration tables, which are prepared consistent with Australian Accounting Standards and theCorporations Act 2001 (Cth), are outlined later in this report.
By providing this table below, the strong correlation between actual remuneration received and Company performance can be clearly demonstrated. Actual cash bonuses were significantly lower than targeted incentives this year because the ROCCE targets at the Group level and for all businesses except one were not achieved. Actual cash bonuses reflect the figures in the statutory remuneration table.
In FY08, there were three tranches of performance rights granted, with vesting subject to relative TSR, EPS and EBITDA respectively. 59.6% of the relative TSR rights vested in FY11 and the balance lapsed in FY13. 100% of the EPS rights lapsed in FY13 and there was no further vesting of the EBITDA rights because these fully vested in FY12. The 2009 and 2010 performance rights are subject to relative TSR only and none of these performance rights vested based on performance to 30 June 2013 as relative TSR performance was below the median company of the TSR peer group.
The actual value of LTI awards is different from the targeted LTI awards noted below, as well as in the statutory remuneration table in Section E. This is because the actual LTI figures reflect the value of the LTI awards that actually vested on the vesting date (ie the actual amount that Senior Executives received in FY13) whereas the value of the LTI figures in the statutory remuneration table reflects the amortised value of the entire LTI award (that may or may not vest) in accordance with accounting standards. By comparing the two tables, it can be seen that the actual remuneration of the Senior Executives during FY13 was significantly lower than their targeted incentives, as well as the remuneration that is required to be disclosed in the statutory remuneration table. Due to the relative TSR performance, Senior Executives received no value with regard to their performance rights in FY13.
| | | | | | | | | | | | | | | | | | | | | | | | | | | | |
SENIOR EXECUTIVES
(A$) | | FIXED
REMUNERATION1 | | | ACTUAL
CASH
BONUS2 | | | TARGET
CASH
BONUS | | | ACTUAL
LONG-TERM
INCENTIVES3 | | | TARGET
LONG-TERM
INCENTIVES | | | TOTAL ACTUAL
REMUNERATION | | | TOTAL TARGET
REMUNERATION | |
D Dienst4,5 | | | 1,756,797 | | | | 590,660 | | | | 1,771,979 | | | | 110,064 | | | | 4,089,183 | | | | 2,457,521 | | | | 7,617,959 | |
G Davy4,6,7 | | | 448,335 | | | | – | | | | 595,511 | | | | – | | | | 595,511 | | | | 448,335 | | | | 1,639,357 | |
R Kelman4 | | | 770,194 | | | | 120,000 | | | | 705,872 | | | | – | | | | 882,340 | | | | 890,194 | | | | 2,358,406 | |
R Larry4 | | | 764,967 | | | | – | | | | 666,937 | | | | 57,368 | | | | 833,671 | | | | 822,335 | | | | 2,265,575 | |
D McGree | | | 774,807 | | | | 264,753 | | | | 718,410 | | | | – | | | | 718,410 | | | | 1,039,560 | | | | 2,211,627 | |
| 1 | Other than for Mr Dienst, fixed remuneration includes cash salary, other benefits, pension and superannuation, and leave accruals in line with statutory remuneration disclosures. For Mr Dienst, fixed remuneration also includes a payment for his Paid Time Off entitlement while the statutory remuneration table includes the accrual for this amount. |
| 2 | Actual cash bonus refers to the Senior Executive’s total bonus that was earned in FY13 and will be paid to the Senior Executive in September 2013 following the finalisation of the audited financial results. |
| 3 | LTI refers to equity allocations granted in prior years that vested during FY13. The value has been calculated using the closing share price of the Company’s shares on the business day prior to vesting. For Mr Dienst, it also includes amounts paid out under the deferred compensation plan. |
| 4 | Messrs Dienst, Kelman and Larry received their cash payments in United States dollars. Mr Davy received his cash payments in pounds sterling. |
| 5 | Mr Dienst retired on 30 June 2013. |
| 6 | Mr Davy left the Company in March 2013 and did not receive any benefits under the Company’s STI or LTI Plan. |
| 7 | Mr Davy’s STI and LTI targets reflect his annual target opportunities at the start of the fiscal year. |
B: REMUNERATION GOVERNANCE FRAMEWORK
We have a strong remuneration governance framework, with the Board being ultimately responsible for the Company’s executive remuneration practices. The Committee advises the Board in making remuneration decisions.
The primary role of the Committee is to support and advise the Board on the implementation and maintenance of coherent, fair and responsible remuneration policies and practices that are observed by the Company and enable it to attract and retain executives and directors who will create value for shareholders. The Committee’s charter, which is available on the Company’s website at www.simsmm.com, provides further information on the role of the Committee.
D I R E C T O R S’ R E P O R T
The diagram below illustrates the role of the Board, the Committee, management and external advisers (including remuneration consultants) in relation to remuneration.
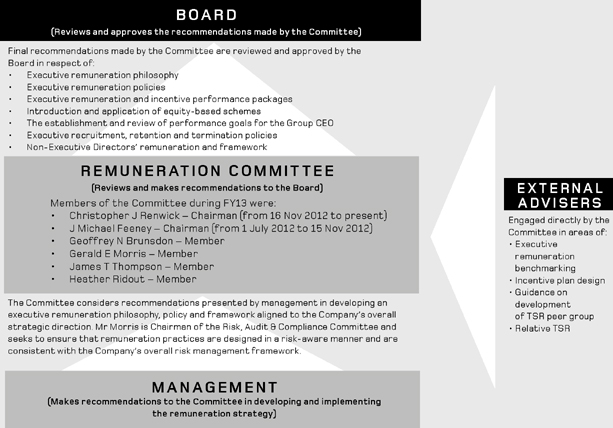
In addition to the above, in recognition of the value and advantages of having a diversified workforce and consistent with the Company’s Workforce Diversity Policy (a copy of which can be found on the Company’s website at www.simsmm.com), the Committee is responsible for reviewing and approving the measurable objectives for achieving diversity as noted in the Company’s Corporate Governance Statement.
Use of External Remuneration Advisor
The Committee retains Mercer, a remuneration consultant, to serve as its external advisor. During FY13, Mercer provided the Company with a remuneration recommendation as defined under theCorporations Act 2001 (Cth). In its capacity as advisor to the Committee, Mercer performs competitive remuneration research and provides guidance on Senior Executive remuneration issues. The activity includes providing guidance on the appropriate TSR peer group, which includes industry-related companies of relative sized revenue and market capitalisation with similar geographic footprints and complexity.
Mercer also assesses competitive Senior Executive base salary, annual incentive, and long-term incentive levels for the Committee’s consideration as it approves base salary adjustments and sets target incentive opportunities for Senior Executives. During FY13, Mercer also reviewed the Company’s LTI Plan and provided the Committee with potential alternatives, provided guidance on competitive practices with regard to Executive contracts, provided valuations of awards under the LTI Plan and assessed the Company’s cumulative TSR against the TSR peer group.
The Mercer fees for the above remuneration recommendations were A$108,735. In addition, Mercer provided advisory services to the Board and assisted the Company with various accounting valuations. Fees for these services were A$18,499 and A$11,440 respectively.
The Committee has implemented protocols around the appointment and use of remuneration consultants to ensure compliance with theCorporations Act 2001 (Cth). Mr Renwick, Chairman of the Committee, directly engaged Mercer to perform the above work and Mercer did not provide its report to any member of Company management. The Committee also had direct access to Mercer during executive sessions (without Company management) throughout FY13. Mercer has declared to the Committee that their remuneration recommendations were not unduly influenced by any of the Company’s KMP throughout the course of their engagement. Based on the protocols followed, and Mercer’s declaration, the Board is satisfied that the remuneration recommendation from Mercer was made free from undue influence by any of the KMP.
C: SENIOR EXECUTIVE REMUNERATION POLICY
Our executive remuneration policy supports our vision and aligns executive incentive pay with the achievement of Company strategic and business priorities and the creation of shareholder value.
FY13 Senior Executive remuneration policy
The Senior Executive remuneration policy recognises that the Company operates in a global environment and that the Company’s performance depends on the quality of its people. The policy seeks to ensure alignment between the Company’s remuneration philosophy, its business strategy and the best interest of its shareholders.
The primary aim of the Company’s Senior Executive remuneration policy is to attract, motivate and retain high calibre Senior Executives. To do so, the Company provides Senior Executive remuneration packages that are competitive (referencing market data) and commensurate with employee responsibilities and accountabilities. The diagram below provides a snapshot of the Company’s remuneration principles and its components, and how they support the Company’s overall vision.
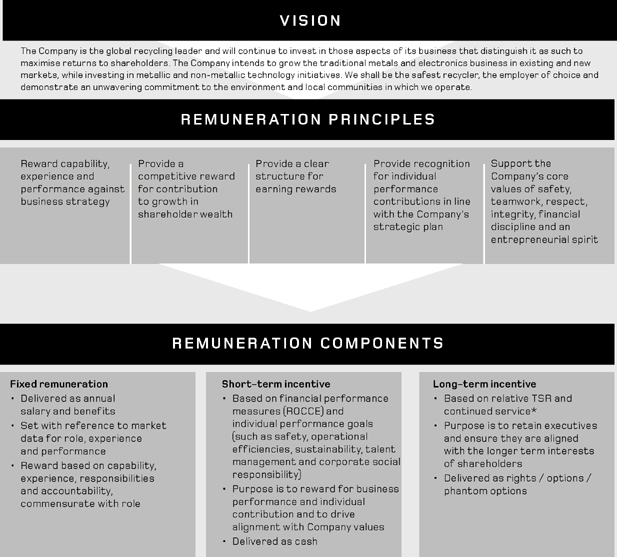
| * | As noted in Section A, grants in FY14 under the LTI Plan will continue to be by way of options and performance rights. The performance rights, however, will now make up two thirds of the total award and will be subject to a relative TSR hurdle and an EPS hurdle. The options will continue to require the Senior Executives to assist in growing the Company’s share price above the exercise price. |
D I R E C T O R S’ R E P O R T
D: SENIOR EXECUTIVE REMUNERATION FRAMEWORK
Our executive remuneration framework is heavily skewed towards variable pay, with 81% of the Group CEO’s target pay being at-risk, subject to challenging short-term and long-term hurdles.
The Senior Executive remuneration framework reflects the international nature of the Company and the fact that we employ Senior Executives based throughout the world.
The framework is continually reviewed by the Committee to ensure best practices are followed. The Company also undertakes an annual remuneration review to determine the total remuneration positioning of its Senior Executives against the market.
Fixed and variable (‘at-risk’) remuneration mix
In line with the Company’s intent to ensure the Senior Executive remuneration framework is aligned to the Company’s performance, a significant portion of an Executive’s remuneration is ‘at-risk’. The following chart sets out the target remuneration mix; that is, fixed remuneration (salary / package), target short-term incentive, and long-term incentive for the Senior Executives.
TOTAL TARGET REMUNERATION MIX
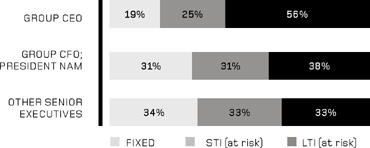
Fixed remuneration
Fixed remuneration comprises base salary and benefits:
| • | | Base salary is determined on an individual basis, taking into consideration the individual’s capability, experience, responsibilities and accountability, as well as external market factors and benchmark data. In light of our global operations, the peer group that Mercer uses for benchmarking purposes includes industry-related companies of a relative size, footprint and complexity. |
| • | | Benefits programs vary by market and may include health insurance, life and disability insurance, retirement programs (depending on national government and tax regulations) and automobile allowances. |
Remuneration packages (including fixed components of base salaries and benefits) are reviewed annually. In reviewing any changes to Senior Executive remuneration, the Committee references individual performance, as well as market-based comparable positions in public surveys and obtains advice from its external remuneration consultant where necessary.
There are no guaranteed increases to any components of fixed remuneration for any Senior Executives.
‘At-risk’ remuneration
‘At-risk’ remuneration comprises both short-term and long-term incentives. ‘At-risk’ means an absence of certainty regarding the payment of a particular component of remuneration in the event agreed-upon performance hurdles or employment conditions are not met during the performance period. The remuneration of Senior Executives is linked to performance through short- and long-term incentives. Details on each of these Plans are outlined below.
Short-Term Incentive Plan (STI Plan)
The STI Plan for Senior Executives is based 80% on financial performance (ROCCE) and 20% on individual goals that are critical to the overall success of the Company.
Senior Executives are eligible to participate in the Company’s STI Plan. The table below summarises the key aspects of the STI Plan.
| | |
Frequency, timing and form of award | | Senior Executives have an opportunity to earn an annual cash-based incentive based on the achievement of pre-defined targets over the fiscal year. |
| |
| | Individual goals and targets are set on an annual basis. |
| |
| | | Payment is made in September following the finalisation of the audited financial results. |
Target and maximum STI opportunities | | The STI target opportunity is 130% of fixed remuneration for the Group CEO and 100% of fixed remuneration for Senior Executives. |
| |
| | | The actual STI award can range from a minimum of nil to a maximum of 200% of the target opportunity for all Senior Executives. |
| | | | | | |
Performance measures | | | | FINANCIAL MEASURES | | INDIVIDUAL MEASURES |
| | Weighting | | 80% | | 20% |
| | Metrics | | • Based on ROCCE targets1, taking into account Group or business unit cost of capital. • Group Senior Executives – ROCCE is based wholly on overall Group performance. • Regional Senior Executives – ROCCE is based wholly on the results of their own business units. | | • Individual goals are set in several key performance areas which focus on individual initiatives that are critical to the overall success of the Company. They may include: – Safety (ie reduction in certain safety incident metrics) – Environment & Sustainability – Implementation of certain aspects of the Company strategic plan – Talent Management (ie succession planning, management development, etc) – Shareholder and community relations |
| | 1 ROCCE is computed as Profit Before Interest and Taxes (PBIT) divided by Average Controlled Capital Employed (CCE). |
| | |
| | | The Committee understands the desire for greater transparency of specific targets. However, given the Company’s size and position in the industry, we believe disclosing precise financial / individual performance targets would put us at a competitive disadvantage due to commercial sensitivity. |
Rationale for performance measures | | ROCCE has been approved by the Committee as the appropriate financial measure as the Committee believes that ROCCE is a key performance driver of the Group. ROCCE focuses on the effective management of invested capital while encouraging maximisation of operating profits. |
| |
| | | The Company has chosen relevant individual performance measures to drive and reinforce the desired individual behaviours and outcomes, even in difficult economic and financial times. |
Determination of performance measures | | The financial targets for Senior Executives are recommended each year by the Group CEO and reviewed by the Committee for recommendation to the Board for approval. The financial targets for the Group CEO are recommended by the Committee and approved by the Board. The financial targets are determined by taking into consideration stretch performance targets in the context of the economic cycle. |
| |
| | | Individual goals and targets for Senior Executives are established on an annual basis by the Group CEO, taking into consideration the Senior Executive’s required goals to support the Company’s strategic plan. The individual goals and targets for the Group CEO are recommended by the Committee for approval by the Board. |
Assessment of��performance against measures | | A minimum ROCCE threshold must be achieved before any payment is awarded against the ROCCE hurdle. Likewise, a minimum level of performance must be achieved against the individual goals before any payment is awarded against the individual goals. |
| |
| | Payment between threshold and maximum is then determined by reference to ROCCE and individual performance outcomes against the pre-defined individual goals. Once the threshold hurdle is met, awards are linear in calculation until the maximum hurdle is reached. |
| |
| | At the end of the fiscal year, each Senior Executive’s individual performance is assessed based on appropriate ROCCE performance (eg overall Group performance or the relevant business unit performance) and a review of individual performance against pre-defined key performance areas. |
| |
| | The individual’s performance is rated on a scale of 0 to 4. Participants must receive a weighted average rating of at least 2.0 (meets expectations) in order to receive target payment based on the individual performance component. A rating below 1.75 results in no award with regard to the individual performance component. |
| |
| | Senior Executive performance is assessed by the Group CEO, and recommended payments are considered and, if appropriate, approved by the Committee. For the Group CEO, performance is assessed by the Committee and a recommended payment is approved by the Board. The Board maintains full discretion over the level of any STI awards paid to the Group CEO and Senior Executives. For FY13, in the absence of a Group CEO for the year-end evaluation process, the Committee considered Senior Executive individual performance and exercised its discretion to award the related FY13 STI payments. |
| |
| | | Performance against the financial targets is set out in Section E. |
Termination provisions | | A voluntary termination prior to the last calendar day of the fiscal year will result in no STI being paid for the year unless the Committee determines otherwise. Upon a qualifying cessation (ie termination due to death, disability or redundancy), STI performance for the relevant period will be assessed and paid. |
| |
| | | No STI payments will be made in the case of termination for cause. |
D I R E C T O R S’ R E P O R T
Long-Term Incentive Plan (LTI Plan)
The FY13 LTI Plan aligns executive rewards with the shareholder experience through the use of relative TSR and absolute share price. The LTI Plan will be changing for FY14 to increase performance shares to two thirds of the award by introducing a third performance hurdle (EPS). In addition, effective for FY14 and beyond, re-testing will be removed on all new LTI grants.
The commentary below relates to the FY13 LTI Plan. For information on the changes that will be made to the FY14 LTI Plan, see Section A.
The Committee believes that Senior Executive participation in equity-based incentive plans is a key element which aligns executive and shareholder objectives. The LTI Plan is the principal means of allowing Senior Executives the opportunity to be rewarded for the Company’s growth in share price and total shareholder return. The LTI Plan provides a direct link between the value created for shareholders, and the reward earned by Senior Executives. It also assists in the retention of Senior Executives.
The LTI Plan allows for grants of performance rights (rights), options and phantom options. The LTI Plan is designed to focus on two key aspects of future performance. First, rights recognise shareholder value creation relative to companies either within the Company’s industry or of a similar nature, as measured by TSR. Second, options (and phantom options where applicable) reflect creation of absolute shareholder value, as recognised by absolute growth in the Company’s share price.
| | |
Performance Rights | | • A right is a contractual right to acquire an ordinary share for nil consideration. United States participants have their rights settled in American Depositary Shares (ADSs) unless otherwise determined by the Board. |
| |
| | | • Rights reward Senior Executives for relative performance as a relative TSR hurdle must be satisfied in order for the rights to vest. Accordingly, for participants to receive any value from the Plan, the Company’s TSR performance must be above the median of the TSR peer group. |
Options | | • An option is a contract that gives the holder the right, but not the obligation, to acquire an ordinary share at a fixed price over a specified period of time. United States participants have their options settled in ADSs unless otherwise determined by the Board. |
| |
| | | • Options reward Senior Executives for absolute share price performance. This is because the options only have value if the share price exceeds the exercise price at the end of the vesting period. The options are also subject to a continuous service vesting condition. This reflects common market practice in the United States, where the Company competes for much of its talent and business. |
Phantom Options | | • Phantom options operate in the same manner as options; however, they are cash-settled rather than equity-settled. Accordingly, rather than receiving one fully paid ordinary share in the Company upon exercise, the Senior Executive receives the value of one fully paid ordinary share in the Company in cash. |
| |
| | | • Phantom options (as opposed to equity-settled options) have been offered to participants in Australia from 1 July 2010 onwards because of the differing securities laws and taxation treatments. |
The combination of rights and options has enabled the Board to achieve an appropriate balance in terms of ensuring that rewards for Senior Executives are competitive, aligned to the Company’s global business and its shareholders, and reflective of market practice in Australia, the United States and the United Kingdom. This structure of only rewarding Senior Executives when both relative and absolute shareholder value has been created made this Plan one of the more rigorous in the market.
That said, the Committee will be making some changes to the LTI Plan hurdles in FY14 to further align the LTI Plan to Company objectives and to respond to feedback from shareholders and proxy advisers. Refer to Section A for further details.
The following table summarises the LTI Plan as it relates to grants made in FY13.
| | |
Frequency and timing of awards | | • The Company’s shareholders approved an LTI award for the Group CEO at the Company’s 2012 Annual General Meeting (AGM). In conjunction with the AGM, the Committee approved and granted LTI awards for the Senior Executives. |
| |
| | | • Awards are typically made on an annual basis. |
Valuation of grants | | • The fair value of rights and options is calculated by Mercer at their grant date using a Black- Scholes, Binomial or Monte Carlo simulation option pricing model as appropriate. See Note 25 of the financial report for assumptions used in determining the fair value. |
Treatment of dividends | | • Holders of rights and options are not entitled to dividends over the term of the relevant vesting period (and in the case of options, until exercised). |
| | | | | | | | |
| | | OPTIONS / PHANTOM OPTIONS | | RIGHTS |
Performance measure and rationale | | • In order for options to deliver value to participants, the Company’s share price must increase above the exercise price. This aligns the award’s value to absolute growth in shareholder wealth. | | • In order for rights to vest, the Company’s TSR must be at the 51stpercentile or higher against the TSR peer group. Above the 51stpercentile, vesting is prorated, with full vesting occurring at the 75thpercentile. This aligns the vesting of Senior Executive awards to relative shareholder wealth creation. |
Performance / exercise period | | • Options generally vest in three equal instalments over a three-year period. This vesting schedule reflects common market practice in the United States.1 | | • Performance is measured over an initial three - year period starting 1 July 2012 through 30 June 2015, with two potential annual re-tests at Year 4 (30 June 2016) and Year 5 (30 June 2017). |
| | |
| | • Options expire seven years after the date of grant. | | • The potential tests at Year 4 and Year 5 will be measured over the extended four-year and five-year periods respectively. Any unvested rights outstanding at the end of Year 5 will immediately lapse. |
| | |
| | | | | • In light of feedback from shareholders and proxy advisors, re-testing will be removed from LTI grants commencing in FY14 and beyond. |
Exercise price | | • The exercise price of options is set at grant, and is equal to the average closing share price for the five days preceding the grant date2. | | • Nil |
TSR peer group | | • N/A | | • The following companies comprise the FY13 TSR peer group, chosen from comparable industry sectors: |
| | | | | | PEER COMPANIES |
| | | | | | AK Steel | | Nucor |
| | | | | | Alcoa | | POSCO |
| | | | | | Allegheny Technologies | | Reliance Steel |
| | | | | | ArcelorMittal | | Schnitzer Steel |
| | | | | | Arrium | | Steel Dynamics |
| | | | | | BlueScope Steel | | Tokyo Steel |
| | | | | | Commercial Metals | | U.S. Steel |
| | | | | | Gerdau | | |
| | | | | | | | | |
Vesting schedule | | • N/A | | • The vesting schedule against the relative TSR hurdle is: |
| | | | |
| | | | | | TSR GROWTH RELATIVE | | PROPORTION OF TSR |
| | | | | | TO THE PEER GROUP | | GRANT VESTING |
| | | | | | Less than | | 0% |
| | | | | | 51st percentile | | |
| | | | | | 51st percentile | | 50% |
| | | | | | 51st percentile | | Pro-rata straight line |
| | | | | | to 75th percentile | | |
| | | | | | 75th percentile | | 100% |
| | | | | | or higher | | |
| | | | | | | | | |
Treatment of awards on termination of employment | | • Where participants resign, or are terminated for cause, awards are forfeited. • Where termination of employment is the result of a qualifying cessation (ie death, total or permanent disablement, or other circumstances at the discretion of the Board), participants will be entitled to unvested awards in accordance with the original vesting schedule. |
| | | • At the Board’s discretion, any unvested awards will continue to be held by eligible terminated participants and will be tested at the end of the initial performance period. Any unvested awards lapse at the end of the initial performance period, subject to the Board’s discretion. |
Treatment of awards on change of control | | • A change in control of the Company may trigger full vesting of awards in certain circumstances, subject to Board discretion. |
| 1 | Each instalment vests on the last business day of August in 2013, 2014 and 2015 |
| 2 | For United States-based Senior Executives, option awards are not Incentive Stock Options for the purposes of section 422 of the United States Internal Revenue Code. |
D I R E C T O R S’ R E P O R T
Guidelines for Group CEO approval of Discretionary Awards
The guidelines for Group CEO approval authority limits for individual discretionary cash awards and aggregate discretionary cash and / or equity awards are:
| • | | Individual awards:Any individual discretionary cash award in excess of US$500,000 must be presented to the Committee for approval. |
| • | | Aggregate awards:If the aggregate sum of the cash and / or equity award per occurrence is in excess of the Group CEO Discretionary Capital Expenditure authority (currently US$1,000,000), then it must be presented to the Committee for approval. |
Securities Trading Policy
The trading of securities issued to participants pursuant to the LTI Plan is subject to, and conditional upon, compliance with the terms of the Company’s policy titled ‘Dealings in Sims Metal Management Limited Securities’ (a copy of which is available on the Company’s website at www.simsmm.com). Senior Executives are prohibited from entering into any hedging arrangements over unvested awards under the LTI Plan. The Company would consider a breach of the Securities Trading Policy as serious misconduct, which may lead to disciplinary action up to and including dismissal.
| E: | REMUNERATION OUTCOMES FOR SENIOR EXECUTIVES DURING FY13, INCLUDING DISCUSSION OF THE LINKAGE BETWEEN ‘AT-RISK’ REMUNERATION AND COMPANY PERFORMANCE |
Overview of the link between remuneration and performance
Outlined below is the Company’s performance against key metrics over the past five fiscal years.
| | | | | | | | | | | | | | | | | | | | |
| | | FISCAL YEAR | |
| | | 20131 | | | 20121,2 | | | 20112 | | | 20102 | | | 20091 | |
(Loss)/Profit Before Interest and Tax (A$m) | | | (469.4 | ) | | | (623.3 | ) | | | 293.1 | | | | 198.3 | | | | (105.6 | ) |
Diluted EPS (cents) | | | (228.1 | ) | | | (302.4 | ) | | | 90.9 | | | | 61.8 | | | | (82.5 | ) |
Return on Shareholders’ Equity | | | (24.2% | ) | | | (27.3% | ) | | | 6.4% | | | | 3.7% | | | | (5.3% | ) |
Total dividends (cents) | | | 0.0 | | | | 20.0 | | | | 47.0 | | | | 33.0 | | | | 38.0 | |
Share price at 30 June A$ | | | 8.26 | | | | 9.61 | | | | 17.65 | | | | 17.11 | | | | 26.51 | |
| 1 | FY13, FY12 and FY09 reflect goodwill and other intangible impairment charges of A$304.4 million, A$675.6 million and A$191.1 million respectively. |
| 2 | Previously reported amounts have been restated. See Note 2 of the financial report. |
The Board considers performance against Profit Before Interest and Tax (PBIT) in the STI Plan because it is this figure divided by Average Controlled Capital Employed that determines ROCCE.
The TSR graph below compares the Company’s (ASX: SGM) TSR against the peer group (as referenced above) for the five-year period ending 30 June 2013. TSR is the return to shareholders provided by share price appreciation plus dividends (which are assumed to be reinvested in the Company’s shares) expressed as a percentage of the share price at the beginning of the measurement period, adjusted where appropriate for bonus issues, capital consolidation or equivalents. As the Company’s TSR has been below the median against its peer group of companies, there has been no vesting under the LTI Plan, against the relative TSR hurdle, since FY11.
Cumulative Total Shareholder Return (TSR) (%)
Sims Metal Management against the TSR peer group (excluding the Company).
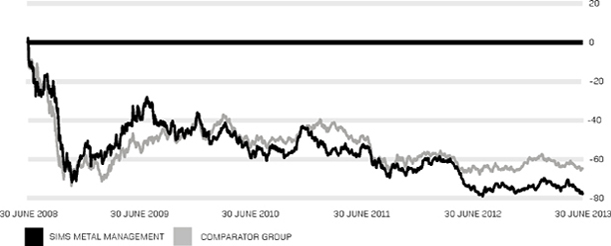
Short-term incentives
STI measures are based on financial performance (ROCCE) and individual performance measures. The table below outlines FY13 Group and business unit performance against the STI ROCCE targets. Below threshold performance results in no financial payout.
| | | | |
| NAME | | BUSINESS UNIT | | ROCCE PERFORMANCE |
D Dienst | | Group | | Below threshold |
G Davy | | Global SRS (excluding United Kingdom SRS) | | Below threshold |
G Davy | | United Kingdom Metals/United Kingdom SRS | | Below threshold |
R Kelman | | North America Metals | | Below threshold |
R Larry | | Group | | Below threshold |
D McGree | | Australia Metals | | Below threshold |
D McGree | | New Zealand Metals | | Above threshold |
The following table outlines the proportion of the target STI that was earned and forfeited in relation to FY13. Both ROCCE and individual performance influences individual STI payments.
| | | | | | | | | | | | | | | | |
| NAME | | PROPORTION OF TARGET STI EARNED DURING FY13 | | | PROPORTION OF TARGET STI FORFEITED DURING FY13 | | | PROPORTION OF TARGET STI EARNED DURING FY12 | | | PROPORTION OF TARGET STI FORFEITED DURING FY12 | |
D Dienst1 | | | 33% | | | | 67% | | | | 20% | | | | 80% | |
G Davy2 | | | 0% | | | | 100% | | | | 41% | | | | 59% | |
R Kelman | | | 17% | | | | 83% | | | | 20% | | | | 80% | |
R Larry | | | 0% | | | | 100% | | | | 20% | | | | 80% | |
D McGree | | | 35% | | | | 65% | | | | 34% | | | | 66% | |
| 1 | Mr Dienst retired on 30 June 2013. In consideration of Mr Dienst’s achievement against additional Personal Priorities throughout the year, the Board exercised its discretion to award Mr Dienst with a total STI payment of one-third of his STI opportunity. The additional Personal Priorities included assisting the Company’s executive search firm to define the parameters for the new Group CEO, managing the process around the consideration of internal candidates and assisting with the establishment of the interim management structure. |
| 2 | Mr Davy left the Company on 19 March 2013 and forfeited his STI award. |
Long-term incentives
The table below outlines the percentage of the FY08, FY09 and FY10 rights that vested during FY13. For transparency, the historical levels of vesting associated with these grants has also been shown, along with the total percentage of the grant that has either vested or been forfeited (on aggregate).
Any grants made subsequent to FY10 are not eligible for vesting in FY13 and therefore have not been included in the table below.
| | | | | | | | | | | | | | | | | | | | |
| GRANT / HURDLE1 | | % OF RIGHTS THAT VESTED IN FY11 | | | % OF RIGHTS THAT VESTED IN FY12 | | | % OF RIGHTS THAT VESTED IN FY13 | | | TOTAL % OF RIGHTS THAT VESTED | | | TOTAL % OF RIGHTS THAT WERE FORFEITED | |
FY08 grant | | | | | | | | | | | | | | | | | | | | |
Relative TSR2 | | | 59.6 | 3 | | | 0 | 4 | | | 0 | 5 | | | 59.6 | | | | 40.4 | 5 |
EPS6 | | | 0 | | | | 0 | | | | 0 | | | | 0 | | | | 100 | 6 |
EBITDA7 | | | 56.2 | | | | 43.8 | | | | n/a | | | | 100 | 7 | | | 0 | |
FY09 grant8 | | | | | | | | | | | | | | | | | | | | |
Relative TSR | | | n/a | | | | 0 | 9 | | | 0 | 10 | | | 0 | | | | 0 | 11 |
FY10 grant12 | | | | | | | | | | | | | | | | | | | | |
Relative TSR | | | n/a | | | | n/a | | | | 0 | 13 | | | 0 | | | | 0 | 14 |
| 1 | Each instalment vests on the date of earnings release, being in the fiscal year following the test date. |
| 2 | The FY08 TSR rights had an initial performance period from 1 July 2007 to 30 June 2010 (3 years). They were re-tested on 30 June 2011 (after 4 years) and on 30 June 2012 (after 5 years). |
| 3 | This equated to a TSR percentile rank of 55.6%. |
| 4 | No additional rights vested in Year 4 because the TSR percentile rank was lower than the 55.6% achieved in Year 3. |
| 5 | No additional rights vested in Year 5 because the TSR percentile rank was lower than the 55.6% achieved in Year 3. Due to this, 40.4% of the rights lapsed in August 2012. |
| 6 | The FY08 EPS rights were fully forfeited in FY13 as the hurdle was not achieved. |
| 7 | The FY08 EBITDA rights fully vested in FY12. |
| 8 | The FY09 rights had an initial performance period from 1 July 2008 to 30 June 2011 (3 years). They were re-tested on 30 June 2012 (after 4 years) and on 30 June 2013 (after 5 years). |
| 9 | The TSR percentile rank was less than the 51st percentile. Accordingly, there was no vesting. |
| 10 | The TSR percentile rank was less than the 51st percentile. Accordingly, there was no vesting. |
| 11 | None of the FY09 rights were forfeited during the fiscal year because they stay on-foot until 23 August 2013. That said, the last test date was 30 June 2013 and the TSR percentile rank on this date was lower than the 51st percentile. Accordingly, all of the FY09 rights will lapse in FY14. |
| 12 | The FY10 rights had an initial performance period from 1 July 2009 to 30 June 2012 (3 years). They were re-tested on 30 June 2013 (after 4 years) and will be re-tested again on 30 June 2014 (after 5 years). |
| 13 | The TSR percentile rank was less than the 51st percentile. Accordingly, there was no vesting. |
| 14 | The FY10 rights remain on-foot until August 2014. Accordingly, no rights were forfeited during FY13. They were re-tested on 30 June 2013 and the TSR percentile rank was below the 51st percentile. Accordingly, no additional rights will vest in FY14. |
D I R E C T O R S’ R E P O R T
Statutory Executive Remuneration Disclosures
Certain Senior Executives (as disclosed below) are not residents of Australia. Their respective remuneration paid in foreign currency has been converted to Australian dollars at an average exchange rate for the year. Accordingly, exchange rate movements may influence the disclosed fee level.
| | | | | | | | | | | | | | | | | | | | | | | | | | | | | | | | |
| | | | | | | SHORT-TERM BENEFITS | | | POST-EMPLOYMENT
BENEFITS | | | | | | | | | | |
| (A$) | | LOCATION | | FISCAL YEAR | | CASH SALARY1 | | | CASH BONUS2 | | | OTHER BENEFITS3 | | | PENSION AND SUPERANNUATION | | | OTHER LONG-
TERM BENEFITS4 | | | SHARE-BASED
PAYMENTS5 | | | TOTAL | |
Senior Executives (including the Executive Director and Group CEO) | |
D Dienst6 | | USA | | 2013 | | | 1,363,061 | | | | 590,660 | | | | 100,339 | | | | 56,828 | | | | 4,868 | | | | 6,855,231 | | | | 8,970,987 | |
| | | | | 2012 | | | 1,288,885 | | | | 819,653 | | | | 109,473 | | | | 37,594 | | | | – | | | | 4,281,770 | | | | 6,537,375 | |
G Davy6,7 | | UK | | 2013 | | | 392,907 | | | | – | | | | 23,952 | | | | 31,476 | | | | – | | | | (476,441 | ) | | | (28,106 | ) |
| | | | | 2012 | | | 526,691 | | | | 244,274 | | | | 32,107 | | | | 25,023 | | | | – | | | | 701,230 | | | | 1,529,325 | |
R Kelman6 | | USA | | 2013 | | | 705,872 | | | | 120,000 | | | | 33,980 | | | | 30,342 | | | | 4,868 | | | | 639,792 | | | | 1,534,854 | |
| | | | | 2012 | | | 668,669 | | | | 133,686 | | | | 92,863 | | | | 29,222 | | | | 4,845 | | | | 638,123 | | | | 1,567,408 | |
R Larry6 | | USA | | 2013 | | | 666,937 | | | | – | | | | 69,252 | | | | 28,778 | | | | 4,868 | | | | 741,083 | | | | 1,510,918 | |
| | | | | 2012 | | | 644,442 | | | | 128,888 | | | | 131,998 | | | | 29,734 | | | | 4,845 | | | | 852,834 | | | | 1,792,741 | |
D McGree | | Australia | | 2013 | | | 718,410 | | | | 264,753 | | | | 22,567 | | | | 33,830 | | | | 63,908 | | | | 437,830 | | | | 1,541,298 | |
| | | | | 2012 | | | 621,557 | | | | 244,923 | | | | 2,362 | | | | 108,773 | | | | 19,430 | | | | 393,231 | | | | 1,390,276 | |
A Ratner6,8 | | USA | | 2013 | | | – | | | | – | | | | – | | | | – | | | | – | | | | – | | | | – | |
| | | | | 2012 | | | 644,442 | | | | 128,888 | | | | 51,065 | | | | 18,015 | | | | – | | | | 638,123 | | | | 1,480,533 | |
Total Executive Director and | | 2013 | | | 3,847,187 | | | | 975,413 | | | | 250,090 | | | | 181,254 | | | | 78,512 | | | | 8,197,495 | | | | 13,529,951 | |
Group CEO & Senior Executives | | 2012 | | | 4,394,686 | | | | 1,700,312 | | | | 419,868 | | | | 248,361 | | | | 29,120 | | | | 7,505,311 | | | | 14,297,658 | |
| 1 | Cash salary includes amounts sacrificed in lieu of other benefits at the discretion of the individual. |
| 2 | Cash bonus amounts for FY13 and FY12 reflect the amounts accrued for all Senior Executives under the FY13 and FY12 STI Plans respectively. The cash bonus for Mr Dienst in FY12 included a one-off payment of US500,000 in exchange for an agreement to extend his existing contract through 30 June 2013. |
| 3 | Other short-term benefits include auto allowances, health and life insurance benefits, amounts accrued for annual leave during the period and personal security payments (for Mr Dienst). For US employees, it also includes a Paid Time Off policy which includes a carry-over feature of up to twice the annual entitlement. The amount for Mr Larry in FY12 included a one-time reimbursement (plus related gross-up) of expenses incurred arising from a medical injury that occurred while travelling internationally on Company business. |
| 4 | Other long-term benefits include amounts accrued for cash-based long-term incentive plans, long-service leave (for Mr McGree) and deferred compensation plans (for Messrs Dienst, Kelman and Larry). |
| 5 | Share-based payments represent the accounting expense (as computed pursuant to AASB 2 (IFRS 2), ‘Share-based Payments’) recognised by the Company for share-based awards. For Mr Dienst, this includes US$3,459,082 (A$3,367,814) attributed to acceleration of expense as a result of his good leaver provision in retirement. |
| 6 | Messrs Dienst, Kelman, Larry and Ratner receive/d their cash payments in United States dollars. Mr Davy received his cash payments in pounds sterling. |
| 7 | Mr Davy left the Company on 19 March 2013. Mr Davy’s 2013 remuneration disclosed above reflects his remuneration for the period 1 July 2012 to 19 March 2013. Mr Davy did not receive any termination benefits. |
| 8 | Mr Ratner’s FY12 remuneration reflects his full remuneration for FY12 in the capacity of President – Operations North America (1 July 2011 to 31 January 2012) and Group Executive Vice President – Operations and SHEC (1 February 2012 to 30 June 2012). He ceased to be a KMP as of 31 January 2012. Accordingly, no remuneration has been disclosed for FY13. |
Fixed and actual ‘at-risk’ remuneration for FY13
Outlined below is the percentage of the Senior Executives’ FY13 remuneration that was fixed and ‘at-risk’ based upon the statutory remuneration table. The percentage of their remuneration that consisted of rights and options is also disclosed.
| | | | | | | | | | | | | | | | |
| | | FIXED REMUNERATION % | | | ‘AT-RISK’ REMUNERATION % | | | REMUNERATION CONSISTING OF RIGHTS % | | | REMUNERATION CONSISTING OF OPTIONS % | |
Senior Executives | | | | | | | | | | | | | | | | |
D Dienst | | | 17 | | | | 83 | | | | 54 | | | | 22 | |
R Kelman | | | 50 | | | | 50 | | | | 21 | | | | 21 | |
R Larry | | | 51 | | | | 49 | | | | 26 | | | | 23 | |
D McGree | | | 54 | | | | 46 | | | | 21 | | | | 7 | |
Mr Davy left the Company on 19 March 2013 and the Company reversed an expense associated with his share-based payment. As this reversal resulted in a negative number, the calculation of his remuneration that was fixed and at-risk is not meaningful.
F: SENIOR EXECUTIVE CONTRACTS
Executive Director and Group CEO
The Executive Director and Group CEO, Mr Dienst, retired from the Group, and resigned as a Director, on 30 June 2013. The Company has entered into a consulting arrangement with Mr Dienst.
Employment contract
During Mr Dienst’s employment, the key terms of his contract were:
| • | | Mr Dienst entered into an employment contract with Metal Management, Inc. (MMI) on 26 July 2007. This contract was amended as of 1 August 2009 and was due to expire on 30 June 2012. Last fiscal year, the Company made a one-off payment to Mr Dienst of US$500,000 to extend the expiry / term of his contract through 30 June 2013. Mr Dienst’s employment contract expired on 30 June 2013 and he ceased to be employed by the Company as of this date. |
| • | | The amended employment contract with the Company required that Mr Dienst pay back up to US$3 million (Clawback Amount), amortising over a four-year period, should he resign or terminate his agreement other than for good reason, as defined by the agreement. There was no amortisation amount included in the remuneration table for FY13 as the Clawback Amount was fully amortised in FY12. |
| • | | Under the original agreement with MMI, if Mr Dienst was terminated involuntarily other than for cause, the Company was required to continue to pay Mr Dienst his fixed remuneration and target bonus for 24 months following termination. In addition, per the original agreement, and as previously disclosed in prior years, all unvested options, share grants, and any unvested LTI Plan compensation, would vest upon early involuntary termination. Going forward, for all new Senior Executives, the Committee has committed to structuring termination benefits in line with Australian market practice. |
| • | | Prior to the merger between MMI and the former Sims Group Limited, the MMI Board amended certain grants of performance rights pursuant to Mr Dienst’s previous employment contract with MMI which caused vesting of such performance rights upon a change of control. |
Benefits received upon retirement
Upon his retirement on 30 June 2013, Mr Dienst received no severance payment and no payment in lieu of notice. He received an STI award of US$606,667 (A$590,660), being one third of his target STI opportunity. Further information on the basis of this award is disclosed in Section E.
The Board exercised its discretion to determine that Mr Dienst’s cessation of employment was a ‘qualifying cessation’ under the LTI Plan rules. As such, the options issued to Mr Dienst under the LTI Plan that have not vested will vest in accordance with their respective original vesting schedules through August 2015. The Board further exercised its discretion to allow for additional limited re-testing. As such, the performance rights previously granted to Mr Dienst in November 2010, 2011 and 2012 will continue to be tested in accordance with the LTI Plan rules up to June 2015.
The performance rights previously granted to Mr Dienst in November 2008 and 2009 lapsed on 30 June 2013. The options issued to Mr Dienst under the LTI Plan that have vested will continue to be exercisable until their original expiration dates.
D I R E C T O R S ’ R E P O R T
Consulting agreement
Mr Dienst has entered into a consulting agreement with the Company effective from 1 July 2013. As disclosed by the Company to the Australian Securities Exchange on 6 June 2013, the material terms of the consultancy agreement are:
| • | | Term of up to 12 months; |
| • | | Duties and responsibilities shall include: |
| | – | assisting, as reasonably requested, the transition into the Company of the new CEO; |
| | – | providing advice to the Chairman of the Company on SHEC safety related matters; and |
| | – | assisting with the Company’s strategy in China; |
| • | | Mr Dienst will make himself available up to an average of 12 days per month; |
| • | | Consulting fee of US$50,000 per month, as well as reasonable expenses associated with the consultancy; |
| • | | During the term and, if the agreement continues for its full term until 30 June 2014, for a period of three months thereafter, Mr Dienst will not engage in any business or activity which is directly or indirectly in competition with that of the Company. |
Senior Executives
The details of executive contracts for Senior Executives, other than Mr Davy who left the Company on 19 March 2013, are summarised below:
| | |
| Contract term | | • Mr McGree has a fixed term contract with automatic renewal. • Mr Larry’s contract, which expired on 30 June 2012, was allowed to automatically renew through 30 June 2013 and again through 30 June 2014 in accordance with the terms of the agreement. • Mr Kelman does not have an employment contract. |
| Notice period | | • Contracts typically may not be terminated during the fixed term, other than for cause. • For Mr McGree, after the expiration of his term, the Company must provide 12 months prior written notice or payment in lieu of notice. The Senior Executive is required to provide three months prior written notice to terminate the agreement. |
Termination provisions (other than for cause) | | • Mr Larry is entitled to receive an amount equivalent to 12 months base salary and all unvested options, share grants and LTI Plan awards vest in accordance with their original vesting schedule. • Mr McGree may have his contract terminated by the Company provided he receives 12 months prior written notice of termination or payment in lieu of notice based on his remuneration package. |
| Change of control | | • Mr Larry is entitled to an amount equal to two times his fixed remuneration, and all unvested share awards will vest, if his employment is terminated within 12 months as a result of change in control. This clause is part of a legacy arrangement with MMI and will be addressed in any negotiations between Mr Larry and the Company in respect of the renewal of his contract with effect from 1 July 2014. • Mr McGree is entitled to a payment equivalent to six months total annual remuneration if he remains in the employ of the employer six months after a takeover of the Company (or if he is terminated within six months of such a takeover). |
| Redundancy | | • In the event of redundancy, Mr McGree is entitled to the greater of 12 months’ notice or payment in lieu, or a benefit calculated by reference to the Sims Metal Management Redundancy Policy up to a maximum of 18 months’ remuneration depending upon years of service. |
G: SHARE-BASED PAYMENT DISCLOSURES
Options provided as remuneration
The following table summarises the terms of outstanding option grants (and phantom option grants where applicable) for the Senior Executives.
| | | | | | | | | | | | | | | | | | | | | | | | | | |
| NAME | | GRANT DATE | | NUMBER GRANTED | | | EXERCISE PRICE | | | FAIR VALUE AT GRANT DATE | | | DATE NEXT TRANCHE CAN BE EXERCISED | | EXPIRY DATE | | % OF OPTIONS THAT HAVE VESTED | | | MAXIMUM TOTAL VALUE OF UNVESTED GRANT1 | |
| Ordinary Shares (A$) | | | | | | | | | | | | | | | | | | | | | | | | | | |
D McGree | | 30 Nov 10 | | | 56,562 | 2 | | | $17.62 | | | | $0.40 | 2 | | 23 Aug 13 | | 30 Nov 17 | | | 66.7% | | | | $471 | |
| | 11 Nov 11 | | | 87,260 | 2 | | | $13.07 | | | | $0.89 | 2 | | 23 Aug 13 | | 11 Nov 18 | | | 33.3% | | | | $13,881 | |
| | | 16 Nov 12 | | | 146,268 | 2 | | | $9.29 | | | | $1.69 | 2 | | 30 Aug 13 | | 16 Nov 19 | | | 0% | | | | $139,490 | |
| ADS (US$) | | | | | | | | | | | | | | | | | | | | | | | | | | |
D Dienst | | 22 Nov 10 | | | 203,908 | | | | $16.73 | | | | $6.19 | | | 23 Aug 13 | | 22 Nov 17 | | | 66.7% | | | | $–3 | |
| | 11 Nov 11 | | | 283,695 | | | | $13.37 | | | | $4.52 | | | 23 Aug 13 | | 11 Nov 18 | | | 33.3% | | | | $–3 | |
| | | 16 Nov 12 | | | 487,814 | | | | $9.49 | | | | $2.18 | | | 30 Aug 13 | | 16 Nov 19 | | | 0% | | | | $–3 | |
R Kelman | | 30 Nov 10 | | | 50,977 | | | | $16.98 | | | | $6.14 | | | 23 Aug 13 | | 30 Nov 17 | | | 66.7% | | | | $7,152 | |
| | 11 Nov 11 | | | 70,924 | | | | $13.37 | | | | $4.52 | | | 23 Aug 13 | | 11 Nov 18 | | | 33.3% | | | | $58,823 | |
| | | 16 Nov 12 | | | 157,886 | | | | $9.49 | | | | $2.18 | | | 30 Aug 13 | | 16 Nov 19 | | | 0% | | | | $193,482 | |
R Larry | | 30 Nov 10 | | | 63,721 | | | | $16.98 | | | | $6.14 | | | 23 Aug 13 | | 30 Nov 17 | | | 66.7% | | | | $8,941 | |
| | 11 Nov 11 | | | 88,655 | | | | $13.37 | | | | $4.52 | | | 23 Aug 13 | | 11 Nov 18 | | | 33.3% | | | | $73,528 | |
| | | 16 Nov 12 | | | 149,175 | | | | $9.49 | | | | $2.18 | | | 30 Aug 13 | | 16 Nov 19 | | | 0% | | | | $182,808 | |
| 1 | No options will vest if the vesting conditions are not satisfied, hence the minimum value of unvested awards is nil. The maximum value of the unvested awards has been determined as the amount of the grant date fair value that is yet to be expensed. |
| 2 | Represents a cash-settled phantom option grant. In accordance with AASB 2 (IFRS 2), the fair value is as of the end of the reporting period. |
| 3 | Mr Dienst retired on 30 June 2013 as a ‘Qualified Cessation’ in accordance with the LTI Plan rules. The maximum value of the unvested award is nil as the remaining fair value of the awards was fully expensed in FY13. |
The following table summarises the option holdings of the Senior Executives for FY13.
| | | | | | | | | | | | | | | | | | | | | | | | | | | | | | | | | | | | |
| NAME | | BALANCE AT 1 JULY 2012 | | | NUMBER GRANTED | | | NUMBER EXERCISED | | | NUMBER LAPSED | | | BALANCE AT 30 JUNE 2013 | | | NUMBER OF OPTIONS VESTED DURING FY13 | | | NUMBER OF VESTED OPTIONS HELD AT 30 JUNE 2013 | | | VALUE OF OPTIONS GRANTED DURING FY13 | | | VALUE OF OPTIONS THAT WERE EXERCISED OR SOLD DURING FY13 | |
Ordinary Shares (A$) | | | | | | | | | | | | | | | | | | | | | | | | | | | | | | | | | | | | |
G Davy1 | | | 199,927 | | | | – | | | | – | | | | (199,927 | ) | | | – | | | | – | | | | – | | | | – | | | | – | |
D McGree2 | | | 238,264 | | | | 146,268 | | | | – | | | | – | | | | 384,532 | | | | 63,577 | | | | 161,237 | | | | 247,339 | | | | – | |
| ADS (US$) | | | | | | | | | | | | | | | | | | | | | | | | | | | | | | | | | | | | |
D Dienst | | | 1,075,640 | 3 | | | 487,814 | | | | – | | | | – | | | | 1,563,454 | 3 | | | 221,881 | | | | 818,541 | | | | 1,063,434 | | | | – | |
R Kelman | | | 196,036 | | | | 157,886 | | | | – | | | | – | | | | 353,922 | | | | 55,605 | | | | 131,761 | | | | 344,191 | | | | – | |
R Larry | | | 318,098 | | | | 149,175 | | | | – | | | | – | | | | 467,273 | | | | 69,507 | | | | 237,755 | | | | 325,202 | | | | – | |
| 1 | Mr Davy left the Company on 19 March 2013 and all of his vested and unvested options were forfeited. |
| 2 | Includes cash-settled option grants. |
| 3 | Balance includes 410,000 options which were assumed as a result of the merger with MMI. |
D I R E C T O R S ’ R E P O R T
Rights provided as remuneration
The table below summarises the terms of outstanding rights. None of these rights have vested.
| | | | | | | | | | | | | | | | | | |
| NAME | | GRANT DATE | | NUMBER GRANTED | | | FAIR VALUE AT GRANT DATE | | | DATE NEXT TRANCHE VESTS | | EXPIRY DATE | | MAXIMUM TOTAL VALUE
OF UNVESTED GRANT1 | |
Ordinary Shares (A$) | | | | | | | | | | | | | | | | | | |
D McGree | | 02 Apr 09 | | | 16,313 | | | | $15.46 | | | 23 Aug 13 | | 23 Aug 13 | | | – | |
| �� | 23 Nov 09 | | | 20,728 | | | | $15.97 | | | 23 Aug 13 | | 31 Aug 14 | | | – | |
| | 30 Nov 10 | | | 24,517 | | | | $14.04 | | | 23 Aug 13 | | 31 Aug 15 | | | $18,430 | |
| | 11 Nov 11 | | | 35,178 | | | | $10.42 | | | 31 Aug 14 | | 31 Aug 16 | | | $135,163 | |
| | | 16 Nov 12 | | | 54,589 | | | | $5.29 | | | 31 Aug 15 | | 31 Aug 17 | | | $197,675 | |
ADS (US$) | | | | | | | | | | | | | | | | | | |
D Dienst2 | | 22 Nov 10 | | | 271,865 | | | | $9.09 | | | 23 Aug 13 | | 31 Aug 15 | | | – | |
| | 11 Nov 11 | | | 332,916 | | | | $8.24 | | | 31 Aug 14 | | 31 Aug 16 | | | – | |
| | | 16 Nov 12 | | | 511,883 | | | | $4.12 | | | 31 Aug 15 | | 31 Aug 17 | | | – | |
R Kelman | | 02 Apr 09 | | | 38,580 | | | | $10.32 | | | 23 Aug 13 | | 23 Aug 13 | | | – | |
| | 23 Nov 09 | | | 25,531 | | | | $11.99 | | | 23 Aug 13 | | 31 Aug 14 | | | – | |
| | 30 Nov 10 | | | 33,983 | | | | $9.29 | | | 23 Aug 13 | | 31 Aug 15 | | | $16,903 | |
| | 11 Nov 11 | | | 41,615 | | | | $8.24 | | | 31 Aug 14 | | 31 Aug 16 | | | $126,443 | |
| | | 16 Nov 12 | | | 82,838 | | | | $4.12 | | | 31 Aug 15 | | 31 Aug 17 | | | $233,625 | |
R Larry | | 02 Apr 09 | | | 48,225 | | | | $10.32 | | | 23 Aug 13 | | 23 Aug 13 | | | – | |
| | 23 Nov 09 | | | 31,914 | | | | $11.99 | | | 23 Aug 13 | | 31 Aug 14 | | | – | |
| | 30 Nov 10 | | | 42,479 | | | | $9.29 | | | 23 Aug 13 | | 31 Aug 15 | | | $21,129 | |
| | 11 Nov 11 | | | 52,018 | | | | $8.24 | | | 31 Aug 14 | | 31 Aug 16 | | | $158,052 | |
| | | 16 Nov 12 | | | 78,268 | | | | $4.12 | | | 31 Aug 15 | | 31 Aug 17 | | | $220,736 | |
| 1 | No performance rights will vest if the vesting conditions are not satisfied, hence the minimum value of unvested awards is nil. The maximum value of the unvested performance rights has been determined as the amount of the grant date fair value that is yet to be expensed. |
| 2 | Mr Dienst retired as a Director and Group CEO on 30 June 2013. In accordance with the terms of the LTI Plan, Mr Dienst’s 2010, 2011 and 2012 performance rights will continue to be tested in accordance with the LTI Plan rules up to June 2015. The maximum value of the unvested grant is nil as in accordance with AASB 2 (IFRS 2), the remaining fair value of the grants were required to be fully expensed on the date of his retirement. |
The following table summarises the rights holdings of the Senior Executives for FY13.
| | | | | | | | | | | | | | | | | | | | |
| NAME | | BALANCE AT 1 JULY 2012 | | | NUMBER GRANTED | | | NUMBER VESTED | | | NUMBER FORFEITED | | | BALANCE AT 30 JUNE 2013 | |
Ordinary Shares (A$) | | | | | | | | | | | | | | | | | | | | |
G Davy1 | | | 121,760 | | | | – | | | | – | | | | (121,760 | ) | | | – | |
D McGree | | | 112,478 | | | | 54,589 | | | | – | | | | (15,742 | ) | | | 151,325 | |
ADS (US$) | | | | | | | | | | | | | | | | | | | | |
D Dienst | | | 862,879 | | | | 511,883 | | | | – | | | | (258,098 | ) | | | 1,116,664 | |
R Kelman | | | 158,091 | | | | 82,838 | | | | – | | | | (18,382 | ) | | | 222,547 | |
R Larry | | | 179,897 | | | | 78,268 | | | | (5,261 | ) | | | – | | | | 252,904 | |
| 1 | Mr Davy left the Company on 19 March 2013 and all of his unvested rights were forfeited. |
H: NON-EXECUTIVE DIRECTOR REMUNERATION
Non-Executive Directors (NEDs) receive a base fee and also further fees for chairmanship of a Board Committee. Consistent with their governance role, NEDs do not participate in any incentive plans. Given the Group’s performance, the Board resolved to reduce NED fees by 10% for FY14.
Approach to determining Non-Executive Director fees
Remuneration for NEDs recognises the need to reward directors for their commitment to the corporate governance of the Company, their active participation in the affairs of the business and the contribution they make generally to the maximisation of shareholder value. The Company aims to provide a level of remuneration for NEDs taking into account, among other things, fees paid for similar roles in comparable companies, the time commitment, risk and responsibility accepted by NEDs, and recognition of their commercial expertise and experience.
Non-Executive Directors’ fees
The total amount of fees, including superannuation, for all NEDs must not exceed the limit approved by shareholders. The last approval was for A$3,000,000 per annum approved at the 2009 AGM. The Board has resolved to reduce NED fees by 10% for FY14. Accordingly, no increase to the NED fee pool will be sought at the Company’s 2013 AGM. The Board intends to revert to full fees in FY15.
Under the current fee framework, NEDs receive a base fee and also receive further fees for chairmanship of a Board Committee. There are no additional fees for membership of a Committee. The table below outlines fees for FY13 and FY14.
| | | | | | | | |
| | | FISCAL YEAR | |
| NED FEES (AUD) | | 2013 | | | 2014* | |
Base fee (Chairperson) | | | 450,528 | | | | 405,475 | |
Base fee (NED) | | | 203,424 | | | | 183,082 | |
Chairperson Risk, Audit & Compliance Committee | | | 65,000 | | | | 58,500 | |
Chairperson Safety, Health, Environment & Community Committee | | | 35,000 | | | | 31,500 | |
Chairperson Remuneration Committee | | | 35,000 | | | | 31,500 | |
Chairperson Finance & Investment Committee | | | 35,000 | | | | 31,500 | |
Chairperson Nomination/Governance Committee | | | 35,000 | | | | 31,500 | |
| * | Reflecting 10% reduction in NED fees. |
NEDs also receive reimbursement for reasonable travel, accommodation and other expenses incurred in travelling to or from meetings of the Board, or when otherwise engaged in the business of the Company in accordance with Board policy.
NEDs are not currently covered by any contract of employment; therefore, they have no contract duration, notice period for termination, or entitlement to termination payments other than as noted below under Retirement benefits.
NED equity arrangements
NEDs do not participate in any incentive (cash or equity-based) arrangements. Mr Morris holds options as a result of grants made by MMI prior to the merger with the former Sims Group Limited in March 2008.
Superannuation and retirement benefits
For Australian resident NEDs, superannuation is paid in addition to the above fees. The Company pays superannuation at 9% (increasing to 9.25% in FY14) for each Australian resident NED, as required by legislation. Superannuation is not paid for overseas directors.
The Company’s NEDs’ Retirement Allowance Scheme was discontinued effective 30 June 2006. The accrued amount for Mr Feeney, the sole remaining NED who had participated in the plan, was frozen and had been indexed at 5% per annum. Mr Feeney retired on 15 November 2012 and received a payment of A$522,453 from the Company’s NED Retirement Allowance Scheme.
D I R E C T O R S’ R E P O R T
Statutory NED remuneration disclosures
For NEDs who receive payments in foreign currencies, the table below reflects the Australian dollar equivalent based on the exchange rate at the date of payment. Accordingly, exchange rate movements may influence the disclosed fee level.
| | | | | | | | | | | | | | | | | | | | |
| (A$) | | | | | | SHORT-TERM
BENEFITS | | | POST-EMPLOYMENT BENEFITS | |
| NAME | | LOCATION | | FISCAL YEAR | | CASH FEES | | | SUPER- ANNUATION5 | | | RETIREMENT BENEFITS | | | TOTAL | |
N Bobins1 | | USA | | 2013 | | | 230,899 | | | | – | | | | – | | | | 230,899 | |
| | | | | 2012 | | | 225,935 | | | | – | | | | – | | | | 225,935 | |
G Brunsdon | | Australia | | 2013 | | | 463,657 | | | | 41,729 | | | | – | | | | 505,386 | |
| | | | | 2012 | | | 308,199 | | | | 27,738 | | | | – | | | | 335,937 | |
J DiLacqua1 | | USA | | 2013 | | | 217,763 | | | | – | | | | – | | | | 217,763 | |
| | | | | 2012 | | | 162,939 | | | | – | | | | – | | | | 162,939 | |
JM Feeney2 | | Australia | | 2013 | | | 89,409 | | | | 8,047 | | | | 9,616 | | | | 107,072 | |
| | | | | 2012 | | | 238,424 | | | | 21,458 | | | | 24,421 | | | | 284,303 | |
R Lewon1,3 | | USA | | 2013 | | | – | | | | – | | | | – | | | | – | |
| | | | | 2012 | | | 81,306 | | | | – | | | | – | | | | 81,306 | |
G Morris1 | | USA | | 2013 | | | 259,953 | | | | – | | | | – | | | | 259,953 | |
| | | | | 2012 | | | 254,363 | | | | – | | | | – | | | | 254,363 | |
C Renwick | | Australia | | 2013 | | | 238,424 | | | | 21,458 | | | | – | | | | 259,882 | |
| | | | | 2012 | | | 238,424 | | | | 21,458 | | | | – | | | | 259,882 | |
H Ridout | | Australia | | 2013 | | | 203,424 | | | | 18,308 | | | | – | | | | 221,732 | |
| | | | | 2012 | | | 169,520 | | | | 15,257 | | | | – | | | | 184,777 | |
T Sato4 | | Japan | | 2013 | | | 50,856 | | | | – | | | | – | | | | 50,856 | |
P Sukagawa4 | | Japan | | 2013 | | | 152,568 | | | | – | | | | – | | | | 152,568 | |
| | | | | 2012 | | | 203,424 | | | | – | | | | – | | | | 203,424 | |
J Thompson1 | | USA | | 2013 | | | 217,945 | | | | – | | | | – | | | | 217,945 | |
| | | | | 2012 | | | 192,946 | | | | – | | | | – | | | | 192,946 | |
P Varello1,2 | | USA | | 2013 | | | 74,679 | | | | – | | | | – | | | | 74,679 | |
| | | | | 2012 | | | 350,099 | | | | – | | | | – | | | | 350,099 | |
Total | | | | 2013 | | | 2,199,577 | | | | 89,542 | | | | 9,616 | | | | 2,298,735 | |
| | | | | 2012 | | | 2,425,579 | | | | 85,911 | | | | 24,421 | | | | 2,535,911 | |
| 1 | Messrs Bobins, DiLacqua, Lewon, Morris, Thompson and Varello are residents of the United States and received their payments in United States dollars. Fees for FY12 and FY13 that were paid in United States dollars were converted at a rate of A$1 to US$1 as established by the Committee in July 2011. |
| 2 | Messrs Feeney and Varello retired from the Board on 15 November 2012. |
| 3 | Mr Lewon retired from the Board on 10 November 2011. |
| 4 | Mr Sato was appointed by Mitsui as their representative Director on 1 April 2013. Mr Sukagawa served as the representative Director for Mitsui until 31 March 2013. NED fees for Messrs Sato and Sukagawa are paid to a Mitsui affiliate in Australia. |
| 5 | Superannuation contributions are made on behalf of NEDs to satisfy the Company’s obligations under Superannuation Guarantee legislation. |
This report is made in accordance with a resolution of the Board of Directors and is signed for and on behalf of the Board of Directors.

G N Brunsdon
Chairman
Sydney
23 August 2013
F I N A N C I A L S T A T E M E N T S
CONSOLIDATED INCOME STATEMENTSFOR THE YEAR ENDED 30 JUNE 2013
| | | | | | | | | | | | | | | | |
| | | NOTE | | | 2013 A$M | | | 2012 A$M RESTATED | | | 2011 A$M RESTATED | |
Revenue | | | 7 | | | | 7,203.1 | | | | 9,042.3 | | | | 8,852.9 | |
| | | | |
Other income | | | 8 | | | | 52.6 | | | | 91.2 | | | | 42.5 | |
Raw materials used and changes in inventories | | | | | | | (5,452.2 | ) | | | (7,065.5 | ) | | | (6,699.8 | ) |
Freight expense | | | | | | | (560.3 | ) | | | (687.0 | ) | | | (715.1 | ) |
Employee benefits expense | | | | | | | (535.2 | ) | | | (562.4 | ) | | | (453.8 | ) |
Depreciation and amortisation expense | | | 8 | | | | (123.5 | ) | | | (129.9 | ) | | | (130.6 | ) |
Repairs and maintenance expense | | | | | | | (105.8 | ) | | | (127.2 | ) | | | (123.5 | ) |
Other expenses | | | | | | | (608.7 | ) | | | (497.5 | ) | | | (504.4 | ) |
Impairment of goodwill and other intangibles | | | 8 | | | | (304.4 | ) | | | (618.1 | ) | | | – | |
Finance costs | | | 8 | | | | (24.9 | ) | | | (24.9 | ) | | | (27.1 | ) |
Impairment of goodwill in jointly controlled entity | | | 30 | | | | – | | | | (57.5 | ) | | | – | |
Share of results of investments accounted for using the equity method | | | 30 | | | | (27.7 | ) | | | (8.0 | ) | | | 28.1 | |
(Loss)/profit before income tax | | | | | | | (487.0 | ) | | | (644.5 | ) | | | 269.2 | |
| | | | |
Income tax benefit/(expense) | | | 9 | | | | 20.9 | | | | 22.0 | | | | (81.9 | ) |
(Loss)/profit for the year | | | | | | | (466.1 | ) | | | (622.5 | ) | | | 187.3 | |
| | | | |
| | | | | | A¢ | | | A¢ | | | A¢ | |
(Loss)/earnings per share: | | | | | | | | | | | | | | | | |
Basic | | | 5 | | | | (228.1 | ) | | | (302.4 | ) | | | 91.5 | |
Diluted | | | 5 | | | | (228.1 | ) | | | (302.4 | ) | | | 90.9 | |
The consolidated income statements should be read in conjunction with the accompanying notes. Restatement of prior period comparative amounts are detailed in Note 2.

F I N A N C I A L S T A T E M E N T S
CONSOLIDATED STATEMENTS OF COMPREHENSIVE INCOME FOR THE YEAR ENDED 30 JUNE 2013
| | | | | | | | | | | | | | | | |
| | | NOTE | | | 2013
A$M | | | 2012 A$M
RESTATED | | | 2011 A$M
RESTATED | |
(Loss)/profit for the year | | | | | | | (466.1) | | | | (622.5) | | | | 187.3 | |
| | | | |
Other comprehensive income/(loss): | | | | | | | | | | | | | | | | |
| | | | |
Items that may be reclassified to profit or loss | | | | | | | | | | | | | | | | |
Changes in the fair value of available-for-sale financial assets, net of tax | | | 21 | | | | – | | | | – | | | | 0.8 | |
Changes in the fair value of cash flow hedges, net of tax | | | 21 | | | | (3.8) | | | | 1.2 | | | | 0.5 | |
Foreign exchange translation differences, net of tax | | | 21 | | | | 121.7 | | | | 87.2 | | | | (522.9) | |
Share of other comprehensive income of associates, net of tax | | | 30 | | | | 0.6 | | | | (0.4) | | | | – | |
| | | | |
Items that will not be reclassified to profit or loss | | | | | | | | | | | | | | | | |
Net actuarial gain/(loss) on defined benefit plans, net of tax | | | 19 | (e) | | | 5.1 | | | | (11.3) | | | | 2.8 | |
| | | | |
Other comprehensive income/(loss) for the year, net of tax | | | | | | | 123.6 | | | | 76.7 | | | | (518.8) | |
| | | | |
Total comprehensive loss for the year | | | | | | | (342.5) | | | | (545.8) | | | | (331.5) | |
The consolidated statements of comprehensive income should be read in conjunction with the accompanying notes. Restatement of prior period comparative amounts are detailed in Note 2.
CONSOLIDATED STATEMENTS OF FINANCIAL POSITION AS AT 30 JUNE 2013
| | | | | | | | | | | | | | | | |
| | | NOTE | | | 2013 A$M | | | 2012 A$M
RESTATED | | | 1 JULY 2011
A$M
RESTATED | |
ASSETS | | | | | | | | | | | | | | | | |
Current assets | | | | | | | | | | | | | | | | |
Cash and cash equivalents | | | 33 | | | | 46.9 | | | | 51.4 | | | | 165.5 | |
Trade and other receivables | | | 10 | | | | 455.4 | | | | 518.8 | | | | 606.7 | |
Inventory | | | 11 | | | | 574.9 | | | | 829.5 | | | | 966.1 | |
Other financial assets | | | 12 | | | | 29.1 | | | | 29.4 | | | | 15.8 | |
Assets classified as held for sale | | | 34 | | | | 53.1 | | | | – | | | | – | |
Total current assets | | | | | | | 1,159.4 | | | | 1,429.1 | | | | 1,754.1 | |
| | | | |
Non-current assets | | | | | | | | | | | | | | | | |
Investments accounted for using the equity method | | | 30 | | | | 330.0 | | | | 351.1 | | | | 310.3 | |
Other financial assets | | | 12 | | | | 47.9 | | | | 49.4 | | | | 12.3 | |
Property, plant and equipment | | | 13 | | | | 992.2 | | | | 977.1 | | | | 865.5 | |
Retirement benefit assets | | | 19 | | | | 0.4 | | | | – | | | | 0.9 | |
Deferred tax assets | | | 9 | | | | 123.0 | | | | 129.4 | | | | 99.4 | |
Goodwill | | | 14 | | | | 166.5 | | | | 446.3 | | | | 988.7 | |
Other intangible assets | | | 15 | | | | 97.4 | | | | 126.6 | | | | 136.2 | |
Total non-current assets | | | | | | | 1,757.4 | | | | 2,079.9 | | | | 2,413.3 | |
Total assets | | | | | | | 2,916.8 | | | | 3,509.0 | | | | 4,167.4 | |
| | | | |
LIABILITIES | | | | | | | | | | | | | | | | |
Current liabilities | | | | | | | | | | | | | | | | |
Trade and other payables | | | 16 | | | | 585.2 | | | | 672.1 | | | | 747.3 | |
Borrowings | | | 17 | | | | 11.6 | | | | 13.7 | | | | 0.5 | |
Other financial liabilities | | | 12 | | | | 6.3 | | | | 2.1 | | | | 5.8 | |
Current tax liabilities | | | | | | | 13.2 | | | | 15.7 | | | | 29.2 | |
Provisions | | | 18 | | | | 38.5 | | | | 30.6 | | | | 37.1 | |
Liabilities associated with assets held for sale | | | 34 | | | | 16.6 | | | | – | | | | – | |
Total current liabilities | | | | | | | 671.4 | | | | 734.2 | | | | 819.9 | |
| | | | |
Non-current liabilities | | | | | | | | | | | | | | | | |
Payables | | | | | | | 8.3 | | | | 8.0 | | | | 3.7 | |
Borrowings | | | 17 | | | | 189.1 | | | | 329.9 | | | | 291.2 | |
Deferred tax liabilities | | | 9 | | | | 73.8 | | | | 109.1 | | | | 119.6 | |
Provisions | | | 18 | | | | 40.5 | | | | 29.5 | | | | 18.6 | |
Retirement benefit obligations | | | 19 | | | | 4.9 | | | | 14.6 | | | | 2.9 | |
Total non-current liabilities | | | | | | | 316.6 | | | | 491.1 | | | | 436.0 | |
Total liabilities | | | | | | | 988.0 | | | | 1,225.3 | | | | 1,255.9 | |
| | | | |
Net assets | | | | | | | 1,928.8 | | | | 2,283.7 | | | | 2,911.5 | |
| | | | |
EQUITY | | | | | | | | | | | | | | | | |
Contributed equity | | | 20 | | | | 2,795.7 | | | | 2,804.3 | | | | 2,817.9 | |
Reserves | | | 21 | | | | (197.8) | | | | (332.9) | | | | (445.2) | |
Retained (deficit)/earnings | | | 21 | | | | (669.1) | | | | (187.7) | | | | 538.8 | |
Total equity | | | | | | | 1,928.8 | | | | 2,283.7 | | | | 2,911.5 | |
The consolidated statements of financial position should be read in conjunction with the accompanying notes. Restatement of prior period comparative amounts are detailed in Note 2.
F I N A N C I A L S T A T E M E N T S
CONSOLIDATED STATEMENTS OF CHANGES IN EQUITY FOR THE YEAR ENDED 30 JUNE 2013
| | | | | | | | | | | | | | | | | | | | |
| | | NOTE | | | CONTRIBUTED
EQUITY A$M | | | RESERVES
A$M | | | RETAINED
EARNINGS/
(DEFICIT)
A$M | | | TOTAL
EQUITY
A$M | |
Balance at 1 July 2010 | | | | | | | 2,795.2 | | | | 58.1 | | | | 425.5 | | | | 3,278.8 | |
Adjustment on correction of an error, net of tax | | | 2 | | | | – | | | | 0.1 | | | | (5.3) | | | | (5.2) | |
Restated total equity at 1 July 2010 | | | | | | | 2,795.2 | | | | 58.2 | | | | 420.2 | | | | 3,273.6 | |
| | | | | |
Profit for the year (restated) | | | 2 | | | | – | | | | – | | | | 187.3 | | | | 187.3 | |
Other comprehensive income (restated) | | | | | | | – | | | | (521.6) | | | | 2.8 | | | | (518.8) | |
Total comprehensive loss for the year | | | | | | | – | | | | (521.6) | | | | 190.1 | | | | (331.5) | |
| | | | | |
Transactions with owners in their capacity as owners: | | | | | | | | | | | | | | | | | | | | |
Dividends provided for or paid | | | 22 | | | | – | | | | – | | | | (71.5) | | | | (71.5) | |
Share-based payments | | | | | | | 3.6 | | | | 18.2 | | | | – | | | | 21.8 | |
Dividend reinvestment plan | | | 22 | | | | 19.1 | | | | – | | | | – | | | | 19.1 | |
| | | | | | | | 22.7 | | | | 18.2 | | | | (71.5) | | | | (30.6) | |
Balance at 30 June 2011 (restated) | | | | | | | 2,817.9 | | | | (445.2) | | | | 538.8 | | | | 2,911.5 | |
| | | | | |
Loss for the year (restated) | | | 2 | | | | – | | | | – | | | | (622.5) | | | | (622.5) | |
Other comprehensive income (restated) | | | | | | | – | | | | 88.0 | | | | (11.3) | | | | 76.7 | |
Total comprehensive loss for the year | | | | | | | – | | | | 88.0 | | | | (633.8) | | | | (545.8) | |
| | | | | |
Transactions with owners in their capacity as owners: | | | | | | | | | | | | | | | | | | | | |
Dividends provided for or paid | | | 22 | | | | – | | | | – | | | | (92.7) | | | | (92.7) | |
Share-based payments | | | | | | | 1.5 | | | | 24.3 | | | | – | | | | 25.8 | |
Buy-back of ordinary shares | | | 20 | | | | (38.5) | | | | – | | | | – | | | | (38.5) | |
Dividend reinvestment plan | | | 22 | | | | 23.4 | | | | – | | | | – | | | | 23.4 | |
| | | | | | | | (13.6) | | | | 24.3 | | | | (92.7) | | | | (82.0) | |
Balance at 30 June 2012 (restated) | | | | | | | 2,804.3 | | | | (332.9) | | | | (187.7) | | | | 2,283.7 | |
| | | | | | | | | | | | | | | | | | | | |
Loss for the year | | | | | | | – | | | | – | | | | (466.1) | | | | (466.1) | |
Other comprehensive income | | | | | | | – | | | | 118.5 | | | | 5.1 | | | | 123.6 | |
Total comprehensive loss for the year | | | | | | | – | | | | 118.5 | | | | (461.0) | | | | (342.5) | |
| | | | | |
Transactions with owners in their capacity as owners: | | | | | | | | | | | | | | | | | | | | |
Dividends provided for or paid | | | 22 | | | | – | | | | – | | | | (20.4) | | | | (20.4) | |
Share-based payments | | | | | | | – | | | | 16.6 | | | | – | | | | 16.6 | |
Buy-back of ordinary shares | | | 20 | | | | (8.6) | | | | – | | | | – | | | | (8.6) | |
| | | | | | | | (8.6) | | | | 16.6 | | | | (20.4) | | | | (12.4) | |
Balance at 30 June 2013 | | | | | | | 2,795.7 | | | | (197.8) | | | | (669.1) | | | | 1,928.8 | |
The consolidated statements of changes in equity should be read in conjunction with the accompanying notes. Restatement of prior period comparative amounts are detailed in Note 2.
CONSOLIDATED STATEMENTS OF CASH FLOWS FOR THE YEAR ENDED 30 JUNE 2013
| | | | | | | | | | | | | | | | |
| | | NOTE | | | 2013 A$M | | | 2012 A$M | | | 2011 A$M | |
Cash flows from operating activities | | | | | | | | | | | | | | | | |
Receipts from customers (inclusive of goods and services tax) | | | | | | | 7,441.6 | | | | 9,323.9 | | | | 8,776.0 | |
Payments to suppliers and employees (inclusive of goods and services tax) | | | | | | | (7,131.4) | | | | (8,959.9) | | | | (8,564.2) | |
Interest received | | | | | | | 5.0 | | | | 2.6 | | | | 3.2 | |
Interest paid | | | | | | | (21.7) | | | | (22.6) | | | | (21.9) | |
Dividends received from associates and jointly controlled entities | | | | | | | 11.8 | | | | 5.1 | | | | 15.8 | |
Insurance recoveries | | | | | | | 1.4 | | | | 5.3 | | | | 7.6 | |
Income taxes paid | | | | | | | (9.4) | | | | (64.8) | | | | (57.9) | |
Net cash inflows from operating activities | | | 33 | | | | 297.3 | | | | 289.6 | | | | 158.6 | |
| | | | |
Cash flows from investing activities | | | | | | | | | | | | | | | | |
Payments for property, plant and equipment | | | 13 | | | | (149.0) | | | | (161.1) | | | | (142.8) | |
Proceeds from sale of property, plant and equipment | | | | | | | 4.8 | | | | 6.6 | | | | 3.9 | |
Payments for acquisition of subsidiaries, net of cash acquired | | | 28 | | | | (28.1) | | | | (82.2) | | | | (105.8) | |
Payment for an interest in an associate | | | 30 | | | | – | | | | (93.5) | | | | – | |
Return of capital from associates and jointly controlled entities | | | 30 | | | | – | | | | 0.3 | | | | – | |
Proceeds from sale of an interest in a jointly controlled entity | | | | | | | 7.3 | | | | – | | | | – | |
Proceeds from sale of business divisions | | | 28 | | | | 44.9 | | | | – | | | | – | |
Proceeds from sale of jointly controlled assets | | | 28 | | | | – | | | | 40.0 | | | | – | |
Loan to an associate | | | | | | | – | | | | (37.8) | | | | – | |
Payments for other financial assets | | | | | | | (1.4) | | | | (1.5) | | | | (28.3) | |
Proceeds from sale of other financial assets | | | | | | | 1.1 | | | | 0.4 | | | | 54.8 | |
Loan to third parties | | | | | | | (5.7) | | | | (33.0) | | | | (10.2) | |
Proceeds from repayment on third party loans | | | | | | | 7.3 | | | | 19.2 | | | | 3.3 | |
Net cash outflows from investing activities | | | | | | | (118.8) | | | | (342.6) | | | | (225.1) | |
| | | | |
Cash flows from financing activities | | | | | | | | | | | | | | | | |
Proceeds from borrowings | | | | | | | 2,488.3 | | | | 2,557.3 | | | | 3,177.7 | |
Repayment of borrowings | | | | | | | (2,645.6) | | | | (2,514.3) | | | | (2,997.8) | |
Fees paid for loan facilities | | | | | | | (0.2) | | | | (2.1) | | | | (6.9) | |
Proceeds from issue of shares | | | | | | | – | | | | 1.5 | | | | 3.6 | |
Payments for shares bought back | | | 20 | | | | (8.6) | | | | (38.5) | | | | – | |
Dividends paid | | | 22 | | | | (20.4) | | | | (69.3) | | | | (52.4) | |
Net cash (outflows)/inflows from financing activities | | | | | | | (186.5) | | | | (65.4) | | | | 124.2 | |
| | | | |
Net (decrease)/increase in cash and cash equivalents | | | | | | | (8.0) | | | | (118.4) | | | | 57.7 | |
| | | | |
Cash and cash equivalents at the beginning of the financial year | | | | | | | 51.4 | | | | 165.5 | | | | 132.3 | |
Effects of exchange rate changes on cash and cash equivalents | | | | | | | 3.5 | | | | 4.3 | | | | (24.5) | |
Cash and cash equivalents at the end of the financial year | | | 33 | | | | 46.9 | | | | 51.4 | | | | 165.5 | |
The consolidated statements of cash flows should be read in conjunction with the accompanying notes.
F I N A N C I A L S T A T E M E N T S
NOTES TO THE CONSOLIDATED FINANCIAL STATEMENTS FOR THE YEAR ENDED 30 JUNE 2013
Note 1 – Summary of significant accounting policies
The principal accounting policies adopted in the preparation of these consolidated financial statements are set out below. These policies have been consistently applied to all the years presented, unless otherwise stated.
Sims Metal Management Limited (the “Company”) is a company domiciled in Australia. The consolidated financial statements for the year ended 30 June 2013 comprise the Company and its subsidiaries (together referred to as the “Group”) and the Group’s interest in associates, jointly controlled entities and joint venture operations. The Group is a for-profit entity for the purpose of preparing the consolidated financial statements.
The consolidated financial statements are general purpose financial statements, which have been prepared in accordance with the requirements of theCorporations Act 2001, Australian Accounting Standards, interpretations and other authoritative pronouncements of the Australian Accounting Standards Board (“AASB”).
The consolidated financial statements were authorised for issue in accordance with a resolution of the Directors on 23 August 2013.
Compliance with IFRS
The consolidated financial statements comply with International Financial Reporting Standards (“IFRS”) and interpretations as issued by the International Accounting Standards Board (“IASB”).
Historical cost convention
The consolidated financial statements have been prepared under the historical cost convention, except for certain financial assets and liabilities, and liabilities for cash-settled share based payments, which are measured at fair value.
Reclassifications
Certain reclassifications have been made to prior period amounts to conform to the current period financial statement presentation with no significant impact on the previously reported consolidated financial statements.
The Group reclassified contract labour and redundancy costs of A$78.5 million and A$44.0 million, which were included within other expenses for the years ended 30 June 2012 and 30 June 2011, respectively, to employee benefits expense.
Rounding of amounts
The Company is of a kind referred to in the Australian Securities and Investments Commission (“ASIC”) Class Order No. 98/100 and, in accordance with this Class Order, amounts in the consolidated financial statements have been rounded off to the nearest tenth of a million dollars, unless otherwise stated.
| (c) | Critical accounting estimates |
The preparation of the consolidated financial statements requires the use of certain critical accounting estimates. It also requires management to exercise its judgement in the process of applying the Group’s accounting policies. The areas involving a higher degree of judgement or complexity, or areas where assumptions and estimates are significant to the consolidated financial statements, are disclosed in Note 4.
| (d) | New accounting standards and interpretations |
The Group has adopted AASB 2011-9Amendments to Australian Accounting Standards – Presentation of Items of Other Comprehensive Income (Revised IAS 1). The adoption of the new standard has not resulted in any changes to the Group’s accounting policies and has no effect on the amounts reported for the current or prior years. However, the application of AASB 2011-9 (Revised IAS 1) has resulted in changes to the Group’s presentation of the statement of comprehensive income.
A number of new standards, amendments to standards and interpretations are effective for annual periods beginning on or after 1 July 2013 and have not been applied in preparing these consolidated financial statements. The Group’s assessment of the impact of these new standards, amendments to standards and interpretations is set out below.
| • | | AASB 9Financial Instruments (IFRS 9) and AASB 2010-7Amendments to Australian Accounting Standards arising from AASB 9. |
AASB 9 (IFRS 9) introduces new requirements for the classification, measurement and derecognition of financial assets and financial liabilities. Application of AASB 9 (IFRS 9) is not expected to have a significant impact on the Group’s accounting for financial assets and financial liabilities. AASB 9 (IFRS 9) is effective for annual periods beginning on or after 1 July 2015, and is available for early adoption.
| • | | AASB 10Consolidated Financial Statements (IFRS 10), AASB 11Joint Arrangements (IFRS 11), AASB 12Disclosure of Interests in Other Entities (IFRS 12), revised AASB 127Separate Financial Statements (revised IAS 27), AASB 128Investments in Associates and Joint Ventures (revised IAS 28) and AASB 2011-7Amendments to Australian Accounting Standards arising from the Consolidation and Joint Arrangements Standards. |
In August 2011, the AASB and IASB issued a suite of six new and amended standards which address the accounting for joint arrangements, consolidated financial statements and associated disclosures. The standards are effective for annual periods beginning on or after 1 July 2013.
AASB 10 (IFRS 10) replaces the guidance on control and consolidation in AASB 127 (IAS 27)Consolidated and Separate Financial Statements and Interpretation 12Consolidation – Special Purpose Entities. AASB 10 (IFRS 10) includes a new definition of control that focusses on the need to have both power and rights or exposure to variable returns. A review of all entities in the Group which are less than 100% owned has been completed to assess the impact of AASB 10 (IFRS 10). The review determined that AASB 10 (IFRS 10) is not expected to have a significant impact on the composition of investments currently consolidated into the Group’s results.
AASB 11(IFRS 11) replaces AASB 131 (IAS 31)Interests in Joint Ventures and uses the definition of control in AASB 10 (IFRS 10) to introduce a principles based approach to accounting for joint arrangements. The focus is no longer on the legal structure of joint arrangements, but rather on how rights and obligations are shared by the parties to the joint arrangement. The joint arrangement will be classified as either a joint operation or a joint venture. Parties to a joint operation recognise their share of assets, liabilities, income and expenses in relation to their interest in a joint operation. Joint venturers will be required to apply the equity method of accounting for their investment in a joint venture. A review of the Group’s joint arrangements determined that AASB 11 (IFRS 11) is not expected to have a significant impact on the Group’s consolidated financial statements.
AASB 12 (IFRS 12) sets out the required disclosures for entities reporting under the two new standards, AASB 10 (IFRS 10) and AASB 11 (IFRS 11), and replaces the disclosure requirements currently found in AASB 127 (IAS 27) and AASB 128 (IAS 28). Application of this standard by the Group will not affect any of the amounts recognised in the consolidated financial statements, but will impact the type of information disclosed in relation to the Group’s investments.
Amendments to AASB 128 (IAS 28) provide clarification that an entity continues to apply the equity method and does not remeasure its retained interest as part of ownership changes where a joint venture becomes an associate, and vice versa. The amendments also introduce a “partial disposal” concept. The Group is still assessing the impact of these amendments.
| • | | AASB 13 (IFRS 13)Fair Value Measurement and AASB 2011-8Amendments to Australian Accounting Standards arising from AASB 13. |
AASB 13 (IFRS 13) was released in September 2011. It explains how to measure fair value and aims to enhance fair value disclosures. The Group has yet to determine which, if any, of its current measurement techniques will have to change as a result of the new guidance. It is therefore not possible to state the impact, if any, of the new rules on any of the amounts recognised in the financial statements. However, application of the new standard will impact the type of information disclosed in the notes to the consolidated financial statements. The standard is effective for annual periods after 1 July 2013.
| • | | Revised AASB 119 (revised IAS 19)Employee Benefits, AASB 2011-10Amendments to Australian Accounting Standards arising from AASB 119. |
In September 2011, the AASB and IASB released a revised standard on accounting for employee benefits. It requires the recognition of all remeasurements of defined benefit liabilities/assets immediately in other comprehensive income (removal of the so-called ‘corridor’ method), the immediate recognition of all past service cost in profit or loss and the calculation of a net interest expense or income by applying the discount rate to the net defined benefit liability or asset. This replaces the expected return on plan assets that is currently included in profit or loss. The revised standard also introduces a number of additional disclosures for defined benefit liabilities/assets and could affect the timing of the recognition of termination benefits. The amendments will have to be implemented retrospectively.
Had the Group adopted the new rules in the current reporting period, profit or loss for the current period would have been approximately A$1.1 million lower net of tax, other comprehensive income approximately A$1.1 million higher net of tax and total comprehensive income for the period unchanged. The Group expects a similar impact on profit or loss and other comprehensive income in the 2014 financial year. In the statement of financial position as at 30 June 2013, retirement benefit obligations, deferred tax assets and retained earnings including accumulated other comprehensive income would have been unchanged.
| • | | AASB 2011-4Amendments to Australian Accounting Standards to Remove Individual Key Management Personnel Disclosure Requirements. |
AASB 2011-4 removes the individual key management personnel disclosure requirements from AASB 124 Related Party Disclosures, to achieve consistency with the international equivalent standard and remove a duplication of the requirements with theCorporations Act 2001. These amendments will be effective as of 1 July 2013 and cannot be adopted early.
There are no other standards that are not yet effective and that are expected to have a material impact on the entity in the current or future reporting periods and on foreseeable future transactions.
F I N A N C I A L S T A T E M E N T S
NOTES TO THE CONSOLIDATED FINANCIAL STATEMENTSFOR THE YEAR ENDED 30 JUNE 2013
Note 1 – Summary of significant accounting policies (continued)
| (e) | Principles of consolidation |
Subsidiaries are all entities over which the Group has the power to govern the financial and operating policies, generally accompanying a shareholding of more than one-half of the voting rights. The existence and effect of potential voting rights that are currently exercisable or convertible are considered when assessing whether the Group controls another entity. Subsidiaries are fully consolidated from the date on which control is transferred to the Group. They are de-consolidated from the date that control ceases. Accounting policies of subsidiaries, associates and jointly controlled entities have been changed where necessary to ensure consistency with the policies adopted by the Group.
| (ii) | Investments in associates and jointly controlled entities (equity-accounted investees) |
An associate is an entity over whose operating and financial policies the Group exercises significant influence, but not control. Significant influence is presumed to exist where the Group has between 20% and 50% of the voting rights, but can also arise where the Group holds less than 20% if it has the power to be actively involved and influential in policy decisions affecting the entity. Jointly controlled entities are those entities over whose activities the Group has joint control, established by contractual agreement and requiring unanimous consent for strategic financial and operating decisions.
Investments in associates and jointly controlled entities are accounted for using the equity method of accounting. This involves recording the investment initially at cost, which therefore includes any goodwill and other intangibles on acquisition. The cost of the investment includes transaction costs. Impairment losses on the equity value of associates are reported under share of results of investments accounted for using the equity method.
The consolidated financial statements include the Group’s share of the profit or loss and other comprehensive income of equity-accounted investees, after adjustments to align the accounting policies with those of the Group, from the date that significant influence or joint control commences until the date that significant influence or joint control ceases.
| (iii) | Jointly controlled operations |
A jointly controlled operation is a joint venture carried on by each venturer using its own assets in pursuit of the joint operations. A jointly controlled operation does not involve the establishment of a corporation, partnership or other entity. The consolidated financial statements include the assets that the Group controls and the liabilities that it incurs in the course of pursuing the joint operation, and the expenses that the Group incurs and its share of the income that it earns from the joint operation.
| (iv) | Transactions eliminated in consolidation |
Intercompany transactions, balances and unrealised gains on transactions between Group companies are eliminated. Unrealised gains on transactions between the Group and its equity-accounted investees are eliminated to the extent of the Group’s interest in the investee. Unrealised losses are also eliminated unless the transaction provides evidence of an impairment of the asset transferred.
| (v) | Changes in ownership interests |
When the Group ceases to have control, joint control or significant influence, any retained interest in the entity is remeasured to its fair value with the change in carrying amount recognised in profit or loss. The fair value is the initial carrying amount for the purposes of subsequently accounting for the retained interest as an associate or financial asset. In addition, any amounts previously recognised in other comprehensive income in respect of that entity are accounted for as if the Group had directly disposed of the related assets or liabilities. This may mean that amounts previously recognised in other comprehensive income are reclassified to profit or loss.
If the ownership interest in an equity-accounted investee is reduced, but joint control or significant influence is retained, only a proportionate share of the amounts previously recognised in other comprehensive income are reclassified to profit or loss where appropriate.
The acquisition method of accounting is used to account for all business combinations, regardless of whether equity instruments or other assets are acquired. The consideration transferred to the acquisition of a subsidiary comprises the fair values of the assets transferred, the liabilities incurred and the equity interests issued by the Group. The consideration transferred also includes the fair value of any contingent consideration arrangement and the fair value of any pre-existing equity interest in the subsidiary. Acquisition-related costs are expensed as incurred. Identifiable assets acquired and liabilities and contingent liabilities assumed in a business combination are, with limited exceptions, measured initially at their fair values at the acquisition date. On an acquisition-by-acquisition basis, the Group recognises any non-controlling interest in the acquiree either at fair value or at the non-controlling interest’s proportionate share of the acquiree’s net identifiable assets.
The excess of the consideration transferred and the amount of any non-controlling interest in the acquiree over the fair value of the net identifiable assets acquired is recorded as goodwill. If those amounts are less than the fair value of the net identifiable assets of the subsidiary acquired and the measurement of all amounts has been reviewed, the difference is recognised directly in profit or loss as a bargain purchase.
Where settlement of any part of cash consideration is deferred, the amounts payable in the future are discounted to their present value as at the date of the exchange. The discount rate used is the entity’s incremental borrowing rate, being the rate at which a similar borrowing could be obtained from an independent financier under comparable terms and conditions.
Contingent consideration is classified as either equity or a financial liability. Amounts classified as a financial liability are subsequently remeasured to fair value with changes in fair value recognised in profit or loss.
| (g) | Foreign currency translation |
| (i) | Functional and presentation currency |
Items included in the financial statements of each of the Group’s entities are measured using the currency of the primary economic environment in which the entity operates (the “functional currency”). The consolidated financial statements are presented in Australian dollars, which is the Company’s functional and presentation currency.
| (ii) | Transactions and balances |
Foreign currency transactions are translated into the functional currency using the exchange rates prevailing at the dates of the transactions. Foreign exchange gains and losses resulting from the settlement of such transactions and from the translation at year end exchange rates of monetary assets and liabilities denominated in foreign currencies are recognised in profit or loss, except when deferred in equity as qualifying cash flow hedges and qualifying net investment hedges or are attributable to part of the net investment in a foreign operation.
Non-monetary items that are measured at fair value in a foreign currency are translated using the exchange rates at the date when the fair value was determined. Translation differences on assets and liabilities carried at fair value are reported as part of the fair value gain or loss. Translation differences on non-monetary financial assets and liabilities such as equities held at fair value through profit or loss are recognised in profit or loss as part of the fair value gain or loss, and translation differences on non-monetary assets such as equities classified as available-for-sale financial assets are included in other comprehensive income.
The results and financial position of foreign operations (none of which has the currency of a hyperinflationary economy) that have a functional currency different from the presentation currency are translated into the presentation currency as follows:
| • | | assets and liabilities for each statement of financial position presented are translated at the closing rate at the date of that statement of financial position; |
| • | | income and expenses for each income statement and statement of comprehensive income are translated at average exchange rates (unless this is not a reasonable approximation of the cumulative effect of the rates prevailing on the transaction dates, in which case they are translated at the date of the transaction); and |
| • | | all resulting exchange differences are recognised in other comprehensive income. |
On consolidation, exchange differences arising from the translation of any net investment in foreign entities, borrowings and other financial instruments designated as hedges of such investments, or long-term intragroup borrowings which, in substance, form part of the Group’s net investment in an entity, are recognised in other comprehensive income. When a loss of control occurs over a foreign operation, a proportionate share of such exchange differences is reclassified to profit or loss as part of the gain or loss on disposal where applicable.
Goodwill and fair value adjustments arising on the acquisition of a foreign entity are treated as assets and liabilities of the foreign entity and translated at the closing rate.
Revenue is measured at the fair value of the consideration received or receivable. Amounts disclosed as revenue are net of returns and trade allowances. Amounts billed to customers in respect of shipping and handling are classified as sales revenue where the Group is responsible for carriage, insurance and freight. All shipping and handling costs incurred by the Group are recognised as freight expense in the income statement.
The Group recognises revenue when the amount of revenue can be reliably measured, it is probable that future economic benefits will flow to the entity and specific criteria have been met for each of the Group’s activities as described below. The amount of revenue is not considered to be reliably measurable until all contingencies relating to the sale have been resolved.
Revenue is recognised for the major business activities as follows:
Revenue from the sale of goods is recognised when there is persuasive evidence, usually in the form of an executed sales agreement at the time of delivery of goods to the customer, indicating that there has been a transfer of risks and rewards to the customer, no further work or processing is required, the quantity and quality of the goods have been determined, the price is fixed and generally title has passed.
Service revenue principally represents revenue earned from the collection of end-of-life post-consumer products for the purpose of product recycling. Service revenue is recognised when the services have been provided. Service revenue received in advance of the service being rendered is deferred.
Interest income is recognised on an accrual basis using the effective interest method.
Dividends are recognised when the right to receive payment is established.
F I N A N C I A L S T A T E M E N T S
NOTES TO THE CONSOLIDATED FINANCIAL STATEMENTSFOR THE YEAR ENDED 30 JUNE 2013
Note 1 – Summary of significant accounting policies (continued)
Grants from the government are recognised at their fair value where there is a reasonable assurance that the grant will be received and the Group will comply with all attached conditions.
Government grants relating to costs are deferred and recognised in profit or loss over the period necessary to match them with the costs that they are intended to compensate.
Government grants relating to the purchase of property, plant and equipment are included in non-current liabilities as deferred income and are credited to other income in the income statement on a straight-line basis over the expected lives of the related assets.
The income tax expense or benefit for the period is the tax payable on the current period’s taxable income based on the applicable income tax rate for each jurisdiction adjusted by changes in deferred tax assets and liabilities attributable to temporary differences and unused tax losses.
The current income tax charge is calculated on the basis of the tax laws enacted or substantively enacted at the end of the reporting period in the countries where the Group’s subsidiaries and associates operate and generate taxable income. Management periodically evaluates provisions taken in tax returns with respect to situations in which applicable tax regulation is subject to interpretation. It establishes provisions where appropriate on the basis of amounts expected to be paid to the tax authorities.
Deferred income tax is provided in full, using the liability method, on temporary differences arising between the tax bases of assets and liabilities and their carrying amounts in the consolidated financial statements. However, the deferred income tax is not accounted for if it arises from initial recognition of an asset or liability in a transaction other than a business combination that at the time of the transaction affects neither accounting nor taxable profit or loss. Deferred income tax is determined using tax rates (and laws) that have been enacted or substantially enacted by the end of the reporting period and are expected to apply when the related deferred income tax asset is realised or the deferred income tax liability is settled.
Deferred tax assets are recognised for deductible temporary differences and unused tax losses only if it is probable that future taxable amounts will be available to utilise those temporary differences and losses.
Deferred tax liabilities and assets are not recognised for temporary differences between the carrying amount and tax bases of investments in controlled entities where the Company is able to control the timing of the reversal of the temporary differences and it is probable that the differences will not reverse in the foreseeable future.
Deferred tax assets and liabilities are offset when there is a legally enforceable right to offset current tax assets and liabilities and when the deferred tax balances relate to the same taxation authority. Current tax assets and tax liabilities are offset where the entity has a legally enforceable right to offset and intends either to settle on a net basis, or to realise the asset and settle the liability simultaneously.
Current and deferred tax is recognised in profit or loss, except to the extent that it relates to items recognised in other comprehensive income or directly in equity. In this case, the tax is also recognised in other comprehensive income or directly in equity, respectively.
| (i) | Tax consolidation legislation |
Sims Metal Management Limited and its wholly owned Australian controlled entities have implemented the tax consolidation legislation as of 31 October 2005. Sims Metal Management Limited is the head entity of the tax consolidated group. Members of the tax consolidated group have entered into a tax sharing and funding agreement that provides for the allocation of income tax liabilities between entities should the head entity default on its tax payment obligations. No amounts have been recognised in the consolidated financial statements in respect of this agreement on the basis that the probability of default is remote.
| (ii) | Investment allowances |
Entities within the Group may be entitled to claim special tax deductions for investments in qualifying assets (investment allowances). The Group accounts for such allowances as tax credits, which means that the allowance reduces income tax payable and current tax expense. A deferred tax asset is recognised for unclaimed tax credits that are carried forward as deferred tax assets.
Leases are classified at their inception as either finance or operating leases based on the economic substance of the arrangement so as to reflect the risks and benefits incidental to ownership. Finance leases are those that effectively transfer from the lessor to the lessee substantially all the risks and benefits incidental to ownership of the leased property. All other leases are classified as operating leases.
Assets held under finance leases are initially recognised at their fair value at the inception of the lease or, if lower, at the present value of the minimum lease payments. The corresponding liability to the lessor is included in the statement of financial position as a finance lease obligation. Lease payments are apportioned between finance expenses and reduction of the lease obligation so as to achieve a constant rate of interest on the remaining balance of the liability. The Group does not have any significant finance leases.
Operating lease payments are recognised as an expense on a straight-line basis over the lease term. In the event that lease incentives are received to enter into operating leases, such incentives are recognised as a liability. The aggregate benefit of incentives is recognised as a reduction of rental expense on a straight-line basis.
Lease income from operating leases where the Group is a lessor is recognised in income on a straight-line basis over the lease term. The respective leased assets are included in the statement of financial position based on their nature.
Operating segments are reported in a manner consistent with the internal reporting that was provided to the Group Chief Executive Officer (“CEO”), who was the chief operating decision maker. The Group CEO retired on 30 June 2013. Details on the Group’s segments are set out in Note 6.
| (m) | Impairment of non-current assets |
Goodwill and other intangible assets that have an indefinite useful life are not subject to amortisation and are tested annually for impairment, or more frequently if events or changes in circumstances indicate a potential for impairment. Other assets are tested for impairment whenever events or changes in circumstances indicate that the carrying amount may not be recoverable. An impairment loss is recognised for the amount by which the asset’s carrying amount exceeds its recoverable amount. The recoverable amount is the higher of an asset’s fair value less costs to sell and value-in-use. For the purposes of assessing impairment, assets are grouped at the lowest levels for which there are separately identifiable cash inflows, which are largely independent of the cash inflows from other assets or groups of assets (“CGUs”). Non-financial assets, other than goodwill, that suffered impairment are reviewed for possible reversal of the impairment at each reporting period.
| (n) | Cash and cash equivalents |
For the purpose of presentation in the consolidated statement of cash flows, cash and cash equivalents includes cash on hand, deposits held at call with financial institutions and other short-term, highly liquid investments with original maturities of three months or less that are readily convertible to known amounts of cash and which are subject to an insignificant risk of changes in value.
| (o) | Trade and other receivables |
Trade receivables are recognised initially at fair value and subsequently measured at amortised cost, less provision for impairment. Trade receivables are generally due for settlement within 30 to 60 days following shipment, except in the case of certain ferrous shipments made to export destinations, which are generally secured by letters of credit that are collected on negotiated terms but generally within 10 days of shipment.
Collectability of trade receivables is reviewed on an ongoing basis. Individual debts that are known to be uncollectible are written-off by reducing the carrying amount directly. An allowance account (a provision for impairment of trade receivables) is used when there is objective evidence that the Group will not be able to collect all amounts due according to the original terms of the receivable. Indicators of impairment would include significant financial difficulties of the debtor, likelihood of the debtor’s insolvency, default or delinquency in payment, or a significant deterioration in creditworthiness. The amount of the impairment provision is recognised in profit or loss within other expenses.
When a trade receivable for which an impairment provision had been recognised becomes uncollectible in a subsequent period, it is written-off against the provision for impairment account. Subsequent recoveries of amounts previously written-off are credited against other expenses in profit or loss.
Inventories are stated at the lower of cost and net realisable value. Cost is based on weighted average and comprises direct materials, direct labour and an appropriate proportion of variable and fixed overhead expenditures, the latter being allocated on the basis of normal operating capacity. Net realisable value is the estimated selling price in the ordinary course of business less the estimated costs of completion and the estimated costs necessary to make the sale.
Stores consist of consumable and maintenance stores and are valued at the lower of cost and net realisable value. Cost is determined using weighted average costs.
| (q) | Non-current assets (or disposal groups) held for sale and discontinued operations |
Non-current assets (or disposal groups) are classified as held for sale if their carrying amount will be recovered principally through a sale transaction rather than through continuing use and a sale is considered highly probable. They are measured at the lower of their carrying amount and fair value less costs to sell, except for assets such as deferred tax assets, assets arising from employee benefits and financial assets that are carried at fair value, which are specifically exempt from this requirement.
An impairment loss is recognised for any initial or subsequent write-down of the asset (or disposal group) to fair value less costs to sell. A gain is recognised for any subsequent increases in fair value less costs to sell of an asset (or disposal group), but not in excess of any cumulative impairment loss previously recognised. A gain or loss not previously recognised by the date of the sale of the non-current asset (or disposal group) is recognised at the date of derecognition.
Non-current assets (including those that are part of a disposal group) are not depreciated or amortised while they are classified as held for sale. Interest and other expenses attributable to the liabilities of a disposal group classified as held for sale continue to be recognised.
F I N A N C I A L S T A T E M E N T S
NOTES TO THE CONSOLIDATED FINANCIAL STATEMENTSFOR THE YEAR ENDED 30 JUNE 2013
Note 1 – Summary of significant accounting policies (continued)
| (q) | Non-current assets (or disposal groups) held for sale and discontinued operations (continued) |
Non-current assets classified as held for sale and the assets of a disposal group classified as held for sale are presented separately from the other assets in the statement of financial position. The liabilities of an asset classified as held for sale and the liabilities of a disposal group classified as held for sale are presented separately from other liabilities in the statement of financial position.
A discontinued operation is a component of the entity that has been disposed of or is classified as held for sale and that represents a separate major line of business or geographical area of operations, is part of a single coordinated plan to dispose of such a line of business or area of operations, or is a subsidiary acquired exclusively with a view to resale. The results of discontinued operations are presented separately in profit or loss.
| (r) | Property, plant and equipment |
Property, plant and equipment is recorded at historical cost less accumulated depreciation and accumulated impairment. Historical cost includes expenditures that are directly attributable to the acquisition and installation of the items. Cost may also include transfers from equity of any gain or loss on qualifying cash flow hedges of foreign currency purchases of property, plant and equipment.
Subsequent costs are included in the asset’s carrying amount or recognised as a separate asset, as appropriate, only when it is probable that future economic benefits associated with the item will flow to the Group and the cost of the item can be measured reliably. The carrying amount of any component accounted for as a separate asset is derecognised when replaced. All other repairs and maintenance are charged to profit or loss during the financial period in which they are incurred.
Land is not depreciated. Depreciation on other assets is calculated using the straight-line method to allocate their cost net of their residual values, over their estimated useful lives, as follows:
| • | | Buildings – 25 to 40 years |
| • | | Plant and equipment – 3 to 20 years |
| • | | Leasehold improvements – lesser of life of asset or life of the lease |
The assets’ residual values and useful lives are reviewed, and adjusted if appropriate, at the end of each reporting period. An asset’s carrying amount is written-down immediately to its recoverable amount if the asset’s carrying amount is greater than its estimated recoverable amount as set out in Note 1(m). Gains and losses on disposals are determined by comparing proceeds with carrying amounts and recognised in profit or loss.
Initial recognition and measurement
The Group classifies its financial assets in the following categories: financial assets at fair value through profit or loss, loans and receivables, or available-for-sale financial assets. The Group determines the classification of its financial assets at initial recognition.
All financial assets are recognised initially at fair value plus transaction costs, except in the case of financial assets recorded at fair value through profit or loss.
Purchases or sales of financial assets that require delivery of assets within a time frame established by regulation or convention in the market place (regular way trades) are recognised on the trade date – the date that the Group commits to purchase or sell the asset.
Subsequent measurement
The subsequent measurement of financial assets depends on their classification as described below:
Financial assets at fair value through profit or loss
Financial assets at fair value through profit or loss are financial assets held for trading. A financial asset is classified in this category if acquired principally for the purpose of selling in the short-term. Derivatives are classified as held for trading unless they are designated as effective hedging instruments. Gains or losses on financial assets held for trading are recognised in profit or loss and the related assets are classified in the statement of financial position based on their maturity.
The Group evaluates its financial assets held for trading, other than derivatives, to determine whether the intention to sell them in the near term is still appropriate. When in rare circumstances the Group is unable to trade these financial assets due to inactive markets and management’s intention to sell them in the foreseeable future significantly changes, the Group may elect to reclassify these financial assets. The reclassification to loans and receivables or available-for-sale depends on the nature of the asset. This evaluation does not affect any financial assets designated at fair value through profit or loss using the fair value option at designation, these instruments cannot be reclassified after initial recognition.
Derivatives embedded in host contracts are accounted for as separate derivatives and recorded at fair value if their economic characteristics and risks are not closely related to those of the host contracts and the host contracts are not held for trading or designated at fair value though profit or loss. These embedded derivatives are measured at fair value with changes in fair value recognised in profit or loss. Reassessment only occurs if there is a change in the terms of the contract that significantly modifies the cash flows that would otherwise be required.
Loans and receivables
Loans and receivables are non-derivative financial assets with fixed or determinable payments that are not quoted in an active market. After initial measurement, such financial assets are subsequently measured at amortised cost using the effective interest method, less impairment.
Convertible loans held by the Group are separately presented as a debt portion and conversion option embedded in convertible loans. On initial recognition, the debt portion represents the residual between the fair value of the convertible loan and the fair value of the embedded conversion option. The debt portion is classified as loans and receivables and is subsequently measured at amortised cost using the effective interest method.
Available-for-sale financial assets
Available-for-sale financial assets are non-derivative financial assets that are designated as available-for-sale or are not classified in any other category. They are included in non-current assets unless the investment matures or management intends to dispose of the investment within 12 months of the end of the reporting period. Investments are designated as available-for-sale if they do not have fixed maturities and fixed or determinable payments and management intends to hold them for the medium to long term.
After initial measurement, available-for-sale financial investments are subsequently measured at fair value with unrealised gains or losses recognised as other comprehensive income in the available-for-sale investments reserve until the investment is derecognised, at which time the cumulative gain or loss is recognised in other operating income, or the investment is determined to be impaired, when the cumulative loss is reclassified from the available-for-sale investment reserve to profit or loss.
The Group evaluates whether the ability and intention to sell its available-for-sale financial assets in the near term is still appropriate. When, in rare circumstances, the Group is unable to trade these financial assets due to inactive markets and management’s intention to do so significantly changes in the foreseeable future, the Group may elect to reclassify these financial assets. Reclassification to loans and receivables is permitted when the financial assets meet the definition of loans and receivables and the Group has the intent and ability to hold these assets for the foreseeable future or until maturity.
For a financial asset reclassified from the available-for-sale category, the fair value carrying amount at the date of reclassification becomes its new amortised cost and any previous gain or loss on the asset that has been recognised in equity is amortised to profit or loss over the remaining life of the investment using the effective interest method. Any difference between the new amortised cost and the maturity amount is also amortised over the remaining life of the asset using the effective interest method. If the asset is subsequently determined to be impaired, then the amount recorded in equity is reclassified to profit or loss.
Offsetting financial instruments
Financial assets and liabilities are offset, and the net amount reported in the statement of financial position, when there is a legally enforceable right to offset the recognised amounts and there is an intention to settle on a net basis or realise the asset and settle the liability simultaneously.
Impairment
The Group assesses at the end of each reporting period whether there is objective evidence that a financial asset or group of financial assets is impaired. In the case of equity securities classified as available-for-sale, a significant or prolonged decline in the fair value of a security below its cost is considered as an indicator that the securities are impaired. If any such evidence exists for available-for-sale financial assets, the cumulative loss, measured as the difference between the acquisition cost and the current fair value, less any impairment loss on that financial asset previously recognised in profit or loss, is reclassified from equity and recognised in profit or loss as a reclassification adjustment. Impairment losses recognised in profit or loss on equity instruments classified as available-for-sale are not reversed through profit or loss.
If there is evidence of impairment for any of the Group’s financial assets carried at amortised cost, the loss is measured as the difference between the asset’s carrying amount and the present value of estimated future cash flows, excluding future credit losses that have not been incurred. The cash flows are discounted at the financial asset’s original effective interest rate. The loss is recognised in profit or loss.
| (t) | Derivatives and hedging activities |
Derivatives are initially recognised at fair value on the date a derivative contract is entered into and are subsequently remeasured to their fair value at the end of each reporting period. The accounting for subsequent changes in fair value depends on whether the derivative is designated as a hedging instrument, and if so, the nature of the item being hedged. The Group designates certain derivatives as either: (i) hedges of the fair value of recognised assets or liabilities or a firm commitment (“fair value hedges”); or (ii) hedges of a particular risk associated with the cash flows of recognised assets and liabilities and highly probable forecast transactions (“cash flow hedges”).
Certain derivative instruments do not qualify for hedge accounting, despite being valid economic hedges of the relevant risks. Changes in the fair value of any derivative instrument that does not qualify for hedge accounting are recognised immediately in profit or loss and are included in other income or other expenses.
The Group documents, at the inception of the hedging transaction, the relationship between hedging instruments and hedged items, as well as its risk management objective and strategy for undertaking various hedge transactions. The Group also documents its assessment, both at hedge inception and on an ongoing basis, of whether the derivatives that are used in hedging transactions have been, and will continue to be, highly effective in offsetting changes in fair values or cash flows of hedged items.
F I N A N C I A L S T A T E M E N T S
NOTES TO THE CONSOLIDATED FINANCIAL STATEMENTSFOR THE YEAR ENDED 30 JUNE 2013
Note 1 – Summary of significant accounting policies (continued)
| (t) | Derivatives and hedging activities (continued) |
The fair values of various derivative financial instruments used for hedging purposes are disclosed in Note 12. Movements in the hedging reserve in equity are shown in Note 21. The full fair value of a hedging derivative is classified as a non-current asset or liability when the remaining maturity of the hedged item is more than 12 months; it is classified as a current asset or liability when the remaining maturity is less than 12 months.
Options and warrants associated with listed equity securities and the conversion feature of convertible loans are classified as derivatives on the statement of financial position.
Changes in the fair value of derivatives that are designated and qualify as fair value hedges are recorded in profit or loss, together with any changes in the fair value of the hedged asset or liability that are attributable to the hedged risk.
The effective portion of changes in the fair value of derivatives that are designated and qualify as cash flow hedges are recognised in other comprehensive income and accumulated in the hedging reserve in equity. The gain or loss relating to the ineffective portion is recognised immediately in profit or loss. Amounts accumulated in equity are reclassified to profit or loss in the periods when the hedged item affects profit or loss (for instance when the forecast sale that is hedged takes place). The gain or loss relating to the effective portion of forward foreign exchange contracts hedging export sales is recognised in profit or loss within revenue.
Where the hedged item is the cost of a non-financial asset or liability, such as a forecast transaction for the purchase of property, plant and equipment, the amounts recognised within other comprehensive income are transferred to the initial carrying amount of the non-financial asset or liability.
When a hedging instrument expires or is sold or terminated, or when a hedge no longer meets the criteria for hedge accounting, any cumulative gain or loss existing in equity at that time remains in equity and is recognised when the forecast transaction is ultimately recognised in profit or loss. When a forecast transaction is no longer expected to occur, the cumulative gains or losses that were deferred in equity are immediately transferred to profit or loss.
| (u) | Goodwill and other intangible assets |
Goodwill is measured as described in Note 1(f). Goodwill is not amortised but it is tested for impairment annually or more frequently if events or changes in circumstances indicate that it might be impaired, and is carried at cost less accumulated impairment losses. Gains and losses on the disposal of an entity include the carrying amount of goodwill relating to the entity sold. Goodwill is allocated to CGUs for the purpose of impairment testing. The allocation is made to those CGUs or groups of CGUs that are expected to benefit from the business combination in which the goodwill arose.
Trade name relates principally to the “Metal Management” trading name. This intangible asset has a finite useful life and is carried at cost less accumulated amortisation. Amortisation is calculated using the straight-line method to allocate the cost of the trade name over its estimated useful life, which is 20 years.
| (iii) | Supplier relationships and contracts |
Supplier relationships and contracts acquired as part of a business combination are recognised separately from goodwill. The supplier relationships and contracts are carried at their fair value at the date of acquisition less accumulated amortisation and impairment losses. Amortisation is calculated based on the timing of projected cash flows of the supplier relationships or straight-line method (as appropriate) over their estimated useful lives, which currently vary from 1 to 10 years.
Permits acquired as part of a business combination are recognised separately from goodwill. Permits are issued by state and local governments and are renewable at little or no cost and are thus considered to have an indefinite life. Permits are carried at their fair value at the date of acquisition and are not amortised. Instead, permits are tested for impairment annually, or more frequently if events or changes in circumstances indicate that they might be impaired, and are carried at cost less accumulated impairment losses. Permits that relate to facilities that close, relocate or sold are written-off to nil at the time the facility is closed, relocated or sold.
| (v) | Trade and other payables |
These amounts represent liabilities for goods and services provided to the Group prior to the end of a financial year, which are unpaid. The amounts are unsecured and are usually payable within 30 days of recognition.
Borrowings are initially recognised at fair value, net of transaction costs incurred. Borrowings are subsequently measured at amortised cost. Any difference between the proceeds (net of transaction costs) and the redemption amount is recognised in profit or loss over the period of the borrowings using the effective interest method. Fees paid on the establishment of loan facilities, which are not an incremental cost relating to the actual draw-down of the facility, are recognised as prepayments and amortised to finance costs on a straight-line basis over the term of the loan facility.
Borrowings are removed from the statement of financial position when the obligation specified in the contract is discharged, cancelled or expired. The difference between the carrying amount of a financial liability that has been extinguished or transferred to another party and the consideration paid, including any non-cash assets transferred or liabilities assumed, is recognised in profit or loss as other income or finance costs.
Borrowings are classified as current liabilities unless the Group has the unconditional right to defer settlement of the liability for at least 12 months after the reporting period.
Borrowing costs incurred for the construction of any qualifying asset are capitalised during the period of time required to complete and prepare the asset for its intended use. Other borrowing costs are recognised as expenses in the period in which they are incurred.
Provisions are recognised when the Group has a present legal or constructive obligation as a result of past events, it is probable that an outflow of resources will be required to settle the obligation, and the amount can be reliably estimated. Provisions are not recognised for future operating losses.
Where there are a number of similar obligations, the likelihood that an outflow will be required in settlement is determined by considering the class of obligations as a whole. A provision is recognised even if the likelihood of an outflow with respect to any one item included in the same class of obligations may be small.
Provisions are measured at the present value of management’s best estimate of the expenditure required to settle the present obligation at the end of the reporting period. The discount rate used to determine the present value is a pre-tax rate that reflects current market assessments of the time value of money and the risks specific to the liability. The increase in the provision due to the passage of time is recognised as interest expense.
| (i) | Salaries and annual leave |
Liabilities for salaries and annual leave expected to be settled within 12 months of the end of the period in which employees render the related service are recognised in respect of employees’ services up to the end of the reporting period and are measured at the amounts expected to be paid when the liabilities are settled. The liability for annual leave is recognised in the provision for employee benefits and the liability for salaries is recognised in other payables.
The liability for long service leave is recognised in the provision for employee benefits and measured as the present value of expected future payments to be made in respect of services provided by employees up to the end of the reporting period in which the employees render the related service. Consideration is given to expected future wage and salary levels, experience of employee departures and periods of service. Expected future payments are discounted using market yields at the reporting date on national government bonds with terms to maturity and currency that match, as closely as possible, the estimated future cash outflows.
| (iii) | Superannuation, pensions and other post-retirement benefits |
The Group operates or participates in a number of pension (including superannuation) schemes throughout the world. The funding of the schemes complies with local regulations. The assets of the schemes are generally held separately from those of the Group and are administered by trustees or management boards.
For defined contribution schemes or schemes operated on an industry-wide basis where it is not possible to identify assets attributable to the participation by the Group’s employees, the cost is calculated on the basis of contributions payable.
For defined benefit schemes, the cost of providing pensions is charged to profit or loss so as to recognise current and past service costs, interest cost on defined benefit obligations, and the effect of any curtailments or settlements, net of expected returns on plan assets. Actuarial gains and losses arising from experience adjustments and changes in actuarial assumptions are recognised in the period in which they occur, directly in other comprehensive income. An asset or liability is consequently recognised in the statement of financial position based on the present value of the defined benefit obligation at the end of the reporting period, less any unrecognised past service costs and the fair value of plan assets at that date.
The present value of the defined benefit obligation is calculated by independent actuaries by discounting expected future payments using market yields at the reporting date on high quality corporate bonds in countries that have developed corporate bond markets. However, where developed corporate bond markets do not exist, the discount rates are selected by reference to national government bonds. In both instances, the bonds are selected with terms to maturity and currencies that match, as closely as possible, the estimated future cash flows. Consideration is given to expected future wage and salary levels, experience of employee departures and periods of service. Details relating to retirement benefit obligations are set out in Note 19.
F I N A N C I A L S T A T E M E N T S
NOTES TO THE CONSOLIDATED FINANCIAL STATEMENTSFOR THE YEAR ENDED 30 JUNE 2013
Note 1 – Summary of significant accounting policies (continued)
| (z) | Employee benefits (continued) |
Termination benefits are payable when employment is terminated before the normal retirement date, or when an employee accepts voluntary redundancy in exchange for these benefits. The Group recognises termination benefits when it is demonstrably committed to either terminating the employment of current employees according to a detailed formal plan without possibility of withdrawal or providing termination benefits as a result of an offer made to encourage voluntary redundancy. Benefits due more than 12 months after the end of the reporting period are discounted to present value.
Share-based compensation benefits are provided to certain employees via the schemes set out in Note 25. For share-based arrangements, the fair value is measured at grant date and recognised as an employee benefit expense with a corresponding increase in equity. For cash-settled share-based arrangements, the fair value of the amount payable is recognised as an employee benefit expense with a corresponding increase to a liability. The liability is re-measured each reporting date and at settlement date. Any changes in the fair value of the liability are recognised as an employee benefit expense in profit or loss.
The fair value at grant date is independently determined using either a binomial model or a Monte-Carlo simulation model. The model takes into account the exercise price, the term, the share price at grant date and expected price volatility of the underlying share, the expected dividend yield, and the risk-free interest rate for the term of the grant. The fair value is adjusted to reflect market vesting conditions, but excludes the impact of any non-market vesting conditions (for example, earnings per share targets). Non-market vesting conditions are included in assumptions about the number of shares that are expected to become exercisable. At the end of each reporting period, the Group revises its estimate of the number of shares that are expected to become exercisable. The employee benefit expense recognised each period takes into account the most recent estimate. The impact of the revision to original estimates, if any, is recognised in profit or loss with a corresponding adjustment to equity.
Ordinary shares are classified as equity. Incremental costs directly attributable to the issue of new shares are shown in equity as a deduction, net of tax, from the proceeds.
When the Company purchases any of its own equity instruments, for example, as a result of a share buy-back, the consideration paid, including any directly attributable incremental costs (net of income taxes) is deducted from contributed equity and any reacquired shares are cancelled upon their purchase.
A provision is made for the amount of any dividends declared on or before the end of the reporting period, but not distributed at the end of the reporting period.
| (ac) | Earnings per share (“EPS”) |
Basic earnings per share is calculated by dividing net profit by the weighted average number of ordinary shares outstanding during the financial year, adjusted for bonus elements in ordinary shares issued during the year.
Diluted earnings per share adjusts the figures used in the determination of basic earnings per share to take into account the after income tax effect of interest and other financing costs associated with dilutive potential ordinary shares, and the weighted average number of additional ordinary shares that would have been outstanding assuming the conversion of all dilutive potential ordinary shares.
| (ad) | Goods and services or other value-added taxes (“GST”) |
Revenues, expenses and assets are recognised net of the amount of associated GST, unless the GST incurred is not recoverable from the taxation authority. In this case, it is recognised as part of the cost of acquisition of the asset or as part of the expense. Receivables and payables are stated inclusive of the amount of GST receivable or payable. The net amount of GST recoverable from, or payable to, the taxation authority is included with other receivables or payables in the statement of financial position.
Cash flows are presented on a gross basis. The GST components of cash flows arising from investing or financing activities, which are recoverable from, or payable to, the taxation authority, are presented as operating cash flows.
| (ae) | Parent entity financial information |
The financial information for the parent entity, Sims Metal Management Limited, disclosed in Note 32, has been prepared on the same basis as the consolidated financial statements, except as set out below.
| (i) | Investments in subsidiaries |
Investments in subsidiaries are accounted for at cost in the financial statements of the Company. Dividends received from subsidiaries are recognised in the Company’s profit or loss, rather than being deducted from the carrying amount of the investments.
| (ii) | Tax consolidation legislation |
The Company and its wholly owned Australian controlled entities have implemented the tax consolidation legislation. The head entity, Sims Metal Management Limited, and the controlled entities in the tax consolidated group account for their own current and deferred tax amounts. These amounts are measured as if each entity in the tax consolidated group continues to be a standalone taxpayer in its own right.
In addition to its current and deferred tax amounts, the Company also recognises the current tax liabilities (or assets) and the deferred tax assets arising from unused tax losses and unused tax credits assumed from controlled entities in the tax consolidated group.
The entities have also entered into a tax funding agreement under which the wholly owned entities fully compensate the Company for any current tax receivable and deferred tax assets relating to unused tax losses or unused tax credits that are transferred to the Company under the tax consolidation legislation. The funding amounts are determined by reference to the amounts recognised in the wholly owned entities’ financial statements.
The amount receivable/payable under the tax funding agreement is due upon receipt of the funding advice from the head entity, which is issued as soon as practicable after the end of each financial year. The head entity may also require payment of interim funding amounts to assist with its obligations to pay tax instalments.
Assets or liabilities arising under the tax funding agreements with the tax consolidated entities are recognised as current amounts receivable from or payable to other entities in the Group.
Any difference between the amounts assumed and amounts receivable or payable under the tax funding agreement are recognised as a contribution to (or distribution from) wholly owned tax consolidated entities.
F I N A N C I A L S T A T E M E N T S
NOTES TO THE CONSOLIDATED FINANCIAL STATEMENTS FOR THE YEAR ENDED 30 JUNE 2013
Note 2 – Prior period restatement
On 21 January 2013, the Board of Directors (the “Board”) announced that it had established a Special Committee (the “Committee”) to investigate inventory valuation issues in the Group’s business in the United Kingdom. On 15 February 2013, the Company announced the preliminary results of the Committee’s investigation which revealed that the Group’s United Kingdom inventories were overstated by A$62.0 million (A$44.9 million after-tax) in periods that preceded fiscal 2013.
As described further in Note 14, the Group was required to reassess its goodwill for impairment in the United Kingdom for the prior periods impacted by the restatement. The reassessment resulted in an additional impairment of goodwill of A$60.5 million (A$56.5 million after-tax) for the year ended 30 June 2012.
The Board believed it was appropriate to adjust these errors with prior year adjustments in accordance AASB 108 (IAS 8) Accounting Policies, Changes in Accounting Estimates and Errors. The impact on the Group’s financial statements for the prior periods impacted is set out below. The entire impact was on the Europe segment.
| (a) | Impact on profit or loss |
| | | | | | | | | | | | |
| | | 2012 A$M | | | 2011 A$M | | | 2010 A$M | |
(Loss)/profit as previously reported | | | (521.4 | ) | | | 192.1 | | | | 126.7 | |
| | | |
Restatement of errors: | | | | | | | | | | | | |
Increase in raw materials used and changes in inventories | | | (48.0 | ) | | | (6.6 | ) | | | (7.4 | ) |
Increase in impairment of goodwill and other intangibles | | | (60.5 | ) | | | - | | | | - | |
Impact of restatement on taxation | | | 7.4 | | | | 1.8 | | | | 2.1 | |
(Loss)/profit as restated | | | (622.5 | ) | | | 187.3 | | | | 121.4 | |
| | | |
(b) Impact on earnings per share | | | | | | | | | | | | |
| | | |
| | | 2012 | | | 2011 | | | 2010 | |
Basic (in cents): | | | | | | | | | | | | |
(Loss)/earnings per share as previously reported | | | (253.3 | ) | | | 93.9 | | | | 64.9 | |
Impact from restatement of errors | | | (49.1 | ) | | | (2.4 | ) | | | (2.8 | ) |
(Loss)/earnings per share as restated | | | (302.4 | ) | | | 91.5 | | | | 62.1 | |
| | | |
Diluted (in cents): | | | | | | | | | | | | |
(Loss)/earnings per share as previously reported | | | (253.3 | ) | | | 93.3 | | | | 64.5 | |
Impact from restatement of errors | | | (49.1 | ) | | | (2.4 | ) | | | (2.7 | ) |
(Loss)/earnings per share as restated | | | (302.4 | ) | | | 90.9 | | | | 61.8 | |
| | | |
(c) Impact on consolidated balance sheet | | | | | | | | | | | | |
| | | |
| | | AS PREVIOUSLY
REPORTED A$M | | | IMPACT OF
RESTATEMENTS
A$M | | | RESTATED
A$M | |
As at 30 June 2012 | | | | | | | | | | | | |
Trade and other receivables | | | 513.4 | | | | 5.4 | | | | 518.8 | |
Inventory | | | 890.0 | | | | (60.5 | ) | | | 829.5 | |
Deferred tax assets | | | 124.2 | | | | 5.2 | | | | 129.4 | |
Goodwill | | | 507.4 | | | | (61.1 | ) | | | 446.3 | |
Deferred tax liabilities | | | 109.4 | | | | (0.3 | ) | | | 109.1 | |
Reserves | | | (333.4 | ) | | | 0.5 | | | | (332.9 | ) |
Retained deficit | | | (76.5 | ) | | | (111.2 | ) | | | (187.7 | ) |
| | | |
As at 30 June 2011 | | | | | | | | | | | | |
Inventory | | | 978.5 | | | | (12.4 | ) | | | 966.1 | |
Current tax liabilities | | | 32.6 | | | | (3.4 | ) | | | 29.2 | |
Reserves | | | (446.3 | ) | | | 1.1 | | | | (445.2 | ) |
Retained earnings/(deficit) | | | 548.9 | | | | (10.1 | ) | | | 538.8 | |
| | | |
As at 30 June 2010 | | | | | | | | | | | | |
Inventory | | | 776.9 | | | | (7.2 | ) | | | 769.7 | |
Current tax liabilities | | | 23.2 | | | | (2.0 | ) | | | 21.2 | |
Reserves | | | 58.1 | | | | 0.1 | | | | 58.2 | |
Retained earnings/(deficit) | | | 425.5 | | | | (5.3 | ) | | | 420.2 | |
Note 3 – Financial risk management
The Group’s activities expose it to a variety of financial risks: market risk (including interest rate risk, foreign exchange risk, commodity price risk and equity securities price risk), credit risk and liquidity risk. The Group’s overall financial risk management strategy seeks to mitigate these risks to minimise potential adverse effects on the financial performance of the Group.
The Group uses derivative financial instruments in certain circumstances in accordance with Board approved policies to hedge exposure to fluctuations in foreign exchange rates or commodity prices. Derivative financial instruments are used for hedging purposes and not as trading or other speculative instruments. The Group uses different methods to measure different types of risk to which it is exposed. These methods include monitoring key movements in interest rates, key transactions affected by foreign exchange, commodity prices, equity prices, and ageing analysis for credit risk. Risk management is carried out by a limited number of employees as authorised by the Board. The Board provides written principles for overall risk management, as well as written policies covering specific areas, such as foreign exchange risk, interest rate risk, credit risk, use of derivative financial instruments and non-derivative financial instruments, and the investment of excess liquidity.
The Risk, Audit & Compliance Committee (“RAC”) of the Board oversees, on a quarterly basis, the monitoring of compliance by management with the Group’s risk management framework. The RAC is assisted in its oversight role by Internal Audit. Internal Audit undertakes both regular and ad hoc reviews of risk management controls and procedures, the results of which are also reported to the RAC.
The Group holds the following financial instruments:
| | | | | | | | |
| | | 2013
A$M | | | 2012 A$M
RESTATED | |
Financial assets: | | | | | | | | |
Cash and cash equivalents | | | 46.9 | | | | 51.4 | |
Trade and other receivables | | | 455.4 | | | | 518.8 | |
Other financial assets | | | 77.0 | | | | 78.8 | |
Total financial assets | | | 579.3 | | | | 649.0 | |
| | |
Financial liabilities: | | | | | | | | |
Trade and other payables | | | 593.5 | | | | 680.1 | |
Borrowings | | | 200.7 | | | | 343.6 | |
Other financial liabilities | | | 6.3 | | | | 2.1 | |
Total financial liabilities | | | 800.5 | | | | 1,025.8 | |
Market risk is the risk that the fair value or future cash flows of the Group’s financial instruments will fluctuate because of changes in market prices. The market risks to which the Group is exposed are discussed in further detail below.
Interest rate risk arises from interest bearing financial assets and liabilities that the Group utilises. The Group’s main exposure to interest rate risk arises from borrowings at variable interest rates. The Group does not use any derivative financial instruments to manage its exposure to interest rate risk. Cash deposits, loans to third parties and associates, and borrowings issued at fixed rates expose the Group to fair value interest rate risk.
The Group’s borrowings are sourced primarily from domestic, but also offshore, markets. The Group’s borrowings consist primarily of foreign currency denominated borrowings and are managed in accordance with targeted currency, interest rate, liquidity and debt portfolio maturity profiles.
Specifically, interest rate risk is managed on the Group’s net debt portfolio by:
| • | | providing access to diverse sources of funding; |
| • | | reducing risks of refinancing by establishing and managing in accordance with target maturity profiles; and |
| • | | negotiating interest rates with the Group’s banks based on a variable pricing matrix, which generally involve a LIBOR rate plus a margin. |
The Group’s weighted average interest rate on interest-bearing liabilities for the year ended 30 June 2013 was 2.8% (2012: 2.5%). If interest rates had increased by 100 basis points as at the balance date with all other variables held constant, post-tax profit for the year ended 30 June 2013 would have been A$1.5 million lower (2012: A$2.4 million lower). A sensitivity of 100 basis points is deemed reasonable based on current and past market conditions. The calculations are based on interest-bearing financial instruments with variable interest rates at the end of the reporting period. A 100 basis points decrease in interest rates would have an equal and opposite effect.
F I N A N C I A L S T A T E M E N T S
NOTES TO THE CONSOLIDATED FINANCIAL STATEMENTS FOR THE YEAR ENDED 30 JUNE 2013
Note 3 – Financial risk management (continued)
| (a) | Market risk (continued) |
(ii) Price risk
Commodity price risk
The Group is exposed to risks associated with fluctuations in the market price for ferrous and non-ferrous metals and precious metals, which are at times volatile. The Group seeks to mitigate commodity price risk by seeking to turn over its inventories quickly, instead of holding inventories in anticipation of higher commodity prices. The ability of the Group to accomplish an adequate level of inventory turnover can be a function of demand and market conditions which are not always steady. The Group uses forward commodity contracts matched to purchases or sales of non-ferrous metals (primarily copper, nickel and aluminium) and certain precious metals (primarily gold, silver and palladium).
The Group’s normal policy is to sell its products at prevailing market prices. Exceptions to this rule are subject to limits and policies approved by the Board and to systems of internal controls and compliance monitoring. The Group’s exposure to commodity prices is to an extent diversified by virtue of its broad commodity base.
At the end of the reporting period, none of the Group’s forward commodity contracts qualified for hedge accounting, despite being valid economic hedges of the relevant risk. Accordingly, any movement in commodity rates that impact the fair value of these forward commodity contracts are recorded in profit or loss. Note 12 shows the carrying amount of the Group’s forward commodity contracts at the end of the reporting period.
The following table shows the effect on post-tax profit from a 10% appreciation in commodity prices at the end of the reporting period being applied to outstanding forward commodity contracts, with all other variables held constant. A 10% sensitivity has been selected, as this is considered reasonable, given the current level of commodity prices and the volatility observed both on a historical basis and on market expectations for future movements.
| | | | | | | | |
| | | 2013
A$M | | | 2012
A$M | |
Impact on post-tax profit – higher/(lower) | | | (8.8 | ) | | | (9.2 | ) |
A 10% depreciation of the stated commodity prices would have an equal and opposite effect.
Equity securities price risk
The Group is exposed to equity securities price risk through financial instruments classified as fair value through profit or loss, whose valuations are partially derived from equity prices of listed securities. These financial instruments relate to an investment in an associate that the Group considers strategic in nature. The Group does not attempt to manage the price risk related to these financial instruments.
The Group is also exposed to equity securities price risk through investments in marketable securities. These marketable securities are traded in major financial markets. The price risk for these investments is immaterial in terms of possible impact on profit or loss.
(iii) Foreign exchange risk
The Group operates internationally and is exposed to foreign exchange risk, primarily with respect to transactions settled in US dollars. Foreign exchange risk arises when future commercial transactions and recognised assets and liabilities are denominated in a currency that is not the entity’s functional currency. Financial assets and liabilities denominated in currencies other than the functional currency of an entity are periodically restated to their functional currency, and the associated gain or loss is taken to profit or loss. The exposure of an entity to transaction risk is minimised by matching local currency income with local currency costs.
The Group seeks to denominate borrowings in the currencies of its principal assets and cash flows. These are primarily denominated in US dollars, British pounds, euros and Australian dollars.
In accordance with Board approved policies, the Group enters into forward foreign exchange contracts to buy and sell specific amounts of various foreign currencies in the future at predetermined exchange rates. The forward foreign exchange contracts are used to hedge transactions denominated in currencies that are not the functional currency of the relevant entity. These contracts are hedging highly probable forecasted transactions and recognised assets and liabilities for the ensuing financial year. The contracts are timed to mature when monies from the forecasted sales are scheduled to be received or when payments for purchases are scheduled to be made.
The Group’s exposure to foreign exchange risk at the end of the reporting period, expressed in Australian dollars, was as follows:
| | | | | | | | |
| | | NET FINANCIAL ASSETS/(LIABILITIES) | |
| CURRENCY | | 2013
A$M | | | 2012
A$M | |
US dollar | | | 22.3 | | | | 37.4 | |
Euro | | | 17.3 | | | | 31.8 | |
British pound | | | (0.2 | ) | | | – | |
The table below shows the net impact of a 10% appreciation of the relevant currency against the Australian dollar for the balances above with all other variables held constant and the corresponding effect on the Group’s forward foreign exchange contracts with all other variables held constant. A sensitivity of 10% has been selected, as this is considered reasonable, given the current level of exchange rates and the volatility observed both on a historical basis and on market expectations for future movements.
| | | | | | | | | | | | | | | | | | | | | | | | |
| | | US DOLLAR | | | EURO | | | BRITISH POUND | |
| | | 2013
A$M | | | 2012
A$M | | | 2013
A$M | | | 2012
A$M | | | 2013
A$M | | | 2012
A$M | |
Impact on post-tax profit – higher/(lower) | | | (1.0 | ) | | | 1.0 | | | | 0.5 | | | | 0.8 | | | | – | | | | – | |
Impact on equity | | | 20.2 | | | | 14.7 | | | | (0.5 | ) | | | (0.7 | ) | | | 10.0 | | | | 9.3 | |
The impact on equity includes the effect from intragroup long-term borrowings which, in substance, form part of the Group’s investment in an entity. Exchange gains and losses on these balances are recorded in the foreign currency translation reserve.
A 10% depreciation of the relevant currency against the Australian dollar would have an equal and opposite effect.
Translation risk
The financial statements for each of the Group’s foreign operations are prepared in local currency, being their functional currency. For the purposes of preparing the Group’s consolidated financial information, each foreign operation’s financial statements are translated into Australian dollars using the applicable foreign exchange rates as at the balance date. A translation risk, therefore, exists on translating the financial statements of the Group’s foreign operations into Australian dollars for the purposes of reporting consolidated financial information. As a result, volatility in foreign exchange rates can impact the Group’s net assets, net profit and the foreign currency translation reserve and as a result can influence compliance with credit agreements.
Credit risk is the risk that a counterparty will not complete its obligations under a financial instrument and cause a financial loss to the Group. The Group has exposure to credit risk on all financial assets included in the Group’s statement of financial position.
The Group establishes credit limits for its customers. Trade and other receivables consist of a large number of customers, spread across various metal producing sectors in international markets. The Group does not have any significant credit risk exposure to a single customer or groups of customers. Ongoing credit evaluation is performed on the financial condition of the Group’s customers and, where appropriate, an impairment provision is raised. For certain customers, the Group purchases credit insurance to protect itself against collection risks.
The Group is also exposed to credit risk arising from the Group’s transactions in derivative contracts. For credit purposes, there is only a credit risk where the counterparty is liable to pay the Group in the event of a closeout. The Group has policies that limit the amount of credit exposure to any financial institution. Derivative counterparties and cash transactions are limited to financial institutions that have a minimum credit rating of “A” by either Standard & Poor’s or Moody’s. Management also monitors the current credit exposure with each counterparty. Any changes to counterparties or their credit limits must be approved by the Group Chief Financial Officer.
Liquidity risk is associated with ensuring that there is sufficient cash and cash equivalents and the availability of funding through an adequate amount of committed credit facilities to meet the Group’s obligations as they mature and the ability to close out market positions.
The Group manages liquidity risk by monitoring forecast and actual cash flows and matching the maturity profiles of financial assets and liabilities. Due to the dynamic and volatile nature of the underlying businesses, the Group aims at maintaining flexibility in funding by keeping committed credit lines available with a variety of counterparties.
The Group has access to unsecured global multi-currency/multi-option loan facilities all of which are subject to common terms. The loan facilities have maturities through 31 October 2015. The Group also has annual rights to extend the maturity by an additional year in certain circumstances. The Group had access to the following credit standby arrangements at the balance date. The amount of credit available is subject to limits from covenants as specified in the loan facilities.
| | | | | | | | |
| | | 2013 A$M | | | 2012 A$M | |
Unsecured global multi-currency/multi-option loan facilities | | | 1,396.7 | | | | 1,451.6 | |
Amount of credit unused | | | 1,177.4 | | | | 1,098.0 | |
The contractual cash flows of the Group’s financial liabilities are shown in the table below. The contractual amounts represent the future undiscounted cash flows. The amounts for interest bearing liabilities also include interest cash flows and, therefore, do not equate to the carrying amount. The expected timing of cash outflows are set out below.
F I N A N C I A L S T A T E M E N T S
NOTES TO THE CONSOLIDATED FINANCIAL STATEMENTSFOR THE YEAR ENDED 30 JUNE 2013
Note 3 – Financial risk management (continued)
| (c) | Liquidity risk (continued) |
| | | | | | | | | | | | | | | | | | | | | | | | |
| | | 2013 A$M | | | 2012 A$M | |
| | | LESS
THAN 1YEAR | | | BETWEEN
1 AND 2 YEARS | | | BETWEEN
2 AND 5 YEARS | | | LESS
THAN 1 YEAR | | | BETWEEN
1 AND 2 YEARS | | | BETWEEN
2 AND 5 YEARS | |
Non-derivatives: | | | | | | | | | | | | | | | | | | | | | | | | |
Trade and other payables | | | 585.2 | | | | – | | | | – | | | | 672.1 | | | | – | | | | – | |
Payables – non-current | | | – | | | | 2.3 | | | | 6.0 | | | | – | | | | 2.9 | | | | 5.1 | |
Borrowings (including interest payments) | | | 30.7 | | | | 19.1 | | | | 195.5 | | | | 18.3 | | | | 18.2 | | | | 349.7 | |
| | | 615.9 | | | | 21.4 | | | | 201.5 | | | | 690.4 | | | | 21.1 | | | | 354.8 | |
Financial guarantees1 | | | 61.9 | | | | – | | | | – | | | | 41.6 | | | | – | | | | – | |
| | | | 677.8 | | | | 21.4 | | | | 201.5 | | | | 732.0 | | | | 21.1 | | | | 354.8 | |
| | | | | | |
Derivatives: | | | | | | | | | | | | | | | | | | | | | | | | |
Net settled (forward commodity contracts) | | | 0.8 | | | | – | | | | – | | | | 1.4 | | | | – | | | | – | |
Gross settled (forward foreign exchange contracts): | | | | | | | | | | | | | | | | | | | | | | | | |
- (inflow) | | | (224.4 | ) | | | – | | | | – | | | | (149.3 | ) | | | – | | | | – | |
- outflow | | | 229.9 | | | | – | | | | – | | | | 150.0 | | | | – | | | | – | |
| | | | 6.3 | | | | – | | | | – | | | | 2.1 | | | | – | | | | – | |
| 1 | Refer to Note 23(a) for details on financial guarantees. The amounts disclosed above are the maximum amounts allocated to the earliest period in which the guarantee could be called. However, the Group considers that it is more likely than not that such an amount will not be payable under the arrangement. |
Note 4 – Critical accounting estimates and judgements
Certain amounts included in the consolidated financial statements involve the use of estimation and/or judgement. Estimates and judgments used in preparation of the consolidated financial statements are continually evaluated and are based on historical experience and other factors, including the expectations of future events that may have a financial impact on the Group and that are believed to be reasonable under the circumstances. The resulting accounting estimates may differ from actual results.
The following are the critical judgements and estimations that have the most significant effect on the amounts recognised in the consolidated financial statements.
Impairment of goodwill
Goodwill is tested for impairment in accordance with the accounting policy stated in Note 1(u). For goodwill impairment testing, the recoverable amount of each CGU is determined based on the higher of its value-in-use or fair value less costs to sell. These calculations require the use of assumptions such as discount rates, exchange rates, growth rates, and other assumptions. As at 30 June 2013, the carrying amount of goodwill was A$166.5 million. Refer to Note 14 for details of these assumptions and the potential impact of changes to the assumptions.
Taxation
The Group is subject to income taxes in numerous jurisdictions. Significant judgement is required in determining the worldwide provision for income taxes due to the complexity of legislation. There are many transactions and calculations for which the ultimate tax determination is uncertain during the ordinary course of business. The Group recognises liabilities for anticipated tax audit issues based on estimates of whether additional taxes will be due. Where the final tax outcome of these matters is different from the amounts that were initially recorded, such differences will impact the income tax and deferred tax provisions in the period in which such determination is made.
The Group recognises the net future tax benefit related to deferred income tax assets to the extent that it is probable that the deductible temporary differences will reverse in the foreseeable future. Assessing the recoverability of deferred income tax assets requires the Group to make significant estimates related to expectations of future taxable income. Estimates of future taxable income are based on forecast cash flows from operations and the application of existing tax laws in each jurisdiction. To the extent that future cash flows and taxable income differ significantly from estimates, the ability of the Group to realise the net deferred tax assets recorded at the reporting date could be impacted. Additionally, future changes in tax laws in the jurisdictions in which the Group operates could limit the ability of the Group to obtain tax deductions in future periods. For more information see Note 9.
Valuation of inventories
The Group’s inventories primarily consist of ferrous and non-ferrous scrap metals. Quantities of inventories are determined using various estimation techniques, including observation, weighing and other industry methods and are subject to periodic physical verification.
Inventories are stated at the lower of cost and net realisable value, with due allowance for excess, obsolete or slow moving items. Cost is determined by the weighted average method and comprises direct purchase costs, direct labour and an appropriate portion of fixed and variable overhead costs (refer to Note 1(p)). The Group reviews its inventory at the end of each reporting period to determine if it is properly stated at net realisable value. Net realisable value is based on current assessments of future demand and market conditions. The amount of write-downs of inventories to net realisable value is disclosed in Note 8. Given the significance of inventories to the consolidated statement of financial position, the determination of net realisable value is considered to be a critical accounting estimate. Impairment losses may be recognised on inventory in the next financial year if management needs to revise its estimates of net realisable value in response to changing market conditions.
Note 5 – Earnings per share
| | | | | | | | | | | | |
| | | 2013 | | | 2012
RESTATED | | | 2011
RESTATED | |
(Loss)/earnings per share (in cents) | | | | | | | | | | | | |
Basic | | | (228.1 | ) | | | (302.4 | ) | | | 91.5 | |
Diluted | | | (228.1 | ) | | | (302.4 | ) | | | 90.9 | |
| | | |
Weighted average number of shares used in the denominator (’000) | | | | | | | | | | | | |
Basic shares | | | 204,391 | | | | 205,828 | | | | 204,630 | |
Dilutive effect of share-based awards | | | – | | | | – | | | | 1,330 | |
Diluted shares | | | 204,391 | | | | 205,828 | | | | 205,960 | |
Due to the loss after tax in the years ended 30 June 2013 and 2012, the dilutive effect of share-based awards, which was approximately 2.8 million and 2.0 million shares, respectively, was not included as the result would have been anti-dilutive. For the year ended 30 June 2011, share awards granted to employees are considered to be potential ordinary shares and have been included in the determination of diluted earnings per share to the extent they are dilutive. Details relating to share awards are set out in Note 25.
Note 6 – Segment information
| (a) | Description of segments |
The Group is principally organised geographically and then by line of business. While the CEO has historically evaluated results in a number of different ways, the geographical area of operation is the primary basis for which the allocations of resources and financial results are assessed. The major geographic areas of operations are as follows:
North America – comprising the United States of America and Canada.
Australasia – comprising Australia, New Zealand, Papua New Guinea, India, Singapore, Hong Kong, Dubai and South Africa.
Europe – comprising the United Kingdom, Sweden, Belgium, the Netherlands, Germany, Poland, the Czech Republic, Hungary, Austria and Croatia.
The Group reports revenues by the following product groups:
| • | | Ferrous secondary recycling – comprising the collection, processing and trading of iron and steel secondary raw material. |
| • | | Non-ferrous secondary recycling – comprising the collection, processing and trading of other metal alloys and residues, principally aluminium, lead, copper, zinc and nickel bearing materials. |
| • | | Recycling solutions – comprising the provision of environmentally responsible solutions for the disposal of post- consumer electronic products, including IT assets recycled for commercial customers. The Group offers fee-for-service business opportunities in the environmentally responsible recycling of negative value materials, including refrigerators, electrical and electronic equipment. |
| • | | Secondary processing and other services – comprising value-added processes involving the melting, refining and ingoting of certain non-ferrous metals and other sources of service based revenue. |
F I N A N C I A L S T A T E M E N T S
NOTES TO THE CONSOLIDATED FINANCIAL STATEMENTSFOR THE YEAR ENDED 30 JUNE 2013
Note 6 – Segment information (continued)
(b) Information about reportable segments
There have been no changes to the basis of segmentation or the measurement basis for the segment profit before income tax since 30 June 2012.
| | | | | | | | | | | | | | | | |
| 2013 | | NORTH AMERICA
A$M | | | AUSTRALASIA
A$M | | | EUROPE
A$M | | | A$M | |
Total sales revenue | | | 4,534.6 | | | | 1,083.1 | | | | 1,575.3 | | | | 7,193.0 | |
Other revenue/income | | | 1.2 | | | | 8.0 | | | | 0.9 | | | | 10.1 | |
Total segment revenue | | | 4,535.8 | | | | 1,091.1 | | | | 1,576.2 | | | | 7,203.1 | |
| | | | |
Segment EBIT | | | (328.8 | ) | | | 10.0 | | | | (150.6 | ) | | | (469.4 | ) |
Interest income | | | | | | | | | | | | | | | 7.3 | |
Finance costs | | | | | | | | | | | | | | | (24.9 | ) |
Loss before income tax | | | | | | | | | | | | | | | (487.0 | ) |
| | | | |
Segment total assets | | | 1,660.0 | | | | 671.4 | | | | 585.4 | | | | 2,916.8 | |
Segment total liabilities | | | 477.7 | | | | 164.8 | | | | 345.5 | | | | 988.0 | |
Net assets | | | 1,182.3 | | | | 506.6 | | | | 239.9 | | | | 1,928.8 | |
| | | | |
Other items: | | | | | | | | | | | | | | | | |
Depreciation and amortisation expense | | | 68.1 | | | | 26.0 | | | | 29.4 | | | | 123.5 | |
Share of results of investments accounted for using the equity method | | | (0.4 | ) | | | (27.3 | ) | | | – | | | | (27.7 | ) |
Investments accounted for using the equity method | | | 233.1 | | | | 96.9 | | | | – | | | | 330.0 | |
Acquisitions of property, plant and equipment | | | 79.2 | | | | 50.2 | | | | 19.6 | | | | 149.0 | |
Impairment charge: | | | | | | | | | | | | | | | | |
Goodwill | | | 292.2 | | | | – | | | | – | | | | 292.2 | |
Other intangible assets | | | 8.5 | | | | – | | | | 3.7 | | | | 12.2 | |
Property, plant and equipment | | | 17.1 | | | | – | | | | 44.1 | | | | 61.2 | |
| | | | |
| 2012 (RESTATED) | | | | | | | | | | | | |
Total sales revenue | | | 6,027.0 | | | | 1,228.1 | | | | 1,780.6 | | | | 9,035.7 | |
Other revenue/income | | | 0.5 | | | | 5.3 | | | | 0.8 | | | | 6.6 | |
Total segment revenue | | | 6,027.5 | | | | 1,233.4 | | | | 1,781.4 | | | | 9,042.3 | |
| | | | |
Segment EBIT | | | (615.9 | ) | | | 93.3 | | | | (100.7 | ) | | | (623.3 | ) |
Interest income | | | | | | | | | | | | | | | 3.7 | |
Finance costs | | | | | | | | | | | | | | | (24.9 | ) |
Loss before income tax | | | | | | | | | | | | | | | (644.5 | ) |
| | | | |
Segment total assets | | | 2,066.3 | | | | 733.0 | | | | 709.7 | | | | 3,509.0 | |
Segment total liabilities | | | 608.6 | | | | 190.6 | | | | 426.1 | | | | 1,225.3 | |
Net assets | | | 1,457.7 | | | | 542.4 | | | | 283.6 | | | | 2,283.7 | |
| | | | |
Other items: | | | | | | | | | | | | | | | | |
Depreciation and amortisation expense | | | 77.1 | | | | 24.9 | | | | 27.9 | | | | 129.9 | |
Share of results of investments accounted for using the equity method | | | (11.9 | ) | | | 3.9 | | | | – | | | | (8.0 | ) |
Investments accounted for using the equity method | | | 230.9 | | | | 120.2 | | | | – | | | | 351.1 | |
Acquisitions of property, plant and equipment | | | 79.0 | | | | 39.5 | | | | 42.6 | | | | 161.1 | |
Impairment charge/(reversal): | | | | | | | | | | | | | | | | |
Goodwill | | | 510.8 | | | | 3.6 | | | | 102.9 | | | | 617.3 | |
Other intangible assets | | | 0.8 | | | | – | | | | – | | | | 0.8 | |
Property, plant and equipment | | | 3.1 | | | | 0.3 | | | | (3.0 | ) | | | 0.4 | |
| | | | | | | | | | | | | | | | |
| 2011 (RESTATED) | | NORTH AMERICA
A$M | | | AUSTRALASIA
A$M | | | EUROPE
A$M | | | A$M | |
Total sales revenue | | | 5,993.0 | | | | 1,369.2 | | | | 1,484.6 | | | | 8,846.8 | |
Other revenue/income | | | 1.0 | | | | 4.8 | | | | 0.3 | | | | 6.1 | |
Total segment revenue | | | 5,994.0 | | | | 1,374.0 | | | | 1,484.9 | | | | 8,852.9 | |
| | | | |
Segment EBIT | | | 120.5 | | | | 79.0 | | | | 93.6 | | | | 293.1 | |
Interest income | | | | | | | | | | | | | | | 3.2 | |
Finance costs | | | | | | | | | | | | | | | (27.1 | ) |
Profit before income tax | | | | | | | | | | | | | | | 269.2 | |
| | | | |
Segment total assets | | | 2,656.0 | | | | 633.0 | | | | 878.4 | | | | 4,167.4 | |
Segment total liabilities | | | 670.4 | | | | 220.9 | | | | 364.6 | | | | 1,255.9 | |
Net assets | | | 1,985.6 | | | | 412.1 | | | | 513.8 | | | | 2,911.5 | |
| | | | |
Other items: | | | | | | | | | | | | | | | | |
Depreciation and amortisation expense | | | 82.7 | | | | 21.7 | | | | 26.2 | | | | 130.6 | |
Share of results of investments accounted for using the equity method | | | 25.2 | | | | 2.9 | | | | – | | | | 28.1 | |
Investments accounted for using the equity method | | | 288.8 | | | | 21.5 | | | | – | | | | 310.3 | |
Acquisitions of property, plant and equipment | | | 69.2 | | | | 29.4 | | | | 44.2 | | | | 142.8 | |
(c) Other segment information
(i) Intersegment sales
Segment revenues, expenses and results include transfers between segments. Such transfers are priced on an “arm’s-length” basis and are eliminated on consolidation.
(ii) Sales to external customers
| | | | | | | | | | | | |
| | | 2013 A$M | | | 2012 A$M | | | 2011 A$M | |
Australia | | | 323.7 | | | | 339.9 | | | | 518.4 | |
China | | | 942.8 | | | | 1,844.6 | | | | 1,373.3 | |
USA | | | 1,499.9 | | | | 1,925.3 | | | | 1,739.6 | |
Turkey | | | 1,276.8 | | | | 1,643.9 | | | | 1,452.3 | |
South Korea | | | 235.7 | | | | 432.7 | | | | 525.7 | |
Other | | | 2,914.1 | | | | 2,849.3 | | | | 3,237.5 | |
| | | | 7,193.0 | | | | 9,035.7 | | | | 8,846.8 | |
No single customer contributed 10% or more to the Group revenue for all the periods presented.
(iii) Revenue by product
| | | | | | | | | | | | |
| | | 2013 A$M | | | 2012 A$M | | | 2011 A$M | |
Ferrous secondary recycling | | | 4,817.0 | | | | 6,258.6 | | | | 6,143.6 | |
Non-ferrous secondary recycling | | | 1,353.0 | | | | 1,656.5 | | | | 1,724.0 | |
Recycling solutions | | | 968.8 | | | | 1,011.8 | | | | 786.4 | |
Secondary processing and other services | | | 54.2 | | | | 108.8 | | | | 192.8 | |
| | | | 7,193.0 | | | | 9,035.7 | | | | 8,846.8 | |
(iv) Non-current assets
Non-current assets (excluding financial assets and deferred tax assets) are held in the following countries:
| | | | | | | | |
| | | 2013
A$M | | | 2012 A$M RESTATED | |
Australia | | | 275.4 | | | | 244.4 | |
USA | | | 964.3 | | | | 1,247.5 | |
United Kingdom | | | 130.0 | | | | 172.3 | |
Other | | | 216.8 | | | | 236.9 | |
| | | | 1,586.5 | | | | 1,901.1 | |
F I N A N C I A L S T A T E M E N T S
NOTES TO THE CONSOLIDATED FINANCIAL STATEMENTSFOR THE YEAR ENDED 30 JUNE 2013
Note 7 – Revenue
| | | | | | | | | | | | |
| | | 2013 A$M | | | 2012 A$M | | | 2011 A$M | |
Sales revenue | | | | | | | | | | | | |
Sale of goods | | | 7,112.4 | | | | 8,965.9 | | | | 8,789.0 | |
Service revenue | | | 80.6 | | | | 69.8 | | | | 57.8 | |
| | | | 7,193.0 | | | | 9,035.7 | | | | 8,846.8 | |
Other revenue | | | | | | | | | | | | |
Interest income | | | 7.3 | | | | 3.7 | | | | 3.2 | |
Rental income | | | 2.8 | | | | 2.9 | | | | 2.9 | |
| | | | 10.1 | | | | 6.6 | | | | 6.1 | |
| | | | 7,203.1 | | | | 9,042.3 | | | | 8,852.9 | |
Note 8 – Other income and expenses
(a) Other income
| | | | | | | | | | | | |
| | | 2013
A$M | | | 2012
A$M | | | 2011
A$M | |
Net gain on commodity derivatives | | | 31.2 | | | | 34.0 | | | | – | |
Net gain on currency derivatives | | | 6.1 | | | | 4.1 | | | | – | |
Gain on sale of jointly controlled assets1 | | | – | | | | 35.7 | | | | – | |
Commercial settlements | | | 3.3 | | | | 1.4 | | | | 15.4 | |
Gain on sale of other financial assets | | | – | | | | – | | | | 11.0 | |
Insurance recoveries | | | 1.4 | | | | 5.3 | | | | 7.6 | |
Net gain on revaluation of financial assets at fair value through profit or loss | | | – | | | | – | | | | 0.6 | |
Government grants | | | 0.7 | | | | 0.5 | | | | 0.7 | |
Net foreign exchange gain | | | – | | | | – | | | | 1.0 | |
Net gain on disposal of property, plant and equipment | | | – | | �� | | 2.8 | | | | 1.3 | |
Reimbursement of expenses from a third party | | | 2.7 | | | | – | | | | – | |
Third party commissions | | | 3.2 | | | | 4.2 | | | | 3.5 | |
Other | | | 4.0 | | | | 3.2 | | | | 1.4 | |
| | | | 52.6 | | | | 91.2 | | | | 42.5 | |
| 1 | Represents the gain from the sale of the Group’s 50% ownership interest in the secondary lead producing facility in Sydney, Australia of Australian Refined Alloys (see Note 28). |
(b) Specific expenses recognised in (loss)/profit before income tax
| | | | | | | | | | | | |
| | | 2013
A$M | | | 2012
A$M | | | 2011
A$M | |
Depreciation and amortisation: | | | | | | | | | | | | |
Depreciation expense | | | 101.1 | | | | 103.1 | | | | 102.2 | |
Amortisation expense | | | 22.4 | | | | 26.8 | | | | 28.4 | |
| | | | 123.5 | | | | 129.9 | | | | 130.6 | |
| | | |
Finance costs1 | | | 24.9 | | | | 24.9 | | | | 27.1 | |
Net foreign exchange loss | | | 6.2 | | | | 2.5 | | | | – | |
Net loss on revaluation of financial assets at fair value through profit or loss2 | | | 6.1 | | | | 2.0 | | | | – | |
Equity-settled share-based payments expense3 | | | 16.1 | | | | 24.3 | | | | 15.7 | |
Cash-settled share-based payments expense | | | 0.4 | | | | – | | | | 0.4 | |
Defined contribution superannuation expense | | | 11.2 | | | | 10.8 | | | | 10.2 | |
Rental expenses relating to operating leases | | | 90.2 | | | | 79.5 | | | | 63.3 | |
Net loss on disposal of property, plant and equipment | | | 0.6 | | | | – | | | | – | |
Net loss on commodity derivatives | | | – | | | | – | | | | 30.9 | |
Net loss on currency derivatives | | | – | | | | – | | | | 0.6 | |
| 1 | Finance costs include commitment fees paid on the Group’s loan facilities of A$7.6 million (2012: A$7.0 million; 2011: A$11.4 million). |
| 2 | Primarily represents losses from the revaluation of derivatives acquired in connection with the Group’s investment in Chiho-Tiande Group (see Note 12). |
| 3 | 2013 amount includes the acceleration of A$3.4 million of expense as a result of the good leaver provision for the former CEO who retired on 30 June 2013. 2012 amount includes A$7.9 million of expense associated with the final settlement of a business arrangement. |
(c) (Loss)/profit before income tax includes the following expenses, which are disclosed due to their size or nature
| | | | | | | | | | | | |
| | | 2013
A$M | | | 2012 A$M
RESTATED | | | 2011 A$M
RESTATED | |
Impairment losses/(reversals): | | | | | | | | | | | | |
Impairment of goodwill (Note 14) | | | 292.2 | | | | 617.3 | | | | – | |
Impairment of other intangible assets (Note 15) | | | 12.2 | | | | 0.8 | | | | – | |
| | | 304.4 | | | | 618.1 | | | | – | |
| | | |
Impairment of goodwill in jointly controlled entity (Note 30) | | | – | | | | 57.5 | | | | – | |
Impairment of investment in an associate (Note 30) | | | 14.9 | | | | – | | | | – | |
Impairment of trade receivables1 | | | 2.4 | | | | 5.1 | | | | 0.3 | |
Impairment of third party loans (Note 12) | | | 4.8 | | | | – | | | | – | |
Impairment of property, plant and equipment2(Note 13) | | | 61.2 | | | | 0.4 | | | | – | |
| | | |
Net loss on sale of business divisions (Note 28) | | | 10.1 | | | | – | | | | – | |
Loss on sale of ownership interest in a jointly controlled entity (Note 30) | | | 0.3 | | | | – | | | | – | |
Loss on sale of jointly controlled assets3 | | | 1.3 | | | | – | | | | – | |
Write-down of inventory to net realisable value | | | 6.0 | | | | 21.3 | | | | 2.0 | |
United Kingdom inventory write-down (Note 2) | | | 63.9 | | | | 48.0 | | | | 6.6 | |
Redundancies | | | 7.3 | | | | 9.9 | | | | 1.6 | |
Natural disaster related expenses4 | | | 5.7 | | | | 2.6 | | | | 6.9 | |
Transaction costs related to business combinations | | | 0.7 | | | | 2.5 | | | | 3.1 | |
Professional fees associated with various matters5 | | | 2.4 | | | | – | | | | – | |
Provision recorded for disputes with third parties (Note 23) | | | 4.7 | | | | 12.8 | | | | – | |
Lease settlements and onerous lease provisions6 | | | 13.1 | | | | – | | | | – | |
Yard closure costs and dilapidation provisions | | | 8.5 | | | | – | | | | – | |
Withdrawal liability related to multi-employer pension plans | | | – | | | | 3.0 | | | | – | |
| 1 | 2013 amount includes A$1.1 million provision related to a receivable that was partially impaired as a result of a customer bankruptcy (2012: A$4.4 million). |
| 2 | 2013 amount is comprised of impairments of A$45.8 million related to excess or under-utilised processing equipment and A$15.4 million related to assets held for sale. 2012 amount was comprised of impairments of A$3.4 million related to excess or under-utilised processing equipment offset by the reversal of a previously recognised impairment of A$3.0 million on land. |
| 3 | Amount represents the loss on the sale of additional assets related to the Group’s 50% ownership interest in the secondary lead producing facility in Sydney, Australia of Australia Refined Alloys. |
| 4 | 2013 amount represents costs associated with Superstorm Sandy in the United States. 2012 and 2011 amounts primarily represents costs associated with the floods in Queensland, Australia. These costs were reimbursed by the Group’s insurance carrier and the reimbursement is included in the “insurance recoveries” line in other income above. |
| 5 | Amounts include professional fees incurred in connection with the United Kingdom investigation conducted by the Special Committee of the Board, legal fees associated with business disposals and costs incurred to-date related to the search for a new Group Chief Executive Officer. |
| 6 | Amounts include settlements for real estate leases which were terminated early and onerous lease provisions for under-utilised sites. |
F I N A N C I A L S T A T E M E N T S
NOTES TO THE CONSOLIDATED FINANCIAL STATEMENTSFOR THE YEAR ENDED 30 JUNE 2013
Note 9 – Income taxes
| | | | | | | | | | | | |
| | | 2013
A$M | | | 2012 A$M RESTATED | | | 2011 A$M RESTATED | |
(a) Income tax (benefit)/expense | | | | | | | | | | | | |
| | | |
Current income tax charge | | | 21.2 | | | | 33.3 | | | | 71.5 | |
Adjustments for prior years | | | (1.7 | ) | | | (6.6 | ) | | | 2.4 | |
Deferred income tax | | | (40.4 | ) | | | (48.7 | ) | | | 8.0 | |
Income tax (benefit)/expense | | | (20.9 | ) | | | (22.0 | ) | | | 81.9 | |
| | | |
Deferred income tax expense included in income tax expense comprises: | | | | | | | | | | | | |
Decrease/(increase) in deferred tax assets | | | 1.6 | | | | (27.3 | ) | | | (6.5 | ) |
(Decrease)/increase in deferred tax liabilities | | | (42.0 | ) | | | (21.4 | ) | | | 14.5 | |
| | | | (40.4 | ) | | | (48.7 | ) | | | 8.0 | |
| | | |
(b) Reconciliation of income tax (benefit)/expense to prima facie tax payable | | | | | | | | | | | | |
| | | |
(Loss)/profit before income tax | | | (487.0 | ) | | | (644.5 | ) | | | 269.2 | |
| | | |
Tax at the standard Australian rate of 30% | | | (146.1 | ) | | | (193.4 | ) | | | 80.8 | |
Non-deductible impairment of goodwill and intangibles | | | 65.8 | | | | 169.5 | | | | – | |
Non-deductible impairment of goodwill in jointly controlled entity | | | – | | | | 11.9 | | | | – | |
Effect of unused losses and tax offsets not recognised as deferred tax assets | | | 50.4 | | | | 9.3 | | | | – | |
Non-deductible expenses | | | 7.9 | | | | 4.7 | | | | 4.6 | |
Effect of tax rates in other jurisdictions | | | (7.4 | ) | | | (9.8 | ) | | | (3.8 | ) |
Non-deductible impairment of investment in associate | | | 4.5 | | | | – | | | | – | |
Share-based payments | | | 4.0 | | | | 6.5 | | | | 2.1 | |
Assessable gain on disposal of business divisions | | | 2.8 | | | | – | | | | – | |
Non-assessable income | | | (2.4 | ) | | | (2.5 | ) | | | (2.0 | ) |
Equity accounted investees results reported net of tax | | | 1.8 | | | | (1.6 | ) | | | (0.9 | ) |
Adjustments for prior years | | | (1.7 | ) | | | (6.3 | ) | | | 2.4 | |
Prior year tax loss not previously recognised | | | (0.4 | ) | | | (1.5 | ) | | | (1.1 | ) |
Non-assessable gain on disposal of jointly controlled assets | | | – | | | | (10.7 | ) | | | – | |
Other | | | (0.1 | ) | | | 1.9 | | | | (0.2 | ) |
Income tax (benefit)/expense | | | (20.9 | ) | | | (22.0 | ) | | | 81.9 | |
| | | |
(c) Income tax charged/(credited) directly to equity | | | | | | | | | | | | |
| | | |
Share-based payments | | | (0.5 | ) | | | 0.0 | | | | (3.3 | ) |
Exchange gain/(loss) on foreign denominated intercompany loans | | | 14.6 | | | | 7.0 | | | | (36.8 | ) |
| | | | 14.1 | | | | 7.0 | | | | (40.1 | ) |
| | | |
(d) Tax (benefit)/expense relating to items of other comprehensive income | | | | | | | | | | | | |
| | | |
Cash flow hedges | | | (1.6 | ) | | | 0.4 | | | | 0.3 | |
Available-for-sale financial assets | | | – | | | | – | | | | 0.6 | |
Defined benefit plans | | | 2.5 | | | | (4.9 | ) | | | 1.7 | |
| | | | 0.9 | | | | (4.5 | ) | | | 2.6 | |
| | | | | | | | |
| | | 2013
A$M | | | 2012 A$M RESTATED | |
(e) Deferred tax assets and liabilities | | | | | | | | |
| | |
Deferred tax assets | | | | | | | | |
The balance comprises temporary difference attributable to: | | | | | | | | |
(amounts recognised in profit or loss) | | | | | | | | |
Provisions and other accruals | | | 19.2 | | | | 20.2 | |
Employee benefits | | | 12.9 | | | | 11.3 | |
Inventory and consumables | | | 6.7 | | | | 7.6 | |
Property, plant and equipment | | | 3.1 | | | | 2.4 | |
Intangibles | | | 18.1 | | | | – | |
Jointly controlled entities and associates | | | 1.0 | | | | 4.1 | |
Tax loss carryforwards | | | 18.1 | | | | 24.2 | |
Share-based payments | | | 5.9 | | | | 6.0 | |
Other | | | 7.1 | | | | 5.0 | |
| | | | 92.1 | | | | 80.8 | |
(amounts recognised directly in equity) | | | | | | | | |
Share-based payments | | | 1.3 | | | | 0.8 | |
Defined benefit plans | | | 3.3 | | | | 8.0 | |
Share placement costs | | | 0.4 | | | | 0.5 | |
Cash flow hedge | | | 1.2 | | | | – | |
Exchange loss on foreign denominated intercompany loans | | | 24.7 | | | | 39.3 | |
| | | | 30.9 | | | | 48.6 | |
Movements | | | | | | | | |
Balance at 1 July | | | 129.4 | | | | 99.4 | |
Charged to income statement | | | (1.6 | ) | | | 27.3 | |
Adjustments for prior years | | | 3.0 | | | | (6.1 | ) |
Transfers from/(to) deferred tax liabilities | | | – | | | | 7.5 | |
Acquisitions | | | – | | | | 2.7 | |
Charged directly to equity and other comprehensive income | | | (15.4 | ) | | | (3.6 | ) |
Foreign exchange differences | | | 7.6 | | | | 2.2 | |
Balance at 30 June | | | 123.0 | | | | 129.4 | |
| | |
Deferred tax assets expected to be recovered within 12 months | | | 47.7 | | | | 43.5 | |
Deferred tax assets expected to be recovered after 12 months | | | 75.3 | | | | 85.9 | |
| | | | 123.0 | | | | 129.4 | |
| | |
Deferred tax liabilities | | | | | | | | |
The balance comprises temporary differences attributable to: | | | | | | | | |
(amounts recognised in profit or loss) | | | | | | | | |
Intangible assets | | | 4.1 | | | | 26.3 | |
Property, plant and equipment | | | 60.9 | | | | 73.4 | |
Inventory and consumables | | | 3.4 | | | | 3.3 | |
Jointly controlled entities and associates | | | 0.7 | | | | 1.3 | |
Employee benefits | | | 2.2 | | | | – | |
Other | | | 2.5 | | | | 4.4 | |
| | | | 73.8 | | | | 108.7 | |
(amounts recognised directly in equity) | | | | | | | | |
Cash flow hedges | | | – | | | | 0.4 | |
F I N A N C I A L S T A T E M E N T S
NOTES TO THE CONSOLIDATED FINANCIAL STATEMENTSFOR THE YEAR ENDED 30 JUNE 2013
Note 9 – Income taxes (continued)
| | | | | | | | |
| | | 2013
A$M | | | 2012 A$M RESTATED | |
(e) Deferred tax assets and liabilities (continued) | | | | | | | | |
Deferred tax liabilities (continued) | | | | | | | | |
Movements | | | | | | | | |
Balance at 1 July | | | 109.1 | | | | 119.6 | |
Charged to income statement | | | (42.0 | ) | | | (21.4 | ) |
Adjustments for prior years | | | 1.0 | | | | (4.2 | ) |
Transfers to/(from) deferred tax assets | | | – | | | | 7.5 | |
Charged directly to equity and other comprehensive income | | | (0.4 | ) | | | (1.1 | ) |
Acquisitions | | | 0.2 | | | | 3.1 | |
Foreign exchange differences | | | 5.9 | | | | 5.6 | |
Balance at 30 June | | | 73.8 | | | | 109.1 | |
| | |
Deferred tax liabilities expected to be settled within 12 months | | | 8.1 | | | | 4.5 | |
Deferred tax liabilities expected to be settled after 12 months | | | 65.7 | | | | 104.6 | |
| | | | 73.8 | | | | 109.1 | |
| (f) | Unrecognised deferred tax assets |
Deferred tax assets totalling A$69.2 million (2012: A$18.8 million) have not been recognised as it is not probable that they will be realised.
| (g) | Unrecognised temporary differences associated with investments and interests |
As at 30 June 2013, there were no unrecognised temporary differences associated with the Group’s investments in subsidiaries, associates, or jointly controlled entities, as the Group has no liability for additional taxation should unremitted earnings be remitted.
Note 10 – Trade and other receivables
| | | | | | | | |
| | | 2013
A$M | | | 2012 A$M RESTATED | |
Trade receivables | | | 335.2 | | | | 392.5 | |
Provision for impairment of receivables | | | (10.6 | ) | | | (8.3 | ) |
| | | | 324.6 | | | | 384.2 | |
| | |
Other receivables and deferred expenses | | | 96.9 | | | | 81.8 | |
Tax receivable | | | 14.1 | | | | 28.4 | |
Prepayments | | | 19.8 | | | | 24.4 | |
| | | | 130.8 | | | | 134.6 | |
| | | | 455.4 | | | | 518.8 | |
Occasionally, the Group will sell a portion of its trade receivables to third parties. All credit risk passes to the third party at the time of the assignment, such that the Group has no further exposure to default by the specific trade debtors. The amount of trade receivables sold to third parties was not significant in the periods presented. The third party is not obliged to accept offers of receivables and the Group is not obligated to make offers or pay commitment fees to the third party.
| (a) | Movements in provision for impairment of receivables |
| | | | | | | | | | | | |
| | | 2013 A$M | | | 2012 A$M | | | 2011 A$M | |
Balance at 1 July | | | 8.3 | | | | 5.4 | | | | 3.6 | |
Provision for impairment recognised during the year | | | 2.4 | | | | 5.1 | | | | 0.3 | |
Acquisitions | | | – | | | | – | | | | 2.8 | |
Write-offs | | | (0.9 | ) | | | (2.4 | ) | | | (0.8 | ) |
Reclassified as assets held for sale | | | (0.1 | ) | | | – | | | | – | |
Foreign exchange differences | | | 0.9 | | | | 0.2 | | | | (0.5 | ) |
Balance at 30 June | | | 10.6 | | | | 8.3 | | | | 5.4 | |
The creation and release of the provision for impaired receivables has been included in other expenses in profit or loss. Amounts charged to the allowance account are generally written-off when there is no expectation of recovering additional cash.
| (b) | Past due but not impaired |
As at 30 June 2013, receivables of A$77.6 million (2012: A$65.7 million) were past due but not impaired and the Group does not hold any material collateral in relation to these receivables. These relate to a number of independent customers for whom there is no recent history of default. The ageing analyses of these receivables are as follows:
| | | | | | | | |
| DAYS OVERDUE: | | 2013
A$M | | | 2012
A$M | |
1 – 30 days | | | 63.5 | | | | 50.6 | |
31 – 60 days | | | 7.4 | | | | 4.0 | |
Over 60 days | | | 6.7 | | | | 11.1 | |
| | | | 77.6 | | | | 65.7 | |
| (c) | Other receivables and deferred expenses |
Other receivable amounts generally arise from transactions outside the usual operating activities of the Group. Interest may be charged at commercial rates where the terms of repayment exceed six months. Collateral is not normally obtained.
| (d) | Foreign exchange and interest rate risk |
Information about the Group’s exposure to foreign exchange risk and interest rate risk in relation to trade and other receivables is provided in Note 3.
| (e) | Fair value and credit risk |
Due to their short-term nature, the carrying value of current receivables approximates its fair value.
The maximum exposure to credit risk at the end of the reporting period is the carrying amount of each class of receivables mentioned above. The fair value of securities held for certain trade receivables is insignificant, as is the fair value of any collateral sold or repledged. Refer to Note 3 for more information on the Group’s exposure to credit risk.
Note 11 – Inventory
| | | | | | | | |
| | | 2013 A$M | | | 2012 A$M RESTATED | |
Raw materials | | | 133.5 | | | | 197.7 | |
Stores and spare parts | | | 33.5 | | | | 36.7 | |
Finished goods | | | 407.9 | | | | 595.1 | |
| | | | 574.9 | | | | 829.5 | |
The cost of inventories recognised as expense during the year ended 30 June 2013 amounted to A$5,580.5 million (2012: A$7,209.2 million). Write-downs of inventories to net realisable value are disclosed in Note 8.
F I N A N C I A L S T A T E M E N T S
NOTES TO THE CONSOLIDATED FINANCIAL STATEMENTS FOR THE YEAR ENDED 30
JUNE 2013
Note 12 – Other financial assets and liabilities
| | | | | | | | |
| | | 2013 A$M | | | 2012 A$M | |
Other financial assets – Current: | | | | | | | | |
Financial assets at fair value through profit or loss: | | | | | | | | |
Investments in marketable securities | | | 7.1 | | | | 5.5 | |
Loans to third parties carried at amortised cost (d) | | | 14.8 | | | | 18.1 | |
Derivative financial instruments (c): | | | | | | | | |
Forward foreign exchange contracts | | | 1.3 | | | | 3.2 | |
Forward commodity contracts | | | 5.9 | | | | 2.6 | |
| | | | 29.1 | | | | 29.4 | |
Other financial assets – Non-current: | | | | | | | | |
Loans and other receivables: | | | | | | | | |
Convertible loan to an associate carried at amortised cost (a) | | | 38.9 | | | | 33.1 | |
Loans to third parties carried at amortised cost (d) | | | – | | | | 2.4 | |
Other receivables | | | 8.6 | | | | 9.7 | |
Financial assets at fair value through profit or loss: | | | | | | | | |
Embedded conversion feature of convertible loan (a) | | | 0.4 | | | | 2.7 | |
Warrants (a) | | | 0.0 | | | | 0.5 | |
Options (b) | | | 0.0 | | | | 1.0 | |
| | | | 47.9 | | | | 49.4 | |
Other financial liabilities – Current: | | | | | | | | |
Derivative financial instruments (c): | | | | | | | | |
Forward foreign exchange contracts | | | 5.5 | | | | 0.7 | |
Forward commodity contracts | | | 0.8 | | | | 1.4 | |
| | | | 6.3 | | | | 2.1 | |
On 1 March 2012, the Group subscribed for a HK$315.6 million (A$37.8 million) convertible loan from Chiho-Tiande Group Limited (“CTG”), an associate of the Group. The convertible loan carries an annual interest rate of 4% and is convertible at HK$6.00 per share. In connection with the subscription, CTG also issued to the Group, warrants to purchase 12,638,441 shares of CTG at an exercise price of HK$6.00 per share. Both the convertible loan and warrants have a term of three years from the date of issue, but are not convertible or exercisable until two years from the date of the issue. In certain instances, the conversion period can be extended for a further two years.
The conversion feature of the convertible loan represents an embedded derivative, which along with the warrants, are recorded as financial assets at fair value through profit or loss. The fair value of both of these financial assets at the issue date was independently calculated by a valuation firm and was recorded as a reduction to the convertible loan as follows in the year ended 30 June 2012:
| | | | |
| | | A$M | |
Fair value of conversion feature | | | 6.1 | |
Fair value of warrants | | | 1.0 | |
Amortised cost of convertible loan | | | 30.7 | |
| | | | 37.8 | |
Subsequent to their initial recognition, the conversion feature and warrants have been measured at fair value, with gains or losses being recognised in profit or loss. Subsequent to its initial recognition, the convertible loan is recorded at amortised cost using the effective interest method.
On 17 January 2012, the Group received options to purchase 20,837,095 shares of CTG as part of its investment in CTG (see Note 30). The options have an exercise price of HK$6.00 per share, are immediately exercisable and expire on 17 January 2015.
The options are recorded as financial assets at fair value through profit or loss. The fair value of the options at the issue date was A$1.1 million and was independently calculated by a valuation firm. Subsequent to its initial recognition, the options have been measured at fair value, with any gains or losses being recognised in profit or loss.
| (c) | Derivatives used by the Group |
The Group is a party to derivative financial instruments in the normal course of business in order to hedge its exposure to currency fluctuations in foreign exchange rates and commodity prices in accordance with the Group’s financial risk management policies, which are set out in Note 3.
| (i) | Forward foreign exchange contracts |
In order to protect against exchange rate movements in relation to material purchases and sales and underlying transactions between subsidiaries, the Group has entered into forward foreign exchange contracts to purchase foreign currencies for settlement of the related transaction. The Group’s primary exposure is to US dollars, euros and British pounds as disclosed in Note 3.
The portion of the gain or loss on the hedging instrument that is determined to be an effective hedge is deferred and recognised in other comprehensive income to the extent that the hedge is effective. When the cash flows occur, the amount is released to profit or loss. Any ineffective portion is charged to profit or loss.
| (ii) | Forward commodity contracts |
The Group has entered into forward commodity contracts, which are economic hedges but do not satisfy the requirements for hedge accounting. These contracts protect against movements in the underlying commodity of the related material purchase or sale. The Group’s primary exposure is to non-ferrous and precious metal prices as disclosed in Note 3.
| (d) | Loans to third parties carried at amortised cost |
As at 30 June 2013, the Group performed an evaluation of a series of loans made to a third party and recorded an impairment charge of A$4.8 million. The Group’s assessment was based on significant financial difficulty facing the third party which has resulted in breach of the loan agreements. The Group has a security interest in the inventory of the third party and determined the impairment based on the amount of the loan that exceeded the value of the security interest. After the impairment charge, the Group has a loan balance, net of the impairment charge, from the third party of A$14.8 million which is all classified as current.
Information about the Group’s exposure to credit risk, foreign exchange, price and interest rate risk is provided in Note 3. The maximum exposure to credit risk at the end of the reporting period is the carrying amount of each class of financial instrument mentioned above.
The loans to third parties and the convertible loan to a listed entity, carried at amortised cost, accrue interest at a fixed rate. The fair value of these loans using current interest rates approximates their carrying value. The carrying value of other non-current receivables approximates their fair value.
Financial instruments carried at fair value are classified by valuation method using the following hierarchy:
| • | | Level 1 – quoted prices (unadjusted) in active markets for identical assets or liabilities. |
| • | | Level 2 – inputs other than quoted prices included within Level 1 that are observable for the asset or liability, either directly (as prices) or indirectly (derived from prices). |
| • | | Level 3 – inputs for the asset or liability that are not based on observable market data (unobservable inputs). |
F I N A N C I A L S T A T E M E N T S
NOTES TO THE CONSOLIDATED FINANCIAL STATEMENTSFOR THE YEAR ENDED 30
JUNE 2013
Note 12 – Other financial assets and liabilities (continued)
| (f) | Fair value (continued) |
The following table presents the Group’s financial instruments measured at fair value by valuation method.
| | | | | | | | | | | | | | | | |
| 2013 | | LEVEL 1
A$M | | | LEVEL 2
A$M | | | LEVEL 3
A$M | | | TOTAL A$M | |
Financial assets: | | | | | | | | | | | | | | | | |
Financial assets at fair value through profit or loss: | | | | | | | | | | | | | | | | |
Investments in marketable securities | | | 7.1 | | | | – | | | | – | | | | 7.1 | |
Embedded conversion feature of convertible loan | | | – | | | | – | | | | 0.4 | | | | 0.4 | |
Warrants | | | – | | | | – | | | | 0.0 | | | | 0.0 | |
Options | | | – | | | | – | | | | 0.0 | | | | 0.0 | |
Derivative financial instruments | | | 5.9 | | | | 1.3 | | | | – | | | | 7.2 | |
| | | | 13.0 | | | | 1.3 | | | | 0.4 | | | | 14.7 | |
Financial liabilities: | | | | | | | | | | | | | | | | |
Derivative financial instruments | | | 0.8 | | | | 5.5 | | | | – | | | | 6.3 | |
| | | | 0.8 | | | | 5.5 | | | | – | | | | 6.3 | |
| | | | |
| 2012 | | | | | | | | | | | | |
Financial assets: | | | | | | | | | | | | | | | | |
Financial assets at fair value through profit or loss: | | | | | | | | | | | | | | | | |
Investments in marketable securities | | | 5.5 | | | | – | | | | – | | | | 5.5 | |
Embedded conversion feature of convertible loan | | | – | | | | – | | | | 2.7 | | | | 2.7 | |
Warrants | | | – | | | | – | | | | 0.5 | | | | 0.5 | |
Options | | | – | | | | – | | | | 1.0 | | | | 1.0 | |
Derivative financial instruments | | | 2.6 | | | | 3.2 | | | | – | | | | 5.8 | |
| | | | 8.1 | | | | 3.2 | | | | 4.2 | | | | 15.5 | |
Financial liabilities: | | | | | | | | | | | | | | | | |
Derivative financial instruments | | | 1.4 | | | | 0.7 | | | | – | | | | 2.1 | |
| | | | 1.4 | | | | 0.7 | | | | – | | | | 2.1 | |
The fair value of financial instruments traded on active markets (such as publicly traded derivatives and investments in marketable securities) is based on quoted market prices at the reporting date. The quoted market price used for financial assets held by the group is the current bid price. These instruments are included in level 1.
The fair value of financial instruments that are not traded in an active market (for example, forward foreign exchange contracts) is determined using forward exchange market rates at the end of the reporting period. These instruments are included in level 2. If one or more of the significant inputs is not based on observable market data, the fair value of financial instruments is included in level 3. This is the case for the embedded conversion feature of the convertible loan and unlisted warrants and options. The following table presents the changes in level 3 instruments for the years ended 30 June 2013 and 2012.
| | | | | | | | | | | | | | | | |
| | | WARRANTS A$M | | | CONVERSION FEATURE A$M | | | OPTIONS A$M | | | TOTAL A$M | |
Balance at 1 July 2011 | | | – | | | | – | | | | – | | | | – | |
Additions | | | 1.0 | | | | 6.1 | | | | 1.1 | | | | 8.2 | |
Revaluation loss recognised in profit or loss | | | (0.4 | ) | | | (1.5 | ) | | | (0.1 | ) | | | (2.0 | ) |
Equity accounting elimination (Note 30) | | | (0.2 | ) | | | (2.3 | ) | | | – | | | | (2.5 | ) |
Foreign exchange differences | | | 0.1 | | | | 0.4 | | | | – | | | | 0.5 | |
Balance at 30 June 2012 | | | 0.5 | | | | 2.7 | | | | 1.0 | | | | 4.2 | |
Revaluation loss recognised in profit or loss | | | (0.7 | ) | | | (4.6 | ) | | | (1.0 | ) | | | (6.3 | ) |
Equity accounting elimination (Note 30) | | | 0.2 | | | | 2.3 | | | | – | | | | 2.5 | |
Foreign exchange differences | | | 0.0 | | | | 0.0 | | | | 0.0 | | | | 0.0 | |
Balance at 30 June 2013 | | | 0.0 | | | | 0.4 | | | | 0.0 | | | | 0.4 | |
During the reporting period, there were no transfers between level 1 and level 2 fair value measurements, or no transfers into or out of level 3 fair value measurements.
Note 13 – Property, plant and equipment
| | | | | | | | | | | | | | | | | | | | | | | | |
| | | LAND A$M | | | BUILDINGS A$M | | | LEASEHOLD IMPROVEMENTS A$M | | | PLANT &
EQUIPMENT
A$M | | | CAPITAL WORK IN PROGRESS A$M | | | TOTAL A$M | |
At 30 June 2013 | | | | | | | | | | | | | | | | | | | | | | | | |
Cost | | | 276.3 | | | | 225.3 | | | | 86.0 | | | | 1,001.7 | | | | 129.7 | | | | 1,719.0 | |
Accumulated depreciation | | | – | | | | (84.8 | ) | | | (40.9 | ) | | | (601.1 | ) | | | – | | | | (726.8 | ) |
Net book amount | | | 276.3 | | | | 140.5 | | | | 45.1 | | | | 400.6 | | | | 129.7 | | | | 992.2 | |
| | | | | | |
Year ended 30 June 2013 | | | | | | | | | | | | | | | | | | | | | | | | |
Balance at 1 July | | | 235.5 | | | | 129.7 | | | | 51.7 | | | | 436.6 | | | | 123.6 | | | | 977.1 | |
Additions | | | 9.4 | | | | 14.9 | | | | 9.3 | | | | 81.9 | | | | 33.5 | | | | 149.0 | |
Disposals | | | – | | | | (0.1 | ) | | | (0.1 | ) | | | (4.3 | ) | | | (2.1 | ) | | | (6.6 | ) |
Transfers | | | 20.5 | | | | 3.1 | | | | 0.6 | | | | 7.3 | | | | (31.5 | ) | | | – | |
Reclassifications (Note 15) | | | 0.4 | | | | (0.2 | ) | | | – | | | | (0.7 | ) | | | – | | | | (0.5 | ) |
Reclassified as assets held for sale | | | (1.9 | ) | | | (1.3 | ) | | | – | | | | (8.0 | ) | | | (0.1 | ) | | | (11.3 | ) |
(Note 34) | | | | | | | | | | | | | | | | | | | | | | | | |
Impairments (Note 8) | | | – | | | | – | | | | (11.9 | ) | | | (49.3 | ) | | | – | | | | (61.2 | ) |
Depreciation expense | | | – | | | | (12.6 | ) | | | (7.5 | ) | | | (81.0 | ) | | | – | | | | (101.1 | ) |
Acquisition of subsidiaries (Note 28) | | | 0.6 | | | | 0.1 | | | | 0.1 | | | | 6.3 | | | | – | | | | 7.1 | |
Sale of business divisions (Note 28) | | | (9.8 | ) | | | (2.9 | ) | | | – | | | | (16.3 | ) | | | (3.8 | ) | | | (32.8 | ) |
Foreign exchange differences | | | 21.6 | | | | 9.8 | | | | 2.9 | | | | 28.1 | | | | 10.1 | | | | 72.5 | |
Balance at 30 June | | | 276.3 | | | | 140.5 | | | | 45.1 | | | | 400.6 | | | | 129.7 | | | | 992.2 | |
| | | | | | |
At 30 June 2012 | | | | | | | | | | | | | | | | | | | | | | | | |
Cost | | | 235.5 | | | | 196.1 | | | | 81.3 | | | | 967.1 | | | | 123.6 | | | | 1,603.6 | |
Accumulated depreciation | | | – | | | | (66.4 | ) | | | (29.6 | ) | | | (530.5 | ) | | | – | | | | (626.5 | ) |
Net book amount | | | 235.5 | | | | 129.7 | | | | 51.7 | | | | 436.6 | | | | 123.6 | | | | 977.1 | |
| | | | | | |
Year ended 30 June 2012 | | | | | | | | | | | | | | | | | | | | | | | | |
Balance at 1 July | | | 211.3 | | | | 118.2 | | | | 47.4 | | | | 414.6 | | | | 74.0 | | | | 865.5 | |
Additions | | | 5.4 | | | | 10.7 | | | | 5.5 | | | | 73.8 | | | | 65.7 | | | | 161.1 | |
Disposals | | | (1.4 | ) | | | (1.2 | ) | | | (0.3 | ) | | | (2.1 | ) | | | – | | | | (5.0 | ) |
Transfers | | | 0.1 | | | | 1.7 | | | | 4.3 | | | | 13.1 | | | | (19.2 | ) | | | – | |
Reclassifications (Note 14) | | | – | | | | – | | | | – | | | | – | | | | (0.2 | ) | | | (0.2 | ) |
Impairments (Note 8) | | | 3.0 | | | | – | | | | – | | | | (3.4 | ) | | | – | | | | (0.4 | ) |
Depreciation expense | | | – | | | | (12.7 | ) | | | (6.8 | ) | | | (83.6 | ) | | | – | | | | (103.1 | ) |
Acquisition of subsidiaries | | | 11.0 | | | | 10.7 | | | | 0.1 | | | | 14.1 | | | | – | | | | 35.9 | |
Sale of jointly controlled assets | | | (2.1 | ) | | | (0.3 | ) | | | – | | | | (1.3 | ) | | | (0.2 | ) | | | (3.9 | ) |
Foreign exchange differences | | | 8.2 | | | | 2.6 | | | | 1.5 | | | | 11.4 | | | | 3.5 | | | | 27.2 | |
Balance at 30 June | | | 235.5 | | | | 129.7 | | | | 51.7 | | | | 436.6 | | | | 123.6 | | | | 977.1 | |
F I N A N C I A L S T A T E M E N T S
NOTES TO THE CONSOLIDATED FINANCIAL STATEMENTSFOR THE YEAR ENDED 30 JUNE 2013
Note 14 – Goodwill
| (a) | Movements in carrying amounts |
| | | | | | | | |
| | | 2013 A$M | | | 2012 A$M RESTATED | |
Cost | | | 1,294.2 | | | | 1,195.4 | |
Accumulated impairment | | | (1,127.7 | ) | | | (749.1 | ) |
Net book amount | | | 166.5 | | | | 446.3 | |
| | |
Balance at 1 July | | | 446.3 | | | | 988.7 | |
Acquisition of subsidiaries (Note 28) | | | 14.0 | | | | 38.7 | |
Derecognised on sale of business divisions (Note 28) | | | (9.9 | ) | | | – | |
Impairment charge | | | (292.2 | ) | | | (617.3 | ) |
Reclassifications | | | – | | | | (1.1 | ) |
Foreign exchange differences | | | 8.3 | | | | 37.3 | |
Balance at 30 June | | | 166.5 | | | | 446.3 | |
Goodwill acquired through business combinations has been allocated to groups of CGUs that are expected to benefit from the acquisition. Goodwill is monitored and tested for impairment by management at the CGU level. The following CGUs have significant amounts of goodwill:
| | | | | | | | | | |
| CGU | | SEGMENT | | 2013
A$M | | | 2012 A$M RESTATED | |
Continental Europe Recycling Solutions | | Europe | | | 60.8 | | | | 53.4 | |
United States Recycling Solutions | | North America | | | 61.0 | | | | 52.5 | |
Australia Metals | | Australasia | | | 40.8 | | | | 35.8 | |
North America Metals | | North America | | | – | | | | 267.1 | |
All other CGUs | | | | | 3.9 | | | | 37.5 | |
Total | | | | | 166.5 | | | | 446.3 | |
| (b) | Key assumptions used for goodwill and intangible asset impairment tests |
The recoverable amount of each of the Group’s CGUs has been determined based on the higher of fair value less costs to sell or value-in-use calculations. The Group believes its methodology is the most meaningful method, in order to reflect the cyclicality of its business and the volatile nature of commodity markets that can impact its business.
The value-in-use calculations use a five year cash flow projection, which is based initially on the budget for the 2014 financial year (as approved by the Board) and a four year forecast prepared by management. The four year forecast is developed using historical averages derived from four years of historical results and the budget for the 2014 financial year. These five year projections also incorporate management estimates related to the inherent impact of future volatility in volumes, commodity prices and margins drawn from past experience and factor in current and expected future economic conditions and consider the potential benefits to arise from significant capital investments approved by the Board. A terminal value is determined from the final year of cash flow based on application of the Gordon Growth model.
The cash flows are discounted using rates that reflect management’s estimate of the time value of money and the risks specific to each CGU that are not already reflected in the cash flows. In determining appropriate discount rates for each CGU, consideration has been given to a weighted average cost of capital of the entity as a whole and adjusted for country and business risk specific to the CGU.
The cash flow projections are based on management’s best estimates, with reference to historical results, to determine income, expenses, capital expenditures and cash flows for each CGU. Expected future cash flows used to determine the value in use of goodwill are inherently uncertain and could materially change over time. Should management’s estimate of the future not reflect actual events, further impairments may be identified.
The key assumptions used for the value-in-use calculations were as follows:
| | | | | | | | | | | | | | | | |
| | | DISCOUNT RATE (PRE-TAX) | | | GROWTH RATE | |
| CGU | | 2013 % | | | 2012 % RESTATED | | | 2013 % | | | 2012 % | |
North America Metals | | | 13.1–14.0 | | | | 13.0–13.4 | | | | 3.0 | | | | 3.0 | |
Bulk Stainless1 | | | 14.5–15.1 | | | | – | | | | 3.0 | | | | – | |
Continental Europe Recycling Solutions | | | 14.0–14.3 | | | | 14.3–14.8 | | | | 1.5–2.5 | | | | 1.5–2.5 | |
Australia Metals | | | 16.0–16.8 | | | | 16.8–16.9 | | | | 2.5 | | | | 2.5 | |
United Kingdom Metals2 | | | – | | | | 13.5–14.0 | | | | – | | | | 2.5 | |
United Kingdom Recycling Solutions2 | | | – | | | | 12.6–13.9 | | | | – | | | | 2.5 | |
United States Recycling Solutions | | | 13.4–14.0 | | | | 13.4–14.1 | | | | 3.0 | | | | 3.0 | |
Australia Recycling Solutions | | | 13.4–14.0 | | | | 16.5–16.9 | | | | 2.5 | | | | 2.5 | |
All other CGUs | | | 12.0–16.9 | | | | 12.2–17.3 | | | | 2.5–3.0 | | | | 2.5–3.0 | |
| 1 | This CGU was valued using the fair value less costs to sell approach in 2012. |
| 2 | These CGUs had either no goodwill or an insignificant amount of goodwill as at 30 June 2013 and hence no goodwill impairment tests were performed. In accordance with AASB 136 (IAS 36), other long-lived assets for these CGUs were analysed for impairment. |
| (c) | Goodwill impairment charges recognised |
The Group tests goodwill annually for impairment or more frequently if there are indications that goodwill might be impaired. Due to the difficult economic conditions affecting the Group’s industry, changes to the Group’s operating results and forecasts, and a significant reduction in the Group’s market capitalisation, a goodwill impairment test was performed during the years ended 30 June 2013 and 30 June 2012, which resulted in the following impairment charges being recognised:
| | | | | | | | |
| CGU | | 2013 A$M | | | 2012 A$M RESTATED | |
North America Metals | | | 256.2 | | | | 510.8 | |
Bulk Stainless | | | 20.8 | | | | – | |
Canada Recycling Solutions | | | 7.6 | | | | – | |
Other | | | 7.6 | | | | – | |
United Kingdom Metals | | | – | | | | 66.1 | |
United Kingdom Recycling Solutions | | | – | | | | 36.8 | |
Australia Recycling Solutions | | | – | | | | 3.6 | |
Total | | | 292.2 | | | | 617.3 | |
Year ended 30 June 2013
During the half year ended 31 December 2012, results for the North America Metals CGU were impacted by lower than anticipated intake volume and shipments, particularly for deep sea ferrous products. The anticipated improvement in the cash flows for this CGU which was the basis for the Group’s impairment considerations as at 30 June 2012 did not materialise. As a result, the future cash flows for the North America Metals CGU was reassessed which indicated that the carrying value of goodwill was not recoverable thus requiring an impairment of the entire goodwill balance for this CGU and an impairment of A$5.5 million related to permits (see Note 15).
The impairment charge related to the Bulk Stainless CGU was a result of the assessment of future cash flows. This CGU has been impacted by weak demand and pricing for stainless steel metals over the last few years. Based on recent financial results and projections of future cash flows, the carrying value of goodwill was determined to be not recoverable thus requiring an impairment of the entire goodwill balance for this CGU.
The impairment charge related to the Canada Recycling Solutions CGU was a result of deterioration in financial performance of the CGU due to increasing competitive pressures. Based on recent financial results and projections of future cash flows, the carrying value of goodwill was determined to be not recoverable thus requiring an impairment of the entire goodwill balance for this CGU.
Year ended 30 June 2012 (restated)
In the year ended 30 June 2012, results for the North America Metals CGU and United Kingdom Metals CGU were impacted by weak volumes and margin pressure that was encountered during the last three months of the period. In October and November 2011, ferrous scrap prices rapidly declined as deep sea ferrous markets became illiquid as economic concerns for Europe and for slowing growth in China became pervasive. These factors adversely impacted the operating results for these CGUs during the year ended 30 June 2012, which required a reassessment of the future cash flows of these CGUs. As a result, the carrying value of the goodwill for both CGUs was not fully recoverable resulting in the impairment charges for these CGUs. After the impairment charge, the United Kingdom Metals CGU had no remaining goodwill.
As described in Note 2, in the half year ended 31 December 2012, the Group identified a significant write-down in the carrying value of the inventory of its United Kingdom operations, most of which related to the United Kingdom Recycling Solutions CGU. As a result of the inventory write-down and related investigation, the Group reassessed its impairment evaluation for the year ended 30 June 2012. Management revised its cash flow projections for this CGU. As a result, the carrying value of goodwill was not recoverable and an impairment for this CGU was recorded. After the impairment charge, this CGU had no remaining goodwill.
F I N A N C I A L S T A T E M E N T S
NOTES TO THE CONSOLIDATED FINANCIAL STATEMENTSFOR THE YEAR ENDED 30 JUNE 2013
Note 14 – Goodwill (continued)
| (c) | Goodwill impairment charges recognised (continued) |
The impairment charge related to the Australia Recycling Solutions CGU was due to continued operating losses for this CGU. As a result, the carrying value of goodwill for this CGU exceeded its recoverable amount. After the impairment charge, this CGU had no remaining goodwill.
| (d) | Impact of possible changes in key assumptions |
The valuations as at 30 June 2013 for CGUs with remaining goodwill balances as at 30 June 2013 indicated sufficient headroom such that reasonable changes to key assumptions in the valuations are unlikely to result in an impairment of the related goodwill. These CGUs have not incurred a goodwill impairment charge in either the current or prior periods.
Note 15 – Other intangible assets
| | | | | | | | | | | | | | | | | | | | |
| | | SUPPLIER RELATIONSHIPS A$M | | | PERMITS A$M | | | LICENSES/ CONTRACTS A$M | | | TRADENAMES A$M | | | TOTAL A$M | |
At 30 June 2013 | | | | | | | | | | | | | | | | | | | | |
Cost | | | 227.3 | | | | 9.2 | | | | 37.2 | | | | 32.8 | | | | 306.5 | |
Accumulated impairment | | | (4.1 | ) | | | (7.3 | ) | | | – | | | | – | | | | (11.4 | ) |
Accumulated amortisation | | | (157.8 | ) | | | – | | | | (31.3 | ) | | | (8.6 | ) | | | (197.7 | ) |
Net book amount | | | 65.4 | | | | 1.9 | | | | 5.9 | | | | 24.2 | | | | 97.4 | |
| | | | | |
Year ended 30 June 2013 | | | | | | | | | | | | | | | | | | | | |
Balance at 1 July | | | 87.6 | | | | 7.9 | | | | 6.9 | | | | 24.2 | | | | 126.6 | |
Acquisitions (Note 28) | | | 4.6 | | | | 0.1 | | | | 1.3 | | | | 0.3 | | | | 6.3 | |
Disposals (Note 28) | | | (9.3 | ) | | | (0.6 | ) | | | – | | | | – | | | | (9.9 | ) |
Reclassification (Note 13) | | | 0.7 | | | | – | | | | (0.5 | ) | | | 0.3 | | | | 0.5 | |
Impairment1 | | | (5.6 | ) | | | (5.5 | ) | | | – | | | | (1.1 | ) | | | (12.2 | ) |
Amortisation charge | | | (18.5 | ) | | | – | | | | (2.3 | ) | | | (1.6 | ) | | | (22.4 | ) |
Foreign exchange differences | | | 5.9 | | | | – | | | | 0.5 | | | | 2.1 | | | | 8.5 | |
Balance at 30 June | | | 65.4 | | | | 1.9 | | | | 5.9 | | | | 24.2 | | | | 97.4 | |
| | | | | |
At 30 June 2012 | | | | | | | | | | | | | | | | | | | | |
Cost | | | 222.4 | | | | 9.2 | | | | 33.2 | | | | 31.0 | | | | 295.8 | |
Accumulated impairment | | | (0.3 | ) | | | (1.3 | ) | | | – | | | | – | | | | (1.6 | ) |
Accumulated amortisation | | | (134.5 | ) | | | – | | | | (26.3 | ) | | | (6.8 | ) | | | (167.6 | ) |
Net book amount | | | 87.6 | | | | 7.9 | | | | 6.9 | | | | 24.2 | | | | 126.6 | |
| | | | | |
Year ended 30 June 2012 | | | | | | | | | | | | | | | | | | | | |
Balance at 1 July | | | 100.3 | | | | 7.1 | | | | 4.8 | | | | 24.0 | | | | 136.2 | |
Acquisitions | | | 5.2 | | | | 1.0 | | | | 3.2 | | | | – | | | | 9.4 | |
Purchases | | | – | | | | – | | | | 1.0 | | | | – | | | | 1.0 | |
Reclassifications (Note 14) | | | 1.0 | | | | 0.1 | | | | 0.2 | | | | – | | | | 1.3 | |
Impairment2 | | | (0.3 | ) | | | (0.5 | ) | | | – | | | | – | | | | (0.8 | ) |
Amortisation charge | | | (23.2 | ) | | | – | | | | (2.5 | ) | | | (1.1 | ) | | | (26.8 | ) |
Foreign exchange differences | | | 4.6 | | | | 0.2 | | | | 0.2 | | | | 1.3 | | | | 6.3 | |
Balance at 30 June | | | 87.6 | | | | 7.9 | | | | 6.9 | | | | 24.2 | | | | 126.6 | |
| 1 | A$3.0 million of impairments were related to assets held for sale. The remaining impairments were recorded in connection with the Group’s impairment analysis of goodwill and intangible assets. |
| 2 | Impairments recognised in connection with yards which were closed. |
Note 16 – Trade and other payables
| | | | | | | | |
| | | 2013 A$M | | | 2012 A$M | |
Trade payables | | | 429.8 | | | | 485.2 | |
Other payables | | | 147.0 | | | | 153.7 | |
Deferred income | | | 8.4 | | | | 33.2 | |
| | | | 585.2 | | | | 672.1 | |
The Group’s exposure to currency and liquidity risk related to trade and other payables is set out in Note 3. The fair value of the Group’s trade and other payables approximates its carrying value.
Note 17 – Borrowings
| | | | | | | | |
| | | 2013
A$M | | | 2012
A$M | |
Current borrowings: | | | | | | | | |
Bank loans | | | 10.0 | | | | 13.5 | |
Other borrowings | | | 1.6 | | | | 0.2 | |
| | | | 11.6 | | | | 13.7 | |
Non-current borrowings: | | | | | | | | |
Bank loans | | | 189.1 | | | | 329.9 | |
| | | | 189.1 | | | | 329.9 | |
Bank loans are unsecured but are subject to various guarantees/cross guarantees, cross defaults and indemnities from the Company and certain of its subsidiaries.
The Group’s exposure to interest rate risk, as well as information relating to the facility arrangements is set out in Note 3.
The Group’s borrowings approximate the carrying amount as the Group’s primary exposure is to floating rate bank loans. The Group has nominal exposure to fixed rates through other borrowings.
Note 18 – Provisions
| | | | | | | | |
| | | 2013
A$M | | | 2012
A$M | |
Employee benefits | | | 45.2 | | | | 40.1 | |
Legal provisions | | | 17.9 | | | | 13.1 | |
Environmental and dilapidations | | | 11.1 | | | | 4.0 | |
Other | | | 4.8 | | | | 2.9 | |
| | | | 79.0 | | | | 60.1 | |
Current | | | 38.5 | | | | 30.6 | |
Non-current | | | 40.5 | | | | 29.5 | |
| | | | 79.0 | | | | 60.1 | |
Movements in each class of provision during the financial year, other than employee benefits, are set out below.
| | | | | | | | | | | | |
| | | LEGAL A$M | | | ENVIRONMENTAL AND DILAPIDATIONS A$M | | | OTHER A$M | |
Balance at 1 July | | | 13.1 | | | | 4.0 | | | | 2.9 | |
Provisions recognised in profit or loss | | | 4.2 | | | | 6.2 | | | | 2.0 | |
Payments | | | (1.0 | ) | | | – | | | | (0.1 | ) |
Foreign exchange differences | | | 1.6 | | | | 0.9 | | | | – | |
Balance at 30 June | | | 17.9 | | | | 11.1 | | | | 4.8 | |
The Group is involved in legal and other disputes and, after taking legal advice, has established provisions taking into account the relevant facts of each dispute. The timing of cash outflows associated with legal claims cannot be reasonably determined. The environmental and dilapidations provision is an estimate of costs for property remediation that will be required in the future.
F I N A N C I A L S T A T E M E N T S
NOTES TO THE CONSOLIDATED FINANCIAL STATEMENTSFOR THE YEAR ENDED 30 JUNE 2013
Note 19 – Retirement benefit obligations
The Group operates a number of pension plans for the benefit of its employees throughout the world. The Group’s pension plans are provided through both defined benefit and defined contribution arrangements. Defined benefit schemes provide benefits based on years of service and/or final average salary. Defined contribution schemes offer employees individual funds that are converted into benefits at the time of retirement.
The following sets out details in respect of the defined benefit sections only. The expense recognised in relation to the defined contribution plans is disclosed in Note 8.
| (a) | Balances recognised in the statement of financial position |
| | | | | | | | |
| | | 2013 A$M | | | 2012 A$M | |
Present value of defined benefit obligation | | | 78.3 | | | | 79.5 | |
Fair value of defined benefit plan assets | | | (73.8 | ) | | | (64.9 | ) |
Net defined benefit liability | | | 4.5 | | | | 14.6 | |
| | |
These amounts are disclosed as: | | | | | | | | |
Retirement benefit assets | | | 0.4 | | | | – | |
Retirement benefit obligations | | | 4.9 | | | | 14.6 | |
| | | | 4.5 | | | | 14.6 | |
The Group has no legal obligation to settle the liability with an immediate contribution or additional one-off contributions. The Group intends to continue to contribute to the defined benefit plans based on recommendations from its actuaries.
| (b) | Expense recognised in profit or loss |
| | | | | | | | | | | | |
| | | 2013
A$M | | | 2012
A$M | | | 2011
A$M | |
Current service cost | | | 1.3 | | | | 1.2 | | | | 1.3 | |
Interest cost | | | 2.9 | | | | 3.3 | | | | 3.3 | |
Past service cost | | | – | | | | 0.1 | | | | – | |
Expected return on plan assets | | | (3.8 | ) | | | (4.1 | ) | | | (3.6 | ) |
| | | | 0.4 | | | | 0.5 | | | | 1.0 | |
| | | |
Actual return on plan assets | | | 8.1 | | | | (0.6 | ) | | | 7.4 | |
| | | | | | | | |
| | | 2013 A$M | | | 2012 A$M | |
Movements in the defined benefit obligation: | | | | | | | | |
Balance at 1 July | | | 79.5 | | | | 64.6 | |
Current service cost | | | 1.3 | | | | 1.2 | |
Interest cost | | | 2.9 | | | | 3.3 | |
Past service cost | | | – | | | | 0.1 | |
Actuarial (gain)/loss | | | (3.3 | ) | | | 11.6 | |
Benefits paid | | | (6.9 | ) | | | (3.0 | ) |
Contributions paid by members | | | 0.3 | | | | 0.3 | |
Foreign exchange differences | | | 4.5 | | | | 1.4 | |
Balance at 30 June | | | 78.3 | | | | 79.5 | |
| | |
Reconciliation of the fair value of plan assets: | | | | | | | | |
Balance at 1 July | | | 64.9 | | | | 62.6 | |
Expected return on plan assets | | | 3.8 | | | | 4.1 | |
Actuarial gain/(loss) | | | 4.3 | | | | (4.6 | ) |
Contributions by Group | | | 3.3 | | | | 4.3 | |
Contributions paid by members | | | 0.3 | | | | 0.3 | |
Benefits paid | | | (6.9 | ) | | | (3.0 | ) |
Foreign exchange differences | | | 4.1 | | | | 1.2 | |
Balance at 30 June | | | 73.8 | | | | 64.9 | |
| (d) | Categories of plan assets |
The major categories of plan assets are as follows:
| | | | | | | | | | | | |
| | | | | | 2013 A$M | | | 2012 A$M | |
Cash | | | | | | | 1.9 | | | | 2.3 | |
Equity instruments | | | | | | | 51.2 | | | | 42.8 | |
Debt instruments | | | | | | | 15.0 | | | | 14.6 | |
Property | | | | | | | 5.7 | | | | 5.2 | |
Total plan assets | | | | | | | 73.8 | | | | 64.9 | |
| | | |
| (e) Amounts recognised in other comprehensive income | | | | | | | | | |
| | | 2013 A$M | | | 2012 A$M | | | 2011 A$M | |
Actuarial gain/(loss) recognised during the financial year | | | 7.6 | | | | (16.2 | ) | | | 4.5 | |
Income tax (expense)/benefit | | | (2.5 | ) | | | 4.9 | | | | (1.7 | ) |
Net actuarial gain/(loss) | | | 5.1 | | | | (11.3 | ) | | | 2.8 | |
| | | |
Cumulative amount at 30 June | | | (21.8 | ) | | | (29.4 | ) | | | (13.2 | ) |
| | | |
(f) Principal actuarial assumptions | | | | | | | | | | | | |
| | | 2013 % | | | 2012 % | | | 2011 % | |
Australia | | | | | | | | | | | | |
Discount rate | | | 2.8 | | | | 2.2 | | | | 4.3 | |
Expected rate of return on plan assets | | | 7.0 | | | | 7.0 | | | | 7.3 | |
Future salary increases | | | 3.5 | | | | 4.0 | | | | 3.5 | |
| | | |
United Kingdom | | | | | | | | | | | | |
Discount rate | | | 4.7 | | | | 4.5 | | | | 5.5 | |
Expected rate of return on plan assets | | | 6.0 | | | | 5.4 | | | | 5.6 | |
Future salary increases | | | 3.7 | | | | 3.3 | | | | 3.9 | |
| | | |
United States | | | | | | | | | | | | |
Discount rate | | | 4.0 | | | | 4.0 | | | | 5.5 | |
Expected rate of return on plan assets | | | 6.3 | | | | 7.3 | | | | 8.0 | |
Future salary increases | | | 3.5 | | | | 3.5 | | | | 3.5 | |
The expected rate of return on plan assets has been based on historical and future expectations of returns for each of the major categories of asset classes, as well as the expected and actual allocation of plan assets to these major categories and considers recommendations from the Group’s actuaries. This resulted in the selection of the weighted average returns of plan assets for each of the defined benefit plans as set out above.
| (g) | Employer contributions |
Employer contributions for defined benefit schemes are based on recommendations of actuarial advisors of the plans. Actuarial assessments are made at no more than one-year intervals, and the last such assessment was made as at 30 June 2013.
The objective of funding is to ensure that the benefit entitlements of members and other beneficiaries are fully funded by the time they become payable. To achieve this objective, the actuaries have adopted a method of funding benefits known as the aggregate funding method. This funding method seeks to have benefits funded by means of a total contribution, which is expected to be a constant percentage of members’ salaries over their working lifetimes.
Using the funding method described above and particular actuarial assumptions as to the plan’s future experience, the actuaries recommended, in their review as at 30 June 2013, a contribution amount that would be sufficient to meet the Group’s obligations to the defined benefit scheme. Total employer contributions expected to be paid by Group companies for the year ending 30 June 2014 is A$0.6 million for Australia, A$1.9 million for the United Kingdom, and A$0.6 million for the United States.
F I N A N C I A L S T A T E M E N T S
NOTES TO THE CONSOLIDATED FINANCIAL STATEMENTSFOR THE YEAR ENDED 30 JUNE 2013
Note 19 – Retirement benefit obligations (continued)
| | | | | | | | | | | | | | | | | | | | |
| | | 2013 A$M | | | 2012 A$M | | | 2011 A$M | | | 2010 A$M | | | 2009 A$M | |
Defined benefit plan obligation | | | 78.3 | | | | 79.5 | | | | 64.6 | | | | 72.9 | | | | 73.4 | |
Plan assets | | | (73.8 | ) | | | (64.9 | ) | | | (62.6 | ) | | | (61.9 | ) | | | (62.2 | ) |
Deficit | | | 4.5 | | | | 14.6 | | | | 2.0 | | | | 11.0 | | | | 11.2 | |
| | | | | |
Experience adjustments arising on plan liabilities | | | (3.3 | ) | | | 11.6 | | | | (0.7 | ) | | | 8.4 | | | | (8.7 | ) |
Experience adjustments arising on plan assets | | | (4.3 | ) | | | 4.6 | | | | (3.8 | ) | | | (4.6 | ) | | | 16.9 | |
Note 20 – Contributed equity
Ordinary shares, which have no par value, trade on the Australian Securities Exchange (“ASX”) and entitle the holder to participate in dividends and the proceeds on winding up of the Company in proportion to the number of shares held. Voting rights attaching to the ordinary shares are, on a show of hands, one vote for every person present as a member, proxy, attorney or representative thereof and, on a poll, one vote per share for every member present in person or by proxy, attorney or representative. The Company does not have a limited amount of authorised capital. The Company’s shares also trade on the New York Stock Exchange in the form of American Depositary Shares (“ADS”) with one ordinary share equaling one ADS. ADSs have the same rights as ordinary shares, including participation in dividends and voting rights.
Movements in the ordinary share balance were as follows:
| | | | | | | | |
| | | NUMBER OF SHARES | | | A$M | |
Balance at 30 June 2011 | | | 205,370,288 | | | | 2,817.9 | |
Issued under long-term incentive plans | | | 713,441 | | | | 1.5 | |
Issued under the dividend reinvestment plan | | | 1,772,714 | | | | 23.4 | |
Share buy-back | | | (3,039,649 | ) | | | (38.5 | ) |
Balance at 30 June 2012 | | | 204,816,794 | | | | 2,804.3 | |
Issued under long-term incentive plans | | | 404,594 | | | | – | |
Share buy-back | | | (912,001 | ) | | | (8.6 | ) |
Balance at 30 June 2013 | | | 204,309,387 | | | | 2,795.7 | |
On 7 October 2011, the Company announced an on-market share buy-back program, which allowed the buy-back of a maximum of 10% of issued capital (20,603,871 ordinary shares) over a 12-month period on the ASX. The buy-back commenced on 24 October 2011 and was completed on 23 October 2012. During the 12 month duration of the share buy-back program, the Company repurchased 3.952 million shares for a total cost of A$47.1 million. The reacquired shares have been cancelled. Details regarding the shares purchased are as follows:
| | | | | | | | |
| | | 2013 | | | 2012 | |
Ordinary shares purchased | | | 912,001 | | | | 3,039,649 | |
High Price | | | A$10.35 | | | | A$13.96 | |
Low Price | | | A$8.63 | | | | A$9.35 | |
Average Price | | | A$9.43 | | | | A$12.67 | |
| (c) | Dividend reinvestment plan |
The Company operated a Dividend Reinvestment Plan (“DRP”) under which holders of ordinary shares were able to elect to have all or part of their dividend entitlements satisfied by issue of new ordinary shares rather than by being paid cash. Shares issued under the DRP were at a 2.5% discount to the market price. On 17 February 2012, the Directors resolved to suspend the DRP.
| (d) | Capital risk management |
The primary objective of managing the Group’s capital is to ensure that there is sufficient capital available to support the funding requirements of the Group, including capital expenditure, in a way that optimises the cost of capital, maximises shareholders’ returns and ensures that the Group remains in a sound financial position.
In order to manage the capital structure, the Group may periodically adjust dividend policy, return capital to shareholders, issue new shares or sell assets to reduce debt.
The Group monitors its capital structure primarily using the gearing ratio. This ratio is calculated as net debt divided by total capital. Net debt is calculated as total borrowings less cash and cash equivalents. Total capital is calculated as total equity as shown in the statement of financial position plus net debt.
The Group’s gearing ratio is as follows:
| | | | | | | | |
| | | 2013 A$M | | | 2012 A$M RESTATED | |
Total borrowings | | | 200.7 | | | | 343.6 | |
Less: cash and cash equivalents | | | (46.9 | ) | | | (51.4 | ) |
Net debt | | | 153.8 | | | | 292.2 | |
Plus: total equity | | | 1,928.8 | | | | 2,283.7 | |
Total capital | | | 2,082.6 | | | | 2,575.9 | |
| | |
Gearing ratio | | | 7.4% | | | | 11.3% | |
There have been no breaches of bank covenants.
Note 21 – Retained earnings/(deficit) and reserves
| (a) | Retained earnings/(deficit) |
| | | | | | | | |
| | | 2013 A$M | | | 2012 A$M RESTATED | |
Balance at 1 July | | | (187.7 | ) | | | 538.8 | |
Loss after tax | | | (466.1 | ) | | | (622.5 | ) |
Dividends paid | | | (20.4 | ) | | | (92.7 | ) |
Actuarial gain/(loss) on defined benefit plans, net of tax | | | 5.1 | | | | (11.3 | ) |
Balance at 30 June | | | (669.1 | ) | | | (187.7 | ) |
| | | | | | | | | | | | | | | | | | | | |
| | | SHARE-BASED PAYMENTS A$M | | | AVAILABLE- FOR-SALE
INVESTMENTS
A$M | | | CASH FLOW HEDGING A$M | | | FOREIGN CURRENCY TRANSLATION A$M | | | TOTAL A$M | |
Balance at 30 June 2011 | | | 71.9 | | | | – | | | | (0.2 | ) | | | (516.9 | ) | | | (445.2 | ) |
Equity-settled share-based payment expense | | | 24.3 | | | | – | | | | – | | | | – | | | | 24.3 | |
Revaluation – gross | | | – | | | | – | | | | 1.3 | | | | – | | | | 1.3 | |
Transfer to profit or loss – gross | | | – | | | | – | | | | 0.3 | | | | – | | | | 0.3 | |
Foreign currency translation differences | | | – | | | | – | | | | – | | | | 94.2 | | | | 94.2 | |
Associates | | | – | | | | (0.1 | ) | | | – | | | | (0.3 | ) | | | (0.4 | ) |
Deferred tax | | | – | | | | – | | | | (0.4 | ) | | | (7.0 | ) | | | (7.4 | ) |
Balance at 30 June 2012 | | | 96.2 | | | | (0.1 | ) | | | 1.0 | | | | (430.0 | ) | | | (332.9 | ) |
Equity-settled share-based payment expense | | | 16.1 | | | | – | | | | – | | | | – | | | | 16.1 | |
Revaluation – gross | | | – | | | | – | | | | (6.7 | ) | | | – | | | | (6.7 | ) |
Transfer to profit or loss – gross | | | – | | | | – | | | | 1.3 | | | | – | | | | 1.3 | |
Foreign currency translation differences | | | – | | | | – | | | | – | | | | 136.3 | | | | 136.3 | |
Associates | | | – | | | | 0.2 | | | | (0.3 | ) | | | 0.7 | | | | 0.6 | |
Deferred tax | | | 0.5 | | | | – | | | | 1.6 | | | | (14.6 | ) | | | (12.5 | ) |
Balance at 30 June 2013 | | | 112.8 | | | | 0.1 | | | | (3.1 | ) | | | (307.6 | ) | | | (197.8 | ) |
F I N A N C I A L S T A T E M E N T S
NOTES TO THE CONSOLIDATED FINANCIAL STATEMENTSFOR THE YEAR ENDED 30 JUNE 2013
Note 21 – Retained earnings/(deficit) and reserves (continued)
| (c) | Nature and purpose of reserves |
(i) Share-based payments reserve
The share-based payments reserve is used to recognise the fair value of share-based awards issued to employees.
(ii) Available-for-sale investments reserve
Changes in the fair value and exchange differences arising on translation of investments, such as equities classified as available-for-sale investments, are recognised in other comprehensive income as described in Note 1(s) and accumulated in a separate reserve within equity. Amounts are reclassified to profit or loss when the associated assets are sold or impaired.
(iii) Cash flow hedging reserve
The cash flow hedging reserve is used to record gains or losses on a hedging instrument in a cash flow hedge that are recognised in other comprehensive income, as described in Note 1(t). Amounts are recognised in profit or loss when the associated hedged transaction affects profit or loss.
(iv) Foreign currency translation reserve
Exchange differences arising on translation of foreign controlled entities are recognised in other comprehensive income, as described in Note 1(g) and accumulated in a separate reserve within equity. The cumulative amount is reclassified to profit or loss when the Group no longer controls the foreign operation.
Note 22 – Dividends
| (a) | Dividends declared and paid during the year |
| | | | | | | | | | | | | | | | | | | | |
| | | CENTS PER SHARE | | | FRANKED % | | | 2013 A$M | | | 2012 A$M | | | 2011 A$M | |
Interim 2013 | | | 0.0 | | | | 0% | | | | – | | | | – | | | | – | |
Final 2012 | | | 10.0 | | | | 0% | | | | 20.4 | | | | – | | | | – | |
Interim 2012 | | | 10.0 | | | | 0% | | | | – | | | | 20.6 | | | | – | |
Final 2011 | | | 35.0 | | | | 43% | | | | – | | | | 72.1 | | | | – | |
Interim 2011 | | | 12.0 | | | | 42% | | | | – | | | | – | | | | 24.6 | |
Final 2010 | | | 23.0 | | | | 74% | | | | – | | | | – | | | | 46.9 | |
Total dividends paid | | | | | | | | | | | 20.4 | | | | 92.7 | | | | 71.5 | |
Shares issued under the DRP | | | | | | | | | | | – | | | | (23.4 | ) | | | (19.1 | ) |
Total cash dividends paid | | | | | | | | | | | 20.4 | | | | 69.3 | | | | 52.4 | |
The franked components of all dividends paid or declared were franked based on a tax rate of 30%.
| (b) | Dividends not recognised at year end |
For the year ended 30 June 2013, the Directors determined that there will be no final dividend declared (2012: A$20.4 million).
| | | | | | | | |
| | | 2013 A$M | | | 2012 A$M | |
Estimated franking credits available for the subsequent financial years based on tax rate of 30%
(2012: 30%) | | | 23.4 | | | | 17.1 | |
The above amounts represent the balance of the franking account as at the end of the reporting date, adjusted for:
| a) | franking credits that will arise from the payment of the amount of the provision for income tax and franking debits that will arise from refunds; |
| b) | franking debits that will arise from the payment of dividends recognised as a liability as at the reporting date; and |
| c) | franking credits that will arise from the receipt of dividends recognised as receivables as at the reporting date. |
Note 23 – Contingencies
The Group has given guarantees in respect of the performance of contracts entered into in the ordinary course of business. The amounts of these guarantees provided by the Group, for which no amounts are recognised in the consolidated financial statements, as at 30 June 2013 was A$61.9 million (2012: A$41.6 million).
See Note 32(b) for information related to guarantees provided by the Company.
The Group files income tax returns in many jurisdictions throughout the world. Various tax authorities are currently reviewing or auditing the Group’s income tax returns. Tax returns contain matters that could be subject to differing interpretations of applicable tax laws and regulations. While it is difficult to predict the ultimate outcome in some cases, the Group does not anticipate that there will be any material impact on the Group’s consolidated financial statements from such audits or reviews.
The Group is subject to comprehensive environmental requirements relating to, among others, the acceptance, storage, treatment, handling and disposal of solid waste and hazardous waste; the discharge of materials and storm water into the environment; the management and treatment of wastewater and stormwater; and the remediation of soil and groundwater contamination. As a consequence, the Group has incurred and will continue to incur environmental costs and liabilities associated with site and facility operation, closure, remediation, monitoring and licensing. Provisions have been made in respect of estimated environmental liabilities where obligations are known to exist and can be reasonably measured. However, additional liabilities may emerge due to a number of factors, including changes in environmental laws and regulations in each of the jurisdictions in which the Group operates or has operated. The Group cannot predict the extent to which it may be affected in the future by any such changes in legislation or regulation.
Various Group companies are parties to legal actions and claims that arise in the ordinary course of their business. While the outcome of such legal proceedings cannot be readily foreseen, the Group believes that they will be resolved without material effect on its financial statements. Provision has been made for known obligations where the existence of the liability is probable and can be reasonably estimated.
On 20 June 2011, the United States District Court Southern District of New York issued a summary judgement against Metal Management Inc. (a subsidiary of the Company) in a dispute involving a breach of contract. The breach of contract relates to the transaction fee that was payable to Metal Management Inc.’s financial advisers in connection with its merger with the Company. The amount of the summary judgement of A$9.8 million was paid during the year ended 30 June 2012.
In the year ended 30 June 2013, the Group recorded a provision of A$4.2 million representing civil penalties and costs to resolve an investigation into alleged violations of California’s scrap purchase record-keeping laws.
In the year ended 30 June 2012, the Group recorded a provision of A$12.8 million related to a dispute with a third party.
Under the terms of a Deed of Cross Guarantee (“DCG”) entered into in accordance with ASIC Class Order 98/1418 (as amended by Class Orders 98/2107, 00/0321, 01/1087, 02/0248 and 02/1017), the Company has undertaken to meet any shortfall that might arise on the winding up of controlled entities that are party to the deed, as described in Note 29. The controlled entities are not in liquidation and there is no indication that they will be wound up.
Note 24 – Commitments
Capital expenditures contracted for at the reporting date but not recognised as liabilities are as follows:
| | | | | | | | |
| | | 2013 A$M | | | 2012
A$M | |
Property, plant and equipment | | | 40.8 | | | | 69.2 | |
The capital commitments included above also include the Group’s share relating to joint venture operations and jointly controlled entities.
F I N A N C I A L S T A T E M E N T S
NOTES TO THE CONSOLIDATED FINANCIAL STATEMENTSFOR THE YEAR ENDED 30 JUNE 2013
Note 24 – Commitments (continued)
The Group has entered into various operating leases on property, plant and equipment. The leases have varying terms, escalation clauses and renewal rights. On renewal, the terms of the leases are renegotiated. Lease commitments for operating leases are as follows:
| | | | | | | | |
| | | 2013
A$M | | | 2012 A$M | |
Not later than one year | | | 85.6 | | | | 68.9 | |
Later than one year, but not later than three years | | | 119.2 | | | | 92.4 | |
Later than three years, but not later than five years | | | 58.2 | | | | 48.4 | |
Later than five years | | | 113.8 | | | | 124.6 | |
Total lease commitments not recognised as liabilities | | | 376.8 | | | | 334.3 | |
The lease commitments included above also include the Group’s share relating to joint venture operations and jointly controlled entities.
Note 25 – Share ownership plans
The Company’s share ownership plans are designed to link the rewards of eligible employees to the long-term performance of the Company and the returns generated for shareholders. The maximum number of shares that can be outstanding at any time under the share ownership plans is limited to 5% of the Company’s issued capital. Grants under the share ownership plans can be in the form of options or share rights. Certain share ownership plans also provide for cash-settlement, which are determined by the Board.
An option is a contract that gives the holder the right, but not the obligation, to acquire the Company’s shares at a fixed or determinable price for a specified period of time. Options have an exercise price based on the weighted average market price of the Company’s ordinary shares (or ADSs) during the five trading days up to the date of the grant. Share rights are a contractual right to acquire the Company’s shares for nil consideration. Unless specified in the grants, holders of options and share rights are not entitled to dividends or voting rights.
| (a) | Effect of share-based payments on profit or loss |
The expense recognised in the income statement in relation to share-based payments is disclosed in Note 8. The carrying amount of liabilities for cash-settled share-based arrangements as at 30 June 2013 was A$0.8 million (2012: A$0.4 million). Where share-based awards are issued to employees of subsidiaries within the Group, the subsidiaries compensate the Company for the fair value of these share-based awards.
| (b) | Long-Term Incentive Plan (“LTIP”) |
In July 2003, the Company established a LTIP designed as a reward and retention tool for certain employees. Options and share rights granted under the LTIP may vest either based on continuous service or based on performance conditions. Share rights that contain performance conditions are referred to as performance rights, whereas share rights which only contain a continuous service condition are referred to as restricted share units. Cash-settled option grants are also made under the LTIP to certain employees. Refer to the Remuneration Report for further information on the terms of the grants made in the year ended 30 June 2013 pursuant to the LTIP.
| (i) | Equity-settled options |
The fair value of equity-settled options granted is independently determined using a Binomial method, which allows for the effects of an early exercise for vested options assuming the share price exceeds one and a half times the exercise price. The significant weighted assumptions used to determine the fair value were as follows:
| | | | | | | | | | | | | | | | |
| | | ORDINARY SHARES | | | ADSs | |
| | | 2013 | | | 2012 | | | 2013 | | | 2012 | |
Risk-free interest rate | | | 2.8% | | | | 3.9% | | | | 1.0% | | | | 1.4% | |
Dividend yield | | | 3.0% | | | | 3.0% | | | | 3.0% | | | | 3.0% | |
Volatility | | | 33.0% | | | | 43.0% | | | | 39.0% | | | | 51.0% | |
Expected life (years) | | | 4.7 | | | | 4.2 | | | | 4.6 | | | | 4.3 | |
Share price at grant date | | | A$8.57 | | | | A$13.27 | | | | US$8.93 | | | | US$13.66 | |
Weighted average fair value | | | A$1.88 | | | | A$4.08 | | | | US$2.18 | | | | US$4.52 | |
Volatility for the ordinary shares is based on historical share price. Due to the sparse trading of the ADSs and its limited listing (since March 2008), the volatility of the ADSs is based on the historical share price of the ordinary shares which have been translated to US dollars using daily exchange rates.
| | | | | | | | | | | | | | | | |
| EQUITY-SETTLED OPTIONS OUTSTANDING | | NUMBER OF OPTIONS 2013 | | | WEIGHTED AVERAGE EXERCISE PRICE 2013 | | | NUMBER OF OPTIONS 2012 | | | WEIGHTED AVERAGE EXERCISE PRICE 2012 | |
Ordinary Shares: | | | | | | | | | | | | | | | | |
Balance at 1 July | | | 1,061,746 | | | | A$19.38 | | | | 825,223 | | | | A$21.34 | |
Granted | | | 248,047 | | | | A$9.29 | | | | 247,823 | | | | A$13.07 | |
Forfeited | | | (325,514) | | | | A$16.34 | | | | (11,300) | | | | A$23.87 | |
Exercised | | | – | | | | – | | | | – | | | | – | |
Balance at 30 June | | | 984,279 | | | | A$17.85 | | | | 1,061,746 | | | | A$19.38 | |
Exercisable at 30 June | | | 660,694 | | | | A$21.20 | | | | 636,585 | | | | A$21.78 | |
| | | | |
ADSs: | | | | | | | | | | | | | | | | |
Balance at 1 July | | | 3,648,508 | | | | US$16.71 | | | | 2,608,765 | | | | US$17.80 | |
Granted | | | 2,106,373 | | | | US$9.49 | | | | 1,311,842 | | | | US$13.37 | |
Forfeited | | | (222,123) | | | | US$12.26 | | | | (90,445) | | | | US$16.57 | |
Exercised | | | – | | | | – | | | | (181,654) | | | | US$8.39 | |
Balance at 30 June | | | 5,532,758 | | | | US$14.14 | | | | 3,648,508 | | | | US$16.71 | |
Exercisable at 30 June | | | 2,508,738 | | | | US$17.80 | | | | 1,581,353 | | | | US$18.75 | |
For equity-settled options exercised during the year ended 30 June 2012, the weighted average share price at the date of exercise was US$14.02 for ADSs.
Information about outstanding and exercisable equity-settled options as at 30 June 2013 is as follows:
| | | | | | | | | | | | | | | | | | | | | | | | |
| | | OUTSTANDING | | | EXERCISABLE | |
| EXERCISE PRICE RANGE | | NUMBER��OF OPTIONS | | | WEIGHTED AVERAGE EXERCISE PRICE | | | WEIGHTED AVERAGE REMAINING CONTRACTUAL LIFE (YEARS) | | | NUMBER OF OPTIONS | | | WEIGHTED AVERAGE EXERCISE PRICE | | | WEIGHTED AVERAGE REMAINING CONTRACTUAL LIFE (YEARS) | |
Ordinary shares: | | | | | | | | | | | | | | | | | | | | | | | | |
A$8–A$15 | | | 393,624 | | | | A$11.06 | | | | 5.57 | | | | 96,446 | | | | A$13.09 | | | | 3.98 | |
A$15–A$20 | | | 134,652 | | | | A$17.68 | | | | 3.83 | | | | 108,245 | | | | A$17.69 | | | | 3.69 | |
A$20–A$30 | | | 456,003 | | | | A$23.75 | | | | 3.19 | | | | 456,003 | | | | A$23.75 | | | | 3.19 | |
| | | | 984,279 | | | | A$17.85 | | | | 4.23 | | | | 660,694 | | | | A$21.20 | | | | 3.38 | |
| | | | | | |
ADSs: | | | | | | | | | | | | | | | | | | | | | | | | |
US$8–US$15 | | | 3,412,854 | | | | US$11.00 | | | | 5.79 | | | | 648,137 | | | | US$12.96 | | | | 4.46 | |
US$15–US$20 | | | 831,586 | | | | US$16.92 | | | | 4.42 | | | | 577,783 | | | | US$16.92 | | | | 4.42 | |
US$20–US$30 | | | 1,288,318 | | | | US$20.65 | | | | 3.23 | | | | 1,282,818 | | | | US$20.65 | | | | 3.23 | |
| | | | 5,532,758 | | | | US$14.14 | | | | 4.99 | | | | 2,508,738 | | | | US$17.80 | | | | 3.82 | |
The fair value of cash-settled options is determined in the same manner as equity-settled options. The liability for cash-settled options is remeasured at each reporting date. The significant weighted assumptions used to remeasure the fair value at 30 June 2013 were as follows:
| | | | | | | | |
| GRANTED DURING YEAR ENDED 30 JUNE | | 2013 | | | 2012 | |
Risk-free interest rate | | | 3.3% | | | | 3.2% | |
Dividend yield | | | 3.0% | | | | 3.0% | |
Volatility | | | 34.0% | | | | 34.0% | |
Expected life (years) | | | 4.2 | | | | 4.0 | |
Share price at reporting date | | | A$8.26 | | | | A$8.26 | |
Weighted average fair value | | | A$1.69 | | | | A$0.89 | |
F I N A N C I A L S T A T E ME N T S
NOTES TO THE CONSOLIDATED FINANCIAL STATEMENTSFOR THE YEAR ENDED 30 JUNE 2013
Note 25 – Share ownership plans (continued)
| (b) | Long-Term Incentive Plan (“LTIP”) (continued) |
| (ii) | Cash-settled options (continued) |
| | | | | | | | | | | | | | | | |
| CASH-SETTLED OPTIONS OUTSTANDING | | NUMBER OF OPTIONS 2013 | | | WEIGHTED AVERAGE EXERCISE PRICE $ 2013 | | | NUMBER OF OPTIONS 2012 | | | WEIGHTED AVERAGE EXERCISE PRICE $ 2012 | |
Ordinary Shares: | | | | | | | | | | | | | | | | |
Balance at 1 July | | | 566,166 | | | | A$14.88 | | | | 238,722 | | | | A$17.62 | |
Granted | | | 611,251 | | | | A$9.29 | | | | 353,533 | | | | A$13.07 | |
Forfeited | | | (75,224) | | | | A$12.02 | | | | (26,089) | | | | A$15.46 | |
Exercised | | | – | | | | – | | | | – | | | | – | |
Balance at 30 June | | | 1,102,193 | | | | A$11.97 | | | | 566,166 | | | | A$14.88 | |
Exercisable at 30 June | | | 248,905 | | | | A$15.68 | | | | 79,573 | | | | A$17.62 | |
Performance rights vest after a period of three to five years, but only if the performance hurdle has been met. Performance hurdles are either based on Total Shareholder Return (“TSR”) or on non-market-based performance criteria. In the year ended 30 June 2013, 461,994 (2012: 44,440) share rights were forfeited as the performance conditions were not satisfied.
Performance-based share right grants made in the years ended 30 June 2013 and 2012 are measured using a TSR hurdle over a three-year period (commencing at the beginning of the financial year) against a comparator group of companies. Full vesting of the performance share rights occurs when the Company’s TSR is at (or exceeds) the 75th percentile relative to the comparator group, scaling down to 50% vesting on a straight-line basis for median performance. Below median performance, no vesting occurs. Initial TSR performance is tested at the third anniversary of the commencement of the performance period, with subsequent performance testing possible at the fourth and fifth anniversaries of the commencement of the performance period.
The fair value of performance share rights granted is independently determined using a Black-Scholes method to produce a Monte-Carlo simulation model which allows for the incorporation for a TSR performance condition that must be met before the share rights vest. The significant weighted assumptions used to determine the fair value were as follows:
| | | | | | | | | | | | | | | | |
| | | ORDINARY SHARES | | | ADSs | |
| | | 2013 | | | 2012 | | | 2013 | | | 2012 | |
Dividend yield | | | 3.0% | | | | 3.0% | | | | 3.0% | | | | 3.0% | |
Risk-free interest rate | | | 2.5% | | | | 3.9% | | | | 0.3% | | | | 1.4% | |
Volatility | | | 33.0% | | | | 43.0% | | | | 39.0% | | | | 51.0% | |
Share price at grant date | | | A$8.57 | | | | A$13.27 | | | | US$8.93 | | | | US$13.66 | |
| | | | |
| | | | | | | | | | | | | | | | |
| PERFORMANCE RIGHTS OUTSTANDING | | NUMBER OF SHARES 2013 | | | WEIGHTED AVERAGE FAIR VALUE AT GRANT DATE $ 2013 | | | NUMBER OF SHARES 2012 | | | WEIGHTED AVERAGE FAIR VALUE AT GRANT DATE $ 2012 | |
Ordinary Shares: | | | | | | | | | | | | | | | | |
Non-vested balance at 1 July | | | 706,947 | | | | A$16.27 | | | | 544,846 | | | | A$18.51 | |
Granted | | | 320,702 | | | | A$5.29 | | | | 242,432 | | | | A$10.42 | |
Forfeited/cancelled | | | (339,613) | | | | A$19.42 | | | | (66,341) | | | | A$10.85 | |
Vested | | | – | | | | – | | | | (13,990) | | | | A$28.04 | |
Non-vested balance at 30 June | | | 688,036 | | | | A$9.60 | | | | 706,947 | | | | A$16.27 | |
| | | | |
ADSs: | | | | | | | | | | | | | | | | |
Balance at 1 July | | | 2,278,835 | | | | US$9.34 | | | | 1,398,064 | | | | US$10.08 | |
Granted | | | 1,361,087 | | | | US$4.12 | | | | 936,183 | | | | US$8.24 | |
Forfeited/cancelled | | | (555,163) | | | | US$9.60 | | | | (55,412) | | | | US$9.40 | |
Vested | | | – | | | | – | | | | – | | | | – | |
Non-vested balance at 30 June | | | 3,084,759 | | | | US$6.99 | | | | 2,278,835 | | | | US$9.34 | |
| (iv) | Restricted share units |
Restricted share units granted to employees typically vest over a period up to three years. The fair value of restricted share units is determined based on the market price of the Company’s shares on the date of grant and the Company’s dividend yield.
| | | | | | | | | | | | | | | | |
| RESTRICTED SHARE UNITS OUTSTANDING | | NUMBER OF
SHARES
2013 | | | WEIGHTED
AVERAGE FAIR
VALUE AT
GRANT DATE $
2013 | | | NUMBER OF
SHARES
2012 | | | WEIGHTED
AVERAGE FAIR VALUE AT
GRANT DATE $
2012 | |
Ordinary Shares: | | | | | | | | | | | | | | | | |
Non-vested balance at 1 July | | | 46,536 | | | | A$14.96 | | | | 57,075 | | | | A$16.46 | |
Granted | | | – | | | | – | | | | – | | | | – | |
Forfeited/cancelled | | | (33,893 | ) | | | A$14.72 | | | | (1,666 | ) | | | A$23.58 | |
Vested | | | (2,629 | ) | | | A$17.67 | | | | (8,873 | ) | | | A$22.96 | |
Non-vested balance at 30 June | | | 10,014 | | | | A$15.05 | | | | 46,536 | | | | A$14.96 | |
| | | | |
ADSs: | | | | | | | | | | | | | | | | |
Balance at 1 July | | | 471,763 | | | | US$13.39 | | | | 193,729 | | | | US$18.49 | |
Granted | | | 408,190 | | | | US$8.70 | | | | 794,691 | | | | US$11.94 | |
Forfeited/cancelled | | | (46,802 | ) | | | US$10.39 | | | | (7,733 | ) | | | US$19.13 | |
Vested | | | (401,965 | ) | | | US$12.81 | | | | (508,924 | ) | | | US$12.98 | |
Non-vested balance at 30 June | | | 431,186 | | | | US$9.80 | | | | 471,763 | | | | US$13.39 | |
| (c) | Transition Incentive Share Plan related to the Metal Management merger |
In accordance with the terms and conditions of the merger agreement with Metal Management Inc., the Sims Group Limited Transition Incentive Plan (“SGLTIP”) was established. The SGLTIP assumed the rights and obligations of Metal Management under its former plan (“MMI Plan”). No additional grants can be made under the SGLTIP.
The options assumed were held by the former directors of Metal Management Inc. who became directors of the Company on the merger date. Each outstanding share option under the MMI Plan was converted into 2.05 options of the Company. Each option represents the right to acquire one ADS. In addition, the exercise price of each outstanding option under the MMI Plan was converted at the same exchange ratio. All the options assumed were fully vested and therefore the fair value was recorded as a component of the purchase price for Metal Management Inc.
The following table sets out details of outstanding options under the SGLTIP:
| | | | | | | | | | | | | | | | |
| | | NUMBER OF
OPTIONS
2013 | | | WEIGHTED
AVERAGE
EXERCISE
PRICE US $
2013 | | | NUMBER OF
OPTIONS
2012 | | | WEIGHTED
AVERAGE
EXERCISE
PRICE US $
2012 | |
Balance at 1 July | | | 492,000 | | | | $13.89 | | | | 615,000 | | | | $15.62 | |
Exercised | | | – | | | | – | | | | – | | | | – | |
Forfeited/cancelled | | | – | | | | – | | | | (123,000 | ) | | | $22.55 | |
Balance at 30 June | | | 492,000 | | | | $13.89 | | | | 492,000 | | | | $13.89 | |
Exercisable at 30 June | | | 492,000 | | | | $13.89 | | | | 492,000 | | | | $13.89 | |
The weighted average contractual life of options outstanding as at 30 June 2013 was 0.56 years (2012: 1.56 years).
Note 26 – Key management personnel disclosures
Key management personnel are those persons defined as having authority and responsibility for planning, directing and controlling the activities of the Group, either directly or indirectly, including any Director (Executive or Non-Executive). Please refer to the Directors’ Report for information regarding each key management person.
| (a) | Key management personnel compensation |
| | | | | | | | |
| | | 2013 A$ | | | 2012 A$ | |
Short-term benefits | | | 7,272,267 | | | | 8,940,445 | |
Long-term benefits | | | 78,512 | | | | 29,120 | |
Post-employment benefits | | | 280,412 | | | | 358,693 | |
Share-based payments | | | 8,197,495 | | | | 7,505,311 | |
| | | | 15,828,686 | | | | 16,833,569 | |
The Group has taken advantage of the relief provided by ASIC Class Order 06/50 and has transferred the detailed remuneration disclosures to the Remuneration Report, which is presented in the Directors’ Report.
F I N A N C I A L S T A T E M E N T S
NOTES TO THE CONSOLIDATED FINANCIAL STATEMENTSFOR THE YEAR ENDED 30
JUNE 2013
Note 26 – Key management personnel disclosures (continued)
| (b) | Equity instrument disclosures relating to key management personnel |
| (i) | Options provided as remuneration and shares issued on exercise of such options |
Details of options provided as remuneration and shares issued on the exercise of such options, together with terms and conditions of the options, can be found in the Remuneration Report.
The number of shares in the Company held during the financial year by each Director and other key management personnel, including their personally related parties, is set out below:
| | | | | | | | | | | | | | | | | | | | |
2013 NAME | | BALANCE AT
1 JULY 2012 | | | RECEIVED ON
EXERCISE OF
OPTIONS OR
RIGHTS | | | PURCHASES/
(SALES) | | | OTHER
CHANGES
DURING THE
YEAR | | | BALANCE AT
30 JUNE 2013 | |
Non-Executive Directors: | | | | | | | | | | | | | | | | | | | | |
N Bobins (ADS) | | | 54,600 | | | | – | | | | – | | | | – | | | | 54,600 | |
G Brunsdon | | | 4,057 | | | | – | | | | 18,000 | | | | – | | | | 22,057 | |
M Feeney1 | | | 32,789 | | | | – | | | | – | | | | (32,789) | | | | – | |
G Morris (ADS) | | | 15,000 | | | | – | | | | 5,000 | | | | – | | | | 20,000 | |
C Renwick | | | 3,144 | | | | – | | | | 10,000 | | | | – | | | | 13,144 | |
M Sukagawa2 | | | 3,000 | | | | – | | | | – | | | | (3,000) | | | | – | |
J Thompson (ADS) | | | 12,000 | | | | – | | | | – | | | | – | | | | 12,000 | |
P Varello (ADS)1 | | | 97,625 | | | | – | | | | 11,100 | | | | (108,725) | | | | – | |
Executive Director: | | | | | | | | | | | | | | | | | | | | |
D Dienst (ADS)3 | | | 592,593 | | | | – | | | | (70,300) | | | | (522,293) | | | | – | |
Senior Executives: | | | | | | | | | | | | | | | | | | | | |
G Davy4 | | | 70,039 | | | | – | | | | – | | | | (70,039) | | | | – | |
R Kelman (ADS) | | | – | | | | – | | | | – | | | | – | | | | – | |
R Larry (ADS) | | | 58,067 | | | | 5,261 | | | | (1,719) | | | | – | | | | 61,609 | |
D McGree | | | 47,462 | | | | – | | | | – | | | | – | | | | 47,462 | |
| | | | | |
2012 NAME | | BALANCE AT
1 JULY 2011 | | | RECEIVED ON
EXERCISE OF
OPTIONS OR
RIGHTS | | | PURCHASES/
(SALES) | | | OTHER
CHANGES
DURING THE
YEAR | | | BALANCE AT
30 JUNE 2012 | |
Non-Executive Directors: | | | | | | | | | | | | | | | | | | | | |
N Bobins (ADS) | | | 54,600 | | | | – | | | | – | | | | – | | | | 54,600 | |
G Brunsdon5 | | | 3,952 | | | | – | | | | – | | | | 105 | | | | 4,057 | |
M Feeney1 | | | 27,789 | | | | – | | | | 5,000 | | | | – | | | | 32,789 | |
G Morris (ADS) | | | 30,000 | | | | – | | | | (15,000) | | | | – | | | | 15,000 | |
C Renwick | | | 3,144 | | | | – | | | | – | | | | – | | | | 3,144 | |
M Sukagawa2 | | | – | | | | – | | | | 3,000 | | | | – | | | | 3,000 | |
J Thompson (ADS) | | | 5,000 | | | | – | | | | 7,000 | | | | – | | | | 12,000 | |
P Varello (ADS)1 | | | 74,925 | | | | – | | | | 22,700 | | | | – | | | | 97,625 | |
Executive Director: | | | | | | | | | | | | | | | | | | | | |
D Dienst (ADS)3 | | | 597,293 | | | | 181,654 | | | | (181,654) | | | | (4,700) | | | | 592,593 | |
Senior Executives: | | | | | | | | | | | | | | | | | | | | |
G Davy4 | | | 67,170 | | | | 2,869 | | | | – | | | | – | | | | 70,039 | |
R Kelman (ADS) | | | – | | | | – | | | | – | | | | – | | | | – | |
R Larry (ADS) | | | 54,477 | | | | 5,261 | | | | (1,671) | | | | – | | | | 58,067 | |
D McGree | | | 47,462 | | | | – | | | | – | | | | – | | | | 47,462 | |
A Ratner6 | | | 75,718 | | | | – | | | | – | | | | – | | | | 75,718 | |
| 1 | Mr Varello and Mr Feeney retired from the Board of Directors on 15 November 2012. |
| 2 | Mr Sukagawa retired from the Board of Directors on 31 March 2013. |
| 3 | Mr Dienst retired from the Board of Directors and the Company on 30 June 2013. Other changes in 2012 for Mr Dienst represent a charitable gift. |
| 4 | Mr Davy left the Company on 19 March 2013. |
| 5 | Other changes for Mr Brunsdon represent shares issued under the dividend reinvestment plan. |
| 6 | Mr Ratner ceased being a KMP on 1 February 2012. |
The number of options over ordinary shares or ADSs in the Company held during the financial year by each Director and other key management personnel, including their personally related parties, are set out below:
| | | | | | | | | | | | | | | | | | | | | | | | | | | | |
2013 NAME | | BALANCE AT
1 JULY 2012 | | | GRANTED | | | EXERCISED | | | FORFEITED | | | BALANCE AT
30 JUNE 2013 | | | VESTED | | | UNVESTED | |
Non-Executive | | | | | | | | | | | | | | | | | | | | | | | | | | | | |
Directors: | | | | | | | | | | | | | | | | | | | | | | | | | | | | |
G Morris (ADS) | | | 82,000 | | | | – | | | | – | | | | – | | | | 82,000 | | | | 82,000 | | | | – | |
Executive Director: | | | | | | | | | | | | | | | | | | | | | | | | | | | | |
D Dienst (ADS)1 | | | 1,075,640 | | | | 487,814 | | | | – | | | | – | | | | 1,563,454 | | | | 818,541 | | | | 744,913 | |
Senior Executives: | | | | | | | | | | | | | | | | | | | | | | | | | | | | |
G Davy2 | | | 199,927 | | | | – | | | | – | | | | (199,927 | ) | | | – | | | | – | | | | – | |
R Kelman (ADS) | | | 196,036 | | | | 157,886 | | | | – | | | | – | | | | 353,922 | | | | 131,761 | | | | 222,161 | |
R Larry (ADS) | | | 318,098 | | | | 149,175 | | | | – | | | | – | | | | 467,273 | | | | 237,755 | | | | 229,518 | |
D McGree3 | | | 238,264 | | | | 146,268 | | | | – | | | | – | | | | 384,532 | | | | 161,237 | | | | 223,295 | |
| | | | | | | |
2012 NAME | | BALANCE AT
1 JULY 2011 | | | GRANTED | | | EXERCISED | | | FORFEITED | | | BALANCE AT
30 JUNE 2012 | | | VESTED | | | UNVESTED | |
Non-Executive | | | | | | | | | | | | | | | | | | | | | | | | | | | | |
Directors: | | | | | | | | | | | | | | | | | | | | | | | | | | | | |
R Lewon (ADS)4 | | | 61,500 | | | | – | | | | – | | | | (61,500 | ) | | | – | | | | – | | | | – | |
G Morris (ADS) | | | 143,500 | | | | – | | | | – | | | | (61,500 | ) | | | 82,000 | | | | 82,000 | | | | – | |
Executive Director: | | | | | | | | | | | | | | | | | | | | | | | | | | | | |
D Dienst (ADS)1 | | | 973,599 | | | | 283,695 | | | | (181,654 | ) | | | – | | | | 1,075,640 | | | | 596,660 | | | | 478,980 | |
Senior Executives: | | | | | | | | | | | | | | | | | | | | | | | | | | | | |
G Davy2 | | | 128,653 | | | | 71,274 | | | | – | | | | – | | | | 199,927 | | | | 87,928 | | | | 111,999 | |
R Kelman (ADS) | | | 125,112 | | | | 70,924 | | | | – | | | | – | | | | 196,036 | | | | 76,156 | | | | 119,880 | |
R Larry (ADS) | | | 229,443 | | | | 88,655 | | | | – | | | | – | | | | 318,098 | | | | 168,248 | | | | 149,850 | |
D McGree3 | | | 151,004 | | | | 87,260 | | | | – | | | | – | | | | 238,264 | | | | 97,660 | | | | 140,604 | |
A Ratner (ADS)5 | | | 183,555 | | | | 70,924 | | | | – | | | | – | | | | 254,479 | | | | 134,599 | | | | 119,880 | |
| 1 | Mr Dienst retired from the Board of Directors and the Company on 30 June 2013. |
| 2 | Mr Davy left the Company on 19 March 2013. |
| 3 | Options granted to Mr McGree in the 2012 and 2013 financial years are phantom options, which are cash-settled. |
| 4 | Mr Lewon retired from the Board of Directors on 10 November 2011. |
| 5 | Mr Ratner ceased being a KMP on 1 February 2012. |
| (iv) | Rights and award holdings |
The number of rights to ordinary shares or ADSs in the Company held during the financial year by each Executive Director and other key management personnel, including their personally related parties, are set out below:
| | | | | | | | | | | | | | | | | | | | |
2013 NAME | | BALANCE AT
1 JULY 2012 | | | GRANTED | | | VESTED | | | FORFEITED | | | BALANCE AT
30 JUNE 2013 | |
Executive Director: | | | | | | | | | | | | | | | | | | | | |
D Dienst (ADS)1 | | | 862,879 | | | | 511,883 | | | | – | | | | (258,098 | ) | | | 1,116,664 | |
Senior Executives: | | | | | | | | | | | | | | | | | | | | |
G Davy2 | | | 121,760 | | | | – | | | | – | | | | (121,760 | ) | | | – | |
R Kelman (ADS) | | | 158,091 | | | | 82,838 | | | | – | | | | (18,382 | ) | | | 222,547 | |
R Larry (ADS) | | | 179,897 | | | | 78,268 | | | | (5,261 | ) | | | – | | | | 252,904 | |
D McGree | | | 112,478 | | | | 54,589 | | | | – | | | | (15,742 | ) | | | 151,325 | |
F I N A N C I A L S T A T E M E N T S
NOTES TO THE CONSOLIDATED FINANCIAL STATEMENTSFOR THE YEAR ENDED 30 JUNE 2013
Note 26 – Key management personnel disclosures (continued)
| (b) | Equity instrument disclosures relating to key management personnel (continued) |
| (iv) | Rights and award holdings (continued) |
| | | | | | | | | | | | | | | | | | | | |
2012 NAME | | BALANCE AT
1 JULY 2011 | | | GRANTED | | | VESTED | | | FORFEITED | | | BALANCE AT
30 JUNE 2012 | |
Executive Director: | | | | | | | | | | | | | | | | | | | | |
D Dienst (ADS)1 | | | 529,963 | | | | 332,916 | | | | – | | | | – | | | | 862,879 | |
Senior Executives: | | | | | | | | | | | | | | | | | | | | |
G Davy2 | | | 95,896 | | | | 28,733 | | | | (2,869 | ) | | | – | | | | 121,760 | |
R Kelman (ADS) | | | 116,476 | | | | 41,615 | | | | – | | | | – | | | | 158,091 | |
R Larry (ADS) | | | 133,140 | | | | 52,018 | | | | (5,261 | ) | | | – | | | | 179,897 | |
D McGree | | | 77,300 | | | | 35,178 | | | | – | | | | – | | | | 112,478 | |
A Ratner (ADS)3 | | | 98,094 | | | | 41,615 | | | | – | | | | – | | | | 139,709 | |
| 1 | Mr Dienst retired from the Board of Directors and the Company on 30 June 2013. |
| 2 | Mr Davy left the Company on 19 March 2013. |
| 3 | Mr Ratner was no longer a KMP as of 31 January 2012. |
| (c) | Other transactions with key management personnel |
Transactions entered into with any Directors or other key management personnel of the Group, including their personally related parties, are at normal commercial terms.
On 1 July 2013, the Company and Mr Dienst entered into a one-year consulting contract. The details of the consulting contract are provided in the Remuneration Report.
During the year ended 30 June 2012, a company related to Mr Varello was paid US$13,432 for administrative services. No payments were made during the year ended 30 June 2013.
Mr Sukagawa served as and Mr Sato serves as the representative director for Mitsui & Co. As a result, their respective director remuneration is paid directly to Mitsui & Co. During the year ended 30 June 2013, the Group paid A$203,424 to Mitsui & Co. for director remuneration (2012: A$203,424).
During the year ended 30 June 2012, Mr Lewon was paid US$50,000 for providing services with respect to certain business development activities in North America. No payments were made during the year ended 30 June 2013
Note 27 – Remuneration of auditors
It is the Group’s policy to employ PricewaterhouseCoopers on assignments additional to their statutory audit duties where PricewaterhouseCoopers’ expertise and experience with the Group are important. These assignments are principally for tax advice and due diligence on acquisitions, or where PricewaterhouseCoopers is awarded assignments on a competitive basis. All audit and non-audit services provided by PricewaterhouseCoopers are subject to pre-approval by the RAC of the Board in accordance with the Group Independence Policy.
The following fees were paid and payable for services provided by the auditor of the Group and its related practices:
| | | | | | | | |
| | | 2013
A$’000 | | | 2012
A$’000 | |
PricewaterhouseCoopers Australia: | | | | | | | | |
Audit and review of financial statements | | | 1,980 | | | | 2,116 | |
Audit-related fees1 | | | 115 | | | | 170 | |
Taxation services | | | 6 | | | | 21 | |
| | | | 2,101 | | | | 2,307 | |
| | |
Network firms of PricewaterhouseCoopers Australia: | | | | | | | | |
Audit and review of financial statements | | | 3,024 | | | | 3,034 | |
Audit-related fees1 | | | 385 | | | | – | |
Taxation services | | | 26 | | | | 5 | |
Other | | | – | | | | 2 | |
| | | | 3,435 | | | | 3,041 | |
Total remuneration for PricewaterhouseCoopers | | | 5,536 | | | | 5,348 | |
| 1 | Audit-related fees include fees related to the restatement of the Group’s financial statements, due diligence related to acquisitions, internal control reviews, accounting consultations and regulatory related matters. |
Note 28 – Business acquisitions and disposals
During the year ended 30 June 2013, the Group acquired five businesses. None of the acquisitions were significant in terms of purchase price. On a combined basis, had the acquisitions all occurred on 1 July 2012, there would not have been a significant change to the Group’s revenue and net profit. Additionally, revenue and net profit contribution by the businesses acquired to the Group post-acquisition was not significant.
| (a) | Purchase consideration and assets and liabilities acquired |
Details of the aggregate purchase consideration and cash outflow are as follows:
| | | | |
| | | A$M | |
Cash paid for current year acquisitions | | | 28.2 | |
Cash acquired | | | (0.1 | ) |
Cash outflow for acquisitions | | | 28.1 | |
Assets and liabilities arising from current year acquisitions are as follows:
| | | | |
| | | FAIR VALUE
A$M | |
Cash | | | 0.1 | |
Trade and other receivables | | | 1.2 | |
Inventories | | | 0.1 | |
Property, plant and equipment (Note 13) | | | 7.1 | |
Identified intangible assets (Note 15) | | | 6.3 | |
Trade and other payables | | | (0.4 | ) |
Deferred tax liability | | | (0.2 | ) |
Net assets acquired | | | 14.2 | |
Goodwill recognised from current year acquisitions are as follows:
| | | | |
| | | A$M | |
Total cash consideration | | | 28.2 | |
Less: net assets acquired | | | (14.2 | ) |
Goodwill on acquisition | | | 14.0 | |
The initial accounting for some of the current year acquisitions has only been provisionally determined. The goodwill is attributable to several factors including, site locations, synergies existing in the operations acquired and the assembled workforce, which together contribute to the profitability of the acquired businesses. Some of the goodwill recognised is expected to be deductible for income tax purposes.
On 30 November 2012, the Group sold its Arizona scrap metal recycling assets to SA Recycling LLC, which is one of the Group’s joint ventures. In addition, in October 2012, the Group sold its Colorado scrap metal recycling assets to a third party. The net loss on the disposal of these assets (included within other expenses) was A$10.1 million and was calculated as follows:
| | | | | | | | |
| | | | | | A$M | |
Cash consideration received | | | | | | | 44.9 | |
Net carrying value of disposed assets: | | | | | | | | |
Inventories | | | (2.4 | ) | | | | |
Property, plant and equipment | | | (32.8 | ) | | | | |
Goodwill | | | (9.9 | ) | | | | |
Other intangibles | | | (9.9 | ) | | | | |
| | | | | | | | (55.0 | ) |
| | | | | | | | (10.1 | ) |
F I N A N C I A L S T A T E M E N T S
NOTES TO THE CONSOLIDATED FINANCIAL STATEMENTSFOR THE YEAR ENDED 30 JUNE 2013
Note 28 – Business acquisitions and disposals (continued)
In February 2012, the Group sold its 50% ownership interest in the secondary lead producing facility in Sydney, Australia of Australian Refined Alloys (“ARA”) to companies associated with Renewed Metal Technologies for total sales proceeds of A$40.0 million. The disposal transaction was an asset sale only comprising the sale of land, buildings, and plant and equipment. The gain on the disposal of the assets recorded in other income in the year ended 30 June 2012 was calculated as follows:
| | | | | | | | |
| | | | | | A$M | |
Consideration received | | | | | | | 40.0 | |
Net carrying value of disposed assets: | | | | | | | | |
Land and buildings | | | (2.4 | ) | | | | |
Plant and equipment | | | (1.3 | ) | | | | |
Capital work-in-progress | | | (0.2 | ) | | | | |
| | | | | | | (3.9 | ) |
Disposal costs | | | | | | | (0.4 | ) |
| | | | | | | | 35.7 | |
In the year ended 30 June 2013, additional assets related to the Group’s 50% ownership interest ARA were sold resulting in a loss on disposal of A$1.3 million. This amount has been recorded in other expenses.
Note 29 – Subsidiaries
The consolidated financial statements incorporate the assets, liabilities and results of the following subsidiaries in accordance with the accounting policy described in Note 1.
| | | | | | | | | | |
| | | | | EQUITY HOLDING % | |
| NAME OF ENTITY | | COUNTRY OF INCORPORATION | | 2013 | | | 2012 | |
Sims Metal Management Limited | | Australia | | | | | | | | |
Sims Group Australia Holdings Limited (i) | | Australia | | | 100% | | | | 100% | |
Sims Aluminium Pty Limited (i) | | Australia | | | 100% | | | | 100% | |
Sims E-Recycling Pty Limited | | Australia | | | 90% | | | | 90% | |
Simsmetal Holdings Pty Limited | | Australia | | | 100% | | | | 100% | |
Simsmetal Properties Qld Pty Limited | | Australia | | | 100% | | | | 100% | |
Sims Industrial Pty Limited | | Australia | | | 100% | | | | 100% | |
Simsmetal Services Pty Limited (i) | | Australia | | | 100% | | | | 100% | |
Simsmetal Properties NSW Pty Limited | | Australia | | | 100% | | | | 100% | |
Sims Group Holdings 3 Pty Limited | | Australia | | | 100% | | | | 100% | |
Universal Inspection and Testing Company Pty Limited | | Australia | | | 100% | | | | 100% | |
Sims Group Holdings 1 Pty Ltd | | Australia | | | 100% | | | | 100% | |
Sims Group Holdings 2 Pty Ltd | | Australia | | | 100% | | | | 100% | |
Electronic Product Stewardship Australasia Pty Limited | | Australia | | | 90% | | | | 90% | |
Sims Recycling Solutions Austrian Holding GmbH | | Austria | | | 100% | | | | 100% | |
Sims Recycling Solutions Austrian Intermediate Holdings GmbH | | Austria | | | 100% | | | | 100% | |
(formerly Sims Recycling Solutions Anteilsverwaltung Austria GmbH) | | | | | | | | | | |
Sims metrade GmbH | | Austria | | | 100% | | | | 100% | |
Sims Recycling Solutions NV | | Belgium | | | 100% | | | | 100% | |
Sims Group Recycling Solutions Canada Ltd | | Canada | | | 100% | | | | 100% | |
Sims Group Canada Holdings Limited | | Canada | | | 100% | | | | 100% | |
ErgoTrade d.o.o. | | Croatia | | | 100% | | | | 100% | |
Sims Lifecycle Services s.r.o. | | Czech Republic | | | 100% | | | | 100% | |
Sims Recycling Solutions FZE | | Dubai | | | 100% | | | | 100% | |
Sims Recycling Solutions SARL (ii) | | France | | | 0% | | | | 100% | |
Sims Group German Holdings GmbH | | Germany | | | 100% | | | | 100% | |
Sims M+R GmbH | | Germany | | | 100% | | | | 100% | |
Sims Lifecycle Services GmbH | | Germany | | | 100% | | | | 100% | |
Sims Metal Management Asia Limited | | Hong Kong | | | 100% | | | | 100% | |
Sims Metal Management China Holdings Limited | | Hong Kong | | | 100% | | | | 100% | |
Sims Metal Management Dragon Holdings Limited | | Hong Kong | | | 100% | | | | 100% | |
Sims Lifecycle Services Kft. | | Hungary | | | 100% | | | | 100% | |
Trishyiraya Recycling India Private Limited | | India | | | 100% | | | | 100% | |
| | | | | | | | | | |
| | | | | EQUITY HOLDING % | |
| NAME OF ENTITY | | COUNTRY OF INCORPORATION | | 2013 | | | 2012 | |
Sims Recycling Solutions India Private Limited | | India | | | 100% | | | | 100% | |
Sims Group Mauritius Limited | | Mauritius | | | 100% | | | | 100% | |
Mirec BV | | Netherlands | | | 100% | | | | 100% | |
Sims Recycling Solutions Coöperatief B.A. | | Netherlands | | | 100% | | | | 100% | |
Sims Lifecycle Services BV | | Netherlands | | | 100% | | | | 100% | |
Sims E – Recycling (NZ) Limited | | New Zealand | | | 90% | | | | 90% | |
Simsmetal Industries Limited | | New Zealand | | | 100% | | | | 100% | |
PNG Recycling Limited | | Papua New Guinea | | | 100% | | | | 100% | |
Gaukara Company No. 2 Limited | | Papua New Guinea | | | 100% | | | | 100% | |
Sims Lifecycle Service Sp z.o.o. (formerly Sims Recycling Solutions Sp z.o.o.) | | Poland | | | 100% | | | | 100% | |
Sims Recycling Solutions Africa Pty Ltd | | Republic of South Africa | | | 100% | | | | 100% | |
Sims Recycling Solutions Pte. Ltd. | | Singapore | | | 100% | | | | 100% | |
Sims Recycling Solutions AB | | Sweden | | | 100% | | | | 100% | |
Sims Group UK Holdings Limited | | UK | | | 100% | | | | 100% | |
Sims Group UK Intermediate Holdings Limited | | UK | | | 100% | | | | 100% | |
Sims Group UK Limited | | UK | | | 100% | | | | 100% | |
C Herring & Son Limited | | UK | | | 100% | | | | 100% | |
Life Cycle Services Limited | | UK | | | 100% | | | | 100% | |
All Metal Recovery Limited | | UK | | | 100% | | | | 100% | |
All Metal Recovery Cradley Heath Limited | | UK | | | 100% | | | | 100% | |
ER Coley (Steel) Limited | | UK | | | 100% | | | | 100% | |
ER Coley (Cast) Limited | | UK | | | 100% | | | | 100% | |
Evans & Mondon Limited | | UK | | | 100% | | | | 100% | |
Sims Recycling Solutions UK Holdings Limited | | UK | | | 100% | | | | 100% | |
Sims Recycling Solutions UK Group Limited | | UK | | | 100% | | | | 100% | |
Sims Recycling Solutions UK Limited | | UK | | | 100% | | | | 100% | |
United Castings Limited | | UK | | | 100% | | | | 100% | |
Sims Group UK Pension Trustees Limited | | UK | | | 100% | | | | 100% | |
Recommit Limited | | UK | | | 100% | | | | 100% | |
Sims Cymru Limited (ii) | | UK | | | 0% | | | | 100% | |
Cooper Metal Recycling Ltd | | UK | | | 100% | | | | 100% | |
Dunn Brothers (1995) Limited | | UK | | | 100% | | | | 100% | |
Cheque Swap Limited (formerly Brook Street Metal Co. Limited) | | UK | | | 100% | | | | 100% | |
Deane Wood Export Limited | | UK | | | 100% | | | | 100% | |
S3 Interactive Limited | | UK | | | 100% | | | | 100% | |
Sims FE Mottram Limited | | UK | | | 100% | | | | 100% | |
Sims Recycling Solutions Inc. | | USA | | | 100% | | | | 100% | |
Sims Recycling Solutions Holdings Inc. | | USA | | | 100% | | | | 100% | |
Sims Metal Management USA GP | | USA | | | 100% | | | | 100% | |
Sims Group USA Holdings Corporation | | USA | | | 100% | | | | 100% | |
Dover Barge Company | | USA | | | 100% | | | | 100% | |
Simsmetal East LLC | | USA | | | 100% | | | | 100% | |
Sims Municipal Recycling of New York LLC | | USA | | | 100% | | | | 100% | |
Schiabo Larovo Corporation | | USA | | | 100% | | | | 100% | |
Simsmetal West LLC | | USA | | | 100% | | | | 100% | |
Sims Group Global Trade Corporation | | USA | | | 100% | | | | 100% | |
Sims Group USA Corporation | | USA | | | 100% | | | | 100% | |
Metal Management, Inc. | | USA | | | 100% | | | | 100% | |
Metal Dynamics Detroit LLC | | USA | | | 100% | | | | 100% | |
SMM Gulf Coast LLC | | USA | | | 100% | | | | 100% | |
Metal Management Midwest, Inc. | | USA | | | 100% | | | | 100% | |
CIM Trucking, Inc. | | USA | | | 100% | | | | 100% | |
Metal Management Indiana, Inc. | | USA | | | 100% | | | | 100% | |
Metal Management Memphis, L.L.C. | | USA | | | 100% | | | | 100% | |
Metal Management Ohio, Inc. | | USA | | | 100% | | | | 100% | |
SMM – North America Trade Corporation | | USA | | | 100% | | | | 100% | |
Metal Management Pittsburgh, Inc. | | USA | | | 100% | | | | 100% | |
Metal Management Aerospace, Inc. | | USA | | | 100% | | | | 100% | |
F I N A N C I A L S T A T E M E N T S
NOTES TO THE CONSOLIDATED FINANCIAL STATEMENTSFOR THE YEAR ENDED 30 JUNE 2013
Note 29 – Subsidiaries (continued)
| | | | | | | | | | |
| | | | | EQUITY HOLDING % | |
| NAME OF ENTITY | | COUNTRY OF INCORPORATION | | 2013 | | | 2012 | |
Metal Management Arizona, L.L.C. | | USA | | | 100% | | | | 100% | |
Proler Southwest Corporation | | USA | | | 100% | | | | 100% | |
SMM South Corporation | | USA | | | 100% | | | | 100% | |
Naporano Iron & Metal, Inc. | | USA | | | 100% | | | | 100% | |
Metal Management Northeast, Inc. | | USA | | | 100% | | | | 100% | |
SMM New England Corporation | | USA | | | 100% | | | | 100% | |
New York Recycling Ventures, Inc. | | USA | | | 100% | | | | 100% | |
Reserve Iron & Metal Limited Partnership | | USA | | | 100% | | | | 100% | |
Port Albany Ventures, LLC | | USA | | | 100% | | | | 100% | |
SMM Southeast LLC | | USA | | | 100% | | | | 100% | |
| (i) | These subsidiaries and the Company are parties to a DCG under which each entity guarantees the debts of the others. The above entities represent a Closed Group and an Extended Closed Group for the purposes of the relevant Australian Securities and Investments Commission Class Order. |
| (ii) | These subsidiaries were deregistered during the year. |
The voting power held in each subsidiary is proportionate to the equity holdings.
Deed of Cross Guarantee
Sims Metal Management Limited, Sims Group Australia Holdings Limited, Sims Aluminium Pty Limited and Simsmetal Services Pty Limited are parties to a DCG under which each Group guarantees the debts of the others. By entering into the DCG, the wholly owned entities have been relieved from the requirements to prepare a financial report and directors report under Class Order 98/1418 (as amended) issued by ASIC.
The above companies represent a “Closed Group” for the purposes of the Class Order. As there are no other parties to the DCG that are controlled by Sims Metal Management Limited, they also represent the “Extended Closed Group”.
Set out below is a condensed consolidated income statement, a consolidated statement of comprehensive income, a summary of movements in consolidated retained earnings/(deficit) and a consolidated statement of financial position for the Closed Group.
| (i) | Condensed consolidated income statement |
| | | | | | | | |
| | | 2013
A$M | | | 2012 A$M RESTATED | |
(Loss)/profit before income tax1 | | | (184.4 | ) | | | (633.7 | ) |
Income tax expense | | | (14.0 | ) | | | (15.3 | ) |
(Loss)/profit after tax | | | (198.4 | ) | | | (649.0 | ) |
|
1 Amount includes a non-cash impairment charge of A$240.2 million for 2013 and A$719.3 million for 2012 after tax against the parent entity’s investment in subsidiaries which are not part of the Closed Group. | |
(ii) Consolidated statement of comprehensive income | | | | | | | | |
(Loss)/profit after tax | | | (198.4 | ) | | | (649.0 | ) |
Other comprehensive income: | | | | | | | | |
Items that may be reclassified to profit or loss | | | | | | | | |
Changes in the fair value of derivatives held as cash flow hedges, net of tax | | | (3.4 | ) | | | 0.4 | |
Share of other comprehensive income from associates | | | (0.3 | ) | | | (0.1 | ) |
| | |
Items that will not be reclassified to profit or loss | | | | | | | | |
Actuarial gain/(loss) on defined benefit plans, net of tax | | | 2.5 | | | | (4.0 | ) |
| | |
Other comprehensive income for the year, net of tax | | | (1.2 | ) | | | (3.7 | ) |
Total comprehensive loss for the year | | | (199.6 | ) | | | (652.7 | ) |
| | |
(iii) Summary of movements in consolidated retained earnings/(deficit) | | | | | | | | |
Balance at 1 July | | | (623.2 | ) | | | 122.5 | |
Loss for the year | | | (198.4 | ) | | | (649.0 | ) |
Actuarial gain/(loss) on defined benefit plans, net of tax | | | 2.5 | | | | (4.0 | ) |
Dividends provided for or paid | | | (20.4 | ) | | | (92.7 | ) |
Balance at 30 June | | | (839.5 | ) | | | (623.2 | ) |
| | | | | | | | |
| | | 2013 A$M | | | 2012 A$M
RESTATED | |
(iv) Consolidated statement of financial position | | | | | | | | |
ASSETS | | | | | | | | |
Current assets | | | | | | | | |
Cash and cash equivalents | | | 3.6 | | | | 1.9 | |
Trade and other receivables | | | 339.1 | | | | 651.0 | |
Inventory | | | 114.0 | | | | 147.0 | |
Other financial assets | | | 1.3 | | | | 3.2 | |
Total current assets | | | 458.0 | | | | 803.1 | |
| | |
Non-current assets | | | | | | | | |
Investments accounted for using the equity method | | | 23.5 | | | | 22.6 | |
Other financial assets | | | 1,552.5 | | | | 1,794.6 | |
Property, plant and equipment | | | 160.7 | | | | 134.8 | |
Retirement benefit assets | | | 0.4 | | | | – | |
Deferred tax assets | | | 20.4 | | | | 29.0 | |
Goodwill | | | 40.4 | | | | 35.6 | |
Other intangible assets | | | 2.6 | | | | 2.9 | |
Total non-current assets | | | 1,800.5 | | | | 2,019.5 | |
Total assets | | | 2,258.5 | | | | 2,822.6 | |
| | |
LIABILITIES | | | | | | | | |
Current liabilities | | | | | | | | |
Trade and other payables | | | 151.0 | | | | 480.3 | |
Borrowings | | | – | | | | 13.5 | |
Other financial liabilities | | | 4.0 | | | | 0.1 | |
Current tax liabilities | | | 3.8 | | | | 5.8 | |
Provisions | | | 15.4 | | | | 17.3 | |
Total current liabilities | | | 174.2 | | | | 517.0 | |
| | |
Non-current liabilities | | | | | | | | |
Payables | | | 1.4 | | | | 1.0 | |
Borrowings | | | 7.7 | | | | 10.5 | |
Deferred tax liabilities | | | 6.7 | | | | 9.5 | |
Provisions | | | 1.7 | | | | 1.6 | |
Retirement benefit obligations | | | – | | | | 4.6 | |
Total non-current liabilities | | | 17.5 | | | | 27.2 | |
Total liabilities | | | 191.7 | | | | 544.2 | |
| | |
Net assets | | | 2,066.8 | | | | 2,278.4 | |
| | |
EQUITY | | | | | | | | |
Contributed equity | | | 2,795.7 | | | | 2,804.3 | |
Reserves | | | 110.6 | | | | 97.3 | |
Retained deficit | | | (839.5 | ) | | | (623.2 | ) |
Total equity | | | 2,066.8 | | | | 2,278.4 | |
F I N A N C I A L S T A T E M E N T S
NOTES TO THE CONSOLIDATED FINANCIAL STATEMENTSFOR THE YEAR ENDED 30 JUNE 2013
Note 30 – Investments in associates and jointly controlled entities
| (a) | Names of associates and jointly controlled entities |
| | | | | | | | | | |
| | | | | OWNERSHIP INTEREST % | |
| | | |
| NAME | | COUNTRY OF INCORPORATION | | 2013 | | | 2012 | |
SA Recycling LLC | | USA | | | 50 | | | | 50 | |
Rondout Iron & Metal Company LLC | | USA | | | 50 | | | | 50 | |
Richmond Steel Recycling Limited | | Canada | | | 50 | | | | 50 | |
LMS Energy Pty Ltd (“LMS”) | | Australia | | | 50 | | | | 50 | |
Simstar Alloys Pty Limited | | Australia | | | 50 | | | | 50 | |
ITL Logistics GmbH | | Germany | | | 34 | | | | 34 | |
Chiho-Tiande Group Limited (“CTG”) | | Cayman Islands | | | 16 | | | | 16 | |
Metal Management Nashville, LLC | | USA | | | – | | | | 50 | |
|
Other than LMS, the principal activity of all other associates or jointly controlled entities is metal recycling. LMS is a specialist landfill gas and renewable energy company, which researches, installs and develops landfill gas extraction systems, renewable energy and power generation technologies. | |
|
(b) Movements in carrying amounts | |
| | | | | 2013 A$M | | | 2012 A$M | |
Balance at 1 July | | | | | 351.1 | | | | 310.3 | |
Disposals (c) | | | | | (7.6 | ) | | | – | |
Acquisitions (d) | | | | | – | | | | 93.5 | |
Share of results | | | | | (15.1 | ) | | | (10.3 | ) |
Impairment of investment in an associate (e) | | | | | (14.9 | ) | | | – | |
Share of other comprehensive income of associates | | | | | 0.6 | | | | (0.4 | ) |
Accretion of deferred gain to equity accounted profit | | | | | 2.3 | | | | 2.3 | |
Equity accounting elimination (Note 12) | | | | | (2.5 | ) | | | 2.5 | |
Dividends received | | | | | (12.3 | ) | | | (5.1 | ) |
Return of capital | | | | | – | | | | (0.3 | ) |
Impairment of goodwill in jointly controlled entity (e) | | | | | – | | | | (57.5 | ) |
Foreign exchange differences | | | | | 28.4 | | | | 16.1 | |
Balance at 30 June | | | | | 330.0 | | | | 351.1 | |
In October 2012, the Group disposed of its 50% ownership interest in its Metal Management Nashville, LLC joint venture for a loss of A$0.3 million.
On 17 January 2012, the Group acquired 16% of the existing shares of CTG, a Hong Kong listed metals and electronics recycler with operations in the People’s Republic of China and Hong Kong. The shares were acquired from founder Chairman Ankong Fang and Delco Participation B.V. (Delco), a Netherlands-based investment holding company, for total consideration of HK$750.1 million (A$93.1 million). The cost of the acquisition also includes transaction costs of A$0.4 million. In addition, Delco granted an option to the Group to acquire a further 2% of CTG (see Note 12).
The Group accounts for CTG as an associate, although the Group holds less than 20% equity interest. This is because the Group exercises significant influence through its nominated director’s active participation on CTG’s board of directors as well as a significant trading relationship with CTG.
On a regular basis, investments in associates and jointly controlled entities are tested for impairment if the Group believes events or changes in circumstances indicate that the carrying value amount may not be recoverable. An impairment loss is recognised for the amount by which the carrying amount of the investment exceeds its recoverable amount. The recoverable amount is the higher of an investment’s fair value less costs to sell and value-in-use.
As at 30 June 2013, the Group determined that its investment in CTG was impaired due to a significant decline in CTG’s quote share price and its recent significant net loss. As a result, the Group recognised an impairment charge of A$14.9 million to write-down its investment in CTG to its fair value. The fair value of the Group’s interest in CTG at 30 June 2013, which is listed on the Hong Kong Stock Exchange, was A$73.4 million (2012: A$86.0 million).
In the year ended 30 June 2012, SA Recycling LLC recognised an impairment on goodwill, of which the Group’s pre-tax share was A$57.5 million. This has been recognised in the income statement in the period. The impairment represents the portion of SA Recycling LLC’s goodwill attributable to the Group which was determined to be not recoverable based on the value in use of the business. Similar to the Group’s North America Metals CGU, SA Recycling LLC was impacted by economic conditions which have impacted its financial results and future forecasts.
| (f) | Summarised financial information of associates and jointly controlled entities |
| | | | | | | | |
| GROUP’S SHARE OF ASSETS AND LIABILITIES | | 2013 A$M | | | 2012 A$M | |
Current assets | | | 186.7 | | | | 207.4 | |
Non-current assets | | | 297.6 | | | | 269.2 | |
Total assets | | | 484.3 | | | | 476.6 | |
| | |
Current liabilities | | | 105.1 | | | | 95.8 | |
Non-current liabilities | | | 112.9 | | | | 102.9 | |
Total liabilities | | | 218.0 | | | | 198.7 | |
Net assets | | | 266.3 | | | | 277.9 | |
| | | | | | | | | | | | |
| GROUP’S SHARE OF REVENUE, EXPENSES AND RESULTS | | 2013 A$M | | | 2012 A$M | | | 2011 A$M | |
Revenues | | | 731.5 | | | | 837.9 | | | | 774.3 | |
Expenses | | | (745.5 | ) | | | (845.7 | ) | | | (747.2 | ) |
(Loss)/profit before income tax | | | (14.0 | ) | | | (7.8 | ) | | | 27.1 | |
Tax expense | | | (1.1 | ) | | | (2.5 | ) | | | (1.4 | ) |
(Loss)/profit for the year | | | (15.1 | ) | | | (10.3 | ) | | | 25.7 | |
| (g) | Contingent liabilities and capital commitments |
The Group’s share of the contingent liabilities of jointly controlled entities is disclosed in Note 23. The Group’s share of the capital commitments and other expenditure commitments of jointly controlled entities is disclosed in Note 24.
| (h) | Jointly controlled operations |
The Group accounts for its 50% interest in Sims Pacific Metals (“SPM”) joint venture under the proportionate consolidation method. SPM is an unincorporated joint venture based in New Zealand and its principal activity is metal recycling. The Group’s interest in SPM is included in the statement of financial position under the classifications shown below:
| | | | | | | | |
| | | 2013 A$M | | | 2012 A$M | |
Current assets | | | 15.9 | | | | 14.2 | |
Non-current assets | | | 8.4 | | | | 7.3 | |
Total assets | | | 24.3 | | | | 21.5 | |
| | |
Current liabilities | | | 18.6 | | | | 15.5 | |
Non-current liabilities | | | 0.2 | | | | 0.2 | |
Total liabilities | | | 18.8 | | | | 15.7 | |
Net assets | | | 5.5 | | | | 5.8 | |
The Group’s share of SPM’s contingent liabilities and capital expenditure commitments is included in Notes 23 and 24, respectively.
F I N A N C I A L S T A T E M E N T S
NOTES TO THE CONSOLIDATED FINANCIAL STATEMENTSFOR THE YEAR ENDED 30 JUNE 2013
Note 31 – Related party transactions
The Group’s related parties are its associates, jointly controlled entities, pension schemes and key management personnel. Group contributions to pension schemes are disclosed in Notes 8 and 19. Compensation paid to key management personnel are disclosed in Note 26.
Related party transactions with the Group’s associates and jointly controlled entities are as follows:
| | | | | | | | |
| | | 2013 A$M | | | 2012 A$M | |
Sales of goods and services | | | 107.1 | | | | 118.3 | |
Purchases of goods and services | | | 531.0 | | | | 890.9 | |
Management fees and commissions | | | 2.6 | | | | 3.1 | |
Interest income | | | 3.9 | | | | 1.2 | |
Transactions with CTG reported above for the year ended 30 June 2012 are only for the period from the date of investment through 30 June 2012.
Outstanding balances from the Group’s associates and jointly controlled entities are as follows:
| | | | | | | | |
| | | 2013 A$M | | | 2012 A$M | |
Current receivables | | | 4.4 | | | | 8.5 | |
Current payables | | | 25.0 | | | | 32.3 | |
Loans to associate | | | 38.9 | | | | 33.1 | |
Note 32 – Parent entity financial information
The Company was incorporated on 20 June 2005. Under the terms of a scheme of arrangement entered into between Sims Metal Management Limited (formerly known as Sims Group Limited from 20 June 2005 to 21 November 2008) and Sims Group Australia Holdings Limited (“SGAHL”) (formerly known as Sims Group Limited prior to 20 June 2005) on 31 October 2005, the shareholders in SGAHL exchanged their shares in that entity for the shares in Sims Metal Management Limited. As required by AASB 3 (IFRS 3), Business Combinations at the time, SGAHL was deemed to be the acquirer in this business combination. This transaction has therefore been accounted for as a reverse acquisition. Accordingly, the consolidated financial statements of Sims Metal Management Limited have been prepared as a continuation of the consolidated financial statements of SGAHL. SGAHL, as the deemed acquirer, has applied purchase accounting for its acquisition of Sims Metal Management Limited as at 31 October 2005.
| (a) | Summary financial information |
| | | | | | | | |
| | | 2013 A$M | | | 2012 A$M
RESTATED | |
Statement of financial position: | | | | | | | | |
Current assets | | | 59.1 | | | | 51.7 | |
Total assets | | | 2,585.2 | | | | 3,005.1 | |
| | |
Current liabilities | | | 62.3 | | | | 61.8 | |
Total liabilities | | | 63.7 | | | | 62.7 | |
| | |
Shareholders’ equity: | | | | | | | | |
Contributed equity | | | 4,116.3 | | | | 4,124.9 | |
Reserves | | | 112.8 | | | | 96.2 | |
Retained deficit | | | (1,707.6 | ) | | | (1,278.7 | ) |
Total equity | | | 2,521.5 | | | | 2,942.4 | |
| | |
Loss for the year1 | | | (408.4 | ) | | | (1,188.8 | ) |
Total comprehensive loss | | | (408.4 | ) | | | (1,188.8 | ) |
| 1 | The parent entity’s loss for the years ended 30 June 2013 and 2012 included a non-cash impairment charge of A$427.0 million and A$1,278.0 million, respectively, after tax against the parent entity’s investment in subsidiaries. In accordance with AASB 136 (IAS 36), the parent entity’s investment in subsidiary balance was compared to the higher of its value-in-use or fair market value less costs to sell, and the comparison identified an impairment in the carrying value of the parent entity’s investment in subsidiaries. This non-cash charge is reversed on consolidation and does not impact the consolidated financial statements of the Group. |
The Company has current liabilities greater than current assets. The current liabilities primarily represent intercompany balances between entities, which are a party to a DCG to which the Parent is also a party. Refer to Note 29.
| (b) | Guarantees entered into by the parent entity |
The Company has not provided financial guarantees for which a liability has been recognised in the Company’s statement of financial position.
The Company and certain of its subsidiaries have given guarantees in respect of the performance of contracts entered into in the ordinary course of business. The amount of these guarantees provided by the Company as at 30 June 2013 was A$46.1 million (2012: A$39.6 million).
On 31 March 2011, the Company provided a guarantee for its proportional share of a lease obligation of a jointly controlled entity of the Group. The Company’s proportional amount of the lease obligation remaining as at 30 June 2013 was A$14.8 million (2012: A$15.0 million).
The Company is party to a number of financing facilities and a Deed of Cross Guarantee under which it guarantees the debts of a number of its subsidiaries. Refer to Notes 17 and 29 for details.
| | | | | | | | |
| | | 2013 A$M | | | 2012 A$M | |
Not later than one year | | | 2.0 | | | | 1.8 | |
Later than one year, but not later than three years | | | 4.2 | | | | 3.7 | |
Later than three years, but not later than five years | | | 4.3 | | | | 3.9 | |
Later than five years | | | 40.7 | | | | 39.0 | |
Total lease commitments not recognised as liabilities | | | 51.2 | | | | 48.4 | |
Note 33 – Cash flow information
| (a) | Cash and cash equivalents |
Cash at the end of the financial year as shown in the consolidated statements of cash flows is reconciled to the related items in the consolidated statements of financial position as follows:
| | | | | | | | |
| | | 2013
A$M | | | 2012
A$M | |
Cash at bank and on hand | | | 46.9 | | | | 51.4 | |
Cash and cash equivalents | | | 46.9 | | | | 51.4 | |
F I N A N C I A L S T A T E M E N T S
NOTES TO THE CONSOLIDATED FINANCIAL STATEMENTSFOR THE YEAR ENDED 30 JUNE 2013
Note 33 – Cash flow information (continued)
| (b) | Reconciliation of (loss)/profit for the year to net cash inflows from operating activities |
| | | | | | | | | | | | |
| | | 2013
A$M | | | 2012 A$M RESTATED | | | 2011 A$M RESTATED | |
(Loss)/profit for the year | | | (466.1 | ) | | | (622.5 | ) | | | 187.3 | |
Depreciation and amortisation | | | 123.5 | | | | 129.9 | | | | 130.6 | |
Amortisation of deferred financing costs | | | 2.3 | | | | 2.0 | | | | 1.9 | |
Unrealised (gain)/loss on held for trading derivatives | | | (2.1 | ) | | | (1.2 | ) | | | (1.2 | ) |
Fair value loss on financial assets at fair value through profit or loss | | | 6.1 | | | | 2.0 | | | | – | |
Impairment of goodwill | | | 292.2 | | | | 617.3 | | | | – | |
Impairment of intangible assets | | | 12.2 | | | | 0.8 | | | | – | |
Impairment of property, plant and equipment | | | 61.2 | | | | 0.4 | | | | – | |
Impairment of investment in an associate | | | 14.9 | | | | – | | | | – | |
Impairment of goodwill in jointly controlled entity | | | – | | | | 57.5 | | | | – | |
Net loss/(gain) on disposal of property, plant and equipment | | | 0.6 | | | | (2.8 | ) | | | (1.3 | ) |
Loss/(gain) on sale of jointly controlled entities and assets | | | 0.3 | | | | (35.7 | ) | | | – | |
Loss on sale of business divisions | | | 10.1 | | | | – | | | | – | |
Share-based payments | | | 16.1 | | | | 24.3 | | | | 15.7 | |
Gain on sale of other financial assets | | | – | | | | – | | | | (11.0 | ) |
Non-cash pension expense | | | 0.4 | | | | 0.5 | | | | 1.0 | |
Imputed portion of interest income on convertible loan | | | (2.3 | ) | | | (0.7 | ) | | | – | |
Equity accounted results net of dividends received | | | 25.1 | | | | 13.1 | | | | (12.3 | ) |
Other | | | – | | | | – | | | | 0.8 | |
| Change in operating assets and liabilities, excluding the effects of acquisitions and disposals of entities: | | | | | | | | | | | | |
Decrease/(increase) in trade and other receivables | | | 67.5 | | | | 139.6 | | | | (91.9 | ) |
Decrease/(increase) in inventories | | | 266.7 | | | | 161.0 | | | | (316.1 | ) |
Decrease/(increase) in prepayments | | | 19.1 | | | | (22.1 | ) | | | (5.6 | ) |
Increase/(decrease) in provisions | | | 11.7 | | | | (15.8 | ) | | | 12.4 | |
(Decrease)/increase in income taxes | | | (3.5 | ) | | | (19.4 | ) | | | 10.2 | |
(Decrease) in deferred taxes | | | (27.6 | ) | | | (39.8 | ) | | | (22.4 | ) |
(Decrease)/increase in trade and other payables | | | (131.1 | ) | | | (98.8 | ) | | | 260.5 | |
| | | |
Net cash inflows from operating activities | | | 297.3 | | | | 289.6 | | | | 158.6 | |
| (c) | Non-cash investing and financing activities |
During the year ended 30 June 2012, dividends of A$23.4 million (2011: A$19.1 million) were paid via the issue of ordinary shares pursuant to the DRP. Refer to Note 22.
Note 34 – Assets/liabilities classified as held for sale
During the year ended 30 June 2013, the Group decided to sell certain assets in the United States within the North America Segment which were determined to be non-core. As of the filing date of this report, these assets have now been sold. Impairment losses relating to property, plant and equipment and intangible assets of A$18.4 million have been recognised with respect to assets held for sale.
| (a) | Assets classified as held for sale |
| | | | | | | | |
| | | 2013 A$M | | | 2012 A$M | |
Trade and other receivables | | | 16.1 | | | | – | |
Inventory | | | 25.3 | | | | – | |
Property, plant and equipment | | | 11.3 | | | | – | |
Prepayments | | | 0.4 | | | | – | |
| | | | 53.1 | | | | – | |
| (b) | Liabilities directly associated with assets classified as held for sale |
| | | | | | | | |
| | | 2013
A$M | | | 2012
A$M | |
Trade and other payables | | | 6.9 | | | | – | |
Provisions | | | 9.7 | | | | – | |
| | | | 16.6 | | | | – | |
Note 35 – Events occurring after the balance sheet date
On 30 June 2013, Daniel W Dienst retired as an Executive Director and Group CEO. Effective 1 July 2013, the Board created a Global Leadership Team to serve in lieu of the Group CEO while the search for a new CEO is accomplished. The Board continues to evaluate candidates for the role and has narrowed the field to external candidates. The Board expects to announce an appointment by the end of the first quarter of fiscal 2014.
F I N A N C I A L S T A T E M E N T S
DIRECTORS’ DECLARATION
In the Directors’ opinion:
| a) | The financial statements and notes set out on pages 57 to 119 are in accordance with theCorporations Act 2001, including: |
| | i) | complying with Accounting Standards, the Corporations Regulations 2001 and other mandatory professional reporting requirements, and |
| | ii) | giving a true and fair view of the consolidated entity’s financial position as at 30 June 2013 and of its performance for the financial year ended on that date, and |
| b) | there are reasonable grounds to believe that Sims Metal Management Limited will be able to pay its debts as and when they become due and payable, and |
| c) | at the date of this declaration, there are reasonable grounds to believe that the members of the Extended Closed Group identified in Note 29 will be able to meet any obligations or liabilities to which they are, or may become, subject by virtue of the Deed of Cross Guarantee described in Note 29. |
Note 1(b) confirms that the financial statements also comply with International Financial Reporting Standards as issued by the International Accounting Standards Board.
The directors have been given the declarations by the Chairman and the Group Chief Financial Officer required by section 295A of theCorporations Act 2001.
The declaration is made in accordance with a resolution of the Directors.

G N Brunsdon
Chairman
Sydney
23 August 2013
O T H E R I N F O R M A T I O N
INDEPENDENT AUDITOR’S REPORT TO THE MEMBERS OF SIMS METAL MANAGEMENT LIMITED

REPORT ON THE FINANCIAL REPORT
We have audited the accompanying financial report of Sims Metal Management Limited (the company), which comprises the consolidated statement of financial position as at 30 June 2013, and the consolidated income statement, the consolidated statement of comprehensive income, consolidated statement of changes in equity and consolidated statement of cash flows for the year ended on that date, a summary of significant accounting policies, other explanatory notes and the directors’ declaration for Sims Metal Management Limited (the consolidated entity). The consolidated entity comprises the company and the entities it controlled at the year’s end or from time to time during the financial year.
DIRECTORS’ RESPONSIBILITY FOR THE FINANCIAL REPORT
The directors of the company are responsible for the preparation of the financial report that gives a true and fair view in accordance with Australian Accounting Standards and the Corporations Act 2001 and for such internal control as the directors determine is necessary to enable the preparation of the financial report that is free from material misstatement, whether due to fraud or error. In Note 1, the directors also state, in accordance with Accounting Standard AASB 101 Presentation of Financial Statements, that the financial statements comply with International Financial Reporting Standards as issued by the International Accounting Standards Board.
AUDITOR’S RESPONSIBILITY
Our responsibility is to express an opinion on the financial report based on our audit. We conducted our audit in accordance with Australian Auditing Standards. Those standards require that we comply with relevant ethical requirements relating to audit engagements and plan and perform the audit to obtain reasonable assurance whether the financial report is free from material misstatement.
An audit involves performing procedures to obtain audit evidence about the amounts and disclosures in the financial report. The procedures selected depend on the auditor’s judgement, including the assessment of the risks of material misstatement of the financial report, whether due to fraud or error. In making those risk assessments, the auditor considers internal control relevant to the consolidated entity’s preparation and fair presentation of the financial report in order to design audit procedures that are appropriate in the circumstances, but not for the purpose of expressing an opinion on the effectiveness of the entity’s internal control. An audit also includes evaluating the appropriateness of accounting policies used and the reasonableness of accounting estimates made by the directors, as well as evaluating the overall presentation of the financial report.
We believe that the audit evidence we have obtained is sufficient and appropriate to provide a basis for our audit opinion.
INDEPENDENCE
In conducting our audit, we have complied with the independence requirements of the Corporations Act 2001.
PricewaterhouseCoopers, ABN 52 780 433 757
Darling Park Tower 2, 201 Sussex Street, GPO BOX 2650, SYDNEY NSW 1171
DX 77 Sydney, Australia
T +61 2 8266 0000, F +61 2 8266 9999, www.pwc.com.au
Liability limited by a scheme approved under Professional Standards Legislation

O T H E R I N F O R M A T I O N
INDEPENDENT AUDITOR’S REPORT TO THE MEMBERS OF SIMS METAL MANAGEMENT LIMITED
AUDITOR’S OPINION
In our opinion:
| (a) | the financial report of Sims Metal Management Limited is in accordance with theCorporations Act 2001, including: |
| | (i) | giving a true and fair view of the consolidated entity’s financial position as at 30 June 2013 and of its performance for the year ended on that date; and |
| | (ii) | complying with Australian Accounting Standards (including the Australian Accounting Interpretations) and the Corporations Regulations 2001, |
| (b) | the financial report and notes also comply with International Financial Reporting Standards as disclosed in Note 1 |
REPORT ON THE REMUNERATION REPORT
We have audited the remuneration report included in pages 38 to 56 of the directors’ report for the year ended 30 June 2013. The directors of the company are responsible for the preparation and presentation of the remuneration report in accordance with section 300A of theCorporations Act 2001. Our responsibility is to express an opinion on the remuneration report, based on our audit conducted in accordance with Australian Auditing Standards.
AUDITOR’S OPINION
In our opinion, the remuneration report of Sims Metal Management Limited for the year ended 30 June 2013, complies with section 300A of theCorporations Act 2001.
| | |
 | |  |
| |
| PricewaterhouseCoopers | | David Wiadrowski |
| | Partner |
| |
| | Sydney |
| |
| | 23 August 2013 |
AUDITOR’S INDEPENDENCE DECLARATION
As lead auditor for the audit of Sims Metal Management Limited for the year ended 30 June 2013, I declare that to the best of my knowledge and belief, there have been:
| (a) | no contraventions of the auditor independence requirements of theCorporations Act 2001 in relation to the audit; and |
| (b) | no contraventions of any applicable code of professional conduct in relation to the audit. |
This declaration is in respect of Sims Metal Management Limited and the entities it controlled during the period.

David Wiadrowski
Partner
PricewaterhouseCoopers
Sydney
23 August 2013
PricewaterhouseCoopers, ABN 52 780 433 757
Darling Park Tower 2, 201 Sussex Street, GPO BOX 2650, SYDNEY NSW 1171
DX 77 Sydney, Australia
T +61 2 8266 0000, F +61 2 8266 9999, www.pwc.com.au
Liability limited by a scheme approved under Professional Standards Legislation
ANNUAL FINANCIAL REPORT EXTRACTS PRESENTED IN US DOLLARS
The audited financial statements of the Group presented in Australian dollars (“A$”) are included in pages 57 to 119. On pages 123 to 126, extracts from the audited financial statements are presented in US dollars (“US”). This information does not form the part of the audited financial statements. The translation from A$ to US$ is included solely for the convenience of the reader. The financial statements as at and for the year ended 30 June 2013 have been translated into US$ at US $1.00 = A$1.0782 based on the closing exchange rate published by the Reserve Bank of Australia.
O T H E R I N F O R M A T I O N
CONSOLIDATED US$ INCOME STATEMENTFOR THE YEAR ENDED 30 JUNE 2013
| | | | |
| | | 2013
US$M | |
Revenue | | | 6,680.9 | |
| |
Other income | | | 48.8 | |
Raw materials used and changes in inventories | | | (5,056.9 | ) |
Freight expense | | | (519.7 | ) |
Employee benefits expense | | | (496.4 | ) |
Depreciation and amortisation expense | | | (114.5 | ) |
Repairs and maintenance expense | | | (98.1 | ) |
Other expenses | | | (564.7 | ) |
Impairment of goodwill and other intangibles | | | (282.3 | ) |
Finance costs | | | (23.1 | ) |
Share of results of investments accounted for using the equity method | | | (25.7 | ) |
Loss before income tax | | | (451.7 | ) |
| |
Income tax benefit | | | 19.4 | |
Loss for the year | | | (432.3 | ) |
| | | | |
| | | US¢ | |
Loss per share: | | | | |
Basic | | | (211.6 | ) |
Diluted | | | (211.6 | ) |
CONSOLIDATED US$ STATEMENT OF FINANCIAL POSITIONAS AT 30 JUNE 2013
| | | | |
| | | 2013
US$M | |
ASSETS | | | | |
Current assets | | | | |
Cash and cash equivalents | | | 43.5 | |
Trade and other receivables | | | 422.3 | |
Inventory | | | 533.2 | |
Other financial assets | | | 27.0 | |
Assets classified as held for sale | | | 49.3 | |
Total current assets | | | 1,075.3 | |
| |
Non-current assets | | | | |
Investments accounted for using the equity method | | | 306.1 | |
Other financial assets | | | 44.4 | |
Property, plant and equipment | | | 920.2 | |
Retirement benefit assets | | | 0.4 | |
Deferred tax assets | | | 114.1 | |
Goodwill | | | 154.4 | |
Other intangible assets | | | 90.3 | |
Total non-current assets | | | 1,629.9 | |
Total assets | | | 2,705.2 | |
| |
LIABILITIES | | | | |
Current liabilities | | | | |
Trade and other payables | | | 542.8 | |
Borrowings | | | 10.8 | |
Other financial liabilities | | | 5.8 | |
Current tax liabilities | | | 12.2 | |
Provisions | | | 35.7 | |
Liabilities associated with assets held for sale | | | 15.4 | |
Total current liabilities | | | 622.7 | |
| |
Non-current liabilities | | | | |
Payables | | | 7.7 | |
Borrowings | | | 175.4 | |
Deferred tax liabilities | | | 68.4 | |
Provisions | | | 37.6 | |
Retirement benefit obligations | | | 4.5 | |
Total non-current liabilities | | | 293.6 | |
Total liabilities | | | 916.3 | |
| |
Net assets | | | 1,788.9 | |
| |
EQUITY | | | | |
Contributed equity | | | 2,593.0 | |
Reserves | | | (183.5 | ) |
Retained deficit | | | (620.6 | ) |
Total equity | | | 1,788.9 | |
O T H E R I N F O R M A T I O N
CONSOLIDATED US$ STATEMENT OF CASH FLOWSFOR THE YEAR ENDED 30 JUNE 2013
| | | | |
| | | 2013
US$M | |
Cash flows from operating activities | | | | |
Receipts from customers (inclusive of goods and services tax) | | | 6,902.1 | |
Payments to suppliers and employees (inclusive of goods and services tax) | | | (6,614.4 | ) |
Interest received | | | 4.6 | |
Interest paid | | | (20.1 | ) |
Dividends received from associates and jointly controlled entities | | | 10.9 | |
Insurance recoveries | | | 1.3 | |
Income taxes paid | | | (8.7 | ) |
Net cash inflow from operating activities | | | 275.7 | |
| |
Cash flows from investing activities | | | | |
Payments for property, plant and equipment | | | (138.2 | ) |
Proceeds from sale of property, plant and equipment | | | 4.5 | |
Payments for acquisition of subsidiaries, net of cash acquired | | | (26.1 | ) |
Proceeds from sale of jointly controlled assets | | | 6.8 | |
Proceeds from sale of business division | | | 41.6 | |
Payments for other financial assets | | | (1.3 | ) |
Proceeds from sale of other financial assets | | | 1.0 | |
Loan to third parties | | | (5.3 | ) |
Proceeds from repayment on third party loans | | | 6.8 | |
Net cash outflow from investing activities | | | (110.2 | ) |
| |
Cash flows from financing activities | | | | |
Proceeds from borrowings | | | 2,307.9 | |
Repayment of borrowings | | | (2,453.8 | ) |
Fees paid for loan facilities | | | (0.2 | ) |
Payments for shares bought back | | | (8.0 | ) |
Dividends paid | | | (18.9 | ) |
Net cash outflow from financing activities | | | (173.0 | ) |
| |
Net decrease in cash and cash equivalents | | | (7.5 | ) |
| |
Cash and cash equivalents at the beginning of the financial year | | | 47.7 | |
Effects of exchange rate changes on cash and cash equivalents | | | 3.3 | |
Cash and cash equivalents at the end of the financial year | | | 43.5 | |
SHAREHOLDER INFORMATIONAS AT 4 SEPTEMBER 2013
EQUITY SECURITIES
SUBSTANTIAL SHAREHOLDERS
| | | | | | | | |
| | | NUMBER HELD | | | % | |
Mitsui Raw Materials Developments Pty Limited | | | 36,151,787 | | | | 17.7 | |
Commonwealth Bank of Australia | | | 19,628,462 | | | | 9.6 | |
National Australia Bank Limited | | | 10,223,031 | | | | 5.0 | |
| | |
| ORDINARY SHARES | | | | | | | | |
| | |
| Distribution of ordinary share holdings | | | | | | | | |
| | |
| RANGE | | | | | HOLDERS | |
1–1,000 | | | | | | | 8,509 | |
1,001–5,000 | | | | | | | 7,122 | |
5,001–10,000 | | | | | | | 926 | |
10,001–100,000 | | | | | | | 374 | |
100,001 and over | | | | | | | 39 | |
Total | | | | | | | 16,970 | |
There were 897 holders of less than a marketable parcel of shares.
Voting rights attaching to the ordinary shares are, on a show of hands, one vote for every person present as a member, proxy, attorney or representative thereof and upon a poll each share shall have one vote.
PERFORMANCE RIGHTS/RESTRICTED SHARE UNITS
Distribution of performance rights/restricted share units holdings
| | | | |
| RANGE | | HOLDERS | |
1–1,000 | | | 22 | |
1,001–5,000 | | | 45 | |
5,001–10,000 | | | 35 | |
10,001–100,000 | | | 74 | |
100,001 and over | | | 6 | |
Total | | | 182 | |
A total of 4,058,860 performance rights and restricted share units to take up ordinary shares or American Depositary Shares are issued under the Sims Metal Management Limited Long Term Incentive Plan and individual contracts, held by 182 holders.
The performance rights and restricted share units do not have any voting rights.
OPTIONS
Distribution of options holdings
| | | | |
| RANGE | | HOLDERS | |
1–1,000 | | | 4 | |
1,001–5,000 | | | 38 | |
5,001–10,000 | | | 26 | |
10,001–100,000 | | | 112 | |
100,001 and over | | | 9 | |
Total | | | 189 | |
A total of 6,517,037 options to take up ordinary shares or American Depositary Shares are issued under the Sims Metal Management Limited Long Term Incentive Plan, held by 189 holders.
A total of 492,000 options to take up ordinary shares or American Depositary Shares are issued under the former Metal Management, Inc. 2002 Incentive Plan, held by two holders.
The options do not have any voting rights.
O T H E R I N F O R M A T I O N
SHAREHOLDER INFORMATION AS AT 4 SEPTEMBER 2013
TWENTY LARGEST SHAREHOLDERS
| | | | | | | | | | | | |
| | | | | | | NO. OF SHARES | | | % HELD | |
1. | | NATIONAL NOMINEES LIMITED | | GPO BOX 1406, MELBOURNE VIC, 3001 | | | 42,745,200 | | | | 20.92 | |
| | | | |
2. | | MITSUI RAW MATERIALS | | LEVEL 40 120 COLLINS STREET, | | | 33,486,787 | | | | 16.39 | |
| | DEVELOPMENT PTY LIMITED | | MELBOURNE VIC, 3000 | | | | | | | | |
| | | | |
3. | | HSBC CUSTODY NOMINEES | | GPO BOX 5302, SYDNEY NSW, 2001 | | | 23,223,523 | | | | 11.37 | |
| | (AUSTRALIA) LIMITED | | | | | | | | | | |
| | | | |
4. | | J P MORGAN NOMINEES AUSTRALIA LIMITED | | LOCKED BAG 7, ROYAL EXCHANGE NSW, 1225 | | | 18,723,660 | | | | 9.16 | |
| | | | |
5. | | CITICORP NOMINEES PTY LIMITED | | GPO BOX 764G, MELBOURNE VIC, 3001 | | | 13,533,542 | | | | 6.62 | |
| | <COLONIAL FIRST STATE INV A/C> | | | | | | | | | | |
| | | | |
6. | | CITICORP NOMINEES PTY LIMITED | | G P O BOX 764G, MELBOURNE VIC, 3001 | | | 8,475,230 | | | | 4.15 | |
| | | | |
7. | | BNP PARIBAS NOMS PTY LTD <DRP> | | PO BOX R209, ROYAL EXCHANGE NSW, 1225 | | | 7,761,948 | | | | 3.80 | |
| | | | |
8. | | JP MORGAN NOMINEES AUSTRALIA LIMITED | | LOCKED BAG 20049, MELBOURNE VIC, 3001 | | | 5,901,299 | | | | 2.89 | |
| | <CASH INCOME A/C> | | | | | | | | | | |
| | | | |
9. | | RBC INVESTOR SERVICES AUSTRALIA | | GPO BOX 5430, SYDNEY NSW, 2001 | | | 3,586,650 | | | | 1.76 | |
| | NOMINEES PTY LIMITED <PI POOLED A/C> | | | | | | | | | | |
| | | | |
10. | | BNP PARIBAS NOMINEES PTY LTD <AGENCY | | PO BOX R209, ROYAL EXCHANGE NSW, 1225 | | | 1,743,438 | | | | 0.85 | |
| | LENDING DRP A/C> | | | | | | | | | | |
| | | | |
11. | | HSBC CUSTODY NOMINEES (AUSTRALIA) | | GPO BOX 5302, SYDNEY NSW, 2001 | | | 992,808 | | | | 0.49 | |
| | LIMITED <NT-COMNWLTH SUPER CORP A/C> | | | | | | | | | | |
| | | | |
12. | | QIC LIMITED | | C/- NATIONAL NOMINEES LIMITED, GPO BOX | | | 857,063 | | | | 0.42 | |
| | | | 2242, BRISBANE QLD, 4001 | | | | | | | | |
| | | | |
13. | | MILTON CORPORATION LIMITED | | PO BOX R1836, ROYAL EXCHANGE NSW, 1225 | | | 793,037 | | | | 0.39 | |
| | | | |
14. | | UCA GROWTH FUND LIMITED | | 130 LITTLE COLLINS STREET, | | | 725,000 | | | | 0.35 | |
| | | | MELBOURNE VIC, 3000 | | | | | | | | |
| | | | |
15. | | UBS NOMINEES PTY LTD | | LEVEL 16, CHIFLEY TOWER, 2 CHIFLEY | | | 675,251 | | | | 0.33 | |
| | | | SQUARE, SYDNEY NSW, 2000 | | | | | | | | |
| | | | |
16. | | AMP LIFE LIMITED | | PO BOX R209, ROYAL EXCHANGE NSW, 1225 | | | 661,530 | | | | 0.32 | |
| | | | |
17. | | KONANN PTY LIMITED | | PO BOX 649, BERWICK VIC, 3806 | | | 541,692 | | | | 0.27 | |
| | <PETER WHITE FAMILY A/C NO 2> | | | | | | | | | | |
| | | | |
18. | | RBC INVESTOR SERVICES AUSTRALIA | | GPO BOX 5430, SYDNEY NSW, 2001 | | | 443,764 | | | | 0.22 | |
| | NOMINEES PTY LIMITED <PISELECT> | | | | | | | | | | |
| | | | |
19. | | ARGO INVESTMENTS LIMITED | | G P O BOX 2692, ADELAIDE SA, 5001 | | | 415,772 | | | | 0.20 | |
| | | | |
20. | | RBC INVESTOR SERVICES AUSTRALIA | | GPO BOX 5430, SYDNEY NSW, 2001 | | | 376,954 | | | | 0.18 | |
| | | NOMINEES PTY LIMITED <PIIC A/C> | | | | | | | | | | |
| | | | | | | | 165,664,148 | | | | 81.08 | |
FIVE YEAR TREND SUMMARY
| | | | | | | | | | | | | | | | | | | | | | | | |
| | | | | | 2013 | | | 2012
RESTATED | | | 2011
RESTATED | | | 2010
RESTATED | | | 2009 | |
Revenue | | | A$m | | | | 7,203.1 | | | | 9,042.3 | | | | 8,852.9 | | | | 7,458.5 | | | | 8,641.0 | |
(Loss)/profit before interest and tax | | | A$m | | | | (469.4 | ) | | | (623.3 | ) | | | 293.1 | | | | 198.3 | | | | (105.6 | ) |
Net interest expense | | | A$m | | | | (17.6 | ) | | | (21.2 | ) | | | (23.9 | ) | | | (13.6 | ) | | | (19.2 | ) |
Tax benefit/(expense) | | | A$m | | | | 20.9 | | | | 22.0 | | | | (81.9 | ) | | | (63.3 | ) | | | (25.5 | ) |
(Loss)/profit after tax | | | A$m | | | | (466.1 | ) | | | (622.5 | ) | | | 187.3 | | | | 121.4 | | | | (150.3 | ) |
Net Cash Flows from Operations | | | A$m | | | | 297.3 | | | | 289.6 | | | | 158.6 | | | | (47.5 | ) | | | 554.4 | |
(Loss)/earnings per share - diluted | | | A¢ | | | | (228.1 | ) | | | (302.4 | ) | | | 90.9 | | | | 61.8 | | | | (82.5 | ) |
Dividends per Share | | | A¢ | | | | 0.0 | | | | 20.0 | | | | 47.0 | | | | 33.0 | | | | 38.0 | |
Return on Shareholders’ Equity | | | % | | | | (24.2 | ) | | | (27.3 | ) | | | 6.4 | | | | 3.7 | | | | (5.3 | ) |
Current Ratio (to 1) | | | | | | | 1.73 | | | | 1.95 | | | | 2.14 | | | | 2.21 | | | | 1.71 | |
Gearing Ratio | | | % | | | | 7.4 | | | | 11.3 | | | | 4.2 | | | | 0.0 | | | | 3.6 | |
Net Tangible Asset Backing per Share | | | A$ | | | | 8.15 | | | | 8.35 | | | | 8.70 | | | | 9.45 | | | | 8.09 | |
CORPORATE DIRECTORY
SECURITIES EXCHANGE LISTING
The Company’s ordinary shares are quoted on the Australian Securities Exchange under the ASX Code ‘SGM’.
REGISTERED OFFICE
Sir Joseph Banks Corporate Park
Suite 3, Level 2
32–34 Lord Street Botany NSW 2019
Telephone: (02) 8113 1600
HEAD OFFICE AND PRINCIPAL ADMINISTRATIVE OFFICE
325 N. LaSalle Street,
Suite 550
Chicago, IL USA 60654
Telephone: (1 312) 645 0700
SHAREHOLDER ENQUIRIES
Enquiries from investors regarding their ordinary share holdings should be directed to:
Computershare Investor Services Pty Limited
Level 4
60 Carrington Street
Sydney NSW 2000
Postal Address:
GPO Box 2975
Melbourne VIC 3001
Telephone: 1300 855 080
Facsimile: (03) 9473 2500
Enquiries from investors regarding the Company’s American Depositary Shares should be directed to:
The Bank of New York Mellon
P.O. Box 358516
Pittsburgh, PA 15252-8516
Telephone: (1 888) BNY ADRS
Email: shrrelations @ bnymellon.com
COMPANY SECRETARIES
Frank Moratti
Scott Miller
AUDITORS
PricewaterhouseCoopers
Darling Park Tower 2
201 Sussex Street
Sydney NSW 1171
For more up-to-the-minute investor relations, visit www.simsmm.com
This report is printed on Pacesetter.
Pacesetter is FSC Mix Certified, which ensures that all virgin pulp is derived from well-managed forests and controlled sources.
It is manufactured by an ISO 14001 certified mill.
Designed and produced by ArmstrongQ – www.armstrongQ.com.au