Exhibit 99.2

Sims Metal Management Strategic Review Galdino Claro, Group CEO 23 July 2014

Disclaimer Cautionary Statements Regarding Forward -Looking Information This presentation may contain forward -looking statements, including statements about Sims Metal Management’s financial condition, results of operations, earnings outlook and prospects. Forward -looking statements are typically identified by words such as “plan,” “believe,” “expect,” “anticipate,” “intend,” “outlook,” “estimate,” “forecast,” “project” and other similar words and expressions. These forward -looking statements involve certain risks and uncertainties. Our ability to predict results or the actual effects of our plans and strategies is subject to inherent uncertainty. Factors that may cause actual results or earnings to differ materially from these forward -looking statements include those discussed and identified in filings we make with the Australian Securities Exchange and the United States Securities and Exchange Commission (“SEC”), including the risk factors described in the Company’s Annual Report on Form 20-F, which we filed with the SEC on 16 October 2013. Because these forward -looking statements are subject to assumptions and uncertainties, actual results may differ materially from those expressed or implied by these forward -looking statements. You are cautioned not to place undue reliance on these statements, which speak only as of the date of this release. All subsequent written and oral forward -looking statements concerning the matters addressed in this presentation and attributable to us or any person acting on our behalf are expressly qualified in their entirety by the cautionary statements contained or referred to in this release. Except to the extent required by applicable law or regulation, we undertake no obligation to update these forward -looking statements to reflect events or circumstances after the date of this release. All references to currencies, unless otherwise stated, reflect measures in Australian dollars. 2
Agenda ? Strategy Overview ? Streamline ? Optimise ? Metals Recycling ? Electronics Recycling (SRS) ? Grow ? Summary

A clear five -year strategic plan Grow Optimise • Organic market share growth and feeder yard network expansion • Selective acquisitive growth Streamline • Return to growth in Global SRS • Strengthen supplier relationships with asset management and • Exploit local & global logistics • Share operational best practices corporate services offerings • Lead on product quality and • Exit non-strategic businesses services • Further cost reductions 1-2 years 3-4 years 5 years 4
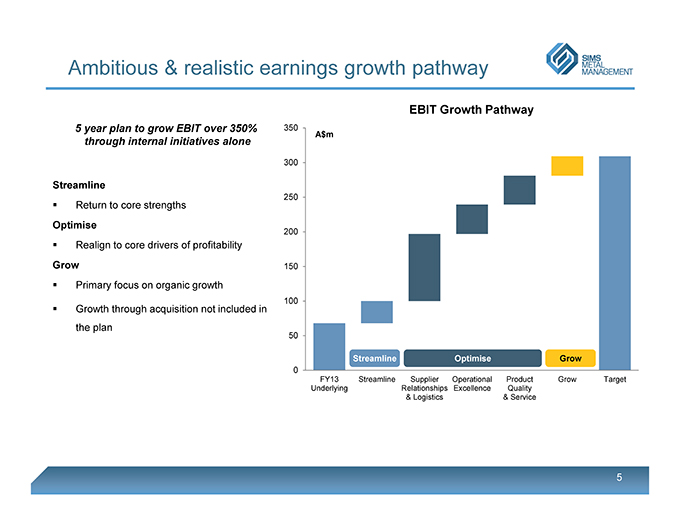
Ambitious & realistic earnings growth pathway EBIT Growth Pathway 5 year plan to grow EBIT over 350% 350 A$m through internal initiatives alone 300 Streamline 250 ? Return to core strengths Optimise 200 ? Realign to core drivers of profitability Grow 150 ? Primary focus on organic growth 100 ? Growth through acquisition not included in the plan 50 Streamline Optimise Grow 0 FY13 Streamline Supplier Operational Product Grow Target Underlying Relationships Excellence Quality & Logistics & Service
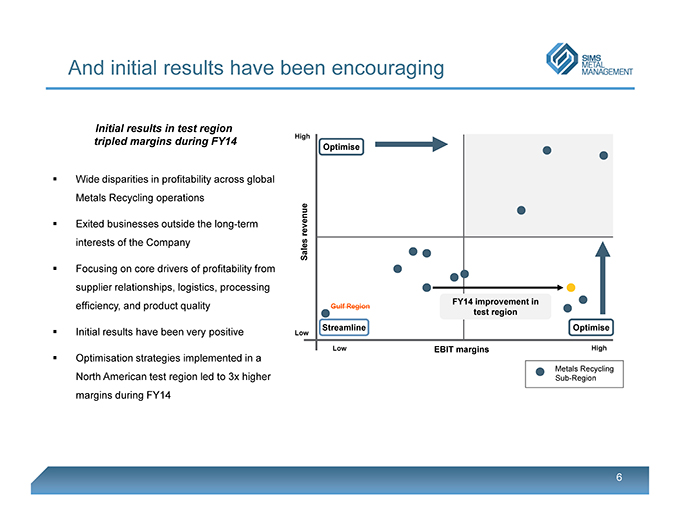
And initial results have been encouraging Initial results in test region Hightripled margins during FY14Optimise? Wide disparities in profitability across global Metals Recycling operations? Exited businesses outside the long-term revenueinterests of the Company Sales? Focusing on core drivers of profitability from supplier relationships, logistics, processing FY14 improvement in efficiency, and product quality Gulf Region test regionStreamline Optimise? Initial results have been very positive LowLow EBIT margins High? Optimisation strategies implemented in a Metals Recycling North American test region led to 3x higher Sub-Region margins during FY14
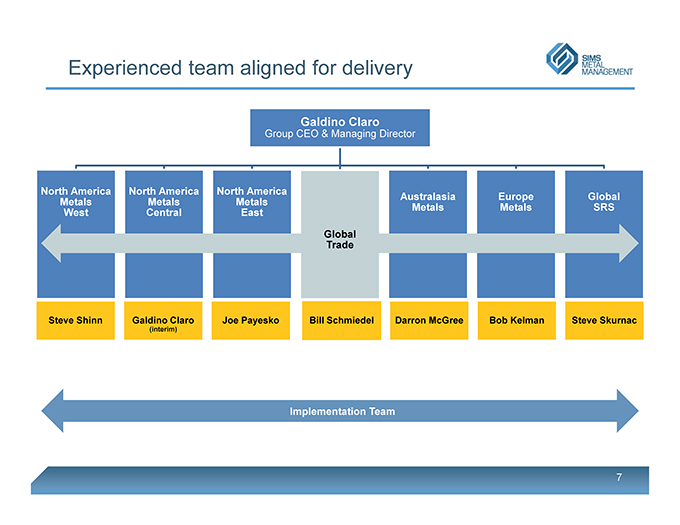
Experienced team aligned for delivery Galdino Claro Group CEO & Managing Director North America North America North America Australasia Europe Global Metals Metals Metals Metals Metals SRS West Central East Global Trade Steve Shinn Galdino Claro Joe Payesko Bill Schmiedel Darron McGree Bob Kelman Steve Skurnac (interim) Implementation Team 7
Agenda ? Strategy Overview ? Streamline ? Optimise ? Metals Recycling ? Electronics Recycling (SRS) ? Grow ? Summary 8
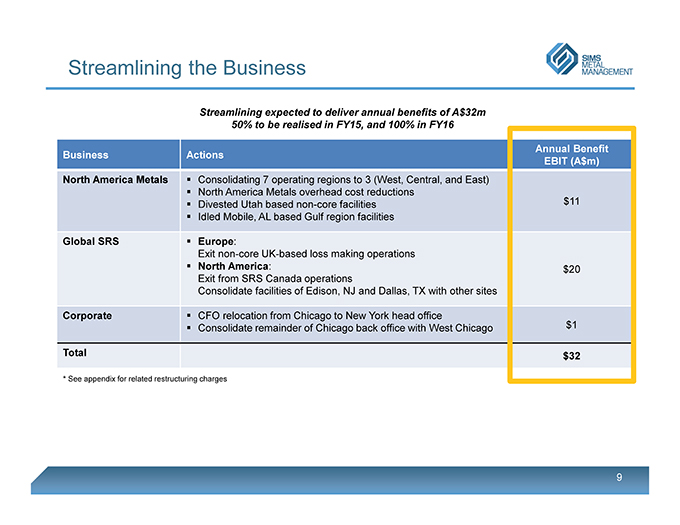
Streamlining the Business Streamlining expected to deliver annual benefits of A$32m 50% to be realised in FY15, and 100% in FY16Annual Benefit Business Actions EBIT (A$m) North America Metals ? Consolidating 7 operating regions to 3 (West, Central, and East)? North America Metals overhead cost reductions? Divested Utah based non-core facilities $11? Idled Mobile, AL based Gulf region facilitiesGlobal SRS ? Europe :Exit non-core UK-basedloss making operations? North America : $20Exit from SRS Canada operations Consolidate facilities of Edison, NJ and Dallas, TX with other sitesCorporate ? CFO relocation from Chicago to New York head office? Consolidate remainder of Chicago back office with West Chicago $1Total $32* See appendix for related restructuring charges 9
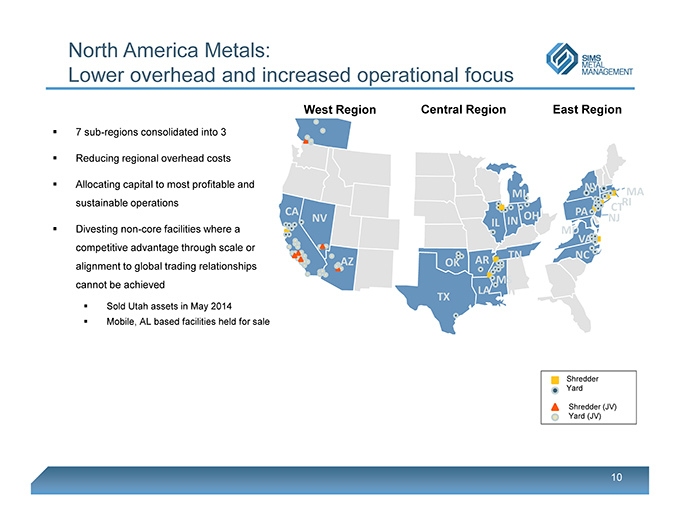
North America Metals: Lower overhead and increased operational focus West Region Central Region East Region ? 7 sub-regions consolidated into 3 ? Reducing regional overhead costs ? Allocating capital to most profitable and NY MA MI sustainable operations RI CT CA PA NV OH NJ ? Divesting non-core facilities where a IL IN MD competitive advantage through scale or VA TN NC AZ OK AR alignment to global trading relationships MS cannot be achievedLA TX ? Sold Utah assets in May 2014? Mobile, AL based facilities held for saleShredder Yard Shredder (JV) Yard (JV) 10
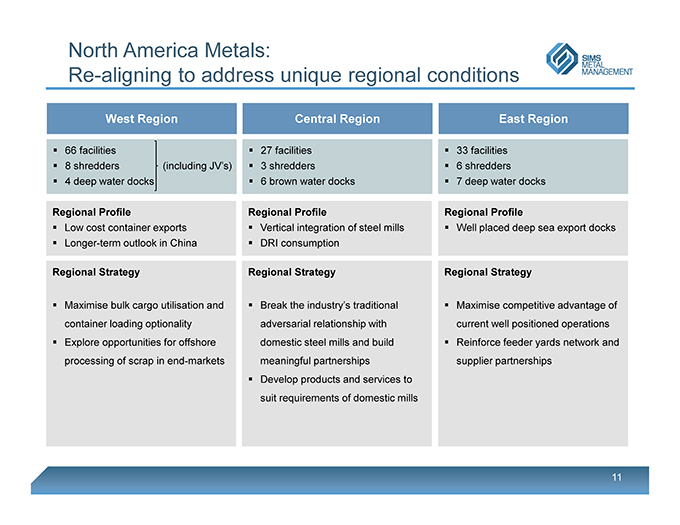
North America Metals: Re-aligning to address unique regional conditions West Region Central Region East Region ? 66 facilities ? 27 facilities ? 33 facilities ? 8 shredders (including JV’s) ? 3 shredders ? 6 shredders ? 4 deep water docks ? 6 brown water docks ? 7 deep water docks Regional Profile Regional Profile Regional Profile ? Low cost container exports ? Vertical integration of steel mills ? Well placed deep sea export docks ? Longer -term outlook in China ? DRI consumption Regional Strategy Regional Strategy Regional Strategy ? Maximise bulk cargo utilisation and ? Break the industry’s traditional ? Maximise competitive advantage of container loading optionality adversarial relationship with current well positioned operations ? Explore opportunities for offshore domestic steel mills and build ? Reinforce feeder yards network and processing of scrap in end-markets meaningful partnerships supplier partnerships ? Develop products and services to suit requirements of domestic mills 11
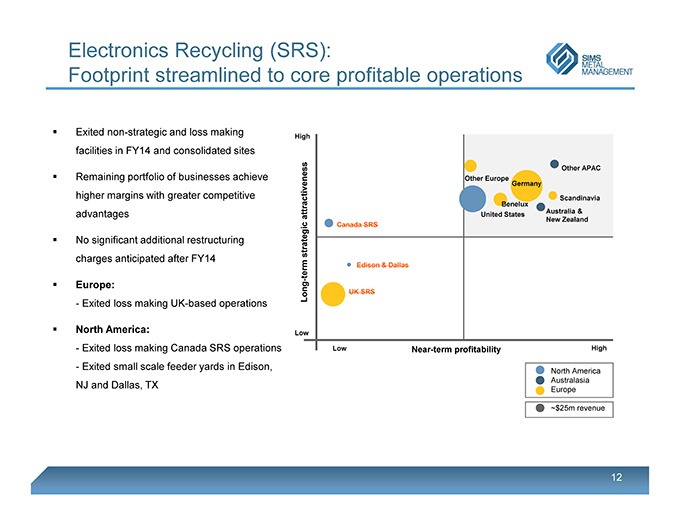
Electronics Recycling (SRS): Footprint streamlined to core profitable operations ? Exited non-strategic and loss making High facilities in FY14 and consolidated sites Other APAC ? Remaining portfolio of businesses achieve Other Europe Germany higher margins with greater competitive Scandinavia Benelux Australia & advantages attractiveness United States New Zealand Canada SRS ? No significant additional restructuring strategic charges anticipated after FY14 term Edison & Dallas—? Europe: Long UK SRS—Exited loss making UK-based operations ? North America: Low—Exited loss making Canada SRS operations Low Near-term profitability High—Exited small scale feeder yards in Edison, North America Australasia NJ and Dallas, TX Europe ~$25m revenue 12
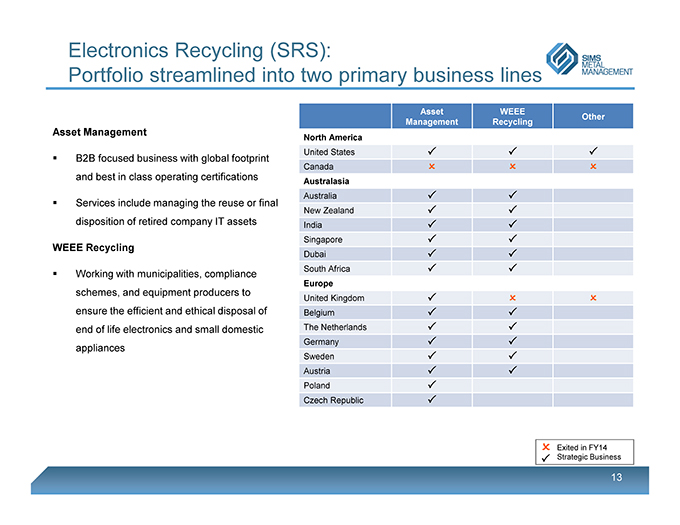
Electronics Recycling (SRS): Portfolio streamlined into two primary business lines Asset WEEE Other Management Recycling Asset Management North America United States ? B2B focused business with global footprint Canada and best in class operating certifications Australasia ? Services include managing the reuse or final Australia New Zealand disposition of retired company IT assets India Singapore WEEE Recycling Dubai South Africa ? Working with municipalities, compliance Europe schemes, and equipment producers to United Kingdom ensure the efficient and ethical disposal of Belgium end of life electronics and small domestic The Netherlands Germany appliances Sweden Austria Poland _ Czech Republic Exited in FY14 _ Strategic Business 13
Agenda ? Strategy Overview ? Streamline ? Optimise ? Metals Recycling ? Electronics Recycling (SRS) ? Grow ? Summary 14
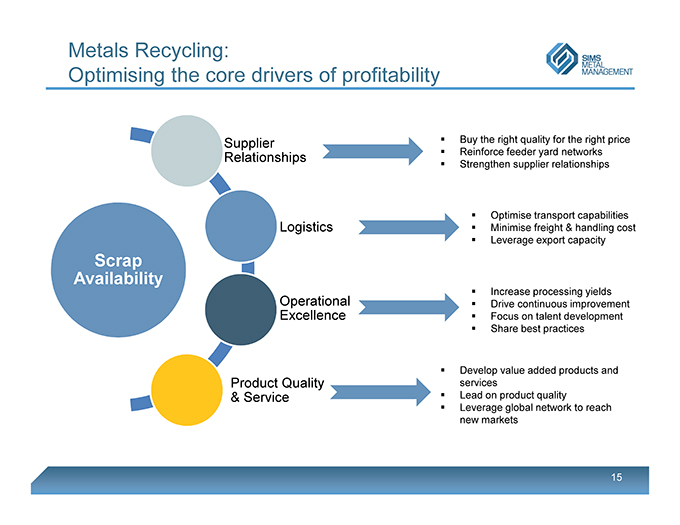
Metals Recycling: Optimising the core drivers of profitability Supplier ? Buy the right quality for the right price ? Reinforce feeder yard networks Relationships ? Strengthen supplier relationships ? Optimise transport capabilities Logistics ? Minimise freight & handling cost ? Leverage export capacity Scrap Availability Operational ? Increase processing yields ? Drive continuous improvement Excellence ? Focus on talent development ? Share best practices ? Develop value added products and Product Quality services & Service ? Lead on product quality ? Leverage global network to reach new markets 15
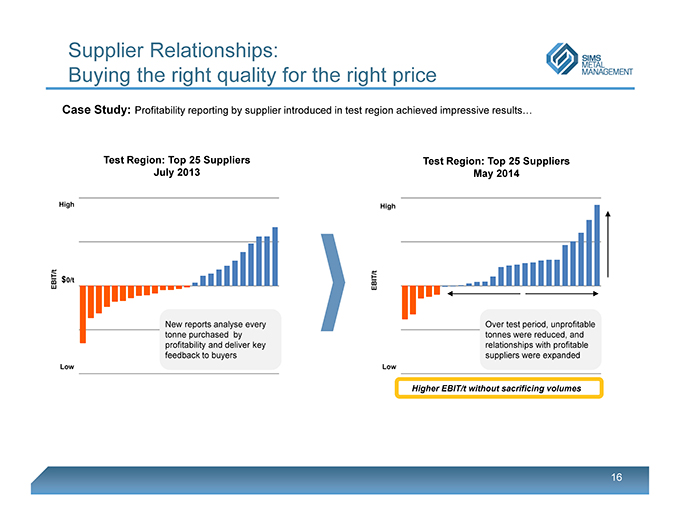
Supplier Relationships: Buying the right quality for the right price Case Study: Profitability reporting by supplier introduced in test region achieved impressive results Test Region: Top 25 Suppliers Test Region: Top 25 Suppliers July 2013 May 2014 High High EBIT/t $0/t EBIT/t New reports analyse every Over test period, unprofitable tonne purchased by tonnes were reduced, and profitability and deliver key relationships with profitable feedback to buyers suppliers were expanded Low Low Higher EBIT/t without sacrificing volumes 16
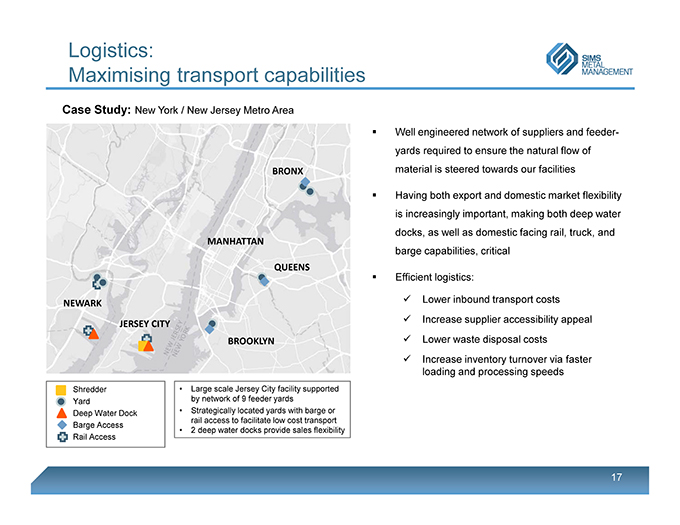
Logistics: Maximising transport capabilities Case Study: New York / New Jersey Metro Area BRONX MANHATTAN QUEENS NEWARK JERSEY CITY BROOKLYN Shredder • Large scale Jersey City facility supported Yard by network of 9 feeder yards Deep Water Dock • Strategically located yards with barge or rail access to facilitate low cost transport Barge Access • 2 deep water docks provide sales flexibility Rail Access Well engineered network of suppliers and feeder-yards required to ensure the natural flow of material is steered towards our facilities Having both export and domestic market flexibility is increasingly important, making both deep water docks, as well as domestic facing rail, truck, and barge capabilities, critical Efficient logistics: ? Lower inbound transport costs ? Increase supplier accessibility appeal ? Lower waste disposal costs ? Increase inventory turnover via faster loading and processing speeds 17
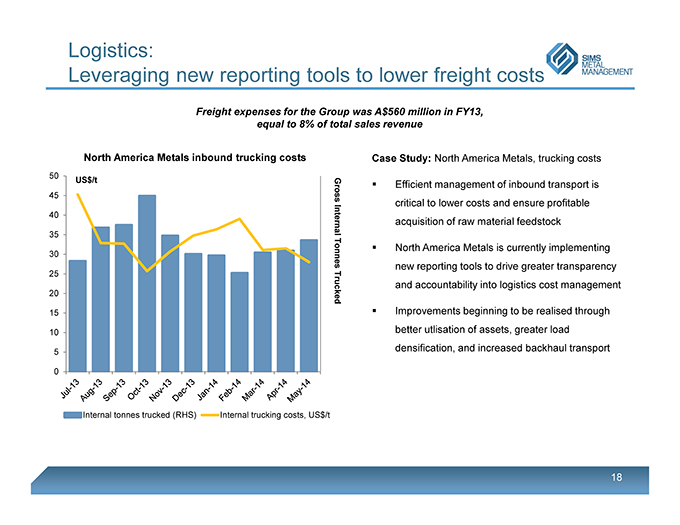
Logistics: Leveraging new reporting tools to lower freight costs Freight expenses for the Group was A$560 million in FY13, equal to 8% of total sales revenue North America Metals inbound trucking costs Case Study: North America Metals, trucking costs 50 100 US$/t ? Efficient management of inbound transport is 45 90 Gross critical to lower costs and ensure profitable 40 80 Internal acquisition of raw material feedstock 35 70 ? North America Metals is currently implementing 30 60 Tonnes new reporting tools to drive greater transparency 25 50 and accountability into logistics cost management 20 40 Trucked 15 30 ? Improvements beginning to be realised through 10 20 better utlisation of assets, greater load densification, and increased backhaul transport 5 10 0 0 Internal tonnes trucked (RHS) Internal trucking costs, US$/t 18
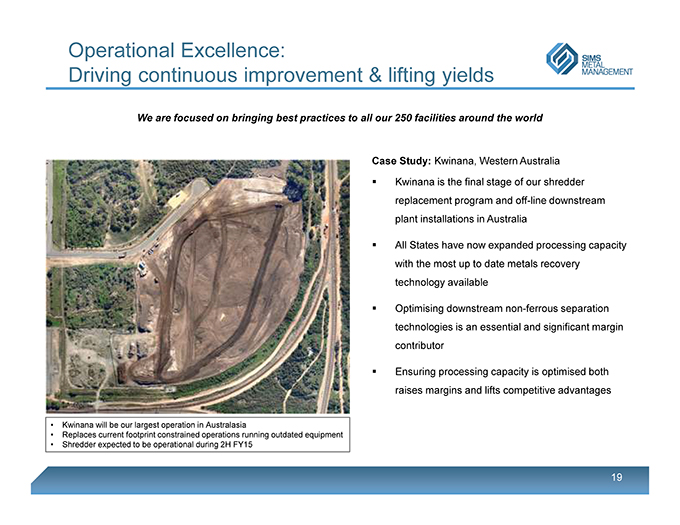
Operational Excellence: Driving continuous improvement & lifting yields We are focused on bringing best practices to all our 250 facilities around the world Case Study: Kwinana, Western Australia ? Kwinana is the final stage of our shredder replacement program and off-line downstream plant installations in Australia ? All States have now expanded processing capacity with the most up to date metals recovery technology available ? Optimising downstream non-ferrous separation technologies is an essential and significant margin contributor ? Ensuring processing capacity is optimised both raises margins and lifts competitive advantages • Kwinana will be our largest operation in Australasia • Replaces current footprint constrained operations running outdated equipment • Shredder expected to be operational during 2H FY15 19
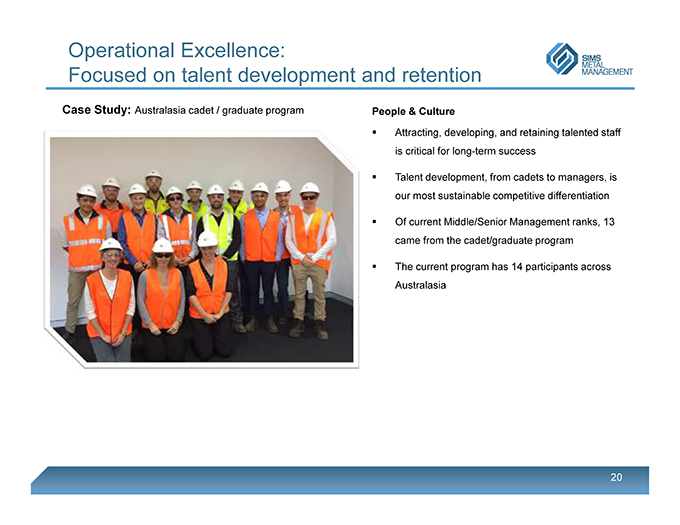
Operational Excellence: Focused on talent development and retention Case Study: Australasia cadet / graduate program People & Culture ? Attracting, developing, and retaining talented staff is critical for long-term success ? Talent development, from cadets to managers, is our most sustainable competitive differentiation ? Of current Middle/Senior Management ranks, 13 came from the cadet/graduate program ? The current program has 14 participants across Australasia 20
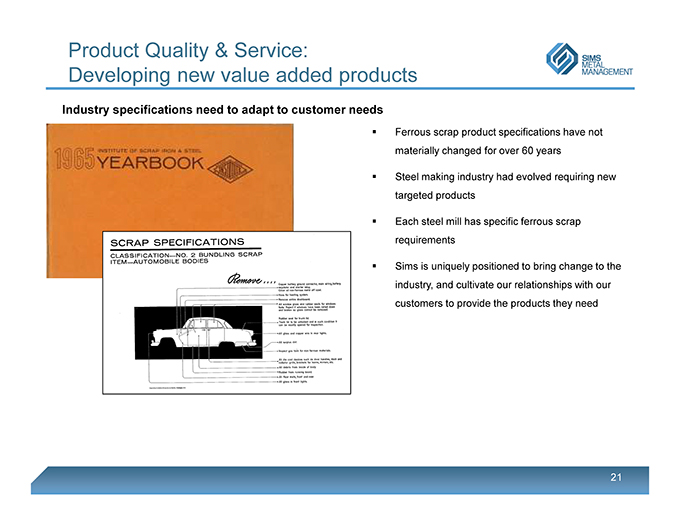
Product Quality & Service: Developing new value added products Industry specifications need to adapt to customer needs Ferrous scrap product specifications have not materially changed for over 60 years Steel making industry had evolved requiring new targeted products Each steel mill has specific ferrous scrap requirements Sims is uniquely positioned to bring change to the industry, and cultivate our relationships with our customers to provide the products they need 21
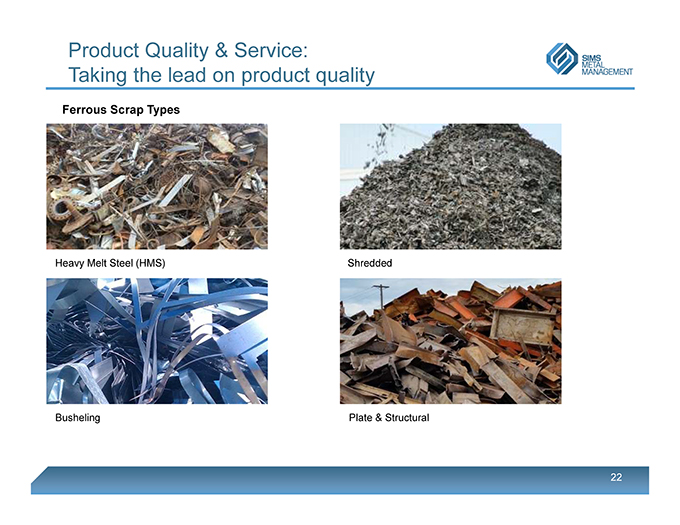
Product Quality & Service: Taking the lead on product quality Ferrous Scrap Types Heavy Melt Steel (HMS) Shredded Plate & Structural Busheling 22
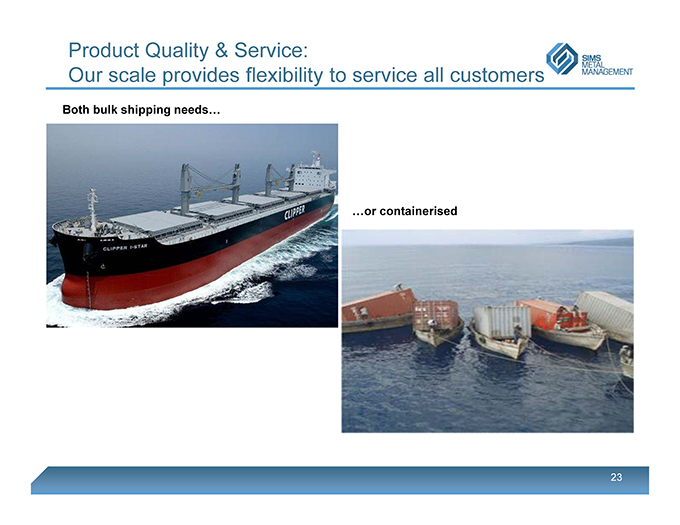
Product Quality & Service: Our scale provides flexibility to service all customers Both bulk shipping needs o r containerised 23
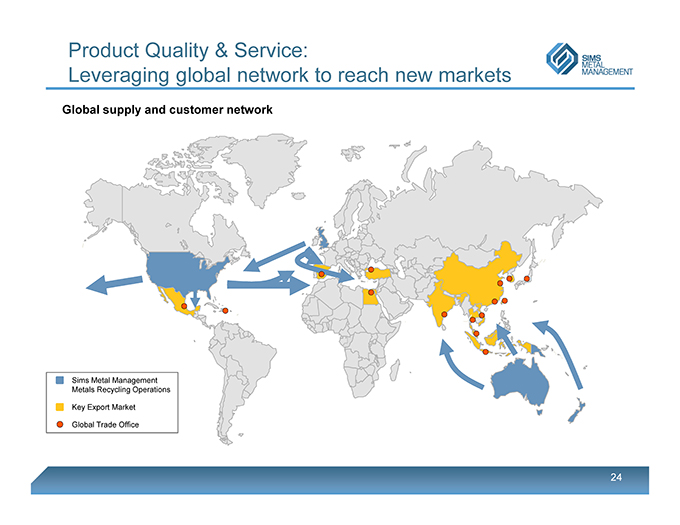
Product Quality & Service: Leveraging global network to reach new markets Global supply and customer network Sims Metal Management Metals Recycling Operations Key Export Market Global Trade Office 24
Agenda ? Strategy Overview ? Streamline ? Optimise ? Metals Recycling ? Electronics Recycling (SRS) ? Grow ? Summary 25
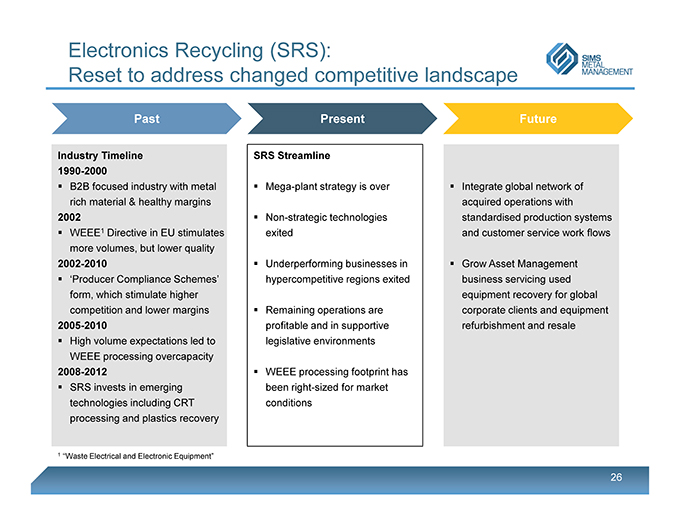
Electronics Recycling (SRS): Reset to address changed competitive landscape Past Present Future Industry Timeline SRS Streamline 1990-2000 ? B2B focused industry with metal ? Mega-plant strategy is over ? Integrate global network of rich material & healthy margins acquired operations with 2002 ? Non-strategic technologies standardised production systems ? WEEE1 Directive in EU stimulates exited and customer service work flows more volumes, but lower quality 2002-2010 ? Underperforming businesses in ? Grow Asset Management ? ‘Producer Compliance Schemes’ hypercompetitive regions exited business servicing used form, which stimulate higher equipment recovery for global competition and lower margins ? Remaining operations are corporate clients and equipment 2005-2010 profitable and in supportive refurbishment and resale ? High volume expectations led to legislative environments WEEE processing overcapacity 2008-2012 ? WEEE processing footprint has ? SRS invests in emerging been right-sized for market technologies including CRT conditions processing and plastics recovery 1 “Waste Electrical and Electronic Equipment” 26
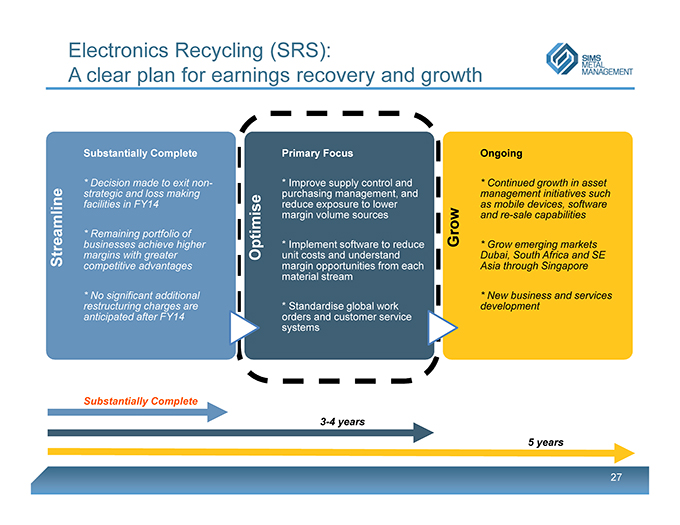
Electronics Recycling (SRS): A clear plan for earnings recovery and growth Substantially Complete Primary Focus Ongoing * Decision made to exit non- * Improve supply control and * Continued growth in asset strategic and loss making purchasing management, and management initiatives such facilities in FY14 reduce exposure to lower as mobile devices, software margin volume sources and re-sale capabilities * Remaining portfolio of Grow businesses achieve higher * Implement software to reduce * Grow emerging markets Streamline margins with greater Optimise unit costs and understand Dubai, South Africa and SE competitive advantages margin opportunities from each Asia through Singapore material stream * No significant additional * New business and services restructuring charges are * Standardise global work development anticipated after FY14 orders and customer service systems Substantially Complete 3-4 years 5 years 27
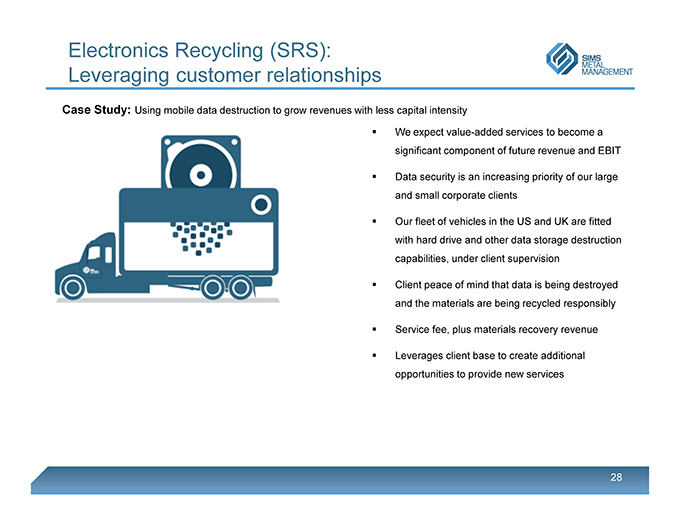
Electronics Recycling (SRS): Leveraging customer relationships Case Study: Using mobile data destruction to grow revenues with less capital intensity We expect value-added services to become a significant component of future revenue and EBIT Data security is an increasing priority of our large and small corporate clients Our fleet of vehicles in the US and UK are fitted with hard drive and other data storage destruction capabilities, under client supervision Client peace of mind that data is being destroyed and the materials are being recycled responsibly Service fee, plus materials recovery revenue Leverages client base to create additional opportunities to provide new services 28
Agenda ? Strategy Overview ? Streamline ? Optimise ? Metals Recycling ? Electronics Recycling (SRS) ? Grow ? Summary 29
Attractive opportunities for growth: Metals Recycling Organic growth in existing core markets ? Strategic feeder yard expansion to secure volumes and improve source control ? Strengthen supplier relationships to lift regional market share Operational footprint enhancements ? Investigate asset swaps and joint ventures where commercial opportunities are available and attractive New market development ? Asia: Retain longer-term options for a physical presence in China and East Asia ? Europe: Explore potential to better service Continental European market 30
Attractive opportunities for growth: Electronics Recycling (SRS) Continue growth in Asset Management ? Leverage global footprint with international client base ? Grow services and revenue sharing as a portion of total SRS revenues ? Expand mobile device repair, re-use, and re-sale Grow emerging markets Dubai, South Africa and SE Asia through Singapore ? Strong demand for e-recycling services from Western firms in emerging market economies New business and services development ? Secure data destruction for server farms and data storage firms ? Mobile data destruction services ? On-site asset management capabilities
Agenda ? Strategy Overview ? Streamline ? Optimise ? Metals Recycling ? Electronics Recycling (SRS) ? Grow ? Summary 32
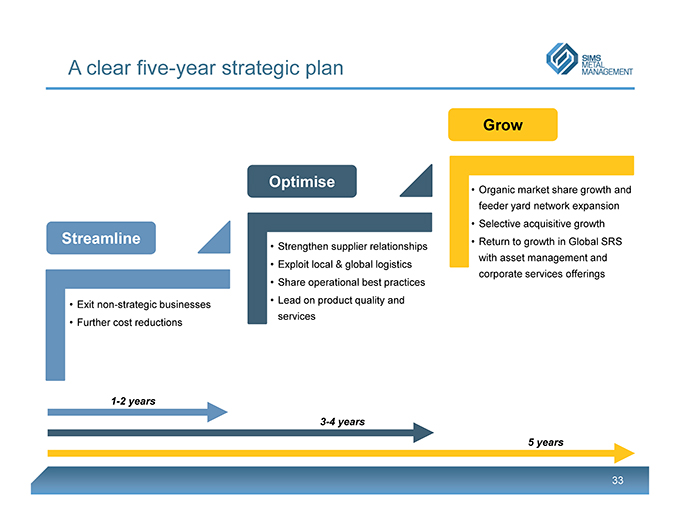
A clear five -year strategic plan Grow Optimise • Organic market share growth and feeder yard network expansion • Selective acquisitive growth Streamline • Return to growth in Global SRS • Strengthen supplier relationships with asset management and • Exploit local & global logistics • Share operational best practices corporate services offerings • Lead on product quality and • Exit non-strategic businesses services • Further cost reductions 1-2 years 3-4 years 5 years 33
Strategic Review Appendix July 23, 2014
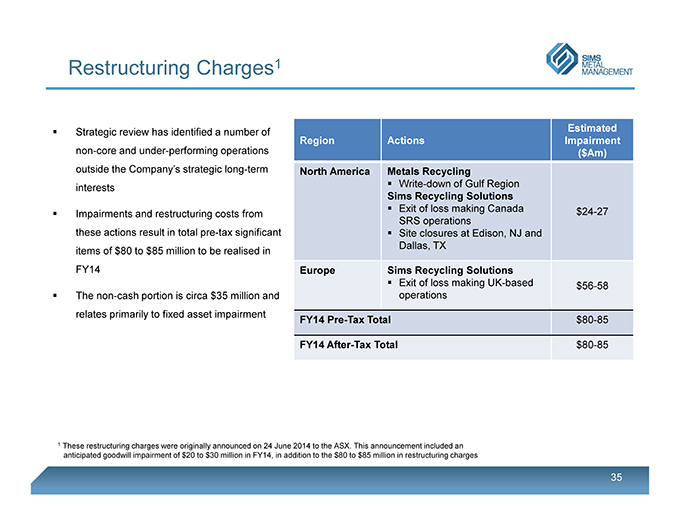
Restructuring Charges 1 ? Strategic review has identified a number of Estimated Region Actions Impairment non-core and under-performing operations ($Am) outside the Company’s strategic long-term North America Metals Recycling interests ? Write-down of Gulf Region Sims Recycling Solutions ? Exit of loss making Canada $24-27 ? Impairments and restructuring costs from SRS operations these actions result in total pre-tax significant ? Site closures at Edison, NJ and Dallas, TX items of $80 to $85 million to be realised in FY14 Europe Sims Recycling Solutions ? Exit of loss making UK-based $56-58 ? The non-cash portion is circa $35 million and operations relates primarily to fixed asset impairment FY14 Pre-TaxTotal $80-85 FY14 After-Tax Total $80-85 1 These restructuring charges were originally announced on 24 June 2014 to the ASX. This announcement included an anticipated goodwill impairment of $20 to $30 million in FY14, in addition to the $80 to $85 million in restructuring charges 35
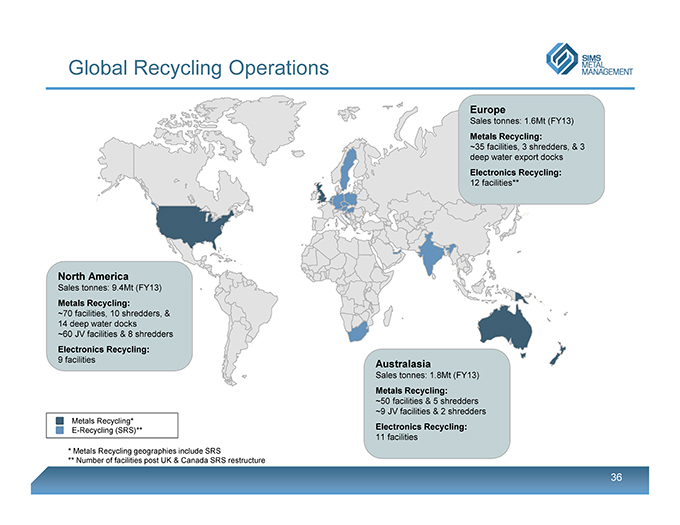
Global Recycling Operations Europe Sales tonnes: 1.6Mt (FY13) Metals Recycling: ~35 facilities, 3 shredders, & 3 deep water export docks Electronics Recycling: 12 facilities** North America Sales tonnes: 9.4Mt (FY13) Metals Recycling: ~70 facilities, 10 shredders, & 14 deep water docks ~60 JV facilities & 8 shredders Electronics Recycling: 9 facilities Metals Recycling* E-Recycling (SRS)** * Metals Recycling geographies include SRS ** Number of facilities post UK & Canada SRS restructure Australasia Sales tonnes: 1.8Mt (FY13) Metals Recycling: ~50 facilities & 5 shredders ~9 JV facilities & 2 shredders Electronics Recycling: 11 facilities 36