MidAmerican Energy Holdings Company
2010 Fixed-Income Investor Conference

Forward-Looking Statements
This report contains statements that do not directly or exclusively relate to historical facts. These statements are “forward-looking
statements” within the meaning of Section 27A of the Securities Act of 1933 and Section 21E of the Securities Exchange Act of 1934, as
amended. Forward-looking statements can typically be identified by the use of forward-looking words, such as “may,” “could,” “project,”
“believe,” “anticipate,” “expect,” “estimate,” “continue,” “intend,” “potential,” “plan,” “forecast” and similar terms. These statements are
based upon MidAmerican Energy Holdings Company’s (“MEHC”) and its subsidiaries’ (collectively, the “Company”) current intentions,
assumptions, expectations and beliefs and are subject to risks, uncertainties and other important factors. Many of these factors are outside
the Company’s control and could cause actual results to differ materially from those expressed or implied by the Company’s forward-
looking statements. These factors include, among others:
– general economic, political and business conditions in the jurisdictions in which the Company’s facilities operate;
– changes in federal, state and local governmental, legislative or regulatory requirements, including those pertaining to income taxes,
affecting the Company or the electric or gas utility, pipeline or power generation industries;
affecting the Company or the electric or gas utility, pipeline or power generation industries;
– changes in, and compliance with, environmental laws, regulations, decisions and policies that could, among other items, increase
operating and capital costs, reduce plant output or delay plant construction;
operating and capital costs, reduce plant output or delay plant construction;
– the outcome of general rate cases and other proceedings conducted by regulatory commissions or other governmental and legal
bodies;
bodies;
– changes in economic, industry or weather conditions, as well as demographic trends, that could affect customer growth and usage or
supply of electricity and gas or the Company’s ability to obtain long-term contracts with customers and suppliers;
supply of electricity and gas or the Company’s ability to obtain long-term contracts with customers and suppliers;
– a high degree of variance between actual and forecasted load and prices that could impact the hedging strategy and costs to balance
electricity and load supply;
electricity and load supply;
– changes in prices, availability and demand for both purchases and sales of wholesale electricity, coal, natural gas, other fuel sources
and fuel transportation that could have a significant impact on generation capacity and energy costs;
and fuel transportation that could have a significant impact on generation capacity and energy costs;
– the financial condition and creditworthiness of the Company’s significant customers and suppliers;
– changes in business strategy or development plans;
– availability, terms and deployment of capital, including reductions in demand for investment-grade commercial paper, debt
securities and other sources of debt financing and volatility in the London Interbank Offered Rate, the base interest rate for MEHC’s
and its subsidiaries’ credit facilities;
securities and other sources of debt financing and volatility in the London Interbank Offered Rate, the base interest rate for MEHC’s
and its subsidiaries’ credit facilities;

Forward-Looking Statements
– changes in MEHC’s and its subsidiaries’ credit ratings;
– performance of the Company’s generating facilities, including unscheduled outages or repairs;
– risks relating to nuclear generation;
– the impact of derivative contracts used to mitigate or manage volume, price and interest rate risk, including increased collateral
requirements, and changes in the commodity prices, interest rates and other conditions that affect the fair value of derivative
contracts;
requirements, and changes in the commodity prices, interest rates and other conditions that affect the fair value of derivative
contracts;
– increases in employee healthcare costs and the potential impact of federal healthcare reform legislation;
– the impact of investment performance and changes in interest rates, legislation, healthcare cost trends, mortality and morbidity on
pension and other postretirement benefits expense and funding requirements;
pension and other postretirement benefits expense and funding requirements;
– changes in the residential real estate brokerage and mortgage industries that could affect brokerage transaction levels;
– unanticipated construction delays, changes in costs, receipt of required permits and authorizations, ability to fund capital projects
and other factors that could affect future generating facilities and infrastructure additions;
and other factors that could affect future generating facilities and infrastructure additions;
– the impact of new accounting pronouncements or changes in current accounting estimates and assumptions on consolidated financial
results;
results;
– the Company’s ability to successfully integrate future acquired operations into its business;
– other risks or unforeseen events, including litigation, wars, the effects of terrorism, embargoes and other catastrophic events; and
– other business or investment considerations that may be disclosed from time to time in MEHC’s filings with the United
States Securities and Exchange Commission (“SEC”) or in other publicly disseminated written documents.
States Securities and Exchange Commission (“SEC”) or in other publicly disseminated written documents.
Further details of the potential risks and uncertainties affecting the Company are described in MEHC’s filings with the SEC, including
Item 1A and other discussions contained in Form 10-K. The Company undertakes no obligation to publicly update or revise any forward-
Item 1A and other discussions contained in Form 10-K. The Company undertakes no obligation to publicly update or revise any forward-
looking statements, whether as a result of new information, future events or otherwise. The foregoing review of factors should not be
construed as exclusive.
construed as exclusive.

Patrick J. Goodman
2010 Fixed-Income Investor Conference
Senior Vice President and Chief Financial Officer
MidAmerican Energy Holdings Company
MidAmerican Energy Holdings Company
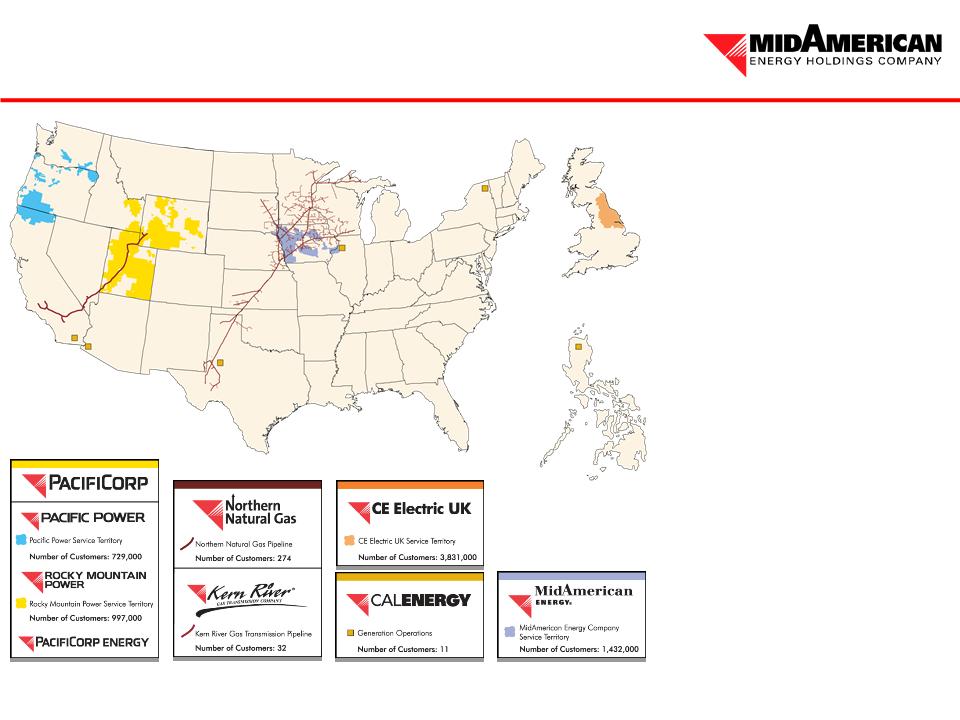
Energy Assets
Energy Assets
REVENUES $11.2 billion
ASSETS $45 billion
CUSTOMERS
Electric: 6.2 million
Natural Gas: 0.7 million
EMPLOYEES 16,300
NATURAL GAS TRANSMISSION
PIPELINE DESIGN CAPACITY
More than 7.0 billion cubic feet per day
GENERATION CAPACITY
18,092 megawatts(1)
NONCARBON GENERATION
More than 4,200 megawatts(1)
23% of total generation capacity
(1) Net MW owned in operation and under
construction as of December 31, 2009
construction as of December 31, 2009
United Kingdom
Philippines

• Berkshire Hathaway ownership allows focus to be on managing medium-
to long-term risks, which promotes long-term sustainability
– Bondholder friendly
• No dividend requirement
– Cash flow is retained in the business and used to help fund growth and improve credit
metrics
metrics
• Access to capital from Berkshire Hathaway allows MEHC to take
advantage of market opportunities
advantage of market opportunities
• Berkshire Hathaway is a long-term holder of assets, and its never-sell
philosophy promotes stability and helps make MEHC the buyer of choice
philosophy promotes stability and helps make MEHC the buyer of choice
Berkshire Hathaway Ownership Benefits

Berkshire Hathaway Equity Commitment
• Equity commitment from AA+ rated parent
– The $3.5 billion commitment has been amended such that the maturity date has
been extended for three years to February 28, 2014, and on March 1, 2011, the
commitment will be changed to $2.0 billion
been extended for three years to February 28, 2014, and on March 1, 2011, the
commitment will be changed to $2.0 billion
• The $2.0 billion level reflects lower debt maturities at MEHC and a reduced need for
equity contributions into our regulated subsidiaries
equity contributions into our regulated subsidiaries
– Access to capital even in times of utility sector and general market stress
No other utility has this quality of explicit financial support
– Commitment can only be drawn for two purposes:
• Paying MEHC parent debt when due
• Funding the general corporate purposes and capital requirements of MEHC’s regulated
subsidiaries
subsidiaries
– Agreement requires funding within 180 days of request
– Future mergers and acquisitions funded separate from this agreement

• Diversification of revenue sources reduces regulatory concentrations
• In 2009, 95% of EBITDA came from investment grade subsidiaries
Consolidated EBITDA(2): $3.7 Billion
MEHC 2009
(1) Excludes HomeServices, which has operations in 20 states and adds further diversification, and equity income from CalEnergy
(2) EBITDA represents operating income plus depreciation and amortization; percentages based on $3.9 billion of EBITDA which excludes Corporate/other of $(190) million
MEHC 2009
Energy Revenue(1): $10.2 Billion
Revenue and EBITDA Diversification

MEHC Financial Summary
Net Income Attributable to MEHC
MEHC Shareholders’ Equity
Property, Plant and Equipment (Net)
Cash Flows from Operations
$1,850
(1)
(1) $1,850m net income includes $646m of after-tax gains related to the termination fee and profit from the investment in Constellation Energy
(2) $1,210m net income excludes a $75m after-tax charge for stock-based compensation and $22m of after-tax income from the sale of Constellation
Energy shares
Energy shares
(3) $2,587m and $3,572m cash flows from operations include $175m and $128m for 2008 and 2009, respectively, related to the termination fee and
profit from the investment in Constellation Energy
profit from the investment in Constellation Energy
(3)
(3)
$1,210
(2)

Segment Information

Segment Information
(1) PacifiCorp includes the acquisition of Chehalis in 2008

Credit Metrics and Ratings
(1) Interest excludes interest on MEHC subordinated debt
(2) Debt excludes MEHC subordinated debt
(3) MEHC subordinated debt excluded from Debt but included in Capital
(4) Ratings for PacifiCorp and Kern River are senior secured rating
• MidAmerican Energy Holdings Company Key Ratios
• Ratings
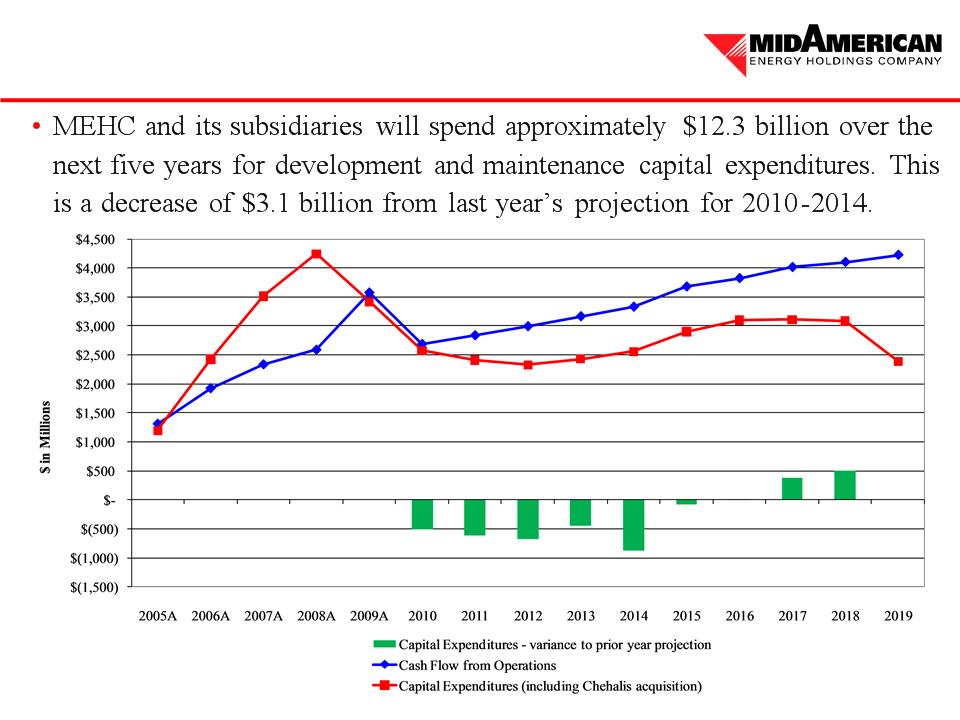
Projected Capital Expenditures
and Cash Flows
and Cash Flows

Projected Capital Expenditures
and Debt Maturities
and Debt Maturities
Projected Capital Expenditures
Long-Term Debt Maturities(1)
(1) Excludes subordinated debt, capital leases and nonregulated project debt
(2) Debt maturities at CE Electric UK exclude maturities at CE UK Gas
($ millions)

Current Credit Facilities
(3) Credit facilities at MEHC, PacifiCorp and MidAmerican Energy Company expire on July 6, 2013
(1)
(2) Credit facility at CE Electric UK expires March 2013; assumes 1.60 $/£ exchange rate
$2,990 Total
$2,792 Total
$1,879 Total
$1,879 Total
(1) Credit facility at HomeServices expires on December 31, 2010
(2)
(3)

Financing Plan 2010-2011
• PacifiCorp anticipates a 2011 debt issuance to, in part, refinance its $500
million November 2011 maturity
million November 2011 maturity
• Northern Natural Gas anticipates a 2011 debt issuance to, in part,
refinance its $250 million June 2011 maturity
refinance its $250 million June 2011 maturity
• MidAmerican Energy Company will issue if additional wind generation
capital expenditures are economic
capital expenditures are economic
• Yorkshire Electricity and Northern Electric plan debt issuances in 2010
and 2011 to support distribution business growth
and 2011 to support distribution business growth
• Kern River 2010 and Apex expansions
• Geothermal plants in Imperial Valley, California, for potential 150 MW
expansion
expansion
• Electric Transmission Texas, LLC issued $225 million in early 2010
with additional issuances likely later in 2010 and 2011
with additional issuances likely later in 2010 and 2011

Questions

2010 Fixed-Income Investor Conference
Richard Walje
President – Rocky Mountain Power

Overview
(1) Net MW owned in operation and under construction as of
December 31, 2009
December 31, 2009
• Headquartered in Portland, Oregon
• 6,447 employees
• 1.7 million electricity customers
• 10,594 net MW generation
capacity(1)
capacity(1)
• Generating capacity by fuel type(1)
– Coal 58%
– Natural gas 21%
– Hydro 11%
– Wind, geothermal & other 10%
(a) Access to other entities’ transmission lines through wheeling arrangements

Business Update
• Rocky Mountain Power’s commitment to employee safety
was recognized both at the state and national level. Currently
ranked in the top 6% of the industry (EEI survey).
was recognized both at the state and national level. Currently
ranked in the top 6% of the industry (EEI survey).
• Rate case settlements with fair revenue results in Utah,
Wyoming and Idaho.
Wyoming and Idaho.
• Retail load in 2009 was 34,256 GWh, a 3.2% decrease from
2008, primarily a recession impact on industrial customers.
Load is anticipated to rebound with a 3.0% increase in 2010
and a 2.6% increase in 2011.
2008, primarily a recession impact on industrial customers.
Load is anticipated to rebound with a 3.0% increase in 2010
and a 2.6% increase in 2011.
• Network reliability improved over the last 5 years, with the
system average interruption duration index improving by 8%
and the system average interruption frequency index by 13%.
system average interruption duration index improving by 8%
and the system average interruption frequency index by 13%.
Rocky Mountain Power service territory
• Wyoming HB 101 (passed) imposes a $1 per MWh wind generation tax beginning in 2012.
This is the first wind tax in the nation. Estimated 2012 impact is less than $2.0m for Rocky
Mountain Power.
This is the first wind tax in the nation. Estimated 2012 impact is less than $2.0m for Rocky
Mountain Power.
• Utah SB 47 (passed) sets state policy to encourage direct load control programs. This is a
first-in-the-nation law to permit an opt-out load control program.
first-in-the-nation law to permit an opt-out load control program.

Business Update – 2010 Challenges
• Given the economic uncertainty, Rocky Mountain Power has
implemented a risk reduction and economic recovery plan that includes:
implemented a risk reduction and economic recovery plan that includes:
– Continued focus on efficiency and cost reductions
• Automated meter reading projects in Rock Springs, Wyoming, and Cedar City and
Smithfield, Utah
Smithfield, Utah
• Encouraging customers to use the company’s Web, paperless billing and
electronic payment
electronic payment
– Continuing to work with at-risk customers
• Bad debt expense increased from $4.1 million in 2007 to $6.1 million in 2008 and
$5.9 million in 2009
$5.9 million in 2009
• Net write-offs of 0.27% of retail revenue are still below the industry average of
0.74% of retail revenue
0.74% of retail revenue
– Prioritizing capital spending to respond to the economic recovery
• New connect activity rebounding in the Salt Lake Valley starting in the 4th quarter
of 2009
of 2009
• Monthly review of large industrial loads and projections for load growth
• Continuing to monitor economic recovery in Utah, Wyoming and Idaho and
update capital allocation
update capital allocation

Regulatory Highlights
• Utah
– 2008 rate case settled for an annual increase of $45 million (3%) effective
May 2009
May 2009
– 2009 rate case order resulted in annual increase of $32 million (2%) effective
February 2010
February 2010
• Includes a 8.34% cost of capital, reflecting a 10.6% authorized return on
equity
equity
– Commission order to proceed to second phase of Energy Cost Adjustment
Mechanism
Mechanism
• Parties will now address design considerations
– PacifiCorp filed an alternative cost recovery application requesting a rate
increase of $34 million (2%) associated with $561 million on two major
construction projects expected to be completed and in-service by June 2010; a
ruling is expected July 1, 2010
increase of $34 million (2%) associated with $561 million on two major
construction projects expected to be completed and in-service by June 2010; a
ruling is expected July 1, 2010

Regulatory Highlights
• Wyoming
– 2008 rate case settled for $18 million (4%) effective May 2009
– Power Cost Adjustment Mechanism effective, $7 million recovery authorized
beginning September 2009; annual filing in January 2010 requesting recovery
of $8 million in deferred net power costs
beginning September 2009; annual filing in January 2010 requesting recovery
of $8 million in deferred net power costs
– General rate case filed in October 2009 requesting an increase of $71 million
based on test period ending December 2010; new rates expected to be effective
August 2010
based on test period ending December 2010; new rates expected to be effective
August 2010
• Idaho
– 2008 general rate case settled for an annual increase of $4 million (3%) for
noncontract retail customers effective April 2009; also found acquisition of
Chehalis generating facility prudent
noncontract retail customers effective April 2009; also found acquisition of
Chehalis generating facility prudent
– Energy Cost Adjustment Mechanism implemented with effective date of July 1,
2009; February 2010 filing by PacifiCorp requesting recovery of $2 million in
deferred net power costs
2009; February 2010 filing by PacifiCorp requesting recovery of $2 million in
deferred net power costs

2010 Fixed-Income Investor Conference
Pat Reiten
President – Pacific Power

Business Update
Pacific Power service territory
• Pacific Power has a 50% reduction in lost-time cases
(lower severity of incidents)
(lower severity of incidents)
• Rate case settlements with fair revenue results –
Washington, Oregon and California
Washington, Oregon and California
• Retail load was 18,454 GWh in 2009 vs. 18,982
GWh in 2008, a 2.8% decrease, and is anticipated to
decrease 2.4% from 2009 to 2011
GWh in 2008, a 2.8% decrease, and is anticipated to
decrease 2.4% from 2009 to 2011
• Significant progress in the Energy Gateway
transmission expansion; the first line segment fully
in-service December 31, 2010
transmission expansion; the first line segment fully
in-service December 31, 2010
• Signed settlement agreement with federal, state and
other parties concerning the Klamath hydroelectric
system
other parties concerning the Klamath hydroelectric
system
• Network reliability has remained relatively
consistent over the last five years
consistent over the last five years
• Signed contract with an employee union
• Initiated six-state enhanced customer
communication campaign
communication campaign

Business Update – 2010 Challenges
• Managing costs, identifying savings and operating below 2005 run rates
- Carefully review staffing requirements
- Assure contract and spending discipline
- Engage employees
• Bad debt expense was $5.9 million in 2009 vs. $8.6 million in 2008 mainly due
to improved communications with customers whose accounts were delinquent
to improved communications with customers whose accounts were delinquent
• Taking action regarding customers and carefully managing risks, including
investment, credit, customer debt and load forecasts
investment, credit, customer debt and load forecasts
- Monitor all key customers; deposits and prompt payments required
- Communicate through quarterly meetings, regional customer conferences, and key
account services and outreach, targeting economically stressed
account services and outreach, targeting economically stressed

Regulatory Highlights
• Oregon
– Power costs update increase of $4 million effective January 1, 2010, through the
Transition Adjustment Mechanism
Transition Adjustment Mechanism
– Order approving 2009 general rate case settlement authorized annual increase of
$42 million (4%) effective February 2010; also approved tariff riders to collect
$8 million over three years
$42 million (4%) effective February 2010; also approved tariff riders to collect
$8 million over three years
– Filed 2010 general rate case requesting an increase of $130.9 million (13.1%)
• Includes Populus to Terminal segment of transmission plan, two new wind
resources, environmental improvement projects at Dave Johnston plant, system
reliability, hydro relicensing and other investments; if approved, new rates to
take effect January 1, 2011
resources, environmental improvement projects at Dave Johnston plant, system
reliability, hydro relicensing and other investments; if approved, new rates to
take effect January 1, 2011
– Initial filing for 2011 Transition Adjustment Mechanism supports an increase of
$69.1 million (7.0%); filing will be updated and adjusted during the year with new
rates effective January 1, 2011
$69.1 million (7.0%); filing will be updated and adjusted during the year with new
rates effective January 1, 2011
• Washington
– Washington Utilities and Transportation Commission approved an all-party
settlement of general rate case resulting in annual increase of $14 million (5%)
effective January 1, 2010
settlement of general rate case resulting in annual increase of $14 million (5%)
effective January 1, 2010

Regulatory Highlights

Energy Gateway
Transmission Expansion
Transmission Expansion
• Highlights
– Approximately 2,000 new line
miles
miles
– More than 100 communities
– Five new substations
– More than 150 million pounds
of conductor
of conductor
– PacifiCorp investment of more
than $6 billion
than $6 billion
Energy Gateway Transmission Expansion Plan
(1,500 MW build-out configuration)
• Key Principles
– Secure capacity for the long-
term benefit of customers
term benefit of customers
– Support multiple resource
scenarios
scenarios
– Secure regulatory and
community support
community support
– Build it
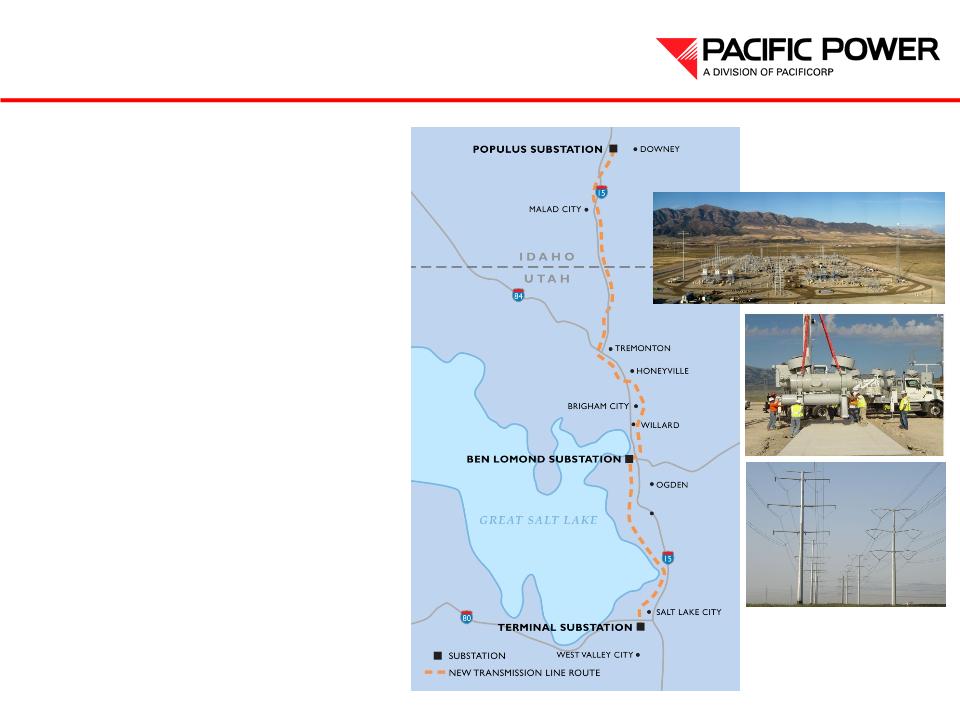
Energy Gateway
Current Construction
Current Construction
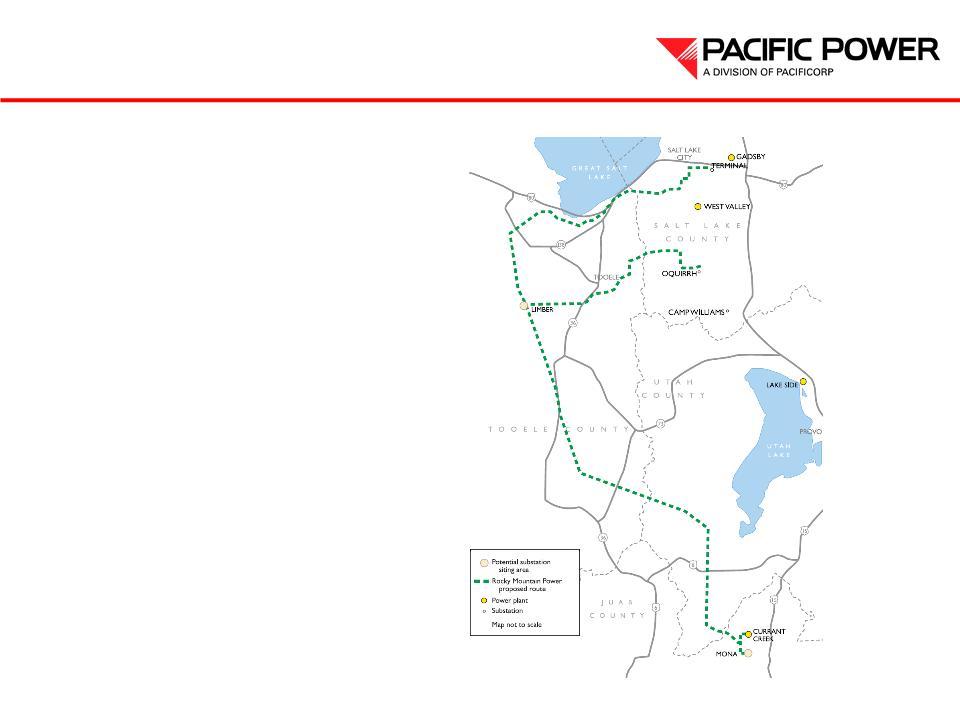
• Gateway Central
– Populus to Terminal
• 135 miles – double-circuit
345kV construction
345kV construction
• In-service date:
– Ben Lomond to Terminal –
June 2010
– Populus to Ben Lomond –
December 2010
December 2010
• Status
– Contract award October 2008
– Commenced February 2009
• Regulatory recovery process
underway
underway
Energy Gateway
Current Construction
Current Construction
• Gateway Central
– Mona to Oquirrh
• 114 miles – double-circuit
345 kV and single-circuit
500 kV construction
345 kV and single-circuit
500 kV construction
• In-service 2013-2014
• Permitting and bid process
underway
underway

Energy Gateway Progress Update
• Gateway South
– Aeolus to Mona
• 395 miles – single-
circuit 500 kV
construction
circuit 500 kV
construction
• In-service 2017 – 2019
• Permitting initiated
– Sigurd to Red Butte
• 165 miles – single-
circuit 345 kV
circuit 345 kV
• In-service 2014
• Permitting underway

Energy Gateway Progress Update
• Gateway West
– Windstar to Populus to
Hemingway
Hemingway
• 1,050 miles – single-
circuit 500 kV and
single-circuit 230 kV
construction
circuit 500 kV and
single-circuit 230 kV
construction
• In-service 2014 – 2018
• Permitting underway
• Westside
– Wallula to McNary
segment under
development
segment under
development
– Exploring development
west of Hemingway
west of Hemingway

2010 Fixed-Income Investor Conference
Micheal Dunn
President – PacifiCorp Energy

Resource Portfolio
(1) Net MW owned in operation and under construction as of December 31, 2009
10,594 net MW generation capacity(1)
• 6,116 MW coal-fueled generation
• 2,232 MW gas-fueled generation
• 1,158 MW hydroelectric
• 1,032 MW wind
• 34 MW geothermal
• 22 MW other
CA
NV
AZ
UT
WY
OR
WA
MT
CO
ID
Pacific Power Service Territory
Coal Plants
Natural Gas Plants
Wind Projects
Coal Mines
Geothermal and Other
Hydro Systems
Rocky Mountain Power Service
Territory
Territory

Generating Capability (MW)
by Fuel Type
by Fuel Type
March 31, 2006
December 31, 2009
(1) Net MW owned in operation and under construction
8,470 MW (1)
10,594 MW (1)

Wind Resource Additions
PacifiCorp’s owned wind-powered generation resource portfolio is composed of the
following projects:
following projects:
• MEHC Renewable Energy Commitment:
– PacifiCorp expects to exceed the 2015 commitment to acquire at least 1,400 MW of new cost-effective renewable
resources by the end of 2010 with a combination of owned and purchased power agreements
resources by the end of 2010 with a combination of owned and purchased power agreements

Future Resource Requirements
• Near-term resource gaps addressed with demand response programs, energy efficiency, and
firm market purchases; long-term resource gaps will also be addressed with thermal
generation and renewables
firm market purchases; long-term resource gaps will also be addressed with thermal
generation and renewables

Future Generation
• Long-term mix and timing of resources largely will depend on the
specifics of climate change, renewable portfolio requirements and
comparative resource type economics
specifics of climate change, renewable portfolio requirements and
comparative resource type economics
• In response to regulatory uncertainty, the company is planning for a
diverse resource mix consisting of:
diverse resource mix consisting of:
– Wind and other types of renewable resources
– Natural gas-fueled generation
– Firm market purchases
– Demand-side management, including both dispatchable load control and
energy efficiency measures
energy efficiency measures

Impact of Economy on
Capital Requirements
Capital Requirements
Given lower load growth, capital projects were deferred or removed
which totaled $1.3 billion in reduction between 2010 and 2014
which totaled $1.3 billion in reduction between 2010 and 2014
– Deferral of two natural gas-fueled plants; one from 2012 to 2015 and another from
2013 to 2017
2013 to 2017
– Postponement of 260.5 MW of wind resource acquisitions from 2012-2016 until
after 2016
after 2016
• Aligns with planned in-service date of Energy Gateway transmission in
Wyoming, which is necessary to access low cost wind resources in Wyoming
Wyoming, which is necessary to access low cost wind resources in Wyoming
• Maintains state and potential federal renewable portfolio standard requirements
and exceeds MidAmerican Energy Holdings Company acquisition commitments
and exceeds MidAmerican Energy Holdings Company acquisition commitments
• Deferred gas and wind generation projects are replaced with economic, flexible
purchased power in the interim
purchased power in the interim
– A general reduction in overall capital spending

Questions

2010 Fixed-Income Investor Conference
Bill Fehrman
President – MidAmerican Energy Company
Overview
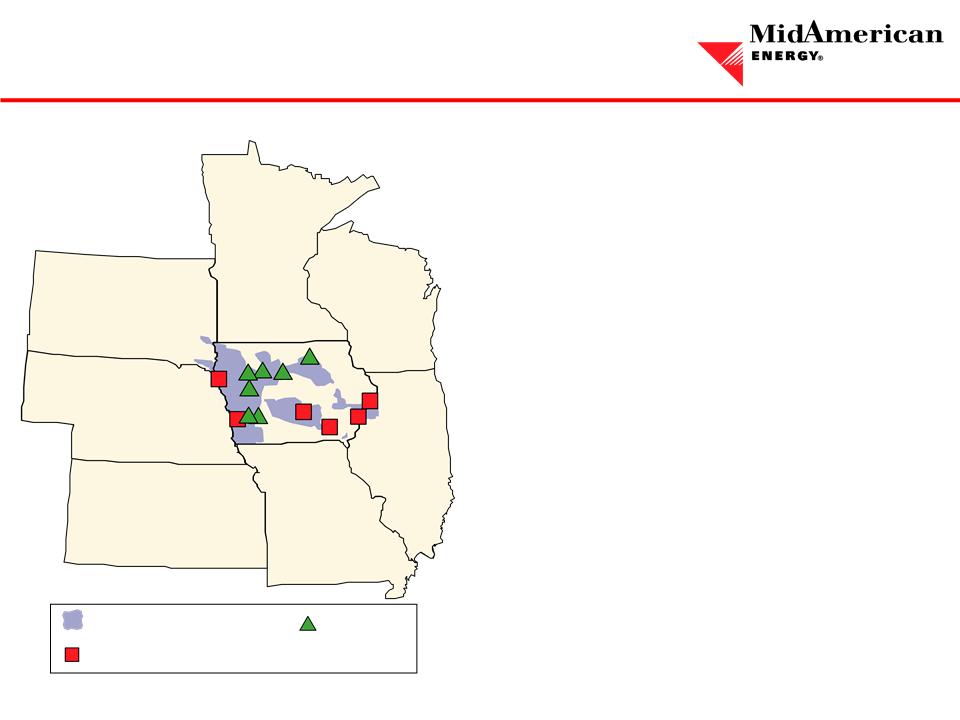
Wind Projects
MidAmerican Energy
Service Territory
Service Territory
Major Generating Facilities
(1) Net MW owned as of December 31, 2009
SD
NE
KS
MO
IL
WI
MN
IA
• Headquartered in Des Moines, Iowa
• 3,567 employees
• 1.4 million electric and natural gas
customers in four Midwestern states
customers in four Midwestern states
• 6,443 net MW generation
capacity(1)
capacity(1)
• Generating capacity by fuel type(1)
– Coal 52%
– Natural gas 20%
– Wind 20%
– Nuclear 7%
– Other 1%

Business Update
• Customer Service
– One of the top ranked utilities in the Midwest region according to 2009 customer
satisfaction studies by J.D. Power and Associates
satisfaction studies by J.D. Power and Associates
– Regulated bad debt expense decreased from $11.2 million in 2008 to $10.1 million
in 2009
in 2009
– Expanded energy efficiency programs to Illinois, South Dakota and Nebraska to
provide our customers with an opportunity to better manage their energy costs
provide our customers with an opportunity to better manage their energy costs
• Employee Commitment
– 2010 is showing improvement in safety performance in numbers of accidents
– Focused on control of benefit costs and overall staffing levels

Business Update
• Financial Strength
– Maintained strong financial results despite economic slowdown and cooler than normal summer
weather – regulated electric retail sales were 3.6% lower in 2009 than 2008 and regulated electric
wholesale margins were $104.7 million lower in 2009 than 2008
weather – regulated electric retail sales were 3.6% lower in 2009 than 2008 and regulated electric
wholesale margins were $104.7 million lower in 2009 than 2008
– Successfully implemented cost containment efforts to lower both capital and O&M spending in
2009 and achieved income tax benefits; continue with aggressive cost containment efforts in
2010
2009 and achieved income tax benefits; continue with aggressive cost containment efforts in
2010
– 2009 net income up 2.0% to $350 million with a return on average equity of 12.7%
– Base electric rate stability for Iowa customers through 2013 – opportunity for rate relief if returns
fall below 10%
fall below 10%
– Significantly higher operating cash flows in 2009 due to 2008 wind projects and other income tax
benefits for the year
benefits for the year
– Experiencing an increase in 2010 retail sales but significant winter storms in January resulted in
increased O&M and capital expenditures of approximately $26.5 million in total
increased O&M and capital expenditures of approximately $26.5 million in total
– MidAmerican Energy Company is in a long generation position with a diversified portfolio,
which will be a significant strategic advantage as markets regain strength and new federal
environmental programs are enacted
which will be a significant strategic advantage as markets regain strength and new federal
environmental programs are enacted

Business Update
• Environmental Respect
– Continued investment in emissions control projects
• Low NOx combustion systems at all coal-fueled units
• Dry scrubber and baghouse projects installed at Louisa Generating Station and
Walter Scott, Jr. Energy Center Unit 3
Walter Scott, Jr. Energy Center Unit 3
• Regulatory Integrity
– Focus is on a balanced outcome for our customers, communities, regulators and
legislators
legislators
– Significant use of binding rate-making principles in Iowa in advance of construction
provides for greater regulatory certainty during future rate cases while meeting the
expectations of policymakers and regulators
provides for greater regulatory certainty during future rate cases while meeting the
expectations of policymakers and regulators
– Approximately 40% of Iowa electric rate base subject to advanced rate-making
principles
principles
– Working with regulators, legislators and other stakeholders to promote legislation
allowing for recovery of expenses up to $5 million per year for no more than three
years to consider potential sites for nuclear generation in Iowa
allowing for recovery of expenses up to $5 million per year for no more than three
years to consider potential sites for nuclear generation in Iowa

Business Update
• Operational Excellence
– Significant operational focus on minimizing plant emissions
– Walter Scott, Jr. Energy Center Unit 4 maintenance outage in 2010
– Seamlessly entered the Midwest ISO as a transmission owning member
September 1, 2009
September 1, 2009
• MidAmerican generation plants have set several production records since
entering the market
entering the market
– Automated meter reading
• Project completed in October 2009, six months ahead of schedule
• 599,507 electric meters and 534,343 gas meters were changed out
• Ability to collect meter reads within the billing window rose from 93.75% in
2007 to 98.8% in 2009
2007 to 98.8% in 2009

• 1,284 MW owned and operated, which ranks MidAmerican Energy
Company No. 1 in wind generation ownership among rate-regulated
utilities in the United States
Company No. 1 in wind generation ownership among rate-regulated
utilities in the United States
• Continue to improve MidAmerican Energy Company’s overall carbon
footprint
footprint
Wind Project Summary
(1) Including AFUDC
Year | Net MW | |||
Facility | Location | Installed | Owned | Capital (1) |
Intrepid | Schaller, IA | 2004-2005 | 176 | |
Century | Blairsburg, IA | 2005-2008 | 200 | |
Victory | Westside, IA | 2006 | 99 | |
Pomeroy | Pomeroy, IA | 2007-2008 | 256 | |
Adair | Adair, IA | 2008 | 175 | |
Carroll | Carroll, IA | 2008 | 150 | |
Charles City | Charles City, IA | 2008 | 75 | |
Walnut | Walnut, IA | 2008 | 153 | |
Total Wind Installed at 12/31/2009 | 1,284 | $2.2 Billion | ||

• MidAmerican Energy Company reached a settlement on rate-making
principles with the Iowa Office of Consumer Advocate for the development
of up to 1,001 MW additional wind generation
principles with the Iowa Office of Consumer Advocate for the development
of up to 1,001 MW additional wind generation
• MidAmerican Energy Company filed a rate-making principles application
filing with the Iowa Utilities Board March 24, 2009
filing with the Iowa Utilities Board March 24, 2009
• Iowa Utilities Board approved the application on December 14, 2009
– A challenge to the Iowa Utilities Board order has been filed in Iowa District Court
• Key provisions of the Iowa Utilities Board order are:
– Develop up to 1,001 MW of new wind generation by December 31, 2012, but not more than
500 MW completed in 2012
500 MW completed in 2012
– Return on equity of 12.2% in all future Iowa rate proceedings
– Projects that do not exceed stipulated cost cap levels (installed cost/kW) are not subject to
prudence or other regulatory review
prudence or other regulatory review
– Depreciable life for wind generation is 20 years
Future Wind

Generating Capacity by Fuel Type
December 31, 2000
December 31, 2009
(1) Net MW owned
4,086 MW (1)
6,443 MW (1)

Wind Benefit –
Decreasing Carbon Footprint
Note: MidAmerican Energy Company sold the environmental attributes of some of this generation to third parties and values do not represent the
carbon footprint of energy delivered to MidAmerican Energy Company’s retail customers
carbon footprint of energy delivered to MidAmerican Energy Company’s retail customers

Ongoing Risk Mitigation
• Continued cost containment efforts
– Fewer contractors
– Manage head count
• Minimize counterparty credit risk through collateral offsets and
other provisions
other provisions
• Continue to pursue hedging strategies to minimize market risk
• Balanced unregulated retail portfolio
• Evaluating transmission opportunities that will enhance the value of
generation resources
generation resources
• With 27% of generating capacity currently provided by noncarbon
sources and authorization to construct up to an additional 1,001 MW
of wind generation in Iowa, MidAmerican Energy Company is well-
positioned to meet the long-term needs of its customers in an
environmentally responsible manner
sources and authorization to construct up to an additional 1,001 MW
of wind generation in Iowa, MidAmerican Energy Company is well-
positioned to meet the long-term needs of its customers in an
environmentally responsible manner

Questions

2010 Fixed-Income Investor Conference
Mark Hewett
President – Northern Natural Gas Company

Overview
TX
OK
KS
NE
SD
MN
WI
IA
• Headquartered in Omaha, Nebraska
• 878 employees
• 15,000-mile interstate natural gas
transmission pipeline system
transmission pipeline system
• Market area design capacity of 5.5 Bcf/day
plus 2.0 Bcf/day field area delivery
capacity
plus 2.0 Bcf/day field area delivery
capacity
• Five natural gas storage facilities with a
total firm capacity of 73 Bcf and more than
2.0 Bcf of peak day delivery capability
total firm capacity of 73 Bcf and more than
2.0 Bcf of peak day delivery capability
• Access to six major supply basins
• Annual deliveries of more than 920 Bcf

Recent Accomplishments
• Continued favorable operating results in 2009
– Continued to demonstrate financial strength during the economic crisis
– Completed several Northern Lights expansion projects, including Zone EF
expansion adding almost 110,000 dth per day of additional market area capacity
expansion adding almost 110,000 dth per day of additional market area capacity
– Identified and executed on sustainable cost-reduction and revenue-growth strategies
of $16 million
of $16 million
– Increased the integrity and reliability of the pipeline while managing operating
costs and staffing
costs and staffing
• In the 2010 Mastio & Company pipeline industry survey report,
Northern was ranked No. 1 out of 16 Mega Pipelines and tied for No. 2
out of 43 interstate pipelines in customer satisfaction
Northern was ranked No. 1 out of 16 Mega Pipelines and tied for No. 2
out of 43 interstate pipelines in customer satisfaction

Strong Market and Competitive Position
• Strategic location in high-demand, upper Midwest market areas
• Retains competitive advantage by providing delivery to city gates in
Northern’s upper Midwest market area
Northern’s upper Midwest market area
• Expanding electric generation and other end-use markets enabled
Northern to establish daily peak delivery record in January 2009
Northern to establish daily peak delivery record in January 2009
• Customer base dominated by local distribution companies
• Lowest transportation cost of natural gas to customers in the upper
Midwest
Midwest
• Provides customers with flexibility to access multiple supply basins
– Hugoton, Permian, Anadarko, Rocky Mountain, Williston and Canada

Revenue Stability
Market Area Transportation
Contract Maturities (1)
(1) Based on MDQ (Maximum Daily Quantities of market area
entitlement in decatherms)
entitlement in decatherms)
Transportation & Storage Revenue
• 70% of 2009 market area transportation revenue was derived from local
distribution companies
distribution companies
• 56% of 2009 storage revenue resulted from long-term firm contracts, with an
average remaining contract life of approximately 8 years
average remaining contract life of approximately 8 years
• 50% of market area capacity is contracted beyond 2015
• Shippers that do not meet our tariff credit standards are required to post collateral

• Northern’s system accesses Granite
Wash tight sands
Wash tight sands
• Working with several customers to
attach incremental supply to its
system from this play; however,
market prices continue to support
movement of gas to the east
attach incremental supply to its
system from this play; however,
market prices continue to support
movement of gas to the east
• Continued shale development
should improve the prospects for
gas demand due to increased supply
availability
should improve the prospects for
gas demand due to increased supply
availability
• Change in gas flow patterns across
the U.S. is likely as nontraditional
supply is developed and brought to
market
the U.S. is likely as nontraditional
supply is developed and brought to
market
Shale Gas Opportunities

Section 5 Rate Proceeding
• Section 5 of the Natural Gas Act allows any party or the Federal Energy
Regulatory Commission to challenge the current rates or service of an
interstate pipeline as no longer being just and reasonable
Regulatory Commission to challenge the current rates or service of an
interstate pipeline as no longer being just and reasonable
– FERC staff and intervenors have the burden of proof
– Rate changes are prospective only and no service changes
• FERC issued order on November 19, 2009
– First time in more than 20 years (Order was initiated by FERC)
– Evaluation based solely on 2008 Form 2 information
– Commission concluded:
• Northern’s calculated cost of service indicates an over recovery of $167.4 million
• Commission calculated return on equity of 24.4%
– Northern submitted a cost and revenue study on February 4, 2010
• Northern study indicated an under recovery of $63 million and an 8% return on equity
– Set for hearing-expedited schedule
• Initial decision (ALJ) by November 15, 2010
• Commission decision not expected before the first quarter of 2011

Overall Strategy
• Aggressively challenge appropriateness of Section 5 proceeding
• Demonstrate existing rates are just and reasonable
• Take control of the Section 5 proceeding by filing a Section 4
general rate case proceeding
general rate case proceeding
• Propose service and rate design changes in the Section 4
proceeding that redistribute operating and financial risk between
the company and its customers
proceeding that redistribute operating and financial risk between
the company and its customers
• Prepare to litigate
• Support customer driven settlement discussions to terminate
Section 5 proceeding
Section 5 proceeding

2010 Fixed-Income Investor Conference
Gary Hoogeveen
President – Kern River Gas Transmission Company

Overview
CA
NV
WY
UT
AZ
• Headquartered in Salt Lake City, Utah
• 162 employees
• 1,700-mile interstate natural gas
transmission pipeline system
transmission pipeline system
• Delivers natural gas from Rocky
Mountain basin to markets in Utah,
Nevada, California and Arizona
Mountain basin to markets in Utah,
Nevada, California and Arizona
• Design capacity: 1.8 million Dth per
day of natural gas
day of natural gas
• Pipeline of choice to Southern
California and Las Vegas
California and Las Vegas
• Delivered approximately 22%(1) of
California’s demand for natural gas
California’s demand for natural gas
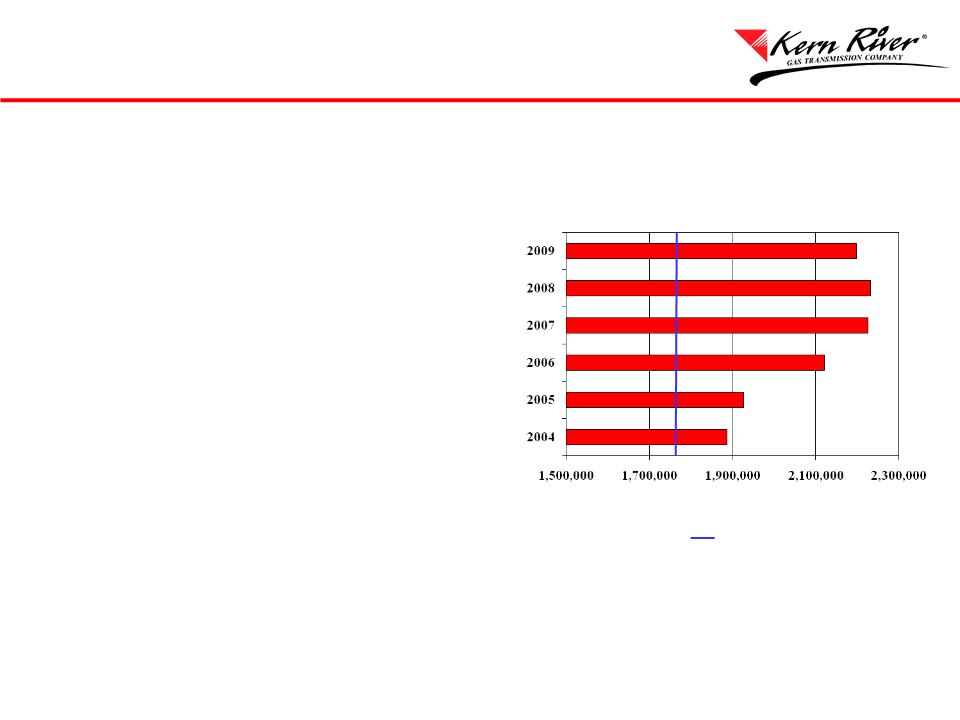
• During 2009, scheduled throughput
averaged 123% of design capacity
averaged 123% of design capacity
• Ranked No. 2 out of 43 interstate
pipelines in 2010 Mastio & Company
survey for customer satisfaction
pipelines in 2010 Mastio & Company
survey for customer satisfaction
• Two expansion projects developed to
expand the pipeline capacity by 23%
expand the pipeline capacity by 23%
Recent Accomplishments
Daily Average Scheduled Volume
Throughput in Dth
Design capacity
(1) Based on the 2009 California Gas Report

• Federal Energy Regulatory Commission order issued
December 17, 2009
December 17, 2009
– Minor adjustments to current rates
– Hearing and settlement procedures for future rates
• Kern River filed compliance filings
• Ongoing settlement discussions with customers related
to future rates after initial contract periods end
to future rates after initial contract periods end
• Expect final order for current rates by second quarter
2010
2010
Rate Case

Competitive Position
• Access to economical Rocky Mountain gas
supplies
supplies
• Direct service to end-users avoids rate stacks of
local distribution companies
local distribution companies
• Relatively new system
– Efficient
– Low fuel rates
– Limited cost for integrity management
• Reasonable market growth from incremental
electric generation
electric generation
– 8,378 MW projected for California
– 500 MW projected for Nevada
• Kern River is the only major pipeline
delivering gas from favorably priced Rocky
Mountain supply basin directly to California
delivering gas from favorably priced Rocky
Mountain supply basin directly to California
– Ruby Pipeline – El Paso’s 1.5 Bcf/d pipeline
from Rockies to Northern California is
scheduled to be in-service in spring 2011
from Rockies to Northern California is
scheduled to be in-service in spring 2011
• REX Pipeline – Kinder Morgan’s 1.8 Bcf/d
pipeline, originating in the Rockies and
delivering to Midwest and Eastern U.S.
markets, became fully operational in
November 2009
pipeline, originating in the Rockies and
delivering to Midwest and Eastern U.S.
markets, became fully operational in
November 2009
Revenue Stability
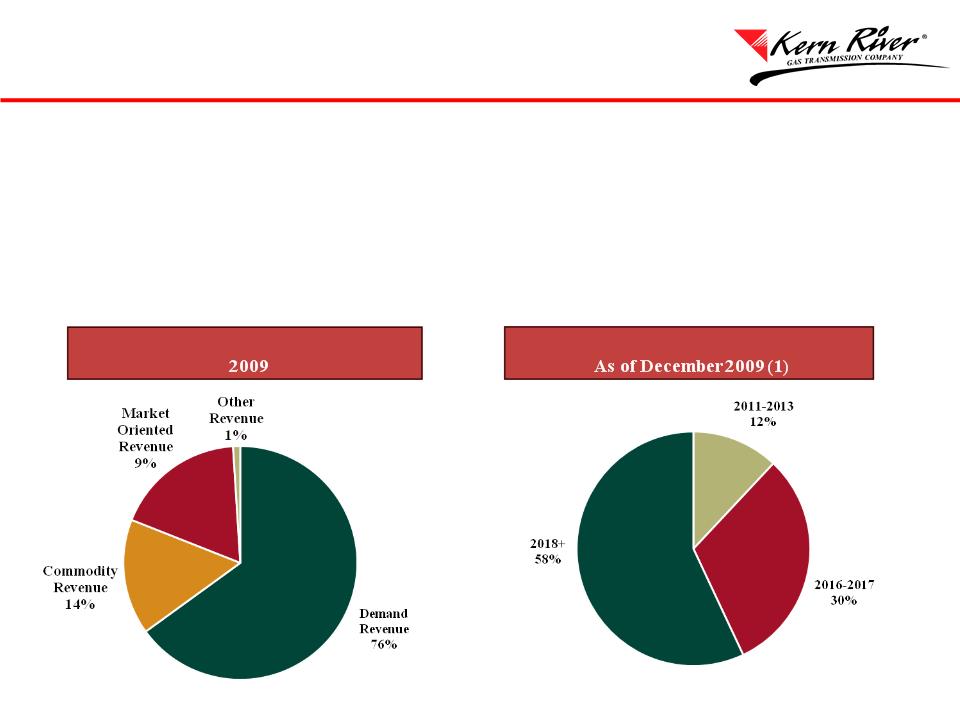
Contract Maturities
Revenue Distribution
• 76% of revenue is from demand charges
• 88% of contracts mature after 2015
• Weighted average shipper rating of BBB+/Baa1
• Shippers that do not meet our tariff credit standards are required to post collateral
(1) Based on daily demand quantity
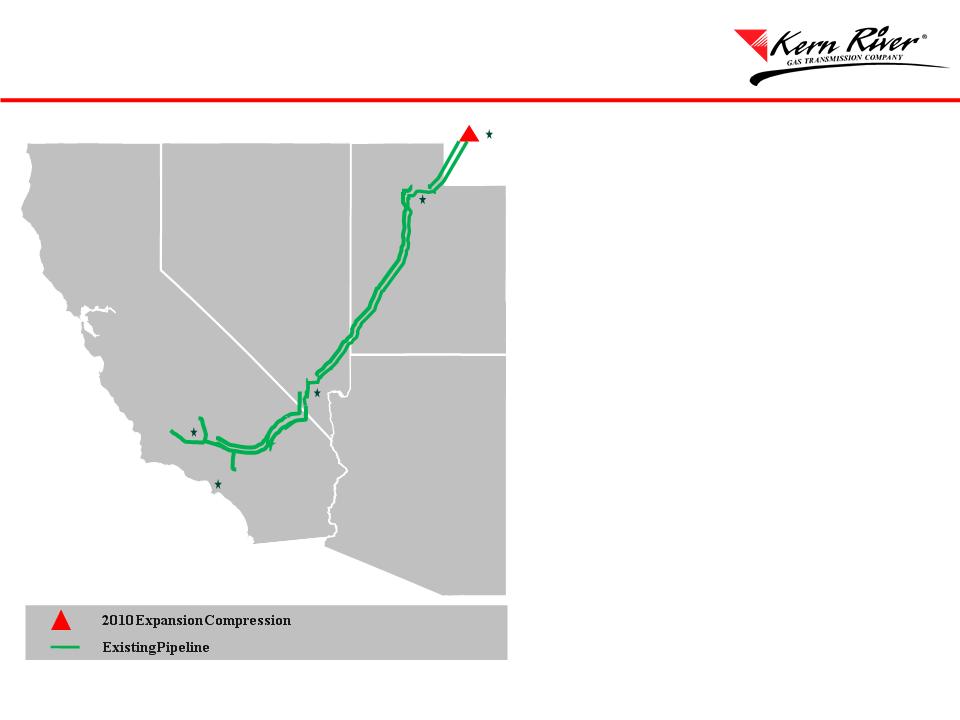
• Economically expand by 145,000 Dth
per day
per day
• Fully contracted with signed
precedent agreements from 11
shippers with a weighted average
rating of BBB/Baa1
precedent agreements from 11
shippers with a weighted average
rating of BBB/Baa1
• Service to Southern California and
Las Vegas
Las Vegas
• $62 million capital cost
• Add 20,500 HP of incremental
compression
compression
• Restage existing compression
• Increase maximum allowable
operating pressure from 1,200 psig to
1,333 psig
operating pressure from 1,200 psig to
1,333 psig
• FERC certificate received June 2009
• Anticipated in-service April 2010
Las Vegas
Bakersfield
Los Angeles
Salt Lake
City
2010 Expansion Project
Muddy Creek

Apex Expansion Project
Mainline Expansion
• Economically expand by 266,000 Dth
per day
per day
• 20-year term contract with NV Energy
• Service to Las Vegas
• $373 million capital cost
• Close Wasatch Loop with 28 miles of
36” pipe
36” pipe
• Add 78,000 HP of new compression at
four locations and restage four existing
compressors
four locations and restage four existing
compressors
• Filed for certificate authority from
FERC December 2009
FERC December 2009
• Approval expected by October 2010
• Anticipated in-service November 1, 2011
Backhaul Capacity Contract
• New ability to receive 400 MDth/d of
firm backhaul
firm backhaul
• In-service April 1, 2009
Bakersfield
Los Angeles
Salt Lake
City
Apex Expansion Loop
Las Vegas
Apex Expansion Pipe
Existing Pipeline

Questions

2010 Fixed-Income Investor Conference
Phil Jones
President – CE Electric UK

Overview
U.K.
London
Newcastle
• Predominantly a wires-only business
serving 3.8 million electricity end-users –
no generation or retail activity
serving 3.8 million electricity end-users –
no generation or retail activity
• Two adjacent license areas allowing us to
operate as a single business
operate as a single business
• Ofgem operates as the single energy regulator covering the gas and electricity
markets.
markets.
• Price controls are set to recover Ofgem’s view of efficient costs over the next
five years (fiscal year beginning April 1).
five years (fiscal year beginning April 1).
• The 14 distribution network operators are licensed to construct and maintain the
electricity network within each geographic area; license requires a 25-year
notice period to be served by the regulator.
electricity network within each geographic area; license requires a 25-year
notice period to be served by the regulator.
• Transmission and distribution is subject to significant economic regulation,
whereas generation, metering and retail operations are open to competition.
whereas generation, metering and retail operations are open to competition.
• The seven DNO ownership groups include different business models – CE
Electric UK is one of three wires-only groups whereas other groups, for example
EDF and E.ON, hold generation and retail in addition to distribution.
Electric UK is one of three wires-only groups whereas other groups, for example
EDF and E.ON, hold generation and retail in addition to distribution.
• DNOs bill retail companies for their use of the electricity network. This charge
amounts to approximately 15 percent of an average domestic customer’s bill, or
around £76 per year.
amounts to approximately 15 percent of an average domestic customer’s bill, or
around £76 per year.
On balance, we are comfortable with the
DPCR 5 settlement
DPCR 5 settlement
Negatives
Positives
Revenues increase annually by an average of 6.4% plus
inflation from April 2010 – March 2015
inflation from April 2010 – March 2015
• Revenues decoupled from volume risk
• Properly designed and calibrated incentive schemes
Cost allowances cover our projected costs
• Full funding of our forecasted indirect costs
• Funds an increased asset-related capital program
• Approval of our proposed outputs
Pension costs covered
• Full funding of distribution business pension costs
• Faster recovery of pension costs than in DPCR 4
Income taxes covered
• Tax-related revenues sufficient to meet projected taxes
• Protection against changes in tax legislation or
accounting standards
accounting standards
Out-performance opportunities exist
• Already rewarded for provision of challenging forecasts
• The opportunity to enhance the base equity return
through cost and service performance
through cost and service performance
Rate of Return
• Base equity return was under our targeted floor of 10.5%
and set at ~ 9.4%
and set at ~ 9.4%
• Over the five-year period, approximately £100m of our
cost recovery has been included as RAV and effectively
defers recovery to 2015 and beyond relative to the
DPCR 4 treatment
cost recovery has been included as RAV and effectively
defers recovery to 2015 and beyond relative to the
DPCR 4 treatment

Ofgem factored in outperformance
when it set the cost of capital
when it set the cost of capital
Assumes Ofgem
gearing, debt rates and
expenditure baselines are
matched
gearing, debt rates and
expenditure baselines are
matched
Source: Electricity Distribution Price Control Review Final Proposals Ref: 144/09 7 December 2009 Chapter 4 – Risks and rewards Page 58 Figure 4.2 -
Potential equity returns (RoRE) at 4.7 per cent WACC (vanilla)
Potential equity returns (RoRE) at 4.7 per cent WACC (vanilla)
Range of
possible
RORE
outcome
possible
RORE
outcome

RAV grows by £401m in real terms and
we aim to deliver outperformance
we aim to deliver outperformance
Notes:
1. All values are shown in 2007/08 prices.
2. Network investment is not directly comparable because outputs are more clearly specified in DPCR 5 than they were in DPCR 4.
3. The costs above exclude all pension costs, as per the Ofgem efficiency comparisons. Pension costs are assessed and funded separately through the price control
• RAV grows by
22% in real terms
and inflation will
also be added
22% in real terms
and inflation will
also be added

Incentives provide upside opportunities
• We have already secured some benefits as a result of our forward plan
being well received by Ofgem
being well received by Ofgem
– An additional £33m is included in our DPCR 5 allowances
• We expect modest outperformance from the Quality of Supply incentives
– The DPCR 5 targets are more reasonable than the DPCR 4 equivalents
– We continue to invest in remote control to improve network performance and reliability
• Line losses represent an opportunity for further upside
– The targets are tighter than in DPCR 4; however, the downside risk is now capped
– The incentive rate has been increased; for DPCR 4 it was set at £48 per MWh, and in
DPCR 5 it has increased to £60 per MWh
DPCR 5 it has increased to £60 per MWh
• Average debt costs are still above the Ofgem assumption but will improve
– We are planning incremental financing during the second quarter of 2010
– We will retain gearing just below the Ofgem assumption of 65%
Key Strengths
• Our performance in 2005 – 2010 (DPCR 4) has consistently been above the sector
average, particularly in safety.
average, particularly in safety.
• We are delivering positive trends on network performance, cost efficiency and customer
satisfaction and will continue to focus on these areas during the DPCR 5 period.
satisfaction and will continue to focus on these areas during the DPCR 5 period.
• Our projections are built on controllable operational cost performance.
• We have secured ongoing cost reimbursement of our significant pension liabilities over
the long term.
the long term.
• The new price control:
– Retains the inflation protection built into the existing arrangement
– Introduces full protection against a reduction in the demand for electricity
– Introduces a tax correction mechanism that covers legislative or accounting
standard changes
standard changes
– Builds in an average annual revenue increase of 6.4%, before inflation, over the five
year period, consistently strengthening our credit metrics as the period unfolds
year period, consistently strengthening our credit metrics as the period unfolds
• We will continue to evaluate growth opportunities that are credit positive.

Questions

Gregory E. Abel
2010 Fixed-Income Investor Conference
President and Chief Executive Officer
MidAmerican Energy Holdings Company

Managing Through Uncertain Times
• Our overall strategy remains unchanged
• Operating in challenging economic times
• Balanced resource decisions
• Transmission investment opportunities
• Energy policy
• Regulatory uncertainty
• Acquisition philosophy
• BYD

Questions
