CASCADE FINANCIAL CORPORATION SELECTED FINANCIAL DATA
(Dollars in thousands, except per share data)
| | | FOR THE YEARS ENDED | |
| | | DECEMBER 31, | |
| | | 2007 | | | 2006 | | | 2005 | | | 2004 | | | 2003 | |
| Interest income | | $ | 93,935 | | | $ | 82,658 | | | $ | 67,802 | | | $ | 55,316 | | | $ | 50,363 | |
| Interest expense | | | 50,540 | | | | 43,268 | | | | 31,276 | | | | 22,919 | | | | 22,753 | |
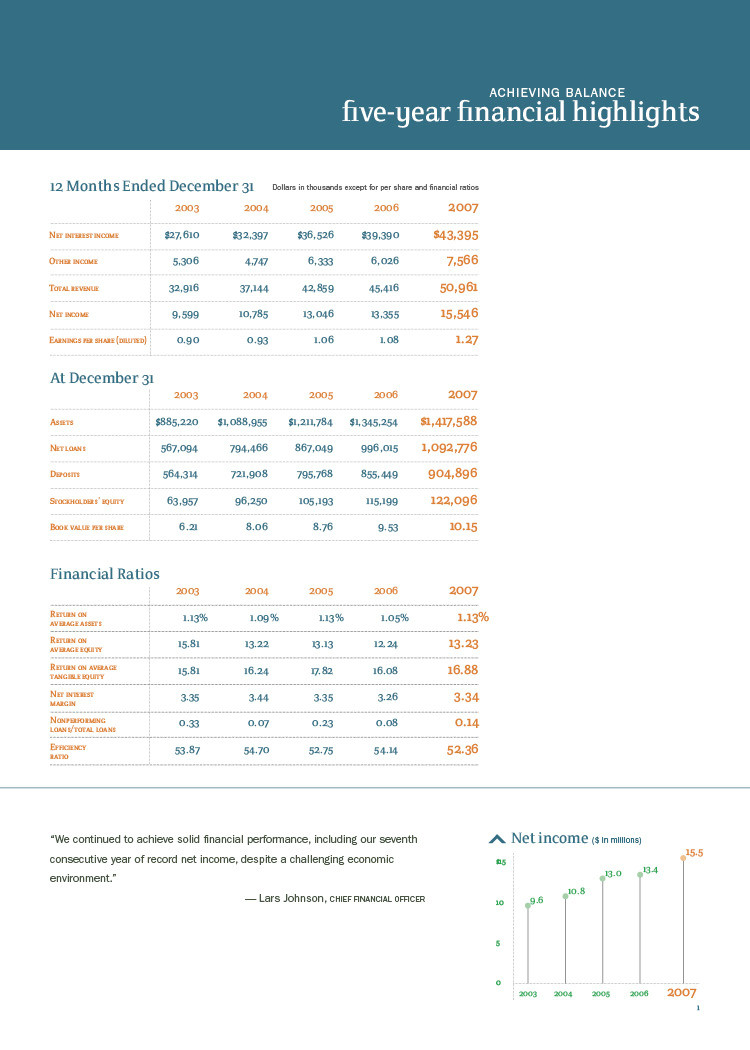
| Net interest income | | | 43,395 | | | | 39,390 | | | | 36,526 | | | | 32,397 | | | | 27,610 | |
| Provision for loan losses | | | 1,350 | | | | 1,000 | | | | 945 | | | | 675 | | | | 1,275 | |
| Net interest income after provision for loan losses | | | 42,045 | | | | 38,390 | | | | 35,581 | | | | 31,722 | | | | 26,335 | |
| | | | | | | | | | | | | | | | | | | | | |
| Other income | | | 7,566 | | | | 6,026 | | | | 6,333 | | | | 4,747 | | | | 5,306 | |
| Other expense | | | 26,682 | | | | 24,586 | | | | 22,606 | | | | 20,317 | | | | 17,733 | |
| Income before provision for income taxes | | | 22,929 | | | | 19,830 | | | | 19,308 | | | | 16,152 | | | | 13,908 | |
| Net income | | | 15,546 | | | | 13,355 | | | | 13,046 | | | | 10,785 | | | | 9,599 | |
Net income per common share, basic (1) | | | 1.29 | | | | 1.11 | | | | 1.09 | | | | 0.96 | | | | 0.94 | |
Net income per common share, diluted (1) | | | 1.27 | | | | 1.08 | | | | 1.06 | | | | 0.93 | | | | 0.90 | |
Book value per common share (1) | | | 10.15 | | | | 9.53 | | | | 8.76 | | | | 8.06 | | | | 6.21 | |
| | | | | | | | | | | | | | | | | | | | | |
| | | AT DECEMBER 31, | |
| | | 2007 | | | 2006 | | | 2005 | | | 2004 | | | 2003 | |
| Assets | | $ | 1,417,588 | | | $ | 1,345,254 | | | $ | 1,211,784 | | | $ | 1,088,955 | | | $ | 885,220 | |
| Loans, net | | | 1,092,776 | | | | 996,015 | | | | 867,049 | | | | 794,466 | | | | 567,094 | |
| Cash and securities | | | 246,548 | | | | 282,301 | | | | 278,747 | | | | 228,644 | | | | 290,537 | |
| Deposits | | | 904,896 | | | | 855,449 | | | | 795,768 | | | | 721,908 | | | | 564,314 | |
| Borrowings | | | 147,512 | | | | 121,485 | | | | 66,270 | | | | 36,356 | | | | 50,123 | |
| FHLB advances | | | 231,000 | | | | 243,000 | | | | 236,000 | | | | 228,000 | | | | 200,000 | |
| Stockholders’ equity | | | 122,096 | | | | 115,199 | | | | 105,193 | | | | 96,250 | | | | 63,957 | |
| Nonperforming loans | | | 1,523 | | | | 851 | | | | 1,987 | | | | 532 | | | | 1,921 | |
| | | | | | | | | | | | | | | | | | | | | |
| | | FINANCIAL RATIOS | |
| | | FOR THE YEARS ENDED | |
| | | DECEMBER 31, | |
| | | 2007 | | | 2006 | | | 2005 | | | 2004 | | | 2003 | |
| Return on average assets | | | 1.13 | % | | | 1.05 | % | | | 1.13 | % | | | 1.09 | % | | | 1.13 | % |
| Return on average equity | | | 13.23 | | | | 12.24 | | | | 13.13 | | | | 13.22 | | | | 15.81 | |
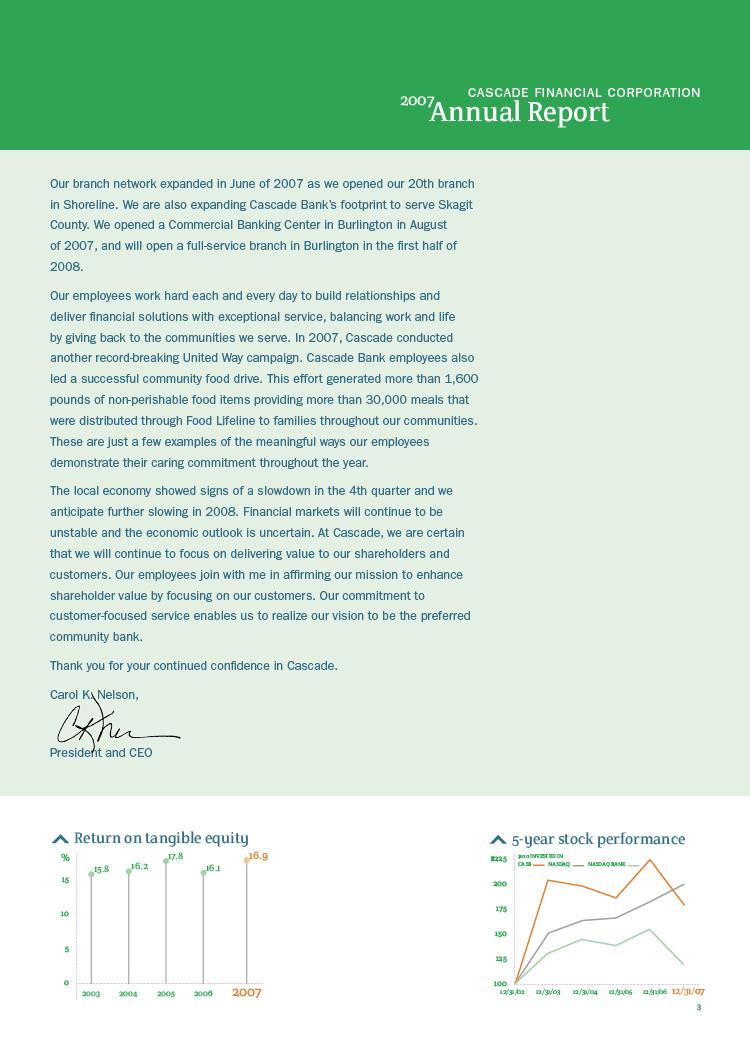
| Return on average tangible equity | | | 16.88 | | | | 16.08 | | | | 17.82 | | | | 16.24 | | | | 15.81 | |
| Net interest margin | | | 3.34 | | | | 3.26 | | | | 3.35 | | | | 3.44 | | | | 3.35 | |
| Efficiency ratio | | | 52.36 | | | | 54.14 | | | | 52.75 | | | | 54.70 | | | | 53.87 | |
| Dividend payout ratio | | | 25.98 | | | | 28.43 | | | | 25.66 | | | | 25.81 | | | | 18.31 | |
| Average stockholders’ equity to average assets | | | 8.58 | | | | 8.55 | | | | 8.60 | | | | 8.25 | | | | 7.15 | |
| Total risk-based capital to risk-weighted assets | | | 10.80 | | | | 11.22 | | | | 10.86 | | | | 11.18 | | | | 13.42 | |
| Tier 1 capital to average total assets | | | 8.90 | | | | 8.99 | | | | 8.23 | | | | 8.14 | | | | 8.49 | |
This statement has not been reviewed, or confirmed for accuracy or relevance, by the Federal Deposit Insurance Corporation.
MANAGEMENT DISCUSSION AND ANALYSIS
The following discussion is provided for the consolidated operations of Cascade Financial Corporation (the “Corporation”) as of December 31, 2007. The Corporation has only one operating subsidiary: Cascade Bank (the “Bank”). The purpose of this discussion is to focus on significant factors concerning the Corporation’s financial condition and results of operations, and to provide a more comprehensive review of the Corporation’s operating results and financial condition than can be obtained from reading the consolidated financial statements alone. This discussion should be read with the consolidated financial statements and the notes thereto.
In addition to historical information, this report contains certain "forward-looking statements" within the meaning of the Private Securities Litigation Reform Act of 1995 ("PSLRA"). This statement is included for the express purpose of availing the Corporation of the protections of the safe harbor provisions of the PSLRA. The forward-looking statements contained herein are subject to factors, risks, and uncertainties that may cause actual results to differ materially from those projected. The following items are among the factors that could cause actual results to differ materially from the forward-looking statements: higher than expected loan delinquency rates; general economic conditions, including their impact on capital expenditures; business conditions in the banking industry; recent world events and their impact on interest rates, businesses, and customers; the regulatory environment; new legislation; vendor quality and efficiency; employee retention factors; rapidly-changing technology; competitive factors, including increased competition with community, regional, and national financial institutions; fluctuating interest rate environments; and similar matters. Readers are cautioned not to place undue reliance on these forward-looking statements, which reflect management's analysis only as of the date of the statement. The Corporation undertakes no obligation to publicly revise or update these forward-looking statements to reflect events or circumstances that arise after the date of this report. Readers should carefully review the risk factors described in this and other documents the Corporation files from time to time with the Securities and Exchange Commission.
Critical Accounting Estimates
Corporations may apply certain critical accounting estimates requiring management to make subjective or complex judgments, often as a result of the need to estimate the effect of matters that are inherently uncertain. The Bank considers its only material critical accounting estimate to be the allowance for loan losses. We believe that the accounting estimate related to the allowance for loan losses is a "critical accounting estimate" because: (1) it is highly susceptible to change from period to period because it requires management to make assumptions about future collectability of loans; and (2) the impact of a sudden large loss could significantly reduce the allowance and would require increased provisions to replenish the allowance, which would negatively affect earnings.
The allowance for loan losses is established through a provision for loan losses charged against earnings. The balance of the allowance for loan losses is maintained at the amount management believes will be adequate to absorb known and inherent losses in the loan portfolio. The appropriate balance of the allowance for loan losses is determined by applying estimated loss factors to the credit exposure from outstanding loans. Estimated loss factors are based on subjective measurements including management’s assessment of the internal risk classifications, changes in the nature of the loan portfolio, industry concentrations, and the impact of current local, regional and national economic factors on the quality of the loan portfolio. Changes in these estimates and assumptions are reasonably possible and may have a material impact on the Corporation’s consolidated financial statements and results of operation.
For additional information regarding the allowance for loan losses, its relation to the provision for loan losses and risk related to asset quality, see Note 4 in the Consolidated Financial Statements for the year ended December 31, 2007, and “Management’s Discussion and Analysis of Financial Condition and Results of Operation – Provision for Loan Losses.”
Critical Accounting Policies
The Corporation’s significant accounting policies are described in Note 1 of the Notes to Consolidated Financial Statements and are essential to understanding Management's Discussion and Analysis of Financial Condition and Results of Operations. The preparation of financial statements in conformity with accounting principles generally accepted in the United States of America requires management to make estimates and assumptions which affect the reported amounts and disclosures. Actual results may differ from these estimates under different assumptions or conditions. The following policies involve a higher degree of judgment than do our other significant accounting policies detailed in Note 1 of the Notes to Consolidated Financial Statements.
Allowance for Loan Losses
The Bank reviews historical origination and charge-off relationships, charge-off experience factors, collection data, delinquency reports, estimates of the value of the underlying collateral, and other information in order to make the necessary judgments as to the appropriateness of the provision for loan losses and the allowance for loan losses. The Bank also uses Qualitative (“Q”) Factors to analyze the adequacy of the loan loss allowance and determine an unallocated portion of the allowance. Factors such as regional/local economic trends, the health of the real estate market, loan and collateral concentrations, size of borrowing relationships, trends in loan delinquencies and charge-offs and changes in asset classifications are now included in the Bank’s analysis of the allowance for loan losses. Loans losses are charged-off against the allowance when management confirms the
uncollectability of a loan balance or when the liquidation value of the collateral is less than the amount of the loan. The Bank believes that the allowance for loan losses is adequate to cover probable losses inherent in its loan portfolio. However, because the allowance for loan losses is based on estimates, there can be no assurance that the ultimate charge-off amount will not exceed the estimates.
Investments
The Bank classifies its investments as held-for-trading, available-for-sale, or held-to-maturity. Held-for-trading securities are marked to market with the change in value recognized in the income statement. Available-for-sale securities are reported at their fair value, which is determined by obtaining quoted market prices. Unrealized gains and losses on available-for-sale securities are included in other comprehensive income and excluded from earnings. Realized gains and losses and declines in fair value judged to be other than temporary are included in earnings. The fair value of financial instruments is discussed in more detail in Note 15 of the Notes to Consolidated Financial Statements. Held-to-maturity securities are carried at amortized cost.
Income Taxes
The Bank estimates tax expense based on the amount it expects to owe various tax authorities. Taxes are discussed in more detail in Note 10 of the Notes to Consolidated Financial Statements. Accrued taxes represent the net estimated amount due or to be received from taxing authorities. In estimating accrued taxes, management assesses the relative merits and risks of the appropriate tax treatment of transactions taking into account statutory, judicial and regulatory guidance in the context of our tax position.
Fair Value
Effective January 1, 2007, we adopted SFAS No. 157, Fair Value Measurements, which among other things, requires enhanced disclosures about financial instruments carried at fair value. SFAS No. 157 establishes a hierarchical disclosure framework associated with the level of pricing observability utilized in measuring financial instruments at fair value. The degree of judgment utilized in measuring the fair value of financial instruments generally correlates to the level of pricing observability. Financial instruments with readily available active quoted prices or for which fair value can be measured from actively quoted prices generally will have a higher degree of pricing observability and a lesser degree of judgment utilized in measuring fair value. Conversely, financial instruments rarely traded or not quoted will generally have little or no pricing observability and a higher degree of judgment utilized in measuring fair value. Pricing observability is impacted by a number of factors, including the type of financial instrument, whether the financial instrument is new to the market and not yet established and the characteristics specific to the transaction. See Note 15 of the Notes to Consolidated Financial Statements for additional information about the level of pricing transparency associated with financial instruments carried at fair value.
FINANCIAL CONDITION
Total Assets
The Corporation’s total assets at December 31, 2007, were $1.4 billion, compared to $1.3 billion at December 31, 2006, an increase of 5.4%. The increase in 2007 is due entirely to internal growth. The Corporation’s total assets at December 31, 2005, were $1.2 billion.
Investment Securities
Total securities held decreased by $7.4 million to $232.0 million as of December 31, 2007. Securities designated as available-for-sale decreased to $94.8 million at December 31, 2007, versus $142.6 million at December 31, 2006. Securities designated as available-for-sale includes $11.9 million in Federal Home Loan Bank of Seattle stock at December 31, 2007 and 2006. Securities designated as held-to-maturity increased to $137.2 million at December 31, 2007, from $96.8 million a year earlier. The securities in both portfolios consist of notes issued by Government Sponsored Enterprises (“GSE” e.g. FHLB, FNMA) or mortgage-backed securities issued by either FNMA or FHLMC or a mortgage conduit. There were no investment securities that were backed by subprime loans and all investments received the highest credit rating from at least one of the major rating agencies.
Loan Portfolio
Net loans increased to $1.1 billion at December 31, 2007, a 9.7% increase over $996.0 million at December 31, 2006. Net loans were $867.0 million at December 31, 2005.
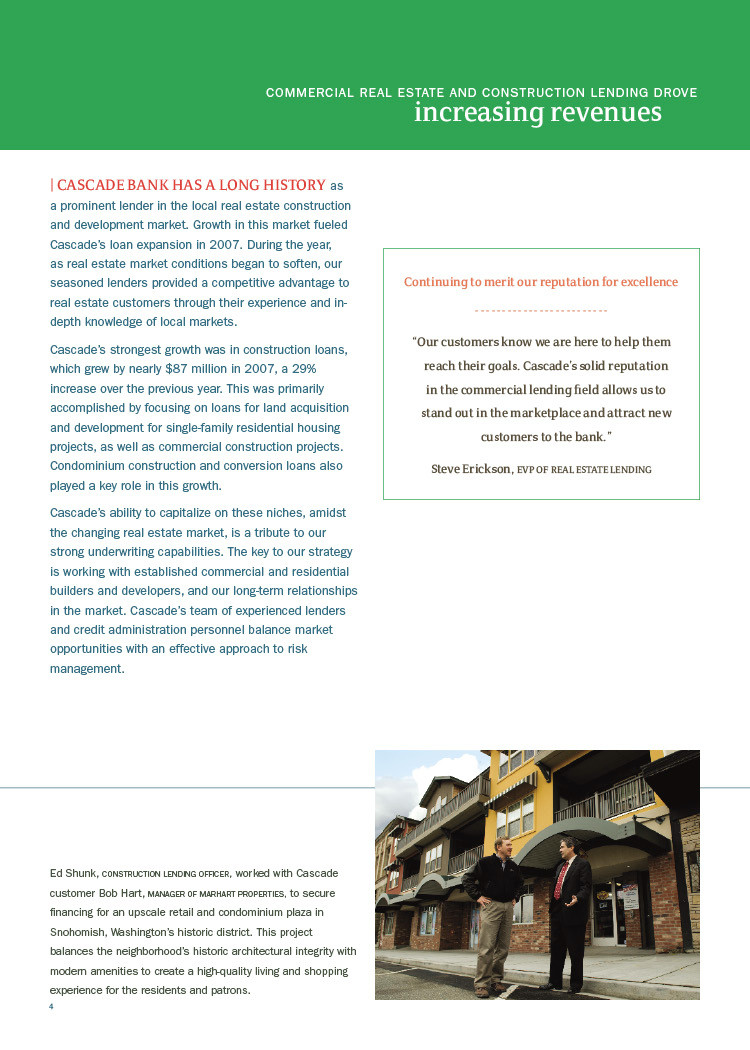
Business banking loans increased from $442.4 million at December 31, 2006, to $468.5 million at December 31, 2007, a 5.9% increase. Growth in this portfolio was the result of our ability to win new borrowing customers in a very competitive market. Construction loans (net of loans in process) increased to $381.8 million from $295.1 million during the year. This portfolio experienced solid growth as the housing market remained relatively strong during the year. Commercial real estate loans increased from $119.3 million at December 31, 2006, to $120.4 million at December 31, 2007. The Corporation’s loan focus remains on small businesses, builders and developers in the Puget Sound Area. Construction lending is directed toward building single-family housing and land development for single-family housing. The Bank generally confines its lending to the Puget Sound Region of Washington State.
Total single-family residential loans increased from $91.3 million at December 31, 2006, to $98.4 million at December 31, 2007. The Corporation sells the vast majority of its originations of 30-year fixed-rate loans, its 15-year fixed-rate loans, and many of its conforming intermediate term hybrid adjustable rate mortgages (“ARMs”) in the secondary mortgage market.
Multifamily loans outstanding decreased from $34.7 million at December 31, 2006, to $11.4 million at December 31, 2007. The Corporation has de-emphasized this product line due to intense pricing pressure, so loan payoffs were not replaced with the same category of loan.
Consumer loans remained flat at $27.7 million as of December 31, 2007. The Bank’s consumer loan portfolio is comprised of home equity loans and lines of credit, installment loans, and credit card loans. Home equity loans generally take the form of a second mortgage. In terms of direct consumer loans, the Bank has not emphasized this line of business, concluding that it is at a competitive disadvantage against the very aggressive pricing of large banks, captive finance companies and the specialty credit card issuers.
The chart below indicates the mix of the loan portfolio as of the dates indicated:
| | | DECEMBER 31, 2007 | | | DECEMBER 31, 2006 | | | DECEMBER 31, 2005 | |
| (Dollars in thousands) | | AMOUNT | | | PERCENT | | | AMOUNT | | | PERCENT | | | AMOUNT | | | PERCENT | |
| | | | | | | | | | | | | | | | | | | |
| Business | | $ | 468,453 | | | | 42 | % | | $ | 442,391 | | | | 44 | % | | $ | 394,034 | | | | 45 | % |
| Construction | | | 381,810 | | | | 34 | | | | 295,087 | | | | 29 | | | | 171,964 | | | | 20 | |
| Commercial real estate | | | 120,421 | | | | 11 | | | | 119,298 | | | | 12 | | | | 141,109 | | | | 16 | |
| Core commercial loans | | | 970,684 | | | | 87 | | | | 856,776 | | | | 85 | | | | 707,107 | | | | 81 | |
| Residential | | | 98,384 | | | | 9 | | | | 91,256 | | | | 10 | | | | 89,422 | | | | 10 | |
| Consumer | | | 27,688 | | | | 3 | | | | 27,686 | | | | 2 | | | | 32,160 | | | | 3 | |
| Multifamily | | | 11,397 | | | | 1 | | | | 34,719 | | | | 3 | | | | 52,057 | | | | 6 | |
| Total loans | | | 1,108,153 | | | | 100 | % | | | 1,010,437 | | | | 100 | % | | | 880,746 | | | | 100 | % |
| Deferred loan fees, net | | | (3,724 | ) | | | | | | | (3,434 | ) | | | | | | | (3,443 | ) | | | | |
| Allowance for losses on loans | | | (11,653 | ) | | | | | | | (10,988 | ) | | | | | | | (10,254 | ) | | | | |
| Loans, net | | $ | 1,092,776 | | | | | | | $ | 996,015 | | | | | | | | 867,049 | | | | | |
Allowance for Loan Losses
Management provides for possible loan losses by maintaining an allowance. The allowance for loan losses reflects management’s best estimate of probable losses as of a particular balance sheet date, but there is no guarantee that management’s estimate will be sufficient to cover actual loan losses. The allowance for loan losses is maintained at a level considered adequate based on management’s assessment of various factors affecting the loan portfolio, including delinquencies, trends in credit quality, local economic conditions, growth of the loan portfolio, past loss experience, and the portfolio’s composition. Increases in the allowance for loan losses made through provisions primarily reflect loan growth, loan loss risks inherent in lending, and the impact of the economic climate on the loan portfolio.
Management determines the amount of the allowance for loan losses by utilizing a loan grading system to determine risk in the loan portfolio and by considering the results of credit reviews. The loan portfolio is separated by quality and then by loan type. Loans of acceptable quality are evaluated as a group, by loan type, with a specific loss rate assigned to the total loans in each type, but unallocated to any individual loan. Conversely, each adversely classified loan is individually analyzed to determine an estimated loss amount. A valuation allowance is also assigned to these adversely classified loans, but at an assumed higher reserve rate due to the greater risk of loss. Past due and impaired loans are actively managed to minimize the potential loss of principal.
At December 31, 2007, the allowance for loan losses was $11.7 million (1.05% of total loans) compared to $11.0 million (1.09% of total loans) at December 31, 2006, and $10.3 million (1.16% of total loans) at December 31, 2005. During 2007, the Corporation added $1.4 million to the allowance compared to $1.0 million in 2006 and $945,000 in 2005. In 2007, the Bank segregated a valuation reserve against off-balance sheet commitments, such as loans in process. As of December 31, 2007, that valuation reserve account was $142,000. Total allowance for loan losses, which includes the allowance for off-balance sheet commitments, was $11.8 million (1.06% of total loans) as of December 31, 2007.
Net loan charge-offs were $543,000 in 2007 (or 0.05% of average loans outstanding) compared to $266,000 in 2006 (or 0.03% of average loans outstanding). Net charge-offs were $254,000 (or 0.03% of average loans outstanding) for the year ended December 31, 2005. The coverage ratio (the allowance for loan losses to nonperforming loans) was 765% at December 31, 2007, 1,291% at December 31, 2006, and 516% at December 31, 2005. Including the allowance for off-balance sheet commitments, the coverage ratio was 774% at December 31, 2007.
Deposit Accounts
Deposit accounts totaled $904.9 million at December 31, 2007, an increase of $49.5 million or 5.8% over $855.4 million at December 31, 2006. Deposits totaled $795.8 million at December 31, 2005. Checking account balances were $138.2 million as of December 31, 2007, compared to $139.5 million in the prior year. With the High Performance Checking program, the Bank was able to maintain its totals even as checking balances declined on a national basis. Money market deposit account balances grew by 14.8% to $316.0 million with rates competitive with those offered by money market funds. Certificates of deposit increased 3.3% to $439.4 million. As business banking activity increases, management’s goal is to increase its noninterest-bearing or low interest accounts through the growth of commercial checking accounts.
The market for deposits has remained very competitive. It remains a key objective of the Bank to increase its demand deposit account balances and other low rate accounts.
Other Borrowings
The Bank uses Federal Home Loan Bank of Seattle (“FHLB”) advances to provide intermediate and longer term funding, as well as to augment deposits. At December 31, 2007, the Bank had $231.0 million in FHLB advances compared to $243.0 million as of December 31, 2006. For 2007, FHLB advances averaged 16.0% of assets compared to 18.6% in 2006. Subject to its Line of Credit with the FHLB, the availability of collateral, and the parameters of liquidity management, the Bank will continue to use advances as a funding source.
The Bank also uses repurchase agreements for funding. At December 31, 2007, the Bank had executed $120.6 million in repurchase agreements compared to $95.7 million a year earlier. In 2000, the Corporation issued $10.3 million in trust preferred securities, which are termed “junior subordinated debentures payable.” These junior subordinated debentures payable have a fixed rate of 11% and mature on March 1, 2030, but are callable at a premium beginning March 1, 2010. In December 2004, the Corporation issued an additional $5.2 million in junior subordinated debentures payable. These debentures have a fixed rate of 5.82% for the first 5 years and then float at the three-month LIBOR plus 1.90% for the remaining 25 years. The debentures are callable at par after 5 years. On March 30, 2006, the Corporation issued an additional $10.3 million in junior subordinated debentures payable. These debentures have an initial rate of 6.65% set for 5 years and then convert to a three-month LIBOR plus 1.40% for the remaining 25 years. The debentures are callable at par after 5 years. Junior subordinated debentures payable are considered Tier 1 capital by financial institution regulators.
Capital
Banking regulations require the Bank to maintain minimum levels of capital. As of December 31, 2007, the Bank remained a “well-capitalized” institution (the FDIC’s highest rating), under regulatory guidelines, with a core capital-to-asset ratio of 9.00% and a risk-based capital-to-asset ratio of 10.91%. The Bank’s regulatory capital ratios are discussed in more detail in Note 12 of the Notes to Consolidated Financial Statements.
Federal Reserve guidelines require the Corporation, on a consolidated basis, to maintain minimum levels of capital as well. At December 31, 2007, the Corporation's total risk-based capital to risk-weighted assets was 10.80%, compared to 11.22% at December 31, 2006, and 10.86% at December 31, 2005. The Corporation projects that earnings retention and existing capital will be sufficient to fund anticipated asset growth and the existing level of cash dividends, while maintaining a “well-capitalized” designation under the FDIC and Federal Reserve guidelines. The Corporation has paid its shareholders a cash dividend on a quarterly basis since 2002. Average shares outstanding, stock options, net income per share and book value per share for all periods presented have been retroactively adjusted to reflect stock splits. For the year, the Corporation returned $4.1 million in dividends to its shareholders compared to $3.7 million in 2006. The dividend payout ratio (the ratio of dividends paid to net income) for 2007 was 26%.
The Corporation is committed to managing capital for maximum shareholder benefit and maintaining protection for depositors and creditors. The Corporation manages various capital levels at both the holding company and subsidiary bank level to attempt to maintain adequate capital ratios and levels in accordance with external regulations and capital guidelines established by the Board of Directors.
RESULTS OF OPERATIONS
Earnings
Cascade Financial Corporation earned net income for the year ended December 31, 2007, of $15.5 million, an increase of 16.4% over the $13.4 million net income in the year ended December 31, 2006. Earnings per fully diluted share (EPS) were $1.27 in 2007 and $1.08 in 2006. Higher net interest income due to increased earning assets and an expanded net interest margin contributed to the improved results. Income was also enhanced by increased checking fees and other service fees, and fair value gains on items subject to mark to market accounting, which partially offset the decline in gains on the sale of loans and the decline in other income. The Corporation earned net income of $13.0 million or $1.06 per fully diluted share for the fiscal year ended December 31, 2005.
Return on Average Equity
Return on average equity for the year ended December 31, 2007, was 13.23% compared to 12.24% for the same period of 2006. Return on average equity for the fiscal year ending December 31, 2005 was 13.13%.
Return on Average Tangible Equity
Return on average tangible equity (average equity less average goodwill) was 16.88% compared to 16.08% in 2006, and 17.82% in 2005. The June 2004 acquisition of Issaquah Bancshares, Inc. (“Issaquah”) generated $26.3 million in goodwill and intangibles as assets and a like amount of capital. Eliminating the average intangible asset and reducing the capital by the same amount produces average tangible equity.
Return on average tangible equity is determined by methods other than those in accordance with accounting principles generally accepted in the United States of America (“GAAP”). This measure excludes the average balance of acquisition-related goodwill and intangibles in determining average tangible shareholders’ equity. Management believes the presentation of this financial measure, excluding the impact of these items, provides useful supplemental information that is essential for a proper understanding of the financial results of Cascade
Financial Corporation. This disclosure should not be viewed as a substitute for results determined to be in accordance with GAAP, nor is it necessarily comparable to non-GAAP performance measures that may be presented by other companies.
A summary of tangible equity follows:
| (Dollars in thousands) | | 2007 | | | 2006 | |
| Net income | | $ | 15,546 | | | $ | 13,355 | |
| Average equity | | $ | 117,534 | | | $ | 109,103 | |
| Average goodwill & intangibles | | | 25,439 | | | | 26,040 | |
| Average tangible equity | | $ | 92,095 | | | $ | 83,063 | |
| Return on average tangible equity | | | 16.88 | % | | | 16.08 | % |
The largest component of the Corporation’s earnings is net interest income. Net interest income is the difference between interest earned on earning assets (primarily loans, interest-bearing deposits with banks, and investment securities) and the interest expense associated with interest-bearing liabilities (deposits and borrowings). Interest earned and interest paid is affected by general economic conditions, including the demand for loans, cost of deposits, market rates of interest and government policies. The Corporation’s operations may be sensitive to changes in interest rates and the resulting impact on net interest income.
Net interest income for the year ended December 31, 2007, increased by 10.2%, or $4.0 million, to $43.4 million from $39.4 million for the year ended December 31, 2006. The improvement in net interest income was primarily due to the growth in our level of average earning assets of $90.8 million and an 8 basis point increase in the net interest margin. Net interest income for the fiscal year ended December 31, 2005 was $36.5 million.
Average earning assets increased 7.5% to $1.3 billion for the year ended December 31, 2007, from $1.2 billion for the year ended December 31, 2006. Average earning assets were $1.1 billion for the year ended December 31, 2005.
Net interest margin is net interest income expressed as a percent of average earning assets. The net interest margin for the year ended December 31, 2007, was 3.34%, compared to 3.26% for the year ended December 31, 2006. While the yield on assets has improved over the last year, liability costs have also increased. The yield on earning assets increased 39 basis points to 7.24% in 2007. The cost of interest-bearing liabilities increased 37 basis points to 4.38% for the year as new liabilities were generally booked at higher rates than the average cost of existing liabilities.
Average Balances and an Analysis of Average Rates Earned and Paid
The following table shows average balances and interest income or interest expense, with the resulting average yield or rate by category or average earning asset or interest-bearing liability.
| | | FOR THE YEARS ENDED DECEMBER 31, | |
| | | 2007 | | | 2006 | | | 2005 | |
| (Dollars in thousands) | | AVERAGE BALANCE | | INTEREST AND DIVIDEND | | YIELD/ COST | | | AVERAGE BALANCE | | INTEREST AND DIVIDEND | | YIELD/ COST | | | AVERAGE BALANCE | | INTEREST AND DIVIDEND | | | YIELD / COST | |
| | | | | | | | | | | | | | | | | | | | | | | |
| ASSETS | | | | | | | | | | | | | | | | | | | | | | |
Interest-earning assets (1) | | | | | | | | | | | | | | | | | | | | | | |
| Residential loans | | $ | 94,608 | | $ | 5,753 | | 6.08 | % | | $ | 98,476 | | $ | 5,582 | | 5.67 | % | | $ | 104,789 | | $ | 5,882 | | | 5.61 | % |
| Multifamily loans | | | 18,467 | | | 1,416 | | 7.67 | | | | 42,574 | | | 2,863 | | 6.72 | | | | 74,650 | | | 4,910 | | | 6.58 | |
| Commercial real estate loans | | | 117,952 | | | 8,259 | | 7.00 | | | | 144,094 | | | 9,821 | | 6.82 | | | | 166,736 | | | 10,957 | | | 6.57 | |
| Construction loans | | | 332,467 | | | 30,094 | | 9.05 | | | | 214,290 | | | 19,376 | | 9.04 | | | | 133,975 | | | 10,199 | | | 7.61 | |
| Consumer loans | | | 27,575 | | | 2,128 | | 7.72 | | | | 30,064 | | | 2,304 | | 7.66 | | | | 31,352 | | | 2,210 | | | 7.05 | |
| Business banking loans | | | 455,024 | | | 33,908 | | 7.45 | | | | 426,194 | | | 31,158 | | 7.31 | | | | 343,182 | | | 23,441 | | | 6.83 | |
| Total loans | | | 1,046,093 | | | 81,558 | | 7.80 | | | | 955,692 | | | 71,104 | | 7.44 | | | | 854,684 | | | 57,599 | | | 6.74 | |
Securities available-for-sale | | | 102,613 | | | 4,828 | | 4.71 | | | | 148,917 | | | 6,735 | | 4.52 | | | | 134,157 | | | 5,582 | | | 4.16 | |
| Securities held-to-maturity | | | 88,535 | | | 4,527 | | 5.11 | | | | 96,668 | | | 4,563 | | 4.72 | | | | 93,069 | | | 4,306 | | | 4.63 | |
| Securities held-for-trading | | | 38,614 | | | 1,884 | | 4.88 | | | | - | | | - | | - | | | | - | | | - | | | - | |
| Daily interest-earning deposits | | | 21,607 | | | 1,138 | | 5.27 | | | | 5,356 | | | 256 | | 4.78 | | | | 6,912 | | | 315 | | | 4.56 | |
Total securities and interest-earning deposits | | | 251,369 | | | 12,377 | | 4.92 | | | | 250,941 | | | 11,554 | | 4.60 | | | | 234,138 | | | 10,203 | | | 4.36 | |
| Total interest-earning assets | | | 1,297,462 | | | 93,935 | | 7.24 | | | | 1,206,633 | | | 82,658 | | 6.85 | | | | 1,088,822 | | | 67,802 | | | 6.23 | |
| Noninterest-earning assets | | | | | | | | | | | | | | | | | | | | | | | | | | | | |
Office properties andequipment, net | | | 13,744 | | | | | | | | | 12,093 | | | | | | | | | 12,741 | | | | | | | |
| Real estate, net | | | - | | | | | | | | | - | | | | | | | | | 328 | | | | | | | |
Other noninterest-earning assets | | | 59,103 | | | | | | | | | 56,830 | | | | | | | | | 53,847 | | | | | | | |
| Total assets | | $ | 1,370,309 | | | | | | | | $ | 1,275,556 | | | | | | | | $ | 1,155,738 | | | | | | | |
| | | FOR THE YEARS ENDED DECEMBER 31, | |
| | | 2007 | | | 2006 | | | 2005 | |
(Dollars in thousands) | | AVERAGE BALANCE | | | INTEREST AND DIVIDEND | | YIELD/ COST | | | AVERAGE BALANCE | | | INTEREST AND DIVIDEND | | YIELD/ COST | | | AVERAGE BALANCE | | | INTEREST AND DIVIDEND | | | YIELD/ COST | |
| LIABILITIES AND EQUITY | | | | | | | | | | | | | | | | | | | | | | | | | |
| Interest-bearing liabilities | | | | | | | | | | | | | | | | | | | | | | | | | |
| Savings accounts | | $ | 13,261 | | | $ | 66 | | 0.50 | % | | $ | 14,748 | | | $ | 75 | | 0.51 | % | | $ | 15,465 | | | $ | 67 | | | 0.43 | % |
| Checking accounts | | | 51,021 | | | | 747 | | 1.46 | | | | 45,039 | | | | 656 | | 1.46 | | | | 39,618 | | | | 245 | | | 0.62 | |
| Money market accounts | | | 284,843 | | | | 12,314 | | 4.32 | | | | 229,788 | | | | 8,505 | | 3.70 | | | | 170,641 | | | | 3,255 | | | 1.91 | |
| Certificates of deposit | | | 444,726 | | | | 22,093 | | 4.97 | | | | 446,437 | | | | 19,339 | | 4.33 | | | | 467,388 | | | | 14,747 | | | 3.16 | |
| Total interest-bearing deposits | | | 793,851 | | | | 35,220 | | 4.44 | | | | 736,012 | | | | 28,575 | | 3.88 | | | | 693,112 | | | | 18,314 | | | 2.64 | |
| Other interest-bearing liabilities | | | | | | | | | | | | | | | | | | | | | | | | | | | | | | | |
| FHLB advances | | | 226,124 | | | | 10,240 | | 4.53 | | | | 237,888 | | | | 11,194 | | 4.71 | | | | 239,896 | | | | 11,031 | | | 4.60 | |
| Other interest-bearing liabilities | | | 134,410 | | | | 5,080 | | 3.78 | | | | 104,085 | | | | 3,499 | | 3.36 | | | | 39,495 | | | | 1,931 | | | 4.89 | |
| Total interest-bearing liabilities | | | 1,154,385 | | | | 50,540 | | 4.38 | | | | 1,077,985 | | | | 43,268 | | 4.01 | | | | 972,503 | | | | 31,276 | | | 3.22 | |
| Other liabilities | | | 98,390 | | | | | | | | | | 88,468 | | | | | | | | | | 83,865 | | | | | | | | |
| Total liabilities | | | 1,252,775 | | | | | | | | | | 1,166,453 | | | | | | | | | | 1,056,368 | | | | | | | | |
| Stockholders’ equity | | | 117,534 | | | | | | | | | | 109,103 | | | | | | | | | | 99,370 | | | | | | | | |
| Total liabilities and stockholders’ equity | | $ | 1,370,309 | | | | | | | | | $ | 1,275,556 | | | | | | | | | $ | 1,155,738 | | | | | | | | |
Net interest income (2) | | | | | | $ | 43,395 | | | | | | | | | $ | 39,390 | | | | | | | | | $ | 36,526 | | | | |
Interest rate spread (3) | | | | | | | | | 2.86 | % | | | | | | | | | 2.84 | % | | | | | | | | | | 3.01 | % |
Net interest margin (4) | | | | | | | | | 3.34 | % | | | | | | | | | 3.26 | % | | | | | | | | | | 3.35 | % |
| Average interest-earning assets | | | | | | | | | | | | | | | | | | | | | | | | | | | | | | | |
to average interest-bearing liabilities | | | 112.39 | % | | | | | | | | | 111.93 | % | | | | | | | | | 111.96 | % | | | | | | | |
(1) Does not include interest on loans 90 days or more past due.
(2) Interest and dividends on total interest-earning assets less interest on total interest-bearing liabilities.
(3) Total interest-earning assets yield less total interest-bearing liabilities cost.
(4) Net interest income as an annualized percentage of total interest-earning assets.
Other Income
Other income is derived from sources other than interest and fees on earning assets. The Corporation’s primary sources of other income are service charge fees on deposit accounts, other service fees, the accretion of cash surrender value of bank owned life insurance (“BOLI”), gains on the sale of single-family residential and other loans, gains on the sale of securities, and rental income, primarily on space at the building that formerly served as the headquarters of Issaquah Bank. Other income for the year ended December 31, 2007, was $7.6 million, compared to $6.0 million and $6.3 million for the same periods in 2006 and 2005, respectively. In 2007, the implementation of Statement of Financial Accounting Standards (“SFAS”) No. 159 resulted in $1.1 million of net fair value gain. There were no corresponding gains in 2006 or 2005. The fair value of financial instruments is discussed in more detail in Note 15 of the Notes to Consolidated Financial Statements.
Other Expense
Other expense represents costs not associated with deposits and other interest-bearing liabilities. It includes expenses associated with personnel, premises and equipment, marketing, and other operations.
Other expense increased by $2.1 million to $26.7 million for the year ended December 31, 2007, from $24.6 million and $22.6 million for 2006 and 2005, respectively. Salaries and employee benefits increased overall by $1.1 million to $13.8 million during 2007 compared to the prior year. B&O tax increased $346,000 to $1.4 million and other expenses increased $410,000 to $6.7 million during 2007 compared to the prior year.
A standard measurement used to calculate the overhead costs of financial institutions is the efficiency ratio. The efficiency ratio is calculated by dividing other expense by total revenue, which generally indicates how much an institution spends to generate a dollar of revenue. The lower the efficiency ratio, the more efficient the institution. For the years ending December 31, 2007, 2006, and 2005, the Corporation’s efficiency ratio was 52.36%, 54.14%, and 52.75%, respectively. Management continues to look for ways to improve the efficiency ratio by increasing other income and net interest income while diligently controlling costs and maintaining high standards of service.
Liquidity Management
Liquidity is a term used to define the Corporation's ability to meet its financial commitments. The Corporation is required by prudent business practice and its regulators to maintain adequate levels of liquidity. The main liquidity requirements are funding customer loan requests and deposit outflows of the Bank. Primary sources of liquidity are cash and cash equivalents, which include highly liquid investments. At December 31, 2007, December 31, 2006, and December 31, 2005, cash and cash equivalents totaled $14.5 million, $42.9 million,
and $31.1 million, respectively. Another source of liquidity is the Corporation’s investment portfolio, which consists of investment-grade securities. These securities are of the highest credit quality and can be sold or used as collateral to secure borrowings.
The primary source of borrowings are Federal Home Loan Bank of Seattle (FHLB-Seattle) advances and repurchase agreements. At December 31, 2007, $264.7 million of additional borrowing capacity remained under the Bank’s existing credit line from the FHLB-Seattle, which is 35% of the Bank’s assets. The use of this Line of Credit is subject to the availability of eligible collateral, which includes residential mortgages, investment grade securities, and commercial real estate mortgages. At December 31, 2007, the Bank had unencumbered eligible collateral of approximately $85.5 million to pledge against the line. In addition, the Bank has the ability to borrow through repurchase agreements. Under these agreements, borrowings are collateralized with mortgage-backed securities or other investment securities.
The Bank has Fed funds borrowing lines with three of its correspondent banks. The Bank used each of these lines during the year. The Bank also has a Line of Credit with the Federal Reserve Bank of San Francisco. As of December 31, 2007, there were no outstanding balances on any of these lines.
Liquidity management is of critical importance to the Bank in that it significantly relies upon wholesale sources of funds (e.g. FHLB-Seattle advances). While these sources have proven to be stable and reliable, an interruption in the availability of these sources could have an adverse impact on the operations of the Corporation. Also see the Consolidated Statement of Cash Flows in the financial statement section of this filing for further information regarding liquidity.
Interest Rate Risk Management
Management considers interest rate risk to be a significant market risk that could have a material effect on the Corporation’s financial condition and results of operations.
The Corporation has taken steps to balance its sensitivity to changes in interest rates by altering its asset and liability mix. The origination of floating-rate loans such as business, construction and other prime-based loans is emphasized. The vast majority of fixed-rate loans have repricing periods with a maximum of five years. The mix of floating- and fixed-rates assets is designed to mitigate the impact of rate changes on the Corporation’s net interest income. Virtually all fixed-rate residential loans are sold into the secondary market. However, the Bank has sought to add prepayment provisions to its newly originated loans with 5 year fixed and adjustable rate loans. Many of the Bank’s fixed-rate loans do not have such provisions for prepayment fees, and as a result, a drop in rates can precipitate a refinancing of the Bank’s assets.
Interest rate risk is monitored using several methodologies, principally financial modeling. The earnings exposure to interest rate changes is evaluated in the context of certain upward and downward interest rate changes occurring instantaneously. At December 31, 2007, a 200 basis point increase in rates would increase forecasted net interest income over a twelve-month period by approximately 1.8%. A 200 basis point decrease in rates would decrease interest income by 5.6% according to the model.
The changes of the fair value of assets and liabilities and the resulting impact on the fair value of equity are also modeled under different rate scenarios. In the 200 basis point increase scenario, the fair value of equity declines by $1.9 million or 1.2%, a 200 basis point decrease in rates would decrease the fair value of equity by $34.6 million or 21.3%. Both are within the guideline established by the Bank’s Asset/Liability Policy.
The Corporation maintained a trading account for financial instruments during 2007, however there was no balance as of December 31, 2007. Moreover, the Corporation is not subject to foreign currency exchange rate risk or commodity price risk.
The individual categories of assets and liabilities that are subject to interest rate sensitivity as of December 31, 2007, are shown in the following table.
| | | INTEREST REPRICING ASSUMPTIONS | |
(Dollars in thousands) | | <1 YEAR | | | 1-3 YEARS | | | 3-5 YEARS | | | 5-10 YEARS | | | 10 YEARS AND UP | | | TOTAL | | | FAIR VALUE | |
| | | | | | | | | | | | | | | | | | | | | | |
| Interest-Sensitive Assets | | | | | | | | | | | | | | | | | | | | | |
| Total loans | | $ | 769,203 | | | $ | 184,515 | | | $ | 142,227 | | | $ | 11,988 | | | $ | 220 | | | $ | 1,108,153 | | | $ | 1,126,274 | |
Investments and other interest-earning assets | | | 47,646 | | | | 20,426 | | | | 36,305 | | | | 102,551 | | | | 27,711 | | | | 234,639 | | | | 232,694 | |
| Interest-Sensitive Liabilities | | | | | | | | | | | | | | | | | | | | | | | | | | | | |
| Checking accounts | | $ | 11,185 | | | $ | 12,202 | | | $ | 18,302 | | | $ | 8,236 | | | $ | 915 | | | $ | 50,840 | | | $ | 50,840 | |
| Money market accounts | | | 311,214 | | | | 1,462 | | | | 2,194 | | | | 987 | | | | 110 | | | | 315,967 | | | | 315,967 | |
| Savings accounts | | | 2,485 | | | | 2,711 | | | | 4,067 | | | | 1,830 | | | | 204 | | | | 11,297 | | | | 11,297 | |
| Certificates of deposit | | | 401,800 | | | | 25,080 | | | | 3,016 | | | | 9,546 | | | | - | | | | 439,442 | | | | 442,262 | |
| Borrowings | | | 142,625 | | | | 10,000 | | | | 35,000 | | | | 139,000 | | | | 25,000 | | | | 351,625 | | | | 364,499 | |
Junior subordinated debentures payable | | | - | | | | - | | | | 15,465 | | | | - | | | | 10,310 | | | | 25,775 | | | | 26,887 | |
Off-Balance Sheet Arrangements: Credit Commitments
Commitments to extend credit are agreements to lend to a customer as long as there is no violation of any condition established in the contract. Commitments generally have fixed expiration dates or other termination clauses and may require payment of a fee. Since many of the commitments are expected to expire without being drawn upon, the total commitment amounts do not necessarily represent future cash requirements.
The Bank underwrites its standby letters of credit using its policies and procedures applicable to loans in general. Standby letters of credit are made on an unsecured and secured basis. The Bank had not incurred any losses on its commitments in 2007 or 2006.
A summary of the notional amount of the Bank’s financial instruments with off-balance sheet risk at December 31, 2007 follows:
| (Dollars in thousands) | | TOTAL | |
| Commitments to extend credit | | $ | 308,753 | |
| Standby letters of credit and financial guarantees written | | | 5,171 | |
| Unused commitments on bankcards | | | 12,840 | |
| Total | | $ | 326,764 | |
The following table sets forth the Corporation’s long-term contractual obligations:
| | | PAYMENTS DUE PER PERIOD | |
| (Dollars in thousands) | | <1 YEAR | | | 1-3 YEARS | | | 3-5 YEARS | | | THEREAFTER | | | TOTAL | |
| Certificates of deposit | | $ | 401,800 | | | $ | 25,080 | | | $ | 3,016 | | | $ | 9,546 | | | $ | 439,442 | |
| Federal Home Loan Bank advances | | | 2,000 | | | | 10,000 | | | | 50,000 | | | | 169,000 | | | | 231,000 | |
| Operating lease obligations | | | 813 | | | | 1,541 | | | | 1,463 | | | | 7,445 | | | | 11,262 | |
| Junior subordinated debentures payable | | | - | | | | - | | | | - | | | | 26,887 | | | | 26,887 | |
| Total | | $ | 404,613 | | | $ | 36,621 | | | $ | 54,479 | | | $ | 212,878 | | | $ | 708,591 | |
The Corporation also has operating leases comprised of leases for office space.
Summation of Factors That May Affect Financial Condition and Future Results
Credit risk: The most significant risk that may impact Cascade Financial Corporation would be deterioration in the quality of the loan portfolio. The Corporation’s loan growth has been focused on commercial lending. While it has not been the Corporation’s experience, historically for the banking industry, commercial loans have higher levels of losses than residential loans. The Corporation’s ability to meet its profitability and growth goals would be severely compromised with a large number of impaired credits. In addition, the Corporation and its subsidiary, Cascade Bank, could face regulatory restrictions on its activities.
Interest rate risk: While the Corporation actively manages its exposure to changes in interest rates, volatile interest rates and/or changes in the shape of the yield curve could have a meaningful impact on the Corporation’s net income. Many of the assets and liabilities of the Corporation have embedded options, which add another layer of complexity in its interest rate risk management practices.
Liquidity: Disruptions in the capital markets could have a major impact on the Corporation’s net income and balance sheet. As a user of Federal Home Loan Bank advances, repurchase agreements and brokered CDs, interruption or truncation of these sources of funds could force the Corporation to liquidate assets at an inauspicious time or curtail lending activity, which could adversely affect customer relationships.
Recently issued accounting pronouncements: In December 2004, the FASB issued No. 123(R), Share-Based Payment, which is a revision of No. 123, Accounting for Stock-Based Compensation. Statement 123(R) supersedes the Accounting Principles Board (“APB”) Opinion No. 25, which the Corporation had used to report stock options granted to employees and directors. Statement 123(R) requires all share-based payments to employees, including stock options, be recognized in the income statement based on their fair values.
Available Information
A copy of the Corporation’s annual report on Form 10-K, quarterly reports on Form 10-Q, current reports on Form 8-K, and all amendments to such reports filed pursuant to Section 13(a) or 15(d) of the Securities Exchange Act of 1934, are available free of charge on or through our website located at www.cascadebank.com as soon as reasonably practicable after filing with the United States Securities and Exchange Commission. These reports are also available to shareholders, at no charge, upon written request to the Secretary of Cascade Financial Corporation at 2828 Colby Avenue, Everett, Washington 98201.
The Board of DirectorsCascade Financial Corporation:
We have audited the accompanying consolidated balance sheets of Cascade Financial Corporation and Subsidiaries (the Corporation) as of December 31, 2007 and 2006, and the related consolidated statements of income, stockholders' equity and comprehensive income, and cash flows for each of the years in the three-year period ended December 31, 2007. We also have audited the Corporation’s internal control over financial reporting as of December 31, 2007, based on criteria established in Internal Control - Integrated Framework issued by the Committee of Sponsoring Organizations of the Treadway Commission (COSO). The Corporation’s management is responsible for these financial statements, for maintaining effective internal control over financial reporting, and for its assessment of the effectiveness of internal control over financial reporting included in the accompanying Report of Management on Internal Control over Financial Reporting. Our responsibility is to express an opinion on these financial statements and an opinion on the effectiveness of the Corporation's internal control over financial reporting based on our audits.
We conducted our audits in accordance with auditing standards of the Public Company Accounting Oversight Board (United States). Those standards require that we plan and perform the audits to obtain reasonable assurance about whether the financial statements are free of material misstatement and whether effective internal control over financial reporting was maintained in all material respects. Our audits of the financial statements included examining, on a test basis, evidence supporting the amounts and disclosures in the financial statements, assessing the accounting principles used and significant estimates made by management, as well as evaluating the overall financial statement presentation. Our audit of internal control over financial reporting included obtaining an understanding of internal control over financial reporting, assessing the risk that a material weakness exists, and testing and evaluating the design and operating effectiveness of internal control based on the assessed risks. Our audits also included performing such other procedures as we considered necessary in the circumstances. We believe that our audits provide a reasonable basis for our opinions.
A company's internal control over financial reporting is a process designed to provide reasonable assurance regarding the reliability of financial reporting and the preparation of financial statements for external purposes in accordance with generally accepted accounting principles. A company's internal control over financial reporting includes those policies and procedures that (1) pertain to the maintenance of records that, in reasonable detail, accurately and fairly reflect the transactions and dispositions of the assets of the company; (2) provide reasonable assurance that transactions are recorded as necessary to permit preparation of financial statements in accordance with generally accepted accounting principles, and that receipts and expenditures of the company are being made only in accordance with authorizations of management and directors of the company; and (3) provide reasonable assurance regarding prevention or timely detection of unauthorized acquisition, use, or disposition of the company's assets that could have a material effect on the financial statements.
Because of its inherent limitations, internal control over financial reporting may not prevent or detect misstatements. Also, projections of any evaluation of effectiveness to future periods are subject to the risk that controls may become inadequate because of changes in conditions, or that the degree of compliance with the policies or procedures may deteriorate.
In our opinion, the consolidated financial statements referred to above present fairly, in all material respects, the consolidated financial position of Cascade Financial Corporation and Subsidiaries as of December 31, 2007 and 2006, and the results of their operations and their cash flows for each of the years in the three-year period ended December 31, 2007, in conformity with accounting principles generally accepted in the United States of America. Also in our opinion, Cascade Financial Corporation maintained, in all material respects, effective internal control over financial reporting as of December 31, 2007, based on criteria established in Internal Control - Integrated Framework issued by the Committee of Sponsoring Organizations of the Treadway Commission (COSO).
As discussed in Note 7 to the consolidated financial statements, effective January 1, 2007, the Corporation adopted Statement of Financial Accounting Standards No. 159, The Fair Value Option for Financial Assets and Financial Liabilities and No. 157, Fair Value Measurements.
/s/ Moss Adams LLP
Everett, Washington
March 12, 2008
CASCADE FINANCIAL CORPORATION AND SUBSIDIARIES
Consolidated Balance Sheets
December 31, 2007, and 2006
| | | DECEMBER 31, | |
| (Dollars in thousands, except share amounts) | | 2007 | | | 2006 | |
| ASSETS | | | | | | |
| Cash on hand and in banks | | $ | 12,911 | | | $ | 23,707 | |
| Interest-bearing deposits in other financial institutions | | | 1,619 | | | | 19,172 | |
| Securities available-for-sale, fair value | | | 82,860 | | | | 130,656 | |
| Securities held-to-maturity, amortized cost | | | 137,238 | | | | 96,846 | |
| Federal Home Loan Bank (FHLB) stock | | | 11,920 | | | | 11,920 | |
| Loans, net | | | 1,092,776 | | | | 996,015 | |
| Goodwill | | | 24,585 | | | | 25,195 | |
| Core deposit intangible, net | | | 634 | | | | 775 | |
| Premises and equipment, net | | | 14,160 | | | | 12,003 | |
| Cash surrender value of bank owned life insurance (BOLI) | | | 22,658 | | | | 17,974 | |
| Accrued interest receivable and other assets | | | 16,227 | | | | 10,991 | |
| Total assets | | $ | 1,417,588 | | | $ | 1,345,254 | |
| | | | | | | | | |
| LIABILITIES AND STOCKHOLDERS’ EQUITY | | | | | | | | |
| Liabilities: | | | | | | | | |
| Deposits | | $ | 904,896 | | | $ | 855,449 | |
| FHLB advances | | | 231,000 | | | | 243,000 | |
| Securities sold under agreements to repurchase | | | 120,625 | | | | 95,710 | |
| Junior subordinated debentures payable | | | 15,465 | | | | 25,775 | |
| Junior subordinated debentures payable, fair value | | | 11,422 | | | | — | |
| Advance payments by borrowers for taxes and insurance | | | 502 | | | | 703 | |
| Dividends payable | | | 1,082 | | | | 967 | |
| Accrued interest payable, expenses, and other liabilities | | | 10,500 | | | | 8,451 | |
| Total liabilities | | | 1,295,492 | | | | 1,230,055 | |
| | | | | | | | | |
| Stockholders’ equity: | | | | | | | | |
| Preferred stock, $.01 par value. Authorized 500,000 shares; no shares issued or outstanding | | | | | | | | |
Common stock, $.01 par value. Authorized 25,000,000 shares; issued and outstanding 12,023,685 shares at December 31, 2007, and 12,093,699 shares at December 31, 2006 | | | 120 | | | | 121 | |
| Additional paid-in capital | | | 40,322 | | | | 39,430 | |
| Retained earnings, substantially restricted | | | 82,169 | | | | 77,952 | |
| Accumulated other comprehensive loss | | | (515 | ) | | | (2,304 | ) |
| Total stockholders’ equity | | | 122,096 | | | | 115,199 | |
| Total liabilities and stockholders’ equity | | $ | 1,417,588 | | | $ | 1,345,254 | |
(See accompanying notes to consolidated financial statements.)
CASCADE FINANCIAL CORPORATION AND SUBSIDIARIES
Consolidated Statements of Income
Years ended December 31, 2007, 2006, and 2005
| | | YEARS ENDED | |
| | | DECEMBER 31, | |
| (Dollars in thousands, except share amounts) | | 2007 | | | 2006 | | | 2005 | |
| Interest income: | | | | | | | | | |
| Loans | | $ | 81,558 | | | $ | 71,104 | | | $ | 57,599 | |
| Securities held-for-trading | | | 1,884 | | | | — | | | | — | |
| Securities available-for-sale | | | 4,756 | | | | 6,723 | | | | 5,534 | |
| Securities held-to-maturity | | | 4,527 | | | | 4,563 | | | | 4,306 | |
| FHLB dividends | | | 72 | | | | 12 | | | | 48 | |
| Interest-bearing deposits | | | 1,138 | | | | 256 | | | | 315 | |
| Total interest income | | | 93,935 | | | | 82,658 | | | | 67,802 | |
| Interest expense: | | | | | | | | | | | | |
| Deposits | | | 35,220 | | | | 28,576 | | | | 18,314 | |
| FHLB advances | | | 10,240 | | | | 11,193 | | | | 11,031 | |
| Securities sold under agreements to repurchase | | | 2,960 | | | | 1,619 | | | | 733 | |
| Junior subordinated debentures payable | | | 2,120 | | | | 1,880 | | | | 1,198 | |
| Total interest expense | | | 50,540 | | | | 43,268 | | | | 31,276 | |
| Net interest income | | | 43,395 | | | | 39,390 | | | | 36,526 | |
| Provision for loan losses | | | 1,350 | | | | 1,000 | | | | 945 | |
| Net interest income after provision for loan losses | | | 42,045 | | | | 38,390 | | | | 35,581 | |
| Other income: | | | | | | | | | | | | |
| Gain on sale of loans | | | 199 | | | | 483 | | | | 865 | |
| (Loss) gain on sale of securities available-for-sale, net | | | (435 | ) | | | — | | | | 67 | |
| Net gain on fair value of financial instruments | | | 1,081 | | | | — | | | | — | |
| Net gain on FHLB advances | | | 569 | | | | — | | | | — | |
| (Loss) gain on sale of REO, net | | | — | | | | (27 | ) | | | 33 | |
| Checking service fees | | | 3,820 | | | | 3,311 | | | | 3,124 | |
| Other service fees | | | 1,059 | | | | 1,156 | | | | 916 | |
| BOLI | | | 803 | | | | 769 | | | | 764 | |
| Other | | | 470 | | | | 334 | | | | 564 | |
| Total other income | | | 7,566 | | | | 6,026 | | | | 6,333 | |
| Other expenses: | | | | | | | | | | | | |
| Salaries and employee benefits | | | 13,817 | | | | 12,691 | | | | 12,114 | |
| Occupancy | | | 3,576 | | | | 3,450 | | | | 3,323 | |
| Marketing | | | 1,182 | | | | 1,094 | | | | 810 | |
| B&O tax | | | 1,373 | | | | 1,027 | | | | 713 | |
| Other | | | 6,734 | | | | 6,324 | | | | 5,646 | |
| Total other expenses | | | 26,682 | | | | 24,586 | | | | 22,606 | |
| Income before provision for income taxes | | | 22,929 | | | | 19,830 | | | | 19,308 | |
| Provision for income taxes | | | 7,383 | | | | 6,475 | | | | 6,262 | |
| Net income | | $ | 15,546 | | | $ | 13,355 | | | $ | 13,046 | |
| | | | | | | | | | | | | |
| Net income per common share, basic | | $ | 1.29 | | | $ | 1.11 | | | $ | 1.09 | |
| Weighted average number of shares outstanding, basic | | | 12,047,792 | | | | 12,060,191 | | | | 11,977,824 | |
| Net income per share, diluted | | $ | 1.27 | | | $ | 1.08 | | | $ | 1.06 | |
| Weighted average number of shares outstanding, diluted | | | 12,284,854 | | | | 12,363,198 | | | | 12,319,873 | |
| | | | | | | | | | | | | |
(See accompanying notes to consolidated financial statements.)
CASCADE FINANCIAL CORPORATION AND SUBSIDIARIES
Consolidated Statements of Stockholders’ Equity and Comprehensive Income
Years ended December 31, 2007, 2006, and 2005
| Consolidated Statement of Stockholders’ Equity | | | | | | | | | | | | | | | | | | |
| (Dollars in thousands, except share amounts) | | SHARES | | | COMMON STOCK | | | ADDITIONAL PAID-IN CAPITAL | | | RETAINED EARNINGS | | | ACCUMULATED OTHER COMPREHENSIVE INCOME (LOSS), NET | | | TOTAL STOCK-HOLDERS’ EQUITY | |
| Balances at December 31, 2004 | | | 9,559,822 | | | $ | 96 | | | $ | 37,326 | | | $ | 59,975 | | | $ | (1,147 | ) | | $ | 96,250 | |
| Cash dividends | | | — | | | | — | | | | — | | | | (3,260 | ) | | | — | | | | (3,260 | ) |
| Options exercised, including related tax benefit | | | 81,019 | | | | — | | | | 803 | | | | — | | | | — | | | | 803 | |
| Net income | | | — | | | | — | | | | — | | | | 13,046 | | | | — | | | | 13,046 | |
| Shares repurchased | | | (40,953 | ) | | | — | | | | (42 | ) | | | (816 | ) | | | — | | | | (858 | ) |
Other comprehensive loss, net of tax (benefit) of $(457) | | | — | | | | — | | | | — | | | | — | | | | (850 | ) | | | (850 | ) |
| Issaquah merger | | | 3,899 | | | | — | | | | 62 | | | | — | | | | — | | | | 62 | |
| Balances at December 31, 2005 | | | 9,603,787 | | | | 96 | | | | 38,149 | | | | 68,945 | | | | (1,997 | ) | | | 105,193 | |
| Stock split (5-for-4) | | | 2,410,282 | | | | 24 | | | | (33 | ) | | | — | | | | — | | | | (9 | ) |
| Cash dividends | | | — | | | | — | | | | — | | | | (3,706 | ) | | | — | | | | (3,706 | ) |
| Options exercised, including related tax benefit | | | 122,920 | | | | 1 | | | | 1,058 | | | | — | | | | — | | | | 1,059 | |
| Stock compensation expense net of tax benefit | | | — | | | | — | | | | 287 | | | | — | | | | — | | | | 287 | |
| Net income | | | — | | | | — | | | | — | | | | 13,355 | | | | — | | | | 13,355 | |
| Shares repurchased | | | (43,290 | ) | | | — | | | | (31 | ) | | | (642 | ) | | | — | | | | (673 | ) |
Other comprehensive loss, net of tax (benefit) of $(165) | | | — | | | | — | | | | — | | | | — | | | | (307 | ) | | | (307 | ) |
| Balances at December 31, 2006 | | | 12,093,699 | | | | 121 | | | | 39,430 | | | | 77,952 | | | | (2,304 | ) | | | 115,199 | |
| Adoption of fair value option | | | — | | | | — | | | | — | | | | (4,532 | ) | | | — | | | | (4,532 | ) |
| Cash dividends | | | — | | | | — | | | | — | | | | (4,094 | ) | | | — | | | | (4,094 | ) |
| Options exercised, including related tax benefit | | | 108,818 | | | | — | | | | 813 | | | | — | | | | — | | | | 813 | |
| Stock compensation expense net of tax benefit | | | — | | | | — | | | | 213 | | | | — | | | | — | | | | 213 | |
| Net income | | | — | | | | — | | | | — | | | | 15,546 | | | | — | | | | 15,546 | |
| Shares repurchased | | | (178,832 | ) | | | (1 | ) | | | (134 | ) | | | (2,703 | ) | | | — | | | | (2,838 | ) |
Other comprehensive income,net of tax provision of $963 | | | — | | | | — | | | | — | | | | — | | | | 1,789 | | | | 1,789 | |
| Balances at December 31, 2007 | | | 12,023,685 | | | $ | 120 | | | $ | 40,322 | | | $ | 82,169 | | | $ | (515 | ) | | $ | 122,096 | |
| Consolidated Statement of Comprehensive Income | | | | | | | | | |
| | | YEARS ENDED DECEMBER 31, | |
| | | 2007 | | | 2006 | | | 2005 | |
| Net income | | $ | 15,546 | | | $ | 13,355 | | | $ | 13,046 | |
| Unrealized gain (loss) on securities available-for-sale, netof tax provision (benefit) of $953, $(165) and $(499) | | | 1,771 | | | | (307 | ) | | | (927 | ) |
| Unrealized (loss) on swaps available-for-sale, net of tax | | | | | | | | | | | | |
provision (benefit) of $0, $0 and $(77) | | | — | | | | — | | | | (146 | ) |
| Reclassification adjustment for gains on securities | | | | | | | | | | | | |
included in net income, net of tax provision of | | | | | | | | | | | | |
$10, $0 and $23 | | | 18 | | | | — | | | | 44 | |
| Reclassification adjustment for gains on swaps included | | | | | | | | | | | | |
in net income, net of tax provision of $0, $0 and $96 | | | — | | | | — | | | | 179 | |
| Comprehensive income | | $ | 17,335 | | | $ | 13,048 | | | $ | 12,196 | |
(See accompanying notes to consolidated financial statements.)
CASCADE FINANCIAL CORPORATION AND SUBSIDIARIES
Consolidated Statements of Cash Flows
Years ended December 31, 2007, 2006, and 2005
| | | YEARS ENDED | |
| | | DECEMBER 31, | |
| (Dollars in thousands) | | 2007 | | | 2006 | | | 2005 | |
| Cash flows from operating activities: | | | | | | | | | |
| Net income | | $ | 15,546 | | | $ | 13,355 | | | $ | 13,046 | |
| Adjustments to reconcile net income to net cash provided by (used in) operating activities: | | | | | | | | | | | | |
| Depreciation and amortization of premises and equipment | | | 1,875 | | | | 1,917 | | | | 1,874 | |
| Provision for losses on loans | | | 1,350 | | | | 1,000 | | | | 945 | |
| Increase in cash surrender value of bank owned life insurance | | | (684 | ) | | | (661 | ) | | | (663 | ) |
| Amortization of retained servicing rights | | | 44 | | | | 6 | | | | 30 | |
| Amortization of core deposit intangible | | | 141 | | | | 141 | | | | 141 | |
| Deferred income taxes | | | 1,982 | | | | 178 | | | | (150 | ) |
| Deferred loan fees, net | | | 290 | | | | (9 | ) | | | 748 | |
| Gain on sale of loans | | | (199 | ) | | | (483 | ) | | | (865 | ) |
| Stock-based compensation | | | 213 | | | | 287 | | | | — | |
| Excess tax benefits from stock-based compensation | | | (231 | ) | | | (314 | ) | | | (301 | ) |
| Purchase of securities held-for-trading | | | (46,413 | ) | | | — | | | | — | |
| Proceeds from sales/calls on securities held-for-trading | | | 112,162 | | | | — | | | | — | |
| Net (loss) gain on sales of securities available-for-sale | | | 435 | | | | — | | | | (67 | ) |
| Net gain on FHLB advances | | | (569 | ) | | | — | | | | — | |
| Loss on sales of premises and equipment | | | — | | | | — | | | | — | |
Net loss (gain) on sale of real estate owned, investment property and other repossessed assets | | | — | | | | 27 | | | | (33 | ) |
| Federal Home Loan Bank stock dividend received | | | — | | | | — | | | | (48 | ) |
| Net change in accrued interest receivable and other assets | | | (1,313 | ) | | | (562 | ) | | | (156 | ) |
Net change in accrued interest payable, expenses and other liabilities | | | (733 | ) | | | 1,764 | | | | 2,392 | |
| Net cash provided by operating activities | | | 83,896 | | | | 16,646 | | | | 16,893 | |
| Cash flows from investing activities: | | | | | | | | | | | | |
| Loans originated, net of principal repayments | | | (91,242 | ) | | | (133,462 | ) | | | (71,352 | ) |
| Purchases of securities held-to-maturity | | | (64,034 | ) | | | (3,434 | ) | | | (10,054 | ) |
| Proceeds from sales/calls on securities held-to-maturity | | | 5,000 | | | | — | | | | — | |
| Principal repayments on securities held-to-maturity | | | 2,658 | | | | 2,020 | | | | 6,271 | |
| Purchases of securities available-for-sale | | | (76,198 | ) | | | (5,716 | ) | | | (58,289 | ) |
| Proceeds from sales of securities available-for-sale | | | 66,220 | | | | — | | | | 6,488 | |
| Principal repayments on securities available-for-sale | | | 5,677 | | | | 15,184 | | | | 22,318 | |
| Purchases of premises and equipment | | | (4,047 | ) | | | (1,846 | ) | | | (1,345 | ) |
| Proceeds from sales/retirements of premises and equipment and REO | | | 15 | | | | 269 | | | | 25 | |
| Proceeds from loan participations sold | | | (6,818 | ) | | | 3,988 | | | | (1,747 | ) |
| Purchase CRA investment | | | (1,890 | ) | | | — | | | | — | |
| Purchase of bank owned life insurance | | | (4,000 | ) | | | — | | | | — | |
| | | | | | | | | | | | | |
| Net cash used in investing activities | | | (168,659 | ) | | | (122,997 | ) | | | (107,685 | ) |
| Subtotal, carried forward | | $ | (84,763 | ) | | $ | (106,351 | ) | | $ | (90,792 | ) |
CASCADE FINANCIAL CORPORATION AND SUBSIDIARIES
Consolidated Statements of Cash Flows, Continued
Years ended December 31, 2007, 2006, and 2005
| | | YEARS ENDED | |
| | | DECEMBER 31, | |
| (Dollars in thousands) | | 2007 | | | 2006 | | | 2005 | |
| | | | | | | | | | |
| Subtotal, brought forward | | $ | (84,763 | ) | | $ | (106,351 | ) | | $ | (90,792 | ) |
| Cash flows from financing activities: | | | | | | | | | | | | |
| Proceeds from issuance of common stock | | | 582 | | | | 736 | | | | 564 | |
| Dividends paid | | | (3,978 | ) | | | (3,603 | ) | | | (3,163 | ) |
| Repurchase of common stock | | | (2,838 | ) | | | (673 | ) | | | (858 | ) |
| Excess tax benefits from stock-based compensation | | | 231 | | | | 314 | | | | 301 | |
| Net increase in deposits | | | 49,134 | | | | 59,681 | | | | 73,860 | |
| Net increase (decrease) in Federal Home Loan Bank advances | | | (11,431 | ) | | | 7,000 | | | | 8,000 | |
| Net increase (decrease) in securities sold under agreements to repurchase | | | 24,915 | | | | 44,652 | | | | 30,156 | |
| Net increase (decrease) in advance payments by borrowers for taxes and insurance | | | (201 | ) | | | 14 | | | | 12 | |
| Proceeds from junior subordinated debentures payable | | | — | | | | 10,000 | | | | — | |
| Net cash provided by financing activities | | | 56,414 | | | | 118,121 | | | | 108,872 | |
| Net increase (decrease) in cash and cash equivalents | | | (28,349 | ) | | | 11,770 | | | | 18,080 | |
| Cash and cash equivalents at beginning of period | | | 42,879 | | | | 31,109 | | | | 13,029 | |
| Cash and cash equivalents at end of period | | $ | 14,530 | | | $ | 42,879 | | | $ | 31,109 | |
| | | | | | | | | | | | | |
| Supplemental disclosures of cash flow information – | | | | | | | | | | | | |
| Cash paid during the period for: | | | | | | | | | | | | |
| Interest | | $ | 51,457 | | | $ | 40,241 | | | $ | 30,642 | |
| Income taxes | | | 5,600 | | | | 6,700 | | | | 4,716 | |
| | | | | | | | | | | | | |
| Supplemental schedule of non-cash investing activities: | | | | | | | | | | | | |
| Mark-to-market on securities available-for-sale | | | (2,752 | ) | | | 472 | | | | 1,308 | |
| Retirement of common stock in retained earnings | | | 171 | | | | 142 | | | | 60 | |
| Dividends declared | | | 4,094 | | | | 3,706 | | | | 3,260 | |
| Cumulative adjustment to equity for SFAS No.159 | | | (3,162 | ) | | | — | | | | — | |
Notes to Consolidated Financial Statements
(Dollars in thousands, except share amounts)
(1) Summary of Significant Accounting Policies
The accounting and financial reporting policies of Cascade Financial Corporation (the “Corporation”) and its sole subsidiary, Cascade Bank (“the Bank”) conform to accounting principles generally accepted in the United States of America and to general practice within the financial institutions industry, where applicable. In preparing the consolidated financial statements, management makes estimates and assumptions that affect the reported amounts of assets and liabilities and disclosure of contingent assets and liabilities at the date of the financial statements and the reported amounts of income and expense. Actual results could differ from those estimates. A material estimate that is particularly susceptible to significant change relates to the determination of the allowance for losses on loans and the valuation of real estate acquired in connection with foreclosures or in satisfaction of loans. In connection with the determination of the estimated losses on loans and foreclosed assets held-for-sale, management obtains independent appraisals for significant properties.
The following is a description of the more significant policies that the Corporation follows in preparing and presenting its consolidated financial statements.
CASCADE FINANCIAL CORPORATION AND SUBSIDIARIES
Notes to Consolidated Financial Statements
(Dollars in thousands, except share amounts)
(a) Basis of Presentation
The consolidated financial statements include the accounts of the Corporation and the Bank. All significant intercompany balances and transactions have been eliminated in the consolidation. In January 2003, the Financial Accounting Standards Board (FASB) issued Interpretation No. 46 (FIN 46), Consolidation of Variable Interest Entities and, in December 2003, issued Revised Interpretation No. 46 (FIN 46R), Consolidation of Variable Interest Entities, which replaced FIN 46. Historically, issuer trusts that issued trust preferred securities (junior subordinated debentures payable) have been consolidated by their parent companies and trust preferred securities have been treated as eligible for Tier 1 capital treatment by bank holding companies under Federal Reserve Board (FRB) rules and regulations relating to minority interests in equity accounts of consolidated subsidiaries. As a result of the adoption of FIN 46R, we deconsolidated the Trust and all periods in the consolidated financial statements have been restated to reflect this change.
In a Supervisory Letter dated July 2, 2003, the FRB stated that trust preferred securities continue to qualify as Tier 1 capital until notice is given to the contrary. The FRB will review the regulatory implications of any accounting treatment changes and will provide further guidance if necessary or warranted.
(b) Cash Equivalents
The Corporation considers all interest-bearing deposits and short-term highly liquid investment securities with an original maturity of three months or less to be cash equivalents.
(c) Interest-Bearing Deposits with Financial Institutions
Interest-bearing deposits with other financial institutions are carried at cost and include interest-bearing deposits at the Federal Home Loan Bank. At times throughout the year, the Bank has balances that exceed FDIC insurance limits.
(d) Federal Home Loan Bank (FHLB) Stock
As a member of the FHLB system, the Bank is required to maintain a minimum level of investment in FHLB stock based on specified percentages of its outstanding FHLB advances. The Bank's investment in FHLB stock is carried at par value ($100 per share), which reasonably approximates its fair value. The Bank may request redemption at par value of any stock in excess of the amount the Bank is required to hold. Stock redemptions are at the discretion of the FHLB. During 2002, the FHLB revised its capital structure from the issuance of one class of stock to two, B (1) and B (2) stock. Class B (1) stock can be sold back to the FHLB at cost, but is restricted as to purchase, sale and redemption. Class B (2) is not a required investment for institutions and is not restricted to purchase and sale, but has the same redemption restrictions as Class B (1) stock. Included in the balance sheet as of December 31, 2007, and 2006, the Bank has $11.9 million and $0 of Class B (1) and B (2) stock.
(e) Transfer of Financial Assets
Transfers of financial assets are accounted for as sales when control over the assets has been surrendered. Control over transferred assets is deemed to be surrendered when (1) the assets have been isolated from the Bank, (2) the transferee obtains the right (free of conditions that constrain it from taking advantage of that right) to pledge or exchange the transferred assets, and (3) the Bank does not maintain effective control over the transferred assets through an agreement to repurchase them before their maturity.
(f) Mortgage Servicing Rights
Servicing assets are recognized when rights are acquired through the sale of mortgage loans or when the Bank originates and sells mortgage loans and retains the servicing. Loans serviced for others are not included in the accompanying consolidated balance sheets. In 2006, the Bank sold $34.1 million of commercial real estate and multifamily loans and retained the servicing. In the two previous years, the Bank had not retained the servicing on any loans sold. Capitalized servicing rights are reported in other assets. Mortgage loans serviced for others include whole loans sold. Loans being serviced totaled $32.0 million and $39.0 million at December 31, 2007, and 2006, respectively.
Servicing fee income is recorded for fees earned for servicing loans. The fees are based on a contractual percentage of the outstanding principal or a fixed amount per loan and are recorded as income when earned. The amortization of mortgage servicing rights is netted against loan servicing fee income.
(g) Marketing Costs
The Bank expenses most marketing costs as they are incurred but some marketing costs are capitalized and amortized over the useful life of the expenditure. Marketing expense was $1.2 million, $1.1 million, and $810 for the years ended December 31, 2007, 2006, and 2005, respectively.
CASCADE FINANCIAL CORPORATION AND SUBSIDIARIES
Notes to Consolidated Financial Statements
(Dollars in thousands, except share amounts)
(h) Comprehensive Income
Comprehensive income is comprised of net income and other comprehensive income. Other comprehensive income includes items previously recorded directly to equity, such as unrealized gains and losses on securities available-for-
sale and certain derivative instruments. Comprehensive income is presented with the consolidated statement of stockholders equity.
(i) Earnings per Share (EPS) Data
The Corporation displays basic and diluted EPS in the consolidated statement of income. Basic EPS is computed by dividing net income by the weighted average number of shares outstanding during the year. Diluted EPS is computed by dividing net income by diluted weighted average shares outstanding, which includes common stock equivalent shares outstanding using the treasury stock method, unless such shares are anti-dilutive. Common stock equivalents include stock options.
(j) Goodwill and Other Intangible Assets
Net assets of companies acquired in purchase transactions are recorded at fair value at the date of acquisition. Identified intangibles are amortized on an accelerated basis over the period benefited. Goodwill is not amortized but is reviewed for potential impairment on a quarterly basis at the reporting unit level. The impairment test is performed in two phases. The first step of the goodwill impairment test compares the fair value of the reporting unit with its carrying amount, including goodwill. If the fair value of the reporting unit exceeds its carrying amount, goodwill of the reporting unit is considered not impaired; however, if the carrying amount of the reporting unit exceeds its fair value, an additional procedure must be performed. That additional procedure compares the implied fair value of the reporting unit’s goodwill (as defined in SFAS No. 142, Goodwill and Other Intangible Assets, (“SFAS 142”)) with the carrying amount of that goodwill. An impairment loss is recorded to the extent that the carrying amount of goodwill exceeds its implied fair value. The excess cost over fair value of net assets acquired consists mainly of goodwill and core deposit premiums. Core deposit intangibles are amortized on a straight-line basis over 8 years. Intangibles are evaluated periodically, and at least annually, for impairment.
Goodwill and other intangible assets consisted of the following at December 31, 2007 and 2006:
| | | GROSS CARRYING AMOUNT | |
| Intangible assets carrying value | | 2007 | | | 2006 | |
| Goodwill | | $ | 24,585 | | | $ | 25,195 | |
| Core deposit intangible, net | | | 634 | | | | 775 | |
| Total | | $ | 25,219 | | | $ | 25,970 | |
Amortization of intangible assets and mortgage servicing rights for 2007 and 2006, was as follows:
| | | YEARS ENDED DECEMBER 31 | |
| Intangible assets amortization and impairment | | 2007 | | | 2006 | |
| Core deposit intangible | | $ | 141 | | | $ | 141 | |
| Mortgage servicing rights | | | 44 | | | | 6 | |
| Total | | $ | 185 | | | $ | 147 | |
Estimated existing intangible asset amortization for the next five years is as follows:
| Estimated amortization expense | | | |
| For year ended 12/31/08 | | $ | 180 | |
| For year ended 12/31/09 | | | 169 | |
| For year ended 12/31/10 | | | 161 | |
| For year ended 12/31/11 | | | 155 | |
| For year ended 12/31/12 | | | 80 | |
CASCADE FINANCIAL CORPORATION AND SUBSIDIARIES
Notes to Consolidated Financial Statements
(Dollars in thousands, except share amounts)
(k) Loans
Almost all of the Corporation's loans are located in Washington State, primarily in the Puget Sound Region. At December 31, 2007, the Corporation's loans were classified as one-to-four-family residences (9%), multifamily residences (1%), real estate construction (34%), business assets (42%), consumer assets (3%), and non-owner occupied commercial real estate properties (11%). Accordingly, the ultimate collectability of the Corporation's loan portfolio is susceptible to changes in the economic and real estate market conditions in the Puget Sound Region.
Business banking loans comprise 42% of the total loan portfolio. Most of the business banking loans are secured with collateral such as commercial property, business inventories, accounts receivable, equipment and personal property of the borrowers and/or guarantors. At December 31, 2007, $25.3 million in commercial and industrial loans were unsecured. Home equity loans and Lines of Credit account for the majority of the consumer loan portfolio.
Real estate loans originated by the Corporation are generally secured by no less than 80% of the lesser of the appraised value or purchase price of the underlying property. The Corporation currently requires first mortgage, residential customers to obtain private mortgage insurance on all loans above an 80% loan-to-value ratio.
Loans that management has the intent and ability to hold for the foreseeable future or until maturity or pay-off generally are reported at their outstanding unpaid principal balances adjusted for charge-offs, the allowance for loan losses, and any deferred fees or costs on originated loans. Interest income is accrued on the unpaid principal balance.
Interest Income
Interest is accrued only if deemed collectible. Accrual of interest income is generally discontinued when a loan becomes 90 days past due and accrued interest amounts are reversed. Once interest has been paid to date or management considers the loan to be fully collectible, it is returned to accrual status. However, the Bank had three loans that were 90 days or more past due and still accruing, totaling $11.6 million at December 31, 2007. These loans are secured by real estate and supported by current appraised values.
Loan origination fees and certain direct origination costs are deferred and amortized as an adjustment of the loan’s yield over the contractual life of the loan using the interest method. In the event loans are sold, the remaining net deferred loan origination fees or costs are recognized as a component of the gains or losses on the sale of loans. When portfolio loans pay off before their contractual maturity, the remaining deferred fees or costs are recognized as interest income or expense.
Loan commitment fees are deferred until loans are funded, at which time they are amortized into interest income using the effective interest method. If the commitment period expires, the fees are recognized as service charges.
Impairment of Loans and Allowance for Loan Losses
The allowance for loan losses is established as losses are estimated to have occurred through a provision for loan losses charged to earnings. Loan losses are charged against the allowance when management believes the uncollectability of a loan balance is confirmed. Subsequent recoveries, if any, are credited to the allowance.
The allowance for loan losses is evaluated on a regular basis by management and is based upon management’s periodic review of the collectability of the loans in light of historical experience, the nature and volume of the loan portfolio, adverse situations that may affect the borrower’s ability to repay, estimated value of any underlying collateral and prevailing economic conditions. This evaluation is inherently subjective as it requires estimates that are susceptible to significant revision as more information becomes available.
The allowance consists of specific, general and unallocated components. The specific component relates to loans that are classified as either doubtful or substandard. For such loans that are also classified as impaired, an allowance is established when the discounted cash flows (or collateral value or observable market price) of the impaired loan is lower than the carrying value of that loan. The general component covers nonclassified loans and is based on historical loss experience adjusted for qualitative factors. An unallocated component is maintained to cover uncertainties that could affect management’s estimate of probable losses. The unallocated component of the allowance reflects the margin of imprecision inherent in the underlying assumptions used in the methodologies for estimating specific and general losses in the portfolio.
A loan is considered impaired when, based on current information and events, it is probable that the Corporation will be unable to collect the scheduled payments of principal or interest when due according to the contractual terms of the loan agreement. Factors considered by management in determining impairment include payment status, collateral value, and the probability of collecting scheduled principal and interest payments when due. Loans that experience
insignificant payment delays and payment shortfalls generally are not classified as impaired. Management determines the significance of payment delays and payment shortfalls on a case-by-case basis, taking into consideration all of the
circumstances surrounding the loan and the borrower, including the length of the delay, the reasons for the delay, the borrower’s prior payment record, and the amount of the shortfall in relation to the principal and interest owed. Impairment is measured on a loan-by-loan basis for commercial and construction loans by either the present value of expected future cash flows discounted at the loan’s effective interest rate, the loan’s obtainable market price, or the fair value of the collateral if the loan is collateral dependent.
CASCADE FINANCIAL CORPORATION AND SUBSIDIARIES
Notes to Consolidated Financial Statements
(Dollars in thousands, except share amounts)
Large groups of smaller balance homogeneous loans are collectively evaluated for impairment. Accordingly, the Corporation does not separately identify individual consumer and residential loans for impairment disclosures, unless such loans are the subject of a restructuring agreement.
Management believes the allowance for losses on loans is adequate. While management uses available information to recognize losses on these assets, future additions to the allowances will be necessary based on
changes in economic conditions, particularly in the Western Washington Region. In addition, various regulatory agencies, as an integral part of their examination process, periodically review the Corporation’s allowances for losses on loans. Such agencies may require the Corporation to recognize additions to the allowances, or change valuations, based on their judgments about information available to them at the time of their examinations.
(l) Sales of Loans
Any loan that management determines will not be held-to-maturity is classified as held-for-sale at the time of origination. Loans originated and designated as held-for-sale are intended for sale in the secondary market and are carried at the lower of cost or estimated fair value in the aggregate. Gains or losses on the sale of such loans are based on the specific identification method. Net unrealized losses, if any, are recognized through a valuation allowance by charges to income. The Bank held $129 in loans held for sale at December 31, 2007, and $311 in loans held for sale at December 31, 2006. Loans are sold without recourse on a best efforts, servicing released basis. In December 2006, the Bank sold $34.1 million in commercial and multifamily loans in which the servicing was retained.
(m) Securities
Debt and equity securities, including mortgage-backed securities (“MBS”), may be classified as held-for-trading, available-for-sale, or held-to-maturity. Securities classified as held-for-trading are carried at fair value with unrealized gains and losses reported in earnings. Securities available-for-sale are carried at fair value, with unrealized gains and losses reported as a component of other comprehensive income. Investment securities held-to-maturity are carried at amortized cost or principal balance, adjusted for amortization of premiums and accretion of discounts. Amortization of premiums and accretion of discounts are calculated using a method that approximates the level yield method. The Corporation has the ability, and it is management’s intention, to hold held-to-maturity securities until maturity. Investments with fair values that are less than the amortized cost are considered impaired. Impairment may result from either a decline in the financial condition of the issuing entity or, in the case of fixed interest rate investments, from rising interest rates. At each financial statement date, management assesses each investment to determine if impaired investments are temporarily impaired or if the impairment is other-than-temporary based upon the positive and negative evidence available. Evidence evaluated includes, but is not limited to, industry analyst reports, credit market conditions, interest rate trends, and the intent and ability of the Corporation to retain its investment in the issuer for a period of time sufficient to allow for any anticipated recovery of fair value. If negative evidence outweighs positive evidence that the carrying amount is recoverable within a reasonable period of time, the impairment is deemed to be other-than-temporary and the security is written down in earnings as a realized loss in the period in which such determination is made. Gains and losses on the sale of securities are recorded on the settlement date and are determined based on the specific identification method.
(n) Real Estate Owned
Real estate owned includes real estate acquired in settlement of loans. Real estate owned is recorded at the lower of cost or fair value, based upon the most recent appraisal, less estimated costs to sell. Development, improvement and direct holding costs related to the property are capitalized. Any loss recorded at the time a foreclosure occurs is classified as a charge-off against the allowance for loan losses. Losses that result from the ongoing periodic valuation of these properties are charged to operations in the period in which they are identified. There was no real estate owned at December 31, 2007 or December 31, 2006.
(o) Premises and Equipment
Land is carried at cost. Buildings and equipment are stated at cost less accumulated depreciation. Straight-line depreciation is provided over the estimated useful lives of the respective assets. Leasehold improvements are amortized over the estimated useful lives of the improvements, or terms of the related leases, whichever is shorter. CASCADE FINANCIAL CORPORATION AND SUBSIDIARIES
Notes to Consolidated Financial Statements
(Dollars in thousands, except share amounts)
(p) Income Taxes
We account for income taxes in accordance with SFAS No. 109 Accounting for Income Taxes (“SFAS No. 109”), under the liability method which requires recognition of deferred tax assets and liabilities for the expected future income tax consequences of transactions that have been included in the Consolidated Financial Statements. Under this method, deferred tax assets and liabilities are determined based on the difference between the financial statement and tax basis of assets and liabilities using enacted tax rates in effect for the year in which the differences are expected to reverse. When circumstances warrant, we assess the likelihood that our net deferred tax assets will more-likely-than-not be recovered from future projected taxable income.
(q) Stock-Based Compensation
The Corporation previously accounted for its stock option plan in accordance with the provisions of APB Opinion No. 25, Accounting for Stock Issued to Employees. Effective January 1, 2006, the Corporation adopted SFAS No. 123 (revised 2004), Share-Based Payment, (“SFAS No. 123(R)”) using the modified prospective method. Statement 123(R) requires all share-based payments to employees, including grants of employee stock options, to be recognized in the income statement based on their fair values. See Note 14 to the Consolidated Financial Statements for a further discussion on stock-based compensation.
(r) Interest Rate Swap Agreements
For asset/liability management purposes, the Corporation has used interest rate swap agreements to hedge various exposures or to modify interest rate characteristics of various instruments. Interest rate swaps are contracts in which a series of interest rate flows are exchanged over a prescribed period. The notional amount on which the interest payments are based is not exchanged. Such derivatives are linked to specific assets or liabilities, and have high correlation between the contract and the underlying item being hedged, both at inception and throughout the hedge period. The Corporation had no interest rate swap agreements at December 31, 2007.
Interest rate swap agreements are utilized to convert a portion of variable-rate debt to a fixed-rate (cash flow hedge), or to convert a portion of fixed-rate assets to a variable-rate (fair value hedge).
Under SFAS No. 133, as amended, the gain or loss on a swap designated and qualifying as a fair value hedging instrument, as well as the offsetting gain or loss on the hedged item attributable to the risk being hedged, is recognized currently in earnings in the same accounting period. The effective portion of the gain or loss on a swap designated and
qualifying as a cash flow hedging instrument is reported as a component of other comprehensive income. The ineffective portion of the gain or loss on the swap instrument, if any, is recognized in current earnings.
Interest rate derivative financial instruments receive hedge accounting treatment only if they are designated as a hedge and are expected to be, and are, effective in substantially reducing interest rate risk arising from the assets and liabilities. Those swaps that do not meet the hedging criteria discussed below would be recorded at fair value with changes in fair value recorded in current income. Swaps must meet specific effectiveness tests (e.g., over time the change in their fair values due to the designated hedge risk must be within 80 to 125 percent of the opposite change in the fair values of the hedged assets or liabilities). If periodic assessment indicates derivatives no longer provide an effective hedge, the derivatives contracts would be closed out and settled or marked-to-market through income.
Beginning January 1, 2001, in accordance with SFAS No. 133, hedges of variable-rate debt are accounted for as cash flow hedges, with changes in fair value recorded in derivative assets or liabilities and other comprehensive income. The net settlement (upon close out or termination) that offsets changes in the value of the hedged debt is deferred and amortized into net interest income over the life of the hedged debt. Hedges of fixed-rate assets are accounted for as fair value hedges, with changes in fair value recorded in derivative assets or liabilities and interest income. The net settlement (upon close out or termination) that offsets changes in the value of the assets adjusts the basis of the assets and is deferred and amortized to interest income over the life of the assets. That portion, if any, of the net settlement amount that did not offset changes in the value of the hedged asset or liability is recognized immediately in noninterest income.
Cash flows resulting from the derivative financial instruments that are accounted for as hedges of assets and liabilities are classified in the cash flow statement in the same category as the cash flows of the items being hedged.
Derivative financial instruments are recognized as assets and liabilities on the consolidated balance sheet and measured at fair value.
(s) Off-Balance Sheet Credit Related Financial Instruments
In the ordinary course of business, the Corporation enters into commitments to extend credit, including commitments under lines of credit, bank cards, letters of credit, and standby letters of credit and guarantees. Such financial instruments are recorded when they are funded.
(t) Bank Owned Life Insurance (BOLI)
The carrying amount of BOLI approximates its fair value, net of any surrender charges. Fair value of BOLI is estimated using the cash surrender value. CASCADE FINANCIAL CORPORATION AND SUBSIDIARIES
Notes to Consolidated Financial Statements
(Dollars in thousands, except share amounts)
(u) Reclassifications
Certain balances have been reclassified to conform to the 2007 presentation.
(v) Recent Accounting Pronouncements
In September 2006, the FASB issued SFAS No. 158, Employers' Accounting for Defined Benefit Pension and Other Post-retirement Plans — An Amendment of FASB Statements No. 87, 88, 106, and 132(R). This Statement improves financial reporting by requiring an employer to recognize the overfunded or underfunded status of a defined benefit post-retirement plan as an asset or liability in its statement of financial position and to recognize changes in that funded status in the year in which the changes occur through comprehensive income of a business entity or changes in unrestricted net assets of a not-for-profit organization. This Statement also improves financial reporting by requiring an employer to measure the funded status of a plan as of the date of its year-end statement of financial position, with limited exceptions. An employer with publicly traded equity securities is required to initially recognize the funded status of a defined benefit post-retirement plan and to provide the required disclosures as of the end of the fiscal year ending after December 15, 2006. The requirement to measure plan assets and benefit obligations as of the date of the employer's fiscal year-end statement of financial position is effective for fiscal years ending after December 15, 2008. SFAS No. 158 is not expected to have a material impact on the Corporation.
In November 2007, the SEC issued Staff Accounting Bulletin No. 109, Written Loan Commitments Recorded at Fair Value through Earnings (“SAB 109”). SAB 109 provides guidance on the accounting for written loan commitments recorded at fair value under GAAP. Specifically, the SAB revises the Staff’s views on incorporating expected net future cash flows related to loan servicing activities in the fair value measurement of a written loan commitment. SAB 109, which supersedes SAB 105, Application of Accounting Principles to Loan Commitments, requires the expected net future cash flows related to the associated servicing of the loan be included in the measurement of all written loan commitments that are accounted for at fair value through earnings. SAB 109 is effective on January 1, 2008 for the Corporation. Adoption of SAB 109 is not expected to have a material impact on the Corporation’s financial statements.
In December 2007, FASB issued SFAS No. 141 (revised), Business Combinations. SFAS No. 141R establishes principles and requirements for how an acquirer recognizes and measures in its financial statements the identifiable assets acquired, the liabilities assumed, any noncontrolling interest in the acquiree and the goodwill acquired. SFAS No. 141R also establishes disclosure requirements to enable the evaluation of the nature and financial effects of the business combination. This statement applies prospectively to business combinations for which the acquisition date is on or after January 1, 2009. Accordingly, we will apply SFAS 141(R) to business combinations occurring on or after January 1, 2009.
In December 2007, the FASB issued SFAS No. 160, Noncontrolling Interests in Consolidated Financial Statements, an amendment of ARB No. 51. SFAS 160 establishes accounting and reporting standards that require that the ownership interests in subsidiaries held by parties other than the parent be clearly identified, labeled, and presented in the consolidated statement of financial position within equity, but separate from the parent’s equity; the amount of consolidated net income attributable to the parent and to the noncontrolling interest be clearly identified and presented on the face of the consolidated statement of income; and changes in a parent’s ownership interest while the parent retains its controlling financial interest in its subsidiary be accounted for consistently. SFAS 160 also requires that any retained noncontrolling equity investment in the former subsidiary be initially measured at fair value when a subsidiary is deconsolidated. SFAS 160 also sets forth the disclosure requirements to identify and distinguish between the interests of the parent and the interests of the noncontrolling owners. SFAS 160 applies to all entities that prepare consolidated financial statements, except not-for-profit organizations, but will affect only those entities that have an outstanding noncontrolling interest in one or more subsidiaries or that deconsolidate a subsidiary. SFAS 160 is effective for fiscal years, and interim periods within those fiscal years, beginning on or after December 15, 2008. Earlier adoption is prohibited. SFAS 160 must be applied prospectively as of the beginning of the fiscal year in which SFAS 160 is initially applied, except for the presentation and disclosure requirements. The presentation and disclosure requirements are applied retrospectively for all periods presented. We do not have a noncontrolling interest in one or more subsidiaries. Accordingly, we do not anticipate that the initial application of SFAS 160 will have an impact on our financial statements.
(2) Restricted Assets
Federal Reserve Board regulations require that the Bank maintain certain minimum reserve balances as either cash on hand, in the vault or on deposit with the Federal Reserve Bank. The minimum reserve balance as of December 31,
2006 was approximately $5.6 million. The reserve required to be held at the Federal Reserve as of December 31, 2007 was $0 due to a reclassification of deposits.
CASCADE FINANCIAL CORPORATION AND SUBSIDIARIES
Notes to Consolidated Financial Statements
(Dollars in thousands, except share amounts)
(3) Securities
A summary of securities at December 31, 2007, and December 31, 2006, follows:
| | | DECEMBER 31, 2007 | |
| | | AMORTIZED COST | | | GROSS UNREALIZED GAINS LESS THAN 1 YEAR | | | GROSS UNREALIZED GAINS MORE THAN 1 YEAR | | | GROSS UNREALIZED LOSSES LESS THAN 1 YEAR | | | GROSS UNREALIZED LOSSES MORE THAN 1 YEAR | | | FAIR VALUE | |
| Securities available-for-sale | | | | | | | | | | | | | | | | | | |
| MBS | | $ | 26,286 | | | $ | 2 | | | $ | 5 | | | $ | (71 | ) | | $ | (795 | ) | | $ | 25,427 | |
| Agency notes | | | 57,366 | | | | 67 | | | | — | | | | — | | | | — | | | | 57,433 | |
Total | | $ | 83,652 | | | $ | 69 | | | $ | 5 | | | $ | (71 | ) | | $ | (795 | ) | | $ | 82,860 | |
| | | AMORTIZED COST | | | GROSS UNREALIZED GAINS LESS THAN 1 YEAR | | | GROSS UNREALIZED GAINS MORE THAN 1 YEAR | | | GROSS UNREALIZED LOSSES LESS THAN 1 YEAR | | | GROSS UNREALIZED LOSSES MORE THAN 1 YEAR | | | FAIR VALUE | |
| Securities held-to-maturity | | | | | | | | | | | | | | | | | | |
| MBS | | $ | 22,556 | | | $ | 28 | | | $ | — | | | $ | — | | | $ | (643 | ) | | $ | 21,941 | |
| Agency notes | | | 113,907 | | | | 67 | | | | — | | | | (246 | ) | | | (149 | ) | | | 113,579 | |
| Corporate/other | | | 775 | | | | — | | | | — | | | | — | | | | — | | | | 775 | |
Total | | $ | 137,238 | | | $ | 95 | | | $ | — | | | $ | (246 | ) | | $ | (792 | ) | | $ | 136,295 | |
| | | DECEMBER 31, 2006 | |
| | | AMORTIZED COST | | | GROSS UNREALIZED GAINS LESS THAN 1 YEAR | | | GROSS UNREALIZED GAINS MORE THAN 1 YEAR | | | GROSS UNREALIZED LOSSES LESS THAN 1 YEAR | | | GROSS UNREALIZED LOSSES MORE THAN 1 YEAR | | | FAIR VALUE | |
| Securities available-for-sale | | | | | | | | | | | | | | | | | | |
| MBS | | $ | 38,428 | | | $ | 47 | | | $ | 3 | | | $ | (18 | ) | | $ | (713 | ) | | $ | 37,747 | |
| Agency notes | | | 95,772 | | | | — | | | | — | | | | — | | | | (2,863 | ) | | | 92,909 | |
Total | | $ | 134,200 | | | $ | 47 | | | $ | 3 | | | $ | (18 | ) | | $ | (3,576 | ) | | $ | 130,656 | |
| | | AMORTIZED COST | | | GROSS UNREALIZED GAINS LESS THAN 1 YEAR | | | GROSS UNREALIZED GAINS MORE THAN 1 YEAR | | | GROSS UNREALIZED LOSSES LESS THAN 1 YEAR | | | GROSS UNREALIZED LOSSES MORE THAN 1 YEAR | | | FAIR VALUE | |
| Securities held-to-maturity | | | | | | | | | | | | | | | | | | |
| MBS | | $ | 25,218 | | | $ | 7 | | | $ | — | | | $ | (14 | ) | | $ | (873 | ) | | $ | 24,338 | |
| Agency notes | | | 70,853 | | | | — | | | | — | | | | (24 | ) | | | (2,406 | ) | | | 68,423 | |
| Corporate/other | | | 775 | | | | — | | | | — | | | | — | | | | — | | | | 775 | |
Total | | $ | 96,846 | | | $ | 7 | | | $ | — | | | $ | (38 | ) | | $ | (3,279 | ) | | $ | 93,536 | |
At December 31, 2007, the Bank had 11 securities with a gross unrealized loss totaling $795 in our available-for-sale portfolio with a fair value of $21.0 million that had an unrealized loss for greater than one year and 14 held-to-maturity securities with a gross unrealized loss totaling $792 with a fair value of $50.0 million that have had an unrealized loss for more than one year. The only impairment on available-for-sale securities was in the MBS category, which accounted for 100% of the total impairment. As of December 31, 2007, the Bank had 12 available-for-sale and 17 held-to-maturity securities included in the temporarily impaired report, compared to 16 available-for-sale and 13 held-to-maturity with unrealized gains. The temporary impairment was less than 3% of the total book value of investments. Temporarily impaired securities are a result of an increase in interest rates and are expected to regain their value as the securities near maturity and/or market rates decline; other-than-temporarily impaired securities are a result of contractual failure by the issuer and are not expected to rebound and are considered not collectable. At December 31, 2007, the Bank had no securities with other-than-temporary impairments.
Certain investment securities shown above currently have fair values less than amortized cost and therefore contain unrealized losses. The Corporation has evaluated these securities and has determined that the decline in value is temporary and is related to the change in market interest rates since purchase. All are rated AAA for credit quality by at least one major
rating agency.
CASCADE FINANCIAL CORPORATION AND SUBSIDIARIES
Notes to Consolidated Financial Statements
(Dollars in thousands, except share amounts)
The decline in value is not related to any company or industry specific event. The Corporation anticipates full recovery of amortized cost with respect to these securities at maturity or sooner in the event of a more favorable market interest rate environment.
As of December 31, 2007, and 2006, the Corporation was required to maintain 81,050 and 79,050 shares, respectively, of $100 par value FHLB stock.
Accrued interest receivable on securities and interest-bearing deposits was $2.2 million and $2.3 million at
December 31, 2007, and 2006, respectively.
Proceeds from the sales of securities available-for-sale and gross realized gains and losses are summarized as follows for the year ended December 31, 2007, 2006, and 2005:
| | | PROCEEDS | | | GAINS | | | LOSSES | |
| Year ended December 31, 2007 | | $ | 66,220 | | | $ | 55 | | | $ | (490 | ) |
| Year ended December 31, 2006 | | | — | | | | — | | | | — | |
| Year ended December 31, 2005 | | | 6,488 | | | | 68 | | | | (1 | ) |
| | | | | | | | | | | | | | | | |
| | | WITHIN ONE YEAR | | | ONE TO FIVE YEARS | | | OVER FIVE TO TEN YEARS | | | OVER TEN YEARS | | | TOTAL | |
| Amortized Cost | | | | | | | | | | | | | | | |
| MBS | | $ | — | | | $ | 11,075 | | | $ | 13,248 | | | $ | 1,963 | | | $ | 26,286 | |
| Agency notes | | | 4,999 | | | | 20,999 | | | | 31,313 | | | | 55 | | | | 57,366 | |
| Total amortized cost | | $ | 4,999 | | | $ | 32,074 | | | $ | 44,561 | | | $ | 2,018 | | | $ | 83,652 | |
| Fair Value | | | | | | | | | | | | | | | | | | | | |
| MBS | | $ | — | | | $ | 10,891 | | | $ | 12,746 | | | $ | 1,790 | | | $ | 25,427 | |
| Agency notes | | | 5,006 | | | | 21,012 | | | | 31,360 | | | | 55 | | | | 57,433 | |
| Total fair value | | $ | 5,006 | | | $ | 31,903 | | | $ | 44,106 | | | $ | 1,845 | | | $ | 82,860 | |
| | | WITHIN ONE YEAR | | | ONE TO FIVE YEARS | | | OVER FIVE TO TEN YEARS | | | OVER TEN YEARS | | | TOTAL | |
| Amortized Cost | | | | | | | | | | | | | | | |
| MBS | | $ | — | | | $ | — | | | $ | — | | | $ | 22,556 | | | $ | 22,556 | |
| Agency notes | | | — | | | | 12,905 | | | | 32,948 | | | | 68,054 | | | | 113,907 | |
| Corporate/other | | | — | | | | — | | | | — | | | | 775 | | | | 775 | |
| Total amortized cost | | $ | — | | | $ | 12,905 | | | $ | 32,948 | | | $ | 91,385 | | | $ | 137,238 | |
| Fair Value | | | | | | | | | | | | | | | | | | | | |
| MBS | | $ | — | | | $ | — | | | $ | — | | | $ | 21,941 | | | $ | 21,941 | |
| Agency notes | | | — | | | | 12,905 | | | | 32,904 | | | | 67,770 | | | | 113,579 | |
| Corporate/other | | | — | | | | — | | | | — | | | | 775 | | | | 775 | |
| Total fair value | | $ | — | | | $ | 12,905 | | | $ | 32,904 | | | $ | 90,486 | | | $ | 136,295 | |
CASCADE FINANCIAL CORPORATION AND SUBSIDIARIES
Notes to Consolidated Financial Statements
(Dollars in thousands, except share amounts)
(4) Loans and Allowance for Loan Losses
A summary of loans at December 31, 2007 and 2006, follows:
| | | DECEMBER 31, | | | DECEMBER 31, | |
| | | 2007 | | | 2006 | |
| Residential | | $ | 98,384 | | | $ | 91,256 | |
| Multifamily | | | 11,397 | | | | 34,719 | |
| Commercial real estate | | | 120,421 | | | | 119,298 | |
Construction(1) | | | 381,810 | | | | 295,087 | |
| Business banking | | | 468,453 | | | | 442,391 | |
| Consumer | | | 27,688 | | | | 27,686 | |
| Total loans | | | 1,108,153 | | | | 1,010,437 | |
| Deferred loan fees, net | | | (3,724 | ) | | | (3,434 | ) |
| Allowance for loan losses | | | (11,653 | ) | | | (10,988 | ) |
| Net loans | | $ | 1,092,776 | | | $ | 996,015 | |
| Loans serviced for others | | $ | 31,965 | | | $ | 39,032 | |
(1) Construction loans are net of loans in process.
Accrued interest on loans was $5.9 million and $5.3 million at December 31, 2007, and December 31, 2006, respectively. Loans to officers and directors totaled $301 at December 31, 2007, $311 at December 31, 2006, and $300 at December 31, 2005. Repayments totaling $10, $6, and $39 were received and additional advances of $0, $17, and $17 were made for the years ended December 31, 2007, 2006, and 2005, respectively. Additionally, in 2006, $2.3 million in loans were excluded since the director previously included was no longer affiliated with the Bank.
At December 31, 2007, the composition of the loan portfolio was as follows:
| | | FIXED | | | VARIABLE | | | ADJUSTABLE | |
| | | RATE | | | RATE (1) | | | RATE | |
| Term to maturity | | | | | | | | | |
| Less than one year | | $ | 50,909 | | | $ | 295,398 | | | $ | 5,359 | |
| 1-3 years | | | 55,379 | | | | 102,387 | | | | 8,155 | |
| 3-5 years | | | 58,783 | | | | 5,357 | | | | 30,531 | |
| 5-10 years | | | 118,199 | | | | 16,337 | | | | 207,110 | |
| 10-20 years | | | 5,056 | | | | 3,888 | | | | 27,186 | |
| Over 20 years | | | 3,744 | | | | 11,842 | | | | 102,533 | |
| Total | | $ | 292,070 | | | $ | 435,209 | | | $ | 380,874 | |
| (1) | Variable includes all Prime, LIBOR, or Treasury indexed loans with a repricing frequency of three months or less. |
Nonaccrual loans totaled $1.5 million, $851, and $2.0 million, respectively, at December 31, 2007, December 31, 2006, and December 31, 2005. If interest on these loans had been recognized, such income would have been $111, $27, and $82 respectively, for the periods ended December 31, 2007, 2006, and 2005. The Corporation has no commitments to extend additional credit on loans that are nonaccrual. At December 31, 2007, 2006, and 2005, loans totaling $29.1 million, $9.4 million, and $17.5 million, were adversely classified loans. Of the adversely classified loans, $451, $223, and $1.5 million were under foreclosure at December 31, 2007, 2006, and 2005, respectively. The average balances of adversely classified loans for the years ended December 31, 2007 and December 31, 2006, respectively, were $9.2 million and $13.8 million and the Corporation recognized $561 and $759 of related interest income on such loans during the time they were adversely classified.
At December 31, 2007, 2006, and 2005, impaired loans totaled $1.5 million, $859, and $2.0 million, respectively. The average balances during the years ended December 31, 2007, 2006 and 2005 were $973, $796, and $1.2 million, respectively. The allowance for loan losses related to these loans was approximately $361, $401, and $801 at December 31, 2007, 2006, and 2005, respectively. Interest collected on these loans in cash and included in income was not considered significant for 2007, 2006, and 2005. If interest on these loans had been accrued, the additional amount of such income would not have been significant for 2007, 2006, and 2005. At December 31, 2007, there were no commitments to lend additional funds to borrowers whose loans were classified as impaired.
The Bank had three loans that were 90 days or more past due and still accruing, totaling $11.6 million at December 31, 2007. These loans are secured by real estate and supported by current appraised values. There were no loans 90 days or more past due at December 31, 2006.
At December 31, 2007, the Corporation had outstanding commitments to grant loans of $13.1 million with fixed interest rates and $32.0 million with adjustable rates.
CASCADE FINANCIAL CORPORATION AND SUBSIDIARIES
Notes to Consolidated Financial Statements
(Dollars in thousands, except share amounts)
The Corporation had non-mandatory forward commitments totaling $0 and $364 to sell loans into the secondary market at December 31, 2007, and December 31, 2006, respectively.
Commitments to extend credit are agreements to lend to a customer as long as there is no violation of any condition
established in the contract. Commitments generally have fixed expiration dates or other termination clauses and may require payment of a fee. Since many of the commitments are expected to expire without being drawn upon, the total
commitment amounts do not necessarily represent future cash requirements. While approximately 100% of commercial letters of credit are utilized, a significant portion of such utilization is on an immediate payment basis. The
Bank evaluates each customer's creditworthiness on a case-by-case basis. The amount of collateral obtained, if it is deemed necessary by the Bank upon extension of credit, is based on management's credit evaluation of the borrower. Collateral held varies but may include accounts receivable, inventory, property, plant and equipment, and income-producing commercial properties.
Unfunded commitments under commercial Lines of Credit, revolving credit lines and loans in process are commitments for possible future extensions of credit to existing customers.
Standby letters of credit and financial guarantees written are conditional commitments issued by the Bank to guarantee the performance of a customer to a third party. Those guarantees are primarily issued to support public and private borrowing arrangements, bond financing, and similar transactions. The Bank underwrites its standby letters of credit using its policies and procedures applicable to loans in general. Standby letters of credit are made on an unsecured and secured basis. The Bank has not been required to perform on any financial guarantees during the past two years. The Bank did not incur any significant losses on its commitments in 2007 or 2006.
At December 31, 2007, and 2006, the following financial instruments with off-balance sheet risk were outstanding:
| | | 2007 | | | 2006 | |
| Commitments to grant loans | | $ | 45,118 | | | $ | 21,412 | |
| Unfunded commitments under lines of credit/loans in process | | | 265,118 | | | | 196,902 | |
| Standby letters of credit and financial guarantees written | | | 5,171 | | | | 4,924 | |
| Unused commitments on bankcards | | | 12,840 | | | | 12,751 | |
| Total | | $ | 328,247 | | | $ | 235,989 | |
| | | YEARS ENDED DECEMBER 31, | |
| | | 2007 | | | 2006 | | | 2005 | |
| Balances at beginning of year | | $ | 10,988 | | | $ | 10,254 | | | $ | 9,563 | |
| Off-balance sheet commitments | | | (142 | ) | | | — | | | | — | |
| Provision for loss | | | 1,350 | | | | 1,000 | | | | 945 | |
| Recoveries | | | 135 | | | | 148 | | | | 266 | |
| Charge-offs | | | (414 | ) | | | (520 | ) | | | | |
| Balances at end of year | | $ | 11,653 | | | $ | 10,988 | | | $ | 10,254 | |
(5) Premises and Equipment
A summary of premises and equipment follows:
| | ESTIMATED | | DECEMBER 31, | | | DECEMBER 31, | |
| | USEFUL LIVES | | 2007 | | | 2006 | |
| Land | | | $ | 4,277 | | | $ | 2,577 | |
| Buildings | 40 years | | | 11,394 | | | | 10,936 | |
| Leasehold improvements | Lease term | | | 2,498 | | | | 2,229 | |
| Furniture and equipment | 2-10 years | | | 14,066 | | | | 14,679 | |
| | | | | 32,235 | | | | 30,421 | |
| Accumulated depreciation and amortization | | | | (18,075 | ) | | | (18,418 | ) |
| Total | | | $ | 14,160 | | | $ | 12,003 | |
Notes to Consolidated Financial Statements
(Dollars in thousands, except share amounts)
The Bank leases space for various branches. These leases run for a period ranging from 20 months to 12 years and allow for established rent increases each year. Generally these leases require the Bank to pay all taxes, maintenance and utility costs, as well as maintain certain types of insurance. The annual lease commitments at December 31, 2007, are as follows:
Years ending December 31, | 2008 | $ | 813 |
| | 2009 | | 788 |
| | 2010 | | 753 |
| | 2011 | | 738 |
| | 2012 | | 725 |
| | Thereafter | | 7,445 |
| | Total | $ | 11,262 |
Rental expenses charged to operations were approximately $763, $693, and $642 for the years ended December 31, 2007, 2006, and 2005, respectively.
(6) Deposits
Deposits at December 31, 2007, and 2006, are summarized as follows:
| | | DECEMBER 31, | | | DECEMBER 31, | |
| | | 2007 | | | 2006 | |
| Noninterest-bearing checking accounts | | $ | 87,350 | | | $ | 87,456 | |
| Interest-bearing checking accounts | | | 50,840 | | | | 52,051 | |
| Money market deposit accounts | | | 315,967 | | | | 275,286 | |
| Savings accounts | | | 11,297 | | | | 15,158 | |
| Certificates of deposit | | | 439,442 | | | | 425,498 | |
| Total | | $ | 904,896 | | | $ | 855,449 | |
Time deposit accounts in amounts of $100 thousand or more totaled $271.5 million and $257.0 million at December 31, 2007, and December 31, 2006, respectively. Deposits held by executive officers and directors totaled $4.2 million at December 31, 2007, and $3.5 million at December 31, 2006. Included in these totals were $2.6 million and $2.0 million held in business accounts on which six directors have signing authority, at December 31, 2007, and December 31 2006, respectively.
| | WEIGHTED AVERAGE INTEREST RATE ON DEPOSITS | | | DEPOSIT ACCOUNTS WITH BALANCES IN EXCESS OF $100 THOUSAND | | ACCRUED INTEREST PAYABLE ON DEPOSITS | |
| | | | | | | | |
| December 31, 2007 | | 3.78 | % | | $ | 606,579 | | $ | 4,285 | |
| December 31, 2006 | | 3.86 | | | | 552,522 | | | 5,176 | |
A summary of interest expense on deposits follows:
| | | YEARS ENDED DECEMBER 31, | |
| | | 2007 | | | 2006 | | | 2005 | |
| Checking and money market accounts | | $ | 13,061 | | | $ | 9,160 | | | $ | 3,500 | |
| Savings accounts and time deposits | | | 22,159 | | | | 19,416 | | | | 14,814 | |
| Total | | $ | 35,220 | | | $ | 28,576 | | | $ | 18,314 | |
| Years ending December 31, | 2008 | $ | 401,800 |
| | 2009 | | 20,900 |
| | 2010 | | 4,180 |
| | 2011 | | 868 |
| | 2012 | | 2,148 |
| | Thereafter | | 9,546 |
| | Total | $ | 439,442 |
(7) Junior Subordinated Debentures Payable (Trust Preferred Securities)
On March 1, 2000, $10.3 million of 11% junior subordinated debentures payable due March 1, 2030, were issued by a wholly owned business Trust whose common equity is 100% owned by Cascade Financial Corporation, Cascade Capital Trust I. The Trust exists for the exclusive purposes of issuing and selling the junior subordinated debentures
CASCADE FINANCIAL CORPORATION AND SUBSIDIARIES
Notes to Consolidated Financial Statements
(Dollars in thousands, except share amounts)
payable, using the proceeds from the sale of the capital securities to acquire junior subordinated debentures payable, issued by Cascade Financial Corporation, and engaging in only those other activities necessary, advisable or incidental to the above. The Corporation used the proceeds for general corporate purposes including stock
repurchases and investment in its subsidiary bank.
The junior subordinated debentures payable will mature on March 1, 2030 unless redeemed prior to such date if certain conditions are met.
In October 2003, the Corporation entered into an interest rate swap agreement with a third party as a hedge of the interest rate on the Corporation’s junior subordinated debentures payable. Under the terms of the agreement, the Corporation received an 11% fixed-rate and paid a floating-rate of USD-six-month LIBOR-BBA plus 520 basis points. The swap was terminated in December 2006 at a loss of $150.
On December 15, 2004, the Corporation issued $5.2 million in junior subordinated debentures payable, as Cascade Capital Trust II. These debentures have a fixed coupon of 5.82% for the first 5 years and then float at the three-month LIBOR plus 1.90% for the remaining 25 years. The debentures are callable at par after 5 years. These debentures are considered Tier 1 capital by financial institution regulators.
On March 30, 2006, the Corporation issued an additional $10.3 million in junior subordinated debentures payable, as Cascade Capital Trust III. These debentures have a fixed coupon of 6.50% for the first 5 years and then float, if not called, at the three-month LIBOR plus 1.40% for the remaining 25 years. These debentures are also considered Tier 1 capital for regulatory purposes.
The junior subordinated debentures payable issued under Cascade Capital Trusts II and III incorporate the same structure, for the same purposes as Cascade Capital Trust I.
Effective January 1, 2007, the Corporation elected early adoption of SFAS No. 159, The Fair Value Option for Financial Assets and Financial Liabilities, and SFAS No. 157, Fair Value Measurements, both of which were issued in February 2007. The Corporation applied fair value accounting to Cascade Capital Trust I. Upon adoption of SFAS No. 159 and No. 157, the Corporation determined a fair value for Cascade Capital Trust I of approximately 117 or $11.17 million for the $10.0 million in trust preferred securities (junior subordinated debentures). This resulted in charging off the unamortized issuance costs to retained earnings of $654 as required under SFAS No. 159. The $1.17 million fair value premium is the result of the 11% coupon and the 5.5% call premium. This fair value premium should be effectively written down to the $550 premium to call the security on March 1, 2010, which is embedded in its fair value. The fair value option was not selected for variable rate junior subordinated debentures totaling $15.0 million. See Note 15 of the Notes to Consolidated Financial Statements for additional information on SFAS No. 157.
(8) FHLB Advances
FHLB advances are summarized as follows:
| | | | DECEMBER 31, | | | DECEMBER 31, | |
| | | | 2007 | | | 2006 | |
MATURITY DATE | AMOUNT | | | WEIGHTED AVERAGE INTEREST RATE | | | AMOUNT | | | WEIGHTED AVERAGE INTEREST RATE | |
At December 31, | 2007 | | $ | — | | | $ | — | | | $ | 32,000 | | | | 5.87 | % |
| | 2008 | | | 2,000 | | | | 3.51 | | | | 2,000 | | | | 3.51 | |
| | 2009 | | | 10,000 | | | | 3.62 | | | | 39,000 | | | | 5.00 | |
| | 2010 | | | — | | | | — | | | | 45,000 | | | | 5.83 | |
| | 2011 | | | 10,000 | | | | 3.88 | | | | 10,000 | | | | 3.88 | |
| | 2012 | | | 40,000 | | | | 4.33 | | | | — | | | | — | |
| | Thereafter(1) | | | 169,000 | | | | 4.32 | | | | 115,000 | | | | 4.04 | |
| | | | $ | 231,000 | | | | 4.27 | % | | $ | 243,000 | | | | 4.76 | % |
| (1) | Includes $30,000 tied to the three-month LIBOR. |
| | | YEARS ENDED DECEMBER 31, | |
| | | 2007 | | | 2006 | |
| Maximum amount of outstanding FHLB advances at any month-end | | $ | 264,790 | | | | 256,000 | |
| Average amount of outstanding FHLB advances during the year | | | 226,124 | | | | 237,888 | |
At December 31, 2007, the Bank had an unused Line of Credit from the FHLB-Seattle of $264.7 million subject to the availability of eligible collateral. The Bank’s credit line with the FHLB-Seattle is 35% of total assets, or up to approximately $495.7 million, and is subject to certain collateral requirements.
FHLB advances are collateralized by otherwise unencumbered permanent residential mortgages, investment grade securities, and other eligible real estate mortgages. Federal statute requires all members of the FHLB to maintain collateral on FHLB borrowings and advances equivalent to the amount borrowed on a daily basis.
CASCADE FINANCIAL CORPORATION AND SUBSIDIARIES
Notes to Consolidated Financial Statements
(Dollars in thousands, except share amounts)
(9) Securities Sold Under Agreements to Repurchase and Lines of Credit
The Corporation enters into sales of securities under agreements to repurchase (reverse repurchase agreements) that are treated as financing arrangements. Accordingly, the obligations to repurchase securities sold are reflected as a liability in the consolidated balance sheets, and the securities underlying the agreements remain in the asset accounts. The securities underlying the agreements are under the Corporation’s control and are held by nationally known government security dealers who are recognized as primary dealers by the Federal Reserve Board, or other investment banking firms approved by the Corporation’s Board of Directors.
Securities sold under agreements to repurchase the same securities consist of agency notes and/or mortgage-backed securities summarized as follows:
| | | | | | | | | UNDERLYING SECURITIES | |
| | | BALANCE OUTSTANDING | | | WEIGHTED AVERAGE INTEREST RATE | | | BOOK VALUE, INCLUDING ACCRUED INTEREST | | | MARKET VALUE | |
| December 31, 2007 | | $ | 120,625 | | | 3.30 | % | | $ | 140,523 | | | $ | 139,722 | |
| December 31, 2006 | | | 95,710 | | | 1.42 | | | | 113,026 | | | | 109,145 | |
| | | YEARS ENDED DECEMBER 31, | |
| | | 2007 | | | 2006 | |
| Maximum amount of outstanding agreements at any month-end | | $ | 120,625 | | | $ | 96,007 | |
| Average amount of outstanding agreements during the year | | | 107,516 | | | | 81,284 | |
The Bank has Fed funds borrowing lines with three of its correspondent banks. One line is for $15.0 million and
matures July 1, 2008. The other two facilities are for $10.0 million each; one matures June 30, 2008, and the other has no maturity date. Interest rates for these lines are quoted at the time of borrowing and are subject to certain collateral requirements. The Bank used each of these lines during the year. The Bank also has the ability to borrow from the Federal Reserve Bank of San Francisco based on the amount of collateral pledged. As of December 31, 2007, there were no outstanding balances on any of these lines.
(10) Income Taxes
Income tax expense (benefits) includes the following components:
| | YEARS ENDED | |
| | DECEMBER 31, | |
| | 2007 | | 2006 | | 2005 | |
| Current | $ | 5,401 | | $ | 6,297 | | $ | 6,412 | |
| Deferred | | 1,982 | | | 178 | | | (150 | ) |
| Total | $ | 7,383 | | $ | 6,475 | | $ | 6,262 | |
In the future, our effective tax rate could be adversely affected by several factors, many of which are outside of our control. Our effective tax rate is affected by the proportion of revenues and income before taxes in the various domestic and international jurisdictions in which we operate. Further, we are subject to changing tax laws, regulations and interpretations in multiple jurisdictions in which we operate, as well as the requirements, pronouncements and rulings of certain tax, regulatory and accounting organizations. We estimate our annual effective tax rate each quarter based on a combination of actual and forecasted results of subsequent quarters. Consequently, significant changes in our actual quarterly or forecasted results may impact the effective tax rate for the current or future periods.
For the year ended December 31, 2007, the Corporation's effective tax rate was 32.2% compared to 32.7% and 32.4% for the years ended December 31, 2006 and 2005. Decreased tax benefits related to interest on tax exempt loans and increases in cash surrender value of bank owned life insurance comprised the significant portion of the differences in the effective tax rates between the two years. CASCADE FINANCIAL CORPORATION AND SUBSIDIARIES
Notes to Consolidated Financial Statements
(Dollars in thousands, except share amounts)
Income tax expense differs from that computed by applying the U.S. federal income tax rate of 35% to pretax income for the years ended December 31st as a result of the following:
| | | 2007 | | | 2006 | | | 2005 | |
| Computed “expected” tax expense | | $ | 8,025 | | | $ | 6,941 | | | $ | 6,758 | |
| Bank owned life insurance (BOLI) | | | (239 | ) | | | (231 | ) | | | (232 | ) |
| Tax exempt interest | | | (218 | ) | | | (341 | ) | | | (284 | ) |
| Nondeductible option cost | | | 68 | | | | 101 | | | | — | |
| Other, net | | | (253 | ) | | | 5 | | | | 20 | |
| Total | | $ | 7,383 | | | $ | 6,475 | | | $ | 6,262 | |
(based upon a percentage of taxable income before such deduction) for additions to tax bad debt reserves established for the purpose of absorbing losses on loans or property acquired through foreclosure. This amount represents allocations of income to bad debt deductions for tax reporting purposes only. Reduction of amounts so allocated for
purposes other than tax bad debt losses will create income for tax reporting purposes only, which will be subject to the then-current corporate income tax rate.
The following table presents major components of the net deferred tax asset (liability) resulting from differences between financial reporting and tax bases at December 31, 2007, and December 31, 2006:
| | | DECEMBER 31, | | | DECEMBER 31, | |
| | | 2007 | | | 2006 | |
| Deferred tax assets: | | | | | | |
| Securities available-for-sale | | $ | 277 | | | $ | 1,240 | |
| Junior subordinated debentures | | | 607 | | | | — | |
| Premises and equipment | | | 274 | | | | — | |
| Loans | | | 3,640 | | | | 3,316 | |
| Gross deferred tax assets | | | 4,798 | | | | 4,556 | |
| Deferred tax liabilities: | | | | | | | | |
| Deferred loan fees | | | (1,184 | ) | | | (1,660 | ) |
| Core deposit intangible | | | (222 | ) | | | (267 | ) |
| Premises and equipment | | | — | | | | (203 | ) |
| FHLB stock | | | (1,732 | ) | | | (1,732 | ) |
| Other | | | (86 | ) | | | (139 | ) |
| Gross deferred tax liabilities | | | (3,224 | ) | | | (4,001 | ) |
| Net deferred tax asset | | $ | 1,574 | | | $ | 555 | |
The Corporation adopted the provisions of FASB Interpretation No. 48, Accounting for Uncertainty in Income Taxes, on January 1, 2007. The Corporation had no unrecognized tax benefits which would require an adjustment to the January 1, 2007 beginning balance of retained earnings. The Corporation had no unrecognized tax benefits at January 1, 2007 and at December 31, 2007.
The Corporation recognizes interest accrued and penalties related to unrecognized tax benefits in tax expense. During the years ended December 31, 2007 and 2006, the Corporation recognized no interest and penalties.
The Corporation and its subsidiaries files income tax returns in the U.S. Federal jurisdiction. With few exceptions, the Corporation is no longer subject to U.S. Federal or state/local income tax examinations by tax authorities for years before 2003.
CASCADE FINANCIAL CORPORATION AND SUBSIDIARIES
Notes to Consolidated Financial Statements
(Dollars in thousands, except share amounts)
(11) Earnings per Share
The following table presents EPS information:
| | | YEARS ENDED DECEMBER 31, | |
| | | 2007 | | | 2006 | | | 2005 | |
| Net income | | $ | 15,546 | | | $ | 13,355 | | | $ | 13,046 | |
| | | | | | | | | | | | | |
| Common shares outstanding (basic) | | | 12,047,792 | | | | 12,060,191 | | | | 11,977,824 | |
| Effect of dilutive stock options | | | 237,062 | | | | 303,007 | | | | 342,049 | |
| Common shares outstanding (diluted) | | | 12,284,854 | | | | 12,363,198 | | | | 12,319,873 | |
| | | | | | | | | | | | | |
| EPS, basic | | $ | 1.29 | | | $ | 1.11 | | | $ | 1.09 | |
| EPS, diluted | | | 1.27 | | | | 1.08 | | | | 1.06 | |
December 31, 2006, and December 31, 2005, respectively, that are considered non-dilutive and have been excluded from the above calculation. Non-dilutive options have an exercise price that is greater than the current market price of the stock.
(12) Stockholders’ Equity
(a) Restrictions on Dividends
Current regulations allow the Bank to pay dividends on its stock if its regulatory capital would not thereby be reduced below the amount required for the statutory capital requirements set by the Federal Deposit Insurance Corporation (FDIC).
(b) Regulatory Capital
The Corporation (on a consolidated basis) and the Bank are subject to various regulatory capital requirements administered by the federal banking agencies. Failure to meet minimum capital requirements can initiate certain mandatory and possibly additional discretionary actions by regulators that, if undertaken, could have a direct material effect on the Corporation's and Bank's financial statements. Under capital adequacy guidelines and the regulatory framework for prompt corrective action, the Corporation and the Bank must meet specific capital guidelines that involve quantitative measures of their assets, liabilities and certain off-balance-sheet items as calculated under regulatory accounting practices. The capital amounts and classification are also subject to qualitative judgments by the regulators about components, risk weightings, and other factors. Prompt corrective action provisions are not applicable to bank holding companies.
Quantitative measures established by regulation to ensure capital adequacy require the Corporation and the Bank to maintain minimum amounts and ratios (set forth in the following table) of total and Tier 1 capital (as defined in the regulations) to risk-weighted assets (as defined) and of Tier 1 capital (as defined) to average assets (as defined). Management believes, as of December 31, 2007, and 2006, that the Corporation and the Bank met all capital adequacy requirements to which they are subject. To be categorized as well-capitalized, an institution must maintain minimum total risk-based, Tier 1 risk-based and Tier 1 leverage ratios as set forth in the following tables.
At December 31, 2007, banking regulations required institutions to have a minimum total risk-based capital to risk-weighted assets ratio of 8% and a Tier 1 (core) capital to adjusted total assets ratio of 4%.
At December 31, 2007, the Bank was in compliance with the regulatory requirements for well-capitalized institutions.
As of December 31, 2007, the most recent notification from the FDIC categorized the Bank as well-capitalized under the regulatory framework for prompt corrective action. There are no conditions or events since the notification that management believes have changed the Bank's category.
| | | ACTUAL | | | | | | WELL-CAPITALIZED REQUIREMENTS | |
| CASCADE BANK | | AMOUNT | | | RATIO | | | AMOUNT | | | RATIO | | | AMOUNT | | | RATIO | |
| December 31, 2007: | | | | | | | | | | | | | | | | | | |
Total risk-based capital to risk-weighted assets (1) | | $ | 135,345 | | | 10.91 | % | | $ | 99,248 | | | 8.00 | % | | $ | 124,059 | | | 10.00 | % |
| Tier I (core) capital to risk-weighted assets | | | 123,550 | | | 9.96 | | | | 49,624 | | | 4.00 | | | | 74,436 | | | 6.00 | |
| Tier I (core) capital to average total assets | | | 123,550 | | | 9.00 | | | | 54,901 | | | 4.00 | | | | 68,626 | | | 5.00 | |
| December 31, 2006: | | | | | | | | | | | | | | | | | | | | | |
Total risk-based capital to risk-weighted assets (1) | | $ | 127,132 | | | 11.20 | % | | $ | 90,816 | | | 8.00 | % | | $ | 113,521 | | | 10.00 | % |
| Tier I (core) capital to risk-weighted assets | | | 116,144 | | | 10.23 | | | | 45,408 | | | 4.00 | | | | 68,112 | | | 6.00 | |
| Tier I (core) capital to average total assets | | | 116,144 | | | 8.96 | | | | 51,850 | | | 4.00 | | | | 64,813 | | | 5.00 | |
CASCADE FINANCIAL CORPORATION AND SUBSIDIARIES
Notes to Consolidated Financial Statements
(Dollars in thousands, except share amounts)
The Corporation, as a bank holding company regulated by the Federal Reserve, is also subject to capital requirements that are similar to those for Cascade Bank.
| | | ACTUAL | | | | | | WELL-CAPITALIZED REQUIREMENTS | |
| CASCADE FINANCIAL CORP | | AMOUNT | | | RATIO | | | AMOUNT | | | RATIO | | | AMOUNT | | | RATIO | |
| December 31, 2007: | | | | | | | | | | | | | | | | | | |
Total risk-based capital to risk-weighted assets (1) | | $ | 134,174 | | | 10.80 | % | | | 99,361 | | | 8.00 | % | | $ | 124,201 | | | 10.00 | % |
| Tier I (core) capital to risk-weighted assets | | | 122,379 | | | 9.85 | | | | 49,681 | | | 4.00 | | | | 74,521 | | | 6.00 | |
| Tier I (core) capital to average total assets | | | 122,379 | | | 8.9 | | | | 55,032 | | | 4.00 | | | | 68,790 | | | 5.00 | |
| December 31, 2006: | | | | | | | | | | | | | | | | | | | | | |
Total risk-based capital to risk-weighted assets (1) | | $ | 127,504 | | | 11.22 | % | | $ | 90,935 | | | 8.00 | % | | | 113,668 | | | 10.00 | % |
| Tier I (core) capital to risk-weighted assets | | | 116,516 | | | 10.25 | | | | 45,467 | | | 4.00 | | | | 68,201 | | | 6.00 | |
| Tier I (core) capital to average total assets | | | 116,516 | | | 8.99 | | | | 51,850 | | | 4.00 | | | $ | 64,813 | | | 5.00 | |
(1) The FDIC and the Federal Reserve require institutions to maintain Tier I capital of not less than one-half of total capital.
(13) Mortgage Servicing Rights
A summary of capitalized mortgage servicing rights, included in other assets, at December 31, 2007, and December 31, 2006, follows:
| | | DECEMBER 31, | | | DECEMBER 31, | |
| | | 2007 | | | 2006 | |
| Balance at beginning of year | | $ | 174 | | | $ | 10 | |
| Additions | | | — | | | | 170 | |
| Amortization | | | (44 | ) | | | (6 | ) |
| Balance at end of year | | $ | 130 | | | $ | 174 | |
(14) Employee Benefit Plans
(a) Savings Plan
The Corporation maintains a savings plan under section 401(k) of the Internal Revenue Code, covering substantially
all full-time employees. Under the plan, employee contributions are matched by the Corporation at a rate of 50% of the first $12 contributed. Such matching becomes vested over a period of five years of credited service. Employees may make investments in various stock, fixed income or money market plans, or may purchase stock in the Corporation.
The Corporation contributed $336, $313, and $287 to the plan for the years ended December 31, 2007, 2006, and 2005, respectively.
(b) Employee Stock Purchase Plan
The Corporation maintains an employee stock purchase plan, under the terms of which 213,212 shares of common stock have been authorized for issuance. The plan allows employees of the Corporation with three months of service the opportunity to purchase common stock through accumulated salary deductions during each offering period. On the first day of each six-month offering period (January 1 and July 1 of each year), eligible employees who elect to participate are granted options to purchase a limited number of shares and unless the participant withdraws from the plan, the option is effectively exercised on the last day of each offering period. The aggregate number of shares to be purchased in any given offering is determined by dividing the accumulated salary deduction for the period by the lower of 85% of the market price of a common share at the beginning or end of an offering period.
(c) Stock Options
The shareholders of the Corporation approved two stock option plans to promote the best interest of the Corporation and its shareholders by providing an incentive to employees and directors. The plans permit the grant of incentive stock options and non-qualified stock options.
Options are granted to certain employees and directors at prices equal to the market value of the stock on the dates the options were granted. The options granted have a term of 10 years from the grant date. Incentive stock options granted to employees vest over a five-year period. Non-qualified options granted to directors vest over a four-year period. Compensation expense is recorded as if each vesting portion of the award is a separate award. The maximum number of options that may be issued under the plan is 937,500 (as adjusted for stock splits and dividends). The Corporation had 597,566 and 592,200 shares available for grant at December 31, 2007, and 2006, respectively. CASCADE FINANCIAL CORPORATION AND SUBSIDIARIES
Notes to Consolidated Financial Statements
(Dollars in thousands, except share amounts)
Accounting for Stock Options
On January 1, 2006, the Corporation adopted SFAS No.123(R), applying the modified prospective method. SFAS No. 123(R) requires all equity-based payments to employees, including grants of employee stock options, to be recognized in the Consolidated Statements of Income at the fair value of the award over the requisite service period. Under the modified prospective method, the Corporation is required to record equity-based compensation expense for all awards granted after the date of adoption and for the unvested portion of previously granted awards outstanding as of the date of adoption.
Net compensation cost charged against income for stock option expense was $213 for 2007, and $287 for 2006. The total income tax benefit recognized in the income statement for stock based compensation arrangements was $231 for 2007, and $314 for 2006.
The fair values of the options granted to the Corporation’s employees were estimated on the date of grant using the Black-Scholes valuation model. The application of this valuation model involves assumptions that are judgmental and sensitive in the determination of compensation expense.
The following table provides the range of assumptions used for stock options granted:
| | | YEARS ENDED DECEMBER 31, | |
| | | 2007 | | | 2006 | | | 2005 | |
| Risk-free interest rate | | | 4.75 | % | | | 4.50 | % | | | 3.00 | % |
| Expected life in years | | | 5 | | | | 5 | | | | 8 | |
| Expected volatility | | | 24 | % | | | 24 | % | | | 24 | % |
| Dividend yield | | | 2.00 | % | | | 2.03 | % | | | 2.02 | % |
| | | | | | | | | | | | | |
Historical information was the primary basis for the selection of the expected volatility, expected dividend yield and the expected lives of the options. The Corporation has collected a long history of option activity and feels that this historical information presents the best basis for future projections. The risk-free interest rate was selected based upon U.S. Treasury issues with a term equal to the expected life of the option being valued at the time of the grant.
A summary of option activity as of, and for the year ended, December 31, 2007 is as follows:
| | | OPTIONS | | | WEIGHTED- AVERAGE EXERCISE PRICE PER SHARE | | | WEIGHTED- AVERAGE REMAINING CONTRACTUAL TERM (IN YEARS) | | | AGGREGATE INTRINSIC VALUE | |
| Outstanding as of December 31, 2006 | | | 703,606 | | | $ | 9.26 | | | | 5.76 | | | $ | 5,511,642 | |
| Granted | | | 4,000 | | | | 16.21 | | | | | | | | | |
| Exercised | | | (102,295 | ) | | | 5.63 | | | | | | | | | |
| Forfeited/Cancelled | | | (9,744 | ) | | | 13.02 | | | | | | | | | |
| Outstanding as of December 31, 2007 | | | 595,567 | | | $ | 9.87 | | | | 5.13 | | | $ | 2,580,240 | |
| | | | | | | | | | | | | | | | | |
| Exercisable as of December 31, 2007 | | | 384,696 | | | $ | 7.76 | | | | 4.07 | | | $ | 2,361,610 | |
All options granted have limited rights that enable a holder upon a change in control of the Corporation to elect to receive cash equal to the difference between the exercise price of the option and the fair market value of the common stock on the date of exercise. At December 31, 2007, and December 31, 2006, 384,696 and 383,916 shares, respectively, were fully exercisable.
The weighted average fair values of options granted under the Corporation's stock option plan were $4.04, $3.77, and $3.86, respectively for the years ended December 31, 2007, December 31, 2006, and December 31, 2005. The total intrinsic value of options exercised were $1.1 million, $1.3 million and $1.1 million, respectively, during the years ended December 31, 2007, 2006, and 2005. Total unrecognized compensation cost related to stock options was $210 as of December 31, 2007, and $466 as of December 31, 2006. That cost is expected to be recognized over a weighted average period of 1.3 years. Cash received from options exercised under all share-based payment arrangements were $576, $670, and $443 for the years ended December 31, 2007, 2006 and 2005, respectively.
As a result of adopting SFAS No. 123(R), the Corporation’s income before income taxes for the years ended December 31, 2007, and 2006, was $213 and $287 lower, respectively, than if it had continued to account for share-based compensation under Opinion No. 25. This option expense is included in salaries and employee benefits expenses.
Prior to the adoption of SFAS No. 123(R), the Corporation presented all tax benefits of deductions resulting from the exercise of stock options as operating cash flows in the Statement of Cash Flows. SFAS No. 123(R) requires the cash flow resulting from the tax benefits resulting from tax deductions in excess of the compensation cost recognized CASCADE
FINANCIAL CORPORATION AND SUBSIDIARIES
Notes to Consolidated Financial Statements
(Dollars in thousands, except share amounts)
for those options (excess tax benefits) to be classified as financing cash flows. The $231 excess tax benefit classified as a financing cash inflow would have been classified as an operating cash inflow if the Corporation had not adopted SFAS No. 123(R).
The following table illustrates the effect on net income and earnings per share for the years ended December 31, 2005, if the Corporation had applied the fair value recognition provisions of SFAS No. 123(R) to stock-based employee compensation:
| | | | |
| | | YEAR ENDED DECEMBER 31, | |
| | | 2005 | |
| Net Income, as reported | | $ | 13,046 | |
| Add: Stock-based employee compensation expense included in reported net income, net of related tax effects | | | - | |
| Deduct: Total stock-based employee compensation expense determined under fair value based method for all awards, net of related tax effects | | | 167 | |
| Pro forma net income | | $ | 12,879 | |
| | | DECEMBER 31, | |
| | | 2005 | |
| Net income per common share - Basic | | $ | 1.09 | |
| As reported | | | | |
| Pro forma | | | 1.07 | |
| Net income per common share - Diluted | | | | |
| As reported | | $ | 1.06 | |
| Pro forma | | | 1.05 | |
In December 2004, the Board adopted the Cascade Bank Deferred Compensation Plan. The purpose of this Plan is to provide specified benefits to a select group of management or highly compensated employees who contribute materially to the continued growth, development and business success of the Bank. The Plan was inactive in 2007 and has been replaced with a new plan effective February 1, 2008.
On January 16, 2008 the Cascade Bank Non-Qualified Deferred Compensation Plan was adopted. During 2007, one of the major projects of the Compensation Committee was to develop and recommend a plan to the Board of Directors that would provide specified benefits to a select group of management and highly compensated employees. Participants may contribute up to 50 percent of salary and 100 percent of their bonus to the Plan. In addition, the Compensation Committee has the authority to authorize an employer contribution to the Plan for these same employees. The contribution will be based upon the performance of the Bank as well as the individual performance of each employee. The Non-Qualified Deferred Compensation Plan will also be available to Directors. Each Director may contribute up to 100 percent of their director compensation to the Plan. No Corporation contributions will be made for Directors.
Employment Agreement
The Bank entered into an employment agreement with Carol K. Nelson dated November 27, 2007, which replaced a previous agreement dated July 12, 2005. This agreement replaced a prior agreement dated March 26, 2002 and extended on January 27, 2004. The current agreement may be terminated upon 90 days written notice.
(15) Fair Value of Financial Instruments
The fair value estimates presented below are subjective in nature, involve uncertainties and matters of significant judgment and, therefore, are not necessarily indicative of the amounts the Corporation could realize in a current market exchange. The Corporation has not included certain material items in its disclosure, such as the value of the long-term relationships with the Corporation’s lending and deposit customers, since this is an intangible and not a financial instrument. Additionally, the estimates do not include any tax ramifications. There may be inherent
weaknesses in any calculation technique, and changes in the underlying assumptions used, including discount rates and estimates of future cash flows, that could materially affect the results. For all of these reasons, the aggregation of the fair value calculations presented herein do not represent, and should not be construed to represent, the underlying value of the Corporation.
CASCADE FINANCIAL CORPORATION AND SUBSIDIARIES
Notes to Consolidated Financial Statements
(Dollars in thousands, except share amounts)
The following table presents a summary of the fair value of the Corporation’s financial instruments:
| | | DECEMBER 31, | | | DECEMBER 31, | |
| | | 2007 | | | 2006 | |
| | | CARRYING VALUE | | | ESTIMATED FAIR VALUE | | | CARRYING VALUE | | | ESTIMATED FAIR VALUE | |
| Financial assets: | | | | | | | | | | | | |
Cash and cash equivalents | | $ | 14,530 | | | $ | 14,530 | | | $ | 42,879 | | | $ | 42,879 | |
| Securities available-for-sale | | | 82,860 | | | | 82,860 | | | | 130,656 | | | | 130,656 | |
| Securities held-to-maturity | | | 137,238 | | | | 136,295 | | | | 96,846 | | | | 93,536 | |
| FHLB stock | | | 11,920 | | | | 11,920 | | | | 11,920 | | | | 11,920 | |
| Loans, net | | | 1,092,776 | | | | 1,110,897 | | | | 996,015 | | | | 1,002,554 | |
| Financial liabilities: | | | | | | | | | | | | | | | | |
Deposit accounts(1) | | $ | 904,896 | | | $ | 895,449 | | | $ | 855,449 | | | $ | 854,795 | |
| Borrowings | | | 351,625 | | | | 364,499 | | | | 338,710 | | | | 338,859 | |
| Junior subordinated debentures payable | | | 15,465 | | | | 14,649 | | | | 25,775 | | | | 27,465 | |
| Junior subordinated debentures payable, at fair value | | | 11,422 | | | | 11,422 | | | | — | | | | — | |
| Mark-to-market on swaps | | | — | | | | — | | | | 312 | | | | 312 | |
| (1) | Net of ($312) mark-to-market on swap for 2006. |
Fair Value Accounting
SFAS No. 159 generally permits the measurement of selected eligible financial instruments at fair value at specified election dates. Upon adoption of SFAS No. 159, the Corporation selected fair value measurement for certain available-for-sale and held-to-maturity investment securities, FHLB advances and Cascade Capital Trust I (junior subordinated debentures), which had fair values of approximately $68.1 million, $46.7 million and $12.1 million, respectively, on January 1, 2007. The Corporation also selected fair value measurement for an interest rate swap on a certificate of deposit with a notional value of $10.0 million and a fair value loss of $312 on January 1, 2007. SFAS No. 157 defines fair value, establishes a framework for measuring fair value under GAAP, and expands disclosures about fair value measurement.
Fair values determined by Level 1 inputs utilize quoted prices (unadjusted) in active markets for identical assets or liabilities that the Corporation has the ability to access. Fair values determined by Level 2 inputs utilize inputs other than quoted prices included in Level 1 that are observable for the asset or liability, either directly or indirectly. Level 2 inputs include quoted prices for similar assets and liabilities in active markets, and inputs other than quoted prices that are observable for the asset or liability, such as interest rates and yield curves that are observable at commonly quoted intervals. Level 3 inputs are unobservable inputs for the asset or liability, and include situations where there is little, if any, market activity for the asset or liability.
Upon adoption of SFAS No. 157, there was no cumulative effect adjustment to beginning retained earnings and no impact on the financial statements, other than in conjunction with the adoption of SFAS No. 159, in the year ended December 31, 2007.
At December 31, 2007, the Corporation had $11.9 million in junior subordinated debenture measured at fair value on a recurring basis.
The junior subordinated debentures are valued using discounted cash flows to the next available redemption date on the date of valuation based on recent issuances or quotations from brokers for comparable bank holding companies and are considered a Level 2 input method.
CASCADE FINANCIAL CORPORATION AND SUBSIDIARIES
Notes to Consolidated Financial Statements
(Dollars in thousands, except share amounts)
| Initial Fair Value Adjustment on Adoption of SFAS 159 | |
| | | JANUARY 1, 2007 | |
| (Dollars in thousands) | | AMORTIZED COST | | | FAIR MARKET VALUATION ADJUSTMENT | | | BASIS AT FMV | | | RELATED DEFERRED TAXES | | | CUMULATIVE EFFECT OF ADOPTION | |
| Assets | | | | | | | | | | | | | | | |
| Securities available-for-sale (AFS) reclassified to fair value | | $ | 54,721 | | | $ | (2,056 | ) | | $ | 52,665 | | | $ | 720 | | | $ | (1,336 | ) |
| Securities held-to-maturity (HTM) reclassified to fair value | | | 15,984 | | | | (554 | ) | | | 15,430 | | | | 194 | | | | (360 | ) |
Deferred origination costs on junior subordinated debentures | | | 654 | | | | (654 | ) | | | - | | | | 227 | | | | (427 | ) |
| | | $ | 71,359 | | | $ | (3,264 | ) | | $ | 68,095 | | | $ | 1,141 | | | $ | (2,123 | ) |
| Liabilities | | | | | | | | | | | | | | | | | | | | |
| FHLB advances | | $ | 45,000 | | | $ | 1,654 | | | $ | 46,654 | | | $ | (579 | ) | | $ | 1,075 | |
| Junior subordinated debentures payable | | | 10,310 | | | | 1,740 | | | | 12,050 | | | | (609 | ) | | | 1,131 | |
| Interest rate swap on CD | | | - | | | | 312 | | | | 312 | | | | (109 | ) | | | 203 | |
| | | $ | 55,310 | | | $ | 3,706 | | | $ | 59,016 | | | $ | (1,297 | ) | | $ | 2,409 | |
| | | | | | | | | | | | | | | | | | | | | |
| Total adjustment | | | | | | | | | | | | | | $ | 2,438 | | | $ | (4,532 | ) |
Less transfer from other comprehensive loss to retained earnings | | | | | | | | | | | | | | | (738 | ) | | $ | 1,370 | |
Cumulative adjustment of deferred tax asset and equity on adoption of SFAS 159 | | | | | | | | | | | | | | $ | 1,700 | | | $ | (3,162 | ) |
Following the initial election, changes in the value of financial instruments recorded at fair value are recognized as gains or losses in subsequent financial reporting periods. As a result of the adoption of SFAS No. 159 and changes in the fair value measurement of the financial assets and liabilities noted above, the Corporation recorded a cumulative net gain of $1.1 million ($703 after tax) for the year ended December 31, 2007.
| Fair Value Gains (Losses) | |
($ IN 000S) PAR VALUE | | | | TOTAL NET INCOME | |
| 10,000 | | Interest rate swap | | $ | 57 | |
| 45,000 | | FHLB advances | | | (70 | ) |
| 70,000 | | Investment securities HFT | | | 518 | |
| 10,000 | | Junior subordinated debentures | | | 576 | |
| | | Total | | $ | 1,081 | |
| | | Adjusted for taxes | | $ | 703 | |
Cash and Cash Equivalents
The carrying amount represents fair value.
Securities including mortgage backed securities and FHLB stock
Fair values are based on quoted market prices or dealer quotations when available or through the use of alternate approaches, such as matrix or model pricing, when market quotes are not readily available.
Loans
Fair values are estimated using current market interest rates to discount future cash flows for each of the six different loan types. Interest rates used to discount the cash flows are based on U.S. Treasury yields or other market interest rates with appropriate spreads for each segment. The spread over the Treasury yields or other market rates is used to account for liquidity, credit quality and higher servicing costs. Prepayment rates are based on expected future prepayment rates, or, where appropriate and available, market prepayment rates.
Deposit Accounts
The fair value of deposits with no stated maturity, such as checking accounts, money market deposit accounts and savings accounts, equals the amount payable on demand. The fair value of certificates of deposits is calculated based on the discounted value of contractual cash flows. The discount rate is equal to the rate currently offered on similar products.
Borrowings (FHLB advances and securities sold under agreements to repurchase)
The fair value is calculated based on the discounted cash flow method, adjusted for market interest rates and terms to maturity.
CASCADE FINANCIAL CORPORATION AND SUBSIDIARIES
Notes to Consolidated Financial Statements
(Dollars in thousands, except share amounts)
Junior Subordinated Debentures Payable (Trust Preferred Securities)
The fair value is calculated based on the amounts required to settle the contracts, adjusted for market interest rates and terms to maturity.
Swaps
The fair value is calculated based on the discounted cash flow method, adjusted for changes in swap spreads to the underlying treasury securities.
(16) On-Balance Sheet Derivative Instruments and Hedging Activities
Derivative Financial Instruments
The Corporation had derivative financial instruments in the form of interest rate swap agreements, which derive their value from underlying interest rates. These transactions involved both credit and market risk. Direct credit exposure is limited to the net difference between the calculated amounts to be received and paid, and any change in fair value of the contract in which the counterparty would owe the Corporation if the contract were terminated. Such difference, which represents the fair value of the derivative instruments, is reflected on the Corporation's balance sheet as derivative assets and derivative liabilities. The Corporation controls the credit risk of its financial contracts through credit approvals, limits and monitoring procedures, and does not expect any counterparties to fail to meet their obligations.
Off-balance-sheet financial instruments - commitments to extend credit, standby letters of credit and financial guarantees represent the principal categories of off-balance instruments (Note 4). The fair value of these commitments is not considered material because they are for a short period of time and subject to customary credit terms.
Risk Management Policies - Hedging Instruments
The primary focus of the Corporation’s asset/liability management program is to monitor the sensitivity of the Corporation’s net income and fair value of equity under varying interest rate scenarios to take steps to control its risks (see Management Discussion and Analysis – Interest Rate Risk Management).
Interest Rate Risk Management - Fair Value Hedging Instruments
The Corporation holds fixed and variable-rate assets and liabilities. Fixed-rates may expose the Corporation to variability in their fair value due to changes in the level of interest rates. The Corporation may utilize interest rate
swaps as an asset/liability management strategy to hedge the change in value of the assets due to changes in interest rate assumptions.
An interest rate swap agreement used to hedge junior subordinated debentures payable (trust preferred securities), with a notional amount of $10.0 million was terminated in December 2006 at a loss of $150.
The information pertaining to a terminated interest rate swap agreement used to hedge certificates of deposit is as follows:
| | | DECEMBER 31, | |
| | | 2006 | |
| Notional amount | | $ | 10,000 | |
| Weighted average pay rate | | | 5.14 | % |
| Fixed receive rate | | | 5.00 | % |
| Maturity in years | | | 7.4 | |
| Unrealized (loss) relating to interest rate swap | | $ | (312 | ) |
This agreement provides for the Corporation to make payments at a variable-rate determined by a three-month LIBOR in exchange for receiving payments at a fixed rate. The unrealized (loss) relating to the interest rate swap of $(312) was marked to market as an adjustment to equity with the implementation of SFAS No. 159 effective January 1, 2007. The swap was terminated in April 2007 at a net loss of $4.
Risk management results for the year ended December 31, 2006, related to the balance sheet hedging of certificates of deposit indicate that the hedge was 100% effective and that there was no component of the derivative instrument’s gain or loss during which was excluded from the assessment of hedge effectiveness.
The Corporation enters into rate lock commitments to extend credit to borrowers for generally a 30-day or 60-day period for the origination of loans.
On March 13, 2002, the Financial Accounting Standards Board determined that loan commitments related to the origination or acquisition of mortgage loans that will be held-for-sale must be accounted for as derivative instruments. Accordingly, the Corporation adopted such accounting on July 1, 2002, and such commitments, along with any related fees received from potential borrowers, are recorded at fair value in derivative assets or liabilities, with changes in fair value recorded in the net gain or loss on sale of mortgage loans. Since the Corporation originates its saleable loans on a “best effort” basis and delivers those loans to the purchaser within 10 days at the committed price, there will generally be no gain or loss recorded on those commitments.
The Corporation had non-mandatory forward commitments totaling $0 and $364 to sell loans into the secondary market at December 31, 2007, and December 31, 2006, respectively.
CASCADE FINANCIAL CORPORATION AND SUBSIDIARIES
Notes to Consolidated Financial Statements
(Dollars in thousands, except share amounts)
(17) Contingencies
The Corporation is a defendant in various legal proceedings arising in connection with its business. It is the opinion of management that the financial position and the results of operations of the Corporation will not be materially adversely
affected by the final outcome of these legal proceedings and that adequate provision has been made in the accompanying consolidated financial statements.
At periodic intervals, the Washington State Department of Financial Institutions and the Federal Deposit Insurance Corporation routinely examine the Corporation’s financial statements as part of their legally prescribed oversight of the banking industry. Based on these examinations, the regulators can direct that the Corporation’s financial statements be adjusted in accordance with their findings.
(18) Condensed Financial Information of Cascade Financial Corporation
Following are the condensed financial statements of Cascade Financial Corporation (parent only) for the period indicated:
| BALANCE SHEET | | DECEMBER 31, 2007 | | | DECEMBER 31, 2006 | |
| Assets: | | | | | | |
| Cash | | $ | 267 | | | $ | 829 | |
| Investment in subsidiary | | | 148,267 | | | | 139,827 | |
| Other assets | | | 2,011 | | | | 1,765 | |
| | | $ | 150,545 | | | $ | 142,421 | |
| Liabilities and stockholders’ equity: | | | | | | | | |
| Other liabilities | | $ | 1,562 | | | $ | 1,447 | |
| Junior subordinated debentures payable | | | 26,887 | | | | 25,775 | |
| Stockholders’ equity | | | 122,096 | | | | 115,199 | |
| | | $ | 150,545 | | | $ | 142,421 | |
| INCOME STATEMENT | | FOR THE YEARS ENDED DECEMBER 31, | |
| | | 2007 | | | 2006 | | | 2005 | |
| Equity in undistributed net income of the subsidiary | | $ | 16,745 | | | $ | 14,836 | | | $ | 13,992 | |
| Interest income – junior subordinated debentures payable | | | 64 | | | | 58 | | | | 46 | |
| Net gain on fair value of junior subordinated debentures payable | | | 576 | | | | — | | | | — | |
| Operating expenses | | | (364 | ) | | | (460 | ) | | | (299 | ) |
| Interest expense – junior subordinated debentures payable | | | (2,120 | ) | | | (1,880 | ) | | | (1,198 | ) |
| Income before benefit from income taxes | | | 14,901 | | | | 12,554 | | | | 12,541 | |
| Benefit from income taxes | | | 645 | | | | 801 | | | | 505 | |
| Net income | | $ | 15,546 | | | $ | 13,355 | | | $ | 13,046 | |
CASCADE FINANCIAL CORPORATION AND SUBSIDIARIES
Notes to Consolidated Financial Statements
(Dollars in thousands, except share amounts)
| STATEMENT OF CASH FLOWS | | FOR THE YEARS ENDED DECEMBER 31, | |
| | | 2007 | | | 2006 | | | 2005 | |
| Cash flows from operating activities: | | | | | | | | | |
| Net income | | $ | 15,546 | | | $ | 13,355 | | | $ | 13,046 | |
Adjustments to reconcile net income to net cash (used in) operating activities: | | | | | | | | | | | | |
| Equity in net income of subsidiaries | | | (16,745 | ) | | | (14,836 | ) | | | (13,992 | ) |
| Increase (decrease) in other assets | | | (31 | ) | | | 936 | | | | 195 | |
| (Decrease) increase in other liabilities | | | (629 | ) | | | (287 | ) | | | 134 | |
| Net cash used in operating activities | | | (1,859 | ) | | | (832 | ) | | | (617 | ) |
| Cash flows from investing activities: | | | | | | | | | | | | |
| Dividends received from subsidiaries | | | 7,300 | | | | 4,250 | | | | 4,000 | |
| Investment in subsidiary | | | — | | | | (10,000 | ) | | | — | |
| Net cash provided (used) by investing activities | | | 7,300 | | | | (5,750 | ) | | | 4,000 | |
| Cash flows from financing activities: | | | | | | | | | | | | |
| Repurchase of common stock | | | (2,838 | ) | | | (673 | ) | | | (858 | ) |
| Proceeds from exercise of stock options | | | 813 | | | | 1,050 | | | | 865 | |
| Dividends paid | | | (3,978 | ) | | | (3,603 | ) | | | (3,163 | ) |
Proceeds from junior subordinated debentures payable | | | — | | | | 10,000 | | | | — | |
| Net cash (used) provided by financing activities | | | (6,003 | ) | | | 6,774 | | | | (3,156 | ) |
| Net increase (decrease) in cash and cash equivalents | | | (562 | ) | | | 192 | | | | 227 | |
| Cash and cash equivalents: | | | | | | | | | | | | |
| Beginning of year | | | 829 | | | | 637 | | | | 410 | |
| End of year | | $ | 267 | | | $ | 829 | | | $ | 637 | |
The Corporation and the Bank, are managed by a legal entity and not by lines of business. The Bank’s operations include commercial banking services, such as lending activities, business services, deposit products and other services. The performance of the Bank as a whole is reviewed by the Board of Directors and Management Committee.
The Management Committee, which is the senior decision making group of the Bank, is comprised of seven members including the President/CEO. Segment information is not necessary to be presented in the notes to the consolidated financial statements because operating decisions are made based on the performance of the Corporation as a whole.
(20) Selected Quarterly Financial Data (Unaudited)
| | | QUARTER ENDED | |
| | | MAR 31, | | | JUNE 30, | | | SEPT 30, | | | DEC 31, | |
| | | 2007 | | | 2007 | | | 2007 | | | 2007 | |
| Interest income | | $ | 22,631 | | | $ | 23,789 | | | $ | 23,378 | | | $ | 24,137 | |
| Interest expense | | | 12,354 | | | | 12,798 | | | | 12,568 | | | | 12,820 | |
| Net interest income | | | 10,277 | | | | 10,991 | | | | 10,810 | | | | 11,317 | |
| Provision for loan losses | | | 250 | | | | 250 | | | | 350 | | | | 500 | |
| Other income | | | 2,051 | | | | 1,834 | | | | 1,942 | | | | 1,739 | |
| Other expense | | | 6,423 | | | | 6,548 | | | | 6,724 | | | | 6,987 | |
| Income before provision for income taxes | | | 5,655 | | | | 6,027 | | | | 5,678 | | | | 5,569 | |
| Provision for income taxes | | | 1,890 | | | | 2,044 | | | | 1,892 | | | | 1,557 | |
| Net income | | $ | 3,765 | | | $ | 3,983 | | | $ | 3,786 | | | $ | 4,012 | |
| Earnings per share, basic | | $ | 0.31 | | | $ | 0.33 | | | $ | 0.32 | | | $ | 0.33 | |
| Earnings per share, diluted | | | 0.30 | | | | 0.32 | | | | 0.31 | | | | 0.33 | |
CASCADE FINANCIAL CORPORATION AND SUBSIDIARIES
Notes to Consolidated Financial Statements
(Dollars in thousands, except share amounts)
(20) Selected Quarterly Financial Data (Unaudited) (continued)
| | | QUARTER ENDED | |
| | | MAR 31, | | | JUNE 30, | | | SEPT 30, | | | DEC 31, | |
| | | 2006 | | | 2006 | | | 2006 | | | 2006 | |
| Interest income | | $ | 18,787 | | | $ | 20,249 | | | $ | 21,396 | | | $ | 22,226 | |
| Interest expense | | | 9,267 | | | | 10,561 | | | | 11,440 | | | | 12,000 | |
| Net interest income | | | 9,520 | | | | 9,688 | | | | 9,956 | | | | 10,226 | |
| Provision for loan losses | | | 250 | | | | 300 | | | | 300 | | | | 150 | |
| Other income | | | 1,325 | | | | 1,573 | | | | 1,616 | | | | 1,512 | |
| Other expense | | | 5,875 | | | | 6,036 | | | | 6,349 | | | | 6,326 | |
| Income before provision for income taxes | | | 4,720 | | | | 4,925 | | | | 4,923 | | | | 5,262 | |
| Provision for income taxes | | | 1,548 | | | | 1,598 | | | | 1,609 | | | | 1,720 | |
| Net income | | $ | 3,172 | | | $ | 3,327 | | | $ | 3,314 | | | $ | 3,542 | |
| Earnings per share, basic | | $ | 0.26 | | | $ | 0.28 | | | $ | 0.27 | | | $ | 0.29 | |
| Earnings per share, diluted | | | 0.26 | | | | 0.27 | | | | 0.27 | | | | 0.29 | |
| | | | | | | | | | | | | | | | | |
| | | QUARTER ENDED | |
| | | MAR 31, | | | JUNE 30, | | | SEPT 30, | | | DEC 31, | |
| | | 2005 | | | 2005 | | | 2005 | | | 2005 | |
| Interest income | | $ | 15,600 | | | $ | 16,666 | | | $ | 17,391 | | | $ | 18,145 | |
| Interest expense | | | 6,826 | | | | 7,515 | | | | 8,055 | | | | 8,880 | |
| Net interest income | | | 8,774 | | | | 9,151 | | | | 9,336 | | | | 9,265 | |
| Provision for loan losses | | | 245 | | | | 250 | | | | 250 | | | | 200 | |
| Other income | | | 1,600 | | | | 1,667 | | | | 1,564 | | | | 1,502 | |
| Other expense | | | 5,553 | | | | 5,776 | | | | 5,672 | | | | 5,605 | |
| Income before provision for income taxes | | | 4,576 | | | | 4,792 | | | | 4,978 | | | | 4,962 | |
| Provision for income taxes | | | 1,505 | | | | 1,577 | | | | 1,634 | | | | 1,546 | |
| Net income | | $ | 3,071 | | | $ | 3,215 | | | $ | 3,344 | | | $ | 3,416 | |
| Earnings per share, basic | | $ | 0.26 | | | $ | 0.27 | | | $ | 0.28 | | | $ | 0.29 | |
| Earnings per share, diluted | | | 0.25 | | | | 0.26 | | | | 0.27 | | | | 0.28 | |
ANNUAL SHAREHOLDERS’ MEETING
The Annual Shareholders’ meeting will be held at the Everett Golf & Country Club, 1500 52nd Street SE, Everett, Washington, on Tuesday, April 22, 2008 at 6:30 p.m. Pacific time.