UNITED STATES
SECURITIES AND EXCHANGE COMMISSION
Washington, D.C. 20549
Form 6-K
REPORT OF FOREIGN PRIVATE ISSUER PURSUANT TO RULE
13a-16 OR 15d-16 UNDER
THE SECURITIES EXCHANGE ACT OF 1934
For the month of July 2021
Commission File Number 001-13314
Huaneng Power International, Inc.
(Translation of registrant’s name into English)
Huaneng Power International, Inc.
Huaneng Building,
6 Fuxingmennei Street,
Xicheng District,
Beijing, 100031 PRC
(Address of principal executive office)
Indicate by check mark whether the registrant files or will file annual reports under cover Form 20-F or Form 40-F. Form 20-F x Form 40-F ¨
Indicate by check mark if the registrant is submitting the Form 6-K in paper as permitted by Regulation S-T Rule 101(b)(1): ¨
Indicate by check mark if the registrant is submitting the Form 6-K in paper as permitted by Regulation S-T Rule 101(b)(7): ¨
This Form 6-K consists of:
1. An announcement regarding 2021 interim results of Huaneng Power International, Inc.(the "Registrant"); and
2. An announcement regarding connected transaction of the Registrant;
Each made by the Registrant on July 28, 2021.
SIGNATURES
Pursuant to the requirements of the Securities Exchange Act of 1934, the registrant has duly caused this report to be signed on its behalf by the undersigned, thereunto duly authorized.
| HUANENG POWER INTERNATIONAL, INC. | ||
| ||
| By: | /s/ Huang Chaoquan | |
| Name: | Huang Chaoquan | |
| Title: | Company Secretary | |
| Date: July 29, 2021 | ||
Hong Kong Exchanges and Clearing Limited and The Stock Exchange of Hong Kong Limited take no responsibility for the contents of this announcement, make no representation as to its accuracy or completeness and expressly disclaim any liability whatsoever for any loss howsoever arising from or in reliance upon the whole or any part of the contents of this announcement.

2021 Interim Results Announcement
| Consolidated operating revenue: | RMB95.116 billion | |
| Net profit attributable to equity holders of the Company: | RMB4.019 billion | |
| Earnings per share: | RMB0.19 |
INTERIM RESULTS
The Board of Directors of Huaneng Power International, Inc. (the “Company”) announces the unaudited operating results for the six months ended 30 June 2021 and a comparison with the operating results for the same period of last year. For the six months ended 30 June 2021, the Company and its subsidiaries recorded consolidated operating revenue of RMB95.116 billion, representing an increase of 20.21% compared to the same period of last year. The net profit attributable to equity holders of the Company was RMB4.019 billion, representing a decrease of 26.14% compared to the same period of last year. The earnings per share was RMB0.19. The net asset (excluding equity interests attributable to minority shareholders and other equity instruments) per share was RMB5.16.
Please refer to the unaudited financial information below for details of the operating results.
- 1 -
BUSINESS REVIEW FOR THE FIRST HALF OF THE YEAR
In the first half of the year, based on the new development stage, the Company implemented the new development concept, integrated into the new development pattern and, in accordance with the annual work deployment and requirements, coordinated the epidemic prevention and control, and operation reform and development, achieved the main production and operation performance goals, which have laid a solid foundation for the whole year’s task.
| 1. | Power Generation |
In the first half of the year, the Company’s total electricity sold by the power plants within China on consolidated basis amounted to 207.926 billion kWh, representing an increase of 20.80% over the same period last year. The average utilization hours of the Company’s power plants within China were 1,980 hours, representing an increase of 263 hours over the same period last year. The company’s market-based transaction power ratio was 61.09%, representing an increase of 11.20 percentage points over the same period last year.
The increase in the Company’s power generation was mainly attributable to: the rapid growth in the demand for power in the whole society, which has driven the generation-side electricity consumption to increase significantly year-on-year. Among the Company’s 26 regions, 22 regions have achieved positive year-on-year growth in power generation. Among them, 10 regions including Guangdong, Chongqing, Fujian, Zhejiang, Jiangsu, and Shanghai have achieved growth rates of more than 20%.
| 2. | Cost Control |
In the first half of the year, coal supply and demand were at a high level. However, due to the limited release of domestic production, tight supply of overseas resources, continued improvement in the macro economy, and insufficient clean energy output, the growth of supply fell below the level of demand growth. The price pivot of coal has moved up significantly. The Company scientifically studied and assessed market trends, flexibly adjusted its procurement strategy, strengthened resource development, improved the fulfillment of long-term contract performance, and actively played the role of imported coal to supplement the supply. Thus the supply of thermal coal for Company was generally safe and stable. Notwithstanding the increase in coal price, the industry benchmarking of Company remained advanced.
- 2 -
| 3. | Energy Conservation and Environmental Protection |
In the first half of the year, the Company steadily promoted the three-year action plan for safety production special rectification, heating renovation, energy saving and emission reduction, wastewater treatment in key areas, and closure of coal yards. The safety, economy, and environmental protection operation of power generation units continued to improve, and the Company’s pollutant emission concentration and energy consumption indicators continued to maintain the industry lead. The Company’s cumulative coal consumption for power supply was 288.47 g/kWh, a year-on-year decrease of 2.10 g/kWh; the average emission concentrations of sulfur dioxide, nitrogen oxides, and soot from thermal power units were all better than the ultra-low emission standards. In the national benchmarking of the energy efficiency level of thermal power units released by CEC, the Company has 52 units with good results.
| 4. | Project Development and Construction |
In the first half of the year, the Company proceeded smoothly in the construction of power generation projects, adding 470 MW of wind power controlled generation capacity, 190 MW of solar energy controlled generation capacity, and 30 MW of biomass controlled generation capacity. In the meantime, some of the power plants invested or controlled by the Company underwent changes in capacity. As of June 30, 2021, the Company’s controlled generation capacity was 114,042 MW, and the equity generation capacity was 99,891 MW. Low carbon clean energy (wind power, solar energy, hydro-power, combined cycle, biomass power) accounted for 21.07% of the installed capacity.
- 3 -
| 5. | Overseas Businesses |
In the first half of the year, the accumulated power generation of Tuas Power Ltd. (“Tuas Power”), a wholly-owned subsidiary of the Company in Singapore, accounted for a market share of 20.5%, representing a decrease of 1.0 percentage point compared to the same period last year. The sales revenue was RMB5.667 billion, representing an increase of RMB34 million from RMB5.633 billon of the same period last year. The pre-tax loss of Singapore business was RMB55 million, representing a decrease in pre-tax profit of RMB91 million over the same period last year (pre-tax profit of RMB36 million).
In the first half of the year, the pre-tax profit of the Sahiwal project in Pakistan was RMB407 million, representing an increase of RMB60 million compared to the same period last year.
PROSPECT FOR THE SECOND HALF OF 2021
At present, China’s economic operation continues to run steadily, to reinforce and improve in stability. In the second half of the year, the results of the overall planning of epidemic prevention and control, and economic and social development will continue to expand and consolidate. China’s economy will return from rapid recovery to normalization, and power generation and consumption will continue to maintain rapid growth. The Company will adhere to the general keynote of seeking progress while maintaining stability, adhere to new development concepts, coordinate energy security and green development, deepen supply-side structural reforms, comprehensively promote high-quality development, and further improve safety management and control, improve quality and efficiency, work in such areas as green development, technological innovation, deepening reforms, and overseas project management, and strive to complete the annual goals and tasks.
In terms of the power market, in the second half of the year, the Company will closely follow the power supply and demand situation, conduct in-depth research on regional market conditions, and adjust business strategies in a timely manner. The Company will actively participate in power market reform, increase policy influence, promote the healthy, orderly and sustainable development of the power market, adhere to the overall planning of volume and price, give full play to its own advantages, and enhance the Company’s ability in market response, development ability and competitiveness. On 16 July 2021, the national carbon market was officially launched, covering the Company’s 72 thermal power plants. The Company is accelerating continuously the pace of structural adjustment and energy saving and carbon reduction efforts, and its energy utilization level is in the leading position in the industry, thus facing relatively lower pressure on fulfillment of carbon trading. The Company will continue to strengthen carbon trading management, formulate carbon trading strategies, and try to complete the national carbon market transaction compliance work on schedule at a lower cost.
- 4 -
In terms of the coal market, in the second half of the year, the focus of domestic policies shifted to “steady growth”, and it is expected that the macro economy will be stable and positive, and the electricity load will continue to grow. After hydropower flood period, the demand for peak load of thermal power has further increased, and electricity coal consumption is likely to remain high. At present, safety supervision and environmental protection control are still strict, and the overall supply is relatively tight. However, the recent high coal price has attracted great attention at the national level. Various measures have been taken to ensure supply and stable prices. The policy impacted market for thermal coal will make coal supply gradually increase, with prices stabilizing and correction. The Company will continue to do a good job in coal market analysis and relevant policy interpretation, actively seek policy support, adhere to the principle of gradient procurement, actively improve the fulfillment of long-term contracts, increase the development of overseas high-quality resources, and leverage on the advantages of the internal industrial chain and the coal capacity from Huaneng Group, and strive to ensure the Company’s fuel supply and price control work.
In terms of the capital market, the monetary policy in the second half of the year will maintain continuity, stability, and sustainability, vigorously serve the real economy, and effectively prevent and control financial risks; promote green and low-carbon development, and establish monetary policy tools to support carbon emission reductions, so as to be stably, orderly and precisely support the development of clean energy, energy conservation and environmental protection, and carbon emission reduction technologies. The Company will pay close attention to the capital market, actively manage, prevent risks, and control capital costs.
In the second half of the year, the Company will adhere to the concept of safe development, highlight the safety of production infrastructure, carry out epidemic prevention and control, resolutely prevent various safety incidents. Leading by the goal of carbon peaking and carbon neutrality, the Company will accelerate the pace of green development, increase the development and construction of new energy projects, promote the optimization and upgrade of the coal-fired power structure, continue to increase heating renovation, energy conservation and emission reduction, and actively participate in carbon market transactions; achieve new breakthroughs in transformation and upgrading; deepen the promotion of quality and efficiency enhancement, focus on ensuring the quantity and price of coal, actively do a good job in power marketing, strictly control costs and expenses, and strive to complete the annual operating performance; accelerate the advancement of scientific and technological innovation and strengthen key core technology research and development; deepen the application of intelligent digitalization, and enhance the core competitiveness of the Company; continue to deepen corporate reforms, strengthen and improve corporate governance, improve management efficiency, and stimulate corporate endogenous motivation; promote corporate culture construction, earnestly fulfill social responsibilities, and continue to create long-term, stable and increasing returns to the shareholders of the Company.
- 5 -
MANAGEMENT’S DISCUSSION AND ANALYSIS
(Prepared under International Financial Reporting Standards (“IFRS”))
General
The principal activities of the Company are investment in, and construction, operation and management of, power plants within China.
As of 30 June 2021, the Company had a controlled installed capacity of 114,042 MW and an equity-based installed capacity of 99,891 MW, of which approximately 21.07% was from clean energy sources (wind, photovoltaic, hydro, gas turbine and biomass power generation). The Company located its power in 26 provinces, autonomous region and municipalities within China; the Company also owns a wholly owned power enterprise located in Singapore, and invests in a power enterprise located in Pakistan. The Company is among the biggest listed power companies in China.
For the six months ended 30 June 2021, the operating revenue of the Company amounted to RMB95,116 million, representing an increase of 20.21% over the same period of last year. The net profit attributable to equity holders of the Company was RMB4.019 billion, representing a decrease of 26.14% over the same period of last year; the earnings per share was RMB0.19.
| I. | Operating Results |
| 1. | Operating results of first half of 2021 |
For the second quarter of 2021, the Company’s total electricity sold by power plants within China on consolidated basis amounted to 102.917 billion kWh, representing an increase of 12.51% over the same period last year. In the first half of 2021, the Company’s total electricity sold by power plants within China on consolidated basis amounted to 207.926 billion kWh, representing an increase of 20.80% over the same period last year. In the first half of 2021, the Company’s average on-grid electricity settlement price for its power plants within China amounted to RMB418.81 per MWh, representing an increase of 0.52% over the same period last year. In the first half of 2021, the proportion of the Company’s market based electricity sold amounted to 61.09%, representing an increase of 11.20 percentage points over the same period last year.
- 6 -
The increase in the Company’s power generation was mainly attributable to the facts that in the first half of 2021, the rapid growth in the demand for power in the whole society, which has driven the generation-side electricity consumption to increase significantly year-on-year. Among the Company’s 26 regions, 22 regions have achieved positive year-on year growth in power generation. Among them, 10 regions including Guangdong, Chongqing, Fujian, Zhejiang, Jiangsu, and Shanghai have achieved growth rates of more than 20%.
The power generations (in billion kWh) of the Company, by regions, are listed below:
| Electricity Sold | ||||||||||||||||
| Region | April to June 2021 | Change | January to June 2021 | Change | ||||||||||||
| Heilongjiang Province | 3.280 | -7.73 | % | 6.188 | -2.23 | % | ||||||||||
| Coal-fired | 2.926 | -8.99 | % | 5.512 | -3.34 | % | ||||||||||
| Wind-power | 0.317 | 4.81 | % | 0.608 | 8.98 | % | ||||||||||
| PV | 0.037 | -1.35 | % | 0.069 | -1.02 | % | ||||||||||
| Jilin Province | 2.452 | -9.20 | % | 4.718 | -4.03 | % | ||||||||||
| Coal-fired | 1.944 | -15.75 | % | 3.736 | -11.16 | % | ||||||||||
| Wind-power | 0.335 | 17.18 | % | 0.667 | 24.43 | % | ||||||||||
| Hydro-power | 0.017 | -48.45 | % | 0.017 | -59.45 | % | ||||||||||
| PV | 0.076 | 370.08 | % | 0.139 | 337.33 | % | ||||||||||
| Biomass Power | 0.080 | 38.54 | % | 0.160 | 56.61 | % | ||||||||||
| Liaoning Province | 4.775 | 25.64 | % | 8.975 | 18.14 | % | ||||||||||
| Coal-fired | 4.600 | 108.32 | % | 8.644 | 18.69 | % | ||||||||||
| Wind-power | 0.120 | 10.55 | % | 0.239 | 13.26 | % | ||||||||||
| Hydro-power | 0.012 | -1.12 | % | 0.012 | -35.20 | % | ||||||||||
| PV | 0.043 | -5.68 | % | 0.080 | -5.32 | % | ||||||||||
| Inner Mongolia | 0.174 | 196.50 | % | 0.241 | 126.80 | % | ||||||||||
| Wind-power | 0.174 | 196.50 | % | 0.241 | 126.80 | % | ||||||||||
| Hebei Province | 2.610 | -9.51 | % | 5.376 | 2.64 | % | ||||||||||
| Coal-fired | 2.469 | -10.30 | % | 5.104 | 2.59 | % | ||||||||||
| Wind-power | 0.128 | 10.48 | % | 0.250 | 6.88 | % | ||||||||||
| PV | 0.013 | -17.79 | % | 0.023 | -22.35 | % | ||||||||||
- 7 -
| Electricity Sold | ||||||||||||||||
| Region | April to June 2021 | Change | January to June 2021 | Change | ||||||||||||
| Gansu Province | 3.208 | -0.14 | % | 7.606 | 8.84 | % | ||||||||||
| Coal-fired | 2.585 | 2.72 | % | 6.339 | 9.75 | % | ||||||||||
| Wind-power | 0.623 | -10.45 | % | 1.267 | 4.51 | % | ||||||||||
| Ningxia | 0.007 | -10.56 | % | 0.011 | -11.11 | % | ||||||||||
| PV | 0.007 | -10.56 | % | 0.011 | -11.11 | % | ||||||||||
| Beijing | 1.732 | -12.82 | % | 4.090 | 4.85 | % | ||||||||||
| Coal-fired | 0.00 | – | 0.648 | 3.60 | % | |||||||||||
| Combined Cycle | 1.732 | -12.82 | % | 3.442 | 5.09 | % | ||||||||||
| Tianjin | 1.242 | 20.02 | % | 2.881 | 0.71 | % | ||||||||||
| Coal-fired | 1.074 | 22.51 | % | 2.233 | 2.11 | % | ||||||||||
| Combined Cycle | 0.163 | 3.80 | % | 0.640 | -4.68 | % | ||||||||||
| PV | 0.005 | 423.99 | % | 0.007 | 348.16 | % | ||||||||||
| Shanxi Province | 1.652 | -2.91 | % | 4.523 | 5.22 | % | ||||||||||
| Coal-fired | 1.337 | -10.76 | % | 2.779 | -3.89 | % | ||||||||||
| Combined Cycle | 0.00 | -100.00 | % | 1.175 | -2.06 | % | ||||||||||
| Wind-power | 0.066 | – | 0.139 | – | ||||||||||||
| PV | 0.248 | 52.99 | % | 0.430 | 106.74 | % | ||||||||||
| Shandong Province | 18.501 | 15.58 | % | 37.892 | 15.29 | % | ||||||||||
| Coal-fired | 17.883 | 14.58 | % | 36.746 | 14.13 | % | ||||||||||
| Wind-power | 0.386 | 78.25 | % | 0.756 | 87.21 | % | ||||||||||
| PV | 0.148 | -19.18 | % | 0.272 | 1.70 | % | ||||||||||
| Biomass Power | 0.084 | – | 0.119 | – | ||||||||||||
| Henan Province | 5.423 | 3.64 | % | 10.708 | 18.47 | % | ||||||||||
| Coal-fired | 4.393 | -4.80 | % | 8.727 | 6.27 | % | ||||||||||
| Combined Cycle | 0.070 | -80.44 | % | 0.090 | -76.73 | % | ||||||||||
| Wind-power | 0.953 | 274.28 | % | 1.878 | 339.80 | % | ||||||||||
| PV | 0.007 | 6.13 | % | 0.013 | 4.10 | % | ||||||||||
| Jiangsu Province | 10.193 | 21.65 | % | 20.411 | 26.69 | % | ||||||||||
| Coal-fired | 7.450 | 8.20 | % | 15.339 | 16.96 | % | ||||||||||
| Combined Cycle | 1.740 | 103.04 | % | 2.952 | 70.74 | % | ||||||||||
| Wind-power | 0.929 | 54.00 | % | 1.987 | 64.22 | % | ||||||||||
| PV | 0.074 | 123.38 | % | 0.133 | 134.78 | % | ||||||||||
- 8 -
| Electricity Sold | ||||||||||||||||
| Region | April to June 2021 | Change | January to June 2021 | Change | ||||||||||||
| Shanghai | 4.452 | 16.05 | % | 9.819 | 30.19 | % | ||||||||||
| Coal-fired | 4.031 | 11.33 | % | 9.190 | 33.96 | % | ||||||||||
| Combined Cycle | 0.413 | 91.43 | % | 0.614 | -9.91 | % | ||||||||||
| PV | 0.008 | – | 0.015 | – | ||||||||||||
| Chongqing | 2.840 | 34.50 | % | 6.505 | 58.02 | % | ||||||||||
| Coal-fired | 2.204 | 25.59 | % | 5.034 | 47.99 | % | ||||||||||
| Combined Cycle | 0.572 | 92.27 | % | 1.344 | 120.74 | % | ||||||||||
| Wind-power | 0.063 | 8.32 | % | 0.127 | 19.68 | % | ||||||||||
| Zhejiang Province | 8.323 | 21.69 | % | 14.838 | 31.67 | % | ||||||||||
| Coal-fired | 7.932 | 19.45 | % | 14.271 | 29.62 | % | ||||||||||
| Combined Cycle | 0.375 | 105.88 | % | 0.541 | 132.95 | % | ||||||||||
| PV | 0.016 | -4.53 | % | 0.026 | -4.83 | % | ||||||||||
| Hubei Province | 3.696 | 3.92 | % | 8.367 | 21.08 | % | ||||||||||
| Coal-fired | 3.447 | 3.63 | % | 7.895 | 22.10 | % | ||||||||||
| Wind-power | 0.152 | 2.45 | % | 0.331 | 9.68 | % | ||||||||||
| Hydro-power | 0.092 | 20.72 | % | 0.131 | -0.49 | % | ||||||||||
| PV | 0.006 | -14.74 | % | 0.010 | -4.79 | % | ||||||||||
| Hunan Province | 2.301 | -0.99 | % | 5.006 | 14.81 | % | ||||||||||
| Coal-fired | 2.012 | -0.67 | % | 4.488 | 18.03 | % | ||||||||||
| Wind-power | 0.168 | -2.74 | % | 0.343 | 5.21 | % | ||||||||||
| Hydro-power | 0.109 | -2.76 | % | 0.155 | -26.86 | % | ||||||||||
| PV | 0.012 | -12.00 | % | 0.021 | 0.55 | % | ||||||||||
| Jiangxi Province | 5.033 | 11.98 | % | 10.187 | 18.35 | % | ||||||||||
| Coal-fired | 4.692 | 11.35 | % | 9.574 | 18.02 | % | ||||||||||
| Wind-power | 0.243 | 5.59 | % | 0.433 | 0.90 | % | ||||||||||
| PV | 0.098 | 93.73 | % | 0.180 | 171.66 | % | ||||||||||
| Anhui Province | 1.241 | 2.38 | % | 2.777 | 15.72 | % | ||||||||||
| Coal-fired | 1.029 | -8.40 | % | 2.284 | 2.16 | % | ||||||||||
| Wind-power | 0.174 | 140.34 | % | 0.424 | 187.19 | % | ||||||||||
| Hydro-power | 0.038 | 131.85 | % | 0.069 | 316.71 | % | ||||||||||
- 9 -
| Electricity Sold | ||||||||||||||||
| Region | April to June 2021 | Change | January to June 2021 | Change | ||||||||||||
| Fujian Province | 4.646 | 22.00 | % | 8.894 | 41.80 | % | ||||||||||
| Coal-fired | 4.643 | 22.02 | % | 8.888 | 41.83 | % | ||||||||||
| PV | 0.003 | -7.18 | % | 0.006 | 1.65 | % | ||||||||||
| Guangdong Province | 9.197 | 43.91 | % | 16.371 | 70.22 | % | ||||||||||
| Coal-fired | 7.963 | 25.25 | % | 14.225 | 48.49 | % | ||||||||||
| Combined Cycle | 1.228 | 4431.97 | % | 2.134 | 7774.37 | % | ||||||||||
| PV | 0.006 | 0.89 | % | 0.012 | 8.57 | % | ||||||||||
| Guangxi | 0.198 | 21.94 | % | 0.383 | 37.51 | % | ||||||||||
| Combined Cycle | 0.108 | -2.80 | % | 0.212 | 20.15 | % | ||||||||||
| Wind-power | 0.091 | 74.53 | % | 0.170 | 67.78 | % | ||||||||||
| Yunnan Province | 2.278 | -16.44 | % | 5.327 | 24.99 | % | ||||||||||
| Coal-fired | 2.153 | -17.05 | % | 5.056 | 28.63 | % | ||||||||||
| Wind-power | 0.124 | -5.01 | % | 0.269 | -17.88 | % | ||||||||||
| Hydro-power | 0.001 | 141.89 | % | 0.002 | -54.37 | % | ||||||||||
| Guizhou Province | 0.107 | 42.42 | % | 0.178 | 13.32 | % | ||||||||||
| Wind-power | 0.048 | -5.46 | % | 0.102 | -22.71 | % | ||||||||||
| PV | 0.059 | 141.46 | % | 0.076 | 202.93 | % | ||||||||||
| Hainan Province | 3.357 | -0.56 | % | 5.656 | -6.80 | % | ||||||||||
| Coal-fired | 3.112 | -4.08 | % | 5.260 | -10.06 | % | ||||||||||
| Combined Cycle | 0.164 | 128.27 | % | 0.253 | 143.09 | % | ||||||||||
| Wind-power | 0.017 | -16.15 | % | 0.039 | -17.06 | % | ||||||||||
| Hydro-power | 0.032 | 228.54 | % | 0.049 | 183.00 | % | ||||||||||
| PV | 0.031 | 5.61 | % | 0.055 | 4.96 | % | ||||||||||
| Total | 102.917 | 12.51 | % | 207.926 | 20.80 | % | ||||||||||
For the second quarter of 2021, the power generation of Tuas Power Ltd. in Singapore, which is wholly-owned by the Company, accounted for a market share of 20.4% in Singapore, representing a decrease of 1.2 percentage points compared to the same period of last year. The accumulated power generation of Tuas Power for the first half year accounted for a market share of 20.5%, representing a decrease of 1.0 percentage point compared to the same period of last year.
- 10 -
| 2. | Comparative Analysis of Operating results |
| 2.1 | Operating revenue and tax and levies on operations |
Operating revenue mainly consists of revenue from electricity sold. For the first half of 2021, the consolidated operating revenue of the Company and its subsidiaries amounted to RMB95.116 billion, representing an increase of 20.21% from RMB79.127 billion for the same period last year. The operating revenue from domestic operations of the Company increased by RMB15.607 billion over the same period of last year, while the operating revenue generated from newly operated generating units (put into operation since 1 January 2020, same below) increased by RMB3.988 billion.
The operating revenue from the operations in Singapore increased by RMB34 million over the same period of last year. The operating revenue from the operations in Pakistan increased by RMB348 million over the same period of last year.
Tax and levies on operations mainly consist of surcharges of value-added tax. According to relevant administrative regulations, these surcharges include City Construction Tax and Education Surcharges calculated at prescribed percentages on the amounts of the value-added tax paid. For the first half of 2021, the tax and levies on operations of the Company and its subsidiaries were RMB0.941 billion, representing an increase of RMB54 million from RMB0.887 billion for the same period of last year.
| 2.2 | Operating expenses |
For the first half of 2021, the total operating expenses of the Company and its subsidiaries was RMB85.002 billion, representing an increase of 29.16% from the same period last year. The operating expenses in domestic operations of the Company increased by RMB18.569 billion, or 31.46%, from the same period last year, which was primarily attributable to increase of fuel costs, while the operating expenses generated from newly operated generating units increased by RMB2.425 billion.
- 11 -
The operating expenses from the operations in Singapore increased by RMB0.183 billion from the same period last year. The operating expenses from the operations in Pakistan increased by RMB0.438 billion from the same period last year.
| 2.2.1 | Fuel costs |
Fuel costs account for the majority of the operating expenses for the Company and its subsidiaries. For the first half of 2021, fuel costs of the Company and its subsidiaries increased by 40.53% to RMB57.380 billion. The fuel costs from domestic operations of the Company and its subsidiaries increased by RMB16.532 billion, which was primarily attributable to the increase of coal price. The fuel costs of the newly operated generating units increased by RMB1.575 billion. Fuel costs in Singapore increased by RMB17 million from the same period last year.
| 2.2.2 | Depreciation |
For the first half of 2021, depreciation expenses of the Company and its subsidiaries increased by RMB251 million to RMB11.094 billion from the same period last year. The depreciation expenses of domestic operations increased by RMB357 million compared to the same period last year, of which the depreciation costs incurred by the newly operated generating units increased by RMB548 million. The depreciation expenses of the operations in Singapore decreased by RMB106 million compared to the same time last year.
| 2.2.3 | Labor |
Labor costs consist of salaries to employees and contributions payable for employees’ housing funds, medical insurance, pension and unemployment insurance, as well as training costs. For the first half of 2021, the labor costs of the Company and its subsidiaries amounted to RMB6.886 billion, representing an increase of RMB1.32 billion from RMB5.566 billion for same period last year.
- 12 -
| 2.2.4 | Maintenance |
For the first half of 2021, the maintenance expenses of the Company and its subsidiaries amounted to RMB1.778 billion, representing an increase of RMB131 million from the same period last year. The maintenance expenses of the Company’s domestic operations increased by RMB107 million compared to the same period last year. The maintenance expenses of operations in Singapore increased by RMB24 million compared to the same period last year.
| 2.2.5 | Other operating expenses (including electricity power purchase costs) |
For the first half of 2021, other operating expenses of the Company and its subsidiaries was RMB7.865 billion, representing an increase of RMB0.940 billion from RMB6.925 billion for the same period last year. The other operating expenses from the Company’s domestic operations increased by RMB256 million. Other operating expenses of the newly operated generating units increased by RMB110 million. Other operating expenses of the operations in Singapore increased by RMB247 million compared to the same period last year. Other operating expenses of the operations in Pakistan increased by RMB437 million compared to the same period last year.
| 2.3 | Financial expenses, net |
The consolidated net financial expenses of the Company and its subsidiaries for the first half of 2021 amounted to RMB4.323 billion, representing a decrease of RMB0.611 billion from RMB4.934 billion for the same period last year, which is mainly due to the decrease of average interest rate and the overall debt amount compared with the same period last year. The financial expenses of domestic operations decreased by RMB0.465 billion, of which the interest expense of newly operated generating unit increased by RMB0.359 billion. The financial expenses of the operations in Singapore increased by RMB19 million. The financial expenses of the operations in Pakistan decreased by RMB165 million.
- 13 -
| 2.4 | Share of profits less losses of associates and joint ventures |
The share of profits less losses of associates and joint ventures of the Company and its subsidiaries for the first half of 2021 was RMB887 million, representing a decrease of RMB162 million from RMB1,049 million for the same period last year. This was mainly attributable to decreased profits of the associates and joint ventures of the Company, including Shenzhen Energy.
| 2.5 | Income tax expenses |
For the first half of 2021, the Company and its subsidiaries registered consolidated income tax expenses of RMB1.057 billion, representing a decrease of RMB838 million from RMB1.895 billion for the same period last year. The income tax expenses for the domestic operations decreased by RMB0.820 billion over the same period last year mainly due to the changes in pre-tax profit structure in the current period, in which the profit of coal power generation units has declined and the portion of profit of new energy units has increased. The latter are mostly in the preferential tax period with low tax rate.
| 2.6 | Profit/loss attributable to equity holders of the Company |
The net profit attributable to equity holders of the Company for the first half of 2021 amounted to RMB4.019 billion, representing a decrease of 26.14% from RMB5.441 billion for the same period last year. The net profit attributable to equity holders of the Company from its domestic operations was RMB3.921 billion, representing a decrease of 25.75% over the same period last year, which is mainly due to reduced profits from domestic power and heat operations resulting from increased coal prices. The net loss attributable to equity holders of the Company from its operations in Singapore was RMB62 million. The net profit attributable to equity holders of the Company from its operations in Pakistan was RMB160 million.
- 14 -
| 2.7 | Comparison of financial positions |
As of June 30, 2021, consolidated total assets of the Company and its subsidiaries were RMB459.537 billion, representing an increase of 2.14% from RMB449.905 billion as of December 31, 2020. Total liabilities amounted to RMB306.520 billion, representing an increase of 2.76% from RMB298.288 billion as at the end of 2020. The gearing ratio was 66.70%.
| 2.8 | Major financial position ratios |
Calculation formula of the financial ratios:
Ratio of liabilities to shareholders’ equity = balance of liabilities at the end of the period/balance of shareholders’ equity (excluding non-controlling interests) at the end of the period
Current ratio = balance of the current assets at the end of the period/balance of current liabilities at the end of the period
Quick ratio = (balance of current assets at the end of the period – net amounts of inventories at the end of the period)/balance of current liabilities at the end of the period
Multiples of interest earned = (profit before tax + interest expenses)/interest expenditure (including capitalized interest)
| The Company and its subsidiaries | ||||||||
| Item | As of June 30, 2021 | As of December 31, 2020 | ||||||
| Ratio of liabilities to shareholders’ equity | 2.38 | 2.30 | ||||||
| Current ratio | 0.50 | 0.43 | ||||||
| Quick ratio | 0.44 | 0.39 | ||||||
| Item | For the six months ended June 30, 2021 | For the six months ended June 30, 2020 | ||||||
| Multiples of interest earned | 2.12 | 2.51 | ||||||
- 15 -
The ratio of liabilities to owner’s equity increased compared with the beginning of the year, mainly due to the increase in the company’s liabilities. The current ratio and the quick ratio increased from the beginning of the year, mainly due to the decrease in short-term interest-bearing debts of the company, which led to a decrease in current liabilities. Multiples of interest earned has decreased compared to the same period of last year, mainly due to the decrease in profit before tax.
As of June 30, 2021, the Company and its subsidiaries had net current liabilities of RMB72.164 billion. Based on the successful financing history of the Company, the undrawn banking facilities available to the Company and its good credit rating, the Company believes it would be able to meet its liabilities as and when they fall due and secure the funds required for operations.
| II. | Liquidity and Cash Resources |
| 1. | Liquidity |
| For the six months ended June 30, 2021 | For the six months ended June 30, 2020 | Change | ||||||||||
| (RMB in 100 Million) | (RMB in 100 Million) | (%) | ||||||||||
| Net cash from operating activities | 191.35 | 158.36 | 20.83 | |||||||||
| Net cash used in investing activities | (170.85 | ) | (158.45 | ) | 7.83 | |||||||
| Net cash (used in)/from financing activities | (17.55 | ) | 26.89 | (165.27 | ) | |||||||
| Effect of foreign exchange rate changes, net | 0.73 | (2.15 | ) | (133.95 | ) | |||||||
| Net increase in cash and cash equivalent | 3.68 | 24.65 | (85.07 | ) | ||||||||
| Cash and cash equivalent at beginning of the reporting period | 132.58 | 124.43 | 6.55 | |||||||||
| Cash and cash equivalent at the end of the reporting period | 136.26 | 149.09 | (8.61 | ) | ||||||||
- 16 -
The net cash provided by operating activities of the Company for the first half of 2021 was RMB19.135 billion, representing an increase of 20.83% over the same period last year. The increase was mainly due to that the cash inflow from operating activities generated by the period-on-period increase in sales of electricity was higher than cash outflow from operating activities resulting from the growth in fuel costs.
Net cash used in investing activities of the Company was RMB17.085 billion, representing An increase of 7.83% from the same period last year, which was mainly due to the expansion of investment in new projects during the current period which contributed to an increase in fixed assets procurement, engineering expenditures and engineering material procurement.
The financing activities of the Company were principally debt financings. For the first half of 2021, the Company drew down new loans of RMB82.309 billion, issued super short-term notes of RMB13.000 billion and long-term bonds of RMB11.300 billion, and repaid loans of RMB77.475 billion, super short-term bonds of RMB18.000 billion and long-term bonds of RMB7.500 billion upon maturity.
As of 30 June 2021, cash and cash equivalents of the Company and its subsidiaries denominated in RMB and Singapore dollar, U.S. dollar, Pakistani Rupee and Japanese Yen, each of which is measured at RMB equivalent, were RMB12.522 billion, RMB0.826 billion, RMB0.607 billion, RMB0.180 billion and RM0.2021 million, respectively.
- 17 -
| 2. | Capital expenditure and cash resources |
| 2.1 | Capital expenditure for infrastructure construction and renovation projects |
The capital expenditure for construction and renovation projects of the Company for the first half of 2021 was RMB14.733 billion, including RMB1.619 billion for Zhuanghe Wind Power, RMB1.548 billion for Qingneng Tongyu Power, RMB1.049 billion for Ruijin Power Generation, RMB0.762 billion for Zhejiang Cangnan Offshore, RMB0.720 billion for Yantai New Energy, RMB0.643 billion for Pinghu Offshore, RMB0.561 billion for Dalian Chuanbo, RMB0.448 billion for Jiuquan Wind Power, RMB0.409 billion for Qingdao Co-generation, RMB0.378 billion for Dalian Co-generation, RMB0.374 billion for Luobei Wind Power, RMB0.362 billion for Shengdong Rudong Offshore, RMB0.34 billion for Yuhuan Power, RMB0.319 billion for Huangmei New Energy, RMB0.300 billion for Shidongkou I, RMB0.266 billion for Diandong Energy, RMB0.262 billion for Weihai Power, RMB0.228 billion for Yangpu Co-generation, RMB0.220 billion for Anhui Mengcheng Wind Power, RMB0.218 billion for Wuzhai Wind Power, RMB0.205 billion for Dezhou New Energy, RMB0.176 billion for Lindian Clean Energy, RMB0.169 billion for Zhumadian Wind Power, RMB0.158 billion for Diandong Mining and RMB0.155 billion for Qinbei Power. The infrastructure and renovation expenditure of other units was RMB2.844 billion.
The above capital expenditures are sourced mainly from internal capital, cash flows provided by operating activities, and debt financing. The Company expects to have significant capital expenditures in the next few years. During the course, the Company will make active efforts to improve project planning process on a commercially viable basis. The Company will also actively develop new projects to pave the way for its long-term growth. The Company expects to finance the above capital expenditures through internal capital, cash flows provided by operating activities, and debt and equity financing.
| 2.2 | Cash resources and anticipated financing costs |
The Company expects to finance its capital expenditure and acquisition costs primarily from internal capital, cash flows from operating activities, and debt and equity financings.
Good operating results and sound credit status provide the Company with strong financing capabilities. As of June 30, 2021, the undrawn banking facilities available to the Company and its subsidiaries amount to more than RMB318.971 billion from, among others, Bank of China, China Construction Bank and Industrial and Commercial Bank of China.
The Company issued unsecured super short-term bonds with face value of RMB2 billion, RMB3 billion, RMB3 billion, RMB2 billion and RMB3 billion bearing annual interest rates of 2.18%, 2.25%, 2.40%, 2.10% and 2.13% on January 20, 2021, January 25, 2021, February 25, 2021, April 26, 2021 and April 29, 2021, respectively. Such bonds are denominated in RMB, issued at face value and mature in 37 days, 30 days, 41 days, 37 days and 36 days, respectively.
- 18 -
The Company issued green mid-term notes with face value of RMB1 billion and RMB2.5 billion bearing annual interest rates of 3.45% and 3.35% on February 9, 2021 and April 16, 2021, respectively. Such mid-term notes are denominated in RMB, issued at face value and both mature in 3 years.
The Company issued corporate bonds with face value of RMB0.5 billion, RMB1.5 billion, RMB0.5 billion, RMB3.5 billion and RMB1.8 billion bearing annual interest rates of 3.35%, 3.97%, 3.33%, 3.97% and 3.99% on May 24, 2021 (two tranches), June 7, 2021 (two tranches) and June 21, 2021, respectively. Such bonds are denominated in RMB, issued at face value and mature in 3 years, 10 years, 3 years, 10 years and 10 years, respectively.
As of June 30, 2021, the Company and its subsidiaries had outstanding short-term loans of RMB68.462 billion (RMB66.311 billion as of the end of 2020), of which borrowings from banks were charged at annual interest rates ranging from 2.80% to 8.33% (2.15% to 4.90% at the end of 2020).
As of June 30, 2021, the Company and its subsidiaries had no outstanding short-term bonds (RMB5.003 billion at the end of 2020).
As of June 30, 2021, the Company and its subsidiaries had total long-term borrowings (including long-term borrowings maturing within one year) of RMB134.555 billion (at the end of 2020: RMB131.886 billion), of which RMB borrowings were RMB118.305 billion (at the end of 2020: RMB114.350 billion), USD borrowings were approximately $1.371 billion (at the end of 2020: $1.480 billion), euro borrowings of approximately €9 million (at the end of 2020: €11 million), Singapore dollar borrowings of S$1.513 billion (at the end of 2020: S$1.551 billion), and Japanese yen borrowings of ¥2.211 billion (at the end of 2020: ¥2.266 billion). US dollar and Singapore dollar borrowings are floating rate borrowings and all other foreign currency loans are fixed rate loans. As of June 30, 2021, the annual interest rate on long-term bank borrowings ranged from 0.75% to 5.20% (at the end of 2020: 0.75% to 6.55%).
- 19 -
The Company will maintain close watch on fluctuations of exchange rate and interest rate markets, and prudently assess currency and interest rate risks.
In addition to meeting cash requirements from operations, constructions and acquisitions in its ordinary course, the Company, along with due consideration of overall development of power generation industry and growth of the Company, will make efforts to control financing costs and financial risks, establish an optimal capital structure for effective financial management activities, with the view to providing sustainable and stable returns to its shareholders.
| 2.3 | Other financing requirements |
The objective of the Company is to bring long-term, consistent and growing returns to its shareholders. In line with this objective, the Company follows a proactive, stable and balanced dividend policy. Upon the approval from the annual general meeting of the shareholders for the year 2020 held on June 22, 2021, the Company declared a cash dividend of RMB0.18 per ordinary share (inclusive of tax), with total dividends of approximately RMB2.826 billion. The Company has not made payment of the dividends as of June 30, 2021.
- 20 -
| III. | Performance and Prospects of Significant Investments |
The Company acquired 25% equity interests in Shenzhen Energy Group (“Shenneng Group”) with payment of RMB2.390 billion on April 22, 2003. In 2011, Shenneng Group divided into a remainder company Shenneng Group and a new company Shenneng Energy Management Company, and the Company holds 25% equity interests in each of the two successors. The Company acquired 200 million shares from Shenzhen Energy Corporation (“Shenzhen Energy”), a subsidiary of Shenneng Group, in December 2007. Shenzhen Energy allotted shares with its capital surplus in 2011. In February 2013, Shenzhen Energy merged Shenzhen Energy Management Company through the combination of directional seasoned offering and cash payment to the shareholders of Shenzhen Energy Management Company. After the merger, the Company directly held 991,741,659 shares of Shenzhen Energy, representing 25.02% of its equity interests. These investments brought a net profit attributable to the equity holders of the Company of RMB396 million for the Company for the first half of 2021 under IFRS. This investment is expected to provide steady returns to the Company.
The Company held 60% direct equity interests in Sichuan Hydropower as of December 31, 2006. In January 2007, Huaneng Group increased its capital investment in Sichuan Hydropower by RMB615 million, thus reducing the Company’s equity interests in Sichuan Hydropower to 49% and making Huaneng Group the controlling shareholder of Sichuan Hydropower. This investment brought to the Company a net profit attributable to the equity holders of the Company of RMB110 million for the first half of 2021 under IFRS. This investment is expected to provide steady returns to the Company.
| IV. | Employee Benefits Policies |
As of June 30, 2021, the Company and its subsidiaries had 57,212 employees. During this reporting period, there was no significant change regarding remuneration policies and training programs of the Company.
| V. | Guarantee for Loans and Restricted Assets |
As of June 30, 2021, the Company provided guarantees of approximately RMB10.521 billion for the long-term bank loans and long-term bonds of Tuas Power; Huaneng Heilongjiang Power Co., Ltd., a subsidiary of the Company, provided guarantee of approximately RMB351 million, RMB692 million and RMB239 million for the long-term bank loans of its subsidiaries Huaneng Daqing Cogeneration Co., Ltd., Daqing Lvyuan Wind Power Co., Ltd., and Huaneng Tongjing Wind Power Co., Ltd., respectively; Huaneng Shandong Power Generation Co., Ltd., a subsidiary of the Company, provided guarantee of RMB0.517 billion for Huaneng Shandong Ruyi (Hong Kong) Energy Co, Ltd.
- 21 -
As of June 30, 2021, the details of secured loans of the Company and its subsidiaries are as follows:
| 1. | As of June 30, 2021, short-term loans of approximately RMB952 million (RMB1.317 billion at the end of 2020) represented the notes receivable that were discounted with recourse. As these notes receivable had not yet matured, the proceeds received were recorded as short-term loans. |
| 2. | As of June 30, 2021, long-term loans of approximately RMB3.405 billion (RMB3.322 billion at the end of 2020) of the Company and its subsidiaries were secured by certain property, plant and equipment with net book value of RMB4.209 billion (RMB3.400 billion at the end of 2020). |
| 3. | As of June 30, 2021, long-term loans of approximately RMB7.730 billion (RMB7.435 billion at the end of 2020) were secured by future electricity revenue of the Company and its subsidiaries. |
As of June 30, 2021, the restricted bank deposits of the Company and its subsidiaries were RMB510 million (RMB614 million at the end of 2020).
As of June 30, 2021, the discounted or endorsed un-matured accounts receivable have a book value of RMB2.416 billion (RMB2.817 billion at the end of 2020).
As of June 30, 2021, the Company and its subsidiaries had no material contingent liability.
| VI. | Risk Factors |
| 1. | Risks relating to Covid-19 |
The Pandemic of Covid-19, though under effective control within China, could be exposed to localized and seasonal outbreak which could impact general economic conditions, electricity demand, project construction, coal production and transportation.
The Company will strictly implement the measures to prevent and control Covid-19 in its ordinary course of business, maintain emergency plan to ensure prevention or mitigation of any risk to which the safety of our people, power production, project construction, materials procurement and fuel supply may be exposed.
- 22 -
| 2. | Risks relating to Electricity Sector and Market |
| (1) | Thermal power business is expected to bear the brunt from extensive utilization of renewable energies along with the proposal of which is topping the agenda of the governments in China and other countries in their efforts to achieve targets in carbon peaking and neutralization. The continued decline of unit utilization hours, shutdown of small-scale units required by government policies and out of operating conditions, and other policies restricting thermal power generation, will have negative impact on the Company’s thermal power business both within and outside China. |
| (2) | The coal-fired power units in China will gradually change from a source of power supply to that of power supplement. The deficiency of capacity recovery cost mechanism, the imperfection of the auxiliary service market, and the one-way, downward pricing regime of the electricity market, have imposed obstacles on effective control of power generation costs and increased the operation risk of thermal power businesses. |
| (3) | The dual-way energy control policies are expected to be implemented increasingly strictly in certain regions of China, which would restrict electricity consumption by certain high-energy-consuming users and limit the total amount of regional coal consumption, creating persistent impact on thermal power generation. |
| (4) | The continuingly reformed power market, expanded volumes of transactions between power producers and users, and the further promoted spot transaction practices market-wide have made it possible to access electricity generated from renewable energies at the price comparable to those from thermal power. The consistently increased market-based transactions of electricity by the Company would subject it to the risk of a downward pricing trend of electricity. |
- 23 -
The Company will accelerate its clean-energy transformation by increasing the proportion of renewable energies in power generation, and actively promote carbon reduction. It will streamline its generation structure by replacement, transformation, upgrade, elimination, and transaction of coal-fueled generating units. It will make coordinated arrangements to carry out upgrades of existing coal power units for energy saving and emission reduction, flexibility, heat supply and biomass coupling, so as to create new competitive advantage for the Company. The Company will closely follow the development of government policies and power market reform, take initiatives to interact with competent price authorities, actively cooperate with the government to establish reasonable, fair and regulated market conditions, take initiatives to respond to market changes, timely adjust pricing strategies, and make efforts to prevent and control the risks affecting electricity prices.
| 3. | Risks relating to Carbon Market |
The recent operation of the national carbon emission trading market will increase benefits for the power generating units with low carbon emissions at the cost of those units with higher carbon emissions. The Company is leading the industry on general energy utilization, and more effective in controlling carbon trading compliance costs from 2019 to 2020 than the comparable companies in the industry. However, the quota allocation plan for 2021 and beyond has not yet been issued, and the risk of an increase in power generation costs due to the gradual tightening of quota allocation cannot be ruled out. The compliance cost of power generation companies could also be subject to further increase along with potential inclusion of other entities and individuals into the market at a later stage.
The Company will pay close attention to the development of policy landscape in carbon market, continuingly strengthen carbon trading management, develop strategies, and try to complete timely and cost-effective fulfilment of carbon trading targets nationwide. Power generation businesses would also benefit from the voluntary emission reduction filing system once renewed by the government, which would help control carbon trading costs by increasing supply of emission reduction available for trading.
- 24 -
| 4. | Risks relating to Coal Market |
The first half of 2021 saw significant upward movement of coal prices. The second half of this year is expected to be subject to certain market risks. First, overcapacity production is officially criminalized, forcing mines producers to strictly comply with approved capacity amount, limiting potential increase of production along with enhanced carbon remission controls. Secondly, the relatively short supply of coal resources around the global, coupled with the sharp rise in crude oil prices and record shipping costs in ten years, has had strong impact on the supply of imported coal. The main source of our coal import is Indonesia. The potentially major change in epidemic situation of covid-19 in Indoenesia would significantly influence the coal import. Consequently, the coal import policy and foreign supply and demand situation in the second half of the year would be major and important concerns. Thirdly, thermal power generators are expected to continuingly play a primary role in meeting the increasing demand for electricity in the second half of 2021, which, coupled with existing low inventories of coals by power plants and tight demand-supply condition in the coal sector, would cause coal prices to maintain at a high level.
In response to the complicated coal market conditions, the Company will (i) take full advantage of its centralized fuel control mechanism to maintain effective control of procurement costs; (ii) strive to reinforce resource development, improve fulfillment of long term contracts, optimize coal category and procurement structure, and improve deployment of power plant resources; (iii) secure high quality coal supply and procurement by utilizing its strength in coal imports and owned transportation capacity; (iv) use coal production capacities of its own and Huaneng Group to maintain consistent coal prices; (v) increase coal blending efforts without compromising safety and environmental protection, and make endeavors to reduce fuel costs; (vi) take initiatives to voice out its concerns on high coal price, communicate its negative impact on secure power supply to national regulatory authorities, with the view to seeking policy support to guide downward movement of coal price.
- 25 -
| 5. | Risks relating to Environmental Protection |
In accordance with the current situation and needs of ecological civilization construction, the central government of China and local governments at all levels were continuously improving and deepening environmental protection policies, and constantly raised new and stricter requirements in water protection and dust control. Consequently, the Company’s power stations, which were established at different times and geographically distributed with large differences in natural and social environments, were confronted with environmental risks in various degrees.
The Company is committed to protecting the environment throughout the life cycle of power generation units, and maintain coordinated management and operation of power generation projects in line with the requirements of the Chinese government.
The Company’s newly operated coal-fired power plants are equipped with advanced technologies and powerful flue gas purification systems for new operating units. The existing generating units are completed with ultra-low emission upgrade required by the Chinese government, readily adaptable to fluctuations in weather conditions, fuel quality, electric and thermal loads and other internal and external factors, and are acceptable to local environmental protection authorities and energy regulators.
The Company is making company-wide efforts to actively follow up comments from environmental protection departments, carefully select advanced and applicable technical solutions, and take initiatives to make improvement in wastewater treatment system, construction of coal yard closure facilities, and comprehensive utilization of ash, and have all risks to environmental protection been efficiently responded and effectively resolved.
- 26 -
| 6. | Risks relating to Interest Rates |
The monetary policies in China in the second half of 2021 are expected to maintain continuity, stability and sustainability, provide strong support for businesses, and effectively prevent and control financial risks; promote green and low-carbon development, put in place policy instruments to sustain carbon emission reduction, and advance development of clean energy, energy conservation and environmental protection, and carbon emission reduction technologies consistently, orderly and effectively. The fluctuation of interest rates of foreign currency debts, which account for an insignificant proportion of our total debts, will have limited impact on the Company.
The Company will pay close attention to changes in the domestic and overseas capital markets. While ensuring meeting funding requirements, the Company will focus on controlling financing costs by making timely adjustment to financing strategy, capitalizing on preferential policies for renewable energy utilization and carbon reduction, and reducing the risk of interest rate fluctuations.
SHARE CAPITAL STRUCTURE
As at 30 June 2021, total issued share capital of the Company amounted to 15,698,093,359 shares, of which 10,997,709,919 shares were domestic shares, representing 70.06% of the total issued share capital of the Company, and 4,700,383,440 shares were foreign shares, representing 29.94% of the total issued share capital of the Company. In respect of foreign shares, Huaneng Group through its wholly-owned subsidiaries China Hua Neng Group Hong Kong Limited and China Huaneng Group Treasury Management (Hong Kong) Limited, held 472,000,000 and 131,596,000 shares, representing 3.01% and 0.84% of the total issued share capital of the Company, respectively. In respect of domestic shares, Huaneng International Power Development Corporation (“HIPDC”) owned a total of 5,066,662,118 shares, representing 32.28%of the total issued share capital of the Company, while Huaneng Group held 1,555,124,549 shares, representing 9.91% of the total issued share capital of the Company. Through its controlling subsidiary China Huaneng Finance Corporation Limited, Huaneng Group held 61,194,199 shares, representing 0.39% of the total issued share capital of the Company. Other domestic shareholders held a total of 4,314,729,053 shares, representing 27.49% of the total issued share capital.
PURCHASE, SALE OR REDEMPTION OF SHARES
The Company and its subsidiaries did not sell any other types of securities and did not purchase or redeem its own shares or other securities in the first half of 2021.
- 27 -
SHAREHOLDINGS OF MAJOR SHAREHOLDERS
The following table summarises the shareholdings of the top ten shareholders of the Company’s shares as at 30 June 2021:
| Name of Shareholders | Total shareholdings as at end of the reporting period | Percentage of shareholding in total issued shares (%) | ||||||
| Huaneng International Power Development Corporation | 5,066,662,118 | 32.28 | % | |||||
| HKSCC Nominees Limited* | 4,094,234,802 | 26.08 | % | |||||
| China Huaneng Group Co., Ltd. | 1,555,124,549 | 9.91 | % | |||||
| Hebei Construction & Investment Group Co., Ltd. | 527,548,946 | 3.36 | % | |||||
| China Hua Neng Group Hong Kong Limited | 472,000,000 | 3.01 | % | |||||
| China Securities Finance Corporation Limited | 466,953,720 | 2.97 | % | |||||
| Jiangsu Guoxin Investment Group Limited | 416,500,000 | 2.65 | % | |||||
| Liaoning Energy Investment (Group) Limited Liability Company | 284,204,999 | 1.81 | % | |||||
| Fujian Investment & Development Group Co., Ltd. | 251,814,185 | 1.60 | % | |||||
| Dalian Municipal Construction Investment Company Limited | 151,500,000 | 0.97 | % | |||||
| * | HKSCC Nominees Limited acts as nominee of holders of H shares of the Company and its shareholdings in the Company represent the total number of H shares held by it as nominee of H shareholders. |
- 28 -
DIRECTORS’ AND SUPERVISORS’ RIGHT TO PURCHASE SHARES
The Company has adopted a code with the standard not lower than that of the Model Code for Securities Transactions by Directors of Listed Issuers as set out in Appendix 10 to the Rules Governing the Listing of Securities on the Stock Exchange of Hong Kong Limited (“Listing Rules”). Following enquiries made by the Company, all Directors and Supervisors confirmed that they have complied with the Code throughout the first half of 2021.
As at 30 June 2021, none of the directors, chief executive officer or supervisors of the Company had any interest or short position in the shares, underlying shares and/or debentures (as the case may be) of the Company or any of its associated corporations (within the definition of Part XV of the Securities and Futures Ordinance (“SFO”) which was required to be notified to the Company and the Stock Exchange of Hong Kong Limited (“Hong Kong Stock Exchange”) pursuant to Divisions 7 and 8 of Part XV of the SFO (including interest and short position which any such Director, chief executive officer or Supervisor is taken or deemed to have under such provisions of the SFO) or which was required to be entered in the register required to be kept by the Company pursuant to Section 352 of the SFO or which was otherwise required to be notified to the Company and the Hong Kong Stock Exchange pursuant to the Model Code for Securities Transactions by Directors of Listed Companies as contained in Appendix 10 to the Listing Rules.
PUBLIC FLOAT
As at the date of this announcement, the Company has maintained the prescribed public float under the Listing Rules and as agreed with the Hong Kong Stock Exchange, based on the information that is publicly available to the Company and within the knowledge of the directors of the Company.
DIVIDENDS
It was resolved by the Board not to distribute dividends for the first half of 2021.
- 29 -
DISCLOSURE OF MATERIAL EVENTS
Status on Change of Supervisor of the Supervisory Committee
On 9 June 2021, due to age reason, Ms. Zhang Xiaojun, a staff representative supervisor of the Company, applied to resign from the duties of the staff representative supervisor of the Tenth Session of the Supervisory Committee of the Company. Pursuant to relevant rules and regulations and the relevant stipulations of the Company, the staff of the Company has unanimously elected Mr. Zhu Tong to be the staff representative supervisor of the Tenth Session of the Supervisory Committee.
At the annual general meeting convened by the Company on 22 June 2021, Mr. Xia Aidong was elected as the supervisor of the Tenth Session of the Supervisory Committee of the Company. Mr. Ye Cai ceased to be the supervisor of the Company due to change of work.
CORPORATE GOVERNANCE
The Company always places emphasis on corporate governance. After years of experience and practice, the Company has gradually formed a standardised and enhanced governance structure, thereby establishing a sound and effective system that is appropriate to the Company’s own development requirements. The Company persists on maximising the benefits of the Company and its shareholders as a whole, treating all of its shareholders fairly and striving for the long-term, stable and increasing returns for shareholders of the Company.
During the reporting period, the Company has complied with the relevant provisions of Corporate Governance Code and Corporate Governance Report set out in Appendix 14 of the Listing Rules.
| (A) | Code of Corporate Governance |
In recent years, the Company adopted the following measures in order to strengthen corporate governance and enhance the Company’s operation quality:
- 30 -
| (1) | Enhancing and improving corporate governance |
In addition to complying with the provisions of the applicable laws, as a public company listed in three markets both domestically and internationally, the Company is subject to the regulations of the securities regulatory authorities of the three listing places and the supervision of investors at large. Accordingly, our fundamental principles are to adopt a corporate governance structure that balances and coordinates the decision-making powers, supervisory powers and operating powers, to act with honesty and integrity, and to operate in accordance with laws and regulations.
Over the years, the Board has formulated and implemented the Rules and Procedures of the General Meetings; Rules and Procedures of the Board of Directors Meetings; the Rules and Procedures of the Supervisory Committee Meetings; the Detailed Rules on the Work of the General Manager; the Detailed Rules on the Work of the Strategy Committee of the Board of Directors; the Detailed Rules on the Work of the Audit Committee of the Board of Directors; the Detailed Rules on the Work of the Nomination Committee of the Board of Directors; the Detailed Rules on the Work of the Remuneration and Appraisal Committee of the Board of Directors; the System on Work of Independent Directors, the System on Work of Independent Directors on the Annual Report and the Work Regulations on Annual Report for the Audit Committee, and amended relevant regulations and systems according to the applicable laws and the development needs of the Company.
- 31 -
The Board of Directors of the Company always regards the enhancement of corporate governance and the regulation of the three meetings as its own responsibility, continuously strengthens its own construction, and operates in compliance with laws and regulations, laying a solid foundation for the Company’s sustained and healthy development. In 2021, the Board of Directors of the Company has continuously led the Company to adhere to strategic leadership, closely focused on the “Four revolutions, One cooperation” new energy security strategy, thoroughly implement the new development concept, vigorously implement the green development strategy, and achieve carbon neutrality. The goal is to lead, formulate and implement the “14th Five-Year” carbon peak action plan, accelerate the development of new energy, and accelerate the optimization and upgrading of coal power structure, implement the three-year action plan for the reform of state-owned enterprises, adhere to the fundamental principle of improving the quality of listed companies, continue to strengthen the construction of corporate management systems and management capabilities, comprehensively promote high-quality development, and accelerate the pace of establishing a world-class listed power company with global competitiveness. At the same time, the Company will strictly abide by the Securities Law, Guidelines for the Governance of Listed Companies”, with the fundamental aim of maximizing the interests of shareholders, treat all shareholders fairly, maintain a positive, balanced and stable dividend policy, and manage well the relationship between its long-term development of the Company and the short-term benefits of its investors.
All members of the Board jointly perform the duties of corporate governance. During the reporting period, the Board has included the following in its scope of duties and authority:
| 1. | Establishing and reviewing the Company’s corporate governance policies and codes, and making such amendments as it deems necessary to ensure the effectiveness of such policies and codes; |
| 2. | Reviewing and supervising the training and sustained professional development of the Company’s directors and senior management; |
| 3. | Reviewing and supervising the Company’s policies and codes regarding the observance of laws and regulatory requirements; |
- 32 -
| 4. | Formulating, reviewing and supervising the codes of conduct and compliance handbook applicable to directors and employees; and |
| 5. | Reviewing the Company’s status on compliance with the Code on Corporate Governance Practices and the disclosures made in the Corporate Governance Report. |
| (2) | Enhancing and improving the information disclosure system |
The Company stresses on the importance of external information disclosure. The Company has established the Information Disclosure Committee which comprises the secretary to the Board of Directors, the chief accountant, managers of each functional department to be responsible for reviewing the Company’s regular reports. The Company has implemented the system of holding regular information disclosure meetings every Monday, chaired by the secretary to the Board of Directors and attended by relevant business departments, to notify and discuss major issues relating to the Company’s operations, which provide a guarantee for the Company to perform its information disclosure obligations timely. The Company has successively formulated and implemented the relevant information disclosure system, and has made timely amendments thereto according to regulatory requirements. The current functioning systems include the Measures on Information Disclosure Management, the Measures on Related Transaction Management, Measures for the Administration of Insiders, the Measures on Investor Relations Management, the Detailed Rules on the Work of the Information Disclosure Committee, Management Measures for Pursuing Responsibility regarding Material Errors in Information Disclosure of Annual Report, etc.. In the first half of 2021, in accordance with relevant regulatory rules and requirements and in conjunction with the Company’s actual situation, the Measures on Information Disclosure Management and the Measures for the Administration of Insiders of the Company have correspondingly been revised to ensure that the system of the Company meets with the latest regulatory requirements. The above measures and system ensure the regulated operation of the Company, strengthen the truthfulness, accuracy, completeness and the timely disclosure of information, and at the same time enhance the quality as well as transparency of the information disclosure.
- 33 -
Relevant departments of the Company compiled answers (and subsequent updates) to questions regarding the hot topics of market concerns, and the Company’s production, operation and operating results in a timely manner. The replies shall become the basis of external communication upon the approval of the Company’s management and the authorised representatives of the Information Disclosure Committee. In addition, the Company engages professional personnel to conduct specialized training for the staff of the Company who are responsible for information disclosure on an irregular basis in order to continuously enhance their expertise.
| (3) | Regulating financial management system, strengthening internal control |
The credibility of a listed company, to a large extent, relates to the quality of the preparation of financial statements and a regulated operation of financial activities. In 2021, the Company continues to adhere to the principle of good faith and fair treatment to its shareholders and makes a lot of detailed work in preparing the financial reports and regulated financial operations, including:
| 1. | In order to strictly implement the accounting rules, accounting standards and accounting systems, to strengthen accounting and accounts supervision, and to truthfully and fairly reflect the financial position, operating results and cash flow, the Company has formulated the Measures on Accounting, the Management Measures on Financial Accounting Reports, the Measures on Fixed Assets Management, Lists of Fixed Assets, the Measures on Cost Management and the Joint Audit Management Regulations on Financial Accounting and other rules and regulations. The Company’s Board, the Supervisory Committee and the Audit Committee have reviewed the Company’s financial reports on a regular basis and the Company has fulfilled the requirements of making the Chairman, the President and the Chief Accountant responsible for the truthfulness and completeness of the financial reports. |
- 34 -
| 2. | In regard to fund management, the Company has formulated a number of management measures including the Measures on Financial Management, the Measures on the Management of the Income and Expenditure of the Funds, the Measures on the Use and Management of Large Amount by Headquarter of the Company, the Measures on the Management of Bills of Exchange, the Measures on Management of Fund Raised, Rules on the Management of Transactions Involving Financial Derivatives, the Measures on the Management of Provision of Security to Third Parties and the Measures for Regulating Fund Transfers with the Related Parties. The Company’s Articles of Association also set out provisions relating to loans, guarantees and investment. In the annual reports of the Company over the previous years, the Company has engaged certified accountants to conduct auditing on the use of funds by the controlling shareholders and other related parties, and issue specific statements according to the requirements of the China Securities Regulatory Commission (“China Securities Regulatory Commission”) and the Shanghai Stock Exchange (“Shanghai Stock Exchange”) for confirmation that there has not been any violation of rules relating to the use of funds. Moreover, the Company also conducted quarterly checking and clearing with related parties in relation to the operational fund transfers in order to ensure the safety of funds. |
| 3. | The overall objective of internal control of the Company is to promote implementation of the corporate strategy. Specific goals are to maintain lawful operation and management of the Company, asset safety, and truthfulness and completeness of financial reports and related information, thus promoting the overall enhancement of operating efficiency and actual effect. |
- 35 -
The Company has comprehensively sort out internal and external risks and various business processes, and completed the “Internal Control Manual”. From 5 aspects of environment control, risk assessment, process control, information and communication and monitoring, the sixth version of the “Internal Control Manual” currently in use by the Company detailed 25 business processes in revenue, material procurement, fuel procurement and capital management, and 19 soft elements including organizational structures, human resources management, antifraud and risk management, thereby comprehensively elaborating the Company’s guiding principles and policies, work procedures and job duties of various posts, regulating the standard procedures of various business processes and realising a streamlined system. The Company has compiled the “Internal Control Evaluation Handbook”, clarifying the three-tier internal control evaluation management system, the internal control evaluation mode that cooperates with daily evaluation and key supervision, standardized internal control evaluation procedures, evaluation methods, defect defining procedures and standards, and realizes internal control and standardization of evaluation. The Company conducts annual assessment on the applicability and effectiveness of the above system and regularly conducts revision and perfection in order to realise dynamic maintenance of the internal control system.
- 36 -
For the purpose of risk identification, the Company in the “Internal Control Manual” stipulates the corresponding control measures and defines key control points. Through the implementation of the “one post for one item system” at each control point, the control responsibility is divided to every post at various levels so that internal control and job responsibilities are combined and all members of staff can participate in the construction of internal control. The Company has implemented the internal control routine evaluation mechanism, set up the post of internal control evaluators in each department and subordinate unit respectively, conducted monthly internal control evaluation, and established a three- tier evaluation quality supervision mechanism respectively at the three levels of the Company, regional offices and basic level units by way of the internal control management system in order to conduct real-time tracking of the implementation of internal control. During the first half of 2021, the Company has successfully completed a six-month internal control routine evaluation, thus effectively protecting and promoting the sustained and healthy development of the businesses of the Company and realising the stable operation of the internal control system. The Company has combined the new requirements and new changes in business and management and constantly advanced experience and common issues, and launched comprehensive and multilevel internal control training each year, and widely publicised internal control concepts and knowledge, thus continuously optimising the internal control environment.
The internal control and management departments, internal audit department and external auditors regularly report the internal control work situation to the Audit Committee of the Board of Directors respectively, thus ensuring the continued and effective operation of the internal control system. During the first half of 2021, the Company took the realization of internal control objectives as the fundamental purpose, and focused on the current key tasks of the Company’s internal control, comprehensively revised and officially released the “Internal Control Objective Assessment Management Measures”, so as to improve and adjust the assessment content and assessment methods, and give full play to the “baton role” of internal control and assessment. The Company conducts internal control target assessment every year, and the assessment results are fulfilled in a timely manner, which effectively guides units at all levels to pay attention to the quality of internal control work, and earnestly realize the in-depth goal of promoting management through internal control.
- 37 -
Upon full assessment, the management of the Company is of the opinion that the internal control system of the Company is sound and effective.
| (b) | Securities transactions by Directors |
As the Company is listed in three jurisdictions, the Company has strictly complied with the relevant restrictive provisions on securities transactions by directors imposed by the regulatory authorities of the US, Hong Kong and China’s Mainland and we insist on the principle of complying with the strictest provision, that is, abiding by the strictest provision among three jurisdictions. We have adopted the Model Code for Securities Transactions by Directors of Listed Issuers set out in Appendix 10 to the Listing Rules as the model code for securities dealings by directors of the Company. During the first half of 2021, the Company has also revised the Management Rules in respect of the Shares of the Company held by the Directors, Supervisors and Senior Management of Huaneng Power International, Inc. according to the relevant regulatory requirements, and strictly requiring the transfer of shares of the Company to be in accordance with the Company Law and relevant systems, prohibiting those who are in possession of securities transaction inside information using inside information in securities trading; and setting out detailed rules for those who are in possession of inside information. Following a specific enquiry on all the directors, supervisors and senior management of the Company, all the directors, supervisors and senior management currently do not hold any shares of the Company and there is no material contract in which the directors, supervisor and senior management directly or indirectly have material interests.
| (c) | Board of Directors |
The Board of Directors of the Company comprises of 15 members. Of the members of the tenth session of the board of directors, Mr. Zhao Keyu as the Chairman; Mr. Zhao Keyu and Mr. Zhao Ping as the Executive Directors; Mr. Huang Jian, Mr. Wang Kui, Mr. Lu Fei, Mr. Teng Yu, Mr. Mi Dabin, Mr. Cheng Heng, Mr. Li Haifeng and Mr. Lin Chong as the Non-executive Directors; and Mr. Xu Mengzhou, Mr. Liu Jizhen, Mr. Xu Haifeng, Mr. Zhang Xianzhi and Mr. Xia Qing as the Independent Non-executive Directors of the Company.
- 38 -
The Board of Directors of the Company has held five meetings during the reporting period, including regular meetings and ad hoc meetings. For details, please see the relevant announcements.
Details of the attendance of directors at the board meetings are as follows:
| Names | Number of meetings to be attended | Number of meetings attended in person | Number of meetings attended by proxy | Rate of Attendance (%) | ||||||||||||
| Executive Directors | ||||||||||||||||
| Zhao Keyu | 5 | 5 | 0 | 100 | % | |||||||||||
| Zhao Ping | 5 | 5 | 0 | 100 | % | |||||||||||
| Non-executive Directors | ||||||||||||||||
| Huang Jian | 5 | 5 | 0 | 100 | % | |||||||||||
| Wang Kui | 5 | 4 | 1 | 100 | % | |||||||||||
| Lu Fei | 5 | 4 | 1 | 100 | % | |||||||||||
| Teng Yu | 5 | 4 | 1 | 100 | % | |||||||||||
| Mi Dabin | 5 | 4 | 1 | 100 | % | |||||||||||
| Cheng Heng | 5 | 4 | 1 | 100 | % | |||||||||||
| Li Haifeng | 5 | 5 | 0 | 100 | % | |||||||||||
| Lin Chong | 5 | 5 | 0 | 100 | % | |||||||||||
| Independent non- executive Directors | ||||||||||||||||
| Xu Mengzhou | 5 | 5 | 0 | 100 | % | |||||||||||
| Liu Jizhen | 5 | 3 | 2 | 100 | % | |||||||||||
| Xu Haifeng | 5 | 5 | 0 | 100 | % | |||||||||||
| Zhang Xianzhi | 5 | 5 | 0 | 100 | % | |||||||||||
| Xia Qing | 5 | 5 | 0 | 100 | % | |||||||||||
- 39 -
As stated in the previous Corporate Governance Reports, the Company’s Articles of Association set out in detail the duties and operational procedures of the Board (please refer to the Company’s Articles of Association for details). The Board of the Company holds regular meetings to hear the reports on the Company’s operating results and makes timely decisions. Material decisions on operation shall be discussed and approved by the Board. Ad hoc meetings may be held if necessary. Board meetings include regular meetings and ad hoc meetings. Regular meetings of the Board include: annual meeting, first quarterly meeting, half-yearly meeting and third quarterly meeting.
All arrangements for regular meetings have been notified to all directors at least 14 days prior to the meeting and the Company has ensured that each director thoroughly understood the agenda of the meeting and fully expressed his/her opinions, while all Independent Non-executive Directors expressed their independent directors’ opinions on their respective duties. Minutes have been taken for all the meetings and filed at the Office of the Board.
Moreover, the Independent Non-executive Directors of the Company have submitted their independent non-executive director confirmation letters of 2021 according to the requirements of the Listing Rules.
The Directors considered that they have complied with the laws and regulations, and provisions of the Articles of Association, and have actively performed the duties faithfully and diligently. Apart from regular and ad hoc meetings, the Directors read the briefs of the Company on a regular basis, the Company’s financial position and operating results and signing and performance of material agreements. The Directors reviewed the reports, data etc. of the Company regularly to understand the situation on production operation of the Company. Through on-site investigation, the independent Directors provided practical resolutions to the Company. All specialized committees under the Board actively carried out works and provided recommendations and policies which formed the basis of accurate policies for the Board.
- 40 -
During the period when the Board was not in session, the Chairman discharged part of the duties of the Board, including but not limited to (1) to examine and approve the proposals in respect of establishing or cancelling development and construction projects; (2) to examine and approve proposals of the in relation to the appointment, removal and transfer of managers of various departments of the Company and managers of external branches; (3) to examine and approve plans on the use of significant funds; (4) to examine and approve proposals on the establishment or cancellation of branch companies or branch organs; and (5) to examine and approve other major issues.
The Board has summarised the implementation and execution of work during the reporting period taking into consideration of opinions of the Supervisory Committee and the Senior Management of the Company. The Board is of the opinion that it has effectively fulfilled its duties to safeguard the interests of the Company and its shareholders.
Directors who attended the 2020 annual general meeting of the Company were Zhao Keyu (Chairman), Zhao Ping (Director), Huang Jian (Director), Li Haifeng (Director), Lin Chong (Director), Xu Mengzhou (Independent Director), Xu Haifeng (Independent Director), Zhang Xianzhi (Independent Director) and Xia Qing (Independent Director).
| (d) | Chairman and President |
The Company shall have a Chairman and a President who shall perform their duties respectively and separately according to the Articles of Association.
The division of duties of the Board and the senior management remained the same as disclosed in the previous Corporate Governance Reports.
- 41 -
| (e) | Non-executive Directors |
According to the Articles of Association, the term of office of each member of the Board of the Company shall not exceed three years (inclusive) and the members may be eligible for re-election. However, the term of office of Independent Non-executive Directors shall not exceed six years (inclusive) according to the relevant regulations of the China Securities Regulatory Commission.
The respective terms of office of the Non-executive Directors are as follows:
| Name of Non-executive Directors | Term of office | |
| Huang Jian | 16 June 2020-2023 | |
| Wang Kui | 16 June 2020-2023 | |
| Lu Fei | 16 June 2020-2023 | |
| Teng Yu | 16 June 2020-2023 | |
| Mi Dabin | 16 June 2020-2023 | |
| Cheng Heng | 16 June 2020-2023 | |
| Li Haifeng | 22 December 2020-2023 | |
| Lin Chong | 16 June 2020-2023 |
| (f) | Directors’ Remuneration |
According to the relevant PRC laws and the Articles of Association, the Board has established the Remuneration and Appraisal Committee which operates in accordance with the Detailed Rules on the Work of the Remuneration and Appraisal Committee and is mainly responsible for studying the appraisal standards of the directors and senior management personnel of the Company, conducting appraisals and making proposals; responsible for studying and examining the remuneration policies and proposals of the directors and senior management personnel of the Company. The Remuneration and Appraisal Committee will review and submit annual total wages to the board of directors annually. Each of the Executive Directors has signed a director’s service contract in accordance with the requirement of the Stock Exchange.
- 42 -
Members of the tenth session of the Remuneration and Appraisal Committee of the board of directors are Mr. Xu Mengzhou, Mr. Zhao Ping, Mr. Cheng Heng, Mr. Li Haifeng, Mr. Liu Jizhen, Mr. Xu Haifeng and Mr. Zhang Xianzhi; among whom Mr. Xu Mengzhou, Mr. Liu Jizhen, Mr. Xu Haifeng and Mr. Zhang Xianzhi are Independent Non-executive Directors and Mr. Xu Mengzhou is the chairman of the committee.
The Remuneration and Appraisal Committee under the Board operates in accordance with the Detailed Rules on the Work of the Remuneration and Appraisal Committee. The Remuneration and Appraisal Committee convened the first meeting in 2021 on 22 March 2021, at which the Report of Total Wage Expenses was reviewed and the Company’s arrangement for the total wage in 2021 was approved. In the second half of 2021, the Remuneration and Appraisal Committee will carry out the work according to the actual situation and the above Detailed Rules at appropriate time.
During the reporting period, the attendance of meetings of the Remuneration and Appraisal Committee of the Company’s Board was as follows:
| Name of meeting | Date of meeting | Members who attended the meeting in person | Members who attended the meeting by proxy | |||
| First meeting of the Remuneration and Appraisal Committee of the Tenth Session of the Board in 2021 | 22 March 2021 | Xu Mengzhou, Zhao Ping, Cheng Heng, Li Haifeng, Liu Jizhen, Xu Haifeng and Zhang Xianzhi | – |
- 43 -
| (g) | Nomination of Directors |
According to the relevant PRC laws and the relevant provisions of the Articles of Association, the Board has established the Nomination Committee. Governed by the Detailed Rules on the Works of the Nomination Committee, the Committee is mainly responsible for studying the selection standards and procedures for candidates for directors and senior management personnel of the Company according to the directors’ qualifications requirements under the Company Law and Securities Law and the needs of the operational management of the Company, and making proposals thereon to the Board; searching for qualified candidates for directors and suitable persons for senior management personnel on a wide basis; and examining the candidates for directors and suitable persons for senior management personnel and making proposals thereon. Currently, the nomination of the candidates for directors of the Company is mainly made by shareholders. The nominations, after examination of the relevant qualification by the Nomination Committee, will be submitted to the Board of Directors. The President of the Company was appointed by the Board and the candidates for the Vice President and management were nominated by the President. Such nominations, after examination of the relevant qualification by the Nomination Committee, will be submitted to the Board of Directors.
Members of the tenth session of the Nomination Committee of the board of directors are Mr. Liu Jizhen, Mr. Zhao Keyu, Mr. Mi Dabin, Mr. Lin Chong, Mr. Xu Mengzhou, Mr. Zhang Xianzhi and Mr. Xia Qing, among whom Mr. Liu Jizhen, Mr. Xu Mengzhou, Mr. Zhang Xianzhi and Mr. Xia Qing are Independent Non-executive Directors and Mr. Liu Jizhen is the chairman of the committee.
During the reporting period, the Nomination Committee of the Company’s Board did not convene any meeting.
| (h) | Appointment of Auditors |
As approved at the 2020 annual general meeting, Ernst & Young Hua Ming LLP was appointed as the Company’s domestic and U.S. 20F Annual Report auditor for 2021, and Ernst & Young, registered public interest entity auditor, was appointed as the Hong Kong auditor of the Company for 2021.
- 44 -
| (i) | Audit Committee |
According to the requirements of the regulatory authorities of the jurisdictions where the Company is listed and the relevant provisions of the Articles of Association, the Board has established the Audit Committee. Governed by the Detailed Rules on the work of the Audit Committee, the Audit Committee is mainly responsible for assisting the Board in the supervision of:
| (1) | the accuracy of the Company’s financial statements; |
| (2) | the Company’s compliance with laws and regulations; |
| (3) | the qualification and independence of the Company’s independent auditors; |
| (4) | the performance of the Company’s independent auditors and internal auditing departments of the Company; and |
| (5) | the control and management of the related party transactions of the Company. |
The Company convenes four regular meetings of the Audit Committee of the Board of Directors each year, at least two of which will be conducted with the Company’s external auditors to listen to reports on audit planning, work arrangement and audit works generally. The Board has formulated the Management Rules on Whistle-Blowing through Hotlines and Mailboxes, and, pursuant to which the Audit Committee will be responsible for the management of the whistle-blowing hotlines and mailboxes.
Members of the Audit Committee comprises of five directors. Members of the tenth session of the Audit Committee of the board of directors are, namely, Mr. Zhang Xianzhi, Mr. Xu Mengzhou, Mr. Liu Jizhen, Mr. Xu Haifeng and Mr. Xia Qing, among whom Mr. Zhang Xianzhi is the chairman of the committee.
- 45 -
During the reporting period, the Audit Committee has held three meetings. As per Audit Committee’s duties, the Audit Committee has communicated separately and respectively with the Company’s counsels, external auditors, management and the relevant functional departments of the Company. With the understandings on the applicable laws and regulations of those jurisdictions in which the shares of the Company are listed, the anti-fraud position in the Company, the recruitment of staff, the implementation and execution of internal control mechanisms, the audit work carried out by external auditors and the responsible officers of the audit department, the Audit Committee has rendered their views and suggestions.
During the reporting period, the attendance of meetings of members of the Audit Committee was as follows:
| Name of meeting | Date of meeting | Members who attended the meeting in person | Members who attended the meeting by proxy | |||
| First meeting of the Audit Committee of the Tenth Session of the Board in 2021 | 26 February 2021 | Zhang Xianzhi, Xu Mengzhou, Liu Jizhen, Xu Haifeng and Xia Qing | – | |||
| Second meeting of the Audit Committee of the Tenth Session of the Board in 2021 | 22 March 2021 | Zhang Xianzhi, Xu Mengzhou, Xu Haifeng and Xia Qing | – | |||
| Third meeting of the Audit Committee of the Tenth Session of the Board in 2021 | 26 April 2021 | Zhang Xianzhi, Xu Mengzhou, Liu Jizhen, Xu Haifeng and Xia Qing | – |
- 46 -
| (j) | Responsibility assumed by the Directors in relation to the financial statements |
The Directors of the Company confirm that they shall assume the relevant responsibility in relation to the preparation of the financial statements of the Company, ensure that the preparation of the financial statements of the Company complies with the relevant laws and regulations and the applicable accounting standards and also warrant that the financial statements of the Company will be published in a timely manner.
| (k) | Senior management’s interests in shares |
None of the senior management of the Company holds any shares of the Company.
| (l) | Strategy Committee |
For compliance with the relevant requirements of the regulations in the jurisdictions where the shares of the Company are listed as well as the Articles of Association of the Company, the Board has established a Strategy Committee. Governed by the Detailed Rules on the Work of the Strategy Committee, the Strategy Committee is primarily responsible for:
| (1) | reviewing and advising on the Company’s long-term strategic development plan; |
| (2) | reviewing and advising on the major fund raising proposals that need to be approved by the Board; |
| (3) | reviewing and advising on the major production and operating projects that need to be approved by the Board; |
| (4) | studying and advising on the matters that would significantly affect the development of the Company; |
| (5) | examining the implementation of the abovementioned matters; |
- 47 -
| (6) | comprehensive risk management of the Company to improve the Company’s overall risk resistance; and |
| (7) | other matters as requested by the Board of Directors. |
The tenth session of the Strategy Committee of the board of directors comprises of seven directors, namely, Mr. Zhao Keyu, Mr. Zhao Ping, Mr. Huang Jian, Mr. Wang Kui, Mr. Lu Fei, Mr. Liu Jizhen and Mr. Xu Haifeng, of whom Mr. Liu Jizhen and Mr. Xu Haifeng are Independent Non-executive Directors. Mr. Zhao Keyu is the chairman of the Strategy Committee.
The risk management work of the Company has been conducted in an orderly manner, which effectively controlled each risk and successively strengthened and enhanced the Company’s internal controls and risk management system.
| (m) | Directors’ and senior management’s training |
The Company organises its Directors and Supervisors to attend the trainings provided by regulatory authorities every year. During the reporting period, the directors and supervisors of the Company attended training of directors and supervisors according to regulatory requirements. Mr. Zhao Keyu, Chairman of the Board of Directors of the Company, and Mr. Zhao Ping, Director and President of the Company, participated in the Special Training on State-owned listed companies by the State-owned Assets Supervision and Administration Commission.
The Company conducts introduction by legal counsels of all three listing jurisdictions specifically to all Independent Non-executive Directors of the Audit Committee of the Company twice a year with respect to the updated regulatory laws, the application of relevant systems to the Company and the Company’s performance of the rules and regulations in places where the Company’s shares are listed.
The Company attaches importance to the training and continuing development of senior management. The Company organises members of senior management to participate the training courses provided by relevant State authorities, industrial managing authorities and industrial associations.
- 48 -
REVIEW BY THE AUDIT COMMITTEE
The interim results of 2021 have been reviewed by the Audit Committee of the Company.
LEGAL PROCEEDINGS
As at 30 June 2021, the Company and its subsidiaries were not involved in any material litigation or arbitration and no material litigation or claim of material importance was pending or threatened against or by the Company as far as the Company is aware.
DOCUMENTS FOR INSPECTION
The Company will also file the interim report in Form 6-K with the US Securities and Exchange Commission. Copies of the interim report for 2021 will be available at the following addresses and websites:
| PRC | Huaneng Power International, Inc. |
| Huaneng Building | |
| 6 Fuxingmennei Street Xicheng District Beijing | |
| The People’s Republic of China | |
| Telephone Number: (8610) 6322 6999 | |
| Fax Number: (8610) 6322 6888 | |
| Website: http://www.hpi.com.cn | |
| Hong Kong | Wonderful Sky Financial Group Limited |
| 9th Floor, Central Plaza, | |
| 99 Queen’s Road Central, Hong Kong | |
| Tel: (852) 2851 1038 | |
| Fax: (852) 2851 1352 | |
| Websites of the Company | http://www.hpi.com.cn |
- 49 -
By Order of the Board
Huaneng Power International, Inc.
Zhao Keyu
Chairman
As at the date of this announcement, the directors of the Company are:
Zhao Keyu (Executive Director) Zhao Ping (Executive Director) Huang Jian (Non-executive Director) Wang Kui (Non-executive Director) Lu Fei (Non-executive Director) Teng Yu (Non-executive Director) Mi Dabin (Non-executive Director) Cheng Heng (Non-executive Director) Li Haifeng (Non-executive Director) Lin Chong (Non-executive Director) | Xu Mengzhou (Independent Non-executive Director) Liu Jizhen (Independent Non-executive Director) Xu Haifeng (Independent Non-executive Director) Zhang Xianzhi (Independent Non-executive Director) Xia Qing (Independent Non-executive Director) |
Beijing, the PRC
28 July 2021
- 50 -
| A. | FINANCIAL INFORMATION EXTRACTED FROM INTERIM CONDENSED CONSOLIDATED FINANCIAL STATEMENTS PREPARED UNDER IFRS |
INTERIM CONSOLIDATED STATEMENT OF FINANCIAL POSITION (UNAUDITED)
AS AT 30 JUNE 2021
(Amounts expressed in thousands of RMB)
| Notes | As at 30 June 2021 | As at 31 December 2020 | ||||||||||
| ASSETS | ||||||||||||
| Non-current assets | ||||||||||||
| Property, plant and equipment | 303,091,962 | 300,171,142 | ||||||||||
| Right-of-use assets | 17,279,212 | 18,292,074 | ||||||||||
| Investments in associates and joint ventures | 22,667,157 | 22,375,377 | ||||||||||
| Investment properties | 647,247 | 647,471 | ||||||||||
| Other equity instrument investments | 771,922 | 664,946 | ||||||||||
| Power generation licenses | 3,851,765 | 3,954,983 | ||||||||||
| Mining rights | 1,611,486 | 1,611,486 | ||||||||||
| Deferred income tax assets | 2,739,025 | 2,699,395 | ||||||||||
| Derivative financial assets | 150,618 | 74,554 | ||||||||||
| Goodwill | 14,459,643 | 14,738,016 | ||||||||||
| Other non-current assets | 20,450,807 | 18,537,583 | ||||||||||
| Total non-current assets | 387,720,844 | 383,767,027 | ||||||||||
| Current assets | ||||||||||||
| Inventories | 8,682,327 | 6,602,459 | ||||||||||
| Other receivables and assets | 4 | 9,023,798 | 7,308,077 | |||||||||
| Accounts and notes receivable | 5 | 39,262,991 | 38,215,715 | |||||||||
| Contract assets | 27,078 | 29,678 | ||||||||||
| Derivative financial assets | 684,563 | 110,179 | ||||||||||
| Bank balances and cash | 14,135,503 | 13,871,523 | ||||||||||
| Total current assets | 71,816,260 | 66,137,631 | ||||||||||
Total assets | 459,537,104 | 449,904,658 | ||||||||||
- 51 -
| Notes | As at 30 June 2021 | As at 31 December 2020 | ||||||||||
| EQUITY AND LIABILITIES | ||||||||||||
| Capital and reserves attributable to equity holders of the Company | ||||||||||||
| Share capital | 15,698,093 | 15,698,093 | ||||||||||
| Other equity instruments | 47,939,706 | 48,419,779 | ||||||||||
| Capital surplus | 25,837,813 | 26,162,550 | ||||||||||
| Surplus reserves | 8,140,030 | 8,140,030 | ||||||||||
| Currency translation differences | (1,047,797 | ) | (738,927 | ) | ||||||||
| Retained earnings | 32,297,355 | 32,164,398 | ||||||||||
| 128,865,200 | 129,845,923 | |||||||||||
| Non-controlling interests | 24,152,141 | 21,770,275 | ||||||||||
| Total equity | 153,017,341 | 151,616,198 | ||||||||||
| Non-current liabilities | ||||||||||||
| Long-term loans | 117,455,834 | 112,077,395 | ||||||||||
| Long-term bonds | 7 | 31,641,364 | 20,382,405 | |||||||||
| Lease liabilities | 4,147,776 | 3,805,635 | ||||||||||
| Deferred income tax liabilities | 2,882,328 | 3,002,527 | ||||||||||
| Derivative financial liabilities | 107,654 | 188,139 | ||||||||||
| Other non-current liabilities | 6,304,735 | 4,784,268 | ||||||||||
| Total non-current liabilities | 162,539,691 | 144,240,369 | ||||||||||
- 52 -
| Notes | As at 30 June 2021 | As at 31 December 2020 | ||||||||||
| EQUITY AND LIABILITIES (CONTINUED) | ||||||||||||
| Current liabilities | ||||||||||||
| Accounts payable and other liabilities | 8 | 44,303,543 | 42,755,361 | |||||||||
| Contract liabilities | 1,948,060 | 2,903,296 | ||||||||||
| Taxes payable | 1,688,218 | 2,044,869 | ||||||||||
| Dividends payable | 4,366,260 | 694,854 | ||||||||||
| Derivative financial liabilities | 46,707 | 106,862 | ||||||||||
| Short-term bonds | 9 | – | 5,002,877 | |||||||||
| Short-term loans | 68,461,611 | 66,311,160 | ||||||||||
| Current portion of long-term loans | 17,099,571 | 19,808,313 | ||||||||||
| Current portion of long-term bonds | 7 | 5,342,920 | 12,678,511 | |||||||||
| Current portion of lease liabilities | 590,975 | 1,676,711 | ||||||||||
| Current portion of other non-current liabilities | 132,207 | 65,277 | ||||||||||
| Total current liabilities | 143,980,072 | 154,048,091 | ||||||||||
| Total liabilities | 306,519,763 | 298,288,460 | ||||||||||
| Total equity and liabilities | 459,537,104 | 449,904,658 | ||||||||||
- 53 -
INTERIM CONSOLIDATED STATEMENT OF COMPREHENSIVE
INCOME (UNAUDITED)
FOR THE SIX MONTHS ENDED 30 JUNE 2021
(Amounts expressed in thousands of RMB, except per share data)
For the six months ended 30 June | ||||||||||||
| Notes | 2021 | 2020 | ||||||||||
| Operating revenue | 3 | 95,115,588 | 79,126,811 | |||||||||
| Tax and levies on operations | (941,226 | ) | (887,000 | ) | ||||||||
| 94,174,362 | 78,239,811 | |||||||||||
| Operating expenses | ||||||||||||
| Fuel | (57,379,823 | ) | (40,830,500 | ) | ||||||||
| Maintenance | (1,777,587 | ) | (1,647,153 | ) | ||||||||
| Depreciation | (11,093,807 | ) | (10,842,692 | ) | ||||||||
| Labour | (6,885,714 | ) | (5,566,132 | ) | ||||||||
| Service fees on transmission and transformer facilities of HIPDC | (47,947 | ) | (48,774 | ) | ||||||||
| Purchase of electricity | (2,608,897 | ) | (2,348,127 | ) | ||||||||
| Others | 11 | (5,208,207 | ) | (4,528,387 | ) | |||||||
| Total operating expenses | (85,001,982 | ) | (65,811,765 | ) | ||||||||
| Profit from operations | 9,172,380 | 12,428,046 | ||||||||||
| Interest income | 135,032 | 154,503 | ||||||||||
| Financial expenses, net | ||||||||||||
| Interest expense | (4,258,960 | ) | (4,854,070 | ) | ||||||||
| Exchange loss and bank charges, net | (64,301 | ) | (79,919 | ) | ||||||||
| Total financial expenses, net | (4,323,261 | ) | (4,933,989 | ) | ||||||||
| Share of profits and losses of associates and joint ventures | 886,779 | 1,049,494 | ||||||||||
| (Loss)/gain on fair value changes of financial assets/liabilities | (28 | ) | 255 | |||||||||
| Other investment loss | (943 | ) | (102,432 | ) | ||||||||
- 54 -
For the six months ended 30 June | ||||||||||||
| Notes | 2021 | 2020 | ||||||||||
| Profit before income tax expense | 11 | 5,869,959 | 8,595,877 | |||||||||
| Income tax expense | 12 | (1,056,714 | ) | (1,895,443 | ) | |||||||
| Net profit | 4,813,245 | 6,700,434 | ||||||||||
| Other comprehensive income/(loss), net of tax | ||||||||||||
| Items that will not be reclassified to profit or loss: | ||||||||||||
| Fair value changes of other equity instrument investments | 4,180 | (789 | ) | |||||||||
| Share of other comprehensive loss of joint ventures and associates | (34,206 | ) | (131,391 | ) | ||||||||
| Income tax effect | (1,045 | ) | 197 | |||||||||
| Items that may be reclassified subsequently to profit or loss: | ||||||||||||
| Share of other comprehensive income of joint ventures and associates | 980 | 1,008 | ||||||||||
| Cash flow hedges: | ||||||||||||
| Effective portion of changes in fair value of hedging instruments arising during the period | 991,452 | (454,787 | ) | |||||||||
| Reclassification adjustments for (gains)/loss included in the profit or loss | (237,742 | ) | 315,632 | |||||||||
| Exchange differences on translation of foreign operations | (305,307 | ) | (421,727 | ) | ||||||||
| Income tax effect | (128,132 | ) | 23,656 | |||||||||
| Other comprehensive income/(loss), net of tax | 290,180 | (668,201 | ) | |||||||||
| Total comprehensive income | 5,103,425 | 6,032,233 | ||||||||||
- 55 -
For the six months | ||||||||||||
Notes | 2021 | 2020 | ||||||||||
Net profit attributable to: | ||||||||||||
| – Equity holders of the Company | 4,018,540 | 5,441,025 | ||||||||||
| – Non-controlling interests | 794,705 | 1,259,409 | ||||||||||
| Total comprehensive income attributable to: | ||||||||||||
| – Equity holders of the Company | 4,287,417 | 4,921,908 | ||||||||||
| – Non-controlling interests | 816,008 | 1,110,325 | ||||||||||
| Earnings per share attributable to the ordinary shareholders of the Company (expressed in RMB per share) | ||||||||||||
| – Basic and diluted | 13 | 0.19 | 0.30 | |||||||||
- 56 -
NOTES TO THE UNAUDITED INTERIM CONDENSED CONSOLIDATED
FINANCIAL INFORMATION
FOR THE SIX MONTHS ENDED 30 JUNE 2021
(Amounts expressed in thousands of RMB unless otherwise stated)
| 1. | BASIS OF PREPARATION |
This unaudited interim condensed consolidated financial information (“interim financial information”) for the six months ended 30 June 2021 has been prepared in accordance with the applicable disclosure provisions of the Rules Governing the Listing of Securities on The Stock Exchange of Hong Kong Limited, and International Accounting Standard (“IAS”) 34 “Interim Financial Reporting”. This interim financial information should be read in conjunction with the annual financial statements for the year ended 31 December 2020, which have been prepared in accordance with International Financial Reporting Standards (“IFRSs”) issued by the International Accounting Standards Board (the “IASB”). This interim financial information was approved for issuance on 27 July 2021.
The accounting policies adopted in the preparation of the interim financial information are consistent with those applied in the preparation of the Group’s annual consolidated financial statements for the year ended 31 December 2020, except for the adoption of the revised IFRSs effective as of 1 January 2021. Details of any changes in accounting policies are set out in note 2.
The preparation of interim financial information in conformity with IAS 34 requires management to make judgements, estimates and assumptions that affect the application of policies and reported amounts of assets and liabilities, income and expenses on a year to date basis. Actual results may differ from these estimates.
This interim financial information contains condensed consolidated financial statements and selected explanatory notes. The notes include an explanation of events and transactions that are significant to an understanding of the changes in financial position and performance of the Group since the 2020 annual financial statements. The interim condensed consolidated financial statements and notes thereto do not include all the information required for a full set of financial statements prepared in accordance with IFRSs.
The financial information relating to the financial year ended 31 December 2020 that is included in the interim financial information as comparative information does not constitute the Company’s annual consolidated financial statements for that financial year but is derived from those financial statements. The annual consolidated financial statements for the year ended 31 December 2020 are available from the Company’s registered office. The auditors have expressed an unqualified opinion on those financial statements in their report dated 23 March 2021.
As at and for the six months ended 30 June 2021, a portion of the Group’s funding requirements for capital expenditures was partially satisfied by short-term financing. Consequently, as at 30 June 2021, the Group had net current liabilities of approximately Renminbi Yuan (“RMB”) 72,164 million. Taking into consideration of the Group’s undrawn available banking facilities of approximately RMB318,971 million as at 30 June 2021, the Group expects to refinance certain of its short-term loans and bonds and also considers alternative sources of financing, where applicable and when needed. Therefore, the directors of the Company are of the opinion that the Group will be able to meet its liabilities as they fall due within the next twelve months and accordingly, the interim financial information is prepared on a going concern basis.
- 57 -
| 2. | PRINCIPAL ACCOUNTING POLICIES |
The accounting policies adopted in the preparation of the interim condensed consolidated financial statements are consistent with those applied in the preparation of the Group’s annual consolidated financial statements for the year ended 31 December 2020, except for the adoption of the following revised IFRSs for the first time for the current period’s financial information.
Amendments to IFRS 9, IAS 39, IFRS 7, IFRS 4 and IFRS 16 | Interest Rate Benchmark Reform – Phase 2 | |
| Amendment to IFRS 16 | Covid-19-Related Rent Concessions |
The nature and impact of the revised IFRSs are described below:
| (a) | Amendments to IFRS 9, IAS 39, IFRS 7, IFRS 4 and IFRS 16 address issues not dealt with in the previous amendments which affect financial reporting when an existing interest rate benchmark is replaced with an alternative risk-free rate (“RFR”). The phase 2 amendments provide a practical expedient to allow the effective interest rate to be updated without adjusting the carrying amount of financial assets and liabilities when accounting for changes in the basis for determining the contractual cash flows of financial assets and liabilities, if the change is a direct consequence of the interest rate benchmark reform and the new basis for determining the contractual cash flows is economically equivalent to the previous basis immediately preceding the change. In addition, the amendments permit changes required by the interest rate benchmark reform to be made to hedge designations and hedge documentation without the hedging relationship being discontinued. Any gains or losses that could arise on transition are dealt with through the normal requirements of IFRS 9 to measure and recognise hedge ineffectiveness. The amendments also provide a temporary relief to entities from having to meet the separately identifiable requirement when an RFR is designated as a risk component. The relief allows an entity, upon designation of the hedge, to assume that the separately identifiable requirement is met, provided the entity reasonably expects the RFR risk component to become separately identifiable within the next 24 months. |
Furthermore, the amendments require an entity to disclose additional information to enable users of financial statements to understand the effect of interest rate benchmark reform on an entity’s financial instruments and risk management strategy. These amendments had no material impact on the interim condensed consolidated financial statements of the Group.
| (b) | Amendment to IFRS 16 issued in April 2021 extends the availability of the practical expedient for lessees to elect not to apply lease modification accounting for rent concessions arising as a direct consequence of the covid-19 pandemic by 12 months. Accordingly, the practical expedient applies to rent concessions for which any reduction in lease payments affects only payments originally due on or before 30 June 2022, provided the other conditions for applying the practical expedient are met. The amendment is effective retrospectively for annual periods beginning on or after 1 April 2021 with any cumulative effect of initially applying the amendment recognised as an adjustment to the opening balance of retained profits at the beginning of the current accounting period. Earlier application is permitted. The amendment did not have any impact on the financial position and performance of the Group as there were no lease payments reduced or waived by the lessors as a result of the covid-19 pandemic during the period. |
- 58 -
| 3. | REVENUE AND SEGMENT INFORMATION |
| (a) | Disaggregation of revenue |
In the following table, revenue is disaggregated by major products and/or service lines of revenue recognition. The table also includes a reconciliation of the disaggregated operating revenue to the Group’s reportable segments (Note 3(b)).
| For the six months ended 30 June 2021 | PRC power segment | Overseas segment | All other segments | Inter- segment revenue | Total | |||||||||||||||
| Note i | ||||||||||||||||||||
| – Sales of power and heat | 84,608,863 | 5,542,341 | – | – | 90,151,204 | |||||||||||||||
| – Sales of coal and raw materials | 1,086,965 | 547 | – | – | 1,087,512 | |||||||||||||||
| – Port service | – | – | 326,136 | (199,921 | ) | 126,215 | ||||||||||||||
| – Transportation service | – | – | 95,467 | (71,331 | ) | 24,136 | ||||||||||||||
| – Lease income | 49,148 | 894,249 | – | – | 943,397 | |||||||||||||||
| – Others | 1,056,085 | 1,725,681 | 17,271 | (15,913 | ) | 2,783,124 | ||||||||||||||
| Total | 86,801,061 | 8,162,818 | 438,874 | (287,165 | ) | 95,115,588 | ||||||||||||||
| For the six months ended 30 June 2020 | PRC power segment | Overseas segment | All other segments | Inter- segment revenue | Total | |||||||||||||||
| Note i | ||||||||||||||||||||
| – Sales of power and heat | 69,771,845 | 5,482,783 | – | – | 75,254,628 | |||||||||||||||
| – Sales of coal and raw materials | 724,782 | 62,769 | – | – | 787,551 | |||||||||||||||
| – Port service | – | – | 217,208 | (132,087 | ) | 85,121 | ||||||||||||||
| – Transportation service | – | – | 74,937 | (41,160 | ) | 33,777 | ||||||||||||||
| – Lease income | 47,954 | 819,009 | – | – | 866,963 | |||||||||||||||
| – Others | 669,399 | 1,416,592 | 12,780 | – | 2,098,771 | |||||||||||||||
| Total | 71,213,980 | 7,781,153 | 304,925 | (173,247 | ) | 79,126,811 | ||||||||||||||
Note i: Overseas segment mainly consists of the operations in Singapore and Pakistan.
The revenue from the sale of power and heat and sale of coal and raw materials is recognised at a point in time upon the transfer of products, whereas the revenue from port service, transportation service, maintenance service, and heating pipeline service is recognised over time during the provision of service. Lease income is recognised over the lease term.
| (b) | Segment information |
Directors and certain senior management of the Company perform the function as the chief operating decision maker (collectively referred to as the “senior management”). The senior management reviews the internal reporting of the Group in order to assess performance and allocate resources. The Company has determined the operating segments based on these reports. The reportable segments of the Group are the PRC power segment, overseas segment and all other segments (mainly including port and transportation operations). No operating segments have been aggregated to form a reportable segment.
- 59 -
Senior management assesses the performance of the operating segments based on a measure of profit before income tax expense under China Accounting Standards for Business Enterprises (“PRC GAAP”) excluding dividend income received from other equity instrument investments, share of profits of China Huaneng Finance Co., Ltd. (“Huaneng Finance”) and operating results of the centrally managed and resource allocation functions of the headquarters (“segment results”). Other information provided, except as noted below, to the senior management of the Company is measured under PRC GAAP.
Segment assets exclude prepaid income tax, deferred income tax assets, other equity instrument investments, investment in Huaneng Finance and assets related to the centrally managed and resource allocation functions of the headquarters that are not attributable to any operating segment (“corporate assets”). Segment liabilities exclude current income tax liabilities, deferred income tax liabilities and liabilities related to the centrally managed and resource allocation functions of the headquarters that are not attributable to any operating segment (“corporate liabilities”). These are part of the reconciliation to total assets and liabilities of the statement of financial position.
- 60 -
All sales among the operating segments have been eliminated as internal transactions when preparing consolidated financial statements.
| (Under PRC GAAP) | ||||||||||||||||
| PRC power segment | Overseas segment | All other segments | Total | |||||||||||||
| For the six months ended 30 June 2021 | ||||||||||||||||
| Total revenue | 86,801,061 | 8,162,818 | 438,874 | 95,402,753 | ||||||||||||
| Intersegment revenue | – | – | (287,165 | ) | (287,165 | ) | ||||||||||
| Revenue from external customers | 86,801,061 | 8,162,818 | 151,709 | 95,115,588 | ||||||||||||
| Segment results | 5,738,444 | 367,705 | 335,794 | 6,441,943 | ||||||||||||
| Interest income | 75,598 | 58,418 | 1,016 | 135,032 | ||||||||||||
| Interest expense | (3,831,679 | ) | (349,919 | ) | (68,732 | ) | (4,250,330 | ) | ||||||||
| Impairment loss | (1,660 | ) | 909 | – | (751 | ) | ||||||||||
| Credit loss | 3,572 | (246 | ) | – | 3,326 | |||||||||||
| Depreciation and amortisation | (10,404,414 | ) | (290,094 | ) | (112,256 | ) | (10,806,764 | ) | ||||||||
| Net gain on disposal of non-current assets | 190,115 | 52 | – | 190,167 | ||||||||||||
| Share of profits less losses of associates and joint ventures | 532,430 | – | 284,874 | 817,304 | ||||||||||||
| Income tax expense | (1,134,044 | ) | 918 | (21,657 | ) | (1,154,783 | ) | |||||||||
- 61 -
| (Under PRC GAAP) | ||||||||||||||||
| PRC power segment | Overseas segment | All other segments | Total | |||||||||||||
| For the six months ended 30 June 2020 (Restated**) | ||||||||||||||||
| Total revenue | 71,288,704 | 7,728,474 | 304,925 | 79,322,103 | ||||||||||||
| Intersegment revenue | – | – | (173,247 | ) | (173,247 | ) | ||||||||||
| Revenue from external customers | 71,288,704 | 7,728,474 | 131,678 | 79,148,856 | ||||||||||||
| Segment results | 8,693,560 | 425,052 | 22,459 | 9,141,071 | ||||||||||||
| Interest income | 73,731 | 79,560 | 1,395 | 154,686 | ||||||||||||
| Interest expense | (4,226,322 | ) | (555,928 | ) | (78,065 | ) | (4,860,315 | ) | ||||||||
| Impairment loss | (68 | ) | (210 | ) | – | (278 | ) | |||||||||
| Credit loss | (428 | ) | (1,736 | ) | – | (2,164 | ) | |||||||||
| Depreciation and amortisation | (9,922,108 | ) | (409,864 | ) | (107,250 | ) | (10,439,222 | ) | ||||||||
| Net gain/(loss) on disposal of non-current assets | 2,571 | – | (2 | ) | 2,569 | |||||||||||
| Share of profits less losses of associates and joint ventures | 897,835 | – | 54,680 | 952,515 | ||||||||||||
| Income tax expense | (2,008,752 | ) | (20,698 | ) | (8,379 | ) | (2,037,829 | ) | ||||||||
- 62 -
| (Under PRC GAAP) | ||||||||||||||||
| PRC power segment | Overseas segment | All other segments | Total | |||||||||||||
| 30 June 2021 | ||||||||||||||||
| Segment assets | 392,730,649 | 39,929,476 | 9,749,431 | 442,409,556 | ||||||||||||
| Including: | ||||||||||||||||
| Additions to non-current assets (excluding financial assets and deferred income tax assets) | 29,751,398 | 227,416 | 14,910 | 29,993,724 | ||||||||||||
| Investments in associates | 14,505,920 | – | 3,984,017 | 18,489,937 | ||||||||||||
| Investments in joint ventures | 1,641,573 | – | 1,078,020 | 2,719,593 | ||||||||||||
| Segment liabilities | (276,788,121 | ) | (23,147,416 | ) | (2,281,926 | ) | (302,217,463 | ) | ||||||||
(Under PRC GAAP)
| PRC power segment | Overseas segment | All other segments | Total | |||||||||||||
| 31 December 2020 | ||||||||||||||||
| Segment assets | 382,917,976 | 39,922,997 | 9,883,826 | 432,724,799 | ||||||||||||
| Including: | ||||||||||||||||
| Additions to non-current assets (excluding financial assets and deferred income tax assets) | 38,156,544 | 432,151 | 186,313 | 38,775,008 | ||||||||||||
| Investments in associates | 14,230,345 | – | 3,855,842 | 18,086,187 | ||||||||||||
| Investments in joint ventures | 1,550,986 | – | 1,193,536 | 2,744,522 | ||||||||||||
| Segment liabilities | (265,407,038 | ) | (23,933,317 | ) | (4,501,554 | ) | (293,841,909 | ) | ||||||||
- 63 -
A reconciliation of segment results to profit before income tax expense is provided as follows:
For the six months ended 30 June | ||||||||
| 2021 | 2020 | |||||||
| (Restated**) | ||||||||
| Segment results (PRC GAAP) | 6,441,943 | 9,141,071 | ||||||
| Reconciling items: | ||||||||
| Loss related to the headquarters | (193,327 | ) | (80,326 | ) | ||||
| Investment income from Huaneng Finance | 77,312 | 91,112 | ||||||
| Dividend income of other equity instrument investments | (16 | ) | – | |||||
| Impact of restatement under PRC GAAP in relation to business combination under common control** | – | (6,451 | ) | |||||
| Impact of other IFRS adjustments* | (455,953 | ) | (549,529 | ) | ||||
| Profit before income tax expense per unaudited interim consolidated statement of comprehensive income | 5,869,959 | 8,595,877 | ||||||
- 64 -
Reportable segments’ assets are reconciled to total assets as follows:
As at 30 June 2021 | As at 31 December 2020 | |||||||
| Total segment assets (PRC GAAP) | 442,409,556 | 432,724,799 | ||||||
| Reconciling items: | ||||||||
| Investment in Huaneng Finance | 1,315,342 | 1,394,030 | ||||||
| Deferred income tax assets | 3,034,687 | 2,996,690 | ||||||
| Prepaid income tax | 321,082 | 133,090 | ||||||
| Other equity instrument investments | 771,922 | 664,946 | ||||||
| Corporate assets | 344,158 | 292,197 | ||||||
| Impact of other IFRS adjustments* | 11,340,357 | 11,698,906 | ||||||
| Total assets per unaudited interim condensed consolidated statement of financial position | 459,537,104 | 449,904,658 | ||||||
Reportable segments’ liabilities are reconciled to total liabilities as follows:
As at 30 June 2021 | As at 31 December 2020 | |||||||
| Total segment liabilities (PRC GAAP) | (302,217,463 | ) | (293,841,909 | ) | ||||
| Reconciling items: | ||||||||
| Current income tax liabilities | (642,457 | ) | (288,106 | ) | ||||
| Deferred income tax liabilities | (954,049 | ) | (977,810 | ) | ||||
| Corporate liabilities | (1,187,676 | ) | (1,622,574 | ) | ||||
| Impact of other IFRS adjustments* | (1,518,118 | ) | (1,558,061 | ) | ||||
| Total liabilities per unaudited interim consolidated statement of financial position | (306,519,763 | ) | (298,288,460 | ) | ||||
- 65 -
Other material items:
| Reportable segment total | Headquarters | Share of profits of Huaneng Finance | Impact of restatement under PRC GAAP in relation to business combination under common control** | Impact of other IFRS adjustments* | Total | |||||||||||||||||||
| For the six months ended 30 June 2021 | ||||||||||||||||||||||||
| Total revenue | 95,115,588 | – | – | – | – | 95,115,588 | ||||||||||||||||||
| Interest expense | (4,250,330 | ) | (8,630 | ) | – | – | – | (4,258,960 | ) | |||||||||||||||
| Impairment loss | (751 | ) | – | – | – | – | (751 | ) | ||||||||||||||||
| Credit loss | 3,326 | – | – | – | – | 3,326 | ||||||||||||||||||
| Depreciation and amortisation | (10,806,764 | ) | (25,232 | ) | – | – | (328,537 | ) | (11,160,533 | ) | ||||||||||||||
| Net gain/(loss) on disposal of non-current assets | 190,167 | – | – | – | (12,836 | ) | 177,331 | |||||||||||||||||
| Share of profits less losses of associates and joint ventures | 817,304 | – | 77,312 | – | (7,837 | ) | 886,779 | |||||||||||||||||
| Income tax expense | (1,154,783 | ) | – | – | – | 98,069 | (1,056,714 | ) | ||||||||||||||||
- 66 -
| Reportable segment total | Headquarters | Share of profits of Huaneng Finance | Impact of | Impact of other IFRS adjustments* | Total | |||||||||||||||||||
| For the six months ended 30 June 2020 (Restated**) | ||||||||||||||||||||||||
| Total revenue | 79,148,856 | – | – | (74,724 | ) | 52,679 | 79,126,811 | |||||||||||||||||
| Interest expense | (4,860,315 | ) | (27,082 | ) | – | 33,327 | – | (4,854,070 | ) | |||||||||||||||
| Impairment loss | (278 | ) | – | – | – | – | (278 | ) | ||||||||||||||||
| Credit loss | (2,164 | ) | – | – | – | – | (2,164 | ) | ||||||||||||||||
| Depreciation and amortisation | (10,439,222 | ) | (12,952 | ) | – | 23,233 | (469,956 | ) | (10,898,897 | ) | ||||||||||||||
| Net gain on disposal of non-current assets | 2,569 | – | – | – | – | 2,569 | ||||||||||||||||||
| Share of profits less losses of associates and joint ventures | 952,515 | – | 91,112 | – | 5,867 | 1,049,494 | ||||||||||||||||||
| Income tax expense | (2,037,829 | ) | – | – | 176 | 142,210 | (1,895,443 | ) | ||||||||||||||||
| * | Other IFRS adjustments above primarily represented the classification adjustments and adjustments related to business combinations under common control and borrowing costs. Other than the classification adjustments, the differences will be gradually eliminated following subsequent depreciation and amortisation of related assets or the extinguishment of liabilities. |
- 67 -
| ** | The Group completed the acquisitions of equity interests of certain companies in the second half of 2020. As the acquisitions were business combinations under common control, the transactions were accounted for by using the pooling of interests method under PRC GAAP. The assets and liabilities acquired in business combinations were measured at the carrying amounts of the acquirees in the consolidated financial statements of the ultimate controlling party on the acquisition date. The operating results for all periods presented were retrospectively restated as if the current structure and operations resulting from the acquisitions had been in existence from the date when the acquirees first became under the control of the same ultimate controlling party. Therefore, the relevant comparative figures in the segment information were restated under the PRC GAAP while the acquisitions were accounted for using the acquisition method under IFRSs. |
Geographical information (Under IFRSs):
| (i) | External revenue generated from the following countries: |
For the six months ended 30 June | ||||||||
| 2021 | 2020 | |||||||
| PRC | 86,952,770 | 71,345,658 | ||||||
| Overseas | 8,162,818 | 7,781,153 | ||||||
| Total | 95,115,588 | 79,126,811 | ||||||
The geographical location of customers is based on the location at which the electricity was transferred, goods were delivered, and services were provided.
- 68 -
| (ii) | Non-current assets (excluding financial assets and deferred income tax assets) are located in the following countries: |
As at 30 June 2021 | As at 31 December 2020 | |||||||
| PRC | 351,587,118 | 346,766,179 | ||||||
| Overseas | 22,584,480 | 23,275,028 | ||||||
| Total | 374,171,598 | 370,041,207 | ||||||
The non-current asset information above is based on the locations of the assets.
The information on sales to major customers of the Group which accounted for 10% or more of external revenue is as follows:
For the six months ended 30 June 2021, the revenue from grid companies under common control of State Grid Corporation of China within the PRC power segment in total accounted for 81% of external revenue (for the six months ended 30 June 2020: 70%). The sales to a subsidiary of State Grid Corporation of China which accounted for 10% or more of external revenue is as follows:
| For the six months ended 30 June | ||||||||||||||||
| 2021 | 2020 | |||||||||||||||
| Amount | Proportion | Amount | Proportion | |||||||||||||
| State Grid Shandong Electric Power Company | 13,655,789 | 14 | % | 11,898,507 | 15 | % | ||||||||||
- 69 -
| 4. | OTHER RECEIVABLES AND ASSETS |
Other receivables and assets comprised the following:
As at 30 June 2021 | As at 31 December 2020 | |||||||
| Prepayments for inventories | 1,841,964 | 1,222,785 | ||||||
| Prepaid income tax | 321,082 | 133,090 | ||||||
| Others | 390,804 | 335,189 | ||||||
| Subtotal prepayments | 2,553,850 | 1,691,064 | ||||||
| Less: Loss allowances | 2,638 | 2,638 | ||||||
| Total prepayments, net | 2,551,212 | 1,688,426 | ||||||
| Dividends receivable | 269,108 | 50,000 | ||||||
| Receivables from sale of fuel | 141,548 | 249,852 | ||||||
| Others (Note i) | 2,865,455 | 2,222,593 | ||||||
| Subtotal other receivables | 3,276,111 | 2,522,445 | ||||||
| Less: Loss allowances | 188,068 | 187,675 | ||||||
| Total other receivables, net | 3,088,043 | 2,334,770 | ||||||
| VAT recoverable | 2,723,423 | 2,428,315 | ||||||
| Finance lease receivables | 507,429 | 478,666 | ||||||
| Designated loan to a joint venture | 80,097 | 304,306 | ||||||
| Others | 138,209 | 138,209 | ||||||
| Subtotal other assets | 3,449,158 | 3,349,496 | ||||||
| Less: Loss allowance | 64,615 | 64,615 | ||||||
| Total other assets, net | 3,384,543 | 3,284,881 | ||||||
| Gross total | 9,279,119 | 7,563,005 | ||||||
| Net total | 9,023,798 | 7,308,077 | ||||||
| Note i: | Included in others were advances amounting to RMB196 million as at 30 June 2021 (31 December 2020: RMB222 million) which were due from Huangtai #8 Power Plant. The balance is repayable on demand. For the six months ended 30 June 2021, the Group received total accumulated repayments amounting to RMB26 million (for the year ended 31 December 2020: RMB10 million). |
- 70 -
| 5. | ACCOUNTS AND NOTES RECEIVABLE |
Accounts and notes receivable comprised the following:
As at | As at 31 December 2020 | |||||||
| Accounts receivable | 33,392,887 | 30,045,678 | ||||||
| Notes receivable | 6,022,682 | 8,325,966 | ||||||
| 39,415,569 | 38,371,644 | |||||||
| Less: Loss allowance | 152,578 | 155,929 | ||||||
| Total | 39,262,991 | 38,215,715 | ||||||
| Analysed into: | ||||||||
| Accounts receivable | ||||||||
| – At amortised cost | 33,178,048 | 28,789,790 | ||||||
| – At fair value through other comprehensive income | 214,839 | 1,255,888 | ||||||
| Notes receivable | ||||||||
| – At amortised cost | 6,022,682 | 8,325,966 | ||||||
During the period ended 30 June 2021, the Group recognised RMB5,365 thousand loss on the date of transfer of the accounts receivable (for the year ended 31 December 2020: RMB41,482 thousand).
- 71 -
Ageing analysis of accounts receivable and notes receivable was as follows:
As at 30 June 2021 | As at 31 December 2020 | |||||||
| Within 1 year | 38,953,790 | 37,966,985 | ||||||
| Between 1 and 2 years | 135,377 | 174,604 | ||||||
| Between 2 and 3 years | 137,100 | 86,388 | ||||||
| Over 3 years | 189,302 | 143,667 | ||||||
| Total | 39,415,569 | 38,371,644 | ||||||
As at 30 June 2021, the maturity period of the notes receivable ranged from 1 month to 12 months (31 December 2020: from 1 month to 12 months).
| 6. | DIVIDENDS OF ORDINARY SHARES AND CUMULATIVE DISTRIBUTION OF OTHER EQUITY INSTRUMENTS |
| (a) | Dividends of ordinary shares |
On 22 June 2021, upon the approval from shareholders at the annual general meeting, the Company declared 2020 final dividend of RMB0.180 (2019 final: RMB0.135) per ordinary share, totalling approximately RMB2,826 million (2019 final: RMB2,119 million). As at 30 June 2021, the Company has not paid the dividend (30 June 2020: the Company has not paid the dividend).
- 72 -
| (b) | Cumulative distribution of other equity instruments |
In 2017, the Company issued two tranches of perpetual corporate bonds with the net proceeds of approximately RMB2,500 million and RMB2,500 million, respectively. The perpetual corporate bonds are issued at par value with an initial distribution rate of 5.05% and 5.17%, respectively. The interests of the perpetual corporate bonds are recorded as distributions, which are paid annually in arrears in September in each year and may be deferred at the discretion of the Company unless compulsory distribution payment events (e.g. distributions to ordinary shareholders of the Company or reduction of the registered capital of the Company) occur. The Company has the right to defer current interests and all deferred interests. The perpetual corporate bonds have no fixed maturity date and are callable at the Company’s discretion in whole in August 2020 and 2022 respectively, and the payment of the principal may be deferred for each renewal period to 3 and 5 years respectively. The applicable distribution rate will be reset on the first call date and each renewal period after the first call date, to the sum of the applicable benchmark interest rate, the initial spread and 300 basis points per annum. On the first call date of bond A in September 2020, the Company decided to exercise the callable option. The bond was redeemed in whole on 25 September 2020.
In 2018, the Company issued three tranches of Yingda Insurance Financing Plan (the “Yingda plan”) with the aggregate proceeds of RMB5,000 million. The Yingda plan has no fixed period with an initial distribution rate of 5.79%. The interests of the financing plan are recorded as distributions, which are paid annually in arrears in June and December in each year and may be deferred at the discretion of the Company unless compulsory payment events (e.g. distributions to ordinary shareholders of the Company or reduction of the registered capital of the Company) occur. The Company has the right to defer current interests and all deferred interests. The Yingda plan has no fixed maturity date and is callable at the Company’s discretion in whole at each distribution date after the 8th year of issuance, or the payment of the principal may be deferred at each distribution date aforementioned. The applicable distribution rate will be reset during the period from the 9th to the 11th years after the issuance, the period from the 11th to the 13th years after the issuance and the 13th year onwards after the issuance, to the higher of the initial distribution rate plus 300 basis points and the 10-year treasury bond yield in the 9th year after the issuance plus 600 basis points, the higher of the initial distribution rate plus 600 basis points and the 10-year treasury bond yield in the 11th year after the issuance plus 900 basis points and the higher of the initial distribution rate plus 900 basis points and the 10-year treasury bond yield in the 13th year after the issuance plus 1,200 basis points, respectively.
- 73 -
In 2019, the Company issued two tranches of China Life Financing Plan (the “China Life plan”) with the aggregate proceeds of RMB4,330 million. The China Life plan has no fixed period with an initial distribution rate of 5.05%. The interests of the China Life plan are recorded as distributions, which are paid annually in arrears in March, June, September and December in each year and may be deferred at the discretion of the Company unless compulsory payment events (distributions to ordinary shareholders of the Company or reduction of the registered capital of the Company) occur. The Company has the right to defer current interests and all deferred interests. The China Life plan has no fixed maturity date and is callable at the Company’s discretion in whole at each distribution date after the 8th year of issuance, or the payment of the principal may be deferred at each distribution date aforementioned. The applicable distribution rate will be reset during the period from the 9th year after the issuance, to the basis rate plus 300 basis points, and will remain 8.05% afterwards.
In 2019, the Company issued two tranches of PICC Financing Plan (the “PICC plan”) with the aggregate proceeds of RMB2,670 million. The PICC plan has no fixed period with an initial distribution rate of 5.10%. The interests of the PICC plan are recorded as distributions, which are paid annually in arrears in March, June, September and December in each year and may be deferred at the discretion of the Company unless compulsory payment events (distributions to ordinary shareholders of the Company or reduction of the registered capital of the Company) occur. The Company has the right to defer current interests and all deferred interests. The PICC plan has no fixed maturity date and is callable at the Company’s discretion in whole at each distribution date after 10th year of issuance, or the payment of the principal may be deferred at each distribution date aforementioned. The applicable distribution rate will be reset during the period from the 11th year after the issuance, to the basis rate plus 300 basis points, and will remain 8.10% afterwards.
In October 2019, the Company issued two tranches of medium-term notes with the net proceeds of approximately RMB2,000 million and RMB2,000 million, respectively. The medium-term notes are issued at par value with an initial distribution rate of 4.08% and 4.05%, respectively. The interests of the medium-term notes are recorded as distributions, which are paid annually in arrears in October in each year and may be deferred at the discretion of the Company unless compulsory distribution payment events (distributions to ordinary shareholders of the Company or reduction of the registered capital of the Company) occur. The Company has the right to defer current interests and all deferred interests. The medium-term notes have no fixed maturity date and are callable at the Company’s discretion at a specific time, and the payment of the principal may be deferred for each renewal period to 3 years, respectively. The applicable distribution rate will be reset on the first call date and for each renewal period after the first call date, to the sum of the applicable benchmark interest rate, the initial spread and 300 basis points per annum.
- 74 -
In November 2019, the Company issued two tranches of medium-term notes with the net proceeds of approximately RMB2,500 million and RMB1,500 million. The medium-term notes are issued at par value with an initial distribution rate of 4.15% and 4.53%, respectively. The interests of the medium-term notes are recorded as distributions, which are paid annually in arrears in November in each year and may be deferred at the discretion of the Company unless compulsory distribution payment events (distributions to ordinary shareholders of the Company or reduction of the registered capital of the Company) occur. The Company has the right to defer current interests and all deferred interests. The medium-term notes have no fixed maturity date and are callable at the Company’s discretion at a specific time, and the payment of the principal may be deferred for each renewal period to 3 and 5 years, respectively. The applicable distribution rate will be reset on the first call date and for each renewal period after the first call date, to the sum of the applicable benchmark interest rate, the initial spread and 300 basis points per annum.
In March 2020, the Company issued two tranches of perpetual corporate bonds with the net proceeds of approximately RMB2,000 million and RMB1,000 million, respectively. The perpetual corporate bonds are issued at par value with an initial distribution rate of 3.58% and 3.85%, respectively. The interests of the perpetual corporate bonds are recorded as distributions, which are paid annually in arrears in March in each year and may be deferred at the discretion of the Company unless compulsory distribution payment events (e.g. distributions to ordinary shareholders of the Company or reduction of the registered capital of the Company) occur. The Company has the right to defer current interests and all deferred interests. The perpetual corporate bonds have no fixed maturity date and are callable at the Company’s discretion in whole in February 2023 and 2025 respectively, and the payment of the principal may be deferred for each renewal period to 3 and 5 years respectively. The applicable distribution rate will be reset on the first call date and for each renewal period after the first call date, to the sum of the applicable benchmark interest rate, the initial spread and 300 basis points per annum.
- 75 -
In April 2020, the Company issued medium-term notes with the net proceeds of approximately RMB3,000 million. The medium-term notes are issued at par value with an initial distribution rate of 3.18%. The interests of the medium-term notes are recorded as distributions, which are paid annually in arrears in April in each year and may be deferred at the discretion of the Company unless compulsory distribution payment events (distributions to ordinary shareholders of the Company or reduction of the registered capital of the Company) occur. The Company has the right to defer current interests and all deferred interests. The medium-term notes have no fixed maturity date and are callable at the Company’s discretion at specific time, and the payment of the principal may be deferred for each renewal period to 3 years. The applicable distribution rate will be reset on the first call date and for each renewal period after the first call date, to the sum of the applicable benchmark interest rate, the initial spread and 300 basis points per annum.
In April 2020, the Company issued China Life Financing Plan (the “China Life plan”) with the proceeds of RMB3,570 million. The China Life plan has no fixed period with an initial distribution rate of 4.75%. The interests of the China Life plan are recorded as distributions, which are paid annually in arrears in March, June, September and December in each year and may be deferred at the discretion of the Company unless compulsory payment events (distributions to ordinary shareholders of the Company or reduction of the registered capital of the Company) occur. The Company has the right to defer current interests and all deferred interests. The China Life plan has no fixed maturity date and are callable at the Company’s discretion in whole at each distribution date after the 8th year of issuance, or the payment of the principal may be deferred at each distribution date aforementioned. The applicable distribution rate will be reset during the period from the 9th year after the issuance, to the basis rate plus 300 basis points, and will remain 7.75% afterwards.
- 76 -
In April 2020, the Company issued the third tranche of the PICC plan with the proceeds of RMB930 million. The PICC plan has no fixed period with an initial distribution rate of 4.75%. The interests of the PICC plan are recorded as distributions, which are paid annually in arrears in March, June, September and December in each year and may be deferred at the discretion of the Company unless compulsory payment events (distributions to ordinary shareholders of the Company or reduction of the registered capital of the Company) occur. The Company has the right to defer current interests and all deferred interests. The PICC plan has no fixed maturity date and is callable at the Company’s discretion in whole at each distribution date after the 10th year of issuance, or the payment of the principal may be deferred at each distribution date aforementioned. The applicable distribution rate will be reset during the period from the 11th year after the issuance, to the basis rate plus 300 basis points, and will remain 7.75% afterwards.
In April 2020, the Company issued a perpetual corporate bond with the net proceeds of approximately RMB2,500 million. The perpetual corporate bond is issued at par value with an initial distribution rate of 3.09%. The interests of the perpetual corporate bond are recorded as distributions, which are paid annually in arrears in April in each year and may be deferred at the discretion of the Company unless compulsory distribution payment events (e.g. distributions to ordinary shareholders of the Company or reduction of the registered capital of the Company) occur. The Company has the right to defer current interests and all deferred interests. The perpetual corporate bond has no fixed maturity date and is callable at the Company’s discretion in whole in March 2023, or the payment of the principal may be deferred for each renewal period to 3 years. The applicable distribution rate will be reset on the first call date and for each renewal period after the first call date, to the sum of the applicable benchmark interest rate, the initial spread and 300 basis points per annum.
- 77 -
In June 2020, the Company issued medium-term notes with the net proceeds of approximately RMB3,500 million. The medium-term notes are issued at par value with an initial distribution rate of 3.60%. The interests of the medium-term notes are recorded as distributions, which are paid annually in arrears in June in each year and may be deferred at the discretion of the Company unless compulsory distribution payment events (distributions to ordinary shareholders of the Company or reduction of the registered capital of the Company) occur. The Company has the right to defer current interests and all deferred interests. The medium-term notes have no fixed maturity date and are callable at the Company’s discretion at a specific time, and the payment of the principal may be deferred for each renewal period to 3 years. The applicable distribution rate will be reset on the first call date and for each renewal period after the first call date, to the sum of the applicable benchmark interest rate, the initial spread and 300 basis points per annum.
In August 2020 and September 2020, the Company issued two tranches of medium-term notes with the net proceeds of approximately RMB2,000 million and RMB1,000 million, respectively. The medium-term notes are issued at par value with an initial distribution rate of 3.99% and 4.40%, respectively. The interests of the medium-term notes are recorded as distributions, which are paid annually in arrears in August and September in each year and may be deferred at the discretion of the Company unless compulsory distribution payment events (distributions to ordinary shareholders of the Company or reduction of the registered capital of the Company) occur. The Company has the right to defer current interests and all deferred interests. The medium-term notes have no fixed maturity date and are callable at the Company’s discretion at a specific time, and the payment of the principal may be deferred for each renewal period to 3 years, respectively. The applicable distribution rate will be reset on the first call date and for each renewal period after the first call date, to the sum of the applicable benchmark interest rate, the initial spread and 300 basis points per annum.
- 78 -
In August 2020, the Company issued the fourth tranche of the PICC plan with the proceeds of RMB3,000 million. The PICC plan has no fixed period with an initial distribution rate of 4.60%. The interests of the PICC plan are recorded as distributions, which are paid annually in arrears in March, June, September and December in each year and may be deferred at the discretion of the Company unless compulsory payment events (distributions to ordinary shareholders of the Company or reduction of the registered capital of the Company) occur. The Company has the right to defer current interests and all deferred interests. The PICC plan has no fixed maturity date and are callable at the Company’s discretion in whole at each distribution date after the 10th year of issuance, or the payment of the principal may be deferred at each distribution date aforementioned. The applicable distribution rate will be reset during the period from the 11th year after the issuance, to the basis rate plus 300 basis points, and will remain 7.60% afterwards.
In September 2020, the Company issued a perpetual corporate bond with the net proceeds of approximately RMB3,000 million. The perpetual corporate bond is issued at par value with an initial distribution rate of 4.38%. The interests of the perpetual corporate bond are recorded as distributions, which are paid annually in arrears in September in each year and may be deferred at the discretion of the Company unless compulsory distribution payment events (e.g. distributions to ordinary shareholders of the Company or reduction of the registered capital of the Company) occur. The Company has the right to defer current interests and all deferred interests. The perpetual corporate bond has no fixed maturity date and is callable at the Company’s discretion in whole in August 2023, and the payment of the principal may be deferred for each renewal period to 3 years. The applicable distribution rate will be reset on the first call date and for each renewal period after the first call date, to the sum of the applicable benchmark interest rate, the initial spread and 300 basis points per annum.
The perpetual corporate bonds, financing plans and medium-term notes were recorded as equity in the consolidated financial statements. During the six months ended 30 June 2021, the profit attributable to holders of other equity instruments, based on the applicable distribution rate, was RMB1,060 million (for the year ended 31 December 2020: RMB1,770 million).
- 79 -
| 7. | LONG-TERM BONDS |
Long-term bonds comprised the following:
| As at 30 June 2021 | As at 31 December 2020 | |||||||
| 2016 corporate bonds (5 years) | – | 3,057,912 | ||||||
| 2016 corporate bonds (10 years) | 1,202,358 | 1,226,429 | ||||||
| 2017 medium-term notes (5 years) | 5,226,223 | 5,113,989 | ||||||
| 2018 corporate bonds (3 years) | – | 1,554,843 | ||||||
| 2018 medium-term notes (3 years) | – | 3,095,285 | ||||||
| 2018 medium-term notes (3 years) | 2,088,539 | 2,043,397 | ||||||
| 2018 debt financing instrument (3 years) | 2,608,910 | 2,549,443 | ||||||
| 2018 corporate bonds (10 years) | 5,203,428 | 5,078,194 | ||||||
| 2019 corporate bonds (10 years) | 2,320,444 | 2,374,934 | ||||||
| 2019 corporate bonds (3 years) | 1,034,755 | 1,017,142 | ||||||
| 2019 medium-term notes (3 years) | 516,364 | 507,320 | ||||||
| 2019 medium-term notes (5 years) | 1,550,497 | 1,521,142 | ||||||
| 2020 corporate bonds (5 years) | 1,944,733 | 1,963,164 | ||||||
| 2020 corporate bonds (10 years) | 1,939,189 | 1,957,722 | ||||||
| 2021 green mid-term notes (3 years) | 1,012,269 | – | ||||||
| 2021 green mid-term notes (3 years) | 2,516,504 | – | ||||||
| 2021 corporate bonds (3 years) | 501,740 | – | ||||||
| 2021 corporate bonds (10 years) | 1,506,186 | – | ||||||
| 2021 corporate bonds (3 years) | 501,091 | – | ||||||
| 2021 corporate bonds (10 years) | 3,509,104 | – | ||||||
| 2021 corporate bonds (10 years) | 1,801,950 | – | ||||||
| Subtotal | 36,984,284 | 33,060,916 | ||||||
| Less: Current portion of long-term bonds | 5,342,920 | 12,678,511 | ||||||
| Total | 31,641,364 | 20,382,405 | ||||||
- 80 -
Details of the outstanding corporate bonds, medium-term notes and debt financing instrument of the Group as at 30 June 2021 are summarised as follows:
| Type of Instruments | Face Value | Issuance Date | Initial Period | Initial Distribution Rate | Effective Rate | Issue Price | Balance as at 31 December 2020 | Issued Amount | Amortisation | Repayment | Foreign Exchange Loss | Foreign Currency Translation Differences | Accrued Interest | Interest Payable | Balance as at 30 June 2021 | |||||||||||||||||||||||||||||||||||||||||||
| 2016 corporate bonds (5 years) | 3,000,000 | June 2016 | 5 years | 3.48 | % | 3.48 | % | 3,000,000 | 3,057,912 | – | (134 | ) | (3,000,000 | ) | – | – | 46,622 | (104,400 | ) | – | ||||||||||||||||||||||||||||||||||||||
| 2016 corporate bonds (10 years) | 1,200,000 | June 2016 | 10 years | 3.98 | % | 3.98 | % | 1,200,000 | 1,226,429 | – | 5 | – | – | – | 23,684 | (47,760 | ) | 1,202,358 | ||||||||||||||||||||||||||||||||||||||||
| 2017 medium-term notes (5 years) | 5,000,000 | July 2017 | 5 years | 4.69 | % | 4.90 | % | 5,000,000 | 5,113,989 | – | (4,052 | ) | – | – | – | 116,286 | – | 5,226,223 | ||||||||||||||||||||||||||||||||||||||||
| 2018 corporate bonds (3 years) | 1,500,000 | April 2018 | 3 years | 4.90 | % | 4.90 | % | 1,500,000 | 1,554,843 | – | (70 | ) | (1,500,000 | ) | – | – | 18,727 | (73,500 | ) | – | ||||||||||||||||||||||||||||||||||||||
| 2018 medium-term notes (3 years) | 3,000,000 | May 2018 | 3 years | 4.80 | % | 4.91 | % | 3,000,000 | 3,095,285 | – | 978 | (3,000,000 | ) | – | – | 47,737 | (144,000 | ) | – | |||||||||||||||||||||||||||||||||||||||
| 2018 medium-term notes (3 years) | 2,000,000 | July 2018 | 3 years | 4.41 | % | 4.56 | % | 2,000,000 | 2,043,397 | – | 1,404 | – | – | – | 43,738 | – | 2,088,539 | |||||||||||||||||||||||||||||||||||||||||
| 2018 debt financing instrument (3 years) | 2,500,000 | July 2018 | 3 years | 4.68 | % | 4.81 | % | 2,500,000 | 2,549,443 | – | 1,448 | – | – | – | 58,019 | – | 2,608,910 | |||||||||||||||||||||||||||||||||||||||||
| 2018 corporate bonds (10 years) | 5,000,000 | September 2018 | 10 years | 5.05 | % | 5.05 | % | 5,000,000 | 5,078,194 | – | 22 | – | – | – | 125,212 | – | 5,203,428 | |||||||||||||||||||||||||||||||||||||||||
| 2019 corporate bonds (10 years) | 2,300,000 | April 2019 | 10 years | 4.70 | % | 4.70 | % | 2,300,000 | 2,374,934 | – | 4 | – | – | – | 53,606 | (108,100 | ) | 2,320,444 | ||||||||||||||||||||||||||||||||||||||||
| 2019 corporate bonds (3 years) | 1,000,000 | July 2019 | 3 years | 3.55 | % | 3.55 | % | 1,000,000 | 1,017,142 | – | 9 | – | – | – | 17,604 | – | 1,034,755 | |||||||||||||||||||||||||||||||||||||||||
| 2019 medium-term notes (3 years) | 500,000 | July 2019 | 3 years | 3.55 | % | 3.65 | % | 500,000 | 507,320 | – | 242 | – | – | – | 8,802 | – | 516,364 | |||||||||||||||||||||||||||||||||||||||||
| 2019 medium-term notes (5 years) | 1,500,000 | July 2019 | 5 years | 3.85 | % | 3.96 | % | 1,500,000 | 1,521,142 | – | 717 | – | – | – | 28,638 | – | 1,550,497 | |||||||||||||||||||||||||||||||||||||||||
| 2020 corporate bonds (5 years) | 2,108,865 | February 2020 | 5 years | 2.25 | % | 2.32 | % | 2,108,865 | 1,963,164 | – | 1,306 | – | 6,630 | (25,843 | ) | 21,049 | (21,573 | ) | 1,944,733 | |||||||||||||||||||||||||||||||||||||||
| 2020 corporate bonds (10 years) | 2,108,865 | February 2020 | 10 years | 2.63 | % | 2.72 | % | 2,108,865 | 1,957,722 | – | 1,291 | – | 6,630 | (25,843 | ) | 24,557 | (25,168 | ) | 1,939,189 | |||||||||||||||||||||||||||||||||||||||
| 2021 green mid-term notes (3 years) | 1,000,000 | February 2021 | 3 years | 3.45 | % | 3.66 | % | 1,000,000 | – | 1,000,000 | (1,153 | ) | – | – | – | 13,422 | – | 1,012,269 | ||||||||||||||||||||||||||||||||||||||||
| 2021 green mid-term notes (3 years) | 2,500,000 | April 2021 | 3 years | 3.35 | % | 3.40 | % | 2,500,000 | – | 2,500,000 | (934 | ) | – | – | – | 17,438 | – | 2,516,504 | ||||||||||||||||||||||||||||||||||||||||
| 2021 corporate bonds (3 years) | 500,000 | May 2021 | 3 years | 3.35 | % | 3.35 | % | 500,000 | – | 500,000 | (4 | ) | – | – | – | 1,744 | – | 501,740 | ||||||||||||||||||||||||||||||||||||||||
| 2021 corporate bonds (10 years) | 1,500,000 | May 2021 | 10 years | 3.97 | % | 3.97 | % | 1,500,000 | – | 1,500,000 | (14 | ) | – | – | – | 6,200 | – | 1,506,186 | ||||||||||||||||||||||||||||||||||||||||
| 2021 corporate bonds (3 years) | 500,000 | June 2021 | 3 years | 3.33 | % | 3.33 | % | 500,000 | – | 500,000 | (4 | ) | – | – | – | 1,095 | – | 501,091 | ||||||||||||||||||||||||||||||||||||||||
| 2021 corporate bonds (10 years) | 3,500,000 | June 2021 | 10 years | 3.97 | % | 3.97 | % | 3,500,000 | – | 3,500,000 | (32 | ) | – | – | – | 9,136 | – | 3,509,104 | ||||||||||||||||||||||||||||||||||||||||
| 2021 corporate bonds (10 years) | 1,800,000 | June 2021 | 10 years | 3.99 | % | 3.99 | % | 1,800,000 | – | 1,800,000 | (18 | ) | – | – | – | 1,968 | – | 1,801,950 | ||||||||||||||||||||||||||||||||||||||||
| Total | 44,017,730 | 33,060,916 | 11,300,000 | 1,011 | (7,500,000 | ) | 13,260 | (51,686 | ) | 685,284 | (524,501 | ) | 36,984,284 | |||||||||||||||||||||||||||||||||||||||||||||
- 81 -
Details of the outstanding corporate bonds, medium-term notes and debt financing instrument of the Group as at 31 December 2020 are summarised as follows:
| Type of Instruments | Face Value | Issuance Date | Initial Period | Initial Distribution Rate | Effective Rate | Issue Price | Balance as at 31 December 2019 | Issued Amount | Amortisation | Repayment | Foreign Exchange gain | Foreign Currency Translation Differences | Interest Payable | Balance as at 31 December 2020 | ||||||||||||||||||||||||||||||||||||||||||
| 2016 corporate bonds (5 years) | 3,000,000 | June 2016 | 5 years | 3.48 | % | 3.48 | % | 3,000,000 | 3,000,072 | – | 62 | – | – | – | 57,778 | 3,057,912 | ||||||||||||||||||||||||||||||||||||||||
| 2016 corporate bonds (10 years) | 1,200,000 | June 2016 | 10 years | 3.98 | % | 3.98 | % | 1,200,000 | 1,199,985 | – | 12 | – | – | – | 26,432 | 1,226,429 | ||||||||||||||||||||||||||||||||||||||||
| 2017 medium-term notes (5 years) | 5,000,000 | July 2017 | 5 years | 4.69 | % | 4.90 | % | 5,000,000 | 5,001,878 | – | 965 | – | – | – | 111,146 | 5,113,989 | ||||||||||||||||||||||||||||||||||||||||
| 2017 debt financing instrument (3 years) | 500,000 | July 2017 | 3 years | 4.75 | % | 4.81 | % | 500,000 | 499,846 | – | 154 | (500,000 | ) | – | – | – | – | |||||||||||||||||||||||||||||||||||||||
| 2017 corporate bonds (3 years) | 2,300,000 | November 2017 | 3 years | 4.99 | % | 4.99 | % | 2,300,000 | 2,299,962 | – | 38 | (2,300,000 | ) | – | – | – | – | |||||||||||||||||||||||||||||||||||||||
| 2018 corporate bonds (3 years) | 1,500,000 | April 2018 | 3 years | 4.90 | % | 4.90 | % | 1,500,000 | 1,500,040 | – | 30 | – | – | – | 54,773 | 1,554,843 | ||||||||||||||||||||||||||||||||||||||||
| 2018 medium-term notes (3 years) | 3,000,000 | May 2018 | 3 years | 4.80 | % | 4.91 | % | 3,000,000 | 2,996,069 | – | 2,953 | – | – | – | 96,263 | 3,095,285 | ||||||||||||||||||||||||||||||||||||||||
| 2018 medium-term notes (3 years) | 2,000,000 | July 2018 | 3 years | 4.41 | % | 4.56 | % | 2,000,000 | 2,001,342 | – | 9 | – | – | – | 42,046 | 2,043,397 | ||||||||||||||||||||||||||||||||||||||||
| 2018 debt financing instrument (3 years) | 2,500,000 | July 2018 | 3 years | 4.68 | % | 4.81 | % | 2,500,000 | 2,495,547 | – | 2,929 | – | – | – | 50,967 | 2,549,443 | ||||||||||||||||||||||||||||||||||||||||
| 2018 corporate bonds (10 years) | 5,000,000 | September 2018 | 10 years | 5.05 | % | 5.05 | % | 5,000,000 | 4,999,993 | – | 30 | – | – | – | 78,171 | 5,078,194 | ||||||||||||||||||||||||||||||||||||||||
| 2019 corporate bonds (10 years) | 2,300,000 | April 2019 | 10 years | 4.70 | % | 4.70 | % | 2,300,000 | 2,299,990 | – | 14 | – | – | – | 74,930 | 2,374,934 | ||||||||||||||||||||||||||||||||||||||||
| 2019 corporate bonds (3 years) | 1,000,000 | July 2019 | 3 years | 3.55 | % | 3.55 | % | 1,000,000 | 1,000,007 | – | 17 | – | – | – | 17,118 | 1,017,142 | ||||||||||||||||||||||||||||||||||||||||
| 2019 medium-term notes (3 years) | 500,000 | July 2019 | 3 years | 3.55 | % | 3.65 | % | 500,000 | 498,759 | – | 488 | – | – | – | 8,073 | 507,320 | ||||||||||||||||||||||||||||||||||||||||
| 2019 medium-term notes (5 years) | 1,500,000 | July 2019 | 5 years | 3.85 | % | 3.96 | % | 1,500,000 | 1,493,433 | – | 1,445 | – | – | – | 26,264 | 1,521,142 | ||||||||||||||||||||||||||||||||||||||||
| 2020 corporate bonds (5 years) | 2,108,865 | February 2020 | 5 years | 2.25 | % | 2.32 | % | 2,108,865 | – | 2,108,865 | (9,456 | ) | – | (23,160 | ) | (129,468 | ) | 16,383 | 1,963,164 | |||||||||||||||||||||||||||||||||||||
| 2020 corporate bonds (10 years) | 2,108,865 | February 2020 | 10 years | 2.63 | % | 2.72 | % | 2,108,865 | – | 2,108,865 | (17,629 | ) | – | (23,160 | ) | (129,468 | ) | 19,114 | 1,957,722 | |||||||||||||||||||||||||||||||||||||
| Total | 35,517,730 | 31,286,923 | 4,217,730 | (17,939 | ) | (2,800,000 | ) | (46,320 | ) | (258,936 | ) | 679,458 | 33,060,916 | |||||||||||||||||||||||||||||||||||||||||||
- 82 -
| 8. | ACCOUNTS PAYABLE AND OTHER LIABILITIES |
Accounts payable and other liabilities comprised:
| As at 30 June 2021 | As at 31 December 2020 | |||||||
| Accounts and notes payable | 19,060,080 | 15,777,784 | ||||||
| Payables to contractors for construction | 16,029,499 | 18,734,201 | ||||||
| Retention payables to contractors | 1,977,556 | 1,530,764 | ||||||
| Consideration payables for business acquisition | 22,842 | 22,842 | ||||||
| Others | 7,213,566 | 6,689,770 | ||||||
| Total | 44,303,543 | 42,755,361 | ||||||
Ageing analysis of accounts and notes payable was as follows:
| As at 30 June 2021 | As at 31 December 2020 | |||||||
| Within 1 year | 18,773,355 | 15,514,112 | ||||||
| Between 1 and 2 years | 157,764 | 166,088 | ||||||
| Over 2 years | 128,961 | 97,584 | ||||||
| Total | 19,060,080 | 15,777,784 | ||||||
- 83 -
| 9. | SHORT-TERM BONDS |
Details of the outstanding short-term bonds as at 30 June 2021 are summarised as follows:
| Type of Instruments | Face Value | Issuance Date | Maturity | Coupon Rate | Issue Price | Balance as at 31 December 2020 | Issued Amount | Interest | Amortisation | Repayment | Balance as at 30 June 2021 | |||||||||||||||||||||||||||||||||
| Super short-term bond (2020 8th) | 2,000,000 | December 2020 | 30 days | 1.50 | % | 2,000,000 | 2,001,951 | – | 575 | (60 | ) | (2,002,466 | ) | – | ||||||||||||||||||||||||||||||
| Super short-term bond (2020 9th) | 3,000,000 | December 2020 | 30 days | 1.40 | % | 3,000,000 | 3,000,926 | – | 2,416 | 110 | (3,003,452 | ) | – | |||||||||||||||||||||||||||||||
| Super short-term bond (2021 1st) | 2,000,000 | January 2021 | 37 days | 2.18 | % | 2,000,000 | – | 2,000,000 | 5,548 | – | (2,005,548 | ) | – | |||||||||||||||||||||||||||||||
| Super short-term bond (2021 2nd) | 3,000,000 | January 2021 | 30 days | 2.25 | % | 3,000,000 | – | 3,000,000 | 8,088 | – | (3,008,088 | ) | – | |||||||||||||||||||||||||||||||
| Super short-term bond (2021 3rd) | 3,000,000 | February 2021 | 41 days | 2.40 | % | 3,000,000 | – | 3,000,000 | 4,258 | – | (3,004,258 | ) | – | |||||||||||||||||||||||||||||||
| Super short-term bond (2021 4th) | 2,000,000 | April 2021 | 37 days | 2.10 | % | 2,000,000 | – | 2,000,000 | 6,302 | – | (2,006,302 | ) | – | |||||||||||||||||||||||||||||||
| Super short-term bond (2021 5th) | 3,000,000 | April 2021 | 36 days | 2.13 | % | 3,000,000 | – | 3,000,000 | 4,420 | – | (3,004,420 | ) | – | |||||||||||||||||||||||||||||||
| Total | 18,000,000 | 5,002,877 | 13,000,000 | 31,607 | 50 | (18,034,534 | ) | – | ||||||||||||||||||||||||||||||||||||
| 10. | ADDITIONAL FINANCIAL INFORMATION ON UNAUDITED INTERIM CONSOLIDATED STATEMENT OF FINANCIAL POSITION |
As at 30 June 2021, the net current liabilities of the Group amounted to approximately RMB72,164 million (31 December 2020: RMB87,910 million). On the same date, total assets less current liabilities were approximately RMB315,557 million (31 December 2020: RMB295,857 million).
- 84 -
| 11. | PROFIT BEFORE INCOME TAX EXPENSE |
Profit before income tax expense was determined after charging/(crediting) the following:
| For the six months ended 30 June | ||||||||
| 2021 | 2020 | |||||||
| Total interest expense on borrowings | 4,768,929 | 5,335,451 | ||||||
| Less: Amounts capitalised in property, plant and equipment | 509,969 | 481,381 | ||||||
| Interest expenses charged to unaudited interim consolidated statement of comprehensive income | 4,258,960 | 4,854,070 | ||||||
| Including: Interest expenses on lease liabilities | 106,339 | 102,524 | ||||||
| Depreciation of property, plant and equipment | 10,749,559 | 10,504,910 | ||||||
| Depreciation of right-of-use assets | 344,248 | 337,782 | ||||||
| Included in other operating expenses: | ||||||||
| – Operating expense of Ruyi Pakistan Energy | 1,808,230 | 1,369,766 | ||||||
| – Other materials expense | 595,559 | 686,847 | ||||||
| – Electricity charges | 534,761 | 484,534 | ||||||
| – Cost of sales of raw materials | 182,821 | 254,982 | ||||||
| – Water charges | 286,478 | 245,238 | ||||||
| – Insurance expense | 198,855 | 193,349 | ||||||
| – Cleaning, greening and fire protection expense | 171,007 | 170,302 | ||||||
| – Purchase of power generation quota | 115,531 | 149,796 | ||||||
| – Water conservancy fund and disabled security fund | 42,316 | 108,588 | ||||||
| – Test and inspection expense | 101,482 | 105,325 | ||||||
| – Service charge | 195,275 | 104,062 | ||||||
| – Auditors’ remuneration-audit services | 20,786 | 15,251 | ||||||
| – Other consulting expense | 71,345 | 71,868 | ||||||
| – Transportation allowance | 87,475 | 72,427 | ||||||
| – Office expense | 88,254 | 63,783 | ||||||
| – Minimum lease payments under operating leases, lease payments not included in the measurement of lease liabilities | 56,017 | 61,455 | ||||||
| – Service concession construction cost | 90,872 | 59,059 | ||||||
| – Research and development expenditure | 121,546 | 56,565 | ||||||
| – Amortisation of other non-current assets | 66,726 | 56,205 | ||||||
| – Heating pipeline related cost | 98,204 | 55,809 | ||||||
| – Property management expense | 45,201 | 49,802 | ||||||
| – Pollutant charge | 49,219 | 40,182 | ||||||
| – Information technology maintenance expense | 52,914 | 38,330 | ||||||
| – Travel expense | 49,730 | 26,949 | ||||||
| – Donations | 12,307 | 17,387 | ||||||
| – Business entertainment expense | 17,362 | 5,654 | ||||||
| – (Reversal)/recognition of loss allowance for receivables | (3,326 | ) | 2,164 | |||||
| – Penalties | 1,841 | 1,964 | ||||||
| – (Reversal)/recognition of provision for inventory obsolescence | (969 | ) | 278 | |||||
| – Impairment loss of other non-current assets | 1,720 | – | ||||||
| – Net gain on disposal of non-current assets | (177,331 | ) | (2,569 | ) | ||||
| – Gain of Three Supplies and Property Management | (20,192 | ) | (13,557 | ) | ||||
| – Government grants | (463,313 | ) | (392,238 | ) | ||||
| – Others | 709,504 | 368,830 | ||||||
| Total | 5,208,207 | 4,528,387 | ||||||
- 85 -
| 12. | INCOME TAX EXPENSE |
| For the six months ended 30 June | ||||||||
| 2021 | 2020 | |||||||
| Current income tax expense | 1,327,158 | 1,801,529 | ||||||
| Deferred income tax | (270,444 | ) | 93,914 | |||||
| Total | 1,056,714 | 1,895,443 | ||||||
No Hong Kong profits tax has been provided as there were no estimated assessable profits in Hong Kong for the six months ended 30 June 2021 (for the six months ended 30 June 2020: Nil).
The Company and its PRC branches and subsidiaries are subject to income tax at 25%, except for certain PRC branches and subsidiaries that are tax exempted or taxed at preferential tax rates, as determined in accordance with the relevant PRC income tax rules and regulations for the six months ended 30 June 2021 and 2020.
The income tax rate applicable to Singapore subsidiaries is 17% (for the six months ended 30 June 2020: 17%). The Company’s overseas subsidiary in Pakistan engaged in the power generation business is entitled to an income tax exemption according to Pakistani 2015 Fiscal Act. Another subsidiary located in Pakistan is engaged in the provision of maintenance services. Before 1 July 2019, the subsidiary’s tax liability would be calculated as the amount which is the highest of (i) normal tax at the rate of 29% of taxable income; (ii) Alternative Corporate Tax (ACT) at the rate of 17% of accounting profit; and (iii) minimum tax deductible at 8% of the revenue. If the income tax calculated is above the normal tax at the rate of 29%, it would be carried forward to subsequent years for settlement against the liabilities of the following years. The carry forward period is 5 years in the case of minimum tax and 10 years in the case of ACT. However, from 1 July 2019, if the minimum tax liability is above the normal tax calculated, it cannot be carried forward to subsequent years.
- 86 -
The reconciliation of the effective income tax rate from the statutory income tax rate is as follows:
| For the six months ended 30 June | ||||||||
| 2021 | 2020 | |||||||
| PRC statutory enterprise income tax rate | 25.00 | % | 25.00 | % | ||||
| Effect of different tax rates of certain subsidiaries | (11.09 | %) | (3.44 | %) | ||||
| Utilisation of previously unrecognised tax losses and deductible temporary differences | (2.17 | %) | (1.17 | %) | ||||
| Unrecognised deductible temporary differences | 0.09 | % | 0.83 | % | ||||
| Unrecognised tax losses for the period | 9.69 | % | 3.35 | % | ||||
| Effect of non-taxable income | (3.79 | %) | (3.04 | %) | ||||
| Effect of non-deductible expenses | 0.51 | % | 0.25 | % | ||||
| Others | (0.24 | %) | 0.28 | % | ||||
| Effective tax rate | 18.00 | % | 22.06 | % | ||||
- 87 -
| 13. | EARNINGS PER SHARE |
The basic earnings per share is calculated by dividing the consolidated net profit attributable to the equity holders of the Company excluding cumulative distribution of other equity instruments by the weighted average number of the Company’s outstanding ordinary shares during the period.
For the six months ended 30 June | ||||||||
| 2021 | 2020 | |||||||
| Consolidated net profit attributable to equity holders of the Company | 4,018,540 | 5,441,025 | ||||||
| Less: Cumulative distribution of other equity instruments | 1,059,926 | 731,099 | ||||||
| Consolidated net profit attributable to ordinary shareholders of the Company | 2,958,614 | 4,709,926 | ||||||
| Weighted average number of the Company’s outstanding ordinary shares (’000) | 15,698,093 | 15,698,093 | ||||||
| Basic and diluted earnings per share (RMB) | 0.19 | 0.30 | ||||||
There was no dilutive effect on earnings per share since the Company had no dilutive potential ordinary shares for the six-month periods ended 30 June 2021 and 2020.
- 88 -
| B. | Financial Information Extracted from Consolidated Financial Statements Prepared Under PRC GAAP |
(Amounts expressed in RMB Yuan unless otherwise stated)
| 1. | Financial Highlights and Financial Ratios (UNAUDITED) |
| For the six months ended 30 June | ||||||||||||||||
| Unit | 2021 | 2020 | Fluctuation | |||||||||||||
| (restated) | ||||||||||||||||
| Operating revenue | RMB | 95,115,588,347 | 79,148,855,317 | 20.17 | % | |||||||||||
| Profit before income tax expense | RMB | 6,325,911,155 | 9,151,857,261 | (30.88 | %) | |||||||||||
| Net profit attributable to equity holders of the Company | RMB | 4,282,135,954 | 5,732,267,235 | (25.30 | %) | |||||||||||
| Net profit attributable to equity holders of the Company less non-recurring items and cumulative distribution of other equity instruments | RMB | 2,808,424,426 | 4,744,273,468 | (40.80 | %) | |||||||||||
| Basic and diluted earnings per share | RMB/share | 0.21 | 0.32 | (34.38 | %) | |||||||||||
| Basic earnings per share less non-recurring items | RMB/share | 0.18 | 0.30 | (40.00 | %) | |||||||||||
| Weighted average of return on equity | % | 4.32 | 6.61 | (34.64 | %) | |||||||||||
| Weighted average of return on equity less non-recurring items | % | 3.78 | 6.28 | (39.81 | %) | |||||||||||
| Net cash provided by operating activities | RMB | 19,134,343,084 | 15,900,435,625 | 20.34 | % | |||||||||||
| Unit | As at 30 June 2021 | As at 31 December 2020 | Fluctuation | |||||||||||||
| Total assets | RMB | 448,196,747,614 | 438,205,752,374 | 2.28 | % | |||||||||||
| Equity to equity holders of the Company | RMB | 120,969,353,725 | 121,698,538,280 | (0.60 | %) | |||||||||||
| Note: | The financial ratio: |
| Earnings per share | = | Consolidated net profit attributable to the equity holders of the Company excluding cumulative distribution of other equity instruments/Weighted average number of the Company’s outstanding ordinary shares |
| Weighted average of return on equity | = | Consolidated net profit attributable to equity holders of the Company/Weighted average number of equity attributable to equity holders of the Company (less non-controlling interests) *100% |
- 89 -
| 2. | ITEMS AND AMOUNTS OF NON-RECURRING ITEMS |
For the six months ended 30 June 2021 | ||||
| Net gain on disposal of non-current assets | 190,167,723 | |||
| Government grants recognised though profit or loss | 435,262,210 | |||
| The investment income of derivative financial instruments and other equity instrument investments (excluding effective hedging instruments related to operating activities of the company) | (27,789 | ) | ||
| Reversal of loss allowances for receivables individually tested for impairments | 3,572,153 | |||
| Profits and losses from entrusted loans | 3,347,037 | |||
| Non-operating income and expenses besides items above | (11,423,173 | ) | ||
| Other items recorded in the profit and loss in accordance with the definition of non-recurring items | (3,831,792 | ) | ||
| 617,066,369 | ||||
| Impact of Income tax | (106,758,749 | ) | ||
| Impact of non-controlling interests (net of tax) | (96,521,933 | ) | ||
| 413,785,687 | ||||
Note 1: The Company and its subsidiaries recognised extraordinary profit and loss items in accordance with the requirement of explanatory Announcement No.1 on Information Disclosure for Companies Offering Their Securities to the Public-Extraordinary Profit and Loss (CSRC announcement [2008] No. 43).
According to the definition of non-recurring items, the non-recurring items that are defined as recurring items are as below:
For the six months ended 30 June 2021 | Reason | |||||
| Value-added tax levied immediately returned and tax deduction | 58,393,500 | Closely related to the normal business of the Company | ||||
| Carbon emissions trading costs | (41,106,256 | ) | Closely related to the normal business of the Company | |||
Note 2: In addition to the above items, other non-operating income is mainly the income from the Company and its subsidiaries’ emission trading income, accepting donations and etc. Other non-operating expenses are mainly the Company and its subsidiaries’ external donations, fines and etc.
Note 3: Other items that meet the definition of extraordinary profit and loss are the expenses for purchasing entrusted management services and the income from providing entrusted operation services.
- 90 -
| 3. | INCOME STATEMENTS FOR THE SIX MONTHS ENDED 30 JUNE 2021 |
(Amounts expressed in RMB, except for share data)
| 2021 | 2020 | 2021 | 2020 | |||||||||||||
| Consolidated | Consolidated | Company | Company | |||||||||||||
| (restated) | ||||||||||||||||
| Operating revenue | 95,115,588,347 | 79,148,855,317 | 12,632,567,850 | 20,984,028,280 | ||||||||||||
| Less: Operating cost | 82,487,813,485 | 63,579,468,162 | 11,670,545,493 | 16,904,231,073 | ||||||||||||
| Taxes and surcharges | 941,225,899 | 887,413,289 | 152,501,770 | 269,278,253 | ||||||||||||
| Selling expenses | 92,230,950 | 55,470,161 | 3,495,044 | 15,677,060 | ||||||||||||
| General and administrative expenses | 2,486,146,418 | 2,023,583,294 | 709,864,863 | 835,072,305 | ||||||||||||
| Research and development expenses | 121,545,919 | 56,564,526 | 36,544,807 | 42,644,857 | ||||||||||||
| Financial expenses | 4,188,229,067 | 4,812,635,295 | 1,026,107,256 | 1,469,115,376 | ||||||||||||
| Including: Interest expenses | 4,258,959,611 | 4,887,396,866 | 1,080,902,551 | 1,481,418,610 | ||||||||||||
| Interest income | 135,031,524 | 154,685,854 | 61,671,068 | 54,676,237 | ||||||||||||
| Add: Other income | 473,054,802 | 393,376,909 | 55,251,126 | 88,349,949 | ||||||||||||
| Investment income | 893,672,926 | 941,195,258 | 1,616,677,271 | 1,905,707,604 | ||||||||||||
| Including: Investment income from associates and joint ventures | 894,615,476 | 1,043,627,111 | 846,892,318 | 985,640,421 | ||||||||||||
| Loss from termination recognition of financial assets measured at amortized cost | (5,364,650 | ) | (21,914,594 | ) | – | – | ||||||||||
| (Loss)/gain from changes in fair value | (27,789 | ) | 255,385 | – | – | |||||||||||
| Credit losses | 3,325,996 | (2,163,996 | ) | – | – | |||||||||||
| Impairment losses | (750,591 | ) | (278,490 | ) | (1,720,248 | ) | – | |||||||||
| Gain on disposal of non-current assets | 177,191,805 | 442,594 | 3,147,510 | 208,829 | ||||||||||||
| Operating profit | 6,344,863,758 | 9,066,548,250 | 706,864,276 | 3,442,275,738 | ||||||||||||
| Add: Non-operating income | 112,511,679 | 116,488,816 | 18,126,265 | 55,151,875 | ||||||||||||
| Less: Non-operating expenses | 131,464,282 | 31,179,805 | 71,062,259 | 11,590,872 | ||||||||||||
| Profit before income tax expense | 6,325,911,155 | 9,151,857,261 | 653,928,282 | 3,485,836,741 | ||||||||||||
| Less: Income tax expense | 1,154,782,960 | 2,037,829,535 | 10,293,437 | 677,710,964 | ||||||||||||
| Net profit | 5,171,128,195 | 7,114,027,726 | 643,634,845 | 2,808,125,777 | ||||||||||||
| The net profit of the merged parties before the merger under common control | – | 6,274,518 | – | – | ||||||||||||
| (1) Classification according to the continuity of operation | ||||||||||||||||
| – Continuous operating net profit | 5,171,128,195 | 7,114,027,726 | 643,634,845 | 2,808,125,777 | ||||||||||||
| (2) Classification according to ownership Attributable to: | ||||||||||||||||
| – Equity holders of the Company | 4,282,135,954 | 5,732,267,235 | 643,634,845 | 2,808,125,777 | ||||||||||||
| – Non-controlling interests | 888,992,241 | 1,381,760,491 | – | – | ||||||||||||
| Other comprehensive income/(loss), net of tax | 290,181,303 | (668,200,728 | ) | (33,225,259 | ) | (130,383,196 | ) | |||||||||
| Other comprehensive income/(loss), net of tax, attributable to equity holders of the Company | 268,877,843 | (519,116,898 | ) | (33,225,259 | ) | (130,383,196 | ) | |||||||||
| (1) Items that will not be reclassified to profit or loss: | ||||||||||||||||
| Including: | ||||||||||||||||
| Fair value changes of other equity instrument investments | 3,108,270 | (565,994 | ) | – | – | |||||||||||
| Share of other comprehensive loss of investees accounted for under the equity method (non-recycling) | (34,206,024 | ) | (131,390,728 | ) | (34,206,024 | ) | (131,390,728 | ) | ||||||||
| (2) Items that may be reclassified subsequently to profit or loss: | ||||||||||||||||
| Including: | ||||||||||||||||
| Share of other comprehensive income of investees accounted for under the equity method (recycling) | 980,765 | 1,007,532 | 980,765 | 1,007,532 | ||||||||||||
| Cash flow hedges | 607,865,342 | (91,143,512 | ) | – | – | |||||||||||
| Translation differences of the financial statements of foreign operations | (308,870,510 | ) | (297,024,196 | ) | – | – | ||||||||||
| Other comprehensive income/(loss) attributable to non-controlling interests, net of tax | 21,303,460 | (149,083,830 | ) | – | – | |||||||||||
| Total comprehensive income | 5,461,309,498 | 6,445,826,998 | 610,409,586 | 2,677,742,581 | ||||||||||||
| Attributable to: | ||||||||||||||||
| – Equity holders of the Company | 4,551,013,797 | 5,213,150,337 | 610,409,586 | 2,677,742,581 | ||||||||||||
| – Non-controlling interests | 910,295,701 | 1,232,676,661 | – | – | ||||||||||||
| Earnings per share (based on the net profit attributable to equity holders of the Company) | ||||||||||||||||
| Basic earnings per share | 0.21 | 0.32 | – | – | ||||||||||||
| Diluted earnings per share | 0.21 | 0.32 | – | – | ||||||||||||
- 91 -
| 4. | Financial Statements Reconciliation between PRC GAAP and IFRSs |
The financial statements, which have been prepared by the Group in conformity with Accounting Standards for Business Enterprises (“PRC GAAP”), differ in certain respects from those of IFRSs. The major impact of adjustments for IFRSs, on the consolidated net profit attributable to equity holders of the Company, is summarised as follows:
Consolidated net | ||||||||
For the six months | ||||||||
| 2021 | 2020 | |||||||
| (Restated) | ||||||||
| Consolidated net profit attributable to equity holders of the Company under PRC GAAP | 4,282,136 | 5,732,267 | ||||||
| Impact of IFRS adjustments: | ||||||||
| Differences in accounting treatment on business combinations under common control and depreciation, amortisation, disposal and impairment of assets acquired in business combinations under common control (A) | (405,574 | ) | (549,532 | ) | ||||
| Difference on depreciation related to borrowing costs capitalised in previous years (B) | (13,508 | ) | (13,508 | ) | ||||
| Others | (36,871 | ) | 7,060 | |||||
| Applicable deferred income tax impact of the GAAP differences above (C) | 98,069 | 142,386 | ||||||
| Profit attributable to non-controlling interests on the adjustments above | 94,288 | 122,352 | ||||||
| Consolidated net profit attributable to equity holders of the Company under IFRSs | 4,018,540 | 5,441,025 | ||||||
- 92 -
| (A) | DIFFERENCES IN THE ACCOUNTING TREATMENT ON BUSINESS COMBINATIONS UNDER COMMON CONTROL AND DEPRECIATION, AMORTISATION, DISPOSAL AND IMPAIRMENT UNDER COMMON CONTROL |
Huaneng Group is the parent company of HIPDC, which in turn is also the ultimate parent of the Company. The Company has carried out a series of acquisitions from Huaneng Group and HIPDC in recent years. As the acquired power companies and plants and the Company were under common control of Huaneng Group before and after the acquisitions, such acquisitions were regarded as business combinations under common control.
In accordance with PRC GAAP, for business combinations under common control, the assets and liabilities acquired in business combinations are measured at the carrying amounts of the acquirees in the consolidated financial statements of the ultimate controlling party on the acquisition date. The difference between the carrying amounts of the net assets acquired and the consideration paid is adjusted to the equity account of the acquirer. The operating results for all periods presented are retrospectively restated as if the current structure and operations resulting from the acquisition had been in existence since the beginning of the earliest year presented, with financial data of previously separate entities consolidated. The cash consideration paid by the Company is treated as an equity transaction in the year of acquisition. The subsequent adjustment of contingent consideration after the acquisition date is also accounted for as an equity transaction.
- 93 -
For business combinations occurred prior to 1 January 2007, in accordance with the previous PRC GAAP, when equity interests acquired were less than 100%, the assets and liabilities of the acquirees were measured at their carrying amounts. The excess of the consideration over the proportionate share of the carrying amounts of the net assets acquired was recorded as an equity investment difference and amortised on a straight-line basis for not more than 10 years. When acquiring the entire equity, the entire assets and liabilities are accounted for in a manner similar to purchase accounting. Goodwill arising from such transactions was amortised over the estimated useful lives on a straight-line basis. On 1 January 2007, in accordance with PRC GAAP, the unamortised equity investment differences and goodwill arising from business combinations under common control were written off against undistributed profits.
Under IFRSs, the Company and its subsidiaries have adopted the purchase method to account for the acquisitions above. The assets and liabilities acquired in acquisitions were recorded at fair value by the acquirer. The excess of the acquisition cost over the proportionate share of fair value of net identifiable assets acquired was recorded as goodwill. Goodwill is not amortised but is tested annually for impairment and carried at cost less accumulated impairment losses. The operating results of the acquirees are consolidated in the operating results of the Company and its subsidiaries from the acquisition dates onwards. The contingent consideration not classified as equity is measured at fair value at each reporting date with the changes in fair value recognised in profit or loss, if such changes are not measurement period adjustments.
As mentioned above, the differences in the accounting treatment under PRC GAAP and IFRSs on business combinations under common control affect both equity and profit. Meanwhile, due to different measurement bases of the assets acquired, depreciation and amortisation in the period subsequent to the acquisition will be affected which will also affect the equity and profit or loss upon subsequent disposals of such investments. Such differences will be gradually eliminated following subsequent depreciation, amortisation and disposal of the related assets.
- 94 -
| (B) | EFFECT OF DEPRECIATION ON THE CAPITALISATION OF BORROWING COSTS IN PREVIOUS YEARS |
In previous years, under the previous PRC GAAP, the scope of capitalisation of borrowing costs was limited to specific borrowings, and thus, borrowing costs arising from general borrowings were not capitalised. In accordance with IFRSs, the Company and its subsidiaries capitalised borrowing costs on general borrowings used for the purpose of obtaining qualifying assets in addition to the capitalisation of borrowing costs on specific borrowings. From 1 January 2007 onwards, the Company and its subsidiaries adopted PRC GAAP No. 17 prospectively. The current adjustments represent the related depreciation on capitalised borrowing costs included in the cost of the related assets under IFRSs in previous years.
| (C) | DEFERRED INCOME TAX IMPACT ON GAAP DIFFERENCES |
This represents related deferred income tax impact on the GAAP differences above where applicable.
- 95 -
Hong Kong Exchanges and Clearing Limited and The Stock Exchange of Hong Kong Limited take no responsibility for the contents of this announcement, make no representation as to its accuracy or completeness and expressly disclaim any liability whatsoever for any loss howsoever arising from or in reliance upon the whole or any part of the contents of this announcement.

CONNECTED TRANSACTION FORMATION OF FENGCHENG COMPANY
On 27 July 2021, Clean Energy Company entered into the Joint Venture Agreement with Pro- Power Investment. Pursuant to the terms and conditions of the Joint Venture Agreement, Clean Energy Company will jointly establish Fengcheng Company with Pro-Power Investment. Clean Energy Company will subscribe for the registered capital of no more than RMB924 million, and Pro-Power Investment will subscribe for RMB396 million (or equivalent in US dollars). Upon completion of the Transaction, Clean Energy Company will hold 70% of the equity interest of Fengcheng Company, while Pro-Power Investment would hold 30% of the equity interest of Fengcheng Company.
As of the date of this announcement, Huaneng Group holds a 75% direct interest and a 25% indirect interest in HIPDC, while HIPDC, being the direct controlling shareholder of the Company, holds a 32.28% interest in the Company. Huaneng Group also holds a 9.91% direct interest in the Company and holds a 3.01% indirect interest in the Company through its wholly- owned subsidiary Hua Neng HK, a 0.84% indirect interest in the Company through Huaneng Treasury, its indirect wholly-owned subsidiary, and a 0.39% indirect interest in the Company through its controlling subsidiary Huaneng Finance. Pro-Power Investment is a wholly-owned subsidiary of Hua Neng HK. According to the Hong Kong Listing Rules, Pro-Power Investment is an associate of the connected person of the Company, and the Transaction constitutes a connected transaction of the Company.
According to the relevant percentage ratios as calculated pursuant to Rule 14.07 of the Hong Kong Listing Rules, the Transaction does not constitute a notifiable transaction under Chapter 14 of the Hong Kong Listing Rules. However, the Transaction constitutes a connected transaction under Chapter 14A of the Hong Kong Listing Rules. As the scale of the Transaction exceeds 0.1% but does not exceed 5% of the applicable percentage ratios (other than the profit ratio) as calculated pursuant to Rule 14.07 of the Hong Kong Listing Rules, the Transaction is only required to comply with the reporting and announcement requirement under Rules 14A.71 and 14A.35 of the Hong Kong Listing Rules but is exempt from independent shareholders’ approval requirements.
- 1 -
| I. | INTRODUCTION |
On 27 July 2021, Clean Energy Company entered into the Joint Venture Agreement with Pro- Power Investment. Pursuant to the terms and conditions of the Joint Venture Agreement, Clean Energy Company will jointly establish Fengcheng Company with Pro-Power Investment. Clean Energy Company will subscribe for the registered capital of no more than RMB924 million, and Pro-Power Investment will subscribe for RMB396 million (or equivalent in US dollars). Upon completion of the Transaction, Clean Energy Company will hold 70% of the equity interest of Fengcheng Company, while Pro-Power Investment would hold 30% of the equity interest of Fengcheng Company. Fengcheng Company will become a subsidiary of Clean Energy Company and the financial results of Fengcheng Company will be consolidated into the financial statements of Clean Energy Company.
Clean Energy Company will pay the consideration for the subscription with its own fund.
| II. | RELATIONSHIP AMONG THE COMPANY, CLEAN ENERGY COMPANY AND PRO- POWER INVESTMENT |
The Company and its subsidiaries mainly develop, construct, operate and manage large-scale power plants in China. It is one of the largest listed power suppliers in China. As at the date of this announcement, the Company’s controlled generation capacity is 114,042 MW and the equity based generation capacity is 99,891 MW.
Clean Energy Company, established on 8 July 2013, is a wholly-owned subsidiary of the Company and is principally engaged in the production and supply of electricity, and the investment, construction, operation and management of clean energy projects, etc..
Pro-Power Investment was incorporated 28 May 2003 in Hong Kong. It is a wholly-owned subsidiary of Hua Neng HK and is mainly engaged in investment business.
As of the date of this announcement, Huaneng Group holds a 75% direct interest and a 25% indirect interest in HIPDC, while HIPDC, being the direct controlling shareholder of the Company, holds a 32.28% interest in the Company. Huaneng Group also holds a 9.91% direct interest in the Company and holds a 3.01% indirect interest in the Company through its wholly- owned subsidiary Hua Neng HK, a 0.84% indirect interest in the Company through Huaneng Treasury, its indirect wholly-owned subsidiary, and a 0.39% indirect interest in the Company through its controlling subsidiary Huaneng Finance. Pro-Power Investment is a wholly-owned subsidiary of Hua Neng HK. According to the Hong Kong Listing Rules, Pro-Power Investment is an associate of the connected person of the Company, and the Transaction constitutes a connected transaction of the Company.
- 2 -
As of the date of this announcement, the connected relationship between the Company and Pro- Power Investment is illustrated as follows:
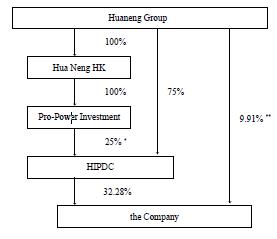
* Huaneng Group, through its wholly-owned subsidiary i.e. Hua Neng HK, indirectly holds 100% of Pro-Power Investment while Pro-Power Investment holds a 25% interest in HIPDC. Therefore, Huaneng Group holds a 25% indirect interest in HIPDC.
** Huaneng Group holds a 9.91% direct interest in the Company and holds a 3.01% interest in the Company through its wholly-owned subsidiary Hua Neng HK, a 0.84% indirect interest in the Company through Huaneng Treasury, its controlling subsidiary, and a 0.39% indirect interest in the Company through its controlling subsidiary Huaneng Finance.
| III. | BASIC INFORMATION OF THE CONNECTED TRANSACTION |
The principal terms of the Joint Venture Agreement are set out as follows:
| 1. | Date |
27 July 2021
| 2. | Parties |
| (1) | Clean Energy Company |
| (2) | Pro-Power Investment |
- 3 -
| 3. | Mode of co-operation |
Both parties will establish Fengcheng Company, with Clean Energy Company to contribute 70% and Pro-Power Investment to contribute 30%. The registered capital of Fengcheng Company is RMB1.32 billion. After the establishment of Fengcheng Company, Clean Energy Company will contribute RMB924 million, and Pro-Power Investment will contribute RMB396 million according to the proportion. Of which, the capital contribution by Pro-Power Investment will be the equivalent in US dollars at the central parity rate of the exchange rate announced by the State Administration of Foreign Exchange on the day when the payment takes place. Capital contribution time: Capital injection in batches according to requirements of project progress, but Clean Energy Company shall complete the capital contribution equal to that of Pro-Power Investment before 31 December 2021.
| 4. | Corporate Governance |
Fengcheng Company will establish a board of directors comprising 4 directors, with two directors recommended by Clean Energy Company, one director recommended by Pro- Power Investment and one staff-elected director. The chairman will be recommended by Clean Energy Company and elected by the board of directors.
Fengcheng Company will establish a board of supervisors comprising 4 supervisors, with two supervisors recommended by Clean Energy Company, one supervisor recommended by Pro-Power Investment and one staff-elected supervisor. The chairman will be recommended by Pro-Power Investment and elected by the board of supervisors.
Fengcheng Company has one general manager and several deputy general managers. The general manager and the person in charge of finance will be recommended by Clean Energy Company; the general manager and deputy general managers of the joint venture company will be appointed by the board of directors.
Fengcheng Company will establish a party committee (or general party branch), which is subordinate to the party committee of Clean Energy Company. The party secretary (or party branch secretary) and the discipline inspection secretary will be recommended and appointed by Clean Energy Company.
| 5. | Effectiveness |
The Joint Venture Agreement shall come into effect upon being signed by the parties thereto.
- 4 -
| IV. | BASIC INFORMATION OF FENGCHENG COMPANY |
Fengcheng Company is planned to be jointly funded and established by Clean Energy Company and Pro-Power Investment. Fengcheng Company will develop the photovoltaic base projects in Fengcheng, carry out project feasibility study and design, external delivery and access and consumption, construction and operation of projects.
| V. | PRICING OF THE TRANSACTION |
Clean Energy Company will contribute no more than RMB924 million, and Pro-Power Investment will contribute RMB396 million (or equivalent in US dollars). After the completion of the Transaction, Clean Energy Company will hold 70% of the equity interest of Fengcheng Company, and Pro-Power Investment will hold 30% of the equity interest of Fengcheng Company.
| VI. | PURPOSE OF THE TRANSACTION AND THE EFFECT ON THE COMPANY |
In order to increase the proportion of the clean energy installed capacity of the Company, optimize the industrial structure and meet the development and construction requirements of photovoltaic base projects in Fengcheng, it is planned to establish Fengcheng Company.
After the completion of the Transaction, Clean Energy Company will consolidate the financial statements of Fengcheng Company. The Transaction will not have a significant impact on the Company’s financial status, and there is no situation that will harm the Company and the interests of its shareholders.
| VII. | IMPLICATIONS UNDER THE HONG KONG LISTING RULES |
According to the relevant percentage ratios as calculated pursuant to Rule 14.07 of the Hong Kong Listing Rules, the Transaction does not constitute a notifiable transaction under Chapter
14 of the Hong Kong Listing Rules. However, the Transaction constitutes a connected transaction under Chapter 14A of the Hong Kong Listing Rules. As the scale of the Transaction exceeds 0.1% but does not exceed 5% of the applicable percentage ratios (other than the profit ratio) as calculated pursuant to Rule 14.07 of the Hong Kong Listing Rules, the Transaction is only required to comply with the reporting and announcement requirement under Rules 14A.71 and 14A.35 of the Hong Kong Listing Rules but is exempt from independent shareholders’ approval requirements.
| VIII. | PROCEDURAL MATTER RELATING TO THE TRANSACTION |
On 27 July 2021, the Fifteenth Meeting of the Tenth Session of the Board of Directors of the Company has considered and approved the resolution regarding the Transaction. According to the SSE Listing Rules and the Hong Kong Listing Rules, Zhao Keyu, Zhao Ping, Huang Jian, Wang Kui, Lu Fei and Teng Yu, all being Directors of the Company having related relationship, abstained from voting on the resolution relating to the Transaction.
- 5 -
The Directors (including the independent non-executive Directors) are of the view that the Joint Venture Agreement was entered into: (1) on normal commercial terms (on arm’s length basis or on terms no less favorable to the Company than terms available from independent third parties);
(2) on terms that are fair and reasonable and are in the interests of the Company and its shareholders as a whole and (3) in the ordinary and usual course of business of the Company.
| IX. | DEFINITIONS |
| “associate(s)” | has the meaning ascribed to it in the Hong Kong Listing Rules |
| “Clean Energy Company” | Huaneng Jiangxi Clean Energy Co., Ltd. |
| “Company” | Huaneng Power International, Inc. |
| “Director(s)” | the director(s) of the Company (including independent non- executive director(s)) |
| “Fengcheng Company” | Huaneng Fengcheng New Energy Co., Ltd., which Clean Energy |
| Company plans to jointly fund and establish with Pro- Power Investment (tentative name, subject to the approval of the Market Supervision and Management Department) |
| “HIPDC” | Huaneng International Power Development Corporation “Hong Kong Listing Rules” the Rules Governing the Listing of Securities on the Hong Kong Stock Exchange |
| “Hong Kong Stock Exchange” | The Stock Exchange of Hong Kong Limited |
| “Hua Neng HK” | China Hua Neng Group Hong Kong Limited |
| “Huaneng Finance” | China Huaneng Finance Corporation Limited |
| “Huaneng Group” | China Huaneng Group Co., Ltd. |
| “Huaneng Treasury” | China Huaneng Group Treasury Management (Hong Kong) Limited |
- 6 -
| “Joint Venture Agreement” | the “Agreement regarding the establishment of a joint venture company |
| between Huaneng Jiangxi Clean Energy Co., Ltd. and Pro-Power Investment Limited” signed between Clean Energy Company and Pro-Power Investment on 27 July 2021 |
| “PRC” or “China” | the People’s Republic of China |
| “Pro-Power Investment” | Pro-Power Investment Limited |
| “ |
| RMB” | Renminbi, the lawful currency of the PRC |
| “SSE Listing Rules” | Rules Governing the Listing of Securities on Shanghai Stock Exchange |
| “Transaction” | according to the terms and conditions of the agreement for establishment of the joint venture company, Clean Energy Company and Pro-Power Investment would jointly fund the establishment of Fengcheng Company. Among which, Clean Energy Company would subscribe for 70% of the registered capital of Fengcheng Company with no more than RMB924 million, and Pro-Power Investment would subscribe for 30% of the registered capital of Fengcheng Company with RMB396 million (or equivalent in US dollars) |
By order of the Board
Huaneng Power International, Inc.
Huang Chaoquan
Company Secretary
As of the date of the announcement, the directors of the Company are:
| Zhao Keyu (Executive Director) | Xu Mengzhou (Independent Non-executive Director) |
| Zhao Ping (Executive Director) | Liu Jizhen (Independent Non-executive Director) |
| Huang Jian (Non-executive Director) | Xu Haifeng (Independent Non-executive Director) |
| Wang Kui (Non-executive Director) | Zhang Xianzhi (Independent Non-executive Director) |
| Lu Fei (Non-executive Director) | Xia Qing (Independent Non-executive Director) |
| Teng Yu (Non-executive Director) | |
| Mi Dabin (Non-executive Director) | |
| Cheng Heng (Non-executive Director) | |
| Li Haifeng (Non-executive Director) | |
| Lin Chong (Non-executive Director) |
Beijing, the PRC
- 7 -
28 July 2021
- 8 -