Commission file number: 1-3330
UNITED STATES
SECURITIES AND EXCHANGE COMMISSION
WASHINGTON, D.C. 20549
FORM 20-F
ANNUAL REPORT
PURSUANT TO SECTION 13 OR 15(d) OF
THE SECURITIES EXCHANGE ACT OF 1934
For the fiscal year ended December 31, 2013
PT Indosat Tbk
(Exact name of Registrant as specified in its charter)
REPUBLIC OF INDONESIA
(Jurisdiction of incorporation or organization)
Indosat Building
Jalan Medan Merdeka Barat No. 21
Jakarta 10110—Indonesia
(62-21) 3000 3001
(Address and telephone number of principal executive offices)
| | |
Name: | | Bayu Hanantasena |
Telephone: | | (62 21) 3000 3001 |
Email: | | investor@indosat.com |
Facsimile: | | (62 21) 3000 3757 |
Address: | | Jalan Medan Merdeka Barat No. 21 |
| | Jakarta 10110 |
| | Indonesia |
Securities registered pursuant to Section 12(b) of the Act.
| | | | |
Title of each Class | | Name of each exchange
on which registered | |
Series B shares, par value Rp100 per share | | | None | * |
Securities registered or to be registered pursuant to Section 12(g) of the Act.
None
Securities for which there is a reporting obligation pursuant to Section 15(d) of the Act.
None
Indicate the number of outstanding shares of each of the issuer’s classes of capital or common stock as of the close of the period covered by the annual report.
| | | | |
Series A shares, par value Rp100 per share | | | 1 | |
Series B shares, par value Rp100 per share | | | 5,433,933,499 | |
Indicate by check mark if the registrant is a well-known seasoned issuer, as defined in Rule 405 of the Securities Act.
Yes x No ¨
If this report is an annual or transition report, indicate by check mark if the registrant is not required to file reports pursuant to Section 13 or 15(d) of the Securities Exchange Act of the Securities Exchange Act of 1934.
Yes ¨ No x
Indicate by check mark whether the registrant: (1) has filed all reports required to be filed by Section 13 or 15(d) of the Securities Exchange Act of 1934 during the preceding 12 months (or for such shorter period that the registrant was required to file such reports), and (2) has been subject to such filing requirements for the past 90 days.
Yes x No ¨
Indicate by check mark whether the registrant has submitted electronically and posted on its corporate Web site, if any, every Interactive Data File required to be submitted and posted pursuant to Rule 405 of Regulation S-T (§232.405 of this chapter) during the preceding 12 months (or for such shorter period that the registrant was required to submit and post such files).
Yes ¨ No x
Indicate by check mark whether the registrant is a large accelerated filer, an accelerated filer, or a non-accelerated filer. See definition of “accelerated filer and large accelerated filer” in Rule 12b-2 of the Exchange Act.
Large accelerated filer x Accelerated filer ¨ Non-accelerated filer ¨
Indicate by check mark which basis of accounting the registrant has used to prepare the financial statements included in this filing:
U.S. GAAP ¨ International Financial Reporting Standards as issued by the International Accounting Standards Board x Other ¨
If “Other” has been checked in response to the previous question, indicate by check mark which financial statement item the registrant has elected to follow.
Item 17 ¨ Item 18 ¨
If this is an annual report, indicate by check mark whether the registrant is a shell company (as defined in Rule 12b-2 of the Exchange Act).
Yes ¨ No x
| * | Not for trading, but only in connection with the previous listing of American Depositary Shares pursuant to the requirements of the New York Stock Exchange. The American Depositary Shares have been delisted from the New York Stock Exchange effective May 17, 2013. |
TABLE OF CONTENTS
i
CERTAIN DEFINITIONS, CONVENTIONS AND GENERAL INFORMATION
Unless the context otherwise requires, references in this Form 20-F to the “Company,” “Indosat,” “we,” “us” and “our” are to PT Indosat Tbk and its consolidated subsidiaries. All references to “Indonesia” are references to the Republic of Indonesia. All references to the “Government” herein are references to the Government of the Republic of Indonesia. References to “United States” or “U.S.” are to the United States of America. References to “United Kingdom” are to the United Kingdom of Great Britain and Northern Ireland. References to “Indonesian rupiah” or “Rp” are to the lawful currency of Indonesia and references to “U.S. dollars” or “US$” are to the lawful currency of the United States. Certain figures (including percentages) have been rounded for convenience, and therefore indicated and actual sums, quotients, percentages and ratios may differ.
Our consolidated financial statements as of January 1, 2012 (restated) and December 31, 2012 (restated) and 2013, and for the years ended December 31, 2011 (restated), 2012 (restated) and 2013 included in this annual report have been prepared in accordance with International Financial Reporting Standards (“IFRS”) as issued by the International Accounting Standards Board (“IASB”). Our consolidated financial statements included in this annual report contain the restatement of our consolidated statements of financial position as of January 1, 2012 and December 31, 2012 and consolidated statements of comprehensive income and consolidated statements of changes in equity for the years ended December 31, 2011 and 2012, to reflect the retrospective adjustment made due to the implementation of IAS 19 “Employee Benefits (Revised 2011),” which is detailed in Note 2d to our consolidated financial statements included elsewhere in this annual report. The revised standard (i) eliminated the “corridor approach” permitted under the previous version of IAS 19 and (ii) provided significant changes in the recognition, presentation and disclosure of post-employment benefits.
Solely for the convenience of the reader, certain Indonesian rupiah amounts have been translated into U.S. dollars at specified rates. The Indonesian rupiah/U.S. dollar exchange rate is the middle exchange rate announced by Bank Indonesia calculated based on Bank Indonesia’s buying and selling rates. Unless otherwise indicated, U.S. dollar equivalent information for amounts in Indonesian rupiah is translated at the middle exchange rate announced by Bank Indonesia for December 31, 2013, which was Rp12,189 per U.S. dollar. The middle exchange rate of Indonesian rupiah for U.S. dollars on April 24, 2014 was Rp11,608 per U.S. dollar. The Federal Reserve Bank of New York does not certify for customs purposes a noon buying rate for cable transfers in Indonesian rupiah. No representation is made that the Indonesian rupiah or U.S. dollar amounts shown herein could have been or could be converted into U.S. dollars or Indonesian rupiah, as the case may be, at any particular rate or at all. See “Item 3: Key Information—Exchange Rate Information” for further information regarding rates of exchange between Indonesian rupiah and U.S. dollars.
FORWARD-LOOKING STATEMENTS
This Form 20-F contains “forward-looking statements,” as defined in Section 27A of the Securities Act, Section 21E of the U.S. Securities Exchange Act of 1934, as amended, or the Exchange Act, and within the meaning of the Private Securities Litigation Reform Act of 1995, including statements regarding our expectations and projections for our future operating performance and business prospects. The words “believe,” “expect,” “anticipate,” “estimate,” “project” and similar words identify forward-looking statements. In addition, all statements other than statements of historical facts included in this Form 20-F are forward-looking statements. Although we believe that the expectations reflected in the forward-looking statements herein are reasonable, we can give no assurance that such expectations will prove to be correct. These forward-looking statements are subject to a number of risks and uncertainties, including changes in the economic, social and political environments in Indonesia. This Form 20-F discloses, under “Item 3: Key Information—Risk Factors” and elsewhere, important factors that could cause actual results to differ materially from our expectations.
ii
GLOSSARY
The explanations of technical terms set forth below are intended to assist you to understand such terms, but are not intended to be technical definitions.
“2G” | second generation of wireless telephone technology that includes GSM, Interim Standard-95 (IS-95) and personnel digital cellular (PDC) technology |
“3G” | third generation of mobile telecommunications standards, including Wideband Code Division Multiple Access/Universal Mobile Telecommunication System (WCDMA/UMTS) |
“active cellular subscriber” | a cellular subscriber who: (i) in the case of a postpaid cellular subscriber, has no outstanding balance remaining due more than 120 days after the last statement date, or (ii) in the case of a prepaid cellular subscriber, is either a “new active prepaid cellular subscriber” or a “recharging active prepaid cellular subscriber.” A “new active prepaid cellular subscriber” is a subscriber who has, as of the relevant date, activated a new prepaid SIM card within the last 63 days of the relevant date (such period is defined as the “new prepaid cellular subscriber life cycle”). The “new prepaid cellular subscriber life cycle” includes a 30-day “active period,” a 30-day “grace period” and a 3-day expiry period. A “recharging active prepaid cellular subscriber” is an existing prepaid cellular subscriber who recharges the SIM card within a 33-day “grace period” immediately following the SIM card’s expiry date by adding certain minimum amounts to the SIM card |
“ADR” | American Depositary Receipt. |
“ADS” | American Depositary Share, a security that represents an ownership interest in the shares of a foreign private issuer, as evidenced by an ADR. Each of our ADSs represents 50 shares of our common stock. |
“analog” | a signal, whether voice, video or data, which is transmitted in similar, or analogous, signals; commonly used to describe telephone transmission and/or switching services that are not digital |
“ARPM” | the average monthly revenue per minute (in Indonesian rupiah), computed by dividing revenues from monthly recurring prepaid and postpaid cellular services, excluding non-recurring revenues such as activation fees and special auctions of telephone numbers, for the relevant period, by the total minutes (billed and unbilled) of outgoing call usage of prepaid and postpaid cellular subscribers for such period |
“ARPU” | Average Revenue Per User, an evaluation statistic for a network operator’s subscriber base. ARPU is computed by dividing monthly recurring prepaid and postpaid cellular services revenues (usage charges, value-added services, interconnection revenues and monthly subscription charges), excluding non-recurring revenues such as activation fees and special auctions of telephone numbers, for the |
iii
| | relevant period by the average number of prepaid and postpaid cellular subscribers. The average number of prepaid and postpaid cellular subscribers is the sum of the total number of active cellular subscribers at the beginning and end of each month divided by two. |
“ATM” | Asynchronous Transfer Mode, the standard packet-switching protocol for transmitting and receiving data via cell relay (uniform 53-byte cells), wherein information for multiple service types, such as voice, video or data is conveyed in small, fixed-size cells |
“attenuation” | gradual loss in intensity of radio frequency signals by absorption and scattering |
“backbone” | the highest level in hierarchical network and designed to carry the heaviest traffic. Backbones are either switched (using ATM, frame relay or both) or routed (using only routers and no switches). The transmission links between nodes or switching facilities consist of microwave, submarine cable, satellite, optical fiber or other transmission technology |
“bandwidth” | the capacity of a communication link |
“base station controller” | the controlling equipment in a 2G network that coordinates the operation of multiple BTSs |
“BPKP” | Badan Pengawasan Keuangan dan Pembangunanor Finance and Development Supervisory Agency |
“BTS” | Base Transceiver Station, a mobile phone base station comprised of radio transmitter and receiver units used for transmitting and receiving voice and data to and from mobile phones in a particular cell area |
“CDMA” | Code Division Multiple Access, a transmission technology where each transmission is sent over multiple frequencies and a unique code is assigned to each data or voice transmission, allowing multiple users to share the same frequency spectrum |
“cellular backhaul” | the transmission lines that connect base station controllers, BTSs and mobile switching centers |
“churn rate” | the subscriber disconnections for a given period, determined by dividing the sum of voluntary and involuntary deactivations during the period by the average number of cellular subscribers for the same period. The average number of cellular subscribers is the sum of the total number of active cellular subscribers at the beginning and end of each month divided by two |
“dBW” | decibel referencing one watt |
“Depositary” | The Bank of New York Mellon, as depositary to the ADS program |
iv
“DGPIM” | Director General of Posts and Informatics Management |
“digital” | a method of storing, processing and transmitting information through the use of distinct electronic or optical pulses that represent the binary digits 0 and 1. Digital transmission and switching technologies employ a sequence of these pulses to represent information as opposed to the continuously variable analog signal. Compared to analog networks, digital networks allow for greater capacity, lower interference, protection against eavesdropping and automatic error correction |
“DLD” | Domestic Long-Distance, long-distance telecommunications services within a country |
“EDGE” | Enhanced Data GSM Environment, a faster version of the global system for GSM wireless service designed to deliver data at rates of up to 384 Kbps, thereby enabling the delivery of multimedia and other broadband applications to mobile users |
“fiber optic cable” | a transmission medium constructed from extremely pure and consistent glass through which digital signals are transmitted as pulses of light. Fiber optic cables offer greater transmission capacity and lower signal distortion than traditional copper cables |
“Fixed telecommunication” | also referred to as “fixed voice service” and includes IDD, DLD and fixed local service. This service also includes fixed wireless access service |
“fixed wireless access” or “FWA” | fixed wireless access service, a limited mobility service that links to an area code |
“frame relay” | a form of packet switching protocol which breaks data stream into small data packets called “frames,” equipped with more sophisticated error detection and correction checking, compared to traditional forms of packet switching (also referred to as “frame net” in our audited consolidated financial statements included elsewhere in this annual report) |
“GPRS” | General Packet Radio Service, a standard for cellular communications which supports a wide range of bandwidths and is particularly suited for sending and receiving data, including e-mail and other high bandwidth applications |
“Greater Jakarta” | Jakarta, Banten, Bogor, Depok, Tangerang and Bekasi |
“GSM” | Global System for Mobile Communications, a digital cellular telecommunications system standardized by the European Telecommunications Standards Institute based on digital transmission and cellular network architecture with roaming in use throughout Europe, Japan and in various other countries |
v
“HSDPA” | High Speed Downlink Packet Access, a packet-based data service or protocol in the 3G (WCDMA/UMTS) standard which provides downlink transmission data at speeds of up to 14.4 Mbps |
“HSPA+” | High Speed Packet Access +, a packet-based data service or protocol in the 3G (WCDMA/UMTS) standard which provides higher downlink and uplink transmission data speeds by enhancing higher order modulation and utilizing multiple-input and multiple-output (MIMO) and multicarrier technologies, reaching downlink speed of up to 42Mbps and uplink speed of up to 11.6Mbps |
“IDD” | International Direct Dialing, a telecommunications service that allows a user to make international long-distance calls without using an operator |
“interconnection” | practice of allowing a competing telecommunications operator to connect its network to the network or network elements of other telecommunications operators to enable the termination of traffic originated by customers of the competing telecommunications operator’s network to the customers of the other telecommunications operator’s network |
“IP VPN” | Internet Protocol Virtual Private Network, a packet-based IP routing service that provides economic data transaction facilities between customer locations while maintaining the level of privacy, reliability and service quality dictated by rapidly evolving businesses. IP VPN service provides flexible any-to-any connectivity using Internet Protocol and allows businesses to communicate privately with branch offices, to exchange corporate network traffic, and to establish communication with trusted external partners at low-wide area networking costs |
“ISP” | Internet Service Provider, a company that provides access to the Internet by providing the interface to the Internet backbone |
“ITRA” | Indonesian Telecommunications Regulatory Authority. |
“Kbps” | kilobits per second, a measure of digital transmission speed |
“LAN” | Local Area Network, a short-distance network designed to connect computers within a localized environment to enable the sharing of data and other communication |
“Lintasarta” | PT Aplikanusa Lintasarta |
“Mbps” | megabits per second, a measure of digital transmission speed |
“media gateway” | a translation unit between telecommunications networks using different standards, such as PSTN, next generation networks and radio access networks |
vi
“MIDI” | Fixed data services, which include multimedia, data communications and Internet services |
“Minutes of Usage” | the minutes of usage per cellular subscriber, computed by dividing the total minutes of outgoing and incoming call usage of prepaid and postpaid cellular subscribers for each month by the average number of active prepaid and postpaid cellular subscribers. The average number of prepaid and postpaid cellular subscribers is the sum of the total number of active cellular subscribers at the beginning and end of each month divided by two |
“MMS” | Multimedia Messaging Services, a cellular telecommunications system that allows SMS messages to include graphics, audio or video components |
“MPLS” | Multi-Protocol Label Switching, a data packet forwarding technology with improved forwarding speed of routers using labels to make data-forwarding decisions that increase the efficiency of data traffic flow through a traffic management pattern that classifies data based on its application |
“network infrastructure” | the fixed infrastructure equipment consisting of fiber optic cables, copper cables, transmission equipment, multiplexing equipment, switches, radio transceivers, antennas, management information systems and other equipment that receives, transmits and processes signals to and from subscriber equipment and/or between wireless networks and fixed networks |
“Node B” | a BTS for a 3G network |
“PSTN” | Public Switched Telephone Network, a fixed telephone network operated and maintained by PT Telekomunikasi Indonesia Tbk |
“RIO” | Reference Interconnection Offer, a regulatory term that refers to the document that covers technical, operational, economic and other aspects of interconnection access by one telecommunications network operator in favor of other telecommunications operators |
“roaming” | the cellular telecommunications feature that permits subscribers of one network to use their mobile handsets and telephone numbers when in a region with cellular network coverage provided by another provider |
“SIM” or “SIM card” | Subscriber Identity Module, the “smart” card designed to be inserted into a mobile handset containing all subscriber-related data such as phone numbers, service details and memory for storing messages |
“SMS” | Short Message Service, a means to send or receive alphanumeric messages to or from mobile handsets |
“VoIP” | Voice over Internet Protocol, a means of sending voice information using Internet protocol. The voice information is transmitted in |
vii
| | discrete packets in digital form rather than the traditional circuit-committed protocols of the PSTN, thereby avoiding the tolls charged by conventional long-distance service providers |
“VSAT” | Very Small Aperture Terminal, a relatively small satellite dish, typically 1.5 to 3.8 meters in diameter, placed at users’ premises and used for two-way data communications through satellite |
“WAP” | Wireless Application Protocol, an open and global standard of technology platform that enables mobile users to access and interact with mobile information services such as e-mail, websites, financial information, online banking information, entertainment (infotainment), games and micro-payments |
“Wi-Fi” | a wireless networking technology that uses radio waves to provide wireless internet and network connections |
“x.25” | a widely used data packet-switching standard that has been partially replaced by frame relay services |
viii
PART I
Item 1: IDENTITY OF DIRECTORS, SENIOR MANAGEMENT AND ADVISERS
Not applicable.
Item 2: OFFER STATISTICS AND EXPECTED TIMETABLE
Not applicable.
Item 3: KEY INFORMATION
Selected Financial and Other Data
The following tables present our selected consolidated financial information and operating statistics as of the dates and for each of the periods indicated. The selected financial information as of and for the years ended December 31, 2009, 2010, 2011, 2012 and 2013 presented below is based upon our audited consolidated financial statements prepared in conformity with IFRS as issued by IASB. In 2013, we adopted IAS 19 “Employee Benefits” (Revised 2011) on a retrospective basis and the 2011 and 2012 consolidated financial statements have been restated as more fully described under “Certain Definitions, Conventions and General Information” of this annual report and in Note 2d to our consolidated financial statements included elsewhere in this annual report. The selected financial information as of and for the years ended December 31, 2009, 2010, 2011, 2012 and 2013 should be read in conjunction with, and is qualified in its entirety by reference to, our audited consolidated financial statements, including the notes thereto, and the other information included elsewhere in this annual report. The audited consolidated financial statements as of and for the year ended December 31, 2009 have been audited by Purwantono, Sarwoko & Sandjaja and the audited consolidated financial statements as of and for the years ended December 31, 2010, 2011, 2012 and 2013 have been audited by Purwantono, Suherman & Surja, the Indonesian member firm of Ernst & Young Global.
1
| | | | | | | | | | | | | | | | | | | | | | | | |
| | | As of December 31, | |
| | | 2009
Rp | | | 2010
Rp | | | 2011
Rp | | | 2012
Rp | | | 2013
Rp | | | 2013
US$(1) | |
| | | | | | | | | (Restated) | | | (Restated) | | | | | | | |
| | | (Rp in billions and US$ in millions, except for number of outstanding shares) | |
Financial Position Data: | | | | | | | | | | | | | | | | | | | | | | | | |
Assets | | | | | | | | | | | | | | | | | | | | | | | | |
Cash and cash equivalents | | | 2,836.0 | | | | 2,075.3 | | | | 2,224.2 | | | | 3,917.2 | | | | 2,233.5 | | | | 183.2 | |
Other current assets (other than cash and cash equivalents)—net | | | 4,302.9 | | | | 3,380.6 | | | | 3,543.4 | | | | 4,391.6 | | | | 4,935.5 | | | | 404.9 | |
Due from related parties—net | | | 7.2 | | | | 8.4 | | | | 10.7 | | | | 10.4 | | | | 7.2 | | | | 0.6 | |
Deferred tax assets—net | | | 88.0 | | | | 94.7 | | | | 120.6 | | | | 114.3 | | | | 101.9 | | | | 8.4 | |
Long-term investments | | | 3.2 | | | | 2.7 | | | | 2.7 | | | | 1,369.7 | | | | 1,393.7 | | | | 114.3 | |
Property and equipment—net | | | 44,358.1 | | | | 43,980.4 | | | | 43,413.0 | | | | 41,860.8 | | | | 42,074.9 | | | | 3,451.9 | |
Goodwill and other intangible assets—net | | | 2,042.8 | | | | 2,063.2 | | | | 2,056.0 | | | | 2,062.8 | | | | 2,051.7 | | | | 168.3 | |
Other non-current assets | | | 1,796.8 | | | | 2,327.3 | | | | 2,428.1 | | | | 2,020.5 | | | | 2,341.6 | | | | 192.2 | |
| | | | | | | | | | | | | | | | | | | | | | | | |
Total assets | | | 55,435.0 | | | | 53,932.6 | | | | 53,798.7 | | | | 55,747.3 | | | | 55,140.0 | | | | 4,523.8 | |
| | | | | | | | | | | | | | | | | | | | | | | | |
Liabilities | | | | | | | | | | | | | | | | | | | | | | | | |
Current liabilities | | | 13,067.3 | | | | 12,029.7 | | | | 11,970.4 | | | | 11,016.4 | | | | 13,494.4 | | | | 1,107.1 | |
Due to related parties | | | 13.8 | | | | 22.1 | | | | 15.5 | | | | 42.8 | | | | 33.3 | | | | 2.7 | |
Obligation under finance lease | | | — | | | | 416.6 | | | | 770.1 | | | | 3,101.9 | | | | 3,594.1 | | | | 294.9 | |
Deferred tax liabilities—net | | | 1,651.8 | | | | 1,961.2 | | | | 2,071.2 | | | | 1,729.2 | | | | 1,155.4 | | | | 94.8 | |
Loans payable (net of current maturities) | | | 12,715.5 | | | | 7,666.8 | | | | 6,425.8 | | | | 3,703.8 | | | | 4,345.3 | | | | 356.5 | |
Bonds payable (net of current maturities) | | | 8,472.2 | | | | 12,114.1 | | | | 12,138.4 | | | | 13,986.5 | | | | 13,285.2 | | | | 1,089.9 | |
Other non-current liabilities | | | 939.5 | | | | 1,032.5 | | | | 1,200.9 | | | | 2,777.6 | | | | 2,058.3 | | | | 168.9 | |
| | | | | | | | | | | | | | | | | | | | | | | | |
Total liabilities | | | 36,860.1 | | | | 35,243.0 | | | | 34,592.3 | | | | 36,358.2 | | | | 37,966.0 | | | | 3,114.8 | |
| | | | | | | | | | | | | | | | | | | | | | | | |
Net assets (total assets—total liabilities) | | | 18,574.9 | | | | 18,689.6 | | | | 19,206.4 | | | | 19,389.1 | | | | 17,174.0 | | | | 1,409.0 | |
Capital stock | | | 543.4 | | | | 543.4 | | | | 543.4 | | | | 543.4 | | | | 543.4 | | | | 44.6 | |
Equity | | | 18,574.9 | | | | 18,689.6 | | | | 19,206.4 | | | | 19,389.1 | | | | 17,174.0 | | | | 1,409.0 | |
Total liabilities and Equity | | | 55,435.0 | | | | 53,932.6 | | | | 53,798.7 | | | | 55,747.3 | | | | 55,140.0 | | | | 4,523.8 | |
Number of outstanding shares | | | 5,433,933,500 | | | | 5,433,933,500 | | | | 5,433,933,500 | | | | 5,433,933,500 | | | | 5,433,933,500 | | | | — | |
2
| | | | | | | | | | | | | | | | | | | | | | | | |
| | | For the years ended December 31, | |
| | | 2009
Rp | | | 2010
Rp | | | 2011
Rp | | | 2012
Rp | | | 2013
Rp | | | 2013
US$(1) | |
| | | | | | | | | (Restated) | | | (Restated) | | | | | | | |
| | | (Rp in billions and US$ in millions, except per
Share and per ADS data) | |
Comprehensive Income Data: | | | | | | | | | | | | | | | | | | | | | | | | |
Operating revenues: | | | | | | | | | | | | | | | | | | | | | | | | |
Cellular | | | 14,331.3 | | | | 15,882.1 | | | | 16,587.4 | | | | 18,489.3 | | | | 19,374.6 | | | | 1,589.5 | |
MIDI | | | 2,712.6 | | | | 2,591.8 | | | | 2,694.2 | | | | 2,909.8 | | | | 3,266.5 | | | | 268.0 | |
Fixed telecommunication | | | 1,803.0 | | | | 1,278.2 | | | | 1,250.0 | | | | 1,021.5 | | | | 1,214.8 | | | | 99.7 | |
| | | | | | | | | | | | | | | | | | | | | | | | |
Total operating revenues | | | 18,846.9 | | | | 19,752.1 | | | | 20,531.6 | | | | 22,420.6 | | | | 23,855.9 | | | | 1,957.2 | |
| | | | | | | | | | | | | | | | | | | | | | | | |
Total operating expenses | | | 15,738.2 | | | | 16,106.5 | | | | 17,290.3 | | | | 19,223.1 | | | | 22,364.2 | | | | 1,834.8 | |
Operating profit | | | 3,108.7 | | | | 3,645.6 | | | | 3,241.3 | | | | 3,197.5 | | | | 1,491.7 | | | | 122.4 | |
Other income (expense): | | | | | | | | | | | | | | | | | | | | | | | | |
Interest income | | | 139.0 | | | | 146.2 | | | | 92.6 | | | | 133.5 | | | | 107.2 | | | | 8.8 | |
Gain (loss) on foreign exchange—net | | | 1,656.4 | | | | 318.2 | | | | (54.2 | ) | | | (789.4 | ) | | | (3,011.4 | ) | | | (247.1 | ) |
Gain (loss) on change in fair value of derivatives—net | | | (486.9 | ) | | | (448.8 | ) | | | 58.0 | | | | 5.0 | | | | 273.3 | | | | 22.4 | |
Financing cost | | | (1,873.0 | ) | | | (2,338.1 | ) | | | (1,929.3 | ) | | | (2,077.4 | ) | | | (2,212.1 | ) | | | (181.5 | ) |
| | | | | | | | | | | | | | | | | | | | | | | | |
Total other expense—net | | | (564.5 | ) | | | (2,322.5 | ) | | | (1,832.9 | ) | | | (2,728.3 | ) | | | (4,843.0 | ) | | | (397.4 | ) |
| | | | | | | | | | | | | | | | | | | | | | | | |
Income tax benefit (expense)—net | | | (783.9 | ) | | | (432.6 | ) | | | (291.0 | ) | | | 20.5 | | | | 668.7 | | | | 54.9 | |
Profit (loss) for the year | | | 1,760.3 | | | | 890.5 | | | | 1,117.4 | | | | 489.7 | | | | (2,682.6 | ) | | | (220.1 | ) |
Attributable to owners of the Company | | | 1,704.0 | | | | 812.6 | | | | 1,018.2 | | | | 376.5 | | | | (2,798.6 | ) | | | (229.6 | ) |
Attributable to non-controlling interests | | | 56.3 | | | | 77.9 | | | | 99.2 | | | | 113.2 | | | | 116.0 | | | | 9.5 | |
Weighted average number of shares outstanding | | | 5,433,933,500 | | | | 5,433,933,500 | | | | 5,433,933,500 | | | | 5,433,933,500 | | | | 5,433,933,500 | | | | — | |
Basic and diluted earnings per share attributable to owners of the Company (in full amounts)(2) | | | 313.6 | | | | 149.5 | | | | 187.4 | | | | 69.3 | | | | (515.0 | ) | | | (42.3 | ) |
Dividends declared per share (in full amounts)(2) | | | 137.86 | | | | 59.5 | | | | 76.8 | | | | 34.5 | | | | — | | | | — | |
Dividends declared per share (in full amounts) (in
US$)(2)(4) | | | 0.015 | | | | 0.006 | | | | 0.008 | | | | 0.003 | | | | — | | | | — | |
Dividends declared per ADS (in full amounts) (in
US$)(2)(3)(4) | | | 0.77 | | | | 0.31 | | | | 0.40 | | | | 0.17 | | | | — | | | | — | |
3
| | | | | | | | | | | | | | | | | | | | | | | | |
| | | As of and for the years ended December 31, | |
| | | 2009
Rp | | | 2010
Rp | | | 2011
Rp | | | 2012
Rp | | | 2013
Rp | | | 2013
US$(1) | |
| | | | | | | | | (Restated) | | | (Restated) | | | | | | | |
| | | (Rp in billions and US$ in millions, except for number of outstanding shares, EBITDA margin and financial ratios) | |
Cash Flow Statement Data | | | | | | | | | | | | | | | | | | | | | | | | |
Net cash provided by (used in): | | | | | | | | | | | | | | | | | | | | | | | | |
Operating activities | | | 4,106.1 | | | | 6,848.6 | | | | 7,320.1 | | | | 6,989.4 | | | | 8,393.2 | | | | 688.6 | |
Investing activities | | | (10,670.7 | ) | | | (5,970.7 | ) | | | (6,037.9 | ) | | | (2,688.9 | ) | | | (9,068.0 | ) | | | (743.9 | ) |
Financing activities | | | 3,724.7 | | | | (1,629.7 | ) | | | (1,135.4 | ) | | | (2,647.5 | ) | | | (749.9 | ) | | | (61.5 | ) |
Net Foreign Exchange differences from cash and cash equivalent | | | (54.9 | ) | | | (9.7 | ) | | | 2.2 | | | | 40.0 | | | | (221.3 | ) | | | (18.2 | ) |
Other Financial Data (unaudited) | | | | | | | | | | | | | | | | | | | | | | | | |
EBITDA(5) | | | 8,767.8 | | | | 9,652.7 | | | | 9,749.6 | | | | 10,558.8 | | | | 10,369.8 | | | | 850.7 | |
EBITDA margin(6) | | | 46.5 | % | | | 48.9 | % | | | 47.5 | % | | | 47.1 | % | | | 43.5 | % | | | 43.5 | % |
Other Financial Data | | | | | | | | | | | | | | | | | | | | | | | | |
Capital expenditures(7) | | | 11,584.5 | | | | 5,951.8 | | | | 6,511.3 | | | | 8,396.6 | | | | 9,371.0 | | | | 768.8 | |
Financial Ratios (unaudited) | | | | | | | | | | | | | | | | | | | | | | | | |
Total Debt to EBITDA(8) | | | 2.94 | | | | 2.50 | | | | 2.43 | | | | 2.10 | | | | 2.33 | | | | 2.33 | |
Net Debt to EBITDA(9) | | | 2.62 | | | | 1.11 | | | | 2.40 | | | | 2.08 | | | | 2.31 | | | | 2.31 | |
EBITDA to Interest Expense(10) | | | 4.85 | | | | 4.69 | | | | 5.73 | | | | 6.17 | | | | 6.11 | | | | 6.11 | |
Footnotes to Selected Financial Information and Other Data:
| (1) | Translated into U.S. dollars based on a conversion rate of Rp12,189 per U.S. dollar, the middle exchange rate announced by Bank Indonesia on December 31, 2013. See “—Exchange Rate Information” below. |
| (2) | Basic earnings per share/ADS, and dividends declared per share/ADS are reported in whole Indonesian rupiah and U.S. dollars. Basic earnings per share/ADS and dividends declared per share/ADS for all periods presented have been computed based upon the weighted average number of shares outstanding, after considering the effect of the stock option where applicable. |
| (3) | The basic earnings and dividends declared per ADS data is calculated on the basis that each ADS represented fifty shares of common stock and does not make allowance for withholding tax to which the holders of the ADSs were subject. Following the voluntary delisting of the ADSs from the New York Stock Exchange (“NYSE”), termination of the ADS program became effective on July 24, 2013. For more information see “Item 9: The Offer and Listing—Offer and Listing Details.” |
| (4) | Calculated using the middle exchange rate announced by Bank Indonesia on each dividend payment date. |
| (5) | We have defined EBITDA as earnings before interest, non-operating income and expense, income tax expense, depreciation and minority interest in net income of subsidiaries as reported in the consolidated financial statements included in this annual report prepared under IFRS. EBITDA is not a standard measure under IFRS. As the telecommunications business is capital intensive, capital expenditure requirements and levels of debt and interest expenses may have a significant impact on the net income of companies with similar operating results. Therefore, we believe that EBITDA provides a useful reflection of our operating results and that net income is the most directly comparable financial measure to EBITDA as an indicator of our operating performance. We also present EBITDA because it is used by some investors as a way to measure a company’s ability to incur and service debt, make capital expenditures and meet working capital requirements. You should not consider our definition of EBITDA in isolation or as an indicator of operating performance, liquidity or any other standard measure under IFRS, or other companies’ definition of EBITDA. Our definition of EBITDA does not account for taxes and other non-operating cash expenses. Funds depicted by this measure may not be available for debt service due to |
4
| | covenant restrictions, capital expenditure requirements and other commitments. The following table reconciles profit (loss) attributable to owners of the Company under IFRS to our definition of EBITDA for the periods indicated: |
| | | | | | | | | | | | | | | | | | | | | | | | |
| | | For the years ended December 31, | |
| | | 2009
Rp | | | 2010
Rp | | | 2011
Rp | | | 2012
Rp | | | 2013
Rp | | | 2013
US$ | |
| | | | | | | | | (Restated) | | | (Restated) | | | | | | | |
| | | (Rp in billions and US$ in millions, except for number of outstanding shares, EBITDA margin and financial ratios) | |
EBITDA | | | 8,767.8 | | | | 9,652.7 | | | | 9,749.6 | | | | 10,558.8 | | | | 10,369.8 | | | | 850.7 | |
Adjustments: | | | | | | | | | | | | | | | | | | | | | | | | |
Gain (loss) on foreign exchange—net | | | 1,656.4 | | | | 492.4 | | | | 36.7 | | | | (744.6 | ) | | | (2,786.9 | ) | | | (228.6 | ) |
Interest income | | | 139.0 | | | | 146.2 | | | | 92.6 | | | | 133.5 | | | | 107.2 | | | | 8.8 | |
Financing cost (including interest expense) | | | (1,873.0 | ) | | | (2,338.1 | ) | | | (1,929.3 | ) | | | (2,077.4 | ) | | | (2,212.1 | ) | | | (181.5 | ) |
Gain (loss) on change in fair value of derivatives—net | | | (486.9 | ) | | | (448.8 | ) | | | 58.0 | | | | 5.0 | | | | 273.3 | | | | 22.4 | |
Others—net (in 2010, 2011, 2012 and 2013 presented as part of operating expense) | | | (87.5 | ) | | | (79.2 | ) | | | (29.9 | ) | | | (306.1 | ) | | | (274.0 | ) | | | (22.5 | ) |
Gain on tower sale | | | — | | | | — | | | | — | | | | 1,184.0 | | | | 141.0 | | | | 11.6 | |
Income tax benefit (expense)—net | | | (783.9 | ) | | | (432.6 | ) | | | (291.0 | ) | | | 20.5 | | | | 668.7 | | | | 54.9 | |
Depreciation and amortization | | | (5,571.6 | ) | | | (6,102.1 | ) | | | (6,569.3 | ) | | | (8,284.0 | ) | | | (8,969.6 | ) | | | (735.9 | ) |
Profit (loss) attributable to non-controlling interest | | | (56.3 | ) | | | (77.9 | ) | | | (99.2 | ) | | | (113.2 | ) | | | (116.0 | ) | | | (9.5 | ) |
Profit (loss) attributable to owners of the Company | | | (1,704.0 | ) | | | 812.6 | | | | 1,018.2 | | | | 376.5 | | | | (2,798.6 | ) | | | (229.6 | ) |
| (6) | EBITDA margin is computed by dividing EBITDA as defined in note (5) above by total operating revenues recorded under IFRS. |
| (7) | Capital expenditures is computed by adding total additions of property and equipment and total additions of goodwill and other intangible assets recorded under IFRS. |
| (8) | We define total debt as total loans payable and bonds payable (current and non-current maturities), unamortized issuance cost (loans, bonds and notes), unamortized consent solicitation fees (loans and bonds) and unamortized discounts (loans and notes) recorded under IFRS. |
| (9) | We define net debt as total debt less unamortized issuance cost (bond, loans and notes), unamortized consent solicitation fees (loans and bonds) and unamortized discounts (loans and notes) recorded under IFRS. |
| (10) | EBITDA to Interest Expense is computed by dividing EBITDA with interest expenses. |
Exchange Rate Information
| | | | | | | | | | | | | | | | |
| | | Exchange Rates of Indonesian Rupiah
Per U.S. Dollar | |
| | | Period end | | | Average(1)(2) | | | Low | | | High | |
Period | | | | | | | | | | | | | | | | |
2009 | | | 9,400 | | | | 10,398 | | | | 12,065 | | | | 9,293 | |
2010 | | | 8,991 | | | | 9,085 | | | | 9,413 | | | | 8,888 | |
2011 | | | 9,068 | | | | 8,779 | | | | 9,185 | | | | 8,460 | |
2012 | | | 9,670 | | | | 9,384 | | | | 9,707 | | | | 8,892 | |
2013 | | | 12,189 | | | | 10,451 | | | | 12,270 | | | | 9,634 | |
October | | | 11,234 | | | | 11,367 | | | | 11,593 | | | | 11,018 | |
November | | | 11,977 | | | | 11,613 | | | | 11,977 | | | | 11,354 | |
December | | | 12,189 | | | | 12,087 | | | | 12,270 | | | | 11,830 | |
2014 | | | | | | | | | | | | | | | | |
January | | | 12,226 | | | | 12,180 | | | | 12,267 | | | | 12,047 | |
February | | | 11,634 | | | | 11,935 | | | | 12,251 | | | | 11,620 | |
March | | | 11,404 | | | | 11,427 | | | | 11,647 | | | | 11,272 | |
April (through April 24, 2014) | | | 11,608 | | | | 11,413 | | | | 11,608 | | | | 11,271 | |
5
Source:Bank Indonesia.
| (1) | The annual average exchange rates are calculated as averages of the middle exchange rate announced by Bank Indonesia on the last day of each month during the year. |
| (2) | The monthly average exchange rates are calculated as averages of each daily middle exchange rate announced by Bank Indonesia. |
Bank Indonesia is the sole issuer of Indonesian rupiah and is responsible for maintaining its stability. Since 1970, Indonesia has implemented three exchange rate systems: (i) a fixed rate system between 1970 and 1978; (ii) a managed floating exchange rate system between 1978 and 1997; and (iii) a free-floating exchange rate system since August 14, 1997. Under the managed floating exchange rate system, Bank Indonesia maintained stability of the Indonesian rupiah through a trading band policy, pursuant to which Bank Indonesia would enter the foreign currency market and buy or sell Indonesian rupiah, as required, when trading in the Indonesian rupiah exceeded bid and offer prices announced by Bank Indonesia on a daily basis. On August 14, 1997, Bank Indonesia terminated the trading band policy and permitted the exchange rate for the Indonesian rupiah to float without an announced level at which it would intervene, which resulted in a substantial decrease in the value of the Indonesian rupiah relative to the U.S. dollar. Under the current system, the exchange rate of the Indonesian rupiah is determined by the market, reflecting the interaction of supply and demand in the market. However, Bank Indonesia may take measures to maintain a stable exchange rate.
The Indonesian rupiah has been and in general is freely convertible or transferable. Bank Indonesia has introduced regulations to restrict the movement of Indonesian rupiah from banks within Indonesia to offshore banks without underlying trade or investment reasons, thereby limiting offshore trading to existing sources of liquidity. In addition, Bank Indonesia has the authority to request information and data concerning the foreign exchange activities of all people and legal entities that are domiciled, or plan to reside, in Indonesia for at least one year.
The Indonesian rupiah/U.S. dollar exchange rate is the middle exchange rate announced by Bank Indonesia calculated based on Bank Indonesia’s buying and selling rates. The middle exchange rate was Rp9,068 per U.S. dollar as of December 31, 2011, Rp9,670 per U.S. dollar as of December 31, 2012 and Rp12,189 per U.S. dollar as of December 31, 2013, respectively. On April 24, 2014, the middle exchange rate was Rp11,608 per U.S. dollar.
The fluctuations in the Indonesian rupiah/U.S. dollar exchange rate will affect the U.S. dollar conversion by The Bank of New York Mellon, as depositary for the ADSs (“Depositary”) on the cash proceeds from the sale by the Depositary of the shares represented by any ADSs that remain outstanding as of July 24, 2014. For more information see “Item 9: The Offer and Listing—Offer and Listing Details.”
Foreign Exchange
Foreign exchange controls were abolished in 1971, and Indonesia now maintains a liberal foreign exchange system that permits the free flow of foreign exchange. Capital transactions, including remittances of capital, profits, dividends and interests, are free from exchange controls. A number of regulations, however, have an impact on the exchange system. Bank Indonesia recently introduced regulations to restrict the movement of Indonesian rupiah from banks within Indonesia to offshore banks without underlying trade or investment reasons, thereby limiting offshore trading to existing sources of liquidity. In addition, Bank Indonesia has the authority to request information and data concerning the foreign exchange activities of all people and legal entities that are domiciled in Indonesia or plan to domicile in Indonesia for at least one year.
6
RISK FACTORS
Risks Relating to Indonesia
We are incorporated in Indonesia and substantially all of our operations, assets and customers are located in Indonesia. As a result, future political, economic, legal and social conditions in Indonesia, as well as certain actions and policies which the Government may, or may not, take or adopt may have a material adverse effect on our business, financial condition, results of operations and prospects.
Domestic, regional or global economic changes may adversely affect our business
The economic crisis which affected Southeast Asia, including Indonesia, from mid-1997 was characterized in Indonesia by, among other things, currency depreciation, negative economic growth, high interest rates, social unrest and extraordinary political events. These conditions had a material adverse effect on Indonesian businesses, including a material adverse effect on the quality and growth of our subscriber base and service offerings, which depend on the health of the overall Indonesian economy. In addition, the economic crisis resulted in the failure of many Indonesian companies to meet their debt obligations.
Beginning in 2008, the global financial crisis which was triggered in part by the subprime mortgage crisis in the United States, caused failures of large U.S. financial institutions and rapidly evolved into a global credit crisis. U.S. bank failures were followed by failures in a number of European banks and declines in various stock indexes, as well as large reductions in the market value of equities and commodities worldwide, including in Indonesia. In addition, since 2010, the European sovereign debt crisis has created concerns about the ability of a number of European countries, including Greece, Ireland, Italy, Portugal and Spain, to continue to service their sovereign debt obligations. These conditions may result in worsening economic conditions in Europe and globally. The world economic downturn has adversely affected the economic performance of Indonesia, resulting in declining economic growth, slowing household consumption and weakening investment due to loss of external demand and increased uncertainty in the world economy. These conditions have had and may continue to have a negative impact on Indonesian businesses and consumers, which may result in reduced demand for telecommunication services.
Volatility in oil prices and potential food shortages may also cause an economic slowdown in many countries, including Indonesia. An economic downturn in Indonesia could also lead to defaults by Indonesian borrowers and could have a material adverse effect on our business, financial condition and results of operations and prospects. The Government continues to have a large fiscal deficit and a high level of sovereign debt. Its foreign currency reserves are modest and the banking sector is weak and suffers from relatively high levels of non-performing loans.
Consumer price index (“CPI”) increased significantly in 2013 by approximately 8.4% (year-on-year), according to the Indonesian Central Statistics Bureau. This increase was primarily due to higher prices in transportation, communication and food. The rise in CPI was in line with Bank Indonesia forecasts, as it primarily related to a rise in fuel prices caused by the planned reduction of government fuel subsidies that became effective in late June 2013. On June 22, 2013, due to the reduction in government fuel subsidies on a per liter basis, the price of regular gasoline in Indonesia increased 44.4% from Rp4,500 per liter to Rp6,500 per liter and the price of diesel increased 22.2% from Rp4,500 per liter to Rp5,500 per liter. There can be no assurance that the recent proposed increase in subsidized fuel prices, or cuts in fuel subsidies in the future, will not result in political and social instability. In July 2013, Bank Indonesia increased the Bank Indonesia reference rate (the “BI Rate”) by 50 basis points to 6.50% after previously increasing the BI Rate by 25 basis points in June 2013. Bank Indonesia subsequently increased the BI Rate to 7.00% in August 2013, 7.25% in September 2013 and to 7.50% in November 2013.
The current high inflation rate in Indonesia and any further increases in the cost of essential items or rise in commodity prices may result in less disposable income available to consumers to spend or cause consumer
7
purchasing power to decrease, which may reduce consumer demand for telecommunication services, including our services. Any decreases in commodity prices in the outlying regions of Indonesia may also result in increased unemployment and therefore affect our customers’ purchasing power. A loss of investor confidence in the financial systems of emerging and other markets, or other factors, including the deterioration of the global economic situation, may cause increased volatility in the Indonesian financial markets and a slowdown in economic growth or negative economic growth in Indonesia. Any such increased volatility or slowdown or negative growth could have a material adverse effect on our business, financial condition and results of operations and prospects.
Political and social instability may adversely affect us
Since 1998, Indonesia has experienced a process of democratic change, resulting in political and social events that have highlighted the unpredictable nature of Indonesia’s changing political landscape. These events have resulted in political instability as well as general social and civil unrest on certain occasions in the past few years. As a relatively new democratic country, Indonesia continues to face various socio-political issues and has, from time to time, experienced political instability and social and civil unrest.
Since 2000, thousands of Indonesians have participated in demonstrations in Jakarta and other Indonesian cities both for and against former President Wahid, former President Megawati, and current President Yudhoyono, as well as in response to specific issues, including fuel subsidy reductions, privatization of state assets, anti-corruption measures, the bailout of PT Bank Century in 2008, decentralization and provincial autonomy and the American-led military campaigns in Afghanistan and Iraq.
In June 2001, demonstrations and strikes affected at least 19 cities after the Government mandated a 30.0% increase in fuel prices. Similar demonstrations in response to the Government’s plans to reduce fuel subsidies occurred in 2003, 2005, 2008 and 2012. Similar demonstrations also occurred in 2013 in response to the Government’s reduction in government fuel subsidies. Although past demonstrations were generally peaceful, some turned violent. We cannot assure you that any future fuel subsidy reductions will not lead to further political and social instability.
Regional political instability and clashes between religious and ethnic groups remain problematic. Separatist movements and clashes between religious and ethnic groups have resulted in social and civil unrest in parts of Indonesia. In the provinces of Aceh and Papua (formerly Irian Jaya), there have been clashes between supporters of those separatist movements and the Indonesian military, although there has been little conflict in Aceh since a memorandum of understanding was signed in August 2005. In recent years, political instability in Maluku and Poso, a district in the province of Central Sulawesi, has intensified and clashes between religious groups in these regions have resulted in thousands of casualties and displaced persons. In recent years, the Government has made limited progress in negotiations with these troubled regions, except in the Province of Aceh where peaceful local elections were held in April 2012, which resulted in former separatists winning the election and becoming the governors of the province.
In 2004 and in 2009, elections were held in Indonesia to elect the President, Vice-President and representatives in the Parliament and, in April 2014, to elect representatives for parliament. Although the 2004 and 2009 elections and 2014 parliamentary elections were conducted peacefully, political campaigns in Indonesia may bring a degree of political and social uncertainty to Indonesia. Increased political activity can be expected in Indonesia, in part due to the upcoming presidential election in 2014.
Political and related social developments in Indonesia have been unpredictable in the past, and we cannot assure you that social and civil disturbances will not occur in the future and on a wider scale, or that any such disturbances will not, directly or indirectly, have a material adverse effect on our business, financial condition, results of operations and prospects.
8
Indonesia is located in an earthquake zone and is subject to significant geological risks which could lead to social unrest and economic loss
Many parts of Indonesia are vulnerable to natural disasters such as earthquakes, tsunamis, floods, volcanic eruptions as well as droughts, power outages or other events beyond our control. In recent years, several natural disasters have occurred in Indonesia (in addition to the Asian tsunami in 2004), including volcanic eruptions of Mount Merapi in southern Java near Yogyakarta and Mount Bromo in East Java in 2010, Mount Lokon in North Sulawesi in 2011, tsunamis in Pangandaran in West Java in 2006 and in Mentawai in West Sumatera in 2010, separate earthquakes in Yogyakarta in 2006, in Papua, West Java, Sulawesi and Sumatra in 2009, off the coast of Sumatra in January 2012 and a hot mud eruption and subsequent flooding in Sidoarjo in East Java in 2006. Indonesia also experienced significant flooding in Wasior district in West Papua in 2010, in Jakarta in 2007 and 2009 and in Solo in Central Java in 2008. More recently, in January 2013, floods in Jakarta resulted in disruptions to businesses and extensive evacuations in the city and, in September 2013, Mount Sinabung in North Sumatra erupted. In February 2014, more than 100,000 people were evacuated due to the volcanic eruption of Mount Kelud in East Java.
As a result of these natural disasters, the Government has had to spend significant amounts on emergency aid and resettlement efforts. Most of these costs have been underwritten by foreign governments and international aid agencies. We cannot assure you that such aid will continue to be forthcoming, or that it will be delivered to recipients on a timely basis. If the Government is unable to timely deliver foreign aid to affected communities, political and social unrest could result. While the Government has implemented various measures to mitigate the losses caused by natural disasters, such as establishing a national board for disaster mitigation and installing tsunami early warning systems, recovery and relief efforts are likely to continue to impose a strain on the Government’s finances, and may affect its ability to meet its obligations on its sovereign debt. Any such failure on the part of the Government, or declaration by it of a moratorium on its sovereign debt, could trigger an event of default under numerous private-sector borrowings including those of our Company, thereby materially and adversely affecting our business.
We cannot assure you that our insurance coverage will be sufficient to protect us from potential losses resulting from such natural disasters and other events beyond our control. In addition, we cannot assure you that the premium payable for these insurance policies upon renewal will not increase substantially, which may materially and adversely affect our financial condition and results of operations. We also cannot assure you that future geological or meteorological occurrences will not have more of an impact on the Indonesian economy. A significant earthquake, other geological disturbance or weather-related natural disaster in any of Indonesia’s more populated cities and financial centers could severely disrupt the Indonesian economy and undermine investor confidence, thereby materially and adversely affecting our business, financial condition, results of operations and prospects.
Terrorist activities in Indonesia could destabilize the country, thereby adversely affecting our business, financial condition, results of operations and prospects
Several bombing incidents have taken place in Indonesia, most significantly in October 2002 in Bali, a region of Indonesia previously considered safe from the unrest affecting other parts of the country. Other bombing incidents, although on a lesser scale, have also been committed in Indonesia on a number of occasions over the past few years, including at shopping centers and places of worship. In April 2003, a bomb exploded outside the main United Nations building in Jakarta and in front of the domestic terminal at Soekarno-Hatta International Airport. In August 2003, a bomb exploded at the JW Marriott Hotel in Jakarta, and in September 2004, a bomb exploded in front of the Australian embassy in Jakarta. In May 2005, bomb blasts in Central Sulawesi killed at least 21 people and injured at least 60 people. In October 2005, bomb blasts in Bali killed at least 23 people and injured at least 101 others. Indonesian, Australian and U.S. government officials have indicated that these bombings may be linked to an international terrorist organization. Demonstrations have taken place in Indonesia in response to plans for and subsequent to U.S., British and Australian military action in Iraq.
9
In January 2007, sectarian terrorists conducted bombings in Poso. In July 2009, bomb blasts in the JW Marriott and Ritz Carlton hotels in Jakarta killed six people and injured at least 50 people. Further terrorist acts may occur in the future and may be directed at foreigners in Indonesia. Violent acts arising from, and leading to, instability and unrest could destabilize Indonesia and the Government and have had, and may continue to have, a material adverse effect on investment and confidence in, and the performance of, the Indonesian economy, and may have a material adverse effect on our business, financial condition, results of operations and prospects.
Our operations may be adversely affected by an outbreak of Severe Acute Respiratory Syndrome (“SARS”), avian influenza, Influenza A (H1N1) virus or other epidemics
In 2003, certain countries in Asia including, Indonesia, the China, Vietnam, Thailand and Cambodia, experienced an outbreak of SARS, a highly contagious form of atypical pneumonia, which seriously interrupted the economic activities in, and the demand for goods plummeted in, the affected regions.
During recent years, large parts of Asia experienced unprecedented outbreaks of avian influenza. In addition, the WHO announced in June 2006 that human-to-human transmission of avian influenza had been confirmed in Sumatra, Indonesia. The United Nations Food and Agricultural Organization warned in March 2008 that avian influenza virus was entrenched in 31 of Indonesia’s 33 provinces and efforts to contain avian influenza are failing in Indonesia. As of January 24, 2014, the World Health Organization (“WHO”) had confirmed a total of 386 fatalities in a total number of 650 cases reported to the WHO, which only reports laboratory confirmed cases of avian influenza. Of these, the Indonesian Ministry of Health reported to the WHO 163 fatalities in a total number of 195 cases of avian influenza in Indonesia. According to the WHO, there were 55 reported human cases of avian influenza in 2006, 42 cases in 2007, 24 cases in 2008, 21 cases in 2009, nine cases in 2010, 12 cases in 2011, nine cases in 2012 and three cases in 2013. In spite of the decreasing number of human cases and the implementation of avian influenza prevention and control measures, no fully effective avian influenza vaccines have been developed, an effective vaccine may not be discovered in time to protect against a potential avian influenza pandemic and the virus may mutate into a deadlier form. Outbreaks in animals, particularly in birds, and in humans are expected to occur from time to time, as long as avian influenza remains endemic in many provinces in Indonesia.
In April 2009, there was an outbreak of the Influenza A (H1N1) virus, which originated in Mexico but has since spread globally, including confirmed reports in Hong Kong, Indonesia, Japan, Malaysia, Singapore and elsewhere in Asia. The Influenza A (H1N1) virus is believed to be highly contagious and may not be easily contained.
An outbreak of SARS, avian influenza, Influenza A (H1N1) virus or a similar epidemic or the perception that an outbreak of such diseases or a similar epidemic may occur, or the measures taken by the governments of affected countries, including Indonesia, against such an outbreak, could severely disrupt the Indonesian and other economies and undermine investor confidence, thereby materially and adversely affecting our financial condition or results of operations.
Labor activism and unrest may adversely affect our business
The liberalization of regulations permitting the formation of labor unions, combined with weak economic conditions, has resulted, and will likely continue to result, in labor unrest and activism in Indonesia. In 2000, the Government issued a labor regulation allowing employees to form unions without employer intervention. In March 2003, the Government enacted a manpower law, Law No. 13 of 2003 (the “Labor Law”), which, among other things, increased the amount of required severance, service and compensation payments to terminated employees, and required employers with 50 or more employees to establish bipartite forums with the participation of employers and employees. To negotiate a collective labor agreement with such a company, a labor union’s membership must consist of more than 50.0% of the company’s employees. In response to a challenge to its validity, the Indonesian Constitutional Court declared the Labor Law to be mostly valid, except
10
for certain provisions relating to, among others, (i) the right of an employer to terminate its employee who committed a serious mistake; (ii) the imprisonment of, or imposition of a monetary penalty on, an employee who instigates or participates in an illegal labor strike or persuades other employees to participate in a labor strike; (iii) the requirement to allow outsourcing or subcontracting arrangements with a temporary employment contract that does not stipulate for the transfer of undertakings protection of employment provision; and (iv) the requirement that a labor union obtain the presentation of at least 50.0% of employees (for a company that has more than one labor union) to be eligible to conduct negotiations with an employer. The Government proposed to amend the Labor Law in a manner which, in the view of labor activists, would result in reduced pension benefits, the increased use of outsourced employees and prohibitions on unions to conduct strikes. The proposal has been suspended and the new Government regulation addressing lay-offs of workers has not yet become effective.
Labor unrest and activism could disrupt our operations and could adversely affect the financial condition of Indonesian companies in general and the value of the Indonesian rupiah relative to other currencies, which could have a material adverse effect on our business, financial condition, results of operations and prospects.
Depreciation in the value of the Indonesian rupiah may adversely affect our business, financial condition, results of operations and prospects
One of the most important immediate causes of the economic crisis which began in Indonesia in mid-1997 was the depreciation and volatility of the value of the Indonesian rupiah, as measured against other currencies, such as the U.S. dollar. Although the Indonesian rupiah has appreciated considerably from its low point of approximately Rp17,000 per U.S. dollar in 1998, it may experience volatility again in the future. During the period between January 1, 2011 through December 31, 2013, the Indonesian rupiah/U.S. dollar middle exchange rate ranged from a low of Rp12,270 per U.S. dollar to a high of Rp8,460 per U.S. dollar. During the year 2013, the Indonesian rupiah/U.S. dollar middle exchange rate announced by Bank Indonesia ranged from a low of Rp12,270 per U.S. dollar to a high of Rp9,634 per U.S. dollar. For more information, see “Item 3: Key Information—Exchange Rate Information.”
We cannot assure you that future depreciation or volatility of the Indonesian rupiah against other currencies, including the U.S. dollar, will not occur. To the extent the Indonesian rupiah depreciates further from the exchange rate at December 31, 2013, our obligations under our accounts payable, procurements payable and our foreign currency-denominated loans payable and bonds payable would increase in Indonesian rupiah terms. Such depreciation of the Indonesia rupiah would result in additional losses on foreign exchange translation and significantly impact our other income and net income.
In addition, while the Indonesian rupiah has generally been freely convertible and transferable (except that Indonesian banks may not transfer Indonesian rupiah to persons outside of Indonesia who lack a bona fide trade or investment purpose), from time to time, Bank Indonesia has intervened in the currency exchange markets in furtherance of its policies, either by selling Indonesian rupiah or by using its foreign currency reserves to purchase Indonesian rupiah. We cannot assure you that the current floating exchange rate policy of Bank Indonesia will not be modified or that the Government will take additional action to stabilize, maintain or increase the value of the Indonesian rupiah, or that any of these actions, if taken, will be successful. Modification of the current floating exchange rate policy could result in significantly higher domestic interest rates, liquidity shortages, capital or exchange controls or the withholding of additional financial assistance by multinational lenders. This could result in a reduction of economic activity, an economic recession, loan defaults or declining usage of our subscribers, and as a result, we may also face difficulties in funding our capital expenditures and in implementing our business strategy. Any of the foregoing consequences could have a material adverse effect on our business, financial condition, results of operations and prospects.
11
Downgrades of credit ratings of the Government or Indonesian companies could adversely affect our business
Beginning in 1997, certain recognized statistical rating organizations, including Moody’s, Standard & Poor’s, and Fitch, downgraded Indonesia’s sovereign rating and the credit ratings of various credit instruments of the Government and a large number of Indonesian banks and other companies. As of April 24, 2014, Indonesia’s sovereign foreign currency long-term debt was rated “Baa3” by Moody’s, “BB+” by Standard & Poor’s, and “BBB-” by Fitch.These ratings reflect an assessment of the Government’s overall financial capacity to pay its obligations and its ability or willingness to meet its financial commitments as they become due.
Even though the recent trend in Indonesian sovereign ratings has been positive, we cannot assure you that Moody’s, Standard & Poor’s, Fitch or any other statistical rating organization will not downgrade the credit ratings of Indonesia or Indonesian companies, including us. Any such downgrade could have an adverse impact on liquidity in the Indonesian financial markets, the ability of the Government and Indonesian companies, including us, to raise additional financing and the interest rates and other commercial terms at which such additional financing is available. Interest rates on our floating rate Indonesian rupiah-denominated debt would also likely increase. Such events could have material adverse effects on our business, financial condition, results of operations and prospects.
The delisting of our ADSs from the NYSE and our intended deregistration under the U.S. Securities Exchange Act of 1934 (the “Exchange Act”), may influence trading opportunities for our shares
We voluntarily delisted trading of our ADSs on the New York Stock Exchange effective May 17, 2013. We will continue to be subject to reporting obligations under the Exchange Act until such time as we can terminate our registration under it. Following the delisting from the NYSE and termination of the ADS program, the only trading market for our common stock is the IDX. See “—Conditions in the Indonesian securities market may affect the price or liquidity of our shares.”
In addition, the delisting and the termination of our ADS program may result in holders of ADRs surrendering their ADRs or ADSs evidenced thereby in exchange for the underlying shares and selling them on the IDX. The termination of our ADS program will also mean that, on and from July 24, 2014, the Depositary will start to sell the shares underlying any ADSs that remain outstanding as at that date. Such sales could affect the price of our shares on the IDX.
Conditions in the Indonesian securities market may affect the price or liquidity of our shares
The Indonesian capital markets are less liquid and have different reporting standards than markets in the United States and many other countries. Also, prices in the Indonesian capital markets are typically more volatile than in such other markets. In the past, Indonesian stock exchanges have experienced some problems which if they were to continue or recur, could affect the market price and liquidity of the securities of Indonesian companies, including our shares. These problems have included closures of exchanges, broker defaults and strikes and settlement delays. In addition, the governing body of the IDX has from time to time imposed restrictions on trading in certain securities, limitations on price movements and margin requirements. The levels of regulation and monitoring of the Indonesian securities markets and the activities of investors, brokers and other market participants are not the same as in certain other countries. In addition, the ability to sell and settle trades on the IDX may be subject to delays. In light of the foregoing, a shareholder may not be able to dispose of its shares at prices or at times at which such holder would be able to do so in more liquid or less volatile markets or at all.
We are subject to corporate disclosure and reporting requirements that differ from those in other countries
Our common stock is listed on the IDX, which is the only trading market for our common stock. Our ADSs were listed on the NYSE from October 18, 1994 until we voluntarily delisted trading of the ADSs effective
12
May 17, 2013. We are subject to corporate governance and reporting requirements that differ, in significant respects, from those applicable to companies in certain other countries including the United States. The amount of information made publicly available by issuers in Indonesia may be less than that made publicly available by comparable companies in certain more developed countries, and certain statistical and financial information of a type typically published by companies in certain more developed countries may not be available. As a result, investors may not have access to the same level and type of disclosure as that available in other countries, and comparisons with other companies in other countries may not be possible in all respects.
We are incorporated in Indonesia, and it may not be possible for investors to effect service of process, or enforce judgments, on us within the United States, or to enforce judgments of a foreign court against us in Indonesia
We are a limited liability company incorporated in Indonesia, operating within the framework of Indonesian laws relating to foreign capital invested companies, and all of our significant assets are located in Indonesia. In addition, several of our Commissioners and substantially all of our Directors reside in Indonesia and a substantial portion of the assets of such persons is located outside the United States. As a result, it may be difficult for investors to effect service of process, or enforce judgments, on us or such persons within the United States, or to enforce against us or such persons in the United States, judgments obtained in U.S. courts.
We have been advised by our Indonesian legal advisor that judgments of U.S. courts, including judgments predicated upon the civil liability provisions of the U.S. federal securities laws or the securities laws of any state within the United States, are not enforceable in Indonesian courts, although such judgments could be admissible as non-conclusive evidence in a proceeding on the underlying claim in an Indonesian court. There is doubt as to whether Indonesian courts will enter judgments in original actions brought in Indonesian courts predicated solely upon the civil liability provisions of the U.S. federal securities laws or the securities laws of any state within the United States. As a result, the claimant would be required to pursue claims against us or such persons in Indonesian courts.
Risks Relating to Our Business
We operate in a legal and regulatory environment that has been undergoing significant reforms. These reforms have been resulting in increased competition, which may result in reduced margins and operating revenues, among other things, all of which may have a material adverse effect on us
The regulatory reform of the Indonesian telecommunications sector, which was initiated by the Government in 1999, resulted in the liberalization of the telecommunications industry, including facilitation of new market entrants and changes to the competitive structure of the telecommunications industry. However, in recent years, the volume and complexity of regulatory changes has created an environment of considerable regulatory uncertainty. In addition, as the reform of the Indonesian telecommunications sector continues, competitors, potentially with greater resources than us, may enter the Indonesian telecommunications sector and compete with us in providing telecommunications services. For example, since January 2007, the Government, through the Ministry of Communication and Information Technology (“MOCIT”), has been responsible for setting reference tariffs for interconnection services. See “Item 3: Key Information—Risk Factors—Risks Relating to Our Business—We depend on interconnection agreements relating to the use of our competitors’ cellular and fixed-line telephone networks.” The MOCIT sets interconnection tariffs for dominant service providers on a “cost” basis as calculated by it, based on network and other cost data submitted by the dominant service providers. In contrast, telecommunications operators which are not designated as dominant operators may simply notify the MOCIT regarding their interconnection terms and conditions, including tariffs, and may implement such terms and conditions or tariffs for its customers without MOCIT approval. The disparity in the treatment of dominant and non-dominant telecommunications operators may create opportunities for new entrants in the telecommunications industry, providing them with increased flexibility to establish lower tariffs and offer lower pricing terms to their customers.
13
In addition, the tariffs in our RIOs have been decreasing in the past few years, and we expect this downward trend to continue. Any decrease in the amount of interconnection costs might reduce our revenue and also our costs for inter-operator traffic. On December 12, 2011, the Government, through the Indonesian Telecommunications Regulatory Authority (“ITRA”) issued letter No.262/BRTI/XII/2011 under which SMS fees changed from a “sender-keeps all” scheme to a cost-based scheme, effective June 1, 2012. Under the current cost-based scheme, we record revenues from interconnection fees payable by other operators whenever one of our subscribers receives an SMS from a subscriber on another network. If one of our subscribers sends an SMS to a recipient on another network, we record revenues for the SMS charge payable by our subscriber and record expenses for interconnection charges payable to the operator of the other network. We cannot assure you that we will be able to fully recoup all interconnection charges we may be required to pay, and as a result, we could experience a decrease in our operating revenues from cellular services. In the future, the Government may announce or implement other regulatory changes, such as changes in interconnection or tariff policies, which may adversely affect our business or our existing licenses.
We cannot assure you that we will be able to compete successfully with other domestic and foreign telecommunications operators or that regulatory changes, amendments or interpretations of current or future laws and regulations promulgated by the Government will not have a material adverse effect on our business, financial condition, results of operations and prospects.
We operate under an uncertain law enforcement environment, which may affect our business and competitiveness
On January 13, 2012, Mr. Indar Atmanto, the former President Director of PT Indosat Mega Media (“IM2”) was accused of corruption by the Attorney General’s Office (“AGO”). According to the AGO, a state loss amounting to Rp1,358.3 billion was caused by an agreement between IM2 and our Company, related to the alleged illegal use by IM2 of our Company’s 2.1 GHz frequency band. The MOCIT issued letter No. 65/M.KOMINFO/02/2012 on February 24, 2012 stating that there was no breach of law, crime committed, and no state loss resulting from the agreement between our Company and IM2. Moreover the MOCIT has also sent a letter to the AGO directly which states that neither our Company nor IM2 has violated any regulation and the collaboration between our Company and IM2 is lawful under the prevailing laws and regulations and common practices in the telecommunication industry. In addition, the ITRA publicly stated that IM2 had not breached any laws or prevailing rules. However, the AGO ignored the letters from the MOCIT and, on November 30, 2012, named our former President Director as a suspect and, on January 3, 2013, also named IM2 and our Company as corporate suspects. On July 8, 2013, the Corruption Court found Mr. Atmanto guilty of corruption and sentenced him to four years imprisonment and a monetary fine of Rp200 million (or an additional three months’ imprisonment). Furthermore, the Corruption Court found IM2 liable for restitution for state losses caused by such transaction and imposed a monetary fine of Rp1,358.3 billion. On July 11, 2013, Mr. Atmanto lodged his appeal against the Corruption Court’s ruling. On January 10, 2014, the Central Jakarta’s High Court affirmed the Corruption Court’s decision and imposed a higher sentence of eight years’ imprisonment and a separate monetary fine of Rp200 million (or an additional three months’ imprisonment). However, the High Court found that the Corruption Court could not impose a monetary sanction against IM2 which, as a separate legal entity, had not been separately indicted in the AGO’s litigation against Mr. Atmanto, and reversed the Corruption Court’s decision with respect to IM2. On January 23, 2014, Mr. Atmanto filed a petition for appeal to the Supreme Court and, on February 7, 2014 submitted memoranda of appeal. As of April 24, 2014, Mr. Atmanto had not received any decision from the Supreme Court with respect to his appeal. As of the same date, our former President Director, IM2 and our Company had not been formally charged for any wrongdoing in relation to this subject matter.
There can be no assurance that the AGO or any Government entity will not bring a similar or other lawsuits against IM2, our Company or any of our officers. Furthermore, we cannot assure you that Mr. Atmanto’s appeal will be decided in his favor. An unfavorable court decision relating to these matters may result in excessive fines to restore alleged state losses. Moreover, we have similar agreements with other internet service providers in
14
Indonesia and there can be no assurance that similar cases will not be filed against us in relation to those agreements. A decision adverse to us in this case or others that may be filed against us in the future could have a material adverse effect on our business, results of operations, financial condition, reputation and competitiveness.
We may be unable to fund the capital expenditures needed for us to remain competitive in the telecommunications industry in Indonesia
The delivery of telecommunications services is capital intensive. In order to be competitive, we must continually expand, modernize and update our telecommunications infrastructure technology, which involves substantial capital investment. For the years ended December 31, 2011, 2012 and 2013, our actual consolidated capital expenditures totaled Rp6,511.3 billion, Rp8,396.6 billion and Rp9,371.0 billion (US$768.8 million), respectively. During 2014, we intend to allocate Rp9,871.9 billion (US$809.9 million) for new capital expenditures, which, taken together with estimated actual capital expenditures expended for 2014 for capital expenditure commitments in prior periods, is expected to result in approximately Rp15,506.9 billion (US$1,272.2 million) total actual capital expenditures for 2014.
Our ability to fund capital expenditures in the future will depend on our future operating performance, which is subject to prevailing economic conditions, levels of interest rates and financial, business and other factors, many of which are beyond our control, and upon our ability to obtain additional external financing. We cannot assure you that additional financing will be available to us on commercially acceptable terms, or at all. In addition, we can only incur additional financing in compliance with the terms of our debt agreements. Accordingly, we cannot assure you that we will have sufficient capital resources to improve or expand our telecommunications infrastructure technology or update our other technology to the extent necessary to remain competitive in the Indonesian telecommunications market. Our failure to do so could have a material adverse effect on our business, financial condition, results of operations and prospects.
We depend on interconnection agreements relating to the use of our competitors’ cellular and fixed-line telephone networks
We are dependent on interconnection agreements relating to the use of our competitors’ cellular and fixed-line telephone networks and associated infrastructure for the successful operation of our business. If any disputes involving such interconnection arrangements arise, whether due to a failure by a counterparty to perform its contractual obligations or for any other reason, the delivery of one or more of our services may be delayed, interrupted or stopped, the quality of our services may be lowered, our subscriber churn rates may increase or our interconnection rates may increase. Any disputes involving our current interconnection agreements, as well as our failure to enter into or renew interconnection agreements, could have a material adverse effect on our business, financial condition, results of operations and prospects.
We may become subject to limitations on foreign ownership in the telecommunication services business
Presidential Regulation No. 36 of 2010 (“Presidential Regulation 36/2010”) sets out the industries and business fields in which foreign investment is prohibited, restricted or subject to the fulfillment of certain conditions as stipulated by the applicable Governmental authorities (the “Negative List”). The telecommunication industry is one of the industries set out in the Negative List, and foreign investment in the Indonesian telecommunication industry is accordingly subject to applicable restrictions and conditions. The Negative List is implemented by the Capital Investment Coordinating Board (the “BKPM”). Restrictions applicable to the telecommunication industry are dependent upon the type of telecommunication business undertaken. Different limitation thresholds are applicable depending upon whether the business pertains to telecommunication networks or services. The limitation on foreign holdings in companies engaging in the telecommunication network business ranges from 49.0%—65.0%, and the limitation on foreign shareholdings in Indonesian companies engaged in the provision of multimedia services (including data communication such as broadband wireless services), from 49.0%—95.0%. Pursuant to Article 8 of Presidential Regulation 36/2010, the
15
restrictions set forth therein shall not apply to investments that have been approved prior to the effectiveness of Presidential Regulation 36/2010 pursuant to investment approval issued by the BKPM unless such restrictions are more favorable to the investments. Presidential Regulation 36/2010 does not change the limitation of foreign shareholding in our business.
On June 22, 2008, Ooredoo Q.S.C (previously known as Qatar Telecom (Qtel) Q.S.C.) (“Ooredoo”), through its subsidiary, Qatar South East Asia Holding S.P.C. purchased all of the issued and outstanding shares of capital stock of each of Indonesia Communications Limited (“ICLM”), and Indonesia Communications Pte. Ltd. (“ICLS”) from Asia Mobile Holdings Pte. Ltd. (“AMH”), a company incorporated in Singapore. Following this acquisition, a change of control occurred in our Company, requiring Ooredoo to conduct a mandatory tender offer. In connection with the tender offer, on December 23, 2008, the Capital Market and Financial Institution Supervisory Agency of the Ministry of Finance of the Republic of Indonesia (“BAPEPAM-LK”) issued a letter (i) noting that it had received a letter from the BKPM dated December 19, 2008, pursuant to which the BKPM confirmed that the maximum amount of foreign capital ownership in our Company shall be 65.0%, and that we may still conduct our cellular network operation and local fixed network business and (ii) permitting Ooredoo to conduct the tender offer. Following the issuance of such letter, Ooredoo conducted a mandatory tender offer to acquire up to 1,314,466,775 Series B Shares, representing approximately 24.19% of our total issued and outstanding Series B Shares (including Series B Shares represented by ADSs).
As we are a publicly listed company, we believe that the Negative List restrictions do not apply to us. Article 4 of the Negative List stipulates that the provisions of the Negative List do not apply to indirect or portfolio investments conducted through the domestic capital market. To date, to the best of our knowledge, no further clarification has been formally issued by the government specifically to address whether the Negative List applies to us. If the relevant regulatory authorities determine that our foreign ownership still exceeds the Negative List restriction, the regulatory authorities may prohibit us from participating in bidding for or obtaining further licenses or additional spectrum. If this occurs, our business, prospects, financial condition and results of operations would be adversely affected.
A failure in the continuing operations of our network, certain key systems, gateways to our network or the networks of other network operators could adversely affect our business, financial condition, results of operations and prospects
We depend to a significant degree on the uninterrupted operation of our network to provide our services. For example, we depend on access to the PSTN for termination and origination of cellular telephone calls to and from fixed-line telephones, and a significant portion of our cellular and international long-distance call traffic is routed through the PSTN. The limited interconnection facilities of the PSTN available to us have adversely affected our business in the past and may adversely affect our business in the future.
Because of interconnection capacity constraints, our cellular subscribers have at times experienced blocked calls. We cannot assure you that these interconnection facilities can be increased or maintained at current levels.
We also depend on certain technologically sophisticated management information systems and other systems, such as our customer billing system, to enable us to conduct our operations. In addition, we rely to a certain extent on interconnection to the networks of other telecommunications operators to carry calls from our subscribers to the subscribers of fixed-line operators and other cellular operators, both within Indonesia and overseas. Our network, including our information systems, information technology and infrastructure and the networks of other operators with whom our subscribers interconnect, are vulnerable to damage or interruptions in operation from a variety of sources including earthquake, fire, flood, power loss, equipment failure, network software flaws, transmission cable disruption or similar events. For example, our telecommunications control and information technology back-up facilities are highly concentrated within our headquarters and our principal operating and tape back-up storage facilities are located at two sites in Jakarta. Furthermore, in April 2014, our cellular and fixed internet network experienced total black-out for a period of approximately 15 hours due to a
16
misconfiguration in our IP/MPLS backbone. We cannot assure you that we will be able to prevent network problems such as this from occurring in the future or that we will be able to rectify such problems quickly.
Any failure that results in an interruption of our operations or of the provision of any service, whether from operational disruption, natural disaster or otherwise, could damage our ability to attract and retain subscribers, cause significant subscriber dissatisfaction and adversely affect our business, financial condition, results of operations and prospects.
Our failure to react to rapid technological changes could adversely affect our business
The telecommunications industry is characterized by rapid and significant changes in technology. We may face increasing competition due to technologies currently under development or which may be developed in the future. Future development or application of new or alternative technologies, services or standards could require significant changes to our business model, the development of new products, the provision of additional services and substantial new investments by us. For example, the development of fixed-mobile convergence technology, which allows a call that originates on a cellular handset to bypass a cellular network and instead be carried over a fixed-line telephone network, could adversely affect our business. New products and services may be expensive to develop and may result in the introduction of additional competitors into the marketplace. We cannot accurately predict how emerging and future technological changes will affect our operations or the competitiveness of our services. We cannot assure you that our technologies will not become obsolete, or be subjected to competition from new technologies in the future, or that we will be able to acquire new technologies necessary to compete in changed circumstances on commercially acceptable terms. Our failure to react to rapid technological changes could adversely affect our business, financial condition, results of operations and prospects.
Security breaches on network or information technology could have an adverse effect on our business
Cyber attacks or other security breaches on network or information technology may cause network failures or service disruptions. Such failures or disruptions of support service to subscribers, even for a limited period of time, may result in significant potential revenue loss and/or loss of market share. In particular, both unsuccessful and successful cyber attacks on companies have increased in frequency, scope and potential harm in recent years. The costs associated with a major cyber attack on us could include expenses associated with incentives offered to existing customers and business partners to retain their business, increased expenditures on cyber security measures, lost revenues from business interruption, litigation and damage to our reputation.
Cyber attacks may also result in fraudulent use of our services. Unauthorized users may obtain access to critical systems, financial data, the private data of customers, and services. This risk has increased in recent years as cyber attacks and their perpetrators become more sophisticated. In addition, a high dependency on third parties for system maintenance may also lead to access to critical systems notwithstanding our supervision of the system maintenance. Such fraudulent access to critical revenue generators or billing systems may result in significant revenue losses.
Cyber attacks may exploit system vulnerability that hold sensitive information such as private subscriber data that could be disclosed or published without the prior consent of our subscribers. This occurrence could adversely impact customer and investor confidence in us, expose us to possible liability suits from subscribers, damage our reputation and could result to business loss.
17
The Government is the majority shareholder of our major competitors, PT Telekomunikasi Indonesia Tbk (“Telkom”) and PT Telekomunikasi Selular (“Telkomsel”). The Government may give priority to Telkom’s or Telkomsel’s businesses over ours
As of December 31, 2013, the Government had a 14.29% equity stake in our Company, including the Series A share, which has special voting rights and veto rights over certain strategic matters under our Articles of Association, including decisions on dissolution, liquidation and bankruptcy, and also permits the Government to nominate one Director to our Board of Directors and one Commissioner to our Board of Commissioners.
As of December 31, 2013, the Government also had a 53.90% equity stake in Telkom, which is our foremost competitor in fixed IDD telecommunications services. As of the same date, Telkom owned a 65.00% interest in Telkomsel, one of our two main competitors in the provision of cellular services. The percentage of the Government’s ownership interest in Telkom is significantly greater than its ownership interest in us. We cannot assure you that significant Government policies and plans will support our business or that the Government will treat us equally with Telkom and Telkomsel when implementing future decisions, or when exercising regulatory power over the Indonesian telecommunications industry. If the Government were to give priority to Telkom’s or Telkomsel’s business over ours, our business, financial condition, and results of operations and prospects could be materially and adversely affected.
Our controlling shareholders’ interests may differ from those of our other shareholders
As of December 31, 2013, Ooredoo Asia Pte. Ltd. (previously known as Qatar Telecom (Qtel Asia) Pte. Ltd.) (“Ooredoo Asia”), owned approximately 65.00% of our issued and outstanding share capital. Ooredoo Asia is currently wholly owned and controlled by Ooredoo, which is majority-owned by the State of Qatar and its affiliated entities. Ooredoo Asia and its controlling shareholder have the ability to exercise a controlling influence over our business and may cause us to take actions that are not in, or may conflict with, our or our other shareholders’ best interests, including matters relating to our management and policies. Although nominees of Ooredoo Asia hold positions on our Board of Commissioners and Board of Directors, we cannot assure you that our controlling shareholder will elect directors and commissioners or influence our business in a way that benefits our other shareholders.
We rely on key management personnel, and our business may be adversely affected by any inability to recruit, train, retain and motivate our key employees
We believe that our current management team contributes significant experience and expertise to the management of our business. The continued success of our business and our ability to execute our business strategies in the future will depend in large part on the efforts of our key personnel. There is a shortage of skilled personnel in the telecommunications industry in Indonesia and this shortage is likely to continue. As a result, competition for certain specialist personnel is intense. In addition, as new market entrants begin or expand operations in Indonesia, certain of our key employees may leave their current positions. Our inability to recruit, train, retain and motivate key employees could have a material adverse effect on our business, financial condition, results of operations and prospects.
If we are found liable for price fixing by the Indonesian Anti-Monopoly Committee, we may be subject to substantial liability which could lead to a decrease in our revenue and affect our business, reputation and profitability
On November 1, 2007, the Indonesian Supervising Committee for Business Competition (the “KPPU”) issued a decision regarding a preliminary investigation involving us and eight other telecommunication companies based on allegations of price-fixing for SMS services and breach of Article 5 of the Law No. 5 of 1999 on Prohibition Against Monopolistic Practice and Unfair Business Competition (“Anti-monopoly Law”). On June 18, 2008, the KPPU determined that Telkom, Telkomsel, PT XL Axiata Tbk (“XL”), PT Bakrie
18
Telecom Tbk (“Bakrie Telecom”), PT Mobile-8 Telecom Tbk (“Mobile-8,” and subsequent to March 2011, “Smartfren”) and PT Smart Telecom (“Smart Telecom”) had jointly breached Article 5 of the Anti-monopoly Law. Mobile-8 appealed this ruling to the Central Jakarta District Court, where Telkomsel, XL, Telkom, Indosat, PT Hutchison CP Telecommunication (“Hutchison”), Bakrie Telecom, Smart Telecom, PT Natrindo Telepon Seluler (“Natrindo”) were summoned to appear as co-defendants in the hearing, while Telkomsel appealed this ruling to the South Jakarta District Court. Although the KPPU decided in our favor with respect to the allegations of price-fixing of SMS, we cannot assure you that the District Court will affirm the KPPU decision. In 2011, the Supreme Court issued a ruling appointing the Central Jakarta District Court jurisdiction to examine the objections filed in the appeal of the KPPU decision. The District Court will consider objections against the KPPU decision based on a re-examination of the KPPU decision and case files submitted by the KPPU. As of April 24, 2014, we have not received any notification from the District Court with respect to the resolution of this case. If the District Court issues a verdict against us, we could be subjected to the payment of a fine, the amount of which will be subject to the discretion of the District Court, which could have an adverse effect on our business, reputation and profitability.
We are exposed to interest rate risk
Our debt includes bank borrowings to finance our operations. Where appropriate, we seek to minimize our interest rate risk exposure by entering into interest rate swap contracts to swap floating interest rates for fixed interest rates over the duration of certain of our borrowings. However, our hedging policy may not adequately cover our exposure to interest rate fluctuations and this may result in a large interest expense and an adverse effect on our business, financial condition and results of operations.
We are exposed to counter-party risk
We may enter into various transactions from time to time which will expose us to the credit of our counter-parties and their ability to satisfy the terms of contracts with us. For example, we may enter into swap arrangements, which expose us to the risk that counter-parties may default on their obligations to perform under the relevant contract. In the event a counter-party, including a financial institution, is declared bankrupt or becomes insolvent, this may result in delays in obtaining funds or us having to liquidate our position, potentially leading to losses.
We may not be able to successfully manage our foreign currency exchange risk
Changes in exchange rates have affected and may continue to affect our financial condition and results of operations. Our U.S. dollars-denominated debt obligations are lower than those which are denominated in Indonesian rupiah. Furthermore, majority of our capital expenditures are denominated in U.S. dollars and we may also incur additional long-term indebtedness in currencies other than the Indonesian rupiah, including the U.S. dollar, to finance further capital expenditures. While a portion of our operating revenues are also U.S. dollar-denominated or U.S. dollar-linked, a substantial portion of our revenues are denominated in Indonesian rupiah.
We hedge a portion of our foreign currency exposure principally because our annual U.S. dollar-denominated operating revenues are less than the sum of our U.S. dollar-denominated operating obligations, such as our U.S. dollar-denominated expenses and our U.S. dollar-denominated principal and interest payments. We cannot assure you that we will be able to manage our exchange rate risk successfully in the future or that our business, financial condition or results of operations will not be adversely affected by our exposure to exchange rate risk. See “Item 11: Quantitative and Qualitative Disclosures about Market Risk.”
19
Risks Relating to our Cellular Services Business
Competition from industry incumbents and new market entrants may adversely affect our cellular services business
The Indonesian cellular services business is highly competitive. Competition among cellular service providers in Indonesia is based on various factors, including pricing, network quality and coverage, the range of services, features offered and customer service. Our cellular services business competes primarily against Telkomsel and XL. Several other smaller GSM and CDMA operators also provide cellular services in Indonesia, including Hutchison, Bakrie Telecom and PT Smartfren Telecom Tbk. In addition to current cellular service providers, the MOCIT may license additional cellular service providers in the future, and such new entrants may compete with us. Moreover, licenses for additional bandwidth may be granted to any existing cellular service providers. For example, in March 2013, the MOCIT announced that Telkomsel and XL were winners of the tender process for an additional 5 Mhz bandwidth at 2.1 GHz radio frequency for the provision of 3G cellular services using IMT-2000 technology, resulting in each of Telkomsel and XL being licensed for an aggregate of 15 Mhz bandwidth at 2.1 Ghz radio frequency. On March 20, 2014, XL completed its acquisition of PT Axis Telekom Indonesia (“Axis,” previously known as Natrindo). XL’s acquisition provides XL with Axis’ frequency spectrum allocation at the 1800 Mhz bandwidth and Axis’ existing subscribers base. We also participated in the tender process, but were not awarded additional frequency. We are currently licensed to use 10 Mhz bandwidth at 2.1 Ghz radio frequency. We cannot predict with accuracy the effect on our business of the frequency spectrum allocation to our competitors.
The competitive landscape in the cellular services business may also be affected by industry consolidation. In March 2010, Smart Telecom and Mobile-8 announced that they entered into a strategic alliance, pursuant to which Mobile-8 (now, “Smartfren”) acquired a significant number of shares in Smart Telecom and both companies agreed to use the “Smartfren” logo and brand. Other cellular service providers may form strategic alliances or otherwise consolidate in the future. In recent years, the continuing competition from industry incumbents and new market entrants in the cellular services market has led to aggressive pricing campaigns by cellular service providers. The decrease in prices for cellular usage also led to an increase in the number of subscribers and in network traffic, resulting in increased network congestion among operators, which has required us to incur additional capital expenditures to continue to expand our network.
In addition to traditional competition from other carrier operators, the widespread use of over-the top (“OTT”) service providers, such as Skype™, Viber™ and WhatsApp™ could also affect our competitive position, cellular services business and results of operations. As basic services such as voice and messaging are being replaced by the widespread use of OTT, we face risks relating to a phenomenon in which, with unlimited data plans, users are able to download unlimited amounts of data resulting in a low rate of data monetization. Carrier operators are beginning to implement strategies to combat any loss in revenue, such as by replacing unlimited data plans with quota-based pricing or tiered-based content pricing, with special packages to access specific content.
We expect competition in the cellular services business to further intensify. New and existing cellular service providers may offer more attractive product and service packages or new technologies, such as mobile money services, or the convergence of various telecommunication services, resulting in higher churn rates, lower ARPU or a reduction of, or slower growth in, our cellular subscriber base. While we expect mobile money to become an important factor in the growth of cellular services by creating new revenue streams to leverage or maintain ARPU and reduce churn rates, we cannot assure you that our assessments will turn out to be accurate. To provide attractive mobile money services, we will need to collaborate with financial institutions to provide cash-in and cash-out points, as well as with other industry players for merchant sharing and infrastructure sharing, among others. There is no assurance that we will be able to successfully execute strategies to take advantage of opportunities presented by new technologies or that we will be able to provide equally or more attractive service packages as compared to existing or new competitors.
20
Since the market is already highly saturated in most areas of existing coverage, cellular service operators are focusing on expanding coverage into rural areas. Although we plan to expand our coverage into rural areas, there can be no assurance that we will be able to set up the infrastructure support needed for such a coverage expansion.
Competition from providers of new technology, together with new entrants, incumbents, almost saturated market and consolidated providers could adversely affect our competitive position, cellular services business, financial condition, results of operations and prospects.
Cellular network congestion and limited spectrum availability could limit our cellular subscriber growth and cause reductions in our cellular service quality
We expect to continue to offer promotional plans to attract subscribers and increase usage of our network by our cellular subscribers. We also expect to continue to promote our data services, including our BlackBerry™ and wireless broadband services. As a result, we may experience increased network congestion, which may affect our network performance and damage our reputation with our subscribers. In addition, higher cellular usage in dense urban areas may require us to use radio frequency engineering techniques, including a combination of macro, micro and indoor cellular designs, to maintain cellular network quality despite radio frequency interference and tighter radio frequency re-use patterns. However, if our cellular subscriber base or usage of our voice and data services should grow significantly in high-density areas, we cannot assure you that these efforts will be sufficient to maintain and improve service quality.
Moreover, the recent increase of smartphone applications that rely on data services has resulted in the huge amount of data traffic and cellular network congestion. In order to combat network congestion and improve network quality, we may be required to combine cellular and fixed networks and deploy Wi-Fi hotspots and 3G900. Our Company through IM2 has been actively deploying Wi-fi hotspot technology under the “Indosat SuperWifi” project. We have also been granted the license to use 900 MHz for 3G services, which we expect will improve and expand our 3G coverage to 3G900. We cannot assure you that these efforts will be sufficient to maintain and improve service quality. To ensure the smooth operation of our upgraded 3G900 network and Wi-Fi access points, we will need to upgrade our backhaul capacity, especially to fiber. “Long Term Evolution” is believed to be a newer technology that can be used to improve network quality, but we are limited by spectrum availability to deploy such services, as well as the higher capital expenditures required to deploy such infrastructure. To support such additional demands on our network, we may be required to make significant capital expenditures to improve our network coverage. Such additional capital expenditures, together with the possible degradation of our cellular services, could adversely affect our competitive position, business, financial condition, results of operations and prospects.
Our operating revenue and ARPU from voice services and fixed wireless services have been decreasing and there is no assurance that we will be successful in extending or launching existing or new products and services to offset such decrease
Our operating revenue and ARPU from voice services have been decreasing mainly due to a competitive market for voice services as well as technological changes, especially new technologies in network, devices and applications that have been causing a shift in the demand for basic services (voice services and SMS) in the telecommunications industry. Although demand for cellular data services has been increasing, margins from cellular data services has been lower compared to margins from the provision of basic services due to a competitive market for cellular data services. As part of our strategy, we intend to introduce and continue to develop cellular data products and services for a deeper and wider market segment and to invest heavily on cellular data services because we believe that cellular data services will be a source of future revenue growth. However, there is no assurance that we will be successful in capturing the growth in cellular data services and maintaining our revenue and profit margins.
21
Due to competition and the increasing popularity of mobile cellular platforms, our fixed wireless revenues and ARPU have been declining in recent years and we expect that this declining trend will continue. In 2013, we initiated a strategy to migrate from the fixed wireless platform currently utilized on our 800 MHz spectrum allocation to a cellular platform and have submitted an application with the MOCIT to do so. However, there can be no assurance that the MOCIT will approve our application or, in the event that we obtain such approval, that we will be successful in such migration, as competition from other mobile cellular providers is intense.
The Government suspension of premium SMS services could adversely affect the revenues from our cellular services business and result in sanctions against us
We have derived significant revenue from premium SMS services in previous years. These services include the delivery of music and ringtones, smartphone wallpapers and other graphics, voting in contests and polls and content including horoscopes, Qur’an quotes and news alerts. In 2011, the ITRA asked telecommunications companies to deactivate premium SMS services and give users a notice of the deactivations with the option to resubscribe. These companies were also asked to cease promoting premium SMS services, provide summaries of premium SMS service charges for users, return amounts charged to user accounts for premium SMS services, and report weekly to the ITRA regarding such actions. The ITRA based its action on complaints from consumers that they were charged for services for which they were not aware they had or inadvertently subscribed and from which they had substantial difficulty unsubscribing. Other consumers complained that charges were unclear and difficult to monitor, particularly consumers of prepaid services.
On August 6, 2013, the MOCIT promulgated MOCIT Regulation Number 21 of 2013 Regarding The Provision of Content Services on Mobile Cellular Network and Wireless Local Fixed Network with Limited Mobility, as amended by MOCIT Regulation No. 10 of 2014 (“MOCIT Regulation 21/2013”), which among others requires network operators such as our Company and content providers to obtain a license from the DGPIM to provide premium SMS services. Furthermore, pursuant to MOCIT Regulation 21/2013, premium SMS content providers are required to meet stricter requirements that are more difficult to comply with. Accordingly we do not expect revenues from premium SMS services to return to levels seen prior to October 2011.
The disruption to our premium SMS services due to the ITRA’s actions in 2011 resulted in a substantial reduction of our revenues from these services. Similar action by the ITRA or the MOCIT in the future may likewise reduce or restrict the growth of our revenues from these services or other related or new products. Furthermore, MOCIT Regulation 21/2013 is a new regulation and its application is uncertain. The ITRA or the MOCIT may take more aggressive action or a strict interpretation of MOCIT Regulation 21/2013 that may lead to disruptions in the delivery of our products or fines or other administrative sanctions. Any of these factors may materially and adversely affect our results of operations and financial condition. If any of these risks materialize, it may have a material adverse effect on our business, cash flows, operational results, financial condition and prospects.
Despite expending significant financial resources to increase our cellular subscriber base, the number of our cellular subscribers may increase without a corresponding increase in our operating revenues
We have expended significant financial resources to develop and expand our cellular network and add to our cellular subscriber base. However, the uncertain economic situation in Indonesia and increasing prices of primary goods may decrease our cellular subscribers’ purchasing power. Our cellular subscribers increased from approximately 51.7 million as of December 31, 2011 to approximately 58.5 million as of December 31, 2012, to approximately 59.6 million as of December 31, 2013. For the years ended December 31, 2011, 2012 and 2013, our ARPU was Rp28,381, Rp27,384 and Rp27,515, respectively. While we intend to continue to expend significant financial resources to expand our cellular subscriber base and expand our cellular network to support the requirements of such as expanded cellular subscriber base, we cannot assure you that such expenditures will be accompanied by a corresponding increase in our ARPU or operating revenues. Accordingly, our subscriber
22
acquisition costs and the capital expenditures required to expand our network capacity could increase without a corresponding increase in our revenue or profitability, which would materially and adversely affect our business, financial condition, results of operations and prospects.
We experience a high churn rate
We experience a high churn rate, as is common for Indonesian telecommunication operators providing prepaid cellular services. We believe that our high churn rate is due to the fact that many of our prepaid subscribers own multiple SIM cards from various cellular providers, allowing them to choose the cheapest package available. Our high churn rates may result in loss of revenue, which could have a material adverse effect on our business, financial condition, results of operations and prospects. We cannot assure you that our churn rate will not increase in future years as a result of aggressive promotional programs launched by other operators.
We depend on the availability of telecommunications towers
We are highly dependent on our and others’ telecommunications tower infrastructure to provide GSM, fixed wireless access and 3G network and mobile cellular telecommunications services, as we typically install transmitter and transceiver and receiver antennas and other BTS supporting facilities on such towers. The availability and installation of such telecommunication towers require licenses from the relevant regional authorities. A number of regional authorities have implemented regulations which limit the number and location of telecommunication towers and established requirements for operators to share in the utilization of telecommunications towers. In addition, on March 17, 2008, the MOCIT issued a regulation on the sharing of telecommunications towers. See “Item 4: Information on the Company—The Telecommunications Law—Tower Sharing Obligation.” Under the regulation, the construction of telecommunications towers requires permits from the relevant governmental institution, while the local government determines the placement and location at which telecommunications towers can be constructed. Moreover, a joint regulation promulgated on March 30, 2009 by the Minister of Home Affairs, the Minister of Public Works, the MOCIT and the Head of the BKPM requires a tower construction permit for every tower built and used for telecommunications services, which would demonstrate compliance with certain technical specifications. If a tower owner fails to obtain such a permit, the appropriate regional authorities will be entitled to impose penalties on the tower owner. Moreover, a telecommunications provider which owns telecommunication towers or tower owner is obligated to allow other telecommunication operators to utilize its telecommunication towers (other than the towers used for its main network), without any discrimination.
Such regulatory requirements may require us to adjust our telecommunications tower construction and leasing plans, relocate our existing telecommunications towers, allow other operators access to our telecommunications towers and perform other measures which may result in the increase of telecommunications tower construction costs, delays in the construction process and potential service disruption for our subscribers. If we cannot fulfill the regulatory requirements for telecommunications towers or meet our own network capacity needs for telecommunications towers, we may face difficulties in developing and providing cellular GSM, fixed wireless access and 3G telecommunications services. Our dependency on our own or others’ telecommunications tower infrastructure, combined with the burden of installing our telecommunications towers in certain instances, may also adversely affect our competitive advantage relative to other operators. Any of these events could result in a material adverse effect on our network capacity, the performance and quality of our networks and services, our reputation, business, results of operations and prospects.
Our ability to maintain and expand our cellular network or conduct our business may be affected by disruptions of supplies and services from our principal suppliers
We rely upon a few principal vendors to supply a substantial portion of the equipment we require to maintain and expand our cellular network, including our microwave backbone, and upon other vendors in relation to other supplies necessary to conduct our business. We depend on equipment and other supplies and
23
services from such vendors to maintain and replace key components of our cellular network and to operate our business. If we are unable to obtain adequate supplies or services in a timely manner or on commercially acceptable terms, or if there are significant increases in the cost of such supplies or services, our ability to maintain and to expand our cellular network and our business, financial condition, results of operations and prospects may be adversely affected.
We depend on our licenses to provide cellular services, and our licenses could be cancelled if we fail to comply with their terms and conditions
We rely on licenses issued by the MOCIT for the provision of our cellular services as well as for the utilization of our allocated spectrum frequencies. The MOCIT, with due regard to prevailing laws and regulations, may amend the terms of our licenses at its discretion. Any breach of the terms and conditions of our licenses or failure to comply with applicable regulations could result in our licenses being cancelled. Any revocation or unfavorable amendment of the terms of our licenses, or any failure to renew them on comparable terms, could have a material adverse effect on our business, financial condition, results of operations and prospects.
A significant increase in frequency fees could adversely affect our business, financial condition and results of operations
Starting on December 15, 2010, the government changed the basis of computing frequency fees to a new formula based on the bandwidth of allocated spectrum occupied by operators. Previously, we were required to pay frequency fees for 800 MHz, 900 MHz and 1800 MHz bands based on the number of radio stations. In 2011, 2012 and 2013, we paid frequency fees amounting to Rp1.8 trillion, Rp2.1 trillion and Rp2.2 trillion (US$184.6 million), respectively. As one of the largest holders of spectrum in Indonesia, we expect to continue to pay a large amount of frequency fees going forward. Future increases in frequency fees are expected to mainly be based on increases in the consumer price index and the population of Indonesia. As a result, changes in macroeconomic conditions in Indonesia could result in increases in frequency fees which, if significant, could adversely affect our business, financial condition and results of operations.
Allegations of health risks from the electromagnetic fields generated by BTSs and cellular handsets, and the lawsuits and publicity relating to them, regardless of merit, could adversely affect our operations
There has been public speculation about possible health risks to individuals from exposure to electromagnetic fields from BTSs and from the use of cellular handsets. We cannot assure you that future studies of these health risks will not suggest a link between electromagnetic fields and adverse health effects which may subject us to legal action from individuals alleging personal injuries or otherwise adversely affect our business.
Risks Relating to Our Fixed Data (“MIDI”) Services Business
Our MIDI services are facing increasing competition, and we may experience declining margins from such services as such competition intensifies
Our MIDI services are facing increased competition from new and established operators, which may have wider customer bases and greater financial resources than us, such as Telkom, with its regional and international reach and developed domestic infrastructure. In addition, operators such as XL, PT First Media Tbk (“First Media”), PT Indonesia Comnet Plus (“Icon+”) and PT NAP Info Lintas Nusa (“Matrix Cable System”), some of which have alliances with foreign telecommunications operators, compete with us in this business segment.
Our satellite business also faces increasing competition as new and more powerful satellites are launched by our competitors and as companies acquire exclusive licenses to provide broadcast services in Indonesia. Our Palapa-C2 and Palapa-D satellite transponder capacity agreements generally involve terms of between one and
24
five years, and we estimate the remaining useful life of such satellites to be approximately one and six years, respectively. As additional satellites become operational and our transponder leases expire or are terminated and price competition intensifies, our transponder lessees may utilize other satellites, thereby adversely affecting our operating margins and operating revenues from such services.
Our satellites have limited operational life and may be damaged or destroyed during in-orbit operation. The loss or reduced performance of our satellites, whether caused by equipment failure or its license being revoked, may adversely affect our financial condition, results of operations and ability to provide certain services
Our Palapa-C2 and Palapa-D satellites have a limited operational life, currently estimated to end in August 2015 and April 2020, respectively. A number of factors affect the operational lives of satellites, including the quality of their construction, the durability of their systems, subsystems and component parts, on-board fuel reserves, accuracy of their launch into orbit, exposure to micrometeorite storms, or other natural events in space, collision with orbital debris, or the manner in which the satellite is monitored and operated.
We currently use satellite transponder capacity on our satellites in connection with many aspects of our business, including direct leasing of such capacity and routing for our international long-distance and cellular services. We note, that based on the factors identified above, our Palapa-C2 satellite could fail prior to 2015 and our Palapa-D satellite could fail prior to 2020, and in-orbit repairs would not be feasible with the exception of repairs that may be addressed through ground-based software or operational fixes. Moreover, International Telecommunication Union regulations specify that a designated satellite slot has been allocated for Indonesia, and the Government has the right to determine which party is licensed to use such slot. While we currently hold a license to use the designated satellite slot, in the event our Palapa-D satellite experience technical problems or failure, the Government may determine that we have failed to optimize the existing slot under our license, which may result in the Government withdrawing our license and granting it to one of our competitors. We cannot assure you that we will be able to maintain use of the designated satellite orbital slot in a manner deemed satisfactory by the Government. On March 26, 2014, the MOCIT declared that it will not extend our license to utilize the 150.5E.L. satellite orbital slot and that such utilization license will expire as of September 1, 2015.
We maintain in-orbit insurance on our Palapa-D satellite on terms and conditions consistent with industry practice. As of December 31, 2013, we had an insurance policy with a total coverage limit of US$102.5 million for total loss of our Palapa-D satellite. If damage or failure renders our satellites unfit for use, we may elect to cease our satellite operations or lease transponder capacity from a third-party provider rather than acquiring a new satellite. The termination of our satellite business could increase operating expenses associated with our provision of other telecommunications services and could adversely affect our business, financial condition and results of operations.
Risks Relating to Our Fixed Telecommunications Services Business
The entry of additional Indonesian telecommunications operators as providers of international long-distance services could adversely affect our fixed telecommunications services operating margins, market share and results of operations
Telkom, a well-established Indonesian telecommunications incumbent with significant political and financial resources, obtained a license to provide international long-distance services and launched its commercial service in 2004. As a result of Telkom’s entry into the international long-distance market, we lost market share and experienced other adverse effects relating to our fixed telecommunications services business. By the end of 2006, Telkom had acquired significant market share for IDD services. In addition, in 2009, the Government issued Bakrie Telecom an international long-distance license in an effort to encourage greater competition in the international long-distance services market. The operations of incumbents and the entrance of new operators into the international long-distance market, including the VoIP services provided by such
25
operators, continue to pose a significant competitive threat to us. We cannot assure you that such adverse effects will not continue or that such increased competition will not continue to erode our market share or adversely affect our fixed telecommunications services operating margins and results of operations.
We face risks related to the opening of new long distance access codes
In an attempt to liberalize DLD services, the Government has issued regulations requiring each provider of DLD services to implement a three-digit access code to be dialed by customers making DLD calls. In 2005, the MOCIT announced that three-digit access codes for DLD calls will be implemented gradually within five years and that it would assign us the “011” DLD access code for five major cities, including Jakarta, and allow us to progressively extend it to all other area codes within five years. Telkom was assigned “017” as its DLD access code. In December 2007, the Government issued new regulations opening DLD access codes in the first city in Balikpapan in April 2008. Following the implementation, Balikpapan residents are able to choose from options “0,” “011” or “017” in connecting their long distance calls.
In April 2008, we and Telkom agreed to open DLD access from our respective subscribers in Balikpapan. Whether the opening of the DLD access code will be implemented in other cities will be based on a study by the ITRA.
The implementation of any new DLD access codes can potentially increase competition by offering our subscribers more options for DLD services. In addition, the opening of new DLD access codes is expected to result in increased competition and less cooperation among industry incumbents, which may result in reduced margins and operating revenue, among other things, all of which may have a material adverse effect on us. We cannot assure you that our access codes will remain intact or be successful in increasing our revenues from DLD services.
Item 4: INFORMATION ON THE COMPANY
History and Development of the Company
PT Indosat Tbk was established in Indonesia on November 10, 1967 as a foreign investment company to provide international telecommunications services in Indonesia and began commercial operations in September 1969 to build, transfer and operate an International Telecommunications Satellite Organization (“Intelsat”) earth station in Indonesia to access Intelsat’s Indian Ocean Region satellites for a period of 20 years. We operate under Law No. 40 of 2007 on Limited Liability Companies.
In 2001, as part of the Government’s initiative to restructure the telecommunications industry, we entered into an agreement with Telkom to eliminate our respective cross-shareholdings in several operating subsidiaries, including:
| | • | | our acquisition of Telkom’s 22.5% ownership interest in Satelindo (at the time the second largest cellular provider in Indonesia); |
| | • | | Telkom’s acquisition of our 35.0% ownership interest in Telkomsel; and |
| | • | | our acquisition of Telkom’s 37.2% ownership interest in PT Aplikanusa Lintasarta (“Lintasarta”) and the purchase of Lintasarta’s convertible bonds held by Telkom. |
Subsequent to the agreement with Telkom, we completed the acquisition of the remaining minority interests in Satelindo in June 2002. Since entering the Indonesian cellular market through our acquisition of Satelindo and establishment of PT Indosat Multimedia Mobile and the subsequent integration of such companies into our Company in 2003, cellular services have become the largest contributor to our operating revenues.
26
In August 2002, we entered the domestic fixed line telecommunications sector by obtaining a license to provide local fixed network services in the Jakarta and Surabaya areas.
In 2002, the Government divested 517.5 million shares, representing approximately 50.0% of our outstanding Series B shares at the time, in two stages. In May 2002, the Government sold 8.1% of our outstanding shares through an accelerated global tender. In December 2002, the Government divested 41.9% of our outstanding Series B shares to a former subsidiary of STT Communications Ltd. (“STT”).
In June 2008, Ooredoo acquired STT’s interest in us, triggering a mandatory tender offer by Ooredoo to acquire up to 1,314,466,775 Series B Shares, representing approximately 24.19% of our total issued and outstanding Series B Shares, at a purchase price of the U.S. dollar equivalent of Rp369,400 per ADS and Rp7,388 per Series B Share. Ooredoo is a publicly held corporation which is majority-owned by the State of Qatar and its affiliated entities. Ooredoo is organized under the laws of the State of Qatar with shares listed on the Doha Securities Market, as well as the Abu Dhabi Securities Market, and Global Depository Receipts traded on the London Stock Exchange.
As of December 31, 2013, the Government owned 14.29% of our outstanding shares, including one Series A share, Ooredoo Asia owned approximately 65.00% of our outstanding Series B shares and SKAGEN AS owned approximately 5.50% of our outstanding Series B shares. Ooredoo Asia is owned by Ooredoo. The remaining 15.20% of our outstanding Series B shares was owned by public shareholders as of December 31, 2013. See “Item 7: Major Shareholders and Related Party Transactions.”
For a description of our principal capital expenditures since January 1, 2010 and principal capital expenditures currently in progress, including the amount invested and method of financing, see “Item 5. Operating and Financial Review and Prospects—Liquidity and Capital Resources—Capital Expenditures.”
Our registered office is located at Indosat Building, Jalan Medan Merdeka Barat, No. 21, Jakarta 10110, Republic of Indonesia, and our telephone number is +62-21-3000-3001. Our corporate website may be accessed through the URLhttp://www.indosat.com. The information found on our corporate website does not, however, form part of this annual report and is not incorporated by reference herein. Our agent for service of process in the United States with respect to our ADSs is the Depositary, Depositary Receipt Division, 101 Barclay Street, New York, New York 10286, U.S.A.
Delisting from The New York Stock Exchange
On April 22, 2013, we announced that we intend to delist the ADSs, as evidenced by ADRs, from the NYSE and the ADSs will not be listed or quoted on another national securities exchange in the United States. On May 6, 2013, we filed a Form 25 with the U.S. Securities and Exchange Commission (the “SEC”) and consequent to the filing, the delisting of our ADSs from the NYSE became effective at the close of business of May 17, 2013. As a consequence of the delisting becoming effective, termination of the deposit agreement dated October 24, 1994 between, our Company, the Depositary and the owners and beneficial owners of ADSs, under which the ADRs were issued (the “Deposit Agreement”) became effective on July 24, 2013. Following the delisting of the ADSs and termination of the ADS program, investors will continue to be able to buy and sell our shares through the IDX. In connection with the delisting, we intend to terminate the registration of our ADSs with the SEC in 2014 in accordance with applicable U.S. securities laws and regulations.
As per the process of termination of the Deposit Agreement, holders of the ADRs can surrender their ADRs or the ADSs evidenced thereby to the Depositary in exchange for the underlying ordinary shares in our Company at any time prior to July 24, 2014. From July 24, 2014, the Depositary will start to sell the remaining underlying shares. Investors who do not surrender their ADRs and request delivery of the underlying shares before the Depositary sells those shares will lose the right to receive such underlying shares and instead will be entitled,
27
upon subsequent surrender of their ADRs or the ADSs evidenced thereby, to receive the net proceeds of sale of those shares net of surrender fees of up to US$0.05 per ADS surrendered. The date or dates on which the Depositary will sell the remaining deposited shares of our Company has not been determined, but will not be earlier than July 24, 2014. These sales are likely to occur progressively driven by market depth.
On May 17, 2013, the last reported sale price for our ADSs at the NYSE was US$28.00 (source: Bloomberg).
Divestiture of Our Entire Shareholding in PT Tower Bersama Infrastructure Tbk (“TBIG”)
On March 14, 2014, we divested our entire shareholding in TBIG, comprised of 239,826,310 shares representing 5% of TBIG’s total issued and paid up share capital at a sale price per share of Rp5,800, raising an aggregate gross proceed of Rp1,391.0 billion. Cash proceeds from the transaction will be applied towards general corporate purposes after deducting for underwriting and other costs. The divestiture of TBIG shares was completed on March 19, 2014. The divestiture of TBIG shares follows the Tower Sale Transaction which was completed in August 2, 2012 and forms part of our strategy to monetize and realize the value of our financial assets.
Business Overview
We are a fully integrated Indonesian telecommunications network and service provider and we offer a full complement of national and international telecommunications services in Indonesia. We are one of the three largest cellular operators in Indonesia as measured by number of cellular subscribers, and a leading provider of international long-distance services in Indonesia. We also provide MIDI services for domestic and regional corporate and wholesale customers as well as domestic retail customers. For the years ended December 31, 2011, 2012 and 2013, our operating revenues totaled Rp20,531.6 billion, Rp22,420.6 billion and Rp23,855.9 billion (US$1,957.2 million), respectively.
Our principal products and services include:
| | • | | Cellular services. We provide GSM 900 and 1800 and 3G cellular services to approximately 59.6 million cellular subscribers throughout Indonesia, as of December 31, 2013. |
| | • | | MIDI services. We provide broadband and narrowband MIDI services consisting of Internet services and data communication services, such as International and Domestic Leased Circuit, and MPLS-based services. We also offer satellite-based services such as transponder leasing and VSAT services and IT services, such as disaster recovery center, data center services, and Indosat Cloud Services with infrastructure-as-a-service. We provide these services directly and through our subsidiaries, Lintasarta and IM2. We offer this suite of products and services primarily to our valued corporate and wholesale customers in an attempt to be their information and telecommunication solution provider. |
| | • | | Fixed telecommunications (voice) services. We are one of the leading providers of international long-distance services in Indonesia, as measured by aggregate incoming and outgoing call minutes for 2013. To complement our cellular services and to enhance our access to domestic and international long-distance customers, we also provide fixed wireless access services using CDMA 2000 1x technology. We have also provided DLD services since 2003 and local fixed telephony services since 2002. |
Our business does not experience significant seasonality. Our principal shareholders are Ooredoo Asia, with an ownership interest of approximately 65.00% of our common stock, the Government, through the Ministry of State-Owned Enterprises, with an ownership interest of 14.29% of our common stock, including the one Series A share and SKAGEN AS, with an ownership of interest of approximately 5.50% of our common stock, in each case as of December 31, 2013. Ooredoo Asia is wholly owned by Ooredoo.
28
As a fully integrated Indonesian telecommunications network and service provider, we offer our customers a full complement of national and international telecommunications services in Indonesia, including cellular services and international long-distance services. As of December 31, 2013, our postpaid cellular subscribers could roam internationally in 190 countries. In addition, for our international long-distance services, we maintain direct connections with 60 foreign telecommunications operators in 32 countries.
As part of the global coverage we offer to our customers, we offer international calling services to Iran and to Cuba, Sudan, and Syria. There are roaming arrangements between our Company and each of Mobile Company of Iran (“MCI”), C Com, Syriatel Mobile Telecom SA (“Syriatel”) and Sudanese Mobile Telephone Co. (“Mobitel”) for Iran, Cuba, Syria and Sudan, respectively. We consider the business between our Company and Telecommunications Company of Iran (“TCI”), MCI, C Com, Syriatel and Mobitel, as well as business in Iran, Cuba, Syria and Sudan, as being insignificant relative to our size.
| | | | | | | | | | | | |
| | | As of and for the years ended
December 31, | |
| | | 2011 | | | 2012 | | | 2013 | |
| | | (unaudited) | |
Operating Data: | | | | | | | | | | | | |
Cellular: | | | | | | | | | | | | |
Number of cellular subscribers(1): | | | | | | | | | | | | |
Prepaid (in millions) | | | 51.0 | | | | 57.8 | | | | 58.8 | |
Postpaid (in millions) | | | 0.7 | | | | 0.7 | | | | 0.8 | |
Total cellular subscribers (in millions)(1): | | | 51.7 | | | | 58.5 | | | | 59.6 | |
ARPU (Rp)(2) | | | 28,381 | | | | 27,384 | | | | 27,515 | |
Minutes of Usage(3) | | | 95 | | | | 104 | | | | 93 | |
ARPM (Rp)(4) | | | 157 | | | | 127 | | | | 133 | |
Number of base transceiver stations | | | 19,253 | | | | 21,930 | | | | 24,280 | |
Number of base station controllers | | | 353 | | | | 351 | | | | 394 | |
Number of mobile switching centers | | | 75 | | | | 67 | | | | 64 | |
MIDI: | | | | | | | | | | | | |
International High Speed Leased Circuit (in thousands) | | | 366 | | | | 480 | | | | 696 | |
Domestic High Speed Leased Circuit (in thousands) | | | 296 | | | | 527 | | | | 2,055 | |
Fixed telecommunications: | | | | | | | | | | | | |
Incoming paid minutes | | | 1,841.7 | | | | 1,824.9 | | | | 1,905.6 | |
Outgoing paid minutes | | | 445.3 | | | | 408.5 | | | | 299.6 | |
Incoming and outgoing paid minutes | | | 2,287.0 | | | | 2,233.3 | | | | 2,205.2 | |
Ratio of incoming to outgoing traffic | | | 4.1 | | | | 4.1 | | | | 6.4 | |
| (1) | Cellular subscribers means the total registered and active cellular subscribers, including wireless broadband subscribers, as of the end of the relevant period. Wireless broadband subscribers refer to subscribers who exclusively subscribe to our wireless broadband services and does not include those who use our cellular “broadband on demand” services. As part of our brand remapping strategy, in January 2013, we ceased marketing wireless broadband services as a standalone cellular service. Existing wireless broadband subscribers may still use our wireless broadband services as part of our cellular services and we still derive revenues therefrom. Our formula to calculate the total number of cellular subscribers was modified to account for this change in product offering. Furthermore, for each of the relevant periods: (a) prepaid wireless broadband subscribers had been reclassified as prepaid cellular subscribers and (b) postpaid wireless broadband subscribers had been reclassified as postpaid cellular subscribers. |
| (2) | The average monthly revenue (in Indonesian rupiah) per cellular subscriber, or ARPU, is computed by dividing monthly recurring prepaid and postpaid cellular services revenues (usage charges, value-added services, interconnection revenues and monthly subscription charges), excluding non-recurring revenues such as activation fees and special auctions of telephone numbers recorded under Indonesia Financial Accounting Standard (“IFAS”), for the relevant period by the average number of prepaid and postpaid cellular subscribers. The average number of prepaid and postpaid cellular subscribers is the sum of the total number of active cellular subscribers at the beginning and end of each month divided by two. |
29
| (3) | The Minutes of Usage per cellular subscriber is computed by dividing the total minutes of outgoing and outgoing call usage of prepaid and postpaid cellular subscribers for each month by the average number of active prepaid and postpaid cellular subscribers. The average number of prepaid and postpaid cellular subscribers is the sum of the total number of active cellular subscribers at the beginning and end of each month divided by two. |
| (4) | ARPM (in Indonesian rupiah) is computed by dividing revenues from monthly recurring prepaid and postpaid cellular services, excluding non-recurring revenues such as activation fees and special auctions of telephone numbers recorded under IFAS, for the relevant period, by the total minutes (billed and unbilled) of outgoing call usage of prepaid and postpaid cellular subscribers for such period. |
The following table sets forth the breakdown of our operating revenues for each of the periods indicated and the percentage contribution of each of our services to our operating revenues:
| | | | | | | | | | | | | | | | | | | | | | | | |
| | | For the years ended December 31, | |
| | | 2011 | | | 2012 | | | 2013 | |
| | | Rp | | | % | | | Rp | | | % | | | Rp | | | % | |
| | | (Restated) | | | | | | | | | | | | | | | | |
| | | (Rp in billions, except percentages) | |
Cellular services | | | 16,587.4 | | | | 80.8 | | | | 18,489.3 | | | | 82.5 | | | | 19,374.6 | | | | 81.2 | |
MIDI services | | | 2,694.2 | | | | 13.1 | | | | 2,909.8 | | | | 13.0 | | | | 3,266.5 | | | | 13.7 | |
Fixed telecommunications | | | 1,250.0 | | | | 6.1 | | | | 1,021.5 | | | | 4.5 | | | | 1,214.8 | | | | 5.1 | |
| | | | | | | | | | | | | | | | | | | | | | | | |
Total operating revenues | | | 20,531.6 | | | | 100.0 | | | | 22,420.6 | | | | 100.0 | | | | 23,855.9 | | | | 100.0 | |
| | | | | | | | | | | | | | | | | | | | | | | | |
Cellular Services
Cellular services contributed revenues of Rp19,374.6 billion (US$1,589.5 million) for the year ended December 31, 2013, representing 81.2% of our total consolidated operating revenues in 2013. We are one of the three largest cellular operators in Indonesia, as measured by the number of cellular subscribers with 59.6 million subscribers as of December 31, 2013. For 2013, we had an estimated subscriber market share of 23.7% of the total GSM market share held by the three major GSM operators, which figure is based on our estimates based on available market data.
Our cellular network currently provides network coverage in all major cities and population centers across Indonesia. We provide our cellular services using GSM 900 and GSM 1800 technology and, for our 3G platform, IMT-2000 technology.
Services
Our principal cellular services are the provision of voice and data services, which we sell through postpaid and prepaid plans. Our prepaid and postpaid subscribers are able to make and receive “on-net” voice calls to and from other Indosat subscribers (including our Matrix, Mentari and IM3 subscribers) on our telecommunication network, as well as “off-net” voice calls to and from subscribers of other telecommunication operators on their fixed and cellular telecommunication networks.
We offer prepaid cellular service plans under the “IM3” and “Mentari,” brand names. We have differentiated our two prepaid brands based on market segments. Such differentiation allows us to target the usage and spending patterns of different consumer segments through our promotional plans. Our IM3 brand is marketed toward the younger generation, with very attractive voice, SMS and data packages and toward mid-low subscribers. Our Mentari brand is marketed towards a more mature market, professional and corporate users, especially the smart phone users, offering integrated packages comprising voice, SMS, and data services and providing subscribers with packages suitable for their smart phones. We continue to develop our IM3 and Mentari brands, offer promotions and engage in advertising tailored for those specific market segments. We offer
30
postpaid plans, designed for high-end professional and corporate users, under the “Matrix” brand name (we no longer communicate and campaign for postpaid cellular services plan under the “Indosat Mobile” brand). Matrix is a service package with a postpaid payment plan that provides the ability to register with numerous other supplementary plans, value-added services and corporate-based services. We offer various Matrix packages with different features and benefits to suit the needs of our subscribers, competitively priced integrated packages, consisting of voice, SMS, and data services.
Prepaid and postpaid subscribers have access to local, DLD and international direct long-distance dialing. In addition, we offer a variety of value-added services, functions and features to our subscribers. Such services, functions and features, which, in certain cases, are free of charge, can be purchased individually or bundled according to the package selected, include:
| | • | | SMS: allows subscribers to send short text messages to other cellular users’ mobile phone display screens; |
| | • | | Mobile data and broadband services: allows subscribers to browse and download sports, news, horoscope, movies, music and finance content to their mobile handsets, connect to a computer as modem, send and receive using GPRS and 3G network for broadband quality; |
| | • | | BlackBerry™ services: allows subscribers to register and use a full suite of BlackBerry™ services, including email, chat, browsing, GPS, and many other BlackBerry™ based applications; |
| | • | | MMS: allows subscribers of GSM service to send pictures, text and sound/voice in a single packet message; |
| | • | | Voice SMS: allows subscribers to send audible messages; |
| | • | | Ring-back tone: allows subscribers to choose their favorite song as the ringtone that is heard by callers for incoming calls; |
| | • | | GPRS: provides mobile data communications with GSM-based technology, including mobile Internet, data transfer and push e-mail (BlackBerry™ services); |
| | • | | Facsimile services: allows subscribers to send and receive faxes; |
| | • | | Voicemail: enables callers to leave voice messages that can be retrieved by subscribers; |
| | • | | Caller identification: displays the incoming call number on a subscriber’s mobile phone display screen; |
| | • | | Call holding: allows subscribers to place an incoming or outgoing call on hold while making or receiving other calls; |
| | • | | Call waiting: signals subscribers that they have an incoming call while the line is engaged. Upon hearing such a signal, subscribers can answer the second call and place the original call on hold; |
| | • | | Call forwarding: enables subscribers to forward incoming calls to other cellular or fixed-line numbers; |
| | • | | Detailed billing: provides subscribers with detailed billing statements indicating the duration and cost of calls made to and from a particular mobile phone; |
| | • | | Direct debit payment: provides a payment option that automatically deducts billed amounts from the subscriber’s bank account or credit card; |
| | • | | Recharge via SMS and automated teller machines: enables subscribers to recharge their prepaid airtime plans via SMS and automated teller machines automatically deducting billed amounts from the subscriber’s bank account; and |
| | • | | International roaming: allows prepaid and postpaid subscribers to send/receive SMS, voice and data (GPRS/3G) services while roaming on foreign cellular networks. |
Facsimile services, detailed billing and direct debit payments are only available to postpaid subscribers. Since 2009, postpaid subscribers have been able to request delivery of printed billing statements or billing
31
statements by e-mail, which minimizes the number of unreceived bills. We offer certain services free of charge, including caller identification, call holding, call waiting and call forwarding, while others, such as SMS, mobile data, broadband, BlackBerry™, facsimile services and detailed billing, carry additional fees.
We offer a VoIP Service, under the brand name “FlatCall 01016,” aimed at our most price-sensitive customers. This service is only available to our cellular, fixed wireless and fixed line subscribers. The “FlatCall 01016” service offers discounted tariff rates for certain top destination countries.
We provide our SMS service to prepaid and postpaid cellular subscribers. Usage levels have increased from an average of approximately 735 million text messages (excluding value-added service SMSs, such as SMSs related to promotions by content providers and advertisers) per day in 2012 to a daily average of approximately 750 million text messages (excluding value-added service SMSs) in 2013. In 2011, 2012 and 2013, SMS usage fees represented a substantial portion of our operating revenues. See “Item 5: Operating and Financial Review and Prospects—Operating Results—Factors Affecting our Results of Operations and Financial Condition—Tariff and Pricing Levels.” However, we have recently seen an increase in revenues from mobile data services. We expect a continuing increase in revenues from mobile data services, including GPRS, 3G, BlackBerry™ and other mobile data services in the future.
We have entered into interconnection agreements with other Indonesian telecommunications operators to allow our cellular networks to interconnect with the PSTN operated by Telkom, our international gateways and the networks of each of the other Indonesian cellular and fixed wireless access operators, thereby allowing our cellular subscribers to communicate with customers of other telecommunications service providers.
We offer international roaming services to our cellular subscribers to enable them to make and receive calls and to send and receive SMS text messages and use data services (on GPRS or 3G) when outside Indonesia. We have entered into roaming agreements with operators of GSM cellular networks in Africa, Europe, North and South America and Asia. As of December 31, 2013, our postpaid cellular subscribers could roam internationally on 519 networks, owned by 384 operators in 190 countries, and our prepaid cellular subscribers could roam internationally on 174 networks, owned by 100 operators in 64 countries.
On December 12, 2006, we became a member of the largest international telecommunications operator alliance in Asia, CONEXUS, which was formed to increase each member’s competitive value in providing international telecommunication services in its respective country and across the Asia-Pacific region. To support current roaming services through GSM, GPRS and wideband code division multiple access, or W-CDMA, the members of the alliance are cooperating to provide roaming with HSDPA technology. This alliance has expanded service coverage to more than 280 million customers in ten countries, including Indonesia as of December 31, 2013. Our postpaid and prepaid subscribers can enjoy a single tariff scheme for voice and SMS, and flat unlimited schemes for data, internet or BlackBerry™ usage.
Mobile Data Services
We launched our portfolio of mobile data services in 2000. Mobile data services can be accessed through, among others, SMS, direct dial-up connection to a WAP server or wireless broadband, where subscribers can access a variety of information, including movie listings, stock quotes, exchange rates, sports and business news and astrological predictions, and recharge their prepaid SMS cards. In addition, subscribers can send and receive e-mail and conduct mobile banking services with several leading banks through their mobile handsets.
We provide GPRS service with EDGE technology in most large cities in Java, Bali, Sumatra, Kalimantan, Sulawesi and Papua. We were the first telecommunications provider to launch the BlackBerry™ service in Indonesia. In cooperation with Research-In-Motion (“RIM”), we introduced BlackBerry™ Enterprise Service to our postpaid (Matrix) corporate customers in December 2004 and BlackBerry™ services for personal postpaid (Matrix) users in March 2005. In June 2008, to differentiate ourselves from other BlackBerry™ service operators,
32
we launched I-GPS and I-Stock applications which allow our BlackBerry™ customers to access a navigation system and real-time stock prices. In January 2009, we launched a BlackBerry™ service subscription via our prepaid brands, Mentari and IM3. In October 2011, we increased the link capacity to RIM to 2 x 3 GBPs, providing our BlackBerry™ subscribers with faster access. This increase means that we have the largest link capacity to RIM in Indonesia. In November 2011, we launched BlackBerry™ App World Billing Carrier, the first BlackBerry™ App World Billing Carrier in Asia. In December 2012, we launched “Starter Pack BlackBerry™,” a card suitable for a BlackBerry™ device. We have approximately 2.6 million BlackBerry™ subscribers as of December 31, 2013. Indonesia is one of the largest growth markets in Southeast Asia for BlackBerry™ devices.
On February 8, 2006, the Government conducted an open bidding process for 3G spectrum licenses and, following satisfactory completion of the bidding process, we were awarded one 3G spectrum license for 5 MHz of paired spectrum. In the same bidding, Telkomsel and XL were also awarded 3G spectrum licenses. In 2007, we began offering an enhanced 3G (“3.5G”) broadband service using HSDPA technology, a mobile wireless telecommunication service with enhanced 3G technology. In August 2009, we were granted additional spectrum under our existing license, which will allow us to double our network capacity to serve our broadband subscribers. In 2009, we started to deploy the new 3.5G network using HSPA+ technology, with downlink speeds of up to 42Mbps and uplink speeds up of to 5.6Mbps, and we began offering such services in 2010. In October 2012, we launched 3G900 Telecommunication Network in Padang and Bukit Tinggi, West Sumatra. We are the first operator in Indonesia to implement this technology and to launch it commercially to the public.
We are committed to developing, enhancing and adding our data service capacity to improve our subscribers’ experience. In June 2013, we substantially increased the quotas of our cellular data packages with the aim of increasing our data user penetration and improving the purchasing profile our subscribers.
In October 2013, we deployed “Indosat SuperWifi” coverage at approximately 4,000 spots in certain main cities in Indonesia including Jakarta, Semarang, Denpasar and Surabaya. “Indosat SuperWifi” adopted the Wi-Fi technology that allows our subscribers to access unlimited internet data on handsets or tablets from “Indosat SuperWifi” hotspots using our number with speeds of up to 20Mbps.
Subscribers and Marketing
We segment the Indonesian population by location, disposable income and other factors we believe indicate the desire and ability of individuals and corporations to purchase our products and services. We then target areas that are generally more prosperous as these areas tend to yield a higher density of potential cellular subscribers. Through this approach, we have achieved a diversified cellular subscriber base spread throughout Indonesia’s major population centers. We implemented this strategy to adapt to competition from new entrants and pricing pressures in major urban areas.
Our prepaid subscriber base has grown significantly over the past three years relative to our postpaid subscriber base. As of December 31, 2011, we had 0.7 million postpaid and 51.0 million prepaid cellular subscribers. As of December 31, 2012, we had 0.7 million postpaid and 57.8 million prepaid cellular subscribers. As of December 31, 2013, we had 0.8 million postpaid and 58.8 million prepaid cellular subscribers. We conduct nationwide marketing and promotional activities, as well as regional or local campaigns, in an attempt to retain our existing valued cellular subscribers and to acquire new cellular subscribers. We believe Indonesian cellular subscribers tend to favor the convenience, ease of activation, avoidance of fixed commitments and lack of credit checks associated with prepaid cellular plans. Accordingly, we have focused on this particular subscriber base in our marketing efforts.
33
The following table presents certain information regarding our cellular subscriber base, ARPU, Minutes of Usage and ARPM as of the dates indicated:
| | | | | | | | | | | | |
| | | As of or for the years ended
December 31, | |
| | | 2011 | | | 2012 | | | 2013 | |
Number of cellular subscribers(1): | | | | | | | | | | | | |
Prepaid (in millions) | | | 51.0 | | | | 57.8 | | | | 58.8 | |
Postpaid (in millions) | | | 0.7 | | | | 0.7 | | | | 0.8 | |
Total cellular subscribers(1): | | | 51.7 | | | | 58.5 | | | | 59.6 | |
ARPU (Rp)(2) | | | 28,381 | | | | 27,384 | | | | 27,515 | |
Minutes of Usage(3) | | | 95 | | | | 104 | | | | 93 | |
ARPM (Rp)(4) | | | 157 | | | | 127 | | | | 133 | |
| (1) | Cellular subscribers means the total registered and active cellular subscribers, including wireless broadband subscribers, as of the end of the relevant period. Wireless broadband subscribers refer to subscribers who exclusively subscribe to our wireless broadband services and does not include those who use our cellular “broadband on demand” services. As part of our brand remapping strategy, in January 2013, we ceased marketing wireless broadband services as a standalone cellular service. Existing wireless broadband subscribers may still use our wireless broadband services as part of our cellular services and we still derive revenues therefrom. Our formula to calculate the total number of cellular subscribers was modified to account for this change in product offering. Furthermore, for each of the relevant periods: (a) prepaid wireless broadband subscribers had been reclassified as prepaid cellular subscribers and (b) postpaid wireless broadband subscribers had been reclassified as postpaid cellular subscribers. |
| (2) | The average monthly revenue (in Indonesian rupiah) per cellular subscriber, or ARPU, is computed by dividing monthly recurring prepaid and postpaid cellular services revenues (usage charges, value-added services, interconnection revenues and monthly subscription charges), excluding non-recurring revenues such as activation fees and special auctions of telephone numbers recorded under IFAS, for the relevant period by the average number of prepaid and postpaid cellular subscribers. The average number of prepaid and postpaid cellular subscribers is the sum of the total number of active cellular subscribers at the beginning and end of each month divided by two. |
| (3) | The Minutes of Usage per cellular subscriber is computed by dividing the total minutes of outgoing and outgoing call usage of prepaid and postpaid cellular subscribers for each month by the average number of active prepaid and postpaid cellular subscribers. The average number of prepaid and postpaid cellular subscribers is the sum of the total number of active cellular subscribers at the beginning and end of each month divided by two. |
| (4) | ARPM (in Indonesian rupiah) is computed by dividing revenues from monthly recurring prepaid and postpaid cellular services, excluding non-recurring revenues such as activation fees and special auctions of telephone numbers recorded under IFAS, for the relevant period, by the total minutes (billed and unbilled) of outgoing call usage of prepaid and postpaid cellular subscribers for such period. |
As of December 31, 2013, we had approximately 59.6 million cellular subscribers.
To consolidate our marketing channels for cellular services, we have opened integrated walk-in centers, under the names “Galeri Indosat,” which we operate, and “Griya Indosat,” which are operated by our exclusive distributors. These walk-in centers function as sales outlets and provide potential and existing cellular subscribers with customer service and product information. We also have a dedicated team of employees who coordinate sales and services to Indonesian corporations.
To supplement our direct marketing channels, we maintain a network of approximately 60 distributors as of December 31, 2013, to whom we offer various incentives for the promotion and sale of our services. These independent regional and multi-regional distributors have their own distribution networks throughout Indonesia and promote our cellular services, primarily to individuals. These distributors include major distributors of
34
mobile handsets and typically have their own retail networks, direct sales forces and sub-distributors in Indonesia. These outlets serve as additional branch outlets for us and offer a broad range of services, including product and service information, customer service and bill payment processing. Existing and new cellular subscribers can activate and register and pay for all of our prepaid cellular services at these outlets. We continue to maintain our relationships with our distributors in an attempt to generate higher sales volume through better product placement, an integrated dealer network and enhanced distributor loyalty.
Tariff Structure and Pricing
The MOCIT establishes a tariff formula that determines the ceiling tariffs, or maximum amounts that operators may charge for prepaid and postpaid cellular services. Cellular service providers are permitted to offer promotional programs that offer lower prices than the ceiling tariffs. We currently price our prepaid cellular services under a variety of ongoing promotional programs to provide incentives to attract new subscribers, stimulate demand and improve our competitive position. We may charge different rates for prepaid and postpaid cellular services, depending on various factors that apply to a particular type of service. For instance, the billing expenses we incur to serve our postpaid subscribers are typically higher and accordingly, our rates for postpaid cellular services tend to be higher than those for prepaid cellular services.
The Indonesian cellular telecommunications market uses a “calling party pays” system, which requires the originators of telephone calls to pay for calls. If one of our subscribers makes a call to another network, we incur interconnection charges. Previously, the tariff for SMS (including value-added SMS) was based on a “sender-keeps-all” scheme, under which we earned revenues whenever one of our cellular subscribers sends an SMS, but not when a customer of another telecommunications operator sent an SMS to one of our cellular subscribers. On December 12, 2011, the Government, through the ITRA, issued letter No.262/BRTI/XII/2011, under which tariffs for SMS changed from a “sender-keeps all” scheme to a cost-based scheme, effective June 1, 2012. Under the current cost-based scheme, we record revenues from interconnection fees payable by other operators whenever one of our cellular subscribers receives an SMS from a subscriber on another network. If one of our subscribers sends an SMS to a recipient on another network (an “off-network SMS”), we record revenues for the SMS charge payable by our subscriber and we record expenses from interconnection charges payable to the operator of the other network. For our GPRS service, we charge cellular subscribers Rp1 per kilobyte of data downloaded for the first 300k and Rp0.5/kB up to Rp2/kB (excluding tax) thereafter, depending on the time of download (i.e. off peak versus peak times). We receive roaming settlements from foreign telecommunications operators when their cellular subscribers roam on our network.
Activation Fees and Monthly Charges. Activation fees represent the initial connection fees charged to new prepaid subscribers when subscribing to a cellular network. Monthly charges are fixed amounts charged to postpaid subscribers, particularly Corporate BlackBerry™ Enterprise Service users that require new BlackBerry™ software. Since 1998, we have not charged our postpaid subscribers an activation fee. In 2011, we offered several programs for postpaid subscribers, including the “Indosat Mobile” package plan which gives subscribers the choice of daily, weekly or monthly usage plans of Rp2,000, Rp12,000 and Rp50,000, respectively, under which the subscriber pays for all calls and data usage at applicable rates.
Usage charges. There are three types of calls: local, domestic long distance, and international calls. Calls are charged on different charging blocks, from per second up to per minute blocks, depending on the package plan chosen by the subscriber. Calls may terminate on any of the cellular, fixed or satellite networks. For on-net calls, our subscribers are charged favorable rates because of our ability to offer bundled products, such as cellular and international long-distance services. For off-net calls, the usage charges of subscribers are greater because of interconnection, domestic long-distance, and international long-distance charges.
Value-added Services. Prior to 2008, tariffs for value-added services were not regulated by the Government. Since April 2008, the MOCIT has been responsible for setting the tariff formula for SMS. As with voice services, we offer promotional discounts for SMS and mobile data services for both postpaid and prepaid subscribers.
35
Interconnection
Prior to 2007, the charges for postpaid subscription services consist of monthly subscription and interconnection-based usage charges. Charges for prepaid subscription services likewise include interconnection-based usage charges. The interconnection-based usage charges for both prepaid and postpaid cellular services are calculated by considering three interconnection costs, namely originating, transit and terminating costs.
Since January 2007, the MOCIT has set a tariff formula for interconnection services. The MOCIT sets this tariff formula on a “cost” basis and publishes the industry reference interconnection tariffs. All service providers are required to publish their interconnection tariffs in their respective RIOs. Interconnection agreements are based on RIOs and for dominant players, their RIOs must be submitted and approved by the ITRA. The MOCIT approved the RIOs we submitted in 2007 and 2008, which have not been adjusted for 2009 and 2010. In 2013, we were not considered a dominant service provider and as such our RIOs were not subject to approval from the ITRA.
On December 31, 2010, the ITRA issued letter No. 227/BRTI/XII/2010 which set a new set of interconnection tariffs. The new interconnection tariffs took effect on January 1, 2011 and have been reflected by an adjustment to our RIOs for 2011. We apply the charges in our RIOs to the interconnection agreements we have with other operators. The charges under our RIOs have been decreasing in the past few years, and we expect the downward trend to continue.
We currently interconnect with fixed line and cellular networks operated by all network operators at numerous locations throughout Indonesia. To minimize our interconnection expenses, we utilize our own backbone transmission facilities whenever possible and in compliance with applicable regulations. For example, routing a long-distance call from a customer in Surabaya to a destination customer in Jakarta through our fiber optic or microwave transmission lines allows us to avoid the use of another operator’s network, thereby lowering our interconnection expenses associated with routing our intra-network usage.
Activation, Billing and Collection
Prepaid cellular subscribers can purchase starter packs from our sales and distribution points or through our various distributors or outlets. To activate service, a new prepaid cellular subscriber must register with us by following the instructions using the interactive menu. Potential postpaid subscribers can apply for our cellular services at our sales and distribution points or through our distributors. Many of our distributors, however, can only receive new applications for postpaid cellular services, which are then forwarded to us for processing. A potential subscriber for our postpaid service is required to provide proof that such subscriber meets our minimum credit requirements. If a potential subscriber does not meet our postpaid requirements, our sales representative recommends our prepaid services. Once approved, postpaid service SIM cards are activated within 24 hours.
We bill our postpaid subscribers on a monthly basis through our centralized billing division. In the case of prepaid subscribers, the wireless billing system automatically reduces the value of each prepaid subscriber’s account as originating, transit and terminating charges are assessed. Our postpaid subscribers have a variety of payment options in paying their monthly bills. Payments may be made by cash and major credit cards through Indosat galleries, bank tellers or post office branches. In addition, subscribers can also make payment via automatic debit through banks or participating credit card companies, bank transfers, automated teller machines, Electronic Data Capture, mobile banking, Internet banking, and phone banking. Payments are due 20 days after the account statement date. 27 days after the statement date, we remind subscribers who have not paid their outstanding balance and block their ability to make outgoing calls. We block a subscriber’s ability to make or receive calls 40 days after the statement date if he or she still has not paid his or her balance. We suspend the service for accounts that are more than 50 days past due and remove such subscriber’s data from our network and permanently disconnect the number and SIM card after 120 days from the statement date.
We have taken a number of steps to prevent subscriber fraud and to minimize losses. We deliver prepaid vouchers to our distributors only on a cash-on-delivery basis and we do not collect payments for our services
36
from cellular subscribers through our distributors. In addition, depending on usage levels, we may require refundable deposits from subscribers. We also review accounts of our high-usage subscribers at regular intervals to ensure that the deposit levels continue to be adequate.
Competition
The cellular services business in Indonesia has become more competitive during recent years due to high cellular penetration rates, mainly in urban areas. Competition in the cellular communications industry is based principally on network coverage, technical quality, price plans, the attractiveness of mobile data services and special features and quality and responsiveness of customer service. Based on our internal estimates, the three major providers of wireless services in Indonesia, Telkomsel (which is majority-owned by Telkom), XL (which is indirectly majority-owned by Axiata Group Bhd. of Malaysia) and us, accounted for almost 80% of the cellular subscriber base in Indonesia in 2013. On March 20, 2014, XL completed its acquisition of Axis. XL’s acquisition provided XL with Axis’ frequency spectrum allocation at the 1800 Mhz bandwidth and Axis’ existing subscribers base.
We also compete with other fixed wireless access service providers. In May 2003, Telkom introduced TelkomFlexi, a CDMA 2000-1X service in the Jakarta area. After receiving requests from industry associations, the MOCIT issued a decree stating that the service area of the fixed wireless access networks must be limited to an area equal to one area code of the local fixed network service. Fixed wireless access service operators are therefore prohibited from extending their roaming services to other area codes, but CDMA operators still have the ability to achieve similar results by giving subscribers a new number when they move to other cities. Telkom, Bakrie Telecom and Smartfren have each been granted nationwide fixed wireless access service licenses, allowing them to offer their services nationwide, further intensifying competition. In 2014, Telkom announced its intention to cease its fixed wireless business by 2015 and to migrate its fixed wireless customers to its cellular platform.
From time to time, Indonesian telecommunications operators conduct aggressive subscriber acquisition programs with the goal of increasing individual market share. By offering discounts, bonuses and special rates, operators attempt to differentiate their services from those of other operators, primarily based on price. This competition has caused tariffs to decline and, as a result, we believe cellular subscriber ARPU has continued to decline for most Indonesian telecommunications operators.
We believe competition for 3G services will be intense as telecommunications operators continue to deploy their networks in major population centers. As of December 31, 2013, there were five telecommunications operators holding 3G licenses: Telkomsel, Hutchison, XL, Axis (which was acquired by XL in March 2014) and us. We commenced providing wireless broadband services using our 3.5G platform in 2009 and, as of December 31, 2013, we offered 3.5G services in 208 cities nationwide.
Our main competitors for mobile broadband services are Telkomsel, and XL with its 3G Hotrod campaign. Other operators, such as Smartfren also provide mobile broadband service using EVDO-CDMA technology.
We believe barriers to entry in the Indonesian cellular and fixed wireless access services industry are currently comparatively high due to the limited availability of frequency spectrum, a capital intensive operating environment, difficulties in acquiring tower sites for network expansion and the established market presence of the three incumbents, us, Telkomsel and XL. Nevertheless, we are anticipating continued intense competition within the Indonesian cellular and fixed wireless access services industry generally. In response to this, we intend to dedicate a substantial portion of our future capital expenditures to our cellular business in an effort to increase network capacity and service quality and to provide various value-added services.
37
MIDI Services
The products and services that we offer in this business segment include high-speed point-to-point international and domestic leased line with broadband and narrowband capacity, MPLS-based services, satellite transponder leasing, Internet services and IT services such as disaster recovery center and data center services. Recently, we launched Indosat Cloud Services with infrastructure-as-a-service. Indosat Cloud Services is provided via the internet or private network in a scalable, package model built using industry leading hardware and software. Recognizing the significant growth potential of data and other network services, including Internet-based services, and their increasing importance to our overall business strategy, we have placed considerable emphasis on this business segment. The growing emphasis on reliable data transmission and interconnectivity by our corporate customers, especially those with multiple branches or locations, presents an excellent opportunity for us. MIDI services represented Rp3,266.5 billion (US$268.0 million), or 13.7% of our total consolidated operating revenues for the year ended December 31, 2013.
| | | | | | | | | | | | |
| | | For the years ended
December 31, | |
| | | 2011 | | | 2012 | | | 2013 | |
| | | (in thousands) | |
MIDI: | | | | | | | | | | | | |
International High Speed Leased Circuit | | | 366 | | | | 480 | | | | 696 | |
Domestic High Speed Leased Circuit | | | 296 | | | | 527 | | | | 2,055 | |
Services
World Link, Direct Link and Domestic Link. World Link is an international private line circuit that provides international connection of high-speed digital data circuits on a point-to-point basis via submarine and terrestrial cables and offers line speeds from 64 Kbps and multiples thereof up to 2 Mbps for narrowband or 45 Mbps and above for broadband. Direct Link is a leased line service through satellite or VSAT connections which provides high-speed digital data circuits on point-to-multipoint basis and offers line speeds from 64 Kbps and multiples thereof up to 2 Mbps for narrowband. Domestic Link is a domestic private leased circuits service that provides high-speed digital data circuits on a point-to-point basis and offers line speeds from 64 Kbps and multiples thereof up to 2 Mbps for narrowband or 45 Mbps and above for broadband. Most of our broadband World Link customers are telecommunications providers who require dedicated broadband international data links, and our narrowband World Link customers consist primarily of corporate users who subscribe to our World Link service for their own internal use. Direct Link is used for international connections and other leased line users located in areas that are not covered by terrestrial domestic networks. Our broadband Domestic Link customers in the domestic market include telecommunications providers that need dedicated domestic broadband data links, and our narrowband Domestic Link customers mostly are corporate users who use the service for their own internal use. We recorded operating revenues of Rp340.7 billion (US$28.0 million) from World Link and Domestic Link operations, representing 10.4% of our consolidated MIDI services operating revenues for the year ended December 31, 2013.
IP VPN. We provide both international and domestic IP VPN services through Indosat, Lintasarta, and IM2, which provide customers with multi-point connectivity for data communication through our robust IP network cloud. These services support flexibility, scalability, and accommodate complex distributed computing applications, while maintaining the quality of service, security, and reliability close to that of private leased circuit. We recorded operating revenue of Rp706.0 billion (US$57.9 million) from IP VPN operations, representing 21.6% of our consolidated MIDI services operating revenues for the year ended December 31, 2013.
MPLS and Metro Ethernet. MPLS and Metro Ethernet are domestic and international leased line services provided through our robust Internet Protocol network cloud. MPLS is a technology platform that has an ability to provide various classes of services on an Internet Protocol network, resulting in a flexible, scalable, reliable and secure data communication link, both for point-to-point or multipoint domestic inter-city and international
38
connections. Our MPLS-based services consist of Premium Ethernet Point to Point, Premium Ethernet Multi Point, and IP VPN, and offer line speeds from 64 Kbps and multiples thereof up to 2 Mbps for narrowband or 45 Mbps and 155 Mbps for broadband. Metro Ethernet provides high-speed domestic inner-city bandwidth connections with line port speeds of 10 Mbps, 100 Mbps and 1 Gbps and an Ethernet base with an incremental guaranteed bandwidth of 1 Mbps. We recorded operating revenue of Rp380.8 billion (US$31.2 million) from MPLS and Metro Ethernet services, representing 11.7% of our consolidated MIDI services operating revenue for the year ended December 31, 2013.
We offer our various data connectivity services, including World Link, Direct Link, Domestic Link, IP VPN, MPLS and Metro Ethernet, to our various corporate customers, including multinational corporations, that are tailored to fit their specific information and telecommunications requirements, pricing parameters, speed requirements and security concerns.
Satellite Services. We lease transponder capacity on our Palapa-D satellite, which is positioned in an orbital slot located over the Asia-Pacific region, to broadcasters and telecommunications operators. Indonesia has a large television market in which a number of privately-owned domestic broadcasters and international programmers compete with the state-owned broadcaster and many of these domestic and international broadcasters lease capacity on our satellite. We have entered into lease arrangements governing transponders on our Palapa-D satellite that vary in duration but generally terminate within two to five years of the effective date of the lease. Transponder leases may be terminated for breach of the lease agreement and most of the leases provide that the lessee may terminate the lease with notice (generally six to 12 months) subject to the payment by the lessee of a termination fee equal to a percentage of the lease payments that would have been due had the lease not been terminated. As of April 24, 2014, our Palapa-C2 satellite had been used by us for our own network infrastructure and was not leased to any third party customer.
We also provide a variety of other satellite derivative services, including occasional use for TV services (including Indosat TV link, “Satellite News Gathering” and transportable uplink station services), private network services, Internet access and multimedia and video conferencing. We expect demand for satellite services to continue to grow, mainly driven by accelerating growth of satellite derivative services. Pressure on pricing is expected to ease as a consequence of improved demand. Satellite services represented Rp278.2 billion (US$22.8 million) or 8.5% of our MIDI services operating revenues for the year ended December 31, 2013.
Internet Services. We provide international IP transit services for ISPs via the Jakabare and SEA-ME-WE 3 (South East Asia Middle East Western Europe 3) cable systems and domestic IP transit via our MPLS backbone. Dedicated internet access services for end users and corporate customers are delivered by Indosat, IM2 and Lintasarta. As part of our strategy to expand our Internet business, we leverage our infrastructure assets through connections to Tier-1 upstream providers, such as AT&T, PCCW Global, STIX and Tata and establishing bilateral peering with major service providers in the region and dominant content providers, such as Google and Microsoft. The total capacity of our international backbone is 160 Gbps, part of which is allocated to support our Internet services, and it is upgradable to up to 640 Gbps. In anticipation of increased competition in the Internet business, we have formulated a strategy to expand our business by developing Internet protocol backbone processes in potential growth areas, deploying public hotspot services and improving our business processes.
Lintasarta offers corporate subscribers dedicated internet services under the “Lintasarta Dedicated Internet” brand and broadband services under the “Lintasarta Broadband Service” brand. We derived Rp696.2 billion (US$57.1 million) or 21.3% of our consolidated MIDI services operating revenues from Internet services for the year ended December 31, 2013.
Internet services represented Rp696.2 billion (US$57.1 million) or 21.3% of our consolidated MIDI services operating revenues for the year ended December 31, 2013.
VSAT Net/IP and VSAT Link. Lintasarta’s VSAT Net/IP and VSAT Link services are satellite-based data networking systems. VSAT Net/IP connects and controls data traffic among remote locations, allowing for quick
39
development of data for network customers with low-to-medium traffic in such sectors as financial services, transportation, trading and distribution. VSAT Link provides point-to-point digital transmission for remote locations by businesses with medium-to-heavy traffic such as those in the manufacturing, mining and financial services industries.
Disaster Recovery Center and Data Center. We provide disaster recovery center and data center services through our Company and Lintasarta. We offer co-location, rack, cage, power, and other supporting facilities as value added services to corporate customers. We also provide backbone or domestic leased line services from our disaster recovery center or data center locations to customer headquarters, as part of our total telecommunications solutions. We received ISO 27001 on Information Security Management System covering our disaster recovery center and data center.
IT Services. We launched Indosat Cloud Services in December 2012, with infrastructure-as-a-service as the first service offered in our cloud portfolio under a revenue sharing agreement with PT Dimension Data Indonesia. We also launched “Indosat Managed Services” in April 2013 which provides managed router and hosting services.
Customers and Marketing
Our customers for MIDI services are primarily corporate clients and small-to medium-size enterprises (“SME”), although we also have wholesale and retail customers for certain services, such as our Internet services. Our marketing activities for MIDI services include exhibitions, participation in events, group presentations, seminars, direct mail, partner promotions, customer retention programs and advertisements in publications and printed media. Also, through our Indosat Corporate Solutions Micro site, we provide corporate customers with convenient access to information about Indosat Corporate Solutions products and services and increase brand awareness of these services. Each business unit seeks to maintain existing customer relationships through activities such as user forums, training seminars, courtesy visits and informal gatherings. In addition, during 2012, Indosat had been selected by the Government as one of the providers to support the national electronic identification card (also known as E-KTP) program. In this program, we had been given trust to deploy infrastructure throughout sub-districts level across Indonesia.
Lintasarta is focused on expanding its market share in segments outside of its core competencies of banking and finance, in light of the anticipated consolidation and restructuring of those industries in Indonesia. Lintasarta is expanding the existing geographic coverage of its products and services to address the increasing demand for telecommunications infrastructure in outlying regions as a result of Indonesian political developments, including increased regional autonomy.
We support our subscribers through local area staff, a 24-hour help desk and integrated real-time network management. In April 2000, Lintasarta achieved ISO 9002 certification for its frame relay, digital data network and VSAT services. In January 2002, we obtained ISO 9001 certification for our frame relay, digital data network and VSAT services, evidencing our commitment to customer satisfaction and continuous service quality improvement. As a result of these activities, Frontier and Marketing Magazine awarded us the “Top Brand Award” in the ISP category for the years 2005 through 2010 and the “Best Contact Center Award” for 2007, 2008 and 2009. As appreciation of our commitment to operational excellence, in June 2010, Cable and Wireless awarded Indosat as “Best Partner” in the Maintenance and Achievement Operational Excellence in Asia category in the Cable and Wireless Global partner Gathering in Singapore. In 2012, we achieved ISO-27001 for our Data Center services, and received the MEF certification for our Metro-Ethernet services. In 2012, Lintasarta was awarded Grand Champion1 in the customer Service Championship and was also awarded the Corporate Image Award among data communication companies. We also received the “Indonesia Data Center Services Provider of the Year” award from Frost & Sullivan for 2012 and 2013.
40
Tariff Structure and Pricing
Customers of our various MIDI services are charged based on the type of product and service provided, the capacity leased, their industry sector, geographic location and the length of service contracts with us (which generally range from one to three years). Service charges generally include the following components: initial installation; monthly service charges (based on location and access speed); transactional charges (based on the volume, duration and/or distance traveled for network traffic); and other charges for services such as consultancy and project management.
Satellite transponder lease rates to international lessees are negotiated individually with customers and depend on the supply and demand for services in the areas covered by our Palapa-C2 and Palapa-D satellites. Our offshore leases averaged between US$1.2 million and US$1.3 million per annum for a full transponder in 2013. Almost all offshore lease payments are payable quarterly in advance in U.S. dollars and other widely used currencies.
Competition
Data communications service providers in Indonesia compete principally on the basis of price, range of services provided and customer service quality. During the last few years, competition among data communications service providers has intensified principally due to the issuance of new licenses resulting from the deregulation of the Indonesian telecommunications industry. We expect competition to continue to intensify. We believe that our major competitors are Citra Sari Makmur, Tangara Mitracom, Satkomindo and Primacom with respect to our VSAT services, Telkom, XL, Icon+, and Citra Sari Makmur, with respect to our domestic leased line services, and Telkom, XL, and to a lesser extent, Matrix Cable System, PT Mora Telematika Indonesia (“Moratel”) and Icon+, with respect to our international leased line services. Telkom enjoys dominance in the MIDI business sector, we believe due in part to its extensive last mile coverage, whereas we are particularly strong in serving the financial, oil and gas, and mining industry segments.
ISPs in Indonesia compete on the basis of network quality, price and network coverage. With respect to Internet-related value-added services, we compete against Telkom and other existing ISPs, such as First Media, PT Supra Primatama Nusantara (operating under its trade name, “Biznet”), PT Cyberindo Aditama (operating under its trade name, “CBN”), PT Berca Hardayaperkasa and PT IndoInternet (operating under its trade name, “Indonet”). We also face significant competition from any new ISPs whose licenses are approved by the MOCIT.
As corporate markets demand greater speed at affordable prices, many bandwidth suppliers have begun making significant investments toward building superior infrastructure using new technology, such as “Dense Wavelength Division Multiplexing,” or DWDM technology. DWDM technology offers more bandwidth capacity and better quality of service with better cost efficiency. This market demand is also leading to the expansion of Ethernet-based services, which offer simplicity of service, affordable prices and wide bandwidth.
The bandwidth industry has been facing recent challenges from the emergence of new operators and the expansion of existing operators, such as Moratel, Telkom and XL. In December 2011, XL and Moratel completed deploying their Batam-Dumai-Malaka Cable System.
Companies in the satellite business compete principally on the basis of coverage, transponder power, product offerings and cost. Generally, the cost of service depends upon the combination of power and coverage. In recent years, competition within the satellite business in the Asia-Pacific region has been intense. Our satellite operations have primarily consisted of leasing transponders to broadcasters and telecommunications operators of VSAT, cellular and IDD services and ISPs. We face competition from foreign and domestic service providers in each of these areas. In leasing our transponders on the Palapa-D satellite, we compete most closely in Indonesia with Telkom and PT Pasifik Satelit Nusantara (“Pasifik Satelit Nusantara”). Pasifik Satelit Nusantara also owns transponders on the Mabuhay Philippines Satellite. Telkom currently operates its own satellites (Telkom-1 and
41
Telkom-2) and earth stations primarily to provide backbone transmission links for its network. Telkom also leases satellite transponder capacity and provides earth station satellite uplinking and downlinking service to domestic and international users. Other private satellites serving the broadcast market within the coverage area of the Palapa satellites include AsiaSat-4, AsiaSat-3S, Apstar-2R, Apstar-5, Apstar-6, Chinasat 10/Sinosat 5, Chinasat 6B, ThaiCom4, ThaiCom5, Measat-3, Measat-3a, Intelsat 7, Intelsat 8, Intelsat 10 and Intelsat 12. APT Satellite, which operates the Apstar satellites, China Satellite Communication Co. Ltd which operates Chinasat satellites, ThaiCom Public Company Ltd, which operates the ThaiCom satellites, Measat Sdn. Bhd, which operates the Measat satellites and Intelsat S.A., which operates the Intelsat Satellites, also compete directly with us in the Asian regional market. Moreover, with the increasing popularity of Direct-To-Home television (“DTH”), our satellite business will face increasing competition as new and more powerful regional satellites are launched. DTH is the reception of satellite programs with a personal dish in an individual home. National broadcasters are seeking DTH licenses to provide nationwide broadcast services in Indonesia. DTH television will enable broadcasters to distribute their program content without utilizing our telecommunication network support. In addition, because of the growing popularity of DTH, we face the possible loss of customers because DTH uses a satellite platform that we do not provide.
Fixed Telecommunications Services
Our fixed telecommunication services include international and domestic long distance as well as fixed wireless access services. For the year ended December 31, 2013, we recorded operating revenues of Rp1,214.8 billion (US$99.7 million) from our fixed telecommunications services, representing 5.1% of our total consolidated operating revenues. Except with respect to payments from our cellular, fixed wireless and fixed line subscribers, we do not receive any payments directly from the end users of our international long-distance services.
Services
International Long-Distance Services. We provide a variety of international voice telecommunications services and both international switched and non-switched telecommunications services. Switched services require interconnection with either the PSTN or another mobile cellular operator’s facilities; non-switched services can be completed through our transmission facilities without the need for interconnection. Within our international long-distance services, we offer a premium IDD service through our “001” and “008” access code. Our premium IDD service can be accessed by any operator in Indonesia. We also offer a budgeted international call services under the brand name “FlatCall 01016,” which offers affordable tariff rates targeting mass and budget oriented customers for certain top destination countries, and is only available to our subscribers. “FlatCall 01016” become a unique selling point to our GSM products differentiating us from our competitors. In 2013, approximately 20.5% of our outgoing international long-distance call minutes (including calls placed through “Flatcall 01016”) originated from the province of East Java, followed by 7.9% originating from the province of West Java, and 33.1% originating from Greater Jakarta. Our outgoing international long-distance calls are routed through our two international gateways. From these gateways, international long-distance services are transferred via submarine cable based on predetermined routing plans developed in collaboration with foreign telecommunications operators. The foreign carriers receiving calls through the international gateways are responsible for terminating the calls to their recipients. Similarly, international long-distance calls received at our gateways are switched from the gateway to their destinations domestically through Telkom’s local network, our cellular network, our fixed local network or one of the other cellular operators with which we maintain interconnection arrangements. In 2010, we began offering international interconnection services to foreign operators whereby we route call traffic that both originates and terminates overseas through our international gateways.
This traffic accounted for 39.9%, 32.5% and 29.3% of our incoming paid minutes for 2011, 2012 and 2013, respectively. In 2013, our revenues from international long-distance services amounted to Rp1,020.0 billion (US$83.7 million).
42
The following table sets forth certain operating data for our international direct dialing services for the periods indicated:
| | | | | | | | | | | | | | | | | | | | | | | | |
| | | For the years ended December 31, | |
| | | 2011 | | | 2012 | | | 2013 | |
| | | Minutes | | | % change | | | Minutes | | | % change | | | Minutes | | | % change | |
| | | (in millions, except percentages) | |
Incoming paid minutes | | | 1,841.7 | | | | 9.7 | | | | 1,824.9 | | | | –0.9 | | | | 1,905.6 | | | | 4.4 | |
Outgoing paid minutes | | | 445.3 | | | | –3.8 | | | | 408.5 | | | | –8.3 | | | | 299.6 | | | | –26.7 | |
Incoming and outgoing paid minutes | | | 2,287.0 | | | | 6.8 | | | | 2,233.3 | | | | –2.3 | | | | 2,205.2 | | | | –1.3 | |
Ratio of incoming to outgoing traffic | | | 4.1 | | | | — | | | | 4.1 | | | | — | | | | 6.4 | | | | — | |
During 2011, 2012 and 2013, our international outgoing calls measured by paid minutes decreased by 3.8%, decreased by 8.3% and decreased by 26.7%, respectively. Our international incoming calls measured by paid minutes increased by 9.7% in 2011, decreased by 0.9% in 2012 and increased by 4.4% in 2013. Combined outgoing and incoming calls, also measured by paid minutes, increased by 6.8%, decreased by 2.3% and decreased by 1.3% during 2011, 2012 and 2013, respectively. We believe that increased competition from Telkom and VoIP operators, some of which are unlicensed, caused a decline in international outgoing and incoming calls traffic.
Fixed Wireless Access Services. We launched our fixed wireless access services in 2004 to complement our cellular services using CDMA 2000 1x technology. On December 12, 2006, the Government granted us a license for two channels of nationwide fixed wireless access in the 800 MHz frequency and by the end of 2007, we migrated our CDMA frequency from 1900 MHz to the new 800 MHz frequency in Greater Jakarta. In 2013, we initiated a strategy to migrate from the fixed wireless platform currently utilized on our 800 MHz spectrum allocation to a cellular platform and have submitted an application with the MOCIT to do so. However, there can be no assurance that the MOCIT will approve our application. As of December 31, 2013, our fixed wireless access service, “StarOne,” had a total subscriber base of 111,799 subscribers with 44,663 postpaid subscribers and 67,136 prepaid subscribers. In 2013, operating revenues from fixed wireless access services totaled Rp59.6 billion (US$4.9 million). Our StarOne services were available in 83 cities as of December 31, 2013.
Local and Domestic Long Distance Services. We launched local and domestic long distance service from Indosat access points such as “StarOne” and “INDOSAT phone” in October 2005. We had local and domestic long-distance coverage of 152 major cities in Indonesia as of December 31, 2013.
Customers and Marketing
The principal customers of our fixed telecommunications services are corporate clients, our own cellular, fixed telecommunications and fixed wireless access customers, and the customers of other telecommunications operators.
We employ a specialized sales force, including a sales group, which focuses on 2,600 corporate and institutional customers, including hotels, large corporate customers, government offices and embassies. We have also implemented a customer loyalty program, which provides incentives to regular users. In addition, we seek to broaden our customer base by conducting joint promotions with other international telecommunications companies to promote our services. We strive to deliver high-quality services that maximize customer satisfaction.
We have undertaken a variety of marketing initiatives to improve our services to fixed telecommunications customers. Our marketing strategy focuses on expanding our market share while retaining our customers through bundling initiatives, and establishing volume commitments for incoming traffic from foreign telecommunications operators. We have traditionally maintained a nationwide advertising campaign, using television, newspapers, magazines, websites and radio to increase brand awareness among business and retail customers. We also maintained regional sales offices in eight locations throughout Indonesia as of December 31, 2013.
43
We maintain a proprietary database of customer information, which allows us to analyze consumer preferences and usage patterns and to develop tailored marketing and products. We conduct our own market research and also engage consultants to perform broader research on customer behavior and needs.
Tariff Structure, Universal Service Obligations and Pricing
Rates.Prior to 2008, the MOCIT set tariffs for international fixed telecommunications services, which were based on the division of all destinations into six zones. On April 30, 2008, the MOCIT established a tariff formula for basic services on fixed networks and required operators to calculate prices using a cost-based formula, which are then submitted to the Government for approval. However, our international long-distance rates have not changed, and so we intend to continue applying international long-distance rates based on the previous regulations which base tariffs on six zones for call destinations.
The provision of international long-distance services between two countries is normally established between telecommunications carriers on a bilateral basis. We typically apply a market termination rate-based pricing system, pursuant to which we agree on asymmetric rates for incoming and outgoing calls. We maintained direct connections with 60 foreign telecommunications operators in 32 countries as of December 31, 2013. Our agreements with these carriers set the terms of payment by us to the foreign telecommunications operators for use of their facilities in connecting international long-distance services billed in Indonesia and by the foreign telecommunications operators to us for use of our facilities (and the local Indonesian networks) in connecting international long-distance services billed abroad. The practice among telecommunications carriers is for charges due in respect of the use of overseas networks to be recorded, collected and forwarded by the telecommunications carrier from the country in which the call is billed. Based on the rates negotiated with each foreign telecommunications operator, we make payments to carriers for outgoing traffic billed in Indonesia, and we receive payments from such carriers for inbound traffic billed outside of Indonesia. Settlements among carriers are normally made quarterly on a net-based method. Our largest correspondent carriers are those located in Malaysia, Singapore, Taiwan, the Middle East and Hong Kong as of December 31, 2013.
VoIP service providers may determine their own collection charges, and each service provider must negotiate with the applicable network provider for interconnection charges. We have entered into an agreement for Telkom to be our network provider for VoIP interconnection.
Interconnection with Domestic Networks. Although we provide international gateways for outgoing calls from and incoming calls to Indonesia, all international long-distance services, except for international transit services, must terminate on one of the domestic fixed or cellular networks. The MOCIT sets interconnection tariffs for international long-distance services which traverse the domestic fixed-line and fixed wireless access networks. We have separate interconnection agreements, which reflect these tariffs, with those operators that interconnect directly with our international gateways.
Universal Service Obligations. The Government imposes a Universal Service Obligation (“USO”) tariff, which from 2005 through 2009 was 0.75% of annual gross revenues less interconnection expenses paid to other telecommunication carriers and bad debts. In January 2009, the Government increased USO tariffs from 0.75% of annual gross revenue to 1.25% of annual gross revenue (after deducting interconnection charges and bad debts).
Customer Billing and Interconnection Charges
Domestic operators maintain control over the billing and collection process for international long-distance services, which are initiated on the domestic networks. Domestic operators retain the appropriate interconnection charges owed to them from the amounts collected and remit the balance (without interest) in Indonesian rupiah to us within not less than 25 days of collection from the customer in Indonesia. The collection cycle for most of the domestic operators is approximately 30 days. We are responsible for generating and delivering such billing
44
information to the domestic operators, through a module known as the System Online Clearing Interconnection service, every twelfth day of the month, which is then billed by the domestic operators approximately five days after receipt from us, resulting in a collection cycle of approximately 50 to 80 days. For purposes of financial reporting, we recognize revenues on a monthly basis based upon our own traffic records. We bill our domestic cellular operators in the middle of the following month and require payment by the end of the month. Accordingly, the normal collection cycle with respect to domestic cellular operators is approximately 20 to 60 days.
We remit the appropriate interconnection charge to the relevant operator for incoming calls terminating on the domestic networks. We generally remit such charges in 20 to 60 days by netting the receivables for outgoing calls. The settlements from foreign telecommunications operators are typically paid in U.S. dollars, which are deposited in Indonesia, and amounts representing interconnection payments payable by us to the domestic network operators are remitted in Indonesian rupiah.
Customer usage of fixed wireless access and domestic long-distance services is calculated starting from the beginning of the month until the end of the month. Customer billing is generated at the beginning of the following month and completed by the fifth day of that month. Billing statements are generally received by customers no later than the tenth of the month and payments are due by the twentieth of the month. For fixed wireless access service, we block the subscribers’ ability to make calls when they have not paid their balance due by the twenty-second day of the month. We block a customer’s ability to make or receive calls 40 days after the statement date if he or she still has not paid his or her balance. We permanently disconnect service and cancel accounts for customers whose bills are more than 60 days past due from the first day of the generated bill. For domestic long-distance services, by the end of the month, we block customers from making calls if they have not paid their balance. For customers who have not paid their balance due by the end of the second month, we block the customers’ ability to make or receive calls. We permanently disconnect service and cancel accounts for customers whose bills are 90 days past due from the first day of the generated bill.
Competition
We are no longer the only authorized provider of traditional IDD (i.e., non-VoIP) call services in Indonesia. The MOCIT has granted operational licenses to provide IDD services to Telkom, which includes the right to use the IDD access code “007” to enter the international long-distance market, and Bakrie Telecom. The Government may also issue new licenses for IDD services to other telecommunications operators, which will increase competition. In addition, Telkom no longer operates a monopoly for DLD services. The traditional IDD market has become even more competitive with the increased usage of VoIP technology. Our VoIP business generated 396.1 million minutes in 2011, 321.2 million minutes in 2012 and 252.6 million minutes in 2013.
In April 2008, we and Telkom agreed to open DLD access from our respective customers in Balikpapan, pursuant to which Telkom’s fixed network customers can dial “011” to access our DLD network while our local fixed network customers can dial “017” to access Telkom’s network. In addition, in 2008, Bakrie Telecom was issued a license as a new DLD operator. The opening of DLD access among competitors and the commencement of operations of new DLD operators is expected to increase competition by providing customers with more options for DLD services.
We also compete with other fixed wireless access service providers. After receiving requests from industry associations, the MOCIT issued a decree stating that the service area of the fixed wireless access networks must be limited to an area equal to one area code of the local fixed network service. Fixed wireless access service operators are therefore prohibited from extending their roaming services to other area codes, but CDMA operators still have the ability to achieve similar results by giving subscribers a new number when they move to other cities. Telkom, Bakrie Telecom and Smartfren have each been granted nationwide fixed wireless access services licenses, allowing them to offer their services nationwide, further intensifying competition. In 2014,
45
Telkom announced its intention to cease its fixed wireless business by 2015 and to migrate its fixed wireless customers to its cellular platform.
Facilities and Infrastructure
The discussion below relates to our cellular network, fixed telecommunications network (including IDD network), and other communications facilities and infrastructure, including that of our significant operating subsidiaries.
Cellular Network
The principal components of our cellular network are:
| | • | | base transceiver/Node B stations: consisting of a transmitter and receiver and serving as a bridge between mobile users in one cell and the mobile switching center via base station controllers and radio network controllers; |
| | • | | base station controllers/radio network controller: devices that connect to and control the base station within each cell site; |
| | • | | mobile switching centers: centers that control the base station controllers and the routing of telephone calls; and |
| | • | | transmission lines: lines that link the mobile switching centers, base station controllers, base stations and the PSTN. |
As of December 31, 2013, our cellular network operated using 10 MHz x 2 uplink and downlink of radio frequency bandwidth in the GSM 900 spectrum, 20 MHz x 2 uplink and downlink of frequency bandwidth in the DCS 1800 spectrum and 10 MHz x 2 uplink and downlink in the IMT-2000 spectrum. The following table sets forth selected information regarding the composition of our cellular network as of the dates indicated:
| | | | | | | | | | | | |
| | | As of December 31, | |
| | | 2011 | | | 2012 | | | 2013 | |
Base transceiver stations | | | 15,816 | | | | 17,334 | | | | 18,871 | |
Node B Stations (3G BTS) | | | 3,437 | | | | 4,596 | | | | 5,409 | |
Total BTS (including 2G and 3G) | | | 19,253 | | | | 21,930 | | | | 24,280 | |
Base station controllers | | | 302 | | | | 292 | | | | 319 | |
Mobile switching centers | | | 75 | | | | 67 | | | | 64 | |
Radio network controllers | | | 51 | | | | 59 | | | | 75 | |
Media gateways | | | 79 | | | | 79 | | | | 81 | |
We purchase our cellular telecommunications equipment primarily from European and Chinese suppliers. Our network is an integrated system employing switching equipment, cell site equipment and a transmission network of point-to-point microwave radio. Most of our cell sites and radio base stations are located in or on buildings or on vacant lots, which we own, or for which leases have been individually negotiated by us for terms typically varying from five to 20 years.
As a result of operating three legacy networks using equipment from numerous suppliers, our capital expenditures have historically been higher than would be the case if we were operating a single network using fewer suppliers. Commencing in 2010, as part of our functional management strategy, we began to rationalize our capital expenditure and procurement planning through our then newly-established investment committee. We have focused our procurement on fewer suppliers and have adopted a framework agreement approach with such suppliers, which we believe has significantly increased the efficiency of our capital expenditure program.
46
On February 7, 2012, we signed transaction documents with TBIG and its subsidiary PT Solusi Menara Indonesia (together, “Tower Bersama”) for the sale and leaseback of 2,500 towers, approximately 25% of our existing tower assets, for a total potential consideration of US$541.5 million, comprising upfront consideration of cash and newly issued TBIG shares and a maximum potential deferred payment of US$112.5 million (the “Tower Sale Transaction”). The consideration paid at closing was US$429.4 million consisting of cash of US$326.3 million and 5% share ownership in TBIG, which had a fair value of US$103.1 million as of August 2, 2012. On March 19, 2014, we divested our entire share ownership in TBIG for an aggregate gross proceed of Rp1,391.0 billion. For more information see “Item 4—Divestiture of Our Entire Shareholding in PT Tower Bersama Infrastructure Tbk (“TBIG”).”
Under the terms of the Tower Sale Transaction, we lease the towers sold for a minimum period of 10 years at fixed rates that are in line with current market rates. By transferring ownership of the towers, we believe we will enjoy significant ongoing maintenance capital expenditure and operational expenditure savings. In addition, we have concluded preferential terms with Tower Bersama in line with its anchor tenant position that imply meaningful additional value to us in the form of realized savings over the term of the lease. Cash proceeds from the transaction have been applied towards repayment of outstanding debt, on-going capital investment and general corporate purposes. The Tower Sale Transaction was completed on August 2, 2012.
The Tower Sale Transaction forms part of our strategy to monetize or increase productivity of non-core assets and we are continuing to consider various options in connection with the operation, ownership and use of our other tower assets to optimize the value of such assets.
Fixed Telecommunications Network
We have built a fixed telecommunications network consisting of two international gateways soft switch base served by satellite circuits, submarine cables and microwave transmission. We also operate four gateways which we use to deliver domestic traffic and will be migrated to the international gateways’ soft switch base. As of December 31, 2013, we offered fixed wireless access services across 83 cities in Indonesia.
International Gateways. For our international long-distance business, we operated through two gateways as of December 31, 2013, one in Jakarta and the other in Surabaya, which provided all of the connections for our services to our international long-distance network. The gateway-switching equipment was purchased from Nokia Siemens Network in 2012.
As of December 31, 2013, we had available international bandwidth capacity of 2,847 Mbps for voice and 140,000 Mbps for data transmission. All of our destinations are digitally connected. The bandwidth available to us is significantly higher than the utilized capacity to allow for anticipated growth in traffic. It is our policy to maintain average utilization at less than 80.0% of capacity to allow for increased usage during peak hours.
Each international gateway is linked to the other international gateways, which permits multiple routing options for each call and provides the system with backup capability in case of equipment failure or overcrowding at any gateway. We have placed interconnection equipment at the facilities of Telkom and certain other cellular operators to connect our international long-distance network to the domestic telecommunications network.
International transmission of voice and data between international gateways occurs across either satellite circuits or submarine cables. Satellite circuits are unaffected by distance and offer broadcast services making them flexible with regard to call destinations. Submarine cables, especially fiber optic digital cables, can offer less expensive high-quality services. However, cable costs increase with distance and destinations are fixed. Satellite circuits can be degraded by atmospheric conditions, while submarine cables can suffer damage from human or natural causes. In general, we use submarine cables with cable-to-cable backup for medium-distance links in Asia and satellite links backup for longer-distance transmission. We use microwave and fiber optic links
47
for connections between gateways and earth stations, as well as for the Batam gateway, which has microwave links to Singapore. It is our policy to maintain 100% redundancy for all of our international long-distance links (which may require routing through a third country) in an effort to provide high-quality services to our customers.
Submarine Cables. We have ownership interests in and access to capacity in submarine cables interconnecting the Asia-Pacific region, North Africa and Europe, as well as those linking the Asia-Pacific region with North America. The table below sets forth the geographic coverage and allocated capacity of our cable network as of December 31, 2013:
| | | | | | |
Submarine Cable Network | | Geographic Coverage | | Capacity | |
| | | | | (in Mbps) | |
APCN-2 | | China, Japan, Malaysia, Philippines, Singapore, Hong Kong South Korea and Taiwan | | | 310.00 | |
| | |
SEA-ME-WE 3 | | Australia, Austria, Belgium, Brunei, Canada, China, Egypt, France, Germany, Greece, Hong Kong, India, Iran, Italy, Japan, Macau, Malaysia, Myanmar, Netherlands, Oman, Pakistan, Portugal, Saudi Arabia, Qatar, Singapore, South Korea, Spain, Sri Lanka, Taiwan, Thailand, Turkey, United Arab Emirates, United States and United Kingdom | | | 109,920.12 | |
| | |
China-US | | China, Taiwan, South Korea and United States | | | 1,414.00 | |
| | |
Asia America Gateway | | Singapore, Malaysia, Thailand, Vietnam, Brunei, Hong Kong, the Philippines, and United States | | | 9,157.47 | |
| | |
Jakabare | | Java—Singapore | | | 240,000.00 | |
| | |
Jakabare | | Java—Kalimantan | | | 80,000.00 | |
| | |
Jakabare | | Kalimantan—Batam | | | 80,000.00 | |
| | |
Jakabare | | Batam—Singapore | | | 160,000.00 | |
| | |
Jakasusi | | Java—Kalimantan | | | 120,000.00 | |
| | |
Jakasusi | | Kalimantan—Sulawesi | | | 90,000.00 | |
| | |
Jasutra | | Java, Sumatera | | | 120,000.00 | |
| | |
Jakarta—Surabaya | | Java | | | 50,000.00 | |
| | |
JAVALI | | Java-Bali | | | 90,000.00 | |
| | | | | | |
Total | | | 1,150,801.59 | |
| | | | | | |
To support the operations of our gateway in Surabaya, we have operated the Jakarta-Surabaya submarine fiber optic cable link since January 1997. This link enhances network reliability and improves the quality of our services in the Surabaya region.
We, along with the Telecommunications Company of Iran (“TCI”), are among more than 80 companies that have an ownership interest in, and access to capacity in the SEA-ME-WE 3 submarine cable. Our ownership interest in the SEA-ME-WE 3 submarine cable stands at approximately 3.4% while TCI’s ownership interest stands at approximately 0.3% as of December 31, 2013. The SEA-ME-WE 3 submarine cable does not have any landing point in Iran. The connection to Iran is through the UAE-Iran submarine cable system that lands at Fujairah Cable Landing Station in the United Arab Emirates.
48
Other Communication Facilities
Our Palapa-C2 and Palapa-D satellite communication systems and fiber optic links to major commercial centers as well as remote areas of Indonesia are used in the provision of our MIDI services and for cellular backhaul.
Satellite Communication System. Communications satellites are of varying use, depending on features such as their footprint, or coverage areas, transponder power (typically stated in dBW), and transponder bandwidth. Transponder bandwidth, expressed in terms of megahertz, varies between C-band and Ku-band transponders.C-band is used worldwide as a standard for satellite communications to transmit signals with minimum atmospheric interference. They can provide very broad coverage over most of the Asian continent, making them very popular for applications such as television broadcasting and VSAT applications. Ku-band transponders operate at a frequency of approximately 11-14 gigahertz. While Ku-band frequencies are more prone to moisture and rain attenuation than C-band frequencies, they are more suitable for IP VSAT applications involving very small antenna applications. Ku-band is generally used for the same purposes as C-band, as well as for satellite news-gathering (truck-mounted antennas) and some VSAT applications. Ku-band is especially prevalent in areas with dense ground-based microwave systems. To compensate for loss of signal strength caused by moisture and rain attenuation, Ku-band transponders are generally of higher-power than C-band transponders and their footprints are smaller.
On August 31, 2009, we launched the Palapa-D satellite, to replace Palapa-C2 at orbital slot 113E, which significantly increased our transponder capacity and provided wider satellite coverage. The increased transponder capacity our Palapa-D satellite provided allowed us to meet both our own satellite transponder requirements as well as those of customers who lease transponder capacity from us. As of December 31, 2013, approximately 86.16% of Palapa-D’s standard C-band transponder capacity, 22.30% of its Ext. C transponder capacity and 99.37% of its Ku-Band transponder capacity were being leased to third parties. As of December 31, 2013, we were using 11.60% of Palapa-D’s Standard C-Band transponder and 60.53% of Palapa-D’s Extended C-Band capacity and 0.51% of its Ku-Band transponder capacity to meet our own bandwidth requirements and the remaining 2.25% Standard C-Band transponder capacity, 17.17% Extended C-Band capacity and 0.12%Ku-Band transponder capacity was available for lease.
After a successful traffic transfer from Palapa-C2 to Palapa-D in early November 2009, Palapa-C2 moved to the orbital slot at 150.5E.L. and will operate in inclined orbit carrying our cellular backhaul until approximately August 2015. On March 26, 2014, the MOCIT declared that it will not extend license to utilize the 150.5E.L. satellite orbital slot and that such utilization license will expire as of September 1, 2015. As of December 31, 2013, we were using 16.44% of our Palapa-C2 Standard C-Band transponder capacity to meet our own bandwidth requirements, and the remaining 83.56% of our capacity was available for lease.
The Palapa-D satellite has eleven 36-megahertz extended C-band transponders, twenty-four 36-megahertz standard C-band transponders, and five 36-megahertz Ku-band transponders wholly owned by us. The maximum power on each of the C-band and Ku-band transponders is 43 dBW and 53 dBW, respectively. The Palapa-D satellite provides C-band coverage to substantially all of Asia with a footprint stretching from the Arabian Peninsula to Japan and China to New Zealand, including central and eastern parts of Australia. Its dBW levels range from a beam edge of 32 dBW to a beam center of 43 dBW. With this power, the Palapa-D satellite has the capability to provide uplink and downlink services from any location within the satellite footprint. The fiveKu-band transponders provide coverage over Indonesia and some of ASEAN Countries with peak transponder power of 53 dBW.
The Palapa-C2 satellite has six 36-megahertz extended C-band transponders owned by Pasifik Satelit Nusantara, and twenty-four 36-megahertz Standard C-band transponders and four 72-megahertz Ku-band transponders owned by us. The maximum power on each of the C-band transponders is 40 dBW. Since the new
49
location of Palapa-C2 is close to another satellite with the same Ku-band frequency plan, we, consistent with the rules and regulations of the International Telecommunication Union and our license, do not operate Ku-band transponders to avoid harmful interference from the other satellite. The Palapa-C2 satellite provides C-band coverage to substantially all of Asia, with a footprint stretching from Central Asia to Japan and southern China to New Zealand, including parts of Australia. Its dBW levels range from a beam edge of 32 dBW to a beam center of 40 dBW. With this power, the Palapa-C2 satellite has the capacity to provide uplink and downlink services from any location within the satellite footprint.
Fiber Optic and Microwave Terrestrial Links. Our optical fiber backbone based on DWDM technology connects all provincial cities in Sumatera, Java, Kalimantan and part of Sulawesi. The optical fiber backbone conveys cellular traffic within and between the cities at 40-60 gigabits per second and facilitates our progressive growth of Internet broadband through 3.5 HSDPA and fixed broadband wireless access. Due to capacity and technology considerations, the existing microwave terrestrial system has been shifted to cover remote spur route areas. As of December 31, 2013, we had fiber optic and microwave terrestrial links to most major cities in Sumatra, Java, Kalimantan and Sulawesi. These links are primarily used to deliver Internet and other MIDI services to our corporate customers.
In December 2010, we entered into a purchase order with Alcatel Lucent Submarine Networks to upgrade the capacity of existing JAKASUSI submarine cable system, which required us to spend approximately US$2.6 million in capital expenditure. The upgraded system increased inter-island capacity from/to Banyu Urip—Takesung (120 Gbps) and Takesung—Aeng Batu Batu (90 Gbps). The upgraded system was ready for service in July 2011.
In December 2010, we entered into a purchase order with IFactor Sdn Bhd, Malaysia to construct the JAVALI submarine cable system, a new submarine cable system which links East Java and Bali and provide high capacity bandwidth, and which involved a total project cost of US$10.8 million. The JAVALI submarine cable system is wholly-owned by us and is designed with 24 optical fiber cores (unrepeated system). The system is initially equipped with 50 gigabits per second capacity with its ultimate capacity at 160 gigabits per second capacity per fiber pairs. The construction of this new cable system was completed in December 2011. As of December 31, 2013, the JAVALI submarine cable system was equipped with a capacity of 100 Gbps capacity with an ultimate capacity at 960 Gbps capacity per fiber pairs.
IP/MPLS Backbone and Metro Ethernet Network. As of December 31, 2013, we had completed our Metro Ethernet Network deployment project in more than 1,061 nodes in Indonesia with fiber optic connectivity. Through this network, we provide virtual leased lines offering point-to-point Ethernet access, virtual private LAN service offering multipoint-to-multipoint Ethernet access and virtual private routed networks offering locally linked IP VPN and Internet. We also use our Metro Ethernet Network for backhauling our 2G and 3G cellular traffic. As of December 31, 2013, dual redundant routers for IP-MPLS backbone were deployed in 41 cities and were connected through our fiber optic backbone. A Metro Ethernet network has also been deployed in 27 Indonesian provinces to provide broadband access to the corporate market in high-rise buildings and cellular backhaul for 3.5 HSDPA service. Internet access, broadcasting service and data center connectivity are among the services used by our customers.
As the technology moves towards “all IP” and the demand of IP-based services is increasing due to its advantages over legacy networks, we aim to deploy a future network to allow IP-based services to be widely available in the region. In 2008, we completed construction of a disaster recovery center in Jatiluhur for corporate customers to allow them to have a data back-up center to secure and protect their business information and in 2011 we upgraded this disaster recovery center to include “meet-me-room” facilities. Also, in 2011 we completed construction of a data center in Jakarta to provide the basic infrastructure for our cloud computing service.
50
Organizational Structure
The following chart illustrates our simplified corporate structure as of December 31, 2013, including our direct and indirect equity ownership in major subsidiaries, together with the jurisdiction of incorporation or organization of each entity. A complete list of our significant subsidiaries and investments in associated companies, and our ownership percentage of each entity, as of December 31, 2013 is contained in Note 1b to our consolidated financial statements included elsewhere in this annual report.
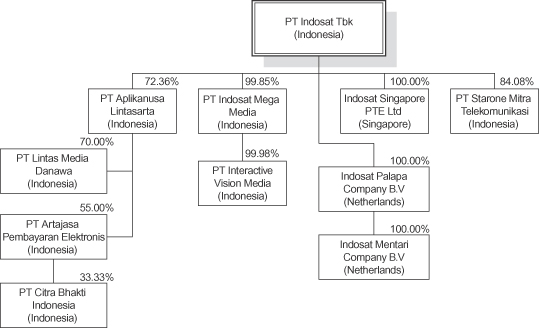
PT Aplikanusa Lintasarta (“Lintasarta”) was established in 1988. Pursuant to its articles of association, Lintasarta engages in the business of providing system data telecommunication and information technology services and network application services, which include providing physical infrastructure and software application and consultation services in data communication and information system for banking, finance and other industries.
IM2 was established in 1996 to engage in the business of providing Internet and television services.
Indosat Singapore Pte Ltd was established on December 21, 2005 to engage in telecommunication data services.
Indosat Palapa Company B.V. and Indosat Mentari Company B.V. were incorporated in Amsterdam, the Netherlands on April 28, 2010 to engage in treasury activities, to lend and borrow money, whether in the form of securities or otherwise, to finance enterprises and companies and to grant security in respect of their respective obligations or those of their group companies and third parties.
PT Starone Mitra Telekomunikasi was established in 2006 to provide telecommunication services and develop telecommunication and media services infrastructure. On July 11, 2013, we made an additional capital injection into PT Starone Mitra Telekomunikasi amounting to Rp16.5 billion, resulting in the increase of our ownership therein from 72.5% into 84.1%.
PT Artajasa Pembayaran Elektronis was established in 2000 to provide electronic transaction management and payment gateway services to corporate clients, particularly from the banking sector, information technology consultation services and telecommunication services.
51
PT Lintas Media Danawa was established on July 28, 2008 to provide information and communication services, such as data center services, e-learning and distant learning for public education services, and content services based on Internet Protocol (e.g. internet gaming and internet payment gateway).
PT Interactive Vision Media was established on April 21, 2009 to engage in the Pay TV business. As of April 24, 2014, PT Interactive Vision Media had not commenced commercial operations.
PT Citra Bhakti Indonesia is a subsidiary of PT Artajasa Pembayaran Elektronis and was established on May 14, 2012 to engage in the business of issuing formal certification to all chip technology-based payment products to support the national implementation of standard chips on ATM and debit cards.
Insurance
As of December 31, 2013, we carried insurance on our property and equipment (except submarine cables and land rights). We maintain in-orbit insurance on the Palapa-D satellite on terms and conditions consistent with industry practice. As of December 31, 2013, we had an insurance policy coverage with a total coverage limit of US$102.5 million for total loss of our Palapa-D satellite.
Intellectual Property
We have registered trademarks and copyrights for our corporate name, logo and certain services with the Ministry of Law and Human Rights of Indonesia (formerly the Ministry of Justice and Human Rights of Indonesia). We believe that our trademarks are important to our success. We have never had to defend any of our trademarks, but we would vigorously do so if necessary.
Properties
Except for ownership rights granted to individuals in Indonesia, the title to land rests with the Indonesian State under the Basic Agrarian Law No. 5 of 1960. Land use is accomplished through land rights whereby the holder of the land right enjoys the full use of the land for a stated period of time, subject to renewal and extensions. In most instances, the land rights are freely tradable and may be pledged as security under loan agreements. Our most important properties are located in Jakarta (approximately 12,050 sq.m. used for international gateways and head office), Ancol (approximately 12,679 sq.m. used as a cable station and switching center), Tanjung Pakis, Karawang (approximately 1,850 sq.m. used as a cable station), Daan Mogot (approximately 134,925 sq.m. used as a satellite earth station complex), Jatiluhur (approximately 135,800 sq.m. used as a satellite earth station complex), Medan (approximately 9,780 sq.m. used for international gateways), Pantai Cermin (approximately 48,567 sq.m. used as an earth station and a cable station), Batam Sekupang (approximately 19,989 sq.m. used for international gateways and an earth station), Tanjung Bemban (approximately 3,500 sq.m. used as a cable station), Surabaya (approximately 11,359sq.m. used as a regional office) and Banyu Urip-Gresik (approximately 130,234 sq.m. used as an earth station, for international gateways and as a cable station), Takisung—Banjarmasin (approximately 1,000 sq.m. used as a cable station), Aeng Batu Batu-Makasar (approximately 2,000 sq.m. used as a cable station) and Sei Kakap Pontianak (approximately 5,394 sq.m. used as a cable station). Except for our property in Daan Mogot, which we lease from Telkom, we hold registered land rights to some of our properties, the initial period of which are for approximately 30 years. We expect that our land rights will be renewed at nominal costs for the foreseeable future. None of our properties are mortgaged or otherwise encumbered.
52
Principal Registered Offices
| | |
Headquarters: | | Jl. Medan Merdeka Barat No. 21 Jakarta 10110, Indonesia Tel: (62-21) 3000 3001 Fax: (62-21) 3000 3754, 3000 3757 |
| |
Jakarta Area Office | | Jl. Medan Merdeka Selatan No. 17 Jakarta 10110, Indonesia Tel: (62-21) 3000 7001 Fax: (62-21) 3000 5702 |
| |
Bogor Tangerang Bekasi Area Office | | Jl. Veteran No. 40 Bekasi Selatan 17141, Indonesia Tel: (62-21) 3017 7075, 3017 7076 Fax: (62-21) 3000 0811 |
| |
West Java Area Office | | Jl. Asia Afrika No. 141-147 Bandung 40112, Indonesia Tel: (62-22) 3000 0900 Fax: (62-22) 3000 5702 |
| |
Northern Sumatera Area Office | | Jl. Perintis Kemerdekaan No. 39 Medan 20236, Indonesia Tel: (62-61) 4567 001 Fax: (62-61) 4531 031 |
| |
Southern Sumatera Area Office | | J1. Angkatan 45 No. 222 Palembang 30137, Indonesia Tel: (62-711) 605 9999 Fax: (62-711) 605 9966, 605 9977 |
| |
Central Java Area Office | | Jl. Pandanaran No. 131 Semarang 50243, Indonesia Tel: (62-24) 3300 2000 Fax: (62-24) 3300 1001 |
| |
East Java Area Office | | Jl. Kayoon No. 72 Surabaya 60271, Indonesia Tel: (62-31) 6000 6001 Fax: (62-31) 5456 001, 5464 392 |
| |
Bali Nusa Tenggara Area Office | | Jl. Raya By Pass Ngurah Rai No. 88 Kuta 80361, Bali, Indonesia Tel: (62-361) 300 5000 Fax: (62-361) 300 5005 |
| |
Kalimantan Area Office | | Jl. MT Haryono No. 69 Balikpapan 76114, Indonesia Tel: (62-542) 741 001, 3030 001 Fax: (62-542) 7514 001, 7206 750 |
| |
Sulampapua Area Office | | Jl. Slamet Riyadi No. 4 Makassar 90111, Indonesia Tel: (62-411) 326 808 Fax: (62-411) 326 828 |
53
Indonesian Telecommunications Industry
Background
Since 1961, telecommunications services in Indonesia have been provided by a succession of state-owned companies. As in other developing economies, the expansion and modernization of telecommunications infrastructure is instrumental to Indonesia’s general economic development. In addition, Indonesia’s large population and economic growth have led to increased demand for telecommunications services.
Indonesia had an estimated population of approximately 247.95 million people as of 2013, ranking it the fourth most-populated country in the world based on International Monetary Fund (“IMF”) estimates. Indonesia’s gross domestic product, or GDP, has grown significantly from US$538.8 billion in 2009 to US$867.5 billion in 2013 in current U.S. dollars according to the IMF, which represents a growth rate of 12.6%. This growth rate compares favorably against the approximately 11.0% and approximately 11.5% GDP growth experienced by Thailand and Malaysia, respectively, estimated by the IMF, during the same period.
The Government, through the MOCIT, has extensive regulatory authority and supervisory control over the telecommunications sector. While the Government had historically maintained a monopoly over telecommunications services in Indonesia, recent reforms, the majority of which came into effect on September 8, 2000, have attempted to create a regulatory framework to promote competition and accelerate infrastructure investment in telecommunications facilities.
In Indonesia, fixed-line services are mostly provided by Telkom, a majority state-owned company, which owns and operates the Indonesia’s primary PSTN and fixed wireless access points. Before the implementation of the new interconnection regime, telecommunications operators interconnected with Telkom’s network to access all fixed-line and cellular users. Telkom’s local fixed-line monopoly ceased on August 1, 2002, and we have since commenced our build-out of a separate fixed-line network. According to the new interconnection regime, telecommunications operators may enter into bilateral agreements which enable them to interconnect directly with other telecommunications operators.
Although cellular penetration is relatively low compared to its regional peers, based on GSM Association estimates, Indonesia’s cellular penetration rates have increased from approximately 88.91% in 2010 to approximately 127.00% in 2013, at a compound annual growth rate of 12.6%. Indonesia’s GDP growth profile and relatively low penetration rates suggest the potential for increased cellular customer demand in Indonesia. The table below summarizes certain information regarding Indonesian and regional cellular penetration in 2013:
| | | | | | | | | | | | |
| | | For the year ended December 31, 2013 | |
| | Population(1) | | | Cellular
penetration(2)(3) | | | GDP
per capita(1) | |
| | (millions) | | | | | | (US$) | |
Hong Kong | | | 7.24 | | | | 189.1 | % | | | 38,605 | |
Singapore | | | 5.43 | | | | 154.7 | % | | | 52,918 | |
South Korea | | | 50.24 | | | | 111.5 | % | | | 23,838 | |
Malaysia | | | 29.96 | | | | 141.2 | % | | | 10,429 | |
Thailand | | | 68.20 | | | | 135.9 | % | | | 5,879 | |
Philippines | | | 97.48 | | | | 112.1 | % | | | 2,792 | |
China | | | 1,360.76 | | | | 88.2 | % | | | 6,569 | |
India | | | 1,243.34 | | | | 71.3 | % | | | 1,414 | |
Indonesia | | | 247.95 | | | | 127.0 | % | | | 3,499 | |
| (2) | GSM Association 2013. |
| (3) | Cellular penetration is the number of cellular subscribers as a percentage of the population. |
54
Cellular Services Market
The telecommunications industry in Indonesia has experienced significant growth in cellular telecommunications services in recent years. Based on GSM Association estimates, the total number of cellular subscribers in Indonesia increased from approximately 211.29 million as of December 31, 2010 to approximately 314.90 million as of December 31, 2013, representing an increase in cellular penetration from approximately 88.91% to approximately 127.00%, respectively.
The following table contains information relating to the cellular telecommunications industry in Indonesia as of and for the periods indicated:
| | | | | | | | | | | | | | | | | | | | |
| | | As of December 31, | |
| | 2010 | | | 2011 | | | 2012 | | | 2013 | | | Compound
Annual Growth
Rate 2010 – 2013 | |
| | | (in millions, except percentages) | |
Indonesian population(1) | | | 237.64 | | | | 241.03 | | | | 244.47 | | | | 247.95 | | | | 1.43 | % |
Cellular subscribers(2) | | | 211.29 | | | | 236.80 | | | | 262.31 | | | | 314.90 | | | | 14.23 | % |
Cellular penetration(2)(3) | | | 88.91 | % | | | 98.24 | % | | | 107.30 | % | | | 127.00 | % | | | 12.62 | % |
| (2) | GSM Association (2013). |
| (3) | Cellular penetration is the number of cellular subscribers as a percentage of the population. |
The wireless market in Indonesia is currently dominated by three major GSM operators: Telkomsel, XL and us. As of December 31, 2013, these nationwide GSM operators collectively held almost 80% share of the Indonesian wireless market based upon our estimates and the public statements of such companies. As of the same date, Telkomsel was the largest national licensed cellular services provider in Indonesia, with approximately 131.5 million cellular subscribers (including mobile broadband) and more than 52.3% GSM market share. XL, the second largest provider, had approximately 60.5 million cellular subscribers and an approximately 24.1% GSM market share as of the same date. We were the third largest cellular operator with approximately 59.6 million cellular subscribers and approximately 23.7% GSM market share as of the same date. Starting in 2002, the Government issued new cellular licenses for using CDMA technology to Mobile-8 and fixed wireless access services licenses using CDMA technology to Telkom, Indosat and Bakrie Telecom. Fixed wireless access service is dominated by Telkom under the brand Flexi with 6.7 million subscribers, as of December 31, 2013, although, in 2014, Telkom announced its intention to cease its fixed wireless business by 2015. There are other smaller players in Indonesian wireless market, such as Bakrie Telecom, HCPT, Smartfren and STI. Our fixed wireless access had 0.11 million subscribers under the brand StarOne as of December 31, 2013. In part, wireless subscriber growth in Indonesia has been driven by the “calling party pays” system, the launch of prepaid service, as well as the introduction of SMS. The calling party pays system requires the originators of telephone calls to pay for calls. Based on international experience, countries that implement a calling party pays system typically experience higher wireless penetration rates because wireless subscribers are more likely to give out their telephone numbers and keep their handsets switched on.
Since its introduction in 1998, prepaid service has been popular in Indonesia, as in other Asian countries, because it permits customers to register for wireless service without undergoing a credit review. Prepaid service also gives customers more control over monthly expenditures. SMS has proven to be popular in Indonesia, particularly on the prepaid platform, as it provides a convenient and cost-efficient alternative to voice and e-mail communications. Competition in the Indonesian wireless services industry is based primarily on service quality, pricing, availability of data services and value-added features such as voice mail and text messaging.
International Long-Distance Market
International long-distance providers in Indonesia generate revenues from both inbound and outbound international long-distance traffic. The three international long-distance service providers are Telkom, which
55
offers its “007” service, Bakrie Telecom with its “009” IDD access code and us with our “001” and “008” access codes. Outgoing tariffs are based on rates set by the MOCIT while incoming tariffs are settled at the applicable accounting rates. Outgoing traffic is generated by fixed-line and mobile subscribers and delivered to the three international service providers directly through international gateways or indirectly through Telkom’s PSTN. Incoming international traffic is received at international gateways and either routed directly to its intended destination from the gateways or indirectly through Telkom’s PSTN network through which it is ultimately switched to its intended destination.
In Indonesia, as in many emerging market countries, inbound communications traffic has exceeded outbound traffic as more developed countries generate a disproportionate amount of international long-distance traffic. We utilize a market termination rate-based pricing system with several of our largest foreign telecommunications counterparts, pursuant to which we agreed on asymmetric rates for incoming and outgoing calls.
Competition from VoIP providers offering services, including budget calls such as “01017” provided by Telkom and “FlatCall 01016” provided by us, and prepaid calling cards has adversely affected and is expected to continue to adversely impact revenues from traditional international long-distance calling services. Moreover, the rise of VoIP providers on applications basis such as Skype™, Google Voice™ and Yahoo Messenger™, which offer free long distance communication services is adversely affecting revenues of the international gateway operators.
As the data communications infrastructure expands in Indonesia, demand for VoIP services may increase. VoIP uses data communications connections to transfer voice traffic over the Internet, which usually provides substantial cost savings to subscribers.
Although the Government has implemented a licensing system to limit the number of VoIP operators in Indonesia, the Government does not presently control the rates charged to end users of VoIP services. However, the Government has indicated that it intends to regulate such rates in the future, and it is expected that such regulations would limit VoIP tariffs to amounts that represent a maximum discount of approximately 40.0% from the then-current PSTN tariffs.
Data Communications Market
Historically, data services in Indonesia primarily consisted of narrow bandwidth leased line services, x.25 service, digital data network service and integrated service digital network service. Digital data network services are digital leased line services for data transmission. Integrated service digital network is a protocol which offers high capacity dial-in access for public networks. This protocol allows simultaneous handling of digitized voice and data traffic on the same digital links via integrated switches across the public network. x.25 is an open standard packet switching protocol that allows low- to medium-speed terminals to have either dial-in or permanent access to a network from a user’s premises and operate on a network. Charges for these services have been declining in recent years.
The rise of the Internet and the wider adoption of multimedia applications are expected to increase demand for sophisticated broadband data services. Operators in Indonesia are deploying advanced broadband networks to provide high-end data services such as frame relay, asynchronous transfer mode and Internet protocol service. In particular, virtual private network services, utilizing ATM, Internet protocol technologies, deploying Wi-Fi technology to reduce cellular network congestion may capture a larger portion of the market share as they provide a reliable and cost-effective alternative to private networks that rely on dedicated leased lines.
The MOCIT reopened the licensing for interconnection of internet service provision or the network access point after previously temporarily closing licensing since 2010. The MOCIT viewed that it was necessary to
56
reopen this licensing to fulfill the high needs of the ISP for bandwidth. As the number of data communication service providers are increasing, the pricing offered to the market becomes more competitive.
Satellite Services Market
In recent years, competition in the Asia-Pacific satellite market has been intense. Companies in this business compete primarily on coverage power, product offerings and price. On September 6, 2005 through MOCIT Regulation No. 13/P/M.KOMINFO/8/2005 as amended by MOCIT Regulation No. 37/P/M.KOMINFO/12/2006, the Government issued regulations requiring all telecommunications operators using satellites in connection with the provision of telecommunications services to possess both earth station and space station operating licenses. These operating licenses will be granted only to telecommunications operators with a landing right and on the condition that the radio frequency spectrum used does not cause harmful interference to existing operators. Foreign satellites are allowed to operate in Indonesia if Indonesian telecommunications operators have reciprocal operating rights in such satellite’s country of origin.
Industry Trends
We believe that the trends driving the telecommunications industry in Indonesia include:
Wireless Services
| | • | | Continued growth in wireless telecommunications. We expect that the wireless telecommunications industry and demand for wireless telecommunications services will continue to grow at a steady rate of around 6% to 7% as Indonesia develops and modernizes. A significant amount of this growth will still come from the “traditional core” markets. |
| | • | | In addition to the growth in core markets, there are sizable emerging segments of strong growth, primarily in consumer broadband and mobile towers. We believe that the competition for 3G services will be increasingly stringent as telecommunications operators began to move its network to the location of highly populated area. As of April 24, 2014, there were four telecom operators that held licenses for 3G services, namely: Telkomsel, Hutchison, XL and us. We started to provide wireless broadband services using 3.5G platform in 2009, and as of December 31, 2013, provided 3.5G services in 208 cities across Indonesia. |
| | • | | Data service will be the source of growth in the telecommunications industry with higher contributions to total revenue. This is in line with the trend of the increase in people’s need for the data supported by cellular phones with internet capabilities and is also aligned with the plan of operators to focus on providing the infrastructure for data services. |
| | • | | Significant growth in wireless penetration rates in regions outside Java. The relatively low wireless penetration rates in regions outside Java offer growth potential for wireless services providers in Indonesia as the population residing outside Java becomes more affluent. |
| | • | | Growing use of value-added services. The growth in usage for value-added services such as OTT, IP Messaging, Cloud service are expected to increase in coming years, thereby helping to stabilize the decrease in usage rates and ARPU for voice services. |
| | • | | Today, there are multiple mobile operators and many companies are aggressively pushing for subscribers and traffic to quickly gain scale and earn market share. We expect consolidation to continue, especially beyond the three large players (Telkomsel, XL and us). One of the major threats to the market is further price deterioration. Service offering and innovation will become the major driver in the competition. |
57
International Long-Distance Services
| | • | | Increased competition in international long-distance services. We expect further governmental deregulation and service quality improvements for VoIP services to increase competition for international long-distance services. |
| | • | | Moderate growth in call volumes. We believe continued domestic economic growth and increase in cellular voice usage will stimulate incremental volume growth for international long-distance services. In addition, the growth of VoIP services is also expected to increase demand for international long-distance services. |
MIDI Services
| | • | | Increasing demand for advanced data communication services. We believe increasing Internet usage and the broadening market for multimedia applications will boost demand for sophisticated data communication services. |
| | • | | Intensified competition in the ISP and network access point markets. As a result of market liberalization and the continued issuance of new licenses, we anticipate competition in the ISP and NAP market will increase. We believe competition will be based primarily on price, quality of service and network coverage. |
| | • | | Increasing demand for broadband services for both fixed and wireless. We believe the expected increase in customer preference and demand for high-speed Internet access will stimulate growth of domestic broadband service. |
Regulation of the Indonesian Telecommunications Industry
The Government, through the MOCIT, exercises both policy making and regulatory authority and is responsible for the implementation of policies that govern the telecommunications industry in Indonesia. The legal framework for the telecommunications industry is based on specific laws as well as government, ministerial and directorate general regulations that are promulgated from time to time. Prior to March 1998, the then Ministry of Tourism, Post and Telecommunications regulated the telecommunications industry in Indonesia. Following the 1999 general elections and a change of government in 2001, the Ministry of Communication assumed responsibility for regulating the telecommunications industry. In February 2005, the authority to regulate the telecommunications industry was transferred from the Ministry of Communication to the MOCIT.
Through the MOCIT, the Government regulates telecommunications network operations and the provision of telecommunications services. In addition, the MOCIT regulates the radio frequency spectrum allocation for all telecommunications operators, each of whom must be licensed by the Directorate General of Post and Informatics Resources and Facilities in order to utilize the radio frequency spectrum. In addition to radio frequency spectrum fees, the Government requires all telecommunications operators to pay a concession license fee equal to 0.5% of gross revenues, less interconnection expenses and provisions for bad debt, for each fiscal year, payable in equal quarterly installments.
The Government’s telecommunications reform policy is set out in its “Blueprint of the Indonesian Government’s Policy on Telecommunications” dated September 17, 1999. The policies, as stated in the blueprint, are to:
| | • | | increase the telecommunications sector’s performance; |
| | • | | liberalize the telecommunications sector with a competitive structure by removing monopolistic controls; |
| | • | | increase transparency and predictability of the regulatory framework; |
58
| | • | | create opportunities for national telecommunications operators to form strategic alliances with foreign partners; and |
| | • | | create business opportunities for small-and medium-size enterprises and facilitate new job opportunities. |
The recent regulatory reforms of the Indonesian telecommunications sector have their foundation in the Telecommunications Law.
The Negative List
Presidential Regulation 36/2010 sets out the industries and business fields in which foreign investment is prohibited, restricted or subject to the fulfillment of certain conditions as stipulated by the applicable Governmental authorities (the “Negative List”). The telecommunication industry is one of the industries set out in the Negative List, and foreign investment in the Indonesian telecommunication industry is accordingly subject to applicable restrictions and conditions. The Negative List is implemented by the BKPM. Restrictions applicable to the telecommunication industry are dependent upon the type of telecommunication business undertaken. Different limitation thresholds are applicable depending upon whether the business pertains to telecommunication networks or services. The limitation on foreign holdings in companies engaging in the telecommunication network business ranges from 49.0% to 65.0%, and the limitation on foreign shareholdings in Indonesian companies engaged in the provision of multimedia services (including data communication such as broadband wireless services), from 49.0% to 95.0%. Pursuant to Article 8 of Presidential Regulation 36/2010, the restrictions set forth therein shall not apply to investments that have been approved prior to the effectiveness of Presidential Regulation 36/2010 pursuant to investment approval issued by the BKPM unless such restrictions are more favorable to the investments. Presidential Regulation 36/2010 does not change the limitation of foreign shareholding in our business.
The Telecommunications Law
The Telecommunications Law became effective on September 8, 2000 and provides key guidelines for industry reforms, including industry liberalization, facilitation of new entrants and enhanced competition. The Government implements such guidelines through Government regulations, ministerial decrees or regulations and other directives by Government bodies. The Telecommunications Law grants the Government, through the Ministry of Communication, the power to make policies, and to regulate, supervise and control the telecommunications industry. Until 2005, the Ministry of Communication, the former regulatory body of the telecommunications industry, had authority over the telecommunications sector in Indonesia and could issue regulations, policies and licenses, and formulate tariffs.
Government Regulation No. 52/2000 on Telecommunications Operations (the “Telecommunications Operations Regulation”) and Government Regulation No. 53/2000 on Radio Frequency Spectrum and Satellite Orbits, were the initial implementing regulations of the Telecommunications Law. The Ministry of Communication also promulgated various decrees, including (i) Ministry of Communication Decree No. KM 20 of 2001, which was revoked by MOCIT Decree No. 01/PER/M.KOMINFO/01/2010 on Telecommunications Network Operation (the “Telecommunications Network Regulation”), (ii) Ministry of Communication Decree No. KM 21 of 2001, which was amended by MOCIT Decree No. 31/PER/M.KOMINFO/09/2008 on Telecommunications Services Operation (the “Telecommunications Services Regulation”), and (iii) Ministry of Communication Decree No. KM 31 TAHUN 2003, which was revoked by MOCIT Decree No. 36/PER/M.KOMINFO/2008 and most recently amended by MOCIT Decree No. 01/PER/M.KOMINFO/02/2011 on the Establishment of an Indonesian Telecommunications Regulatory Authority (the “Telecommunications Regulatory Authority Regulation”).
Under MOCIT Regulation No. 17/PER/M.KOMINFO/11/2010 on Organization and Administration of the Ministry of Communications and Information, the duties and responsibilities of the DGPT were divided and
59
assigned to the Director General of Posts and Informatics Management (“DGPIM”) and the Directorate General of Post and Informatics Resources and Facilities.
On July 11, 2003, the Ministry of Communication promulgated the Telecommunications Regulatory Authority Regulation, pursuant to which it delegated its authority to regulate, supervise and control the Indonesian telecommunications sector to the ITRA, while maintaining the authority to formulate policies for the industry. Pursuant to MOCIT Decree No. 01/PER/M.KOMINFO/02/2011 on the Establishment of an Indonesian Telecommunications Regulatory Authority, the ITRA consists of the Telecommunications Regulatory Committee and the Directorate General of Post and Telecommunication. The Telecommunications Regulatory Committee consists of nine members, six of which are from the community and three of which are from the Government. The position of chairman in the Telecommunications Regulatory Committee is held by the Director General of Telecommunication. Members of the Telecommunications Regulatory Committee, who hold government posts, consist of the Director General of Telecommunication, the Director General of Resources and Equipment of Post and Information and a Government representative as appointed by the MOCIT.
All members of the Telecommunications Regulatory Committee must:
| | (i) | be Indonesian citizens; |
| | (ii) | not be older than 65 years old when he/she registers to be a member of the Telecommunications Regulatory Committee; |
| | (iii) | be physically and mentally healthy; |
| | (iv) | be an expert or a professional in telecommunications/information technology, law, economics or public policy related to telecommunications; |
| | (v) | have experiences in his/her area of expertise; |
| | (vi) | not have direct share ownership and/or have direct business relations with the telecommunication network providers and/or telecommunication services providers; |
| | (vii) | not serve as a director, commissioner or employee of any of the telecommunications operators; |
| | (viii) | not be a member of any political parties when he/she is determined as member of the Telecommunications Regulatory Committee; and |
| | (ix) | be willing not to become a member of any political parties during his/her tenure of service as member of the Telecommunications Regulatory Committee. |
As part of its regulatory function, the ITRA shall prepare and determine regulations regarding telecommunications network operation and telecommunications services provision, which are (i) licensing for telecommunications networks operation and telecommunication services provision, (ii) standard operating performance, (iii) service quality standards, (iv) interconnection expenses/charges, and (v) telecommunications equipment standards. The ITRA is authorized to monitor: (i) the implementation of operation performance; (ii) competition among services operators; and (iii) compliance with set industry standards. As part of its supervision function, the ITRA shall supervise the operating performance, business competition and utilization of telecommunications tools and devices in telecommunications network operation and telecommunications services provision. The controlling function of the ITRA consists of (i) settlement of any dispute resolution among network and service operators; (ii) the control of the use of telecommunications equipment and (iii) the implementation of service quality standards.
Classification of Telecommunications Providers
The Telecommunications Law classifies telecommunications providers into (i) network operators, (ii) services providers and (iii) special providers. Network operators are further classified as (i) fixed
60
telecommunications network operators and (ii) mobile telecommunications network operators. Under the Telecommunications Law, licenses are required for each category of telecommunications operators. A telecommunications network operator is licensed to own and/or operate a telecommunications network. By contrast, a telecommunications service provider license allows a service provider to provide services, but does not require such provider to own a network. Special telecommunications licenses are required for providers of private telecommunications services or for purposes relating to broadcasting and national security interests. The Telecommunications Network Regulation provides that telecommunications network operating licenses must be issued by the MOCIT. The Telecommunications Services Regulation differentiates the basic telephony service operating license to be issued by the MOCIT from the other value-added telephony and some multimedia service operating licenses issued by the DGPIM.
Termination of Exclusivity Rights
In 1995, Telkom was granted a monopoly to provide local fixed-line telecommunications services until December 31, 2010, and DLD services until December 31, 2005. We and Satelindo (which subsequently merged with us) were granted a duopoly for provision of basic international telecommunications services until 2004.
As a consequence of the Telecommunications Law and Ministry of Communication Decree No. KM 21 of 2001, the Government terminated the exclusive rights of Telkom and the duopoly rights of our Company and Satelindo. The Government instead adopted a duopoly policy with Telkom and us competing as full network and service providers.
The market for provision of IDD services was liberalized in August 2003 with the termination of Indosat’s and Satelindo’s exclusive rights. We began operating fixed line services in 2002 and fixed wireless access and DLD services in 2003 after receiving our DLD services license. Telkom subsequently received an IDD services license and began offering IDD services under the international access code “007” in 2004 in direct competition with us.
In an attempt to liberalize DLD services, the Government issued regulations requiring each provider of DLD services to implement a three-digit access code to be dialed by customers making DLD calls. On April 1, 2005, the MOCIT announced that three-digit access codes for DLD calls will be implemented gradually within five years of such date and that it would assign us the “011” DLD access code for five major cities, including Jakarta, and allow us to progressively expand to all other area codes within five years. Telkom was assigned “017” as its DLD access code. On December 3, 2007, MOCIT promulgated regulation No. 43/P/M.KOMINFO/12/2007, amended subsequently, which delayed the implementation of the DLD access code until April 3, 2008 and also set forth a schedule on implementing “01X” long distance access. In January 2007, the Government implemented new interconnection regulations and a five-digit access code system for VoIP services. In April 2008, these access codes were implemented in Balikpapan. Balikpapan residents are able to choose from options “0,” “01016” or “01017” to connect their long distance calls. Whether the DLD access code will be implemented in other cities will be based on a study by the ITRA of our Company and Telkom’s fixed phone service customers.
Tariff for Fixed and Cellular Services
The MOCIT is responsible for setting and adjusting tariff formulas. In 2006, the MOCIT promulgated a number of ministerial decrees and/or regulations, such as (i) No. 8/Per/M.Kominfo/02/2006 on cost-based interconnection, (ii) No. 1/PER/M.Kominfo/1/2006 (as last amended by No. 31 of 2012), No. 2/PER/M.Kominfo/1/2006, No. 4/Per/M.Kominfo/1/2006, No. 7/PER/M.Kominfo/2/2006 (as last amended by No. 32 of 2012), and No. 29/PER/M.Kominfo/3/2006 on 3G Service Provision, (iii) No. 5/Per/M.Kominfo/1/2006 on Telecommunication Kiosk, (iv) No. 11/Per/M.Kominfo/02/2006 on Lawful Interception, and (v) MOCIT Decree No. 181/Kep/M.Kominfo/12/2006 on Migration of fixed wireless access Network to 800MHz Allocated Frequency (as last amended by No. 363/Kep/M.Kominfo/10/2009).
61
In 2007, the MOCIT promulgated new ministerial decrees, including No. 162/Kep/M.Kominfo/5/2007 on the 800 MHz radio frequency channel allocation for operating FWA-CDMA and cellular networks (amendment of MOCIT decree No. 181/Kep/M.Kominfo/12/2006), MOCIT Regulation No. 05/PER/M.Kominfo/2/2007 on Guidance For Tariff Implementation on USO Contributions (as last amended by No. 26/PER/M.Kominfo/07/2008), No. 03/PER/M.KOMINFO/1/2007 on Leased Circuits and MOCIT Regulation No. 43/P/M.Kominfo/12/2007 on changes to all four FTPs (Fundamental Technical Plans)—2000, which delayed the date of implementation of the long distance access code in Balikpapan to April 3, 2008.
In April 2008, the MOCIT promulgated ministerial regulation No. 9/PER/M.Kominfo/04/2008 on tariff determination for cellular services, which revoked MOCIT regulation No. 12/PER/M.Kominfo/02/2006 and determines the type and structure of cellular retail tariffs based on a formula, and No. 15/Per/M.Kominfo/04/2008 on tariff determination for basic telephony services through fixed networks, which revoked MOCIT regulation No. 9/PER/M.Kominfo/02/2006. The tariff covers basic telephony, roaming and multimedia services. The tariff for basic telephony services includes activation fees, monthly fees, usage fees and value-added service fees. Ceiling tariffs for retail cellular services differ between operators due to the use of different calculation methods. Based on the new regulation, the tariff value of basic telephony services through fixed networks and SMS as an additional facility must be calculated by the operator using a cost-based formula with the calculation results stated as ceiling tariffs. The Government is expected to change the fixed telecommunications tariff formulations in the near future. In 2012, in connection with the utilization of 2.1GHz radio frequency band for cellular services, MOCIT promulgated a number of ministerial regulations, such as (i) MOCIT Regulation No. 31 of 2012 (as amendment to the MOCIT Regulation No 1/PER/M.Kominfo/1/2006), (ii) MOCIT Regulation No. 32 of 2012 (as amendment to the MOCIT Regulation No. 7/PER/M.Kominfo/2/2006), and (iii) MOCIT Regulation No. 43 of 2012.
Consumer Protection
On August 6, 2013, MOCIT promulgated MOCIT Regulation 21/2013, which reformed the governance and licensing of the provision of downloadable multimedia and content services and imposed certain consumer protection requirements in relation to the provision of premium SMS services by network providers. MOCIT Regulation 21/2013 requires network operators such as our Company and premium SMS content providers to obtain a license from the DGIPM to provide premium SMS services. Furthermore, MOCIT Regulation 21/2013 stipulates that network operators are responsible for the accuracy and transparency of tariff, billing, charges and the data content delivered to customers. Furthermore, a network operator is obliged to:
| | a. | connect users with the content provider which the user has chosen; |
| | b. | record any users who have registered to subscribe for data content services; |
| | c. | manage billing records for services provided to customers; |
| | d. | maintain adequate network quality between users and content providers; |
| | e. | deregister users from data content services whenever requested; |
| | f. | remove users’ data and content-related data after the deregistration process is completed. |
Furthermore, MOCIT Regulation 21/2013 stipulates that tariff charged to users are to consist only of network costs, content supply costs and content costs. Network cost is defined to consist of (i) costs for registration and unregistration process by users, (ii) content delivery costs to users and (iii) costs for sending notification to users. MOCIT Regulation 21/2013 also stipulates that any network provider’s customers who intend to cease subscribing content services from such network provider must be able to do so free of charge.
62
Public Telephone
Based on MOCIT Regulation No. 01/PER/M.KOMINFO/01/2010 on Telecommunication Network Operation, we have an obligation to provide public telephone lines consisting of 3.0% of the installed network capacity for fixed telecommunications networks that we build.
Universal Service Obligations
Under the Telecommunications Law, all telecommunications network and service operators are bound by Universal Service Obligations (“USO”), which require participation by all operators in the provision of telecommunications facilities and infrastructure in MOCIT USO-designated areas. The USO is a measure intended to provide telecommunication access and/or services to areas that previously lacked access or service.
Pursuant to Government Regulation No. 7/2009, as amended by Government Regulation No. 76 of 2010, and MOCIT Regulation No. 05/PER/M.Kominfo/2/2007, as amended by MOCIT Regulation No. 26/PER/M.Kominfo/07/2008, the Government determined the USO tariff to be 1.25% of an amount equal to gross revenues less interconnection expenses paid to other telecommunication carriers and bad debts.
In March 2004, the MOCIT promulgated Decree No. KM 34 of 2004, which included specifications for USO implementation program zones, technical requirements, operation, financing and monitoring. Decree No. KM 34 of 2004 was replaced with MOCIT Regulation No. 11/Per/M.Kominfo/4/2007, which, in turn, was amended by MOCIT Regulation No. 38/Per/M.Kominfo/09/2007, which regulates the procedure for utilizing USO funds to develop network and telecommunication services in areas with no telecommunication network. In 2008, the Government promulgated MOCIT Regulation No. 32/Per/M.Kominfo/10/2008 (as amended by MOCIT Regulation No. 03/Per/M.Kominfo/02/2010), which replaced MOCIT Regulation No. 11/Per/M.Kominfo/4/2007. According to this decree, a telecommunication network provider which has won tender to provide telecommunication services in areas with no telecommunication network (a “USO Zone”) will use the funds collected through the USO tariff to provide telecommunication access and services, including telephony service, SMS and internet access. While providing such telecommunication service in USO Zones, a telecommunications provider has the right to: (i) use technology, (ii) enter into interconnection arrangement with other telecommunication providers, and (iii) use a frequency spectrum of 2.390-2.400 MHz.
Interconnection Arrangements
In accordance with the express prohibitions in the Telecommunications Law on activities that may create monopolistic practices and unfair business competition, the Telecommunications Law requires network providers to allow users on one network to access users or services on other networks by paying fees agreed upon by each network operator. The Telecommunications Operations Regulation provides that interconnection charges between two or more network operators shall be transparent, mutually agreed on and fair.
On February 8, 2006, through MOCIT Regulation No. 8/PER/M.KOMINFO/02/2006, the Government issued new interconnection provisions setting out a cost-based interconnection regime, which replaced the previous revenue-sharing interconnection regime. As required under this regulation, the Government set a formula as guidance for calculating the interconnection cost for every operator. The results of the calculation are evaluated and used by the Government as a reference point.
Operators must include the result of the government’s formula in all RIO proposals, together with the proposals for call scenarios, traffic routing, point of interconnection, procedure for requesting and providing interconnection, and other matters. RIO proposals must also disclose the type of interconnection services and tariffs charged for each service offered. Interconnection access providers must implement a queuing system on a First-in-First-Serve basis. Additionally, the interconnection mechanism must also be transparent and without any discrimination.
63
Dominant IDD telecommunications operators and non-dominant operators submitted RIOs in September 2006. The RIOs of dominant operators were approved by the Government in October 2006 and the implementation of the new regime began in January 2007 through bilateral agreements among operators. Based on current regulations, RIOs can be amended every year. On April 11, 2008, the Government approved RIO proposals from dominant operators to replace the previous RIOs.
The Government’s National Fundamental Technical Plan sets out technical requirements for routing plans, numbering, and technical aspects for interconnection of the networks of telecommunications operators, which allows all network operators to interconnect directly without rather than through the PSTN.
Fee Regime
Under the Telecommunications Law, in conjunction with other regulations, each telecommunications operator is required to pay the Government a license concession fee, a frequency fee and a satellite orbit fee, as applicable. The concession license fee for each telecommunications operator is approximately 0.5% of gross revenues, consisting of revenues from leasing of networks, interconnection charges, activation of new customers, usage charges, roaming charges and SIM card charges. In addition to these fees, the Government requires all telecommunications operators to pay a USO tariff equal to 1.25% of gross revenues less interconnection expenses and provisions for bad debt for each fiscal year, payable in equal quarterly installments. The frequency fee for CDMA 800 MHz, GSM 900 MHz, DCS 1800 MHz and 3G 2100 MHz is based on its bandwidth allocated frequency. In addition, certain users must pre-pay a one-time satellite orbital connection fee while their satellites are in operation.
Prepaid Cellular Subscriber Registration
On October 28, 2005, the Government began requiring telecommunications operators to register prepaid cellular subscribers. The regulations specified that such registration process must be completed no later than April 28, 2006, which deadline was later extended to September 28, 2006. We instituted procedures in order to complete the required registration at the initial point of sale and finalized the mandatory registrations by the deadline through the cancellation of 1.3 million unregistered accounts. As stated in MOCIT Regulation No. 23/PER/M.KOMINFO/10/2005 on Registration of Telecommunication Service Customers, all operators have an ongoing duty to register their new prepaid cellular subscribers.
Satellite Regulation
The international satellite industry is highly regulated. In addition to domestic licensing and regulation in Indonesia, both the in-orbit placement and operation of our satellites are subject to registration with the Radio Regulation Bureau. Following the World Radiocommunication Conference, which took place from October 22, 2007 to November 16, 2007, some of Indonesia’s satellite characteristics at orbital slots 113E.L. and 150.5E.L. have been reinstated by the International Telecommunication Union. To facilitate utilization of the 150.5E.L. orbital slot, the DGPT promulgated Decree No. 79/DIRJEN/2009 on March 12, 2009, which created a working group consisting of the DGPT (which function had been delegated to the Directorate General of Post and Informatics Resources and Facilities), Telkom and us. In conjunction, on March 16, 2009, the MOCIT issued Letter No. 110/M. Kominfo/03/2009 agreeing to work with us and Telkom to facilitate prompt utilization of the orbital slot.
On December 17, 2011, the MOCIT issued Letter No. 460/M.KOMINFO/12/2011 approving the utilization of the Indonesian satellite filings for the 150.5E.L. orbital slot by Indosat as a closed fixed network provider. On March 26, 2014, the MOCIT declared that it will not extend our license to utilize the 150.5E.L. satellite orbital slot and that such utilization license will expire as of September 1, 2015.
64
Frequency of Fixed Wireless Access-CDMA
Through MOCIT Decree No. 181/2006, as amended, the Government reallocated 800 MHz frequency to fixed wireless access operators as part of a frequency clearance for 3G services (IMT-2000) to Bakrie Telecom, Telkom, Mobile-8, and us. We had previously been granted 5 MHz in uplink and downlink in the following frequencies: uplink frequency 1880-1885 MHz and downlink 1960-1965 MHz in Jakarta, Banten and West Java and uplink and downlink frequency 830-835 MHz and downlink 875-880 MHz in other parts of Indonesia. According to the new regulation, we have been granted 2x1.23 MHz in frequency (uplink 842.055-844.515 MHz and downlink 887.055-889.515 MHz) nationwide. The migration of the frequency was successfully implemented as of December 31, 2007.
In 2013, we submitted an application to the MOCIT to migrate the fixed wireless platform currently utilized on our 800 MHz spectrum allocation to a cellular platform. However, there can be no assurance that the MOCIT will approve our application.
Tower Sharing Obligation
On March 17, 2008, the MOCIT issued MOCIT Regulation No. 02/Per/M. Kominfo/3/2008 on the Guidelines on Construction and Utilization of Sharing Telecommunication Towers (“Tower Decree”). Under the Tower Decree, the construction of telecommunications towers requires permits from the relevant governmental institution, while the local government determines the placement and location at which telecommunications towers can be constructed. In addition, telecommunications providers that own telecommunication towers and tower owners are obligated to allow other telecommunication operators to utilize their telecommunication towers (other than the tower used for its main network), without any discrimination.
Moreover, on March 30, 2009 the Minister of Home Affairs, the Minister of Public Works, the MOCIT and the Head of the Indonesia Investment Coordinating Board promulgated the Joint Regulation No. 19/Per/M. Kominfo/03/2009 on the Guidelines on Construction and Utilization of Sharing Telecommunication Towers (the “Joint Regulation”) requires a tower construction permit for every tower built and used for telecommunications services demonstrating compliance with certain technical specifications. However, through the enactment of this Joint Regulation, the Tower Decree prevails as long as any provision contemplated therein is not contrary with the provisions regulated under the Joint Regulation.
Other than the Joint Regulation and the Tower Decree, several regional authorities have implemented regulations limiting the number and location of telecommunication towers and require operators to share in the utilization of telecommunications towers.
On September 9, 2009, parliament passed Act No. 28 of 2009 regarding local and regional taxes which took effect on January 1, 2010 and which imposes a new kind of tax that may add regulatory costs to the operation of our towers. The new tax is limited to a maximum of 2% of the tax object’s selling value, which refers to the resale value of the tower determined by the relevant tax authorities. The implementation of the new tax will be largely influenced by regional government policies.
Item 4A: UNRESOLVED STAFF COMMENTS
Not applicable.
Item 5: OPERATING AND FINANCIAL REVIEW AND PROSPECTS
The following discussion should be read in conjunction with our audited consolidated financial statements and the related notes thereto as of December 31, 2011 (restated), 2012 (restated) and 2013. The audited consolidated financial statements have been prepared in accordance with IFRS. Certain amounts (including percentage amounts) have been rounded for convenience. This discussion contains forward-looking statements that reflect our current views with respect to future events and our future financial performance. These statements involve risks and uncertainties, and our actual results may differ materially from those anticipated in
65
these forward-looking statements as a result of particular factors such as those set forth under “Forward-Looking Statements” and Item 3. “Key Information—Risk Factors” and elsewhere in this report.
A. OPERATING RESULTS
We are a fully integrated Indonesian telecommunications network and service provider and provide a full complement of national and international telecommunications services in Indonesia. As of December 31, 2013, we were one of the three largest cellular operators in Indonesia in terms of number of cellular subscribers based on available market data. We provide MIDI services to Indonesian and regional corporate and retail customers as well as international long-distance services in Indonesia.
Factors Affecting our Results of Operations and Financial Condition
Our results of operations and financial condition have been affected and will continue to be affected by a number of factors, including the following:
Cellular Subscriber Base and Usage Patterns
Our number of cellular subscribers and their usage of our cellular services directly affects our cellular operating revenues as well as our operating expenses, including interconnection expenses and depreciation and amortization expenses. In order to meet increasing demand for our services, we may be required to expand our cellular network coverage and capacity, which requires additional capital expenditures. Increases in our capital expenditures affect our cash flows, interest expense and depreciation expense.
We were one of the three largest cellular operators in Indonesia, as measured by the number of cellular subscribers, with 59.6 million subscribers as of December 31, 2013. Our total cellular subscribers increased by approximately 13.1% from 51.7 million as of December 31, 2011 to 58.5 million as of December 31, 2012 and by approximately 1.9% to 59.6 million as of December 31, 2013.
In Indonesia mobile phones have become the primary tool for telecommunication, both for voice calls as well as in terms of internet usage. Over 40% of our total cellular revenues in 2013 were derived from voice services, but the growing popularity of smartphones, the popularity of social networking sites and the development of other popular online content, has contributed to the growth of our data revenues in recent years.
Competition
We face intense competition in all of our business segments. Among other things, such competition affects the tariffs we are able to charge for our services, demand for and usage of our services and our operating margins and results of operations.
The cellular services business in Indonesia has become increasingly competitive, as demonstrated by the aggressive subscriber acquisition programs of Indonesian cellular operators in recent years. Competition in the cellular communications industry has historically been based on network coverage, technical quality, price, the availability of data services and special features, and the quality and responsiveness of customer service. Commencing in 2007, competition became more focused on pricing as many operators, including ourselves, began to offer significant promotional discounts to attract subscribers, which we believe to have resulted in high customer churn rates. The high Indonesian customer churn rate can be attributed to the high price sensitivity of subscribers, especially prepaid users and the low switching costs for postpaid subscribers, due to limited contractual lock-ins. Beginning in late 2009, we believe that the market focus on pricing as the key determinant in customers’ product selection has declined and that subscribers are again focused on the historical drivers of network coverage, technical quality, price, the availability of data services and special features.
66
Based on our internal estimates, the three major providers of wireless services in Indonesia, Telkomsel, XL and us, accounted for almost 80% of the cellular subscriber base in Indonesia in 2013. We compete with Telkomsel and XL primarily on the basis of network coverage, quality of service and price. We believe that the size of our subscriber base provides us with a significant competitive advantage over the smaller cellular providers, since we have a larger base of “on net” subscribers and we are able to provide more attractive pricing for on net calls, since we do not pay any interconnection charges to third parties.
Competition in our MIDI services has also continued to increase. During the last few years, competition among data communications service providers has intensified principally due to the issuance of new licenses after the deregulation of the Indonesian telecommunications industry. In addition, our satellite operations, which primarily consist of leasing transponders to broadcasters and telecommunications operators of VSAT, cellular and IDD services and ISPs, face competition from foreign and domestic service providers serving the same customer base.
We are no longer the only authorized provider of traditional IDD (i.e., non-VoIP) call services in Indonesia. The Government may issue more licenses for IDD services to other telecommunications operators, which will increase competition in our fixed telecommunications operations.
We expect competition in our three business segments to continue to be intense. Competition has had, and is expected to have, an impact on our results of operations and financial condition.
Tariff and Pricing Levels
Under existing regulations, the MOCIT establishes a tariff formula that determines the maximum amounts that operators may charge for cellular and fixed telecommunications services. However, the MOCIT allows cellular and fixed telecommunications operators, including us, to offer promotional packages that offer prices lower than the ceiling tariff determined by MOCIT in accordance with the tariff formula. We currently price our cellular services under a variety of ongoing promotional programs intended to attract new subscribers, stimulate demand and improve our competitive position. Any changes in our pricing structure, either as a result of Government tariff policies or in response to competition, could affect our revenues, operating results and financial condition.
For example, on December 12, 2011, the Government, through the ITRA, issued letter No.262/BRTI/XII/2011, under which tariffs for SMS changed from a “sender-keeps all” scheme to a cost-based scheme, effective June 1, 2012. Previously, the tariff for SMS (including SMS and value-added SMS) was based on a “sender-keeps-all” scheme, under which we earned revenues whenever one of our cellular subscribers sent an SMS, but not when a customer of another telecommunications operator sent an SMS to one of our cellular subscribers. Under the current cost-based scheme, we record revenues from interconnection fees payable by other operators whenever one of our cellular subscribers receives an SMS from a subscriber on another network. If one of our subscribers sends an SMS to a recipient on another network (an “off-network SMS”), we record revenues for the SMS charge payable by our subscriber and we record expenses for interconnection charges payable to the operator of the other network.
We expect to recoup any interconnection charges we incur when one of our subscribers sends an off-network SMS through charging higher fees to such subscribers for sending off-network SMSs, while maintaining our current pricing practices with respect to SMSs that terminate on our network. We anticipate that the increase in off-network SMS fees we charge our subscribers may cause a shift in SMS traffic from off-network traffic to on-network traffic, which in turn will reduce the amount of interconnection charges we will incur. We cannot assure you that we will be able to fully recoup all interconnection charges we may be required to pay, or that the revenue recorded from interconnection fees we receive from other operators will fully offset the any interconnection charges we may be required to pay, and as a result, we could experience a decrease in our operating revenues from cellular services.
67
The Indonesian Economy
We believe that the growth in the Indonesian telecommunications industry has been driven in part by recent growth of the Indonesian economy, and that demand for such services should continue, as the Indonesian economy continues to develop and modernize. Our performance and the quality and growth of our customer base and service offerings are necessarily dependent on the health of the overall Indonesian economy.
Tower Sale Transaction
On February 7, 2012, we entered into an Asset Purchase Agreement with Tower Bersama, whereby we agreed to sell 2,500 of our telecommunication towers to Tower Bersama for a total consideration of US$541.5 million, consisting of upfront consideration with a fair value of US$429.4 million and a maximum potential deferred payment of US$112.5 million. The upfront payment includes cash and newly issued TBIG shares of not less than 5% of the increase in TBIG’s capital stock (upon the rights issue of TBIG). Based on the agreement, we also agreed to lease back the spaces in the 2,500 telecommunication towers for a 10-year period with a fixed monthly lease rate of US$1,300 per tower.
On August 2, 2012, we and Tower Bersama closed the sale and leaseback transaction of 2,500 telecommunication towers. The consideration paid at closing was US$429.4 million consisting of cash of US$326.3 million and 5% share ownership in TBIG, which had a fair value of US$103.1 million as of August 2, 2012.
The total consideration received at closing of US$429.4 million (equivalent to approximately Rp4,070,187 million) was allocated for the sale of property and equipment amounting to Rp3,870,600 million and the remainder was allocated for prepaid land lease and existing tower lease contracts from the 2,500 towers. The total carrying amount of the separately identifiable components of the transaction as of the closing date amounted to Rp1,534,494 million, which includes the carrying amount of the property and equipment sold as of the closing date of the transaction that amounted to Rp1,372,674 million. As of the closing date, we recorded the excess of the selling price over the carrying amounts amounting to Rp2,535,693 million (including the Rp2,497,926 million from the sale of property and equipments) as “Gain on Sale of Towers” of Rp1,125.2 billion, and “Deferred Gain on Sales and Leaseback” of Rp1,410.5 billion. As of December 31, 2012, we recorded a total gain on the sale of the towers amounting to Rp1,183,963 million as “Gain on Tower Sale.” The sale and leaseback transaction has been accounted for as resulting in a finance lease. Rp58,771 million of the deferred gain was amortized to the income statement in 2012. The deferred gain is being amortized over the term of the lease period of 10 years. As of December 31, 2013, following one year’s amortization the remaining balance of the deferred gain from the sale and lease back transaction amounted to Rp1,210.7 billion (US$99.3 million).
On March 19, 2014, we divested the remainder of our share ownership in TBIG for an aggregate gross proceed of Rp1,391.0 billion. For more information see “Item 4. Divestiture of Our Entire Shareholding in PT Tower Bersama Infrastructure Tbk (“TBIG”)”.
Capital Expenditures
The delivery of telecommunications services is capital intensive. In order to be competitive, we must continually expand, modernize and update our technology, which involves substantial capital investment. For the years ended December 31, 2011, 2012 and 2013, our actual consolidated capital expenditures totaled Rp6,511.3 billion, Rp8,396.6 billion and Rp9,371.0 billion (US$768.8 million), respectively. During 2014, we intend to allocate approximately Rp9,871.9 billion (US$809.9 million) for new capital expenditures, which, taken together with estimated actual capital expenditures expended for 2014 for capital expenditure commitments in prior periods, will result in approximately Rp15,506.9 billion (US$1,272.2 million) total actual capital expenditures for 2014, which we intend to use for the development of fixed assets in our cellular, fixed data and fixed telecommunications business lines. See “Item 5. Operating and Financial Review and Prospects—Liquidity and Capital Resources—Capital Expenditures.”
68
Historically, we have funded our capital expenditures through internal resources and cash flow from operations, as well as debt financings through bank loans and the capital markets. In 2014, we expect to focus on the modernization of our cellular network in Greater Jakarta, other parts of Java including Surabaya, Bandung, Yogyakarta, Semarang, Sukabumi and Garut and in certain cities outside Java including Medan, Banjarmasin, Lampung, Batam and Palembang. We expect to continue to finance our capital expenditures through such sources. In addition, we also applied a portion of the cash proceeds from the Tower Sale Transaction completed in 2012 towards funding our capital expenditures in 2013. We face liquidity risk if certain events occur, including but not limited to, slower than expected growth in the Indonesian economy, downgrading of our debt ratings or deterioration of our financial performance or financial ratios. If we cannot raise the amounts needed to support our planned capital expenditures for 2014, we may be unable to improve or expand our cellular telecommunications infrastructure or update our other technology to the extent necessary to remain competitive in the Indonesian telecommunications market, which would affect our financial condition, results of operations and prospects.
In addition, unexpected changes in technology, demand for increased network capacity from our subscribers and responses to the operations and product innovation of our competitors may require us to increase our capital expenditures, which could affect our revenues, operating results and financial condition.
Foreign Exchange Volatility
The Indonesian rupiah has appreciated considerably over the last decade from its low point of approximately Rp17,000 per U.S. dollar during the Asian financial crisis. During the period between January 1, 2011 through December 31, 2013, the Indonesian rupiah/U.S. dollar middle exchange rate announced by Bank Indonesia ranged from a low of Rp12,270 per U.S. dollar to a high of Rp8,460 per U.S. dollar, and, during the year 2013, the Indonesian rupiah/U.S. dollar middle exchange rate announced by Bank Indonesia ranged from a low of Rp12,270 per U.S. dollar to a high of Rp9,634 per U.S. dollar. The middle exchange rate announced by Bank Indonesia on December 31, 2013 was Rp12,189 per U.S. dollar. While a substantial portion of our operating revenues is denominated in Indonesian rupiah, a portion of our operating revenues is U.S. dollar-denominated. In addition, a substantial portion of our borrowings, capital expenditures and operating expenses, including interest payments on our Guaranteed Notes due 2020 are denominated in currencies other than Indonesian rupiah, principally the U.S. dollar. As of December 31, 2013, 53.3% of our borrowings were denominated in Indonesian rupiah, with the balance in U.S. dollars. A depreciation in the value of the Indonesian rupiah against the U.S. dollar affects our financial condition and results of operations because, among other things, the Indonesia rupiah value of expenses payable in U.S. dollars will increase by the same factor, thereby requiring us to convert more Indonesian rupiah to pay our U.S. dollar obligations. Conversely, an appreciation in the value of the Indonesian rupiah against the U.S. dollar affects our financial condition and results of operations because, among other things, it causes a decrease in revenue from foreign carriers for inbound international calls, roaming by foreign carriers’ subscribers in Indonesia and operating revenues from our MIDI services and satellite operations. For the year ended December 31, 2011, we recorded a gain on foreign exchange-net of Rp36.7 billion, for the year ended December 31, 2012, we recorded a loss on foreign exchange-net of Rp744.6 billion and for the year ended December 31, 2013, we recorded a loss on foreign exchange-net of Rp2,786.9 billion (US$228.7 million). In addition, certain of our monetary assets and liabilities are subject to foreign currency exposure. These monetary assets primarily consist of cash, cash equivalents and accounts receivable from foreign telecommunications carriers, as well as our foreign currency-denominated accounts receivable. Our monetary liabilities subject to foreign currency exposure consist of procurements payable, loans payable and bonds payable which were incurred for capital expenditure-related liabilities. The level of our net monetary assets is influenced by the extent to which incoming calls exceed outgoing calls in our IDD business and our foreign currency denominated source of revenues.
We cannot assure you that we will be able to manage our exchange rate risk successfully in the future or that we will not continue to be adversely affected by our exposure to exchange rate risk. Our exposure to foreign exchange fluctuations, particularly as against the U.S. dollar, may increase if we incur additional U.S. dollar-denominated debt to finance our capital expenditure plans.
69
In February and March 2009, we obtained consents to amendments to certain of our debt instruments and agreements in order to provide additional flexibility in our debt to equity, debt to EBITDA and EBITDA to interest payment ratio maintenance covenants. While we believe that such amendments will provide us with sufficient cushion in the event of volatility in the Indonesian rupiah/U.S. dollar exchange rates, we cannot assure you that further and more intense volatility than that experienced in the past 12 months will not occur, which could cause us to breach our financial covenants. See “—Liquidity and Capital Resources—Cash Flows—Principal Indebtedness.”
Overview of Operations
Operating Revenues
We generate operating revenues primarily by providing cellular, MIDI and fixed telecommunications (principally international long-distance) services. The following table sets forth the breakdown of our total operating revenues and the percentage contribution of each of our services to our total operating revenues for each of the periods indicated:
| | | | | | | | | | | | | | | | | | | | | | | | | | | | |
| | | For the years ended December 31, | |
| | | 2011 | | | 2012 | | | 2013 | |
| | | Rp
(Restated) | | | % | | | Rp
(Restated) | | | % | | | Rp | | | US$ | | | % | |
| | | (Rp in billions, US$ in millions, except percentages) | |
Cellular services | | | 16,587.4 | | | | 80.8 | | | | 18,489.3 | | | | 82.5 | | | | 19,374.6 | | | | 1,589.5 | | | | 81.2 | |
MIDI services | | | 2,694.2 | | | | 13.1 | | | | 2,909.8 | | | | 13.0 | | | | 3,266.5 | | | | 268.0 | | | | 13.7 | |
Fixed telecommunications | | | 1,250.0 | | | | 6.1 | | | | 1,021.5 | | | | 4.5 | | | | 1,214.8 | | | | 99.7 | | | | 5.1 | |
| | | | | | | | | | | | | | | | | | | | | | | | | | | | |
Total operating revenues | | | 20,531.6 | | | | 100.0 | | | | 22,420.6 | | | | 100.0 | | | | 23,855.9 | | | | 1,957.2 | | | | 100.0 | |
| | | | | | | | | | | | | | | | | | | | | | | | | | | | |
The principal drivers of our operating revenues for all of our services are our subscriber base, usage levels and the rates for services. Usage levels for our services are affected by several factors, including continued growth in demand for telecommunications services in Indonesia, the continued development of the Indonesian economy and competition.
Cellular Services. We derive our cellular services operating revenues from charges for cellular usage, value-added features, monthly subscriptions, sales of cellular handsets, and connection fees, as well as interconnection charges from other telecommunications providers and tower leasing fees.
The following table sets forth the components of our cellular services operating revenues for the periods indicated:
| | | | | | | | | | | | | | | | | | | | | | | | | | | | |
| | | For the years ended December 31, | |
| | | 2011 | | | 2012 | | | 2013 | |
| | | Rp
(Restated) | | | % | | | Rp
(Restated) | | | % | | | Rp | | | US$ | | | % | |
| | | (Rp in billions, US$ in millions, except percentages) | |
Usage charges | | | 8,203.8 | | | | 49.5 | | | | 8,629.7 | | | | 46.7 | | | | 9,281.3 | | | | 761.4 | | | | 47.9 | |
Value-added services | | | 7,502.1 | | | | 45.2 | | | | 7,868.4 | | | | 42.6 | | | | 8,408.3 | | | | 689.8 | | | | 43.4 | |
Interconnection revenues | | | 1,182.4 | | | | 7.1 | | | | 2,175.0 | | | | 11.8 | | | | 2,430.8 | | | | 199.4 | | | | 12.5 | |
Tower leasing | | | 419.7 | | | | 2.5 | | | | 504.9 | | | | 2.7 | | | | 573.3 | | | | 47.0 | | | | 3.0 | |
Monthly subscription charges | | | 134.0 | | | | 0.8 | | | | 136.4 | | | | 0.7 | | | | 127.6 | | | | 10.5 | | | | 0.7 | |
Connection fee | | | 14.2 | | | | 0.1 | | | | 12.6 | | | | 0.0 | | | | 2.1 | | | | 0.2 | | | | 0.0 | |
Sale of BlackBerry™ handsets | | | 1.7 | | | | 0.0 | | | | 0.2 | | | | 0.0 | | | | 4.5 | | | | 0.4 | | | | 0.0 | |
Others | | | 245.9 | | | | 1.5 | | | | 184.4 | | | | 1.0 | | | | 218.6 | | | | 18.0 | | | | 1.1 | |
Up front discount and customer loyalty program | | | (1,116.4 | ) | | | –6.7 | | | | (1,022.3 | ) | | | –5.5 | | | | (1,671.9 | ) | | | (137.2 | ) | | | –8.6 | |
| | | | | | | | | | | | | | | | | | | | | | | | | | | | |
Total cellular services operating revenues | | | 16,587.4 | | | | 100.0 | | | | 18,489.3 | | | | 100.0 | | | | 19,374.6 | | | | 1,589.5 | | | | 100.0 | |
| | | | | | | | | | | | | | | | | | | | | | | | | | | | |
70
A substantial proportion of our cellular subscribers, approximately 98.7% as of December 31, 2013, are prepaid subscribers. We offer a variety of value-added services to our prepaid subscribers, which have increased cellular services operating revenues from data usage, SMS and value-added SMS, which allows subscribers to access a variety of information, such as politics, sports and business news. Revenues from value-added services (including SMS) represented 45.2%, 42.6% and 43.4% of our cellular services operating revenues for the years ended December 31, 2011, 2012 and 2013, respectively. We expect the revenues derived from data usage to increase, which we believe will be primarily driven by our wireless broadband services, the popularity of social networking sites and the development of other popular online content.
We recognize cellular revenues as follows:
| | • | | cellular revenues arising from airtime and roaming calls are recognized based on the duration of successful calls made through our cellular network; |
| | • | | for post-paid subscribers, monthly service fees are recognized as the service is rendered; |
| | • | | for prepaid subscribers, the activation component of starter package sales is deferred and recognized as revenue over the expected average period of the customer relationship. Sales of initial/reload vouchers are recorded as deferred revenue and recognized as revenue upon usage of the airtime or upon expiration of the airtime; |
| | • | | sales of cellular handsets are recognized upon delivery to the customers; |
| | • | | revenues from cellular data communications are recognized based on the duration and quantity of usage; |
| | • | | cellular revenues are presented on a net basis, after compensation to value added service providers; |
| | • | | revenues from network interconnection with other domestic and international telecommunications carriers are recognized monthly on the basis of the actual recorded traffic for the month. |
As part of our brand remapping strategy, in January 2013, we ceased marketing wireless broadband services as a standalone cellular service. Existing wireless broadband subscribers may still use our wireless broadband services as part of our cellular services and we still derive revenues therefrom based on the volume of usage or fixed monthly charges depending on the arrangement with the customers.
MIDI Services. Our MIDI services operating revenues consist primarily of revenues from (i) Internet services provided by us, IM2 and Lintasarta, (ii) IP VPN services, high-speed leased lines and frame relay services provided by us and Lintasarta, (iii) digital data network services provided by Lintasarta, (iv) satellite services, and (v) World link and Direct link.
We defer installation service revenues for Internet services, frame net, World link and Direct line services, upon the completion of the installation or connection of equipment, and recognize as revenue over the expected customer relationship. We recognize revenues from monthly service fees and other MIDI services as the services are rendered. Revenues from usage charges for Internet services are recognized monthly based on the duration of Internet usage or based on the fixed amount of charges depending on the arrangement with the customers. We record satellite revenues on a straight-line basis over the lease period for the transponder. Monthly rent for satellite transponder capacity is based primarily on leased capacity.
A substantial portion of our MIDI services operating revenues is denominated in U.S. dollars and is thus affected by fluctuations in the Indonesian rupiah/U.S. dollar exchange rate. Our MIDI services operating revenues have also been affected recently by a number of other factors, including competition from domestic and international providers, declining tariffs and a migration from legacy services to IP-based services. We expect such trends to continue but believe that the effects on our operating revenues will be offset by increased volume of services leased by our corporate customers and increased demand for our customized services.
71
Fixed Telecommunications Services. Fixed telecommunications services include international long-distance, fixed wireless access services, and fixed line services. International long-distance services, which are comprised of our “001” and “008” IDD services, “Flatcall 01016” as well as operator-assisted and value-added services, represented 84.0% of our operating revenues from fixed telecommunications services for the year ended December 31, 2013. Fixed wireless access and fixed line services represented the remaining balance.
International Long-distance Services. Our international long-distance services operating revenues have two primary sources, incoming call revenues and outgoing call revenues. We have negotiated volume commitments and accounting rates with foreign telecommunications operators or have implemented a market termination rate-based pricing system, and receive net settlement payments from such carriers. Net settlement payments and accounting rates are generally denominated and paid in currencies other than the Indonesian rupiah, principally the U.S. dollar; accordingly, incoming call revenues are affected by fluctuations in exchange rates between the Indonesian rupiah and other currencies.
Fixed Wireless Access Services. As of December 31, 2013, we had 111,799 “StarOne” fixed wireless access subscribers in 83 cities in Indonesia. By the end of 2010, we expanded our fixed wireless access services to several additional cities in order to create capacity for approximately four million fixed wireless access subscribers.
Fixed wireless access revenues arising from usage charges are recognized based on the duration of successful calls made through our fixed network. For postpaid subscribers, monthly service fees are recognized as the service is provided. For prepaid subscribers, the activation component of starter package sales is deferred and recognized as revenue over the estimated life of the customer relationship. Sale of initial or reload vouchers is recorded as unearned revenue and recognized as revenue upon usage of the airtime or upon expiration of the airtime.
Fixed Line Services. We currently have local and domestic long-distance coverage of 152 major cities in Indonesia. Revenues from fixed line installations are recognized as revenue over the estimated life of customer relationship. Revenues from usage charges are recognized based on the duration of successful calls made through our fixed network.
Operating Expenses
Our principal operating expenses include cost of services, depreciation and amortization, personnel expenses, marketing expenses, general and administration expenses. Starting in 2012, we reclassified several portions of our other income (expenses) to operating expense (including gain from foreign exchange, gain on tower sales and others—net) to conform with the presentation of financial statements under OJK or BAPEPAM rules.
Certain of our expenses are denominated in U.S. dollars or currencies other than the Indonesian rupiah. Such expenses include those for international interconnection settlements, certain maintenance agreements and consultancy fees.
Cost of Services. Costs of services expenses include radio frequency fee, interconnection expenses, maintenance, utilities, rents, BlackBerry™ access fee, leased circuits, the cost of SIM cards and pulse reload vouchers, USO, installation and concession fee.
Depreciation and Amortization. We use the straight-line depreciation method for our property, facilities and equipment over their estimated useful lives. A significant portion of our depreciation expenses relate to our cellular services assets. As we continue to expand and enhance the coverage, capacity and quality of our networks, we expect expenses for depreciation to increase. On August 2, 2012, we and Tower Bersama closed the sale and leaseback transaction of 2,500 telecommunication towers. Since the sale and leaseback transaction has been accounted for as resulting in a finance lease, we recognized the leased assets on our balance sheet and recognize depreciation expense on the leased assets.
72
Marketing. Marketing expenses primarily include exhibition, promotion, customer loyalty and advertisement expenses associated with our marketing programs.
Personnel.Personnel expenses primarily include severance benefit under the voluntary separation scheme, which scheme ended in June 2011 for us and in January 2012 for Lintasarta, salaries, incentives and other employee benefits, employee income tax, bonuses, medical expense and pension.
General and Administration. General and administration expenses primarily include rent, professional fees, utilities, transportation, provision for impairment of receivables and office.
Gain on Tower Sale. Gain on tower sale consists of the gain amounting to Rp1,125.2 billion that we recognized from the sale of tower slots not leased back by us from the tower sales and leaseback transaction with Tower Bersama and the amortization of deferred gain amounting to Rp58.8 billion from the tower slots that we leased back from August 2012 to December 2012. Operating expenses for the year ended December 31, 2012 decreased by the amount of the gain on the tower sale in 2012.
Gain (loss) on Foreign Exchange. Gain (loss) on foreign exchanges consists of gains (losses) incurred from accounts other than long-term debt, such as cash and cash equivalents, account receivables and procurement payables, as part of operating expense.
Others—net. Others—net expenses primarily includes the gain from sales of asset (other than towers), the tax expense from penalty or tax assessment from tax offices for income taxes other than corporate income taxes, dividend income from our investment in cost method and professional fees relating to the tower sale and leaseback transaction in 2012.
Other Income (Expense)
The major components of our other income (expense) are interest income, gain (loss) on foreign exchange—net, financing cost and gain (loss) on change in the fair value of derivatives—net. Foreign exchange gain or loss primarily includes the gain (loss) on foreign exchange incurred primarily from our long term debt. See “Item 11: Quantitative and Qualitative Disclosures About Market Risk.” Financing cost primarily includes interest on loans and finance charges under finance leases, including leases of tower slots.
Taxation
Current tax expense is provided based on the estimated taxable income for the year. Deferred tax assets and liabilities are recognized for temporary differences between the financial and the tax bases of assets and liabilities at each reporting date. Future tax benefits, such as the carryover of unused tax losses, are also recognized to the extent that realization of such benefits is probable. The tax effects for the year are allocated to current operations, except for the tax effects from transactions which are directly charged or credited to equity.
Deferred tax assets and liabilities are measured at the tax rates that are expected to apply in the period when the asset is realized or the liability is settled, based on tax rates (and tax laws) that have been enacted or substantively enacted at the balance sheet date. Changes in the carrying amount of deferred tax assets and liabilities due to a change in tax rates are credited or charged to current period operations, except to the extent that they relate to items previously charged or credited to equity.
For each of the consolidated entities, the tax effects of temporary differences and tax loss carryover, which individually are either assets or liabilities, are shown at the applicable net amounts.
73
Profit (Loss) Attributable to Owners of the Company
Our profit (loss) attributable to owners of the Company for the years ended December 31, 2011, 2012 and 2013 is not necessarily reflective of our operating revenues and operating income during such periods, in part due to large fluctuations in several non-operating items, which have impacted our profit (loss) attributable to owners of the Company over such periods. Such non-operating items include, among others, fluctuations in income tax deferred, gain or loss on foreign exchange-net, and gain or loss on change in the fair value of derivatives-net. We expect these fluctuations to continue.
Results of Operations
The following table sets forth selected comprehensive income data expressed as a percentage of total operating revenues for the periods indicated:
| | | | | | | | | | | | |
| | | For the years ended December 31, | |
| | | 2011 | | | 2012 | | | 2013 | |
| | | (Restated) | | | (Restated) | | | | |
Operating revenues: | | | | | | | | | | | | |
Cellular | | | 80.8 | % | | | 82.5 | % | | | 81.2 | % |
MIDI | | | 13.1 | % | | | 13.0 | % | | | 13.7 | % |
Fixed telecommunications | | | 6.1 | % | | | 4.5 | % | | | 5.1 | % |
| | | | | | | | | | | | |
Total operating revenues | | | 100.0 | % | | | 100.0 | % | | | 100.0 | % |
| | | | | | | | | | | | |
Operating expenses: | | | | | | | | | | | | |
Cost of services | | | 36.8 | % | | | 39.7 | % | | | 41.7 | % |
Depreciation and amortization | | | 32.0 | % | | | 36.9 | % | | | 37.6 | % |
Personnel | | | 8.9 | % | | | 6.3 | % | | | 7.3 | % |
General and administration | | | 2.7 | % | | | 2.8 | % | | | 3.8 | % |
Marketing | | | 4.2 | % | | | 4.1 | % | | | 3.7 | % |
Gain on foreign exchange | | | (0.4 | )% | | | (0.2 | )% | | | (0.9 | )% |
Gain on tower sale | | | — | | | | (5.3 | )% | | | (0.6 | )% |
Others—net | | | 0.0 | % | | | 1.4 | % | | | 1.1 | % |
| | | | | | | | | | | | |
Total operating expenses | | | 84.2 | % | | | 85.7 | % | | | 93.7 | % |
| | | | | | | | | | | | |
Net Profit: | | | | | | | | | | | | |
Operating income | | | 15.8 | % | | | 14.3 | % | | | 6.3 | % |
Other expense—net | | | (8.9 | )% | | | (12.2 | )% | | | (20.3 | )% |
Profit before income tax | | | 6.9 | % | | | 2.1 | % | | | (14.0 | )% |
Income tax benefit (expense)—net | | | (1.4 | )% | | | 0.1 | % | | | 2.8 | % |
Profit (loss) attributable to Owners of the Company | | | 5.0 | % | | | 1.7 | % | | | (11.7 | )% |
Profit (loss) attributable to Non-controlling interest | | | 0.5 | % | | | 0.5 | % | | | 0.5 | % |
74
The following table sets forth our operating revenues from our various business segments for the periods indicated:
| | | | | | | | | | | | | | | | | | | | | | | | | | | | |
| | | For the years ended December 31, | |
| | | 2011 | | | 2012 | | | 2013 | |
| | | Rp | | | % | | | Rp | | | % | | | Rp | | | US$ | | | % | |
| | | (Restated) | | | | | | (Restated) | | | | | | | | | | | | | |
| | | (Rp in billions, US$ in millions, except percentages) | |
Cellular Services | | | | | | | | | | | | | | | | | | | | | | | | | | | | |
Usage charges | | | 8,203.8 | | | | 49.5 | | | | 8,629.7 | | | | 46.7 | | | | 9,281.3 | | | | 761.4 | | | | 47.9 | |
Value-added services | | | 7,502.1 | | | | 45.2 | | | | 7,868.4 | | | | 42.6 | | | | 8,408.3 | | | | 689.8 | | | | 43.4 | |
Interconnection revenues | | | 1,182.4 | | | | 7.1 | | | | 2,175.0 | | | | 11.8 | | | | 2,430.8 | | | | 199.4 | | | | 12.5 | |
Tower leasing | | | 419.7 | | | | 2.5 | | | | 504.9 | | | | 2.7 | | | | 573.3 | | | | 47.0 | | | | 3.0 | |
Monthly subscription charges | | | 134.0 | | | | 0.8 | | | | 136.4 | | | | 0.7 | | | | 127.6 | | | | 10.5 | | | | 0.7 | |
Connection fee | | | 14.2 | | | | 0.1 | | | | 12.6 | | | | 0.0 | | | | 2.1 | | | | 0.2 | | | | 0.0 | |
Sale of BlackBerry™ handsets | | | 1.7 | | | | 0.0 | | | | 0.2 | | | | 0.0 | | | | 4.5 | | | | 0.4 | | | | 0.0 | |
Others | | | 245.9 | | | | 1.5 | | | | 184.4 | | | | 1.0 | | | | 218.6 | | | | 18.0 | | | | 1.1 | |
Up front discount and customer loyalty program | | | (1,116.4 | ) | | | –6.7 | | | | (1,022.3 | ) | | | –5.5 | | | | (1,671.9 | ) | | | (137.2 | ) | | | –8.6 | |
| | | | | | | | | | | | | | | | | | | | | | | | | | | | |
Subtotal | | | 16,587.4 | | | | 100.0 | | | | 18,489.3 | | | | 100.0 | | | | 19,374.6 | | | | 1,589.5 | | | | 100.0 | |
| | | | | | | | | | | | | | | | | | | | | | | | | | | | |
| | | | | | | |
MIDI | | | | | | | | | | | | | | | | | | | | | | | | | | | | |
IP VPN | | | 695.9 | | | | 25.8 | | | | 711.4 | | | | 24.4 | | | | 706.0 | | | | 57.9 | | | | 21.6 | |
Internet | | | 375.7 | | | | 14.0 | | | | 422.1 | | | | 14.5 | | | | 696.2 | | | | 57.1 | | | | 21.3 | |
World link and direct link | | | 295.0 | | | | 11.0 | | | | 314.9 | | | | 10.8 | | | | 340.7 | | | | 28.0 | | | | 10.4 | |
Leased line | | | 263.7 | | | | 9.8 | | | | 150.4 | | | | 5.2 | | | | 169.9 | | | | 14.0 | | | | 5.2 | |
Application services | | | 192.6 | | | | 7.1 | | | | 251.9 | | | | 8.7 | | | | 283.8 | | | | 23.3 | | | | 8.7 | |
Satellite lease | | | 150.9 | | | | 5.6 | | | | 213.0 | | | | 7.3 | | | | 278.2 | | | | 22.8 | | | | 8.5 | |
Value-added Service | | | 264.6 | | | | 9.8 | | | | 173.9 | | | | 6.0 | | | | 52.3 | | | | 4.3 | | | | 1.6 | |
Frame net | | | 123.2 | | | | 4.6 | | | | 135.8 | | | | 4.7 | | | | 93.4 | | | | 7.7 | | | | 2.9 | |
Digital data network | | | 103.1 | | | | 3.8 | | | | 112.6 | | | | 3.9 | | | | 110.1 | | | | 9.0 | | | | 3.4 | |
TV link | | | 6.1 | | | | 0.2 | | | | 6.0 | | | | 0.2 | | | | 8.2 | | | | 0.7 | | | | 0.3 | |
MPLS | | | 89.9 | | | | 3.3 | | | | 304.9 | | | | 10.5 | | | | 380.8 | | | | 31.2 | | | | 11.7 | |
Others | | | 133.5 | | | | 5.0 | | | | 112.9 | | | | 3.8 | | | | 146.9 | | | | 12.0 | | | | 4.4 | |
| | | | | | | | | | | | | | | | | | | | | | | | | | | | |
Subtotal | | | 2,694.2 | | | | 100.0 | | | | 2,909.8 | | | | 100.0 | | | | 3,266.5 | | | | 268.0 | | | | 100.0 | |
| | | | | | | | | | | | | | | | | | | | | | | | | | | | |
Fixed Telecommunications | | | | | | | | | | | | | | | | | | | | | | | | | | | | |
International Calls | | | 934.0 | | | | 74.7 | | | | 801.5 | | | | 78.5 | | | | 1,020.0 | | | | 83.7 | | | | 84.0 | |
Fixed Wireless | | | 192.8 | | | | 15.4 | | | | 98.3 | | | | 9.6 | | | | 59.6 | | | | 4.9 | | | | 4.9 | |
Fixed Line | | | 123.2 | | | | 9.9 | | | | 121.7 | | | | 11.9 | | | | 135.2 | | | | 11.1 | | | | 11.1 | |
| | | | | | | | | | | | | | | | | | | | | | | | | | | | |
Subtotal | | | 1,250.0 | | | | 100.0 | | | | 1,021.5 | | | | 100.0 | | | | 1,214.8 | | | | 99.7 | | | | 100.0 | |
| | | | | | | | | | | | | | | | | | | | | | | | | | | | |
Total | | | 20,531.6 | | | | | | | | 22,420.6 | | | | | | | | 23,855.9 | | | | 1,957.2 | | | | | |
| | | | | | | | | | | | | | | | | | | | | | | | | | | | |
Year ended December 31, 2012 compared to Year ended December 31, 2013
Operating Revenues
Total operating revenues increased from Rp22,420.6 billion in 2012 to Rp23,855.9 billion (US$1,957.2 million) in 2013, or 6.4%, primarily as a result of an increase in operating revenues from cellular services and from MIDI services. During 2013, operating revenues from cellular services increased by Rp885.3 billion, or 4.8%, from Rp18,489.3 billion in 2012 to Rp19,374.6 billion (US$1,589.5 million) in 2013. Operating revenues from MIDI services increased by Rp356.7 billion, or 12.3%, from Rp2,909.8 billion in 2012 to Rp3,266.5 billion (US$268.0 million) in 2013. Operating revenues from fixed telecommunications services in 2013 increased by Rp193.3 billion, or 18.9%, from Rp1,021.5 billion in 2012 to Rp1,214.8 billion (US$99.7 million) in 2013.
75
Cellular Services. In 2013, we recorded cellular services operating revenues of Rp19,374.6 billion (US$1,589.5 million), an increase of 4.8% from Rp18,489.3 billion in 2012. The increase was primarily a result of an increase in operating revenues from usage charges, data usage, value-added SMS and SMS interconnection revenue, which was partially offset by a significant increase in upfront discounts and customer loyalty programs relating to discounts provided for outbound data roaming services in relation to a data roaming package which we introduced in 2013. Operating revenues from cellular services represented 81.2% of our total operating revenues for 2013, which is lower than the percentage for 2012.
Usage charges increased by Rp651.6 billion, or 7.6%, from 2012 to Rp9,281.3 billion (US$761.4 million) in 2013, and represented 47.9% of our total cellular services operating revenues. This increase in usage charges was primarily due to an increase in outbound data roaming services.
MIDI Services. In 2013, operating revenues from MIDI services increased by Rp356.7 billion from Rp2,909.8 billion in 2012 to Rp3,266.5 billion (US$268.0 million) in 2013. IP VPN operating revenues decreased by Rp5.4 billion from Rp711.4 billion in 2012 to Rp706.0 billion (US$57.9 million) in 2013. The increase in MIDI services operating revenues was primarily due to an increase in the usage of international and domestic leased circuit and MPLS-based services.
Fixed Telecommunications Services. There was an increase in fixed telecommunications services operating revenues of Rp193.3 billion, or 18.9%, from Rp1,021.5 billion in 2012 to Rp1,214.8 billion (US$99.7 million) in 2013. Operating revenues from international calls and fixed wireless access services represented 84.0% and 4.9% of fixed telecommunications services operating revenues in 2013, respectively. The remaining 11.1% of fixed telecommunications services operating revenues in 2013 was generated by fixed line. Revenues from international calls increased from Rp801.5 billion in 2012 to Rp1,020.0 billion (US$83.7 million) in 2013 due to an increase in incoming IDD traffic from Indosat and non-Indosat subscribers and an increase in fixed line usage.
Operating Expenses
Operating expenses increased by Rp3,141.1 billion, or 16.3%, from Rp19,223.1 billion in 2012 to Rp22,364.2 billion (US$1,834.8 million) in 2013, primarily due to an increase in depreciation and amortization expenses, cost of services, personnel expenses, general and administration expenses.
Depreciation and amortization expenses increased by Rp685.6 billion, or 8.3%, from Rp8,284.0 billion in 2012 to Rp8,969.6 billion (US$735.9 million) in 2013, primarily as a result of the decrease in the useful lives of our cellular technical equipment from 10 years to eight years, which took effect in 2013, based on our review of the estimated useful life of those assets and continued growth of our fixed asset base. The total cost of our property and equipment increased by Rp8,647.6 billion, or 9.8%, from Rp88,417.6 billion in 2012 to Rp97,065.3 billion (US$7,963.4 million) in 2013.
Cost of services expenses increased by Rp1,050.8 billion, or 11.8%, from Rp8,905.7 billion in 2012 to Rp9,956.5 billion (US$816.8 million) in 2013, primarily as a result of an increase of SMS interconnection charges due to the implementation of our “SMS Suka-Suka” free SMS promotional scheme which increased SMS traffic to non-Indosat subscribers and an increase in leased circuits due to additional transmission links leased in 2013.
Personnel expenses increased by Rp324.3 billion, or 23.0%, from Rp1,410.2 billion in 2012 to Rp1,734.4 billion (US$142.3 million) in 2013, primarily due to compensation expense related to severance packages provided to certain of our employees and an increase in headcount.
Marketing expenses decreased by Rp26.7 billion, or 2.9%, from Rp920.3 billion in 2012 to Rp893.6 billion (US$73.3 million) in 2013, primarily due to the implementation in 2013 of a performance-based incentive fee paid to distributors.
76
General and administration expenses increased by Rp276.0 billion, or 44.1%, from Rp625.5 billion in 2012 to Rp901.5 billion (US$74 million) in 2013, primarily due to an increase in professional fees mainly to technical consultants in connection with the modernization of our network and legal expenses in connection with the litigation relating to IM2 and the former President Director of IM2 and provisions for impairment receivables.
Gain on tower sale.We recorded a gain on tower sales amounting to Rp141.1 billion (US$11.6 million) from the tower sale and leaseback transaction with Tower Bersama that closed in August 2012.
Gain on foreign exchange. We recorded an increase in gain on foreign exchange of Rp179.7 billion, or 401.2%, from Rp44.8 billion in 2012 to Rp224.5 billion (US$18.4 million) in 2013 primarily due to an increase in our cash and U.S. dollar-denominated cash and cash equivalents provided by interconnection fees derived from international carriers.
Others—net.Others—net expense decreased by Rp32.1 billion, or 10.5%, from Rp306.1 billion in 2012 to Rp274.0 billion (US$22.5 million) in 2013 mainly due to an increase in gain on sale of technical equipment and dividend income primarily from Asean Cableship Pte. Ltd. and TBIG which were partially offset by an expense relating to provisions for VAT payable adjustments recognized for the 2009, 2012 and 2013 fiscal years in relation to revenues from international incoming call.
Operating Income
As a result of the above factors, operating income decreased by Rp1,705.8 billion, or 53.3%, from Rp3,197.5 billion in 2012 to Rp1,491.7 billion (US$122.4 million) in 2013.
Other Expenses-Net
Other expenses-net increased by Rp2,114.7 billion, or 77.5%, from Rp2,728.3 billion in 2012 to Rp4,843.0 billion (US$397.4 million) in 2013, primarily due to an increase in loss on foreign exchange and in financing costs.
Loss on foreign exchange-net increased by Rp2,222.0 billion, or 281.5%, from Rp789.4 billion in 2012 to Rp3,011.4 billion (US$247.1 million) in 2013. The Indonesian rupiah/U.S. dollar middle exchange rate announced by Bank Indonesia increased from Rp9,670 per U.S. dollar as of December 31, 2012 to Rp12,189 per U.S. dollar as of December 31, 2013, compared to the increased from Rp9,068 per U.S. dollar as of December 31, 2011 to Rp9,670 per U.S. dollar as of December 31, 2012.
We recorded an increase in financing cost to Rp2,212.1 billion (US$181.5 million) in 2013, which represented an increase of Rp134.7 billion, or 6.5%, from Rp2,077.4 billion in 2012 primarily as a result of an increase in interest expense from our finance lease obligations.
We recorded a gain on change in fair value of derivatives-net of Rp273.3 billion (US$22.4 million), representing an increase of Rp268.3 billion, over a gain on change in fair value of derivatives-net of Rp5.0 billion in 2012 due to gains realized from mark-to-market adjustments on our foreign currency swap contracts and the settlement of foreign currency swaps contracts including those which matured in 2013.
We recorded a decrease in interest income to Rp107.2 billion (US$8.8 million) in 2013, which represented a decrease of Rp26.4 billion, or 19.7%, from Rp133.5 billion in 2012, due to a decrease in cash balances in 2013.
Income Tax Benefit (Expense)-Net
We recorded income tax benefit—net of Rp668.7 billion (US$54.9 million) in 2013 compared to income tax benefit of Rp20.5 billion in 2012. The increase in income tax benefit-net was primarily due to tax loss carryover of Rp622.5 billion (US$51.1 million).
77
Profit (Loss) for the Year Attributable to Owners of the Company
We recorded a loss attributable to owners of the Company of Rp2,798.6 billion (US$229.6 million) in 2013 compared to a profit attributable to owners of the Company of Rp376.5 billion in 2012 due to the foregoing factors.
Year ended December 31, 2011 compared to Year ended December 31, 2012
Total operating revenues increased from Rp20,531.6 billion in 2011 to Rp22,420.6 billion in 2012, or 9.2%, primarily as a result of an increase in our cellular services revenue and our MIDI services revenue. During 2012, operating revenues from cellular services increased by Rp1,901.9 billion, or 11.5%, from Rp16,587.4 billion in 2011 to Rp18,489.3 billion in 2012. Operating revenues from MIDI services increased by Rp215.5 billion, or 8.0%, from Rp2,694.2 billion in 2011 to Rp2,909.8 billion in 2012. Operating revenues from fixed telecommunications services in 2012 decreased by Rp228.5 billion, or 18.3%, from Rp1,250.0 billion in 2011 to Rp1,021.5 billion in 2012.
Cellular Services. In 2012, we recorded cellular services operating revenues of Rp18,489.3 billion, an increase of 11.5% from Rp16,587.4 billion in 2011. The increase was primarily a result of an increase in the number of subscribers, SMS interconnection revenue and in the revenue from tower leasing. Operating revenues from cellular services represented 82.5% of our total operating revenues for 2012, which is higher than the percentage for 2011.
Usage charges increased by Rp425.9 billion, or 5.2%, from 2011, and represented 46.7% of our total cellular services operating revenues. This increase in usage was primarily due to an increase in the total Minutes of Usage by our subscribers.
MIDI Services. In 2012, operating revenues from MIDI services increased by Rp215.5 billion from Rp2,694.2 billion in 2011 to Rp2,909.8 billion in 2012. IP VPN operating revenues represent the largest component of MIDI services operating revenue. IP VPN operating revenues increased by Rp15.5 billion from Rp695.9 billion in 2011 to Rp711.4 billion in 2012. The increase in MIDI services operating revenues, including those from international and domestic leased line services, was primarily due to an increase in usage by consumers despite a decline in prices of our services as a result of competitive pressure.
Fixed Telecommunications Services. There was a decrease in fixed telecommunications services operating revenues from Rp1,250.0 billion in 2011 to Rp1,021.5 billion in 2012. Operating revenues from international calls and fixed wireless access services represented 78.5% and 9.6%, respectively, of fixed telecommunications services operating revenues in 2012. The remaining 11.9% of fixed telecommunications services operating revenues in 2012 was generated by fixed line. Revenues from international calls decreased from Rp934.0 billion in 2011 to Rp801.5 billion in 2012 due to a decrease in outgoing IDD traffic from Indosat and non-Indosat subscribers.
Operating Expenses
Operating expenses increased by Rp1,932.8 billion, or 11.2%, from Rp17,290.3 billion in 2011 to Rp19,223.1 billion in 2012, primarily due to increases in cost of services expenses, depreciation and amortization expenses, marketing expenses, general and administration expenses and others—net expenses. This increase was offset in part by a decrease in personnel expenses, as well as by the gain on tower sale of Rp1,184.0 billion recognized in 2012 as a result of the sale and leaseback transaction on August 2, 2012.
Personnel expenses decreased by Rp419.3 billion, or 22.9%, from Rp1,829.5 billion in 2011 to Rp1,410.2 billion in 2012, primarily due to the decrease in compensation expense related to the severance packages provided to participants in the VSS program, which was launched in January 2011 and completed in June 2011 for our Company and launched in December 2011 and completed in January 2012 for Lintasarta.
78
Cost of services expenses increased by Rp1,358.3 billion, or 18.0%, from Rp7,547.4 billion in 2011 to Rp8,905.7 billion in 2012, primarily as a result of the implementation of the new SMS interconnection scheme, increased Governmental levies on frequency fees and 3G spectrum fees and increases in BlackBerry™ license fees.
Depreciation and amortization expenses increased by Rp1,714.7 billion or 26.1%, from Rp6,569.3 billion in 2011 to Rp8,284.0 billion in 2012, primarily as a result of the decrease in the useful lives of our cellular technical equipment from 10 years to eight years, with effect from September 2012, based on our review of the estimated useful life of those assets and continued growth of our fixed asset base. The total cost of our property and equipment increased from Rp83,056.2 billion in 2011 to Rp88,417.6 billion in 2012.
Marketing expenses increased by Rp64.6 billion, or 7.6%, from Rp855.7 billion in 2011 to Rp920.3 billion in 2012, driven primarily by an increase in advertising expenses and expenses relating to market research.
General and administration expenses increased by Rp76.0 billion, or 13.8%, from Rp549.5 billion in 2011 to Rp625.5 billion in 2012, primarily due to a increase in professional fees mainly relating to legal expenses in connection with litigation relating to the misuse of 3G license.
Gain on tower sale.We recorded a gain on tower sales amounting to Rp1,184.0 billion from the tower sale and leaseback transaction with Tower Bersama that closed in August 2012.
Gain on foreign exchange. We recorded a decrease in gain on foreign exchange from Rp90.9 billion in 2011 to Rp44.8 billion in 2012 primarily due to additional realized loss on foreign exchange from the payment of our U.S. dollar-denominated procurement payable in 2012.
Others—net.Others—net expense increased by Rp276.3 billion, or 927.0%, from Rp29.8 billion in 2011 to Rp306.0 billion in 2012 mainly due to additional consultancy fees to arrange and negotiate the tower sale and leaseback transaction and additional income tax article 23 paid to tax offices related to the tower sale and leaseback transaction in 2012.
Operating Income
As a result of the above factors, operating income decreased by Rp43.8 billion, or 1.3%, from Rp3,241.3 billion in 2011 to Rp3,197.6 billion in 2012.
Other Expenses-Net
Other expenses-net increased by Rp895.4 billion, or 48.9%, from Rp1,832.9 billion in 2011 to Rp2,728.3 billion in 2012, primarily due to an increase in loss on foreign exchange and in financing costs.
We recorded a gain on foreign exchange-net of Rp36.7 billion in 2011 compared to a loss on foreign exchange-net of Rp744.6 billion in 2012. The middle exchange rate announced by Bank Indonesia increased from Rp9,068 per U.S. dollar as of December 31, 2011 to Rp9,670 per U.S. dollar as of December 31, 2012, compared to the increase from Rp8,991 per U.S. dollar as of December 31, 2010 to Rp9,068 per U.S. dollar as of December 31, 2011.
We recorded a gain on change in fair value of derivatives-net of Rp5.0 billion in 2012, representing a decrease of Rp53.0 billion, over a gain on change in fair value of derivatives-net of Rp58.0 billion in 2011 due to an increase in currency forward contracts entered into by our Company in 2012.
We recorded an increase in interest income to Rp133.5 billion in 2012, which represented an increase of Rp40.9 billion, or 44.1%, from Rp92.6 billion in 2011, due to higher cash balance mainly from the sale and leaseback transaction in 2012.
79
We recorded an increase in financing cost to Rp2,077.4 billion in 2012, which represented an increase of Rp148.1 billion, or 7.7%, from Rp1,929.3 billion in 2011 as a result of an increase in interest expense from our finance lease obligations under the sale and leaseback transaction in 2012.
Income Tax Benefit (Expense)-Net
We recorded income tax benefit—net of Rp20.5 billion in 2012 compared to income tax expenses of Rp291.0 billion in 2011. The decrease in income tax expense-net was primarily due to a decrease in income before tax resulting from a decrease in operating income and gain on foreign exchange.
Profit (Loss) for the Year Attributable to Owners of the Company
Our profit attributable to owners of the Company decreased by Rp641.7 billion, or 63.0%, from Rp1,018.2 billion in 2011 to Rp376.5 billion in 2012 due to the foregoing factors.
Segment Results
| | | | | | | | | | | | | | | | | | | | | | | | | | | | |
| | | For the years ended December 31, | |
| | | 2011 | | | 2012 | | | 2013 | |
| | | Rp | | | % | | | Rp | | | % | | | Rp | | | US$ | | | % | |
| | | (Restated) | | | | | | (Restated) | | | | | | | | | | | | | |
| | | (Rp in billions, US$ in millions, except percentages) | |
Segmented Operating Revenues | | | | | | | | | | | | | | | | | | | | | | | | | | | | |
Cellular services | | | 16,587.4 | | | | 80.8 | | | | 18,489.3 | | | | 82.5 | | | | 19,374.6 | | | | 1,589.5 | | | | 81.2 | |
MIDI services | | | 2,694.2 | | | | 13.1 | | | | 2,909.8 | | | | 13.0 | | | | 3,266.5 | | | | 268.0 | | | | 13.7 | |
Fixed telecommunications | | | 1,250.0 | | | | 6.1 | | | | 1,021.5 | | | | 4.5 | | | | 1,214.8 | | | | 99.7 | | | | 5.1 | |
| | | | | | | | | | | | | | | | | | | | | | | | | | | | |
Total operating revenues | | | 20,531.6 | | | | 100.0 | | | | 22,420.6 | | | | 100.0 | | | | 23,855.9 | | | | 1,957.2 | | | | 100.0 | |
| | | | | | | | | | | | | | | | | | | | | | | | | | | | |
| | | | | | | |
Segmented Operating Expenses | | | | | | | | | | | | | | | | | | | | | | | | | | | | |
Cellular services | | | 13,731.0 | | | | 79.1 | | | | 16,471.6 | | | | 81.8 | | | | 18,171.0 | | | | 1,490.8 | | | | 80.9 | |
MIDI services | | | 2,286.3 | | | | 13.2 | | | | 2,378.1 | | | | 11.8 | | | | 2,797.1 | | | | 229.5 | | | | 12.5 | |
Fixed telecommunications | | | 1,334.1 | | | | 7.7 | | | | 1,296.1 | | | | 6.4 | | | | 1,487.6 | | | | 122.0 | | | | 6.6 | |
| | | | | | | | | | | | | | | | | | | | | | | | | | | | |
Total operating expenses | | | 17,351.4 | | | | 100.0 | | | | 20,145.8 | | | | 100.0 | | | | 22,455.7 | | | | 1,842.3 | | | | 100.0 | |
| | | | | | | | | | | | | | | | | | | | | | | | | | | | |
| | | | | | | |
Segmented Operating Profit | | | | | | | | | | | | | | | | | | | | | | | | | | | | |
Cellular services | | | 2,856.3 | | | | 89.8 | | | | 2,017.7 | | | | 88.7 | | | | 1,203.6 | | | | 98.7 | | | | 86.0 | |
MIDI services | | | 407.9 | | | | 12.8 | | | | 531.7 | | | | 23.3 | | | | 469.4 | | | | 38.5 | | | | 33.5 | |
Fixed telecommunications | | | (84.0 | ) | | | (2.6 | ) | | | (274.6 | ) | | | (12.0 | ) | | | (272.8 | ) | | | (22.3 | ) | | | (19.5 | ) |
| | | | | | | | | | | | | | | | | | | | | | | | | | | | |
Total operating profit | | | 3,180.2 | | | | 100.0 | | | | 2,274.8 | | | | 100.0 | | | | 1,400.2 | | | | 114.9 | | | | 100.0 | |
| | | | | | | | | | | | | | | | | | | | | | | | | | | | |
Cellular Services
Cellular services operating profit decreased by Rp814.1 billion, 40.3%, from Rp2,017.7 billion in 2012 to Rp1,203.6 billion (US$98.7 million) in 2013 mainly due to an increase in cost of services expenses in relation to our free SMS promotional scheme in 2013, an increase in radio frequency fees, an increase in depreciation of our cellular technical equipment resulting from the decrease in useful lives of such equipment from 10 years to eight years which took effect in 2013 and a significant increase in upfront discounts and customer loyalty programs relating to outbound data roaming services. Such increases were partially offset by the increase in operating revenues from usage charges primarily due to an increase in total Minutes of Usage by our IM3 subscribers and the number of IM3 subscribers and value-added services primarily due to an increase in data usage, SMS and value-added SMS.
80
Cellular services operating profit decreased by Rp838.6 billion, or 29.4%, from Rp2,856.3 billion in 2011 to Rp2,017.7 billion in 2012, mainly due to a significant increase in depreciation of cellular equipment resulting from the decrease in useful lives of such equipment from 10 years to eight years, an increase in SMS interconnection charges as a result of the implementation of the new SMS interconnection scheme, an increase in Governmental levies on frequency fees and 3G spectrum fees and an increase in BlackBerry license fees. Such increases were offset by the increase in cellular services operating revenues mainly due to an increase in usage from a higher number of subscribers, revenues from value-added services driven by higher SMS usage, and SMS interconnection revenues.
MIDI Services
MIDI services operating profit decreased by Rp62.3 billion, or 11.7%, from Rp531.7 billion in 2012 to Rp469.4 billion (US$38.5 million) in 2013 mainly due to increased leased circuit expenses due to an additional transmission link leased in 2013 and depreciation and amortization expense due to an increase in technical equipment related to our MIDI services. These increases were partially offset by an increase in operating revenues primarily from the usage of international and domestic leased circuit and MPLS-based services.
MIDI services operating profit increased by Rp123.8 billion, or 30.4%, from Rp407.9 billion in 2011 to Rp531.7 billion in 2012, mainly due to higher revenue from IP VPN and increased value-added services coming from “Desa Pinter” projects entered between Lintasarta and MOCIT. These increased revenues offset the increase in operating expenses from MIDI services, which were mainly due to increased leased circuit and installation expenses related to the “Desa Pinter” projects, which are projects relating to public internet provision in rural areas or villages.
Fixed Telecommunication Services
Fixed telecommunications services operating losses decreased by Rp1.8 billion from Rp274.6 billion in 2012 to Rp272.8 billion (US$22.3 million) in 2013, mainly due to an increase in incoming IDD traffic from our and non-Indosat subscribers and an increase in fixed line usage, which was partially offset by a decrease in fixed wireless services due to lower usage.
Fixed telecommunications services operating losses increased by Rp190.6, or 226.9%, from Rp84.0 billion in 2011 to Rp274.6 billion in 2012, mainly due to the decrease in fixed telecommunications services operating revenue of Rp228.5 billion, netted with the decrease in fixed telecommunications services operating expenses due to lower interconnection fees that we pay to overseas telecommunication operators.
B. LIQUIDITY AND CAPITAL RESOURCES
Our liquidity requirements have historically arisen from the need to finance investments and capital expenditures related to the expansion of our telecommunications business. Our telecommunications business requires substantial capital expenditures to construct and expand mobile and data network infrastructure and to fund operations, particularly during the network development stage. Although we have substantial existing network infrastructure, we expect to incur additional capital expenditures in order to focus cellular network development in areas that we anticipate to be high-growth areas, as well as to enhance the quality and coverage of our existing network.
We believe our current cash and cash equivalents, cash flow from operations and available sources of financing, as well as a portion of cash proceeds from the divestiture of our entire shareholding in TBIG in 2014, will be sufficient to meet our anticipated cash needs, including our cash needs for working capital and planned capital expenditures, for the foreseeable future. Nonetheless, if global or Indonesian economic conditions worsen, competition or product substitution accelerates beyond current expectations or the value of the Indonesian rupiah depreciates significantly against the U.S. dollar, our net cash flow from operating activities may decrease and the amount of required capital expenditures in Indonesian rupiah terms may increase, any of which may negatively impact our liquidity.
81
As of December 31, 2013, we had existing undrawn loan facilities in the amount of Rp700,0 billion and US$30.0 million which includes the following sources of unused liquidity:
| | • | | Rp450.0 billion under the unsecured revolving credit facility from PT Indonesia Infrastructure Finance and PT Sarana Multi Infrastruktur (Persero); |
| | • | | Rp250.0 billion under the unsecured revolving credit facility from PT Bank Sumitomo Mitsui Indonesia; and |
| | • | | US$30.0 million under the corporate facility from The Hongkong and Shanghai Banking Corporation Limited, Jakarta Branch (“HSBC Jakarta”). |
Cash Flows
The following table sets forth certain information regarding our historical cash flows:
| | | | | | | | | | | | | | | | |
| | | For the years ended December 31, | |
| | | 2011 | | | 2012 | | | 2013 | |
| | | Rp | | | Rp | | | Rp | | | US$ | |
| | | (Restated) | | | (Restated) | | | | | | | |
| | | (Rp in billions, US$ in millions) | |
Net cash flows: | | | | | | | | | | | | | | | | |
Provided by operating activities | | | 7,320.1 | | | | 6,989.4 | | | | 8,393.2 | | | | 688.6 | |
Used in investing activities | | | (6,037.9 | ) | | | (2,688.9 | ) | | | (9,068.0 | ) | | | (743.9 | ) |
Used in financing activities | | | (1,135.4 | ) | | | (2,647.5 | ) | | | (749.9 | ) | | | (61.5 | ) |
Net Foreign Exchange differences from cash and cash equivalents | | | 2.2 | | | | 40.0 | | | | (221.3 | ) | | | (18.2 | ) |
Net Cash Provided by Operating Activities
Net cash provided by operating activities amounted to Rp7,320.1 billion, Rp6,989.4 billion and Rp8,393.2 billion (US$688.6 million) for 2011, 2012 and 2013, respectively. In 2013, net cash provided by operating activities increased primarily due to an increase in cash received from customers.
Net Cash Used in Investing Activities
Net cash used in investing activities amounted to Rp6,037.9 billion, Rp2,688.9 billion and Rp9,068.0 billion (US$743.9 million) for 2011, 2012 and 2013, respectively. Net cash used in investing activities for 2011, 2012 and 2013 had been driven primarily by acquisitions of property and equipment, totaling Rp6,048.0 billion, Rp5,765.9 billion and Rp9,332.4 billion (US$765.6 million), respectively, as we expanded our network coverage and capacity and modernized our network equipment during those years. The property and equipment purchased consisted primarily of exchange and network assets, subscribers’ apparatus and other equipment and buildings and improvements to building leased property. In 2013, net cash used in investing activities increased primarily due to the leaseback of 2,500 telecommunication towers.
Net Cash Used in Financing Activities
Net cash used in financing activities amounted to Rp1,135.4 billion, Rp2,647.5 billion and Rp749.9 billion (US$61.5 million) in 2011, 2012 and 2013, respectively. Net cash used in financing activities in 2013 related primarily to our repayment of long term debt and bonds payable, which was partially offset by proceeds from short-term loans and long-term debt.
82
Principal Indebtedness
The following table sets forth our outstanding borrowings as of December 31, 2011, 2012 and 2013:
| | | | | | | | | | | | | | | | |
| | | As of December 31, | |
| | | 2011 | | | 2012 | | | 2013 | |
| | | Rp | | | Rp | | | Rp | | | US$ | |
| | | (Restated) | | | (Restated) | | | | | | | |
| | | (Rp in billions, US$ in millions) | |
Short term loan (net of unamortized issuance costs) | | | 1,499.3 | | | | 299.5 | | | | 1,499.8 | | | | 123.0 | |
Loans payable (net of unamortized issuance costs, unamortized consent fees, and current maturities) | | | 6,425.8 | | | | 3,703.8 | | | | 4,345.3 | | | | 356.5 | |
Bonds payable (net of unamortized issuance costs, unamortized discount, unamortized consent fees and current maturities) | | | 12,138.4 | | | | 13,986.5 | | | | 13,285.2 | | | | 1,089.9 | |
Current maturities of loans payable | | | 3,300.5 | | | | 2,669.2 | | | | 2,443.4 | | | | 200.5 | |
Current maturities of bonds payable | | | 42.0 | | | | 1,329.2 | | | | 2,356.3 | | | | 193.3 | |
For more information on the maturity profile of borrowings and committed borrowing facilities, see “—F. Tabular Disclosure of Contractual Obligations.”
The increase in short term loan (net of unamortized issuance cost) to Rp1,499.8 billion (US$123.0 million) as of December 31, 2013 from Rp299.5 billion as of December 31, 2012 was primarily due to drawdowns from our short-term credit facilities from Bank Mandiri and were utilized to finance short-term working capital in 2013. The increase in current maturities of bonds payable (net of unamortized issuance costs, unamortized discount, unamortized consent fees and current maturities) to Rp2,356.3 billion (US$193.3 million) as of December 31, 2013 from Rp1,329.2 billion as of December 31, 2012 was due to payment obligations under the Fifth Indosat Bonds, Seventh Indosat Bonds, Second Syari’ah Ijarah Bonds and Fourth Syari’ah Ijarah Bonds which will mature in 2014. The increase in loans payable (net of unamortized issuance cost, unamortized consent fee and current maturities) to Rp4,345.3 billion (US$356.5 million) as of December 31, 2013 from Rp3,703.8 billion as of December 31, 2012 was primarily due to drawdowns from our credit facilities from Bank Sumitomo Mitsui Indonesia, PT Indonesia Infrastructure Finance and PT Sarana Multi Infrastruktur (Persero) and PT Bank Central Asia Tbk (“BCA”) which were obtained in 2013, and were utilized to finance short-term working capital.
Because a portion of our liabilities are U.S. dollar-denominated, we are exposed to fluctuations in the Indonesian rupiah. Depreciation in the Indonesian rupiah and an increase in foreign exchange volatility exposed us to short-term accounting adjustments which impacted our financial ratios. To help address the impact of such currency fluctuations in 2009, we amended the debt to equity ratio covenants in all of our applicable debt instruments and agreements to increase the ratio from 1.75 to 2.50, in order to provide us with additional “cushion” in the event of adverse foreign exchange movements. We also amended the debt to equity ratio covenants in order to better reflect the effect of our hedging policies on this ratio, and amended the definitions of “Debt” and “Equity” in such debt instruments and agreements in order to provide additional headroom under these line items. The Guaranteed Notes due 2020 do not contain a debt to equity requirement.
As part of the amendments approved in 2009, we obtained consents to the following amendments to defined terms in certain of our applicable debt instruments and agreements: (i) excluding non-cash items, including foreign exchange gains or losses, from the definition of “EBITDA”; (ii) excluding interest-bearing procurement payables from the definition of “Debt” unless their maturities are in excess of six months from the invoice date; and (iii) including in “Equity” (a) minority interests, for entities the debt of which is 100% consolidated by us, and (b) subordinated shareholder loans.
While we believe that the foregoing amendments provide us with sufficient cushion in the event of volatility in the U.S. dollar—Indonesian rupiah exchange rates, we cannot assure you that further and more intense volatility than that experienced in the past 12 months will not occur, which could cause us to breach our financial covenants.
83
Set forth below are calculations of our historical financial ratios that are contained in our financial covenants under IFAS as required by our debt agreements.
| | | | | | | | | | | | | | | | | | | | |
| | | | | | As of and for the years ended December 31, | |
| | | Ratio Required | | | 2011 | | | 2012 | | | 2013 | |
| | | | | | Rp | | | Rp | | | Rp | | | US$ | |
| | | | | | (Restated) | | | | | | | | | | |
| | | | | | (Rp in billions, US$ in millions) | |
Financial Position and Comprehensive Income Data: | | | | | | | | | | | | | | | | | | | | |
Short term loan | | | | | | | 1,499.3 | | | | 299.5 | | | | 1,499.8 | | | | 123.0 | |
Current maturities from: | | | | | | | | | | | | | | | | | | | | |
Loans payable | | | | | | | 3,300.5 | | | | 2,669.2 | | | | 2,443.4 | | | | 200.5 | |
Bonds payable | | | | | | | 42.0 | | | | 1,329.2 | | | | 2,356.3 | | | | 193.3 | |
Loans payable—net of current maturities: | | | | | | | | | | | | | | | | | | | | |
Related party | | | | | | | — | | | | — | | | | — | | | | — | |
Third parties | | | | | | | 6,425.8 | | | | 3,703.8 | | | | 4,345.3 | | | | 356.5 | |
Bonds payable—net of current maturities | | | | | | | 12,138.4 | | | | 13,986.5 | | | | 13,285.2 | | | | 1,089.9 | |
Unamortized issuance cost, consent solicitation fees and discounts | | | | | | | 266.1 | | | | 235.2 | | | | 181.8 | | | | 15.0 | |
| | | | | | | | | | | | | | | | | | | | |
Total Debt(1) | | | | | | | 23,672.1 | | | | 22,223.4 | | | | 24,111.8 | | | | 1,978.2 | |
| | | | | | | | | | | | | | | | | | | | |
Total Assets | | | | | | | 53,233.0 | | | | 55,225.1 | | | | 54,520.9 | | | | 4,473.0 | |
Total Liabilities | | | | | | | 34,263.9 | | | | 35,829.7 | | | | 38,003.3 | | | | 3,117.8 | |
Total Equity(2) | | | | | | | 18,969.1 | | | | 19,395.4 | | | | 16,517.6 | | | | 1,355.1 | |
Operating Profit | | | | | | | 3,164.3 | | | | 3,189.9 | | | | 1,509.2 | | | | 123.8 | |
Depreciation and Amortization | | | | | | | 6,558.2 | | | | 8,272.8 | | | | 8,958.4 | | | | 735.0 | |
EBITDA(3) | | | | | | | 9,664.0 | | | | 10,540.0 | | | | 10,376.0 | | | | 851.3 | |
Interest Expense(4) | | | | | | | 1,700.1 | | | | 1,709.9 | | | | 1,697.7 | | | | 139.3 | |
| | | | | |
Financial Ratios: | | | | | | | | | | | | | | | | | | | | |
Debt to Equity ratio(5) | | | <2.50x | | | | 1.25x | | | | 1.15x | | | | 1.46x | | | | 1.46x | |
Debt to EBITDA ratio(6) | | | <3.50x | | | | 2.45x | | | | 2.11x | | | | 2.32x | | | | 2.32x | |
EBITDA to Interest Expense ratio(7) | | | >3.00x | | | | 5.68x | | | | 6.16x | | | | 6.11x | | | | 6.11x | |
| (1) | We define total debt as total loans payable and bonds payable (current and non-current maturities), unamortized issuance cost (loans, bonds and notes), unamortized consent solicitation fees (loans and bonds) and unamortized discounts (loans and notes). According to the amended definition, “Debt” means, with respect to any person on any date of determination (without duplication): |
| | (a) | the principal of and premium (if any) in respect of debt of such person for money borrowed and debt evidenced by notes, debentures, bonds or other similar instruments for the payment of which such person is responsible or liable which in any such case, bears interest or on which interest accrues; and |
| | (b) | all obligations of such person in relation to procurement payables constituting accounts payable to such person’s suppliers which bear interest or on which interest accrues and payment for such accounts payable is due more than six months after the relevant invoice date, but, in relation to any member of our Company or our subsidiaries (together the “Group”), or the Group, deducting all indebtedness advanced by any (direct or indirect) shareholder of our Company to such member of the Group which is subordinated to any indebtedness falling under paragraph (a) above or this paragraph (b). |
| (2) | We define equity as total equity and minority interest. According to the amended definition, “Equity” means total assets less total liabilities, where total liabilities exclude all indebtedness advanced by any (direct or indirect) shareholder of our Company to any member of the Group which is subordinated to any Debt. |
| (3) | We have defined EBITDA as earnings before interest, amortization of goodwill, non-operating income and expense, income tax expense, depreciation and minority interest in net income of subsidiaries as reported in the consolidated financial statements prepared under IFAS. EBITDA is not a standard measure under either IFAS or IFRS. As the telecommunications business is capital intensive, capital expenditure requirements |
84
| | and levels of debt and interest expenses may have a significant impact on the net income of companies with similar operating results. Therefore, we believe that EBITDA provides a useful reflection of our operating results and that profit (loss) attributable to owner of the Company under IFRS is the most directly comparable financial measure to EBITDA as an indicator of our operating performance. You should not consider our definition of EBITDA in isolation or as an indicator of operating performance, liquidity or any other standard measure under either IFAS or IFRS, or other companies’ definition of EBITDA. Our definition of EBITDA does not account for taxes and other non-operating cash expenses. Funds depicted by this measure may not be available for debt service due to covenant restrictions, capital expenditure requirements and other commitments. According to the amended definition, “EBITDA” means, for any period, an amount equal to the sum of operating income (calculated before financing costs, taxes, non-operating income or expenses and extraordinary and exceptional items) plus depreciation and amortization and, in the case of any testing or calculation of the ratio of aggregate Debt of the Group, to EBITDA of the Group after giving pro forma effect to any material acquisition or disposal of assets or businesses as if such acquisition or disposal had occurred on the first day of such period. The following table reconciles our net income under IFAS to our definition of EBITDA for the periods indicated: |
| | | | | | | | | | | | | | | | |
| | | For the years ended December 31, | |
| | | 2011 | | | 2012 | | | 2013 | |
| | | Rp | | | Rp | | | Rp | | | US$ | |
| | | (Restated) | | | | | | | | | | |
| | | (Rp in billions, US$ in millions) | |
EBITDA under IFAS | | | 9,664.0 | | | | 10,540.0 | | | | 10,376.0 | | | | 851.3 | |
Amortization of goodwill | | | — | | | | — | | | | — | | | | — | |
Interest income | | | 92.6 | | | | 133.5 | | | | 107.2 | | | | 8.8 | |
Financing cost | | | (1,929.3 | ) | | | (2,077.4 | ) | | | (2,212.1 | ) | | | (181.5 | ) |
Gain on change in fair value of derivatives—net | | | 58.0 | | | | 5.0 | | | | 273.3 | | | | 22.4 | |
Others—net | | | (32.3 | ) | | | 878.0 | | | | (133.0 | ) | | | (10.9 | ) |
Gain (loss) on foreign exchange—net | | | 36.7 | | | | (744.7 | ) | | | (2,786.9 | ) | | | (228.6 | ) |
Income tax benefit (expense)—net | | | (264.6 | ) | | | 25.8 | | | | 667.4 | | | | 54.8 | |
Depreciation and amortization | | | (6,558.2 | ) | | | (8,272.8 | ) | | | (8,958.4 | ) | | | (735.0 | ) |
Loss attributable to non controlling interest | | | (98.1 | ) | | | (112.3 | ) | | | (115.5 | ) | | | (9.5 | ) |
| | | | | | | | | | | | | | | | |
Profit (loss) for the year attributable to owners of the Company under IFAS | | | 968.7 | | | | 375.1 | | | | (2,782.0 | ) | | | (228.2 | ) |
| | | | | | | | | | | | | | | | |
The following table reconciles our EBITDA under IFAS to IFRS for the periods indicated:
| | | | | | | | | | | | | | | | |
| | | For the years ended December 31, | |
| | | 2011 | | | 2012 | | | 2013 | |
| | | Rp | | | Rp | | | Rp | | | US$ | |
| | | (Restated) | | | (Restated) | | | | | | | |
| | | (Rp in billions, US$ in millions) | |
EBITDA under IFAS | | | 9,664.0 | | | | 10,540.0 | | | | 10,376.0 | | | | 851.3 | |
Deferred connection fees | | | 2.4 | | | | 1.8 | | | | 0.6 | | | | 0.0 | |
Pension cost adjustment | | | 83.2 | | | | 17.0 | | | | (6.8 | ) | | | (0.6 | ) |
EBITDA under IFRS* | | | 9,749.6 | | | | 10,558.8 | | | | 10,369.8 | | | | 850.7 | |
| * | See “Item 3: Key Information—Selected Financial and Other Data” for reconciliation of our EBITDA under IFRS to our profit (loss) attributable to owners of the Company under IFRS. |
| (4) | “Interest Expense” means, for any period, interest expense on Debt. |
| (5) | Using IFRS results, as of December 31, 2011, 2012 and 2013, Total Debt would be Rp23,672.1 billion, Rp22,223.4 billion and Rp24,111.8 billion (US$1,978.2 million), respectively, and Total Equity would be Rp19,206.4 billion, Rp19,389.0 billion and Rp17,174.0 billion (US$1,409.0 million), respectively, resulting in a Debt to Equity ratio of 123%, 115% and 140%, respectively. |
85
| (6) | Using IFRS results, Total Debt would be Rp23,672.1 billion, Rp22,223.4 billion and Rp24,111.8 billion (US$1,978.2 million) as of December 31, 2011, 2012 and 2013, respectively, and EBITDA would be Rp9,749.6 billion, Rp10,558.8 billion and Rp10,369.8 billion (US$850.7 million) for the year ended December 31, 2011, 2012 and 2013, respectively, resulting in a Debt to EBITDA ratio of 243%, 210% and 233% as of December 31, 2011, 2012 and 2013, respectively. |
| (7) | Using IFRS results, EBITDA would be Rp9,749.6 billion, Rp10,558.8 billion and Rp10,369.8 billion (US$850.7 million) for the year ended December 31, 2011, 2012 and 2013, respectively, and Interest Expense would be Rp1,700.1 billion, Rp1,709.9 billion and Rp1,697.7 billion (US$139.3 million), respectively, resulting in an EBITDA to Interest Expense ratio of 573%, 617% and 611% as of December 31, 2011, 2012 and 2013, respectively. |
From time to time, we may repurchase a portion of our debt securities through open-market transactions based on general market conditions.
The following table summarizes our primary long-term indebtedness (including short-term loans) and bonds payable as of December 31, 2011, 2012 and 2013.
| | | | | | | | | | | | | | | | |
| | | As of December 31, | |
| | | 2011 | | | 2012 | | | 2013 | |
| | | Rp | | | Rp | | | Rp | | | US$ | |
| | | (Restated) | | | (Restated) | | | | | | | |
| | | (Rp in billions, US$ in millions) | |
Bonds Payable: | | | | | | | | | | | | | | | | |
Guaranteed Notes Due 2020—net of unamortized discount and unamortized notes issuance cost | | | 5,809.6 | | | | 6,188.9 | | | | 7,838.3 | | | | 643.1 | |
Eighth Indosat Bonds—net of unamortized bonds issuance cost | | | — | | | | 2,691.5 | | | | 2,692.3 | | | | 220.9 | |
Fifth Indosat Bonds—net of unamortized bonds issuance cost | | | 2,590.9 | | | | 2,592.9 | | | | 2,595.3 | | | | 212.9 | |
Seventh Indosat Bonds—net of unamortized bonds issuance cost | | | 1,295.6 | | | | 1,296.6 | | | | 1,297.8 | | | | 106.5 | |
Sixth Indosat Bonds—net of unamortized bonds issuance cost | | | 1,076.4 | | | | 1,078.4 | | | | 319.3 | | | | 26.2 | |
Third Syari’ah Ijarah Bonds—net of unamortized bonds issuance cost and consent solicitation fees | | | 568.5 | | | | 569.6 | | | | — | | | | — | |
Second Syari’ah Ijarah Bonds—net of unamortized bonds issuance cost and consent solicitation fees | | | 398.9 | | | | 399.3 | | | | 399.8 | | | | 32.8 | |
Fifth Syari’ah Ijarah Bonds—net of unamortized bonds issuance cost and consent solicitation fees | | | — | | | | 299.1 | | | | 299.2 | | | | 24.5 | |
Fourth Syari’ah Ijarah Bonds—net of unamortized bonds issuance cost | | | 199.2 | | | | 199.4 | | | | 199.5 | | | | 16.3 | |
Second Indosat Bonds—net of unamortized consent solicitation fees | | | 199.3 | | | | — | | | | — | | | | — | |
Limited Bonds II issued by Lintasarta | | | 25.0 | | | | — | | | | — | | | | — | |
Limited Bonds I issued by Lintasarta | | | 17.0 | | | | — | | | | — | | | | — | |
Total bonds payable | | | 12,180.4 | | | | 15,315.7 | | | | 15,641.5 | | | | 1,283.2 | |
Less current maturities—net of unamortized bonds issuance cost and consent solicitation fees | | | 42.0 | | | | 1,329.2 | | | | 2,356.3 | | | | 193.3 | |
| | | | | | | | | | | | | | | | |
Bonds Payable: Non-current portion | | | 12,138.4 | | | | 13,986.5 | | | | 13,285.2 | | | | 1,089.9 | |
| | | | | | | | | | | | | | | | |
Loans Payable (including short term loans): | | | | | | | | | | | | | | | | |
Related Party—net of unamortized debt issuance cost and consent solicitation fees | | | 2,498.1 | | | | 299.5 | | | | 1,499.8 | | | | 123.0 | |
Third parties—net of unamortized debt issuance cost and consent solicitation fee and unamortized debt discount | | | 8,727.5 | | | | 6,373.0 | | | | 6,788.6 | | | | 557.0 | |
| | | | | | | | | | | | | | | | |
Total loans payable | | | 11,225.6 | | | | 6,672.5 | | | | 8,288.4 | | | | 680.0 | |
Less current maturities | | | 4,799.8 | | | | 2,968.7 | | | | 3,943.1 | | | | 323.5 | |
| | | | | | | | | | | | | | | | |
Loans payable: Non-current portion | | | 6,425.8 | | | | 3,703.8 | | | | 4,345.3 | | | | 356.5 | |
| | | | | | | | | | | | | | | | |
86
Indosat Bonds
The specific terms of each of our Second Indosat Bonds, Fifth Indosat Bonds, Sixth Indosat Bonds, Seventh Indosat Bonds and Eighth Indosat Bonds (the “Indosat Bonds”), are discussed below. The Indosat Bonds are not secured by any specific assets or guaranteed by other parties and rankpari passu with our other unsecured debt. We agreed to certain covenants in connection with the issuance of the Indosat Bonds, including but not limited to agreeing to maintain:
| | • | | equity capital of at least Rp5,000.0 billion; |
| | • | | a ratio of total debt to EBITDA of less than 3.5 to 1.0, as reported in each annual consolidated financial report, except for the Eighth Indosat Bonds in connection with the issuance of which we agreed to maintain the ratio of total net debt to EBITDA of less than 4.0 to 1.0; |
| | • | | a debt to equity ratio of 2.5 to 1.0, as reported in each quarterly consolidated financial report, except for the Eighth Indosat Bonds in connection with the issuance of which we agreed to maintain the ratio of total net debt to equity of 2.5 to 1.0; and |
| | • | | a ratio of EBITDA to interest expense, as reported in each annual consolidated financial report of at least 3.0 to 1.0. On March 24, 2009, we held meetings with holders of our Indonesian rupiah-denominated bonds, including holders of our Indosat Bonds, and obtained consents to amend the definitions of “Debt” and “EBITDA,” to include new definitions for “Equity” and “Group” and to change the applicable ratio of Debt to Equity from 1.75 to 1.0 to 2.5 to 1.0 in the trustee agreement governing these bonds, pursuant to the terms of the deed of amendment for the Second, Fifth and Sixth Indosat Bonds. |
Second Indosat Bonds. On November 6, 2002, we issued our Indosat Bonds II (the “Second Indosat Bonds”), with fixed and/or floating rates, of which there are no more outstanding series as of December 31, 2013. The Series B bonds, with an original face value of Rp200.0 billion, bore interest at a fixed rate of 16.0% per annum and were payable quarterly for 30 years beginning February 6, 2003. We had the right to redeem the Series B bonds, in whole but not in part, on each of the 10th, 15th, 20th and 25th anniversaries of the issuance of the Series B bonds at a price equal to 101% of the Series B bonds’ nominal value. Holders of the Series B bonds had a put right that allowed such holders to demand early repayment from us at a price equal to 100% of the Series B bonds’ nominal value at (i) any time, if the rating of such bonds was reduced to “AA-” or lower or (ii) upon the occurrence of any of the 15th, 20th and 25th anniversaries of the issuance of the Series B bonds. The maturity date of the Series B bonds was November 6, 2032. On November 6, 2012, we exercised our right to redeem in full the remaining outstanding aggregate principal amount of Second Indosat Bonds at the redemption price of 101%.
Fifth Indosat Bonds.On May 29, 2007, we issued our Indosat Bonds V (the “Fifth Indosat Bonds”), in two series with a total face value of Rp2,600.0 billion. The Series A bonds, which have a face value of Rp1,230.0 billion, will mature on May 29, 2014 and the Series B bonds, which have a face value of Rp1,370.0 billion, will mature on May 29, 2017. The Series A bonds bear interest at a fixed rate of 10.20% per annum and the Series B bonds bear interest at a fixed rate of 10.65% per annum. After the first anniversary of the issuance of the bonds, we have the right to buy back part or all of the bonds at the market price, either temporarily or for the purpose of early settlement.
Sixth Indosat Bonds.On April 9, 2008, we issued our Indosat Bonds VI (the “Sixth Indosat Bonds”), in two series with a total face value of Rp1,080.0 billion, the only outstanding series of which are the Series B bonds. The Series A bonds, which had a face value of Rp760.0 billion, had a maturity date of April 9, 2013 and the Series B bonds, which have a face value of Rp320.0 billion will mature on April 9, 2015. The Series A bonds bore interest at a fixed rate of 10.25% per annum and the Series B bonds bear fixed interest rate of 10.80% per annum. After the first anniversary of the issuance of the bonds, we have the right to buy back part or all of the bonds at market price, either temporarily or for the purpose of early settlement. On April 9, 2013, the Series A Sixth Indosat Bonds were paid in full.
87
Seventh Indosat Bonds. On December 8, 2009, we issued our Indosat Bonds VII (the “Seventh Indosat Bonds”), in two series with a total face value of Rp1,300.0 billion. The Series A bonds, which have a face value of Rp700.0 billion, will mature on December 8, 2014 and the Series B bonds, which have a face value of Rp600.0 billion, will mature on December 8, 2016. The Series A bonds bear interest at a fixed rate of 11.25% per annum and the Series B bonds bear interest at a fixed rate of 11.75% per annum. After the first anniversary of the issuance of the bonds, we have the right to buy back part or all of the bonds at market price, either temporarily or for the purpose of early settlement.
Eighth Indosat Bonds. On June 28, 2012, we issued our Indosat Bonds VIII (the “Eighth Indosat Bonds”), in two series with a total face value of Rp2,700.0 billion. The Series A bonds, which have a face value of Rp1,200.0 billion, will mature on June 27, 2019 and the Series B bonds, which have a face value of Rp1,500.0 billion, will mature on June 27, 2022. The Series A bonds bear interest at a fixed rate of 8.625% per annum and the Series B bonds bear interest at a fixed rate of 8.875% per annum. After the first anniversary of the issuance of the bonds, we have the right to buy back part or all of the bonds at market price, either temporarily or for the purpose of early settlement.
Guaranteed Notes Due 2020
On July 29, 2010 we, through Indosat Palapa Company B.V. (“Indosat Palapa”), issued our Guaranteed Notes due 2020 with a total face value of US$650.0 million. The notes were issued at 99.478% of their principal amount and mature on July 29, 2020. The notes bear interest at the fixed rate of 7.375% per annum payable in semi-annual installment due on January 29 and July 29 of each year, commencing January 29, 2011. The notes will be redeemable at the option of Indosat Palapa, in whole or in part, at any time on or after July 29, 2015 at prices equal to 103.6875%, 102.4583%, 101.2292% and 100% of the principal amount during the 12-month period commencing July 29, 2015, 2016, 2017 and 2018 and thereafter, respectively, plus accrued and unpaid interest and additional amounts, if any. In addition, prior to July 29, 2013, Indosat Palapa was entitled to redeem up to a maximum of 35% of the original aggregate principal amount, with the proceeds of one or more public equity offerings of us at a price equal to 107.375% of the principal amount thereof, plus accrued and unpaid interest and additional amounts, if any. The notes are also redeemable at option of Indosat Palapa or us, in whole but not in part, at any time, at a price equal to 100% of principal amount thereof, plus any accrued and unpaid interest to (but not including) the redemption date any additional amounts, in the event of certain changes effecting withholding taxes in Indonesia and the Netherlands. Upon a change in control of our Company (including sale, transfer, assignment, lease, conveyance or other disposition of all or substantially all of our assets), holders of the notes have the right to require Indosat Palapa to repurchase all or any part of such holders’ notes at a purchase price equal to 101% of principal amount thereof, plus accrued and unpaid interest and additional amounts, if any, to the purchase date.
The net proceeds, after deducting the underwriting fees and offering expenses, were received on July 29, 2010 and used (i) to fund the purchase of the outstanding guaranteed notes due 2010 and guaranteed notes due 2012 and any consent solicitation relating to, or redemption of, such notes and (ii) to refinance part of our other existing indebtedness. The notes are unconditionally and irrevocably guaranteed by our Company.
Based on the notes indenture, we are required to comply with certain conditions, such as maintaining certain financial ratios. On June 5, 2012, Indosat Palapa amended the indenture governing the Guaranteed Notes due 2020 in accordance with the consent solicitation statement and related materials, dated May 21, 2012, upon its receipt and acceptance of the requisite number of consents from holders of record of the notes. On February 7, 2012, Indosat entered into an Asset Purchase Agreement with PT Tower Bersama Infrastructure Tbk and its subsidiary, PT Solusi Menara Indonesia, for the sale and leaseback of 2,500 wireless telecommunications towers. The amendments amended the existing exceptions in the indenture governing the Guaranteed Notes due 2020 with respect to qualified tower sales to permit Indosat to consummate the transactions contemplated by the Asset Purchase Agreement and add additional exceptions for dispositions of active infrastructure assets, such as fiber, transmission equipment and radio access network, to joint venture entities with which Indosat may enter into network sharing arrangements, without seeking the consent of holders.
88
Syari’ah Ijarah Bonds (Sukuk Ijarah)
The specific terms of each of our Second Syari’ah Ijarah Bonds, Third Syari’ah Ijarah Bonds, Fourth Syari’ah Ijarah Bonds and Fifth Syari’ah Ijarah Bonds (the “Syari’ah Ijarah Bonds”), are discusses below. The Syari’ah Ijarah Bonds are not secured by any specific assets or guaranteed by other parties and rankpari passuwith our other unsecured debt.
In connection with the issuance of the Syari’ah Ijarah Bonds, we agreed to maintain certain covenants which are similar to the covenants contained in our Indosat Bonds. In addition, we are also prohibited from performing activities which contravene Syari’ah principles. Aside from these prohibitions, there are no material differences in the covenants between the Syari’ah Ijarah Bonds and the Indosat Bonds. On March 24, 2009, we held meetings with holders of our Indonesian rupiah-denominated bonds, including holders of our Syari’ah Ijarah Bonds, and obtained consents to amend to the definitions of “Debt” and “EBITDA,” to add new definitions for “Equity” and “Group” and to change the ratio of Debt to Equity from 1.75 to 1 to 2.5 to 1 in the trustee agreement governing these bonds.
Second Syari’ah Ijarah Bonds. On May 29, 2007, we issued our Sukuk Ijarah Indosat II (the “Second Syari’ah Ijarah Bonds”), which contain terms customary for Islamic financing facilities, with Bank Rakyat Indonesia acting as trustee. The Second Syari’ah Ijarah Bonds have a total face value of up to Rp400.0 billion and mature in May 29, 2014. Holders of the Second Syari’ah Ijarah Bonds receive an Ijarah installment fee, payable on a quarterly basis. The total Ijarah installment fee to be paid to the holders of the Second Syari’ah Ijarah Bonds is Rp40.8 billion per annum. After the first anniversary of issuance of the Second Syari’ah Ijarah Bonds, we have the right to buyback part or all of such bonds at the then-prevailing market price.
Third Syari’ah Ijarah Bonds. On April 9, 2008, we issued our Sukuk Ijarah Indosat III (the “Third Syari’ah Ijarah Bonds”), which contained terms customary for Islamic financing facilities, with Bank Rakyat Indonesia acting as trustee. The Third Syari’ah Ijarah Bonds had a total face value of up to Rp570.0 billion and matured on April 9, 2013. Holders of the Third Syari’ah Ijarah Bonds received an Ijarah installment fee, payable on a quarterly basis. The total Ijarah installment fee expected to be paid to the holders of the Third Syari’ah Ijarah Bonds was Rp58.4 billion per annum. After the first anniversary of the issuance of the Third Syari’ah Ijarah Bonds, we had the right to buyback part or all of such bonds at the then-prevailing market price. On April 9, 2013, these bonds were paid in full.
Fourth Syari’ah Ijarah Bonds. On December 8, 2009, we issued our Sukuk Ijarah Indosat IV (the “Fourth Syari’ah Ijarah Bonds”), which contain terms customary for Islamic financing facilities, with Bank Rakyat Indonesia acting as trustee. The Fourth Syari’ah Ijarah Bonds have a total face value of Rp200.0 billion. The Series A Syari’ah Ijarah Bonds, which have a face value of Rp28.0 billion, will mature on December 8, 2014 and the Series B Syari’ah Ijarah Bonds, which have a face value of Rp172.0 billion, will mature on December 8, 2016. Holders of the Fourth Syari’ah Ijarah Bonds receive an Ijarah installment fee, payable on a quarterly basis. The total Ijarah installment fee expected to be paid to the holders of the Fourth Syari’ah Ijarah Bonds is Rp3.2 billion per annum for the Series A Fourth Syari’ah Ijarah Bonds and Rp20.2 billion per annum for the Series B Fourth Syari’ah Ijarah Bonds. After the first anniversary of the issuance of the Fourth Syari’ah Ijarah Bonds, we have the right to buyback part or all of such bonds at the then-prevailing market price.
Fifth Syari’ah Ijarah Bonds. On June 28, 2012, we issued our Sukuk Ijarah Indosat V (the “Fifth Syari’ah Ijarah Bonds”), which contain terms customary for Islamic financing facilities, with Bank Rakyat Indonesia acting as trustee. The Fifth Syari’ah Ijarah Bonds have a total face value of up to Rp300.0 billion and will mature on June 27, 2019. Holders of the Fifth Syari’ah Ijarah Bonds receive an Ijarah installment fee, payable on a quarterly basis. The total Ijarah installment fee expected to be paid to the holders of the Fifth Syari’ah Ijarah Bonds is Rp25.9 billion per annum. After the first anniversary of the issuance of the Fifth Syari’ah Ijarah Bonds, we have the right to buyback part or all of such bonds at the then-prevailing market price.
89
Goldman Sachs International (“GSI”) Loan Facility
On May 30, 2007, we received from GSI a loan amounting to Rp434.3 billion, which was received in U.S. dollars amounting to US$50.0 million, for the purchase of telecommunications equipment. The loan matured on May 30, 2013. The loan bore interest at a fixed annual rate of 8.75%, which is payable quarterly every February 28, May 30, August 30 and November 30, commencing August 30, 2007, up to May 30, 2013. We fully repaid the principal and interest of this facility on May 30, 2013.
The loan agreement provided an option for GSI to convert the loan into a U.S. dollar loan of US$50.0 million on May 30, 2012 (the “Conversion Option”). The fair value of the Conversion Option was presented as part of long-term debt. On May 30, 2012, GSI exercised the Conversion Option to convert the loan into a U.S. dollar loan of US$50.0 million as a result of which the loan bears interest at the fixed annual rate of 6.45% on the principal amount of US$50.0 million.
We were required to notify GSI regarding of certain events which could result in loan termination, such as (i) certain changes affecting withholding taxes in the United Kingdom or Indonesia, (ii) default under our guaranteed notes due 2012, (iii) default under any notes issued or guaranteed by us where the settlement is in U.S. dollars or default under any notes issued or guaranteed by us where the settlement is in Indonesian rupiah, (iv) redemption, purchase or cancellation of the guaranteed notes due 2012 and there being no other U.S. dollar indebtedness outstanding upon such redemption, purchaser or cancellation and (v) a change of control. On June 24, 2008, GSI waived its rights to terminate the loan as a result of the change of control triggered by Ooredoo’s acquisition of a 40.81% interest in our issued and outstanding share capital in June 2008.
BCA Loan Facilities
On August 28, 2007, we obtained a five-year Rp1,600.0 billion unsecured credit facility from BCA for the repayment of a syndicated loan facility and the purchase of telecommunications equipment. The loan bore (i) fixed annual interest rates for the first two years (9.75% on the first year and 10.5% on the second year) and (ii) floating interest rates for the remaining years based on the prevailing annual rate of 3-month JIBOR plus 1.5% per annum; all interest is payable quarterly. On September 20, 2007, we obtained an additional credit facility of Rp400.0 billion from BCA. As a result, the aggregate principal amount under our credit facility with BCA became Rp2,000.0 billion. The repayment of the loan drawdowns were to be made annually, as follows: (a) 10.0% of the total loan drawdowns in the first and second years after the first drawdown; (b) 15.0% of the total loan drawdowns in the third and fourth years after the first drawdown; and (c) 50.0% of the total loan drawdowns in the fifth year after the first drawdown. On September 27, October 26 and December 27, 2007, we made the first, second and third loan drawdowns totaling Rp2,000.0 billion. Under the loan agreement, we had agreed to maintain certain covenants, which were similar to the covenants contained in the Indosat Bonds. On February 12, 2009, we amended our five-year BCA credit facility agreement, based on the consent letter received on February 6, 2009, to change the definitions of “EBITDA,” to insert definitions for “Debt,” “Equity” and “Group” and to change the ratio of Debt to Equity from 1.75 to 1 to 2.5 to 1 in the loan agreement governing this loan facility. On September 27, 2008, September 25, 2009, September 27, 2010, and September 27, 2011, we paid the first, second, third and fourth semi-annual installment amounting to Rp200.0 billion, Rp200.0 billion, Rp300.0 billion and Rp300.0 billion, respectively. On September 27, 2012, we repaid in full the remaining outstanding amount under this facility amounting to Rp1,000.0 billion.
On February 10, 2011, we entered into a credit agreement with BCA for a revolving credit facility with a maximum principal amount of Rp1,000.0 billion to fund our capital expenditures and general corporate expenditures. This facility was available from February 10, 2011 to February 10, 2014. On December 1, 2011, we entered into an amendment to our credit agreement with BCA to (i) increase the total principal amount available under the revolving credit facility to Rp1,500.0 billion, (ii) change the interest rate for drawdowns to1-month JIBOR plus 1.25% per annum, from 1-month JIBOR plus 1.40% per annum, and (iii) to provide that the maturity date of loans made under the revolving credit facility shall be no later than February 10, 2014. On
90
February 25, 2014, agreed to extend the maturity date of this facility to February 10, 2015. The interest rate under this facility is subject to review based on current economic conditions. During 2013, the interest rate was adjusted three times, to 1-month JIBOR plus 1.50% on July 26, 2013, to 1-month JIBOR plus 1.75% on August 26, 2013 and to 1-month JIBOR plus 2.00% per annum on December 26, 2013. On February 28, 2014, the interest rate under this facility was adjusted to1-month JIBOR plus 2.25% per annum. Based on the credit agreement, we are required to comply with certain covenants, such as maintaining certain financial ratios. On June 17, 2011, we made our first drawdown of Rp500.0 billion and on July 15, 2011, we repaid Rp300.0 billion of the loan. On December 9, 2011, we made a drawdown of the remaining Rp1,300.0 billion available under the facility. On February 17, 2012 and March 17, 2012, we repaid an amount of Rp200.0 billion each. On March 30, 2012 and June 21, 2012, we made drawdowns of Rp200.0 billion and Rp400.0 billion, respectively. On May 30, 2012, June 29, 2012, July 5, 2012 and August 2, 2012, we repaid outstanding amounts of Rp200.0 billion, Rp200.0 billion, Rp650.0 billion and Rp650.0 billion, respectively. On September 26, 2012, September 28, 2012, December 12, 2012 and December 26, 2012, we made drawdowns of Rp200,0 billion, Rp500.0 billion, Rp150.0 billion and Rp150.0 billion, respectively. On January 28, 2013 and February 19, 2013, we repaid an amount of Rp300.0 billion each. On April 5, 2013 and June 26, 2013, we made drawdowns of Rp500.0 billion and Rp600.0 billion, respectively.
On July 15, 2013, we entered into an amendment to our revolving credit agreement with BCA to obtain a five-year unsecured investment credit facility with a maximum principal amount of Rp1,000.0 billion for capital expenditure, general corporate expenditures and refinancing purposes. This facility is available for six months after the signing date and matures on December 12, 2018. The initial coupon was 8.70% which is subject to review based on current economic conditions. The interest rate was increased several times to 9.00% on August 26, 2013 and to 9.25% on September 26, 2013, to 9.50% on December 26, 2013 and to 9.75% on February 28, 2014. On December 12, 2013, we made a full drawdown of the facility. The repayment of the loan drawdowns will be made annually, as follows: (i) 10.0% of the total loan drawdowns in the first year after the drawdown date of the agreement, (ii) 10.0% of the total loan drawdowns on the first year after the first repayment date, (iii) 15.0% of the total loan drawdowns on the second and third years after the first repayment date, respectively, and (iv) 50.0% of the total loan drawdowns on the fourth year of the first repayment date.
PT Bank Mandiri (Persero) Tbk (“Bank Mandiri”) Loan Facilities
On September 18, 2007, we obtained a five-year unsecured credit facility from Bank Mandiri amounting to Rp2,000.0 billion for the purchase of telecommunications equipment. The loan bore interest at (i) fixed annual rates for the first two years (9.75% on the first year and 10.5% on the second year), and (ii) floating rates for the remaining years based on the prevailing annual rate of average 3-month JIBOR plus 1.5% per annum; all interest were payable quarterly. The repayment of the loan drawdowns were to be made annually, as follows: (a) 10.0% of the total loan drawdowns in the first and second years after the first drawdown; (b) 15.0% of the total loan drawdowns in the third and fourth years after the first drawdown; and (c) 50.0% of the total loan drawdowns in the fifth year after the signing date of the agreement. On September 27 and December 27, 2007, we made the first and second loan drawdowns totaling Rp2,000.0 billion. Based on the loan agreement, we have agreed to certain covenants, including maintaining certain financial ratios. On September 27, 2008, September 25, 2009, September 27, 2010 and September 27, 2011, we paid the first, second, third and fourth annual installments, amounting to Rp200.0 billion, Rp200 billion, Rp300 billion and Rp300.0 billion, respectively. On March 23, 2009, we entered into an agreement with Bank Mandiri to amend the definitions of “EBITDA,” to insert new definitions for “Debt,” “Equity” and “Group” and to change the ratio of Debt to Equity in the loan agreement governing this loan facility. On September 14, 2012, we repaid in full the remaining outstanding amount under this facility amounting to Rp1,000.0 billion.
On June 21, 2011, we entered into a credit agreement providing for a three-year unsecured revolving credit facility from Bank Mandiri in a maximum principal amount of Rp1,000.0 billion for working capital, capital expenditures and refinancing purposes. On December 5, 2011, we entered into an amendment of the credit agreement with Bank Mandiri to (i) increase the maximum amount available under the loan facility to
91
Rp1,500.0 billion and (ii) change the interest rate for drawdowns to 1-month JIBOR plus 1.25% per annum, from 1-month JIBOR plus 1.40% per annum. The interest rate of this facility is subject to review based on current economic conditions. On July 12, 2013, the interest rate was adjusted to 1-month JIBOR plus 1.75% per annum and on January 12, 2014, the interest rate was increased to 1-month JIBOR plus 2.0% per annum. This facility is available from June 21, 2011 to June 20, 2014. Each drawdown under this facility has a term of three months, which may be extended a further three months upon the submission of a written application for such an extension by Indosat to Bank Mandiri. Based on the credit agreement, we are required to comply with certain covenants, such as maintaining certain financial ratios.
On August 2, 2011, we made our first drawdown of Rp300.0 billion and on December 14, 2011, we made a drawdown of the remaining Rp1,200.0 billion available under the facility. On February 2, 2012, we repaid an amount of Rp200.0 billion outstanding under this facility. On March 28, 2012, we made a drawdown of Rp200.0 billion. On May 14, 2012, we repaid an amount of Rp200.0 billion outstanding under this facility. On June 21, 2012, we made a drawdown of Rp.200.0 billion. On June 29, 2012, July 5, 2012 and August 2, 2012, we repaid an amount of Rp200.0 billion, Rp650.0 billion and Rp650.0 billion, respectively. On December 12, 2012 and December 26, 2012, we made a drawdown of Rp150,0 billion each.
On January 15, 2013, we repaid an amount of Rp100.0 billion outstanding under this facility. On April 5, 2013, June 4, 2013 and July 24, 2013, we made drawdowns of Rp250.0 billion, Rp500.0 billion and Rp550.0 billion, respectively under this facility.
HSBC Satellite Financing and Corporate Facility
On November 27, 2007, we signed two unsecured facility agreements with HSBC France and one unsecured facility agreement with HSBC Jakarta to finance the development of the Palapa-D satellite. These combined export credit and commercial financing facilities consist of the following:
| | • | | a 12-year term facility agreement amounting to US$157.2 million (“COFACE Term Facility”) to finance the payment of 85.0% of the French Content under the Palapa-D satellite contract, plus 100% of the COFACE Premium, as such terms are defined in the COFACE Term Facility agreement. The COFACE Term Facility bears interest at a fixed rate of 5.69% per annum, which is payable semi-annually. On March 29, 2010, September 29, 2010, March 29, 2011, September 29, 2011, March 29, 2012, September 28, 2012, March 29, 2013 and September 30, 2013, we paid the first, second, third, fourth, fifth, sixth, seventh and eighth semi-annual installments amounting to US$7.9 million each; |
| | • | | a 12-year term facility agreement amounting to US$44.2 million (“Sinosure Term Facility”) to finance the payment of 85.0% of the amounts payable under the Launch Service Contract (as defined in the Sinosure Term Facility agreement) with respect to our Palapa-D satellite. The Sinosure Term Facility bears floating interest rate based on U.S. dollars at LIBOR plus 0.35% per annum, which is payable semi-annually. On March 29, 2010, September 29, 2010, March 29, 2011, September 29, 2011, March 29, 2012, September 28, 2012, March 29, 2013 and September 30, 2013, we paid the first, second, third, fourth, fifth, sixth, seventh and eighth semi-annual installments amounting to US$2.2 million each; and |
| | • | | a nine-year Commercial Facility Agreement amounting to US$27.0 million (“Commercial Facility”) to finance the construction and launch of the Palapa-D satellite and the payment of the premium associated with the medium-long term buyer credit insurance policy issued in connection with the Sinosure Term Facility. The Commercial Facility bears floating interest rate based on U.S. dollars at LIBOR plus 1.45% per annum, which is payable semi-annually. On March 10, 2008, HSBC Jakarta transferred its rights and obligations under the Commercial Facility agreement to PT Bank CIMB Niaga Tbk (“CIMB Niaga”) and Bank of China Limited, Jakarta Branch. On November 27, 2009, May 27, 2010, November 29, 2010, May 26, 2011 and November 28, 2011, we paid the first, second, third, fourth and fifth semi-annual installments, respectively, amounting to US$1.4 million each. On |
92
| | May 29, 2012, November 27, 2012, May 27, 2013 and November 27, 2013 we paid the sixth, seventh, eighth and ninth semi-annual installments, respectively, amounting to US$2.0 million each. |
The facilities contain certain financial covenants. On March 18, 2009, we entered into agreements with HSBC France and HSBC Jakarta to amend the definitions of “Debt,” “EBITDA” and “Equity” and the ratio of Debt to Equity in our COFACE Term Facility, the Sinosure Term Facility and Commercial Facility, as applicable. According to the agreement, we are required to maintain: (i) equity capital in excess of Rp5,000.0 billion, (ii) a debt to equity ratio not to exceed 2.5:1, (iii) an EBITDA to interest ratio not to be less than 2.5:1, and (iv) a Debt to EBITDA ratio not to exceed 3.5:1.
In addition, on July 20, 2005, we entered into a Corporate Facility Agreement with HSBC Jakarta, which has subsequently been amended several times, to finance our short term working capital needs. The facility consists of a combined limit in the amount of US$30.0 million, comprising a revolving loan facility with a limit of US$30.0 million (including revolving loans denominated in rupiah of up to Rp255.0 billion) and an overdraft facility with a limit of US$2.0 million (including a Rupiah-denominated overdraft facility of up to Rp17.0 billion). The expiration date of the facility is June 30, 2014. We had not drawn on this facility as of December 31, 2013.
ING/DBS Syndicated Loan Facility
On June 12, 2008, we entered into a US$450.0 million syndicated loan facility with 13 banks and financial institutions, with ING Bank N.V., Singapore Branch and DBS Bank Ltd. serving as arrangers. The amount of interest to be paid on the outstanding amount of the loan were to be the aggregate of (i) the applicable margin of 1.85% per annum for non-Indonesian lenders or 1.90% per annum for lenders resident in Indonesia and (ii) LIBOR. The repayment of the loan drawdowns were to be made in semi-annual installments commencing June 12, 2011. On June 10, 2011 and December 12, 2011, we made our first and second semi-annual repayments amounting to US$112.5 million and US$108.0 million, respectively. On February 24, 2009, we entered into an agreement with the majority lenders to amend the definitions of “Debt,” “EBITDA” and “Equity” and the ratio of Debt to Equity in our ING/DBS Syndicated Loan Facility. Pursuant to the terms of the ING/DBS Syndicated Loan Facility agreement, as amended by the deed of amendment, we had agreed to certain covenants, including but not limited to the following maintenance covenants:
| | • | | a ratio of total debt to EBITDA of less than 3.5 to 1; |
| | • | | a total debt to equity ratio of 2.5 to 1; and |
| | • | | a ratio of EBITDA to interest expense, as reported as at the end of each financial year and as at the end of each of the first three quarters of our financial year, of at least 2.5 to 1. |
The repayment of the loan drawdowns were to be made semi-annually, as follows: (a) 25% of the total loan drawdowns in the third year after the signing date of the agreement (first repayment date), (b) 24% of the total loan drawdowns on the sixth month after the first repayment date, (c) 8% each of the total loan drawdowns on the 12th and 18th months after the first repayment date, and (d) 35% of the total loan drawdowns on the 24th month after the first repayment date.
On September 26 and October 30, 2008, we received the first and second drawdowns from this credit facility totaling US$450.0 million. On June 12, 2013, we repaid the remaining outstanding balance and the interest owed under this facility of US$159.4 million.
AB Svensk Exportkredit (“SEK”) Loan Facility Guaranteed by Export Kredit Namnden (“EKN”)
On August 18, 2009, we obtained credit facilities from SEK, guaranteed by EKN, an export credit agency of the Kingdom of Sweden, for the maximum total amount of US$315,000,000 to be used for the purchase of
93
Ericsson telecommunication equipment, with The Hongkong and Shanghai Banking Corporation Limited (“HSBC”), Hong Kong and The Royal Bank of Scotland N.V. (formerly known as ABN AMRO Bank N.V.), Hong Kong Branch as the original lenders and arrangers, while HSBC Bank Plc, London, United Kingdom acted as the facility agent and EKN agent. On September 2, 2009, the original lenders transferred such rights and obligations to SEK, pursuant to the terms of the agreement.
The credit facilities consist of facilities A, B and C with maximum amounts of US$100.0 million, US$155.0 million and US$60.0 million, respectively. Facility A bears interest at LIBOR plus 0.25% per annum, together with SEK funding costs and an EKN premium margin. Facility B and Facility C bear interest at 0.05% per annum plus 2.60% per annum plus the EKN Premium Margin. The repayment of each of facilities A, B and C shall be made in fourteen installments starting six months after May 31, 2009, February 28, 2010 and November 30, 2010, respectively. Based on the agreement, we are required to comply with certain covenants, such as maintaining certain financial ratios, which are substantially the same as the covenants under the ING/DBS Syndicated Loan Facility. In addition, we are required to maintain a minimum consolidated equity of at least Rp5,000.0 billion. As of December 31, 2011, we have drawn US$100.0 million, US$155.0 million and US$60.0 million from facilities A, B and C, respectively.
On November 30, 2009, May 27, 2010, November 30, 2010, May 27, 2011, November 30, 2011, May 30, 2012, November 30, 2012, May 30, 2013 and November 29, 2013 we paid the first, second, third, fourth, fifth, sixth, seventh, eighth and ninth semi-annual installments for Facility A amounting to US$7.1 million each. On August 28, 2010, February 28, 2011, August 25, 2011, February 28, 2012, August 28, 2012, February 28, 2013 and August 28, 2013 we paid the first, second, third, fourth, fifth, sixth and seventh semi-annual installment for Facility B amounting to US$11.1 million each. On May 27, 2011, November 30, 2011, May 27, 2012, November 30, 2012, May 30, 2013 and November 29, 2013 we paid the first, second, third, fourth, fifth and sixth semi-annual installment for Facility C amounting to US$4.3 million each.
Bank Sumitomo Mitsui Indonesia Loan Facilities
On December 26, 2012, we entered into a credit agreement providing for a three-year unsecured revolving credit facility from PT Bank Sumitomo Mitsui Indonesia in a maximum principal amount of Rp650.0 billion for working capital, capital expenditures and refinancing purposes. The interest rate for drawdowns is 1-month or3-month JIBOR plus 1.25% per annum. This facility is available from December 26, 2012 to December 26, 2015. Each drawdown under this facility has a term of one or three months, which may be extended a further one or three months upon the submission of a written application for such an extension by us to PT Bank Sumitomo Mitsui Indonesia. Based on the credit agreement, we are required to comply with certain covenants, such as maintaining certain financial ratios. On December 27, 2012, we made our first drawdown of Rp100.0 billion. On March 27, 2013 and April 5, 2013, we made the second and the third drawdowns of Rp300.0 billion and Rp250.0 billion each.
PT Indonesia Infrastructure Finance and PT Sarana Multi Infrastruktur (Persero) Credit Facilities
On October 18, 2013, we entered into a syndicated credit agreement providing for a three-year unsecured revolving credit facility from PT Indonesia Infrastructure Finance and PT Sarana Multi Infrastruktur (Persero), with PT Bank Permata Tbk serving as the facility agent, in a maximum principal amount of Rp750.0 billion for general purposes. The interest rate for drawdowns is 3-month or 6-month JIBOR plus 2.25% per annum depending on the term of each drawdown. This facility is available from October 18, 2013 to October 18, 2016. Each drawdown under this facility has a term of three or six months, which may be extended a further three or six months upon the submission of a written application for such an extension by us to PT Indonesia Infrastructure Finance and PT Sarana Multi Infrastruktur (Persero). Based on the credit agreement, we are required to comply with certain covenants, such as maintaining certain financial ratios. On each of December 12, 2013 and January 3, 2014, we made a drawdown of Rp300.0 billion.
94
The Bank of Tokyo-Mitsubishi UFJ, Ltd (“BTMU”) Credit Facilities
On December 23, 2013, we entered into a credit agreement providing for a three-year unsecured revolving credit facility from BTMU in a maximum principal amount of Rp250.0 billion for working capital, capital expenditure and general corporate purposes. The maximum interest rate for drawdowns is 6-month JIBOR plus 2.45% per annum. This facility is available from December 23, 2013 to December 23, 2016. Each drawdown under this facility has a term of maximum six months, which may be extended a further six months upon the submission of a written application for such an extension by us to BTMU. Based on the credit agreement, we are required to comply with certain covenants, such as maintaining certain financial ratios. We have not drawn on this facility as of December 31, 2013.
Lintasarta
Lintasarta’s long-term debt comprises of Investment Credit Facility VI from CIMB Niaga (formerly PT Bank Niaga Tbk) and unsecured limited bonds. As of December 31, 2013, the investment credit facility from CIMB Niaga and the unsecured limited bonds was fully repaid.
Investment Credit Facility VI. On February 24, 2009, Lintasarta obtained a credit facility from CIMB Niaga amounting to Rp75.0 billion for the purchase of telecommunications equipment, computers and other supporting facilities. The loan bore fixed annual interest at a fixed rate of 14.50% per annum (subject to change by CIMB Niaga based on market conditions), which is payable quarterly. The maturity date of the loan was August 24, 2012. The total outstanding principal amount of the loan as of December 31, 2012 was Rp22.5 billion, which was scheduled to be repaid in three installments on February 24, May 24, and August 24, 2012. On August 24, 2012, this facility was fully repaid.
Limited Bonds I. On June 2, 2003, Lintasarta agreed with its stockholders to issue limited bonds to stockholders totaling Rp40.0 billion, including our portion of Rp9.6 billion (“Limited Bonds I”). The Limited Bonds I were unsecured and had an initial maturity date of June 2, 2006. The Limited Bonds I bore interest at the fixed rate of 16.0% per annum for the first year and floating interest rates for the following years based on the average 3-month time deposit rates of Bank Mandiri, PT Bank Negara Indonesia (Persero) Tbk, Bank Rakyat Indonesia and PT Bank Tabungan Negara (Persero) Tbk plus a 3.0% margin, with a maximum rate of 19.0% per annum and a minimum rate of 11.0% per annum. Interest was payable quarterly from September 2, 2003. On June 14, 2006, Lintasarta agreed with the holders to extend the maturity date from June 2, 2006 to June 2, 2009 and the nominal value of the Limited Bonds I became Rp34.9 billion, including our portion of Rp9.6 billion. On June 2, 2009, Lintasarta repaid a portion of the Limited Bonds I amounting to Rp8,303 million. On August 25, 2009, the agreement governing the Limited Bonds I was amended to amend the face value of the Limited Bonds I to become Rp26.6 billion, including our portion of Rp9.6 billion, extend the maturity date to June 2, 2012 and to amend the floating interest rate to be based on JIBOR plus 4%, not to exceed 19.00% with a minimum floating interest rate of 12.75%. On December 28, 2011, Lintasarta repaid a portion of the limited bonds amounting to Rp9.6 billion, which is our portion. On January 31, 2012, Lintasarta repaid the remaining Rp17.0 billion outstanding under these bonds.
Limited Bonds II. On June 14, 2006, Lintasarta entered into an agreement with its stockholders to issue limited bonds amounting to Rp66.2 billion, including our portion of Rp35.0 billion (“Limited Bonds II”). The Limited Bonds II represented unsecured bonds which were originally set to mature on June 14, 2009 and bore interest at the floating rates determined using the average 3-month Indonesian rupiah time deposit rates with Bank Mandiri, PT Bank Negara Indonesia (Persero) Tbk, Bank Rakyat Indonesia and PT Bank Tabungan Negara (Persero) plus a fixed premium of 3.0%. The maximum limit of the floating rates was 19.0% per annum and the minimum limit was 11.0% per annum. The interest was payable on a quarterly basis starting September 14, 2006. The proceeds of the Limited Bonds II were used for capital expenditure to expand Lintasarta’s telecommunications peripherals.
95
On July 17, 2006, Lintasarta obtained approval from CIMB Niaga on the issuance of the Limited Bonds II. On June 14, 2009, Lintasarta paid a portion of the Limited Bonds II amounting to Rp6.2 billion. Based on the minutes of the joint meeting of Lintasarta’s boards of commissioners and directors held on May 20, 2009, the representatives of Lintasarta’s stockholders agreed to extend the maturity date of the remaining Limited Bonds II of Rp60.0 billion, including our portion of Rp35.0 billion, to June 14, 2012 and to increase the minimum limit of the floating interest rates 12.75%. On August 25, 2009, the Limited Bonds II agreement, after being amended to accommodate the changes in maturity date and minimum limit of floating interest rates, was finalized. On December 28, 2011, Lintasarta repaid a portion of the Limited Bonds II amounting to Rp35.0 billion, which is our portion. Subsequently, on February 29, 2012, Lintasarta repaid the remaining Rp25.0 billion outstanding under the Limited Bonds II.
Dividend Practice
Our shareholders determine dividend payouts in the Annual General Meeting of Shareholders pursuant to recommendations from our Board of Directors. At our 2011, 2012 and 2013 Annual General Meetings of Shareholders, our shareholders declared final cash dividends amounting to 50.0% of our net income for each of the years ended December 31, 2010, 2011 and 2012, respectively. There can be no assurance that we will pay dividends in respect of any financial year. The decision of the Board of Directors to recommend a dividend payment is subject to a number of factors which include, among others, our net profits, financial performance and applicable rules and regulations.
Capital Resources
We believe that our cash flow from operations and drawings from our existing credit facilities, as well as a portion of the cash proceeds from the divestiture of our entire shareholding in TBIG in 2014, will provide sufficient financing for our anticipated capital expenditures, anticipated debt repayment and interest obligations and other operating needs under our current business plan. However, we face liquidity risks if certain events occur, including but not limited to, slower than expected growth in the Indonesian economy, downgrading of our debt ratings or deterioration of our financial performance or financial ratios.
In the event we cannot finance our planned capital expenditures with internally generated cash flows, we may seek external sources of funding. Our ability to raise additional debt financing will be subject to certain covenants in our existing indebtedness. We cannot assure you that we will be able to obtain suitable financing arrangements (including vendor or other third-party financing) for our planned capital expenditures. In the event that we are unable to find such additional external funding sources, we may elect to reduce our planned capital expenditures. Such reduction in planned capital expenditures may have an adverse effect on our operating performance and our financial condition.
Capital Expenditures
Historical Capital Expenditures
From January 1, 2011 through December 31, 2013, we had capital expenditures totaling Rp24,278.9 billion (US$1,991.9 million), which were primarily used to purchase equipment and services from foreign suppliers in connection with the development of our cellular network. We had capital expenditures of Rp9,371.0 billion (US$768.8 million) during the year ended December 31, 2013, with such investment predominantly focused on optimizing and enhancing the capacity and quality of our existing cellular, fixed and MIDI network and telecommunications infrastructure. In February 2014, we completed the modernization of our network in Bali by implementing U900 technology throughout the island.
96
Capital Expenditures for 2014
Under our capital expenditure program for our various businesses, our planned capital expenditures for 2014 are more than the amounts spent in 2011, 2012 and 2013. Our capital expenditure program currently focuses on optimizing and enhancing the capacity and quality of our existing cellular, fixed and MIDI network and telecommunications infrastructure. For the years ended December 31, 2011, 2012 and 2013, our actual consolidated capital expenditures totaled Rp6,511.3 billion, Rp8,396.6 billion and Rp9,371.0 billion (US$768.8 million), respectively. During 2014, we intend to allocate approximately Rp9,871.9 billion (US$809.9 million) for new capital expenditures, which, taken together with estimated actual capital expenditures expended for 2014 for capital expenditure commitments in prior periods, will result in approximately Rp15,506.9 billion (US$1,272.2 million) total actual capital expenditures for 2014. We intend to allocate our capital expenditures for 2014 as follows:
| | • | | Cellular network investment: We plan to apply a large majority of our capital expenditures to finance the continued enhancement and expansion of the capacity and coverage of our cellular network. In 2014, we plan to focus on the modernization of our cellular network in Greater Jakarta, other parts of Java including Surabaya, Bandung, Yogyakarta, Semarang, Sukabumi and Garut and in certain cities outside Java including Medan, Banjarmasin, Lampung, Batam and Palembang. |
| | • | | Other investment: We plan to invest the remainder of our capital expenditures budget in non-cellular network areas and continue to provide them with voice, long-distance and MIDI services and make improvements to our backbone. |
The foregoing amounts represent our budgeted investment plans. Actual expenditures on a cash basis will vary depending on several factors, including the method of financing and timing of completion of delivery of equipment and services purchased. Historically, expenditure on a cash basis trails budgeted expense by approximately at least 20.0% of our budget. As of December 31, 2013, we had commitments for capital expenditures of Rp9,371.0 billion (US$768.8 million), primarily relating to the enhancement and expansion of the capacity and coverage of our cellular network.
The foregoing capital expenditure plan is based on our understanding of current market and regulatory conditions and we may amend our plans in response to changes in such conditions. In particular, depending on the regulatory framework for other wireless services, we may decide to increase our investment in fixed wireless access networks and services, either through increased capital expenditures, reallocation of our existing planned expenditures, through revenue-sharing schemes or a combination of the foregoing. Revenue-sharing schemes would include partnerships with private investors under which such investors would finance construction of a project in exchange for revenues from the project, similar to a build-operate-transfer structure.
Historically, we have funded our capital expenditures through internal resources and cash flow from operations, as well as debt financings through bank loans and the capital markets. We expect to continue to finance our capital expenditures through such sources as well as a portion of cash proceeds from the divestiture of our entire shareholding in TBIG in 2014. In addition, we also applied a portion of the cash proceeds from the Tower Sale Transaction completed in 2012 towards funding capital expenditures in 2013. We face liquidity risk if certain events occur, including but not limited to, slower than expected growth in the Indonesian economy, downgrading of our debt ratings or deterioration of our financial performance or financial ratios. If we cannot raise the amounts needed to support our planned capital expenditures for 2014, we may be unable to improve or expand our cellular telecommunications infrastructure or update our other technology to the extent necessary to remain competitive in the Indonesian telecommunications market, which would affect our financial condition, results of operations and prospects.
Critical Accounting Policies
Our consolidated financial statements have been prepared in accordance with IFRS. References to IFRS include the application of International Financial Reporting Standards, International Accounting Standards (“IAS”), Interpretations of the International Financial Reporting Interpretations Committee (“IFRIC”).
97
The preparation of these financial statements requires management to make estimates and assumptions that affect the reported amounts of assets and liabilities as well as the disclosure of contingent assets and liabilities at the date of the financial statements and the reported amounts of revenues and expenses during the reporting period. Management bases its estimates and assumptions on historical experience and other factors that are believed to be reasonable under the circumstances. We continually evaluate such estimates and assumptions. Actual results could differ from those estimates under different assumptions or actual conditions. We believe that, of our significant accounting policies, the following may involve a higher degree of judgment or complexity.
Goodwill and Other Intangible Assets
The consolidated financial statements and results of operations reflect acquired businesses after the completion of the respective acquisition. We account for the acquired businesses using the acquisition method of accounting which requires extensive use of accounting estimates and judgments to determine the fair market values of the acquiree’s identifiable assets and liabilities at the acquisition date. Any excess in the purchase price over the fair market values of the net assets acquired is recorded as goodwill in the consolidated statements of financial position. Thus, the numerous judgments made in estimating the fair market value to be assigned to the acquiree’s assets and liabilities can materially affect our financial performance.
Estimating Useful Lives of Property and Equipment and Intangible Assets
We estimate the useful lives of our property and equipment and intangible assets based on expected asset utilization as anchored on business plans and strategies that also consider expected future technological developments and market behavior. The estimation of the useful lives of property and equipment is based on our collective assessment of industry practice, internal technical evaluation and experience with similar assets. The estimated useful lives are reviewed annually and are updated if expectations differ from previous estimates due to physical wear and tear, technical or commercial obsolescence and legal or other limitations on the use of the assets. It is possible, however, that future results of operations could be materially affected by changes in the estimates brought about by changes in the factors mentioned above.
The amounts and timing of recorded expenses for any period will be affected by changes in these factors and circumstances. A reduction in the estimated useful lives of our property and equipment will increase the recorded operating expenses and decrease non-current assets. An extension in the estimated useful lives will decrease the recorded operating expenses and increase non-current assets.
Impairment of non-financial assets
An impairment exists when the carrying value of an asset or cash generating unit exceeds its recoverable amount, which is the higher of its fair value less costs to sell and its value in use. The fair value less costs to sell calculation is based on available data from binding sales transactions in arm’s length transactions of similar assets or observable market prices less incremental costs for disposing of the asset. The value in use calculation is based on a discounted cash flow model. The cash flows are derived from the budget for the next five years and do not include restructuring activities that we are not yet committed to or significant future investments that will enhance the asset’s performance of the cash generating unit being tested. The recoverable amount is most sensitive to the discount rate used for the discounted cash flow model as well as the expected future cash-inflows and the growth rate used for extrapolation purposes.
Estimation of Pension Cost and Other Employee Benefits
The cost of our defined benefit pension plan and present value of our pension obligations are determined using a projected-unit-credit method. Actuarial valuation includes making various assumptions which consist, among other things, of discount rates, rates of compensation increases and mortality rates. Due to the complexity
98
of valuation and their long-term nature, our defined benefit pension obligation is highly sensitive to changes in assumptions.
While we believe that our assumptions are reasonable and appropriate, significant differences in our actual experience or significant changes in our assumptions may materially affect the costs and obligations of pension and other long-term employee benefits. All assumptions are reviewed at each reporting date.
Further details about the assumptions are given in Note 30 to our audited consolidated financial statements.
Recoverability of Deferred Income Tax Assets
We review the carrying amounts of deferred income tax assets at the end of each reporting period and reduce these to the extent that it is no longer probable that sufficient taxable income will be available to allow all or part of the deferred income tax assets to be utilized. Our assessment on the recognition of deferred income tax assets on deductible temporary differences is based on the level and timing of forecasted taxable income of the subsequent reporting periods. This forecast is based on our past results and future expectations on revenues and expenses as well as future tax planning strategies. However, there is no assurance that sufficient taxable income will be generated to allow all or part of deferred income tax assets to be utilized.
Estimating Allowance for Impairment Losses on Receivables
If there is objective evidence that an impairment loss has been incurred in trade receivables, we estimate the allowance for impairment losses related to their trade receivables that are specifically identified as doubtful for collection. The level of allowance is evaluated by management on the basis of factors that affect the collectability of the accounts. In these cases, we use judgment based on the best available facts and circumstances, including but not limited to, the length of our relationship with the customers and the customers’ credit status based on third-party credit reports and known market factors, to record specific reserves for customers against amounts due in order to reduce our receivables to amounts that they expect to collect. These specific reserves are re-evaluated and adjusted as additional information received affects the amounts estimated.
In addition to specific allowance against individually significant receivables, we also assess a collective impairment allowance against credit exposure of our customers which are grouped based on common credit characteristic, which, although not specifically identified as requiring a specific allowance, have a greater risk of default than when the receivables were originally granted to customers. This collective allowance is based on historical loss experience using various factors such as historical performance of the customers within the collective group, deterioration in the markets in which the customers operate, and identified structural weaknesses or deterioration in the cash flows of debtors.
Determination of Fair Values of Financial Assets and Financial Liabilities
We carry certain financial assets and liabilities at fair values, which require extensive use of accounting estimates and judgments for the fair values of financial assets and liabilities. Where the fair value of financial assets and financial liabilities recorded in the statements of financial position cannot be derived from active markets, their fair value is determined using valuation techniques including the discounted cash flow model. The inputs to these models are taken from observable markets where possible, but where this is not feasible, a degree of judgment is required in establishing fair values. The judgments include considerations of inputs such as liquidity risk, credit risk and volatility. Changes in assumptions about these factors could affect the reported fair value of financial instruments. Further details about the fair value measurement are given in Note 2f11 to our audited consolidated financial statements included elsewhere in this annual report.
Exchange of asset transactions
During 2011 to 2013, we entered into several contracts for the exchange of assets for certain of our existing cellular technical equipment with third party suppliers. For the exchange of assets transactions, we evaluate
99
whether the transactions contain commercial substance based on IAS 16 “Property, Plant and Equipment,” which requires us to make judgments and estimates of the future cash flow and the fair value of the assets received and given up as a result of the transactions. Management considered the exchange of assets transactions to have met the criteria of commercial substance. However, the fair values of neither the assets received nor the assets given up could be measured reliably, hence, their values were measured at the carrying amounts of the assets given up plus any cash consideration paid.
Leases
We are a party to various lease agreements either as a lessee or a lessor in respect of certain property and equipment. As provided in IAS 17, “Leases,” a lease is classified as a finance lease if it transfers substantially all the risks and rewards incidental to ownership and as an operating lease if it does not.
As a lessee, our finance leases are capitalized at the commencement of the lease at the fair value of the leased property or, if lower, at the present value of the minimum lease payments. Finance lease payments are apportioned between finance charges and reduction of the lease liability so as to achieve a constant rate of interest on the remaining balance of the liability. Finance charges are recognized in financing costs in profit or loss. An asset subject to a finance lease is depreciated over its useful life. However, if there is no reasonable certainty that we will obtain ownership by the end of the lease term, the asset is depreciated over the shorter of its estimated useful life and the lease term. The current portion of obligations under finance leases are presented as part of Other Current Financial Liabilities. In contrast, operating lease payments are recognized as an operating expense in profit or loss on a straight-line basis over the lease term.
We have classified a number of our tower leases as finance leases due to the fact that these leases meet at least one of the eight factors set out in IAS 17 to be considered when determining whether substantially all the risks and rewards incidental to ownership have been transferred. All of our other leases are classified as operating leases.
The classification of leases under which we are either a lessee or a lessor requires that we make judgments and estimates in determining whether substantially all of the risks and rewards incidental to ownership of the leased assets have been transferred. While we believe our classification of certain of our tower leases as finance leases is reasonable and appropriate, we continue to evaluate the most appropriate treatment of these tower leases.
Determining whether a lease transaction is a finance lease or an operating lease is a complex issue and requires substantial judgment as to whether the lease agreement transfers substantially all the risks and rewards of ownership to or from us. Careful and considered judgment is required on various complex aspects that include, but are not limited to, the fair value of the leased asset, the economic life of the leased asset, whether renewal options are included in the lease term and determining an appropriate discount rate to calculate the present value of the minimum lease payments.
Classification as a finance lease or operating lease determines whether the leased asset is capitalized and recognized in the consolidated statement of financial position. In sale-and-leaseback transactions, the classification of the leaseback arrangements determines how the gain or loss on the sale transaction is recognized. It is either deferred and amortized (finance lease) or recognized in the consolidated statement of comprehensive income immediately (operating lease).
Determination of functional currency
The functional currencies of the entities under our group are the currency of the primary economic environment in which each we operate. It is the currency that mainly influences the revenue and cost of rendering services.
100
Uncertain tax exposures
In certain circumstances, we may not be able to determine the exact amount of our current or future tax liabilities or recoverable amount of the claim for tax refund due to ongoing investigations by, or negotiations with, the taxation authority. Uncertainties exist with respect to the interpretation of complex tax regulations and the amount and timing of future taxable income. In determining the amount to be recognized in respect of an uncertain tax liability or the recoverable amount of the claim for tax refund related to uncertain tax positions, we apply similar considerations as we would use in determining the amount of a provision to be recognized in accordance with IAS 37 “Provisions, Contingent Liabilities and Contingent Assets.” We make an analysis of all uncertain tax positions to determine if a tax liability for uncertain tax benefit or a provision for unrecoverable claim for tax refund should be recognized.
We present interest and penalties for the underpayment of income tax, if any, in Income Tax Expense in profit or loss.
Provision for legal contingency
IM2 is currently under investigation by the Attorney General’s Office for being involved in a significant legal case. Our judgment of the probable cost for the resolution of the case has been developed in consultation with the our counsel handling the defense in this matter and is based upon their analysis of potential outcomes. We currently do not believe this case could materially reduce the our revenues and profitability. It is possible, however, that future financial performance could be materially affected by changes in our judgment or effectiveness of our strategy relating to the case. See Note 34i—Significant Agreements, Commitments and Contingency of to our audited consolidated financial statements included elsewhere in this annual report.
Revenue recognition
Our revenue recognition policies require the use of estimates and assumptions that may affect the reported amounts of revenues and receivables.
Our agreements with domestic and foreign carriers for inbound and outbound traffic subject to settlements require traffic reconciliations before actual settlement is done, which may not be the actual volume of traffic as measured by us. Initial recognition of revenues is based on observed traffic adjusted by normal experience adjustments, which historically are not material to the consolidated statements of comprehensive income.
Differences between the amounts initially recognized and the actual settlements are recorded upon reconciliation. However, there is no assurance that the use of such estimates will not result in material adjustments in future periods.
We recognize revenues from installation and activation related fees and the corresponding costs over the expected average periods of customer relationship for cellular, MIDI and fixed telecommunication services. We estimate the expected average period of customer relationship based on the most recent churn-rate analysis.
New Accounting Standards and Interpretations to Existing Standards Effective Subsequent to December 31, 2013
Please see Note 2e—Summary of Significant Accounting Policies to the accompanying consolidated financial statements in Item 19 for a discussion of new accounting standards that became effective subsequent to December 31, 2013 and their anticipated impact on our consolidated financial statements for the current and future periods.
C. RESEARCH AND DEVELOPMENT, PATENTS AND LICENSES, ETC.
For the years ended December 31, 2011, 2012 and 2013, we did not conduct significant research and development activities. Since 2013, we commenced development of e-commerce digital products and services to
101
complement our core telecommunications services business. In 2013, we established a dedicated in-house product development team which focuses on developing mobile finance, mobile payments, e-commerce and mobile advertising products and services. Our in-house product development team publicly rolled out the award-winning “Dompetku” mobile money service in 2013 which allows customers to make payments using our cellular pre-paid vouchers. We typically outsource the development of the software platforms for our e-commerce services to third party developers.
In December 2013, we also established Idea Box, a business incubator based in Jakarta, through which we intend strengthen our business portfolio by supporting the development of innovative and marketablee-commerce products and services by startup companies in Indonesia. Idea Box is intended to invest a minority stake in startup companies which we believe have promising and commercial potential but which may or may not have been fully market-tested.
D. TREND INFORMATION
Please refer to the introductory discussion to “—Operating and Financial Review and Prospects—Operating Results” above for a detailed discussion of significant trends impacting our operating results and financial condition. See also “Item 3: Key Information—Risk Factors” for more information regarding why reported financial information may not necessarily be indicative of future operating results.
In January and December 2011, we and Lintasarta each introduced an organizational restructuring which forms part of our transformation program that began in 2009 to increase our productivity and improve our longer-term operating results. We and Lintasarta each offered special compensation packages to employees who meet certain criteria as determined by us and Lintasarta, respectively, and who opted to end their employment relationship with us or Lintasarta, respectively, as part of such organizational restructuring under our and Lintasarta’s voluntary separation scheme (“VSS Program”). As of December 31, 2013, 214 of our employees participated in the VSS Program.
E. OFF-BALANCE SHEET ARRANGEMENTS
As of December 31, 2013, we had no off-balance sheet arrangements that were reasonably likely to have a current or future effect on our financial condition, changes in financial condition, revenues or expenses, results of operations, liquidity, capital expenditures or capital resources that is material to investors.
F. TABULAR DISCLOSURE OF CONTRACTUAL OBLIGATIONS
As of December 31, 2013, we had contractual obligations in the amount of US$1,713.9 million in foreign currency denominated contracts and Rp20,425.0 billion in Indonesian rupiah-denominated contracts. The foreign currency denominated contractual obligations require payments totaling US$281.3 million in 2014, US$313.8 million from 2015 to 2016, US$229.8 million from 2017 to 2018 and US$888.9 million from 2019 and thereafter. The Indonesian rupiah-denominated contractual obligations require payments totaling Rp8,393.2 billion in 2014, Rp4,513.0 billion from 2015 to 2016, Rp3,365.1 billion from 2017 to 2018 and
102
Rp4,153.7 billion from 2019 and thereafter. The table below sets forth information relating to certain of our contractual obligations as of December 31, 2013:
| | | | | | | | | | | | | | | | | | | | | | | | | | | | | | | | | | | | | | | | |
| | | Payments due by the periods ending December 31, | |
| | | Total | | | 2014 | | | 2015-2016 | | | 2017-2018 | | | 2019 and
thereafter | |
| | | Rp | | | US$ | | | Rp | | | US$ | | | Rp | | | US$ | | | Rp | | | US$ | | | Rp | | | US$ | |
| | | (Rp in billions and US$ in millions) | |
Contractual obligations: | | | | | | | | | | | | | | | | | | | | | | | | | | | | | | | | | | | | | | | | |
Short-term loan | | | 1,500.0 | | | | — | | | | 1,500.0 | | | | — | | | | — | | | | — | | | | — | | | | — | | | | — | | | | — | |
Loans payable | | | 3,450.0 | | | | 280.5 | | | | 1,600.0 | | | | 69.2 | | | | 1,200.0 | | | | 131.2 | | | | 650.0 | | | | 60.0 | | | | — | | | | 20.1 | |
Bonds payable | | | 7,820.0 | | | | 650.0 | | | | 2,358.0 | | | | — | | | | 1,092.0 | | | | — | | | | 1,370.0 | | | | — | | | | 3,000.0 | | | | 650.0 | |
Interest payable on loans and bonds | | | 3,662.1 | | | | 367.0 | | | | 1,102.8 | | | | 59.0 | | | | 1,318.6 | | | | 110.2 | | | | 710.1 | | | | 101.1 | | | | 530.6 | | | | 96.7 | |
Obligations under finance lease | | | 2,317.2 | | | | 293.8 | | | | 353.6 | | | | 34.3 | | | | 705.5 | | | | 68.7 | | | | 635.0 | | | | 68.7 | | | | 623.1 | | | | 122.1 | |
Purchase obligations | | | 1,478.8 | | | | 118.8 | | | | 1,478.8 | | | | 118.8 | | | | — | | | | — | | | | — | | | | — | | | | — | | | | — | |
Other non-current liabilities and non-current financial liabilities | | | 196.9 | | | | 3.7 | | | | — | | | | — | | | | 196.9 | | | | 3.7 | | | | — | | | | — | | | | — | | | | — | |
| | | | | | | | | | | | | | | | | | | | | | | | | | | | | | | | | | | | | | | | |
Total contractual cash obligations | | | 20,425.0 | | | | 1,713.8 | | | | 8,393.2 | | | | 281.3 | | | | 4,513.0 | | | | 313.8 | | | | 3,365.1 | | | | 229.8 | | | | 4,153.7 | | | | 888.9 | |
| | | | | | | | | | | | | | | | | | | | | | | | | | | | | | | | | | | | | | | | |
Item 6: DIRECTORS, SENIOR MANAGEMENT AND EMPLOYEES
Directors and Senior Management
In accordance with Indonesian law, we have a Board of Commissioners and a Board of Directors. The two boards are separate, and no individual may be a member of both boards.
Board of Commissioners
Our Board of Commissioners consists of ten members, one of whom is designated the President Commissioner. The members of the Board of Commissioners are elected and dismissed by shareholders’ resolutions at a general meeting of shareholders, provided that one member of the Board of Commissioners shall be nominated by the holder of the one Series A share. In accordance with BAPEPAM-LK regulations and IDX rules, four commissioners have been designated as Independent Commissioners: Rudiantara, Soeprapto S.IP, Chris Kanter and Richard Farnsworth Seney. As of April 24, 2014, our Board of Commissioners consisted of 10 members as listed below:
| | | | | | | | |
Name | | Age | | Commissioner
Since | | | Position |
H.E. Sheikh Abdullah Bin Mohammed Bin Saud Al Thani | | 54 | | | 2008 | | | President Commissioner |
Dr. Nasser Mohammed Marafih | | 53 | | | 2008 | | | Commissioner |
Richard Farnsworth Seney | | 59 | | | 2012 | | | Independent Commissioner |
Rachmat Gobel | | 51 | | | 2008 | | | Commissioner |
Rionald Silaban | | 48 | | | 2008 | | | Commissioner |
Beny Roelyawan | | 57 | | | 2012 | | | Commissioner |
Cynthia Alison Gordon | | 51 | | | 2013 | | | Commissioner |
Rudiantara | | 54 | | | 2012 | | | Independent Commissioner |
Soeprapto S.IP | | 67 | | | 2005 | | | Independent Commissioner |
Chris Kanter | | 62 | | | 2010 | | | Independent Commissioner |
Set forth below is a brief biography of each of our Commissioners.
H.E. Sheikh Abdullah Bin Mohammed Bin Saud Al Thani has been the President Commissioner since August 2008. Sheikh Abdullah is currently the Chairman of the Board of Directors of Ooredoo Qatar (formerly known as Qtel) and the Ooredoo (formerly known as Qtel Group). In his capacity as Chairman, Sheikh Abdullah
103
represents a wide range of business skills, experience and knowledge. He has helped enhance Ooredoo Qatar’s corporate governance system to ensure Ooredoo Qatar is directed and controlled in the most efficient manner in line with international practices, thereby reinforcing both corporate accountability and the sustained creation of shareholder wealth. Sheikh Abdullah has previously held several high profile positions in Qatar including the Chief of the Royal Court (Amiri Diwan), a role he filled from 2000 to 2005. His Excellency enjoys the status of a minister, and he is also a member of the Qatari Planning Council. He graduated as a Pilot in the British Army Air Corps and completed his studies at the Senior Military War College for the Armed Forces in the United States of America.
Dr. Nasser Mohammed Marafih has been a Commissioner at Indosat since August 2008 and is the Chairman of the Remuneration Committee and the Budget Committee. Dr. Marafih is the Group Chief Executive Officer of Ooredoo. Dr. Marafih started his career at Ooredoo Qatar in 1992 as an expert advisor from the University of Qatar and was involved in the introduction of the first GSM service in the Middle East in February 1994. Dr. Marafih has spearheaded Ooredoo’s global growth in recent years. He has received a number of prestigious awards and holds several key industry roles. He was Chairman of the GSM Association’s Mobile for Development Foundation in 2012 and he sits in the Board of the GSM Association which represents the interests of the worldwide mobile communications industry. He is also the Chairman of the SAMENA Telecommunication Council for South Asia, Middle East, North Africa. In 2013, he led the global launch of the new “Ooredoo” brand, supported Ooredoo’s efforts to increase its stakes in Asiacell Communications PJSC and Wataniya Telecom (National Mobile Telecommunications Company K.S.C.) and successfully secured a business license for Ooredoo Myanmar. He was named as one of the most influential telecommunications professional in the world in the Global Telecoms Business Power 100 list in 2013. Dr. Marafih holds a Bachelor of Science in Electrical Engineering, a Master of Science and a Ph.D. in Communication Engineering, all from George Washington University in the United States.
Richard Farnsworth Seney has been an Independent Commissioner since September 2012 and was appointed as the Chairman of the Audit Committee from June 2013. Mr. Seney served as Commissioner of our Company from 2009 to 2012, Chief Operating Officer of Ooredoo from 2007 to 2011, President and Chief Executive Officer of MCT Corp. (including predecessors) from 1992 to 2007, Executive Vice President and General Manager of MCT Investors, L.P. from 1987 to 2002, and Executive Vice President and Chief Financial Officer of Charisma Communications Corporation from 1985 to 1987. Mr. Seney received a Bachelor degree in Commerce from the University of Virginia McIntire School of Commerce.
Rachmat Gobel has been a Commissioner since 2008. Currently he is the Chairman of the Gobel Group of companies that has operations in manufacturing, trading, services, integrated logistics management as well as food and hospitality, including industrial catering. In 1960, Gobel Group entered into a technical assistance agreement with Panasonic Corporation (formerly Matsushita Electric Industrial Co., Ltd.), one of the world’s leaders in electronics and electrical goods. Since 1970 Gobel Group has been the Indonesian joint venture partner of Panasonic. Mr. Gobel also holds other high level positions, including as a Commissioner of PT Smart Tbk, Commissioner of PT Visi Media Asia Tbk, the Vice Chairman of the Board of Advisors of the Indonesian Chamber of Commerce and Industry (Kamar Dagang dan Industri Indonesia or KADIN Indonesia), the Vice Chairman of the Employers Association of Indonesia (Asosiasi Pengusaha Indonesia or “APINDO”), the Chairman of the Federation of Electronic and Telematics Association (FGABEL) and the Chairman of the Indonesian Renewable Energy Society. He has also been appointed as a member of the National Innovation Committee (Komite Inovasi Nasional or KIN) by President Susilo Bambang Yudhoyono. Mr. Gobel graduated with a Bachelor of Science degree in International Trade from Chuo University in Tokyo, Japan in 1987 and was awarded an Honorary Doctorate Degree from Takushoku University, Tokyo, Japan in 2002. In 2009, he received the prestigious “Distinguished Engineering Award in Manufacturing Technology” in the Field of Manufacturing Technology” (“Perekayasa Utama Kehormatan dalam Bidang Teknologi Manufaktur”) from the Agency for the Assessment and Application Technology(Badan Pengkajian dan Penerapan Teknologi or BPPT).In 2009, he also received the “BNSP-Competency Award” from the National Agency for Certification of Professions (Badan Nasional Sertifikasi Profesi or BNSP), Ministry of Manpower and Transmigration of the Republic of Indonesia.
104
In 2011, he received the prestigious “Asian Productivity Organization Regional Award” from the Asian Productivity Organization in Tokyo, Japan, for his contributions to improving productivity in Indonesia’s industry sector and demonstrating the significant role of private-sector leaders in introducing sustainable development through Green Productivity and forging strategic partnerships with the rest of Asia and the Pacific, from the Asian Productivity Organization, Tokyo, Japan. Mr. Gobel is also actively involved in numerous social activities, including the Indonesian Red Cross.
Rionald Silaban has been a Commissioner since June 2008 and was appointed as a member of the Risk Management Committee in the same year. He currently serves as Senior Advisor to the Minister of Finance. He has held several positions in the past, including Director of the Center for Policy Analysis and Harmonization of the Ministry of Finance in Indonesia, Director of Fiscal Risk Management of the Ministry of Finance from 2006 to 2008, Senior Advisor at the World Bank in Washington D.C., U.S. from 2004 to 2006, Division Head in Secretariat General of the Ministry of Finance from 2002 to 2004, Head of the Assets Monitoring Division of the Indonesian Banking Restructuring Agency from 2000 to 2002, Division Head for Financial Service of the Legal Bureau of the Ministry of Finance from 1998 to 2000, Deputy Director for Privatization of Directorate General State-Owned Enterprise of the Ministry of Finance from 1997 to 1998, Head of Section of the Legal Bureau of the Ministry of Finance from 1994 to 1997 and Head of Secretariat for Privatization Committee of Ministry of Finance from 1994 to 1997. Mr. Silaban earned a law degree from the University of Indonesia in 1989 and a Master of Laws degree from the Georgetown University Law Center, Washington D.C. in the United States, in 1993.
Beny Roelyawanhas been a Commissioner since June 2012. Mr. Roelyawan served as Deputy III at the State Intelligence Agency, Republic of Indonesia from January 2006 to July 2013 and as Deputy VII of Analysis and Production from July 2013 until today. He received Honorary Award of Satyalancana Karya Satya X in 2001 and Satyalancana Karya Satya XX in 2005. He holds a Bachelor degree in Economy Enterprises from the University of Diponegoro in Indonesia.
Cynthia Alison Gordon has been a Commissioner since June 2013. Mrs. Gordon joined Ooredoo in January 2012 as Group Chief Commercial Officer. She is responsible for marketing, distribution and customer services across Ooredoo. Mrs. Gordon works closely with Ooredoo’s operating subsidiaries to develop, review and implement commercial strategies to drive revenue and profitability growth. Mrs. Gordon has more than 20 years of experience at leading mobile, broadband and fixed-line operations in the emerging and developed markets. Mrs. Gordon started her career at Unilever as a management trainee focusing on brand management of Unilever’s major mass-market brands. From 1991 until 1998, Mrs. Gordon held senior marketing positions at One to One (a subsidiary of T-Mobile USA, Inc.), Lloyds Bank Plc and Abbey National Plc. Mrs. Gordon was Marketing Director at ACC International (a subsidiary of AT&T Inc.) from 1998 until 1999 and a Marketing Director at THUS Group Plc (which was subsequently acquired by Vodafone Group Plc) from 2000 until 2001. In 2001, she joined Orange S.A. (previously known as France Télécom S.A.) (“Orange”) as Marketing Director where she rose to become Vice-President of Business Marketing. From 2007 until 2009, she was Group Chief Commercial Officer at Mobile TeleSystems OJSC (“MTS”), where she led MTS’s commercial strategy and direction and helped to develop a common marketing strategy with simple tariffs across markets, and supported MTS’s launch into India. During her tenure, MTS became the first Russian brand to enter the Financial Time’s Global Brands list in 2008. From 2009 until 2011, she returned to Orange as Vice-President of Partnerships and Emerging Markets, where she supported Orange’s emerging market operations in Africa and Eastern Europe and managed Orange’s relationship with Apple. Mrs. Gordon holds a Bachelor of Arts in Business Studies from Brighton University.
Rudiantara has been an Independent Commissioner since November, 2012. Currently, Mr. Rudiantara is the Chief Executive Officer of PT Bukitasam Transpacific Railways and PT Rajawali Asia Resources. Mr. Rudiantara previously held various positions, including Independent Commissioner and Chairman of the Audit Committee of Telkom from 2011 to 2012, Deputy Chief Executive Officer of PT PLN (Persero), Deputy Chief Executive Officer of PT Semen Gresik (Persero) Tbk, Director and Commissioner of XL, COO PT
105
Telekomindo Primabhakti, Commissioner Bank Pos and Director of Telkomsel. He received an MBA degree from IPPM (Institut Pendidikan dan Pembinaan Manajemen) and Bachelor degree in Statistic from the University of Padjadjaran in Indonesia.
Soeprapto S.IP has been an Independent Commissioner since 2005 and from 2005 until 2012 was a member of the Audit Committee. In the past, Mr. Soeprapto has held several positions, including as Personnel Assistant to the Army Chief of Staff of the Republic of Indonesia from 2000 to 2001, and currently serves as a Commissioner of each of PT Padangbara Sukses Makmur since 2008 and PT Sawit Kaltim Lestari since 2010. Mr. Soeprapto earned a degree in Political Science from Universitas Terbuka in Jakarta and participant of the Regular Course (KRA 29) in 1996 at the Indonesian National Resilience Institute (Lembaga Ketahanan Nasional or LEMHANAS).
Chris Kanter has been an Independent Commissioner since January 2010. Mr. Kanter is an Indonesian businessman and business community leader, who is at the forefront of the national economic reform agenda in Indonesia. A trained engineer, he is the Chairman and Founder of Sigma Sembada Group, a major turnkey contractor, with operations in the transportation and logistics segments and in oil exploration. In 2011 he was appointed by the President of Indonesia to serve as a member of National Economic Council (Komite EkonomiNasionalor KEN). Mr. Kanter also serves as Chairman of the Board of Founders of the Swiss German University, Vice Chairman of the National Board of APINDO, Chairman of Board of Founders of the Global Entrepreneurship Program Indonesia and Vice President Commissioner of PT Bank BNP Paribas Indonesia. Mr. Kanter also served as a member of the Peoples Consultative Congress (MPR) of the Republic of Indonesia from 1998 to 2002. Mr. Kanter is a graduate of the Faculty of Engineering, Trisakti University, Indonesia.
The term of each of the Commissioners concludes at the close of the fourth annual general meeting of shareholders after the date of appointment, expiring in 2016 for the current Commissioners. A Commissioner may be removed prior to the expiration of his term of office at a general meeting of the shareholders. The Commissioners’ business address is Jalan Medan Merdeka Barat 21, Jakarta, 10110, Republic of Indonesia.
Board of Directors
Our Board of Directors is responsible for our overall management and day-to-day operations under the supervision of the Board of Commissioners. The Board of Directors consists of at least three members, including one President Director. The members of the Board of Directors are elected and dismissed by shareholders’ resolutions at a general meeting of shareholders, provided that one member of the Board of Directors shall be nominated by the holder of the one Series A share. As of April 24, 2014, our Board of Directors consisted of three members as listed below:
| | | | | | | | |
Name | | Age | | Director
Since | | | Position |
Alexander Rusli | | 43 | | | 2012 | | | President Director & Chief Executive Officer |
Fadzri Sentosa | | 50 | | | 2007 | | | Director & Chief Wholesale and Infrastructure Officer |
Curt Stefan Carlsson | | 43 | | | 2011 | | | Director & Chief Financial Officer |
Set forth below is a brief biography of each of our Directors:
Alexander Rusli assumed the role of President Director and CEO in November 2012 after serving as an Independent Commissioner since January 2010. Before November 2012, Mr. Rusli was a Managing Director in Northstar Pacific, a private equity fund which focuses on Indonesian and Southeast Asian opportunities. Prior to his role in Northstar Pacific, Mr. Rusli served the Government of Indonesia for nine years. In his first six years in government, he was an Expert Advisor to the Minister of Communications and Information Technology, where he was involved in the formulation of policy and regulation in the Telecommunication, Media and Postal
106
industries. In his last three years in government services, he was an Expert Staff to the Minister of State-Owned Enterprises, overseeing approximately 140 state-owned enterprises with more than 500 subsidiaries. During that period, he also held various positions at certain state-owned companies including serving as commissioner of PT Krakatau Steel (Persero), a steel producer, PT Geodipa Energi, a geothermal company and PT Kertas Kraft Aceh, a kraft paper manufacturer. Prior to his posts in the Government, Mr. Rusli was Principal Consultant for PricewaterhouseCoopers Management Consulting in Indonesia. Mr. Rusli completed all his formal tertiary education in Curtin University, Western Australia. He holds a Doctor of Philosophy degree in Information Systems.
Fadzri Sentosa was appointed as a Director in June 2007 and as Director & Chief Wholesale and Infrastructure Officer in June 2009. Currently, Mr. Sentosa is a member of the Board of Commissioners of Lintasarta since 2007 and IM2 since his return to IM2 in 2013. Mr. Sentosa has previously held various positions with us, including as member of the Board of Commissioners of IM2 from 2005 to 2009, Group Head of National Card and Channel Management from 2006 to 2007, Senior Vice President of Commerce, Jabotabek Region from 2005 to 2006 and Senior Vice President of Cellular Sales from 2003 to 2004, member of the Board of Directors of Satelindo in 2003 and a member of the Board of Director of PT Indosat Multimedia Mobile from 2002 to 2003. Mr. Sentosa received a Master degree in International Business Management from the University of Technology, Sydney in 2001 and a Bachelor degree in Telecommunications Engineering from the Bandung Institute of Technology in 1986.
Curt Stefan Carlsson was appointed as Director & Chief Financial Officer in September 2011. Mr. Carlsson has previously held various positions, including Chief Operations Advisor at wi-tribe Philippines since January 2011, he held a transitional advisory role at Telenor Asia from August 2010 to December 2010, Chief Financial Officer at DiGi.Com Bhd and at DiGi Telecommunications Sdn Bhd, Selangor, Malaysia from November 2006 to July 2010, Chief Financial Officer at Telenor Pakistan Pvt. Ltd (TP) from June 2004 to October 2006, Chief Financial Officer at Telenor Mobile Sverige (TMS), Sweden, from August 2001 to May 2004, Chief Financial Officer at Mobyson, Norway from May 2000 to July 2001 and an Auditor at PricewaterhouseCoopers, Sweden, from September 1997 to April 2000. He holds a Master in Science degree in Business and Economics from the University of Uppsala, Sweden in 1997.
The Directors’ terms of appointment end at the close of the fifth annual general meeting after the date of their appointment. At a general meeting of shareholders, the shareholders may remove any Director before the expiration of his term of office. A Director’s term of office will automatically terminate upon bankruptcy, if he is put under custody by court order, upon his resignation or death or in the event that the Director is prohibited by law from holding such position. In the event any member of the Board of Directors resigns, a written notice of such resignation must be submitted by the resigning Director to us, for the attention of the Board of Commissioners and Board of Directors. We are required to convene a general meeting of shareholders to resolve such resignation within 60 days after we receive the resignation letter. Within 45 days after a vacancy is created on the Board of Directors that causes the number of members of the Board of Directors to be less than the minimum required number of Directors as stipulated in our Articles of Association, a general meeting of shareholders must be convened to fill the vacancy. A member of the Board of Directors may not assume a concurrent position, which may cause a conflict of interest, directly or indirectly, with our interests. A member of the Board of Directors may assume a concurrent position that does not cause a conflict of interest, subject to the approval of the Board of Commissioners and notification to a general meeting of shareholders. Should the President Director want to assume a concurrent position of this type, the approval of a general meeting of shareholders is also required. The business address of the Board of Directors is Jalan Medan Merdeka Barat 21, Jakarta, 10110, Republic of Indonesia.
None of our Commissioners or Directors has a service contract with us, nor are any such contracts proposed or under consideration. There is no family relationship between or among any of the Commissioners or Directors listed above.
107
Compensation of Commissioners and Directors
For their services, our Commissioners and Directors are entitled to remuneration, which is determined by the annual general meeting of shareholders. The net amount of remuneration paid to our Commissioners and Directors for the year ended December 31, 2013, including basic compensation and short and long-term incentives, was Rp41,672 billion (US$3,418 million).
The remuneration of our Directors is determined by the Board of Commissioners, pursuant to a delegation of authority by the shareholders in a general meeting. In making its determination, the Board of Commissioners must consider any recommendations provided by our Remuneration Committee and must report the determination to our shareholders at the annual general meeting of shareholders. Since 2006, semi-annual incentives were eliminated and we introduced a Restricted Share Unit Plan as a long-term incentive for Commissioners and an Economic Profit Sharing Plan for Directors which is divided into cash bonus payment as short-term incentive and Restricted Share Unit Plan as long-term incentive.
Pension, Retirement and Other Benefits
We and Lintasarta have defined benefit and contribution pension plans that cover substantially all of our qualified permanent employees. PT Asuransi Jiwasraya, a state-owned life insurance company, manages the plans and the amount of pension benefits to be paid upon retirement is based on the employees’ most recent basic salary and their number of years of service.
For the year ended December 31, 2013, we, Lintasarta and IM2 incurred a total benefit of Rp180.2 billion (US$14.8 million) for pension, post-retirement benefits (i.e., benefits under Labor Law 13) and post-retirement healthcare for our employees. As of December 31, 2013, we and Lintasarta also recognized total prepaid pension costs of Rp127.7 billion (US$10.5 million), while we, Lintasarta and IM2 recognized total accrued liability of post-retirement benefits and post-retirement healthcare of Rp765.2 billion (US$62.8 million). For more information about our pension plan, including the total amount set aside to provide pension, retirement or similar benefits, see Note 22 and Note 30 to our audited consolidated financial statements.
Board Practices
Our Board of Commissioners acts as our overall supervisory and monitoring body with principal functions including reviewing our development plan, monitoring the performance of our work plan and reviewing and approving our budget. It is required to perform its duties, authorities and responsibilities in accordance with the provisions of our Articles of Association and resolutions of the shareholders’ general meeting. Decisions above certain monetary thresholds must be referred by our Board of Directors to our Board of Commissioners or shareholders for their review and approval. In carrying out its supervisory activities, the Board of Commissioners represents the interests of our Company.
Meetings of our Board of Commissioners must be held at least once every three months, or when deemed necessary by the President Commissioner or upon request of at least one-third of the total members of the Board of Commissioners. A meeting of the Commissioners may make lawful and binding decisions only if a majority of the Commissioners are present or represented. At any meeting each Commissioner is entitled to one vote and, in addition, may cast one vote for each Commissioner he is representing. A Commissioner may be represented at a meeting of the Commissioners only by another Commissioner appointed pursuant to a power of attorney. Except as otherwise provided in our Articles of Association, resolutions of the Board of Commissioners must be adopted by deliberation and consensus. If no agreement is reached through this method, resolutions must be passed by a simple majority of the Commissioners. In the event of a tie vote, the proposal is deemed rejected unless the matter concerns an individual, in which case the President Commissioner may cast the deciding vote. The Board of Commissioners may adopt lawful and binding decisions without convening a meeting of the Commissioners if all of the members of the Board of Commissioners approve and sign the decision.
108
Our Board of Directors is generally responsible for managing our business in accordance with applicable laws, our Articles of Association and the policies and directives issued by the general meeting of shareholders and the Board of Commissioners. The President Director alone has the authority to represent and act on behalf of the Board of Directors and our Company. However, if the President Director is absent or unavailable, then one of the Directors designated by the President Commissioner shall have such authority to represent the Directors.
The Board of Directors must obtain written approval from the Board of Commissioners to: (i) purchase and/or sell shares of other companies in the capital markets; (ii) enter into, commit to enter into, amend and/or terminate a license agreement or cooperation, joint venture, management and similar agreement with other enterprises or parties; (iii) purchase, dispose, sell, pledge or encumber all or part of the business, title to or the fixed or other assets of our Company (including any interest therein); (iv) cease to collect and write-off accounts receivable from the books as well as supplies of goods; (v) bind our Company as guarantor (borg or avalist) or in any other way in which our Company becomes liable to another party’s debt obligation, whether by an agreement to take over another party’s debt, an agreement to grant financing to another party to purchase goods or services, or by the purchase of shares, capital participation, advance payment or loan to pay in full another party’s debt; (vi) accept or grant or commit to grant medium/long-term loans and accept or grant non-operational short-term loans (except for granting loans to a subsidiary and/or employees of our Company which have been approved pursuant to applicable internal procedures); (vii) conduct the expenditure of capital goods in a transaction or an inter-related transaction with a nominal value higher than the permitted value determined by the Board of Commissioners from time to time; (viii) issue bonds or other securities than can be converted into shares; (ix) propose the issuance of new shares of our Company; (x) provide an indemnity to or otherwise guarantee the obligation of any person; (xi) determine and/or change our Company’s management structure; (xii) make a new business plan or change the business plan; (xiii) change the accounting, financial, or tax practice and system of our Company or our subsidiary; (xiv) change our Company’s name; (xv) approve the financial statement provided to the shareholders in the GMS; (xvi) determine the annual budget of our Company and the annual budget of a subsidiary; (xvii) carry out capital participation or dispose capital participation of our Company in other enterprises that are not carried out through the capital markets; (xviii) establish a subsidiary or approve the relinquishment or the reduction of its interest, whether directly or indirectly, in each of the subsidiaries, or take over the shares in any company or relinquish any shares in any company; (xix) take any corporate action or investments related to any subsidiary of our Company; (xx) use any right of the shareholders in our Company’s subsidiary, or any other company in which our Company has a share participation; (xxi) approve the payment of any bonus or similar payment to our Company’s employees or change the remuneration structure of employees; (xxii) undertake a merger, consolidation, acquisition or separation, each as defined under the Law No. 40 of 2007 on Limited Liability Companies, as amended; (xxiii) establish or change our Company’s asset liability management policy; (xxiv) establish or change standing delegations among members of the Board of Directors relating to signing authority limits for expenditures, assets purchases and sales, loans and other commitments; and (xxv) engage in any other material transaction or matters as may be determined by the Board of Commissioners from time to time having a value of the lower of 5.0% or more of total revenue or 2.5% or more of our non-current assets on a consolidated basis as set out in our audited consolidated financial statements. The Board of Commissioners shall be obligated to determine thresholds in respect of the actions referenced to in (i) to (viii), (x) and (xxi) above and shall be entitled to change such thresholds from time to time. In the event actions are taken within the applicable threshold, then the approval from the Board of Commissioners’ is not required. In granting a written approval for the actions above, the Board of Commissioners must observe prevailing capital markets regulations.
Meetings of the Board of Directors are convened when called by the President Director, or when requested by more than one-third of the total members of the Board of Directors. A meeting of the Directors is valid and entitled to adopt binding decisions only if a majority of the Directors are present or represented. A Director may be represented at a meeting of the Board of Directors only by another Director appointed pursuant to a power of attorney issued for that particular purpose. At any meeting of the Board of Directors each Director is entitled to one vote and, in addition, one vote for each other Director he is representing. Resolutions of the Board of Directors must be adopted by deliberation and consensus. If no agreement is reached by deliberation and
109
consensus, the resolutions must be passed by a majority vote, and, in the event of a tie vote, the President Director has a deciding vote. The Board of Directors may adopt valid and binding resolutions without convening a meeting of the Directors if all of the Directors approve and sign the resolutions in writing.
Individual Directors are charged with specific responsibilities. In the event that a vacancy occurs in the Board of Directors, so long as the position remains vacant, one of the other Directors will be nominated by the Board of Commissioners to perform the work of the absentee Director. If, for any reason, we cease to have any Directors, the Board of Commissioners is to assume the ongoing obligations of the Board of Directors and must convene a general meeting of shareholders to elect a new Board of Directors within 45 days.
Our Articles of Association provide that if there is a conflict between our interests and those of a Director, then with the approval of the Board of Commissioners, we shall be represented by another member of the Board of Directors. If all Directors have a conflict, we shall be represented by the Board of Commissioners or one Commissioner designated by the President Commissioner. If the entire Board of Commissioners has a conflict, the shareholders may appoint one or more persons to represent us at the general meeting of shareholders.
Audit Committee
In accordance with BAPEPAM-LK, IDX and NYSE regulations, we have formed an independent Audit Committee, consisting of five persons and chaired by one of the Independent Commissioners. The duties of the Audit Committee include providing professional, independent advice to the Board of Commissioners and identifying matters that require the attention of the Board of Commissioners, including a review of the following: our financial information (including financial reports and projections); the independence and objectivity of our public accountant; the adequacy of our public accountant’s audits that all material risks have been considered; the adequacy of our internal controls; our compliance as a listed company with the prevailing capital markets regulations and other regulations related to our business and our internal auditors’ duties. The Audit Committee also examines and reports complaints to the Board of Commissioners, maintains the confidentiality of documents, data and information relating to us, conducts an audit of any alleged mistake in the resolutions of a Board of Directors’ meeting or deviations in the implementation of the resolutions of such meeting and maintains the Audit Committee charter.
On June 18, 2013, Richard Farnsworth Seney was appointed as Chairman of the Audit Committee. As of December 31, 2013, the members of our Audit Committee were Richard Farnsworth Seney (Chairman), Rudiantara, Chris Kanter, Kanaka Puradiredja and Unggul Saut Marupa Tampubolon. BAPEPAM-LK regulations require at least two outside persons to serve as members of the Audit Committee. As of December 31, 2013, two of the members of our Audit Committee, Kanaka Puradiredja and Unggul Saut Marupa Tampubolon, were independent outside Commissioners. We have posted the written charter of the Audit Committee dated September 4, 2013 on our website atwww.indosat.com, where it is publicly available.
Such charter is reviewed annually and a revised charter has been approved by our Board of Commissioners and is attached hereto as Exhibit 15.13.
Remuneration Committee
Our Remuneration Committee is responsible for providing recommendations to our Board of Commissioners regarding remuneration, bonuses and other benefits for members of our Board of Commissioners and Board of Directors as well as employees, including the structure, terms and issuance of stock options. As of December 31, 2013, the members of our Remuneration Committee were Dr. Nasser Mohammed Marafih, Soeprapto S.IP., Rudiantara and Cynthia Alison Gordon. We have posted the written charter of the Remuneration Committee on our website atwww.indosat.com, where it is publicly available.
110
Risk Management Committee
On October 26, 2005, we established a Risk Management Committee, which reports to our Board of Commissioners. Our Risk Management Committee evaluates potential risks regarding our business and provides recommendations to our Board of Commissioners regarding our policies regarding risk assessment and risk management, including making recommendations for improvements to our existing procedures as necessary. As of December 31, 2013, the members of our Risk Management Committee were Rachmat Gobel (Chairman), Rionald Silaban, Richard Farnsworth Seney and Cynthia Alison Gordon We have posted the written charter of the Risk Management Committee on our website atwww.indosat.com, where it is publicly available.
Budget Committee
Our Budget Committee assists the Board of Commissioners in performing the Board’s supervisory and advisory duties by reviewing and giving its recommendations to the Board in relation to our strategic plans, the annual work plan and budget (which includes the capital expenditure plan). As of December 31, 2013, the members of our Budget Committee were Dr. Nasser Mohammed Marafih (Chairman), Richard Farnsworth Seney, Chris Kanter and Cynthia Alison Gordon.
Employees
As of December 31, 2013, on a consolidated basis, we employed 4,200 employees, 3,956 of whom were permanent employees and 244 of whom were non-permanent employees. As of December 31, 2013, excluding seconded employees, our subsidiaries employed approximately 910 permanent employees. As of December 31, 2013, our permanent employees included 997 managerial-level employees (employees with the rank of manager or higher) and 2,049 non-managerial employees, compared to 957 managerial-level employees and 2,010 non-managerial employees as of December 31, 2012, and 900 managerial and 1,948 non-managerial employees as of December 31, 2011. Our turnover rate for employees during 2013 was 2.98% per annum, representing a decrease from 5.6% in 2012 (due to the VSS Program). As a result, as of December 31, 2013, our employees had worked for us for an average of 12.8 years.
We provide a number of benefits to our employees, including a pension plan, medical benefits, life insurance, income tax allowances and access to a cooperative established by the employees.
Some of our employees are entitled to a pension under a defined benefit plan, pursuant to which they receive both a lump sum payment and a monthly benefit through an insurance program managed by PT Asuransi Jiwasraya (Persero), a state-owned insurance company. As of December 31, 2013, we insured 1,482 permanent employees through a fully-funded pension program. In this program, an employee who resigns at 56 years of age will receive a pension benefit. In addition, we established a defined contribution pension plan for our employees in May 2001. Following the merger of Satelindo and PT Indosat Multimedia Mobile into Indosat, we combined the defined contribution plans established for our legacy subsidiaries’ employees with our plan. Under the defined contribution plan, employees contribute between 10.0% and 13.33% of their base salary to the plan. We then make a contribution to the plan equivalent to 50% of each employee’s contribution.
On December 12, 2013, we implemented an employment termination program as part of our reorganization plan under which employees whose employment are terminated will receive severance benefits. As of December 31, 2013, 214 employees were terminated under this employment termination program as approved by the Board of Directors.
On August 25, 1999, our employees established the Indosat Workers Union (Serikat Pekerja Indosat or “SPI”). On September 15, 2006, our management and SPI signed a collective labor agreement covering general terms of employment, including working hours, payroll, employee development and competency, occupational safety and health, employees’ welfare, social allowances, employees’ code of conduct and mechanisms for
111
handling disputes. This collective labor agreement was renewed on January 1, 2013 which is valid until December 31, 2014. We believe we maintain a good relationship with the union. As stipulated by Article 7.3 of the collective labor agreement, we conduct meetings with the union at least once every three months.
Our employees have also established the Indosat Employees Cooperative (Koperasi Pegawai Indosat or “Kopindosat”). Kopindosat provides various benefits, such as consumer loans, principally to our employees, and car and equipment rental, principally to us. The management of Kopindosat is elected by our employees every three years at a members’ meeting. Kopindosat has a minority stake in some of our affiliates. We have also temporarily seconded several of our employees to support Kopindosat and its subsidiaries in conducting their business, as well as to provide job training for its employees.
Share Ownership
One of our directors beneficially owns less than one percent of our common stock and his beneficial share ownership in us has been recorded in our special register.
Item 7: MAJOR SHAREHOLDERS AND RELATED PARTY TRANSACTIONS
As of December 31, 2013, our issued and fully paid capital was divided into one Series A share and 5,433,933,499 Series B shares, each with a par value of Rp100. The Government, through the Ministry of State-Owned Enterprises, owns the one Series A share and has special voting rights, and owns 776,624,999 Series B shares representing 14.29% of our shares. Ooredoo Asia owns 3,031,528,000 Series B shares and 500,528,600 Series B shares underlying our ADSs, or a total of 3,532,056,600 Series B shares representing 65.00% of our shares. SKAGEN AS owns 298,880,950 Series B shares representing 5.50% of our shares. As of December 31, 2013, 24,445,450 of our ordinary shares underlying our ADSs (excluding those owned by Ooredoo Asia and SKAGEN), representing in aggregate approximately 0.40% of our outstanding shares, and 802,925,500 Series B shares (excluding those owned by Ooredoo Asia, the Government and SKAGEN) representing 14.80% of our shares, were held by the public. Because many of our Series B shares and ADSs were held by brokers and other institutions on behalf of security holders in street name, we believe that the number of beneficial holders of our ordinary shares is higher. We have voluntarily delisted trading of our ADSs on the NYSE effective May 17, 2013, and since then our ADSs have not been listed or quoted on any national securities exchange in the United States. We will continue to be subject to reporting obligations under the Exchange Act until such time as we can terminate the registration of our securities under it.
The following table sets forth information as of December 31, 2013 regarding (i) persons known to us to own more than 5.0% of our common stock (whether directly or beneficially through the ADSs) and (ii) the total amount of any class of our common stock owned by individual members of the Board of Commissioners and the Board of Directors:
| | | | | | | | | | |
Title of class | | Name | | Number of
Shares Held | | | Percentage
of Total
Outstanding
Shares of Class | |
Series A | | Government | | | 1 | | | | 100.00 | % |
Series B | | Ooredoo Asia(1) | | | 3,532,056,600 | | | | 65.00 | |
Series B | | Government | | | 776,624,999 | | | | 14.29 | |
Series B | | SKAGEN AS | | | 298,880,950 | | | | 5.50 | |
Series B | | Fadzri Sentosa | | | 10,000 | | | | 0.00 | * |
| (1) | Ooredoo Asia is wholly owned by Ooredoo. |
112
The Government
Prior to our initial public offering in 1994, the Government owned 100% of our outstanding common stock. As of the beginning of 2002, the Government owned 65.0% of our outstanding common stock. By virtue of its common stock ownership, the Government had retained control over us and had the power to elect all of our Board of Commissioners and our Board of Directors and to determine the outcome of substantially all actions requiring the approval of our shareholders. In addition, pension plans, insurance funds and other Indonesian investors owned or controlled, directly or indirectly, by the Government, purchased shares of common stock in the initial public offering.
On May 16, 2002, the Government sold 8.1% of our outstanding common stock through an accelerated global tender, reducing the Government’s shareholding to 56.9%. On December 20, 2002, the Government sold 41.9% of our outstanding common stock to ICLM (described below), further reducing the Government’s shareholding to 15.0%. Although Government’s ownership has been reduced, the Government retains a significant degree of influence over us through the one Series A share.
As the holder of the one Series A share, the Government has special voting rights. The material rights and restrictions which are applicable to our common stock are also applicable to the one Series A share, except that the Government may not transfer the Series A share. In addition, through the Series A share, the Government has veto rights with respect to: (i) increases in our share capital without pre-emptive rights; (ii) mergers, consolidations, acquisitions and demerger involving us; (iii) dissolution, liquidation and bankruptcy; (iv) amendments to our Articles of Association related to our purposes and objectives and the Series A holder’s veto rights.
ICLM and Ooredoo Asia
On December 15, 2002, ICLM, which, at the time was a subsidiary of STT, entered into a share purchase agreement and a shareholders’ agreement with the Government, acting through the Ministry of State-Owned Enterprises in its capacity as our shareholder. STT is 100% owned by ST Telemedia, which is indirectly owned by Temasek Holdings (Private) Limited. Pursuant to the share purchase agreement, the Government sold to ICLM 434,250,000 Series B Shares representing 41.9% of the total outstanding Series B Shares. After consummation of this sale and purchase, the Government held 155,324,999 Series B Shares, representing 15.0% of the total outstanding Series B Shares. As of May 4, 2006, ICLM owned 2,171,250,000 (39.96%) of our Series B shares, the Government owned one Series A share and 776,624,999 of our Series B shares (14.29%) and ICLS, an affiliate of ICLM, owned 46,340,000 (0.85%) of our Series B shares.
On January 17, 2007, ICLM notified us regarding the intention of Ooredoo to make an equity investment of approximately 25.0% in AMH which, at the time, was wholly owned by STT, which we understand closed on March 1, 2007. Upon the closing of the transaction, STT effectively controlled approximately 75.0% of AMH, which directly owns ICLM and ICLS.
On June 22, 2008, following negotiations with ST Telemedia, Ooredoo purchased all of the issued and outstanding shares of capital stock of each of ICLM and ICLS. Pursuant to the share purchase agreement, Ooredoo, through its subsidiary Qatar South East Asia Holding S.P.C., acquired all of the capital stock of ICLM and ICLS from AMH, which is 75.0% indirectly owned by STT and 25.0% indirectly owned by Ooredoo. Following this acquisition, pursuant to Indonesian law requirements, Ooredoo conducted a mandatory tender offer to acquire up to 24.19% of our outstanding Series B Shares (including Series B Shares underlying ADSs) and as of December 31, 2013 owned 65.0% of our shares. On June 4, 2009, ICLM sold its 39.96% ownership in our Company to ICLS and, pursuant thereto, ICLS became the legal owner of 3,532,056,600 shares representing 65.0% of our shares. On September 11, 2009, ICLS changed its name to Qatar Telecom (Qtel Asia) Pte. Ltd. and on March 7, 2013, Qatar Telecom (Qtel Asia) Pte. Ltd. changed its name to Ooredoo Asia. Ooredoo is 68%-owned by the Qatar government.
113
Ooredoo provides significant financial expertise, procurement, legal, operational, network build and maintenance, marketing, human resources, business development and technical support to us. Ooredoo has management representation in us and actively participates in business strategy formulation. We intend to take advantage of synergies existing and created by our membership in the Ooredoo group of companies, thereby enhancing our position in the Indonesian telecommunications market.
SKAGEN AS
In September 2010, we were informed by SKAGEN AS, a Norwegian investment company with eleven mutual funds under management, that through certain purchases of our ADSs, it owns more than 5% of our shares. As of December 31, 2013 SKAGEN AS owned approximately 5.50% of our shares.
Related Party Transactions
We are a party to certain agreements and engage in transactions with a number of entities that are related to us, including joint venture companies, cooperatives and foundations, as well as our controlling shareholders, the Government and Ooredoo Asia, and entities that are related to or owned or controlled by the Government and Ooredoo Asia. As of December 31, 2013, the most significant of these transactions include cash and cash equivalents in the amount of Rp879.0 billion (US$72.1 million) deposited in state-owned banks, operating revenues from Telkomsel amounting to Rp637.2 billion (US$52.3 million) and a short-term loan from Mandiri amounting to Rp1,499.8 billion (US$123.0 million). For further information on interest rate in relation to our outstanding loans, see “Item 5: Operating and Financial Review and Prospects—Liquidity and Capital Resources—Cash Flows—Principal Indebtedness.” In addition, we are a party to various agreements with other state-owned entities such as insurance companies, banks and various suppliers.
In 2012, we entered into an agreement with Ooredoo Group LLC (“Ooredoo Group”) pursuant to which Ooredoo Group agreed to provide project management and consultancy services at our request. This agreement has an unlimited term until terminated by mutual consent of the parties thereto or upon the liquidation or insolvency of any of the parties thereto. Terms and conditions of such services are to be provided at arm’s length terms which are to be agreed upon on a project by project basis. In 2013, Ooredoo Group provided consultancy services to assist us among others in the improvement of our sourcing system and processes, enhancement of our corporate governance practices and business development for an aggregate consideration of Rp21.5 billion (US$1.8 million).
In 2012, we entered into an agreement with Ooredoo Group pursuant to which Ooredoo Group agreed to provide its personnel to be seconded at our Company at our request. Under the terms of this agreement, our Company will bear all expenses relating to each seconded personnel. This agreement is valid from January 1, 2012 for a period of five years and shall be automatically extended for additional terms of one year unless terminated by mutual consent of the parties thereto or upon the liquidation or insolvency of any of the parties thereto. In 2013, several Ooredoo Group personnel were seconded at our Company who assumed various roles among others in network and technological development, marketing and finance, for an aggregate consideration of Rp.44.3 billion (US3.6 million).
For a discussion of some of significant transactions entered into with related parties, see Note 31 of our consolidated financial statements included elsewhere in this annual report.
Item 8: FINANCIAL INFORMATION
Consolidated Financial Statement and Other Financial Information
See “Item 17: Financial Statements” for our audited consolidated financial statements filed as part of this annual report. No significant changes have occurred since the date of our audited consolidated financial statements.
114
Legal Proceedings
From time to time, we are involved in legal proceedings concerning matters arising in connection with the conduct of our business. We are not currently involved in, and have not recently been involved in, any legal or arbitration proceedings that we believe would be likely to have a material effect on our financial condition or results of operations other than as disclosed in this annual report.
On May 5, 2004, we received the Supreme Court’s verdict No. 1610K/PDT/2003 in favor of Primer Koperasi Pegawai Kantor Menteri Negara Kebudayaan dan Pariwisata (known as Primkopparseni), regarding a disputed foreign currency exchange transaction. The court’s judgment required us to pay Rp13.7 billion plus 6.0% interest per annum from February 16, 1998 until the final settlement date and on December 22, 2004, we satisfied the judgment through payment of Rp19.3 billion to the Central Jakarta District Court. Furthermore, in January 2005, we filed a motion for reconsideration against the Supreme Court’s verdict. As of April 24, 2014, the Supreme Court has not issued a verdict for the reconsideration.
On November 1, 2007, the KPPU issued a decision regarding a preliminary investigation involving us and eight other telecommunication companies based on allegations of price-fixing for SMS services and breach of Article 5 of the Anti-monopoly Law. On June 18, 2008, the KPPU determined that Telkom, Telkomsel, XL, Bakrie Telecom, Mobile-8 and Smart Telecom (as of March 2011, Mobile-8 had changed its name to PT Smartfren Telecom Tbk) had jointly breached Article 5 of the Anti-monopoly Law. Mobile-8 appealed this ruling to the Central Jakarta District Court, where Telkomsel, XL, Telkom, Indosat, Hutchison, Bakrie Telecom, Smart Telecom, Natrindo were summoned to appear as co-defendants in the hearing, while Telkomsel appealed this ruling to the South Jakarta District Court. Although the KPPU decided in our favor with respect to the allegations of price-fixing of SMS, we cannot assure you that the District Court will affirm the KPPU decision. In 2011, the Supreme Court issued a ruling appointing the Central Jakarta District Court jurisdiction to examine the objections filed in the appeal of the KPPU decision. The District Court will consider objections against the KPPU decision based on a re-examination of the KPPU decision and case files submitted by KPPU. As of April 24, 2014, we have not received any notification from the District Court with respect to the resolution of this case.
On January 13, 2012, Mr. Indar Atmanto, the former President Director of IM2 was accused of corruption by the AGO. According to the AGO, a state loss amounting to Rp1,358.3 billion was caused by an agreement between IM2 and our Company, related to the alleged illegal use by IM2 of our Company’s 2.1 GHz frequency band. The MOCIT issued letter No. 65/M.KOMINFO/02/2012 on February 24, 2012 stating that there was no breach of law, crime committed, and no state loss resulting from the agreement between our Company and IM2. Moreover the MOCIT has also sent a letter to the AGO directly which states that neither our Company nor IM2 has violated any regulation and the collaboration between our Company and IM2 is lawful under the prevailing laws and regulations and common practices in the telecommunication industry. In addition, the ITRA publicly stated that IM2 had not breached any laws or prevailing rules. However, the AGO ignored the letters from the MOCIT and, on November 30, 2012, named our former President Director as a suspect and, on January 3, 2013, also named IM2 and our Company as corporate suspects. On July 8, 2013, the Corruption Court found Mr. Atmanto guilty of corruption and sentenced him to four years imprisonment and a monetary fine of Rp200 million (or an additional three months’ imprisonment). Furthermore, the Corruption Court found IM2 liable for restitution for state losses caused by such transaction and imposed a monetary fine of Rp1,358.3 billion. On July 11, 2013, Mr. Atmanto lodged his appeal against the Corruption Court’s ruling. On January 10, 2014, the Central Jakarta’s High Court affirmed the Corruption Court’s decision and imposed a higher sentence of eight years’ imprisonment and a separate monetary fine of Rp200 million (or an additional three months’ imprisonment). However, the High Court found that the Corruption Court could not impose a monetary sanction against IM2 which, as a separate legal entity, had not been separately indicted in the AGO’s litigation against Mr. Atmanto, and reversed the Corruption Court’s decision with respect to IM2. On January 23, 2014, Mr. Atmanto filed a petition for appeal to the Supreme Court and, on February 7, 2014 submitted memoranda of appeal. As of April 24, 2014, Mr. Atmanto had not received any decision from the Supreme Court with respect to
115
his appeal. As of the same date, our former President Director, IM2 and our Company had not been formally charged for any wrongdoing in relation to this subject matter.
On December 24, 2008, we received the DGT’s Decision Letter which increased the overpayment amount by Rp84,650 million in the assessment letter on tax overpayment (SKPLB) for fiscal year 2004, which amount was lower by Rp41,753 million than the amount stated in an earlier Decision Letter received on July 4, 2008. On January 21, 2009, we filed suit objecting to the discrepancy in the amount of tax overpayment during fiscal year 2004. On February 2, 2009, the Company received the tax refund from the Tax Office of Rp84,650 million. With respect thereto, on December 4, 2009, the Tax Court revoked the DGT’s Decision Letter dated December 24, 2008 above. On March 17, 2010, the DGT issued a decision favorable to the Company, informing it that the tax overpayment for fiscal year 2004 should be Rp126,403 million instead of Rp84,650 million, which would entitle the Company to get a refund of the difference, amounting to Rp41,753 million. The Company subsequently received the payment of such tax refund amounting to Rp41,753 million from DGT on April 13, 2010. On March 5, 2012, the Company received a Tax Court’s Decision Letter accepting the Company’s request for interest compensation related to the issuance of an assessment letter of tax overpayment (SKPLB) for fiscal year 2004 amounting to Rp60,674 million. Based on the Company’s evaluation, the realization of income related with the interest compensation was only probable, instead of virtually certain. Therefore, the interest compensation was not recognized in the Company’s 2012 financial statements. On June 29, 2012, the Company received a copy of a memorandum for reconsideration request from the Tax Court to the Supreme Court on the Tax Court’s Decision Letter dated March 5, 2012 related to the interest compensation above. On July 27, 2012, the Company submitted a counter-memorandum for reconsideration request to the Supreme Court. As of April 24, 2014, the Company has not received any decision from the Supreme Court with respect to such request.
On June 8, 2009, the Company received an assessment letter on tax underpayment (SKPKB) from the DGT for Satelindo’s corporate income tax for fiscal year 2002 amounting to Rp105,809 million (including penalties and interest), which was paid in July 2009. The Company accepted a part of the correction of the 2002 corporate income tax amounting to Rp2,646 million which was charged to 2009 current operations. Under Indonesian Tax Law, a taxpayer is required to pay the tax underpayment amount as stated in such assessment letter within one month from the date of such assessment letter. The taxpayer can reclaim the tax paid through an objection or appeal process. On August 28, 2009, the Company submitted an objection letter to the Tax Office regarding the remaining correction on Satelindo’s 2002 corporate income tax. On July 15, 2010, the Company received the DGT’s Decision Letter declining the Company’s objection to the correction on Satelindo’s corporate income tax for fiscal year 2002. On October 14, 2010, the Company submitted an appeal letter to the Tax Court concerning the Company’s objection to the correction on Satelindo’s corporate income tax for fiscal year 2002. On June 25, 2012, the Company received the Tax Court’s Decision Letter rejecting the Company’s appeal on Satelindo’s corporate income tax for fiscal year 2002. The Company charged the related claim for tax refund amounting to Rp103,163 million to 2012 operations as part of “Current Income Tax Expense.”
On June 8, 2009, the Company also received SKPKB from the DGT for Satelindo’s 2002 and 2003 income tax article 26 amounting to Rp51,546 million and Rp40,307 million (including penalties and interests), respectively. On August 27, 2009, the Company submitted an objection letter to the Tax Office for the correction of the Satelindo’s 2002 and 2003 income tax article 26. On July 16, 2010, the Company received the DGT’s Decision Letters declining the Company’s objection to the correction of the Satelindo’s 2002 and 2003 income tax article 26. On October 12, 2010, the Company submitted appeal letters to the Tax Court concerning the Company’s objection to the correction of Satelindo’s 2002 and 2003 income tax article 26. On November 6, 2012, the Company received the Tax Court’s Decision Letters accepting the Company’s appeal on Satelindo’s 2002 and 2003 income tax article 26 amounting to Rp87,198 million, which amount is lower than the amount recognized by the Company in its financial statements. The Company accepted the corrections amounting to Rp4,655 million which was charged to 2012 operations as part of “Others—net.” On January 28, 2013, the Company has received the restitution.
116
On September 7, 2009, the Company received the DGT’s Decision Letter which declined the Company’s objection to the remaining corrections of the 2006 corporate income tax. On December 2, 2009, the Company submitted an appeal letter to the Tax Court regarding the remaining corrections of the Company’s 2006 corporate income tax. On April 26, 2011, the Company received the Tax Court’s Decision Letter which accepted the Company’s appeal on the remaining correction of the 2006 corporate income tax. On June 21, 2011, the Company received a tax refund amounting to Rp82,626 million. On August 22, 2011, the Company received a copy of a memorandum for reconsideration request from the Tax Court to the Supreme Court on the Tax Court’s Decision Letter dated April 26, 2011 for the 2006 corporate income tax. On September 21, 2011, the Company submitted a counter-memorandum for reconsideration request to the Supreme Court. As of April 24, 2014, the Company has not received any decision from the Supreme Court with respect to such request.
On May 25, 2010, the Company received the Tax Court’s Decision Letter which declined the Company’s appeal in May and September 2008 to the correction of the 2004 and 2005 income tax article 26 in the amount of Rp60,493 million and Rp82,126 million, respectively. The Company charged the tax correction to 2010 operations, which was presented as part of “Other Income (Expenses)—Others—Net.”
On September 17, 2010, the Company received Tax Collection Letters (“STPs”) from the DGT for the underpayment of the Company’s 2008 and 2009 income tax article 26 totaling Rp80,018 million (including interest). On October 13, 2010, the Company submitted cancellation letters to the Tax Office regarding such STPs. Subsequently, on November 16, 2010, the Company was required to pay a certain portion of these STPs by using the approved tax refund claim for the Company’s corporate income tax for fiscal year 2005 amounting to Rp38,155 million. On January 7, 2011, the Company paid the remaining amount of Rp41,863 million. On April 11, 2011, the Company received a letter from the Tax Office which declined the request for cancellation of such STPs. On May 5, 2011, the Company submitted an appeal letter to the Tax Court concerning these STPs. On July 30, 2012, the Company received the Tax Court’s Decision Letter accepting the Company’s appeal. On September 11, 2012, the Company submitted a request for restitution to the Tax Office to transfer the tax overpayment related to these STPs. On December 26, 2012 the Company received a copy of a memorandum for reconsideration request from the Tax Court to the Supreme Court’s decision letter dated July 30, 2012 for the underpayment of the Company’s 2008-2009 income tax article 26. On February 6, 2013, the Company submitted a counter-memorandum for reconsideration request to the Supreme Court. On October 25 and November 4, 2013, the Company received the refund totaling Rp80,018 million.
On October 29, 2010, the Company received the Tax Court’s Decision Letter which accepted the Company’s appeal in August 2008 to the correction of the 2005 corporate income tax amounting to Rp38,155 million, which was offset against the underpayment of the Company’s 2008 and 2009 income tax article 26 based on STPs received by the Company on September 17, 2010. On February 24, 2011, we received a copy of a memorandum for reconsideration request from the Tax Court to the Supreme Court on the Tax Court’s Decision Letter dated October 29, 2010, regarding our 2005 corporate income tax. On March 25, 2011, the Company submitted a counter memorandum for reconsideration request to the Supreme Court. As of April 24, 2014, the Company has not received any decision from the Supreme Court with respect to such request.
On April 21, 2011, the Company received assessment letters on tax underpayment (SKPKB) from the DGT for the Company’s VAT for the period from January to December 2009, totaling Rp182,800 million (including penalties), which was paid on July 15, 2011. The Company accepted a part of the corrections amounting to Rp4,160 million, which was charged to 2011 operations, which left a balance of Rp178,640 million which the Company is objecting. On July 19, 2011, the Company submitted objection letters to the Tax Office regarding the remaining correction on the Company’s VAT for such period. On June 4, 2012, the Company received the DGT’s decision letters that declined the Company’s objections and, based on its audit, the DGT charged the Company for additional underpayment for the period of January, March, April, June, August to December 2009 totaling Rp57,166 million and overpayment for the period of February, May and July 2009 totaling Rp4,027 million. On July 4, 2012, the Company paid the additional underpayment amounting to Rp57,166 million. On August 24, 2012 and August 31, 2012, the Company received the overpayment amounting to Rp3,839 million
117
and Rp188 million, respectively. On September 3, 2012, the Company submitted appeal letters to the Tax Court regarding the remaining correction on the Company’s VAT for the period January to December 2009 totaling Rp231,778 million (comprised of the initial claim of Rp178,640 million and assessed VAT underpayment of Rp57,166 million net of refunded VAT overpayment of Rp4,027 million). On February 12, February 19 and February 20, 2014, the Company received the Tax Court’s decision letters which accepted the Company’s appeal, however it also charged for a separate VAT underpayment totaling Rp180,930 million, which left a balance of Rp50,848 million for which the Company is eligible for refund. During April 15 and 23, 2014, the Company received the remaining tax refund.
On April 21, 2011, the Company also received an assessment letter on tax overpayment (SKPLB) from the DGT for the Company’s 2009 corporate income tax amounting to Rp29,272 million, which amount is lower than the amount recognized by the Company in its financial statements of Rp95,677 million, which left a balance of Rp66,405 million. The Company accepted a part of the corrections amounting to Rp835 million, which was charged to 2011 operations. On May 31, 2011, the Company received a tax refund of Rp23,695 million, net of the amount of the VAT correction for the period from January to December 2009 that the Company accepted. On July 20, 2011, the Company submitted an objection letter to the Tax Office regarding the remaining correction on the Company’s 2009 corporate income tax. On June 29, 2012, the Company received the DGT’s Decision Letter which declined the Company’s objection. On September 21, 2012, the Company submitted an appeal letter to the Tax Court concerning the Company’s objection to the correction on corporate income tax for fiscal year 2009. As of April 24, 2014, the Company has not received any decision from the Tax Court on such letter.
On July 3, 2012, the Company received an assessment letter of tax overpayment (SKPLB) from the DGT for the Company’s 2010 corporate income tax amounting to Rp89,381 million. The Company accepted all of the corrections amounting to Rp61 million, which were charged to 2012 operations. On August 24, 2012, the Company received the tax refund of its claim for 2010 corporate income tax amounting to Rp89,381 million. Based on this SKPLB, the DGT also made a correction amounting to Rp101,978 million, which decreased the tax loss carry forward as of December 31, 2010. The Company accepted the corrections amounting to Rp101,978 million.
On July 3, 2012, the Company also received an assessment letter of tax overpayment (SKPLB) from the DGT for the Company’s VAT for the period March 2010 amounting to Rp28,545 million, which amount is lower than the amount claimed by the Company in its income tax returns of Rp37,153 million, and an assessment letter of tax underpayment (SKPKB) for the Company’s VAT for the period January, February and April to December 2010 totaling Rp98,011 million (including penalties). On August 2, 2012, the Company paid the underpayment amounting to Rp98,011 million. On August 24, 2012, the Company received the overpayment amounting to Rp28,545 million from DGT. On October 1 and 2, 2012, the Company submitted objection letters to the Tax Office regarding an assessment letter of tax overpayment (SKPLB) and an assessment letter of tax underpayment (SKPKB) on the Company’s VAT for the period January to December 2010 totaling Rp106,619 million. On September 17 and 26, 2013, the Company received the DGT’s decision letter that declined the Company’s objection and the DGT charged the additional tax underpayment for the period from January to December 2010 totaling Rp93,167 million, which was paid on October 16, 2013 and October 25, 2013. On December 10, 2013, the Company submitted an appeal letter to the Tax Court with respect to the correction of the Company’s VAT for the period from January to December 2010 totaling Rp171,241 million. As of April 24, 2014, the Company has not received any decision from the Tax Court with respect to such appeal.
On June 26, 2013, the Company received an assessment letter of tax overpayment (SKPLB) from the DGT for the Company’s 2011 corporate income tax amounting to Rp97,600 million, which was received on August 14, 2013. Based on this an assessment letter of tax overpayment (SKPLB), the Tax Office made two corrections totaling Rp409,921 million, which decreased the Company’s tax loss carried forward as of December 31, 2011. On September 23, 2013, the Company submitted an objection letter to the Tax Office regarding these two corrections totaling Rp409,921 million. However, on October 16, 2013, the Company
118
submitted a letter to cancel the objection of one correction amounting to Rp165,944 million. As of April 24, 2014, the Company has not received any decision from the Tax Office with respect to the remaining objection.
On June 26, 2013, the Company also received an assessment letter of tax underpayment (SKPKB) from the DGT with respect to the Company’s VAT for the period from January to December 2011 totaling Rp133,160 million (including penalties), which was paid by the Company on July 24, 2013. The Company accepted a part of the corrections totaling Rp2,069 million, which were charged to 2013 operations. On September 23, 2013, the Company submitted objection letters to the Tax Office regarding the remaining correction on the Company’s VAT for the period January to December 2011. As of April 24, 2014, the Company has not received any decision from the Tax Office with respect to such objection.
On September 4, 2013, the Company received an assessment letter of tax underpayment (SKPKB) from the DGT for the Company’s VAT for the period from January to December 2012 totaling Rp148,161 million (including penalties), which was paid by the Company on October 3, 2013. On November 29, 2013, the Company submitted objection letters to the Tax Office with respect to the Company’s VAT for such period totaling Rp148,161 million. As of April 24, 2014, the Company has not received any decision from the Tax Office with respect to such objection.
On December 27, 2013, the Company received an assessment letter of tax underpayment (SKPKB) from the DGT for the Company’s 2007 and 2008 corporate income tax amounting to Rp110,413 million and Rp97,132 million (including penalties), respectively, which were paid on January 24, 2014. On March 20, 2014, the Company submitted objection letters to the Tax Office with respect to such underpayment.As of April 24, 2014, the Company has not received any decision from the Tax Office on the remaining objection.
We are not involved in any other material cases, including civil, criminal, bankruptcy, state administration cases or arbitration cases in the Indonesian National Board of Arbitration or labor cases in Industrial Relation Court which may materially affect our performance.
Dividend Policy
Our shareholders determine dividend payouts in the Annual General Meeting of Shareholders pursuant to recommendations from our Board of Directors. At our 2011, 2012 and 2013 Annual General Meetings of Shareholders, our shareholders declared final cash dividends amounting to 50.0% of our net income for each of the years ended December 31, 2010, 2011 and 2012, respectively. There can be no assurance that we will pay dividends in respect of any financial year. The decision of the Board of Directors to recommend a dividend payment is subject to a number of factors which include, among others, our net profits, financial performance and applicable rules and regulations.
119
Item 9: THE OFFER AND LISTING
Offer and Listing Details
The table below sets forth, for periods indicated, the reported high and low quoted prices for our common stock on the Indonesia Stock Exchange, or the IDX:
| | | | | | | | |
| | | Price per Share | |
| | | High | | | Low | |
| | | (Rp) | |
Calendar Year | | | | | | | | |
2009 | | | 5,950 | | | | 4,200 | |
2010 | | | 6,300 | | | | 4,400 | |
2011 | | | 6,000 | | | | 4,700 | |
2012 | | | 7,000 | | | | 3,425 | |
2013 | | | 7,200 | | | | 3,500 | |
| | |
Financial Quarter | | | | | | | | |
First Quarter 2012 | | | 5,950 | | | | 4,975 | |
Second Quarter 2012 | | | 5,250 | | | | 3,425 | |
Third Quarter 2012 | | | 6,400 | | | | 4,225 | |
Fourth Quarter 2012 | | | 7,000 | | | | 5,200 | |
First Quarter 2013 | | | 7,200 | | | | 5,850 | |
Second Quarter 2013 | | | 6,850 | | | | 4,750 | |
Third Quarter 2013 | | | 5,150 | | | | 4,000 | |
Fourth Quarter 2013 | | | 4,625 | | | | 3,500 | |
| | |
Month | | | | | | | | |
October 2013 | | | 4,625 | | | | 4,150 | |
November 2013 | | | 4,275 | | | | 3,500 | |
December 2013 | | | 4,150 | | | | 3,875 | |
January 2014 | | | 4,100 | | | | 3,955 | |
February 2014 | | | 4,295 | | | | 3,925 | |
March 2014 | | | 4,075 | | | | 3,775 | |
April 2014 (through April 24, 2014) | | | 3,990 | | | | 3,810 | |
120
The table below sets forth, for the periods indicated, the reported high and low quoted prices of the ADSs on the New York Stock Exchange, or the NYSE.
| | | | | | | | |
| | | Price per ADS | |
| | | High | | | Low | |
| | | (in US$) | |
Calendar Year | | | | | | | | |
2009 | | | 30 47/128 | | | | 16 189/256 | |
2010 | | | 35 37/64 | | | | 24 7/32 | |
2011 | | | 34 7 /16 | | | | 25 63/64 | |
2012 | | | 35 31/64 | | | | 27 23/32 | |
2013 (through May 17, 2013) | | | 28 | | | | 36 47/100 | |
| | |
Financial Quarter | | | | | | | | |
First Quarter 2012 | | | 31 47/64 | | | | 27 23/32 | |
Second Quarter 2012 | | | 28 3/8 | | | | 18 15/32 | |
Third Quarter 2012 | | | 31 23/32 | | | | 22 17/32 | |
Fourth Quarter 2012 | | | 36 15/32 | | | | 29 31/32 | |
First Quarter 2013 | | | 29 243/250 | | | | 36 47/100 | |
Second Quarter 2013 (through May 17, 2013) | | | 28 | | | | 34 37/50 | |
Third Quarter 2013 | | | N/A | | | | N/A | |
Fourth Quarter 2013 | | | N/A | | | | N/A | |
| | |
Month | | | | | | | | |
October 2013 | | | N/A | | | | N/A | |
November 2013 | | | N/A | | | | N/A | |
December 2013 | | | N/A | | | | N/A | |
January 2014 | | | N/A | | | | N/A | |
February 2014 | | | N/A | | | | N/A | |
March 2014 | | | N/A | | | | N/A | |
April 2014 | | | N/A | | | | N/A | |
On April 22, 2013, we announced that we intend to delist the ADSs, as evidenced by ADRs, from the NYSE and the ADSs will not be listed or quoted on another national securities exchange in the United States. On May 6, 2013, we filed a Form 25 with the U.S. Securities and Exchange Commission (the “SEC”) and consequent to the filing, the delisting of our ADSs from the NYSE became effective at the close of business of May 17, 2013. As a consequence of the delisting becoming effective, termination of the Deposit Agreement became effective on July 24, 2013. Following the delisting of the ADSs and termination of the ADS program, investors will continue to be able to buy and sell our shares through the IDX. In connection with the delisting, we intend to terminate the registration of our ADSs with the SEC in 2014 in accordance with applicable U.S. securities laws and regulations.
As per the process of termination of the Deposit Agreement, holders of the ADRs can surrender their ADRs or the ADSs evidenced thereby to the Depositary in exchange for the underlying ordinary shares in our Company at any time prior to July 24, 2014. From July 24, 2014, the Depositary will start to sell the remaining underlying shares. Investors who do not surrender their ADRs and request delivery of the underlying shares before the Depositary sells those shares will lose the right to receive such underlying shares and instead will be entitled, upon subsequent surrender of their ADRs or the ADSs evidenced thereby, to receive the net proceeds of sale of those shares net of surrender fees of up to US$0.05 per ADS surrendered. The date or dates on which the Depositary will sell the remaining deposited shares of our Company has not been determined, but will not be earlier than July 24, 2014. These sales are likely to occur progressively driven by market depth.
On May 17, 2013, the last reported sale price for our ADSs at the NYSE was US$28.00 (source: Bloomberg).
121
Markets
Our common stock is listed on the IDX, which is the only trading market for our common stock.
The Indonesian Securities Market
Changes to BAPEPAM-LK
On November 22, 2012, with the enactment of Law No. 21 of 2011 regarding Financial Services Authority (“OJK Law”), the Government has effectively created a new integrated and independent financial authority called the Financial Services Authority (Otoritas Jasa Keuangan or “OJK”). By the authority given under the OJK Law, OJK has taken over the supervision and regulation of capital markets, insurance, pension funds, and multi finance companies from BAPEPAM-LK as of December 31, 2012 and will take over the supervision and regulation of banks from Bank Indonesia as of December 31, 2013. OJK Law stipulates that all existing licenses, approvals, and decisions issued before the transfer of duties and authorities of BAPEPAM-LK to OJK will continue to be valid, while applications for licenses and approvals and other decisions made or outstanding after December 31, 2012 will be processed by OJK.
Overview of the IDX
On November 30, 2007, the Jakarta Stock Exchange and the Surabaya Stock Exchange merged to become the IDX. The IDX began operations on December 3, 2007 and in 2007, had a market capitalization of Rp2,539,041 billion, in which Rp1,982 billion of it came from equities, Rp79,065 billion and US$105 million came from corporate bonds and Rp477 trillion came from government bonds. As of December 31, 2013, the market capitalization of the IDX was comprised of, among others, Rp4,219,020 billion of equities, Rp218,220 billion and US$100 million of corporate bonds, Rp995,252 billion of government bonds, Rp2,362 billion of asset-backed securities and Rp4,127 billion of warrants.
There are currently two daily trading sessions for regular and negotiable markets from Monday to Thursday:
| | a. | For regular market: 9:00 a.m. to 12:00 noon, and 1:30 p.m. to 3:49:59 p.m.; and |
| | b. | For negotiable market: 9:00 a.m. to 12:00 noon, and 1:30 p.m. to 4:15 p.m. |
There are two trading sessions for regular and negotiable market on Friday:
| | a. | For regular market: 9:00 a.m. to 11:30 a.m., and 2:00 p.m. to 3:49:59 p.m.; and |
| | b. | For negotiable market: 9:00 a.m. to 11:30 a.m., and 2:00 p.m. to 4:15 p.m. |
There is only one cash market trading session from Monday to Thursday, 9:00 a.m. to 12:00 noon and Friday, 9:00 a.m. to 11:30 a.m.
Trading on the IDX is based on an order-driven market system. Investors must contact brokerage companies, or IDX members, that will execute their orders through the IDX trading system. Trading on the IDX can only be done by IDX members who are registered as members of the Indonesian Clearing and Guarantee Corporation, or KPEI. A brokerage company may also buy and sell securities for its own account. No limitation of share ownership by foreign investors or foreign institutions exists through direct placement or through trading on the IDX, except for banking institutions, which may only be 99.0% foreign owned.
Trading is divided into three market segments: regular market, negotiable market, and cash market. The regular market is the mechanism for trading stock in standard lots on a continuous auction market during exchange hours. With respect to the trading of stock, a round lot consists of 100 shares. The price movements are limited as follows: (i) if the share price is below Rp500, then the price moves in increments of Rp1 with the aggregate daily price movement limited to Rp20; (ii) if the share price is equal to Rp500 or more, but less than
122
Rp5,000, then the price moves in increments of Rp5 with the aggregate daily price movement limited to Rp100; and (iii) if the share price is equal to Rp5,000 or more, then the price moves in increments of Rp25 with the aggregate daily price movement limited to Rp500. Orders are processed by computers that carry out matching processes of the outstanding “bids” and “asks” according to price and time priority. Price priority gives priority to buying orders at a lower price or selling orders at a higher price. If buying or selling orders are placed at the same price, priority is given to the buying or selling order placed first (time priority).
Trades in the negotiated market can be completed without using the round lot system and price step rule. IDX members can advertise selling or buying orders through the IDX trading system and amend their order by negotiating with another member. The ultimate price is based on agreement, but it is recommended to be based on the stock price on the regular market.
Transactions on the IDX regular market and negotiated market are required to be settled no later than the third trading day after the transactions, while transaction on the cash market shall be settled on the same day. In case of a default by an exchange member on settlement upon the due date, they are liable to pay 125.0% of the highest price of the same securities or the same trading day.
The IDX board of directors may cancel a transaction if proof exists of fraud, manipulation or the use of insider information. The board of directors may also suspend trading if there are indications of bogus transactions or jacking up of share prices, misleading information, use of insider information, counterfeit securities or securities blocked from trading, or other important events.
IDX members may charge fees for their services based on an agreement with their clients. When conducting stock transactions on the IDX, exchange members are required to pay a transaction fee equal to 0.018% of the cumulative transaction value of each transaction plus an additional 0.01% for cash and regular market transactions guaranteed by KPEI (subject to a minimum transaction fee of Rp20,000,000). The commissions and transaction fees do not include the 10.0% value-added tax and the 0.1% transaction tax levied on the cumulative value of the sales of the shares.
The Indonesian capital markets are generally less liquid than those in countries with more developed capital markets. This illiquidity is especially pronounced for large blocks of securities. Also, prices in the Indonesian capital markets are typically more volatile than in such other markets. Accordingly, we cannot assure you that a holder of common stock will be able to dispose of common stock at prices or at times at which such holder would be able to do so in more liquid markets or at all. Further, we cannot assure you that a holder of common stock will be able to dispose of common stock at or above such holder’s purchase price.
On January 20, 2014, the IDX amended Rule No. I-A 2004 on the Listing of Equity Securities Other Than Shares Issued by Listed Companies, which took effect on January 30, 2014. The amendments include, among others:
| | (a) | a continuing obligation for listed companies to maintain at least 50 million shares listed on the IDX and a minimum of 7.5% of total issued share capital held by the public. In addition, listed companies are subject to a continuing obligation to maintain a minimum of 300 shareholders holding securities accounts with IDX members. The IDX provides for a grace period of 24 months for compliance with the new requirements from January 30, 2014; |
| | (b) | at least 30% of a listed company’s board of commissioners is required to be comprised of independent commissioners. |
| | (c) | a vacancy that arises in a listed company’s independent commissioners must be filled at the next general Meeting of Shareholders or no later than six months since such vacancy arose; |
| | (d) | at least one member of the board of directors of a listed company must be an independent director; and |
| | (e) | an independent commissioner and director of a listed company may only serve a maximum of two consecutive terms in office. |
123
Item 10: ADDITIONAL INFORMATION
Description of Articles of Association and Capital Stock
As of December 31, 2013, the authorized capital of our Company was Rp2,000,000,000,000, divided into 20,000,000,000 shares consisting of one Series A share and 19,999,999,999 Series B shares, each share of par value Rp100. Of the authorized capital, 5,433,933,500 shares were subscribed to and fully paid up in cash, consisting of one Series A share and 5,433,933,499 Series B shares, or with a total nominal value of Rp543,393,350,000 by:
| | a. | the Republic of Indonesia, one Series A share and 776,624,999 Series B shares with a total nominal value of Rp77,662,500,000; |
| | b. | Ooredoo Asia, 3,532,056,600 Series B shares with a total value of Rp353,205,660,000; and |
| | c. | the Public, 1,125,251,900 Series B shares with a total nominal value of Rp112,525,190,000. |
On March 8, 2004, we held an Extraordinary General Meeting of Shareholders which approved the split of nominal value of Series A share and Series B shares from Rp500 to Rp100 per share, which increased our authorized shares to 20,000,000,000 shares and our issued shares to 5,177,500,000 shares. After the stock split, the authorized capital of Indosat is Rp2,000,000,000,000 divided into 20,000,000,000 shares consisting of one Series A share and 19,999,999,999 Series B shares, each share of par value Rp100. Of our authorized capital, 5,177,500,000 shares were subscribed to and fully paid up in cash, consisting of one Series A share and 5,177,499,999 Series B shares, or with a total nominal value of Rp517,750,000,000 by:
| | a. | the Republic of Indonesia, one Series A share and 776,624,999 Series B shares with a total nominal value of Rp77,662,499,900; |
| | b. | ICLM, 2,171,250,000 Series B shares with a total value of Rp217,125,000,000; and |
| | c. | the Public, 2,229,625,000 Series B shares with a total nominal value of Rp222,962,500,000. |
The amendment to the Articles of Association of our Company, necessitated by the stock split, has been reported to and accepted by the Minister of Justice and Human Rights of Indonesia under number C-05582 HT.01.04.TH.2004, dated March 8, 2004. Such amendment has been registered in the Central Jakarta Company Register Office under number 0540/RUB.09.05/III/2004, dated March 9, 2004. On October 20, 2004, the Ministry of Justice and Human Rights of Indonesia changed its name to the Ministry of Law and Human Rights of Indonesia.
On January 28, 2010, we convened an Extraordinary General Meeting of Shareholders to approve, among others, an amendment to Article 3 of Indosat’s Articles of Association, covering our purposes and objective. Such amendment was required in compliance with BAPEPAM-LK Rule No. IX.J.1.
Our Articles of Association, or the Articles, state that any transaction involving a conflict of interest as defined in prevailing capital market regulations should obtain the approval of the independent shareholders in a general meeting of shareholders especially convened for such purpose.
Each Director receives an annual bonus as well as other incentives in the event we surpass certain financial and operating targets, the amounts of which are determined by our Board of Commissioners and reported at our annual general meeting of shareholders. Bonuses are budgeted annually and are based on the recommendation of our Board of Directors, whose recommendation must be approved by our Board of Commissioners prior to submission to our shareholders. Each Commissioner is granted a monthly honorarium and certain other allowances, the amounts of which are determined by our shareholders at our annual general meeting of shareholders.
124
Our Board of Directors are responsible for leading and managing our Company in accordance with our objectives and purposes as well as to control, preserve and manage our assets. To complete these responsibilities, our Board of Directors are authorized to cause us to borrow such sums as required from time to time subject to the limitations set forth in the Articles. The borrowing powers of our Board of Directors may only be varied through an amendment to the Articles. The Articles do not contain any requirement for the Directors to retire by a specified age or to own any or a specified number of our common shares.
Common Stock
The following is a summary of the material rights and restrictions related to the common stock of our Company based upon applicable provisions of Indonesian law and provisions of our Articles of Association, which were amended on January 28, 2010 and approved by the Minister of Law and Human Rights of Indonesia on February 25, 2010. This description does not purport to be complete and is qualified by reference to the Articles of Association and the laws of Indonesia relating to companies, which may in certain instances differ from provisions contained in the Articles of Association.
All of the shares of common stock are registered shares and are issued in the name of the owner of the common stock registered in the register of shareholders of our Company. The Board of Directors keeps a register of shareholders of our Company, and our Company must treat the person whose name is entered in such register of shareholders as the only person entitled to exercise any rights conferred by law with respect to such common stock.
All transfers of common stock must be evidenced by an instrument of transfer signed by or on behalf of the transferor and by or on behalf of the transferee or based on other letters, which give satisfactory evidence of such transfer in the opinion of the Board of Directors. Transfers of common stock take effect only after the transfer is registered in the register of shareholders. The transferor of any common stock will be treated as the owner of such common stock until the name of the transferee has been entered in the register of shareholders.
The holders of common stock are entitled to pre-emptive rights if we issue common stock, convertible bonds, warrants or similar securities. Such pre-emptive rights may be transferred or assigned to third parties subject to the restrictions set forth in the stipulations in the Articles, prevailing capital markets regulations and Indonesian law. Any rights issue shall be first approved by our general meeting of shareholders and an announcement of such a plan shall be made by the Board of Directors in two daily newspapers (one in the English language and one in the Indonesian language). If the holders of common stock do not exercise their pre-emptive rights within the period fixed by the Board of the Directors in accordance with the relevant regulations, the Board of Directors may issue such common stock, convertible bonds, warrants or similar securities to third parties at a price and on terms at least the same as that offered previously to the existing shareholders and as determined by the Board of Directors.
Our authorized capital stock may be increased or decreased only by a resolution of an extraordinary general meeting of shareholders and an amendment of the Articles. Any such Amendment will be effective only after we receive approval from the Minister of Law and Human Rights of Indonesia.
As an exception to the above provisions, our Company, with the approval of a general meeting of shareholders at which the holder of the Series A share attends and approves the resolution, may issue new shares without conducting a limited public offer to shareholders. This issuance may be done provided that this issue is made for a specified number of shares and such shares are issued within a specified period of time in compliance with the Indonesian capital market regulations or under any exemption we may receive therefrom, and the said shares may be sold by us to any person at a price and upon such conditions as may be determined by the Board of Directors, provided that the price is not lower than par value. There are no limitations on the rights of foreign investors to own our common stock if such stock is acquired through capital markets.
125
These provisions also applymutatis mutandis in the event we issue convertible bonds and/or warrants and/or other similar securities, provided that any new share issued resulting from convertible bonds and/or warrants and/or other similar securities shall be for a specified number of shares and within a specified period of time in compliance with the Indonesian capital market regulations or any exemption that we may receive therefrom.
Series A Share
The material rights and restrictions which are applicable to the common stock are also applicable to the one Series A share, except that the Government may not transfer the Series A share and it has veto rights with respect to: (i) amendment to the objective and purposes of our Company; (ii) increase of capital without pre-emptive rights; (iii) merger, consolidation, acquisition and demerger; and (iv) amendment to the provisions regarding the rights of “A” share as stipulated in the Articles of Association; and (v) dissolution, bankruptcy and liquidation of our Company.
Purpose and Duration
Pursuant to Article 3 of our Articles of Association, as amended on January 28, 2010, in order to comply with BAPEPAM-LK Rule No. IX.J.1 on guidelines of articles of association of a company who conduct public offering on equity securities and public companies, our purposes, objectives and business activities are as follows:
| | 1. | The purposes and objectives of our Company are to provide telecommunications networks, telecommunication services as well as information technology and/or convergence technology services. |
| | 2. | In order to achieve the abovementioned purposes and objectives, we may carry out activities including the main business as follows: |
| | a. | To provide telecommunication networks, telecommunication services as well as information technology and/or convergence technology services, including but not limited to provision of basic telephony services, multimedia services, internet telephony services, network access point services, internet services, mobile telecommunication networks and fixed telecommunication networks; and |
| | b. | To engage in the payment transaction and money transfer service through telecommunication networks as well as information technology and/or convergence technology. |
| | 3. | In order to achieve the abovementioned purposes and objectives and in order to support the main business of our Company as mentioned above, we can conduct supporting business activities, as follows: |
| | a. | To plan, to procure, to modify, to build, to provide, to develop and to operate, to lease, to rent, to maintain infrastructure/facilities including resources to support our business in providing telecommunication networks, telecommunication services as well as information technology and/or convergence technology services; |
| | b. | To conduct business and operating activities (including development, marketing and sales of telecommunication networks, telecommunication services as well as information technology and/or convergence technology services by us), including research, customer services, education and courses both domestic and overseas; and |
| | c. | To conduct other activities necessary to support and/or related with the provision of telecommunication networks, telecommunication services as well as information technology and/or convergence technology services including but not limited to electronic transactions and provision of hardware, software, content as well as telecommunication managed services. |
126
We were established on November 10, 1967 with no time limit on our establishment.
Voting Rights
Each share of common stock entitles the registered holder thereof to one vote at any general meeting of shareholders of our Company. Shareholders appoint members of the Board of Directors for a period commencing from the date of the general meeting of shareholders that appointed them and ending at the closing of the fifth annual general meeting of shareholders subsequent to the date of their appointment.
An annual general meeting of shareholders must be held, at the latest, on June 30 of each year. At such annual general meeting, the Directors must (i) report on the affairs and management of our Company and the results for the most recent financial year; (ii) submit the audited balance sheet and audited profit and loss statement for such financial year to the meeting for approval; (iii) determine the plan for use of profit and the amount of dividend for such financial year; (iv) submit a request for the appointment of a public accountant; and (v) submit all other matters to be addressed at the meeting. In addition, the Board of Commissioners should also report their supervisory activities during the preceding fiscal year as stipulated in the annual report. All materials described in (i) through (v) will be made available at our Company for inspection by shareholders from the date of the invitation for the annual general meeting of shareholders until the date of the annual general meeting of shareholders.
Proposals duly submitted by shareholders representing at least 10.0% of our subscribed shares may be included in the agenda of such meeting, provided that such proposals are received by the Board of Directors at least 21 days prior to such meeting.
The Board of Directors or the Board of Commissioners may convene an extraordinary general meeting of shareholders and must convene such a meeting upon receipt of written notice from a shareholder or shareholders representing at least 10.0% of the subscribed shares of our Company. Upon receipt of such written notice, within 22 days of the date such written notice is accepted, the Board of Directors shall discuss, resolve, and if the Board of Directors have resolved to convene such extraordinary meeting of shareholders, the Board of Directors shall announce notice of the extraordinary meeting of shareholders at the latest 14 days prior to the invitation of the extraordinary meeting of shareholders without counting the announcement date and the invitation date. No later than 14 days prior to the extraordinary meeting of shareholders, without counting the invitation date and the meeting date, the Board of Directors shall announce invitation to the extraordinary meeting of shareholders.
If the Directors fail to provide notice of such a meeting, the shareholders concerned can re-submit their notice to the Board of Commissioners. Upon receipt of such notice, within 22 days of the date such notice is accepted, the Board of Commissioners shall discuss, resolve, and if the Board of Commissioners have resolved to convene such extraordinary meeting of shareholders, the Board of Commissioners shall announce notice to the extraordinary meeting of shareholders at the latest 14 days (excluding notification date and invitation date) prior to the invitation of the extraordinary meeting of shareholders. No later than 14 days prior to the extraordinary meeting of shareholders, without counting the invitation date and the meeting date, the Board of Commissioners shall announce invitation to the extraordinary meeting of shareholders. If the Board of Commissioners fails to make notice of the extraordinary meeting of shareholders within 22 days as of the receipt of such request, the shareholders concerned may call such meeting at the expense of our Company after obtaining approval from the Chairman of District Court.
Announcement of a general meeting is given to shareholders at least 14 days (excluding notification date and invitation date) prior to the notice for the general meeting by an advertisement in at least two daily newspapers (one in the Indonesian language and one in the English language), one of which has a wide circulation in Indonesia. Notice must be given by placement of advertisement in at least two daily newspapers, one of which is in the Indonesian language and has a wide circulation in Indonesia and one of which is in the English language at least 14 days before the date of the annual general meeting or extraordinary general meeting, excluding the date of the notice and the date of the meeting.
127
If all shareholders are present and/or represented, notice requirements may be waived and the general meeting of shareholders may adopt binding resolutions.
Generally, the quorum for a general meeting of shareholders requires shareholders representing more than 50.0% of the issued shares of common stock to be represented in person or by a power of attorney at such meeting.
Shareholders may be represented at a general meeting of shareholders by a person holding a power of attorney, but no Commissioner, Director or employee of our Company may act in such capacity. Unless otherwise provided in the Articles, and subject to the special voting rights of the Special Share, resolutions in order to be adopted must receive the affirmative vote of the holders of more than 50.0% of the shares of common stock which are present and being voted at the meeting (simple majority votes).
Fiscal Year and Accounts
Our fiscal year commences on January 1 and ends on December 31.
No later than 90 days from the closing of the fiscal year, the Board of Directors must submit the balance sheet, profit and loss account and other financial statements audited by a public accountant to the Board of Commissioners, who must review these statements and report on this review to the general meeting of shareholders. Copies of such documents must be available at our head office from the date of notice for the annual general meeting of shareholders up to the date of closing of the annual general meeting of shareholders.
The annual general meeting of shareholders will consider and decide whether or not our balance sheet and profit and loss account is approved. Such approval fully discharges the Board of Directors and the Board of Commissioners from their responsibilities during the fiscal year concerned to the extent that such actions are reflected in such balance sheet and profit and loss account.
Utilization of Profit and Dividends
The profit of our Company, as determined by the annual general meeting of shareholders, after deduction of corporate tax, must be used as a reserve fund, for dividends and for other purposes, the percentage of which must be determined annually by a general meeting of shareholders.
Dividends are paid in accordance with a resolution adopted at a general meeting of shareholders, upon the recommendation of the Board of Directors, which resolution also determines the time and manner of payment of the dividends. All shares of common stock which are fully paid and outstanding at the time a dividend or other distribution is declared are entitled to share equally in such dividends or other distribution. Dividends are payable to the persons whose names are entered in the register of shareholders of our Company, on a business day determined by the general meeting of shareholders at which the resolution for the distribution of dividends is adopted.
The Board of Directors and the Board of Commissioners may, by resolutions of both, declare interim dividends if our financial condition so permits, provided that such interim dividends are offset against the dividends to be declared at the subsequent annual general meeting.
Dividends unclaimed after five years from the date of which they are payable cease to be payable and are to be credited to our reserve fund. Notices concerning dividends and interim dividends must be announced in at least two daily newspapers in the Indonesian language with wide or national circulation in Indonesia, in one daily newspaper in the English language and on the stock exchange where the shares are listed.
If the profit and loss account in one fiscal year shows a loss which cannot be covered by the reserve fund referred to below, the loss remains recorded as such in the profit and loss account and for the succeeding years we are deemed not to have made a profit if the loss recorded as such in the profit and loss account has not been fully covered.
128
To cover future losses, a reserve fund may be created and the amount of the reserve fund will be determined by a general meeting of shareholders. The reserve fund may be used for capital outlays or other purposes as determined at the annual general meeting of shareholders. However, it must only be used for the benefit of our Company. Any profits earned from such reserve fund shall be entered in the profit and loss account of our Company.
Liquidation
In the event that we go into liquidation, the Board of Directors will act as liquidator if required by the prevailing regulations. The balance of any liquidation account which is set up, after payment of all our debts and obligations, will be used to pay all of our shares. If possible, payment on these shares shall be made at a price written on the share certificates. The remaining balance of the liquidation account shall be distributed according to resolutions of the general meeting of shareholders.
Amendments to the Articles of Association
Amendments to our Articles of Association may be made only by a resolution of an extraordinary general meeting of shareholders attended by at least two-thirds of the shareholders and approved by more than two-thirds of the shareholders with voting rights, provided that (i) increases in our share capital without pre-emptive rights, (ii) merger, consolidation, acquisition and demerger involving us, (iii) dissolution and liquidation, (iv) amendments to the Articles of Association related to our purposes and objectives and the Series A holder’s veto rights can be affected only if the meeting is attended and the action approved by the holder of the Series A share.
A resolution regarding a reduction of the authorized or subscribed capital must be published by the Board of Directors in at least two daily newspapers, one of which is in the Indonesian language having a national circulation, and the other in the English language, for the benefit of creditors within the period at the latest of seven days after the date of the general meeting of shareholders. In case a quorum for the extraordinary general meeting is not reached, within ten to twenty-one days from the original extraordinary general meeting a second meeting may be held to decide on matters which were not resolved at the first meeting. The second meeting can result in a valid and binding decision if attended by at least three-fifths of the shareholders and be approved by more than half of the shareholders with voting rights. Amendments related to a reduction of capital only become effective upon the approval of the Ministry of Law and Human Rights of Indonesia.
Transactions with Affiliates
It is the policy of our Company not to enter into transaction with affiliates unless the terms thereof are no less favorable to Indosat than those which could be obtained by our Company on an arm’s length basis from an unaffiliated third party.
Under OJK regulations and Article 19 of our Articles of Association, any transaction in which there is a conflict of interest (as defined below) must be approved by a majority of the shareholders of common stock who do not have a conflict of interest in the proposed transaction, unless the conflict existed before our Company was listed and was fully disclosed in the offering documents. A conflict of interest is defined in BAPEPAM-LK Rule No. IX.E.1 to mean the difference between our Company’s common interests, on the one hand, and the personal economic interests of the members of our Board of Commissioners, Board of Directors or our majority shareholders (a holder of 20.0% or more of our issued shares) of our Company in one transaction which may impose losses on us. A conflict of interest also exists under BAPEPAM-LK rules when members of the Board of Commissioners, Board of Directors or a controlling shareholder of our Company is involved in a transaction in which their personal interests may be in conflict with the interest of our Company, unless otherwise excepted by BAPEPAM-LK regulations.
We expect, in light of the substantial presence which enterprises owned or controlled by the Government or Ooredoo Asia or one of their affiliates have in Indonesia, that it may be desirable, in connection with the
129
development and growth of our business, for us to enter into joint ventures or other arrangements or transactions with such enterprise from time to time. Under such circumstances, we may seek to consult OJK in determining whether the proposed joint venture, arrangement or transaction would require a vote of disinterested shareholders under the terms of the BAPEPAM-LK Rule No. IX.E.1. If OJK were of the view that the proposed joint venture, arrangement or transaction would not require a vote of disinterested shareholders under its rule, we would proceed without seeking disinterested shareholder approval. If, however, OJK were to take the position that the proposal would require a vote of disinterested shareholders under its rule, we would either seek to obtain the requisite disinterested shareholder approval or abandon the proposal.
Material Contracts
On July 30, 2007, we entered into a cooperation agreement with Telkomsel to set up network interconnection between our fixed local telecommunications network and Telkomsel’s cellular mobile network. Pursuant to this agreement, we and Telkomsel agreed to enable each party’s customers to make local, long-distance and international calls between our fixed local telecommunications network and Telkomsel’s cellular mobile network. We amended this agreement through the first amendment No. Telkomsel: AMD.2283/LG.05/PD-00/XII/2007—No. Indosat: 029/C00-CC0/LG/07 dated December 19, 2007, the second amendment No. Telkomsel: AMD.339/LG.05/PD-00/III/2008—No. Indosat: 004/C00-CC0/LGL/08 dated March 3, 2008, the third amendment No. Telkomsel: 1762/LG.05/PD-00/XI/2010 and No. Indosat: 011/C00-C0AA/LGL/10 dated November 1, 2010, the fourth amendment No. Telkomsel: 459/LG.05/PD-00/IV/2011—No. Indosat: 042/C00-C0H/LGL/11 dated April 7, 2011, the fifth amendment No. Telkomsel: 741/LG.05/PD-00/VII/2011—No. Indosat: 84/C00-C0HA/LGL/2011 dated July 19, 2011, the sixth amendment No. Telkomsel: Amd.684/LG.05/PD-00/V/2012—No. Indosat: 06/C00-C0HA/LGL/2012 dated May 28, 2012 and the latest addendum as set forth in the mutual office minutes No. Telkomsel: 005/IC.01/MO-01/III/2013 – No. Indosat: 004/C00-COH/LGL/2013 dated March 8, 2013.
On August 28, 2007, we entered into a five-year unsecured credit facility agreement with BCA, amounting to Rp1,600 billion. Furthermore, on September 20, 2007, we obtained an increase in the credit facility by Rp400,000. As a result, the credit facility has become Rp2,000,000.
On February 10, 2011, we entered into a credit agreement with BCA providing for a three-year unsecured time loan revolving facility amounting to up to Rp1,000 billion. This agreement was amended on December 1, 2011 to increase the amount available under the facility to a maximum of Rp1,500 billion. On December 19, 2012, we entered into a second amendment of this unsecured time loan revolving facility agreement. On July 15, 2013, we entered into a third amendment to our unsecured time loan revolving facility with BCA to obtain a five-year unsecured investment credit facility with a maximum principal amount of Rp1,000.0 billion to fund our Company’s capital expenditures, general corporate expenditures and refinancing. This facility is available six months after the signing date. For further information on these agreements, see “Item 5: Operating and Financial Review and Prospects—Liquidity and Capital Resources—Cash Flows—Principal Indebtedness.”
On December 18, 2007, we entered into an interconnection agreement with Telkom to set up network interconnection between our cellular wireless network and Telkom’s fixed telecommunications network. Under this agreement, we and Telkom agreed to open prefixes and access codes belonging to the other party, which enable each party’s customers to make interconnection calls of various types between our cellular wireless network and Telkom’s fixed telecommunications network. The agreement sets forth the interconnection tariffs for providing interconnection services based upon a cost-based regime and is valid for two years, but can be extended or terminated based upon mutual agreement of the parties. We amended this agreement as stipulated in first amendment No. Telkom 47/HK.820/DCI-A1000000/2008—No. Indosat 021/C00-CC0/LGL/2008 dated March 31, 2008 and second amendment No. Telkom 123/HK.820/DCI-A1000000/2009—No. Indosat 007/C00-C0A/LGL/2009 dated December 30, 2009, the third amendment as stipulated in the form of mutual office minutes No. Telkom Tel.024/YN.000/DCI-A1050000/2011—No. Indosat 003/C00-C0H/LGL/2011 dated January 31, 2011, which has been restated in the amendment No. Telkom: Tel.185/HK 820/DCI-A1000000/2011—No. Indosat: 032/C00-C0H/LGL/2011 dated July 20, 2011, the fourth amendment No.
130
Telkom: Tel. 259/HK 820/DCI-A1000000/2011 – No. Indosat: 043/C00-C0H/LGL/2011 dated December 20, 2011 and the latest amendment as stipulated in the form of mutual office minutes No. Telkom: Tel.35/YN000/DWS-C1010000/2012 – No. Indosat: 014/C00-C0HA/LGL/2012 dated May 30, 2012.
On December 18, 2007, we entered into an interconnection agreement with Telkom to set up network interconnection between our fixed telecommunications network and Telkom’s fixed telecommunications network. Under this agreement, we and Telkom agreed to open prefixes and access codes belonging to the other party which enable each party’s customers to make local, long-distance and international calls between our fixed telecommunications network and Telkom’s fixed telecommunications network. The agreement sets forth the interconnection tariffs for providing interconnection services based upon a cost-based regime and is valid for two years, but can be extended or terminated based upon mutual agreement of the parties. We amended this agreement through the first amendment No. Telkom 48/HK.820/DCI-A1000000/2008—No Indosat 020/C00-CC0/LGL/2008 dated March 31, 2008, the second Amendment No. Telkom 125/HK.820/DCI-A1000000/2009—No. Indosat 006/C00-COA/LGL/2009 dated December 30, 2009, the third amendment as stipulated in the form of mutual office minutes No. Telkom Tel.025/YN.000/DCI-A1050000/2011—No. Indosat 002/C00-C0H/LGL/2011 dated January 31, 2011, the third amendment No. Telkom: Tel.186/HK 820/DCI-A1000000/2011 – No. Indosat: 033/C00-C0H/LGL/2011 dated July 20, 2011, the fourth amendment No. Telkom: Tel. 260/HK 820/DCI-A1000000/2011 – No. Indosat: 044/C00-C0H/LGL/2011 dated December 20, 2011 and the latest amendment as stipulated in the form of mutual office minutes No. Telkom: Tel.036/YN000/DWS-C1010000/2012 – No. Indosat: 0134/C00-C0HA/LGL/2012 dated May 30, 2012.
On December 19, 2007, we entered into a cooperation agreement with Telkomsel to set up network interconnection between our cellular mobile network and Telkomsel’s cellular mobile network. Pursuant to this agreement, we and Telkomsel agreed to enable each party’s customers to make or receive interconnection calls of various types between our cellular mobile network and Telkomsel’s cellular mobile network. The agreement is automatically renewed every two years but can be unilaterally terminated by either party upon three month’s written notice. We amended the agreement through the first amendment No. Telkomsel: AMD.233/LG.05/PD-00/II/2008 and No. Indosat: 003/C00-CC0/LGL/08 dated February 18, 2008 and through the second amendment No. Telkomsel: 1392/LG.05/PD-00/IX/2010 and No. Indosat: 009/C00-C0AA/LGL/10 dated September 7, 2010, through the third amendment No. Telkomsel: 458/LG.05/PD-00/IV/2011 and No. Indosat: 041/C00-C0H/LGL/11 dated April 7, 2011, the fourth amendment No.Telkomsel:Amd.682/LG.05/PD-00/V/2012 – No. Indosat: 05/C00-C0HA/LGL/2012 dated May 28, 2012 and the latest addendum as set forth in the mutual office minutes No. Telkomsel: 004/IC.01/MO-01/III/2013 – No. Indosat: 003/C00-C0H/LGL/2013 dated March 8, 2013.
On March 24, 2009, we held meetings with holders of our Series B Second Indosat Bonds, Fifth Indosat Bonds, Sixth Indosat Bonds, Second Syari’ah Ijarah Bonds and Third Syari’ah Ijarah Bonds, and obtained consents to, among other things, amendments to the definitions of “Debt,” “EBITDA” and “Equity” and to change the ratio of Debt to Equity from 1.75 to 1 to 2.5 to 1 in the trustee agreements to these bonds. For further information on these amendments, see “Item 5: Operating and Financial Review and Prospects—Liquidity and Capital Resources—Cash Flows—Principal Indebtedness.”
On July 28, 2009, we entered into a five-year unsecured credit facility agreement with Bank Mandiri amounting to Rp1,000 billion and on August 18, 2009, we obtained an export credit facility from EKN totaling US$315.0 million. On June 21, 2011 we entered into a credit agreement with Bank Mandiri providing for athree-year unsecured revolving credit facility amounting to up to Rp1,000 billion. This agreement was amended on December 5, 2011 to, among other things, increase the amount available under the facility to a maximum of Rp1,500 billion. For further information on these agreements, see “Item 5: Operating and Financial Review and Prospects—Liquidity and Capital Resources—Cash Flows—Principal Indebtedness.”
On November 25, 2009, we entered into two trustee agreements with PT Bank Rakyat Indonesia (Persero) Tbk, as trustee, in connection with our Seventh Indosat Bonds and our Fourth Syari’ah Ijarah Bonds. The Seventh Indosat Bonds were issued on December 8, 2009 and have total face value of Rp1,300.0 billion. The Fourth Syari’ah Ijarah Bonds were issued on December 8, 2009 and have a total face value of Rp200.0 billion.
131
For further information on this agreement, see “Item 5: Operating and Financial Review and Prospects—Liquidity and Capital Resources—Cash Flows—Principal Indebtedness.”
On July 29, 2010 we, through Indosat Palapa Company B.V. (“Indosat Palapa”) issued guaranteed notes due 2020 with a total face value of US$650.0 million. The notes were issued at 99.478% of their principal amount and mature on July 29, 2020. The notes bear interest at the fixed rate of 7.375% per annum payable insemi-annual installment due on January 29 and July 29 of each year, commencing January 29, 2011. For further information on these notes, see “Item 5: Operating and Financial Review and Prospects—Liquidity and Capital Resources—Cash Flows—Principal Indebtedness.”
On February 7, 2012, we signed transaction documents with Tower Bersama for the sale and leaseback of 2,500 towers, approximately 25% of our existing tower assets, for a total potential consideration of US$541.5 million, comprising upfront consideration of cash and newly issued TBIG shares and a maximum potential deferred payment of US$112.5 million.
On June 13, 2012, we entered into two trustee agreements with PT Bank Rakyat Indonesia (Persero) Tbk, as trustee, in connection with our Eighth Indosat Bonds and our Fifth Syari’ah Ijarah Bonds. The Eighth Indosat Bonds were issued on June 27, 2012 and have total face value of Rp2,700.0 billion. The Fifth Syari’ah Ijarah Bonds were issued on June 27, 2012 and have a total face value of Rp300.0 billion. For further information on this agreement, see “Item 5: Operating and Financial Review and Prospects—Liquidity and Capital Resources—Cash Flows—Principal Indebtedness.”
On December 14, 2012, we entered into a Pico Sharing Agreement with XL to mutually share each parties’ pico cell capacity. Pursuant to this agreement, we and XL agree to mutually share pico cell capacity at certain buildings.
On December 26, 2012, we entered into a three-year unsecured revolving credit facility agreement with PT Bank Sumitomo Mitsui Indonesia, amounting to Rp650 billion. This agreement was amended on March 19, 2013.
On October 18, 2013, we entered into a syndicated credit agreement providing for a three-year unsecured revolving credit facility PT Indonesia Infrastructure Finance and PT Sarana Multi Infrastruktur (Persero) with PT Bank Permata Tbk serving as the facility agent in a maximum principal amount of Rp750.0 billion for our general corporate purposes. This facility is available from October 18, 2013 to October 18, 2016.
On December 23, 2013, we entered into a credit agreement providing for a three-year unsecured revolving credit facility from BTMU in a maximum principal amount of Rp250.0 billion for working capital, capital expenditure and general corporate funding. This facility is available from December 23, 2013 to December 23, 2016. For further information on these agreements, see “Item 5: Operating and Financial Review and Prospects—Liquidity and Capital Resources—Cash Flows—Principal Indebtedness.”
Tower Lease Agreements
To comply with the Minister of Communication and Information Regulation No. 02/PER/M.KOMINFO/2008 in conjunction with The Joint Decree of Minister of Communication and Information, Minister of Internal Affairs, Minister of Public Work and Head of Coordination Investment Board concerning Guidelines For Construction And Utilization Of Joint Telecommunication Towers, we have entered into tower lease agreements with several tenants, as follows:
On January 29, 2010 we entered into a tower lease agreement with PT Hutchison CP Telecommunications (“HCPT”), pursuant to which HCPT intends to lease our Company’s towers at basic service (without civil, mechanical and electrical components). The term of this agreement is 12 years and can be extended for a minimum of six years thereafter, unless HCPT intends to terminate the agreement with prior written notice submitted within one month before the end of the agreement. We amended this agreement on August 18, 2011.
132
On April 15, 2010 we entered into a tower lease agreement with Natrindo, pursuant to which Natrindo intends to lease our Company’s towers at basic service (without civil, mechanical and electrical components). The term of this agreement is 10 years and can be extended automatically for the same period of the initial term, unless Natrindo intends to terminate the agreement with prior written notice submitted within 90 days before the end of the agreement.
On May 24, 2010 we entered into a tower lease agreement with XL, pursuant to which XL intends to lease our Company’s towers at basic service (without civil, mechanical and electrical components). The term of this agreement is 10 years and can be extended for a minimum of five years unless XL intends to terminate the agreement with prior written notice submitted within 120 days before the end of the agreement. We amended this agreement on February 1, 2012.
On June 3, 2010 we entered into a tower lease agreement with PT Berca Global Access (“Berca”), pursuant to which Berca intends to lease our Company’s towers at basic service (without civil, mechanical and electrical components). The term of this agreement is 10 years and can be extended for a minimum of six years unless Berca intends to terminate the agreement with prior written notice submitted within one month before the end of the agreement.
On February 4, 2011, we entered into a tower lease agreement with PT Daya Mitra Telekomunikasi (“Mitratel”), pursuant to which Mitratel intends to lease our Company’s towers at basic service (without civil, mechanical and electrical components) and reserves the right to re-lease it to Telkom with full services (including civil, mechanical and electrical components). The term of this agreement shall be 10 years period and can be extended for a minimum of five years based on mutual consent of the parties.
On February 10, 2011, we entered into a memorandum of agreement with First Media, pursuant to which First Media leased our Company’s tower with full services (including civil, mechanical and electrical components). On September 30, 2013, First Media and our Company entered into a tower lease agreement which replaced and superseded the memorandum of agreement. The term of this tower lease agreement is five years which can be extended automatically for a minimum of five years, unless First Media terminates the tower lease agreement with prior written notice submitted within one month before the end of such tower lease agreement. Pursuant to a novation agreement dated October 2, 2013, First Media assigned its rights and obligations under the tower lease agreement to PT Internux.
On August 2, 2012, we signed a Master Lease Agreement with Tower Bersama, in substantially the same form of the agreement that we had filed as an exhibit to our annual report on Form 20-F for the year ended December 31, 2011, for the lease of 2,500 towers, to implement the Tower Sale Transaction. The term of this agreement shall be for a 10-year period and can be extended for a subsequent 10 years.
On September 29, 2011, we entered into a tower lease agreement with Smart Telecom pursuant to which Smart Telecom agreed to lease our Company’s towers at basic service (without civil, mechanical and electrical components). The terms of this agreement is 10 years and can be extended automatically for the same period of the initial term, unless Smart Telecom terminates the agreement with prior written notice submitted within 60 days before the end of the agreement.
A copy, summary and/or translation of the above agreements were filed as Exhibits 4.2 through 4.13, 15.1, 15.4, 15.7, 15.10, 5.11 and 15.14 through 15.28 attached hereto.
Exchange Controls
See “Item 3: Key Information—Foreign Exchange” included elsewhere in this annual report.
133
Taxation
The following summary contains a description of the principal Indonesian and U.S. federal tax consequences of the purchase, ownership and disposition of ADSs or shares of common stock. This summary does not purport to be a complete description of all of the tax considerations that may be relevant to a decision to purchase, own or dispose of ADSs or shares of common stock. PROSPECTIVE PURCHASERS SHOULD CONSULT THEIR TAX ADVISORS ABOUT THE INDONESIAN AND U.S. FEDERAL, STATE AND LOCAL TAX CONSEQUENCES TO THEM OF THE PURCHASE, OWNERSHIP AND DISPOSITION OF ADSs OR SHARES OF COMMON STOCK.
The following is a summary of the principal Indonesian tax consequences of the ownership and disposition of common stock or ADSs to a non-resident individual or non-resident entity that holds common stock or ADSs (a “Non-Indonesian Holder”). As used in the preceding sentence, a “non-resident individual” is a foreign national individual who is not physically present in Indonesia for 183 days or more during any 12-month period or present for any period with the intent to reside in Indonesia, during which period such non-resident individual receives income in respect of the ownership or disposition of common stock or ADSs, and a “non-resident entity” is a corporation or a non-corporate body that is established, domiciled or organized under the laws of a jurisdiction other than Indonesia and does not have a fixed place of business or otherwise conducts business or carries out activities through a permanent establishment in Indonesia during an Indonesian tax year in which suchnon-Indonesian entity receives income in respect of the ownership or disposition of common stock or ADSs. In determining the residency of an individual or entity, consideration will be given to the provisions of any applicable double taxation treaty to which Indonesia is a party.
Dividends.Dividends declared by us out of retained earnings and distributed to a Non-Indonesian Holder in respect of common stock or ADSs are subject to Indonesian withholding tax, currently at the rate of 20.0%, on the amount of the distribution (in the case of cash dividends) or on the shareholders’ proportional share of the value of the distribution. A lower rate provided under double taxation treaties may be applicable provided the recipient is the beneficial owner of the dividend and has provided to us (with a copy to the Indonesian Office of Tax Services where we are registered) a certificate of tax domicile issued by the competent authority, or its designee, of the jurisdiction where the Non-Indonesian Holder is domiciled. Indonesia has concluded double taxation treaties with over 50 countries, including Australia, Belgium, Canada, France, Germany, Japan, Malaysia, The Netherlands, Singapore, Sweden, Switzerland, the United Kingdom and the United States of America. Under the U.S.-Indonesia tax treaty, the withholding tax on dividends is generally, in the absence of a 25.0% voting interest, reduced to 15.0%.
Capital Gains. The sale or transfer of common stock listed on an Indonesian stock exchange is subject to tax at the rate of 0.1% of the value of the transaction. The broker handling the transaction is obligated to withhold such tax. The holding, sale or transfer of founder shares listed on an Indonesian stock exchange may, under current Indonesian tax regulations, be subject to an additional 0.5% final income tax. The estimated net income received or accrued from the sale of movable assets in Indonesia, which may include common stock not listed on an Indonesian stock exchange or ADSs, by a Non-Indonesian holder (with the exception of the sale of assets under Article 4 paragraph (2) of the Indonesian income tax law) may be subject to Indonesian withholding tax at the rate of 20.0%.
In cases where a purchaser or Indonesian broker will be required under Indonesian tax laws to withhold tax on payment of the purchase price for common stock or ADSs, that payment may be exempt from Indonesian withholding or other Indonesian income tax under applicable double taxation treaties to which Indonesia is a party (including the U.S.-Indonesia double taxation treaty). However, current Indonesian tax regulations do not provide specific procedures for removing the purchaser’s or Indonesian broker’s obligation to withhold tax from the proceeds of such sale. To take advantage of the double taxation treaty relief, Non-Indonesian Holders may have to seek a refund from the Indonesian Tax Office by making a specific application accompanied by a Certificate of Domicile issued by the competent tax authority, or its designee, of the jurisdiction in which the Non-Indonesian Holder is domiciled.
134
Stamp Duty. Transactions in common stock in Indonesia are subject to stamp duty pursuant to Government Regulation No. 24/2000, payable at the rate of Rp6,000 on transactions with a total value of more than Rp1,000,000 and Rp3,000 on transactions with a total value of up to Rp1,000,000.
U.S. Federal Income Taxation
The following discussion addresses the principal U.S. federal income tax consequences to a U.S. Holder (as defined below), of owning ADSs or shares of our common stock. The description below is based on the Internal Revenue Code of 1986, as amended, or the Code, Treasury Regulations promulgated thereunder, the income tax convention between the United States and Indonesia and judicial and administrative interpretations thereof, all as in effect on the date hereof and all of which are subject to change, possibly retroactively. The tax treatment of a holder of ADSs or shares of our common stock may vary depending upon the holder’s particular situation. Certain holders (including, but not limited to, insurance companies, tax-exempt organizations, financial institutions, persons subject to the alternative minimum tax, broker-dealers, persons that have a “functional currency” other than the U.S. dollar, persons that received ADSs or shares of our common stock as compensation for services, persons owning, directly or indirectly, 10.0% or more of our voting shares, and persons who hold ADSs or shares of our common stock as part of a “hedge,” “straddle” or “conversion transaction” within the meaning of Sections 1221, 1092 and 1258 of the Code and the Treasury Regulations thereunder) may be subject to special rules not discussed below. Except as discussed below with regard to persons who are not U.S. Holders (as defined below), the following summary is limited to U.S. Holders (as defined below) who will hold ADSs or shares of our common stock as “capital assets,” within the meaning of Section 1221 of the Code. The discussion below does not address the effect of any state or local tax law on a holder of ADSs or shares of our common stock.
As used herein, the term “U.S. Holder” means a holder of ADSs or shares of our common stock that is for U.S. federal income tax purposes (i) a citizen or resident of the United States; (ii) a corporation (including any entity treated as a corporation for U.S. federal income tax purposes) created or organized in or under the laws of the United States, any state thereof or the District of Columbia; (iii) an estate whose income is subject to U.S. taxation regardless of its source; (iv) a trust if a court within the United States is able to exercise primary supervision over the administration of the trust and one or more United States persons have the authority to control all substantial decisions of the trust; or (v) a holder whose income in respect of the ADSs or shares of our common stock is subject to U.S. federal income tax on a net income basis.
If a partnership or other entity or arrangement treated as a partnership for U.S. federal income tax purposes holds ADSs or shares of our common stock, the tax treatment of a partner will generally depend upon the status of the partner and the activities of the partnership. A U.S. Holder that is a partner in a partnership holding ADSs or shares of our common stock is urged to consult its own tax advisor.
The summary below does not discuss all aspects of U.S. federal income taxation that may be relevant to a particular holder of ADSs or shares of our common stock in light of the holder’s particular circumstances and income tax situation. Prospective holders should consult their own tax advisors as to the specific tax consequences to them of the purchase, ownership and disposition of ADSs or shares of our common stock, including the application and the effect of state, local, foreign and other tax laws and the possible effects of changes in United States or other tax laws.
Taxation of Distributions. Subject to the discussion under “Passive Foreign Investment Company Status” below, for U.S. federal income tax purposes, the amount of a distribution with respect to ADSs or shares of our common stock (including any withholding tax deemed to be imposed with respect to such distributions) will be treated as a dividend taxable as ordinary income on the date of receipt by the Depositary or the holder, respectively, to the extent of our current and accumulated earnings and profits, as determined for U.S. federal income tax purposes. Distributions, if any, in excess of such current and accumulated earnings and profits will first constitute a non-taxable return of capital to the extent thereof, and then as a capital gain realized on the disposition of the ADSs or shares of our common stock. The portion of any distribution treated as a non-taxable
135
return of capital will reduce such holder’s adjusted tax basis in such ADSs or shares of our common stock. Such capital gain will be long-term if the ADSs or shares of our common stock have been held longer than one year. U.S. Holders will not be eligible for the dividends received deduction otherwise allowable under the Code for distributions to domestic corporations in respect of distributions on the ADSs or share of our common stock.
“Qualified dividend income” received by an individual is subject to federal income taxation at rates lower than those applicable to other types of ordinary income. Based upon our existing and anticipated future operations and current assets, we believe that we are a “qualified foreign corporation” and that our dividends paid to U.S. Holders who are individuals will be eligible to be treated as “qualified dividend income” provided that applicable holding period requirements with respect to the ADSs or shares of our common stock and other applicable requirements are satisfied by such U.S. Holders. Dividends paid by a foreign corporation that is classified as a passive foreign investment company, or PFIC, are not “qualified dividend income.” See “—Passive Foreign Investment Company Status” below.
If a distribution is paid in any currency other than U.S. dollars, the amount of the distribution will be translated into U.S. dollars at the spot rate on the date the distribution is received (which for holders of ADSs, would be the date such dividend is received by the Depositary), regardless of whether the distributions are in fact converted into U.S. dollars on that date. Any gain or loss in respect of such non-U.S. currency arising from exchange rate fluctuations after that date will be ordinary income or loss.
Taxation of Capital Gains and Losses. Subject to the discussion under “Passive Foreign Investment Company Status” below, a U.S. Holder will generally recognize a taxable gain or loss on the sale, exchange or other disposition of ADSs or shares of our common stock in an amount equal to the difference between the amount realized on the sale, exchange or other disposition and such holder’s adjusted tax basis in such ADSs or shares of our common stock. This will result in a long-term or short-term capital gain or loss, depending on whether the ADSs or shares of our common stock have been held for more than one year. For non-corporate U.S. Holders, the U.S. income tax rate applicable to the net long-term capital gain recognized for a year upon a sale, exchange or other disposition of ADSs or shares of our common stock is currently 20.0%. Deposit and withdrawal of shares of our common stock in exchange for ADSs by a U.S. Holder will not result in a realization of gain or loss for U.S. federal income tax purposes.
Passive Foreign Investment Company Status. Special U.S. federal income tax rules apply to a U.S. Holder that holds an equity interest in a PFIC. In general, a foreign corporation will constitute a PFIC for any taxable year for United States federal income tax purposes if 75.0% or more of its gross income for such taxable year consists of passive income (generally, interest, dividend, rents, royalties and net gain from the disposition of assets that give rise to such income) or 50.0% or more of its average assets held during such taxable year consist of assets that produce or are held for the production of passive income.
Based upon our existing and anticipated future operations and current assets, we believe that we are not, and anticipate that we will not become in the foreseeable future, a PFIC. If we are not operated in the manner currently anticipated, however, we may be considered a PFIC for the current or for a subsequent year depending upon our actual activities. Furthermore, because PFIC status is determined on a year-by-year basis and depends upon the composition of a company’s income and assets and the market value of its assets from time to time, there can be no assurance that we will not be considered a PFIC for any taxable year.
If we are a PFIC for any taxable year during which a U.S. Holder holds ADSs or shares of our common stock, such U.S. Holder will be subject to special tax rules with respect to any “excess distribution” received and any gain realized from a sale or other disposition, including a pledge, of ADSs or shares of our common stock. Distributions received in a taxable year that are greater than 125% of the average annual distributions received during the shorter of the three preceding taxable years or such U.S. Holder’s holding period for ADSs or shares of our common stock will be treated as excess distributions. Under these special tax rules: (a) the excess distribution or gain will be allocated rateably over such U.S. Holder’s holding period for ADSs or shares of our common stock, (b) the amount allocated to the current taxable year, and any taxable year prior to the first taxable
136
year in which we were a PFIC, will be treated as ordinary income, and (c) the amount allocated to each other year will generate an additional tax that is due for the current taxable year and that is equal to the total, for each such other year, of (i) the amount allocated to such year multiplied by the highest tax rate in effect for such year and (ii) an amount equal to the interest charge that would have been imposed for underpaying that amount of tax for such year.
An election may be available to avoid these adverse tax consequences if certain conditions are met and the U.S. Holder elects to annually mark-to-market the ADSs or shares of common stock. Furthermore, although a PFIC shareholder may mitigate the rules described above by electing to treat a PFIC as a “qualified electing fund” under Section 1295 of the Code, this option is not available to U.S. Holders because we do not intend to comply with the requirements necessary to permit a U.S. Holder to make this election.
U.S. Holders are advised to consult their tax advisors concerning the U.S. federal income tax consequences of holding the ADSs or shares of our common stock and of making the mark-to-market election if we are considered a PFIC in any taxable year. A U.S. Holder who owns ADSs or shares of our common stock during any year that we are a PFIC must file with the Internal Revenue Service, or IRS, Form 8621.
Foreign Tax Credit Considerations. For United States federal income tax purposes, U.S. Holders will be treated as having received the amount of any Indonesian tax withheld upon the payment of a dividend and as then having paid over the withheld taxes to Indonesia. As a result of this rule, the amount of dividend included in a U.S. Holder’s gross income may be greater than the amount of cash actually received (or receivable) by the U.S. Holder.
Subject to the limitations and conditions set forth in the Code, U.S. Holders may elect to claim a credit against their U.S. federal income tax liability for Indonesian tax withheld from dividends or Indonesian tax imposed on capital gains, if any, or, if they do not elect to credit any foreign tax for the taxable year, they may deduct such tax. For purposes of the foreign tax credit limitation, dividends and capital gains will, depending on a U.S. Holder’s particular circumstances, generally constitute “passive” or “general” income. Furthermore, dividends will generally constitute foreign source income and currency gains and capital gains will generally constitute U.S. source income. Capital loss will generally be allocated against U.S. source income. Because capital gains will generally constitute U.S. source income, as a result of the U.S. foreign tax credit limitation, any Indonesian or other foreign tax imposed upon capital gains in respect of ADSs or shares of our common stock may not be currently creditable unless a U.S. Holder had other foreign source income for the year in the appropriate foreign tax credit limitation basket or an election to treat such gain as foreign source income is available. Investors are urged to consult their tax advisors regarding the availability of the foreign tax credit under their particular circumstances.
Non-U.S. Holders. Except for the possible imposition of U.S. backup withholding tax (see “—U.S. Backup Withholding and Information Reporting”), payments of any dividend on an ADS or share of our common stock to a holder who is not a U.S. Holder (a “non-U.S. Holder”) will not be subject to U.S. federal income tax and gain from the sale, redemption or other disposition of an ADS or a shares of our common stock, provided that:
| | a. | the non-U.S. Holder shall not be or have been engaged in a trade or business in the United States; |
| | b. | there is no present or former connection between such non-U.S. Holder and the United States, including, without limitation, such non-U.S. Holder’s status as a former citizen thereof or former resident thereof; and |
| | c. | in the case of a gain from the sale, redemption or other disposition of an ADS or shares of our common stock by an individual, the non-U.S. Holder is not present in the United States for 183 days or more in the taxable year of the sale or certain other conditions are met. |
If dividends, gain or income with respect to an ADS or shares of our common stock of a non-U.S. Holder is effectively connected with the conduct of such trade or business (or attributable to a permanent establishment in the United States, in the case of a holder who is a resident of a country which has an income tax treaty with the
137
United States), the non-U.S. Holder may be subject to U.S. income taxes on such dividend, gain or income at the statutory rates provided for U.S. Holders after deduction of deductible expenses allocable to such effectively connected income. In addition, if such a non-U.S. Holder is a foreign corporation, it may be subject to a branch profits tax currently equal to 30.0% of its effectively connected earnings and profits for the taxable year, as adjusted for certain items, unless a lower rate applies under a United States income tax treaty with thenon-U.S. Holder’s country of residence. For this purpose, dividends, gain or income in respect of an ADS or shares of our common stock will be included in earnings and profits subject to the branch profits tax if the dividend, gain or income is effectively connected with the conduct of the United States trade or business of the non-U.S. Holder.
U.S. Backup Withholding and Information Reporting. Payments made by a U.S. paying agent or other U.S. intermediary broker in respect of ADSs or shares of our common stock may be subject to information reporting to the IRS and to a backup withholding tax. Backup withholding will not apply, however, (i) to a holder who furnishes a correct taxpayer identification number and makes any other required certification or (ii) to a holder who is otherwise exempt from backup withholding.
Any amounts withheld under the backup withholding rules from a payment to a holder will be allowed as a refund or a credit against such holder’s U.S. federal income tax, provided that the holder has complied with applicable reporting obligations.
Information with Respect to Foreign Financial Assets. Under recently enacted legislation, the Hiring Incentives to Restore Employment Act (the “HIRE Act”), individuals that (i) are either (a) a U.S. citizen, (b) a resident alien for any part of the year, (c) a nonresident alien that has made an election to be treated as a resident alien for purposes of filing a joint U.S. federal income tax return or (d) a nonresident alien who is a bonafide resident of American Samoa or Puerto Rico and (ii) own “specified foreign financial assets” with an aggregate value in excess of US$50,000 on the last day of the taxable year (or with an aggregate value in excess of $75,000 at any time during the taxable year), will generally be required to file an information report on IRS Form 8938 with respect to such assets with their U.S. federal tax returns. “Specified foreign financial assets” include any financial accounts maintained by foreign financial institutions, as well as any of the following, but only if they are held for investment and not held in accounts maintained by financial institutions: (i) stocks and securities issued by non-United States persons, (ii) financial instruments and contracts that have non-United States issuers or counterparties, and (iii) interests in foreign entities. Holders that are individuals are urged to consult their tax advisors regarding the application of this legislation to their ownership of ADSs or shares of our common stock.
Documents on Display
Any material which is filed as an exhibit to this annual report on Form 20-F with the SEC is available for inspection at our offices. See “Item 4: Information on the Company—Principal Registered Offices.”
Item 11: QUANTITATIVE AND QUALITATIVE DISCLOSURES ABOUT MARKET RISK
Quantitative and Qualitative Disclosure about Market Risk
We are exposed to market risks primarily from changes in interest rates, changes in foreign currency exchange rates, and equity price risk on the value of our long-term investments. To manage our foreign exchange and interest rate risks, we have entered into interest rate swap contracts, cross currency swap contracts and other transactions aimed at reducing and/or managing the adverse impact of changes in foreign exchange and interest rates on our operating results and cash flows. We enter into such transactions to minimize risk without engaging in speculative practices. We account for these instruments as transactions not designated as hedges, wherein changes in the fair value are charged or credited directly as expenses or income for the relevant year. We also convert surplus Indonesian rupiah funds to U.S. dollars on a regular basis in amounts necessary to meet our U.S. dollar expenses.
138
Interest Rate Sensitivity
As of December 31, 2013, most of our outstanding debt was subject to fixed interest rates. In addition, as of December 31, 2013, we held U.S. dollar-denominated and Indonesian rupiah-denominated deposits, which also have exposure to interest rate fluctuations. The following table sets forth information regarding our financial instruments that are sensitive to changes in interest rates. For long-term debt and bonds payable, the table sets forth principal cash flows and related interest rates according to their expected maturity dates. The information set forth in the table has been determined based on the following assumptions: (i) variable interest rates in time deposits denominated in U.S. dollar and Indonesian rupiah are based on the available interest rate in 2013; (ii) interest rates for long-term deposits denominated in Indonesian rupiah are based on 1-month Certificate of Bank Indonesia and one or three month JIBOR on December 31, 2013 plus a margin; and (iii) interest rates for long-term debts denominated in U.S. dollars are based on provisions in the various agreements. However, we cannot assure you that such assumptions will be correct for future periods. Such assumptions and the information described in the table may be influenced by a number of factors, including increases in interest rates in Indonesia resulting from continued tight liquidity and other monetary and macroeconomic factors affecting Indonesia.
| | | | | | | | | | | | | | | | | | | | | | | | | | | | | | | | | | | | | | |
| | | | | Outstanding Balance as
at December 31, 2013 | | | Expected Maturity Date as of December 31 | |
| | | Interest Rate | | Foreign
Currency | | | Rupiah
Equivalent | | | 2014 | | | 2015 | | | 2016 | | | 2017 | | | 2018 | | | 2019 and
Thereafter | | | Total | |
| | | | | (US$ million) | | | (Rp billion) | | | (Rp billion) | |
Assets | | | | | | | | | | | | | | | | | | | | | | | | | | | | | | | | | | | | | | |
Variable rate | | | | | | | | | | | | | | | | | | | | | | | | | | | | | | | | | | | | | | |
Time deposits and deposits on call | | | | | | | | | | | | | | | | | | | | | | | | | | | | | | | | | | | | | | |
Rp | | 2.0% - 11.0% | | | — | | | | 1,088.0 | | | | 1,088.0 | | | | — | | | | — | | | | — | | | | — | | | | — | | | | 1,088.0 | |
US$ | | 0.03% - 3.5% | | | 64.1 | | | | 781.2 | | | | 781.2 | | | | — | | | | — | | | | — | | | | — | | | | — | | | | 781.2 | |
| | | | | | | | | | | | | | | | | | | | | | | | | | | | | | | | | | | | | | |
Total Assets | | | | | 64.1 | | | | 1,869.2 | | | | 1,869.2 | | | | — | | | | — | | | | — | | | | — | | | | — | | | | 1,869.2 | |
| | | | | | | | | | | | | | | | | | | | | | | | | | | | | | | | | | | | | | |
Liabilities | | | | | | | | | | | | | | | | | | | | | | | | | | | | | | | | | | | | | | |
Loans payable | | | | | | | | | | | | | | | | | | | | | | | | | | | | | | | | | | | | | | |
Fixed rate | | | | | | | | | | | | | | | | | | | | | | | | | | | | | | | | | | | | | | |
Rp | | | | | | | | | | | | | | | | | | | | | | | | | | | | | | | | | | | | | | |
Principal | | | | | — | | | | 1,000.0 | | | | 100.0 | | | | 100.0 | | | | 150.0 | | | | 150.0 | | | | 500.0 | | | | — | | | | 1,000.0 | |
Interest | | Fixed rate of 9.75% | | | — | | | | — | | | | 97.5 | | | | 87.8 | | | | 78.0 | | | | 63.4 | | | | 48.8 | | | | — | | | | 375.5 | |
US$ | | | | | | | | | | | | | | | | | | | | | | | | | | | | | | | | | | | | | | |
Principal | | | | | 206.1 | | | | 2,512.2 | | | | 566.0 | | | | 566.0 | | | | 566.0 | | | | 431.0 | | | | 191.6 | | | | 191.6 | | | | 2,512.2 | |
Interest | | Fixed rate, ranging from 4.24% p.a. -6.45%
p.a. | | | — | | | | — | | | | 117.4 | | | | 90.3 | | | | 63.3 | | | | 36.2 | | | | 19.1 | | | | 8.2 | | | | 334.5 | |
Variable rate | | | | | | | | | | | | | | | | | | | | | | | | | | | | | | | | | | | | | | |
Rp | | | | | | | | | | | | | | | | | | | | | | | | | | | | | | | | | | | | | | |
Principal | | | | | — | | | | 3,650.0 | | | | 1,500.0 | | | | 2,150.0 | | | | — | | | | — | | | | — | | | | — | | | | 3,650.0 | |
Interest | | Floating rate of 1-month
JIBOR + 2.25% | | | — | | | | — | | | | 276.3 | | | | 81.9 | | | | — | | | | — | | | | — | | | | — | | | | 358.2 | |
Rp | | | | | | | | | | | | | | | | | | | | | | | | | | | | | | | | | | | | | | |
Principal | | | | | — | | | | 300.0 | | | | — | | | | — | | | | 300.0 | | | | — | | | | — | | | | — | | | | 300.0 | |
Interest | | Floating rate of3-month
JIBOR + 1.5% - 2.25% | | | — | | | | — | | | | 30.3 | | | | 30.3 | | | | 25.2 | | | | — | | | | — | | | | — | | | | 85.8 | |
US$ | | | | | | | | | | | | | | | | | | | | | | | | | | | | | | | | | | | | | | |
Principal | | | | | 74.4 | | | | 906.9 | | | | 277.4 | | | | 277.4 | | | | 190.4 | | | | 53.9 | | | | 53.9 | | | | 53.9 | | | | 906.9 | |
Interest | | Floating rate of6-month LIBOR + 0.35% - 2.87% | | | — | | | | — | | | | 17.5 | | | | 12.8 | | | | 7.5 | | | | 4.7 | | | | 3.8 | | | | 1.8 | | | | 48.1 | |
139
| | | | | | | | | | | | | | | | | | | | | | | | | | | | | | | | | | | | | | |
| | | | | Outstanding Balance as
at December 31, 2013 | | | Expected Maturity Date as of December 31 | |
| | | Interest Rate | | Foreign
Currency | | | Rupiah
Equivalent | | | 2014 | | | 2015 | | | 2016 | | | 2017 | | | 2018 | | | 2019 and
Thereafter | | | Total | |
| | | | | (US$ million) | | | (Rp billion) | | | (Rp billion) | |
Bonds payable | | | | | | | | | | | | | | | | | | | | | | | | | | | | | | | | | | | | | | |
Fixed rate | | | | | | | | | | | | | | | | | | | | | | | | | | | | | | | | | | | | | | |
Rp | | | | | | | | | | | | | | | | | | | | | | | | | | | | | | | | | | | | | | |
Principal | | | | | — | | | | 7,820.0 | | | | 2,358.0 | | | | 320.0 | | | | 772.0 | | | | 1,370.0 | | | | — | | | | 3,000.0 | | | | 7,820.0 | |
Interest | | Fixed rate, ranging
from 8.625% p.a. -
16.0% p.a. | | | — | | | | — | | | | 698.7 | | | | 516.4 | | | | 499.1 | | | | 335.5 | | | | 262.5 | | | | 530.6 | | | | 2,842.8 | |
US$ | | | | | | | | | | | | | | | | | | | | | | | | | | | | | | | | | | | | | | |
Principal | | | | | 650.0 | | | | 7,922.9 | | | | — | | | | — | | | | — | | | | — | | | | — | | | | 7,922.9 | | | | 7,922.9 | |
Interest | | 7.375% | | | — | | | | — | | | | 584.3 | | | | 584.3 | | | | 584.3 | | | | 584.3 | | | | 584.3 | | | | 1,168.7 | | | | 4,090.2 | |
Variable rate | | | | | | | | | | | | | | | | | | | | | | | | | | | | | | | | | | | | | | |
Rp | | | | | | | | | | | | | | | | | | | | | | | | | | | | | | | | | | | | | | |
Principal | | | | | — | | | | — | | | | — | | | | — | | | | — | | | | — | | | | — | | | | — | | | | — | |
Interest | | — | | | — | | | | — | | | | — | | | | — | | | | — | | | | — | | | | — | | | | — | | | | — | |
| | | | | | | | | | | | | | | | | | | | | | | | | | | | | | | | | | | | | | |
Total Liabilities | | | | | 930.5 | | | | 24,112.0 | | | | 6,623.4 | | | | 4,817.2 | | | | 3,235.8 | | | | 3,029.0 | | | | 1,664.0 | | | | 12,877.7 | | | | 32,247.1 | |
| | | | | | | | | | | | | | | | | | | | | | | | | | | | | | | | | | | | | | |
Net Cash Flows | | | | | (866.4 | ) | | | (22,242.8 | ) | | | (4,754.2 | ) | | | (4,817.2 | ) | | | (3,235.8 | ) | | | (3,029.0 | ) | | | (1,664.0 | ) | | | (12,877.7 | ) | | | (30,377.9 | ) |
In addition, as of December 31, 2013, we held U.S. dollar-denominated and Indonesian rupiah-denominated deposits, which also have exposure to interest rate fluctuations.
Exchange Rate Sensitivity
Our exposure to exchange rate fluctuations results primarily from U.S. dollar-denominated long-term debt obligations, bonds payable and accounts receivable and payable.
Our accounts payable are primarily foreign currency-denominated net settlement payments to foreign telecommunications operators, while most of our accounts receivable are Indonesian rupiah-denominated payments from domestic operators. During the period from January 1, 2011 through December 31, 2013, the Indonesian rupiah/U.S. dollar middle exchange rate announced by Bank Indonesia ranged from a low of Rp12,270 per U.S. dollar to a high of Rp8,460 per U.S. dollar, and, during 2013, ranged from a low of Rp12,270 per U.S. dollar to a high of Rp9,634 per U.S. dollar. On December 31, 2013, the middle exchange rate announced by Bank Indonesia was Rp12,189 per U.S. dollar. As a result, we recorded a gain of Rp36.7 billion in 2011, a loss of Rp789.4 billion in 2012 and a loss of Rp3,011.4 billion (US$247.1 million) in 2013.
140
The following table sets forth information about our financial instruments by functional currency and presents such information in Indonesian rupiah equivalents, which is our reporting currency. The table summarizes information on instruments and transactions that are sensitive to foreign exchange rates, including term deposits, accounts payable and receivable, and our financial instruments including term deposits, account receivable and account payable, and their long term debt. The table presents principal cash flows by expected maturity dates. The information presented in the table has been determined based on the middle exchange rate announced by Bank Indonesia on December 31, 2013 of Rp12,189 per US$1.00. However, we cannot assure you that such assumption will be correct for future periods. Such assumption and the information described in the table may be influenced by a number of factors, including depreciation or appreciation of the Indonesian rupiah in future periods.
| | | | | | | | | | | | | | | | | | | | | | | | | | | | | | | | |
| | | Expected Maturity Date as of December 31, | |
| | | Foreign
Currency | | | 2014 | | | 2015 | | | 2016 | | | 2017 | | | 2018 | | | 2019 and
Thereafter | | | Total | |
| | | (US$ in millions) | | | | | | | | | | | | (Rp in billion) | | | | | | | | | | |
Assets: | | | | | | | | | | | | | | | | | | | | | | | | | | | | | | | | |
Cash and cash equivalents(1) US$ denominated | | | 83.5 | | | | 1,017.6 | | | | — | | | | — | | | | — | | | | — | | | | — | | | | 1,017.6 | |
Accounts receivable US$ denominated | | | 117.5 | | | | 1,431.9 | | | | — | | | | — | | | | — | | | | — | | | | — | | | | 1,431.9 | |
Derivative assets US$ denominated | | | 16.0 | | | | 195.6 | | | | — | | | | — | | | | — | | | | — | | | | — | | | | 195.6 | |
Other current financial assets US$ denominated | | | 0.2 | | | | 2.8 | | | | — | | | | — | | | | — | | | | — | | | | — | | | | 2.8 | |
Due from related parties US$ denominated | | | 0.0 | | | | 0.6 | | | | — | | | | — | | | | — | | | | — | | | | — | | | | 0.6 | |
Other non-current financial assets US$ denominated | | | 1.5 | | | | — | | | | 17.5 | | | | — | | | | — | | | | — | | | | — | | | | 17.5 | |
| | | | | | | | | | | | | | | | | | | | | | | | | | | | | | | | |
| | | | | | | | |
Total Assets | | | 218.7 | | | | 2,648.5 | | | | 17.5 | | | | — | | | | — | | | | — | | | | — | | | | 2,666.0 | |
| | | | | | | | |
Liabilities: | | | | | | | | | | | | | | | | | | | | | | | | | | | | | | | | |
Accounts payable—trade US$ denominated | | | 10.4 | | | | 126.9 | | | | — | | | | — | | | | — | | | | — | | | | — | | | | 126.9 | |
Procurement payable US$ denominated | | | 81.2 | | | | 990.0 | | | | — | | | | — | | | | — | | | | — | | | | — | | | | 990.0 | |
Accrued expenses US$ denominated | | | 46.2 | | | | 562.8 | | | | — | | | | — | | | | — | | | | — | | | | — | | | | 562.8 | |
Deposits from customers US$ denominated | | | 2.7 | | | | 32.9 | | | | — | | | | — | | | | — | | | | — | | | | — | | | | 32.9 | |
Derivative liabilities US$ denominated | | | 3.0 | | | | 36.9 | | | | — | | | | — | | | | — | | | | — | | | | — | | | | 36.9 | |
Other current financial liabilities US$ denominated | | | 18.0 | | | | 219.0 | | | | — | | | | — | | | | — | | | | — | | | | — | | | | 219.0 | |
Due to related parties US$ denominated | | | 1.6 | | | | — | | | | 18.9 | | | | — | | | | — | | | | — | | | | — | | | | 18.9 | |
Loans payable including current maturities US$ denominated | | | 280.5 | | | | 843.4 | | | | 843.4 | | | | 756.3 | | | | 484.9 | | | | 245.5 | | | | 245.5 | | | | 3,419.0 | |
Bonds payable including current maturities US$ denominated | | | 650.0 | | | | — | | | | — | | | | — | | | | — | | | | — | | | | 7,922.9 | | | | 7,922.9 | |
Obligation under capital lease US$ denominated | | | 194.8 | | | | — | | | | 237.4 | | | | 257.3 | | | | 278.9 | | | | 302.3 | | | | 1,298.2 | | | | 2,374.1 | |
Other non-current financial liabilities US$ denominated | | | 3.6 | | | | — | | | | 44.8 | | | | — | | | | — | | | | — | | | | — | | | | 44.8 | |
| | | | | | | | | | | | | | | | | | | | | | | | | | | | | | | | |
| | | | | | | | |
Total Liabilities | | | 1,292.0 | | | | 2,811.9 | | | | 1,144.5 | | | | 1,013.6 | | | | 763.8 | | | | 547.8 | | | | 9,466.6 | | | | 15,748.2 | |
| | | | | | | | | | | | | | | | | | | | | | | | | | | | | | | | |
| | | | | | | | |
Net Cash Flows | | | (1,073.3 | ) | | | (163.4 | ) | | | (1,127.0 | ) | | | (1,013.6 | ) | | | (763.8 | ) | | | (547.8 | ) | | | (9,466.6 | ) | | | (13,082.5 | ) |
| | | | | | | | | | | | | | | | | | | | | | | | | | | | | | | | |
| (1) | Cash and cash equivalents consist of cash on hand, cash in banks and time deposits. |
141
Equity Price Risk
Our long-term investments consist primarily of minority investments in the equity of private Indonesian companies and equity of foreign companies. With respect to the Indonesian companies in which we have investments, the financial performance of such companies may be adversely affected by economic conditions in Indonesia.
Foreign Currency Swap Derivatives Contracts
As of December 31, 2013, we had hedging facilities amounting to US$244.0 million of foreign currency forward derivatives contracts, representing 26.2% of our U.S. dollar denominated bonds and loans as of December 31, 2013. As of December 31, 2013, we had no outstanding foreign currency swap contracts. In 2013, we settled two of our structured foreign currency swap contracts with two international financial institutions.
As of December 31, 2013, we had outstanding foreign currency contracts under which we agreed to pay Indonesian rupiah in exchange for the counterparty’s obligation to pay U.S. dollars, based upon agreed spot rates. In the event that the Indonesian rupiah appreciates against the U.S. dollar, we would recognize losses on such transactions, which could have a material and adverse effect on our financial condition.
Interest Rate Swap Derivatives Contracts
As of December 31, 2013, we maintained interest rate swap contracts that we entered into in 2008 with respect to an aggregate amount of US$38.7 million under which we agreed to make fixed interest rate payments in exchange for a six-month U.S. dollar LIBOR-linked floating rate plus either 0.35% or 1.45% per year in order to hedge the interest rate risks on our HSBC Sinosure and HSBC Commercial satellite financing agreements.
Item 12: DESCRIPTION OF SECURITIES OTHER THAN EQUITY SECURITIES
Fees and Charges Our American Depositary Shares Holders May Have to Pay
The Bank of New York Mellon, the depositary of our ADS program, charges the following to any party depositing or withdrawing ordinary shares or any party surrendering ADRs or ADSs evidenced thereby or to whom ADRs or ADSs are issued, whichever applicable, pursuant to the deposit agreement with the Depositary: (1) taxes and other governmental charges, (2) registration fees as may from time to time be in effect for the registration of transfers of shares, (3) cable, telex and facsimile transmission expenses as are expressly provided in the deposit agreement to be at the expense of persons depositing shares or owners, (4) expenses incurred by the Depositary in the conversion of foreign currency pursuant to the deposit agreement, (5) a fee not in excess of $5.00 per 100 ADSs (or portion thereof) for the execution and delivery of ADSs and the surrender of ADSs and, (6) a fee for the distribution of proceeds of sales of securities or rights pursuant to the deposit agreement, respectively, in an amount equal to the fee for the issuance of ADSs referred to above which would have been charged as a result of the deposit by owners of shares received in exercise of rights distributed to them pursuant to the deposit agreement, respectively, but which securities or rights are instead sold by the Depositary and the net proceeds distributed. Under the deposit agreement, the Depositary collects such fees by deducting those fees from the amounts distributed or by selling a portion of distributable property to pay the fees. Following the voluntary delisting of the ADSs from the NYSE, termination of the ADS program became effective on July 24, 2013. For more information see “Item 9: The Offer and Listing—Offer and Listing Details.”
Fees to be made by the Depositary to Us
The Depositary has agreed to reimburse certain of our expenses related to our ADS program and incurred by us in connection with the program. The Depositary has reimbursed to us, or paid amounts on our behalf to third parties, or waived its fees and expenses, in the total amount of US$67,854.50 for the year ended December 31, 2013.
142
The table below sets forth the types of expenses that the depositary has agreed to reimburse, and the invoices relating to the year ended December 31, 2013 that were reimbursed:
| | | | |
Type of Fees | | Amount | |
Printing costs | | $ | — | |
NYSE Listing Fee | | $ | — | |
Costs related to ADS program | | $ | — | |
Total | | $ | — | |
The depositary has also agreed to waive fees for standard costs associated with the administration of the ADS program and has paid certain expenses directly to third parties on our behalf. The table below sets forth those expenses that the depositary has waived or paid directly to third parties relating to the year ended December 31, 2013:
| | | | |
Type of Fees | | Amount | |
| | | (US$) | |
Mailing, printing and service fees and expenses | | | — | |
Meeting-related expenses | | | 771.19 | |
Fees and expenses related to the administration of the ADS program | | | 67,083.31 | |
Total | | | 67,854.50 | |
143
PART II
Item 13: DEFAULTS, DIVIDEND ARREARAGES AND DELINQUENCIES
Following the Asian financial crisis and the related devaluation of the Indonesian rupiah against the U.S. dollar in late 1997, Satelindo defaulted on its debt obligations in 1998. Satelindo restructured its debt obligations in 2000. Immediately prior to the restructuring, Satelindo had a total principal amount of indebtedness of US$530.5 million, of which US$519.1 million was restructured. As of December 31, 2013, neither we nor our subsidiaries had a material default relating to our outstanding indebtedness.
Item 14: MATERIAL MODIFICATIONS TO THE RIGHTS OF SECURITY HOLDERS AND USE OF PROCEEDS
None.
Item 15: CONTROLS AND PROCEDURES
Disclosure Controls and Procedures
As of December 31, 2013, or the Evaluation Date, our management, including our President Director & Chief Executive Officer and Director & Chief Financial Officer, carried out an evaluation of the effectiveness of our disclosure controls and procedures, as defined in Rules 13a-15(e) and 15(d)-15(e) under the Exchange Act. Based on that evaluation, we concluded that, as of the December 31, 2013, our disclosure controls and procedures were effective.
Management’s Annual Report on Internal Control over Financial Reporting
As required by section 404 of the Sarbanes-Oxley Act of 2002, our management is responsible for establishing and maintaining adequate internal control over financial reporting, as defined in Rules 13a-15(f) and 15d-15(f) under the Exchange Act. Our system of internal control over financial reporting was designed to provide reasonable assurance to our management and Audit Committee of the reliability of our financial reporting and the preparation of published financial statements in accordance with IFRS. Management conducted an evaluation of the effectiveness of our internal control over financial reporting as of December 31, 2013 based on the framework in Internal Control—Integrated Framework, issued by the Committee of Sponsoring Organizations of the Treadway Commission (1992 framework), or COSO. Internal control over financial reporting includes those policies and procedures that (1) pertain to the maintenance of records that, in reasonable detail, accurately and fairly reflect the transactions and dispositions of the assets of the company; (2) provide reasonable assurance that transactions are recorded as necessary to permit the preparation of financial statements in accordance with IFRS and that receipts and expenditures of our Company are being made only in accordance with authorizations of our Board of Directors; and (3) provide reasonable assurance regarding prevention or timely detection of unauthorized acquisition, use or disposition of the company’s assets that could have a material effect on the financial statements. Based on these criteria, our management concluded that, as of December 31, 2013, our internal control over financial reporting was effective.
All internal control systems, no matter how well designed, have inherent limitations, including the possibility of human error and the circumvention or overriding of the controls and procedures which may not prevent or detect misstatements. Also, projections of any evaluation of effectiveness to future periods are subject to the risk that controls may become inadequate because of changes in conditions.
Remediation of Previously Reported Material Weakness
As previously disclosed in our annual report on Form 20-F for the year ended December 31, 2012, as a result of management’s evaluation of our internal control over financial reporting, management identified a
144
material weakness in our internal control over financial reporting for 2010, 2011 and 2012. The material weakness arose due to the failure of management to design and maintain effective controls over the analysis and evaluation necessary to determine the appropriate accounting treatment of lease arrangements for such periods.
Exchange Act Rule 12b-2 (17 CFR 240.12b-2) and Rule 1-02 of Regulation S-X (17 CFR 210.1-02) defines a material weakness as a deficiency, or combination of deficiencies, in internal control over financial reporting such that there is a reasonable possibility that a material misstatement of the company’s annual or interim financial statements will not be prevented or detected on a timely basis.
In 2013, we enhanced the capability of our accounting team to address complex accounting issues by implementing additional training related to complex accounting standards and updates on IFRS. Based on our evaluation, the controls have been functioning effectively as of December 31, 2013. As a result, management has concluded that the material weakness previously disclosed in the annual report on Form 20-F for the year ended December 31, 2012 has been remediated as of December 31, 2013.
Report of Independent Registered Public Accounting Firm on Internal Controls
Purwantono, Suherman & Surja, a member firm of Ernst & Young Global Limited, the independent registered public accounting firm, has audited our consolidated financial statements included in this annual report and has issued an attestation report on internal control over financial reporting as of December 31, 2013. This attestation report is set forth on page F-3 of our consolidated financial statements attached hereto.
Changes in Internal Control Over Financial Reporting
Except as described above in the paragraph titled “Remediation of Previously Reported Material Weakness,” there were no changes in our internal control over financial reporting during the period covered by this annual report that have materially affected, or are reasonably likely to materially affect, our internal control over financial reporting.
Item 16A: AUDIT COMMITTEE FINANCIAL EXPERT
The Board of Commissioners has determined that Kanaka Puradiredja constitute an “audit committee financial expert,” as defined in Item 16A of Form 20-F, and that such person is also “independent,” as defined in Rule 10A-3 under the Exchange Act.
Item 16B: CODE OF ETHICS
We have adopted a Code of Ethics that applies to all employees, including our Board of Directors. We have posted this Code of Ethics on our website at www.indosat.com, where it is publicly available. A copy of our Code of Ethics was filed as Exhibit 11.1 to our annual report on Form 20-F for the year ended December 31, 2009. On November 20, 2010, we issued guidelines on the implementation of our Code of Ethics in order to raise awareness and provide practical guidelines on the application of our Code of Ethics among all of our employees.
145
Item 16C: PRINCIPAL ACCOUNTANT FEES AND SERVICES
The following table contains a summary of the fees paid to Purwantono, Suherman & Surja, the Indonesian member firm of Ernst & Young Global, our independent external auditors for the years ended December 31, 2012 and 2013:
| | | | | | | | |
| | | 2012 | | | 2013 | |
| | | (in US$) | |
Audit fees(1) | | | 805,206 | | | | 685,103 | |
Audit-related fees(2) | | | 762,219 | | | | 557,425 | |
Tax fees(3) | | | — | | | | — | |
All other fees(4) | | | — | | | | — | |
| | | | | | | | |
Total Fees | | | 1,567,425 | | | | 1,242,528 | |
| | | | | | | | |
| (1) | Audit fees represent fees for professional services provided for the financial audit of our financial statements and of our subsidiaries, IM2, Lintasarta, PT Starone Mitra Telekomunikasi and PT Artajasa Pembayaran Elektronis and our internal control audit and attestation services in compliance with Section 404 of the Sarbanes-Oxley Act of 2002. |
| (2) | Audit-related fees in 2012 and 2013 primarily consisted of fees for performing limited reviews of our interim financial information including those of our subsidiaries, agreed upon procedures and for performing services in connection with our bonds issuance in 2012. |
| (3) | Tax fees represent fees for professional services related to tax compliance and tax planning/advisory consultation. |
| (4) | All other fees represent professional services provided for services not directly supporting financial statement audits. |
These professional services are covered within the scope of audit services as defined by the Commission’s regulations.
In June 2004, the Audit Committee adopted a policy pursuant to which all audit and non-audit services must be pre-approved by the Audit Committee. Under no circumstances may our principal external auditors provide services that are prohibited by the Sarbanes-Oxley Act of 2002 or rules issued thereunder. Non-prohibited audit-related services may be provided to us, subject to such pre-approval process and prohibitions. The pre-approval policy relates to all services provided by our principal external auditor and does not include any pre-set fee limits that do not require pre-approval or anyde minimis exception.
Item 16D: EXEMPTIONS FROM THE LISTING STANDARDS FOR AUDIT COMMITTEES
In accordance with Indonesian law, we have a two-tier board structure, consisting of a Board of Commissioners and a Board of Directors. The executive management functions are carried out by our Board of Directors, while our Board of Commissioners is principally responsible for supervising and advising our Board of Directors in the operation and management of our Company.
Under the IDX rules, our Audit Committee must consist of at least three members, one of whom must be an independent commissioner and concurrently the chairman of the Audit Committee, while the other two members must be external independent parties of whom at least one such party shall have accounting and/or finance expertise. Our Audit Committee is composed of five members and is chaired by one of our Independent Commissioners. Members of our Audit Committee are appointed and dismissed by our Board of Commissioners.
Listing rules adopted pursuant to Rule 10A-3 under the Exchange Act require a foreign private issuer with securities listed on the NYSE to have an audit committee comprised of independent directors. The rules became effective on July 31, 2005. Under Rule 10A-3(c)(3), foreign private issuers are exempt from such independence
146
requirements if (i) the home country government or stock exchange requires the company to have an audit committee; (ii) the audit committee is separate from the board of directors or has members from both inside and outside the board of directors; (iii) the audit committee members are not elected by the management and no executive officer of the company is a member of the audit committee; (iv) the home country government or stock exchange has requirements for an audit committee independent from the management of the company; and (v) the audit committee is responsible for the appointment, retention and oversight of the work of external auditors. We rely on the general exemption under Rule 10A-3(c)(3) of the Exchange Act with respect to the composition of our Audit Committee as set forth in our Section 303A.11 website disclosure, which is made publicly available on our website, www.indosat.com.
We believe our reliance on the exemption would not materially or adversely affect the ability of our Audit Committee to act independently. We also believe the intent of such provisions are meant to ensure that the Audit Committee is independent from influence by management and would provide a forum separate from management in which auditors and other interested parties can candidly discuss concerns. The IDX rules require that each member of the Audit Committee be independent. The rules also require that at least two of the members of the Audit Committee be external independent members, which means that they must be independent of not only the Board of Directors but also the Board of Commissioners and us as a whole. Accordingly, we believe the standard established by the IDX rules are at least equally effective in ensuring the ability of our Audit Committee to act independently.
Item 16E: PURCHASES OF EQUITY SECURITIES BY THE ISSUER AND AFFILIATED PURCHASERS
Not applicable.
Item 16F: CHANGE IN REGISTRANT’S CERTIFYING ACCOUNTANT
There were no changes in or disagreements with our accountants on any matter of accounting principle, practice or financial disclosure during the last two fiscal years.
Item 16G: CORPORATE GOVERNANCE
We are incorporated under the laws of the Republic of Indonesia and the principal trading market for our ordinary shares is the IDX. Our ordinary shares are registered with the U.S. Securities and Exchange Commission and our ADSs were listed on the NYSE from October 18, 1994 until we voluntarily delisted trading of the ADSs from the NYSE effective May 17, 2013. As such, we are subject to certain corporate governance requirements.
Our home country requirements for corporate governance are embodied primarily in Law No. 40 of 2007 on Limited Liability Companies, Law No. 8 of 1995 on Capital Markets, BAPEPAM-LK regulations and rules issued by the IDX. In addition to these statutory requirements, our Articles of Association incorporate provisions directing certain corporate governance practices.
However, many of the corporate governance rules contained in the NYSE Listed Company Manual, or the NYSE listing standards, are not required for “foreign private issuers” and we are permitted to follow our home country corporate governance practices in lieu of most corporate governance standards contained in the NYSE listing standards. Although we have complied voluntarily with most of the corporate governance rules contained in the NYSE listing standards, there are certain important differences between our corporate governance standards and those standards applicable to U.S. companies listed on the NYSE which are described below.
147
Audit Committee
The NYSE listing standards require NYSE-listed companies to maintain an audit committee comprised of at least three members satisfying the requirements for independence set forth in Section 303A.02. Pursuant to BAPEPAM-LK regulations, public companies in Indonesia must maintain audit committees comprised of at least one independent commissioner and two members from outside the company. Our Audit Committee consists of five members, three of whom are Independent Commissioners and two of whom are independent outsiders, as required by BAPEPAM-LK regulations.
In addition, our Audit Committee’s written charter does not require our Audit Committee to review earnings guidance prior to filing to ensure compliance with the prevailing capital market laws and regulations as required under Section 303A.07(c)(iii)(C), although the written charter does require review of press releases containing financial information. Unlike the requirements set forth in the NYSE listing standards, our Audit Committee does not have direct responsibility for the appointment, retention and compensation of our external auditor. Our Audit Committee can only recommend the appointment of the external auditor to the Board of Commissioners, and the Board of Commissioner’s decision is subject to shareholder approval as required by Indonesian law. A copy of our Audit Committee’s written charter can be found on our website at www.indosat.com and is attached as Exhibit 15.16 to our Form 20-F filed on June 1, 2010.
Composition of Board of Directors; Nominating Committee
The NYSE listing standards require that the board of directors of an NYSE-listed company consist of a majority of independent directors and that a nominating committee be established. We have a dual board structure, with a separate Board of Directors and Board of Commissioners, separating the powers of management (exercised by the Board of Directors) from those of supervision (exercised by the Board of Commissioners). As such, when the NYSE listing standards apply corporate governance principles to the directors of a NYSE-listed company, we evaluate our practices with reference to our Commissioners. As required by BAPEPAM-LK regulations and IDX rules, our ten-member Board of Commissioners maintains a minimum of at least three independent members. Further, we do not have a nominating committee. At meetings of our shareholders, our shareholders nominate and elect persons to our Board of Commissioners.
Pursuant to the NYSE listing standards, directors of NYSE-listed companies must meet at regularly-scheduled executive sessions without management. Neither the BAPEPAM-LK regulations nor IDX rules require us to hold such executive sessions where the Board of Commissioners meets without any Directors present. In the past, our Board of Commissioners, which is entirely composed of non-management persons, has met in executive session periodically, in addition to the customary presentation of information by our Board of Directors to the Board of Commissioners. In early 2005, we instituted procedures by which our Board of Commissioners started meeting in executive sessions at the end of each regularly-scheduled meeting, which currently occur at least on a quarterly basis.
Compensation Committee
The NYSE listing standards require NYSE-listed companies to maintain a compensation committee composed entirely of independent directors with a written charter addressing the committee’s performance and responsibilities as well as requiring an annual performance evaluation. Our Remuneration Committee currently has three members from our Board of Commissioners and has the responsibilities contained in the NYSE listing standards. However, only two of the three committee members are independent and its written charter does not provide for an annual performance evaluation of the Remuneration Committee. A copy of our Remuneration Committee’s written charter can be found on our website at www.indosat.com.
Item 16H: MINE SAFETY DISCLOSURE
Not applicable.
148
PART III
Item 17: FINANCIAL STATEMENTS
The financial statements listed in Item 19(a) of this annual report, together with the reports of our independent auditors thereon, are filed as part of this annual report.
Item 18: FINANCIAL STATEMENTS
Not applicable. See Item 17.
Item 19: EXHIBITS
| | | | | | |
(a) | | Index to Consolidated Financial Statements | | | |
| | |
| | Report of Independent Registered Public Accounting Firm | | | F-2-F-3 | |
| | Consolidated Statements of Financial Position as of January 1, 2012 and December 31, 2012 and 2013 | | | F-4-F-7 | |
| | Consolidated Statements of Comprehensive Income for the Years Ended December 31, 2011, 2012 and 2013 | | | F-8-F-9 | |
| | Consolidated Statements of Changes in Equity for the Years Ended December 31, 2011, 2012 and 2013 | | | F-10-F-12 | |
| | Consolidated Statements of Cash Flows for the Years Ended December 31, 2011, 2012 and 2013 | | | F-13-F-14 | |
| | Notes to Consolidated Financial Statements for the Years ended December 31, 2011, 2012 and 2013 | | | F-15-F-162 | |
| | |
(b) | | Index to Exhibits |
| |
| 1.1 | | Notarial Deed No. 118 Relating to the Amendment and Restatement of the Articles of Association, dated June 11, 2009(4) |
| |
| 1.2 | | Notarial Deed No. 123, Relating to the Amendment of the Articles of Association, dated January 28, 2010(4) |
| |
| 4.1 | | Form of Non-Compete Agreement(7) |
| |
| 4.2 | | Agreement for Network Interconnection for Indosat’s Fixed Local Telecommunication Network and Telkomsel’s Cellular Mobile Network, between Indosat and Telkomsel, dated July 30, 2007 and its Amendments dated December 19, 2007(5), March 3, 2008(4), November 1, 2010(3), April 7, 2011(2), July 19, 2011(2), May 28, 2012(1) and March 8, 2013(1) |
| |
| 4.3 | | Agreement for Network Interconnection for Cellular Mobile Network between Indosat and Telkomsel, dated December 19, 2007 and its Amendments dated February 18, 2008(4), September 7, 2010(3), April 7, 2011(2), May 28, 2012(1) and March 8, 2013(1) |
| |
| 4.4 | | Agreement for Network Interconnection for Indosat’s Cellular Mobile Network and Telkom’s Fixed Local Telecommunication Network, between Indosat and Telkom, dated December 18, 2007 and its Amendments dated March 31, 2008(4), December 30, 2009(3), January 31, 2011(3), July 20, 2011(2), December 20, 2011(2)and May 30, 2012(1) |
| |
| 4.5 | | Agreement for Network Interconnection for Fixed Telecommunication Network between Indosat and Telkom, dated December 18, 2007 and Amendments dated March 31, 2008(4), December 30, 2009(3), January 31, 2011(3), July 20, 2011(2), December 20, 2011(2)and May 30, 2012(1) |
| |
| 4.6 | | Tower Lease Agreement between Indosat and PT Hutchison CP Telecommunications dated January 29, 2010(3) and its Amendment dated August 18, 2011(2) |
| |
| 4.7 | | Tower Lease Agreement between Indosat and PT Natrindo Telepon Seluler dated April 15, 2010(3) |
149
| | |
(b) | | Index to Exhibits |
| |
| 4.8 | | Tower Lease Agreement between Indosat and PT XL Axiata dated May 24, 2010(3) and its Amendment dated February 1, 2012(1) |
| |
| 4.9 | | Tower Lease Agreement between Indosat and PT Berca Global Access dated June 3, 2010(3) |
| |
| 4.10 | | Tower Lease Agreement between Indosat and PT Daya Mitra Telekomunikasi dated February 4, 2011(3) |
| |
| 4.11 | | Memorandum of Agreement between Indosat and PT First Media Tbk dated February 10, 2011(3) as replaced and superseded by Tower Lease Agreement between Indosat and PT First Media Tbk dated September 30, 2013 and Novation Agreement thereto between Indosat, PT First Media Tbk and PT Internux dated October 2, 2013 |
| |
| 4.12 | | Pico Sharing Agreement between Indosat and PT XL Axiata Tbk dated December 14, 2012(1) |
| |
| 4.13 | | Tower Lease Agreement between Indosat and PT Smart Telecom dated September 29, 2011 |
| |
| 7.1 | | Operating and Financial Ratios |
| |
| 8.1 | | List of Our Subsidiaries |
| |
| 12.1 | | Certification by the Chief Executive Officer in accordance with Section 302 of the Sarbanes-Oxley Act of 2002 |
| |
| 12.2 | | Certification by the Chief Financial Officer in accordance with Section 302 of the Sarbanes-Oxley Act of 2002 |
| |
| 13.1 | | Certification by the Chief Executive Officer Required by 18 U.S.C. §1350 |
| |
| 13.2 | | Certification by the Chief Financial Officer Required by 18 U.S.C. §1350 |
| |
| 15.1 | | Trustee Agreement for the Fifth Indosat Bonds, dated May 9, 2007(6) and its Amendment on May 4, 2009(4) |
| |
| 15.2 | | Credit Agreement with Goldman Sachs International dated May 30, 2007(6) |
| |
| 15.3 | | Trustee Agreement for the Second Syari’ah Ijarah Bonds, dated May 9, 2007(6) and its Amendment on May 4, 2009(4) |
| |
| 15.4 | | Credit Agreement with PT Bank Central Asia Tbk, dated August 28, 2007(6), its Amendment on October 30, 2007(6)and on February 12, 2009(5) |
| |
| 15.5 | | Credit Agreement with PT Bank Mandiri (Persero) Tbk, dated September 18, 2007(6) and its Amendment on March 23, 2009(5) |
| |
| 15.6 | | Credit Agreement with Bank DBS Indonesia, dated November 1, 2007(6) and its Amendment on March 25, 2009(5) |
| |
| 15.7 | | Sinosure Term Facility Agreement with HSBC France, dated November 27, 2007(5) and its Amendment on March 18, 2009(5) |
| |
| 15.8 | | COFACE Term Facility Agreement with HSBC France, dated November 27, 2007(5) and its Amendment on March 18, 2009(5) |
| |
| 15.9 | | Commercial Facility Agreement with the Hongkong Shanghai Corporation Limited, Jakarta Branch, dated November 27, 2007(5) and its Amendment on March 18, 2009(5) |
| |
| 15.10 | | Trustee Agreement for the Sixth Indosat Bonds, dated March 17, 2008(6) and its Amendment on May 4, 2009(4) |
| |
| 15.11 | | Trustee Agreement for the Third Syari’ah Ijarah Bonds, dated March 17, 2008(6) and its Amendment on May 4, 2009(4) |
| |
| 15.12 | | Syndicated Loan Facility with ING/DBS, dated June 12, 2008(5) and its Amendment on February 24, 2009(5) |
| |
| 15.13 | | Revised Audit Committee Charter, dated September 4, 2013 |
150
| | |
| |
| 15.14 | | Deed of Amendment of Trustee Agreement for the Second Indosat Bonds, dated May 4, 2009(4) |
| |
| 15.15 | | Deed of Amendment of Trustee Agreement for the Syariah Ijarah Bonds, dated May 4, 2009(4) |
| |
| 15.16 | | Credit Agreement with PT Bank Mandiri (Persero) Tbk, dated July 28, 2009(4) |
| |
| 15.17 | | EKN Facility Agreement with HSBC Hongkong and ABN Amro Bank Hongkong, dated August 18, 2009(4) |
| |
| 15.18 | | Trustee Agreement for the Seventh Indosat Bonds, dated November 25, 2009(4) |
| |
| 15.19 | | Trustee Agreement for the Fourth Syari’ah Ijarah Bonds, dated November 25, 2009(4) |
| |
| 15.20 | | Indenture dated July 29, 2010 covering our Guaranteed Notes due 2020(3) and its Supplement dated June 5, 2012(1) |
| |
| 15.21 | | Time Loan Revolving Credit Facility Agreement with PT Bank Central Asia Tbk, dated February 10, 2011(3) and its Amendment on December 1, 2011(2)and July 15, 2013 |
| |
| 15.22 | | Credit Agreement with PT Bank Mandiri (Persero) Tbk, dated June 21, 2011 and its Amendment on December 5, 2011(2) |
| |
| 15.23 | | Asset Purchase Agreement, dated February 7, 2012, by and among Indosat, PT Tower Bersama Infrastructure Tbk and PT Solusi Menara Indonesia(2) |
| |
| 15.24 | | Credit Agreement with PT Bank Sumitomo Mitsui Indonesia, dated December 26, 2012 and its Amendment on March 19, 2013(1) |
| |
| 15.25 | | Trustee Agreement for the Eighth Indosat Bonds, dated June 13, 2012(1) |
| |
| 15.26 | | Trustee Agreement for the Fifth Syari’ah Ijarah Bonds, dated June 13, 2012(1) |
| |
| 15.27 | | Syndicated Credit Agreement between Indosat, PT Indonesia Infrastructure Finance and PT Sarana Multi Infrastruktur (Persero) dated October 18, 2013 |
| |
| 15.28 | | Credit Agreement between Indosat and The Bank of Tokyo-Mitsubishi UFJ, Ltd dated December 23, 2013 |
| (1) | Incorporated by reference to our annual report on Form 20-F for the fiscal year ended December 31, 2012 (File No.001-13330) filed with the U.S. Securities and Exchange Commission on April 30, 2013. |
| (2) | Incorporated by reference to our annual report on Form 20-F for the fiscal year ended December 31, 2011 (File No.001-13330) filed with the U.S. Securities and Exchange Commission on April 30, 2012. |
| (3) | Incorporated by reference to our annual report on Form 20-F for the fiscal year ended December 31, 2010 (File No.001-13330) filed with the U.S. Securities and Exchange Commission on May 18, 2011. |
| (4) | Incorporated by reference to our annual report on Form 20-F for the fiscal year ended December 31, 2009 (File No.001-13330) filed with the U.S. Securities and Exchange Commission on June 1, 2010. |
| (5) | Incorporated by reference to our annual report on Form 20-F for the fiscal year ended December 31, 2008 (File No. 001-13330) filed with the U.S. Securities and Exchange Commission on April 15, 2009. |
| (6) | Incorporated by reference to our annual report on Form 20-F for the fiscal year ended December 31, 2007 (File No. 001-13330) filed with the U.S. Securities and Exchange Commission on May 5, 2008. |
| (7) | Incorporated by reference to our annual report on Form 20-F for the fiscal year ended December 31, 2005 (File No. 001-13330) filed with the U.S. Securities and Exchange Commission on June 28, 2006. |
We have not included as exhibits certain instruments with respect to our long-term debt, the total amount of debt authorized under each of which does not exceed 10.0% of our total consolidated assets. We agree to furnish a copy of any such instrument to the Commission upon request.
151
SIGNATURE
The registrant hereby certifies that it meets all of the requirements for filing on Form 20-F and that it has duly caused and authorized the undersigned to sign this annual report on its behalf.
Date: April 30, 2014
| | |
| PT INDOSAT TBK |
| |
By: | | /s/ Alexander Rusli |
| Name: | | Alexander Rusli |
| Title: | | President Director and Chief Executive Officer |
152
PT INDOSAT Tbk AND ITS SUBSIDIARIES
CONSOLIDATED FINANCIAL STATEMENTS
WITH REPORT OF INDEPENDENT
REGISTERED PUBLIC ACCOUNTING FIRM
JANUARY 1, 2012 (RESTATED), DECEMBER 31, 2012 (RESTATED) AND DECEMBER 31, 2013
AND YEARS ENDED DECEMBER 31, 2011 (RESTATED), 2012 (RESTATED) AND 2013
Table of Contents
***************************
F-1
Report of Independent Registered Public Accounting Firm
Report No. RPC-5732/PSS/2014
The Shareholders and the Boards of Commissioners and Directors
PT Indosat Tbk.
We have audited the accompanying consolidated statements of financial position of PT Indosat Tbk. (the “Company”) and its subsidiaries as of January 1, 2012 and December 31, 2012 and 2013, and the related consolidated statements of comprehensive income, changes in equity, and cash flows for each of the three years in the period ended December 31, 2013. These consolidated financial statements are the responsibility of the Company’s management. Our responsibility is to express an opinion on these consolidated financial statements based on our audits.
We conducted our audits in accordance with the standards of the Public Company Accounting Oversight Board (United States). Those standards require that we plan and perform the audit to obtain reasonable assurance about whether the financial statements are free of material misstatement. An audit includes examining, on a test basis, evidence supporting the amounts and disclosures in the financial statements. An audit also includes assessing the accounting principles used and significant estimates made by management, as well as evaluating the overall financial statement presentation. We believe that our audits provide a reasonable basis for our opinion.
In our opinion, the consolidated financial statements referred to above present fairly, in all material respects, the consolidated financial positions of PT Indosat Tbk. and its subsidiaries as of January 1, 2012 and December 31, 2012 and 2013, and the consolidated results of their operations and their cash flows for each of the three years in the period ended December 31, 2013 in conformity with International Financial Reporting Standards as issued by the International Accounting Standards Board.
As discussed in Note 2d to the consolidated financial statements, the Company changed its method of accounting for defined benefit plans on a retrospective basis and the 2011 and 2012 consolidated financial statements have been restated as a result of the adoption of International Accounting Standard 19Employee Benefits (Revised 2011) effective January 1, 2013.
We also have audited, in accordance with the standards of the Public Company Accounting Oversight Board (United States), the Company’s internal control over financial reporting as of December 31, 2013, based on criteria established in Internal Control-Integrated Framework issued by the Committee of Sponsoring Organizations of the Treadway Commission (1992 framework), and our report dated April 29, 2014 expressed an unqualified opinion thereon.
Purwantono, Suherman & Surja
Jakarta, Indonesia
April 29, 2014
F-2
Report of Independent Registered Public Accounting Firm
Report No. RPC-5733/PSS/2014
The Shareholders and the Boards of Commissioners and Directors
PT Indosat Tbk.
We have audited PT Indosat Tbk. (the “Company”) and its subsidiaries’ internal control over financial reporting as of December 31, 2013 based on criteria established in Internal Control-Integrated Framework issued by the Committee of Sponsoring Organizations of the Treadway Commission (1992 framework) (the “COSO criteria”). The Company and its subsidiaries’ management is responsible for maintaining effective internal control over financial reporting, and for its assessment of the effectiveness of internal control over financial reporting included in the accompanying Management’s Annual Report on Internal Control over Financial Reporting. Our responsibility is to express an opinion on the Company and its subsidiaries’ internal control over financial reporting based on our audit.
We conducted our audit in accordance with the standards of the Public Company Accounting Oversight Board (United States). Those standards require that we plan and perform the audit to obtain reasonable assurance about whether effective internal control over financial reporting was maintained in all material respects. Our audit included obtaining an understanding of internal control over financial reporting, assessing the risk that a material weakness exists, testing and evaluating the design and operating effectiveness of internal control based on the assessed risk, and performing such other procedures as we considered necessary in the circumstances. We believe that our audit provides a reasonable basis for our opinion.
A company’s internal control over financial reporting is a process designed to provide reasonable assurance regarding the reliability of financial reporting and the preparation of financial statements for external purposes in accordance with International Financial Reporting Standards as issued by the International Accounting Standards Board. A company’s internal control over financial reporting includes those policies and procedures that (1) pertain to the maintenance of records that, in reasonable detail, accurately and fairly reflect the transactions and dispositions of the assets of the company; (2) provide reasonable assurance that transactions are recorded as necessary to permit preparation of financial statements in accordance with International Financial Reporting Standards as issued by the International Accounting Standards Board, and that receipts and expenditures of the company are being made only in accordance with authorizations of management and directors of the company; and (3) provide reasonable assurance regarding prevention or timely detection of unauthorized acquisition, use, or disposition of the company’s assets that could have a material effect on the financial statements.
Because of its inherent limitations, internal control over financial reporting may not prevent or detect misstatements. Also, projections of any evaluation of effectiveness to future periods are subject to the risk that controls may become inadequate because of changes in conditions or that the degree of compliance with the policies or procedures may deteriorate.
In our opinion, PT Indosat Tbk. and its subsidiaries maintained, in all material respects, effective internal control over financial reporting as of December 31, 2013, based on the COSO criteria.
We also have audited, in accordance with the standards of the Public Company Accounting Oversight Board (United States), the consolidated statements of financial position of PT Indosat Tbk. and its subsidiaries as of January 1, 2012 and December 31, 2012 and 2013, and the related consolidated statements of comprehensive income, changes in equity, and cash flows for each of the three years in the period ended December 31, 2013, and our report dated April 29, 2014 expressed an unqualified opinion thereon.
Purwantono, Suherman & Surja
Jakarta, Indonesia
April 29, 2014
F-3
PT INDOSAT Tbk AND ITS SUBSIDIARIES
CONSOLIDATED STATEMENTS OF FINANCIAL POSITION
January 1, 2012 (Restated), December 31, 2012 (Restated) and December 31, 2013
(Expressed in millions of rupiah, except share data)
| | | | | | | | | | | | | | |
| | | Notes | | January 1, 2012
(Restated) | | | December 31, | |
| | | | | 2012
(Restated) | | | 2013 | |
| | | | | Rp | | | Rp | | | Rp | |
ASSETS | | | | | | | | | | | | | | |
| | | | |
CURRENT ASSETS | | | | | | | | | | | | | | |
Cash and cash equivalents | | 2f8,4,21 | | | | | | | | | | | | |
| | 31,36 | | | 2,224,206 | | | | 3,917,236 | | | | 2,233,532 | |
Accounts receivable | | 2f8,5 | | | | | | | | | | | | |
Trade—net of allowance for impairment of Rp536,651 as of January 1, 2012, Rp564,630 as of December 31, 2012 and Rp521,406 as of December 31, 2013 | | 20,31,34j,34m,36 | | | 1,500,096 | | | | 2,038,719 | | | | 2,268,339 | |
Others—net of allowance for impairment of Rp16,702 as of January 1, 2012, Rp18,748 as of December 31, 2012 and Rp35,388 as of December 31, 2013 | | | | | 5,660 | | | | 22,441 | | | | 16,294 | |
Inventories—net of allowance for obsolescence of Rp18,401 as of January 1, 2012, Rp14,613 as of December 31, 2012 and Rp13,213 as of December 31, 2013 | | 2f20 | | | 75,890 | | | | 52,556 | | | | 36,004 | |
Derivative assets | | 2f8,2f15 | | | | | | | | | | | | |
| | 20,21,36 | | | 159,349 | | | | 69,654 | | | | 195,569 | |
Advances | | 34j,34m | | | 40,485 | | | | 36,057 | | | | 34,867 | |
Prepaid frequency fee and licenses | | 2f19,2f21 | | | | | | | | | | | | |
| | 31 | | | 1,353,819 | | | | 1,528,215 | | | | 1,757,586 | |
Prepaid expenses—other | | 2f19,2f21 | | | | | | | | | | | | |
| | 30,31 | | | 351,833 | | | | 335,815 | | | | 373,897 | |
Other current assets | | 7 | | | 31,437 | | | | 294,735 | | | | 221,256 | |
Other current financial assets—net | | 2f8,6,21 | | | | | | | | | | | | |
| | 31,36 | | | 24,790 | | | | 13,382 | | | | 31,673 | |
| | | | | | | | | | | | | | |
Total Current Assets | | | | | 5,767,565 | | | | 8,308,810 | | | | 7,169,017 | |
| | | | | | | | | | | | | | |
The accompanying notes form an integral part of these consolidated financial statements.
F-4
PT INDOSAT Tbk AND ITS SUBSIDIARIES
CONSOLIDATED STATEMENTS OF FINANCIAL POSITION—(Continued)
January 1, 2012 (Restated), December 31, 2012 (Restated) and December 31, 2013
(Expressed in millions of rupiah, except share data)
| | | | | | | | | | | | | | |
| | | Notes | | January 1, 2012
(Restated) | | | December 31, | |
| | | | | 2012
(Restated) | | | 2013 | |
| | | | | Rp | | | Rp | | | Rp | |
NON-CURRENT ASSETS | | | | | | | | | | | | | | |
Due from related parties—net of allowance for impairment of Rp15 as of January 1, 2012, December 31, 2012 and 2013 | | 2f8,21,31,36 | | | 10,654 | | | | 10,358 | | | | 7,167 | |
Deferred tax assets—net | | 2d,2f6,16 | | | 120,599 | | | | 114,304 | | | | 101,853 | |
Property and equipment—net | | 2f16,2f17,2f19,
2f22,8 | | | 43,412,937 | | | | 41,860,846 | | | | 42,074,920 | |
Goodwill and other intangible assets—net | | 2f1,2f2,2f22, 9 | | | 2,055,971 | | | | 2,062,825 | | | | 2,051,717 | |
Long-term prepaid rentals—net of current portion | | 2f21,10,31 | | | 766,349 | | | | 755,237 | | | | 810,354 | |
Long-term prepaid licenses—net of current portion | | 2f19,2f21 | | | 331,868 | | | | 266,027 | | | | 200,186 | |
Long-term advances | | 11,31,34j,34m | | | 161,649 | | | | 40,994 | | | | 92,162 | |
Long-term prepaid pension—net of current portion | | 2d,2f7,30a6,31 | | | 73,717 | | | | 20,670 | | | | 123,814 | |
Long-term receivables | | 2d,2f8 | | | 12,675 | | | | 9,572 | | | | 10,246 | |
Other non-current financial assets—net | | 2f8,12,21,
31,34j,34m,36 | | | 212,270 | | | | 1,543,140 | | | | 1,557,367 | |
Other non-current assets—net | | 2f3,2f6,13 | | | 872,436 | | | | 754,498 | | | | 941,206 | |
| | | | | | | | | | | | | | |
Total Non-current Assets | | | | | 48,031,125 | | | | 47,438,471 | | | | 47,970,992 | |
| | | | | | | | | | | | | | |
TOTAL ASSETS | | | | | 53,798,690 | | | | 55,747,281 | | | | 55,140,009 | |
| | | | | | | | | | | | | | |
The accompanying notes form an integral part of these consolidated financial statements.
F-5
PT INDOSAT Tbk AND ITS SUBSIDIARIES
CONSOLIDATED STATEMENTS OF FINANCIAL POSITION—(Continued)
January 1, 2012 (Restated), December 31, 2012 (Restated) and December 31, 2013
(Expressed in millions of rupiah, except share data)
| | | | | | | | | | | | | | |
| | Notes | |
| January 1, 2012
(Restated) |
| | | December 31, | |
| | | | | 2012
(Restated) | | | 2013 | |
| | | | | Rp | | | Rp | | | Rp | |
LIABILITIES AND EQUITY | | | | | | | | | | | | | | |
| | | | |
CURRENT LIABILITIES | | | | | | | | | | | | | | |
Short-term loan | | 2f9,14,21,31,36 | | | 1,499,256 | | | | 299,529 | | | | 1,499,849 | |
Accounts payable—trade | | 2f9,21,31,36 | | | 319,058 | | | | 231,737 | | | | 339,310 | |
Procurement payable | | 2f9,15,21, | | | | | | | | | | | | |
| | 31,36 | | | 3,475,862 | | | | 2,737,850 | | | | 3,064,287 | |
Taxes payable | | 2f6,16 | | | 28,294 | | | | 34,025 | | | | 15,337 | |
Accrued expenses | | 2f7,2f9,17,21,30c4,30d4, | | | | | | | | | | | | |
| | 31,36 | | | 1,895,613 | | | | 1,961,285 | | | | 2,107,467 | |
Unearned income | | 2f5,34n | | | 1,034,797 | | | | 1,073,706 | | | | 922,403 | |
Deposits from customers | | 2f9,21,36 | | | 37,265 | | | | 43,825 | | | | 49,335 | |
Derivative liabilities | | 2f9,2f15, | | | | | | | | | | | | |
| | 20,21,36 | | | 138,189 | | | | 81,241 | | | | 36,903 | |
Current maturities of: | | | | | | | | | | | | | | |
Loans payable | | 2f9,18,21,31,36 | | | 3,300,537 | | | | 2,669,218 | | | | 2,443,367 | |
Bonds payable | | 2f9,19,21,36 | | | 41,989 | | | | 1,329,175 | | | | 2,356,310 | |
Other current financial liabilities | | 2f9,2f19,21,31,34o,36 | | | 71,828 | | | | 289,164 | | | | 362,448 | |
Other current liabilities | | 29,31 | | | 127,761 | | | | 265,614 | | | | 297,421 | |
| | | | | | | | | | | | | | |
Total Current Liabilities | | | | | 11,970,449 | | | | 11,016,369 | | | | 13,494,437 | |
| | | | | | | | | | | | | | |
NON-CURRENT LIABILITIES | | | | | | | | | | | | | | |
Due to related parties | | 2f9,21,31,36 | | | 15,480 | | | | 42,789 | | | | 33,301 | |
Obligation under finance lease | | 2f9,2f19,21,34o,36 | | | 770,081 | | | | 3,101,910 | | | | 3,594,112 | |
Deferred tax liabilities—net | | 2d,2f6,16 | | | 2,071,183 | | | | 1,729,226 | | | | 1,155,446 | |
Loans payable—net of current maturities | | 2f9,18, 21,31,36 | | | 6,425,779 | | | | 3,703,822 | | | | 4,345,267 | |
Bonds payable—net of current maturities | | 2f9,19,21,36 | | | 12,138,353 | | | | 13,986,507 | | | | 13,285,207 | |
Employee benefit obligations—net of current portion | | 2d,2f7,22 | | | 998,499 | | | | 1,409,211 | | | | 746,971 | |
Other non-current financial liabilities | | 2f9,21,36 | | | 107,433 | | | | 69,273 | | | | 82,855 | |
Other non-current liabilities | | 29,31 | | | 95,054 | | | | 1,299,131 | | | | 1,228,415 | |
| | | | | | | | | | | | | | |
Total Non-current Liabilities | | | | | 22,621,862 | | | | 25,341,869 | | | | 24,471,574 | |
| | | | | | | | | | | | | | |
TOTAL LIABILITIES | | | | | 34,592,311 | | | | 36,358,238 | | | | 37,966,011 | |
| | | | | | | | | | | | | | |
The accompanying notes form an integral part of these consolidated financial statements.
F-6
PT INDOSAT Tbk AND ITS SUBSIDIARIES
CONSOLIDATED STATEMENTS OF FINANCIAL POSITION—(Continued)
January 1, 2012 (Restated), December 31, 2012 (Restated) and December 31, 2013
(Expressed in millions of rupiah, except share data)
| | | | | | | | | | | | | | |
| | Notes | |
| January 1, 2012
(Restated) |
| | | December 31, | |
| | | | | 2012
(Restated) | | | 2013 | |
| | | | | Rp | | | | Rp | | | | Rp | |
EQUITY | | | | | | | | | | | | | | |
| | | | |
EQUITY ATTRIBUTABLE TO OWNERS OF THE COMPANY | | | | | | | | | | | | | | |
Capital stock—Rp100 par value per A share and B share Authorized—1 A share and 19,999,999,999 B shares Issued and fully paid—1 A share and 5,433,933,499 B shares | | 23 | | | 543,393 | | | | 543,393 | | | | 543,393 | |
Premium on capital stock | | 23 | | | 1,546,587 | | | | 1,546,587 | | | | 1,546,587 | |
Retained earnings | | | | | | | | | | | | | | |
Appropriated | | | | | 134,446 | | | | 134,446 | | | | 134,446 | |
Unappropriated | | 2d | | | 16,346,858 | | | | 16,305,909 | | | | 13,319,725 | |
Other components of equity | | 2b,2d,2f | | | 187,874 | | | | 336,917 | | | | 1,034,530 | |
| | | | | | | | | | | | | | |
Total Equity Attributable to Owners of the Company | | | | | 18,759,158 | | | | 18,867,252 | | | | 16,578,681 | |
Non-controlling Interests | | 2b | | | 447,221 | | | | 521,791 | | | | 595,317 | |
| | | | | | | | | | | | | | |
TOTAL EQUITY | | | | | 19,206,379 | | | | 19,389,043 | | | | 17,173,998 | |
| | | | | | | | | | | | | | |
TOTAL LIABILITIES AND EQUITY | | | | | 53,798,690 | | | | 55,747,281 | | | | 55,140,009 | |
| | | | | | | | | | | | | | |
The accompanying notes form an integral part of these consolidated financial statements.
F-7
PT INDOSAT Tbk AND ITS SUBSIDIARIES
CONSOLIDATED STATEMENTS OF COMPREHENSIVE INCOME
Years Ended December 31, 2011 (Restated), 2012 (Restated) and 2013
(Expressed in millions of rupiah, except share data)
| | | | | | | | | | | | | | |
| | | Notes | | 2011
(Restated) | | | 2012
(Restated) | | | 2013 | |
| | | | | Rp | | | Rp | | | Rp | |
REVENUES | | 2f5,2f19,24,
31,35 | | | | | | | | | | | | |
Cellular | | | | | 16,587,385 | | | | 18,489,329 | | | | 19,374,638 | |
Multimedia, Data Communication, Internet (“MIDI”) | | 34j,34m | | | 2,694,271 | | | | 2,909,798 | | | | 3,266,465 | |
Fixed telecommunications | | | | | 1,249,982 | | | | 1,021,450 | | | | 1,214,787 | |
| | | | | | | | | | | | | | |
Total Revenues | | | | | 20,531,638 | | | | 22,420,577 | | | | 23,855,890 | |
| | | | | | | | | | | | | | |
EXPENSES | | 2f5.5,35 | | | | | | | | | | | | |
Cost of services | | 25,31,34p,34s | | | 7,547,407 | | | | 8,905,736 | | | | 9,956,533 | |
Depreciation and amortization | | 2f2,2f16,8,9 | | | 6,569,328 | | | | 8,284,012 | | | | 8,969,636 | |
Personnel | | 2d,2f7,26,30,31 | | | 1,829,473 | | | | 1,410,165 | | | | 1,734,443 | |
General and administration | | 27,31,34h | | | 549,530 | | | | 625,540 | | | | 901,534 | |
Marketing | | 31 | | | 855,686 | | | | 920,296 | | | | 893,574 | |
Gain on foreign exchange—net | | | | | (90,919 | ) | | | (44,793 | ) | | | (224,518 | ) |
Gain on tower sale | | 29 | | | — | | | | (1,183,963 | ) | | | (141,050 | ) |
Others—net | | 8,16,35 | | | 29,790 | | | | 306,080 | | | | 273,996 | |
| | | | | | | | | | | | | | |
Net Expenses | | | | | 17,290,295 | | | | 19,223,073 | | | | 22,364,148 | |
| | | | | | | | | | | | | | |
OPERATING PROFIT | | | | | 3,241,343 | | | | 3,197,504 | | | | 1,491,742 | |
| | | | | | | | | | | | | | |
Gain on change in fair value of derivatives—net | | 2f11,2f15,20,35 | | | 57,944 | | | | 4,964 | | | | 273,259 | |
Interest income | | 2f5.2,31,35 | | | 92,646 | | | | 133,544 | | | | 107,193 | |
Loss on foreign exchange—net | | 2f4,5,35 | | | (54,188 | ) | | | (789,438 | ) | | | (3,011,410 | ) |
Financing cost | | 2f19,14,18,19, | | | | | | | | | | | | |
| | 28,31,34o,35 | | | (1,929,354 | ) | | | (2,077,350 | ) | | | (2,212,095 | ) |
| | | | | | | | | | | | | | |
Other Expenses—Net | | | | | (1,832,952 | ) | | | (2,728,280 | ) | | | (4,843,053 | ) |
| | | | | | | | | | | | | | |
PROFIT (LOSS) BEFORE INCOME TAX | | | | | 1,408,391 | | | | 469,224 | | | | (3,351,311 | ) |
| | | | | | | | | | | | | | |
INCOME TAX BENEFIT (EXPENSE) | | 2f6,16,35 | | | | | | | | | | | | |
Current | | | | | (122,842 | ) | | | (234,429 | ) | | | (118,156 | ) |
Deferred | | 2d | | | (168,139 | ) | | | 254,946 | | | | 786,820 | |
| | | | | | | | | | | | | | |
Income Tax Benefit (Expense)—net | | | | | (290,981 | ) | | | 20,517 | | | | 668,664 | |
| | | | | | | | | | | | | | |
PROFIT (LOSS) FOR THE YEAR | | | | | 1,117,410 | | | | 489,741 | | | | (2,682,647 | ) |
| | | | | | | | | | | | | | |
OTHER COMPREHENSIVE INCOME (LOSS) | | | | | | | | | | | | | | |
Other comprehensive income to be reclassified to profit or loss in subsequent periods | | | | | | | | | | | | | | |
Unrealized changes in fair value of available for sale assets | | 12 | | | — | | | | 389,718 | | | | 23,982 | |
Differences in foreign currency translation | | 2b,2f4 | | | 534 | | | | (36 | ) | | | 226 | |
Income tax effect | | | | | (133 | ) | | | (1,238 | ) | | | (1,836 | ) |
The accompanying notes form an integral part of these consolidated financial statements.
F-8
PT INDOSAT Tbk AND ITS SUBSIDIARIES
CONSOLIDATED STATEMENTS OF COMPREHENSIVE INCOME—(Continued)
Years Ended December 31, 2011 (Restated), 2012 (Restated) and 2013
(Expressed in millions of rupiah, except share data)
| | | | | | | | | | | | | | |
| | | Notes | | 2011
(Restated) | | | 2012
(Restated) | | | 2013 | |
| | | | | Rp | | | Rp | | | Rp | |
Other comprehensive income (loss) not to be reclassified to profit or loss in subsequent periods | | | | | | | | | | | | | | |
Remeasurement gains (losses) on defined benefit plans | | | | | (88,882 | ) | | | (327,925 | ) | | | 905,239 | |
Income tax effect | | | | | 22,221 | | | | 81,980 | | | | (226,310 | ) |
| | | | | | | | | | | | | | |
Other Comprehensive income—net of tax | | 2f4, 2f8 | | | (66,260 | ) | | | 142,499 | | | | 701,301 | |
| | | | | | | | | | | | | | |
NET COMPREHENSIVE INCOME (LOSS) | | | | | 1,051,150 | | | | 632,240 | | | | (1,981,346 | ) |
| | | | | | | | | | | | | | |
PROFIT (LOSS) FOR THE YEAR ATTRIBUTABLE TO: | | | | | | | | | | | | | | |
Owners of the Company | | 2d | | | 1,018,215 | | | | 376,540 | | | | (2,798,605 | ) |
Non-controlling Interests | | 2b,2d | | | 99,195 | | | | 113,201 | | | | 115,958 | |
| | | | | | | | | | | | | | |
Net | | | | | 1,117,410 | | | | 489,741 | | | | (2,682,647 | ) |
| | | | | | | | | | | | | | |
OTHER COMPREHENSIVE INCOME (LOSS)—NET OF TAX ATTRIBUTABLE TO: | | | | | | | | | | | | | | |
Owners of the Company | | | | | (65,844 | ) | | | 149,043 | | | | 697,613 | |
Non-controlling Interests | | 2b | | | (416 | ) | | | (6,544 | ) | | | 3,688 | |
| | | | | | | | | | | | | | |
Net | | | | | (66,260 | ) | | | 142,499 | | | | 701,301 | |
| | | | | | | | | | | | | | |
TOTAL COMPREHENSIVE INCOME (LOSS)—NET OF TAX ATTRIBUTABLE TO: | | | | | | | | | | | | | | |
Owners of the Company | | | | | 952,371 | | | | 525,583 | | | | (2,100,992 | ) |
Non-controlling Interests | | 2b | | | 98,779 | | | | 106,657 | | | | 119,646 | |
| | | | | | | | | | | | | | |
Net | | | | | 1,051,150 | | | | 632,240 | | | | (1,981,346 | ) |
| | | | | | | | | | | | | | |
BASIC AND DILUTED EARNINGS (LOSS) PER SHARE ATTRIBUTABLE TO OWNERS OF THE COMPANY | | 2d,2f25,23,32 | | | 187.38 | | | | 69.29 | | | | (515.02 | ) |
| | | | | | | | | | | | | | |
BASIC AND DILUTED EARNINGS (LOSS) PER AMERICAN DEPOSITARY SHARE (ADS)
(50 B SHARES PER ADS) ATTRIBUTABLE TO OWNERS OF THE COMPANY | | 2d,2f25,23,32 | | | 9,369.04 | | | | 3,464.71 | | | | (25,751.19 | ) |
| | | | | | | | | | | | | | |
The accompanying notes form an integral part of these consolidated financial statements.
F-9
PT INDOSAT Tbk AND ITS SUBSIDIARIES
CONSOLIDATED STATEMENTS OF CHANGES IN EQUITY
Years Ended December 31, 2011 (Restated), 2012 (Restated) and 2013
(Expressed in millions of rupiah, except share data)
| | | | | | | | | | | | | | | | | | | | | | | | | | | | | | | | | | | | | | | | | | | | | | |
| | | | | Equity Attributable to the Owners of the Company | | | | | | | |
| | | | | Capital
Stock—Issued
and Fully
Paid | | | Premium on
Capital Stock | | | Retained Earnings | | | Share of
Equity
Changes in
Associated
Companies | | | Difference in
Foreign
Currency
Translation(*) | | | Unrealized
changes in
fair value on
available for
sale assets | | | Remea-
surement
losses on
defined
benefit
plans | | | Total | | | Non-
controlling
Interests | | | Total
Equity | |
Description | | Notes | | | | Appropriated | | | Unappropriated | | | | | | | | |
Balance as of January 1, 2011, as previously reported | | | | | 543,393 | | | | 1,546,587 | | | | 134,446 | | | | 15,679,724 | | | | 404,104 | | | | (2,727 | ) | | | — | | | | — | | | | 18,305,527 | | | | 384,074 | | | | 18,689,601 | |
| | | | | | | | | | | | | | | | | | | | | | | | | | | | | | | | | | | | | | | | | | | | | | |
Restatement | | 2d | | | — | | | | — | | | | — | | | | (27,490 | ) | | | — | | | | — | | | | — | | | | (147,659 | ) | | | (175,149 | ) | | | (5,805 | ) | | | (180,954 | ) |
| | | | | | | | | | | | | | | | | | | | | | | | | | | | | | | | | | | | | | | | | | | | | | |
Balance as of January 1, 2011, after restatement | | | | | 543,393 | | | | 1,546,587 | | | | 134,446 | | | | 15,652,234 | | | | 404,104 | | | | (2,727 | ) | | | — | | | | (147,659 | ) | | | 18,130,378 | | | | 378,269 | | | | 18,508,647 | |
| | | | | | | | | | | | | | | | | | | | | | | | | | | | | | | | | | | | | | | | | | | | | | |
Profit for the year | | | | | — | | | | — | | | | — | | | | 1,018,215 | | | | — | | | | — | | | | — | | | | — | | | | 1,018,215 | | | | 99,195 | | | | 1,117,410 | |
Other comprehensive income (loss) | | | | | — | | | | — | | | | — | | | | — | | | | — | | | | 401 | | | | — | | | | (66,245 | ) | | | (65,844 | ) | | | (416 | ) | | | (66,260 | ) |
| | | | | | | | | | | | | | | | | | | | | | | | | | | | | | | | | | | | | | | | | | | | | | |
Net comprehensive income (loss) | | | | | — | | | | — | | | | — | | | | 1,018,215 | | | | — | | | | 401 | | | | — | | | | (66,245 | ) | | | 952,371 | | | | 98,779 | | | | 1,051,150 | |
Resolution during the Annual Stockholders’ General Meeting on June 24, 2011 | | | | | | | | | | | | | | | | | | | | | | | | | | | | | | | | | | | | | | | | | | | | | | |
Declaration of cash dividend | | 33 | | | — | | | | — | | | | — | | | | (323,591 | ) | | | — | | | | — | | | | — | | | | — | | | | (323,591 | ) | | | — | | | | (323,591 | ) |
Dividends paid to non-controlling interests | | | | | — | | | | — | | | | — | | | | — | | | | — | | | | — | | | | — | | | | — | | | | — | | | | (29,827 | ) | | | (29,827 | ) |
| | | | | | | | | | | | | | | | | | | | | | | | | | | | | | | | | | | | | | | | | | | | | | |
Balance as of December 31, 2011 | | | | | 543,393 | | | | 1,546,587 | | | | 134,446 | | | | 16,346,858 | | | | 404,104 | | | | (2,326 | ) | | | — | | | | (213,904 | ) | | | 18,759,158 | | | | 447,221 | | | | 19,206,379 | |
| | | | | | | | | | | | | | | | | | | | | | | | | | | | | | | | | | | | | | | | | | | | | | |
| * | This reserve arose from the translation of the financial statements of Indosat Finance B.V. and Indosat International Finance Company B.V. from euro, and Indosat Palapa Company B.V. and Indosat Singapore Pte. Ltd. from U.S. dollar to rupiah, net of applicable taxes. |
The accompanying notes form an integral part of these consolidated financial statements.
F-10
PT INDOSAT Tbk AND ITS SUBSIDIARIES
CONSOLIDATED STATEMENTS OF CHANGES IN EQUITY—(Continued)
Years Ended December 31, 2011 (Restated), 2012 (Restated) and 2013
(Expressed in millions of rupiah, except share data)
| | | | | | | | | | | | | | | | | | | | | | | | | | | | | | | | | | | | | | | | | | | | | | | | |
| | | | | | Equity Attributable to the Owners of the Company | | | | | | | |
| | | Notes | | | Capital
Stock—Issued
and Fully
Paid | | | Premium on
Capital Stock | | | Retained Earnings | | | Share of
Equity
Changes in
Associated
Companies | | | Difference in
Foreign
Currency
Translation(*) | | | Unrealized
changes in
fair value of
available for
sale assets | | | Remea-
surement
losses on
defined
benefit
plans | | | Total | | | Non-
controlling
Interests | | | Total
Equity | |
Description | | | | | Appropriated | | | Unappropriated | | | | | | | | |
Balance as of January 1, 2012, as previously reported | | | | | | | 543,393 | | | | 1,546,587 | | | | 134,446 | | | | 16,314,201 | | | | 404,104 | | | | (2,326 | ) | | | — | | | | — | | | | 18,940,405 | | | | 452,092 | | | | 19,392,497 | |
| | | | | | | | | | | | | | | | | | | | | | | | | | | | | | | | | | | | | | | | | | | | | | | | |
Restatement | | | 2d | | | | — | | | | — | | | | — | | | | 32,657 | | | | — | | | | — | | | | — | | | | (213,904 | ) | | | (181,247 | ) | | | (4,871 | ) | | | (186,118 | ) |
| | | | | | | | | | | | | | | | | | | | | | | | | | | | | | | | | | | | | | | | | | | | | | | | |
Balance as of January 1, 2012, after restatement | | | | | | | 543,393 | | | | 1,546,587 | | | | 134,446 | | | | 16,346,858 | | | | 404,104 | | | | (2,326 | ) | | | — | | | | (213,904 | ) | | | 18,759,158 | | | | 447,221 | | | | 19,206,379 | |
| | | | | | | | | | | | | | | | | | | | | | | | | | | | | | | | | | | | | | | | | | | | | | | | |
Profit for the year | | | | | | | — | | | | — | | | | — | | | | 376,540 | | | | — | | | | — | | | | — | | | | — | | | | 376,540 | | | | 113,201 | | | | 489,741 | |
Other comprehensive income (loss) | | | | | | | — | | | | — | | | | — | | | | — | | | | — | | | | (1,274 | ) | | | 389,718 | | | | (239,401 | ) | | | 149,043 | | | | (6,544 | ) | | | 142,499 | |
| | | | | | | | | | | | | | | | | | | | | | | | | | | | | | | | | | | | | | | | | | | | | | | | |
Net comprehensive income (loss) | | | | | | | — | | | | — | | | | — | | | | 376,540 | | | | — | | | | (1,274 | ) | | | 389,718 | | | | (239,401 | ) | | | 525,583 | | | | 106,657 | | | | 632,240 | |
Resolution during the Annual Stockholders’ General Meeting on May 14, 2012 | | | | | | | | | | | | | | | | | | | | | | | | | | | | | | | | | | | | | | | | | | | | | | | | |
Declaration of cash dividend | | | 33 | | | | — | | | | — | | | | — | | | | (417,489 | ) | | | — | | | | — | | | | — | | | | — | | | | (417,489 | ) | | | — | | | | (417,489 | ) |
Dividends paid to non-controlling interests | | | | | | | — | | | | — | | | | — | | | | — | | | | — | | | | — | | | | — | | | | — | | | | — | | | | (32,087 | ) | | | (32,087 | ) |
| | | | | | | | | | | | | | | | | | | | | | | | | | | | | | | | | | | | | | | | | | | | | | | | |
Balance as of December 31, 2012 | | | | | | | 543,393 | | | | 1,546,587 | | | | 134,446 | | | | 16,305,909 | | | | 404,104 | | | | (3,600 | ) | | | 389,718 | | | | (453,305 | ) | | | 18,867,252 | | | | 521,791 | | | | 19,389,043 | |
| | | | | | | | | | | | | | | | | | | | | | | | | | | | | | | | | | | | | | | | | | | | | | | | |
| * | This reserve arose from the translation of the financial statements of Indosat Finance B.V. and Indosat International Finance Company B.V. from euro, and Indosat Palapa Company B.V. and Indosat Singapore Pte. Ltd. from U.S. dollar to rupiah, net of applicable taxes. |
The accompanying notes form an integral part of these consolidated financial statements.
F-11
PT INDOSAT Tbk AND ITS SUBSIDIARIES
CONSOLIDATED STATEMENTS OF CHANGES IN EQUITY—(Continued)
Years Ended December 31, 2011 (Restated), 2012 (Restated) and 2013
(Expressed in millions of rupiah, except share data)
| | | | | | | | | | | | | | | | | | | | | | | | | | | | | | | | | | | | | | | | | | | | | | | | |
| | | | | | Equity Attributable to the Owners of the Company | | | | | | | |
| | | Notes | | | Capital
Stock—
Issued and
Fully Paid | | | Premium on
Capital Stock
| | | Retained Earnings | | | Share of
Equity
Changes in
Associated
Companies | | | Difference in
Foreign
Currency
Translation(*) | | | Unrealized
changes in
fair value of
available
for sale
assets | | | Remea-
surement
gains
(losses) on
defined
benefit
plans | | | Total | | | Non-
controlling
Interests | | | Total
Equity | |
Description | | | | | Appropriated | | | Unappropriated | | | | | | | | |
Balance as of January 1, 2013, as previously reported | | | | | | | 543,393 | | | | 1,546,587 | | | | 134,446 | | | | 16,262,361 | | | | 404,104 | | | | (3,600 | ) | | | 389,718 | | | | — | | | | 19,277,009 | | | | 532,069 | | | | 19,809,078 | |
| | | | | | | | | | | | | | | | | | | | | | | | | | | | | | | | | | | | | | | | | | | | | | | | |
Restatement | | | 2d | | | | — | | | | — | | | | — | | | | 43,548 | | | | — | | | | — | | | | — | | | | (453,305 | ) | | | (409,757 | ) | | | (10,278 | ) | | | (420,035 | ) |
| | | | | | | | | | | | | | | | | | | | | | | | | | | | | | | | | | | | | | | | | | | | | | | | |
Balance as of January 1, 2013, after restatement | | | | | | | 543,393 | | | | 1,546,587 | | | | 134,446 | | | | 16,305,909 | | | | 404,104 | | | | (3,600 | ) | | | 389,718 | | | | (453,305 | ) | | | 18,867,252 | | | | 521,791 | | | | 19,389,043 | |
| | | | | | | | | | | | | | | | | | | | | | | | | | | | | | | | | | | | | | | | | | | | | | | | |
Profit (loss) for the year | | | | | | | — | | | | — | | | | — | | | | (2,798,605 | ) | | | — | | | | — | | | | — | | | | — | | | | (2,798,605 | ) | | | 115,958 | | | | (2,682,647 | ) |
Other comprehensive income (loss) | | | | | | | — | | | | — | | | | — | | | | — | | | | — | | | | (1,610 | ) | | | 23,982 | | | | 675,241 | | | | 697,613 | | | | 3,688 | | | | 701,301 | |
| | | | | | | | | | | | | | | | | | | | | | | | | | | | | | | | | | | | | | | | | | | | | | | | |
Net comprehensive income (loss) | | | | | | | — | | | | — | | | | — | | | | (2,798,605 | ) | | | — | | | | (1,610 | ) | | | 23,982 | | | | 675,241 | | | | (2,100,992 | ) | | | 119,646 | | | | (1,981,346 | ) |
Resolution during the Annual Stockholders’ General Meeting on June 18, 2013 | | | | | | | | | | | | | | | | | | | | | | | | | | | | | | | | | | | | | | | | | | | | | | | | |
Declaration of cash dividend | | | 33 | | | | — | | | | — | | | | — | | | | (187,579 | ) | | | — | | | | — | | | | — | | | | — | | | | (187,579 | ) | | | — | | | | (187,579 | ) |
Dividends paid to non-controlling interests | | | | | | | — | | | | — | | | | — | | | | — | | | | — | | | | — | | | | — | | | | — | | | | — | | | | (46,120 | ) | | | (46,120 | ) |
| | | | | | | | | | | | | | | | | | | | | | | | | | | | | | | | | | | | | | | | | | | | | | | | |
Balance as of December 31, 2013 | | | | | | | 543,393 | | | | 1,546,587 | | | | 134,446 | | | | 13,319,725 | | | | 404,104 | | | | (5,210 | ) | | | 413,700 | | | | 221,936 | | | | 16,578,681 | | | | 595,317 | | | | 17,173,998 | |
| | | | | | | | | | | | | | | | | | | | | | | | | | | | | | | | | | | | | | | | | | | | | | | | |
| * | This reserve arose from the translation of the financial statements of Indosat Palapa Company B.V. and Indosat Singapore Pte. Ltd. from U.S. dollar to rupiah, net of applicable taxes. |
The accompanying notes form an integral part of these consolidated financial statements.
F-12
PT INDOSAT Tbk AND ITS SUBSIDIARIES
CONSOLIDATED STATEMENTS OF CASH FLOWS
Years Ended December 31, 2011, 2012 and 2013
(Expressed in millions of rupiah)
| | | | | | | | | | | | | | |
| | | Notes | | 2011 | | | 2012 | | | 2013 | |
| | | | | Rp | | | Rp | | | Rp | |
CASH FLOWS FROM OPERATING | | | | | | | | | | | | | | |
ACTIVITIES | | | | | | | | | | | | | | |
Cash received from: | | | | | | | | | | | | | | |
Customers | | | | | 20,620,790 | | | | 21,960,377 | | | | 23,288,619 | |
Refund of taxes | | 7,13 | | | 141,271 | | | | 179,478 | | | | 352,444 | |
Settlement from currency forward contracts | | 20aa-fp | | | 55,371 | | | | 116,147 | | | | 134,477 | |
Interest income | | | | | 81,336 | | | | 131,804 | | | | 109,626 | |
Settlement from derivative contracts | | 20d-i | | | 20,626 | | | | 34,410 | | | | 26,149 | |
| | | | |
Cash paid to/for: | | | | | | | | | | | | | | |
Authorities, other operators, suppliers and others | | | | | (9,102,182 | ) | | | (11,607,302 | ) | | | (11,563,977 | ) |
Financing cost | | | | | (1,739,810 | ) | | | (2,026,450 | ) | | | (2,145,722 | ) |
Employees | | | | | (2,003,642 | ) | | | (1,252,470 | ) | | | (1,443,524 | ) |
Income taxes | | | | | (563,320 | ) | | | (424,538 | ) | | | (311,134 | ) |
Settlement from interest swap contracts | | 20o-z | | | — | | | | — | | | | (32,000 | ) |
Interest rate swap contracts | | 20m-n | | | (119,521 | ) | | | (82,306 | ) | | | (17,853 | ) |
Swap cost from cross currency swap contracts | | 20a-l | | | (70,838 | ) | | | (39,697 | ) | | | (3,926 | ) |
| | | | | | | | | | | | | | |
Net Cash Provided by Operating Activities | | | | | 7,320,081 | | | | 6,989,453 | | | | 8,393,179 | |
| | | | | | | | | | | | | | |
CASH FLOWS FROM INVESTING ACTIVITIES | | | | | | | | | | | | | | |
Proceeds from sale of property and equipment | | 8, 29 | | | 6,708 | | | | 3,100,109 | | | | 208,024 | |
Cash dividend received from other long-term investment | | 12 | | | 13,790 | | | | — | | | | 53,141 | |
Acquisitions of property and equipment | | 8 | | | (6,047,958 | ) | | | (5,765,942 | ) | | | (9,322,410 | ) |
Acquisition of intangible assets | | 9 | | | (10,452 | ) | | | (23,073 | ) | | | (6,732 | ) |
| | | | | | | | | | | | | | |
Net Cash Used in Investing Activities | | | | | (6,037,912 | ) | | | (2,688,906 | ) | | | (9,067,977 | ) |
| | | | | | | | | | | | | | |
CASH FLOWS FROM FINANCING ACTIVITIES | | | | | | | | | | | | | | |
Proceeds from long-term loans | | 18 | | | 2,322,900 | | | | 1,700,000 | | | | 2,950,000 | |
Proceeds from short-term loan | | 14 | | | 1,500,000 | | | | 700,000 | | | | 1,300,000 | |
Decrease in restricted cash and cash equivalents | | | | | — | | | | — | | | | 15,801 | |
Repayment of long-term loans | | 18 | | | (3,505,063 | ) | | | (5,455,925 | ) | | | (3,366,200 | ) |
Repayment of bonds payable | | 19 | | | (1,100,000 | ) | | | (241,989 | ) | | | (1,330,000 | ) |
Cash dividend paid by the Company | | 33 | | | (323,591 | ) | | | (417,489 | ) | | | (187,579 | ) |
Repayment of short-term loan | | 14 | | | — | | | | (1,900,000 | ) | | | (100,000 | ) |
Cash dividend paid by subsidiaries to non-controlling interest | | | | | (29,692 | ) | | | (32,085 | ) | | | (31,945 | ) |
Proceeds from bonds payable | | 19 | | | — | | | | 3,000,000 | | | | — | |
| | | | | | | | | | | | | | |
Net Cash Used in Financing Activities | | | | | (1,135,446 | ) | | | (2,647,488 | ) | | | (749,923 | ) |
| | | | | | | | | | | | | | |
The accompanying notes form an integral part of these consolidated financial statements.
F-13
PT INDOSAT Tbk AND ITS SUBSIDIARIES
CONSOLIDATED STATEMENTS OF CASH FLOWS—(Continued)
Years Ended December 31, 2011, 2012 and 2013
(Expressed in millions of rupiah)
| | | | | | | | | | | | | | | | |
| | | Notes | | | 2011 | | | 2012 | | | 2013 | |
| | | | | | Rp | | | Rp | | | Rp | |
Net Foreign Exchange Differences from Cash and Cash Equivalents | | | | | | | 2,213 | | | | 39,971 | | | | (221,260 | ) |
| | | | | | | | | | | | | | | | |
NET INCREASE (DECREASE) IN CASH AND CASH EQUIVALENTS | | | | | | | 148,936 | | | | 1,693,030 | | | | (1,645,981 | ) |
CASH AND CASH EQUIVALENTS OF LIQUIDATED SUBSIDIARIES | | | 1b | | | | — | | | | — | | | | (37,723 | ) |
CASH AND CASH EQUIVALENTS AT BEGINNING OF YEAR | | | | | | | 2,075,270 | | | | 2,224,206 | | | | 3,917,236 | |
| | | | | | | | | | | | | | | | |
CASH AND CASH EQUIVALENTS AT END OF YEAR | | | 4 | | | | 2,224,206 | | | | 3,917,236 | | | | 2,233,532 | |
| | | | | | | | | | | | | | | | |
DETAILS OF CASH AND CASH EQUIVALENTS: | | | | | | | | | | | | | | | | |
Time deposits with original maturities of three months or less and deposits on call | | | | | | | 1,919,227 | | | | 3,493,467 | | | | 1,869,203 | |
Cash on hand and in banks | | | | | | | 304,979 | | | | 423,769 | | | | 364,329 | |
| | | | | | | | | | | | | | | | |
Cash and cash equivalents as stated in the consolidated statements of financial position | | | | | | | 2,224,206 | | | | 3,917,236 | | | | 2,233,532 | |
| | | | | | | | | | | | | | | | |
The accompanying notes form an integral part of these consolidated financial statements.
F-14
PT INDOSAT Tbk AND ITS SUBSIDIARIES
NOTES TO CONSOLIDATED FINANCIAL STATEMENTS
as of January 1, 2012 (Restated), December 31, 2012 (Restated) and December 31, 2013
and for the Years ended December 31, 2011 (Restated), 2012 (Restated) and 2013
(Expressed in millions of rupiah and thousands of U.S. dollar, except share and tariff data)
1. GENERAL
a. Company’s Establishment
PT Indosat Tbk (“the Company”) was established in the Republic of Indonesia on November 10, 1967 within the framework of the Indonesian Foreign Investment Law No. 1 of 1967 based on the notarial deed No. 55 of Mohamad Said Tadjoedin, S.H. The deed of establishment was published in Supplement No. 24 of State Gazette No. 26 dated March 29, 1968 of the Republic of Indonesia. In 1980, the Company was sold by American Cable and Radio Corporation, an International Telephone & Telegraph subsidiary, to the Government of the Republic of Indonesia (“the Government”) and became a State-owned Company (Persero).
On February 7, 2003, the Company received the approval from the Capital Investment Coordinating Board (“BKPM”) in its letter No. 14/V/PMA/2003 for the change of its legal status from a State-owned Company (Persero) to a Foreign Capital Investment Company. Subsequently, on March 21, 2003, the Company received the approval from the Ministry of Justice and Human Rights of the Republic of Indonesia on the amendment of its Articles of Association to reflect the change of its legal status.
The Company’s Articles of Association has been amended from time to time. The latest amendment was covered by notarial deed No. 123 dated January 28, 2010 of Aulia Taufani, S.H., (as a substitute notary of Sutjipto, S.H.) as approved in the Stockholders’ Extraordinary General Meeting held on January 28, 2010, in order to comply with the Indonesian Capital Market and Financial Institutions Supervisory Agency (“BAPEPAM-LK”) Rule No. IX.J.1 dated May 14, 2008 on the Principles of Articles of Association of Limited Liability Companies that Conduct Public Offering of Equity Securities and Public Companies and Rule No. IX.E.1 on Affiliate Transactions and Certain Conflict of Interests Transactions. The latest amendment of the Company’s Articles of Association has been reported to, and approved by, the Ministry of Law and Human Rights of the Republic of Indonesia based on its letters No. AHU-09555.AH.01.02 Year 2010 dated February 22, 2010 and No. AHU-AH.01.10-04964 dated February 25, 2010. The latest amendment relates to, among other matters, the changes in the Company’s purposes, objectives and business activities, appointment of acting President Director if the incumbent President Director is unavailable, requirement of Board of Directors’ meetings and definition of conflict of interests.
The address of the Company’s registered office is at Jl. Medan Merdeka Barat 21, Jakarta and it has 3 regional offices located in Jakarta, Medan and Balikpapan.
According to article 3 of its Articles of Association, the Company’s purposes and objectives are to provide telecommunications networks, telecommunications services as well as information technology and/or convergence technology services by carrying out the following main business activities:
| | a. | To provide telecommunications networks, telecommunications services as well as information technology and/or convergence technology services, including but not limited to providing basic telephony services, multimedia services, internet telephony services, network access point services, internet services, mobile telecommunications networks and fixed telecommunications networks; and |
| | b. | To engage in payment transactions and money transfer services through telecommunications networks as well as information technology and/or convergence technology. |
F-15
PT INDOSAT Tbk AND ITS SUBSIDIARIES
NOTES TO CONSOLIDATED FINANCIAL STATEMENTS—(Continued)
as of January 1, 2012 (Restated), December 31, 2012 (Restated) and December 31, 2013
and for the Years ended December 31, 2011 (Restated), 2012 (Restated) and 2013
(Expressed in millions of rupiah and thousands of U.S. dollar, except share and tariff data)
The Company can provide supporting business activities in order to achieve the purposes and objectives, and to support its main businesses, as follows:
| | a. | To plan, to procure, to modify, to build, to provide, to develop, to operate, to lease, to rent, and to maintain infrastructures/facilities including resources to support the Company’s business in providing telecommunications networks, telecommunications services as well as information technology and/or convergence technology services; |
| | b. | To conduct business and operating activities (including development, marketing and sales of telecommunications networks, telecommunications services as well as information technology and/or convergence technology services by the Company), including research, customer services, education and courses (both domestic and overseas); and |
| | c. | To conduct other activities necessary to support and/or related to the provision of telecommunications networks, telecommunications services as well as information technology and/or convergence technology services including but not limited to electronic transactions and provision of hardware, software, content as well as telecommunications-managed services. |
The consolidated financial statements of the Company and its subsidiaries (collectively referred to hereafter as “the Group”) as of January 1, 2012 (Restated), December 31, 2012 (Restated) and 2013 and for the year ended December 31, 2011 (Restated), 2012 (Restated) and 2013 were approved and authorized for issue by the Board of Directors on April 29, 2014, as reviewed and recommended for approval by the Audit Committee.
The consolidated statement of financial position as of January 1, 2012 is consistent with the December 31, 2011 consolidated statement of financial position, except for the impact of the retrospective restatement as a result of the adoption of International Accounting Standard 19Employee Benefits (Revised 2011) effective January 1, 2013, as discussed in Note 2d.
F-16
PT INDOSAT Tbk AND ITS SUBSIDIARIES
NOTES TO CONSOLIDATED FINANCIAL STATEMENTS—(Continued)
as of January 1, 2012 (Restated), December 31, 2012 (Restated) and December 31, 2013
and for the Years ended December 31, 2011 (Restated), 2012 (Restated) and 2013
(Expressed in millions of rupiah and thousands of U.S. dollar, except share and tariff data)
b. Structure of the Company’s Subsidiaries
As of January 1, 2012 and December 31, 2012 and 2013, the Company has direct and indirect ownership in the following subsidiaries:
| | | | | | | | | | | | | | | | | | | | |
Name of Subsidiary | | Location | | Principal Activity | | Start of
Commercial
Operations | | | Percentage of Ownership (%) | |
| | | | | January 1,
2012 | | | December 31,
2012 | | | December 31,
2013 | |
Indosat Palapa Company B.V. (“IPBV”)(1) | | Amsterdam | | Finance | | | 2010 | | | | 100.00 | | | | 100.00 | | | | 100.00 | |
Indosat Mentari Company B.V. (“IMBV”)(1) | | Amsterdam | | Finance | | | 2010 | | | | 100.00 | | | | 100.00 | | | | 100.00 | |
Indosat Finance Company B.V. (“IFB”)(4) | | Amsterdam | | Finance | | | 2003 | | | | 100.00 | | | | 100.00 | | | | — | |
Indosat International Finance Company B.V. (“IIFB”)(4) | | Amsterdam | | Finance | | | 2005 | | | | 100.00 | | | | 100.00 | | | | — | |
Indosat Singapore Pte. Ltd. (“ISPL”) | | Singapore | | Telecommunication | | | 2005 | | | | 100.00 | | | | 100.00 | | | | 100.00 | |
PT Indosat Mega Media (“IMM”) | | Jakarta | | Multimedia | | | 2001 | | | | 99.85 | | | | 99.85 | | | | 99.85 | |
PT Interactive Vision Media (“IVM”)(3) | | Jakarta | | Pay TV | | | — | | | | 99.83 | | | | 99.83 | | | | 99.83 | |
PT Starone Mitra Telekomunikasi (“SMT”) (5) | | Semarang | | Telecommunication | | | 2006 | | | | 72.54 | | | | 72.54 | | | | 84.08 | |
PT Aplikanusa Lintasarta (“Lintasarta”) | | Jakarta | | Data Communication | | | 1989 | | | | 72.36 | | | | 72.36 | | | | 72.36 | |
PT Lintas Media Danawa (“LMD”) (3) | | Jakarta | | Information and Communication Services | | | 2008 | | | | 50.65 | | | | 50.65 | | | | 50.65 | |
PT Artajasa Pembayaran Elektronis (“APE”) (3) (Note 2b) | | Jakarta | | Telecommunication | | | 2000 | | | | 39.80 | | | | 39.80 | | | | 39.80 | |
| | | | | | | | | | | | |
| | | Total Assets
(Before Eliminations) | |
Name of Subsidiary | | January 1,
2012 | | | December 31,
2012 | | | December 31,
2013 | |
IPBV(1) | | | 6,015,894 | | | | 6,442,367 | | | | 8,128,654 | |
IMBV(1) | | | 6,010,359 | | | | 6,436,524 | | | | 8,120,891 | |
IFB(4) | | | 20,923 | | | | 21,963 | | | | — | |
IIFB(4) | | | 8,688 | | | | 8,853 | | | | — | |
ISPL | | | 78,264 | | | | 99,519 | | | | 116,223 | |
IMM | | | 740,431 | | | | 807,162 | | | | 845,195 | |
IVM(2) | | | 5,198 | | | | 5,448 | | | | 5,681 | |
SMT(5) | | | 209,541 | | | | 250,726 | | | | 236,631 | |
Lintasarta | | | 1,853,437 | | | | 2,019,743 | | | | 2,188,384 | |
LMD (3) | | | 5,199 | | | | 3,760 | | | | 7,332 | |
APE(3) | | | 258,745 | | | | 372,556 | | | | 435,088 | |
| | (1) | IPBV and IMBV were incorporated in Amsterdam on April 28, 2010 to engage in treasury activities, to lend and borrow money, whether in the form of securities or otherwise, to finance enterprises and companies, and to grant security in respect of their respective obligations or those of their group companies and third parties. |
F-17
PT INDOSAT Tbk AND ITS SUBSIDIARIES
NOTES TO CONSOLIDATED FINANCIAL STATEMENTS—(Continued)
as of January 1, 2012 (Restated), December 31, 2012 (Restated) and December 31, 2013
and for the Years ended December 31, 2011 (Restated), 2012 (Restated) and 2013
(Expressed in millions of rupiah and thousands of U.S. dollar, except share and tariff data)
| | (2) | IVM, a subsidiary of IMM, was established on April 21, 2009 to engage in Pay TV services. IMM made capital injections to IVM on March 9 and 30, 2011 totaling Rp4,999. On July 12, 2011, IVM obtained the license to conduct its Pay TV services. However, as of December 31, 2013, IVM has not started its commercial operations. |
| | (3) | Lintasarta has direct 55% and 70% ownership in APE and LMD, respectively. |
| | (4) | On July 4, 2013, the Company as the sole shareholder of IFB and IIFB resolved to voluntarily dissolve and put those two entities into voluntary liquidation, by virtue of an Extraordinary General Meeting of Shareholders (EGMS). In connection with such liquidation, IFB and IIFB have appointed IMBV as the liquidator and custodian of the books and records. A liquidation agreement has also been executed by the Company, IFB, IIFB and IMBV concerning the liquidation. On October 21, 2013, the Company received the return of capital from IFB amounting to US$275.0 and EUR1,481.9 and from IIFB amounting to EUR673.9 due to their liquidation. The deregistration with the Dutch Chamber of Commerce was completed as of November 4, 2013. |
| | (5) | On July 11, 2013, the Company made additional capital injection to SMT amounting to Rp16,549, resulting in the increase of the Company’s ownership in SMT from 72.54% to 84.08%. |
c. Merger of the Company, Satelindo, Bimagraha and IM3
Based on Merger Deed No. 57 dated November 20, 2003 (“merger date”) of Poerbaningsih Adi Warsito, S.H., the Company, PT Satelit Palapa Indonesia (“Satelindo”), PT Bimagraha Telekomindo (“Bimagraha”) and PT Indosat Multi Media Mobile (“IM3”) agreed to merge, with the Company as the surviving entity. All assets and liabilities owned by Satelindo, Bimagraha and IM3 were transferred to the Company on the merger date. These three companies were dissolved by operation of law without the need to undergo the regular liquidation process.
The names “Satelindo” and “IM3” in the following notes refer to these entities before they were merged with the Company, or as the entities that entered into contractual agreements that were taken over by the Company as a result of the merger.
2. SUMMARY OF SIGNIFICANT ACCOUNTING POLICIES
The significant accounting policies applied consistently in the preparation of the consolidated financial statements are as follows:
a. Basis of Consolidated Financial Statements
The consolidated financial statements have been prepared using the historical cost basis of accounting, except for derivative financial instruments and available for sale financial assets which are stated at fair value.
The consolidated statements of cash flows classify cash receipts and payments into operating, investing and financing activities. The cash flows from operating activities are presented using the direct method.
The consolidated financial statements are presented in Indonesian rupiah, which is the Company’s functional and presentation currency.
b. Principles of Consolidation
The consolidated financial statements include the Company’s accounts and those of its subsidiaries (Note 1b).
In accordance with International Financial Reporting Standards (“IFRS”) 10, the Company prepares and presents the consolidated financial statements for a group of entities under its control.
F-18
PT INDOSAT Tbk AND ITS SUBSIDIARIES
NOTES TO CONSOLIDATED FINANCIAL STATEMENTS—(Continued)
as of January 1, 2012 (Restated), December 31, 2012 (Restated) and December 31, 2013
and for the Years ended December 31, 2011 (Restated), 2012 (Restated) and 2013
(Expressed in millions of rupiah and thousands of U.S. dollar, except share and tariff data)
Control is achieved when the parent is exposed, or has rights, to variable returns from its involvement with the investee and has the ability to affect those returns through its power over the investee. Specifically, the parent controls an investee if and only if the parent has:
| | • | | Power over the investee (i.e. existing rights that give it the current ability to direct the relevant activities of the investee) |
| | • | | Exposure, or rights, to variable returns from its involvement with the investee, and |
| | • | | The ability to use its power over the investee to affect its returns |
When the parent has less than a majority of the voting or similar rights of an investee, the parent considers all relevant facts and circumstances in assessing whether it has power over an investee, including:
| | • | | The contractual arrangement with the other vote holders of the investee |
| | • | | Rights arising from other contractual arrangements |
| | • | | The parent’s voting rights and potential voting rights |
The parent re-assesses whether or not it controls an investee if facts and circumstances indicate that there are changes to one or more of the three elements of control. Consolidation of a subsidiary begins when the parent obtains control over the subsidiary and ceases when the parent loses control of the subsidiary. Assets, liabilities, income and expenses of a subsidiary acquired or disposed of during the year are included in the statement of comprehensive income from the date the parent gains control until the date the parent ceases to control the subsidiary.
The financial statements of the subsidiaries are prepared for the same reporting period as the Company, using consistent accounting policies. All intra-group balances, transactions, unrealized gains and losses resulting from intra-group transactions and dividends are eliminated in full.
Total comprehensive income within a subsidiary is attributed to the non-controlling interest even if that results in a deficit balance.
A change in the ownership interest of a subsidiary, without a loss of control, is accounted for as an equity transaction. If the Group loses control over a subsidiary, it:
| | • | | Derecognizes the assets (including goodwill) and liabilities of the subsidiary |
| | • | | Derecognizes the carrying amount of any non-controlling interest |
| | • | | Derecognizes the cumulative translation differences recorded in equity |
| | • | | Recognizes the fair value of the consideration received |
| | • | | Recognizes the fair value of any investment retained |
| | • | | Recognizes any surplus or deficit in profit or loss |
| | • | | Reclassifies the parent’s share of components previously recognized in other comprehensive income to profit or loss or retained earnings, as appropriate. |
The consolidated financial statements also include the accounts of APE (Lintasarta’s subsidiary). The accounts of APE in 2011, 2012 and 2013 were consolidated because its financial and operating policies were controlled by Lintasarta.
F-19
PT INDOSAT Tbk AND ITS SUBSIDIARIES
NOTES TO CONSOLIDATED FINANCIAL STATEMENTS—(Continued)
as of January 1, 2012 (Restated), December 31, 2012 (Restated) and December 31, 2013
and for the Years ended December 31, 2011 (Restated), 2012 (Restated) and 2013
(Expressed in millions of rupiah and thousands of U.S. dollar, except share and tariff data)
The accounts of IPBV, IMBV, ISPL, IFB and IIFB (the latter two liquidated in July 2013), were translated into rupiah amounts at the middle rates of exchange prevailing at statement of financial position date for accounts and the average rates during the year for profit or loss accounts. The resulting differences arising from the translations of the financial statements of IPBV, IMBV, ISPL, IFB and IIFB are presented as part of Other Comprehensive Income in the consolidated statements of comprehensive income.
Non-controlling interests in subsidiaries represent the minority stockholders’ proportionate share in the equity (including net income) of the subsidiaries which are not wholly-owned.
c. Statement of Compliance
The consolidated financial statements of the Group have been prepared in accordance with IFRS as issued by the International Accounting Standards Board (“IASB”).
d. Restatement
Effective January 1, 2013, the Group has retrospectively adopted International Accounting Standard 19 (Revised 2011), Employee Benefits (“IAS 19”). The revised standard (i) eliminates the “corridor approach” permitted under the previous version of IAS 19 and (ii) provides for significant changes in the recognition, presentation and disclosure of post-employment benefits, which among others are as follows:
| | • | | Actuarial gains and losses are now required to be recognized in other comprehensive income (OCI) and excluded permanently from profit and loss. |
| | • | | Expected return on plan assets will no longer be recognized in profit or loss. Expected returns are replaced by recognizing interest income (or expense) on the net defined benefit asset (or liability) in profit or loss, which is calculated using the discount rate used to measure the pension obligation. |
| | • | | Unvested past service costs can no longer be deferred and recognized over the future vesting period. Instead, all past service costs will be recognized at the earlier of when the amendment / curtailment occurs or when the Group recognizes related restructuring or termination costs. |
Such changes are made in order that the net pension assets or liabilities are recognized in the consolidated statements of financial position to reflect the full value of the plan deficit or surplus.
F-20
PT INDOSAT Tbk AND ITS SUBSIDIARIES
NOTES TO CONSOLIDATED FINANCIAL STATEMENTS—(Continued)
as of January 1, 2012 (Restated), December 31, 2012 (Restated) and December 31, 2013
and for the Years ended December 31, 2011 (Restated), 2012 (Restated) and 2013
(Expressed in millions of rupiah and thousands of U.S. dollar, except share and tariff data)
The impact of the restatement is as follows:
As of January 1, 2012 / December 31, 2011:
| | | | | | | | | | | | |
| | | January 1, 2012/
December 31, 2011
(Previously Reported) | | | Adjustments | | | January 1, 2012/
December 31, 2011
(Restated) | |
ASSETS | | | | | | | | | | | | |
Non-current Assets | | | | | | | | | | | | |
Deferred tax asset—net | | | 113,812 | | | | 6,787 | | | | 120,599 | |
Long-term prepaid pension—net of current portion | | | 103,181 | | | | (29,464 | ) | | | 73,717 | |
Long-term receivables | | | 20,677 | | | | (8,002 | ) | | | 12,675 | |
LIABILITIES | | | | | | | | | | | | |
Non-current Liabilities | | | | | | | | | | | | |
Deferred tax liabilities—net | | | 2,126,930 | | | | (55,747 | ) | | | 2,071,183 | |
Employee benefit obligations—net of current portion | | | 787,313 | | | | 211,186 | | | | 998,499 | |
EQUITY | | | | | | | | | | | | |
Retained earnings | | | | | | | | | | | | |
Unappropriated | | | 16,314,201 | | | | 32,657 | | | | 16,346,858 | |
Other components of equity | | | 401,778 | | | | (213,904 | ) | | | 187,874 | |
Non-controlling interests | | | 452,092 | | | | (4,871 | ) | | | 447,221 | |
As of December 31, 2012:
| | | | | | | | | | | | |
| | | December 31, 2012
(Previously Reported) | | | Adjustments | | | December 31, 2012
(Restated) | |
ASSETS | | | | | | | | | | | | |
Non-current Assets | | | | | | | | | | | | |
Deferred tax asset—net | | | 100,693 | | | | 13,611 | | | | 114,304 | |
Long-term prepaid pension—net of current portion | | | 88,845 | | | | (68,175 | ) | | | 20,670 | |
Long-term receivables | | | 17,959 | | | | (8,387 | ) | | | 9,572 | |
LIABILITIES | | | | | | | | | | | | |
Non-current Liabilities | | | | | | | | | | | | |
Deferred tax liabilities—net | | | 1,855,129 | | | | (125,903 | ) | | | 1,729,226 | |
Employee benefit obligations—net of current portion | | | 926,224 | | | | 482,987 | | | | 1,409,211 | |
EQUITY | | | | | | | | | | | | |
Retained earnings | | | | | | | | | | | | |
Unappropriated | | | 16,262,361 | | | | 43,548 | | | | 16,305,909 | |
Other components of equity | | | 790,222 | | | | (453,305 | ) | | | 336,917 | |
Non-controlling interests | | | 532,069 | | | | (10,278 | ) | | | 521,791 | |
F-21
PT INDOSAT Tbk AND ITS SUBSIDIARIES
NOTES TO CONSOLIDATED FINANCIAL STATEMENTS—(Continued)
as of January 1, 2012 (Restated), December 31, 2012 (Restated) and December 31, 2013
and for the Years ended December 31, 2011 (Restated), 2012 (Restated) and 2013
(Expressed in millions of rupiah and thousands of U.S. dollar, except share and tariff data)
For the year ended December 31, 2011:
| | | | | | | | | | | | |
| | | December 31, 2011
(Previously Reported) | | | Adjustments | | | December 31, 2011
(Restated) | |
EXPENSE | | | | | | | | | | | | |
Personnel | | | 1,912,647 | | | | (83,174 | ) | | | 1,829,473 | |
INCOME TAX EXPENSE | | | | | | | | | | | | |
Deferred | | | (146,462 | ) | | | (21,677 | ) | | | (168,139 | ) |
PROFIT FOR THE YEAR ATTRIBUTABLE TO: | | | | | | | | | | | | |
Owners of the Company | | | 958,068 | | | | 60,147 | | | | 1,018,215 | |
Non-controlling interests | | | 97,845 | | | | 1,350 | | | | 99,195 | |
OTHER COMPREHENSIVE INCOME (LOSS) | | | | | | | | | | | | |
Remeasurement losses on defined benefit plan | | | — | | | | (88,882 | ) | | | (88,882 | ) |
Income tax effect | | | — | | | | 22,221 | | | | 22,221 | |
| | | | | | | | | | | | |
| | | December 31, 2011
(Previously Reported) | | | Adjustments | | | December 31, 2011
(Restated) | |
BASIC AND DILUTED EARNINGS PER SHARE ATTRIBUTABLE TO OWNERS OF THE COMPANY | | | 176.31 | | | | 11.07 | | | | 187.38 | |
BASIC AND DILUTED EARNINGS PER AMERICAN DEPOSITORY SHARE (ADS) (50 B PER SHARES PER ADS) ATTRIBUTABLE TO OWNERS OF THE COMPANY | | | 8,815.60 | | | | 553.44 | | | | 9,369.04 | |
For the year ended December 31, 2012:
| | | | | | | | | | | | |
| | | December 31, 2012
(Previously Reported) | | | Adjustments | | | December 31, 2012
(Restated) | |
EXPENSE | | | | | | | | | | | | |
Personnel | | | 1,427,194 | | | | (17,029 | ) | | | 1,410,165 | |
INCOME TAX BENEFIT (EXPENSE) | | | | | | | | | | | | |
Deferred | | | 259,947 | | | | (5,001 | ) | | | 254,946 | |
PROFIT FOR THE YEAR ATTRIBUTABLE TO: | | | | | | | | | | | | |
Owners of the Company | | | 365,649 | | | | 10,891 | | | | 376,540 | |
Non-controlling interests | | | 112,064 | | | | 1,137 | | | | 113,201 | |
OTHER COMPREHENSIVE INCOME (LOSS) | | | | | | | | | | | | |
Remeasurement losses on defined benefit plan | | | — | | | | (327,925 | ) | | | (327,925 | ) |
Income tax effect | | | — | | | | 81,980 | | | | 81,980 | |
BASIC AND DILUTED EARNINGS PER SHARE ATTRIBUTABLE TO OWNERS OF THE COMPANY | | | 67.29 | | | | 2.00 | | | | 69.29 | |
BASIC AND DILUTED EARNINGS PER AMERICAN DEPOSITORY SHARE (ADS) (50 B PER SHARES PER ADS) ATTRIBUTABLE TO OWNERS OF THE COMPANY | | | 3,364.50 | | | | 100.21 | | | | 3,464.71 | |
F-22
PT INDOSAT Tbk AND ITS SUBSIDIARIES
NOTES TO CONSOLIDATED FINANCIAL STATEMENTS—(Continued)
as of January 1, 2012 (Restated), December 31, 2012 (Restated) and December 31, 2013
and for the Years ended December 31, 2011 (Restated), 2012 (Restated) and 2013
(Expressed in millions of rupiah and thousands of U.S. dollar, except share and tariff data)
e. Adoption of New and Revised Accounting Standards
New and amended standards and interpretations
The accounting policies adopted are consistent with those of the previous financial year, except for the new and amended IAS, IFRS and International Financial Reporting Interpretations Committee (“IFRIC”) interpretations effective as of January 1, 2013. The following standards, amendments and interpretations, which became effective January 1, 2013, are relevant to the Group:
| | • | | IAS 1 (Amendment)—Presentation of Financial Statements—Presentation of Items of Other Comprehensive Income |
| | • | | IAS 1 (Amendment)—Clarification of the Requirement of Comparative Information |
| | • | | IAS 19 (Revised)—Employee Benefits (2011) |
| | • | | IAS 28 (2011)—Investment in Associates and Joint Ventures |
| | • | | IFRS 7 (Amendment)—Financial Instruments: Disclosures—Offsetting Financial Assets and Financial Liabilities |
| | • | | IFRS 10 & IAS 27—Consolidated Financial Statements and Separate Financial Statements |
| | • | | IFRS 11—Joint Arrangements |
| | • | | IFRS 12—Disclosure of Interests in Other Entities |
| | • | | IFRS 13—Fair Value Measurement |
| | • | | IFRS 9—Financial Instruments: Classification and Measurement |
IAS 1 (Amendment)—Presentation of Financial Statements—Presentation of Items of Other Comprehensive Income
The amendment to IAS 1 requires that an entity present separately the items of other comprehensive income that would be reclassified to profit or loss in the future if certain conditions are met from those that would never be reclassified to profit or loss. The amendment is effective for annual periods beginning after July 1, 2012.
This amendment did not have any significant impact on the Group; however, it required a change in the presentation of its remeasurement gain (losses) on defined benefit plans to be presented under Other Comprehensive Income as an item which would never be reclassified to profit or loss.
IAS 1 (Amendment)—Clarification of the Requirement of Comparative Information
These amendments clarify the difference between voluntary additional comparative information and the minimum required comparative information. An entity must include comparative information in the related notes to the financial statements when it voluntarily provides comparative information beyond the minimum required comparative period. The amendments, however, clarify that the opening statement of financial position (as at January 1, 2012 in the case of the Group), presented as a result of the retrospective restatement or reclassification of items in financial statements does not have to be accompanied by comparative information in the related notes.
The amendments affected presentation only and did not have an impact on the Group’s financial position or performance.
F-23
PT INDOSAT Tbk AND ITS SUBSIDIARIES
NOTES TO CONSOLIDATED FINANCIAL STATEMENTS—(Continued)
as of January 1, 2012 (Restated), December 31, 2012 (Restated) and December 31, 2013
and for the Years ended December 31, 2011 (Restated), 2012 (Restated) and 2013
(Expressed in millions of rupiah and thousands of U.S. dollar, except share and tariff data)
IAS 19—Employee Benefits (Revised 2011)
The Group applied IAS 19 (Revised 2011) retrospectively in accordance with the transitional provisions set out in the revised standard. The opening statement of financial position of the earliest comparative period presented (January 1, 2012) and the comparative figures have been accordingly restated.
IAS 19 (Revised 2011) changes, among other things, the accounting for defined benefit plans. Some of the key changes that impacted the Group included the following:
| | • | | The amendments require the recognition of changes in defined benefit obligations and in the fair value of plan assets when they occur, and hence eliminated the “corridor approach” for recognizing actuarial gains or losses permitted under the previous version of IAS 19. All actuarial gains and losses are recognized immediately through other comprehensive income in order for the net pension asset or liability recognized in the consolidated statement of financial position to reflect the full value of the plan deficit or surplus. |
| | • | | All past service costs are recognized at the earlier of when the amendment/curtailment occurs or when the related restructuring or termination costs are recognized. As a result, unvested past service costs can no longer be deferred and recognized over the future vesting period. |
| | • | | The interest cost and expected return on plan assets used in the previous version of IAS 19 are replaced with a net-interest amount, which is calculated by applying the discount rate to the net defined benefit liability or asset at the start of each annual reporting period. |
IAS 19 (Revised 2011) also requires more extensive disclosures. The impact of the new standard has been disclosed in Notes 2d and 30.
IAS 19 (Revised 2011) has been applied retrospectively, with the following permitted exceptions:
| | • | | The carrying amounts of other assets have not been adjusted for changes in employee benefit costs that were included before January 1, 2012. |
Sensitivity disclosures for the defined benefit obligation for comparative period (year ended December 31, 2012) have not been provided.
IAS 28 (2011)—Investment in Associates and Joint Ventures
| | • | | Associates held for sale: IFRS 5 Non-current Assets Held for Sale and Discontinued Operations applies to an investment, or a portion of an investment, in an associate or a joint venture that meets the criteria to be classified as held for sale. For any retained portion of the investment that has not been classified as held for sale, the entity applies the equity method until disposal of the portion held for sale. After disposal, any retained interest is accounted for using the equity method if the retained interest continues to be an associate or a joint venture; and |
| | • | | On cessation of significant influence or joint control, if an investment in an associate becomes an investment in a joint venture or vice versa, the entity does not re-measure the retained interest. |
This amendment did not have any impact on the Group since there is no interest in joint ventures as of December 31, 2013.
F-24
PT INDOSAT Tbk AND ITS SUBSIDIARIES
NOTES TO CONSOLIDATED FINANCIAL STATEMENTS—(Continued)
as of January 1, 2012 (Restated), December 31, 2012 (Restated) and December 31, 2013
and for the Years ended December 31, 2011 (Restated), 2012 (Restated) and 2013
(Expressed in millions of rupiah and thousands of U.S. dollar, except share and tariff data)
IFRS 7 (Amendment)—Financial Instruments: Disclosures—Offsetting Financial Assets and Financial Liabilities
IFRS 7 introduces disclosures about the impact of netting arrangements on an entity’s financial position. Based on the new disclosure requirements, the Group had to provide information about what amounts have been offset in the statement of financial position and the nature and extent of rights of set-off under master netting arrangements or similar arrangements.
This amendment did not have any significant impact on the Group as it does not have any transactions involving the offsetting of financial assets and financial liabilities.
IFRS 10 & IAS 27—Consolidated Financial Statements and Separate Financial Statements
IFRS 10 introduces a single control model to determine whether an investee should be consolidated. IFRS 10 replaces parts of previously existing IAS 27 Consolidated and Separate Financial Statements that dealt with consolidated financial statements and SIC-12 Consolidation—Special Purpose Entities. This new control model focuses on whether the Group has power over an investee, exposure or rights to variable returns from its involvement with the investee and ability to use its power to affect those returns.
Amendments in IAS 27 did not have significant impact to the Group as it does not prepare separate IFRS financial statements.
IFRS 11—Joint Arrangements
IFRS 11 replaces the parts of previously existing IAS 31 Interests in Joint Ventures that dealt with accounting for joint ventures. IFRS 11 requires that interests in joint arrangements be classified as either joint operations (if the Group has rights to the assets, and obligations for the liabilities, relating to an arrangement) or joint ventures (if the Group has rights only to the net assets of an arrangement. When making this assessment, the Group has to consider the structure of the arrangements, contractual terms and other facts and circumstances.
This new standard did not have any significant impact on the Group since it does not have any interests in joint arrangements as of December 31, 2013.
IFRS 12—Disclosure of Interests in Other Entities
IFRS 12 brings together into a single standard all of the disclosure requirements about an entity’s interests in subsidiaries, joint arrangements, associates and unconsolidated structured entities. It requires the disclosure of information about the nature, risks and financial effects of these interests.
As the result of the adoption of IFRS 12, the Group has disclosed its interests in subsidiaries and other structured entities. Specific disclosure on interest in subsidiaries and structured entities has been made by the Group in Notes 1b, 12 and 13.
IFRS 13—Fair Value Measurement
IFRS 13 provides a single source of guidance on how fair value is measured, and replaces the fair value measurement guidance that is currently dispersed throughout IFRS. It unifies the definition of fair value as
F-25
PT INDOSAT Tbk AND ITS SUBSIDIARIES
NOTES TO CONSOLIDATED FINANCIAL STATEMENTS—(Continued)
as of January 1, 2012 (Restated), December 31, 2012 (Restated) and December 31, 2013
and for the Years ended December 31, 2011 (Restated), 2012 (Restated) and 2013
(Expressed in millions of rupiah and thousands of U.S. dollar, except share and tariff data)
the price that would be received to sell an asset or paid to transfer a liability in an orderly transaction between market participants at the measurement date. It replaces and expands the disclosure requirements on fair value measurements in other IFRSs, including IFRS 7.
The Group has included the required disclosures in Notes 2f8—2f15 and 21. In accordance with the transitional provisions of IFRS 13, the Group has applied the new fair value measurement guidance prospectively and has not provided any comparative information for the new disclosures. Notwithstanding the above, the change has no significant impact on the measurements of the Group’s assets and liabilities.
The application of IFRS 13 has not materially impacted the fair value measurements carried out by the Group.
Standards issued but not yet effective
IFRS 9 Financial Instruments: Classification and Measurement
IFRS 9, as issued, reflects the IASB’s work on the replacement of IAS 39 and applies to classification and measurement of financial assets and financial liabilities as defined in IAS 39, hedge accounting. The standard will be effective for annual periods beginning on or after January 1, 2018. In subsequent phases, the IASB will address impairment of financial assets and further amendments to classification and measurement of financial assets. The Group will quantify the effect in conjunction with the other phases, when the final standard, including all phases, is issued.
IAS 19 Defined Benefit Plans: Employee Contributions (Amended)
The amendments clarify the requirements that relate to how contributions from employees or third parties that are linked to service should be attributed to periods of service. In addition, it permits a practical expedient if the amount of the contributions is independent of the number of years of service. The amendment for contributions from employees or third parties that are linked to service are:
| | • | | If the amount of the contributions is independent of the number of years of service, contributions may be recognized as a reduction in the service cost in the period in which the related service is rendered. |
| | • | | If the amount of the contributions depends on the number of years of service, those contributions must be attributed to periods of service using the same attribution method as used for the gross benefit. |
The amendments become effective for annual periods beginning on or after July 1, 2014. Based on preliminary analyses, no material impact is expected on the financial statements of the Group.
IAS 32 Offsetting Financial Assets and Financial Liabilities (Amendment)
The amendments to IAS 32 clarify the meaning of “currently has a legally enforceable right to set-off”. The amendments also clarify the application of the IAS 32 offsetting criteria to settlement systems (such as central clearing house systems), which apply gross settlement mechanisms that are not simultaneous.
The amendments clarify that rights of set-off must not only be legally enforceable in the normal course of business, but must also be enforceable in the event of default and the event of bankruptcy or insolvency of all of the counterparties to the contract, including the reporting entity itself. The amendments also clarify
F-26
PT INDOSAT Tbk AND ITS SUBSIDIARIES
NOTES TO CONSOLIDATED FINANCIAL STATEMENTS—(Continued)
as of January 1, 2012 (Restated), December 31, 2012 (Restated) and December 31, 2013
and for the Years ended December 31, 2011 (Restated), 2012 (Restated) and 2013
(Expressed in millions of rupiah and thousands of U.S. dollar, except share and tariff data)
that rights of set-off must not be contingent on a future event. The IAS 32 offsetting criteria require the reporting entity to intend either to settle on a net basis, or to realize the asset and settle the liability simultaneously. The amendments clarify that only gross settlement mechanisms with features that eliminate or result in insignificant credit and liquidity risk and that process receivables and payables in a single settlement process or cycle would be, in effect, equivalent to net settlement and, therefore, meet the net settlement criterion.
These amendments are applied retrospectively in accordance with the requirements of IAS 8, “Accounting Policies, Changes in Accounting Estimates and Errors” for changes in accounting policy.
The amendments become effective for annual periods beginning on or after January 1, 2014 and are not expected to impact the Group’s financial statements.
IAS 36 Recoverable Amount Disclosure for Non-Financial Assets (Amended)
The amendments clarify the disclosure requirements in respect of fair value less costs of disposal. When IAS 36 Impairment of Assets was originally changed as a consequence of IFRS 13, the IASB intended to require disclosure of information about the recoverable amount of impaired assets if that amount was based on fair value less costs to sell. An unintended consequence of the amendments was that an entity would be required to disclose the recoverable amount for each cash-generating unit for which the carrying amount of goodwill or intangible assets with indefinite useful lives allocated to that unit was significant in comparison with the entity’s total carrying amount of goodwill or intangible assets with indefinite useful lives. This requirement has been deleted by the amendment.
In addition, the IASB added two disclosure requirements:
| | • | | Additional information about the fair value measurement of impaired assets when the recoverable amount is based on fair value less costs of disposal. |
| | • | | Information about the discount rates that have been used when the recoverable amount is based on fair value less costs of disposal using a present value technique. The amendment harmonizes disclosure requirements between value in use and fair value less costs of disposal. |
These amendments are applied retrospectively, in accordance with the requirements of IAS 8, “Accounting Policies, Changes in Accounting Estimates and Errors” for changes in accounting policy.
The amendments become effective for annual periods beginning on or after January 1, 2014 and are not expected to impact the Group’s financial statements.
IAS 39 Novation of Derivatives and Continuation of Hedge Accounting (Amended)
The amendments provide an exception to the requirement to discontinue hedge accounting in certain circumstances in which there is a change in counterparty to a hedging instrument in order to achieve clearing for that instrument. The amendment covers novation of derivatives:
| | • | | which arises as a consequence of laws or regulations, or the introduction of laws or regulations. |
| | • | | where the parties to the hedging instrument agree that one or more clearing counterparties replace the original counterparty to become the new counterparty to each of the parties. |
F-27
PT INDOSAT Tbk AND ITS SUBSIDIARIES
NOTES TO CONSOLIDATED FINANCIAL STATEMENTS—(Continued)
as of January 1, 2012 (Restated), December 31, 2012 (Restated) and December 31, 2013
and for the Years ended December 31, 2011 (Restated), 2012 (Restated) and 2013
(Expressed in millions of rupiah and thousands of U.S. dollar, except share and tariff data)
| | • | | which did not result in changes to the terms of the original derivative other than changes directly attributable to the change in counterparty to achieve clearing. |
All of the above criteria must be met in order to continue hedge accounting after the novation. The amendments cover novation to central counterparties, as well as to intermediaries such as clearing members, or clients of the latter that are themselves intermediaries.
For novation that does not meet the criteria for the exception, entities have to assess the changes to the hedging instrument against the derecognition criteria for financial instruments and the general conditions for continuation of hedge accounting.
The amendments are applied retrospectively, in accordance with the requirements of IAS 8, “Accounting Policies, Changes in Accounting Estimates and Errors” for changes in accounting policy.
The amendments become effective for annual periods beginning on or after January 1, 2014. The Company has not novated any derivatives during the current period. However, these amendments would be considered for future novations.
IFRIC 21 Levies
IFRIC 21 is applicable to all levies other than outflows that are within the scope of other standards (e.g., IAS 12) and fines or other penalties for breaches of legislation. Levies are defined in the interpretation as outflows of resources embodying economic benefits imposed by government on entities in accordance with legislation.
The interpretation clarifies that an entity recognizes a liability for a levy when the activity that triggers payment, as identified by the relevant legislation, occurs. It also clarifies that a levy liability is accrued progressively only if the activity that triggers payment occurs over a period of time, in accordance with the relevant legislation. For a levy that is triggered upon reaching a minimum threshold, the interpretation clarifies that no liability is recognized before the specified minimum threshold is reached.
The amendments are applied retrospectively, in accordance with the requirements of IAS 8, “Accounting Policies, Changes in Accounting Estimates and Errors” for changes in accounting policy.
The amendments become effective for annual periods beginning on or after January 1, 2014. The Group does not expect that IFRIC 21 will have material financial impact in future financial statements.
IFRS 10, IFRS 12, and IAS 27 Investment Entities (Amended)
The investment entities amendments apply to investments in subsidiaries, joint ventures and associates held by a reporting entity that meets the definition of an investment entity. The key amendments include:
| | a. | Investment entity is defined in IFRS 10. |
| | b. | An investment entity must meet three elements of the definition and consider four typical characteristics, in order to qualify as an investment entity. |
| | c. | An entity must consider all facts and circumstances, including its purpose and design, in making its assessment. |
F-28
PT INDOSAT Tbk AND ITS SUBSIDIARIES
NOTES TO CONSOLIDATED FINANCIAL STATEMENTS—(Continued)
as of January 1, 2012 (Restated), December 31, 2012 (Restated) and December 31, 2013
and for the Years ended December 31, 2011 (Restated), 2012 (Restated) and 2013
(Expressed in millions of rupiah and thousands of U.S. dollar, except share and tariff data)
| | d. | An investment entity accounts for its investments in subsidiaries, associates and joint ventures at fair value through profit or loss in accordance with IFRS 9 (or IAS 39, as applicable), except for investments in subsidiaries, associates and joint ventures that provide services that relate only to the investment entity, which must be consolidated (investments in subsidiaries) or accounted for using the equity method (investments in associates or joint ventures). |
| | e. | An investment entity must measure its investment in another controlled investment entity at fair value. |
| | f. | A non-investment entity parent of an investment entity is not permitted to retain the fair value accounting that the investment entity subsidiary applies to its controlled investees. |
| | g. | For venture capital organizations, mutual funds, unit trusts and others that do not qualify as investment entities, the existing option in IAS 28, to measure investments in associates and joint ventures at fair value through profit or loss, is retained. |
The amendments must be applied retrospectively, subject to certain transition reliefs. These amendments become effective for annual periods beginning on or after January 1, 2014. These amendments will not be relevant to the Group, since none of the entities in the Group would qualify as an investment entity under IFRS 10.
f. Significant Accounting Policies and Practices
f1. Business combinations and goodwill
Business combinations
Business combinations are accounted for using the acquisition method. The cost of an acquisition is measured as the aggregate of the consideration transferred, measured at acquisition date fair value and the amount of any non-controlling interest in the acquiree. For each business combination, the acquirer measures the non-controlling interest in the acquiree either at fair value or at the proportionate share of the acquiree’s identifiable net assets. Acquisition costs incurred are expensed and included in administrative expenses.
When the Group acquires a business, it assesses the financial assets and liabilities assumed for appropriate classification and designation in accordance with the contractual terms, economic circumstances and pertinent conditions as at the acquisition date. This includes the separation of embedded derivatives in host contracts of the acquiree.
If the business combination is achieved in stages, the acquisition date fair value of the acquirer’s previously held equity interest in the acquiree is remeasured to fair value at the acquisition date through profit or loss.
Any contingent consideration to be transferred by the acquirer will be recognized at fair value at the acquisition date. Contingent consideration classified as an asset or liability that is a financial instrument and within the scope of IAS 39Financial Instruments: Recognition and Measurement, is measured at fair value with changes in fair value recognized either in profit or loss or as a change to Other Comprehensive Income. If the contingent consideration is not within the scope of IAS 39, it is measured in accordance with the appropriate IFRS. Contingent consideration that is classified as equity is not re-measured and subsequent settlement is accounted for within equity.
F-29
PT INDOSAT Tbk AND ITS SUBSIDIARIES
NOTES TO CONSOLIDATED FINANCIAL STATEMENTS—(Continued)
as of January 1, 2012 (Restated), December 31, 2012 (Restated) and December 31, 2013
and for the Years ended December 31, 2011 (Restated), 2012 (Restated) and 2013
(Expressed in millions of rupiah and thousands of U.S. dollar, except share and tariff data)
Goodwill
Goodwill is initially measured at cost being the excess of the aggregate of the consideration transferred and the amount recognized for non-controlling interest over the net identifiable assets acquired and liabilities assumed. If this consideration is lower than the fair value of the net assets of the subsidiary acquired, the difference is recognized in profit or loss.
After initial recognition, goodwill is measured at cost less any accumulated impairment losses. For the purpose of impairment testing, goodwill acquired in a business combination is, from the acquisition date, allocated to each of the Group’s cash-generating units (“CGUs”) that are expected to benefit from the combination, irrespective of whether other assets or liabilities of the acquiree are assigned to those CGUs.
Where goodwill forms part of a CGU and part of the operation within that CGU is disposed of, the goodwill associated with the operation disposed of is included in the carrying amount of the operation when determining the gain or loss on disposal of the operation. Goodwill disposed of in this circumstance is measured based on the relative values of the operation disposed of and the portion of the CGU retained.
f2. Intangible assets
Intangible assets acquired separately are measured on initial recognition at cost. The cost of intangible assets acquired in a business combination is its fair value as at the date of acquisition. Following initial recognition, intangible assets are carried at cost less any accumulated amortization and accumulated impairment losses, if any.
The useful lives of intangible assets are assessed as either finite or indefinite.
Intangible assets with finite lives are amortized over their useful lives and assessed for impairment whenever there is an indication that the intangible asset may be impaired. The amortization period and the amortization method for an intangible asset with a finite useful life are reviewed at least at the end of each reporting period. Changes in the expected useful life or the expected pattern of consumption of future economic benefits embodied in the asset is accounted for by changing the amortization period or method, as appropriate, and are treated as changes in accounting estimates. The amortization expense on intangible assets with finite lives is recognized in profit or loss in the expense category consistent with the function of the intangible assets.
Intangible assets with indefinite useful lives are not amortized, but are tested for impairment annually, either individually or at the cash-generating unit level. The assessment of indefinite life is reviewed annually to determine whether the indefinite life continues to be supportable. If not, the change in useful life from indefinite to finite is made on a prospective basis.
At the time of acquisition of a subsidiary, any intangible assets recognized are amortized using the straight-line method based on the estimated useful lives of the assets as follows:
| | | | |
| | | Years | |
Customer base | | | | |
—Prepaid | | | 6 | |
—Post-paid | | | 5 | |
Spectrum license | | | 5 | |
Brand | | | 8 | |
Patent | | | 10 | |
F-30
PT INDOSAT Tbk AND ITS SUBSIDIARIES
NOTES TO CONSOLIDATED FINANCIAL STATEMENTS—(Continued)
as of January 1, 2012 (Restated), December 31, 2012 (Restated) and December 31, 2013
and for the Years ended December 31, 2011 (Restated), 2012 (Restated) and 2013
(Expressed in millions of rupiah and thousands of U.S. dollar, except share and tariff data)
Internally generated intangible assets, excluding capitalized development costs, are not capitalized and expenditure is reflected in profit or loss in the year in which the expenditure is incurred.
Gains or losses arising from derecognition of an intangible asset are measured as the difference between the net disposal proceeds and the carrying amount of the asset and are recognized in profit or loss when the asset is derecognized.
Computer Software
Software that is not an integral part of the related hardware is amortized using the straight-line method over 5 years and assessed for impairment whenever there is indication of impairment. The Company reviews the amortization period and the amortization method for the software at least at each financial year end. Residual value of software is assumed to be zero.
f3. Investments in associated Companies
The Group’s investment in its associate is accounted for using the equity method. An associate is an entity over which the Group has significant influence.
Under the equity method, the investment in the associate is carried in the consolidated statements of financial position at cost plus post acquisition changes in the Group’s share of net assets of the associate. Goodwill relating to the associate is included in the carrying amount of the investment and is neither amortized nor individually tested for impairment.
The consolidated statements of comprehensive income reflect the share of the results of operations of the associate. Where there has been a change recognized directly in the equity of the associate, the Group recognizes its share of any changes and discloses this, when applicable, in the consolidated statements of changes in equity. Unrealized gains and losses resulting from transactions between the Group and the associate are eliminated to the extent of the interest in the associate.
The Group’s share of profit of an associate is shown on the face of the consolidated statements of comprehensive income. This is the profit attributable to equity holders of the associate and therefore is profit after tax and non-controlling interests in the subsidiaries of the associate.
The financial statements of the associate are prepared for the same reporting period as the Group. Where necessary, adjustments are made to bring the accounting policies in line with those of the Group.
After application of the equity method, the Group determines whether it is necessary to recognize an additional impairment loss on its investment in its associate. The Group determines at each reporting date whether there is any objective evidence that the investment in the associate is impaired. If this is the case, the Group calculates the amount of impairment as the difference between the recoverable amount of the associate and its carrying value and recognizes the amount in the consolidated statements of comprehensive income.
Upon loss of significant influence over the associate, the Group measures and recognizes any retained investment at its fair value. Any difference between the carrying amount of the associate upon loss of significant influence and the fair value of the retained investment and proceeds from disposal is recognized in profit or loss.
F-31
PT INDOSAT Tbk AND ITS SUBSIDIARIES
NOTES TO CONSOLIDATED FINANCIAL STATEMENTS—(Continued)
as of January 1, 2012 (Restated), December 31, 2012 (Restated) and December 31, 2013
and for the Years ended December 31, 2011 (Restated), 2012 (Restated) and 2013
(Expressed in millions of rupiah and thousands of U.S. dollar, except share and tariff data)
f4. Foreign currency translation
The consolidated financial statements are presented in rupiah, which is the Company’s functional currency and the Group’s presentation currency. Transactions involving foreign currencies are initially recorded at the functional currency rate prevailing at the date of the transaction. Monetary assets and liabilities denominated in foreign currencies are translated at the functional currency spot rate of exchange prevailing at the end of the reporting period. All differences are taken to the statements of comprehensive income, except for foreign exchange differences that qualify as capitalizable borrowing costs for qualifying properties under construction and installation. Non-monetary items that are measured in terms of historical cost in a foreign currency are translated using the exchange rates as at the dates of the initial transactions. Non-monetary items measured at fair value in a foreign currency are translated using the exchange rates at the date when the fair value is determined.
The functional currency and presentation currency of IFB and IIFB (which were liquidated in July 2013) are in Euro, while these of IPBV, IMBV and ISP are in U.S. dollar. As at the end of the reporting period, the assets and liabilities of these subsidiaries are translated into the presentation currency of the Company at the spot rate which is the exchange rate prevailing at the end of the reporting period and their statements of comprehensive income are translated at the average rate during the period. The resulting differences arising from the translations of the financial statements of IPBV, IMBV, IFB, IIFB and ISP are included in other comprehensive income and presented as part of “Difference in Foreign Currency Translation” in the consolidated statements of changes in equity.
f5. Revenue recognition and expense recognition
f5.1 Service Revenues
Cellular
Cellular revenues arising from airtime and roaming calls are recognized based on the duration of successful calls made through the Company’s cellular network and presented on gross basis.
For post-paid subscribers, monthly service fees are recognized as the service is provided.
The activation component of starter package sales is deferred and recognized as revenue over the expected average period of the customer relationship. Sales of initial/reload vouchers are recorded as unearned income and recognized as revenue upon usage of the airtime or upon expiration of the airtime.
Sales of wireless broadband modems and cellular handsets are recognized upon delivery to the customers.
Revenues from wireless broadband data communications are recognized based on the duration of usage or fixed monthly charges depending on the arrangement with the customers.
Cellular revenues are presented on a net basis, after compensation to value added service providers.
Customer Loyalty Program
The Company operated a customer loyalty program called“Poin Plus Plus,” which allowed customers to accumulate points for every reload and payment by the Company’s prepaid and post-paid subscribers, respectively. The points could then be redeemed for free telecommunication and non-telecommunication
F-32
PT INDOSAT Tbk AND ITS SUBSIDIARIES
NOTES TO CONSOLIDATED FINANCIAL STATEMENTS—(Continued)
as of January 1, 2012 (Restated), December 31, 2012 (Restated) and December 31, 2013
and for the Years ended December 31, 2011 (Restated), 2012 (Restated) and 2013
(Expressed in millions of rupiah and thousands of U.S. dollar, except share and tariff data)
products, subject to a minimum number of points being obtained. Starting July 29, 2011, the “Poin PlusPlus”program was replaced with the“Indosat Senyum”program. Both programs have similarity in nature and scheme to redeem the points, except that, under the new program, the Company no longer includes the subscription period as a variable item in calculating the points. Effective March 31, 2013, the Company ceased the “Indosat Senyum” program and all outstanding obligations expired as of December 31, 2013.
Customer loyalty credits are accounted for as a separate component of the sales transaction in which they are granted. The Company records a liability at the time of reload and payment by its prepaid and post-paid subscribers, respectively, based on the fair value expected to be incurred to supply products in the future. The consideration received is allocated between the cellular products sold and the points issued, with the consideration allocated to the points equal to their fair value. Fair value of the points issued is deferred and recognized as revenue when the points are redeemed, the redemption period expires or when the program is terminated.
Dealer Commissions
Consideration in the form of sales discount given by the Company to a dealer is recognized as a reduction of revenue.
If the Company receives, or will receive, an identifiable benefit in exchange for a consideration given by the Company to a dealer, and the fair value of such benefit can be reasonably estimated, the consideration will be recorded as a marketing expense.
Tower Leasing
Revenue from tower leasing classified as operating leases is recognized on a straight-line basis over the lease term based on the amount stated in the agreement between the Company and the lessee.
MIDI
Revenues arising from installation service are deferred and recognized over the expected average period of the customer relationship. Revenues from monthly service fees are recognized as the services are provided. Revenues from usage charges are recognized monthly based on the duration of internet usage or based on the fixed amount of charges depending on the arrangement with the customers.
| | • | | Frame Net, World Link and Direct Link |
Revenues arising from installation service are deferred and recognized over the expected average period of the customer relationship. Revenues from monthly service fees are recognized as the services are provided.
| | • | | Satellite Operating Lease |
Revenues are recognized on a straight-line basis over the lease term.
| | • | | Revenues from other MIDI services are recognized when the services are rendered. |
F-33
PT INDOSAT Tbk AND ITS SUBSIDIARIES
NOTES TO CONSOLIDATED FINANCIAL STATEMENTS—(Continued)
as of January 1, 2012 (Restated), December 31, 2012 (Restated) and December 31, 2013
and for the Years ended December 31, 2011 (Restated), 2012 (Restated) and 2013
(Expressed in millions of rupiah and thousands of U.S. dollar, except share and tariff data)
Fixed Telecommunications
Revenues from outgoing international call traffic are recognized on the basis of the actual recorded traffic for the year and have been reported on a gross basis.
Fixed wireless revenues arising from usage charges are recognized based on the duration of successful calls made through the Company’s fixed network.
For post-paid subscribers, monthly service fees are recognized as the services are provided.
For prepaid subscribers, the activation component of starter package sales is deferred and recognized as revenue over the expected average period life of the customer relationship. Sale of initial/reload vouchers is recorded as unearned income and recognized as income upon usage of the airtime or upon expiration of the airtime.
Revenues from fixed line installations are deferred and recognized as revenue over the expected average period of the customer relationship. Revenues from usage charges are recognized based on the duration of successful calls made through the Company’s fixed network.
Interconnection Revenue
Revenues from network interconnection with other domestic and international telecommunications carriers are recognized monthly on the basis of the actual recorded traffic for the month.
f5.2 Interest Income
Interest income is recognized as it accrues on a time proportion basis taking into account the principal amount outstanding and the effective interest rate. Majority of interest income represents interest earned from cash and cash equivalents.
f5.3 Agency Relationship
Revenues from an agency relationship are recorded based on the gross amount billed to the customer when the Company and subsidiaries act as a principal in the sale of services.
When the Company and subsidiaries act as an agent and earn commission from the suppliers of the services, revenues are recorded based on the net amount retained (the amount paid by the customer less the amount paid to the suppliers).
f5.4 Dividends
Dividend income is recognized when the Company’s right to receive the payment is established.
F-34
PT INDOSAT Tbk AND ITS SUBSIDIARIES
NOTES TO CONSOLIDATED FINANCIAL STATEMENTS—(Continued)
as of January 1, 2012 (Restated), December 31, 2012 (Restated) and December 31, 2013
and for the Years ended December 31, 2011 (Restated), 2012 (Restated) and 2013
(Expressed in millions of rupiah and thousands of U.S. dollar, except share and tariff data)
f5.5 Expenses
Interconnection Expenses
Expenses from network interconnection with other domestic and international telecommunications carriers are accounted for as operating expenses in the period these are incurred.
Other Expenses
Expenses are recognized when incurred.
f6. Taxation
Current income tax
Current income tax assets and liabilities are measured at the amount expected to be recovered from or paid to the taxation authorities. The tax rates and tax laws used to compute the amount are those that are enacted or substantively enacted, at the reporting date in the countries where the Group operates and generates taxable income.
Current income tax relating to items recognized directly in equity is recognized in equity. Management periodically evaluates positions taken in the tax returns with respect to situations in which applicable tax regulations are subject to interpretation and establishes provisions where appropriate.
Deferred tax
Deferred tax is provided using the liability method on all temporary differences at the end of the reporting year between the tax bases of assets and liabilities and their carrying amounts for financial reporting purposes.
Deferred tax liabilities are recognized for all taxable temporary differences except: (1) where the deferred tax liability arises from the initial recognition of goodwill or of an asset or liability in a transaction that is not a business combination and, at the time of the transaction, affects neither the accounting profit nor taxable profit or loss and (2) in respect of taxable temporary differences associated with investments in subsidiaries and associates, where the timing of the reversal of the temporary differences can be controlled and it is possible that the temporary differences will not reverse in the foreseeable future.
Deferred tax assets are recognized for all deductible temporary differences and carryforward of unused tax losses, to the extent that it is probable that taxable profit will be available against which the deductible temporary differences and carryforward of unused tax losses can be utilized except: (1) where the deferred tax asset relating to the deductible temporary difference arises from the initial recognition of an asset or liability in a transaction that is not a business combination and, at the time of the transaction, affects neither the accounting profit nor taxable profit or loss and (2) in respect of deductible temporary differences associated with investments in subsidiaries and associates, deferred tax assets are recognized only to the extent that it is probable that the temporary differences will reverse in the foreseeable future and taxable profit will be available against which the temporary differences can be utilized.
The carrying amount of deferred tax assets is reviewed at each reporting date and reduced to the extent that it is no longer probable that sufficient taxable profit will be available to allow all or part of the deferred
F-35
PT INDOSAT Tbk AND ITS SUBSIDIARIES
NOTES TO CONSOLIDATED FINANCIAL STATEMENTS—(Continued)
as of January 1, 2012 (Restated), December 31, 2012 (Restated) and December 31, 2013
and for the Years ended December 31, 2011 (Restated), 2012 (Restated) and 2013
(Expressed in millions of rupiah and thousands of U.S. dollar, except share and tariff data)
tax asset to be utilized. Unrecognized deferred tax assets are reassessed at each reporting date and are recognized to the extent that it has become probable that future taxable profits will allow the deferred tax asset to be recovered.
Deferred tax assets and liabilities are measured at the tax rates that are expected to apply in the year when the asset is realized or the liability is settled, based on tax rates (and tax laws) that have been enacted or substantively enacted at the reporting date.
Deferred tax relating to items recognized outside profit or loss is recognized outside profit or loss. Deferred tax items are recognized in correlation to the underlying transaction either in other comprehensive income or directly in equity.
Deferred tax assets and deferred tax liabilities are offset, if a legally enforceable right exists to set off current tax assets against current income tax liabilities and the deferred taxes relate to the same taxable entity and the same taxation authority.
Sales tax
Revenues, expenses and assets are recognized net of the amount of sales tax.
The net amount of sales tax recoverable from, or payable to, the taxation authority is included as part of receivables or payables in the consolidated statements of financial position.
f7. Pensions and other post-employment benefits
Funded Plans
The Group has defined benefit pension plans which require contributions to be made to separately administered funds. Pension costs under the Group’s defined benefit pension plans are determined by periodic actuarial calculation using the projected-unit-credit method and applying the assumptions as in accordance with IAS 19 (Revised 2011).
Re-measurements, comprising of actuarial gains and losses and the return on plan assets (excluding net interest), are recognized immediately in the consolidated statements of financial position with a corresponding debit or credit to Other Comprehensive Income in the period in which they occur. Re-measurements are not reclassified to profit or loss in subsequent periods.
Past service costs are recognized in profit or loss on the earlier of:
| | • | | The date of the plan amendment or curtailment, and |
| | • | | The date that the Group recognizes restructuring-related costs |
Net interest is calculated by applying the discount rate to the net defined benefit liability or asset. The Group recognizes the following changes in the net defined benefit obligation under ‘personnel expense’ in the consolidated statements of comprehensive income (by function):
| | • | | Service costs comprising current service costs, past-service costs, gains and losses on curtailments and non-routine settlements |
| | • | | Net interest expense or income |
F-36
PT INDOSAT Tbk AND ITS SUBSIDIARIES
NOTES TO CONSOLIDATED FINANCIAL STATEMENTS—(Continued)
as of January 1, 2012 (Restated), December 31, 2012 (Restated) and December 31, 2013
and for the Years ended December 31, 2011 (Restated), 2012 (Restated) and 2013
(Expressed in millions of rupiah and thousands of U.S. dollar, except share and tariff data)
Unfunded Plans
The Group also provides other post-employment benefits to its employees, such as benefits under Labor Law No.13/2003 (“Labor Law”) and post-retirement healthcare benefits. These benefits are unfunded. The accounting treatment for the unfunded plans is the same as that of the funded plans above.
f8. Financial assets
Initial recognition
Financial assets within the scope of IAS 39 are classified as financial assets at fair value through profit or loss, loans and receivables, held-to-maturity investments, available-for-sale financial assets, or as derivatives designated as hedging instruments in an effective hedge, as appropriate. The Group determines the classification of its financial assets at initial recognition.
All financial assets are recognized initially at fair value plus transaction costs, except in the case of financial assets which are recorded at fair value through profit or loss.
Purchases or sales of financial assets that require delivery of assets within a time frame established by regulation or convention in the marketplace (regular way trades) are recognized on the trade date, i.e., the date that the Group commits to purchase or sell the assets.
The Group’s financial assets include cash and cash equivalents, trade and other accounts receivable, due from related parties, derivative financial instruments and other current and non-current financial assets (quoted and unquoted financial instruments).
Subsequent measurement
The subsequent measurement of financial assets depends on their classification as follows:
| | • | | Financial assets at fair value through profit or loss |
Financial assets at fair value through profit or loss include financial assets held for trading and financial assets designated upon initial recognition at fair value through profit or loss.
Financial assets are classified as held for trading if they are acquired for the purpose of selling or repurchase in the near term. Derivatives, including separated embedded derivatives, are also classified as held for trading unless they are designated as effective hedging instruments.
Financial assets at fair value through profit or loss are carried in the consolidated statements of financial position at fair value with changes in fair value recognized in profit or loss.
Derivatives embedded in host contracts are accounted for as separate derivatives and recorded at fair value if their economic characteristics and risks are not closely related to those of the host contracts and the host contracts are not held for trading or designated at fair value through profit or loss. These embedded derivatives are measured at fair value with changes in fair value recognized in profit or loss. Reassessment only occurs if there is a change in the terms of the contract that significantly modifies the cash flows that would otherwise be required.
F-37
PT INDOSAT Tbk AND ITS SUBSIDIARIES
NOTES TO CONSOLIDATED FINANCIAL STATEMENTS—(Continued)
as of January 1, 2012 (Restated), December 31, 2012 (Restated) and December 31, 2013
and for the Years ended December 31, 2011 (Restated), 2012 (Restated) and 2013
(Expressed in millions of rupiah and thousands of U.S. dollar, except share and tariff data)
Loans and receivables are non-derivative financial assets with fixed or determinable payments that are not quoted in an active market. After initial measurement, such financial assets are subsequently measured at amortized cost using the effective interest rate (“EIR”) method, less impairment. Amortized cost is calculated by taking into account any discount or premium on acquisition and fees or costs that are an integral part of the EIR. The EIR amortization is included in profit or loss. The losses arising from impairment are recognized in profit or loss.
The Group’s cash and cash equivalents, trade and other accounts receivables, due from related parties, other current financial assets and other non-current financial assets are included in this category.
Cash and cash equivalents comprise cash on hand and in banks and all unrestricted time deposits (including deposit on call) with original maturities of three months or less at the time of placement.
Time deposits which are pledged as collateral for bank guarantees are not classified as part of “Cash and Cash Equivalents”. These are presented as part of either “Other Current Financial Assets” or “Other Non-current Financial Assets”.
| | • | | Held-to-maturity (HTM) investments |
Non-derivative financial assets with fixed or determinable payments and fixed maturities are classified as HTM when the Group has the positive intention and ability to hold them to maturity. After initial measurement, HTM investments are measured at amortized cost using the EIR method, less impairment. Amortized cost is calculated by taking into account any discount or premium on acquisition and fees or costs that are an integral part of the EIR. The EIR amortization is included in profit or loss. The losses arising from impairment are recognized in profit or loss.
The Group did not have any HTM investments during the years ended December 31, 2011, 2012 and 2013.
| | • | | Available-for-sale (AFS) financial assets |
AFS financial assets are non-derivative financial assets that are designated as available-for-sale or are not classified in any of the three preceding categories. After initial measurement, AFS financial assets are measured at fair value with unrealized gains or losses recognized in other comprehensive income until the investment is derecognized or determined to be impaired, at which time the cumulative gain or loss in other comprehensive income is recognized in profit or loss. Interest earned on AFS financial investments is reported as interest income using the EIR method.
The Group has the following investments classified as AFS:
| | - | Investments in shares of stock that do not have readily determinable fair value in which the equity interest is less than 20%. These are carried at cost less allowance for impairment. |
| | - | Investments in equity shares that have readily determinable fair value in which the equity interest is less than 20% and which are classified as available-for-sale, are recorded at fair value. |
F-38
PT INDOSAT Tbk AND ITS SUBSIDIARIES
NOTES TO CONSOLIDATED FINANCIAL STATEMENTS—(Continued)
as of January 1, 2012 (Restated), December 31, 2012 (Restated) and December 31, 2013
and for the Years ended December 31, 2011 (Restated), 2012 (Restated) and 2013
(Expressed in millions of rupiah and thousands of U.S. dollar, except share and tariff data)
f9. Financial liabilities
Initial recognition
Financial liabilities within the scope of IAS 39 are classified as financial liabilities at fair value through profit or loss, loans and borrowings, or as derivatives designated as hedging instruments in an effective hedge, as appropriate. The Group determines the classification of its financial liabilities at initial recognition.
All financial liabilities are recognized initially at fair value and, in the case of loans and borrowings, inclusive of directly attributable transaction costs.
The Group’s financial liabilities include trade accounts payables, procurement payable, accrued expenses, loans and bonds payable, deposits from customers, due to related parties, obligation under finance lease, derivative financial instruments and other current and non-current financial liabilities.
Subsequent measurement
The measurement of financial liabilities depends on their classification as follows:
| | • | | Financial liabilities at fair value through profit or loss |
Financial liabilities at fair value through profit or loss include financial liabilities held for trading and financial liabilities designated upon initial recognition as at fair value through profit or loss.
Financial liabilities are classified as held for trading if they are acquired for the purpose of selling or repurchase in the near term. This category includes derivative financial instruments entered into by the Company that are not designated as hedging instruments in hedge relationships as defined by IAS 39. Separated embedded derivatives are also classified as held for trading unless they are designated as effective hedging instruments.
Gains or losses on liabilities held for trading are recognized in profit or loss.
After initial recognition, interest-bearing loans and borrowings are subsequently measured at amortized cost using the EIR method. The EIR amortization is included in financing costs in profit or loss.
Gains and losses are recognized in profit or loss when the liabilities are derecognized, as well as through the EIR amortization process.
f10. Offsetting of financial instruments
Financial assets and financial liabilities are offset and the net amount is reported in the consolidated statements of financial position if, and only if, there is a currently enforceable legal right to offset the recognized amounts and there is an intention to settle on a net basis, or to realize the assets and settle the liabilities simultaneously.
f11. Fair value of financial instruments
The fair value of financial instruments that are traded in active markets at each reporting date is determined by reference to quoted market prices or dealer price quotations (bid price for long positions and ask price for short positions), without any deduction for transaction costs. For financial instruments where
F-39
PT INDOSAT Tbk AND ITS SUBSIDIARIES
NOTES TO CONSOLIDATED FINANCIAL STATEMENTS—(Continued)
as of January 1, 2012 (Restated), December 31, 2012 (Restated) and December 31, 2013
and for the Years ended December 31, 2011 (Restated), 2012 (Restated) and 2013
(Expressed in millions of rupiah and thousands of U.S. dollar, except share and tariff data)
there is no active market, fair value is determined using valuation techniques. Such techniques may include using recent arm’s length market transactions, reference to the current fair value of another instrument that is substantially the same, discounted cash flow analysis or other valuation models.
Credit risk adjustment
The Company adjusts the price in the most advantageous market to reflect any differences in counterparty credit risk between instruments traded in that market and the ones being valued for financial asset positions. In determining the fair value of financial liability positions, the Company’s own credit risk associated with the instrument is taken into account.
f12. Amortized cost of financial instruments
Amortized cost is computed using the EIR method less any allowance for impairment and principal repayment or reduction. The calculation takes into account any premium or discount on acquisition and includes transaction costs and fees that are an integral part of the EIR.
f13. Impairment of financial assets
The Group assesses at the end of each reporting period whether there is any objective evidence that a financial asset or a group of financial assets is impaired. A financial asset or a group of financial assets is deemed to be impaired if, and only if, there is objective evidence of impairment as a result of one or more events that have occurred after the initial recognition of the asset (an incurred ‘loss event’) and that loss event has an impact on the estimated future cash flows of the financial asset or the group of financial assets that can be reliably estimated. Evidence of impairment may include indications that the debtors or a group of debtors are experiencing significant financial difficulty, default or delinquency in interest or principal payments, the probability that they will enter bankruptcy or other financial reorganization and where observable data indicate that there is a measurable decrease in the estimated future cash flows, such as changes in arrears or economic conditions that correlate with defaults.
| | • | | Financial assets carried at amortized cost |
For loans and receivables carried at amortized cost, the Group first assesses whether objective evidence of impairment exists individually for financial assets that are individually significant, or collectively for financial assets that are not individually significant. If the Group determines that no objective evidence of impairment exists for an individually assessed financial asset, whether significant or not, it includes the asset in a group of financial assets with similar credit risk characteristics and collectively assesses them for impairment. Assets that are individually assessed for impairment and for which an impairment loss is, or continues to be, recognized are not included in a collective assessment of impairment.
If there is objective evidence that an impairment loss has occurred, the amount of the loss is measured as the difference between the asset’s carrying amount and the present value of estimated future cash flows (excluding future expected credit losses that have not yet been incurred). The present value of the estimated future cash flows is discounted at the financial asset’s original EIR. If a loan has a variable interest rate, the discount rate for measuring impairment loss is the current EIR.
F-40
PT INDOSAT Tbk AND ITS SUBSIDIARIES
NOTES TO CONSOLIDATED FINANCIAL STATEMENTS—(Continued)
as of January 1, 2012 (Restated), December 31, 2012 (Restated) and December 31, 2013
and for the Years ended December 31, 2011 (Restated), 2012 (Restated) and 2013
(Expressed in millions of rupiah and thousands of U.S. dollar, except share and tariff data)
The carrying amount of the asset is reduced through the use of an allowance account and the amount of the loss is recognized in profit or loss. Interest income continues to be accrued on the reduced carrying amount based on the rate of interest used to discount future cash flows for the purpose of measuring impairment loss. Loans and receivables, together with the associated allowance, are written off when there is no realistic prospect of future recovery and all collateral has been realized or has been transferred to the Group. If, in a subsequent year, the amount of the estimated impairment loss increases or decreases because of an event occurring after the impairment was recognized, the previously recognized impairment loss is increased or reduced by adjusting the allowance account. If a future write-off is later recovered, the recovery is recognized in profit or loss.
In the case of equity investment classified as an AFS financial asset, objective evidence would include a significant or prolonged decline in the fair value of the investment below its cost.
Where there is objective evidence of impairment, the cumulative loss—measured as the difference between the acquisition cost and the current fair value, less any impairment loss on that investment previously recognized in profit or loss—is recycled from other comprehensive income to profit or loss. Impairment losses on equity investments are not reversed through profit or loss; increases in their fair value after impairment are recognized directly in other comprehensive income.
In the case of debt instruments classified as available-for-sale, impairment is assessed based on the same criteria as financial assets carried at amortized cost. Future interest income is based on the reduced carrying amount and is accrued based on the rate of interest used to discount future cash flows for the purpose of measuring impairment loss. Such accrual is recorded as part of “Interest income” account in profit or loss. If, in a subsequent year, the fair value of a debt instrument increases and the increase can be objectively related to an event occurring after the impairment loss was recognized in profit or loss, the impairment loss is reversed through profit or loss.
f14. Derecognition of financial assets and liabilities
Financial assets
A financial asset (or where applicable, a part of a financial asset or part of a group of similar financial assets) is derecognized when: (1) the rights to receive cash flows from the asset have expired; or (2) the Group has transferred its rights to receive cash flows from the asset or has assumed an obligation to pay the received cash flows in full without material delay to a third party under a “pass-through” arrangement; and either (a) the Group has transferred substantially all the risks and rewards of the asset, or (b) the Group has neither transferred nor retained substantially all the risks and rewards of the asset, but has transferred control of the asset.
Financial liabilities
A financial liability is derecognized when the obligation under the liability is discharged or cancelled or has expired.
F-41
PT INDOSAT Tbk AND ITS SUBSIDIARIES
NOTES TO CONSOLIDATED FINANCIAL STATEMENTS—(Continued)
as of January 1, 2012 (Restated), December 31, 2012 (Restated) and December 31, 2013
and for the Years ended December 31, 2011 (Restated), 2012 (Restated) and 2013
(Expressed in millions of rupiah and thousands of U.S. dollar, except share and tariff data)
When an existing financial liability is replaced by another from the same lender on substantially different terms, or the terms of an existing liability are substantially modified, such an exchange or modification is treated as a derecognition of the original liability and the recognition of a new liability, and the difference in the respective carrying amounts is recognized in profit or loss.
f15. Derivative financial instruments
The Company enters into and engages in cross currency swap, interest rate swap, currency forward and other permitted instruments, if considered necessary, for the purpose of managing its foreign exchange and interest rate exposures emanating from the Company’s loans and bonds payable in foreign currencies. These derivative financial instruments, while providing effective economic hedges of specific interest rate and foreign exchange risks under the Company’s financial risk management objectives and policies, do not meet the criteria for hedge accounting as provided in IAS 39 and are initially recognized at fair value on the date the derivative contract is entered into and are subsequently re-measured at fair value. Derivatives are carried as assets when their fair value is positive and as liabilities when their fair value is negative.
Any gains or losses arising from changes in fair value of derivatives during the year, which are entered into as economic hedges that do not qualify for hedge accounting, are taken directly to profit or loss.
Derivative assets and liabilities are presented under current assets and liabilities, respectively. Embedded derivatives are presented with the host contract in the consolidated statements of financial position which represents an appropriate presentation of overall future cash flows for the instrument taken as a whole.
The net changes in fair value of derivative instruments, swap cost or income, termination cost or income, and settlement of derivative instruments are credited (charged) to “Gain (Loss) on Change in Fair Value of Derivatives—Net,” which is presented in the consolidated statements of comprehensive income.
f16. Property and equipment
Property and equipment are stated at cost (which includes certain capitalized borrowing costs incurred during the construction phase), less accumulated depreciation, amortization and impairment in value. Depreciation and amortization of property and equipment is computed using the straight-line method based on the estimated useful lives of the assets.
Property and equipment acquired in exchange for a non-monetary asset or for a combination of monetary and non-monetary assets are measured at fair values unless:
| | (i) | the exchange transaction lacks commercial substance, or |
| | (ii) | the fair value of neither the assets received nor the assets given up can be measured reliably. |
The acquired assets are measured this way even if the Group cannot immediately derecognize the assets given up. If the acquired assets cannot be reliably measured at fair value, their value is measured at the carrying amount of the assets given up plus cash consideration.
An item of property and equipment is derecognized upon disposal or when no future economic benefits are expected from its use or disposal. Any gain or loss arising on derecognition of the asset (calculated as the difference between the net disposal proceeds and the carrying amount of the asset) is included in profit or loss when the asset is derecognized.
F-42
PT INDOSAT Tbk AND ITS SUBSIDIARIES
NOTES TO CONSOLIDATED FINANCIAL STATEMENTS—(Continued)
as of January 1, 2012 (Restated), December 31, 2012 (Restated) and December 31, 2013
and for the Years ended December 31, 2011 (Restated), 2012 (Restated) and 2013
(Expressed in millions of rupiah and thousands of U.S. dollar, except share and tariff data)
The estimated useful lives of the assets are as follows:
| | | | |
| | | Years | |
Land rights | | | 50 | |
Exchange and network assets | | | 3 to 15 | |
Subscribers’ apparatus and other equipment | | | 3 to 5 | |
Buildings and building & leasehold improvements | | | 40 and 3 to 25 | |
Personnel costs which are directly related to the development, construction and installation of property and equipment are capitalized as part of the cost of such assets.
The cost of maintenance and repairs is charged to income as incurred. Significant renewals and betterments which enhance the asset’s condition on its initial performance are capitalized. When properties are retired or otherwise disposed of, their costs and the related accumulated depreciation are derecognized from the accounts, and any resulting gains or losses are recognized in profit or loss for the year.
Properties under construction and installation are stated at cost. Cost includes cost of construction, equipment, capitalizable borrowing costs and other direct costs. Property under construction is not depreciated until such time that the relevant asset is completed and available for its intended use.
The residual values, useful lives and methods of depreciation and amortization of property and equipment are reviewed and adjusted prospectively, if appropriate, at each financial year end.
f17. Borrowing costs
Borrowing costs are capitalized if they are directly attributable to the acquisition, construction or production of an asset that necessarily takes a substantial period of time to get ready for its intended use. Capitalization of borrowing costs commences when the activities necessary to prepare the asset for its intended use are in progress and expenditures and borrowing costs are being incurred. Borrowing costs include interest charges and other costs incurred in connection with the borrowing of funds, as well as exchange differences arising from foreign currency borrowings used to finance these projects, to the extent that they are regarded as an adjustment to interest costs (estimated quarterly by capping the exchange differences taken as borrowing costs at the amount of borrowing costs on the functional currency equivalent borrowings).
f18. Decommissioning liabilities
The Group is legally required under various lease agreements to dismantle installations in leased sites and restore such sites to their original condition at the end of the lease contract term.
The amount of asset retirement obligations is accreted, and such accretion is recognized as interest expense.
f19. Leases
The determination of whether an arrangement is, or contains, a lease is based on the substance of the arrangement at the inception date. The arrangement is assessed for whether fulfillment of the arrangement is dependent on the use of a specific asset or assets or the arrangement conveys a right to use the asset or assets, even if that right is not explicitly specified in an arrangement.
F-43
PT INDOSAT Tbk AND ITS SUBSIDIARIES
NOTES TO CONSOLIDATED FINANCIAL STATEMENTS—(Continued)
as of January 1, 2012 (Restated), December 31, 2012 (Restated) and December 31, 2013
and for the Years ended December 31, 2011 (Restated), 2012 (Restated) and 2013
(Expressed in millions of rupiah and thousands of U.S. dollar, except share and tariff data)
Group as a lessee
A finance lease that transfers to the Group substantially all the risks and benefits incidental to ownership of the leased item, is capitalized at the commencement of the lease at the fair value of the leased property or, if lower, at the present value of the minimum lease payments. Lease payments are apportioned between finance charges and reduction of the lease liability so as to achieve a constant rate of interest on the remaining balance of the liability. Finance charges are recognized in financing cost in profit or loss.
A leased asset is depreciated over the useful life of the asset. However, if there is no reasonable certainty that the Group will obtain ownership by the end of the lease term, the asset is depreciated over the shorter of the estimated useful life of the asset and the lease term.
The current portion of obligations under finance lease is presented as part of Other Current Financial Liabilities.
Operating lease payments are recognized as an operating expense in profit or loss on a straight-line basis over the lease term.
Group as a lessor
A lease in which the Group does not transfer substantially all the risks and benefits of the ownership of an asset is classified as an operating lease. Initial direct costs incurred in negotiating an operating lease are added to the carrying amount of the leased asset and recognized over the lease term on the same basis as rental income. Contingent rents are recognized as revenue in the period in which they are earned.
A lease in which the Group transfers substantially all the risks and benefits of the ownership of an asset is classified as a finance lease. Leased asset is recognized as asset held under a finance lease in the consolidated statements of financial position and presented as a receivable at an amount equal to the net investment in the lease. Selling profit or loss is recognized in the period, in accordance with the policy followed by the Group for outright sales. Costs incurred by the Group in connection with negotiating and arranging a lease are recognized as an expense when the selling profit is recognized.
Sale-and-leaseback transactions
When the Group enters into a sale-and-leaseback transaction, the Group analyzes if the leaseback arrangement meets the criteria of a finance lease or operating lease. Where the classification results in a finance lease, any excess of sales proceeds over the carrying value of the asset sold is deferred and amortized over the lease term. Where the transaction is classified as an operating lease and it is clear that the transaction is established at fair value, any profit or loss is recognized immediately.
f20. Inventories
Inventories, which mainly consist of SIM cards, broadband modems, starter packs, cellular handsets and pulse reload vouchers, are valued at the lower of cost or net realizable value. Cost is determined using the weighted-average method. Net realizable value is the estimated selling price in the ordinary course of business less the estimated costs necessary to make the sale.
F-44
PT INDOSAT Tbk AND ITS SUBSIDIARIES
NOTES TO CONSOLIDATED FINANCIAL STATEMENTS—(Continued)
as of January 1, 2012 (Restated), December 31, 2012 (Restated) and December 31, 2013
and for the Years ended December 31, 2011 (Restated), 2012 (Restated) and 2013
(Expressed in millions of rupiah and thousands of U.S. dollar, except share and tariff data)
f21. Prepaid frequency fee and licenses and other prepaid expenses
Prepaid frequency fee and licenses and other prepaid expenses, which mainly consist of rentals, insurance and advertising, are expensed as the related asset is utilized. The non-current portions of prepaid rentals and upfront fee of 3G and BWA licenses are shown as part of “Long-term Prepaid Rentals—Net of Current Portion” and “Long-term Prepaid Licenses—Net of Current Portion”, respectively.
f22. Impairment of non-financial assets
Property and equipment
The Group assesses, at each reporting date, whether there is an indication that an asset may be impaired. If any such indication exists or when annual impairment testing for an asset is required, the Group estimates the asset’s recoverable amount. An asset’s recoverable amount is the higher of such asset’s or cash-generating unit’s fair value less costs to sell and its value in use and is determined for an individual asset, unless the asset does not generate cash inflows that are largely independent from those of other assets or groups of assets. When the carrying amount of an asset or cash-generating unit exceeds its recoverable amount, the asset is considered impaired and is written down to its recoverable amount. In assessing the value in use, the estimated future cash flows are discounted to their present value using a pre-tax discount rate that reflects current market assessments of the time value of money and the risks specific to the asset. In determining the fair value less costs to sell, recent market transactions are taken into account, if available. If no such transactions can be identified, an appropriate valuation model is used. These calculations are corroborated by valuation multiples, quoted share prices for publicly traded subsidiaries or other available fair value indicators. Impairment losses of continuing operations are recognized in profit or loss.
For assets, excluding goodwill, an assessment is made at each reporting date as to whether there is any indication that previously recognized impairment losses may no longer exist or may have decreased. If such indication exists, the Group estimates the asset’s or cash-generating unit’s recoverable amount. A previously recognized impairment loss is reversed only if there has been a change in the assumptions used to determine the asset’s recoverable amount since the last impairment loss was recognized. The reversal is limited so that the carrying amount of the asset does not exceed its recoverable amount, nor exceeds the carrying amount that would have been determined, net of depreciation, had no impairment loss been recognized for the asset in prior years. Such reversal is recognized in profit or loss.
The following assets have specific characteristics for impairment testing:
Goodwill and other intangible assets
Goodwill is tested for impairment annually as at December 31 and when circumstances indicate that the carrying value may be impaired. Impairment is determined for goodwill by assessing the recoverable amount of each cash-generating unit (or group of cash-generating units) to which the goodwill relates. When the recoverable amount of the cash-generating unit is less than its carrying amount, an impairment loss is recognized. Impairment losses relating to goodwill cannot be reversed in future periods.
Intangible assets with indefinite useful lives are tested for impairment annually either individually or at the cash-generating unit level, as appropriate, and when circumstances indicate that the carrying value may be impaired.
F-45
PT INDOSAT Tbk AND ITS SUBSIDIARIES
NOTES TO CONSOLIDATED FINANCIAL STATEMENTS—(Continued)
as of January 1, 2012 (Restated), December 31, 2012 (Restated) and December 31, 2013
and for the Years ended December 31, 2011 (Restated), 2012 (Restated) and 2013
(Expressed in millions of rupiah and thousands of U.S. dollar, except share and tariff data)
f23. Provision
Provision is recognized when the Group has a present obligation (legal or constructive) as a result of a past event, it is probable that an outflow of resources embodying economic benefits will be required to settle the obligation, and a reliable estimate can be made of the amount of the obligation. When the Group expects some or the whole provision to be reimbursed, for example under an insurance contract, the reimbursement is recognized as a separate asset but only when the reimbursement is virtually certain. The expense relating to any provision is recognized in profit or loss net of any reimbursement.
f24. Operating segment
An operating segment is a component of entity that engages in business activities from which it may earn revenues and incur expenses (including revenues and expenses relating to transactions with other components of the same entity), whose operating results are reviewed regularly by the entity’s chief operating decision maker (Board of Directors) to make decisions about resources to be allocated to the segment and to assess its performance and for which discrete financial information is available.
f25. Basic and diluted earnings (loss) per share / ADS
Basic earnings (loss) per share is computed by dividing profit (loss) for the year attributable to ordinary owners of the Company by the weighted-average number of ordinary shares outstanding during the year (Note 32).
Basic earnings (loss) per ADS attributable to owners of the Company is computed by multiplying basic earnings (loss) per share attributable to owners of the Company by 50, which is equal to the number of shares per ADS.
Diluted earnings (loss) per share is computed by dividing profit (loss) for the year attributable to ordinary owners of the Company (after adjusting for the profit or loss effect related to dilutive potential ordinary shares) by the weighted average number of ordinary shares outstanding during the year plus the weighted average number of ordinary shares that would be issued on conversion of all potentially dilutive ordinary shares.
f26. Concession financial assets
The Group constructs or upgrades infrastructure (construction or upgrade services) used to provide public service and operates and maintains that infrastructure (operation services) for a specified period of time. These arrangements may include infrastructure used in a public-to-private service concession arrangement for its entire useful life.
These arrangements are accounted for based on the nature of the consideration and using the financial asset model as the Group has an unconditional contractual right to receive cash or another financial asset from or at the direction of, the grantor for the construction services.
In the financial asset model, the amount due from the grantor meets the definition of a receivable which is measured at fair value. It is subsequently measured at amortized cost. The amount initially recognized plus the cumulative interest on that amount is calculated using the effective interest method.
The consideration received or receivable is allocated by reference to the relative fair values of the services provided, typically a construction component and a service element for operating and maintenance
F-46
PT INDOSAT Tbk AND ITS SUBSIDIARIES
NOTES TO CONSOLIDATED FINANCIAL STATEMENTS—(Continued)
as of January 1, 2012 (Restated), December 31, 2012 (Restated) and December 31, 2013
and for the Years ended December 31, 2011 (Restated), 2012 (Restated) and 2013
(Expressed in millions of rupiah and thousands of U.S. dollar, except share and tariff data)
services performed. Revenue from the concession arrangements earned under the financial asset model consists of the (i) fair value of the amount due from the grantor, and (ii) interest income related to the capital investment in the project.
Any asset carried under concession arrangements is derecognized on disposal or when no future economic benefits are expected from its future use or disposal or when the contractual rights to the financial asset expire.
3. MANAGEMENT’S USE OF JUDGMENTS, ESTIMATES AND ASSUMPTIONS
The preparation of the Group’s consolidated financial statements requires management to make judgments, estimates and assumptions that affect the reported amounts of revenues, expenses, assets and liabilities, and the disclosure of contingent liabilities, at the end of the reporting period. However, uncertainty about these assumptions and estimates could result in outcomes that require a material adjustment to the carrying amount of the asset or liability affected in future years.
a. Judgments
In the process of applying the Group’s accounting policies, management has made the following judgments, apart from those including estimations and assumptions, which have the most significant effect on the amounts recognized in the consolidated financial statements:
| | • | | Determination of functional currency |
The functional currencies of the entities under the Company are the currency of the primary economic environment in which each entity operates. It is the currency that mainly influences the revenue and cost of rendering services.
The Group has various lease agreements whereas the Group acts as lessor or lessee in respect of certain property and equipment. The Group evaluates whether significant risks and rewards of ownership of the leased assets are transferred based on IAS 17, “Leases”, which requires the Group to make judgments and estimates of transfer of risks and rewards related to the ownership of the assets.
Tower leases
For tower leases, the unit of account is considered at the level of the slot or site space because the lease is dependent on the use of this specific space in the tower where the Company places its equipment.
Licenses
In 2006, the Company was granted a license to use 2.1 GHz radio frequency spectrum by the Ministry of Communications and Information Technology (“MOCIT”). The Company was obliged to pay an upfront fee and annual radio frequency fee for 10 years (Note 34p). The upfront fee is recorded as part of Long-term Prepaid Licenses for the non-current portion and Prepaid Expenses for the current portion, and amortized over the 10-year license term using the straight-line method.
F-47
PT INDOSAT Tbk AND ITS SUBSIDIARIES
NOTES TO CONSOLIDATED FINANCIAL STATEMENTS—(Continued)
as of January 1, 2012 (Restated), December 31, 2012 (Restated) and December 31, 2013
and for the Years ended December 31, 2011 (Restated), 2012 (Restated) and 2013
(Expressed in millions of rupiah and thousands of U.S. dollar, except share and tariff data)
In 2009, the Company obtained an additional 3G license, and IMM was granted an operating license for “Packet Switched” local telecommunications network using 2.3 GHz radio frequency spectrum of Broadband Wireless Access (“BWA”). The Company and IMM were obliged to pay an upfront fee and annual radio frequency fee for 10 years (Note 34p). The upfront fee is recorded as part of Long-term Prepaid Licenses for the non-current portion and Prepaid Expenses for the current portion, and amortized over the 10-year license term using the straight-line method.
Management believes, as supported by written confirmation from the Directorate General of Post and Telecommunications (“DGPT”),that the 3G and BWA licenses may be returned at any time without any financial obligation to pay the remaining outstanding annual radio frequency fees (i.e., the license arrangement does not transfer substantially all the risks and rewards incidental to ownership). Accordingly, the Company and IMM recognize the prepaid annual radio frequency fee as operating lease expense, amortized using the straight-line method over the term of the rights to operate the 3G and BWA licenses. Management evaluates its plan to continue to use the licenses on an annual basis.
| | • | | Impairment of non-financial assets |
An impairment exists when the carrying value of an asset or cash-generating unit exceeds its recoverable amount, which is the higher of its fair value less costs to sell and its value in use. The calculation of the fair value less costs to sell is based on available data from binding sales transactions in arm’s length transactions of similar assets or observable market prices less incremental costs for disposing of the assets. The value in use calculation is based on a discounted cash flow model. The cash flows are derived from the budget for the next five years and do not include restructuring activities that the Group is not yet committed to or significant future investments that will enhance the performance of the CGU being tested. The recoverable amount is most sensitive to the discount rate used for the discounted cash flow model as well as the expected future cash-inflows and the growth rate used for extrapolation purposes.
| | • | | Exchange of asset transactions |
During 2010—2012, the Group entered into several contracts with third party suppliers for the exchange of new assets for existing cellular technical equipment of the Group. For such transactions, the Group evaluates whether the transaction has commercial substance based on IAS 16, “Property, Plant and Equipment”, which requires the Group to make judgments about the configuration of the future cash flows. Management considered the exchange of assets transactions to have met the criteria of commercial substance; however, the fair values of neither the assets received nor the assets given up could be measured reliably, hence, the new assets were measured at the carrying amounts of the assets given up plus any cash consideration paid.
| | • | | Sale-and-leaseback transactions |
The Group classifies leases into finance leases or operating leases in accordance with the accounting policies stated in Note 2f19. Determining whether a lease transaction is a finance lease or an operating lease is a complex issue and requires substantial judgment as to whether the lease agreement transfers substantially all the risks and rewards of ownership to or from the Group. Careful and considered judgment is required on various complex aspects that include, but are not limited to, the fair value of the leased asset, the economic life of the leased asset, whether renewal options are included in the lease term and determining an appropriate discount rate to calculate the present value of the minimum lease payments.
F-48
PT INDOSAT Tbk AND ITS SUBSIDIARIES
NOTES TO CONSOLIDATED FINANCIAL STATEMENTS—(Continued)
as of January 1, 2012 (Restated), December 31, 2012 (Restated) and December 31, 2013
and for the Years ended December 31, 2011 (Restated), 2012 (Restated) and 2013
(Expressed in millions of rupiah and thousands of U.S. dollar, except share and tariff data)
Classification as a finance lease or operating lease determines whether or not the leased asset is capitalized and recognized in the consolidated statements of financial position. In sale-and-leaseback transactions, the classification of the leaseback arrangements as described above determines how the gain or loss on the sale transaction is recognized. It is either deferred and amortized (finance lease) or recognized in the consolidated statements of comprehensive income immediately (operating lease).
| | • | | Provision for legal contingency |
IMM is currently under investigation by the Attorney General’s Office for being involved in a significant legal case (Note 34i). Management’s judgment of the probable cost for the resolution of the case has been developed in consultation with the Company’s counsel handling the defense in this matter and is based upon their analysis of potential outcomes. Management currently does not believe this case could materially reduce the Company’s revenues and profitability. It is possible, however, that future financial performance could be materially affected by changes in their judgment or effectiveness of their strategy relating to the case. See Note 34i—Significant Agreements, Commitments and Contingency.
| | • | | Allowance for impairment of receivables |
If there is objective evidence that an impairment loss has been incurred on trade receivables, the Group will recognizes an allowance for impairment loss related to the trade receivables that are specifically identified as doubtful for collection.
In addition to specific allowance against individually significant receivables, the Group also recognizes a collective impairment allowance against credit exposure of its receivables which are grouped based on common credit characteristics, which, although not specifically identified as requiring a specific allowance, have a greater risk of default than when the receivables were originally granted to customers.
b. Estimates and Assumptions
The key assumptions concerning the future and other key sources of estimation uncertainty at the end of the reporting period that have a significant risk of causing a material adjustment to the carrying amounts of assets and liabilities within the next financial year are discussed below:
| | • | | Determination of fair values of financial assets and financial liabilities |
Where the fair value of financial assets and financial liabilities recorded in the consolidated statements of financial position cannot be derived from active markets, their fair value is determined using valuation techniques including the discounted cash flow model. The inputs to these models are taken from observable markets where possible, but where this is not feasible, a degree of judgment is required in establishing fair values. The judgments include considerations of inputs such as liquidity risk, credit risk and volatility. Changes in assumptions about these factors could affect the reported fair value of the financial instruments. See Note 21 for further discussion.
| | • | | Estimating useful lives of property and equipment and intangible assets |
The Group estimates the useful lives of its property and equipment and intangible assets based on expected asset utilization as anchored on business plans and strategies that also consider expected
F-49
PT INDOSAT Tbk AND ITS SUBSIDIARIES
NOTES TO CONSOLIDATED FINANCIAL STATEMENTS—(Continued)
as of January 1, 2012 (Restated), December 31, 2012 (Restated) and December 31, 2013
and for the Years ended December 31, 2011 (Restated), 2012 (Restated) and 2013
(Expressed in millions of rupiah and thousands of U.S. dollar, except share and tariff data)
future technological developments and market behavior. The estimation of the useful lives of property and equipment is based on the Group’s collective assessment of industry practice, internal technical evaluation and experience with similar assets. The estimated useful lives are reviewed annually and are updated if expectations differ from previous estimates due to physical wear and tear, technical or commercial obsolescence and legal or other limitations on the use of the assets. It is possible, however, that future results of operations could be materially affected by changes in the estimates brought about by changes in the factors mentioned above.
The amounts and timing of recorded expenses for any year will be affected by changes in these factors and circumstances. A reduction in the estimated useful lives of the Group’s property and equipment will increase the recorded operating expenses and decrease non-current assets. An extension in the estimated useful lives of the Group’s property and equipment will decrease the recorded expenses and increase non-current assets.
| | • | | Goodwill and intangible assets |
The consolidated financial statements reflect acquired businesses after the completion of the respective acquisitions. The Company accounts for the acquired businesses using the acquisition method which requires extensive use of accounting estimates and judgments to determine the fair market values of the acquiree’s identifiable assets and liabilities at the acquisition date. Any excess in the purchase price over the fair market values of the net assets acquired is recorded as goodwill in the consolidated statements of financial position. Thus, the numerous judgments made in estimating the fair market value of the acquiree’s assets and liabilities can materially affect the Company’s financial performance.
| | • | | Recoverability of deferred income tax assets |
The Group reviews the carrying amounts of deferred income tax assets at the end of each reporting period and reduces these to the extent that it is no longer probable that sufficient taxable income will be available to allow all or part of the deferred income tax assets to be utilized. The Group’s assessment on the recognition of deferred income tax assets on deductible temporary differences is based on the level and timing of forecasted taxable income in subsequent reporting periods. This forecast is based on the Group’s past results and future expectations of revenues and expenses as well as future tax planning strategies. However, there is no assurance that sufficient taxable income will be generated to allow all or part of deferred income tax assets to be utilized.
| | • | | Estimating allowance for impairment of receivables |
The level of a specific allowance is evaluated by management on the basis of factors that affect the collectability of receivables. In these cases, the Group uses judgment based on the best available facts and circumstances, including but not limited to, the length of the Group’s relationship with the customers and the customers’ credit status based on third-party credit reports and known market factors, to record specific reserves for customers against amounts due in order to reduce the Group’s receivables to amounts that it expects to collect. These specific reserves are re-evaluated and adjusted as additional information received affects the amounts estimated.
Any collective allowance recognized is based on historical loss experience using various factors such as historical performance of the debtors within the collective group and judgments on the effect of deterioration in the markets in which the debtors operate and identified structural weaknesses or deterioration in the cash flows of debtors.
F-50
PT INDOSAT Tbk AND ITS SUBSIDIARIES
NOTES TO CONSOLIDATED FINANCIAL STATEMENTS—(Continued)
as of January 1, 2012 (Restated), December 31, 2012 (Restated) and December 31, 2013
and for the Years ended December 31, 2011 (Restated), 2012 (Restated) and 2013
(Expressed in millions of rupiah and thousands of U.S. dollar, except share and tariff data)
| | • | | Estimation of pension cost and other employee benefits |
The cost of defined benefit plan and present value of the pension obligation are determined using the projected-unit-credit method. Actuarial valuation includes making various assumptions which consist of, among other things, discount rates, rates of compensation increases and mortality rates. Due to complexity of valuation and its long-term nature, a defined benefit obligation is highly sensitive to changes in assumptions.
While the Group believes that its assumptions are reasonable and appropriate, significant differences in the Group’s actual experience or significant changes in its assumptions may materially affect the costs and obligations of pension and other long-term employee benefits. All assumptions are reviewed annually at each reporting date.
Further details about the assumptions used, including a sensitivity analysis, are given in Note 30.
| | • | | Asset retirement obligations |
Asset retirement obligations are recognized in the year in which they are incurred if a reasonable estimate of the provision can be made. The recognition of the obligations requires an estimation of the cost to restore / dismantle on a per location basis and is based on the best estimate of the expenditure required to settle the obligation at the future restoration/dismantlement date, discounted using a pre-tax rate that reflects the current market assessment of the time value of money and, where appropriate, the risk specific to the liability.
The Company’s revenue recognition policies require the use of estimates and assumptions that may affect the reported amounts of revenues and receivables.
The Company’s agreements with domestic and foreign carriers for inbound and outbound traffic subject to settlements require traffic reconciliations before actual settlement is done, which may not be the actual volume of traffic as measured by the Company. Initial recognition of revenues is based on observed traffic adjusted by normal experience adjustments, which historically are not material to the consolidated statements of comprehensive income.
Differences between the amounts initially recognized and the actual settlements are recorded upon reconciliation. However, there is no assurance that the use of such estimates will not result in material adjustments in future periods.
The Group recognizes revenues from installation and activation related fees and the corresponding costs over the expected average periods of customer relationship for cellular, MIDI and fixed telecommunication services. The Group estimates the expected average period of customer relationship based on the most recent churn-rate analysis.
| | • | | Uncertain tax exposures |
In certain circumstances, the Group may not be able to determine the exact amount of its current or future tax liabilities or recoverable amount of the claim for tax refund due to ongoing investigations by, or negotiations with, the taxation authority. Uncertainties exist with respect to the interpretation of complex tax regulations and the amount and timing of future taxable income. In determining the amount to be recognized in respect of an uncertain tax liability or the recoverable amount of the claim for tax refund related to uncertain tax positions, the Group
F-51
PT INDOSAT Tbk AND ITS SUBSIDIARIES
NOTES TO CONSOLIDATED FINANCIAL STATEMENTS—(Continued)
as of January 1, 2012 (Restated), December 31, 2012 (Restated) and December 31, 2013
and for the Years ended December 31, 2011 (Restated), 2012 (Restated) and 2013
(Expressed in millions of rupiah and thousands of U.S. dollar, except share and tariff data)
applies similar considerations as they would use in determining the amount of a provision to be recognized in accordance with IAS 37Provisions, Contingent Liabilities and Contingent Assets. The Group makes an analysis of all uncertain tax positions to determine if a tax liability or a provision for unrecoverable claim for tax refund should be recognized.
The Group presents interest and penalties for the underpayment of income tax, if any, in Income Tax Benefit (Expense) in profit or loss.
4. CASH AND CASH EQUIVALENTS
This account consists of the following:
| | | | | | | | | | | | |
| | | | | | December 31, | |
| | | January 1, 2012 | | | 2012 | | | 2013 | |
Cash on hand (including US$13 on January 1, 2012, nil on December 31, 2012 and US$4 on December 31, 2013) | | | 1,580 | | | | 1,837 | | | | 2,091 | |
| | | |
Cash in banks | | | | | | | | | | | | |
Related parties (Note 31) (including US$3,805 on January 1, 2012, US$2,754 on December 31, 2012 and US$4,732 on December 31, 2013) | | | 93,880 | | | | 115,707 | | | | 144,030 | |
Third parties (including US$13,506 on January 1, 2012, US$10,332 on December 31, 2012 and US$14,661 on December 31, 2013) | | | 209,519 | | | | 306,225 | | | | 218,208 | |
| | | | | | | | | | | | |
| | | 304,979 | | | | 423,769 | | | | 364,329 | |
| | | | | | | | | | | | |
| | | |
Time deposits and deposits on call | | | | | | | | | | | | |
Related parties (Note 31) (including US$11,115 on January 1, 2012, US$72,701 on December 31, 2012 and US$9,551 on December 31, 2013) | | | 884,080 | | | | 1,418,361 | | | | 734,929 | |
Third parties (including US$24,917 on January 1, 2012, US$163,492 on December 31, 2012 and US$54,539on December 31, 2013) | | | 1,035,147 | | | | 2,075,106 | | | | 1,134,274 | |
| | | | | | | | | | | | |
| | | 1,919,227 | | | | 3,493,467 | | | | 1,869,203 | |
| | | | | | | | | | | | |
Total | | | 2,224,206 | | | | 3,917,236 | | | | 2,233,532 | |
| | | | | | | | | | | | |
Time deposits and deposits on call denominated in rupiah earned interest at annual rates ranging from 2.50% to 9.75% in 2011, from 2.00% to 9.50% in 2012 and from 2.00% to 11.00% in 2013, while those denominated in U.S. dollars earned interest at annual rates ranging from 0.01% to 2.75% in 2011, from 0.01% to 3.00% in 2012 and from 0.03% to 3.50% in 2013.
The interest rates on deposits on call and time deposits with related parties are comparable to those offered by third parties.
F-52
PT INDOSAT Tbk AND ITS SUBSIDIARIES
NOTES TO CONSOLIDATED FINANCIAL STATEMENTS—(Continued)
as of January 1, 2012 (Restated), December 31, 2012 (Restated) and December 31, 2013
and for the Years ended December 31, 2011 (Restated), 2012 (Restated) and 2013
(Expressed in millions of rupiah and thousands of U.S. dollar, except share and tariff data)
5. ACCOUNTS RECEIVABLE—TRADE
This account consists of the following:
| | | | | | | | | | | | |
| | | | | | December 31, | |
| | | January 1, 2012 | | | 2012 | | | 2013 | |
Related parties (Note 31) | | | | | | | | | | | | |
PT Telekomunikasi Indonesia Tbk (“Telkom”) (including US$51 on January 1, 2012, US$436 on December 31, 2012 and US$70 on December 31, 2013) | | | 19,977 | | | | 73,835 | | | | 99,971 | |
Others (including US$8,085 on January 1, 2012, US$7,318 on December 31, 2012 and US$6,752 on December 31, 2013) | | | 345,373 | | | | 543,447 | | | | 556,548 | |
| | | | | | | | | | | | |
Sub-total | | | 365,350 | | | | 617,282 | | | | 656,519 | |
Less allowance for impairment | | | 47,107 | | | | 42,632 | | | | 24,316 | |
| | | | | | | | | | | | |
Net | | | 318,243 | | | | 574,650 | | | | 632,203 | |
| | | | | | | | | | | | |
Third parties | | | | | | | | | | | | |
Local companies (including US$16,593 on January 1, 2012, US$24,583 on December 31, 2012 and US$34,143 on December 31, 2013) | | | 791,178 | | | | 902,013 | | | | 801,108 | |
Overseas international carriers (US$66,532 on January 1, 2012, US$79,275 on December 31, 2012 and US$76,513 on December 31, 2013) | | | 603,309 | | | | 766,070 | | | | 932,619 | |
Post-paid subscribers from: | | | | | | | | | | | | |
Cellular | | | 254,565 | | | | 297,721 | | | | 333,783 | |
Fixed telecommunication | | | 22,345 | | | | 20,263 | | | | 65,716 | |
| | | | | | | | | | | | |
Sub-total | | | 1,671,397 | | | | 1,986,067 | | | | 2,133,226 | |
Less allowance for impairment | | | 489,544 | | | | 521,998 | | | | 497,090 | |
| | | | | | | | | | | | |
Net | | | 1,181,853 | | | | 1,464,069 | | | | 1,636,136 | |
| | | | | | | | | | | | |
Total | | | 1,500,096 | | | | 2,038,719 | | | | 2,268,339 | |
| | | | | | | | | | | | |
F-53
PT INDOSAT Tbk AND ITS SUBSIDIARIES
NOTES TO CONSOLIDATED FINANCIAL STATEMENTS—(Continued)
as of January 1, 2012 (Restated), December 31, 2012 (Restated) and December 31, 2013
and for the Years ended December 31, 2011 (Restated), 2012 (Restated) and 2013
(Expressed in millions of rupiah and thousands of U.S. dollar, except share and tariff data)
The aging schedule of the accounts receivable—trade is as follows:
| | | | | | | | | | | | | | | | | | | | | | | | |
| | | January 1, 2012 | | | December 31, 2012 | | | December 31, 2013 | |
Number of Months Outstanding | | Amount | | | Percentage
(%) | | | Amount | | | Percentage
(%) | | | Amount | | | Percentage
(%) | |
Related parties | | | | | | | | | | | | | | | | | | | | | | | | |
0 - 6 months | | | 257,348 | | | | 70.44 | | | | 477,272 | | | | 77.32 | | | | 611,654 | | | | 93.17 | |
7 - 12 months | | | 35,252 | | | | 9.65 | | | | 52,246 | | | | 8.46 | | | | 13,070 | | | | 1.99 | |
13 - 24 months | | | 64,498 | | | | 17.65 | | | | 30,390 | | | | 4.92 | | | | 8,967 | | | | 1.36 | |
Over 24 months | | | 8,252 | | | | 2.26 | | | | 57,374 | | | | 9.30 | | | | 22,828 | | | | 3.48 | |
| | | | | | | | | | | | | | | | | | | | | | | | |
Total | | | 365,350 | | | | 100.00 | | | | 617,282 | | | | 100.00 | | | | 656,519 | | | | 100.00 | |
| | | | | | | | | | | | | | | | | | | | | | | | |
Third parties | | | | | | | | | | | | | | | | | | | | | | | | |
0 - 6 months | | | 945,410 | | | | 56.56 | | | | 1,036,438 | | | | 52.19 | | | | 1,296,795 | | | | 60.79 | |
7 - 12 months | | | 208,218 | | | | 12.46 | | | | 235,844 | | | | 11.87 | | | | 80,735 | | | | 3.79 | |
13 - 24 months | | | 255,648 | | | | 15.30 | | | | 259,715 | | | | 13.08 | | | | 270,766 | | | | 12.69 | |
Over 24 months | | | 262,121 | | | | 15.68 | | | | 454,070 | | | | 22.86 | | | | 484,930 | | | | 22.73 | |
| | | | | | | | | | | | | | | | | | | | | | | | |
Total | | | 1,671,397 | | | | 100.00 | | | | 1,986,067 | | | | 100.00 | | | | 2,133,226 | | | | 100.00 | |
| | | | | | | | | | | | | | | | | | | | | | | | |
The changes in the allowance for impairment of accounts receivable—trade are as follows:
| | | | | | | | | | | | |
| | | Total | | | Related
Parties | | | Third
Parties | |
January 1, 2012 | | | | | | | | | | | | |
Balance at beginning of year | | | 496,110 | | | | 47,640 | | | | 448,470 | |
Provision (reversal)—net (Note 27) | | | 41,051 | | | | (1,509 | ) | | | 42,560 | |
Net effect of foreign exchange adjustment | | | 105 | | | | 976 | | | | (871 | ) |
Write-offs | | | (615 | ) | | | — | | | | (615 | ) |
| | | | | | | | | | | | |
Balance at end of year | | | 536,651 | | | | 47,107 | | | | 489,544 | |
| | | | | | | | | | | | |
Individual impairment | | | 189,486 | | | | 44,086 | | | | 145,400 | |
Collective impairment | | | 347,165 | | | | 3,021 | | | | 344,144 | |
| | | | | | | | | | | | |
Total | | | 536,651 | | | | 47,107 | | | | 489,544 | |
| | | | | | | | | | | | |
Gross amount of receivables, individually impaired, before deducting any individually assessed impairment allowance | | | 309,556 | | | | 117,572 | | | | 191,984 | |
| | | | | | | | | | | | |
F-54
PT INDOSAT Tbk AND ITS SUBSIDIARIES
NOTES TO CONSOLIDATED FINANCIAL STATEMENTS—(Continued)
as of January 1, 2012 (Restated), December 31, 2012 (Restated) and December 31, 2013
and for the Years ended December 31, 2011 (Restated), 2012 (Restated) and 2013
(Expressed in millions of rupiah and thousands of U.S. dollar, except share and tariff data)
| | | | | | | | | | | | |
| | | Total | | | Related
Parties | | | Third
Parties | |
December 31, 2012 | | | | | | | | | | | | |
Balance at beginning of year | | | 536,651 | | | | 47,107 | | | | 489,544 | |
Provision (reversal)—net (Note 27) | | | 56,163 | | | | (6,567 | ) | | | 62,730 | |
Net effect of foreign exchange adjustment | | | 7,802 | | | | 2,092 | | | | 5,710 | |
Write-offs | | | (35,986 | ) | | | — | | | | (35,986 | ) |
| | | | | | | | | | | | |
Balance at end of year | | | 564,630 | | | | 42,632 | | | | 521,998 | |
| | | | | | | | | | | | |
Individual impairment | | | 208,208 | | | | 37,852 | | | | 170,356 | |
Collective impairment | | | 356,422 | | | | 4,780 | | | | 351,642 | |
| | | | | | | | | | | | |
Total | | | 564,630 | | | | 42,632 | | | | 521,998 | |
| | | | | | | | | | | | |
Gross amount of receivables, individually impaired, before deducting any individually assessed impairment allowance | | | 341,363 | | | | 111,124 | | | | 230,239 | |
| | | | | | | | | | | | |
December 31, 2013 | | | | | | | | | | | | |
Balance at beginning of year | | | 564,630 | | | | 42,632 | | | | 521,998 | |
Provision (reversal)—net (Note 27) | | | 102,307 | | | | (5,369 | ) | | | 107,676 | |
Net effect of foreign exchange adjustment | | | 21,867 | | | | 1,108 | | | | 20,759 | |
Write-offs | | | (167,398 | ) | | | (14,055 | ) | | | (153,343 | ) |
| | | | | | | | | | | | |
Balance at end of year | | | 521,406 | | | | 24,316 | | | | 497,090 | |
| | | | | | | | | | | | |
Individual impairment | | | 115,881 | | | | 18,134 | | | | 97,747 | |
Collective impairment | | | 405,525 | | | | 6,182 | | | | 399,343 | |
| | | | | | | | | | | | |
Total | | | 521,406 | | | | 24,316 | | | | 497,090 | |
| | | | | | | �� | | | | | |
Gross amount of receivables, individually impaired, before deducting any individually assessed impairment allowance | | | 295,329 | | | | 69,267 | | | | 226,062 | |
| | | | | | | | | | | | |
The aging schedule of the allowance for impairment of accounts receivable—trade is as follows:
| | | | | | | | | | | | | | | | |
| | | December 31, 2012 | | | December 31, 2013 | |
| | | Gross | | | Allowance
for
impairment | | | Gross | | | Allowance
for
impairment | |
Not past due and past due up to 6 months | | | 1,513,710 | | | | 35,270 | | | | 1,908,449 | | | | 28,246 | |
Past due more than 7 to 12 months | | | 288,090 | | | | 35,992 | | | | 93,805 | | | | 21,173 | |
Past due more than 13 to 24 months | | | 290,105 | | | | 57,293 | | | | 279,733 | | | | 54,160 | |
Past due more than 24 months | | | 511,444 | | | | 436,075 | | | | 507,758 | | | | 417,827 | |
| | | | | | | | | | | | | | | | |
Total | | | 2,603,349 | | | | 564,630 | | | | 2,789,745 | | | | 521,406 | |
| | | | | | | | | | | | | | | | |
The Group has made provision for impairment of accounts receivable—trade based on the collective assessment of historical impairment rates and individual assessment of its customers’ credit history. The Group does not apply a distinction between related party and third party accounts receivable in assessing amounts past due. As of December 31, 2012 and 2013, the carrying amount of trade receivables of the Group considered past due but not impaired amounted to Rp1,172,818 and Rp1,491,450, respectively.
F-55
PT INDOSAT Tbk AND ITS SUBSIDIARIES
NOTES TO CONSOLIDATED FINANCIAL STATEMENTS—(Continued)
as of January 1, 2012 (Restated), December 31, 2012 (Restated) and December 31, 2013
and for the Years ended December 31, 2011 (Restated), 2012 (Restated) and 2013
(Expressed in millions of rupiah and thousands of U.S. dollar, except share and tariff data)
Management believes that accounts receivable past due but not impaired, along with accounts receivable that are neither past due nor impaired, are due from customers with good credit history and are expected to be recoverable.
The net effect of foreign exchange adjustment was due to the strengthening or weakening of the rupiah vis-à-vis the U.S. dollar in relation to U.S. dollar accounts previously provided with allowance and was credited or charged to “Gain on Foreign Exchange—Net”.
Information about the Group’s exposure to credit risk is disclosed in Note 36.
Management believes the established allowance is sufficient to cover impairment of accounts receivable—trade.
6. OTHER CURRENT FINANCIAL ASSETS—NET
This account consists of the following:
| | | | | | | | | | | | |
| | | January 1,
2012 | | | December 31, | |
| | | | 2012 | | | 2013 | |
Short-term investment * | | | 25,395 | | | | 25,395 | | | | — | |
Less allowance for impairment | | | 25,395 | | | | 25,395 | | | | — | |
| | | | | | | | | | | | |
Net | | | — | | | | — | | | | — | |
Restricted cash and cash equivalents (including
US$168 on January 1, 2012, US$231 on
December 31, 2012 and US$205 on
December 31, 2013) | | | 18,830 | | | | 5,483 | | | | 25,008 | |
Others (including US$10 on January 1, 2012,
US$257 on December 31, 2012 and US$21
on December 31, 2013) | | | 5,960 | | | | 7,899 | | | | 6,665 | |
| | | | | | | | | | | | |
Total | | | 24,790 | | | | 13,382 | | | | 31,673 | |
| | | | | | | | | | | | |
| * | The Company wrote off the short-term investment in mutual funds of PT Jakarta Asset Management in April 2013 based on the approval dated April 16, 2013 from the Board of Commissioners. |
F-56
PT INDOSAT Tbk AND ITS SUBSIDIARIES
NOTES TO CONSOLIDATED FINANCIAL STATEMENTS—(Continued)
as of January 1, 2012 (Restated), December 31, 2012 (Restated) and December 31, 2013
and for the Years ended December 31, 2011 (Restated), 2012 (Restated) and 2013
(Expressed in millions of rupiah and thousands of U.S. dollar, except share and tariff data)
7. OTHER CURRENT ASSETS
This account consists of the following:
| | | | | | | | | | | | |
| | | January 1,
2012 | | | December 31, | |
| | | | 2012 | | | 2013 | |
Prepayment for taxes: | | | | | | | | | | | | |
VAT—net | | | 29,677 | | | | 124,642 | | | | 214,454 | |
Claim for tax refund—2002 and 2003 article 26 (**) | | | — | | | | 87,198 | | | | — | |
Claim for tax refund—2008 and 2009 article 26 (*) | | | — | | | | 80,018 | | | | — | |
Other tax prepayments | | | 1,018 | | | | 2,485 | | | | 3,295 | |
Others | | | 742 | | | | 392 | | | | 3,507 | |
| | | | | | | | | | | | |
Total | | | 31,437 | | | | 294,735 | | | | 221,256 | |
| | | | | | | | | | | | |
| * | On May 5, 2011, the Company submitted an appeal letter to the Tax Court concerning the Company’s request for cancellation of Tax Collection Letters (“STPs”) for the underpayment of the Company’s 2008 and 2009 income tax article 26 totaling Rp80,018 (including interest). On July 30, 2012, the Company received the Tax Court’s Decision Letter which accepted the Company’s appeal concerning these STPs. On December 26, 2012, the Company received a copy of a Memorandum for Reconsideration Request (Memori Permohonan Peninjauan Kembali)from the Tax Court to the Supreme Court on the Tax Court’s Decision Letter dated July 30, 2012 for the underpayment of the Company’s 2008 and 2009 article 26 tax. On February 6, 2013, the Company submitted a Counter-Memorandum for Reconsideration Request to the Supreme Court. On October 25 and November 4, 2013, the Company received the refund from the Tax Office. |
| ** | On November 6, 2012, the Company received a Decision Letter from the Tax Court accepting the Company’s appeal on Satelindo’s 2002 and 2003 income tax article 26 totaling Rp87,198 which is lower than the amount originally recognized by the Company in its financial statements. The Company accepted the corrections amounting to Rp4,655, which was charged to current operations as part of “Expenses—Others - Net”. On January 28, 2013, the Company received the refund from the Tax Office. |
F-57
PT INDOSAT Tbk AND ITS SUBSIDIARIES
NOTES TO CONSOLIDATED FINANCIAL STATEMENTS—(Continued)
as of January 1, 2012 (Restated), December 31, 2012 (Restated) and December 31, 2013
and for the Years ended December 31, 2011 (Restated), 2012 (Restated) and 2013
(Expressed in millions of rupiah and thousands of U.S. dollar, except share and tariff data)
8. PROPERTY AND EQUIPMENT
The details of property and equipment are as follows:
| | | | | | | | | | | | | | | | | | | | | | | | |
| | | Exchange
and
network
assets | | | Subscribers’
apparatus
and other
equipment | | | Buildings and
building &
leasehold
improvements | | | Landrights | | | Properties
under
construction
and
installation | | | Total | |
At January 1, 2011 | | | 56,964,683 | | | | 4,310,375 | | | | 13,259,684 | | | | 541,087 | | | | 3,461,884 | | | | 78,537,713 | |
Additions | | | 515,431 | | | | 37,772 | | | | 429,760 | | | | — | | | | 5,517,983 | | | | 6,500,946 | |
Derecognitions | | | (1,799,943 | ) | | | (81,053 | ) | | | (101,426 | ) | | | — | | | | — | | | | (1,982,422 | ) |
Reclassifications | | | 5,383,034 | | | | 394,167 | | | | 391,715 | | | | 1,975 | | | | (6,170,891 | ) | | | — | |
| | | | | | | | | | | | | | | | | | | | | | | | |
At December 31, 2011 | | | 61,063,205 | | | | 4,661,261 | | | | 13,979,733 | | | | 543,062 | | | | 2,808,976 | | | | 83,056,237 | |
Additions | | | 460,579 | | | | 61,291 | | | | 2,653,360 | | | | 2,437 | | | | 5,195,859 | | | | 8,373,526 | |
Derecognitions | | | (585,370 | ) | | | (40,717 | ) | | | (2,386,031 | ) | | | — | | | | — | | | | (3,012,118 | ) |
Reclassifications | | | 4,194,853 | | | | 254,660 | | | | 588,861 | | | | — | | | | (5,038,374 | ) | | | — | |
| | | | | | | | | | | | | | | | | | | | | | | | |
At December 31, 2012 | | | 65,133,267 | | | | 4,936,495 | | | | 14,835,923 | | | | 545,499 | | | | 2,966,461 | | | | 88,417,645 | |
Additions | | | 249,479 | | | | 36,752 | | | | 342,914 | | | | 1,618 | | | | 8,733,574 | | | | 9,364,337 | |
Derecognitions | | | (616,729 | ) | | | (18,024 | ) | | | (81,938 | ) | | | — | | | | — | | | | (716,691 | ) |
Reclassifications | | | 4,418,432 | | | | 691,017 | | | | 471,331 | | | | — | | | | (5,580,780 | ) | | | — | |
| | | | | | | | | | | | | | | | | | | | | | | | |
At December 31, 2013 | | | 69,184,449 | | | | 5,646,240 | | | | 15,568,230 | | | | 547,117 | | | | 6,119,255 | | | | 97,065,291 | |
| | | | | | |
Accumulated depreciation, amortization and impairment | | | | | | | | | | | | | | | | | | | | | | | | |
Accumulated depreciation, amortization and impairment at January 1, 2011 | | | 26,089,761 | | | | 3,326,258 | | | | 5,059,660 | | | | 81,608 | | | | — | | | | 34,557,287 | |
Depreciation and amortization charge for the year | | | 5,093,301 | | | | 466,208 | | | | 981,010 | | | | 11,151 | | | | — | | | | 6,551,670 | |
Derecognitions | | | (1,283,254 | ) | | | (81,054 | ) | | | (101,349 | ) | | | — | | | | — | | | | (1,465,657 | ) |
| | | | | | | | | | | | | | | | | | | | | | | | |
Accumulated depreciation, amortization and impairment at December 31, 2011 | | | 29,899,808 | | | | 3,711,412 | | | | 5,939,321 | | | | 92,759 | | | | — | | | | 39,643,300 | |
Depreciation and amortization charge for the year | | | 6,802,221 | | | | 364,765 | | | | 1,089,619 | | | | 11,188 | | | | — | | | | 8,267,793 | |
Derecognitions | | | (311,707 | ) | | | (39,850 | ) | | | (1,002,737 | ) | | | — | | | | — | | | | (1,354,294 | ) |
| | | | | | | | | | | | | | | | | | | | | | | | |
Accumulated depreciation, amortization and impairment at December 31, 2012 | | | 36,390,322 | | | | 4,036,327 | | | | 6,026,203 | | | | 103,947 | | | | — | | | | 46,556,799 | |
Depreciation and amortization charge for the year | | | 7,271,845 | | | | 428,417 | | | | 1,240,292 | | | | 11,242 | | | | — | | | | 8,951,796 | |
Derecognitions | | | (418,435 | ) | | | (17,850 | ) | | | (81,939 | ) | | | — | | | | — | | | | (518,224 | ) |
| | | | | | | | | | | | | | | | | | | | | | | | |
Accumulated depreciation, amortization and impairment at December 31, 2013 | | | 43,243,732 | | | | 4,446,894 | | | | 7,184,556 | | | | 115,189 | | | | — | | | | 54,990,371 | |
| | | | | | | | | | | | | | | | | | | | | | | | |
| | | | | | |
Net Book value | | | | | | | | | | | | | | | | | | | | | | | | |
At January 1, 2011 | | | 30,874,922 | | | | 984,117 | | | | 8,200,024 | | | | 459,479 | | | | 3,461,884 | | | | 43,980,426 | |
At December 31, 2011/January 1, 2012 | | | 31,163,397 | | | | 949,849 | | | | 8,040,412 | | | | 450,303 | | | | 2,808,976 | | | | 43,412,937 | |
At December 31, 2012 | | | 28,742,945 | | | | 900,168 | | | | 8,809,720 | | | | 441,552 | | | | 2,966,461 | | | | 41,860,846 | |
At December 31, 2013 | | | 25,940,717 | | | | 1,199,346 | | | | 8,383,674 | | | | 431,928 | | | | 6,119,255 | | | | 42,074,920 | |
F-58
PT INDOSAT Tbk AND ITS SUBSIDIARIES
NOTES TO CONSOLIDATED FINANCIAL STATEMENTS—(Continued)
as of January 1, 2012 (Restated), December 31, 2012 (Restated) and December 31, 2013
and for the Years ended December 31, 2011 (Restated), 2012 (Restated) and 2013
(Expressed in millions of rupiah and thousands of U.S. dollar, except share and tariff data)
Submarine cables (presented as part of exchange and network assets) represent the Company’s proportionate investment in submarine cable circuits jointly constructed, operated, maintained and owned with other countries, based on the respective contracts and/or the construction and maintenance agreements.
The carrying values of property and equipment held under finance leases as of December 31, 2011/January 1, 2012, December 31, 2012 and December 31, 2013 are Rp750,544, Rp3,238,774 and Rp3,105,678, respectively. Additions during the years 2011, 2012 and 2013 included Rp427,242, Rp2,704,030 and Rp340,305, respectively, of acquisition cost of property and equipment under finance leases.
Depreciation and amortization expense charged to profit or loss amounted to Rp6,551,670, Rp8,267,793 and Rp8,951,796 in 2011, 2012 and 2013, respectively.
Management believes that there is no impairment in asset values or recovery of the impairment reserve as contemplated in IAS 36 for the current year.
As of December 31, 2013, the Group has no property and equipment pledged as collateral to any credit facilities.
As of December 31, 2013, the Group insured its property and equipment (except submarine cables and landrights) for US$233,663 and Rp30,841,197 including insurance amounting to US$102,500 on the Company‘s satellite. Management believes that the sum insured is sufficient to cover possible losses arising from fire, explosion, lightning, aircraft damage and other natural disasters.
As of December 31, 2013, the Group has property and equipment with total cost amounting to Rp5,157,156, which have been fully depreciated but are still being used.
The details of the Group’s properties under construction and installation as of January 1, 2012 and December 31, 2012 and 2013 are as follows:
| | | | | | | | | | | | |
| | | Percentage of
Completion | | | Cost | | | Estimated Date of Completion | |
January 1, 2012 | | | | | | | | | | | | |
Exchange and network assets | | | 17 - 90 | | | | 2,574,418 | | | | January - June 2012 | |
Subscribers’ apparatus and other equipment | | | 40 - 90 | | | | 93,535 | | | | January - June 2012 | |
Buildings and building & leasehold improvements | | | 20 - 95 | | | | 141,023 | | | | January - June 2012 | |
| | | | | | | | | | | | |
Total | | | | | | | 2,808,976 | | | | | |
| | | | | | | | | | | | |
December 31, 2012 | | | | | | | | | | | | |
Exchange and network assets | | | 7 - 99 | | | | 2,438,240 | | | | January - March 2013 | |
Subscribers’ apparatus and other equipment | | | 0 - 95 | | | | 203,441 | | | | January - September 2013 | |
Buildings and building & leasehold improvements | | | 10 - 96 | | | | 324,780 | | | | January - December 2013 | |
| | | | | | | | | | | | |
Total | | | | | | | 2,966,461 | | | | | |
| | | | | | | | | | | | |
December 31, 2013 | | | | | | | | | | | | |
Exchange and network assets | | | 1 - 99 | | | | 5,285,315 | | | | January 2014 - December 2016 | |
Subscribers’ apparatus and other equipment | | | 10 - 99 | | | | 738,457 | | | | January - July 2014 | |
Buildings and building & leasehold improvements | | | 34 - 93 | | | | 95,483 | | | | January - November 2014 | |
| | | | | | | | | | | | |
Total | | | | | | | 6,119,255 | | | | | |
| | | | | | | | | | | | |
Borrowing costs capitalized to properties under construction and installation for the years ended December 31, 2011, 2012 and 2013 amounted to Rp2,933, Rp nil and Rp nil, respectively.
F-59
PT INDOSAT Tbk AND ITS SUBSIDIARIES
NOTES TO CONSOLIDATED FINANCIAL STATEMENTS—(Continued)
as of January 1, 2012 (Restated), December 31, 2012 (Restated) and December 31, 2013
and for the Years ended December 31, 2011 (Restated), 2012 (Restated) and 2013
(Expressed in millions of rupiah and thousands of U.S. dollar, except share and tariff data)
For the years ended December 31, 2011, 2012 and 2013, exchanges and sales of certain property and equipment were performed as follows:
| | | | | | | | | | | | |
| | | 2011 | | | 2012 | | | 2013 | |
Exchanges of assets | | | | | | | | | | | | |
Sumatra and Java Project (Note 34k) | | | | | | | | | | | | |
Carrying amount of assets received | | | 115,734 | | | | 273,665 | | | | 57,069 | |
Carrying amount of assets given up | | | (115,734 | ) | | | (273,665 | ) | | | (57,069 | ) |
| | | |
Kalimantan Project | | | | | | | | | | | | |
Carrying amount of assets received | | | 400,956 | | | | — | | | | — | |
Carrying amount of assets given up | | | (400,956 | ) | | | — | | | | — | |
| | | |
Sales of 2,500 towers (Note 29) | | | | | | | | | | | | |
Proceeds | | | — | | | | 3,870,600 | | | | — | |
Net book value | | | — | | | | (1,372,674 | ) | | | — | |
| | | | | | | | | | | | |
Excess of selling price over carrying amount | | | — | | | | 2,497,926 | | | | — | |
Deferred gain from sales and leaseback | | | — | | | | (1,318,923 | ) | | | — | |
| | | | | | | | | | | | |
Recognized gain | | | — | | | | 1,179,003 | | | | — | |
| | | | | | | | | | | | |
Assets finance leased out | | | | | | | | | | | | |
Fair value of assets being leased out | | | — | | | | — | | | | 196,464 | |
Net book value | | | — | | | | — | | | | (141,223 | ) |
| | | | | | | | | | | | |
Gain | | | — | | | | — | | | | 55,241 | |
| | | | | | | | | | | | |
Sales of assets | | | | | | | | | | | | |
Proceeds | | | 6,708 | | | | 7,215 | | | | 11,560 | |
Net book value | | | (76 | ) | | | (11,487 | ) | | | (173 | ) |
| | | | | | | | | | | | |
Gain (loss) | | | 6,632 | | | | (4,272 | ) | | | 11,387 | |
| | | | | | | | | | | | |
Total Gain | | | 6,632 | | | | 1,174,731 | | | | 66,628 | |
| | | | | | | | | | | | |
In the above exchange of asset transaction, the fair value of neither the assets received nor the assets given up can be measured reliably, hence, their values were measured at the carrying amounts of the assets given up plus the cash consideration paid.
In accordance with its policy, the Company reviews the estimated useful lives of its fixed assets on an annual basis.
Effective September 1, 2012, the Company changed its estimate of the useful lives of its cellular technical equipment from 10 years to 8 years. The change was made mainly due to the Company’s plan to change its network with new updated equipment that will enable the Company to fully utilize its 900 MHz frequency channel for 3G services. The effect of this change in estimate was to increase 2012 and 2013 depreciation expense by Rp1,256,941 and Rp1,323,176, respectively.
F-60
PT INDOSAT Tbk AND ITS SUBSIDIARIES
NOTES TO CONSOLIDATED FINANCIAL STATEMENTS—(Continued)
as of January 1, 2012 (Restated), December 31, 2012 (Restated) and December 31, 2013
and for the Years ended December 31, 2011 (Restated), 2012 (Restated) and 2013
(Expressed in millions of rupiah and thousands of U.S. dollar, except share and tariff data)
The effect of the change in the useful lives of these assets is to increase (decrease) income before income tax as follows:
| | | | |
Period | | Amount | |
Year ending December 31, 2014 | | | (624,964 | ) |
Year ending December 31, 2015 | | | (358,302 | ) |
Year ending December 31, 2016 | | | (206,442 | ) |
Year ending December 31, 2017 | | | 667,750 | |
As of December 31, 2013, the Company has undertaken a review of the estimated useful lives of its property and equipment. As a result of the review, the Company concluded that it should accelerate the depreciation of Fixed Wireless Assets technical equipment by Rp201,433, which was recognized in the 2013 consolidated statement of comprehensive income under “Expenses—depreciation and amortization”. The Company believes that the net cash flows to be generated from Fixed Wireless services will continue to significantly decrease in the future mainly due to increased competition in the Fixed Wireless market that has resulted in lower average tariffs, declining active customers and declining Average Revenue Per User (“ARPU”).
On January 28, 2013, the Company and PT Link Net (Link Net) entered into an agreement, whereby the Company agreed to grant Link Net an Indefeasible Right of Use (“IRU”) for a pair of fiber optics in the Company’s Jakarta-Batam-Singapore (JAKABARE) submarine cable network for a non-cancellable period of 12 years from January 1, 2013 to December 31, 2024. Link Net agreed to pay the Company the amount of US$20,300 (equivalent to Rp196,464) for the right to use one pair of fiber optics (from the total capacity of fiber optics of 4 pairs of JAKABARE submarine cable). The payment was made in a series of installments, with the last one occurring on October 30, 2013.
Accordingly, for the year ended December 31, 2013, the Company derecognized a portion of its submarine cable network asset with a carrying value of Rp141,223 and recognized the gain from the above outright sale of Rp55,241.
9. GOODWILL AND OTHER INTANGIBLE ASSETS
The changes in the goodwill and other intangible assets account are as follows:
| | | | | | | | | | | | | | | | |
| | | Non-integrated
Software | | | Other
Intangible
Assets | | | Goodwill | | | Total | |
Cost: | | | | | | | | | | | | | | | | |
At January 1, 2011 | | | 275,629 | | | | 597,448 | | | | 2,944,362 | | | | 3,817,439 | |
Additions | | | 10,340 | | | | 112 | | | | — | | | | 10,452 | |
| | | | | | | | | | | | | | | | |
At December 31, 2011 | | | 285,969 | | | | 597,560 | | | | 2,944,362 | | | | 3,827,891 | |
Additions | | | 23,055 | | | | 18 | | | | — | | | | 23,073 | |
| | | | | | | | | | | | | | | | |
At December 31, 2012 | | | 309,024 | | | | 597,578 | | | | 2,944,362 | | | | 3,850,964 | |
Additions | | | 6,703 | | | | 29 | | | | — | | | | 6,732 | |
| | | | | | | | | | | | | | | | |
At December 31, 2013 | | | 315,727 | | | | 597,607 | | | | 2,944,362 | | | | 3,857,696 | |
| | | | | | | | | | | | | | | | |
F-61
PT INDOSAT Tbk AND ITS SUBSIDIARIES
NOTES TO CONSOLIDATED FINANCIAL STATEMENTS—(Continued)
as of January 1, 2012 (Restated), December 31, 2012 (Restated) and December 31, 2013
and for the Years ended December 31, 2011 (Restated), 2012 (Restated) and 2013
(Expressed in millions of rupiah and thousands of U.S. dollar, except share and tariff data)
| | | | | | | | | | | | | | | | |
| | | Non-integrated
Software | | | Other
Intangible
Assets | | | Goodwill | | | Total | |
Accumulated Amortization: | | | | | | | | | | | | | | | | |
At January 1, 2011 | | | 225,952 | | | | 597,448 | | | | 930,862 | | | | 1,754,262 | |
Amortization | | | 17,607 | | | | 51 | | | | — | | | | 17,658 | |
| | | | | | | | | | | | | | | | |
At December 31, 2011 | | | 243,559 | | | | 597,499 | | | | 930,862 | | | | 1,771,920 | |
Amortization | | | 16,210 | | | | 9 | | | | — | | | | 16,219 | |
| | | | | | | | | | | | | | | | |
At December 31, 2012 | | | 259,769 | | | | 597,508 | | | | 930,862 | | | | 1,788,139 | |
Amortization | | | 17,830 | | | | 10 | | | | — | | | | 17,840 | |
| | | | | | | | | | | | | | | | |
At December 31, 2013 | | | 277,599 | | | | 597,518 | | | | 930,862 | | | | 1,805,979 | |
| | | | | | | | | | | | | | | | |
Net Book Value: | | | | | | | | | | | | | | | | |
At January 1, 2011 | | | 49,677 | | | | — | | | | 2,013,500 | | | | 2,063,177 | |
| | | | | | | | | | | | | | | | |
At December 31, 2011 | | | 42,410 | | | | 61 | | | | 2,013,500 | | | | 2,055,971 | |
| | | | | | | | | | | | | | | | |
At December 31, 2012 | | | 49,255 | | | | 70 | | | | 2,013,500 | | | | 2,062,825 | |
| | | | | | | | | | | | | | | | |
At December 31, 2013 | | | 38,128 | | | | 89 | | | | 2,013,500 | | | | 2,051,717 | |
| | | | | | | | | | | | | | | | |
Other intangible assets consist of the following:
| | | | | | | | | | | | | | | | | | | | | | | | | | | | | | | | | | | | | | | | |
| | | Useful lives
(years) | | | January 1, 2012 | | | December 31, 2012 | | | December 31, 2013 | |
| | | | Gross | | | Net | | | Gross | | | Net | | | Gross | | | Net | |
| | | Carrying
Amount | | | Accumulated
Amortization | | | | Carrying
Amount | | | Accumulated
Amortization | | | | Carrying
Amount | | | Accumulated
Amortization | | |
Customer base: | | | | | | | | | | | | | | | | | | | | | | | | | | | | | | | | | | | | | | | | |
Post-paid | | | 5 | | | | 154,220 | | | | 154,220 | | | | — | | | | 154,220 | | | | 154,220 | | | | — | | | | 154,220 | | | | 154,220 | | | | — | |
Prepaid | | | 6 | | | | 73,128 | | | | 73,128 | | | | — | | | | 73,128 | | | | 73,128 | | | | — | | | | 73,128 | | | | 73,128 | | | | — | |
Spectrum license | | | 5 | | | | 222,922 | | | | 222,922 | | | | — | | | | 222,922 | | | | 222,922 | | | | — | | | | 222,922 | | | | 222,922 | | | | — | |
Brand | | | 8 | | | | 147,178 | | | | 147,178 | | | | — | | | | 147,178 | | | | 147,178 | | | | — | | | | 147,178 | | | | 147,178 | | | | — | |
Patent | | | 10 | | | | 112 | | | | 51 | | | | 61 | | | | 130 | | | | 60 | | | | 70 | | | | 159 | | | | 70 | | | | 89 | |
| | | | | | | | | | | | | | | | | | | | | | | | | | | | | | | | | | | | | | | | |
Total | | | | | | | 597,560 | | | | 597,499 | | | | 61 | | | | 597,578 | | | | 597,508 | | | | 70 | | | | 597,607 | | | | 597,518 | | | | 89 | |
| | | | | | | | | | | | | | | | | | | | | | | | | | | | | | | | | | | | | | | | |
Goodwill arose from the acquisition of ownership in Bimagraha and Satelindo in 2001 and 2002, respectively, and from the acquisition of additional ownership in Lintasarta in 2005, in SMT in 2008 and LMD in 2010.
Goodwill acquired through business combination has been allocated to the cellular business unit, which is also considered as one of the Group’s operating segments.
Goodwill is tested for impairment annually (as at December 31) and when circumstances indicate the carrying value may be impaired. The Company considers the relationship between its market capitalization and its book value, among other factors, when reviewing for indications of impairment. As of December 31, 2013, the market capitalization of the Company was above the book value of its net assets. The recoverable amount of the cellular business unit has been determined based on fair values less cost to sell (“FVLCTS”) calculation that uses the Income Approach (a Discounted Cash Flows Method) and the Market Approach (a Guideline Public Company Method).
F-62
PT INDOSAT Tbk AND ITS SUBSIDIARIES
NOTES TO CONSOLIDATED FINANCIAL STATEMENTS—(Continued)
as of January 1, 2012 (Restated), December 31, 2012 (Restated) and December 31, 2013
and for the Years ended December 31, 2011 (Restated), 2012 (Restated) and 2013
(Expressed in millions of rupiah and thousands of U.S. dollar, except share and tariff data)
Key assumptions used in the FVLCTS calculation at December 31, 2013:
Discount rates—The Company has chosen to use the weighted average cost of capital (“WACC”) as the discount rate for the discounted cash flow. The estimated WACC applied in determining the recoverable amount of the cellular business unit is between 13% and 14%.
Compounded Annual Growth Rate (“CAGR”)—The CAGR projection for the 5-year budget period of the cellular business unit’s revenue based on the market analysts’ forecast is between 4.8% and 6.4%.
Cost to Sell—As the recoverable amount of the cellular business unit is determined using FVLCTS, the estimated cost to sell the business is based on a certain percentage of the equity value. The estimated cost to sell used for this calculation is at approximately 1.0% of the enterprise value.
As a result of the impairment testing, management did not identify an impairment for the cellular business unit to which goodwill of Rp2,013,500 is allocated.
Goodwill Sensitivity Analysis
The calculation of impairment testing of cellular business using FVLCTS is most sensitive to the following assumptions:
Revenue growth
| | • | | The Company experienced delay in network modernization in third quarter of 2013 which, according to some research analysts, may impact the Company’s ability to compete with other mobile operators in the future. However, some analysts also believe that management can catch up to this delay. |
| | • | | Based on the research, analysts predict the Company’s CAGR revenue growth in the range of 1.8% to 9.5%. |
| | • | | For sensitivity purposes, the estimate used is+ 7.0% from CAGR based assumption, resulting in revenue growth between -1.8% to 12.2%. |
| | • | | Based on the assumptions above, impairment will occur when: |
| | - | | WACC 13%—revenue growth is less than the estimated growth of 4.0% |
| | - | | WACC 14%—revenue growth declines more than 1.9% |
EBITDA margin
| | • | | The Company is predicted to have difficulty in maintaining its Earnings Before Interest, Taxes, Depreciation and Amortization (“EBITDA”) margin, due to high competition in cellular business in addition to delay in network modernization. |
| | • | | Based on the research, after having considered the network modernization delay and heightened competition factor, analysts continue to predict that EBITDA margin of the Company is in the range of 44.6% to 46.7%. |
| | • | | For sensitivity purposes, the Company has incorporated both down side and upside impact. It is estimated that the EBITDA margin will be affected+ 3.5% from base assumption, which is in the range of 42.4% to 48.2%. |
F-63
PT INDOSAT Tbk AND ITS SUBSIDIARIES
NOTES TO CONSOLIDATED FINANCIAL STATEMENTS—(Continued)
as of January 1, 2012 (Restated), December 31, 2012 (Restated) and December 31, 2013
and for the Years ended December 31, 2011 (Restated), 2012 (Restated) and 2013
(Expressed in millions of rupiah and thousands of U.S. dollar, except share and tariff data)
| | • | | Based on the assumptions above, impairment will occur when: |
| | - | | WACC 13%—EBITDA margin decreases more than 2.2% |
| | - | | WACC 14%—EBITDA margin decreases more than 1.1% |
Capex-to-Sales ratio
| | • | | Management has addressed the network modernization factors in the first two years of the projection; therefore, the capex to sales ratio will slow down to normal growth. |
| | • | | For sensitivity purposes, it is estimated that the capex to sales ratio will increase/decrease+ 5% from base assumption depending on the Company’s achievement during the projected years. |
| | • | | Based on the assumptions above, impairment will occur when: |
| | - | | WACC 13%—when capex to sales ratio increases more than 6.7% |
| | - | | WACC 14%—when capex to sales ratio increases more than 3.4% |
Terminal growth rate
| | • | | Analysts predict that terminal growth rate of Telecommunications, Media and Technology industry (“TMT”) is in the range of 2% to 3%. |
| | • | | For sensitivity purposes, the same estimate has been used. |
| | • | | Based on the assumptions above, impairment will occur when: |
| | - | | WACC 13%—terminal growth declines less than 0.73% |
| | - | | WACC 14%—terminal growth declines less than 1.78% |
Discount rate
| | • | | Due to recent macro economic conditions, such as increase in the budget deficit, actual inflation rate being more than targeted, weakening rupiah against U.S. dollar, and the upcoming general elections, there is elevated risk associated with Indonesian business. |
| | • | | For sensitivity purposes, it is estimated that the discount rate is in the range of 11% to 17%. |
| | • | | Based on the assumptions above, impairment will occur when discount rate is more than 16%. |
10. LONG-TERM PREPAID RENTALS—NET OF CURRENT PORTION
This account represents mainly the long-term portion of prepaid rentals on sites and towers.
11. LONG-TERM ADVANCES
This account represents advances to suppliers and contractors for the purchase and construction/installation of property and equipment which will be reclassified to the related property and equipment accounts upon the receipt of the property and equipment purchased or after the construction/installation of the property and equipment has reached a certain percentage of completion.
F-64
PT INDOSAT Tbk AND ITS SUBSIDIARIES
NOTES TO CONSOLIDATED FINANCIAL STATEMENTS—(Continued)
as of January 1, 2012 (Restated), December 31, 2012 (Restated) and December 31, 2013
and for the Years ended December 31, 2011 (Restated), 2012 (Restated) and 2013
(Expressed in millions of rupiah and thousands of U.S. dollar, except share and tariff data)
12. OTHER NON-CURRENT FINANCIAL ASSETS—NET
This account consists of the following:
| | | | | | | | | | | | |
| | | January 1, 2012 | | | December 31, | |
| | | | 2012 | | | 2013 | |
Other long-term investments | | | 116,307 | | | | 1,483,317 | | | | 1,507,299 | |
Less allowance for impairment | | | 113,577 | | | | 113,577 | | | | 113,577 | |
| | | | | | | | | | | | |
Net | | | 2,730 | | | | 1,369,740 | | | | 1,393,722 | |
| | | | | | | | | | | | |
Restricted cash and cash equivalents (including
US$290 on January 1, 2012, US$140 on
December 31, 2012 and US$121 on
December 31, 2013) | | | 50,826 | | | | 83,232 | | | | 94,874 | |
Employee loans receivable | | | 13,515 | | | | 11,025 | | | | 8,890 | |
Others (including US$1,288 on January 1, 2012,
US$1,010 on December 31, 2012 and US$1,317
on December 31,2013) | | | 145,199 | | | | 79,143 | | | | 59,881 | |
| | | | | | | | | | | | |
Sub-total | | | 209,540 | | | | 173,400 | | | | 163,645 | |
| | | | | | | | | | | | |
Total | | | 212,270 | | | | 1,543,140 | | | | 1,557,367 | |
| | | | | | | | | | | | |
Other long-term investments—net consist of the following:
| | a. | Investments in shares of stock classified as available for sale: |
| | | | | | | | | | | | | | | | | | | | | | |
December 31, 2013 | | Location | | | Principal Activity | | Ownership
(%) | | | Cost | | | Unrealized
Changes in
Fair Value | | | Carrying
Value | |
PT Tower Bersama Infrastructure Tbk (“Tower Bersama”) (Notes 29 and 37I)* | |
| Indonesia
|
| | Telecommunication infrastructure service | | | 5.00 | | | | 977,292 | | | | 413,700 | | | | 1,390,992 | |
| | | | | | |
December 31, 2012 | | | | | | | | | | | | | | | | | | | | | | |
Tower Bersama (Note 29) | |
| Indonesia
|
| | Telecommunication infrastructure service | | | 5.00 | | | | 977,292 | | | | 389,718 | | | | 1,367,010 | |
| * | The Company received dividend income amounting to Rp14,390 from Tower Bersama on October 3, 2013. |
On August 2, 2012, the Company received 5% ownership in Tower Bersama as part of its consideration for the sale-and-leaseback transaction of telecommunication towers (Note 29).
F-65
PT INDOSAT Tbk AND ITS SUBSIDIARIES
NOTES TO CONSOLIDATED FINANCIAL STATEMENTS—(Continued)
as of January 1, 2012 (Restated), December 31, 2012 (Restated) and December 31, 2013
and for the Years ended December 31, 2011 (Restated), 2012 (Restated) and 2013
(Expressed in millions of rupiah and thousands of U.S. dollar, except share and tariff data)
| | b. | Investments in shares of stock accounted under the cost method: |
| | | | | | | | | | | | |
January 1, 2012 and
December 31, 2012 | | Location | | Principal Activity | | Ownership
(%) | | | Cost/Carrying
Value | |
PT First Media Tbk | | Indonesia | | Cable television and internet network service provider | | | 1.07 | | | | 50,000 | |
Pendrell Corporation [previously ICO Global Communication (Holdings) Limited] ** | | United States
of America | | Satellite service | | | 0.0067 | | | | 49,977 | |
| | | | |
Asean Cableship Pte. Ltd. (“ACPL”)*** | | Singapore
| | Repairs and maintenance of submarine cables | | | 16.67 | | | | 1,265 | |
Others | | | | | | | 12.80 - 18.89 | | | | 14,966 | |
| | | | | | | | | | | | |
Total | | | | | | | | | | | 116,208 | |
Less allowance for impairment | | | | | | | | | | | 113,577 | |
| | | | | | | | | | | | |
Net | | | | | | | | | | | 2,631 | |
| | | | | | | | | | | | |
December 31, 2013 | | | | | | | | | | |
PT First Media Tbk | | Indonesia
| | Cable television and internet network service provider | | | 1.07 | | | | 50,000 | |
Pendrell Corporation** | | United States
of America | | Satellite service | | | 0.0065 | | | | 49,977 | |
ACPL*** | | Singapore
| | Repairs and maintenance of submarine cables | | | 16.67 | | | | 1,265 | |
Others | | | | | | | 12.80 - 18.89 | | | | 14,966 | |
| | | | | | | | | | | | |
Total | | | | | | | | | | | 116,208 | |
Less allowance for impairment | | | | | | | | | | | 113,577 | |
| | | | | | | | | | | | |
Net | | | | | | | | | | | 2,631 | |
| | | | | | | | | | | | |
| ** | On March 15, 2011, the Company’s ownership in ICO Global Communication (Holdings) Limited was diluted from 0.0087% to 0.0068% since the Company did not exercise its right in relation to a right issue conducted by ICO Global Communication (Holdings) Limited. On July 21, 2011, ICO Global Communication changed its name to Pendrell Corporation. Furthermore, as of December 31, 2013, the Company’s ownership in Pendrell has been diluted to 0.0065%. |
| *** | The Company received dividend income from its investment in ACPL totaling US$1,574 (equivalent to Rp13,790), Rp nil and US$3,573 (equivalent to 38,751) for the years ended December 31, 2011, 2012 and 2013, respectively. |
The Company has provided allowance for impairment of its investments in shares of stock accounted under the cost method amounting to Rp113,577 as of January 1, 2012, December 31, 2012 and 2013, which the Company believes is adequate to cover impairment losses on the investments.
| | c. | Equity securities in BNI of Rp89 and Telkom of Rp10 are both classified as available for sale as of January 1, 2012, December 31, 2012 and 2013. |
F-66
PT INDOSAT Tbk AND ITS SUBSIDIARIES
NOTES TO CONSOLIDATED FINANCIAL STATEMENTS—(Continued)
as of January 1, 2012 (Restated), December 31, 2012 (Restated) and December 31, 2013
and for the Years ended December 31, 2011 (Restated), 2012 (Restated) and 2013
(Expressed in millions of rupiah and thousands of U.S. dollar, except share and tariff data)
13. OTHER NON-CURRENT ASSETS—NET
This account consists of the following:
| | | | | | | | | | | | |
| | | | | | December 31, | |
| | | January 1, 2012 | | | 2012 | | | 2013 | |
Investment in an associated company(i) | | | 56,300 | | | | 57,174 | | | | 56,880 | |
Less allowance for impairment | | | 56,300 | | | | 56,300 | | | | 56,300 | |
| | | | | | | | | | | | |
Net | | | — | | | | 874 | | | | 580 | |
| | | | | | | | | | | | |
Claims for tax refund | | | | | | | | | | | | |
Corporate income tax | | | | | | | | | | | | |
Current year (Note 16) | | | 181,717 | | | | 162,647 | | | | 220,575 | |
Previous years(ii) | | | 333,217 | | | | 248,708 | | | | 230,379 | |
VAT and others(iii)—net of allowance for tax adjustments of | | | | | | | | | | | | |
Rp nil as of January 1, 2012 and December 31,
2012 and Rp159,908 as of December 31, 2013 | | | 351,909 | | | | 339,796 | | | | 424,640 | |
| | | | | | | | | | | | |
| | | 866,843 | | | | 751,151 | | | | 875,594 | |
| | | | | | | | | | | | |
Others | | | 5,593 | | | | 2,473 | | | | 65,032 | |
| | | | | | | | | | | | |
Total | | | 872,436 | | | | 754,498 | | | | 941,206 | |
| | | | | | | | | | | | |
| | (i) | Investment in an associated company—accounted under the equity method |
| | | | | | | | | | | | | | | | | | | | |
| | | Location | | Principal Activity | | Ownership
% | | | Cost | | | Accumulated
Equity in
Undistributed
Net loss | | | Carrying
value | |
PT Citra Bakti Indonesia | | Indonesia | | Certified service company for chip-based ATM/debit card and related devices and infrastructure | | | | | | | | | | | | | | | | |
2013 | | | | | | | 33.33 | | | | 1,000 | | | | 420 | | | | 580 | |
2012 | | | | | | | 33.33 | | | | 1,000 | | | | 126 | | | | 874 | |
F-67
PT INDOSAT Tbk AND ITS SUBSIDIARIES
NOTES TO CONSOLIDATED FINANCIAL STATEMENTS—(Continued)
as of January 1, 2012 (Restated), December 31, 2012 (Restated) and December 31, 2013
and for the Years ended December 31, 2011 (Restated), 2012 (Restated) and 2013
(Expressed in millions of rupiah and thousands of U.S. dollar, except share and tariff data)
| | (ii) | The claims for tax refund with respect to corporate income tax relating to previous years are as follows: |
| | | | | | | | | | | | |
Fiscal Year | | January 1, 2012 | | | December 31, | |
| | | 2012 | | | 2013 | |
I. Related to uncertain tax positions | | | | | | | | | | | | |
a. Satelindo—2002 | | | 103,163 | | | | — | | | | — | |
b. The Company—2009 | | | 65,570 | | | | 65,570 | | | | 65,570 | |
c. The Company—2010 | | | 89,442 | | | | — | | | | — | |
c. IMM—2010 | | | 75,042 | | | | — | | | | — | |
d. The Company—2011 | | | — | | | | 97,600 | | | | — | |
d. IMM—2011 | | | — | | | | 85,538 | | | | — | |
II. Not related to uncertain tax positions | | | | | | | | | | | | |
The Company—2012 | | | — | | | | — | | | | 132,316 | |
IMM—2012 | | | — | | | | — | | | | 32,493 | |
| | | | | | | | | | | | |
Total | | | 333,217 | | | | 248,708 | | | | 230,379 | |
| | | | | | | | | | | | |
| | a. | Satelindo’s 2002 corporate income tax |
On June 25, 2012, the Company received the Decision Letter from the Tax Court which declined the Company’s appeal in October 2010 on Satelindo’s corporate income tax for fiscal year 2002 amounting to Rp103,163. The Company charged the related claim for tax refund amounting to Rp103,163 to the 2012 operations as part of “Income Tax Expense—Current” (Note 16).
| | b. | The Company’s 2009 corporate income tax |
On April 21, 2011, the Company received an assessment letter on tax overpayment (“SKPLB”) from the Directorate General of Taxation (“DGT”) for the Company’s 2009 corporate income tax amounting to Rp29,272. The Company accepted a part of the corrections amounting to Rp836, which was charged to the 2011 operations (Note 16). On May 31, 2011, the Company received the tax refund of its claim for 2009 corporate income tax amounting to Rp23,695, which was offset against the VAT tax correction amount for the period January—December 2009. On July 20, 2011, the Company submitted an objection letter to the Tax Office regarding the remaining correction on the Company’s 2009 corporate income tax amounting to Rp65,570. On June 29, 2012, the Company received the Decision Letter from the DGT which declined the Company’s objection. On September 21, 2012, the Company submitted an appeal letter to the Tax Court concerning the Company’s objection to the correction on corporate income tax for fiscal year 2009. As of the issuance date of the consolidated financial statements, the Company has not received any decision from the Tax Court on such appeal.
| | c. | The Company’s and IMM’s 2010 corporate income tax |
On July 3, 2012, the Company received SKPLB from the DGT for the Company’s 2010 corporate income tax amounting to Rp89,381. The Company accepted some of the corrections amounting to Rp61, which was charged to the 2012 operations (Note 16). On August 24, 2012, the Company received the tax refund of its claim for 2010 corporate income tax amounting to Rp89,381. Within
F-68
PT INDOSAT Tbk AND ITS SUBSIDIARIES
NOTES TO CONSOLIDATED FINANCIAL STATEMENTS—(Continued)
as of January 1, 2012 (Restated), December 31, 2012 (Restated) and December 31, 2013
and for the Years ended December 31, 2011 (Restated), 2012 (Restated) and 2013
(Expressed in millions of rupiah and thousands of U.S. dollar, except share and tariff data)
this SKPLB, the DGT also made a correction amounting to Rp101,978, which decreased the tax loss carried forward as of December 31, 2010. The Company accepted the correction amounting to Rp101,978.
On April 26, 2012, IMM received SKPLB from the DGT for IMM’s 2010 corporate income tax amounting to Rp68,657. IMM charged the unapproved 2010 claim for tax refund amounting to Rp6,422 to the 2012 operations as part of current income tax expense (Note 16). On the same date, IMM also received the assessment letter on tax underpayment (“SKPKBs”) for its 2010 income tax articles 21, 23 and 26 and VAT totaling Rp11,132 (including penalties and interest). On June 22, 2012, IMM received the refund of its claim for 2010 corporate income tax amounting to Rp57,525, net of the underpayment of its 2010 income tax articles 21, 23 and 26 and VAT.
| | d. | The Company’s and IMM’s 2011 corporate income tax |
On June 26, 2013, the Company received SKPLB from the DGT for the Company’s 2011 corporate income tax amounting to Rp97,600. On August 14, 2013, the Company received this amount as tax refund from the DGT. Within this SKPLB, the Tax Office also made two corrections totaling Rp409,921, which decreased the tax loss carried forward as of December 31, 2011. On September 23, 2013, the Company submitted an objection letter to the Tax Office regarding these two corrections. However, on October 16, 2013, the Company submitted a letter to cancel the objection of one of the corrections amounting to Rp165,944. As of the issuance date of the consolidated financial statements, the Company has not received any decision from the Tax Office on the remaining objection to the correction amounting to Rp243,977.
On July 19, 2013, IMM received SKPLB from the DGT for IMM’s 2011 corporate income tax amounting to Rp90,812. On the same date, IMM also received SKPKBs for underpayment of its 2011 income tax articles 23 and 26 and VAT totaling Rp 3,184 (including penalties and interest). On September 6, 2013, IMM received the refund of its claim for 2011 corporate income tax amounting to Rp87,628, net of the above underpayment of its 2011 income tax articles 23 and 26 and VAT.
F-69
PT INDOSAT Tbk AND ITS SUBSIDIARIES
NOTES TO CONSOLIDATED FINANCIAL STATEMENTS—(Continued)
as of January 1, 2012 (Restated), December 31, 2012 (Restated) and December 31, 2013
and for the Years ended December 31, 2011 (Restated), 2012 (Restated) and 2013
(Expressed in millions of rupiah and thousands of U.S. dollar, except share and tariff data)
| | (iii) | The claims for tax refund with respect to VAT and others are as follows: |
| | | | | | | | | | | | |
Fiscal Year | | January 1, 2012 | | | December 31, | |
| | | 2012 | | | 2013 | |
I. Related to uncertain tax positions | | | | | | | | | | | | |
1a. The Company’s 2009 VAT | | | 178,640 | | | | 231,779 | | | | 50,347 | |
1b. The Company’s 2010 VAT | | | — | | | | 106,619 | | | | 199,786 | |
1c. The Company’s 2011 VAT | | | — | | | | — | | | | 131,091 | |
1d. The Company’s 2012 VAT | | | — | | | | — | | | | 148,161 | |
2. The Company’s 2005 income tax article 23 | | | 1,398 | | | | 1,398 | | | | 1,398 | |
3. The Company’s 2008 and 2009 income tax article 26* (Note 7) | | | 80,018 | | | | — | | | | — | |
4. Satelindo’s 2002 and 2003 income tax article 26* (Note 7) | | | 91,853 | | | | — | | | | — | |
Allowance for tax adjustments | | | — | | | | — | | | | (159,908 | ) |
Net | | | 351,909 | | | | 339,796 | | | | 370,875 | |
II. Not related to uncertain tax positions | | | | | | | | | | | | |
The Company’s restitution of VAT 2011 and 2012 | | | — | | | | — | | | | 53,765 | |
| | | | | | | | | | | | |
Total | | | 351,909 | | | | 339,796 | | | | 424,640 | |
| | | | | | | | | | | | |
| * | In 2012, the claims for tax refund from the Company’s 2008 and 2009 income tax article 26 and Satelindo’s 2002 and 2003 income tax article 26 were reclassified to “Other Current Assets” (Note 7). |
| | 1. | The Company’s 2009, 2010, 2011 and 2012 VAT |
| | a. | On April 21, 2011, the Company received SKPKBs from the DGT for the Company’s VAT for the period January—December 2009 totaling Rp182,800 (including penalties), which was paid on July 15, 2011. The Company accepted a part of the corrections amounting to Rp4,160 which was charged to the 2011 operations. On July 19, 2011, the Company submitted an objection letter to the Tax Office regarding the remaining correction on the Company’s VAT for the period January—December 2009. On June 4, 2012, the Company received the decision letter from the DGT that declined the Company’s objection and, based on its audit, the DGT charged the Company additional underpayment for the period January, March, April, June, August—December 2009 totaling Rp57,166 and overpayment for the period February, May and July 2009 totaling Rp4,027. On July 4, 2012, the Company paid the additional underpayment amounting to Rp57,166. On August 24 and 31, 2012, the Company received the overpayment totaling Rp4,027. On September 3, 2012, the Company submitted an appeal letter to the Tax Court regarding the remaining correction on the Company’s VAT for the period January—December 2009 amounting to Rp231,779. |
On February 12, 19 and 20, 2014, the Company received the Tax Court’s Decision Letters for the VAT periods “January—June 2009”, “July—August, October—December 2009” and “September 2009”, respectively, which accepted the Company’s appeal. However, it also charged for separate VAT underpayment totaling Rp180,930 for the same period. The Company accepted the correction made by the Tax Court and charged it to the 2013 operations. During April 15–23, 2014, the Company has received the restitution.
F-70
PT INDOSAT Tbk AND ITS SUBSIDIARIES
NOTES TO CONSOLIDATED FINANCIAL STATEMENTS—(Continued)
as of January 1, 2012 (Restated), December 31, 2012 (Restated) and December 31, 2013
and for the Years ended December 31, 2011 (Restated), 2012 (Restated) and 2013
(Expressed in millions of rupiah and thousands of U.S. dollar, except share and tariff data)
| | b. | On July 3, 2012, the Company received SKPLB from the DGT for the Company’s VAT for the period March 2010 amounting to Rp28,545, which was lower than the original amount recognized by the Company in its 2012 financial statements, and SKPKBs for the Company’s VAT for the period January, February and April—December 2010 totaling Rp98,011 (including penalties). On August 2, 2012, the Company paid the underpayment amounting to Rp98,011. On August 24, 2012, the Company received the overpayment amounting to Rp28,545 from the DGT. On October 1 and 2, 2012, the Company submitted objection letters to the Tax Office regarding SKPLB and SKPKBs on the Company’s VAT for the period January—December 2010 totaling Rp106,619. On September 17 and 26, 2013, the Company received the decision letter from the DGT which charged the Company for additional underpayment for the period January—December 2010 totaling Rp93,167, which was paid on October 16 and 25, 2013. On December 10, 2013, the Company submitted an appeal letter to the Tax Court with respect to the correction of the Company’s VAT for the period January—December 2010 totaling Rp171,241. As of the issuance date of the consolidated financial statements, the Company has not received any decision from the Tax Court on such appeal. |
| | c. | On June 26, 2013, the Company received SKPKB from the DGT for the Company’s VAT for the period January—December 2011 totaling Rp133,160 (including penalties), which was paid on July 24, 2013. The Company accepted a part of the corrections on VAT totaling Rp2,069, which were charged to the 2013 current operations. On September 23, 2013, the Company submitted an objection letter to the Tax Office regarding the remaining correction on the Company’s VAT for the period January—December 2011. As of the issuance date of the consolidated financial statements, the Company has not received any decision from the Tax Office on such objection. |
| | d. | On September 4, 2013, the Company received SKPKBs from the DGT for the Company’s VAT for the period January—December 2012 totaling Rp148,161 (including penalties), which was paid on October 3, 2013. On November 29, 2013, the Company submitted objection letters to the Tax Office with respect to the Company’s VAT for the period January—December 2012 totaling Rp148,161. As of the issuance date of the consolidated financial statements, the Company has not received any decision from the Tax Office on such objection. |
Based on the Company’s assessment on the above-mentioned uncertain VAT positions as of December 31, 2013, the Company wrote off a part of the claims for tax refund amounting to Rp181,432, provided an allowance for adjustments on the claims for tax refund amounting to Rp159,908, and provided a provision for VAT amounting to Rp125,486, all of which have been recorded in the 2013 consolidated financial statements.
14. SHORT-TERM LOAN
The balance of this account amounting to Rp1,499,256, Rp299,529 and Rp1,499,849 (net of unamortized loan issuance cost of Rp744, Rp471 and Rp151, respectively) as of January 1, 2012, December 31, 2012 and 2013, respectively, represents unsecured facility drawdowns from Mandiri, a related party (Note 31).
On June 21, 2011, the Company entered into a Revolving Time Loan Facility agreement with Mandiri covering a maximum amount of Rp1,000,000 to finance the Company’s operational working capital, capital
F-71
PT INDOSAT Tbk AND ITS SUBSIDIARIES
NOTES TO CONSOLIDATED FINANCIAL STATEMENTS—(Continued)
as of January 1, 2012 (Restated), December 31, 2012 (Restated) and December 31, 2013
and for the Years ended December 31, 2011 (Restated), 2012 (Restated) and 2013
(Expressed in millions of rupiah and thousands of U.S. dollar, except share and tariff data)
expenditure and/or refinancing requirements. This facility is available from June 21, 2011 to June 20, 2014 and drawdowns bear interest at 1-month Jakarta Inter-Bank Offered Rate (“JIBOR”) plus 1.4% per annum. Each drawdown matures 3 months from the drawdown date and can be extended for further 3-month periods by submitting a written request for such extension to Mandiri.
Subsequently, on December 5, 2011, the Company entered into an amendment of this agreement to cover the increase of the facility amount up to Rp1,500,000 and the change of the interest rate to 1-month JIBOR plus 1.25% per annum. On July 12, 2013, the interest rate was changed to 1-month JIBOR plus 1.75% per annum (Note 37f).
On August 2 and December 14, 2011; March 28, June 21 and December 12 and 26, 2012; April 5, June 4 and July 24, 2013, the Company made several drawdowns from this loan facility totaling Rp3,500,000.
On February 2, May 14, June 29, July 5, August 2, 2012 and January 15, 2013, the Company repaid the drawdowns previously made totaling Rp2,000,000.
Voluntary early repayment is permitted subject to 3 days’ prior written notice. The Company may early repay the whole or any part of the loan.
Based on the facility agreement, the Company is required to comply with certain covenants such as maintaining financial ratios. As of January 1, 2012, December 31, 2012 and 2013, the Company has complied with all the financial ratios required to be maintained under the loan agreement.
The amortization of the loan issuance cost for the years ended December 31, 2011, 2012 and 2013 amounted to Rp1,656, Rp321 and Rp320, respectively (Note 28).
15. PROCUREMENT PAYABLE
This account consists of amounts due for capital and operating expenditures procured from the following:
| | | | | | | | | | | | |
| | | January 1, 2012 | | | December 31, | |
| | | | 2012 | | | 2013 | |
Related parties (Note 31) (including US$114 on
January 1, 2012, US$78 on December 31, 2012
and US$42 on December 31, 2013) | | | 36,073 | | | | 43,783 | | | | 43,988 | |
Third parties (including US$220,674 on
January 1, 2012, US$141,024 on December 31, 2012
and US$81,178 on December 31, 2013) | | | 3,439,789 | | | | 2,694,067 | | | | 3,020,299 | |
| | | | | | | | | | | | |
Total | | | 3,475,862 | | | | 2,737,850 | | | | 3,064,287 | |
| | | | | | | | | | | | |
The billed amount of procurement payable amounted to Rp555,065, Rp531,799 and Rp801,308 as of January 1, 2012, December 31, 2012 and 2013, respectively. The unbilled amount of procurement payable amounted to Rp2,920,797, Rp2,206,051 and Rp2,262,979 as of January 1, 2012, December 31, 2012 and 2013, respectively.
F-72
PT INDOSAT Tbk AND ITS SUBSIDIARIES
NOTES TO CONSOLIDATED FINANCIAL STATEMENTS—(Continued)
as of January 1, 2012 (Restated), December 31, 2012 (Restated) and December 31, 2013
and for the Years ended December 31, 2011 (Restated), 2012 (Restated) and 2013
(Expressed in millions of rupiah and thousands of U.S. dollar, except share and tariff data)
16. TAXATION
This account consists of the following:
| | | | | | | | | | | | |
| | | January 1, 2012 | | | December 31, | |
| | | | 2012 | | | 2013 | |
Income tax article 25 | | | 14,964 | | | | 7,888 | | | | 9,139 | |
Estimated corporate income tax payable,
less tax prepayments of Rp106,847 on January 1, 2012,
Rp97,715 on December 31, 2012 and Rp114,123 on December 31, 2013 | | | 13,330 | | | | 26,137 | | | | 6,198 | |
| | | | | | | | | | | | |
Total | | | 28,294 | | | | 34,025 | | | | 15,337 | |
| | | | | | | | | | | | |
The computation of the estimated income tax payable / claim for tax refund is as follows:
| | | | | | | | | | | | |
| | | January 1, 2012 | | | December 31, | |
| | | | 2012 | | | 2013 | |
Income tax expense (benefit)—current, at statutory tax rates | | | | | | | | | | | | |
Company | | | | | | | | | | | | |
Tax expense from tax correction from previous year | | | 836 | | | | 103,224 | | | | — | |
Subsidiaries | | | | | | | | | | | | |
Income tax expense—current | | | 120,177 | | | | 123,852 | | | | 120,321 | |
Tax expense (benefit) from tax correction from previous year | | | 1,829 | | | | 7,353 | | | | (2,165 | ) |
| | | | | | | | | | | | |
Income tax expense—current—net | | | 122,842 | | | | 234,429 | | | | 118,156 | |
| | | | | | | | | | | | |
Prepayments of income tax of the Company | | | 95,210 | | | | 129,086 | | | | 219,867 | |
Prepayments of income tax of Subsidiaries | | | 193,354 | | | | 131,276 | | | | 114,831 | |
| | | | | | | | | | | | |
Total prepayments of income tax | | | 288,564 | | | | 260,362 | | | | 334,698 | |
| | | | | | | | | | | | |
Estimated income tax payable | | | | | | | | | | | | |
Subsidiaries | | | 13,330 | | | | 26,137 | | | | 6,198 | |
| | | | | | | | | | | | |
Net | | | 168,387 | | | | 136,510 | | | | 214,377 | |
| | | | | | | | | | | | |
Presented in consolidated statement of financial position as: | | | | | | | | | | | | |
Claim for tax refund—part of “Other Non-current Assets” (Note 13) | | | | | | | | | | | | |
The Company | | | 95,210 | | | | 129,086 | | | | 219,867 | |
Subsidiaries | | | 86,507 | | | | 33,561 | | | | 708 | |
| | | | | | | | | | | | |
Total | | | 181,717 | | | | 162,647 | | | | 220,575 | |
| | | | | | | | | | | | |
F-73
PT INDOSAT Tbk AND ITS SUBSIDIARIES
NOTES TO CONSOLIDATED FINANCIAL STATEMENTS—(Continued)
as of January 1, 2012 (Restated), December 31, 2012 (Restated) and December 31, 2013
and for the Years ended December 31, 2011 (Restated), 2012 (Restated) and 2013
(Expressed in millions of rupiah and thousands of U.S. dollar, except share and tariff data)
| | b. | Income tax expense (benefit)—net |
The components of the income tax expense (benefit)—net for the years ended December 31, 2011, 2012 and 2013 are as follows:
| | | | | | | | | | | | |
| | | 2011
(Restated) | | | 2012
(Restated) | | | 2013 | |
Income tax expense (benefit)—current, at statutory tax rates | | | | | | | | | | | | |
Company | | | | | | | | | | | | |
Tax expense from tax correction from previous year | | | 836 | | | | 103,224 | | | | — | |
Subsidiaries | | | | | | | | | | | | |
Income tax expense—current | | | 120,177 | | | | 123,852 | | | | 120,321 | |
Tax expense (benefit) from tax correction from previous year | | | 1,829 | | | | 7,353 | | | | (2,165 | ) |
| | | | | | | | | | | | |
Income tax expense—current—net | | | 122,842 | | | | 234,429 | | | | 118,156 | |
| | | | | | | | | | | | |
Income tax expense (benefit)—deferred—effect of temporary differences at enacted maximum tax rates (25% in 2011, 2012 and 2013) | | | | | | | | | | | | |
Company | | | | | | | | | | | | |
Equity in net income of investees | | | 53,215 | | | | 49,409 | | | | 45,783 | |
Amortization of goodwill and other intangible assets | | | 43,333 | | | | 37,629 | | | | 32,249 | |
Adjustment due to tax audit and others | | | — | | | | 824 | | | | 14,018 | |
Gain on outright sale of assets being leased | | | — | | | | — | | | | 13,810 | |
Write-off of accounts receivable (provision for impairment of
receivables)—net | | | (6,877 | ) | | | (12,496 | ) | | | 11,429 | |
Loss (gain) on sale of property and equipment—net | | | (54,348 | ) | | | (31,149 | ) | | | 10,391 | |
Write-off of short-term investment (Note 6) | | | — | | | | — | | | | 6,349 | |
Amortization of debt and bonds issuance costs, consent solicitation fees and discount (Notes 18 and 19) | | | (3,670 | ) | | | (6,310 | ) | | | 4,112 | |
Depreciation—net | | | 307,104 | | | | (214,121 | ) | | | (658,123 | ) |
Charges from leasing transaction | | | (12,298 | ) | | | (33,733 | ) | | | (170,159 | ) |
Utilization of tax losses carry-forward (tax loss) | | | (66,731 | ) | | | 93,925 | | | | (45,392 | ) |
Accrual of employee benefits—net | | | 28,919 | | | | (41,635 | ) | | | (31,138 | ) |
Provision for termination, gratuity and compensation benefits of
employees—net | | | (232 | ) | | | (11,981 | ) | | | (8,061 | ) |
Net periodic pension cost | | | 3,847 | | | | 560 | | | | (4,612 | ) |
Amortization of long-term prepaid licenses | | | 3,314 | | | | (858 | ) | | | (4,069 | ) |
Reversal of deferred tax liabilities from tower sale transactions | | | — | | | | (91,938 | ) | | | — | |
Others | | | (213 | ) | | | (7,594 | ) | | | (21,408 | ) |
| | | | | | | | | | | | |
Net | | | 295,363 | | | | (269,468 | ) | | | (804,821 | ) |
Deferred income tax benefit—net resulting from reversal of deferred tax liabilities (DTL) on investments in IMM, ISPL and IPBV | | | (109,497 | ) | | | — | | | | — | |
| | | | | | | | | | | | |
Net | | | 185,866 | | | | (269,468 | ) | | | (804,821 | ) |
Subsidiaries | | | | | | | | | | | | |
Depreciation—net | | | (11,934 | ) | | | 5,700 | | | | 9,043 | |
Net periodic pension cost | | | 1,091 | | | | 1,532 | | | | 1,792 | |
Write-off of accounts receivable (provision for impairment of
receivables)—net | | | (3,601 | ) | | | 4,989 | | | | 1,599 | |
Accrued expenses | | | (3,034 | ) | | | 1,270 | | | | (5,887 | ) |
Others | | | (249 | ) | | | 1,031 | | | | 11,454 | |
| | | | | | | | | | | | |
Net | | | (17,727 | ) | | | 14,522 | | | | 18,001 | |
| | | | | | | | | | | | |
Net income tax expense (benefit)—deferred | | | 168,139 | | | | (254,946 | ) | | | (786,820 | ) |
| | | | | | | | | | | | |
Income tax benefit (expense)—net | | | (290,981 | ) | | | 20,517 | | | | 668,664 | |
| | | | | | | | | | | | |
F-74
PT INDOSAT Tbk AND ITS SUBSIDIARIES
NOTES TO CONSOLIDATED FINANCIAL STATEMENTS—(Continued)
as of January 1, 2012 (Restated), December 31, 2012 (Restated) and December 31, 2013
and for the Years ended December 31, 2011 (Restated), 2012 (Restated) and 2013
(Expressed in millions of rupiah and thousands of U.S. dollar, except share and tariff data)
The reconciliation between the income tax expense (benefit) calculated by applying the applicable tax rate of 25% to the profit (loss) before income tax and the income tax expense (benefit)—net as shown in the consolidated statements of comprehensive income for the years ended December 31, 2011, 2012 and 2013 is as follows:
| | | | | | | | | | | | |
| | | 2011
(Restated) | | | 2012
(Restated) | | | 2013 | |
Profit (loss) before income tax | | | 1,408,391 | | | | 469,224 | | | | (3,351,311 | ) |
| | | | | | | | | | | | |
Income tax expense (benefit) at the applicable tax rate of 25% | | | 352,098 | | | | 117,306 | | | | (837,828 | ) |
Company’s equity in Subsidiaries’ profit before income tax and reversal of inter-company consolidation eliminations | | | 43,802 | | | | 59,426 | | | | 64,629 | |
Tax effect on permanent differences | | | | | | | | | | | | |
Tax expenses | | | 2,872 | | | | 3,419 | | | | 75,472 | |
Assessment for income taxes and VAT (including penalties) | | | 3,300 | | | | 2,940 | | | | 46,988 | |
Employee benefits | | | 18,501 | | | | 21,070 | | | | 27,934 | |
Unrecognized deferred tax asset on current tax loss | | | — | | | | 13,278 | | | | 7,011 | |
Donation | | | 9,116 | | | | 6,037 | | | | 5,783 | |
Representation and entertainment | | | 2,218 | | | | 1,679 | | | | 3,305 | |
Amortization of landrights | | | 2,788 | | | | 2,797 | | | | 2,811 | |
Interest income already subject to final tax | | | (21,162 | ) | | | (28,362 | ) | | | (26,632 | ) |
Amortization of deferred gain on tower sale—net already subjected to final tax (Note 29) | | | — | | | | — | | | | (26,447 | ) |
5% final tax on sale of tower | | | — | | | | 46,335 | | | | — | |
Transaction cost for tower sale subjected to final tax | | | — | | | | 14,112 | | | | — | |
Gain on tower sale—net already subject to final tax (Note 29) | | | — | | | | (387,928 | ) | | | — | |
Others | | | (25,633 | ) | | | 538 | | | | (23,565 | ) |
Utilization of tax losses carryforward | | | — | | | | — | | | | (5,179 | ) |
Adjustment due to tax audit and others | | | 9,913 | | | | (3,741 | ) | | | 19,219 | |
Tax expense (benefit) from tax correction from previous year | | | 2,665 | | | | 7,414 | | | | (2,165 | ) |
Tax expense from tax correction on Satelindo’s corporate income tax for fiscal year 2002 | | | — | | | | 103,163 | | | | — | |
Deferred income tax benefit from the reversal of DTL on investments in IMM, ISPL and IPBV | | | (109,497 | ) | | | — | | | | — | |
| | | | | | | | | | | | |
Income tax expense (benefit)—net per consolidated statements of comprehensive income | | | 290,981 | | | | (20,517 | ) | | | (668,664 | ) |
| | | | | | | | | | | | |
F-75
PT INDOSAT Tbk AND ITS SUBSIDIARIES
NOTES TO CONSOLIDATED FINANCIAL STATEMENTS—(Continued)
as of January 1, 2012 (Restated), December 31, 2012 (Restated) and December 31, 2013
and for the Years ended December 31, 2011 (Restated), 2012 (Restated) and 2013
(Expressed in millions of rupiah and thousands of U.S. dollar, except share and tariff data)
| | c. | Deferred tax assets and liabilities |
The tax effects of significant temporary differences between financial and tax reporting of the Company are as follows:
| | | | | | | | | | | | |
| | | January 1, 2012
(Restated) | | | December 31, | |
| | | | 2012
(Restated) | | | 2013 | |
Deferred tax assets | | | | | | | | | | | | |
Accrual of employee benefits—net | | | 259,630 | | | | 376,141 | | | | 226,423 | |
Charges from leasing transaction | | | 18,823 | | | | 52,556 | | | | 222,715 | |
Tax losses carried-forward | | | 352,246 | | | | 216,784 | | | | 195,842 | |
Allowance for impairment of accounts receivable | | | 125,073 | | | | 137,568 | | | | 126,139 | |
Allowance for impairment of investment in associated company and other long-term investment | | | 42,469 | | | | 42,469 | | | | 42,469 | |
Pension cost | | | 20,458 | | | | 27,902 | | | | 2,093 | |
Allowance for impairment of short-term investment | | | 6,349 | | | | 6,349 | | | | — | |
Others | | | 2,145 | | | | 500 | | | | 4,093 | |
| | | | | | | | | | | | |
Total | | | 827,193 | | | | 860,269 | | | | 819,774 | |
| | | | | | | | | | | | |
Deferred tax liabilities | | | | | | | | | | | | |
Property and equipment | | | 2,499,936 | | | | 2,122,016 | | | | 1,435,778 | |
Goodwill and other intangible assets | | | 205,285 | | | | 242,914 | | | | 275,162 | |
Investments in subsidiaries | | | 161,112 | | | | 199,859 | | | | 227,828 | |
Long-term prepaid licenses | | | 16,876 | | | | 16,018 | | | | 11,949 | |
Deferred debt and bonds issuance costs, consent solicitation fees and discount | | | 6,856 | | | | 547 | | | | 4,659 | |
Difference in transactions of equity changes in associated company | | | 1,460 | | | | 1,460 | | | | 1,460 | |
Others | | | 659 | | | | 463 | | | | — | |
| | | | | | | | | | | | |
Total | | | 2,892,184 | | | | 2,583,277 | | | | 1,956,836 | |
| | | | | | | | | | | | |
Deferred tax liabilities—net | | | 2,064,991 | | | | 1,723,008 | | | | 1,137,062 | |
| | | | | | | | | | | | |
The breakdown by entity of the deferred tax assets and liabilities for the Group are:
| | | | | | | | | | | | | | | | | | | | | | | | |
| | | January 1, 2012
(Restated) | | | December 31, 2012
(Restated) | | | December 31, 2013 | |
| | | Deferred
Tax
Assets | | | Deferred
Tax
Liabilities | | | Deferred
Tax
Assets | | | Deferred
Tax
Liabilities | | | Deferred
Tax
Assets | | | Deferred
Tax
Liabilities | |
Company | | | — | | | | 2,064,991 | | | | — | | | | 1,723,008 | | | | — | | | | 1,137,062 | |
Subsidiaries | | | | | | | | | | | | | | | | | | | | | | | | |
Lintasarta | | | 85,966 | | | | — | | | | 90,984 | | | | — | | | | 85,020 | | | | | |
IMM | | | 34,633 | | | | — | | | | 23,320 | | | | — | | | | 16,833 | | | | | |
APE | | | — | | | | 5,165 | | | | — | | | | 5,438 | | | | — | | | | 17,958 | |
ISP | | | — | | | | 1,027 | | | | — | | | | 780 | | | | — | | | | 426 | |
SMT | | | — | | | | — | | | | — | | | | — | | | | — | | | | — | |
LMD | | | — | | | | — | | | | — | | | | — | | | | — | | | | — | |
| | | | | | | | | | | | | | | | | | | | | | | | |
Total | | | 120,599 | | | | 2,071,183 | | | | 114,304 | | | | 1,729,226 | | | | 101,853 | | | | 1,155,446 | |
| | | | | | | | | | | | | | | | | | | | | | | | |
F-76
PT INDOSAT Tbk AND ITS SUBSIDIARIES
NOTES TO CONSOLIDATED FINANCIAL STATEMENTS—(Continued)
as of January 1, 2012 (Restated), December 31, 2012 (Restated) and December 31, 2013
and for the Years ended December 31, 2011 (Restated), 2012 (Restated) and 2013
(Expressed in millions of rupiah and thousands of U.S. dollar, except share and tariff data)
The deferred tax assets of Lintasarta relate mainly to the deferred tax on the temporary difference with respect to the recognition of depreciation of property and equipment.
The significant temporary differences on which deferred tax assets have been computed are not deductible for income tax purposes until the accrued employee benefits are paid, the allowance for impairment of receivables is realized upon the write-off of the receivables after fulfilling certain requirements under the Income Tax Law, the allowance for impairment of investments in associated company and other long-term investments is realized upon sale of the investments and the pension cost is paid.
The significant deferred tax liabilities relate to the differences in the book and tax bases of property and equipment, goodwill and other intangible assets, investments in subsidiaries, long-term prepaid licenses, debt and bonds issuance costs, consent solicitation fees and discount.
Prior to 2011, the Company provided for deferred tax liabilities and deferred tax assets relating tothe book-versus-tax-basis differences in its investments in subsidiaries as the Company believed that it was probable the investments for certain subsidiaries would be recovered through the sale of the shares which is a taxable transaction, and for certain subsidiaries the differences would be deductible from ordinary income as a result of a merger. In 2011, the Company re-evaluated its investment strategy including the accounting treatment on the recognition of deferred tax liabilities and deferred tax assets relating to the book-versus-tax-basis differences in investments in subsidiaries and the evaluation of “foreseeable future” and the “more likely than not” judgments. Based on the Company’s evaluation, the deferred tax liabilities are not recognized for temporary differences between the tax and book bases in investments in certain subsidiaries (IMM, ISPL and IPBV) since the Company believes the timing of the reversal of the temporary differences can be controlled and it is probable that the temporary differences will not be reversed in the foreseeable future. Hence, the balance of the deferred tax liabilities on the taxable temporary differences on the investments in IMM, ISPL and IPBV as of January 1, 2011 totaling Rp109,497 was reversed with a credit to current deferred income tax benefit.
As of January 1, 2012/December 31, 2011, December 31, 2012 and 2013, the aggregate amounts of temporary differences associated with investments in subsidiaries, for which deferred tax liabilities have not been recognized were Rp390,256, Rp406,962 and Rp451,447, respectively.
Realization of the deferred tax assets is dependent upon the Company and subsidiaries’ capability in generating future profitable operations. Although realization is not assured, the Company and subsidiaries believe that it is probable that these deferred tax assets will be realized through reduction of future taxable income when temporary differences reverse. The amount of the deferred tax assets is considered realizable; however, it could be reduced if actual future taxable income is lower than estimates.
SMT did not recognize deferred tax asset on the tax losses carried-forward as it is not probable that taxable income will be available against which the tax losses carried-forward can be utilized. If SMT was able to recognize all unrecognized deferred tax assets, the profit would increase by Rp43,149.
F-77
PT INDOSAT Tbk AND ITS SUBSIDIARIES
NOTES TO CONSOLIDATED FINANCIAL STATEMENTS—(Continued)
as of January 1, 2012 (Restated), December 31, 2012 (Restated) and December 31, 2013
and for the Years ended December 31, 2011 (Restated), 2012 (Restated) and 2013
(Expressed in millions of rupiah and thousands of U.S. dollar, except share and tariff data)
The tax losses carried-forward of SMT and the Company as of December 31, 2013 can be carried forward through to 2018 based on the following schedule:
| | | | | | | | | | | | |
Year of Expiration | | SMT | | | The Company | | | Total | |
2014 | | | 43,353 | | | | — | | | | 43,353 | |
2015 | | | 46,041 | | | | 500,819 | | | | 546,860 | |
2016 | | | 22,771 | | | | 100,980 | | | | 123,751 | |
2017 | | | 32,390 | | | | — | | | | 32,390 | |
2018 | | | 28,044 | | | | 181,567 | | | | 209,611 | |
| | | | | | | | | | | | |
Total | | | 172,599 | | | | 783,366 | | | | 955,965 | |
| | | | | | | | | | | | |
| | d. | Tax assessment and administration |
On November 28, 2012, the Company received SKPKBs from the DGT for the Company’s 2009 income tax articles 21, 22, 23, 26 and 4(2) totaling Rp4,829 (including penalties), which were charged to the 2012 operations as part of “Expenses—Others—Net”.
On June 26, 2013, the Company received SKPKBs from the DGT for the Company’s 2011 income tax articles 21, 26 and 4 (2) totaling Rp4,171 (include penalties), which were charged to the 2013 operations as part of “Expenses—Others—Net”.
The taxation laws of Indonesia require that the Company and its local subsidiaries submit individual annual corporate income tax return on the basis of self-assessment. Under the prevailing regulations, the DGT may assess or amend taxes within a certain period. For fiscal years 2007 and earlier, this period is within ten years from the time the tax became due, but not later than 2013, while for fiscal years 2008 and onwards, the period is within five years from the time the tax became due.
On November 25, 2013, the Company submitted to the Tax Office a revised 2012 annual corporate income tax return after considering the result of tax audit on 2011 corporate income tax, which increased the estimated taxable income for the year ended December 31, 2012 and decreased the accumulated tax losses carried-forward as of December 31, 2012 by Rp163,561.
The tax audits on the Company’s corporate income tax have been completed for all fiscal years prior to 2012.
F-78
PT INDOSAT Tbk AND ITS SUBSIDIARIES
NOTES TO CONSOLIDATED FINANCIAL STATEMENTS—(Continued)
as of January 1, 2012 (Restated), December 31, 2012 (Restated) and December 31, 2013
and for the Years ended December 31, 2011 (Restated), 2012 (Restated) and 2013
(Expressed in millions of rupiah and thousands of U.S. dollar, except share and tariff data)
17. ACCRUED EXPENSES
This account consists of the following:
| | | | | | | | | | | | |
| | | | | | December 31, | |
| | | January 1, 2012
(Restated) | | | 2012
(Restated) | | | 2013 | |
Employee benefits (Notes 22, 30c4 and 30d4) | | | 180,441 | | | | 200,033 | | | | 359,745 | |
Interest | | | 319,880 | | | | 331,101 | | | | 344,019 | |
Network repairs and maintenance | | | 288,731 | | | | 229,921 | | | | 233,392 | |
Internet circuit | | | 55,593 | | | | 60,646 | | | | 176,519 | |
Marketing | | | 214,907 | | | | 235,957 | | | | 165,008 | |
Dealer incentives (Note 2f5.1) | | | 82,615 | | | | 170,115 | | | | 146,355 | |
Rental | | | 59,929 | | | | 95,200 | | | | 107,898 | |
Utilities | | | 58,609 | | | | 87,669 | | | | 103,590 | |
Radio frequency fee | | | 283,588 | | | | 214,653 | | | | 95,109 | |
Universal Service Obligation (“USO”) | | | 59,716 | | | | 92,916 | | | | 92,711 | |
Blackberry access fee | | | 79,627 | | | | 48,666 | | | | 84,914 | |
Consultancy fees | | | 35,309 | | | | 44,331 | | | | 63,716 | |
Concession fee | | | 39,507 | | | | 41,277 | | | | 30,667 | |
General and administration | | | 31,119 | | | | 34,772 | | | | 27,392 | |
Others (each below Rp20,000) | | | 106,042 | | | | 74,028 | | | | 76,432 | |
| | | | | | | | | | | | |
Total | | | 1,895,613 | | | | 1,961,285 | | | | 2,107,467 | |
| | | | | | | | | | | | |
18. LOANS PAYABLE
This account consists of the following:
| | | | | | | | | | | | |
| | | | | | December 31, | |
| | | January 1, 2012 | | | 2012 | | | 2013 | |
Third parties—net* | | | 8,727,473 | | | | 6,373,040 | | | | 6,788,634 | |
Related party (Note 31) | | | | | | | | | | | | |
Mandiri—net** | | | 998,843 | | | | — | | | | — | |
| | | | | | | | | | | | |
Total loans payable | | | 9,726,316 | | | | 6,373,040 | | | | 6,788,634 | |
| | | | | | | | | | | | |
Less current maturities—net*** | | | | | | | | | | | | |
Third parties | | | 2,301,694 | | | | 2,669,218 | | | | 2,443,367 | |
Related party | | | 998,843 | | | | — | | | | — | |
| | | | | | | | | | | | |
Total current maturities | | | 3,300,537 | | | | 2,669,218 | | | | 2,443,367 | |
| | | | | | | | | | | | |
Long-term portion | | | | | | | | | | | | |
Third parties | | | 6,425,779 | | | | 3,703,822 | | | | 4,345,267 | |
| | | | | | | | | | | | |
| | | 6,425,779 | | | | 3,703,822 | | | | 4,345,267 | |
| | | | | | | | | | | | |
| * | net of unamortized debt issuance cost and consent solicitation fee of Rp146,511 as of January 1, 2012, Rp111,333 as of December 31, 2012, and Rp80,364 as of December 31, 2013; and unamortized debt discount of Rp11,891 as of January 1, 2012 and Rp3,682 as of December 31, 2012 |
F-79
PT INDOSAT Tbk AND ITS SUBSIDIARIES
NOTES TO CONSOLIDATED FINANCIAL STATEMENTS—(Continued)
as of January 1, 2012 (Restated), December 31, 2012 (Restated) and December 31, 2013
and for the Years ended December 31, 2011 (Restated), 2012 (Restated) and 2013
(Expressed in millions of rupiah and thousands of U.S. dollar, except share and tariff data)
| ** | net of unamortized debt issuance cost and consent solicitation fee of Rp1,157 on January 1, 2012 |
| *** | net of unamortized debt issuance cost and consent solicitation fees of Rp2,295 as of January 1, 2012, Rp6,415 as of December 31, 2012 and Rp41 as of December 31, 2013. |
The loans from third parties consist of the following:
| | | | | | | | | | | | |
| | | | | | December 31, | |
| | | January 1, 2012 | | | 2012 | | | 2013 | |
AB Svensk Exportkredit (“SEK”), Sweden with Guarantee from Exportkreditnamnden (“EKN”)—net of unamortized debt issuance cost of Rp26,434 in 2011, Rp21,351 in 2012 and Rp12,887 in 2013 | | | 2,127,216 | | | | 1,840,124 | | | | 1,784,991 | |
BCA Revolving Time Loan—net of unamortized debt issuance cost of Rp736 in 2011, Rp413 in 2012 and Rp41 in 2013 | | | 1,499,264 | | | | 999,587 | | | | 1,499,959 | |
HSBC France—net of unamortized debt issuance cost and consent solicitation fee of Rp104,536 in 2011, Rp84,315 in 2012 and Rp63,235 in 2013 | | | 1,356,403 | | | | 1,278,872 | | | | 1,409,586 | |
BCA Investment Credit Facility—net of unamortized debt issuance cost of Rp1,558 | | | — | | | | — | | | | 998,442 | |
Bank Sumitomo Mitsui Indonesia (“BSMI”) Revolving Time Loan—net of unamortized debt issuance cost of Rp971 in 2012 and Rp645 in 2013 | | | — | | | | 99,029 | | | | 649,355 | |
PT Indonesia Infrastructure Finance and PT Sarana Multi Infrastruktur (“IIF & SMI”) Revolving Time Loan—net of unamortized debt issuance cost of Rp1,096 | | | — | | | | — | | | | 298,904 | |
9-Year Commercial Loan—net of unamortized debt issuance cost and consent solicitation fee of Rp2,046 in 2011, Rp1,550 in 2012 and Rp902 in 2013 | | | 181,834 | | | | 155,318 | | | | 147,397 | |
Syndicated U.S. Dollar Loan Facility—net of unamortized debt issuance cost and consent solicitation fee of Rp11,621 in 2011 and Rp2,733 in 2012 | | | 2,069,484 | | | | 1,520,292 | | | | — | |
Goldman Sachs International (“GSI”) | | | | | | | | | | | | |
Principal, net of unamortized debt discount of Rp11,891 in 2011 and Rp3,682 in 2012 | | | 422,409 | | | | 479,818 | | | | — | |
Foreign Exchange (FX) Conversion Option—net of credit risk adjustment | | | 49,518 | | | | — | | | | — | |
BCA—net of unamortized debt issuance cost and consent solicitation fee of Rp1,138 | | | 998,862 | | | | — | | | | — | |
Investment Credit Facility 6 from CIMB Niaga | | | 22,483 | | | | — | | | | — | |
| | | | | | | | | | | | |
Total | | | 8,727,473 | | | | 6,373,040 | | | | 6,788,634 | |
Less current maturities (net of unamortized debt issuance costs and consent solicitation fees totaling Rp2,295 in 2011, Rp6,415 in 2012 and Rp41 in 2013) | | | 2,301,694 | | | | 2,669,218 | | | | 2,443,367 | |
| | | | | | | | | | | | |
Long-term portion | | | 6,425,779 | | | | 3,703,822 | | | | 4,345,267 | |
| | | | | | | | | | | | |
F-80
PT INDOSAT Tbk AND ITS SUBSIDIARIES
NOTES TO CONSOLIDATED FINANCIAL STATEMENTS—(Continued)
as of January 1, 2012 (Restated), December 31, 2012 (Restated) and December 31, 2013
and for the Years ended December 31, 2011 (Restated), 2012 (Restated) and 2013
(Expressed in millions of rupiah and thousands of U.S. dollar, except share and tariff data)
The details of the loans from a related party and third parties are as follows:
| | | | | | | | | | |
Counterparties | | Loan Type | | Maturity | | Amount | | Interest Structure | | Remarks on Repayment
and Others |
a. Mandiri* | | • 5-year unsecured credit facility 1 • Loan drawdowns were paid annually | | September 18, 2012 | | Rp2,000,000 | | • Year 1: 9.75% p.a. • Year 2: 10.5% p.a. • Years 3-5: average3-month JIBOR + 1.5% p.a. • Paid quarterly | | • Without penalty if the repayment was made after the 24thmonth after the agreement date subject to 7 days’ prior written notice • With penalty of 2% of the prepaid amount for repayment prior to the 24thmonth after the agreement date • On June 21, 2012, the Company obtained the consent letter from Mandiri for the sale of asset transaction (Note 29). • In September 2012, this loan was fully repaid. |
| | | | | |
b. SEK Sweden with Guarantee from EKN | | • Credit facilities consisting of Facilities A, B and C with maximum amounts of US$100,000, US$155,000 and US$60,000, respectively • Loan drawdowns are payablesemi-annually | | May 31, 2016 for Facility A, February 28, 2017 for Facility B and November 30, 2017 for Facility C | | US$315,000 | | • Facility A: Margin of 0.25% London Inter-Bank Offered Rate (“LIBOR”), SEK Funding Cost of 1.05% and EKN Premium Margin of 1.57% • Facility B: Margin of 0.05%, Commercial Interest Reference Rate (“CIRR”) and EKN Premium Margin of 1.61% • Facility C: Margin of 0.05%, CIRR and EKN Premium Margin of 1.59% • Payablesemi-annually. | | • Permitted only in proportionate amount for each of Facilities A, B and C, after the last day of the availability period and on a repayment date subject to 20 days’ prior written Notice • In minimum amount of US$5,000 and in an amount divisible by US$500 • Any repayment shall satisfy the obligation of loan repayment in inverse chronological order • On June 18, 2012, the Company amended its credit facility agreement with HSBC Bank Plc, as facility agent. The amendment included changes in definition of certain terms related to sale of asset transactions (Note 29). |
F-81
PT INDOSAT Tbk AND ITS SUBSIDIARIES
NOTES TO CONSOLIDATED FINANCIAL STATEMENTS—(Continued)
as of January 1, 2012 (Restated), December 31, 2012 (Restated) and December 31, 2013
and for the Years ended December 31, 2011 (Restated), 2012 (Restated) and 2013
(Expressed in millions of rupiah and thousands of U.S. dollar, except share and tariff data)
| | | | | | | | | | |
Counterparties | | Loan Type | | Maturity | | Amount | | Interest Structure | | Remarks on Repayment
and Others |
c. BCA | | • Revolving time loan with maximum amount of Rp1,000,000 • Each drawdown matures 1 month from the drawdown date. Subsequently, on August 9, 2011, the Company obtained an approval from BCA to amend the maturity date of each drawdown to become at the latest on February 10, 2014. • On December 1, 2011, the facility amount was increased to Rp1,500,000 and the interest rate was changed. | | February 10, 2014 (Note 37j) | | Rp1,500,000 | | • JIBOR + 1.4% p.a. However, starting December 1, 2011, JIBOR + 1.25% p.a., starting July 26, 2013, JIBOR + 1.5% p.a., starting August 26, 2013,JIBOR+ 1.75% p.a., starting December 26, 2013, JIBOR +2.00% p.a. • Payable monthly (Note 37g) | | • Permitted subject to 1 day prior written notice, the Company may repay the whole or any part of the loan. • On June 11, 2012, the Company obtained the consent letter from BCA for the sale of asset transaction (Note 29). • On December 19, 2012, the Company amended its credit facility agreement with BCA. The amendment included changes in definition of certain terms related to sale of asset transaction (Note 29). |
| | | | | |
d. HSBC France | | • 12 year - COFACE term facility • Payable in twenty semi-annual Installments | | September 30, 2019 | | US$157,243 | | • 5.69% p.a. • Payablesemi-annually | | • Permitted with a corresponding proportionate voluntary prepayment under the SINOSURE Facility after the last day of the availability period and on a repayment date subject to 30 days’ prior written notice • In minimum amount of US$10,000 and in an amount divisible by US$1,000 • Any repayment shall satisfy the obligation of loan repayment in inverse chronological order • On June 18, 2012, the Company amended its COFACE credit facility agreement with HSBC France, as facility agent. The amendment included changes in definition of certain terms related to sale of asset transactions (Note 29). |
F-82
PT INDOSAT Tbk AND ITS SUBSIDIARIES
NOTES TO CONSOLIDATED FINANCIAL STATEMENTS—(Continued)
as of January 1, 2012 (Restated), December 31, 2012 (Restated) and December 31, 2013
and for the Years ended December 31, 2011 (Restated), 2012 (Restated) and 2013
(Expressed in millions of rupiah and thousands of U.S. dollar, except share and tariff data)
| | | | | | | | | | |
Counterparties | | Loan Type | | Maturity | | Amount | | Interest Structure | | Remarks on Repayment
and Others |
d. HSBC France (continued) | | • 12 year - SINOSURE term Facility • Payable in twenty semi-annual Installments | | September 30, 2019 | | US$44,200 | | • USD LIBOR + 0.35% p.a. • Payablesemi-annually | | • Permitted with a corresponding proportionate voluntary prepayment under the COFACE Facility after the last day of the availability period and on a repayment date subject to 30 days’ prior written notice • In minimum amount of US$10,000 and in an amount divisible by US$1,000 • Any repayment shall satisfy the obligation of loan repayment in inverse chronological order • On July 23, 2012, the Company amended its SINOSURE credit facility agreement with HSBC France, as facility agent. The amendment included changes in definition of certain terms related to sale of asset transaction (Notes 29). |
| | | | | |
e. BCA | | • 5 year - investment credit facility • Payable annually | | December 12, 2018 | | Rp1,000,000 | | • 8.7% p.a. However, starting August 26, 2013, 9.00% p.a., starting September 26, 2013, 9.25% p.a., starting December 26, 2013, 9.50% p.a. (Note 37g) • Payable quarterly | | • The Company may repay the whole or any part of the loan without penalty if the repayment is made on interest payment date and subject to 5 days prior written notice |
| | | | | |
f. BSMI | | • Revolving time loan with maximum amount of Rp650,000 • Each drawdown matures at the maximum of 36 months from the Drawdown date, but not exceeding December 31, 2015. | | December 31, 2015 | | Rp650,000 | | • JIBOR + 1.25% p.a. • Payable monthly quarterly orsemi-annually | | • Permitted subject to 5 days’ prior written notice, the Company may repay the whole or any part of the loan. |
F-83
PT INDOSAT Tbk AND ITS SUBSIDIARIES
NOTES TO CONSOLIDATED FINANCIAL STATEMENTS—(Continued)
as of January 1, 2012 (Restated), December 31, 2012 (Restated) and December 31, 2013
and for the Years ended December 31, 2011 (Restated), 2012 (Restated) and 2013
(Expressed in millions of rupiah and thousands of U.S. dollar, except share and tariff data)
| | | | | | | | | | |
Counterparties | | Loan Type | | Maturity | | Amount | | Interest Structure | | Remarks on Repayment
and Others |
g. IIF & SMI | | • Syndicated revolving time loan with maximum amount of Rp750,000 • Each drawdown matures at the maximum of 36 months from the drawdown date, but not exceeding October 18, 2016 | | October 18, 2016 | | Rp750,000 | | • JIBOR + 2.25% p.a. • Payable quarterly or semi-annually (Note 37a) | | • Permitted subject to 5 days’ prior written notice, the Company may repay the whole or any part of the loan. |
| | | | | |
h. HSBC Jakarta Branch, CIMB Niaga and Bank of China Limited Jakarta Branch | | • 9-year unsecured commercial facility • Payable in fifteen semi-annual payments after 24 months from the date of loan agreement. For the 1st five installments: US$1,351.85 each; and US$2,027.78 each for the remaining installments thereafter | | November 28, 2016 | | US$27,037 | | • USD LIBOR + 1.45% p.a. • Payablesemi-annually | | • Permitted only on each repayment date after the first repayment date subject to 30 days’ prior written notice • In minimum amount of US$5,000 and in an amount divisible by US$1,000 • Any prepayment shall satisfy the obligation of loan repayment proportionately. • On June 20, 2012, the Company amended its credit facility agreement with HSBC Ltd, as facility agent. The amendment included changes in definition of certain terms related to sale of asset transaction (Note 29). |
F-84
PT INDOSAT Tbk AND ITS SUBSIDIARIES
NOTES TO CONSOLIDATED FINANCIAL STATEMENTS—(Continued)
as of January 1, 2012 (Restated), December 31, 2012 (Restated) and December 31, 2013
and for the Years ended December 31, 2011 (Restated), 2012 (Restated) and 2013
(Expressed in millions of rupiah and thousands of U.S. dollar, except share and tariff data)
| | | | | | | | | | |
Counterparties | | Loan Type | | Maturity | | Amount | | Interest Structure | | Remarks on Repayment
and Others |
i. Syndicated U.S. Dollar Loan Facility—12 Financial Institutions** | | • 5-year unsecured credit facility • Loan drawdowns were paidsemi-annually | | June 12, 2013 | | US$450,000 | | • USD LIBOR + 1.90% p.a. (onshore lenders); USD LIBOR + 1.85% p.a. (offshore lenders) • Paid semi-annually | | • Permitted only after the 6th month from the date of loan agreement subject to 15 days’ prior written notice (in the minimum amount of US$10,000 and in an amount divisible by US$1,000). • On June 19, 2012, the Company amended its credit facility agreement with PT Bank DBS Indonesia, as facility agent. The amendment included changes in definition of certain terms related to sale of asset transaction (Note 29). • In June 2013, this loan was fully repaid |
| | | | | |
j. GSI*** | | • Investment loan Provided an “FX Conversion Option” for GSI to convert the loan payable into U.S. dollar loan of US$50,000 on May 30, 2012 (“FX Conversion Option”) • Fair value of FX Conversion Option as of December 31, 2011 and 2010 amounting to US$5,460.78 (equivalent to Rp49,518) and US$6,072.20 (equivalent to Rp54,595), respectively (Note 20) | | May 30, 2013 | | US$50,000 | | • 8.75% p.a. • Paid quarterly • If GSI took FX Conversion Option, starting May 30, 2012, the loan would bear interest at the fixed annual rate of 6.45% applied on the fixed US$50,000 principal | | • Certain changes affecting withholding taxes in the United Kingdom or Indonesia. • Default under Guaranteed Notes due 2012. • Default under the Company’s USD Notes and IDR Bonds. • Redemption, purchase or cancellation of the Guaranteed Notes Due 2012 and there were no USD Indosat Notes outstanding upon such redemption, purchase or cancellation. • Change of control in the Company. • In May 2013, this loan was fully repaid. |
| ** | On October 14, 2011, PT Bank UOB Indonesia (one of lenders under the Syndicated U.S. Dollar Loan Facility) transferred its portion of the loan to UOB Limited (another lender under the Syndicated U.S. Dollar Loan Facility), hence the number of lenders became 12. |
| *** | On May 30, 2012, GSI exercised the FX conversion option to convert the loan into U.S. dollar loan of US$50,000. The Company earned gain from the conversion amounting to Rp5,319 which was credited to Gain on Change in Fair Value of Derivatives—Net. |
F-85
PT INDOSAT Tbk AND ITS SUBSIDIARIES
NOTES TO CONSOLIDATED FINANCIAL STATEMENTS—(Continued)
as of January 1, 2012 (Restated), December 31, 2012 (Restated) and December 31, 2013
and for the Years ended December 31, 2011 (Restated), 2012 (Restated) and 2013
(Expressed in millions of rupiah and thousands of U.S. dollar, except share and tariff data)
| | | | | | | | | | |
Counterparties | | Loan Type | | Maturity | | Amount | | Interest Structure | | Remarks on Repayment
and Others |
k. BCA | | • 5-year unsecured credit facility 1 • Loan drawdowns paid annually | | September 27, 2012 | | Rp2,000,000 | | • Year 1: 9.75% p.a. • Year 2: 10.5% p.a. • Years 3-5: 3-month JIBOR + 1.5% p.a. • Paid quarterly | | • Without penalty if the repayment was made after the 24th month after the agreement date subject to 7 days’ prior written notice • With penalty of 2% of the prepaid amount for repayment prior to the 24th month after the agreement date • On June 11, 2012, the Company obtained the consent letter from BCA for the sale of asset transaction (Note 29) • In September 2012, this loan was fully repaid |
| | | | | |
l. CIMB Niaga | | • Investment credit facility 6 obtained by Lintasarta • Paid quarterly | | August 24, 2012 | | Rp75,000 | | • 14.5% p.a subject to review by CIMB Niaga depending on the market condition • Paid quarterly | | • Permitted only on interest payment date subject to 15 days’ prior written notice, Lintasarta may repay the whole or any part of the loan before the due date only by using the fund from Lintasarta’s operational activities. Repayment using the fund from loans obtained from other parties is allowed with penalty determined by CIMB Niaga. • The loan was collateralized by all equipment (Note 8) purchased from the proceeds of credit facility. • In April 2012, this loan was fully repaid. |
F-86
PT INDOSAT Tbk AND ITS SUBSIDIARIES
NOTES TO CONSOLIDATED FINANCIAL STATEMENTS—(Continued)
as of January 1, 2012 (Restated), December 31, 2012 (Restated) and December 31, 2013
and for the Years ended December 31, 2011 (Restated), 2012 (Restated) and 2013
(Expressed in millions of rupiah and thousands of U.S. dollar, except share and tariff data)
The future scheduled principal payments of all the loans payable as of December 31, 2013 are as follows:
| | | | | | | | | | | | | | | | | | | | | | | | |
| | | Twelve months ending December 31, | |
| | | 2014 | | | 2015 | | | 2016 | | | 2017 | | | 2018 and
thereafter | | | Total | |
In rupiah | | | | | | | | | | | | | | | | | | | | | | | | |
BCA—revolving time loan | | | 1,500,000 | | | | — | | | | — | | | | — | | | | — | | | | 1,500,000 | |
BCA—investment credit facility | | | 100,000 | | | | 100,000 | | | | 150,000 | | | | 150,000 | | | | 500,000 | | | | 1,000,000 | |
BSMI—revolving time loan | | | — | | | | 650,000 | | | | — | | | | — | | | | — | | | | 650,000 | |
IIF & SMI—revolving time loan | | | — | | | | — | | | | 300,000 | | | | — | | | | — | | | | 300,000 | |
| | | | | | | | | | | | | | | | | | | | | | | | |
Sub-total | | | 1,600,000 | | | | 750,000 | | | | 450,000 | | | | 150,000 | | | | 500,000 | | | | 3,450,000 | |
| | | | | | | | | | | | | | | | | | | | | | | | |
In U.S. dollar | | | | | | | | | | | | | | | | | | | | | | | | |
SEK, Sweden (US$147,500) | | | 548,505 | | | | 548,505 | | | | 461,441 | | | | 239,427 | | | | — | | | | 1,797,878 | |
HSBC France (US$120,832.02) | | | 245,470 | | | | 245,470 | | | | 245,470 | | | | 245,470 | | | | 490,941 | | | | 1,472,821 | |
9-Year Commercial Facility (US$12,166.65) | | | 49,433 | | | | 49,433 | | | | 49,433 | | | | — | | | | — | | | | 148,299 | |
| | | | | | | | | | | | | | | | | | | | | | | | |
Sub-total | | | 843,408 | | | | 843,408 | | | | 756,344 | | | | 484,897 | | | | 490,941 | | | | 3,418,998 | |
| | | | | | | | | | | | | | | | | | | | | | | | |
Total | | | 2,443,408 | | | | 1,593,408 | | | | 1,206,344 | | | | 634,897 | | | | 990,941 | | | | 6,868,998 | |
| | | | | | | | | | | | | | | | | | | | | | | | |
Less: | | | | | | | | | | | | | | | | | | | | | | | | |
—unamortized debt issuance costs and consent solicitation fees | | | | (80,364 | ) |
| | | | | | | | | | | | | | | | | | | | | | | | |
Net | | | | 6,788,634 | |
| | | | | | | | | | | | | | | | | | | | | | | | |
All loans are neither collateralized by any specific Group assets nor guaranteed by other parties, except for the assets that have been specifically used as security in Note 18l.
The total amortization of debt issuance, discount and consent solicitation fees on the loans for the years ended December 31, 2011, 2012 and 2013 amounted to Rp63,731, Rp65,269 and Rp37,403, respectively (Note 28).
As of January 1, 2012, December 31, 2012 and 2013, the Group has complied with all financial ratios required to be maintained under the loan agreements.
F-87
PT INDOSAT Tbk AND ITS SUBSIDIARIES
NOTES TO CONSOLIDATED FINANCIAL STATEMENTS—(Continued)
as of January 1, 2012 (Restated), December 31, 2012 (Restated) and December 31, 2013
and for the Years ended December 31, 2011 (Restated), 2012 (Restated) and 2013
(Expressed in millions of rupiah and thousands of U.S. dollar, except share and tariff data)
19. BONDS PAYABLE
This account consists of the following:
| | | | | | | | | | | | | | |
| | | | | January 1, 2012 | | | December 31, | |
| | | | | | 2012 | | | 2013 | |
| a) | | Guaranteed Notes Due 2020—net of unamortized notes issuance cost of Rp58,420 in 2011, Rp73,454 in 2012 and Rp64,407 in 2013, and discount of Rp26,208 in 2011, Rp23,154 in 2012 and Rp20,100 in 2013 | | | 5,809,572 | | | | 6,188,892 | | | | 7,838,343 | |
| b) | | Eighth Indosat Bonds in Year 2012 with Fixed Rates—net of unamortized bonds issuance cost and consent solicitation fees of Rp8,478 in 2012 and Rp7,696 in 2013 | | | — | | | | 2,691,522 | | | | 2,692,304 | |
| c) | | Fifth Indosat Bonds in Year 2007 with Fixed Rates—net of unamortized bonds issuance cost and consent solicitation fees of Rp9,102 in 2011, Rp7,061 in 2012 and Rp4,657 in 2013 | | | 2,590,898 | | | | 2,592,939 | | | | 2,595,343 | |
| d) | | Seventh Indosat Bonds in Year 2009 with Fixed Rates—net of unamortized bonds issuance cost of Rp4,442 in 2011, Rp3,454 in 2012 and Rp2,292 in 2013 | | | 1,295,558 | | | | 1,296,546 | | | | 1,297,708 | |
| e) | | Indosat Sukuk Ijarah II in Year 2007—net of unamortized bonds issuance cost and consent solicitation fees of Rp1,124 in 2011, Rp698 in 2012 and Rp214 in 2013 | | | 398,876 | | | | 399,302 | | | | 399,786 | |
| f) | | Sixth Indosat Bonds in Year 2008 with Fixed Rates—net of unamortized bonds issuance cost and consent solicitation fees of Rp3,603 in 2011, Rp1,609 in 2012 and Rp673 in 2013 | | | 1,076,397 | | | | 1,078,391 | | | | 319,327 | |
| g) | | Indosat Sukuk Ijarah V in Year 2012—net of unamortized bonds issuance cost and consent solicitation fees of Rp930 in 2012 and Rp818 in 2013 | | | — | | | | 299,070 | | | | 299,182 | |
| h) | | Indosat Sukuk Ijarah IV in Year 2009—net of unamortized bonds issuance cost of Rp754 in 2011, Rp627 in 2012 and Rp476 in 2013 | | | 199,246 | | | | 199,373 | | | | 199,524 | |
| i) | | Indosat Sukuk Ijarah III in Year 2008—net of unamortized bonds issuance cost and consent solicitation fees of Rp1,545 in 2011 and Rp353 in 2012 | | | 568,455 | | | | 569,647 | | | | — | |
| j) | | Second Indosat Bonds in Year 2002 with Fixed and Floating Rates—net of unamortized consent solicitation fees of Rp649 | | | 199,351 | | | | — | | | | — | |
| k) | | Limited Bonds II issued by Lintasarta* | | | 25,000 | | | | — | | | | — | |
| l) | | Limited Bonds I issued by Lintasarta** | | | 16,989 | | | | — | | | | — | |
| | | | | | | | | | | | | | |
Total bonds payable | | | 12,180,342 | | | | 15,315,682 | | | | 15,641,517 | |
Less current maturities (net of unamortized bonds issuance cost and consent solicitation fees totaling Rp825 in 2012 and Rp1,690 in 2013) | | | 41,989 | | | | 1,329,175 | | | | 2,356,310 | |
| | | | | | | | | | | | | | |
Long-term portion | | | 12,138,353 | | | | 13,986,507 | | | | 13,285,207 | |
| | | | | | | | | | | | | | |
| * | After elimination of Limited Bonds II amounting to Rp35,000 issued to the Company on January 1, 2012. Lintasarta made early repayment of such amount on December 29, 2011. |
| ** | After elimination of Limited Bonds I amounting to Rp9,564 issued to the Company on January 1, 2012. Lintasarta made early repayment of such amount on December 29, 2011. |
F-88
PT INDOSAT Tbk AND ITS SUBSIDIARIES
NOTES TO CONSOLIDATED FINANCIAL STATEMENTS—(Continued)
as of January 1, 2012 (Restated), December 31, 2012 (Restated) and December 31, 2013
and for the Years ended December 31, 2011 (Restated), 2012 (Restated) and 2013
(Expressed in millions of rupiah and thousands of U.S. dollar, except share and tariff data)
| | | | | | | | |
Bond | | Nominal
Amount | | Interest | | Maturity | | Remarks |
a. Guaranteed Notes Due 2020 | | US$650,000 | | • 7.375% p.a. • Payable semi-annually | | July 29, 2020 | | The notes are redeemable at the option of IPBV: • Prior to July 29, 2013, the Issuer may redeem up to a maximum of 35% of the original aggregate Notes issued with the proceeds of one or more Public Offerings at a redemption price equal to 107.375% of the principal amount. • Prior to July 29, 2015, the Issuer will be entitled at its option to redeem all or any portion of the Notes at a redemption price equal to 100% of the principal amount of the Notes plus the Applicable Premium. • On and after July 29, 2015, the Issuer may redeem the Notes in whole or in part at any time and from time to time at the certain redemption prices. • At any time, upon not less than 30 days’ nor more than 60 days’ prior notice, the Issuer may redeem the Notes at a price equal to 100% of the principal amount thereof, plus any accrued and unpaid interest to (but not including) the redemption date and any additional amounts, in the event of certain changes affecting withholding taxes in Indonesia and the Netherlands. • Upon a change in control of IPBV, the holder of the notes has the right to require IPBV to repurchase all or any part of such holder’s notes. • Based on latest rating reports (released in November, August and June 2013, the notes have BB+ (watch positive), Ba1 (stable outlook) and BBB (stable outlook) ratings from Standard & Poor’s (“S&P”), Moody’s Investors Service (“Moody’s”) and Fitch Ratings (“Fitch”), respectively. |
F-89
PT INDOSAT Tbk AND ITS SUBSIDIARIES
NOTES TO CONSOLIDATED FINANCIAL STATEMENTS—(Continued)
as of January 1, 2012 (Restated), December 31, 2012 (Restated) and December 31, 2013
and for the Years ended December 31, 2011 (Restated), 2012 (Restated) and 2013
(Expressed in millions of rupiah and thousands of U.S. dollar, except share and tariff data)
| | | | | | | | |
Bond | | Nominal
Amount | | Interest | | Maturity | | Remarks |
b. Eighth Indosat Bonds in Year 2012 | | | | | | | | |
| | | | |
• Series A | | Rp1,200,000 | | • 8.625% p.a. • Payable quarterly | | June 27, 2019 | | • The Company can buy back part or all of the bonds, after the 1st anniversary of the bonds, at market price temporarily or as an early settlement. • Based on the latest rating report released in March 2013, the bonds haveidAA+ rating from PT Pemeringkat Efek Indonesia (“Pefindo”). |
| | | | |
• Series B | | Rp1,500,000 | | • 8.875% p.a. • Payable quarterly | | June 27, 2022 | | |
| | | | |
c. Fifth Indosat Bonds in Year 2007 | | | | | | | | |
| | | | |
• Series A | | Rp1,230,000 | | • 10.20% p.a. • Payable quarterly | | May 29, 2014 | | • The Company can buy back part or all of the bonds, after the 1st anniversary of the bonds, at market price temporarily or as an early settlement. • Based on the latest rating report released in March 2013, the bonds haveidAA+ rating from Pefindo. |
| | | | |
• Series B | | Rp1,370,000 | | • 10.65% p.a. • Payable quarterly | | May 29, 2017 | | |
| | | | |
d. Seventh Indosat Bonds in Year 2009 | | | | | | | | |
| | | | |
• Series A | | Rp700,000 | | • 11.25% p.a. • Payable quarterly | | December 8, 2014 | | • The Company can buy back part or all of the bonds, after the 1st anniversary of the bonds, at market price temporarily or as an early settlement. • Based on the latest rating report released in March 2013, the bonds haveidAA+ rating from Pefindo. |
| | | | |
• Series B | | Rp600,000 | | • 11.75% p.a. • Payable quarterly | | December 8, 2016 | | |
F-90
PT INDOSAT Tbk AND ITS SUBSIDIARIES
NOTES TO CONSOLIDATED FINANCIAL STATEMENTS—(Continued)
as of January 1, 2012 (Restated), December 31, 2012 (Restated) and December 31, 2013
and for the Years ended December 31, 2011 (Restated), 2012 (Restated) and 2013
(Expressed in millions of rupiah and thousands of U.S. dollar, except share and tariff data)
| | | | | | | | |
Bond | | Nominal
Amount | | Interest | | Maturity | | Remarks |
| | | | |
e. Indosat Sukuk Ijarah II in Year 2007 (“Sukuk Ijarah II”) | | Rp400,000 | | • Bondholders are entitled to annual fixed Ijarah return (“Cicilan Imbalan Ijarah”) totaling Rp40,800, payable on a quarterly basis starting August 29, 2007 up to May 29, 2014. | | May 29, 2014 | | • The Company can buy back part or all of the bonds, after the 1st anniversary of the bonds, at market price • Based on the latest rating report released in March 2013, the bonds haveidAA+(sy) rating from Pefindo. |
| | | | |
f. Sixth Indosat Bonds in Year 2008 | | | | | | | �� | |
| | | | |
• Series A | | Rp760,000 | | • 10.25% p.a. • Paid quarterly | | April 9, 2013 | | • The Company had the option to buy back part or all of the bonds after the 1st anniversary of the bonds, at market price temporarily or as an early settlement. • Based on the latest rating report released in March 2013, the bonds haveidAA+ rating from Pefindo. • On April 9, 2013, the Company paid the series A bonds in full. |
| | | | |
• Series B | | Rp320,000 | | • 10.80% p.a. • Payable quarterly | | April 9, 2015 | | |
| | | | |
g. Indosat Sukuk Ijarah V in Year 2012 (“Sukuk Ijarah V”) | | Rp300,000 | | • Bondholders are entitled to annual fixed Ijarah return (“Cicilan Imbalan Ijarah”) totaling Rp25,875, payable on a quarterly basis starting September 27, 2012 up to June 27, 2019. | | June 27, 2019 | | • The Company can buy back part or all of the bonds, after the 1st anniversary of the bonds, at market price. • Based on the latest rating report released in March 2013, the bonds haveidAA+(sy) rating from Pefindo. |
| | | | |
h. Indosat Sukuk Ijarah IV in Year 2009 (“Sukuk Ijarah IV”) | | | | | | | | |
| | | | |
• Series A | | Rp28,000 | | • Bondholders are entitled to annual fixed ijarah return (“Cicilan Imbalan Ijarah”) totaling Rp3,150, payable on a quarterly basis starting March 8, 2010 up to December 8, 2014. | | December 8, 2014 | | • The Company can buy back part or all of the bonds, after the 1st anniversary of the bonds, at market price. • Based on the latest rating report released in March 2013, the bonds haveidAA+(sy) rating from Pefindo. |
F-91
PT INDOSAT Tbk AND ITS SUBSIDIARIES
NOTES TO CONSOLIDATED FINANCIAL STATEMENTS—(Continued)
as of January 1, 2012 (Restated), December 31, 2012 (Restated) and December 31, 2013
and for the Years ended December 31, 2011 (Restated), 2012 (Restated) and 2013
(Expressed in millions of rupiah and thousands of U.S. dollar, except share and tariff data)
| | | | | | | | |
Bond | | Nominal
Amount | | Interest | | Maturity | | Remarks |
• Series B | | Rp172,000 | | • Bondholders are entitled to annual fixed ijarah return (“Cicilan Imbalan Ijarah”) totaling Rp20,210, paid on a quarterly basis starting March 8, 2010 up to December 8, 2016. | | December 8, 2016 | | |
| | | | |
i. Indosat Sukuk Ijarah III in Year 2008 (“Sukuk Ijarah III”) | | Rp570,000 | | • Bondholders were entitled to annual fixed Ijarah return (“Cicilan Imbalan Ijarah”)totaling Rp58,425, paid on a quarterly basis starting July 9, 2008 up to April 9, 2013. | | April 9, 2013 | | • The Company had the option to buy back part or all of the bonds, after the 1st anniversary of the bonds, at market price. • Based on the latest rating report released in March 2013, the bonds haveidAA+(sy) (stable outlook) rating from Pefindo. • On April 9, 2013, the Company paid the bonds in full. |
| | | | |
j. Second Indosat Bonds in Year 2002—Series B | | Rp200,000 | | • 16% p.a. • Paid quarterly | | November 6, 2032 | | • The Company had call option on the 10th, 15th, 20th and 25th anniversaries of the bonds at 101% of the bonds’ nominal value and the bondholder had sell option if the rating of the bonds decreased toidAA- or lower or on the 15th, 20th and 25th anniversaries of the bonds. • Based on the latest rating report released in June 2012, the bonds hadidAA+ from Pefindo • On November 6, 2012, the Company exercised the right to redeem in full the remaining outstanding Second Indosat Bonds at 101% price |
| | | | |
k. Limited Bonds II issued by Lintasarta (amended on August 25, 2009) | | Rp66,150, with the remaining amount of Rp60,000 since June 14, 2009 | | • Average 3-month rupiah time deposit rates with Mandiri, BNI, BRI and BTN, plus a fixed premium of 3%. The maximum limit of floating rates was 19% and the minimum limit was 11% p.a. and starting June 14, 2009, the minimum limit increased to 12.75%. • Paid quarterly | | June 14, 2009 extended to June 14, 2012 | | • On February 29, 2012, Lintasarta paid these bonds in full. |
F-92
PT INDOSAT Tbk AND ITS SUBSIDIARIES
NOTES TO CONSOLIDATED FINANCIAL STATEMENTS—(Continued)
as of January 1, 2012 (Restated), December 31, 2012 (Restated) and December 31, 2013
and for the Years ended December 31, 2011 (Restated), 2012 (Restated) and 2013
(Expressed in millions of rupiah and thousands of U.S. dollar, except share and tariff data)
| | | | | | | | |
Bond | | Nominal
Amount | | Interest | | Maturity | | Remarks |
l. Limited Bonds I issued by Lintasarta (amended on August 25, 2009) | | Rp34,856, with the remaining amount of Rp26,553 since June 2, 2009 | | • Average 3-month rupiah time deposit rates with Mandiri, BNI, BRI and BTN, plus a fixed premium of 3%. The maximum limit of floating rates was 19% and the minimum limit was 11% p.a. and starting June 14, 2009, the minimum limit increased to 12.75%. • Paid quarterly | | June 2, 2009 extended to June 2, 2012 | | • On January 31, 2012, Lintasarta paid these bonds in full. |
The future scheduled principal payments of all the bonds payable outstanding as of December 31, 2013 are as follows:
| | | | | | | | | | | | | | | | | | | | | | | | |
| | | Twelve months ending December 31, | |
| | | 2014 | | | 2015 | | | 2016 | | | 2017 | | | 2018 and
thereafter * | | | Total | |
In U.S. dollar | | | | | | | | | | | | | | | | | | | | | | | | |
Guaranteed Notes Due 2020* (US$650,000) | | | — | | | | — | | | | — | | | | — | | | | 7,922,850 | | | | 7,922,850 | |
| | | | | | | | | | | | | | | | | | | | | | | | |
In Rupiah | | | | | | | | | | | | | | | | | | | | | | | | |
Eighth Indosat Bonds* | | | — | | | | — | | | | — | | | | — | | | | 2,700,000 | | | | 2,700,000 | |
Fifth Indosat Bonds* | | | 1,230,000 | | | | — | | | | — | | | | 1,370,000 | | | | — | | | | 2,600,000 | |
Seventh Indosat Bonds* | | | 700,000 | | | | — | | | | 600,000 | | | | — | | | | — | | | | 1,300,000 | |
Sukuk Ijarah II* | | | 400,000 | | | | — | | | | — | | | | — | | | | — | | | | 400,000 | |
Sixth Indosat Bonds* | | | — | | | | 320,000 | | | | — | | | | — | | | | — | | | | 320,000 | |
Sukuk Ijarah V* | | | — | | | | — | | | | — | | | | — | | | | 300,000 | | | | 300,000 | |
Sukuk Ijarah IV* | | | 28,000 | | | | — | | | | 172,000 | | | | — | | | | — | | | | 200,000 | |
| | | | | | | | | | | | | | | | | | | | | | | | |
Sub-total | | | 2,358,000 | | | | 320,000 | | | | 772,000 | | | | 1,370,000 | | | | 3,000,000 | | | | 7,820,000 | |
| | | | | | | | | | | | | | | | | | | | | | | | |
Total | | | 2,358,000 | | | | 320,000 | | | | 772,000 | | | | 1,370,000 | | | | 10,922,850 | | | | 15,742,850 | |
| | | | | | | | | | | | | | | | | | | | | | | | |
Less: | | | | | | | | | | | | | | | | | | | | | | | | |
—unamortized notes issuance cost | | | | | | | | | | | | | | | | | | | | | | | (64,407 | ) |
—unamortized notes discount | | | | | | | | | | | | | | | | | | | | | | | (20,100 | ) |
—unamortized bonds issuance cost and consent solicitation fees | | | | | | | | | | | | | | | | | | | | | | | (16,826 | ) |
| | | | | | | | | | | | | | | | | | | | | | | | |
Net | | | | | | | | | | | | | | | | | | | | | | | 15,641,517 | |
| | | | | | | | | | | | | | | | | | | | | | | | |
| * | Refer to previous discussion on early repayment options for each bond/note. |
F-93
PT INDOSAT Tbk AND ITS SUBSIDIARIES
NOTES TO CONSOLIDATED FINANCIAL STATEMENTS—(Continued)
as of January 1, 2012 (Restated), December 31, 2012 (Restated) and December 31, 2013
and for the Years ended December 31, 2011 (Restated), 2012 (Restated) and 2013
(Expressed in millions of rupiah and thousands of U.S. dollar, except share and tariff data)
All bonds are neither collateralized by any specific Group assets nor guaranteed by other parties. All of the Group’s assets, except for the assets that were specifically used as security (Note 18l) in 2011 to its other creditors, are used as pari-passu security for all of the Group’s other liabilities including the bonds.
On June 5, 2012, the Company and IPBV entered into a supplemental indenture with Bank of New York Mellon, as a trustee, for the IPBV Guaranteed Notes Due 2020 based on the consent letter received on May 21, 2012 representing 93.21% of the notesholders. The supplemental indenture included the amendment of certain definitions under the previous Guaranteed Notes Due 2020 indentures and the approval for the sale of asset transaction (Note 29).
On June 8, 2012, the Company received the consent letter from BRI, as a trustee, for the Eighth Indosat Bonds, Seventh Indosat Bonds, Sixth Indosat Bonds, Fifth Indosat Bonds, Second Indosat Bonds and Sukuk Ijarah V, IV, III and II regarding the Company’s sale of asset transaction (Note 29).
The total amortization of bonds issuance cost, consent solicitation fees, notes issuance cost and discount for the years ended December 31, 2011, 2012 and 2013 amounted to Rp18,057, Rp23,288 and Rp18,485, respectively (Note 28).
As of January 1, 2012, December 31, 2012 and 2013, the Group has complied with all financial ratios required to be maintained under the Notes Indenture and Trustee Agreements.
20. DERIVATIVES
The Company entered into several swap and forward contracts. Listed below is information related to the contracts and their fair values (net of credit risk adjustment) as of January 1, 2012, December 31, 2012 and 2013:
| | | | | | | | | | | | | | | | | | | | | | | | | | | | | | |
| | | | | | | | Fair Value (Rp) | |
| | | | | Notional Amount
(US$) | | | January 1, 2012 | | | December 31, 2012 | | | December 31, 2013 | |
| | | | | | Receivable | | | Payable | | | Receivable | | | Payable | | | Receivable | | | Payable | |
Cross Currency Swap Contracts: | | | | | | | | | | | | | | | | | | | | | | | | | | | | |
a. | | Standard Chartered (“StandChart”)(1) | | | 25,000 | | | | — | | | | 6,981 | | | | — | | | | — | | | | — | | | | — | |
b. | | StandChart(3) | | | 25,000 | | | | 1,620 | | | | — | | | | — | | | | — | | | | — | | | | — | |
c. | | StandChart(4) | | | 25,000 | | | | 12,608 | | | | — | | | | — | | | | — | | | | — | | | | — | |
d. | | MLIB(2) | |
| 25,000 with
decreasing amount |
| | | 3,639 | | | | — | | | | 7,919 | | | | — | | | | — | | | | — | |
e. | | DBS(2) | |
| 25,000 with
decreasing amount |
| | | 4,271 | | | | — | | | | 7,962 | | | | — | | | | — | | | | — | |
f. | | HSBC, Jakarta Branch(8) | | | 10,000 | | | | — | | | | — | | | | 2,631 | | | | — | | | | — | | | | — | |
g. | | Barclays Bank PLC (“Barclays”)(8) | | | 14,500 | | | | — | | | | — | | | | 3,295 | | | | — | | | | — | | | | — | |
h. | | HSBC, Jakarta Branch(9) | | | 14,000 | | | | — | | | | — | | | | 4,338 | | | | — | | | | — | | | | — | |
i. | | HSBC, Jakarta Branch(10) | | | 11,000 | | | | — | | | | — | | | | 3,762 | | | | — | | | | — | | | | — | |
j. | | GSI | | | 75,000 | | | | — | | | | — | | | | — | | | | — | | | | — | | | | — | |
k. | | MLIB | | | 50,000 | | | | — | | | | — | | | | — | | | | — | | | | — | | | | — | |
l. | | MLIB | | | 25,000 | | | | — | | | | — | | | | — | | | | — | | | | — | | | | — | |
| | | | | | | | | | | | | | | | | | | | | | | | | | | | | | |
Sub-total | | | | | | | 22,138 | | | | 6,981 | | | | 29,907 | | | | — | | | | — | | | | — | |
| | | | | | | | | | | | | | | | | | | | | | | | | | | | | | |
F-94
PT INDOSAT Tbk AND ITS SUBSIDIARIES
NOTES TO CONSOLIDATED FINANCIAL STATEMENTS—(Continued)
as of January 1, 2012 (Restated), December 31, 2012 (Restated) and December 31, 2013
and for the Years ended December 31, 2011 (Restated), 2012 (Restated) and 2013
(Expressed in millions of rupiah and thousands of U.S. dollar, except share and tariff data)
| | | | | | | | | | | | | | | | | | | | | | | | | | | | | | |
| | | | | | | | Fair Value (Rp) | |
| | | | | Notional Amount
(US$) | | | January 1, 2012 | | | December 31, 2012 | | | December 31, 2013 | |
| | | | | | Receivable | | | Payable | | | Receivable | | | Payable | | | Receivable | | | Payable | |
Interest Rate Swap Contracts: | | | | | | | | | | | | | | | | | | | | | | | | | | | | |
m. | | HSBC, Jakarta Branch | |
| 27,037 with
decreasing amount |
| | | — | | | | 13,254 | | | | — | | | | 11,613 | | | | — | | | | 8,110 | |
n. | | HSBC, Jakarta Branch | |
| 44,200 with
decreasing amount |
| | | — | | | | 35,370 | | | | — | | | | 38,260 | | | | — | | | | 28,793 | |
o. | | GSI(11) | | | 100,000 | | | | — | | | | 60,869 | | | | — | | | | 25,287 | | | | — | | | | — | |
p. | | DBS(11) | |
| 25,000 with
decreasing amount |
| | | — | | | | 4,174 | | | | — | | | | 1,391 | | | | — | | | | — | |
q. | | DBS(12) | |
| 25,000 with
decreasing amount |
| | | — | | | | 3,678 | | | | — | | | | 1,244 | | | | — | | | | — | |
r. | | Bank of Tokyo MUFJ (“BTMUFJ”)(13) | |
| 25,000 with
decreasing amount |
| | | — | | | | 2,649 | | | | — | | | | 894 | | | | — | | | | — | |
s. | | BTMUFJ(13) | |
| 25,000 with
decreasing amount |
| | | — | | | | 2,347 | | | | — | | | | 804 | | | | — | | | | — | |
t. | | BTMUFJ(13) | |
| 25,000 with
decreasing amount |
| | | — | | | | 2,118 | | | | — | | | | 735 | | | | — | | | | — | |
u. | | StandChart(13) | |
| 40,000 with
decreasing amount |
| | | — | | | | 2,692 | | | | — | | | | 1,013 | | | | — | | | | — | |
v. | | DBS(6) | |
| 26,000 with
decreasing amount |
| | | — | | | | 1,486 | | | | — | | | | — | | | | — | | | | — | |
w. | | DBS(7) | |
| 26,000 with
decreasing amount |
| | | — | | | | 1,282 | | | | — | | | | — | | | | — | | | | — | |
x. | | BTMUFJ(5) | |
| 36,500 with
decreasing amount |
| | | — | | | | 1,289 | | | | — | | | | — | | | | — | | | | — | |
y. | | International Netherlands Group (“ING”) Bank N.V | |
| 36,500 with
decreasing amount |
| | | — | | | | — | | | | — | | | | — | | | | — | | | | — | |
z. | | ING Bank N.V | | | 33,500 | | | | — | | | | — | | | | — | | | | — | | | | — | | | | — | |
| | | | | | | | | | | | | | | | | | | | | | | | | | | | | | |
Sub-total | | | | | | | — | | | | 131,208 | | | | — | | | | 81,241 | | | | — | | | | 36,903 | |
| | | | | | | | | | | | | | | | | | | | | | | | | | | | | | |
| (1) | contract entered into January 2006 and settled in June 2012 |
| (2) | the Company used the option to exercise US$8,750 in June 2013, US$2,000 in December 2012, US$2,000 in June 2012 and US$6,000 in December 2011 of the contract amount. |
| (3) | contract entered into in March 2006 and settled in June 2012 |
| (4) | contract entered into in May 2006 and settled in June 2012 |
| (5) | contract entered into in March 2009 and settled in June 2012 |
| (6) | contract entered into in December 2008 and settled in December 2012 |
| (7) | contract entered into in January 2009 and settled in December 2012 |
| (8) | contract entered into in August 2012 and settled in January 2013 |
| (9) | contract entered into in August 2012 and settled in February 2013 |
| (10) | contract entered into in August 2012 and settled in March 2013 |
| (11) | contract entered into in September 2008 and settled in June 2013 |
| (12) | contract entered into in October 2008 and settled in June 2013 |
| (13) | contract entered into in December 2008 and settled in June 2013 |
F-95
PT INDOSAT Tbk AND ITS SUBSIDIARIES
NOTES TO CONSOLIDATED FINANCIAL STATEMENTS—(Continued)
as of January 1, 2012 (Restated), December 31, 2012 (Restated) and December 31, 2013
and for the Years ended December 31, 2011 (Restated), 2012 (Restated) and 2013
(Expressed in millions of rupiah and thousands of U.S. dollar, except share and tariff data)
| | | | | | | | | | | | | | | | | | | | | | | | | | | | | | |
| | | | | | | | Fair Value (Rp) | |
| | | | | Notional
Amount
(US$) | | | January 1, 2012 | | | December 31, 2012 | | | December 31, 2013 | |
| | | | | | Receivable | | | Payable | | | Receivable | | | Payable | | | Receivable | | | Payable | |
Currency Forward Contracts: | | | | | | | | | | | | | | | | | | | | | | | | | | | | |
aa. | | JP Morgan | | | 10,000 | | | | — | | | | — | | | | — | | | | — | | | | — | | | | — | |
ab. | | DBS | | | 20,000 | | | | — | | | | — | | | | — | | | | — | | | | — | | | | — | |
ac. | | Deutsche Bank | | | 20,000 | | | | — | | | | — | | | | — | | | | — | | | | — | | | | — | |
ad. | | Deutsche Bank | | | 10,000 | | | | — | | | | — | | | | — | | | | — | | | | — | | | | — | |
ae. | | JP Morgan | | | 10,000 | | | | — | | | | — | | | | — | | | | — | | | | — | | | | — | |
af. | | StandChart | | | 5,000 | | | | — | | | | — | | | | — | | | | — | | | | — | | | | — | |
ag. | | JP Morgan | | | 10,000 | | | | — | | | | — | | | | — | | | | — | | | | — | | | | — | |
ah. | | PT Danareksa (Persero) (“Danareksa”) | | | 5,000 | | | | — | | | | — | | | | — | | | | — | | | | — | | | | — | |
ai. | | JP Morgan | | | 5,000 | | | | — | | | | — | | | | — | | | | — | | | | — | | | | — | |
aj. | | StandChart | | | 5,000 | | | | — | | | | — | | | | — | | | | — | | | | — | | | | — | |
ak. | | JP Morgan | | | 5,000 | | | | — | | | | — | | | | — | | | | — | | | | — | | | | — | |
al. | | HSBC, Jakarta Branch | | | 5,000 | | | | — | | | | — | | | | — | | | | — | | | | — | | | | — | |
am. | | HSBC, Jakarta Branch | | | 5,000 | | | | — | | | | — | | | | — | | | | — | | | | — | | | | — | |
an. | | JP Morgan | | | 5,000 | | | | — | | | | — | | | | — | | | | — | | | | — | | | | — | |
ao. | | HSBC, Jakarta Branch | | | 1,000 | | | | — | | | | — | | | | — | | | | — | | | | — | | | | — | |
ap. | | HSBC, Jakarta Branch | | | 3,000 | | | | — | | | | — | | | | — | | | | — | | | | — | | | | — | |
aq | | HSBC, Jakarta Branch | | | 10,000 | | | | 5,231 | | | | — | | | | — | | | | — | | | | — | | | | — | |
ar | | JP Morgan | | | 2,000 | | | | 1,011 | | | | — | | | | — | | | | — | | | | — | | | | — | |
as. | | StandChart | | | 7,000 | | | | 3,902 | | | | — | | | | — | | | | — | | | | — | | | | — | |
at. | | JP Morgan | | | 9,500 | | | | 4,832 | | | | — | | | | — | | | | — | | | | — | | | | — | |
au. | | HSBC, Jakarta Branch | | | 6,000 | | | | 3,222 | | | | — | | | | — | | | | — | | | | — | | | | — | |
av. | | HSBC, Jakarta Branch | | | 7,500 | | | | 4,021 | | | | — | | | | — | | | | — | | | | — | | | | — | |
aw. | | JP Morgan | | | 13,750 | | | | 6,771 | | | | — | | | | — | | | | — | | | | — | | | | — | |
ax. | | StandChart | | | 8,000 | | | | 4,542 | | | | — | | | | — | | | | — | | | | — | | | | — | |
ay. | | StandChart | | | 6,600 | | | | 3,666 | | | | — | | | | — | | | | — | | | | — | | | | — | |
az. | | StandChart | | | 3,000 | | | | 1,486 | | | | — | | | | — | | | | — | | | | — | | | | — | |
ba. | | DBS | | | 10,000 | | | | 5,010 | | | | — | | | | — | | | | — | | | | — | | | | — | |
bb. | | ING | | | 7,000 | | | | 3,538 | | | | — | | | | — | | | | — | | | | — | | | | — | |
bc. | | DBS | | | 7,000 | | | | 3,528 | | | | — | | | | — | | | | — | | | | — | | | | — | |
bd. | | DBS | | | 10,000 | | | | 5,497 | | | | — | | | | — | | | | — | | | | — | | | | — | |
be. | | JP Morgan | | | 10,000 | | | | 5,523 | | | | — | | | | — | | | | — | | | | — | | | | — | |
bf. | | HSBC, Jakarta branch | | | 10,000 | | | | 4,909 | | | | — | | | | — | | | | — | | | | — | | | | — | |
bg. | | ING | | | 10,000 | | | | 5,330 | | | | — | | | | — | | | | — | | | | — | | | | — | |
bh. | | ING | | | 13,000 | | | | 6,960 | | | | — | | | | — | | | | — | | | | — | | | | — | |
bi. | | DBS | | | 13,000 | | | | 6,859 | | | | — | | | | — | | | | — | | | | — | | | | — | |
bj. | | ING | | | 13,500 | | | | 7,386 | | | | — | | | | — | | | | — | | | | — | | | | — | |
bk. | | ING | | | 10,000 | | | | 5,478 | | | | — | | | | — | | | | — | | | | — | | | | — | |
bl. | | ING | | | 10,000 | | | | 5,508 | | | | — | | | | — | | | | — | | | | — | | | | — | |
bm. | | GSI | | | 8,000 | | | | 4,558 | | | | — | | | | — | | | | — | | | | — | | | | — | |
bn. | | GSI | | | 13,000 | | | | 7,550 | | | | — | | | | — | | | | — | | | | — | | | | — | |
F-96
PT INDOSAT Tbk AND ITS SUBSIDIARIES
NOTES TO CONSOLIDATED FINANCIAL STATEMENTS—(Continued)
as of January 1, 2012 (Restated), December 31, 2012 (Restated) and December 31, 2013
and for the Years ended December 31, 2011 (Restated), 2012 (Restated) and 2013
(Expressed in millions of rupiah and thousands of U.S. dollar, except share and tariff data)
| | | | | | | | | | | | | | | | | | | | | | | | | | | | | | |
| | | | | | | | Fair Value (Rp) | |
| | | | | Notional
Amount
(US$) | | | January 1, 2012 | | | December 31, 2012 | | | December 31, 2013 | |
| | | | | | Receivable | | | Payable | | | Receivable | | | Payable | | | Receivable | | | Payable | |
bo. | | Royal Bank of Scotland (“RBS”) | | | 12,000 | | | | 6,370 | | | | — | | | | — | | | | — | | | | — | | | | — | |
bp | | GSI | | | 12,000 | | | | 7,185 | | | | — | | | | — | | | | — | | | | — | | | | — | |
bq. | | GSI | | | 12,500 | | | | 7,338 | | | | — | | | | — | | | | — | | | | — | | | | — | |
br. | | HSBC | | | 2,000 | | | | — | | | | — | | | | — | | | | — | | | | — | | | | — | |
bs. | | HSBC | | | 14,000 | | | | — | | | | — | | | | — | | | | — | | | | — | | | | — | |
bt. | | StandChart | | | 20,000 | | | | — | | | | — | | | | — | | | | — | | | | — | | | | — | |
bu. | | HSBC | | | 18,500 | | | | — | | | | — | | | | — | | | | — | | | | — | | | | — | |
bv. | | DBS | | | 2,000 | | | | — | | | | — | | | | — | | | | — | | | | — | | | | — | |
bw. | | BNP Paribas | | | 2,000 | | | | — | | | | — | | | | — | | | | — | | | | — | | | | — | |
bx. | | GSI | | | 5,000 | | | | — | | | | — | | | | — | | | | — | | | | — | | | | — | |
by. | | ING | | | 5,000 | | | | — | | | | — | | | | — | | | | — | | | | — | | | | — | |
bz. | | Barclays | | | 10,000 | | | | — | | | | — | | | | — | | | | — | | | | — | | | | — | |
ca. | | Barclays | | | 20,000 | | | | — | | | | — | | | | — | | | | — | | | | — | | | | — | |
cb. | | BNP Paribas | | | 20,000 | | | | — | | | | — | | | | — | | | | — | | | | — | | | | — | |
cc. | | ING | | | 23,000 | | | | — | | | | — | | | | 4,137 | | | | — | | | | — | | | | — | |
cd. | | GSI | | | 13,000 | | | | — | | | | — | | | | 3,278 | | | | — | | | | — | | | | — | |
ce. | | JP Morgan | | | 10,000 | | | | — | | | | — | | | | — | | | | — | | | | — | | | | — | |
cf. | | JP Morgan | | | 10,000 | | | | — | | | | — | | | | — | | | | — | | | | — | | | | — | |
cg. | | BNP Paribas | | | 20,000 | | | | — | | | | — | | | | 2,981 | | | | — | | | | — | | | | — | |
ch.. | | Barclays | | | 20,000 | | | | — | | | | — | | | | 3,254 | | | | — | | | | — | | | | — | |
ci. | | BNP Paribas | | | 20,000 | | | | — | | | | — | | | | 3,675 | | | | — | | | | — | | | | — | |
cj. | | JP Morgan | | | 20,000 | | | | — | | | | — | | | | 4,427 | | | | — | | | | — | | | | — | |
ck. | | ING | | | 15,000 | | | | — | | | | — | | | | 2,956 | | | | — | | | | — | | | | — | |
cl. | | Barclays | | | 15,000 | | | | — | | | | — | | | | 2,166 | | | | — | | | | — | | | | — | |
cm. | | DBS | | | 15,000 | | | | — | | | | — | | | | 1,983 | | | | — | | | | — | | | | — | |
cn. | | DBS | | | 20,000 | | | | — | | | | — | | | | 2,621 | | | | — | | | | — | | | | — | |
co. | | JP Morgan | | | 25,000 | | | | — | | | | — | | | | 77 | | | | — | | | | — | | | | — | |
cp. | | DBS | | | 15,000 | | | | — | | | | — | | | | 140 | | | | — | | | | — | | | | — | |
cq. | | Barclays | | | 26,000 | | | | — | | | | — | | | | 1,850 | | | | — | | | | — | | | | — | |
cr. | | JP Morgan | | | 30,000 | | | | — | | | | — | | | | 2,231 | | | | — | | | | — | | | | — | |
cs. | | BNP Paribas | | | 25,000 | | | | — | | | | — | | | | 2,356 | | | | — | | | | — | | | | — | |
ct. | | ING | | | 15,000 | | | | — | | | | — | | | | 1,615 | | | | — | | | | — | | | | — | |
cu. | | StandChart | | | 12,000 | | | | — | | | | — | | | | — | | | | — | | | | — | | | | — | |
cv. | | BTMU Singapore | | | 13,000 | | | | — | | | | — | | | | — | | | | — | | | | — | | | | — | |
cw. | | BNP Paribas | | | 11,000 | | | | — | | | | — | | | | — | | | | — | | | | — | | | | — | |
cx. | | ING | | | 28,000 | | | | — | | | | — | | | | — | | | | — | | | | — | | | | — | |
cy. | | BTMU Singapore | | | 20,000 | | | | — | | | | — | | | | — | | | | — | | | | — | | | | — | |
cz. | | BTMU Singapore | | | 10,000 | | | | — | | | | — | | | | — | | | | — | | | | — | | | | — | |
da. | | BTMU Singapore | | | 13,000 | | | | — | | | | — | | | | — | | | | — | | | | — | | | | — | |
db. | | DBS | | | 20,000 | | | | — | | | | — | | | | — | | | | — | | | | — | | | | — | |
dc. | | DBS | | | 20,000 | | | | — | | | | — | | | | — | | | | — | | | | — | | | | — | |
dd. | | Barclays | | | 10,000 | | | | — | | | | — | | | | — | | | | — | | | | — | | | | — | |
F-97
PT INDOSAT Tbk AND ITS SUBSIDIARIES
NOTES TO CONSOLIDATED FINANCIAL STATEMENTS—(Continued)
as of January 1, 2012 (Restated), December 31, 2012 (Restated) and December 31, 2013
and for the Years ended December 31, 2011 (Restated), 2012 (Restated) and 2013
(Expressed in millions of rupiah and thousands of U.S. dollar, except share and tariff data)
| | | | | | | | | | | | | | | | | | | | | | | | | | | | | | |
| | | | | | | | Fair Value (Rp) | |
| | | | | Notional
Amount
(US$) | | | January 1, 2012 | | | December 31, 2012 | | | December 31, 2013 | |
| | | | | | Receivable | | | Payable | | | Receivable | | | Payable | | | Receivable | | | Payable | |
de. | | StandChart | | | 15,000 | | | | — | | | | — | | | | — | | | | — | | | | — | | | | — | |
df. | | CIMB Niaga | | | 15,000 | | | | — | | | | — | | | | — | | | | — | | | | — | | | | — | |
dg. | | JP Morgan | | | 10,000 | | | | — | | | | — | | | | — | | | | — | | | | — | | | | — | |
dh. | | StandChart | | | 20,000 | | | | — | | | | — | | | | — | | | | — | | | | — | | | | — | |
di. | | DBS | | | 18,000 | | | | — | | | | — | | | | — | | | | — | | | | — | | | | — | |
dj. | | BNP Paribas | | | 20,000 | | | | — | | | | — | | | | — | | | | — | | | | — | | | | — | |
dk. | | Barclays | | | 20,000 | | | | — | | | | — | | | | — | | | | — | | | | — | | | | — | |
dl. | | ING | | | 20,000 | | | | — | | | | — | | | | — | | | | — | | | | — | | | | — | |
dm. | | Natixis | | | 15,000 | | | | — | | | | — | | | | — | | | | — | | | | — | | | | — | |
dn. | | JP Morgan | | | 15,000 | | | | — | | | | — | | | | — | | | | — | | | | — | | | | — | |
do | | JP Morgan | | | 10,000 | | | | — | | | | — | | | | — | | | | — | | | | — | | | | — | |
dp. | | JP Morgan | | | 15,000 | | | | — | | | | — | | | | — | | | | — | | | | — | | | | — | |
dq. | | CIMB Niaga | | | 9,750 | | | | — | | | | — | | | | — | | | | — | | | | — | | | | — | |
dr. | | BNP Paribas | | | 12,000 | | | | — | | | | — | | | | — | | | | — | | | | — | | | | — | |
ds. | | Barclays | | | 25,000 | | | | — | | | | — | | | | — | | | | — | | | | — | | | | — | |
dt. | | CIMB Niaga | | | 20,000 | | | | — | | | | — | | | | — | | | | — | | | | — | | | | — | |
du. | | CIMB Niaga | | | 20,000 | | | | — | | | | — | | | | — | | | | — | | | | — | | | | — | |
dv. | | BNP Paribas | | | 25,000 | | | | — | | | | — | | | | — | | | | — | | | | — | | | | — | |
dw. | | DBS | | | 20,000 | | | | — | | | | — | | | | — | | | | — | | | | — | | | | — | |
dx. | | Danareksa | | | 10,000 | | | | — | | | | — | | | | — | | | | — | | | | — | | | | — | |
dy. | | Merrill Lynch | | | 12,000 | | | | — | | | | — | | | | — | | | | — | | | | — | | | | — | |
dz. | | Merrill Lynch | | | 14,500 | | | | — | | | | — | | | | — | | | | — | | | | — | | | | — | |
ea. | | Merrill Lynch | | | 12,000 | | | | — | | | | — | | | | — | | | | — | | | | — | | | | — | |
eb. | | DBS | | | 25,000 | | | | — | | | | — | | | | — | | | | — | | | | — | | | | — | |
ec. | | Standchart | | | 12,000 | | | | — | | | | — | | | | — | | | | — | | | | — | | | | — | |
ed. | | BTMU | | | 12,000 | | | | — | | | | — | | | | — | | | | — | | | | — | | | | — | |
ee. | | DBS | | | 12,500 | | | | — | | | | — | | | | — | | | | — | | | | — | | | | — | |
ef. | | Danareksa | | | 9,500 | | | | — | | | | — | | | | — | | | | — | | | | — | | | | — | |
eg. | | CIMB Niaga | | | 11,000 | | | | — | | | | — | | | | — | | | | — | | | | — | | | | — | |
eh. | | CIMB Niaga | | | 21,000 | | | | — | | | | — | | | | — | | | | — | | | | — | | | | — | |
ei. | | Standchart | | | 15,000 | | | | — | | | | — | | | | — | | | | — | | | | — | | | | — | |
ej. | | CIMB Niaga | | | 12,000 | | | | — | | | | — | | | | — | | | | — | | | | 22,692 | | | | — | |
ek. | | CIMB Niaga | | | 12,000 | | | | — | | | | — | | | | — | | | | — | | | | 22,728 | | | | — | |
el. | | BTMU | | | 10,000 | | | | — | | | | — | | | | — | | | | — | | | | — | | | | — | |
em. | | DBS | | | 5,000 | | | | — | | | | — | | | | — | | | | — | | | | — | | | | — | |
en. | | Merrill Lynch | | | 13,000 | | | | — | | | | — | | | | — | | | | — | | | | — | | | | — | |
eo. | | CIMB Niaga | | | 9,500 | | | | — | | | | — | | | | — | | | | — | | | | — | | | | — | |
ep. | | Barclays | | | 14,000 | | | | — | | | | — | | | | — | | | | — | | | | — | | | | — | |
eq. | | BNP Paribas | | | 9,500 | | | | — | | | | — | | | | — | | | | — | | | | — | | | | — | |
er. | | BNP Paribas | | | 10,000 | | | | — | | | | — | | | | — | | | | — | | | | 4,944 | | | | — | |
es. | | Barclays | | | 10,000 | | | | — | | | | — | | | | — | | | | — | | | | 5,154 | | | | — | |
et. | | BTMU | | | 10,000 | | | | — | | | | — | | | | — | | | | — | | | | 5,060 | | | | — | |
F-98
PT INDOSAT Tbk AND ITS SUBSIDIARIES
NOTES TO CONSOLIDATED FINANCIAL STATEMENTS—(Continued)
as of January 1, 2012 (Restated), December 31, 2012 (Restated) and December 31, 2013
and for the Years ended December 31, 2011 (Restated), 2012 (Restated) and 2013
(Expressed in millions of rupiah and thousands of U.S. dollar, except share and tariff data)
| | | | | | | | | | | | | | | | | | | | | | | | | | | | | | |
| | | | | | | | Fair Value (Rp) | |
| | | | | Notional
Amount
(US$) | | | January 1, 2012 | | | December 31, 2012 | | | December 31, 2013 | |
| | | | | | Receivable | | | Payable | | | Receivable | | | Payable | | | Receivable | | | Payable | |
eu. | | Barclays | | | 10,000 | | | | — | | | | — | | | | — | | | | — | | | | 5,355 | | | | — | |
ev. | | BTMU | | | 10,000 | | | | — | | | | — | | | | — | | | | — | | | | 5,200 | | | | — | |
ew. | | BNP Paribas | | | 10,000 | | | | — | | | | — | | | | — | | | | — | | | | 10,142 | | | | — | |
ex. | | Barclays | | | 10,000 | | | | — | | | | — | | | | — | | | | — | | | | — | | | | — | |
ey. | | JP Morgan | | | 10,000 | | | | — | | | | — | | | | — | | | | — | | | | — | | | | — | |
ez. | | BTMU | | | 10,000 | | | | — | | | | — | | | | — | | | | — | | | | — | | | | — | |
fa. | | ING | | | 10,000 | | | | — | | | | — | | | | — | | | | — | | | | 6,829 | | | | — | |
fb. | | Barclays | | | 10,000 | | | | — | | | | — | | | | — | | | | — | | | | 7,164 | | | | — | |
fc. | | DBS | | | 10,000 | | | | — | | | | — | | | | — | | | | — | | | | 7,480 | | | | — | |
fd. | | ING | | | 10,000 | | | | — | | | | — | | | | — | | | | — | | | | 9,044 | | | | — | |
fe. | | ING | | | 10,000 | | | | — | | | | — | | | | — | | | | — | | | | 9,718 | | | | — | |
ff. | | JP Morgan | | | 10,000 | | | | — | | | | — | | | | — | | | | — | | | | 10,032 | | | | — | |
fg. | | DBS | | | 10,000 | | | | — | | | | — | | | | — | | | | — | | | | 11,667 | | | | — | |
fh. | | BTMU | | | 10,000 | | | | — | | | | — | | | | — | | | | — | | | | 7,108 | | | | — | |
fi. | | DBS | | | 10,000 | | | | — | | | | — | | | | — | | | | — | | | | 6,521 | | | | — | |
fj. | | BTMU | | | 10,000 | | | | — | | | | — | | | | — | | | | — | | | | 7,637 | | | | — | |
fk. | | BNP Paribas | | | 10,000 | | | | — | | | | — | | | | — | | | | — | | | | 7,732 | | | | — | |
fl. | | Barclays | | | 10,000 | | | | — | | | | — | | | | — | | | | — | | | | 5,575 | | | | — | |
fm. | | BNP Paribas | | | 10,000 | | | | — | | | | — | | | | — | | | | — | | | | 2,798 | | | | — | |
fn. | | ING | | | 10,000 | | | | — | | | | — | | | | — | | | | — | | | | 7,907 | | | | — | |
fo. | | DBS | | | 10,000 | | | | — | | | | — | | | | — | | | | — | | | | 3,134 | | | | — | |
fp. | | DBS | | | 10,000 | | | | — | | | | — | | | | — | | | | — | | | | 3,948 | | | | — | |
| | | | | | | | | | | | | | | | | | | | | | | | | | | | | | |
Sub-total | | | | | | | 137,211 | | | | — | | | | 39,747 | | | | — | | | | 195,569 | | | | — | |
| | | | | | | | | | | | | | | | | | | | | | | | | | | | | | |
Total | | | | | | | 159,349 | | | | 138,189 | | | | 69,654 | | | | 81,241 | | | | 195,569 | | | | 36,903 | |
| | | | | | | | | | | | | | | | | | | | | | | | | | | | | | |
The net changes in fair value of the swap contracts, currency forward contracts and embedded derivative, swap income or cost, termination income or cost, and settlement of derivative instruments totaling Rp57,944, Rp4,964 and Rp273,259 for the years ended December 31, 2011, 2012 and 2013, respectively, were credited to “Gain on Change in Fair Value of Derivatives—Net”, which is presented in profit or loss.
F-99
PT INDOSAT Tbk AND ITS SUBSIDIARIES
NOTES TO CONSOLIDATED FINANCIAL STATEMENTS—(Continued)
as of January 1, 2012 (Restated), December 31, 2012 (Restated) and December 31, 2013
and for the Years ended December 31, 2011 (Restated), 2012 (Restated) and 2013
(Expressed in millions of rupiah and thousands of U.S. dollar, except share and tariff data)
The following are the details of the contracts:
Cross Currency Swap Contracts
| | | | | | | | | | | | | | | | | | | | |
No. | | Counter-
Parties | | Contract Period and Swap
Amount | | Annual Swap Premium Rate | | Swap Premium
Payment Date | | Amount of Swap
Premium Paid/
Amortized (Rp) | |
| | | | | | 2011 | | | 2012 | | | 2013 | |
| a. | | StandChart(1) | | January 11, 2006—June 22, 2012 Swap Rp236,250 for US$25,000 | | 4.78% of US$25,000 | | Every June 22 and December 22 | | | 10,672 | | | | 5,754 | | | | — | |
| | | | | | | |
| b. | | StandChart(2) | | March 15, 2006—June 22, 2012 Swap Rp228,550 for US$25,000 | | 3.75% of US$25,000 | | Every June 22 and December 22 | | | 8,372 | | | | 4,515 | | | | — | |
| | | | | | | |
| c. | | StandChart(3) | | May 12, 2006—June 22, 2012 Swap Rp217,500 for US$25,000 | | 3.45% of US$25,000 | | Every June 22 and December 22 | | | 7,702 | | | | 4,153 | | | | — | |
| | | | | | | |
| d. | | MLIB(4) | | September 2, 2008—June 12, 2013. The Company will receive the following: • zero amount if the IDR/USD spot rate at termination date is less than or equal to Rp8,800 to US$1 (in full amounts) • certain U.S. dollar amount as arranged in the contract multiplied by (IDR/USD spot rate—Rp8,800) (in full amount) divided by IDR/USD spot rate if the IDR/USD spot rate at termination date is greater than Rp8,800 but is less than or equal to Rp12,000 to US$1 (in full amounts) • certain U.S. dollar amount as arranged in the contract multiplied by (Rp3,200 (in full amount) divided by IDR/USD spot rate) if the IDR/USD spot rate at termination date is greater than Rp12,000 to US$1 (in full amounts) | | 4.10% of US$25,000 up to June 12, 2011, and 4.10% of decreasing U.S. dollar amount as arranged in the contract up to June 12, 2013 | | Every June 12 and December 12 | | | 9,968 | | | | 5,806 | | | | 2,223 | |
F-100
PT INDOSAT Tbk AND ITS SUBSIDIARIES
NOTES TO CONSOLIDATED FINANCIAL STATEMENTS—(Continued)
as of January 1, 2012 (Restated), December 31, 2012 (Restated) and December 31, 2013
and for the Years ended December 31, 2011 (Restated), 2012 (Restated) and 2013
(Expressed in millions of rupiah and thousands of U.S. dollar, except share and tariff data)
| | | | | | | | | | | | | | | | | | | | |
No. | | Counter-
Parties | | Contract Period and Swap Amount | | Annual Swap Premium Rate | | Swap Premium
Payment Date | | Amount of Swap
Premium Paid/
Amortized (Rp) | |
| | | | | | 2011 | | | 2012 | | | 2013 | |
| e. | | DBS(5) | | September 10, 2008 - June 12, 2013 The Company will receive the following: • zero amount if the IDR/USD spot rate at the scheduled settlement date is at or less than Rp8,800 to US$1 (in full amounts) • certain U.S. dollar amount which is equal to U.S. dollar amount at scheduled settlement date multiplied by (IDR/USD spot rate— Rp8,800) (in full amount) divided by IDR/USD spot rate if the IDR/USD spot rate at settlement date is greater than Rp8,800 and is at or less than Rp12,000 to US$1 (in full amounts) • certain U.S. dollar amount which is equal to U.S. dollar amount at scheduled settlement date multiplied by (Rp12,000—Rp8,800) (in full amounts) divided by IDR/USD spot rate if the IDR/USD spot rate at settlement date is greater than Rp12,000 to US$1 (in full amounts) | | 3.945% of US$25,000 up to June 12, 2011, and 3.945% of decreasing U.S. dollar amount as arranged in the contract up to June 12, 2013 | | Every June 12 and December 12 | | | 8,727 | | | | 4,440 | | | | 1,703 | |
| | | | | | | |
| f. | | HSBC(6) | | August 23, 2012 - January 23, 2013 Swap Rp96,000 for US$10,000 | | 3.00% of US$10,000 | | Upfront premium of US$300 (equivalent to Rp2,851) which was fully paid on August 27, 2012. The premium is amortized over the contract period. | | | — | | | | 2,423 | | | | 429 | |
| | | | | | | |
| g. | | Barclays(7) | | August 23, 2012 - January 23, 2013 Swap Rp139,200 for US$14,500 | | 2.94% of US$14,500 | | Upfront premium of US$426 (equivalent to Rp4,052) which was fully paid on August 27, 2012. The premium is amortized over the contract period. | | | — | | | | 3,443 | | | | 609 | |
F-101
PT INDOSAT Tbk AND ITS SUBSIDIARIES
NOTES TO CONSOLIDATED FINANCIAL STATEMENTS—(Continued)
as of January 1, 2012 (Restated), December 31, 2012 (Restated) and December 31, 2013
and for the Years ended December 31, 2011 (Restated), 2012 (Restated) and 2013
(Expressed in millions of rupiah and thousands of U.S. dollar, except share and tariff data)
| | | | | | | | | | | | | | | | | | | | |
No. | | Counter-
Parties | | Contract Period and Swap Amount | | Annual Swap Premium Rate | | Swap Premium
Payment Date | | Amount of Swap
Premium Paid/
Amortized (Rp) | |
| | | | | | 2011 | | | 2012 | | | 2013 | |
| h. | | HSBC(8) | | August 23, 2012 - February 25, 2013 Swap Rp134,400 for US$14,000 | | 3.20% of US$14,000 | | Upfront premium of US$448 (equivalent to Rp4,258) which was fully paid on August 27, 2012. The premium is amortized over the contract period. | | | — | | | | 2,976 | | | | 1,282 | |
| | | | | | | |
| i. | | HSBC(9) | | August 23, 2012 - March 25, 2013 Swap Rp105,600 for US$11,000 | | 3.70% of US$11,000 | | Upfront premium of US$407 (equivalent to Rp3,868) which was fully paid on August 27, 2012. The premium is amortized over the contract period | | | — | | | | 2,350 | | | | 1,518 | |
| | | | | | | |
| j. | | GSI | | August 22, 2005 - June 22, 2012 The Company will swap the following: • US$75,000 which is equal to US$75,000 multiplied by the lowest IDR/USD exchange rate within the period of August 22, 2005 - June 22, 2012 if the IDR/USD spot rate at termination date is less than or equal to the lowest of IDR/USD exchange rate mentioned above plus Rp4,300 (in full amounts) • US$75,000 which is equal to US$75,000 multiplied by the lowest IDR/USD spot rate at termination date minus Rp4,300 (in full amounts) if the IDR/USD spot rate at termination date is greater than the lowest of IDR/USD exchange rate mentioned above plus Rp4,300 (in full amounts) | | 3.28% of US$75,000 | | Every June 22 and December 22 | | | 10,689 | | | | — | | | | — | |
F-102
PT INDOSAT Tbk AND ITS SUBSIDIARIES
NOTES TO CONSOLIDATED FINANCIAL STATEMENTS—(Continued)
as of January 1, 2012 (Restated), December 31, 2012 (Restated) and December 31, 2013
and for the Years ended December 31, 2011 (Restated), 2012 (Restated) and 2013
(Expressed in millions of rupiah and thousands of U.S. dollar, except share and tariff data)
| | | | | | | | | | | | | | | | | | | | |
No. | | Counter-
Parties | | Contract Period and Swap Amount | | Annual Swap Premium Rate | | Swap Premium
Payment Date | | Amount of Swap
Premium Paid/
Amortized (Rp) | |
| | | | | | 2011 | | | 2012 | | | 2013 | |
| k. | | MLIB | | August 8, 2008 - June 22, 2012 The Company will receive the following: • zero amount if the IDR/USD spot rate at termination date is less than or equal to Rp8,950 to US$1 (in full amounts) • certain U.S. dollar amount which is equal to US$50,000 multiplied by (1—Rp8,950 divided by IDR/USD spot rate) (in full amounts) if the IDR/USD spot rate at termination date is greater than Rp8,950 but is less than or equal to Rp11,000 to US$1 (in full amounts) • certain U.S. dollar amount which is equal to US$50,000 multiplied by (Rp11,000—Rp8,950) divided by IDR/USD spot rate (in full amounts) if the IDR/USD spot rate at termination date is greater than Rp11,000 to US$1 (in full amounts) | | 4.22% of US$50,000 | | Every June 22 and December 22 | | | 11,326 | | | | — | | | | — | |
| | | | | | | |
| l. | | MLIB | | September 8, 2008 - June 22, 2012 The Company will receive the following: • zero amount if the IDR/USD spot rate at termination date is less than or equal to Rp9,000 to US$1 (in full amounts) • certain U.S. dollar amount which is equal to US$25,000 multiplied by (1—Rp9,000 divided by IDR/USD spot rate) (in full amounts) if the IDR/USD spot rate at termination date is greater than Rp9,000 but is less than or equal to Rp11,000 to US$1 (in full amounts) • certain U.S. dollar amount which is equal to US$25,000 multiplied by (Rp11,000—Rp9,000) divided by IDR/USD spot rate (in full amounts) if the IDR/USD spot rate at termination date is greater than Rp11,000 to US$1 (in full amounts) | | 2.52% of US$25,000 | | Every June 22 and December 22 | | | 3,382 | | | | — | | | | — | |
| | | | | | Total | | | | | 70,838 | | | | 35,860 | | | | 7,764 | |
| (1) | On June 22, 2012, this contract expired and the Company received settlement gain on the cross currency swap amounting to Rp575. |
| (2) | On June 22, 2012, this contract expired and the Company received settlement gain on the cross currency swap amounting to Rp8,275. |
| (3) | On June 22, 2012, this contract expired and the Company received settlement gain on the cross currency swap amounting to Rp19,325. |
F-103
PT INDOSAT Tbk AND ITS SUBSIDIARIES
NOTES TO CONSOLIDATED FINANCIAL STATEMENTS—(Continued)
as of January 1, 2012 (Restated), December 31, 2012 (Restated) and December 31, 2013
and for the Years ended December 31, 2011 (Restated), 2012 (Restated) and 2013
(Expressed in millions of rupiah and thousands of U.S. dollar, except share and tariff data)
| (4) | On June 12, 2013, December 12, 2012, June 13, 2012 and December 12, 2011, the Company used the option to exercise US$8,750, US$2,000, US$2,000 and US$6,000 of the contract amount, and received settlement gain from the exercise amounting to US$1,055 or equivalent to Rp10,482 on June 12, 2013, US$186 or equivalent to Rp1,793 on December 12, 2012, US$140 or equivalent to Rp1,325 on June 13, 2012 and US$189 or equivalent to Rp1,716 on December 12, 2011. |
| (5) | On June 12, 2013, December 12, 2012, June 12, 2012 and December 12, 2011, the Company used the option to exercise US$8,750, US$2,000, US$2,000 and US$6,000 of the contract amount, and received settlement gain from the exercise amounting to US$1,055 or equivalent to Rp10,482 on June 12, 2013, US$186 or equivalent to Rp1,793 on December 12, 2012, US$140 or equivalent to Rp1,324 on June 12, 2012 and US$189 or equivalent to Rp1,716 on December 12, 2011. |
| (6) | On January 25, 2013, this contract was terminated and the Company received settlement gain on the cross currency swap amounting to Rp430. |
| (7) | On February 8, 2013, this contract was terminated and the Company received settlement gain on the cross currency swap amounting to Rp2,204. |
| (8) | On February 27, 2013, this contract was terminated and the Company received settlement gain on the cross currency swap amounting to Rp1,176. |
| (9) | On March 27, 2013, this contract was terminated and the Company received settlement gain on the cross currency swap amounting to Rp1,375. |
Cross currency swap contract with GSI is structured to include credit-linkage with the Company as the reference entity and with the Company’s (i) bankruptcy, (ii) failure to pay on certain debt obligations or (iii) restructuring of certain debt obligations as the relevant credit events. Upon the occurrence of any of these credit events, the Company’s obligations and those of GSI under these swap contracts will be terminated without any further payments or settlements being made by or owed to either party, including a payment by either party of any marked-to-market value of the swap contracts.
Interest Rate Swap Contracts
| | | | | | | | | | | | | | | | | | | | |
No. | | Counter-
Parties | | Contract Period | | Annual Interest Swap
Rate | | Swap Income (Expense)
Receipt (Payment) Date | | Amount of Swap Expense
Paid (Rp) | |
| | | | | | 2011 | | | 2012 | | | 2013 | |
| m. | | HSBC | | April 23, 2008 - November 27, 2016 | | 5.42% of US$27,037, the notional amount of which will decrease based on predetermined schedule, in exchange for 6-month U.S. dollar LIBOR plus 1.45% per annum | | Every April 1 and October 1 up to October 2009, and every May 27 and November 27 up to termination date | | | 7,034 | | | | 5,949 | | | | 5,608 | |
| | | | | | | |
| n. | | HSBC | | April 23, 2008 - September 29, 2019 | | 4.82% of US$44,200, the notional amount of which will decrease based on predetermined schedule, in exchange for U.S. dollar LIBOR plus 0.35% per annum | | Every January 28 and July 28 up to July 2009, and every March 29 and September 29 up to termination date | | | 13,799 | | | | 12,439 | | | | 12,246 | |
| | | | | | | |
| o. | | GSI(12) | | September 2, 2008 - June 12, 2013 | | (8.10%—underlyer return) of US$100,000 per annum, in exchange for 6-month U.S. dollar LIBOR plus 1.85% per annum | | Every June 10 and December 10 up to June 2011, and every June 12 and December 12 up to termination date | | | 38,978 | | | | 45,178 | | | | — | |
F-104
PT INDOSAT Tbk AND ITS SUBSIDIARIES
NOTES TO CONSOLIDATED FINANCIAL STATEMENTS—(Continued)
as of January 1, 2012 (Restated), December 31, 2012 (Restated) and December 31, 2013
and for the Years ended December 31, 2011 (Restated), 2012 (Restated) and 2013
(Expressed in millions of rupiah and thousands of U.S. dollar, except share and tariff data)
| | | | | | | | | | | | | | | | | | | | |
No. | | Counter-
Parties | | Contract Period | | Annual Interest Swap
Rate | | Swap Income (Expense)
Receipt (Payment) Date | | Amount of Swap Expense
Paid (Rp) | |
| | | | | | 2011 | | | 2012 | | | 2013 | |
| | | | | | | |
| p. | | DBS(13) | | September 5, 2008 - June 12, 2013 | | 5.625% of US$25,000 per annum, in exchange for 6-month U.S. dollar LIBOR plus 1.85% per annum | | Every June 10 and December 10 up to December 2010, and every June 12 and December 12 up to termination date | | | 7,463 | | | | 3,405 | | | | — | |
| | | | | | | |
| q. | | DBS(14) | | October 23, 2008 - June 12, 2013 | | 5.28% of US$25,000, the notional amount of which will decrease based on predetermined schedule, in exchange for 6-month U.S. dollar LIBOR plus 1.85% per annum | | Every March 25 and September 25 up to March 2011, and every June 12 and December 12 up to termination date | | | 8,426 | | | | 3,017 | | | | — | |
| | | | | | | |
| r. | | BTMUFJ(15) | | December 1, 2008 - June 12, 2013 | | 4.46% of US$25,000, the notional amount of which will decrease based on predetermined schedule, in exchange for 6-month U.S. dollar LIBOR plus 1.85% per annum | | Every March 25 and September 25 up to March 2011, and every June 12 and December 12 up to termination date | | | 5,052 | | | | 2,094 | | | | — | |
| | | | | | | |
| s. | | BTMUFJ(16) | | December 4, 2008 - June 12, 2013 | | 4.25% of US$25,000, the notional amount of which will decrease based on predetermined schedule, in exchange for 6-month U.S. dollar LIBOR plus 1.85% per annum | | Every March 25 and September 25 up to March 2011, and every June 12 and December 12 up to termination date | | | 5,000 | | | | 1,858 | | | | — | |
| | | | | | | |
| t. | | BTMUFJ(17) | | December 12, 2008 - June 12, 2013 | | 4.09% of US$25,000, the notional amount of which will decrease based on predetermined schedule, in exchange for 6-month U.S. dollar LIBOR plus 1.85% per annum | | Every March 25 and September 25 up to March 2011, and every June 12 and December 12 up to termination date | | | 4,381 | | | | 1,678 | | | | — | |
| | | | | | | |
| u. | | StandChart(18) | | December 19, 2008 - June 12, 2013 | | 3.85% of US$40,000, the notional amount of which will decrease based on predetermined schedule, in exchange for 6-month U.S. dollar LIBOR plus 1.85% per annum | | Every March 25 and September 25 up to March 2011, and every June 12 and December 12 up to termination date | | | 6,066 | | | | 2,252 | | | | — | |
| | | | | | | |
| v. | | DBS(11) | | December 22, 2008 - December 12, 2012 | | 4.02% of US$26,000, the notional amount of which will decrease based on predetermined schedule, in exchange for 6-month U.S. dollar LIBOR plus 1.85% per annum | | Every March 25 and September 25 up to March 2011, and every June 12 and December 12 up to termination date | | | 5,068 | | | | 1,663 | | | | — | |
F-105
PT INDOSAT Tbk AND ITS SUBSIDIARIES
NOTES TO CONSOLIDATED FINANCIAL STATEMENTS—(Continued)
as of January 1, 2012 (Restated), December 31, 2012 (Restated) and December 31, 2013
and for the Years ended December 31, 2011 (Restated), 2012 (Restated) and 2013
(Expressed in millions of rupiah and thousands of U.S. dollar, except share and tariff data)
| | | | | | | | | | | | | | | | | | | | |
No. | | Counter-
Parties | | Contract Period | | Annual Interest Swap
Rate | | Swap Income (Expense)
Receipt (Payment) Date | | Amount of Swap Expense
Paid (Rp) | |
| | | | | | 2011 | | | 2012 | | | 2013 | |
| w. | | DBS(11) | | January 21, 2009 - December 12, 2012 | | 3.83% of US$26,000, the notional amount of which will decrease based on predetermined schedule, in exchange for 6-month U.S. dollar LIBOR plus 1.85% per annum | | Every March 25 and September 25 up to March 2011, and every June 12 and December 12 up to termination date | | | 4,510 | | | | 1,452 | | | | — | |
| | | | | | | |
| x. | | BTMUFJ(10) | | March 2, 2009 - June 12, 2012 | | 4.10% of US$36,500, the notional amount of which will decrease based on predetermined schedule, in exchange for 6-month U.S. dollar LIBOR plus 1.85% per annum | | Every March 25 and September 25 up to March 2011, and every June 12 and December 12 up to termination date | | | 6,432 | | | | 1,321 | | | | — | |
| | | | | | | |
| y. | | ING Bank N.V | | March 3, 2009 - December 12, 2011 | | 4.0094% of US$25,000, the notional amount of which will decrease based on predetermined schedule, in exchange for 6-month U.S. dollar LIBOR plus 1.85% per annum | | Every March 25 and September 25 up to March 2011, and every June 12 and December 12 up to termination date | | | 4,185 | | | | — | | | | — | |
| | | | | | | |
| z. | | ING Bank N.V | | April 14, 2009 - June 12, 2011 | | 3.75% of US$133,500, in exchange for 6-month U.S dollar LIBOR plus 1.85% per annum | | Every March 25 and September 25 up to March 2011, and on June 12, 2011 | | | 3,127 | | | | — | | | | — | |
| | | | | | Total | | | | | 119,521 | | | | 82,306 | | | | 17,854 | |
| (10) | On June 12, 2012, this contract expired and the Company received zero settlement. |
| (11) | On December 12, 2012, these contracts expired and the Company received zero settlement. |
| (12) | On June 12, 2013, this contract expired and the Company paid settlement loss on the interest rate swap amounting to (Rp25,854). |
| (13) | On June 12, 2013, this contract expired and the Company paid settlement loss on the interest rate swap amounting to (Rp1,406). |
| (14) | On June 12, 2013, this contract expired and the Company paid settlement loss on the interest rate swap amounting to (Rp1,257). |
| (15) | On June 12, 2013, this contract expired and the Company paid settlement loss on the interest rate swap amounting to (Rp903). |
| (16) | On June 12, 2013, this contract expired and the Company paid settlement loss on the interest rate swap amounting to (Rp813). |
| (17) | On June 12, 2013, this contract expired and the Company paid settlement loss on the interest rate swap amounting to (Rp743). |
| (18) | On June 12, 2013, this contract expired and the Company paid settlement loss on the interest rate swap amounting to (Rp1,024). |
F-106
PT INDOSAT Tbk AND ITS SUBSIDIARIES
NOTES TO CONSOLIDATED FINANCIAL STATEMENTS—(Continued)
as of January 1, 2012 (Restated), December 31, 2012 (Restated) and December 31, 2013
and for the Years ended December 31, 2011 (Restated), 2012 (Restated) and 2013
(Expressed in millions of rupiah and thousands of U.S. dollar, except share and tariff data)
Currency Forward Contracts
| | | | | | | | | | | | | | | | | | | | |
No. | | Counter-
parties | | Contract Period | | IDR/USD Fixing Rate
(in full amounts) | | | Amount of Settlement
Gain (Loss) (Rp) | |
| | | | | 2011 | | | 2012 | | | 2013 | |
| aa. | | JP Morgan | | July 14, 2011 - December 12, 2011 | | | Rp8,699 to US$1 | | | | 3,860 | | | | — | | | | — | |
| ab. | | DBS | | July 19, 2011 - December 12, 2011 | | | Rp8,699 to US$1 | | | | 7,720 | | | | — | | | | — | |
| ac. | | Deutsche Bank | | July 19, 2011 - December 12, 2011 | | | Rp8,714 to US$1 | | | | 7,420 | | | | — | | | | — | |
| ad. | | Deutsche Bank | | July 21, 2011 - December 12, 2011 | | | Rp8,665 to US$1 | | | | 4,200 | | | | — | | | | — | |
| ae. | | JP Morgan | | July 21, 2011 - December 12, 2011 | | | Rp8,665 to US$1 | | | | 4,200 | | | | — | | | | — | |
| af. | | StandChart | | July 22, 2011 - December 12, 2011 | | | Rp8,623 to US$1 | | | | 2,310 | | | | — | | | | — | |
| ag. | | JP Morgan | | July 22, 2011 - December 12, 2011 | | | Rp8,637 to US$1 | | | | 4,480 | | | | — | | | | — | |
| ah. | | Danareksa | | July 26, 2011 - December 12, 2011 | | | Rp8,604 to US$1 | | | | 2,405 | | | | — | | | | — | |
| ai. | | JP Morgan | | July 26, 2011 - December 12, 2011 | | | Rp8,614 to US$1 | | | | 2,355 | | | | — | | | | — | |
| aj. | | StandChart | | July 26, 2011 - December 12, 2011 | | | Rp8,614 to US$1 | | | | 2,355 | | | | — | | | | — | |
| ak. | | JP Morgan | | July 29, 2011 - December 12, 2011 | | | Rp8,568 to US$1 | | | | 2,585 | | | | — | | | | — | |
| al. | | HSBC | | August 1, 2011 - November 30, 2011 | | | Rp8,533 to US$1 | | | | 3,185 | | | | — | | | | — | |
| am. | | HSBC | | August 1, 2011 - December 12, 2011 | | | Rp8,541 to US$1 | | | | 2,720 | | | | — | | | | — | |
| an. | | JP Morgan | | August 2, 2011 - November 30, 2011 | | | Rp8,538 to US$1 | | | | 3,160 | | | | — | | | | — | |
| ao. | | HSBC | | August 4, 2011 - November 28, 2011 | | | Rp8,547 to US$1 | | | | 553 | | | | — | | | | — | |
| ap. | | HSBC | | August 4, 2011 - November 30, 2011 | | | Rp8,549 to US$1 | | | | 1,863 | | | | — | | | | — | |
| aq. | | HSBC | | August 10, 2011 - January 24, 2012 | | | Rp8,698 to US$1 | | | | — | | | | 3,200 | | | | — | |
| ar. | | JP Morgan | | August 10, 2011 - January 24, 2012 | | | Rp8,696 to US$1 | | | | — | | | | 578 | | | | — | |
| as. | | StandChart | | August 10, 2011 - January 24, 2012 | | | Rp8,696 to US$1 | | | | — | | | | 966 | | | | — | |
| at. | | JP Morgan | | August 11, 2011 - January 24, 2012 | | | Rp8,693 to US$1 | | | | — | | | | 2,774 | | | | — | |
| au. | | HSBC | | August 11, 2011 - February 28, 2012 | | | Rp8,714 to US$1 | | | | — | | | | 2,226 | | | | — | |
| av. | | HSBC | | August 11, 2011 - February 28, 2012 | | | Rp8,715 to US$1 | | | | — | | | | 2,775 | | | | — | |
| aw. | | JP Morgan | | August 12, 2011 - March 29, 2012 | | | Rp8,764 to US$1 | | | | — | | | | 5,830 | | | | — | |
| ax. | | StandChart | | August 15, 2011 - May 30, 2012 | | | Rp8,785 to US$1 | | | | — | | | | 5,495 | | | | — | |
| ay. | | StandChart | | August 15, 2011 - May 30, 2012 | | | Rp8,787 to US$1 | | | | — | | | | 5,168 | | | | — | |
| az. | | StandChart | | August 16, 2011 - June 12, 2012 | | | Rp8,788 to US$1 | | | | — | | | | 5,280 | | | | — | |
| ba. | | DBS | | August 19, 2011 - January 27, 2012 | | | Rp8,708 to US$1 | | | | — | | | | 3,173 | | | | — | |
| bb. | | ING | | August 19, 2011 - January 27, 2012 | | | Rp8,706 to US$1 | | | | — | | | | 2,235 | | | | — | |
| bc. | | DBS | | August 19, 2011 - January 27, 2012 | | | Rp8,705 to US$1 | | | | — | | | | 2,242 | | | | — | |
| bd. | | DBS | | August 19, 2011 - June 12, 2012 | | | Rp8,819 to US$1 | | | | — | | | | 6,430 | | | | — | |
| be. | | JP Morgan | | August 19, 2011 - June 12, 2012 | | | Rp8,826 to US$1 | | | | — | | | | 6,365 | | | | — | |
| bf. | | HSBC | | August 19, 2011 - June 12, 2012 | | | Rp8,832 to US$1 | | | | — | | | | 6,160 | | | | — | |
| bg. | | ING | | August 22, 2011 - January 12, 2012 | | | Rp8,662 to US$1 | | | | — | | | | 5,405 | | | | — | |
| bh. | | ING | | August 22, 2011 - January 30, 2012 | | | Rp8,679 to US$1 | | | | — | | | | 4,053 | | | | — | |
| bi. | | DBS | | August 22, 2011 - February 28, 2012 | | | Rp8,715 to US$1 | | | | — | | | | 4,786 | | | | — | |
| bj. | | ING | | August 22, 2011 - March 28, 2012 | | | Rp8,737 to US$1 | | | | — | | | | 6,070 | | | | — | |
| bk. | | ING | | August 23, 2011 - January 12, 2012 | | | Rp8,644 to US$1 | | | | — | | | | 5,585 | | | | — | |
| bl. | | ING | | August 23, 2011 - January 12, 2012 | | | Rp8,647 to US$1 | | | | — | | | | 5,555 | | | | — | |
| bm. | | GSI | | August 23, 2011 - January 12, 2012 | | | Rp8,640 to US$1 | | | | — | | | | 4,500 | | | | — | |
F-107
PT INDOSAT Tbk AND ITS SUBSIDIARIES
NOTES TO CONSOLIDATED FINANCIAL STATEMENTS—(Continued)
as of January 1, 2012 (Restated), December 31, 2012 (Restated) and December 31, 2013
and for the Years ended December 31, 2011 (Restated), 2012 (Restated) and 2013
(Expressed in millions of rupiah and thousands of U.S. dollar, except share and tariff data)
| | | | | | | | | | | | | | | | | | |
No. | | Counter-
parties | | Contract Period | | IDR/USD Fixing Rate
(in full amounts) | | Amount of Settlement
Gain (Loss) (Rp) | |
| | | | | 2011 | | | 2012 | | | 2013 | |
| bn. | | GSI | | August 24, 2011 - January 27, 2012 | | Rp8,645 to US$1 | | | — | | | | 4,940 | | | | — | |
| bo. | | RBS | | August 24, 2011 - February 10, 2012 | | Rp8,666 to US$1 | | | — | | | | 3,901 | | | | — | |
| bp. | | GSI | | August 24, 2011 - February 29, 2012 | | Rp8,663 to US$1 | | | — | | | | 6,005 | | | | — | |
| bq. | | GSI | | August 24, 2011 - February 29, 2012 | | Rp8,675 to US$1 | | | — | | | | 6,107 | | | | — | |
| br. | | HSBC | | August 16, 2012 - November 23, 2012 | | Rp9,647 to US$1 | | | — | | | | (38 | ) | | | — | |
| bs. | | HSBC | | August 16, 2012 - November 28, 2012 | | Rp9,654 to US$1 | | | — | | | | (644 | ) | | | — | |
| bt. | | StandChart | | August 16, 2012 - December 10, 2012 | | Rp9,681 to US$1 | | | — | | | | (560 | ) | | | — | |
| bu. | | HSBC | | August 16, 2012 - December 10, 2012 | | Rp9,670 to US$1 | | | — | | | | (407 | ) | | | — | |
| bv. | | DBS | | August 23, 2012 - November 26, 2012 | | Rp9,616 to US$1 | | | — | | | | 62 | | | | — | |
| bw. | | BNP Paribas | | August 24, 2012 - December 21, 2012 | | Rp9,690 to US$1 | | | — | | | | 46 | | | | — | |
| bx. | | GSI | | August 24, 2012 - December 21, 2012 | | Rp9,694 to US$1 | | | — | | | | 95 | | | | — | |
| by. | | ING | | August 24, 2012 - December 21, 2012 | | Rp9,695 to US$1 | | | — | | | | 90 | | | | — | |
| bz. | | Barclays | | September 6, 2012 - December 5, 2012 | | Rp9,695 to US$1 | | | — | | | | (890 | ) | | | — | |
| ca. | | Barclays | | September 7, 2012 - December 5, 2012 | | Rp9,694 to US$1 | | | — | | | | (1,760 | ) | | | — | |
| cb. | | BNP Paribas | | September 12, 2012 - December 13, 2012 | | Rp9,653 to US$1 | | | — | | | | 1,112 | | | | — | |
| cc. | | ING | | September 14, 2012 - January 11, 2013 | | Rp9,631 to US$1 | | | — | | | | — | | | | 4,564 | |
| cd. | | GSI | | September 17, 2012 - January 11, 2013 | | Rp9,560 to US$1 | | | — | | | | — | | | | 3,487 | |
| ce. | | JP Morgan | | September 28, 2012 - December 21, 2012 | | Rp9,660 to US$1 | | | — | | | | 619 | | | | — | |
| cf. | | JP Morgan | | October 5, 2012 - December 21, 2012 | | Rp9,642 to US$1 | | | — | | | | 618 | | | | — | |
| cg. | | BNP Paribas | | November 14, 2012 - February 8, 2013 | | Rp9,683 to US$1 | | | — | | | | — | | | | 20 | |
| ch. | | Barclays | | November 29, 2012 - March 4, 2013 | | Rp9,697 to US$1 | | | — | | | | — | | | | (560 | ) |
| ci. | | BNP Paribas | | November 30, 2012 - March 4, 2013 | | Rp9,669 to US$1 | | | — | | | | — | | | | — | |
| cj. | | JP Morgan | | December 3, 2012 - March 5, 2013 | | Rp9,638 to US$1 | | | — | | | | — | | | | 862 | |
| ck. | | ING | | December 4, 2012 - March 6, 2013 | | Rp9,666 to US$1 | | | — | | | | — | | | | 658 | |
| cl. | | Barclays | | December 5, 2012 - February 5, 2013 | | Rp9,690 to US$1 | | | — | | | | — | | | | 1,175 | |
| cm. | | DBS | | December 5, 2012 - February 5, 2013 | | Rp9,695 to US$1 | | | — | | | | — | | | | 1,102 | |
| cn. | | DBS | | December 7, 2012 - February 11, 2013 | | Rp9,702 to US$1 | | | — | | | | — | | | | 496 | |
| co. | | JP Morgan | | December 10, 2012 - March 13, 2013 | | Rp9,865 to US$1 | | | — | | | | — | | | | (4,425 | ) |
| cp. | | DBS | | December 10, 2012 - March 12, 2013 | | Rp9,853 to US$1 | | | — | | | | — | | | | (2,475 | ) |
| cq. | | Barclays | | December 12, 2012 - February 11, 2013 | | Rp9,770 to US$1 | | | — | | | | — | | | | (1,118 | ) |
| cr. | | JP Morgan | | December 12, 2012 - February 11, 2013 | | Rp9,765 to US$1 | | | — | | | | — | | | | (1,140 | ) |
| cs. | | BNP Paribas | | December 17, 2012 - March 20, 2013 | | Rp9,775 to US$1 | | | — | | | | — | | | | (1,425 | ) |
| ct. | | ING | | December 18, 2012 - March 20, 2013 | | Rp9,770 to US$1 | | | — | | | | — | | | | (780 | ) |
| cu. | | Standchart | | January 22, 2013 - March 27, 2013 | | Rp9,815 to US$1 | | | — | | | | — | | | | (1,080 | ) |
| cv. | | BTMU Singapore | | January 22, 2013 - May 3, 2013 | | Rp9,834 to US$1 | | | — | | | | — | | | | (1,457 | ) |
| cw. | | BNP Paribas | | February 27, 2013 - May 3, 2013 | | Rp9,721 to US$1 | | | — | | | | — | | | | 11 | |
| cx. | | ING | | February 28, 2013 - May 3, 2013 | | Rp9,697 to US$1 | | | — | | | | — | | | | 701 | |
F-108
PT INDOSAT Tbk AND ITS SUBSIDIARIES
NOTES TO CONSOLIDATED FINANCIAL STATEMENTS—(Continued)
as of January 1, 2012 (Restated), December 31, 2012 (Restated) and December 31, 2013
and for the Years ended December 31, 2011 (Restated), 2012 (Restated) and 2013
(Expressed in millions of rupiah and thousands of U.S. dollar, except share and tariff data)
| | | | | | | | | | | | | | | | | | |
No. | | Counter-
parties | | Contract Period | | IDR/USD Fixing Rate
(in full amounts) | | Amount of Settlement
Gain (Loss) (Rp) | |
| | | | | 2011 | | | 2012 | | | 2013 | |
| cy. | | BTMU Singapore | | February 6, 2013 - May 3, 2013 | | Rp9,709 to US$1 | | | — | | | | — | | | | 937 | |
| cz. | | BTMU Singapore | | February 25, 2013 - April 9, 2013 | | Rp9,732 to US$1 | | | — | | | | — | | | | 239 | |
| da. | | BTMU Singapore | | February 27, 2013 - May 3, 2013 | | Rp9,743 to US$1 | | | — | | | | — | | | | (273 | ) |
| db. | | DBS | | February 8, 2013 - April 9, 2013 | | Rp9,694 to US$1 | | | — | | | | — | | | | 1,236 | |
| dc. | | DBS | | February 21, 2013 - April 9, 2013 | | Rp9,731 to US$1 | | | — | | | | — | | | | 498 | |
| dd. | | Barclays | | February 28, 2013 - May 13, 2013 | | Rp9,708 to US$1 | | | — | | | | — | | | | 141 | |
| de. | | Standchart | | February 4, 2013 - May 28, 2013 | | Rp9,795 to US$1 | | | — | | | | — | | | | 105 | |
| df. | | CIMB Niaga | | February 11, 2013 - May 28, 2013 | | Rp9,729 to US$1 | | | — | | | | — | | | | 1,095 | |
| dg. | | JP Morgan | | March 6, 2013 - May 10, 2013 | | Rp9,735 to US$1 | | | — | | | | — | | | | 60 | |
| dh. | | Standchart | | March 11, 2013 - May 28, 2013 | | Rp9,787 to US$1 | | | — | | | | — | | | | 300 | |
| di. | | DBS | | March 13, 2013 - May 28, 2013 | | Rp9,779 to US$1 | | | — | | | | — | | | | 414 | |
| dj. | | BNP Paribas | | March 14, 2013 - June 5, 2013 | | Rp9,790 to US$1 | | | — | | | | — | | | | 2,387 | |
| dk. | | Barclays | | March 14, 2013 - June 5, 2013 | | Rp9,788 to US$1 | | | — | | | | — | | | | 2,427 | |
| dl. | | ING | | March 15, 2013 - June 3, 2013 | | Rp9,784 to US$1 | | | — | | | | — | | | | 2,506 | |
| dm. | | Natixis | | March 19, 2013 - June 5, 2013 | | Rp9,793 to US$1 | | | — | | | | — | | | | 1,745 | |
| dn. | | JP Morgan | | March 19, 2013 - June 5, 2013 | | Rp9,787 to US$1 | | | — | | | | — | | | | 1,835 | |
| do. | | JP Morgan | | March 19, 2013 - July 26, 2013 | | Rp9,870 to US$1 | | | — | | | | — | | | | 3,839 | |
| dp. | | JP Morgan | | March 19, 2013 - July 26, 2013 | | Rp9,870 to US$1 | | | — | | | | — | | | | 5,759 | |
| dq. | | CIMB Niaga | | March 20, 2013 - June 17, 2013 | | Rp9,835 to US$1 | | | — | | | | — | | | | 1,014 | |
| dr. | | BNP Paribas | | March 22, 2013 - July 3, 2013 | | Rp9,900 to US$1 | | | — | | | | — | | | | 1,004 | |
| ds. | | Barclays | | March 22, 2013 - July 3, 2013 | | Rp9,899 to US$1 | | | — | | | | — | | | | 2,116 | |
| dt. | | CIMB Niaga | | March 26, 2013 - June 5, 2013 | | Rp9,833 to US$1 | | | — | | | | — | | | | 620 | |
| du. | | CIMB Niaga | | March 26, 2013 - June 5, 2013 | | Rp9,817 to US$1 | | | — | | | | — | | | | 620 | |
| dv. | | BNP Paribas | | March 27, 2013 - June 5, 2013 | | Rp9,815 to US$1 | | | — | | | | — | | | | 2,362 | |
| dw. | | DBS | | March 27, 2013 - June 5, 2013 | | Rp9,814 to US$1 | | | — | | | | — | | | | 840 | |
| dx. | | Danareksa | | March 26, 2013 - June 5, 2013 | | Rp9,834 to US$1 | | | — | | | | — | | | | 220 | |
| dy. | | Merrill Lynch | | April 9, 2013 - July 3, 2013 | | Rp9,807 to US$1 | | | — | | | | — | | | | 3,335 | |
| dz. | | Merrill Lynch | | April 10, 2013 - July 3, 2013 | | Rp9,755 to US$1 | | | — | | | | — | | | | 2,130 | |
| ea. | | Merrill Lynch | | April 25, 2013 - August 2, 2013 | | Rp9,805 to US$1 | | | — | | | | — | | | | 6,172 | |
| eb. | | DBS | | April 26, 2013 - August 2, 2013 | | Rp9,802 to US$1 | | | — | | | | — | | | | 12,937 | |
| ec. | | StandChart | | May 27, 2013 - July 26, 2013 | | Rp9,884 to US$1 | | | — | | | | — | | | | 4,728 | |
| ed. | | BTMU | | May 31, 2013 - July 26, 2013 | | Rp9,929 to US$1 | | | — | | | | — | | | | 4,188 | |
| ee. | | DBS | | June 5, 2013 - August 26, 2013 | | Rp9,965 to US$1 | | | — | | | | — | | | | 11,988 | |
| ef. | | Danareksa | | June 5, 2013 - September 16, 2013 | | Rp9,996 to US$1 | | | — | | | | — | | | | 14,944 | |
| eg. | | CIMB Niaga | | June 12, 2013 - September 16, 2013 | | Rp9,988 to US$1 | | | — | | | | — | | | | 15,785 | |
| eh | | CIMB Niaga | | June 20, 2013 - July 8, 2013 | | Rp10,015 to US$1 | | | — | | | | — | | | | 5,523 | |
| ei. | | StandChart | | June 21, 2013 - November 25, 2013 | | Rp10,240 to US$1 | | | — | | | | — | | | | 26,055 | |
F-109
PT INDOSAT Tbk AND ITS SUBSIDIARIES
NOTES TO CONSOLIDATED FINANCIAL STATEMENTS—(Continued)
as of January 1, 2012 (Restated), December 31, 2012 (Restated) and December 31, 2013
and for the Years ended December 31, 2011 (Restated), 2012 (Restated) and 2013
(Expressed in millions of rupiah and thousands of U.S. dollar, except share and tariff data)
| | | | | | | | | | | | | | | | | | |
No. | | Counter-
parties | | Contract Period | | IDR/USD Fixing Rate
(in full amounts) | | Amount of Settlement
Gain (Loss) (Rp) | |
| | | | | 2011 | | | 2012 | | | 2013 | |
| ej. | | CIMB Niaga | | June 27, 2013 - January 6, 2014 | | Rp10,285 to US$1 | | | — | | | | — | | | | — | |
| ek. | | CIMB Niaga | | June 27, 2013 - January 6, 2014 | | Rp10,282 to US$1 | | | — | | | | — | | | | — | |
| el. | | BTMU | | July 15, 2013 - August 16, 2013 | | Rp10,140 to US$1 | | | — | | | | — | | | | 5,830 | |
| em. | | DBS | | July 15, 2013 - August 16, 2013 | | Rp10,125 to US$1 | | | — | | | | — | | | | 2,990 | |
| en. | | Merrill Lynch | | August 21, 2013 - November 21, 2013 | | Rp11,660 to US$1 | | | — | | | | — | | | | (4,136 | ) |
| eo. | | CIMB Niaga | | August 22, 2013 - December 20, 2013 | | Rp11,502 to US$1 | | | — | | | | — | | | | 6,774 | |
| ep. | | Barclays | | August 30, 2013 - October 1, 2013 | | Rp11,375 to US$1 | | | — | | | | — | | | | (1,129 | ) |
| eq. | | BNP Paribas | | September 9, 2013 - October 11, 2013 | | Rp11,538 to US$1 | | | — | | | | — | | | | (3,167 | ) |
| er. | | BNP Paribas | | September 12, 2013 - January 6, 2014 | | Rp11,720 to US$1 | | | — | | | | — | | | | — | |
| es. | | Barclays | | September 13, 2013 - January 6, 2014 | | Rp11,680 to US$1 | | | — | | | | — | | | | — | |
| et. | | BTMU | | September 13, 2013 - January 6, 2014 | | Rp11,675 to US$1 | | | — | | | | — | | | | — | |
| eu. | | Barclays | | September 18, 2013 - January 6, 2014 | | Rp11,660 to US$1 | | | — | | | | — | | | | — | |
| ev. | | BTMU | | September 18, 2013 - January 6, 2014 | | Rp11,661 to US$1 | | | — | | | | — | | | | — | |
| ew. | | BNP Paribas | | September 19, 2013 - January 6, 2014 | | Rp11,199 to US$1 | | | — | | | | — | | | | — | |
| ex. | | Barclays | | September 24, 2013 - November 6, 2013 | | Rp11,362 to US$1 | | | — | | | | — | | | | (3,365 | ) |
| ey. | | JP Morgan | | September 24, 2013 - November 6, 2013 | | Rp11,407 to US$1 | | | — | | | | — | | | | (3,828 | ) |
| ez. | | BTMU | | September 24, 2013 - November 1, 2013 | | Rp11,440 to US$1 | | | — | | | | — | | | | (5,939 | ) |
| fa. | | ING | | October 8, 2013 - January 6, 2014 | | Rp11,508 to US$1 | | | — | | | | — | | | | — | |
| fb. | | Barclays | | October 10, 2013 - January 6, 2014 | | Rp11,480 to US$1 | | | — | | | | — | | | | — | |
| fc. | | DBS | | October 10, 2013 - January 6, 2014 | | Rp11,452 to US$1 | | | — | | | | — | | | | — | |
| fd. | | ING | | October 11, 2013 - February 4, 2014 | | Rp11,388 to US$1 | | | — | | | | — | | | | — | |
| fe. | | ING | | October 11, 2013 - February 4, 2014 | | Rp11,320 to US$1 | | | — | | | | — | | | | — | |
| ff. | | JP Morgan | | October 17, 2013 - January 6, 2014 | | Rp11,175 to US$1 | | | — | | | | — | | | | — | |
| fg. | | DBS | | October 21, 2013 - February 4, 2014 | | Rp11,135 to US$1 | | | — | | | | — | | | | — | |
| fh. | | BTMU | | November 14, 2013 - January 13, 2014 | | Rp11,495 to US$1 | | | — | | | | — | | | | — | |
| fi. | | DBS | | November 18, 2013 - January 13, 2014 | | Rp11,572 to US$1 | | | — | | | | — | | | | — | |
| fj. | | BTMU | | November 19, 2013 - January 13, 2014 | | Rp11,442 to US$1 | | | — | | | | — | | | | — | |
| fk. | | BNP Paribas | | November 19, 2013 - January 13, 2014 | | Rp11,463 to US$1 | | | — | | | | — | | | | — | |
| fl. | | Barclays | | November 26, 2013 - January 29, 2014 | | Rp11,730 to US$1 | | | — | | | | — | | | | — | |
| fm. | | BNP Paribas | | November 19, 2013 - January 6, 2014 | | Rp11,935 to US$1 | | | — | | | | — | | | | — | |
| fn. | | ING | | November 29, 2013 - January 13, 2014 | | Rp11,425 to US$1 | | | — | | | | — | | | | — | |
| fo. | | DBS | | November 29, 2013 - January 13, 2014 | | Rp11,887 to US$1 | | | — | | | | — | | | | — | |
| fp. | | DBS | | December 2, 2013 - February 4, 2014 | | Rp11,572 to US$1 | | | — | | | | — | | | | — | |
| | | | TOTAL | | | | | 55,371 | | | | 116,147 | | | | 134,477 | |
21. FINANCIAL ASSETS AND LIABILITIES
The Group has various financial assets such as trade and other accounts receivable, and unrestricted and restricted cash and cash equivalents, which arise directly from the Group’s operations. The Group’s principal financial liabilities, other than derivatives, consist of loans and bonds payable, procurement payable, and trade
F-110
PT INDOSAT Tbk AND ITS SUBSIDIARIES
NOTES TO CONSOLIDATED FINANCIAL STATEMENTS—(Continued)
as of January 1, 2012 (Restated), December 31, 2012 (Restated) and December 31, 2013
and for the Years ended December 31, 2011 (Restated), 2012 (Restated) and 2013
(Expressed in millions of rupiah and thousands of U.S. dollar, except share and tariff data)
accounts payable and others. The main purpose of these financial liabilities is to finance the Group’s operations. The Company also enters into derivative transactions, primarily cross currency swaps, interest rate swaps, and currency forward contracts, for the purpose of managing its foreign exchange and interest rate exposures emanating from the Company’s loans and bonds payable in foreign currencies.
The following table sets forth the Group’s financial assets and financial liabilities as of January 1, 2012, December 31, 2012 and 2013:
| | | | | | | | | | | | |
| | | | | | December 31, | |
| | | January 1, 2012 | | | 2012 | | | 2013 | |
Financial Assets | | | | | | | | | | | | |
Held for trading | | | | | | | | | | | | |
Derivative assets | | | 159,349 | | | | 69,654 | | | | 195,569 | |
Loans and receivables | | | | | | | | | | | | |
Cash and cash equivalents | | | 2,224,206 | | | | 3,917,236 | | | | 2,233,532 | |
Accounts receivable—trade and others—net | | | 1,505,756 | | | | 2,061,160 | | | | 2,284,633 | |
Other current financial assets—net | | | 24,790 | | | | 13,382 | | | | 31,673 | |
Due from related parties—net | | | 10,654 | | | | 10,358 | | | | 7,167 | |
Other non-current financial assets—others | | | 209,540 | | | | 173,400 | | | | 163,645 | |
Available for sale | | | | | | | | | | | | |
Other current financial assets—short-term investments—net | | | — | | | | — | | | | — | |
Other non-current financial assets—other long-term investments—net | | | 2,730 | | | | 1,369,740 | | | | 1,393,722 | |
| | | | | | | | | | | | |
Total Financial Assets | | | 4,137,025 | | | | 7,614,930 | | | | 6,309,941 | |
| | | | | | | | | | | | |
| | | |
Financial Liabilities | | | | | | | | | | | | |
Held for trading | | | | | | | | | | | | |
Derivative liabilities | | | 138,189 | | | | 81,241 | | | | 36,903 | |
Liabilities at amortized cost | | | | | | | | | | | | |
Short-term loan | | | 1,499,256 | | | | 299,529 | | | | 1,499,849 | |
Accounts payable—trade | | | 319,058 | | | | 231,737 | | | | 339,310 | |
Procurement payable | | | 3,475,862 | | | | 2,737,850 | | | | 3,064,287 | |
Accrued expenses | | | 1,895,613 | | | | 1,961,285 | | | | 2,107,467 | |
Deposits from customers | | | 37,265 | | | | 43,825 | | | | 49,335 | |
Loans payable—current maturities | | | 3,300,537 | | | | 2,669,218 | | | | 2,443,367 | |
Bonds payable—current maturities | | | 41,989 | | | | 1,329,175 | | | | 2,356,310 | |
Other current financial liabilities | | | 71,828 | | | | 289,164 | | | | 362,448 | |
Due to related parties | | | 15,480 | | | | 42,789 | | | | 33,301 | |
Obligation under finance lease | | | 770,081 | | | | 3,101,910 | | | | 3,594,112 | |
Loans payable—net of current maturities | | | 6,425,779 | | | | 3,703,822 | | | | 4,345,267 | |
Bonds payable—net of current maturities | | | 12,138,353 | | | | 13,986,507 | | | | 13,285,207 | |
Other non-current financial liabilities | | | 107,433 | | | | 69,273 | | | | 82,855 | |
| | | | | | | | | | | | |
Total Financial Liabilities | | | 30,236,723 | | | | 30,547,325 | | | | 33,600,018 | |
| | | | | | | | | | | | |
F-111
PT INDOSAT Tbk AND ITS SUBSIDIARIES
NOTES TO CONSOLIDATED FINANCIAL STATEMENTS—(Continued)
as of January 1, 2012 (Restated), December 31, 2012 (Restated) and December 31, 2013
and for the Years ended December 31, 2011 (Restated), 2012 (Restated) and 2013
(Expressed in millions of rupiah and thousands of U.S. dollar, except share and tariff data)
The following table sets forth the carrying values and estimated fair values of the Group’s financial instruments that are carried in the consolidated statements of financial position:
| | | | | | | | | | | | | | | | | | | | | | | | |
| | | Carrying Amount | | | Fair Value | |
| | | January 1,
2012 | | | December 31, | | | January 1,
2012 | | | December 31, | |
| | | | 2012 | | | 2013 | | | | 2012 | | | 2013 | |
Current Financial Assets | | | | | | | | | | | | | | | | | | | | | | | | |
Cash and cash equivalents | | | 2,224,206 | | | | 3,917,236 | | | | 2,233,532 | | | | 2,224,206 | | | | 3,917,236 | | | | 2,233,532 | |
Accounts receivable—trade and others—net | | | 1,505,756 | | | | 2,061,160 | | | | 2,284,633 | | | | 1,505,756 | | | | 2,061,160 | | | | 2,284,633 | |
Derivative assets | | | 159,349 | | | | 69,654 | | | | 195,569 | | | | 159,349 | | | | 69,654 | | | | 195,569 | |
Other current financial assets—net | | | 24,790 | | | | 13,382 | | | | 31,673 | | | | 24,790 | | | | 13,382 | | | | 31,673 | |
| | | | | | | | | | | | | | | | | | | | | | | | |
Total current financial assets | | | 3,914,101 | | | | 6,061,432 | | | | 4,745,407 | | | | 3,914,101 | | | | 6,061,432 | | | | 4,745,407 | |
| | | | | | | | | | | | | | | | | | | | | | | | |
Non-current Financial Assets | | | | | | | | | | | | | | | | | | | | | | | | |
Due from related parties—net | | | 10,654 | | | | 10,358 | | | | 7,167 | | | | 8,967 | | | | 9,539 | | | | 6,174 | |
Other long-term investments—net | | | 2,730 | | | | 1,369,740 | | | | 1,393,722 | | | | 2,730 | | | | 1,369,740 | | | | 1,393,722 | |
Other non-current financial assets—net | | | 209,540 | | | | 173,400 | | | | 163,645 | | | | 205,261 | | | | 171,648 | | | | 162,900 | |
| | | | | | | | | | | | | | | | | | | | | | | | |
Total non-current financial assets | | | 222,924 | | | | 1,553,498 | | | | 1,564,534 | | | | 216,958 | | | | 1,550,927 | | | | 1,562,796 | |
| | | | | | | | | | | | | | | | | | | | | | | | |
Total Financial Assets | | | 4,137,025 | | | | 7,614,930 | | | | 6,309,941 | | | | 4,131,059 | | | | 7,612,359 | | | | 6,308,203 | |
| | | | | | | | | | | | | | | | | | | | | | | | |
Current Financial Liabilities | | | | | | | | | | | | | | | | | | | | | | | | |
Short-term loan | | | 1,499,256 | | | | 299,529 | | | | 1,499,849 | | | | 1,499,256 | | | | 299,529 | | | | 1,499,849 | |
Accounts payable—trade | | | 319,058 | | | | 231,737 | | | | 339,310 | | | | 319,058 | | | | 231,737 | | | | 339,310 | |
Procurement payable | | | 3,475,862 | | | | 2,737,850 | | | | 3,064,287 | | | | 3,475,862 | | | | 2,737,850 | | | | 3,064,287 | |
Accrued expenses | | | 1,895,613 | | | | 1,961,285 | | | | 2,107,467 | | | | 1,895,613 | | | | 1,961,285 | | | | 2,107,467 | |
Deposits from customers | | | 37,265 | | | | 43,825 | | | | 49,335 | | | | 37,265 | | | | 43,825 | | | | 49,335 | |
Derivative liabilities | | | 138,189 | | | | 81,241 | | | | 36,903 | | | | 138,189 | | | | 81,241 | | | | 36,903 | |
Loans payable—current maturities | | | 3,300,537 | | | | 2,669,218 | | | | 2,443,367 | | | | 3,927,062 | | | | 2,791,147 | | | | 2,624,742 | |
Bonds payable—current maturities | | | 41,989 | | | | 1,329,175 | | | | 2,356,310 | | | | 43,137 | | | | 1,343,205 | | | | 2,372,560 | |
Other current financial liabilities | | | 71,828 | | | | 289,164 | | | | 362,448 | | | | 71,828 | | | | 289,164 | | | | 362,448 | |
| | | | | | | | | | | | | | | | | | | | | | | | |
Total current financial liabilities | | | 10,779,597 | | | | 9,643,024 | | | | 12,259,276 | | | | 11,407,270 | | | | 9,778,983 | | | | 12,456,901 | |
| | | | | | | | | | | | | | | | | | | | | | | | |
Non-current Financial Liabilities | | | | | | | | | | | | | | | | | | | | | | | | |
Due to related parties | | | 15,480 | | | | 42,789 | | | | 33,301 | | | | 13,030 | | | | 39,405 | | | | 28,687 | |
Obligation under finance lease | | | 770,081 | | | | 3,101,910 | | | | 3,594,112 | | | | 770,081 | | | | 3,101,910 | | | | 3,594,112 | |
Loans payable—net of current maturities | | | 6,425,779 | | | | 3,703,822 | | | | 4,345,267 | | | | 5,864,354 | | | | 3,331,132 | | | | 3,276,815 | |
Bonds payable—net of current maturities | | | 12,138,353 | | | | 13,986,507 | | | | 13,285,207 | | | | 13,334,903 | | | | 15,318,676 | | | | 14,075,516 | |
Other non-current financial liabilities | | | 107,433 | | | | 69,273 | | | | 82,855 | | | | 101,068 | | | | 66,433 | | | | 74,117 | |
| | | | | | | | | | | | | | | | | | | | | | | | |
Total non-current financial liabilities | | | 19,457,126 | | | | 20,904,301 | | | | 21,340,742 | | | | 20,083,436 | | | | 21,857,556 | | | | 21,049,247 | |
| | | | | | | | | | | | | | | | | | | | | | | | |
Total Financial Liabilities | | | 30,236,723 | | | | 30,547,325 | | | | 33,600,018 | | | | 31,490,706 | | | | 31,636,539 | | | | 33,506,148 | |
| | | | | | | | | | | | | | | | | | | | | | | | |
Fair Value Measurement
The fair values of the financial assets and liabilities are presented at the amounts at which the instruments could be exchanged in a current transaction between willing parties, other than in a forced sale or liquidation.
F-112
PT INDOSAT Tbk AND ITS SUBSIDIARIES
NOTES TO CONSOLIDATED FINANCIAL STATEMENTS—(Continued)
as of January 1, 2012 (Restated), December 31, 2012 (Restated) and December 31, 2013
and for the Years ended December 31, 2011 (Restated), 2012 (Restated) and 2013
(Expressed in millions of rupiah and thousands of U.S. dollar, except share and tariff data)
The following methods and assumptions were used to estimate the fair value of each class of financial instrument for which it is practicable to estimate such value:
Short-term financial assets and liabilities:
| | • | | Short-term financial instruments with remaining maturities of one year or less (cash and cash equivalents, trade and other accounts receivable, other current financial assets, short-term loan, trade accounts payable, procurement payable, accrued expenses, deposits from customers and other current financial liabilities). |
These financial instruments approximate their carrying amounts largely due to their short-term maturities.
| | • | | Derivative financial instruments |
Cross currency swap contracts (including bifurcated embedded derivative)
These derivatives are measured at their fair values using internal valuation techniques as no quoted market prices exist for such instruments. The principal technique used to value these instruments is the use of discounted cash flows. The key inputs include interest rate yield curves, foreign exchange rates, Credit Default Spread (“CDS”), and the spot price of the underlying instruments.
Interest rate swap contracts
These derivatives are measured at their fair values, computed using discounted cash flows based on observable market inputs which include interest rate yield curves and payment dates.
Currency forward contracts
These derivatives are measured at their fair values, computed using discounted cash flows based on observable market inputs which include foreign exchange rates, payment dates and the spot price of the underlying instruments.
Long-term financial assets and liabilities:
| | • | | Long-term fixed-rate and variable-rate financial liabilities (unquoted loans and bonds payable) |
The fair value of these financial liabilities is determined by discounting future cash flows using applicable rates from observable current market transactions for instruments with similar terms, credit risk and remaining maturities.
| | • | | Other long-term financial assets and liabilities (due from / to related parties, obligation under finance lease, other long-term investments and other non-current financial assets) |
Estimated fair value is based on discounted value of future cash flows adjusted to reflect counterparty risk (for financial assets) and the Group’s own credit risk (for financial liabilities) and using risk-free rates for similar instruments.
| | • | | Financial instruments quoted in an active market |
The fair value of the bonds issued by the Company which are traded in an active market is determined with reference to their quoted market prices.
For equity investments classified as available-for-sale, the fair value is determined based on the latest market quotation as published by the Indonesia Stock Exchange as of January 1, 2012 and December 31, 2012 and 2013.
F-113
PT INDOSAT Tbk AND ITS SUBSIDIARIES
NOTES TO CONSOLIDATED FINANCIAL STATEMENTS—(Continued)
as of January 1, 2012 (Restated), December 31, 2012 (Restated) and December 31, 2013
and for the Years ended December 31, 2011 (Restated), 2012 (Restated) and 2013
(Expressed in millions of rupiah and thousands of U.S. dollar, except share and tariff data)
Fair Value Hierarchy
Financial assets and liabilities are classified in their entirety based on the lowest level of input that is significant to the fair value measurements. The assessment of the significance of a particular input to the fair value measurements requires judgment, and may affect the valuation of the assets and liabilities being measured and their placement within the fair value hierarchy.
The fair value hierarchy consists as follows:
| | • | | Level 1—Quoted (unadjusted) market prices in active markets for identical assets or liabilities |
| | • | | Level 2—Valuation techniques for which the lowest level input that is significant to the fair value measurement is directly or indirectly observable |
| | • | | Level 3—Valuation techniques for which the lowest level input that is significant to the fair value measurement is unobservable |
The best evidence of fair value is quoted prices in an active market. If the market for a financial instrument is not active, an entity establishes fair value by using a valuation technique. The objective of using a valuation technique is to establish what the transaction price would have been on the measurement date in an arm’s length exchange motivated by normal business considerations. Valuation techniques include using recent arm’s length market transactions between knowledgeable, willing parties, if available, reference to the current fair value of another instrument that is substantially the same, discounted cash flow analysis and option pricing models. If there is a valuation technique commonly used by market participants to price the instrument and that technique has been demonstrated to provide reliable estimates of prices obtained in actual market transactions, the entity uses that technique. The chosen valuation technique makes maximum use of market inputs and relies as little as possible on entity-specific inputs. It incorporates all factors that market participants would consider in setting a price and is consistent with accepted economic methodologies for pricing financial instruments. Periodically, the Company calibrates the valuation technique and tests it for validity using prices from any observable current market transactions in the same instrument (i.e., without modification or repackaging) or based on any available observable market data.
F-114
PT INDOSAT Tbk AND ITS SUBSIDIARIES
NOTES TO CONSOLIDATED FINANCIAL STATEMENTS—(Continued)
as of January 1, 2012 (Restated), December 31, 2012 (Restated) and December 31, 2013
and for the Years ended December 31, 2011 (Restated), 2012 (Restated) and 2013
(Expressed in millions of rupiah and thousands of U.S. dollar, except share and tariff data)
The Company’s fair value hierarchy as of January 1, 2012, December 31, 2012 and 2013 are as follows:
| | | | | | | | | | | | | | | | |
| | | January 1, 2012 | |
| | | TOTAL | | | Quoted prices in
active markets
for identical
assets or
liabilities
(Level 1) | | | Significant and
observable
inputs, directly
or indirectly
(Level 2) | | | Significant
unobservable
inputs
(Level 3) | |
Current Financial Assets | | | | | | | | | | | | | | | | |
Accounts receivable—trade and others—net | | | 1,505,756 | | | | — | | | | — | | | | 1,505,756 | |
Derivative assets | | | 159,349 | | | | — | | | | 159,349 | | | | — | |
Other current financial assets—net | | | 24,790 | | | | — | | | | 24,790 | | | | — | |
Non-current Financial Assets | | | | | | | | | | | | | | | | |
Due from related parties—net | | | 8,967 | | | | — | | | | 8,967 | | | | — | |
Other non-current financial assets—net | | | 207,991 | | | | — | | | | 207,991 | | | | — | |
| | | | | | | | | | | | | | | | |
Total Financial Assets | | | 1,906,853 | | | | — | | | | 401,097 | | | | 1,505,756 | |
| | | | | | | | | | | | | | | | |
Current Financial Liabilities | | | | | | | | | | | | | | | | |
Derivative liabilities | | | 138,189 | | | | — | | | | 138,189 | | | | — | |
Embedded derivatives | | | 49,518 | | | | — | | | | 49,518 | | | | — | |
Loans payable—current maturities | | | 3,927,062 | | | | — | | | | 3,927,062 | | | | — | |
Bonds payable—current maturities | | | 43,137 | | | | — | | | | 43,137 | | | | — | |
Other current financial liabilities | | | 71,828 | | | | — | | | | 71,828 | | | | — | |
| | | | | | | | | | | | | | | | |
| | | January 1, 2012 | |
| | | TOTAL | | | Quoted prices
in active
markets for
identical
assets or
liabilities
(Level 1) | | | Significant and
observable
inputs, directly
or indirectly
(Level 2) | | | Significant
unobservable
inputs
(Level 3) | |
Non-current Financial Liabilities | | | | | | | | | | | | | | | | |
Due to related parties | | | 13,030 | | | | — | | | | 13,030 | | | | — | |
Obligation under finance lease | | | 770,081 | | | | — | | | | 770,081 | | | | — | |
Loans payable—net of current maturities | | | 5,864,354 | | | | — | | | | 5,864,354 | | | | — | |
Bonds payable—net of current maturities | | | 13,334,903 | | | | 13,334,903 | | | | — | | | | — | |
Other non-current financial liabilities | | | 101,068 | | | | — | | | | 101,068 | | | | — | |
| | | | | | | | | | | | | | | | |
Total Financial Liabilities | | | 24,313,170 | | | | 13,334,903 | | | | 10,978,267 | | | | — | |
| | | | | | | | | | | | | | | | |
F-115
PT INDOSAT Tbk AND ITS SUBSIDIARIES
NOTES TO CONSOLIDATED FINANCIAL STATEMENTS—(Continued)
as of January 1, 2012 (Restated), December 31, 2012 (Restated) and December 31, 2013
and for the Years ended December 31, 2011 (Restated), 2012 (Restated) and 2013
(Expressed in millions of rupiah and thousands of U.S. dollar, except share and tariff data)
| | | | | | | | | | | | | | | | |
| | | December 31, 2012 | |
| | | TOTAL | | | Quoted prices
in active
markets for
identical
assets or
liabilities
(Level 1) | | | Significant and
observable
inputs, directly
or indirectly
(Level 2) | | | Significant
unobservable
inputs
(Level 3) | |
Current Financial Assets | | | | | | | | | | | | | | | | |
Accounts receivable—trade and others—net | | | 2,061,160 | | | | — | | | | — | | | | 2,061,160 | |
Derivative assets | | | 69,654 | | | | — | | | | 69,654 | | | | — | |
Other current financial assets—net | | | 13,382 | | | | — | | | | 13,382 | | | | — | |
Non-current Financial Assets | | | | | | | | | | | | | | | | |
Due from related parties—net | | | 9,539 | | | | — | | | | 9,539 | | | | — | |
Other non-current financial assets—net | | | 1,541,388 | | | | 1,369,740 | | | | 171,648 | | | | — | |
| | | | | | | | | | | | | | | | |
Total Financial Assets | | | 3,695,123 | | | | 1,369,740 | | | | 264,223 | | | | 2,061,160 | |
| | | | | | | | | | | | | | | | |
Current Financial Liabilities | | | | | | | | | | | | | | | | |
Derivative liabilities | | | 81,241 | | | | — | | | | 81,241 | | | | — | |
Loans payable—current maturities | | | 2,791,147 | | | | — | | | | 2,791,147 | | | | — | |
Bonds payable—current maturities | | | 1,343,205 | | | | 1,343,205 | | | | — | | | | — | |
Other current financial liabilities | | | 289,164 | | | | — | | | | 289,164 | | | | — | |
Non-current Financial Liabilities | | | | | | | | | | | | | | | | |
Due to related parties | | | 39,405 | | | | — | | | | 39,405 | | | | — | |
Obligation under finance lease | | | 3,101,910 | | | | — | | | | 3,101,910 | | | | — | |
Loans payable—net of current maturities | | | 3,331,132 | | | | — | | | | 3,331,132 | | | | — | |
Bonds payable—net of current maturities | | | 15,318,676 | | | | 15,318,676 | | | | — | | | | — | |
Other non-current financial liabilities | | | 66,433 | | | | — | | | | 66,433 | | | | — | |
| | | | | | | | | | | | | | | | |
Total Financial Liabilities | | | 26,362,313 | | | | 16,661,881 | | | | 9,700,432 | | | | — | |
| | | | | | | | | | | | | | | | |
F-116
PT INDOSAT Tbk AND ITS SUBSIDIARIES
NOTES TO CONSOLIDATED FINANCIAL STATEMENTS—(Continued)
as of January 1, 2012 (Restated), December 31, 2012 (Restated) and December 31, 2013
and for the Years ended December 31, 2011 (Restated), 2012 (Restated) and 2013
(Expressed in millions of rupiah and thousands of U.S. dollar, except share and tariff data)
| | | | | | | | | | | | | | | | |
| | | December 31, 2013 | |
| | | TOTAL | | | Quoted prices
in active
markets for
identical
assets or
liabilities
(Level 1) | | | Significant and
observable
inputs, directly
or indirectly
(Level 2) | | | Significant
unobservable
inputs
(Level 3) | |
Current Financial Assets | | | | | | | | | | | | | | | | |
Accounts receivable—trade and others—net | | | 2,284,633 | | | | — | | | | — | | | | 2,284,633 | |
Derivative assets | | | 195,569 | | | | — | | | | 195,569 | | | | — | |
Other current financial assets—net | | | 31,673 | | | | — | | | | 31,673 | | | | — | |
Non-current Financial Assets | | | | | | | | | | | | | | | | |
Due from related parties—net | | | 6,174 | | | | — | | | | 6,174 | | | | — | |
Other non-current financial assets—net | | | 1,556,622 | | | | 1,393,722 | | | | 162,900 | | | | — | |
| | | | | | | | | | | | | | | | |
Total Financial Assets | | | 4,074,671 | | | | 1,393,722 | | | | 396,316 | | | | 2,284,633 | |
| | | | | | | | | | | | | | | | |
Current Financial Liabilities | | | | | | | | | | | | | | | | |
Derivative liabilities | | | 36,903 | | | | — | | | | 36,903 | | | | — | |
Loans payable—current maturities | | | 2,624,742 | | | | — | | | | 2,624,742 | | | | — | |
Bonds payable—current maturities | | | 2,372,560 | | | | 2,372,560 | | | | — | | | | — | |
Other current financial liabilities | | | 362,448 | | | | — | | | | 362,448 | | | | — | |
Non-current Financial Liabilities | | | | | | | | | | | | | | | | |
Due to related parties | | | 28,687 | | | | — | | | | 28,687 | | | | — | |
Obligation under finance lease | | | 3,594,112 | | | | — | | | | 3,594,112 | | | | — | |
Loans payable—net of current maturities | | | 3,276,815 | | | | — | | | | 3,276,815 | | | | — | |
Bonds payable—net of current maturities | | | 14,075,516 | | | | 14,075,516 | | | | — | | | | — | |
Other non-current financial liabilities | | | 74,117 | | | | — | | | | 74,117 | | | | — | |
| | | | | | | | | | | | | | | | |
Total Financial Liabilities | | | 26,445,900 | | | | 16,448,076 | | | | 9,997,824 | | | | — | |
| | | | | | | | | | | | | | | | |
During the years ended December 31, 2011, 2012 and 2013, there were no transfers between Level 1 and Level 2 fair value measurements.
22. EMPLOYEE BENEFIT OBLIGATIONS—NET OF CURRENT PORTION
This account consists of the non-current portions of employee benefit obligations as follows:
| | | | | | | | | | | | |
| | | December 31, | |
| | | January 1, 2012
(Restated) | | | 2012
(Restated) | | | 2013 | |
Post-retirement healthcare (Note 30d4) | | | 674,832 | | | | 1,002,513 | | | | 469,727 | |
Labor Law 13 (Note 30c4) | | | 286,435 | | | | 362,522 | | | | 239,481 | |
Service award | | | 35,071 | | | | 41,479 | | | | 35,378 | |
Accumulated leave benefits | | | 2,161 | | | | 2,697 | | | | 2,385 | |
| | | | | | | | | | | | |
Total | | | 998,499 | | | | 1,409,211 | | | | 746,971 | |
| | | | | | | | | | | | |
F-117
PT INDOSAT Tbk AND ITS SUBSIDIARIES
NOTES TO CONSOLIDATED FINANCIAL STATEMENTS—(Continued)
as of January 1, 2012 (Restated), December 31, 2012 (Restated) and December 31, 2013
and for the Years ended December 31, 2011 (Restated), 2012 (Restated) and 2013
(Expressed in millions of rupiah and thousands of U.S. dollar, except share and tariff data)
23. CAPITAL STOCK
The Company’s capital stock ownership details as of January 1, 2012, December 31, 2012 and 2013 are as follows:
| | | | | | | | | | | | |
Stockholders | | Number of
Shares Issued
and Fully Paid | | | Amount | | | Percentage
of Ownership
(%) | |
January 1, 2012 | | | | | | | | | | | | |
A Share | | | | | | | | | | | | |
Government | | | 1 | | | | — | | | | — | |
B Shares | | | | | | | | | | | | |
Ooredoo Asia, Pte. Ltd.
(previously Qatar Telecom
(Qtel Asia) Pte. Ltd) | | | 3,532,056,600 | | | | 353,206 | | | | 65.00 | |
Government | | | 776,624,999 | | | | 77,662 | | | | 14.29 | |
SKAGEN Funds (SKAGEN AS) | | | 305,498,450 | | | | 30,550 | | | | 5.62 | |
Director: | | | | | | | | | | | | |
Fadzri Sentosa | | | 10,000 | | | | 1 | | | | 0.00 | |
Others (each holding below 5%) | | | 819,743,450 | | | | 81,974 | | | | 15.09 | |
| | | | | | | | | | | | |
Total | | | 5,433,933,500 | | | | 543,393 | | | | 100.00 | |
| | | | | | | | | | | | |
| | | |
December 31, 2012 | | | | | | | | | | | | |
A Share | | | | | | | | | | | | |
Government | | | 1 | | | | — | | | | — | |
B Shares | | | | | | | | | | | | |
Ooredoo Asia, Pte. Ltd. | | | 3,532,056,600 | | | | 353,206 | | | | 65.00 | |
Government | | | 776,624,999 | | | | 77,662 | | | | 14.29 | |
SKAGEN Funds (SKAGEN AS) | | | 299,382,400 | | | | 29,938 | | | | 5.51 | |
Director: | | | | | | | | | | | | |
Fadzri Sentosa | | | 10,000 | | | | 1 | | | | 0.00 | |
Others (each holding below 5%) | | | 825,859,500 | | | | 82,586 | | | | 15.20 | |
| | | | | | | | | | | | |
Total | | | 5,433,933,500 | | | | 543,393 | | | | 100.00 | |
| | | | | | | | | | | | |
| | | |
December 31, 2013 | | | | | | | | | | | | |
A Share | | | | | | | | | | | | |
Government | | | 1 | | | | — | | | | — | |
B Shares | | | | | | | | | | | | |
Ooredoo Asia, Pte. Ltd. | | | 3,532,056,600 | | | | 353,206 | | | | 65.00 | |
Government | | | 776,624,999 | | | | 77,662 | | | | 14.29 | |
SKAGEN Funds (SKAGEN AS)
(Note 37c) | | | 298,880,950 | | | | 29,888 | | | | 5.50 | |
Director: | | | | | | | | | | | | |
Fadzri Sentosa | | | 10,000 | | | | 1 | | | | 0.00 | |
Others (each holding below 5%) | | | 826,360,950 | | | | 82,636 | | | | 15.21 | |
| | | | | | | | | | | | |
Total | | | 5,433,933,500 | | | | 543,393 | | | | 100.00 | |
| | | | | | | | | | | | |
F-118
PT INDOSAT Tbk AND ITS SUBSIDIARIES
NOTES TO CONSOLIDATED FINANCIAL STATEMENTS—(Continued)
as of January 1, 2012 (Restated), December 31, 2012 (Restated) and December 31, 2013
and for the Years ended December 31, 2011 (Restated), 2012 (Restated) and 2013
(Expressed in millions of rupiah and thousands of U.S. dollar, except share and tariff data)
The “A” share is a special share held by the Government and has special voting rights. The material rights and restrictions which are applicable to the “B” shares are also applicable to the “A” share, except that the Government may not transfer the “A” share, which has a veto right with respect to (i) amendment to the objective and purposes of the Company; (ii) increase of capital without pre-emptive rights; (iii) merger, consolidation, acquisition and demerger; (iv) amendment to the provisions regarding the rights of “A” share as stipulated in the Articles of Association; and (v) dissolution, bankruptcy and liquidation of the Company. The “A” shareholder also has the right to appoint one Director and one Commissioner of the Company.
24. REVENUES
The details of this account for the years ended December 31, 2011, 2012 and 2013 consist of the following:
| | | | | | | | | | | | |
| | | 2011 | | | 2012 | | | 2013 | |
Cellular | | | | | | | | | | | | |
Usage charges | | | 8,203,788 | | | | 8,629,697 | | | | 9,281,316 | |
Value-added services | | | 7,502,140 | | | | 7,868,391 | | | | 8,408,278 | |
Interconnection services | | | 1,182,384 | | | | 2,174,964 | | | | 2,430,823 | |
Tower leasing (Note 34n) | | | 419,720 | | | | 504,857 | | | | 573,263 | |
Monthly subscription charges | | | 134,032 | | | | 136,429 | | | | 127,628 | |
Upfront discount and customer loyalty program (Note 2f5.1) | | | (1,116,471 | ) | | | (1,022,262 | ) | | | (1,671,899 | ) |
Others | | | 261,792 | | | | 197,253 | | | | 225,229 | |
| | | | | | | | | | | | |
Sub-total | | | 16,587,385 | | | | 18,489,329 | | | | 19,374,638 | |
| | | | | | | | | | | | |
MIDI | | | | | | | | | | | | |
Internet Protocol Virtual Private Network (IP VPN) | | | 695,947 | | | | 711,427 | | | | 706,005 | |
Internet | | | 375,743 | | | | 422,099 | | | | 696,238 | |
Multiprotocol Label Switching (MPLS) | | | 89,937 | | | | 304,868 | | | | 380,804 | |
World link and direct link | | | 294,956 | | | | 314,878 | | | | 340,739 | |
Application services | | | 192,562 | | | | 251,893 | | | | 283,760 | |
Satellite lease | | | 150,894 | | | | 213,052 | | | | 278,244 | |
Leased line | | | 263,723 | | | | 150,400 | | | | 169,911 | |
Digital data network | | | 103,098 | | | | 112,597 | | | | 110,117 | |
Frame net | | | 123,249 | | | | 135,761 | | | | 93,391 | |
Value added service | | | 264,569 | | | | 173,940 | | | | 52,241 | |
Others | | | 139,593 | | | | 118,883 | | | | 155,015 | |
| | | | | | | | | | | | |
Sub-total | | | 2,694,271 | | | | 2,909,798 | | | | 3,266,465 | |
| | | | | | | | | | | | |
Fixed Telecommunications | | | | | | | | | | | | |
International Calls | | | 934,021 | | | | 801,442 | | | | 1,019,980 | |
Fixed Line | | | 123,185 | | | | 121,735 | | | | 135,168 | |
Fixed Wireless | | | 192,776 | | | | 98,273 | | | | 59,639 | |
| | | | | | | | | | | | |
Sub-total | | | 1,249,982 | | | | 1,021,450 | | | | 1,214,787 | |
| | | | | | | | | | | | |
Total | | | 20,531,638 | | | | 22,420,577 | | | | 23,855,890 | |
| | | | | | | | | | | | |
F-119
PT INDOSAT Tbk AND ITS SUBSIDIARIES
NOTES TO CONSOLIDATED FINANCIAL STATEMENTS—(Continued)
as of January 1, 2012 (Restated), December 31, 2012 (Restated) and December 31, 2013
and for the Years ended December 31, 2011 (Restated), 2012 (Restated) and 2013
(Expressed in millions of rupiah and thousands of U.S. dollar, except share and tariff data)
The details of net revenues (included as part of cellular revenue—value added service) received by the Company from agency relationships are as follows:
| | | | | | | | | | | | |
| | | 2011 | | | 2012 | | | 2013 | |
Gross revenues | | | 8,081,500 | | | | 7,966,505 | | | | 8,593,805 | |
Compensation to value added service providers | | | (579,360 | ) | | | (98,114 | ) | | | (185,527 | ) |
| | | | | | | | | | | | |
Net revenues | | | 7,502,140 | | | | 7,868,391 | | | | 8,408,278 | |
| | | | | | | | | | | | |
Revenues from related parties amounted to Rp1,554,780, Rp1,812,619 and Rp2,059,851 for the years ended December 31, 2011, 2012 and 2013, respectively (Note 31). These amounts represent 7.57%, 8.08% and 8.63% of total revenues in 2011, 2012 and 2013, respectively.
The revenues from interconnection services are presented on a gross basis (Note 2f5.1).
25. EXPENSES—COST OF SERVICES
The details of this account for the years ended December 31, 2011, 2012 and 2013 consist of the following:
| | | | | | | | | | | | |
| | | 2011 | | | 2012 | | | 2013 | |
Interconnection | | | 1,706,521 | | | | 2,557,775 | | | | 2,946,483 | |
Radio frequency fee (Note 34p) | | | 1,755,852 | | | | 1,961,377 | | | | 2,225,610 | |
Maintenance | | | 921,990 | | | | 829,757 | | | | 981,191 | |
Utilities | | | 822,784 | | | | 842,963 | | | | 891,951 | |
Rent (Note 34o) | | | 612,348 | | | | 726,872 | | | | 726,915 | |
Blackberry access fee | | | 371,229 | | | | 519,611 | | | | 517,993 | |
Leased circuits (Note 34s) | | | 331,390 | | | | 349,114 | | | | 464,438 | |
USO | | | 228,693 | | | | 273,943 | | | | 330,469 | |
Cost of SIM cards and pulse reload vouchers | | | 285,812 | | | | 234,239 | | | | 253,343 | |
Installation | | | 141,420 | | | | 169,440 | | | | 161,404 | |
Concession fee | | | 122,178 | | | | 141,111 | | | | 149,354 | |
Delivery and transportation | | | 83,073 | | | | 122,348 | | | | 129,986 | |
Communication network | | | 6,221 | | | | 53,956 | | | | 70,428 | |
License | | | 32,225 | | | | 54,177 | | | | 45,338 | |
Billing and collection | | | 57,780 | | | | 41,767 | | | | 28,995 | |
Cost of handsets and modems | | | 12,500 | | | | 12,392 | | | | 10,834 | |
Others | | | 55,391 | | | | 14,894 | | | | 21,801 | |
| | | | | | | | | | | | |
Total | | | 7,547,407 | | | | 8,905,736 | | | | 9,956,533 | |
| | | | | | | | | | | | |
Interconnection relates to the expenses for the interconnection between the Company’s telecommunications networks and those owned by Telkom or other telecommunications carriers (Note 2f5).
F-120
PT INDOSAT Tbk AND ITS SUBSIDIARIES
NOTES TO CONSOLIDATED FINANCIAL STATEMENTS—(Continued)
as of January 1, 2012 (Restated), December 31, 2012 (Restated) and December 31, 2013
and for the Years ended December 31, 2011 (Restated), 2012 (Restated) and 2013
(Expressed in millions of rupiah and thousands of U.S. dollar, except share and tariff data)
26. EXPENSES—PERSONNEL
The details of this account for the years ended December 31, 2011, 2012 and 2013 consist of the following:
| | | | | | | | | | | | |
| | | 2011
(Restated) | | | 2012
(Restated) | | | 2013 | |
Salaries | | | 472,826 | | | | 547,923 | | | | 605,798 | |
Incentives and other employee benefits | | | 272,291 | | | | 324,681 | | | | 317,039 | |
Employee income tax | | | 260,104 | | | | 167,205 | | | | 257,395 | |
Bonuses | | | 199,043 | | | | 127,746 | | | | 153,160 | |
Severance benefits under VSS and ESP * | | | 579,301 | | | | 6,330 | | | | 137,633 | |
Post-retirement healthcare cost (income) (Note 30d1) | | | (137,495 | ) | | | 82,196 | | | | 90,107 | |
Medical expense | | | 60,819 | | | | 56,782 | | | | 59,039 | |
Separation, appreciation and compensation expense under Labor Law No. 13/2003 (Note 30c1) | | | 5,522 | | | | 52,431 | | | | 54,841 | |
Net periodic pension cost (Note 30a1) | | | 11,402 | | | | 24,108 | | | | 35,231 | |
Early retirement | | | 15,170 | | | | 1,210 | | | | 5,075 | |
Outsourcing | | | 36,264 | | | | — | | | | — | |
Others | | | 54,226 | | | | 19,553 | | | | 19,125 | |
| | | | | | | | | | | | |
Total | | | 1,829,473 | | | | 1,410,165 | | | | 1,734,443 | |
| | | | | | | | | | | | |
| * | On January 20, 2011 and January 2, 2012, the Company’s and Lintasarta’s Boards of Directors issued Directors’ Decree No. 003/Direksi/2011 and Directors’ Decree No. 015/Direksi/40000/2012, respectively, regarding the Organizational Restructuring Program through an offering scheme on the basis of mutual agreement between the Company/Lintasarta and certain employees (“VSS = Voluntary Separation Scheme”), that became effective on the same date. For the year ended December 31, 2011, there were 994 and 54 employees of the Company and Lintasarta, respectively, who availed themselves of the scheme, and the benefits paid by the Company and Lintasarta amounted to Rp566,034 and Rp13,267, respectively. For the year December 31, 2012, there were 24 employees of Lintasarta, who availed themselves of the scheme and the benefits paid amounted to Rp6,330. |
| | On December 12, 2013, the Company’s Directors issued Decree No. 050/AC0-ACBA/HRD-PKG/13, “Employment Separation Program (“ESP”) due to Reorganization”. Under this decree, there were 214 employees of the Company who were qualified for this program after the approval from the Board of Directors, and the benefit to be paid amounted to Rp137,633. |
The personnel expenses capitalized to properties under construction and installation for the years ended December 31, 2011, 2012 and 2013 amounted to Rp46,575, Rp52,339 and Rp50,623, respectively.
F-121
PT INDOSAT Tbk AND ITS SUBSIDIARIES
NOTES TO CONSOLIDATED FINANCIAL STATEMENTS—(Continued)
as of January 1, 2012 (Restated), December 31, 2012 (Restated) and December 31, 2013
and for the Years ended December 31, 2011 (Restated), 2012 (Restated) and 2013
(Expressed in millions of rupiah and thousands of U.S. dollar, except share and tariff data)
27. EXPENSES—GENERAL AND ADMINISTRATION
The details of this account for the years ended December 31, 2011, 2012 and 2013 consist of the following:
| | | | | | | | | | | | |
| | | 2011 | | | 2012 | | | 2013 | |
Professional fees | | | 109,523 | | | | 186,886 | | | | 365,348 | |
Rent | | | 113,277 | | | | 117,845 | | | | 136,205 | |
Provision for impairment of receivables—net (Note 5) | | | 41,051 | | | | 56,163 | | | | 102,307 | |
Transportation | | | 65,807 | | | | 61,231 | | | | 69,829 | |
Insurance | | | 44,539 | | | | 37,582 | | | | 33,857 | |
Training, education and research | | | 23,371 | | | | 26,443 | | | | 32,033 | |
Social activities | | | 16,620 | | | | 27,683 | | | | 30,269 | |
Office | | | 34,956 | | | | 28,705 | | | | 28,051 | |
Public relation | | | 9,262 | | | | 13,084 | | | | 22,374 | |
Utilities | | | 14,069 | | | | 14,636 | | | | 15,044 | |
Communications | | | 10,433 | | | | 7,589 | | | | 6,973 | |
Others (each below Rp10,000) | | | 66,622 | | | | 47,693 | | | | 59,244 | |
| | | | | | | | | | | | |
Total | | | 549,530 | | | | 625,540 | | | | 901,534 | |
| | | | | | | | | | | | |
28. FINANCING COST
The details of this account for the years ended December 31, 2011, 2012 and 2013 consist of the following:
| | | | | | | | | | | | |
| | | 2011 | | | 2012 | | | 2013 | |
Interest on loans | | | 1,700,091 | | | | 1,709,946 | | | | 1,697,679 | |
Finance charges under finance lease | | | 133,322 | | | | 261,458 | | | | 446,917 | |
Amortization of debt and bonds / notes issuance costs, consent solicitation fees and discount (Notes 14, 18 and 19) | | | 83,444 | | | | 88,878 | | | | 56,208 | |
Interest expense from Lintasarta’s USO Project | | | 6,345 | | | | 11,256 | | | | 8,391 | |
Bank charges | | | 6,152 | | | | 5,812 | | | | 2,900 | |
| | | | | | | | | | | | |
Total | | | 1,929,354 | | | | 2,077,350 | | | | 2,212,095 | |
| | | | | | | | | | | | |
29. GAIN ON TOWER SALE
On February 7, 2012, the Company entered into an Asset Sale Agreement with PT Tower Bersama Infrastructure Tbk and its subsidiary, PT Solusi Menara Bersama (collectively referred to as “Tower Bersama”), whereby the Company agreed to sell 2,500 of its telecommunication towers to Tower Bersama for a total consideration of US$518,500, consisting of US$406,000 paid upfront and a maximum potential deferred payment of US$112,500. The upfront payment includes PT Tower Bersama Infrastructure Tbk’s shares of not less than 5% of the increase in its capital stock (upon the Rights Issue of PT Tower Bersama Infrastructure Tbk). Based on the agreement, the Company also agreed to lease back the spaces in the 2,500 telecommunication towers for a 10-year period with fixed monthly lease rate of US$1,300 per tower slot (in full amount). The leases have an option to be renewed for a further 10-year period.
F-122
PT INDOSAT Tbk AND ITS SUBSIDIARIES
NOTES TO CONSOLIDATED FINANCIAL STATEMENTS—(Continued)
as of January 1, 2012 (Restated), December 31, 2012 (Restated) and December 31, 2013
and for the Years ended December 31, 2011 (Restated), 2012 (Restated) and 2013
(Expressed in millions of rupiah and thousands of U.S. dollar, except share and tariff data)
On August 2, 2012, the Company and Tower Bersama closed the deal on the sale-and-leaseback transaction of 2,500 telecommunication towers. On the closing date of such transaction, the Company received cash amounting to US$326,289 (equal to Rp3,092,894) and obtained 5% ownership (equal to 239,826,310 shares) in Tower Bersama with a value of US$103,101 (equivalent to Rp977,292) (Note12).
The total consideration of US$429,390 (equal to Rp4,070,187) is allocated to the sales of property and equipment amounting to Rp3,870,600 and the remainder is allocated to prepaid land lease and existing tower lease contracts from the 2,500 towers. The total carrying amount of the separately identifiable components of the transaction is Rp1,534,494 which includes the carrying amount of property and equipment amounting to Rp1,372,674. As of the agreement closing date, the Company recorded the excess of the selling price over the carrying amounts amounting to Rp2,535,693 (including the Rp2,497,926 from the sale of property and equipment) as “Gain on Sale of Towers” of Rp1,125,192, and “Deferred Gain on Sale-and-Leaseback Transactions” of Rp1,410,501. The deferred gain is amortized over the term of the lease, being 10 years.
For the year ended December 31, 2012, the Company recognized total “Gain on Sale of Towers” of Rp1,183,963, which included an amortization of the “Deferred Gain on Sale-and-Leaseback Transactions”. As of December 31, 2012 and 2013, the balances of the current portion of outstanding deferred gain on sale-and-leaseback transactions amounting to Rp141,050 each are presented as part of “Other Current Liabilities”, while the balances of the long-term portion amounting to Rp1,210,680 and Rp1,069,630, respectively, are presented as part of “Other Non-current Liabilities”.
For the years ended December 31, 2012 and 2013, the Company recorded amortization of deferred gain on sale-and-leaseback transactions amounting to Rp58,771 and Rp141,050, respectively.
30. PENSION PLAN
The Company, Satelindo and Lintasarta have defined benefit and defined contribution pension plans covering substantially all of their respective qualified permanent employees.
A. Defined Benefit Pension Plan
The Company, Satelindo and Lintasarta provide defined benefit pension plans to their respective employees under which pension benefits to be paid upon retirement are based on the employees’ most recent basic salary and number of years of service. PT Asuransi Jiwasraya (“Jiwasraya”), a state-owned life insurance company, manages the plans. Pension contributions are determined by periodic actuarial calculations performed by Jiwasraya.
Based on an amendment dated December 22, 2000 of the Company’s pension plan, which was further amended on March 29, 2001, the benefits and premium payment pattern were changed. Before the amendment, the premium was regularly paid annually until the plan would be fully funded and the benefits consisted of retirement benefit (regular monthly or lump-sum pension) and death insurance. In conjunction with the amendment, the plan would be fully funded after making installment payments up to January 2002 of the required amount to fully fund the plan determined as of September 1, 2000. The amendment also includes an additional benefit in the form of thirteenth-month retirement benefit, which is payable annually 14 days before Idul Fitri (“Moslem Holiday”).
F-123
PT INDOSAT Tbk AND ITS SUBSIDIARIES
NOTES TO CONSOLIDATED FINANCIAL STATEMENTS—(Continued)
as of January 1, 2012 (Restated), December 31, 2012 (Restated) and December 31, 2013
and for the Years ended December 31, 2011 (Restated), 2012 (Restated) and 2013
(Expressed in millions of rupiah and thousands of U.S. dollar, except share and tariff data)
The amendment covers employees registered as participants of the pension plan as of September 1, 2000 and includes an increase in basic salary pension by 9% compounded annually starting from September 1, 2001. The amendment also stipulates that there will be no increase in the premium even in cases of mass employee terminations or changes in marital status.
The total premium installments based on the amendment amounted to Rp355,000 and were paid on due dates.
On March 1, 2007, the Company entered into an agreement with Jiwasraya to provide defined death insurance plan to 1,276 employees as of January 1, 2007, who are not covered by the defined benefit pension plan as stated above. Based on the agreement, a participating employee will receive:
| | • | | Expiration benefit equivalent to the cash value at the normal retirement age, or |
| | • | | Death benefit not due to accident equivalent to 100% of insurance money plus cash value when the employee dies not due to accident, or |
| | • | | Death benefit due to accident equivalent to 200% of insurance money plus cash value when the employee dies due to accident. |
The premium of Rp7,600 was fully paid on March 29, 2007. Subsequently, in August 2007, February to December 2008, January to December 2009, January to December 2010, January to December 2011, January to December 2012 and January to December 2013, the Company made payments for additional premium of Rp275 for additional 55 employees, Rp805 for additional 161 employees, Rp415 for additional 81 employees, Rp120 for additional 14 employees, Rp378 for additional 41 employees, Rp883 for additional 143 employees and Rp782 for additional 117 employees, respectively.
On June 25, 2003, Satelindo entered into an agreement with Jiwasraya to amend the benefits and premium payment pattern of the former’s pension plan. The amendment covers employees registered as participants of the pension plan as of December 25, 2002 up to June 25, 2003. Other new conditions include the following:
| | • | | An increase in pension basic salary at 6% compounded annually starting from December 25, 2002 |
| | • | | Thirteenth-month retirement benefit, which is payable annually 14 days before Idul Fitri |
| | • | | An increase in periodic payment of retirement benefit at 6% compounded annually starting one year after receiving periodic retirement benefit for the first time |
| | • | | If the average annual interest rate of time deposits of government banks exceeds 15%, the participants’ retirement benefit will be increased by a certain percentage in accordance with the formula agreed by both parties. |
On April 15, 2005, Lintasarta entered into an agreement with Jiwasraya to replace their existing agreement. Based on the new agreement, the benefits and premium payment pattern were changed. This agreement is effective starting January 1, 2005. The total premium installments based on the agreement amount to Rp61,623, which is payable in 10 annual installments starting 2005 until 2015.
The new agreement covers employees registered as participants of the pension plan as of April 1, 2003. The conditions under the new agreement include the following:
| | • | | An increase in pension basic salary by 3% (previously was estimated at 8%) compounded annually starting April 1, 2003 |
F-124
PT INDOSAT Tbk AND ITS SUBSIDIARIES
NOTES TO CONSOLIDATED FINANCIAL STATEMENTS—(Continued)
as of January 1, 2012 (Restated), December 31, 2012 (Restated) and December 31, 2013
and for the Years ended December 31, 2011 (Restated), 2012 (Restated) and 2013
(Expressed in millions of rupiah and thousands of U.S. dollar, except share and tariff data)
| | • | | An increase in periodic payment of retirement benefit at 5% compounded annually starting one year after receiving periodic retirement benefit for the first time |
| | • | | If the average annual interest rate of time deposits of government banks exceeds 15%, the participants’ retirement benefit will be increased by a certain percentage in accordance with the formula agreed by both parties. |
On May 2, 2005, Lintasarta entered into an agreement with Jiwasraya to amend the above agreement. The amendment covers employees registered as participants of the pension plan as of April 1, 2003 up to November 30, 2004 with additional 10 annual premium installments totaling Rp1,653 which are payable starting 2005 until 2015.
The contributions made by Lintasarta to Jiwasraya amounted to Rp9,653 each for the years ended December 31, 2011, 2012 and 2013, respectively.
The net periodic pension cost for the pension plans of the Company and Lintasarta for the years ended December 31, 2011, 2012 and 2013 was calculated based on the actuarial valuations as of December 31, 2011, 2012 and 2013, respectively. The actuarial valuations were prepared by an independent actuary, using the projected-unit-credit method and applying the following assumptions:
| | | | | | | | | | | | |
| | | 2011 | | | 2012 | | | 2013 | |
| Annual discount rate | | | 7.0 and 7.5 | % | | | 6.0 | % | | | 9.0 | % |
Annual rate of increase in compensation | | | 3.0,6.0 and 9.0 | % | | | 3.0,6.0 and 9.0 | % | | | 3.0,6.0 and 9.0 | % |
Mortality rate (Indonesian Mortality Table—TMI) | | | TMI 1999 | | | | TMI 2011 | | | | TMI 2011 | |
| | (i). | The composition of the net periodic pension cost is as follows: |
| | | | | | | | | | | | |
2011 | | The Company | | | Lintasarta | | | Total | |
Service cost | | | 27,167 | | | | 3,839 | | | | 31,006 | |
Net interest on the net defined benefit liability (asset) | | | (1,199 | ) | | | (1,164 | ) | | | (2,363 | ) |
Curtailment loss (gain) | | | (18,886 | ) | | | 1,645 | | | | (17,241 | ) |
| | | | | | | | | | | | |
Net periodic pension cost (Note 26) | | | 7,082 | | | | 4,320 | | | | 11,402 | |
| | | | | | | | | | | | |
| | | | | | | | | | | | |
2012 | | The Company | | | Lintasarta | | | Total | |
Service cost | | | 25,617 | | | | 3,219 | | | | 28,836 | |
Net interest on the net defined benefit liability (asset) | | | (4,726 | ) | | | (919 | ) | | | (5,645 | ) |
Curtailment loss | | | — | | | | 917 | | | | 917 | |
| | | | | | | | | | | | |
Net periodic pension cost (Note 26) | | | 20,891 | | | | 3,217 | | | | 24,108 | |
| | | | | | | | | | | | |
| | | | | | | | | | | | |
2013 | | The Company | | | Lintasarta | | | Total | |
Service cost | | | 28,310 | | | | 3,722 | | | | 32,032 | |
Net interest on the net defined benefit liability (asset) | | | (1,547 | ) | | | (580 | ) | | | (2,127 | ) |
Curtailment loss | | | 8,129 | | | | — | | | | 8,129 | |
Immediate recognition of past service cost—vested benefit | | | — | | | | (2,803 | ) | | | (2,803 | ) |
| | | | | | | | | | | | |
Net periodic pension cost (Note 26) | | | 34,892 | | | | 339 | | | | 35,231 | |
| | | | | | | | | | | | |
F-125
PT INDOSAT Tbk AND ITS SUBSIDIARIES
NOTES TO CONSOLIDATED FINANCIAL STATEMENTS—(Continued)
as of January 1, 2012 (Restated), December 31, 2012 (Restated) and December 31, 2013
and for the Years ended December 31, 2011 (Restated), 2012 (Restated) and 2013
(Expressed in millions of rupiah and thousands of U.S. dollar, except share and tariff data)
| | (ii). | The funded status of the plans is as follows: |
| | | | | | | | | | | | |
| | | | | | December 31, | |
| | | January 1, 2012
(Restated) | | | 2012
(Restated) | | | 2013 | |
Plan assets at fair value | | | 538,902 | | | | 576,335 | | | | 549,859 | |
Projected benefit obligation | | | (463,074 | )* | | | (554,209 | ) | | | (422,206 | )* |
| | | | | | | | | | | | |
Excess of plan assets over projected benefit obligation | | | 75,828 | | | | 22,126 | | | | 127,653 | |
Unrecognized actuarial loss | | | 29,464 | | | | 68,175 | | | | — | |
| | | | | | | | | | | | |
Total prepaid pension cost, as previously reported | | | 105,292 | | | | 90,301 | | | | 127,653 | |
Restatement | | | (29,464 | ) | | | (68,175 | ) | | | — | |
| | | | | | | | | | | | |
Total prepaid pension cost, as restated | | | 75,828 | | | | 22,126 | | | | 127,653 | |
| | | | | | | | | | | | |
| | * | net of curtailment effect during 2011 and 2013 due to VSS and ESP (Note 26) |
| | (iii) | Movements in the fair value of plan assets are as follows: |
| | | | | | | | | | | | |
2011 | | The Company | | | Lintasarta | | | Total | |
Fair value of plan assets at beginning of year | | | 793,664 | | | | 59,294 | | | | 852,958 | |
Actual return on plan assets | | | 44,985 | | | | 5,353 | | | | 50,338 | |
Actuarial gain (loss) on plan assets | | | 16,841 | | | | (925 | ) | | | 15,916 | |
Contributions | | | 378 | | | | 9,653 | | | | 10,031 | |
Actual benefits paid | | | (378,978 | ) | | | (11,363 | ) | | | (390,341 | ) |
| | | | | | | | | | | | |
Fair value of plan assets at end of year | | | 476,890 | | | | 62,012 | | | | 538,902 | |
| | | | | | | | | | | | |
| | | | | | | | | | | | |
2012 | | The Company | | | Lintasarta | | | Total | |
Fair value of plan assets at beginning of year | | | 476,890 | | | | 62,012 | | | | 538,902 | |
Actual return on plan assets | | | 33,072 | | | | 4,509 | | | | 37,581 | |
Actuarial gain (loss) on plan assets | | | 12,222 | | | | (4,077 | ) | | | 8,145 | |
Contributions | | | 883 | | | | 9,653 | | | | 10,536 | |
Actual benefits paid | | | (9,751 | ) | | | (9,078 | ) | | | (18,829 | ) |
| | | | | | | | | | | | |
Fair value of plan assets at end of year | | | 513,316 | | | | 63,019 | | | | 576,335 | |
| | | | | | | | | | | | |
| | | | | | | | | | | | |
2013 | | The Company | | | Lintasarta | | | Total | |
Fair value of plan assets at beginning of year | | | 513,316 | | | | 63,019 | | | | 576,335 | |
Actual return on plan assets | | | 30,376 | | | | 4,014 | | | | 34,390 | |
Actuarial gain (loss) on plan assets | | | 17,534 | | | | (3,860 | ) | | | 13,674 | |
Contributions | | | 782 | | | | 9,653 | | | | 10,435 | |
Actual benefits paid | | | (83,099 | ) | | | (1,876 | ) | | | (84,975 | ) |
| | | | | | | | | | | | |
Fair value of plan assets at end of year | | | 478,909 | �� | | | 70,950 | | | | 549,859 | |
| | | | | | | | | | | | |
F-126
PT INDOSAT Tbk AND ITS SUBSIDIARIES
NOTES TO CONSOLIDATED FINANCIAL STATEMENTS—(Continued)
as of January 1, 2012 (Restated), December 31, 2012 (Restated) and December 31, 2013
and for the Years ended December 31, 2011 (Restated), 2012 (Restated) and 2013
(Expressed in millions of rupiah and thousands of U.S. dollar, except share and tariff data)
| | (iv) | Movements in the present value of the defined benefit obligation are as follows: |
| | | | | | | | | | | | |
2011 | | The Company | | | Lintasarta | | | Total | |
Present value of benefit obligation at beginning of year | | | 700,410 | | | | 50,215 | | | | 750,625 | |
Interest cost | | | 43,786 | | | | 4,189 | | | | 47,975 | |
Current service cost | | | 27,167 | | | | 3,839 | | | | 31,006 | |
Actuarial gain on obligation | | | (12,066 | ) | | | (561 | ) | | | (12,627 | ) |
Effect of settlement | | | (358,597 | ) | | | (9,080 | ) | | | (367,677 | ) |
Actual benefits paid | | | (18,750 | ) | | | (1,858 | ) | | | (20,608 | ) |
Effect of curtailment | | | (18,886 | ) | | | 1,645 | | | | (17,241 | ) |
Effect of changes in demographic assumptions | | | (8,462 | ) | | | — | | | | (8,462 | ) |
Effect of changes in financial assumptions | | | 55,206 | | | | 4,877 | | | | 60,083 | |
| | | | | | | | | | | | |
Present value of benefit obligation at end of year | | | 409,808 | | | | 53,266 | | | | 463,074 | |
| | | | | | | | | | | | |
| | | | | | | | | | | | |
2012 | | The Company | | | Lintasarta | | | Total | |
Present value of benefit obligation at beginning of year | | | 409,808 | | | | 53,266 | | | | 463,074 | |
Interest cost | | | 28,346 | | | | 3,590 | | | | 31,936 | |
Current service cost | | | 25,617 | | | | 3,219 | | | | 28,836 | |
Actuarial loss on obligation | | | 2,434 | | | | 356 | | | | 2,790 | |
Effect of settlement | | | — | | | | (4,360 | ) | | | (4,360 | ) |
Actual benefits paid | | | (9,751 | ) | | | (3,909 | ) | | | (13,660 | ) |
Effect of curtailment | | | — | | | | 917 | | | | 917 | |
Effect of changes in demographic assumptions | | | (891 | ) | | | (146 | ) | | | (1,037 | ) |
Effect of changes in financial assumptions | | | 38,291 | | | | 7,422 | | | | 45,713 | |
| | | | | | | | | | | | |
Present value of benefit obligation at end of year | | | 493,854 | | | | 60,355 | | | | 554,209 | |
| | | | | | | | | | | | |
| | | | | | | | | | | | |
2013 | | The Company | | | Lintasarta | | | Total | |
Present value of benefit obligation at beginning of year | | | 493,854 | | | | 60,355 | | | | 554,209 | |
Interest cost | | | 28,829 | | | | 3,434 | | | | 32,263 | |
Current service cost | | | 28,310 | | | | 3,722 | | | | 32,032 | |
Actuarial loss (gain) on obligation | | | 1,763 | | | | (473 | ) | | | 1,290 | |
Immediate recognition of prior service cost | | | — | | | | (2,803 | ) | | | (2,803 | ) |
Actual benefits paid | | | (14,586 | ) | | | (629 | ) | | | (15,215 | ) |
Effect of curtailment | | | 8,129 | | | | — | | | | 8,129 | |
Effect of settlement | | | (68,193 | ) | | | — | | | | (68,193 | ) |
Effect of changes in demographic assumptions | | | — | | | | — | | | | — | |
Effect of changes in financial assumptions | | | (105,924 | ) | | | (13,582 | ) | | | (119,506 | ) |
| | | | | | | | | | | | |
Present value of benefit obligation at end of year | | | 372,182 | | | | 50,024 | | | | 422,206 | |
| | | | | | | | | | | | |
F-127
PT INDOSAT Tbk AND ITS SUBSIDIARIES
NOTES TO CONSOLIDATED FINANCIAL STATEMENTS—(Continued)
as of January 1, 2012 (Restated), December 31, 2012 (Restated) and December 31, 2013
and for the Years ended December 31, 2011 (Restated), 2012 (Restated) and 2013
(Expressed in millions of rupiah and thousands of U.S. dollar, except share and tariff data)
| | (v) | Movements in the prepaid pension cost are as follows: |
| | | | | | | | | | | | |
2011 | | The Company | | | Lintasarta | | | Total | |
Prepaid pension cost at beginning of year | | | 93,254 | | | | 9,080 | | | | 102,334 | |
Contribution to Jiwasraya | | | 378 | | | | 9,653 | | | | 10,031 | |
Net periodic pension cost | | | (7,082 | ) | | | (4,320 | ) | | | (11,402 | ) |
Refund from Jiwasraya | | | (1,631 | ) | | | (426 | ) | | | (2,057 | ) |
Other comprehensive income | | | (17,837 | ) | | | (5,241 | ) | | | (23,078 | ) |
| | | | | | | | | | | | |
Prepaid pension cost at end of year | | | 67,082 | | | | 8,746 | | | | 75,828 | |
| | | | | | | | | | | | |
| | | | | | | | | | | | |
2012 | | The Company | | | Lintasarta | | | Total | |
Prepaid pension cost at beginning of year | | | 67,082 | | | | 8,746 | | | | 75,828 | |
Contribution to Jiwasraya | | | 883 | | | | 9,653 | | | | 10,536 | |
Net periodic pension cost | | | (20,891 | ) | | | (3,217 | ) | | | (24,108 | ) |
Refund from Jiwasraya | | | — | | | | (808 | ) | | | (808 | ) |
Other comprehensive income | | | (27,613 | ) | | | (11,709 | ) | | | (39,322 | ) |
| | | | | | | | | | | | |
Prepaid pension cost at end of year | | | 19,461 | | | | 2,665 | | | | 22,126 | |
| | | | | | | | | | | | |
| | | | | | | | | | | | |
2013 | | The
Company | | | Lintasarta | | | Total | |
Prepaid pension cost at beginning of year | | | 19,461 | | | | 2,665 | | | | 22,126 | |
Contribution to Jiwasraya | | | 782 | | | | 9,653 | | | | 10,435 | |
Net periodic pension cost | | | (34,892 | ) | | | (339 | ) | | | (35,231 | ) |
Refund from Jiwasraya | | | (320 | ) | | | (1,247 | ) | | | (1,567 | ) |
Other comprehensive income | | | 121,695 | | | | 10,195 | | | | 131,890 | |
| | | | | | | | | | | | |
Prepaid pension cost at end of year | | | 106,726 | | | | 20,927 | | | | 127,653 | |
| | | | | | | | | | | | |
| | (vi) | Prepaid pension cost consists of: |
| | | | | | | | | | | | |
| | | | | | December 31, | |
| | | January 1, 2012
(Restated) | | | 2012
(Restated) | | | 2013 | |
Current portion (presented as part of “Prepaid Expenses”) | | | | | | | | | | | | |
The Company | | | 1,730 | | | | 1,224 | | | | 1,276 | |
Lintasarta | | | 381 | | | | 232 | | | | 2,563 | |
| | | | | | | | | | | | |
| | | 2,111 | | | | 1,456 | | | | 3,839 | |
| | | | | | | | | | | | |
Long-term portion (presented as “Long-term prepaid pension—net of current portion”) | | | | | | | | | | | | |
The Company | | | 65,352 | | | | 18,237 | | | | 105,450 | |
Lintasarta | | | 8,365 | | | | 2,433 | | | | 18,364 | |
| | | | | | | | | | | | |
| | | 73,717 | | | | 20,670 | | | | 123,814 | |
| | | | | | | | | | | | |
Total prepaid pension cost | | | 75,828 | | | | 22,126 | | | | 127,653 | |
| | | | | | | | | | | | |
F-128
PT INDOSAT Tbk AND ITS SUBSIDIARIES
NOTES TO CONSOLIDATED FINANCIAL STATEMENTS—(Continued)
as of January 1, 2012 (Restated), December 31, 2012 (Restated) and December 31, 2013
and for the Years ended December 31, 2011 (Restated), 2012 (Restated) and 2013
(Expressed in millions of rupiah and thousands of U.S. dollar, except share and tariff data)
| | (vii) | The major categories of plan assets as a percentage of the fair value of total plan assets are as follows: |
| | | | | | | | | | | | | | | | | | | | | | | | |
Investment Types | | January 1, 2012 | | | December 31, 2012 | | | December 31, 2013 | |
| | Quoted
Market | | | Unquoted
Market | | | Quoted
Market | | | Unquoted
Market | | | Quoted
Market | | | Unquoted
Market | |
Time Deposits | | | — | | | | 12.76 | % | | | — | | | | 12.10 | % | | | — | | | | 6.15 | % |
Bonds | | | 0.40 | % | | | 2.99 | % | | | 1.11 | % | | | 2.62 | % | | | 1.23 | % | | | 1.47 | % |
Policy Loan | | | — | | | | 1.83 | % | | | — | | | | 1.58 | % | | | — | | | | 0.84 | % |
Shares | | | 0.84 | % | | | — | | | | 4.55 | % | | | — | | | | 17.19 | % | | | — | |
Mutual Funds | | | 67.40 | % | | | 1.57 | % | | | 63.78 | % | | | 1.42 | % | | | 33.12 | % | | | 1.75 | % |
Unit Link Mutual Funds | | | 8.48 | % | | | — | | | | 9.46 | % | | | — | | | | 5.19 | % | | | 0.00 | % |
Properties | | | — | | | | 3.10 | % | | | — | | | | 2.80 | % | | | — | | | | 32.73 | % |
Direct Placement | | | — | | | | 0.63 | % | | | — | | | | 0.57 | % | | | — | | | | 0.33 | % |
Others | | | — | | | | 0.01 | % | | | — | | | | 0.01 | % | | | — | | | | — | |
| | | | | | | | | | | | | | | | | | | | | | | | |
Total | | | 77.12 | % | | | 22.89 | % | | | 78.90 | % | | | 21.10 | % | | | 56.73 | % | | | 43.27 | % |
| | | | | | | | | | | | | | | | | | | | | | | | |
Jiwasraya’s principal investment objectives are to ensure the availability of funds to pay pension benefit as it become due under a broad range of future economic probabilities, to maximize long-term investment return with an acceptable level of risk based on the Group pension obligations, and to be broadly diversified across and within the capital markets to insulate asset values against adverse experience in any one market. Each asset class has broadly diversified characteristics. As of December 31, 2013, Jiwasraya changes its major categories of plan assets to properties from mutual funds, to maximize the investment return of the plan assets.
The overall expected rate of return on assets is determined based on the market expectations prevailing on that date, applicable to the period over which the obligation is to be settled.
| | (viii) | A quantitative sensitivity analysis for significant assumptions as of December 31, 2013 is as follows: |
| | | | | | | | |
| | | Discount Rate | |
| | | 1% Increase | | | 1% Decrease | |
The Company | | | | | | | | |
Sensitivity level | | | 10 | % | | | 8 | % |
Impact on the net Defined Benefit Obligation (DBO) | | | 342,399 | | | | 394,706 | |
| | | | | | | | |
Lintasarta | | | | | | | | |
Sensitivity level | | | 10 | % | | | 9 | % |
Impact on the net DBO | | | 46,396 | | | | 54,061 | |
| | | | | | | | |
| | (ix) | The maturity of defined benefit obligation as of December 31, 2013 is as follows: |
| | | | | | | | | | | | |
| | | The Company | | | Lintasarta | | | Total | |
Within the next 12 months (the next annual reporting period) | | | 15,189 | | | | 1,684 | | | | 16,873 | |
Between 2 and 5 years | | | 140,898 | | | | 12,045 | | | | 152,943 | |
Between 5 and 10 years | | | 322,505 | | | | 56,191 | | | | 378,696 | |
Beyond 10 years | | | 788,649 | | | | 108,889 | | | | 897,538 | |
| | | | | | | | | | | | |
Total | | | 1,267,241 | | | | 178,809 | | | | 1,446,050 | |
| | | | | | | | | | | | |
F-129
PT INDOSAT Tbk AND ITS SUBSIDIARIES
NOTES TO CONSOLIDATED FINANCIAL STATEMENTS—(Continued)
as of January 1, 2012 (Restated), December 31, 2012 (Restated) and December 31, 2013
and for the Years ended December 31, 2011 (Restated), 2012 (Restated) and 2013
(Expressed in millions of rupiah and thousands of U.S. dollar, except share and tariff data)
The average duration of the defined benefit plan obligation at the end of reporting period is 13.7 years and 9.2 years for the Company and Lintasarta, respectively.
B. Defined Contribution Pension Plan
In May 2001 and January 2003, the Company and Satelindo assisted their employees in establishing their respective employees’ defined contribution pension plans, in addition to the defined benefit pension plan as mentioned above. Starting June 2004, the Company also assisted ex-IM3 employees in establishing their defined contribution pension plan. Under the defined contribution pension plan, the employees contribute 10%—20% of their basic salaries, while the Company does not contribute to the plans. Total contributions of the employees for the years ended December 31, 2011, 2012 and 2013 amounted to Rp43,709, Rp49,836 and Rp53,473, respectively, which include total contributions for key management personnel amounting to Rp2,436 for each of the years ended December 31, 2011, 2012 and 2013. The plan assets are being administered and managed by seven financial institutions appointed by the Company and Satelindo, based on the choice of the employees.
C. Labor Law No. 13/2003
The Company, Lintasarta and IMM also accrue benefits under Labor Law No. 13/2003 (“Labor Law”) dated March 25, 2003. Their employees will receive the benefits under either this law or the defined benefit pension plan, depending upon the commencement date of their employment.
The net periodic pension cost under the Labor Law for the years ended December 31, 2011, 2012 and 2013 was calculated based on the actuarial valuations as of December 31, 2011, 2012 and 2013, respectively. The actuarial valuations were prepared by an independent actuary, using the projected-unit-credit method and applying the following assumptions:
| | | | | | | | | | | | |
| | | 2011 | | | 2012 | | | 2013 | |
Annual discount rate | | | 7.5 | % | | | 6.0 and 6.5 | % | | | 9.0 and 9.5 | % |
Annual rate of increase in compensation | | | 8.0 and 9.0 | % | | | 7.5 and 8.5 | % | | | 7.5 and 8.5 | % |
| | (i) | The composition of the periodic pension cost under the Labor Law are as follows: |
| | | | | | | | | | | | | | | | |
2011 | | The Company | | | Lintasarta | | | IMM | | | Total | |
Service cost | | | 24,738 | | | | 2,002 | | | | 2,614 | | | | 29,354 | |
Net interest on the net defined benefit liability (asset) | | | 12,855 | | | | 2,064 | | | | 968 | | | | 15,887 | |
Curtailment gain | | | (38,829 | ) | | | (890 | ) | | | — | | | | (39,719 | ) |
| | | | | | | | | | | | | | | | |
Net periodic pension cost (income) under the Labor Law (Note 26) | | | (1,236 | ) | | | 3,176 | | | | 3,582 | | | | 5,522 | |
| | | | | | | | | | | | | | | | |
| | | | | | | | | | | | | | | | |
2012 | | The Company | | | Lintasarta | | | IMM | | | Total | |
Service cost | | | 25,711 | | | | 3,289 | | | | 2,632 | | | | 31,632 | |
Net interest on the net defined benefit liability (asset) | | | 18,776 | | | | 1,775 | | | | 1,166 | | | | 21,717 | |
Immediate recognition of past service cost—vested benefit | | | — | | | | — | | | | (523 | ) | | | (523 | ) |
Curtailment gain | | | — | | | | (395 | ) | | | — | | | | (395 | ) |
| | | | | | | | | | | | | | | | |
Net periodic pension cost under the Labor Law (Note 26) | | | 44,487 | | | | 4,669 | | | | 3,275 | | | | 52,431 | |
| | | | | | | | | | | | | | | | |
F-130
PT INDOSAT Tbk AND ITS SUBSIDIARIES
NOTES TO CONSOLIDATED FINANCIAL STATEMENTS—(Continued)
as of January 1, 2012 (Restated), December 31, 2012 (Restated) and December 31, 2013
and for the Years ended December 31, 2011 (Restated), 2012 (Restated) and 2013
(Expressed in millions of rupiah and thousands of U.S. dollar, except share and tariff data)
| | | | | | | | | | | | | | | | |
2013 | | The Company | | | Lintasarta | | | IMM | | | Total | |
Service cost | | | 30,321 | | | | 4,160 | | | | 2,917 | | | | 37,398 | |
Net interest on the net defined benefit liability (asset) | | | 19,427 | | | | 2,944 | | | | 1,279 | | | | 23,650 | |
Immediate recognition of past service cost—vested benefit | | | — | | | | 728 | | | | — | | | | 728 | |
Curtailment gain | | | (6,935 | ) | | | — | | | | — | | | | (6,935 | ) |
| | | | | | | | | | | | | | | | |
Net periodic pension cost under the Labor Law (Note 26) | | | 42,813 | | | | 7,832 | | | | 4,196 | | | | 54,841 | |
| | | | | | | | | | | | | | | | |
| | (ii) | The compositions of the accrued pension cost under the Labor Law are as follows: |
| | | | | | | | | | | | |
| | | | | | December 31, | |
| | | January 1, 2012
(Restated) | | | 2012
(Restated) | | | 2013 | |
Projected benefit obligation | | | 291,135 | * | | | 367,641 | | | | 244,877 | * |
Plan assets at fair value | | | — | | | | — | | | | — | |
Unrecognized actuarial loss | | | (83,494 | ) | | | (105,413 | ) | | | — | |
Unrecognized past service cost | | | (8,612 | ) | | | (7,795 | ) | | | — | |
| | | | | | | | | | | | |
Accrued pension cost, as previously reported | | | 199,029 | | | | 254,433 | | | | 244,877 | |
Restatement | | | 92,106 | | | | 113,208 | | | | — | |
| | | | | | | | | | | | |
Accrued pension cost, as restated | | | 291,135 | | | | 367,641 | | | | 244,877 | |
| | | | | | | | | | | | |
| | * | net of curtailment effect during 2011 and 2013 due to VSS and ESP (Note 26) |
| | (iii) | Movements in the present value of pension cost obligation under the Labor Law are as follows: |
| | | | | | | | | | | | | | | | |
2011 | | The Company | | | Lintasarta | | | IMM | | | Total | |
Present value of benefit obligation at beginning of year | | | 182,572 | | | | 24,340 | | | | 10,842 | | | | 217,754 | |
Actuarial loss (gain) on obligation | | | 75,163 | | | | (5,182 | ) | | | (1,442 | ) | | | 68,539 | |
Current service cost | | | 24,740 | | | | 2,003 | | | | 2,612 | | | | 29,355 | |
Interest cost | | | 12,855 | | | | 2,064 | | | | 969 | | | | 15,888 | |
Actual benefits paid | | | (1,826 | ) | | | (111 | ) | | | (255 | ) | | | (2,192 | ) |
Effect of curtailment | | | (38,828 | ) | | | (890 | ) | | | — | | | | (39,718 | ) |
Effect of changes in demographic assumptions | | | (63,857 | ) | | | — | | | | — | | | | (63,857 | ) |
Effect of changes in financial assumptions | | | 60,169 | | | | 1,936 | | | | 3,261 | | | | 65,366 | |
| | | | | | | | | | | | | | | | |
Present value of benefit obligation at end of year | | | 250,988 | | | | 24,160 | | | | 15,987 | | | | 291,135 | |
| | | | | | | | | | | | | | | | |
| | | | | | | | | | | | | | | | |
2012 | | The Company | | | Lintasarta | | | IMM | | | Total | |
Present value of benefit obligation at beginning of year | | | 250,988 | | | | 24,160 | | | | 15,987 | | | | 291,135 | |
Current service cost | | | 25,711 | | | | 3,289 | | | | 2,632 | | | | 31,632 | |
Interest cost | | | 18,776 | | | | 1,775 | | | | 1,166 | | | | 21,717 | |
Actuarial loss (gain) on obligation | | | (889 | ) | | | 16,734 | | | | 57 | | | | 15,902 | |
Actual benefits paid | | | (1,290 | ) | | | (186 | ) | | | (878 | ) | | | (2,354 | ) |
Immediate recognition of past service cost | | | — | | | | — | | | | (523 | ) | | | (523 | ) |
Effect of curtailment | | | — | | | | (395 | ) | | | — | | | | (395 | ) |
Effect of changes in demographic assumption | | | (1,490 | ) | | | (50 | ) | | | (79 | ) | | | (1,619 | ) |
Effect of changes in financial assumptions | | | 7,604 | | | | 3,162 | | | | 1,380 | | | | 12,146 | |
| | | | | | | | | | | | | | | | |
Present value of benefit obligation at end of year | | | 299,410 | | | | 48,489 | | | | 19,742 | | | | 367,641 | |
| | | | | | | | | | | | | | | | |
F-131
PT INDOSAT Tbk AND ITS SUBSIDIARIES
NOTES TO CONSOLIDATED FINANCIAL STATEMENTS—(Continued)
as of January 1, 2012 (Restated), December 31, 2012 (Restated) and December 31, 2013
and for the Years ended December 31, 2011 (Restated), 2012 (Restated) and 2013
(Expressed in millions of rupiah and thousands of U.S. dollar, except share and tariff data)
| | | | | | | | | | | | | | | | |
2013 | | The Company | | | Lintasarta | | | IMM | | | Total | |
Present value of benefit obligation at beginning of year | | | 299,410 | | | | 48,489 | | | | 19,742 | | | | 367,641 | |
Current service cost | | | 30,321 | | | | 4,160 | | | | 2,917 | | | | 37,398 | |
Interest cost | | | 19,427 | | | | 2,944 | | | | 1,279 | | | | 23,650 | |
Actuarial loss (gain) on obligation | | | (682 | ) | | | 10,904 | | | | (3,000 | ) | | | 7,222 | |
Actual benefits paid | | | (1,074 | ) | | | (463 | ) | | | (143 | ) | | | (1,680 | ) |
Immediate recognition of past service cost | | | — | | | | 728 | | | | — | | | | 728 | |
Effect of settlement | | | (9,498 | ) | | | — | | | | — | | | | (9,498 | ) |
Effect of curtailment | | | (6,935 | ) | | | — | | | | — | | | | (6,935 | ) |
Effect of changes in demographic assumptions | | | — | | | | — | | | | — | | | | — | |
Effect of changes in financial assumption | | | (148,064 | ) | | | (18,446 | ) | | | (7,139 | ) | | | (173,649 | ) |
| | | | | | | | | | | | | | | | |
Present value of benefit obligation at end of year | | | 182,905 | | | | 48,316 | | | | 13,656 | | | | 244,877 | |
| | | | | | | | | | | | | | | | |
| | (iv) | Movements in the accrued pension cost under the Labor Law are as follows: |
| | | | | | | | | | | | | | | | |
2011 | | The Company | | | Lintasarta | | | IMM | | | Total | |
Accrued pension cost under the Labor Law at beginning of year | | | 182,572 | | | | 24,340 | | | | 10,842 | | | | 217,754 | |
Periodic Labor Law cost | | | (1,236 | ) | | | 3,176 | | | | 3,582 | | | | 5,522 | |
Benefit payment | | | (1,826 | ) | | | (111 | ) | | | (255 | ) | | | (2,192 | ) |
Other comprehensive income | | | 71,478 | | | | (3,245 | ) | | | 1,818 | | | | 70,051 | |
| | | | | | | | | | | | | | | | |
Accrued pension cost under the Labor Law at end of year | | | 250,988 | | | | 24,160 | | | | 15,987 | | | | 291,135 | |
| | | | | | | | | | | | | | | | |
| | | | | | | | | | | | | | | | |
2012 | | The Company | | | Lintasarta | | | IMM | | | Total | |
Accrued pension cost under the Labor Law at beginning of year | | | 250,988 | | | | 24,160 | | | | 15,987 | | | | 291,135 | |
Periodic Labor Law cost | | | 44,487 | | | | 4,669 | | | | 3,275 | | | | 52,431 | |
Benefit payment | | | (1,290 | ) | | | (186 | ) | | | (878 | ) | | | (2,354 | ) |
Other comprehensive income | | | 5,225 | | | | 19,846 | | | | 1,358 | | | | 26,429 | |
| | | | | | | | | | | | | | | | |
Accrued pension cost under the Labor Law at end of year | | | 299,410 | | | | 48,489 | | | | 19,742 | | | | 367,641 | |
| | | | | | | | | | | | | | | | |
| | | | | | | | | | | | | | | | |
2013 | | The Company | | | Lintasarta | | | IMM | | | Total | |
Accrued pension cost under the Labor Law at beginning of year | | | 299,410 | | | | 48,489 | | | | 19,742 | | | | 367,641 | |
Periodic Labor Law cost | | | 42,813 | | | | 7,832 | | | | 4,196 | | | | 54,841 | |
Benefit payment | | | (10,572 | ) | | | (463 | ) | | | (143 | ) | | | (11,178 | ) |
Other comprehensive income | | | (148,746 | ) | | | (7,542 | ) | | | (10,139 | ) | | | (166,427 | ) |
| | | | | | | | | | | | | | | | |
Accrued pension cost under the Labor Law at end of year | | | 182,905 | | | | 48,316 | | | | 13,656 | | | | 244,877 | |
| | | | | | | | | | | | | | | | |
F-132
PT INDOSAT Tbk AND ITS SUBSIDIARIES
NOTES TO CONSOLIDATED FINANCIAL STATEMENTS—(Continued)
as of January 1, 2012 (Restated), December 31, 2012 (Restated) and December 31, 2013
and for the Years ended December 31, 2011 (Restated), 2012 (Restated) and 2013
(Expressed in millions of rupiah and thousands of U.S. dollar, except share and tariff data)
As of January 1, 2012, December 31, 2012 and 2013, the current portion of pension cost under the Labor Law included in accrued expenses (Note 17) amounted to Rp4,700, Rp5,119 and Rp5,396, respectively, and the non-current portion included in employee benefit obligations (Note 22) amounted to Rp286,435, Rp362,522 and Rp239,481, respectively.
| | (v) | A quantitative sensitivity analysis for significant assumptions as of December 31, 2013 is as follows: |
| | | | | | | | |
| | | Discount Rate | |
| | | 1% Increase | | | 1% Decrease | |
The Company | | | | | | | | |
Sensitivity level | | | 10.5 | % | | | 8.5 | % |
Impact on the net Defined Benefit Obligation (DBO) | | | 163,427 | | | | 205,544 | |
| | | | | | | | |
Lintasarta | | | | | | | | |
Sensitivity level | | | 10 | % | | | 8 | % |
Impact on the net DBO | | | 43,694 | | | | 53,615 | |
| | | | | | | | |
IMM | | | | | | | | |
Sensitivity level | | | 10.5 | % | | | 8.5 | % |
Impact on the net DBO | | | 11,993 | | | | 15,629 | |
| | | | | | | | |
| | (vi) | The maturity of defined benefit obligation as of December 31, 2013 is as follows: |
| | | | | | | | | | | | | | | | |
| | | The Company | | | Lintasarta | | | IMM | | | Total | |
Within the next 12 months (the next annual reporting period) | | | 4,683 | | | | 713 | | | | 170 | | | | 5,566 | |
Between 2 and 5 years | | | 27,871 | | | | 5,791 | | | | 2,862 | | | | 36,524 | |
Between 5 and 10 years | | | 88,989 | | | | 39,772 | | | | 7,480 | | | | 136,241 | |
Beyond 10 years | | | 1,693,518 | | | | 279,362 | | | | 225,547 | | | | 2,198,427 | |
| | | | | | | | | | | | | | | | |
Total | | | 1,815,061 | | | | 325,638 | | | | 236,059 | | | | 2,376,758 | |
| | | | | | | | | | | | | | | | |
The average duration of the defined benefit plan obligation at the end of reporting period is 13.4 years, 12.0 years and 15.3 years for the Company, Lintasarta, and IMM, respectively.
D. Post-retirement Healthcare
The Company provides post-retirement healthcare benefits to its employees who leave the Company after the employees fulfill the early retirement requirement. The spouse and children who have been officially registered in the administration records of the Company are also eligible to receive benefits. If the employees die, the spouse and children are still eligible for the post-retirement healthcare until the spouse dies or remarries and the children reach the age of 25 or get married.
The utilization of post-retirement healthcare is limited to an annual maximum ceiling that refers to monthly pension from Jiwasraya as follows:
| | • | | 16 times the Jiwasraya monthly pension for a pensioner who receives monthly pension from Jiwasraya |
F-133
PT INDOSAT Tbk AND ITS SUBSIDIARIES
NOTES TO CONSOLIDATED FINANCIAL STATEMENTS—(Continued)
as of January 1, 2012 (Restated), December 31, 2012 (Restated) and December 31, 2013
and for the Years ended December 31, 2011 (Restated), 2012 (Restated) and 2013
(Expressed in millions of rupiah and thousands of U.S. dollar, except share and tariff data)
| | • | | 16 times the equality monthly pension for a pensioner who became permanent employee after September 1, 2000 |
| | • | | 16 times the last monthly pension for a pensioner who retired after July 1, 2003 and does not receive Jiwasraya monthly pension. |
The net periodic post-retirement healthcare cost for the years ended December 31, 2011, 2012 and 2013 was calculated based on the actuarial valuations as of December 31, 2011, 2012 and 2013. The actuarial valuations were prepared by an independent actuary, using the projected-unit-credit method and applying the following assumptions:
| | | | | | | | | | | | |
| | | 2011 | | | 2012 | | | 2013 | |
Annual discount rate | | | 8.0 | % | | | 7.0 | % | | | 9.5 | % |
Ultimate cost trend rate | | | 6.0 | % | | | 6.0 | % | | | 6.0 | % |
Next year trend rate | | | 12.0 | % | | | 10.0 | % | | | 8.0 | % |
Period to reach ultimate cost trend rate | | | 3 years | | | | 2 years | | | | 1 year | |
| | (i) | The compositions of the periodic post-retirement healthcare cost are as follows: |
| | | | | | | | | | | | |
| | | 2011 | | | 2012 | | | 2013 | |
Net interest on the net defined benefit liability | | | 68,955 | | | | 54,484 | | | | 70,832 | |
Service cost | | | 24,149 | | | | 27,712 | | | | 40,321 | |
Curtailment gain | | | (230,599 | ) | | | — | | | | (21,046 | ) |
| | | | | | | | | | | | |
Net periodic post-retirement healthcare cost (income) (Note 26) | | | (137,495 | ) | | | 82,196 | | | | 90,107 | |
| | | | | | | | | | | | |
| | (ii) | The compositions of the accrued post-retirement healthcare cost are as follows: |
| | | | | | | | | | | | |
| | | | | | December 31, | |
| | | January 1, 2012
(Restated) | | | 2012
(Restated) | | | 2013 | |
Projected benefit obligation | | | 687,789 | * | | | 1,017,673 | | | | 482,526 | * |
Plan assets at fair value | | | — | | | | — | | | | — | |
Unrecognized actuarial loss | | | (103,679 | ) | | | (362,116 | ) | | | — | |
Unrecognized past service cost | | | (15,401 | ) | | | (7,662 | ) | | | — | |
| | | | | | | | | | | | |
Accrued post-retirement healthcare cost, as previously reported | | | 568,709 | | | | 647,895 | | | | 482,526 | |
Restatement | | | 119,080 | | | | 369,778 | | | | — | |
| | | | | | | | | | | | |
Accrued post-retirement healthcare cost, as restated | | | 687,789 | | | | 1,017,673 | | | | 482,526 | |
| | | | | | | | | | | | |
| | * | net of curtailment effect during 2011 and 2013 due to VSS and ESP (Note 26) |
F-134
PT INDOSAT Tbk AND ITS SUBSIDIARIES
NOTES TO CONSOLIDATED FINANCIAL STATEMENTS—(Continued)
as of January 1, 2012 (Restated), December 31, 2012 (Restated) and December 31, 2013
and for the Years ended December 31, 2011 (Restated), 2012 (Restated) and 2013
(Expressed in millions of rupiah and thousands of U.S. dollar, except share and tariff data)
| | (iii) | Movements in the present value of defined benefit obligation during the years ended December 31, 2011, 2012 and 2013 are as follows: |
| | | | | | | | | | | | |
| | | 2011 | | | 2012 | | | 2013 | |
Present value of benefit obligation at beginning of year | | | 846,636 | | | | 687,789 | | | | 1,017,673 | |
Interest cost | | | 68,955 | | | | 54,484 | | | | 70,832 | |
Current service cost | | | 24,149 | | | | 27,712 | | | | 40,321 | |
Actual benefits paid | | | (10,978 | ) | | | (13,470 | ) | | | (11,569 | ) |
Effect of changes in demographic assumptions | | | (29,450 | ) | | | 65,637 | | | | — | |
Effect of changes in financial assumptions | | | 179,780 | | | | 174,068 | | | | (317,082 | ) |
Effect of curtailment | | | (230,600 | ) | | | — | | | | (21,046 | ) |
Effect of settlement | | | — | | | | — | | | | (10,700 | ) |
Actuarial loss (gain) on obligation | | | (160,703 | ) | | | 21,453 | | | | (285,903 | ) |
| | | | | | | | | | | | |
Present value of benefit obligation at end of year | | | 687,789 | | | | 1,017,673 | | | | 482,526 | |
| | | | | | | | | | | | |
| | (iv) | Movements in the accrued post-retirement healthcare cost during the years ended December 31, 2011, 2012 and 2013 are as follows: |
| | | | | | | | | | | | |
| | | 2011 | | | 2012 | | | 2013 | |
Beginning balance | | | 846,636 | | | | 687,789 | | | | 1,017,673 | |
Net periodic post-retirement healthcare cost | | | (137,495 | ) | | | 82,196 | | | | 90,107 | |
Benefit payment | | | (10,978 | ) | | | (13,470 | ) | | | (22,269 | ) |
Other comprehensive income | | | (10,374 | ) | | | 261,158 | | | | (602,985 | ) |
| | | | | | | | | | | | |
Ending balance | | | 687,789 | | | | 1,017,673 | | | | 482,526 | |
| | | | | | | | | | | | |
As of January 1, 2012, December 31, 2012 and 2013, the current portion of post-retirement healthcare cost included in accrued expenses (Note 17) amounted to Rp12,957, Rp15,160 and Rp12,799, respectively, and the non-current portion included in employee benefit obligations (Note 22) amounted to Rp674,832, Rp1,002,513 and Rp469,727, respectively.
| | (v) | A quantitative sensitivity analysis for significant assumptions as of December 31, 2013 is as follows: |
| | | | | | | | | | | | | | | | |
| | | Discount Rate | | | Estimated Healthcare Cost
Increase Rate | |
| | | 1% Increase | | | 1% Decrease | | | 1% Increase | | | 1% Decrease | |
Sensitivity level | | | 10.5 | % | | | 8.5 | % | | | 7 | % | | | 5 | % |
Impact on the net Defined Benefit Obligation (DBO) | | | 408,735 | | | | 577,354 | | | | 579,778 | | | | 406,023 | |
| | | | | | | | | | | | | | | | |
| | (vi) | The maturity of defined benefit obligation as of December 31, 2013 is as follows: |
| | | | |
Period | | Amount | |
Within the next 12 months (the next annual reporting period) | | | 12,799 | |
Between 2 and 5 years | | | 63,040 | |
Between 5 and 10 years | | | 116,985 | |
Beyond 10 years | | | 1,514,111 | |
| | | | |
Total | | | 1,706,935 | |
| | | | |
F-135
PT INDOSAT Tbk AND ITS SUBSIDIARIES
NOTES TO CONSOLIDATED FINANCIAL STATEMENTS—(Continued)
as of January 1, 2012 (Restated), December 31, 2012 (Restated) and December 31, 2013
and for the Years ended December 31, 2011 (Restated), 2012 (Restated) and 2013
(Expressed in millions of rupiah and thousands of U.S. dollar, except share and tariff data)
The average duration of the defined benefit plan obligation at the end of reporting period is 19.3 years.
31. ACCOUNTS AND TRANSACTIONS WITH RELATED PARTIES
The details of the accounts and the significant transactions entered into with related parties (affiliates, unless otherwise indicated) are as follows:
| | | | | | | | | | | | | | | | | | | | | | | | |
| | | Amount | | | Percentage to Total Assets/
Liabilities (%) | |
| | | January 1,
2012
(Restated) | | | December 31,
2012
(Restated) | | | December 31,
2013 | | | January 1,
2012
(Restated) | | | December 31,
2012
(Restated) | | | December 31,
2013 | |
Cash and cash equivalents (Note 4) | | | | | | | | | | | | | | | | | | | | | | | | |
Government-related entities: | | | | | | | | | | | | | | | | | | | | | | | | |
State-owned banks | | | 977,960 | | | | 1,534,068 | | | | 878,959 | | | | 1.82 | | | | 2.75 | | | | 1.59 | |
| | | | | | | | | | | | | | | | | | | | | | | | |
Accounts receivable—trade (Note 5) | | | | | | | | | | | | | | | | | | | | | | | | |
Government-related entities: | | | | | | | | | | | | | | | | | | | | | | | | |
State-owned companies | | | 358,423 | | | | 593,773 | | | | 600,185 | | | | 0.67 | | | | 1.07 | | | | 1.09 | |
Ultimate parent company: | | | | | | | | | | | | | | | | | | | | | | | | |
Ooredoo | | | 6,927 | | | | 23,509 | | | | 56,334 | | | | 0.01 | | | | 0.04 | | | | 0.10 | |
| | | | | | | | | | | | | | | | | | | | | | | | |
Total | | | 365,350 | | | | 617,282 | | | | 656,519 | | | | 0.68 | | | | 1.11 | | | | 1.19 | |
Less allowance for impairment of accounts receivable | | | 47,107 | | | | 42,632 | | | | 24,316 | | | | 0.09 | | | | 0.08 | | | | 0.04 | |
| | | | | | | | | | | | | | | | | | | | | | | | |
Net | | | 318,243 | | | | 574,650 | | | | 632,203 | | | | 0.59 | | | | 1.03 | | | | 1.15 | |
| | | | | | | | | | | | | | | | | | | | | | | | |
Prepaid expenses | | | | | | | | | | | | | | | | | | | | | | | | |
Government-related entities: | | | | | | | | | | | | | | | | | | | | | | | | |
State-owned companies | | | 8,222 | | | | 6,543 | | | | 17,701 | | | | 0.01 | | | | 0.01 | | | | 0.04 | |
Governmental departments | | | 205 | | | | 84 | | | | 335 | | | | 0.00 | | | | 0.00 | | | | 0.00 | |
Entity under significant influence: | | | | | | | | | | | | | | | | | | | | | | | | |
Kopindosat | | | 3,681 | | | | 2,579 | | | | 1,944 | | | | 0.01 | | | | 0.01 | | | | 0.00 | |
| | | | | | | | | | | | | | | | | | | | | | | | |
Total | | | 12,108 | | | | 9,206 | | | | 19,980 | | | | 0.02 | | | | 0.02 | | | | 0.04 | |
| | | | | | | | | | | | | | | | | | | | | | | | |
Other current and non-current financial assets | | | | | | | | | | | | | | | | | | | | | | | | |
Government-related entities: | | | | | | | | | | | | | | | | | | | | | | | | |
State-owned banks | | | 193,679 | | | | 162,071 | | | | 149,868 | | | | 0.36 | | | | 0.29 | | | | 0.27 | |
Governmental departments | | | 87 | | | | 87 | | | | 87 | | | | 0.00 | | | | 0.00 | | | | 0.00 | |
| | | | | | | | | | | | | | | | | | | | | | | | |
Total | | | 193,766 | | | | 162,158 | | | | 149,955 | | | | 0.36 | | | | 0.29 | | | | 0.27 | |
| | | | | | | | | | | | | | | | | | | | | | | | |
Due from related parties | | | | | | | | | | | | | | | | | | | | | | | | |
Entity under significant influence: | | | | | | | | | | | | | | | | | | | | | | | | |
Kopindosat | | | 6,012 | | | | 6,188 | | | | 3,169 | | | | 0.01 | | | | 0.02 | | | | 0.01 | |
Government-related entities: | | | | | | | | | | | | | | | | | | | | | | | | |
State-owned companies | | | 1,583 | | | | 1,870 | | | | 2,325 | | | | 0.00 | | | | 0.00 | | | | 0.00 | |
Key management personnel: | | | | | | | | | | | | | | | | | | | | | | | | |
Senior management | | | 3,020 | | | | 1,621 | | | | 1,688 | | | | 0.01 | | | | 0.00 | | | | 0.00 | |
Ultimate parent company: | | | | | | | | | | | | | | | | | | | | | | | | |
Ooredoo | | | 54 | | | | 694 | | | | — | | | | 0.00 | | | | 0.00 | | | | — | |
| | | | | | | | | | | | | | | | | | | | | | | | |
Total | | | 10,669 | | | | 10,373 | | | | 7,182 | | | | 0.02 | | | | 0.02 | | | | 0.01 | |
Less allowance for impairment of receivables | | | 15 | | | | 15 | | | | 15 | | | | 0.00 | | | | 0.00 | | | | 0.00 | |
| | | | | | | | | | | | | | | | | | | | | | | | |
Net | | | 10,654 | | | | 10,358 | | | | 7,167 | | | | 0.02 | | | | 0.02 | | | | 0.01 | |
| | | | | | | | | | | | | | | | | | | | | | | | |
F-136
PT INDOSAT Tbk AND ITS SUBSIDIARIES
NOTES TO CONSOLIDATED FINANCIAL STATEMENTS—(Continued)
as of January 1, 2012 (Restated), December 31, 2012 (Restated) and December 31, 2013
and for the Years ended December 31, 2011 (Restated), 2012 (Restated) and 2013
(Expressed in millions of rupiah and thousands of U.S. dollar, except share and tariff data)
| | | | | | | | | | | | | | | | | | | | | | | | |
| | | Amount | | | Percentage to Total Assets/
Liabilities (%) | |
| | | January 1,
2012
(Restated) | | | December 31,
2012
(Restated) | | | December 31,
2013 | | | January 1,
2012
(Restated) | | | December 31,
2012
(Restated) | | | December 31,
2013 | |
Long-term prepaid rentals—net of current portion | | | | | | | | | | | | | | | | | | | | | | | | |
Government-related entities: | | | | | | | | | | | | | | | | | | | | | | | | |
State-owned companies | | | 21,587 | | | | 21,346 | | | | 21,082 | | | | 0.04 | | | | 0.04 | | | | 0.04 | |
Entity under significant influence: | | | | | | | | | | | | | | | | | | | | | | | | |
Kopindosat | | | 9,962 | | | | 4,275 | | | | 6,212 | | | | 0.02 | | | | 0.01 | | | | 0.01 | |
| | | | | | | | | | | | | | | | | | | | | | | | |
Total | | | 31,549 | | | | 25,621 | | | | 27,294 | | | | 0.06 | | | | 0.05 | | | | 0.05 | |
| | | | | | | | | | | | | | | | | | | | | | | | |
Long-term advances | | | | | | | | | | | | | | | | | | | | | | | | |
Entities under significant influence: | | | | | | | | | | | | | | | | | | | | | | | | |
PT Personel Alih Daya | | | 12,148 | | | | — | | | | — | | | | 0.02 | | | | — | | | | — | |
Government-related entities: | | | | | | | | | | | | | | | | | | | | | | | | |
State-owned companies | | | 44 | | | | — | | | | — | | | | 0.00 | | | | — | | | | — | |
| | | | | | | | | | | | | | | | | | | | | | | | |
Total | | | 12,192 | | | | — | | | | — | | | | 0.02 | | | | — | | | | — | |
| | | | | | | | | | | | | | | | | | | | | | | | |
Long-term prepaid pension—net of current portion (Note 30) | | | | | | | | | | | | | | | | | | | | | | | | |
State-owned companies | | | 73,717 | | | | 20,670 | | | | 123,814 | | | | 0.14 | | | | 0.04 | | | | 0.22 | |
| | | | | | | | | | | | | | | | | | | | | | | | |
Short and long-term bank loan (Note 14) | | | | | | | | | | | | | | | | | | | | | | | | |
Government-related entities: | | | | | | | | | | | | | | | | | | | | | | | | |
State-owned bank | | | 1,499,256 | | | | 299,529 | | | | 1,499,849 | | | | 4.33 | | | | 0.82 | | | | 3.95 | |
| | | | | | | | | | | | | | | | | | | | | | | | |
Accounts payable—trade | | | | | | | | | | | | | | | | | | | | | | | | |
Government-related entities: | | | | | | | | | | | | | | | | | | | | | | | | |
State-owned companies | | | 23,233 | | | | 22,614 | | | | 41,603 | | | | 0.07 | | | | 0.06 | | | | 0.11 | |
Entities under significant influence: | | | | | | | | | | | | | | | | | | | | | | | | |
Kopindosat | | | — | | | | — | | | | 5,941 | | | | — | | | | — | | | | 0.02 | |
Ultimate parent company: | | | | | | | | | | | | | | | | | | | | | | | | |
Ooredoo | | | 348 | | | | 36 | | | | 59 | | | | 0.00 | | | | 0.00 | | | | 0.00 | |
| | | | | | | | | | | | | | | | | | | | | | | | |
Total | | | 23,581 | | | | 22,650 | | | | 47,603 | | | | 0.07 | | | | 0.06 | | | | 0.13 | |
| | | | | | | | | | | | | | | | | | | | | | | | |
Procurement payable (Note 15) | | | | | | | | | | | | | | | | | | | | | | | | |
Entities under significant influence: | | | | | | | | | | | | | | | | | | | | | | | | |
PT Personel Alih daya | | | 16,319 | | | | 17,993 | | | | 15,934 | | | | 0.05 | | | | 0.05 | | | | 0.04 | |
Kopindosat | | | 9,872 | | | | 11,875 | | | | 13,581 | | | | 0.03 | | | | 0.03 | | | | 0.04 | |
Government-related entities: | | | | | | | | | | | | | | | | | | | | | | | | |
State-owned companies | | | 9,882 | | | | 13,915 | | | | 14,473 | | | | 0.02 | | | | 0.04 | | | | 0.04 | |
| | | | | | | | | | | | | | | | | | | | | | | | |
Total | | | 36,073 | | | | 43,783 | | | | 43,988 | | | | 0.10 | | | | 0.12 | | | | 0.12 | |
| | | | | | | | | | | | | | | | | | | | | | | | |
Accrued expenses | | | | | | | | | | | | | | | | | | | | | | | | |
Government-related entities: | | | | | | | | | | | | | | | | | | | | | | | | |
State-owned companies | | | 66,399 | | | | 56,590 | | | | 108,571 | | | | 0.19 | | | | 0.15 | | | | 0.29 | |
Entities under significant influence: | | | | | | | | | | | | | | | | | | | | | | | | |
PT Personel Alih Daya | | | 18,222 | | | | 40,420 | | | | 46,118 | | | | 0.05 | | | | 0.11 | | | | 0.12 | |
Kopindosat | | | 5,817 | | | | 10,265 | | | | 14,464 | | | | 0.02 | | | | 0.03 | | | | 0.04 | |
Key management personnel: | | | | | | | | | | | | | | | | | | | | | | | | |
Senior management | | | 37,851 | | | | 43,610 | | | | — | | | | 0.11 | | | | 0.12 | | | | — | |
| | | | | | | | | | | | | | | | | | | | | | | | |
Total | | | 128,289 | | | | 150,885 | | | | 169,153 | | | | 0.37 | | | | 0.41 | | | | 0.45 | |
| | | | | | | | | | | | | | | | | | | | | | | | |
F-137
PT INDOSAT Tbk AND ITS SUBSIDIARIES
NOTES TO CONSOLIDATED FINANCIAL STATEMENTS—(Continued)
as of January 1, 2012 (Restated), December 31, 2012 (Restated) and December 31, 2013
and for the Years ended December 31, 2011 (Restated), 2012 (Restated) and 2013
(Expressed in millions of rupiah and thousands of U.S. dollar, except share and tariff data)
| | | | | | | | | | | | | | | | | | | | | | | | |
| | | Amount | | | Percentage to Total Assets/
Liabilities (%) | |
| | | January 1,
2012
(Restated) | | | December 31,
2012
(Restated) | | | December 31,
2013 | | | January 1,
2012
(Restated) | | | December 31,
2012
(Restated) | | | December 31,
2013 | |
Due to related parties | | | | | | | | | | | | | | | | | | | | | | | | |
Ultimate parent company: | | | | | | | | | | | | | | | | | | | | | | | | |
Ooredoo | | | 552 | | | | 25,968 | | | | 17,046 | | | | 0.00 | | | | 0.07 | | | | 0.04 | |
Government-related entities: | | | | | | | | | | | | | | | | | | | | | | | | |
State-owned companies | | | 14,928 | | | | 16,821 | | | | 6,763 | | | | 0.04 | | | | 0.05 | | | | 0.02 | |
Entity under significant influence: | | | | | | | | | | | | | | | | | | | | | | | | |
Kopindosat | | | — | | | | — | | | | 6,486 | | | | — | | | | — | | | | 0.02 | |
PT Personel Alih Daya | | | — | | | | — | | | | 3,006 | | | | — | | | | — | | | | 0.01 | |
| | | | | | | | | | | | | | | | | | | | | | | | |
Total | | | 15,480 | | | | 42,789 | | | | 33,301 | | | | 0.04 | | | | 0.12 | | | | 0.09 | |
| | | | | | | | | | | | | | | | | | | | | | | | |
Other current and non-current liabilities | | | | | | | | | | | | | | | | | | | | | | | | |
Government-related entities: | | | | | | | | | | | | | | | | | | | | | | | | |
Governmental departments | | | 2,141 | | | | 4,131 | | | | — | | | | 0.00 | | | | 0.01 | | | | — | |
State-owned companies | | | 6,455 | | | | — | | | | 11,025 | | | | 0.02 | | | | — | | | | 0.03 | |
| | | | | | | | | | | | | | | | | | | | | | | | |
Total | | | 8,596 | | | | 4,131 | | | | 11,025 | | | | 0.02 | | | | 0.01 | | | | 0.03 | |
| | | | | | | | | | | | | | | | | | | | | | | | |
Loans payable (Note 18) | | | | | | | | | | | | | | | | | | | | | | | | |
Government- related entities: | | | | | | | | | | | | | | | | | | | | | | | | |
State-owned banks | | | 998,843 | | | | — | | | | — | | | | 2.89 | | | | — | | | | — | |
| | | | | | | | | | | | | | | | | | | | | | | | |
| | | | | | | | | | | | | | | | | | | | | | | | |
| | | Amount | | | Percentage to Respective Income or
Expenses (%) | |
| | | 2011
(Restated) | | | 2012
(Restated) | | | 2013 | | | 2011
(Restated) | | | 2012
(Restated) | | | 2013 | |
Revenues | | | | | | | | | | | | | | | | | | | | | | | | |
Government-related entities: | | | | | | | | | | | | | | | | | | | | | | | | |
State-owned companies | | | 1,459,979 | | | | 1,509,179 | | | | 1,729,361 | | | | 7.10 | | | | 6.73 | | | | 7.26 | |
Governmental departments | | | 24,823 | | | | 224,219 | | | | 240,842 | | | | 0.12 | | | | 1.00 | | | | 1.01 | |
Ultimate parent company: | | | | | | | | | | | | | | | | | | | | | | | | |
Ooredoo | | | 69,978 | | | | 78,672 | | | | 88,982 | | | | 0.34 | | | | 0.36 | | | | 0.37 | |
Entities under significant influence: | | | | | | | | | | | | | | | | | | | | | | | | |
Kopindosat | | | — | | | | 549 | | | | 666 | | | | — | | | | 0.00 | | | | 0.00 | |
| | | | | | | | | | | | | | | | | | | | | | | | |
Total | | | 1,554,780 | | | | 1,812,619 | | | | 2,059,851 | | | | 7.56 | | | | 8.09 | | | | 8.64 | |
| | | | | | | | | | | | | | | | | | | | | | | | |
Expenses | | | | | | | | | | | | | | | | | | | | | | | | |
Cost of services | | | | | | | | | | | | | | | | | | | | | | | | |
Government-related entities: | | | | | | | | | | | | | | | | | | | | | | | | |
State-owned companies | | | 1,567,294 | | | | 1,810,335 | | | | 2,446,334 | | | | 9.10 | | | | 9.41 | | | | 10.94 | |
Entities under significant influence: | | | | | | | | | | | | | | | | | | | | | | | | |
Kopindosat | | | 121,456 | | | | 24,298 | | | | 138,768 | | | | 0.68 | | | | 0.13 | | | | 0.62 | |
PT Personel Alih Daya | | | 93,190 | | | | 70,967 | | | | 115,913 | | | | 0.53 | | | | 0.37 | | | | 0.51 | |
Ultimate parent company: | | | | | | | | | | | | | | | | | | | | | | | | |
Ooredoo | | | 66,619 | | | | 52,737 | | | | 72,789 | | | | 0.38 | | | | 0.27 | | | | 0.33 | |
| | | | | | | | | | | | | | | | | | | | | | | | |
Total | | | 1,848,559 | | | | 1,958,337 | | | | 2,773,804 | | | | 10.69 | | | | 10.18 | | | | 12.40 | |
| | | | | | | | | | | | | | | | | | | | | | | | |
F-138
PT INDOSAT Tbk AND ITS SUBSIDIARIES
NOTES TO CONSOLIDATED FINANCIAL STATEMENTS—(Continued)
as of January 1, 2012 (Restated), December 31, 2012 (Restated) and December 31, 2013
and for the Years ended December 31, 2011 (Restated), 2012 (Restated) and 2013
(Expressed in millions of rupiah and thousands of U.S. dollar, except share and tariff data)
| | | | | | | | | | | | | | | | | | | | | | | | |
| | | Amount | | | Percentage to Respective Income or
Expenses (%) | |
| | | January 1,
2012
(Restated) | | | December 31,
2012
(Restated) | | | December 31,
2013 | | | January 1,
2012
(Restated) | | | December 31,
2012
(Restated) | | | December 31,
2013 | |
Personnel | | | | | | | | | | | | | | | | | | | | | | | | |
Key management personnel: | | | | | | | | | | | | | | | | | | | | | | | | |
Senior managementShort-term employee benefits | | | 102,156 | | | | 147,439 | | | | 165,498 | | | | 0.59 | | | | 0.76 | | | | 0.74 | |
Termination benefits | | | 46,316 | | | | 1,210 | | | | 11,701 | | | | 0.27 | | | | 0.01 | | | | 0.05 | |
Other long-term benefits | | | 16,481 | | | | 14,860 | | | | 10,748 | | | | 0.09 | | | | 0.08 | | | | 0.05 | |
| | | | | | | | | | | | | | | | | | | | | | | | |
Sub-total | | | 164,953 | | | | 163,509 | | | | 187,947 | | | | 0.95 | | | | 0.85 | | | | 0.84 | |
| | | | | | | | | | | | | | | | | | | | | | | | |
Government-related entities: | | | | | | | | | | | | | | | | | | | | | | | | |
State-owned companies | | | 11,402 | | | | 24,108 | | | | 35,231 | | | | 0.06 | | | | 0.13 | | | | 0.16 | |
Entity under significant influence: | | | | | | | | | | | | | | | | | | | | | | | | |
PT Personel Alih Daya | | | 21,028 | | | | — | | | | — | | | | 0.13 | | | | — | | | | | |
| | | | | | | | | | | | | | | | | | | | | | | | |
Total | | | 197,383 | | | | 187,617 | | | | 223,178 | | | | 1.14 | | | | 0.98 | | | | 1.00 | |
| | | | | | | | | | | | | | | | | | | | | | | | |
Marketing | | | | | | | | | | | | | | | | | | | | | | | | |
Entities under significant influence: | | | | | | | | | | | | | | | | | | | | | | | | |
PT Personel Alih Daya | | | 75,905 | | | | 88,688 | | | | 108,100 | | | | 0.44 | | | | 0.46 | | | | 0.48 | |
Kopindosat | | | 15,963 | | | | 21,230 | | | | 27,092 | | | | 0.09 | | | | 0.11 | | | | 0.12 | |
Government-related entities: | | | | | | | | | | | | | | | | | | | | | | | | |
State-owned companies | | | 62 | | | | 2 | | | | — | | | | 0.00 | | | | 0.00 | | | | 0.00 | |
| | | | | | | | | | | | | | | | | | | | | | | | |
Total | | | 91,920 | | | | 109,920 | | | | 135,192 | | | | 0.53 | | | | 0.57 | | | | 0.60 | |
| | | | | | | | | | | | | | | | | | | | | | | | |
General and administration | | | | | | | | | | | | | | | | | | | | | | | | |
Government-related entities: | | | | | | | | | | | | | | | | | | | | | | | | |
State-owned companies | | | 100,234 | | | | 31,023 | | | | 37,737 | | | | 0.58 | | | | 0.16 | | | | 0.17 | |
Entities under significant influence: | | | | | | | | | | | | | | | | | | | | | | | | |
Kopindosat | | | 24,294 | | | | 22,676 | | | | 26,699 | | | | 0.14 | | | | 0.12 | | | | 0.12 | |
PT Personel Alih Daya | | | 17,971 | | | | 14,838 | | | | 25,127 | | | | 0.10 | | | | 0.08 | | | | 0.11 | |
| | | | | | | | | | | | | | | | | | | | | | | | |
Total | | | 142,499 | | | | 68,537 | | | | 89,563 | | | | 0.82 | | | | 0.36 | | | | 0.40 | |
| | | | | | | | | | | | | | | | | | | | | | | | |
Other expenses - net | | | | | | | | | | | | | | | | | | | | | | | | |
Government-related entities: | | | | | | | | | | | | | | | | | | | | | | | | |
State-owned banks | | | 53,281 | | | | 20,491 | | | | 26,656 | | | | 2.91 | | | | 0.75 | | | | 0.55 | |
| | | | | | | | | | | | | | | | | | | | | | | | |
F-139
PT INDOSAT Tbk AND ITS SUBSIDIARIES
NOTES TO CONSOLIDATED FINANCIAL STATEMENTS—(Continued)
as of January 1, 2012 (Restated), December 31, 2012 (Restated) and December 31, 2013
and for the Years ended December 31, 2011 (Restated), 2012 (Restated) and 2013
(Expressed in millions of rupiah and thousands of U.S. dollar, except share and tariff data)
The relationship and nature of account balances/transactions with related parties are as follows:
| | | | | | |
No | | Related Parties | | Relationship | | Nature of Account Balances/Transactions |
1. | | State-owned banks | | Government—related entities | | Cash and cash equivalents, account receivable—trade, other current and non-current financial and non-financial assets, short-term bank loan and loan payable |
| | | |
2. | | State-owned companies | | Government—related entities | | Accounts receivable—trade, prepaid expenses, due from related parties, long-term prepaid rentals, long-term advances, long-term prepaid pension, accounts payable—trade, procurement payable, accrued expenses, due to related parties, other current and non-current financial and non-financial liabilities, revenues, expenses—cost of services, expenses—personnel, expenses—marketing and expenses—general and administration |
| | | |
3. | | Ooredoo | | Ultimate parent company | | Accounts receivable—trade, due from related parties, accounts payable—trade, due to related parties, revenues and expenses—cost of services |
| | | |
4. | | Governmental departments | | Government—related entities | | Prepaid expenses, other current and non-current financial and non-financial assets, other current and non-current financial and non-financial liabilities and revenues |
| | | |
5. | | Kopindosat | | Entity under common significant influence | | Prepaid expenses, due from related parties, long-term prepaid rentals, accounts payable -trade, procurement payable, accrued expenses, due to related parties, revenues, expenses—cost of services, expenses—marketing and expenses—general and administration |
| | | |
6. | | Senior management (consist of members of Boards of Directors and Commissioners and those who directly report to the Board of Directors) | | Key management personnel | | Due from related parties, accrued expenses and expenses—personnel |
| | | |
7. | | PT Personnel Alih Daya | | Entity under common significant influence | | Advances and long-term advances, procurement payable, accrued expenses, due to related parties, expenses—cost of services, expenses—personnel, expenses—marketing and expenses—general and administration and expenses |
F-140
PT INDOSAT Tbk AND ITS SUBSIDIARIES
NOTES TO CONSOLIDATED FINANCIAL STATEMENTS—(Continued)
as of January 1, 2012 (Restated), December 31, 2012 (Restated) and December 31, 2013
and for the Years ended December 31, 2011 (Restated), 2012 (Restated) and 2013
(Expressed in millions of rupiah and thousands of U.S. dollar, except share and tariff data)
32. BASIC AND DILUTED EARNINGS (LOSS) PER SHARE
The following table sets forth the computation of basic and diluted earnings (loss) per share:
| | | | | | | | | | | | |
| | | 2011
(Restated) | | | 2012
(Restated) | | | 2013 | |
Numerator for basic and diluted earnings (loss) per share—profit (loss) for the year attributable to the Owners of the Company, as previously reported | | | 958,068 | | | | 365,649 | | | | (2,798,605 | ) |
Restatement | | | 60,147 | | | | 10,891 | | | | — | |
| | | | | | | | | | | | |
Numerator for basic and diluted earnings (loss) per share—profit (loss) for the year attributable to the Owners of the Company, as restated | | | 1,018,215 | | | | 376,540 | | | | (2,798,605 | ) |
Denominator for basic and diluted earnings (loss) per share—weighted-average number of shares outstanding during the year | | | 5,433,933,500 | | | | 5,433,933,500 | | | | 5,433,933,500 | |
| | | | | | | | | | | | |
Basic and diluted earnings (loss) per share | | | 187.38 | | | | 69.29 | | | | (515.02 | ) |
| | | | | | | | | | | | |
Basic and diluted earnings (loss) per ADS (50 B shares per ADS) | | | 9,369.04 | | | | 3,464.71 | | | | (25,751.19 | ) |
| | | | | | | | | | | | |
There are no potential dilutive outstanding shares as of January 1, 2012, December 31, 2012 and 2013.
33. DISTRIBUTION OF INCOME AND APPROPRIATION OF RETAINED EARNINGS
At the Company’s Stockholders’ Annual General Meeting (“SAGM”), the shareholders approved, among others, the appropriation of annual profit for cash dividend distribution, as follows, and the utilization of the remaining amount for reinvestment and working capital.
| | | | | | | | |
SAGM Date | | Dividend per Share
(Rp) | | | Dividend
Payment Date | |
2010 Profit | | | | | | | | |
June 24, 2011 | | | 59.55 | | | | August 5, 2011 | * |
2011 Profit | | | | | | | | |
May 14, 2012 | | | 76.83 | | | | June 26, 2012 | * |
2012 Profit | | | | | | | | |
June 18, 2013 | | | 34.52 | | | | July 29, 2013 | ** |
| * | Dividend for the Government was paid in accordance with the prevailing laws and regulations in Indonesia. On July 22 and August 5, 2011, the Company paid dividend amounting to Rp46,248 and Rp277,343, respectively, to the Government and other stockholders for the dividend declared on June 24, 2011. |
| ** | Dividend for the Government was paid in accordance with the prevailing laws and regulations in Indonesia. On June 11 and June 26, 2012, the Company paid dividend amounting to Rp59,668 and Rp357,821, respectively, to the Government and other stockholders for the dividend declared on May 14, 2012. |
| *** | Dividend for the Government was paid in accordance with the prevailing laws and regulations in Indonesia. On July 29, 2013, the Company paid dividend amounting to Rp26,809 and Rp160,770 to the Government and other stockholders, respectively, for the dividend declared on June 18, 2013. |
F-141
PT INDOSAT Tbk AND ITS SUBSIDIARIES
NOTES TO CONSOLIDATED FINANCIAL STATEMENTS—(Continued)
as of January 1, 2012 (Restated), December 31, 2012 (Restated) and December 31, 2013
and for the Years ended December 31, 2011 (Restated), 2012 (Restated) and 2013
(Expressed in millions of rupiah and thousands of U.S. dollar, except share and tariff data)
34. SIGNIFICANT AGREEMENTS, COMMITMENTS AND CONTINGENCY
| | a. | As of December 31, 2013, commitments on capital expenditures which are contractual agreements not yet realized relate to the procurement and installation of property and equipment amounting to US$118,767 and Rp1,478,760 (Note 37p). |
The significant commitments on capital expenditures are as follows:
| | | | | | | | |
| Contract Date | | Contract Description | | Vendor | | Amount of
Contract/Purchase
Orders (“POs”)
Already Issued | | Amount of
Contract/
POs Not Yet
Served |
| October 1, 2010 & December 10, 2012 | | Procurement of Telecommunications Equipment and Related Services | | PT Ericsson Indonesia and Ericsson AB | | US$607,990 and Rp2,214,954 | | US$19,466
and
Rp604,983 |
| June 16, 2010 & December 10, 2012 | | Procurement of Telecommunications Infrastructure | | PT Nokia Siemens Networks and Nokia Siemens Networks Oy | | US$537,984 and Rp2,028,054 | | US$60,013
and
Rp302,739 |
| August 2, 2010 & December 21, 2012 | | Procurement of Telecommunications Infrastructure | | PT Huawei Tech Investment | | US$177,196 and Rp589,419 | | US$8,004
and
Rp188,695 |
| | b. | On December 27, 2013, the Company received SKPKBs from the DGT for the Company’s 2007 and 2008 corporate income tax amounting to Rp110,413 and Rp97,132, respectively (Note 37h). |
| | c. | On December 23, 2013, the Company entered into a 3-year time revolving facility from BTMUFJ amounting to Rp250,000. Drawdowns from this facility will bear interest JIBOR + 2.45% per annum. As of December 31, 2013, the Company has not made any drawdown from this facility. |
| | d. | On November 27, 2013, the Company and Orbital Sciences Corporation entered into an agreement on the procurement of Satellite Palapa E. The contract value ranges from US$124,900 to US$218,300 depending on the price schemes available for the Company up to June 30, 2014. The execution of such contract will also depend on the final evaluation from the Government of the Republic of Indonesia on the Company’s right to use the 150.5 East Latitude (EL) satellite orbital slot (Note 37n). As of December 31, 2013, the Company has paid an upfront payment to Orbital Sciences Corporation amounting to US$1,300. |
| | e. | On October 10, 2013, the Company and Subpartners PTY LTD, Australia entered into a Memorandum of Understanding (“MOU”) on the construction of a fiber optic submarine cable system connecting Perth, Western Australia and Singapore, with an intermediate landing in Jakarta, Indonesia (“APX-West cable system”). The term of MOU will be valid for six months from the date of such MOU or until the definitive agreement is executed, whichever date is earlier. |
| | f. | On May 1, 2013, the Company and PT XL Axiata entered into a cooperation agreement on the construction and use of optic cable for 6 links. |
| | g. | On March 5, 2012, the Company received the Tax Court’s Decision Letter accepting the Company’s request for interest compensation related to the issuance of 2004 SKPLB amounting to Rp60,674. On June 29, 2012, the Company received a copy of a Memorandum for Reconsideration Request (MemoriPermohonan Peninjauan Kembali) from the Tax Court to the Supreme Court on the Tax Court’s |
F-142
PT INDOSAT Tbk AND ITS SUBSIDIARIES
NOTES TO CONSOLIDATED FINANCIAL STATEMENTS—(Continued)
as of January 1, 2012 (Restated), December 31, 2012 (Restated) and December 31, 2013
and for the Years ended December 31, 2011 (Restated), 2012 (Restated) and 2013
(Expressed in millions of rupiah and thousands of U.S. dollar, except share and tariff data)
| | Decision Letter dated March 5, 2012 for the interest compensation related to the issuance of 2004 SKPLB. On July 27, 2012, the Company submitted a Counter-Memorandum Requesting for Reconsideration to the Supreme Court. Based on the Company’s evaluation for the year ended December 31, 2012, the realization of income related with the interest compensation was only probable, instead of virtually certain. Therefore, the interest compensation was not recognized in the Company’s financial statements for the year ended December 31, 2012. As of the issuance date of the consolidated financial statements, the Company has not received any decision from the Supreme Court on such request. |
| | h. | In 2012, the Company and Ooredoo, the Group’s ultimate parent company, entered into a cooperation agreement, whereas Ooredoo agreed to provide its personnel to be seconded at the Company’s request. This agreement is valid from January 1, 2012 for a period of five years and shall be automatically extended for additional terms of one year unless terminated by mutual consent of the parties thereto or upon the liquidation or insolvency of any of the parties thereto. For the years ended December 31, 2013 and 2012, the Company recorded the cost for the secondees totaling Rp44,273 and Rp76,596, respectively, as part of “General and Administration Expenses—Professional Fees”. |
In 2012, the Company and Ooredoo, the Group’s ultimate parent company, also entered into a cooperation agreement, whereas Ooredoo agreed to make available its personnel to provide project management and consultancy services at the Company’s request. This agreement has an unlimited term until terminated by mutual consent of the parties thereto or upon the liquidation or insolvency of any of the parties thereto. Terms and conditions of such services are to be provided at arm’s length terms which are to be agreed upon on a project by project basis. For the years ended December 31, 2013 and 2012, the Company recorded the cost for the project management and consultancy services totaling Rp21,475 and Rp nil, respectively, as part of “General and Administration Expenses—Professional Fees”.
| | i. | On January 18, 2012, the Company and IMM, a subsidiary, were investigated by the Attorney General’s Office (AGO) in connection with the cooperation agreement between the Company and IMM to provide 3G-based broadband internet services. IMM had been accused of illegally sharing or using the Company’s 3G license (Note 1a) without paying annual frequency fee, concession fee and tender upfront fee. The MOCIT, as well as the Indonesian Regulatory Body (BRTI), has made a public statement that IMM has not breached any prevailing regulations; nevertheless, the case continues to be investigated by the AGO. |
On July 8, 2013, the Corruption Court issued its final verdict which found Mr. Indar Atmanto, former President Director of IMM, guilty by virtue of representing IMM in signing and entering into a cooperation agreement with the Company and sentenced him to four years imprisonment, and fined him the amount of Rp200 (if Mr. Indar Atmanto fails to pay the fine, he would serve an additional three months imprisonment). In its decision, although IMM has not been named as a defendant, the District Court had also ordered IMM to pay substitution money in the amount of Rp1,358,343 as charged by the prosecutors for the losses sustained by the State.
A petition for an appeal was formally filed by Mr. Indar Atmanto on July 11, 2013 to the High Court of Jakarta (the “Appelate Court”) and subsequently the AGO also filed its appeal on July 15, 2013 to the Appelate Court. On January 10, 2014, the Appellate Court examined the case and reaffirmed the decision of the District Court. The Appellate Court increased the punishment of Mr. Indar Atmanto from four years to eight years imprisonment. The monetary fine and additional prison term (if Mr. Indar Atmanto refuses to pay the monetary fine) remain the same. In addition, the conviction
F-143
PT INDOSAT Tbk AND ITS SUBSIDIARIES
NOTES TO CONSOLIDATED FINANCIAL STATEMENTS—(Continued)
as of January 1, 2012 (Restated), December 31, 2012 (Restated) and December 31, 2013
and for the Years ended December 31, 2011 (Restated), 2012 (Restated) and 2013
(Expressed in millions of rupiah and thousands of U.S. dollar, except share and tariff data)
against IMM to pay substitution money in the amount of Rp1,358,343 was annulled. The Appellate Court considered IMM as a separate legal entity, and therefore stated that any cases brought against it must be indicted separately as it was not named as a defendant in the original case against Mr. Indar Atmanto.
As of the issuance date of the consolidated financial statements, the Appellate Court decision is not yet final and binding as Mr. Indar Atmanto, as well as the prosecutors, has submitted their respective petitions for cassation. A petition for cassation on behalf of Mr. Indar Atmanto has been filed on January 23, 2014 and the Memorandum of Cassation has been submitted by the lawyers on February 7, 2014 to the Supreme Court. Mr. Indar Atmanto has also submitted his private Memorandum of Cassation on February 7, 2014. The prosecutors have also filed petition for cassation since the Appellate Court’s verdict is less than their prosecution plan and has annulled the charge of substitution money against IMM. This cassation implies that the prosecutors will not execute the decision of the Appellate Court before the Supreme Court issued its decision which, under Indonesian law, is considered as a final and binding decision.
As of December 31, 2013, the Company did not accrue any liabilities related to the legal case because the Company believes, as supported by MOCIT and its legal counsel, that the cooperation agreement between Indosat and IMM does not breach any prevailing laws.
| | j. | On December 30, 2011, Lintasarta, entered into agreements with MOCIT-Balai Telekomunikasi dan Informasi Pedesaan (“MOCIT-BTIP”), whereby Lintasarta agreed to provide Public Access Services for Wireless Fidelity (WiFi) Internet inKewajiban Pelayanan Umum/ Universal Service Obligation (KPU/USO) Regencies (Kabupaten) (Penyediaan Jasa Akses Publik Layanan Internet WiFi Kabupaten KPU/USO) for Work Packages (Paket Pekerjaan) 3 and 6 that cover the provinces of West Kalimantan, South Kalimantan, Central Kalimantan, East Kalimantan, Bali, West Nusa Tenggara and East Nusa Tenggara. The agreements cover a four-year concession period and have contract values of Rp71,992 and Rp44,422 for Work Packages 3 and 6, respectively. In accordance with the contract, Lintasarta received advance payments representing 15% of the contract value. Fixed payment for services is received on a quarterly basis based on performance evaluation. At the end of the concession period, Lintasarta must transfer the assets subject to the concession agreement back to the local government. |
Subsequently on January 10, 2012, Lintasarta, also entered into an agreement with MOCIT-BTIP for the provision of Public Access Services for Wireless Fidelity (WiFi) Internet in KPU/USO Regencies (Kabupaten KPU/USO) (Penyediaan Jasa Akses Publik Layanan Internet WiFi Kabupaten KPU/USO) for Work Package (Paket Pekerjaan) 4 that covers the provinces of Gorontalo, West Sulawesi, South Sulawesi, Central Sulawesi, South East Sulawesi and North Sulawesi with contract value of Rp91,491. The terms and conditions of this agreement are consistent with those of the agreement above.
On July 9, 2012, the agreements were amended to extend the period of pre-operational stage from six months to sixteen months for WiFi 3 and 4 and to fourteen months for WiFi 6 starting from the issuance of the work order letter.
The consideration received or receivable in exchange for Lintasarta’s infrastructure construction services or its acquisition of infrastructure to be used in the arrangements was recognized as a financial asset to the extent that Lintasarta has an unconditional contractual right to receive cash or other financial asset for its construction services from or at the direction of the grantor.
F-144
PT INDOSAT Tbk AND ITS SUBSIDIARIES
NOTES TO CONSOLIDATED FINANCIAL STATEMENTS—(Continued)
as of January 1, 2012 (Restated), December 31, 2012 (Restated) and December 31, 2013
and for the Years ended December 31, 2011 (Restated), 2012 (Restated) and 2013
(Expressed in millions of rupiah and thousands of U.S. dollar, except share and tariff data)
As of January 1, 2012, December 31, 2012 and 2013, the current portions of outstanding receivables arising from this service concession arrangement amounting to Rp nil, Rp nil and Rp15,258, respectively, are classified as part of “Trade Accounts Receivable—Related Parties”, while the long-term portions of the outstanding receivables amounting to Rp nil, Rp8,974, Rp8,383, respectively, are classified as part of “Other Non-current Financial Assets”. Revenues from construction services earned by Lintasarta for the years ended December 31, 2011, 2012 and 2013 amounting to Rp nil, Rp37,175 and Rp13,787, respectively, are classified as part of “Revenues—MIDI”.
On February 8, 2012, Lintasarta entered into an agreement with PT Widtech Indonesia, for the procurement of equipment and infrastructure required for the construction of WiFi, as agreed with MOCIT-BTIP above, with total contract value amounting to Rp121,927. On May 29, 2013, the agreements were amended to change the payment of work progress.
| | k. | In May 2011 to March 2012, the Company issued several POs to PT Nokia Siemens Network and Nokia Siemens Network OY with total amounts of US$34,829 and Rp208,948 for the procurement of cellular technical equipment in the Sumatra and Java Areas. Based on the POs, the Company agreed to exchange certain existing cellular equipment with new equipment units and pay US$11,462 and Rp171,844 to Nokia for the installation services and additional equipment. For the year ended December 31, 2013, the carrying amount of the cellular technical equipment units given up amounted to Rp57,069 (Note 8) and the accumulated carrying amount of such equipment up to December 31, 2013 amounted to Rp446,468. |
| | l. | On April 26, 2011, the Company received the Tax Court’s Decision Letter which accepted the Company’s appeal on the remaining correction of the 2006 corporate income tax. On June 21, 2011, the Company received the tax refund amounting to Rp82,626. On August 22, 2011, the Company received a copy of a Memorandum Requesting for Reconsideration (Memori Permohonan Peninjauan Kembali) from the Tax Court to the Supreme Court on the Tax Court’s Decision Letter dated April 26, 2011 for the 2006 corporate income tax. On September 21, 2011, the Company submitted a Counter-Memorandum Requesting for Reconsideration to the Supreme Court. As of the issuance date of the consolidated financial statements, the Company has not received any decision from the Supreme Court on such request. |
| | m. | On April 15, 2010, Lintasarta, a subsidiary, entered into agreements with MOCIT-BTIP, whereby Lintasarta agreed to providePusat Layanan Jasa Akses Internet Kecamatan (Center for Internet Access and Services in Rural Areas) (PLIK) for Work Packages (Paket Pekerjaan) 7, 8 and 9 that cover the provinces of Bali, West Nusa Tenggara, East Nusa Tenggara, West Kalimantan, South Kalimantan, East Kalimantan, Central Kalimantan, Maluku and Papua. On December 22, 2010, the agreements were amended to increase the contract values. The agreements are non-cancellable and cover four years starting from October 15, 2010 with contract value amounting to Rp91,895, Rp143,668 and Rp116,721 for Work Packages 7, 8 and 9, respectively. In accordance with the agreements, Lintasarta placed its time deposits totaling Rp18,200 as a performance bond for the four-year contract period. These deposits are classified as part of “Other Non-current Financial Assets”. In accordance with the agreements, Lintasarta received advance payments representing 20% of the contract value. Fixed payment for services is received on a quarterly basis based on performance evaluation. At the end of the agreements, Lintasarta and MOCIT-BTIP plan to renegotiate the terms and conditions of any new arrangements. |
On December 12, 2010, Lintasarta entered into agreements with MOCIT-BTIP to providePusat Layanan Jasa Akses Internet Kecamatan Bergerak (Mobile Center for Internet Access and Services in
F-145
PT INDOSAT Tbk AND ITS SUBSIDIARIES
NOTES TO CONSOLIDATED FINANCIAL STATEMENTS—(Continued)
as of January 1, 2012 (Restated), December 31, 2012 (Restated) and December 31, 2013
and for the Years ended December 31, 2011 (Restated), 2012 (Restated) and 2013
(Expressed in millions of rupiah and thousands of U.S. dollar, except share and tariff data)
Rural Areas) (PLIKB) for Work Packages 2, 3, 11, 15, 16 and 18 that cover the provinces of North Sumatra, West Sumatra, East Nusa Tenggara, West Kalimantan, South Kalimantan and East Kalimantan. The agreements are non-cancellable and cover four years starting on September 22, 2011 with contract values amounting to Rp79,533, Rp92,003, Rp60,149, Rp71,879, Rp84,583 and Rp69,830 for Work Packages 2, 3, 11, 15, 16 and 18, respectively. On October 19, 2011, the agreements were amended to change the work starting date from September 22, 2011 to December 22, 2011. In accordance with the agreements, Lintasarta received advance payments representing 15% of the contract value. Fixed payment for services is received on a quarterly basis based on performance evaluation. At the end of the concession period, Lintasarta must transfer all assets subject to the concession agreement to the local government.
On May 6, 2010, Lintasarta entered into an agreement with PT Wira Eka Bhakti (WEB), for the procurement of equipment and infrastructure required for the construction of PLIK, as agreed with MOCIT-BTIP above, with total contract value amounting to Rp189,704. The agreement had been amended several times, with the latest amendment dated March 9, 2011 increasing the contract value to Rp208,361.
On March 23, 2011, Lintasarta entered into agreements with WEB and PT Personel Alih Daya (a related party), for the procurement of equipment and infrastructure required for the construction of PLIKB, as agreed with MOCIT-BTIP above, with total contract values amounting to Rp276,274 and Rp60,739, respectively.
Subsequently on January 3, 2014, the agreement for PLIKB of Work Package 2 was amended to, among others, amend the clause with respect to the calculation of performance related compensation.
As of December 31, 2013 and 2012, the current portions of outstanding receivables are classified as part of “Trade Accounts Receivable—Related Parties” amounting to Rp270,204 and Rp283,945, respectively, while the long-term portions amounting to Rp20,754 and Rp45,097, respectively, are classified as part of “Other Non-current Financial Assets”.
There is no revenue from construction services earned by Lintasarta for the year ended December 31, 2013.
| | n. | On January 29, April 15, May 24 and June 3 in 2010, and February 4 and 10 in 2011, the Company agreed to lease part of its telecommunications towers and sites to PT Hutchison CP Telecommunications (“Hutchison”) for a period of 12 years, to PT Axis Telecom (previously PT Natrindo Telepon Selular) (“Axis”) for a period of 10 years, to PT XL Axiata Tbk (“XL Axiata”) for a period of 10 years, to PT Berca Global Access (“Berca”) for a period of 10 years, to PT Dayamitra Telekomunikasi (“Mitratel”) for a period of 10 years and to PT First Media Tbk (“FM”) for a period of 5 years, respectively. Hutchison, Axis and XL Axiata (on annual basis), Berca and Mitratel (on quarterly basis) and FM (on semi-annual basis) are required to pay the lease and maintenance fees in advance which are recorded as part of unearned income. |
On August 18, 2011, the Company and Hutchison amended their tower leasing agreement covering changes in certain arrangements with respect to, among others, amount of compensation paid to landlords or residents around the leased site shouldered by the Company, penalty charged for overdue payments and effective lease period.
On December 11, 2012, the Company agreed to lease part of its In-Building Coverage telecommunication infrastructure and sites to Hutchison for a period of 5 years.
F-146
PT INDOSAT Tbk AND ITS SUBSIDIARIES
NOTES TO CONSOLIDATED FINANCIAL STATEMENTS—(Continued)
as of January 1, 2012 (Restated), December 31, 2012 (Restated) and December 31, 2013
and for the Years ended December 31, 2011 (Restated), 2012 (Restated) and 2013
(Expressed in millions of rupiah and thousands of U.S. dollar, except share and tariff data)
Future minimum lease receivables under the agreements as at December 31, 2013 and 2012 and January 1, 2012 / December 31, 2011 are as follows:
| | | | | | | | | | | | |
| | | January 1, 2012/
December 31, 2011 | | | December 31, | |
| | | | 2012 | | | 2013 | |
Within one year | | | 471,284 | | | | 655,894 | | | | 444,932 | |
After one year but not more than five years | | | 1,874,860 | | | | 2,597,263 | | | | 1,729,048 | |
More than five years | | | 1,817,218 | | | | 2,211,422 | | | | 1,339,623 | |
| | | | | | | | | | | | |
Total | | | 4,163,362 | | | | 5,464,579 | | | | 3,513,603 | |
| | | | | | | | | | | | |
| | o. | During 2008-2013, the Company entered into several agreements with PT Solusi Menara Indonesia, PT Professional Telekomunikasi Indonesia (“Protelindo”), PT Solusindo Kreasi Pratama, XL Axiata, Mitratel, PT BIT Teknologi Nusantara, PT Solusi Tunas Pratama, PT Corona Telecommunication Services, PT Mitrayasa Sarana Informasi and Tower Bersama (Note 29) for the Company to lease part of spaces in their telecommunication towers and sites for an initial period of 10 years. The Company may extend the lease period for another 10 years, with additional lease fees based on the inflation rates in Indonesia. |
Future minimum rentals payable under the finance lease agreements as at December 31, 2013 are as follows:
| | | | | | | | |
| | | Minimum
payments | | | Present
value of
payments | |
Within one year | | | 772,032 | | | | 346,357 | |
After one year but not more than five years | | | 3,014,118 | | | | 1,808,332 | |
More than five years | | | 2,112,762 | | | | 1,785,780 | |
| | | | | | | | |
Total | | | 5,898,912 | | | | 3,940,469 | |
Less amount representing finance charge | | | 1,958,443 | | | | — | |
| | | | | | | | |
Present value of minimum lease payments | | | 3,940,469 | | | | 3,940,469 | |
| | | | | | | | |
Current portion (presented as part of Other Current Financial Liabilities) | | | | | | | 346,357 | |
Long-term portion (presented as Obligations under Finance Lease) | | | | | | | 3,594,112 | |
| | | | | | | | |
Total | | | | | | | 3,940,469 | |
| | | | | | | | |
| | p. | The Company and IMM have committed to pay annual radio frequency fee over the 3G and BWA licenses period, provided the Company and IMM hold the 3G and BWA licenses. The amount of annual payment is based on the payment scheme set out in Regulations No. 7/PER/M.KOMINFO/2/2006, No. 268/KEP/M.KOMINFO/9/2009 and No. 237/KEP/ M.KOMINFO/7/2009 dated February 8, 2006, September 1, 2009 and July 27, 2009, respectively, of the MOCIT. The Company and IMM paid the annual frequency fee for the 3G and BWA licenses totaling Rp640,379 and Rp548,154 for the years ended December 31, 2013 and 2012, respectively. |
| | q. | On July 20, 2005, the Company obtained facilities from HSBC to fund the Company’s short-term working capital needs. The facilities agreement has been amended several times. On September 20, |
F-147
PT INDOSAT Tbk AND ITS SUBSIDIARIES
NOTES TO CONSOLIDATED FINANCIAL STATEMENTS—(Continued)
as of January 1, 2012 (Restated), December 31, 2012 (Restated) and December 31, 2013
and for the Years ended December 31, 2011 (Restated), 2012 (Restated) and 2013
(Expressed in millions of rupiah and thousands of U.S. dollar, except share and tariff data)
| | 2011, the expiration date of the facilities was extended up to April 30, 2012 and the interest rate and certain provisions of the agreement were changed as follows: |
| | • | | Overdraft facility amounting to US$2,000 (including overdraft facility denominated in rupiah amounting to Rp17,000). Interest is charged on daily balances at 3.75% per annum and 6% per annum below the HSBC Best Lending Rate for the loan portions denominated in rupiah and U.S. dollar, respectively. |
| | • | | Revolving loan facility amounting to US$30,000 (including revolving loan denominated in rupiah amounting to Rp255,000). The loan matures within a maximum period of 180 days and can be drawn in tranches with minimum amounts of US$500 and Rp500 for loans denominated in U.S. dollar and rupiah, respectively. Interest is charged on daily balances at 2.25% per annum above the HSBC Cost of Fund Rate for the loans denominated either in rupiah or U.S. dollar. |
| | • | | The facilities are considered uncommitted facility based on guidelines No.12/516/DPNP/DPnP dated September 21, 2010 issued by the Central Bank of Indonesia; consequently, these facilities can be automatically cancelled by HSBC in the event that the Company’s credit collectability declines to either substandard, doubtful or loss based on HSBC’s assessment pursuant to the general criteria set out by the Central Bank of Indonesia. |
On March 27, 2012, the Company received the letter from HSBC extending these facilities up to April 30, 2013. Furthermore, on July 8, 2013, the Company received the letter from HSBC extending these facilities up to June 30, 2014.
| | r. | In 1994, the Company was appointed as a Financial Administrator (“FA”) by a consortium which was established to build and sell/lease Asia Pacific Cable Network (“APCN”) submarine cable in countries in the Asia-Pacific Region. As an FA, the Company collected and distributed funds from the sale of APCN’s Indefeasible Right of Use (“IRU”), Defined Underwritten Capacity (“DUC”) and Occasional Commercial Use (“OCU”). |
The funds received from the sale of IRU, DUC and OCU and for upgrading the APCN cable did not belong to the Company and, therefore, were not recorded in the Company’s books. However, the Company managed these funds in separate accounts.
As of December 31 2013, the balance of the funds (including interest earned) which are under the Company’s custody amounted to US$3,971. Besides receiving their share of the funds from the sale of IRU, DUC and OCU, the members of the consortium also received their share of the interest earned by the above funds.
| | s. | Other agreements made with Telkom are as follows: |
| | • | | Under a cooperation agreement, the compensation to Telkom relating to leased circuit/ channel services, such as world link and bit link, is calculated at 15% of the Company’s collected revenues from such services. |
The Company and Satelindo also lease circuits from Telkom to link Jakarta, Medan and Surabaya.
| | • | | In 1994, Satelindo entered into a land transfer agreement for the transfer of Telkom’s rights to use a 134,925-square meter land property located at Daan Mogot, West Jakarta, where Satelindo’s earth control station is currently situated. The land transfer agreement enables Satelindo to use the land for a period of 30 years from the date of the agreement, for a price equivalent to US$40,000 less Rp43,220. The period of the agreement may be extended based on mutual agreement. |
F-148
PT INDOSAT Tbk AND ITS SUBSIDIARIES
NOTES TO CONSOLIDATED FINANCIAL STATEMENTS—(Continued)
as of January 1, 2012 (Restated), December 31, 2012 (Restated) and December 31, 2013
and for the Years ended December 31, 2011 (Restated), 2012 (Restated) and 2013
(Expressed in millions of rupiah and thousands of U.S. dollar, except share and tariff data)
The aforementioned agreement was subsequently superseded by a land rental agreement dated December 6, 2001, generally under the same terms as those of the land transfer agreement.
| | • | | In 1999, Lintasarta entered into an agreement with Telkom, whereby Telkom agreed to lease transponders to Lintasarta. This agreement has been amended several times, the latest amendment of which is based on the tenth amendment agreement dated March 7, 2012. Transponder lease expense charged to operations amounting to Rp33,044 and Rp27,371 for the years ended December 31, 2013 and 2012, respectively, is presented as part of “Expenses—Cost of Services—Leased Circuits” (Note 25) in the consolidated statements of comprehensive income. |
35. OPERATING SEGMENT INFORMATION
The Group manages and evaluates its operations in three major reportable segments: cellular, fixed telecommunications and MIDI. The operating segments are managed separately because each offers different services/products and serves different markets. The Group operates in one geographical area only, so no geographical information on segments is presented.
The cellular segment currently provides the network coverage in all major cities and population centers across Indonesia by using GSM 900 and GSM 1800 technology. Its primary service is the provision of voice and data transfer which is sold through post-paid and prepaid plans.
The fixed telecommunication segment is the provider of international long-distance services, fixed wireless services, Direct Long Distance (DLD) services and local fixed telephony services.
The MIDI segment offers products and services which include internet, high-speed point-to-point international and domestic digital leased line broadband and narrowband services, a high-performance packet-switching service and satellite transponder leasing and broadcasting services.
Refer to Notes 2f5 and 24 for the description of type of products and services under each reporting segment.
No operating segments have been aggregated to form the above reportable operating segments.
Segment results and assets include items directly attributable to a segment as well as those that can be allocated on a reasonable basis. Expenditures for segment assets represent the total costs incurred during the period to acquire segment assets that are expected to be used for more than one year.
Management monitors the operating results of the Group’s business units separately for the purpose of making decisions about resource allocation and performance assessment. Segment performance is evaluated based on operating profit or loss which in certain respects as explained in the table below, is measured differently from operating profit or loss in the consolidated financial statements. The Group’s financing (including financing cost and finance income) and income taxes are managed on a group basis and are not allocated to operating segments.
Operating segments are reported based on financial information determined in conformity with Indonesian Financial Accounting Standards (“IFAS”), which reporting is also consistent with the internal reporting provided to the chief operational decision maker. The chief operational decision maker is responsible for allocating resources and assessing performance of the operating segments, and has been identified as a steering committee that makes strategic decisions.
Inter-segment revenue relates to revenue between the reporting segments and has been eliminated on consolidation.
F-149
PT INDOSAT Tbk AND ITS SUBSIDIARIES
NOTES TO CONSOLIDATED FINANCIAL STATEMENTS—(Continued)
as of January 1, 2012 (Restated), December 31, 2012 (Restated) and December 31, 2013
and for the Years ended December 31, 2011 (Restated), 2012 (Restated) and 2013
(Expressed in millions of rupiah and thousands of U.S. dollar, except share and tariff data)
Consolidated information by industry segment follows:
| | | | | | | | | | | | | | | | | | | | | | | | | | | | |
| | | Major Segments | | | | | | | | | | | | | |
| | | Cellular | | | Fixed
Telecom-
munications | | | MIDI | | | Inter-Segment
Eliminations (1) | | | Total | | | Adjustments (2) | | | Consolidated | |
December 31, 2011 (Restated) | | | | | | | | | | | | | | | | | | | | | | | | | | | | |
Revenues | | | | | | | | | | | | | | | | | | | | | | | | | | | | |
Revenues from external customers | | | 16,587,385 | | | | 1,249,982 | | | | 2,691,925 | | | | — | | | | 20,529,292 | | | | 2,346 | | | | 20,531,638 | |
Inter-segment revenues | | | — | | | | — | | | | 609,497 | | | | (609,497 | ) | | | — | | | | — | | | | — | |
| | | | | | | | | | | | | | | | | | | | | | | | | | | | |
Total revenues | | | 16,587,385 | | | | 1,249,982 | | | | 3,301,422 | | | | (609,497 | ) | | | 20,529,292 | | | | 2,346 | | | | 20,531,638 | |
Expenses | | | 13,785,603 | | | | 1,338,073 | | | | 2,299,771 | | | | — | | | | 17,423,447 | | | | (72,023 | ) | | | 17,351,424 | |
Operating profit (loss) | | | 2,801,782 | | | | (88,091 | ) | | | 392,154 | | | | — | | | | 3,105,845 | | | | 74,369 | | | | 3,180,214 | |
Gain on foreign exchange—net | | | — | | | | — | | | | — | | | | — | | | | 90,919 | | | | — | | | | 90,919 | |
Others—net | | | — | | | | — | | | | — | | | | — | | | | (32,455 | ) | | | 2,665 | | | | (29,790 | ) |
| | | | | | | | | | | | | | | | | | | | | | | | | | | | |
Operating profit | | | — | | | | — | | | | — | | | | — | | | | 3,164,309 | | | | 77,034 | | | | 3,241,343 | |
Interest income | | | — | | | | — | | | | — | | | | — | | | | 92,646 | | | | — | | | | 92,646 | |
Gain on change in fair value of derivatives—net | | | — | | | | — | | | | — | | | | — | | | | 57,944 | | | | — | | | | 57,944 | |
Financing cost | | | — | | | | — | | | | — | | | | — | | | | (1,929,354 | ) | | | — | | | | (1,929,354 | ) |
Loss on foreign exchange—net | | | — | | | | — | | | | — | | | | — | | | | (54,188 | ) | | | — | | | | (54,188 | ) |
Total income tax expense | | | — | | | | — | | | | — | | | | — | | | | (264,613 | ) | | | (26,368 | ) | | | (290,981 | ) |
| | | | | | | | | | | | | | | | | | | | | | | | | | | | |
Profit for the year | | | | | | | | | | | | | | | | | | | 1,066,744 | | | | 50,666 | | | | 1,117,410 | |
| | | | | | | | | | | | | | | | | | | | | | | | | | | | |
Segment assets | | | 48,913,656 | | | | 2,068,759 | | | | 8,185,387 | | | | (7,929,430 | ) | | | 51,238,372 | | | | 596,659 | | | | 51,835,031 | |
Unallocated assets | | | | | | | | | | | | | | | | | | | 1,994,640 | | | | (30,981 | ) | | | 1,963,659 | |
| | | | | | | | | | | | | | | | | | | | | | | | | | | | |
Assets—net | | | | | | | | | | | | | | | | | | | 53,233,012 | | | | 565,678 | | | | 53,798,690 | |
| | | | | | | | | | | | | | | | | | | | | | | | | | | | |
Segment liabilities | | | 27,073,313 | | | | 742,444 | | | | 3,042,387 | | | | (6,269,068 | ) | | | 24,589,076 | | | | (33,183 | ) | | | 24,555,893 | |
Unallocated liabilities | | | | | | | | | | | | | | | | | | | 9,674,836 | | | | 361,582 | | | | 10,036,418 | |
| | | | | | | | | | | | | | | | | | | | | | | | | | | | |
Liabilities—net | | | | | | | | | | | | | | | | | | | 34,263,912 | | | | 328,399 | | | | 34,592,311 | |
| | | | | | | | | | | | | | | | | | | | | | | | | | | | |
Other disclosures | | | | | | | | | | | | | | | | | | | | | | | | | | | | |
Capital expenditures | | | 5,576,208 | | | | 228,834 | | | | 706,244 | | | | — | | | | 6,511,286 | | | | — | | | | 6,511,286 | |
Depreciation and amortization | | | 5,418,955 | | | | 292,140 | | | | 847,082 | | | | — | | | | 6,558,177 | | | | 11,151 | | | | 6,569,328 | |
Provision for impairment of receivables | | | 222,215 | | | | 53,497 | | | | 260,939 | | | | — | | | | 536,651 | | | | — | | | | 536,651 | |
F-150
PT INDOSAT Tbk AND ITS SUBSIDIARIES
NOTES TO CONSOLIDATED FINANCIAL STATEMENTS—(Continued)
as of January 1, 2012 (Restated), December 31, 2012 (Restated) and December 31, 2013
and for the Years ended December 31, 2011 (Restated), 2012 (Restated) and 2013
(Expressed in millions of rupiah and thousands of U.S. dollar, except share and tariff data)
| | | | | | | | | | | | | | | | | | | | | | | | | | | | |
| | | Major Segments | | | | | | | | | | | | | |
| | | Cellular | | | Fixed
Telecom-
munications | | | MIDI | | | Inter-Segment
Eliminations (1) | | | Total | | | Adjustments (2) | | | Consolidated | |
December 31, 2012 (Restated) | | | | | | | | | | | | | | | | | | | | | | | | | | | | |
Revenues | | | | | | | | | | | | | | | | | | | | | | | | | | | | |
Revenues from external customers | | | 18,489,329 | | | | 1,021,450 | | | | 2,908,033 | | | | — | | | | 22,418,812 | | | | 1,765 | | | | 22,420,577 | |
Inter-segment revenues | | | — | | | | — | | | | 597,914 | | | | (597,914 | ) | | | — | | | | — | | | | — | |
| | | | | | | | | | | | | | | | | | | | | | | | | | | | |
Total revenues | | | 18,489,329 | | | | 1,021,450 | | | | 3,505,947 | | | | (597,914 | ) | | | 22,418,812 | | | | 1,765 | | | | 22,420,577 | |
Expenses | | | 16,473,013 | | | | 1,296,127 | | | | 2,382,450 | | | | — | | | | 20,151,590 | | | | (5,841 | ) | | | 20,145,749 | |
Operating profit (loss) | | | 2,016,316 | | | | (274,677 | ) | | | 525,583 | | | | — | | | | 2,267,222 | | | | 7,606 | | | | 2,274,828 | |
Gain on tower sale | | | — | | | | — | | | | — | | | | — | | | | 1,183,963 | | | | — | | | | 1,183,963 | |
Gain on foreign exchange—net | | | — | | | | — | | | | — | | | | — | | | | 44,793 | | | | — | | | | 44,793 | |
Others—net | | | — | | | | — | | | | — | | | | — | | | | (306,080 | ) | | | — | | | | (306,080 | ) |
| | | | | | | | | | | | | | | | | | | | | | | | | | | | |
Operating profit | | | — | | | | — | | | | — | | | | — | | | | 3,189,898 | | | | 7,606 | | | | 3,197,504 | |
Interest income | | | — | | | | — | | | | — | | | | — | | | | 133,544 | | | | — | | | | 133,544 | |
Gain on change in fair value of derivatives—net | | | ��� | | | | — | | | | — | | | | — | | | | 4,964 | | | | — | | | | 4,964 | |
Financing cost | | | — | | | | — | | | | — | | | | — | | | | (2,077,350 | ) | | | — | | | | (2,077,350 | ) |
Loss on foreign exchange—net | | | — | | | | — | | | | — | | | | — | | | | (789,438 | ) | | | — | | | | (789,438 | ) |
Income tax benefit—net | | | — | | | | — | | | | — | | | | — | | | | 25,798 | | | | (5,281 | ) | | | 20,517 | |
| | | | | | | | | | | | | | | | | | | | | | | | | | | | |
Profit for the year | | | | | | | | | | | | | | | | | | | 487,416 | | | | 2,325 | | | | 489,741 | |
| | | | | | | | | | | | | | | | | | | | | | | | | | | | |
Segment assets | | | 51,599,983 | | | | 1,417,859 | | | | 8,460,772 | | | | (8,473,481 | ) | | | 53,005,133 | | | | 585,169 | | | | 53,590,302 | |
Unallocated assets | | | | | | | | | | | | | | | | | | | 2,219,928 | | | | (62,949 | ) | | | 2,156,979 | |
| | | | | | | | | | | | | | | | | | | | | | | | | | | | |
Assets—net | | | | | | | | | | | | | | | | | | | 55,225,061 | | | | 522,220 | | | | 55,747,281 | |
| | | | | | | | | | | | | | | | | | | | | | | | | | | | |
Segment liabilities | | | 29,495,438 | | | | 448,908 | | | | 2,521,525 | | | | (6,640,808 | ) | | | 25,825,063 | | | | 618 | | | | 25,825,681 | |
Unallocated liabilities | | | | | | | | | | | | | | | | | | | 10,004,614 | | | | 527,943 | | | | 10,532,557 | |
| | | | | | | | | | | | | | | | | | | | | | | | | | | | |
Liabilities—net | | | | | | | | | | | | | | | | | | | 35,829,677 | | | | 528,561 | | | | 36,358,238 | |
| | | | | | | | | | | | | | | | | | | | | | | | | | | | |
Other disclosures | | | | | | | | | | | | | | | | | | | | | | | | | | | | |
Capital expenditures | | | 7,449,614 | | | | 123,983 | | | | 822,984 | | | | — | | | | 8,396,581 | | | | — | | | | 8,396,581 | |
Depreciation and amortization | | | 7,078,187 | | | | 415,410 | | | | 779,227 | | | | — | | | | 8,272,824 | | | | 11,188 | | | | 8,284,012 | |
Provision for impairment of receivables | | | 274,949 | | | | 59,092 | | | | 230,589 | | | | — | | | | 564,630 | | | | — | | | | 564,630 | |
F-151
PT INDOSAT Tbk AND ITS SUBSIDIARIES
NOTES TO CONSOLIDATED FINANCIAL STATEMENTS—(Continued)
as of January 1, 2012 (Restated), December 31, 2012 (Restated) and December 31, 2013
and for the Years ended December 31, 2011 (Restated), 2012 (Restated) and 2013
(Expressed in millions of rupiah and thousands of U.S. dollar, except share and tariff data)
| | | | | | | | | | | | | | | | | | | | | | | | | | | | |
| | | Major Segments | | | | | | | | | | | | | |
| | | Cellular | | | Fixed
Telecom-
munications | | | MIDI | | | Inter-Segment
Eliminations (1) | | | Total | | | Adjustments (2) | | | Consolidated | |
December 31, 2013 | | | | | | | | | | | | | | | | | | | | | | | | | | | | |
Revenues | | | | | | | | | | | | | | | | | | | | | | | | | | | | |
Revenues from external customers | | | 19,374,638 | | | | 1,214,787 | | | | 3,265,847 | | | | — | | | | 23,855,272 | | | | 618 | | | | 23,855,890 | |
Inter-segment revenues | | | — | | | | — | | | | 724,704 | | | | (724,704 | ) | | | — | | | | — | | | | — | |
| | | | | | | | | | | | | | | | | | | | | | | | | | | | |
Total revenues | | | 19,374,638 | | | | 1,214,787 | | | | 3,990,551 | | | | (724,704 | ) | | | 23,855,272 | | | | 618 | | | | 23,855,890 | |
Expenses | | | 18,153,802 | | | | 1,486,404 | | | | 2,797,422 | | | | — | | | | 22,437,628 | | | | 18,092 | | | | 22,455,720 | |
Operating profit (loss) | | | 1,220,836 | | | | (271,617 | ) | | | 468,425 | | | | — | | | | 1,417,644 | | | | (17,474 | ) | | | 1,400,170 | |
Gain on tower sale | | | — | | | | — | | | | — | | | | — | | | | 141,050 | | | | — | | | | 141,050 | |
Gain on foreign exchange—net | | | — | | | | — | | | | — | | | | — | | | | 224,518 | | | | — | | | | 224,518 | |
Others—net | | | — | | | | — | | | | — | | | | — | | | | (273,996 | ) | | | — | | | | (273,996 | ) |
| | | | | | | | | | | | | | | | | | | | | | | | | | | | |
Operating profit | | | — | | | | — | | | | — | | | | — | | | | 1,509,216 | | | | (17,474 | ) | | | 1,491,742 | |
Income tax benefit—net | | | — | | | | — | | | | — | | | | — | | | | 667,378 | | | | 1,286 | | | | 668,664 | |
Gain on change in fair value of derivatives—net | | | — | | | | — | | | | — | | | | — | | | | 273,259 | | | | — | | | | 273,259 | |
Interest income | | | — | | | | — | | | | — | | | | — | | | | 107,193 | | | | — | | | | 107,193 | |
Loss on foreign exchange—net | | | — | | | | — | | | | — | | | | — | | | | (3,011,410 | ) | | | — | | | | (3,011,410 | ) |
Financing cost | | | — | | | | — | | | | — | | | | — | | | | (2,212,095 | ) | | | — | | | | (2,212,095 | ) |
| | | | | | | | | | | | | | | | | | | | | | | | | | | | |
Loss for the year | | | | | | | | | | | | | | | | | | | (2,666,459 | ) | | | (16,188 | ) | | | (2,682,647 | ) |
| | | | | | | | | | | | | | | | | | | | | | | | | | | | |
Segment assets | | | 52,963,887 | | | | 969,366 | | | | 8,707,074 | | | | (10,548,670 | ) | | | 52,091,657 | | | | 573,926 | | | | 52,665,583 | |
Unallocated assets | | | | | | | | | | | | | | | | | | | 2,429,234 | | | | 45,192 | | | | 2,474,426 | |
| | | | | | | | | | | | | | | | | | | | | | | | | | | | |
Assets—net | | | | | | | | | | | | | | | | | | | 54,520,891 | | | | 619,118 | | | | 55,140,009 | |
| | | | | | | | | | | | | | | | | | | | | | | | | | | | |
Segment liabilities | | | 31,522,602 | | | | 640,188 | | | | 3,072,679 | | | | (8,574,051 | ) | | | 26,661,418 | | | | — | | | | 26,661,418 | |
Unallocated liabilities | | | | | | | | | | | | | | | | | | | 11,341,875 | | | | (37,282 | ) | | | 11,304,593 | |
| | | | | | | | | | | | | | | | | | | | | | | | | | | | |
Liabilities—net | | | | | | | | | | | | | | | | | | | 38,003,293 | | | | (37,282 | ) | | | 37,966,011 | |
| | | | | | | | | | | | | | | | | | | | | | | | | | | | |
Other disclosures | | | | | | | | | | | | | | | | | | | | | | | | | | | | |
Capital expenditures | | | 8,084,870 | | | | 112,790 | | | | 1,173,381 | | | | — | | | | 9,371,041 | | | | — | | | | 9,371,041 | |
Depreciation and amortization | | | 7,561,379 | | | | 523,183 | | | | 873,832 | | | | — | | | | 8,958,394 | | | | 11,242 | | | | 8,969,636 | |
Provision for impairment of receivables | | | 305,370 | | | | 45,120 | | | | 170,916 | | | | — | | | | 521,406 | | | | — | | | | 521,406 | |
| (1) | These include inter-segment assets, liabilities and revenues eliminated upon consolidation. |
| (2) | These are adjustments to reconcile segment financial information to consolidated IFRS financial statements. Segment financial information, as reported to the chief operation decision maker, is still managed and maintained by the Group under IFAS which differs from IFRS. The adjustments relate primarily to: |
| | a. | The accounting for land rights: Under IFAS, land rights are not amortized while under IFRS, land rights are amortized over the lease term. |
| | b. | Goodwill: Prior to January 1, 2011, under IFAS, goodwill was previously amortized on a straight-line basis over its useful life. Starting January 1, 2011, IFAS 19 (similar to IAS 36) was adopted and goodwill was no longer amortized but subject to annual impairment testing similar to IFRS. The difference in carrying value relates to the amortization prior to the adoption of IFAS 19. |
| | c. | Revenue from service connection: Prior to January 1, 2010, revenue from service connection was not deferred while under IFRS, the revenue is deferred and recognized over the expected average period of the customer relationship. With the prospective adoption of IFAS 23 in January 1, 2010, the difference in revenue recognized pertains to the amortization of the outstanding deferred income as of January 1, 2010. |
| | d. | The accounting for employee benefit: Under IFAS, employee benefits use the corridor approach, while under IFRS, employee benefits use the OCI approach. |
F-152
PT INDOSAT Tbk AND ITS SUBSIDIARIES
NOTES TO CONSOLIDATED FINANCIAL STATEMENTS—(Continued)
as of January 1, 2012 (Restated), December 31, 2012 (Restated) and December 31, 2013
and for the Years ended December 31, 2011 (Restated), 2012 (Restated) and 2013
(Expressed in millions of rupiah and thousands of U.S. dollar, except share and tariff data)
36. FINANCIAL RISK MANAGEMENT OBJECTIVES AND POLICIES
A. RISK MANAGEMENT
The main risks arising from the Group’s financial instruments are interest rate risk, foreign exchange rate risk, equity price risk, credit risk and liquidity risk. The importance of managing these risks has significantly increased in light of the considerable change and volatility in both Indonesian and international financial markets. The Company’s Board of Directors reviews and approves the policies for managing these risks which are summarized below.
Interest rate risk
Interest rate risk is the risk that the fair value or future cash flows of a financial instrument will fluctuate because of changes in market interest rates. The Group’s exposure to the risk of changes in market interest rates relates primarily to its loans and bonds payable with floating interest rates.
The Company’s policies relating to interest rate risk are as follows:
| | (1) | Manage interest cost through a mix of fixed and variable rate debts. The Company evaluates the fixed to floating rate ratio of its loans and bonds payable in line with movements of relevant interest rates in the financial markets. Based on management’s assessment, new financing will be priced either on a fixed or floating rate basis. |
| | (2) | Manage interest rate exposure on its loans and bonds payable by entering into interest rate swap contracts. |
As of January 1, 2012, December 31, 2012 and 2013, more than 65%, 82% and 79%, respectively, of the Group’s debts are fixed-rated.
Several interest rate swap contracts are entered into to hedge floating rate U.S. dollar debts. These contracts are accounted for as transactions not designated as hedges, wherein the changes in the fair value are credited or charged directly to profit or loss for the year.
The following table demonstrates the sensitivity to a reasonably possible change in interest rates, with all other variables held constant, of the Group’s profit or loss for the years ended December 31, 2011, 2012 and 2013 (through the impact on floating rate borrowings which is based on LIBOR for U.S. dollar borrowings and on JIBOR for rupiah borrowings).
| | | | | | | | | | | | |
| | | 2011 | | | 2012 | | | 2013 | |
Increase/decrease in basis points: | | | | | | | | | | | | |
U.S. dollar | | | 8 | | | | 11 | | | | 4 | |
Rupiah | | | 107 | | | | 19 | | | | 77 | |
Effect on profit (loss) for the year | | | US$340 | | | | US$267 | | | | US$27 | |
U.S. dollar | |
| (equivalent to
Rp3,084 |
) | |
| (equivalent to
Rp2,584 |
) | |
| (equivalent to
Rp329 |
) |
Rupiah | | | Rp23,099 | | | | Rp4,535 | | | | Rp15,198 | |
Management conducted a survey among the Group’s banks to determine the outlook of the LIBOR and JIBOR interest rates until the Group’s next reporting date of March 31, 2012, 2013 and 2014. The outlook is
F-153
PT INDOSAT Tbk AND ITS SUBSIDIARIES
NOTES TO CONSOLIDATED FINANCIAL STATEMENTS—(Continued)
as of January 1, 2012 (Restated), December 31, 2012 (Restated) and December 31, 2013
and for the Years ended December 31, 2011 (Restated), 2012 (Restated) and 2013
(Expressed in millions of rupiah and thousands of U.S. dollar, except share and tariff data)
that the LIBOR and JIBOR interest rates may move 8, 11 and 4 basis point higher or lower, and 107, 19 and 77 basis points higher or lower, respectively, as compared to the interest rates at the end of the years ended December 31, 2011, 2012 and 2013, respectively.
If LIBOR interest rates were 8, 11 and 4 basis point higher or lower than the market levels for the years ended December 31, 2011, 2012 and 2013, respectively, with all other variables held constant, the Group’s profit (loss) for the years ended and the consolidated equity would be Rp949,287, Rp522,999 lower and (Rp2,101,321) higher or Rp955,455, Rp528,167 higher and (Rp2,100,663) lower; Rp18,756,074, Rp18,864,668 and Rp16,578,352 lower or Rp18,762,242, Rp18,869,836 and Rp16,579,010 higher than the actual results for the years ended December 31, 2011, 2012 and 2013, respectively, mainly due to the higher and lower interest expense on floating rate borrowings.
If JIBOR interest rates were 107, 19 and 77 basis point higher or lower than the market levels for the years ended December 31, 2011, 2012 and 2013, respectively, with all other variables held constant, the Group’s profit (loss) for the years ended and the consolidated equity would be Rp929,272, Rp521,048 lower and (Rp2,116,190) higher; Rp975,470, Rp530,118 higher or (Rp2,085,794) lower; Rp18,736,059, Rp18,862,717 and Rp16,563,483 lower or Rp18,782,257, Rp18,871,787 and Rp16,593,879 higher than the actual results for the years ended December 31, 2011, 2012 and 2013, respectively, mainly due to the higher and lower interest expense on floating rate borrowings.
Foreign exchange rate risk
Foreign exchange rate risk is the risk that the fair value or future cash flows of a financial instrument will fluctuate because of changes in foreign exchange rates. The Group’s exposure to exchange rate fluctuations results primarily from U.S. dollar-denominated loans and bonds payable, accounts receivable, accrued expenses and procurement payable.
To manage foreign exchange rate risks, the Company entered into several cross currency swap and currency forward contracts and other permitted instruments, if considered necessary. These contracts are accounted for as transactions not designated as hedges, wherein the changes in the fair value are credited or charged directly to profit or loss for the year.
The Group’s procurement payable is primarily denominated in foreign currencies payable to suppliers and contractors for the purchase and construction or installation of property and equipment, while a significant part of the Group’s accounts receivable represents Indonesian rupiah-denominated collectibles from domestic operators.
To the extent the Indonesian rupiah depreciated further from the exchange rates in effect at December 31, 2011, 2012 and 2013, the Group’s obligations denominated in foreign currencies will increase in Indonesian rupiah terms. However, the increases in these obligations will be offset in part by increases in the values of foreign currency-denominated time deposits and accounts receivable. As of January 1, 2012, December 31, 2012 and 2013, 27.33%, 31.81% and 26.22%, respectively, of the Group’s U.S. dollar-denominated debts were covered by several currency forward contracts.
F-154
PT INDOSAT Tbk AND ITS SUBSIDIARIES
NOTES TO CONSOLIDATED FINANCIAL STATEMENTS—(Continued)
as of January 1, 2012 (Restated), December 31, 2012 (Restated) and December 31, 2013
and for the Years ended December 31, 2011 (Restated), 2012 (Restated) and 2013
(Expressed in millions of rupiah and thousands of U.S. dollar, except share and tariff data)
The following table shows the Group’s consolidated U.S. dollar-denominated assets and liabilities as of January 1, 2012, December 31, 2012 and 2013:
| | | | | | | | | | | | | | | | | | | | | | | | |
| | | January 1, 2012 | | | December 31, 2012 | | | December 31, 2013 | |
| | | U.S. Dollar | | | Rupiah * | | | U.S. Dollar | | | Rupiah * | | | U.S. Dollar | | | Rupiah * | |
Assets: | | | | | | | | | | | | | | | | | | | | | | | | |
Cash and cash equivalents | | | 53,356 | | | | 483,835 | | | | 249,279 | | | | 2,410,529 | | | | 83,487 | | | | 1,017,623 | |
Accounts receivable—trade | | | 91,260 | | | | 827,553 | | | | 111,612 | | | | 1,079,285 | | | | 117,478 | | | | 1,431,942 | |
Derivative assets | | | 17,573 | | | | 159,349 | | | | 7,203 | | | | 69,654 | | | | 16,045 | | | | 195,569 | |
Other current financial assets—net | | | 178 | | | | 1,613 | | | | 488 | | | | 4,719 | | | | 227 | | | | 2,762 | |
Other current assets | | | 15 | | | | 138 | | | | — | | | | — | | | | — | | | | — | |
Due from related parties | | | 317 | | | | 2,871 | | | | 106 | | | | 1,028 | | | | 45 | | | | 553 | |
Other non-current financial assets—net | | | 1,578 | | | | 14,306 | | | | 1,150 | | | | 11,121 | | | | 1,438 | | | | 17,528 | |
| | | | | | | | | | | | | | | | | | | | | | | | |
Total assets | | | 164,277 | | | | 1,489,665 | | | | 369,838 | | | | 3,576,336 | | | | 218,720 | | | | 2,665,977 | |
| | | | | | | | | | | | | | | | | | | | | | | | |
Liabilities: | | | | | | | | | | | | | | | | | | | | | | | | |
Accounts payable—trade | | | 13,010 | | | | 117,971 | | | | 9,343 | | | | 90,347 | | | | 10,412 | | | | 126,913 | |
Procurement payable | | | 220,788 | | | | 2,002,110 | | | | 141,102 | | | | 1,364,458 | | | | 81,220 | | | | 989,989 | |
Accrued expenses | | | 45,156 | | | | 409,476 | | | | 46,424 | | | | 448,918 | | | | 46,170 | | | | 562,764 | |
Deposits from customers | | | 1,834 | | | | 16,629 | | | | 2,478 | | | | 23,962 | | | | 2,696 | | | | 32,866 | |
Derivative liabilities | | | 15,239 | | | | 138,189 | | | | 8,401 | | | | 81,241 | | | | 3,028 | | | | 36,903 | |
Other current financial liabilities | | | 41 | | | | 371 | | | | 16,676 | | | | 161,255 | | | | 17,974 | | | | 219,091 | |
Due to related parties | | | 9 | | | | 83 | | | | 2,685 | | | | 25,968 | | | | 1,552 | | | | 18,915 | |
Loans payable (including current maturities) | | | 653,848 | | | | 5,929,093 | | | | 557,193 | | | | 5,388,055 | | | | 280,499 | | | | 3,418,998 | |
Bonds payable (including current maturities) | | | 650,000 | | | | 5,894,200 | | | | 650,000 | | | | 6,285,500 | | | | 650,000 | | | | 7,922,850 | |
Obligations under finance lease | | | — | | | | — | | | | 212,757 | | | | 2,057,362 | | | | 194,783 | | | | 2,374,205 | |
Other non-current financial liabilities | | | — | | | | — | | | | — | | | | — | | | | 3,669 | | | | 44,726 | |
| | | | | | | | | | | | | | | | | | | | | | | | |
Total liabilities | | | 1,599,925 | | | | 14,508,122 | | | | 1,647,059 | | | | 15,927,066 | | | | 1,292,003 | | | | 15,748,220 | |
| | | | | | | | | | | | | | | | | | | | | | | | |
Net liabilities position | | | 1,435,648 | | | | 13,018,457 | | | | 1,277,221 | | | | 12,350,730 | | | | 1,073,283 | | | | 13,082,243 | |
| | | | | | | | | | | | | | | | | | | | | | | | |
| * | The exchange rates used to translate the U.S. dollar amounts into rupiah were Rp9,068 to US$1.00 (in full amounts), Rp9,670 to US$1.00 (in full amounts) and Rp12,189 to US$1.00 (in full amounts) as published by the Indonesian Central Bank as of January 1, 2012, December 31, 2012 and 2013, respectively. |
The following table demonstrates the sensitivity to a reasonably possible change in the U.S. dollar exchange rates, with all other variables held constant, of the Group’s consolidated profit (loss) for the years ended December 31, 2011, 2012 and 2013:
| | | | | | | | | | | | |
| | | 2011 | | | 2012 | | | 2013 | |
Change in U.S. dollar exchange rate | | | 1.24 | % | | | 1.83 | % | | | 2.90 | % |
Effect on consolidated profit (loss) for the year | | | Rp122,342 | | | | Rp169,551 | | | | Rp284,152 | |
Management conducted a survey among the Group’s banks to determine the outlook of the U.S. dollar exchange rate until the Group’s next reporting dates of March 31, 2012, 2013 and 2014. The outlook is that the U.S. dollar exchange rate may strengthen or weaken by 1.24%, 1.83% and 2.90% as compared to the exchange rate at December 31, 2011, 2012 and 2013, respectively.
F-155
PT INDOSAT Tbk AND ITS SUBSIDIARIES
NOTES TO CONSOLIDATED FINANCIAL STATEMENTS—(Continued)
as of January 1, 2012 (Restated), December 31, 2012 (Restated) and December 31, 2013
and for the Years ended December 31, 2011 (Restated), 2012 (Restated) and 2013
(Expressed in millions of rupiah and thousands of U.S. dollar, except share and tariff data)
If the U.S. dollar exchange rate strengthened or weakened by 1.24%, 1.83% and 2.90% as compared to the exchange rate as of December 31, 2011, 2012 and 2013, respectively, with all other variables held constant, the Group’s profit (loss) for the years then ended would be Rp830,029, Rp356,032 lower and (Rp2,385,144) higher or Rp1,074,713, Rp695,134 higher and (Rp1,816,840) lower while the Group’s consolidated equity would be Rp18,636,816, Rp18,697,701 and Rp16,294,529 lower or Rp18,881,500, Rp19,036,803 and Rp16,862,833 higher than the actual results as of December 31, 2011, 2012 and 2013, respectively, mainly due to the consolidated foreign exchange gain and loss on the translation of U.S. dollar-denominated net liabilities.
Equity price risk
The Group’s long-term investments consist primarily of minority investment in the equity of private Indonesian companies and equity of foreign companies. With respect to the Indonesian companies in which the Group has investments, the financial performance of such companies may be adversely affected by the economic conditions in Indonesia.
Credit risk
Credit risk is the risk that the Group will incur a loss arising from its customers, clients or counterparties that fail to discharge their contractual obligations. There are no significant concentrations of credit risk. The Group manages and controls this credit risk by setting limits on the amount of risk it is willing to accept for individual or collective customers and by monitoring exposures in relation to such limits.
The Group trades only with recognized and creditworthy third parties. It is the Group’s policy that all customers who wish to trade on credit terms are subject to credit verification procedures. In addition, receivable balances are monitored on an ongoing basis to reduce the exposure to bad debts. The Group places its cash and cash equivalents in a number of different financial institutions, including state-owned and internationally recognized banks because they have the most extensive branch networks in Indonesia and are considered to be financially sound banks.
The table below shows the maximum exposure to credit risk for the components of the consolidated statements of financial position:
| | | | | | | | | | | | |
| | | Maximum Exposure(1) | |
| | | January 1,
2012 | | | December 31,
2012 | | | December 31,
2013 | |
Loans and receivables: | | | | | | | | | | | | |
Cash and cash equivalents | | | 2,224,206 | | | | 3,917,236 | | | | 2,233,532 | |
Accounts receivable | | | | | | | | | | | | |
Trade—net | | | 1,500,096 | | | | 2,038,719 | | | | 2,268,339 | |
Others—net | | | 5,660 | | | | 22,441 | | | | 16,294 | |
Other current financial assets—net | | | 24,790 | | | | 13,382 | | | | 31,673 | |
Due from related parties—net | | | 10,654 | | | | 10,358 | | | | 7,167 | |
Other non-current financial assets—net | | | 209,540 | | | | 173,400 | | | | 163,645 | |
F-156
PT INDOSAT Tbk AND ITS SUBSIDIARIES
NOTES TO CONSOLIDATED FINANCIAL STATEMENTS—(Continued)
as of January 1, 2012 (Restated), December 31, 2012 (Restated) and December 31, 2013
and for the Years ended December 31, 2011 (Restated), 2012 (Restated) and 2013
(Expressed in millions of rupiah and thousands of U.S. dollar, except share and tariff data)
| | | | | | | | | | | | |
| | | Maximum Exposure(1) | |
| | | January 1,
2012 | | | December 31,
2012 | | | December 31,
2013 | |
Held-for-trading: | | | | | | | | | | | | |
Currency forward | | | 137,211 | | | | 39,747 | | | | 195,569 | |
Cross currency swaps | | | 22,138 | | | | 29,907 | | | | — | |
Available-for-sale investments: | | | | | | | | | | | | |
Other non-current financial assets—other long-term investments—net | | | 2,730 | | | | 2,730 | | | | 2,730 | |
| | | | | | | | | | | | |
Total | | | 4,137,025 | | | | 6,247,920 | | | | 4,918,949 | |
| | | | | | | | | | | | |
| (1) | There are no collaterals held or other credit enhancements or offsetting arrangements that affect this maximum exposure. |
Liquidity risk
Liquidity risk is defined as the risk that an entity will encounter difficulty in meeting obligations associated with financial liabilities that are settled by delivering cash or another financial asset.
The Group’s liquidity requirements have historically arisen from the need to finance investments and capital expenditures related to the expansion of its telecommunications business. The Group’s telecommunications business requires substantial capital to construct and expand mobile and data network infrastructure and to fund operations, particularly during the network development stage.
Although the Group has substantial existing network infrastructure, the Group expects to incur additional capital expenditures primarily in order to focus cellular network development in areas it anticipate will be high-growth areas, as well as to enhance the quality and coverage of its existing network.
In the management of liquidity risk, the Group monitors and maintains a level of cash and cash equivalents deemed adequate to finance the Group’s operations and to mitigate the effects of fluctuation in cash flows. The Group also regularly evaluates the projected and actual cash flows, including its loan maturity profiles, and continuously assesses conditions in the financial markets for opportunities to pursue fund-raising initiatives. These activities may include bank loans, debt capital and equity market issues.
F-157
PT INDOSAT Tbk AND ITS SUBSIDIARIES
NOTES TO CONSOLIDATED FINANCIAL STATEMENTS—(Continued)
as of January 1, 2012 (Restated), December 31, 2012 (Restated) and December 31, 2013
and for the Years ended December 31, 2011 (Restated), 2012 (Restated) and 2013
(Expressed in millions of rupiah and thousands of U.S. dollar, except share and tariff data)
The table below summarizes the maturity profiles of the Group’s financial liabilities based on contractual undiscounted payments.
| | | | | | | | | | | | | | | | | | | | | | | | | | | | | | | | |
| | | Expected maturity as of December 31, | |
| | | 2012 | | | 2013 | | | 2014 | | | 2015 | | | 2016 and
thereafter | | | Total
contractual
cash flows | | | Interest
value | | | Carrying
amount | |
January 1, 2012 | | | | | | | | | | | | | | | | | | | | | | | | | | | | | | | | |
Short-term loan | | | 1,579,092 | | | | — | | | | — | | | | — | | | | — | | | | 1,579,092 | | | | (79,836 | ) | | | 1,499,256 | |
Accounts payable—trade | | | 319,058 | | | | — | | | | — | | | | — | | | | — | | | | 319,058 | | | | — | | | | 319,058 | |
Procurement payable | | | 3,475,862 | | | | — | | | | — | | | | — | | | | — | | | | 3,475,862 | | | | — | | | | 3,475,862 | |
Accrued expenses | | | 1,895,613 | | | | — | | | | — | | | | — | | | | — | | | | 1,895,613 | | | | — | | | | 1,895,613 | |
Deposits from customers | | | 37,265 | | | | — | | | | — | | | | — | | | | — | | | | 37,265 | | | | — | | | | 37,265 | |
Derivative liabilities | | | 138,189 | | | | — | | | | — | | | | — | | | | — | | | | 138,189 | | | | — | | | | 138,189 | |
Other current financial liabilities | | | 196,675 | | | | — | | | | — | | | | — | | | | — | | | | 196,675 | | | | (124,847 | ) | | | 71,828 | |
Due to related parties | | | — | | | | 15,480 | | | | — | | | | — | | | | — | | | | 15,480 | | | | — | | | | 15,480 | |
Obligation under financial lease | | | — | | | | 180,602 | | | | 180,602 | | | | 180,602 | | | | 696,670 | | | | 1,238,476 | | | | (468,395 | ) | | | 770,081 | |
Other non-current financial liabilities | | | — | | | | 84,186 | | | | 34,631 | | | | — | | | | — | | | | 118,817 | | | | (11,384 | ) | | | 107,433 | |
Loans payable | | | 3,732,456 | | | | 2,774,662 | | | | 2,245,335 | | | | 706,241 | | | | 1,396,047 | | | | 10,854,741 | | | | (1,128,425 | ) | | | 9,726,316 | |
Bonds payable | | | 1,167,023 | | | | 2,384,195 | | | | 3,260,902 | | | | 1,040,592 | | | | 11,263,104 | | | | 19,115,816 | | | | (6,935,474 | ) | | | 12,180,342 | |
| | | | | | | | | | | | | | | | | | | | | | | | | | | | | | | | |
Total | | | 12,541,233 | | | | 5,439,125 | | | | 5,721,470 | | | | 1,927,435 | | | | 13,355,821 | | | | 38,985,084 | | | | (8,748,361 | ) | | | 30,236,723 | |
| | | | | | | | | | | | | | | | | | | | | | | | | | | | | | | | |
| | | | | | | | | | | | | | | | | | | | | | | | | | | | | | | | |
| | | Expected maturity as of December 31, | |
| | | 2013 | | | 2014 | | | 2015 | | | 2016 | | | 2017 and
thereafter | | | Total
contractual
cash flows | | | Interest
value | | | Carrying
amount | |
December 31, 2012 | | | | | | | | | | | | | | | | | | | | | | | | | | | | | | | | |
Short-term loan | | | 315,736 | | | | — | | | | — | | | | — | | | | — | | | | 315,736 | | | | (16,207 | ) | | | 299,529 | |
Accounts payable—trade | | | 231,737 | | | | — | | | | — | | | | — | | | | — | | | | 231,737 | | | | — | | | | 231,737 | |
Procurement payable | | | 2,737,850 | | | | — | | | | — | | | | — | | | | — | | | | 2,737,850 | | | | — | | | | 2,737,850 | |
Accrued expenses | | | 1,961,285 | | | | — | | | | — | | | | — | | | | — | | | | 1,961,285 | | | | — | | | | 1,961,285 | |
Deposits from customers | | | 43,825 | | | | — | | | | — | | | | — | | | | — | | | | 43,825 | | | | — | | | | 43,825 | |
Derivative liabilities | | | 81,241 | | | | — | | | | — | | | | — | | | | — | | | | 81,241 | | | | — | | | | 81,241 | |
Other current financial liabilities | | | 670,834 | | | | — | | | | — | | | | — | | | | — | | | | 670,834 | | | | (381,670 | ) | | | 289,164 | |
Due to related parties | | | — | | | | 42,789 | | | | — | | | | — | | | | — | | | | 42,789 | | | | — | | | | 42,789 | |
Obligation under financial lease | | | — | | | | 622,020 | | | | 622,020 | | | | 622,020 | | | | 2,827,500 | | | | 4,693,560 | | | | (1,591,650 | ) | | | 3,101,910 | |
Other non-current financial liabilities | | | — | | | | 71,592 | | | | 4,588 | | | | — | | | | — | | | | 76,180 | | | | (6,907 | ) | | | 69,273 | |
Loans payable | | | 2,924,722 | | | | 1,793,139 | | | | 856,839 | | | | 654,973 | | | | 830,089 | | | | 7,059,762 | | | | (686,722 | ) | | | 6,373,040 | |
Bonds payable | | | 2,643,553 | | | | 3,520,261 | | | | 1,299,951 | | | | 1,734,671 | | | | 13,638,300 | | | | 22,836,736 | | | | (7,521,054 | ) | | | 15,315,682 | |
| | | | | | | | | | | | | | | | | | | | | | | | | | | | | | | | |
Total | | | 11,610,783 | | | | 6,049,801 | | | | 2,783,398 | | | | 3,011,664 | | | | 17,295,889 | | | | 40,751,535 | | | | (10,204,210 | ) | | | 30,547,325 | |
| | | | | | | | | | | | | | | | | | | | | | | | | | | | | | | | |
F-158
PT INDOSAT Tbk AND ITS SUBSIDIARIES
NOTES TO CONSOLIDATED FINANCIAL STATEMENTS—(Continued)
as of January 1, 2012 (Restated), December 31, 2012 (Restated) and December 31, 2013
and for the Years ended December 31, 2011 (Restated), 2012 (Restated) and 2013
(Expressed in millions of rupiah and thousands of U.S. dollar, except share and tariff data)
| | | | | | | | | | | | | | | | | | | | | | | | | | | | | | | | |
| | | Expected maturity as of December 31, | |
| | | 2014 | | | 2015 | | | 2016 | | | 2017 | | | 2018 and
thereafter | | | Total
contractual
cash flows | | | Interest
value | | | Carrying
amount | |
December 31, 2013 | | | | | | | | | | | | | | | | | | | | | | | | | | | | | | | | |
Short-term loan | | | 1,500,000 | | | | — | | | | — | | | | — | | | | — | | | | 1,500,000 | | | | (151 | ) | | | 1,499,849 | |
Accounts payable—trade | | | 339,310 | | | | — | | | | — | | | | — | | | | — | | | | 339,310 | | | | — | | | | 339,310 | |
Procurement payable | | | 3,064,287 | | | | — | | | | — | | | | — | | | | — | | | | 3,064,287 | | | | — | | | | 3,064,287 | |
Accrued expenses | | | 2,107,467 | | | | — | | | | — | | | | — | | | | — | | | | 2,107,467 | | | | — | | | | 2,107,467 | |
Deposits from customers | | | 49,335 | | | | — | | | | — | | | | — | | | | — | | | | 49,335 | | | | — | | | | 49,335 | |
Derivative liabilities | | | 36,903 | | | | — | | | | — | | | | — | | | | — | | | | 36,903 | | | | — | | | | 36,903 | |
Other current financial liabilities | | | 788,124 | | | | — | | | | — | | | | — | | | | — | | | | 788,124 | | | | (425,676 | ) | | | 362,448 | |
Due to related parties | | | — | | | | 33,301 | | | | — | | | | — | | | | — | | | | 33,301 | | | | — | | | | 33,301 | |
Obligation under financial lease | | | — | | | | 771,409 | | | | 770,925 | | | | 763,186 | | | | 2,821,359 | | | | 5,126,879 | | | | (1,532,767 | ) | | | 3,594,112 | |
Other non-current financial liabilities | | | 11,181 | | | | 50,294 | | | | 11,181 | | | | 11,181 | | | | — | | | | 83,837 | | | | (982 | ) | | | 82,855 | |
Loans payable | | | 2,443,408 | | | | 1,593,408 | | | | 1,206,344 | | | | 634,897 | | | | 990,941 | | | | 6,868,998 | | | | (80,364 | ) | | | 6,788,634 | |
Bonds payable | | | 2,358,000 | | | | 320,000 | | | | 772,000 | | | | 1,370,000 | | | | 10,922,850 | | | | 15,742,850 | | | | (101,333 | ) | | | 15,641,517 | |
| | | | | | | | | | | | | | | | | | | | | | | | | | | | | | | | |
Total | | | 12,698,015 | | | | 2,768,412 | | | | 2,760,450 | | | | 2,779,264 | | | | 14,735,150 | | | | 35,741,291 | | | | (2,141,273 | ) | | | 33,600,018 | |
| | | | | | | | | | | | | | | | | | | | | | | | | | | | | | | | |
B. CAPITAL MANAGEMENT
The Group aims to achieve an optimal capital structure in pursuit of its business objectives, which include maintaining healthy capital ratios and strong credit ratings, and maximizing stockholder value.
Some of the Group’s debt instruments contain covenants that impose compliance with certain leverage ratios. In addition, the Company’s credit ratings from the international credit ratings agencies are based on its ability to remain within certain leverage ratios. The Group has complied with all externally imposed capital requirements.
Management monitors capital using several financial leverage measurements such as debt-to-equity ratio. The Group’s objective is to maintain its debt-to-equity ratio at a maximum of 2.50 each as of January 1, 2012, December 31, 2012 and 2013.
The Group continues to manage its debt covenants and capital structure based on financial information determined under IFAS.
F-159
PT INDOSAT Tbk AND ITS SUBSIDIARIES
NOTES TO CONSOLIDATED FINANCIAL STATEMENTS—(Continued)
as of January 1, 2012 (Restated), December 31, 2012 (Restated) and December 31, 2013
and for the Years ended December 31, 2011 (Restated), 2012 (Restated) and 2013
(Expressed in millions of rupiah and thousands of U.S. dollar, except share and tariff data)
As of December 31, 2011, 2012 and 2013, the Group’s debt-to-equity ratio accounts are as follows:
| | | | | | | | | | | | | | | | | | | | | | | | |
| | | January 1, 2012 | | | December 31, 2012 | | | December 31, 2013 | |
| | | Loans and
Bonds Payable | | | Guaranteed
Notes Due 2020 | | | Loans and
Bonds Payable | | | Guaranteed
Notes Due 2020 | | | Loans and
Bonds Payable | | | Guaranteed
Notes Due 2020 | |
Short-term loan—gross | | | 1,500,000 | | | | 1,500,000 | | | | 300,000 | | | | 300,000 | | | | 1,500,000 | | | | 1,500,000 | |
Loans and bonds payable—including current maturities—gross | | | 22,172,064 | | | | 22,172,064 | | | | 21,923,555 | | | | 21,923,555 | | | | 22,611,848 | | | | 22,611,848 | |
Obligation under finance lease | | | — | | | | 825,836 | | | | — | | | | 3,374,139 | | | | — | | | | 3,940,469 | |
| | | | | | | | | | | | | | | | | | | | | | | | |
Total debts | | | 23,672,064 | | | | 24,497,900 | | | | 22,223,555 | | | | 25,597,694 | | | | 24,111,848 | | | | 28,052,317 | |
| | | | | | | | | | | | | | | | | | | | | | | | |
Total equity | | | 19,206,379 | | | | 19,206,379 | | | | 19,389,043 | | | | 19,389,043 | | | | 17,173,998 | | | | 17,173,998 | |
| | | | | | | | | | | | | | | | | | | | | | | | |
Debt to equity ratio | | | 1.23 | | | | 1.28 | | | | 1.15 | | | | 1.32 | | | | 1.40 | | | | 1.63 | |
| | | | | | | | | | | | | | | | | | | | | | | | |
C. COLLATERAL
The loans of Lintasarta, a subsidiary, which were obtained from CIMB Niaga, are collateralized by all equipment (Notes 8 and 18l) purchased by Lintasarta from the proceeds of the credit facilities. There are no other significant terms and conditions associated with the use of the equipment.
The Company did not hold any collateral as of January 1, 2012, December 31, 2012 and 2013.
37. EVENTS AFTER THE REPORTING PERIOD
| | a. | On January 3, 2014, the Company made the second drawdown of Rp300,000 from its Syndicated Revolving Time Loan facility with IIF and SMI (Note 18g). |
| | b. | During January, February, March and April 2014, the Company entered into 5, 20, 4 and 3 currency forward contracts with several counter-parties with total notional amounts of US$75,000, US$370,000, US$72,000 and US$40,000, respectively. |
| | c. | As of January 10, 21 and 27 and February 3 and 9, 2014, SKAGEN Funds, a stockholder, reported its ownership in the Company to be 5.50%, 5.47%, 5.46%, 5.43% and 5.42%, respectively, as stated in its letter to OJK on the same dates. |
| | d. | On January 15, 2014, the Company sent a letter to OJK informing the latter about the updated status of the legal case in regard to the allegation of frequency 2.1 GHz misuse by IMM and the Company under a cooperation agreement on broadband internet services (Note 34i). |
| | e. | On January 20 and February 4, 2014, March 4 and April 2, 2014, the Company received the ratings for its Guaranteed Notes 2020 from S&P, Moody’s and Fitch at BB+ (stable outlook), Ba1 (stable outlook), BBB (stable outlook), respectively. |
F-160
PT INDOSAT Tbk AND ITS SUBSIDIARIES
NOTES TO CONSOLIDATED FINANCIAL STATEMENTS—(Continued)
as of January 1, 2012 (Restated), December 31, 2012 (Restated) and December 31, 2013
and for the Years ended December 31, 2011 (Restated), 2012 (Restated) and 2013
(Expressed in millions of rupiah and thousands of U.S. dollar, except share and tariff data)
On March 11, 2014, the Company received the rating from Pefindo for its local bonds and sukuk at id AA+ (stable outlook) and id AA+(sy) (stable outlook), respectively.
| | f. | On January 20, 2014, the Company received a letter from Mandiri informing the Company about the further increase in the interest rate of the Revolving Time Loan facility into 1-Month JIBOR + 2.00% per annum. The new interest rate is effective starting January 12, 2014 (Note 14). |
| | g. | On January 23, 2014, the Company received a letter from BCA informing the Company about the further increase in the interest rate of Revolving Time Loan facility and Investment Credit Facility to1-Month JIBOR + 2.25% per annum and 9.75%, respectively. The new interest rates are effective starting February 28, 2014 (Notes 18c and 18e). |
| | h. | On January 24, 2014, the Company paid the underpayment amounting to Rp110,413 and Rp97,132 of the 2007 and 2008 corporate income tax, respectively (Note 34b). On March 20, 2014, the Company submitted objection letters to the Tax Office regarding this correction on the Company’s 2007 and 2008 corporate income tax amounting to Rp110,413 and Rp97,132, respectively. As of the issuance date of the consolidated financial statements, the Company has not received any decision from the Tax Office on these objections. |
| | i. | On January 30, 2014, BRTI issued a letter to all telecommunication operators, informing them of the details of the 2014 interconnection fee to be implemented by telecommunication operators in Indonesia. |
| | j. | On February 25, 2014, the Company received a letter from BCA approving the extension of maturity of the Revolving Time Loan Facility up to February 10, 2015 (Note 18c). |
| | k. | On February 28 and March 28, 2014, the Company paid the loan principal installments of SEK Credit Facility B and HSBC France’s COFACE and SINOSURE term facilities amounting to US$11,071.43 (Note 18b) and US$10,069.34 (Note 18d), respectively. |
| | l. | On March 14, 2014, the Company entered into an agreement with Merrill Lynch, Singapore to sell the Company’s investment in 239,826,310 shares in Tower Bersama at Rp5,800 per share (Note 12a). The Company subsequently received the proceeds from the sale on March 19, 2014. Hence, the investment in Tower Bersama will be derecognized in the next financial year and the cumulative fair value gain of Rp413,700 recorded in other comprehensive income will be recycled to profit or loss. |
| | m. | During March 2014, the Company received SKPKBs from the DGT on 2010 income tax articles 21, 22, 23, 26 and 4(2) totaling Rp5,401, which were paid in April 2014. |
| | n. | On March 26, 2014, the Company received a letter from the MOCIT informing the Company that its license to utilize the 150.5 EL satellite orbital slot will no longer be extended and such license utilization will cease as of September 1, 2015 (Note 34d). On March 27, 2014, the Company submitted a letter to the MOCIT to request for clarification regarding the basis of its decision and the rules and regulations which the Company has purportedly failed to comply with. As of the issuance date of the consolidated financial statements, the Company has not received any response from the MOCIT. |
| | o. | On April 1, 2014, the Company received dividend income from its investment in ACPL amounting to US$396.8 (equivalent to Rp4,525). |
| | p. | As of April 29, 2014, the prevailing exchange rate of the rupiah to U.S. dollar is Rp11,589 to US$1 (in full amounts), while as of December 31, 2013, the prevailing exchange rate was Rp12,189 to US$1 (in full amounts). Using the exchange rate as of April 29, 2014, the Group earned exchange gain |
F-161
PT INDOSAT Tbk AND ITS SUBSIDIARIES
NOTES TO CONSOLIDATED FINANCIAL STATEMENTS—(Continued)
as of January 1, 2012 (Restated), December 31, 2012 (Restated) and December 31, 2013
and for the Years ended December 31, 2011 (Restated), 2012 (Restated) and 2013
(Expressed in millions of rupiah and thousands of U.S. dollar, except share and tariff data)
| | amounting to approximately Rp643,970 (excluding the effect of revaluing derivative contracts on April 29, 2014) on the foreign currency liabilities, net of foreign currency assets, as of December 31, 2013 (Note 36). |
The translation of the foreign currency liabilities, net of foreign currency assets, should not be construed as a representation that these foreign currency liabilities and assets have been, could have been, or could in the future be, converted into rupiah at the prevailing exchange rate of the rupiah to U.S. dollar as of December 31, 2013 or at any other rate of exchange.
The commitments for the capital expenditures denominated in foreign currencies as of December 31, 2013 as disclosed in Note 34a are approximately Rp1,376,391 if translated at the prevailing exchange rate as of April 29, 2014.
F-162