Exhibit 99.1
| 2024 Annual Report |
| Annual Report 2024 Forward-looking statements This Annual Report contains forward-looking statements within the meaning of Section 27A of the US Securities Act of 1933, as amended, and Section 21E of the US Securities Exchange Act of 1934, as amended. These statements are subject to risks and uncertainties that could cause actual results or outcomes of RELX PLC (together with its subsidiaries, “RELX”, “we” or “our”) to differ materially from those expressed in any forward-looking statement. We consider any statements that are not historical facts to be “forward-looking statements”. The terms “outlook”, “estimate”, “forecast”, “project”, “plan”, “intend”, “expect”, “should”, “could”, “will”, “believe”, “trends” and similar expressions may indicate a forward-looking statement. Important factors that could cause actual results or outcomes to differ materially from estimates or forecasts contained in the forward-looking statements include, among others: regulatory and other changes regarding the collection or use of personal data; changes in law and legal interpretation affecting our intellectual property rights and internet communications; current and future geopolitical, economic and market conditions; research integrity issues or changes in the payment model for our scientific, technical and medical research products; competitive factors in the industries in which we operate and demand for our products and services; our inability to realise the future anticipated benefits of acquisitions; compromises of our cybersecurity systems or other unauthorised access to our databases; changes in economic cycles, trading relations, communicable disease epidemics or pandemics, severe weather events, natural disasters and terrorism; failure of third parties to whom we have outsourced business activities; significant failure or interruption of our systems; our inability to retain high-quality employees and management; changes in tax laws and uncertainty in their application; exchange rate fluctuations; adverse market conditions or downgrades to the credit ratings of our debt; changes in the market values of defined benefit pension scheme assets and in the market related assumptions used to value scheme liabilities; breaches of generally accepted ethical business standards or applicable laws; and other risks referenced from time to time in the filings of RELX PLC with the US Securities and Exchange Commission. You should not place undue reliance on these forward-looking statements, which speak only as of the date of this Annual report. Except as may be required by law, we undertake no obligation to publicly update or release any revisions to these forward-looking statements to reflect events or circumstances after the date of this Annual report or to reflect the occurrence of unanticipated events. About us RELX is a global provider of information-based analytics and decision tools for professional and business customers, enabling them to make better decisions, getbetter results and be more productive. Our purpose is to benefit society by developing products that help researchers advance scientific knowledge; doctors and nurses improve the lives of patients; lawyers promote the rule of law and achieve justice andfair results for their clients; businesses and governments prevent fraud; consumers access financial services and get fair prices on insurance; and customers learn about markets and complete transactions. Our purpose guides our actions beyond the products that we develop. It defines us as a company. Every day across RELX our employees are inspired to undertake initiatives that make unique contributions to society andthe communities in which we operate. |
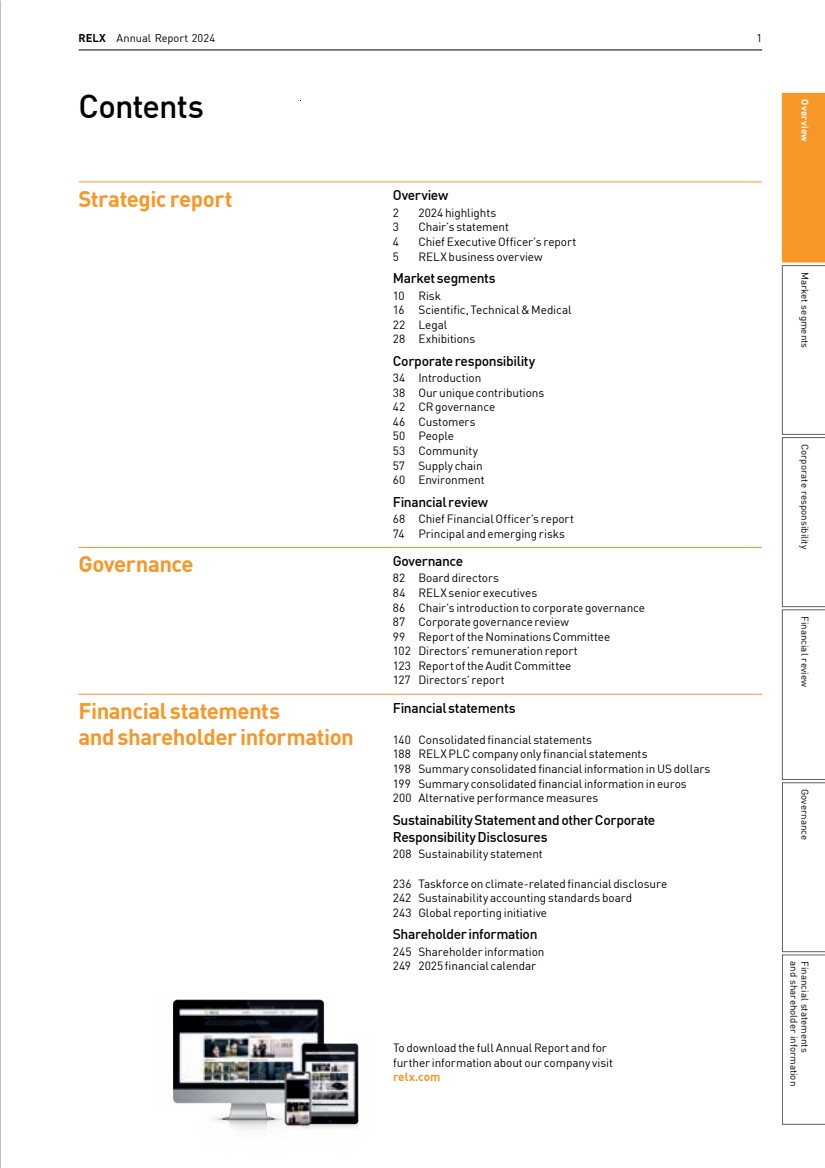
| RELX Annual Report 2024 1 Contents Strategic report Overview 2 2024 highlights 3 Chair’s statement 4 Chief Executive Officer’s report 5 RELX business overview Market segments 10 Risk 16 Scientific, Technical & Medical 22 Legal 28 Exhibitions Corporate responsibility 34 Introduction 38 Our unique contributions 42 CR governance 46 Customers 50 People 53 Community 57 Supply chain 60 Environment Financial review 68 Chief Financial Officer’s report 74 Principal and emerging risks Governance Governance 82 Board directors 84 RELX senior executives 86 Chair’s introduction to corporate governance 87 Corporate governance review 99 Report of the Nominations Committee 102 Directors’ remuneration report 123 Report of the Audit Committee 127 Directors’ report Financial statements and shareholder information Financial statements 140 Consolidated financial statements 188 RELX PLC company only financial statements 198 Summary consolidated financial information in US dollars 199 Summary consolidated financial information in euros 200 Alternative performance measures Sustainability Statement and other Corporate ResponsibilityDisclosures 208 Sustainability statement 236 Taskforce on climate-related financial disclosure 242 Sustainability accounting standards board 243 Global reporting initiative Shareholder information 245 Shareholder information 249 2025 financial calendar To download the full Annual Report and for further information about our company visit relx.com Market segments Governance and shareholder information Financial statements Financial review Corporate responsibility Overview |
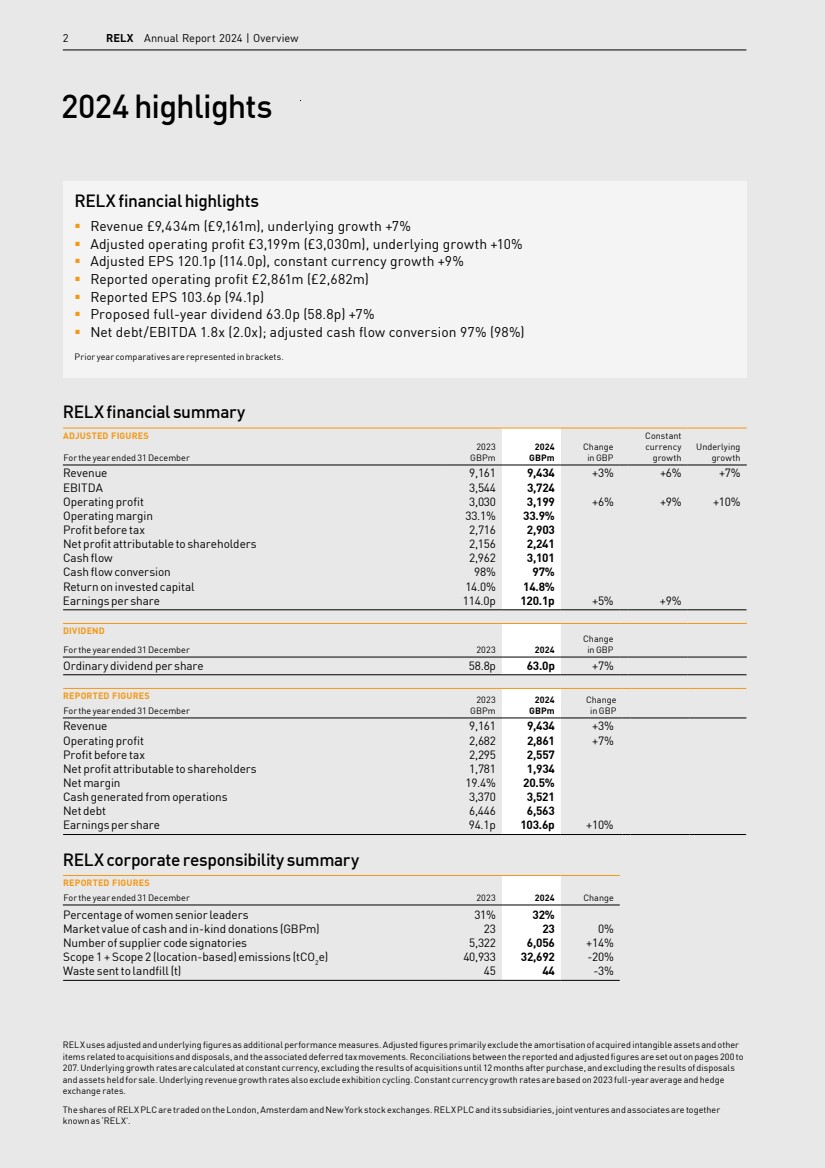
| 2 RELX Annual Report 2024 | Overview 2024 highlights RELX financial highlights § Revenue £9,434m (£9,161m), underlying growth +7% § Adjusted operating profit £3,199m (£3,030m), underlying growth +10% § Adjusted EPS 120.1p (114.0p), constant currency growth +9% § Reported operating profit £2,861m (£2,682m) § Reported EPS 103.6p (94.1p) § Proposed full-year dividend 63.0p (58.8p) +7% § Net debt/EBITDA 1.8x (2.0x); adjusted cash flow conversion 97% (98%) Prior year comparatives are represented in brackets. RELX financial summary ADJUSTED FIGURES 2023 GBPm 2024 GBPm Change in GBP Constant currency growth Underlying For the year ended 31 December growth Revenue 9,161 9,434 +3% +6% +7% EBITDA 3,544 3,724 Operating profit 3,030 3,199 +6% +9% +10% Operating margin 33.1% 33.9% Profit before tax 2,716 2,903 Net profit attributable to shareholders 2,156 2,241 Cash flow 2,962 3,101 Cash flow conversion 98% 97% Return on invested capital 14.0% 14.8% Earnings per share 114.0p 120.1p +5% +9% DIVIDEND 2023 2024 Change For the year ended 31 December in GBP Ordinary dividend per share 58.8p 63.0p +7% REPORTED FIGURES 2023 GBPm 2024 GBPm Change For the year ended 31 December in GBP Revenue 9,161 9,434 +3% Operating profit 2,682 2,861 +7% Profit before tax 2,295 2,557 Net profit attributable to shareholders 1,781 1,934 Net margin 19.4% 20.5% Cash generated from operations 3,370 3,521 Net debt 6,446 6,563 Earnings per share 94.1p 103.6p +10% RELX corporate responsibility summary REPORTED FIGURES For the year ended 31 December 2023 2024 Change Percentage of women senior leaders 31% 32% Market value of cash and in-kind donations (GBPm) 23 23 0% Number of supplier code signatories 5,322 6,056 +14% Scope 1 + Scope 2 (location-based) emissions (tCO2 e) 40,933 32,692 -20% Waste sent to landfill (t) 45 44 -3% RELX uses adjusted and underlying figures as additional performance measures. Adjusted figures primarily exclude the amortisation of acquired intangible assets and other items related to acquisitions and disposals, and the associated deferred tax movements. Reconciliations between the reported and adjusted figures are set out on pages 200 to 207. Underlying growth rates are calculated at constant currency, excluding the results of acquisitions until 12 months after purchase, and excluding the results of disposals and assets held for sale. Underlying revenue growth rates also exclude exhibition cycling. Constant currency growth rates are based on 2023 full-year average and hedge exchange rates. The shares of RELX PLC are traded on the London, Amsterdam and New York stock exchanges. RELX PLC and its subsidiaries, joint ventures and associates are together known as ‘RELX’. |
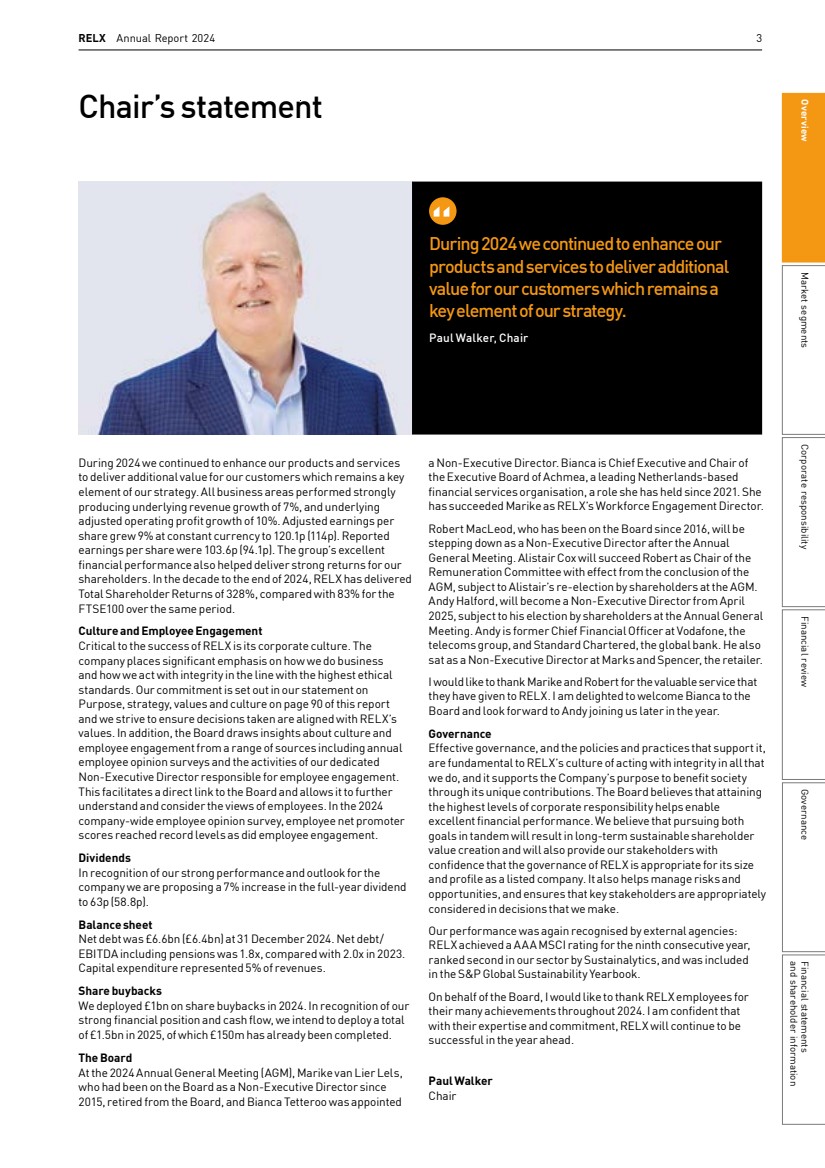
| RELX Annual Report 2024 3 Chair’s statement During 2024 we continued to enhance our products and services to deliver additional value for our customers which remains a key element of our strategy. Paul Walker, Chair During 2024 we continued to enhance our products and services to deliver additional value for our customers which remains a key element of our strategy. All business areas performed strongly producing underlying revenue growth of 7%, and underlying adjusted operating profit growth of 10%. Adjusted earnings per share grew 9% at constant currency to 120.1p (114p). Reported earnings per share were 103.6p (94.1p). The group’s excellent financial performance also helped deliver strong returns for our shareholders. In the decade to the end of 2024, RELX has delivered Total Shareholder Returns of 328%, compared with 83% for the FTSE100 over the same period. Culture and Employee Engagement Critical to the success of RELX is its corporate culture. The company places significant emphasis on how we do business and how we act with integrity in the line with the highest ethical standards. Our commitment is set out in our statement on Purpose, strategy, values and culture on page 90 of this report and we strive to ensure decisions taken are aligned with RELX’s values. In addition, the Board draws insights about culture and employee engagement from a range of sources including annual employee opinion surveys and the activities of our dedicated Non-Executive Director responsible for employee engagement. This facilitates a direct link to the Board and allows it to further understand and consider the views of employees. In the 2024 company-wide employee opinion survey, employee net promoter scores reached record levels as did employee engagement. Dividends In recognition of our strong performance and outlook for the company we are proposing a 7% increase in the full-year dividend to 63p (58.8p). Balance sheet Net debt was £6.6bn (£6.4bn) at 31 December 2024. Net debt/ EBITDA including pensions was 1.8x, compared with 2.0x in 2023. Capital expenditure represented 5% of revenues. Share buybacks We deployed £1bn on share buybacks in 2024. In recognition of our strong financial position and cash flow, we intend to deploy a total of £1.5bn in 2025, of which £150m has already been completed. The Board At the 2024 Annual General Meeting (AGM), Marike van Lier Lels, who had been on the Board as a Non-Executive Director since 2015, retired from the Board, and Bianca Tetteroo was appointed a Non-Executive Director. Bianca is Chief Executive and Chair of the Executive Board of Achmea, a leading Netherlands-based financial services organisation, a role she has held since 2021. She has succeeded Marike as RELX’s Workforce Engagement Director. Robert MacLeod, who has been on the Board since 2016, will be stepping down as a Non-Executive Director after the Annual General Meeting. Alistair Cox will succeed Robert as Chair of the Remuneration Committee with effect from the conclusion of the AGM, subject to Alistair’s re-election by shareholders at the AGM. Andy Halford, will become a Non-Executive Director from April 2025, subject to his election by shareholders at the Annual General Meeting. Andy is former Chief Financial Officer at Vodafone, the telecoms group, and Standard Chartered, the global bank. He also sat as a Non-Executive Director at Marks and Spencer, the retailer. I would like to thank Marike and Robert for the valuable service that they have given to RELX. I am delighted to welcome Bianca to the Board and look forward to Andy joining us later in the year. Governance Effective governance, and the policies and practices that support it, are fundamental to RELX’s culture of acting with integrity in all that we do, and it supports the Company’s purpose to benefit society through its unique contributions. The Board believes that attaining the highest levels of corporate responsibility helps enable excellent financial performance. We believe that pursuing both goals in tandem will result in long-term sustainable shareholder value creation and will also provide our stakeholders with confidence that the governance of RELX is appropriate for its size and profile as a listed company. It also helps manage risks and opportunities, and ensures that key stakeholders are appropriately considered in decisions that we make. Our performance was again recognised by external agencies: RELX achieved a AAA MSCI rating for the ninth consecutive year, ranked second in our sector by Sustainalytics, and was included in the S&P Global Sustainability Yearbook. On behalf of the Board, I would like to thank RELX employees for their many achievements throughout 2024. I am confident that with their expertise and commitment, RELX will continue to be successful in the year ahead. Paul Walker Chair Market segments Governance and shareholder information Financial statements Financial review Corporate responsibility Overview |
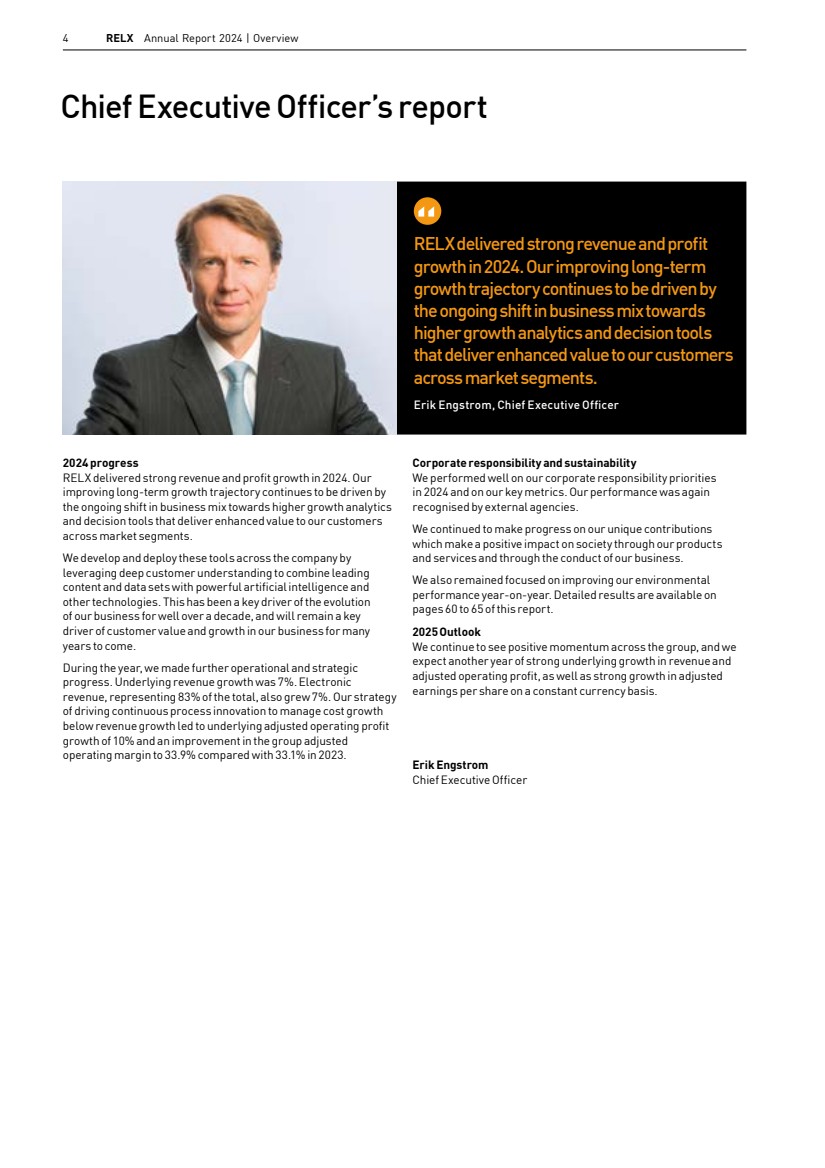
| 4 RELX Annual Report 2024 | Overview Chief Executive Officer’s report RELX delivered strong revenue and profit growth in 2024. Our improving long-term growth trajectory continues to be driven by the ongoing shift in business mix towards higher growth analytics and decision tools that deliver enhanced value to our customers across market segments. Erik Engstrom, Chief Executive Officer 2024 progress RELX delivered strong revenue and profit growth in 2024. Our improving long-term growth trajectory continues to be driven by the ongoing shift in business mix towards higher growth analytics and decision tools that deliver enhanced value to our customers across market segments. We develop and deploy these tools across the company by leveraging deep customer understanding to combine leading content and data sets with powerful artificial intelligence and other technologies. This has been a key driver of the evolution of our business for well over a decade, and will remain a key driver of customer value and growth in our business for many years to come. During the year, we made further operational and strategic progress. Underlying revenue growth was 7%. Electronic revenue, representing 83% of the total, also grew 7%. Our strategy of driving continuous process innovation to manage cost growth below revenue growth led to underlying adjusted operating profit growth of 10% and an improvement in the group adjusted operating margin to 33.9% compared with 33.1% in 2023. Corporate responsibility and sustainability We performed well on our corporate responsibility priorities in 2024 and on our key metrics. Our performance was again recognised by external agencies. We continued to make progress on our unique contributions which make a positive impact on society through our products and services and through the conduct of our business. We also remained focused on improving our environmental performance year-on-year. Detailed results are available on pages 60 to 65 of this report. 2025 Outlook We continue to see positive momentum across the group, and we expect another year of strong underlying growth in revenue and adjusted operating profit, as well as strong growth in adjusted earnings per share on a constant currency basis. Erik Engstrom Chief Executive Officer |
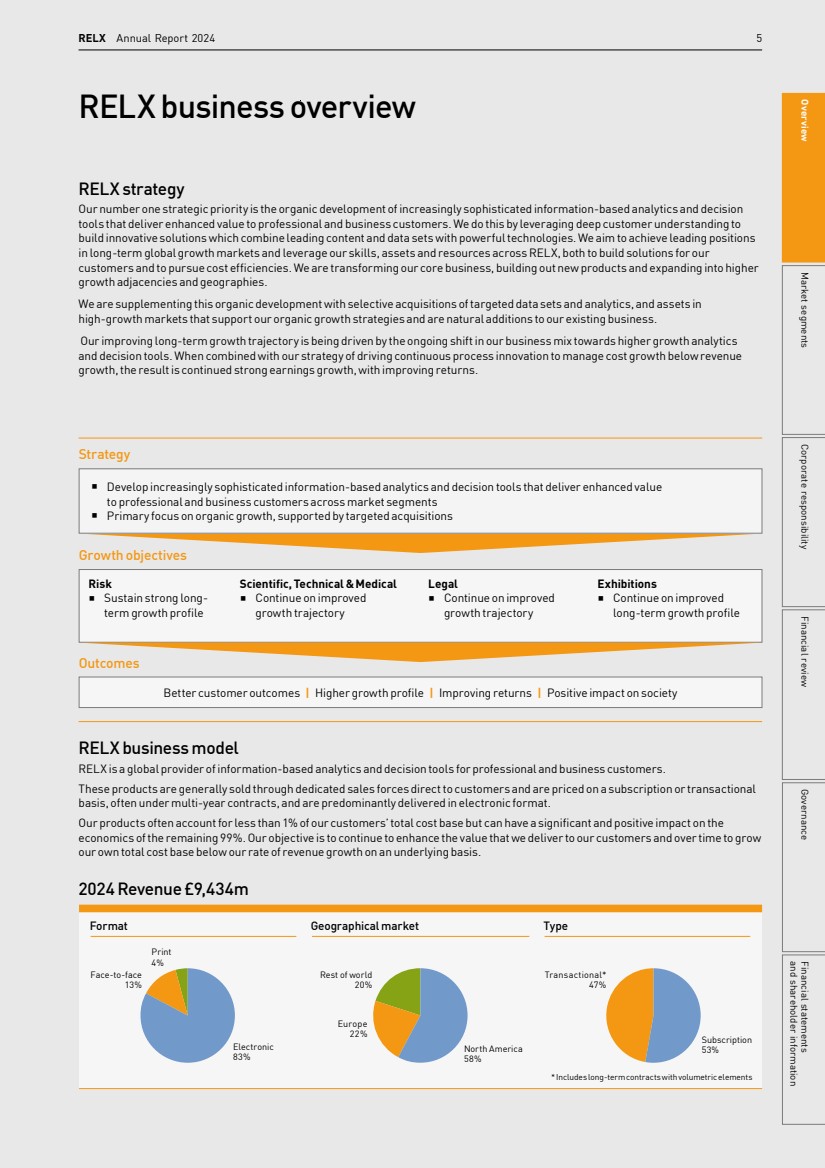
| RELX Annual Report 2024 5 RELX business overview RELX strategy Our number one strategic priority is the organic development of increasingly sophisticated information-based analytics and decision tools that deliver enhanced value to professional and business customers. We do this by leveraging deep customer understanding to build innovative solutions which combine leading content and data sets with powerful technologies. We aim to achieve leading positions in long-term global growth markets and leverage our skills, assets and resources across RELX, both to build solutions for our customers and to pursue cost efficiencies. We are transforming our core business, building out new products and expanding into higher growth adjacencies and geographies. We are supplementing this organic development with selective acquisitions of targeted data sets and analytics, and assets in high-growth markets that support our organic growth strategies and are natural additions to our existing business. Our improving long-term growth trajectory is being driven by the ongoing shift in our business mix towards higher growth analytics and decision tools. When combined with our strategy of driving continuous process innovation to manage cost growth below revenue growth, the result is continued strong earnings growth, with improving returns. RELX business model RELX is a global provider of information-based analytics and decision tools for professional and business customers. These products are generally sold through dedicated sales forces direct to customers and are priced on a subscription or transactional basis, often under multi-year contracts, and are predominantly delivered in electronic format. Our products often account for less than 1% of our customers’ total cost base but can have a significant and positive impact on the economics of the remaining 99%. Our objective is to continue to enhance the value that we deliver to our customers and over time to grow our own total cost base below our rate of revenue growth on an underlying basis. § Develop increasingly sophisticated information-based analytics and decision tools that deliver enhanced value to professional and business customers across market segments § Primary focus on organic growth, supported by targeted acquisitions Strategy Better customer outcomes | Higher growth profile | Improving returns | Positive impact on society Outcomes Risk § Sustain strong long-term growth profile Scientific, Technical & Medical § Continue on improved growth trajectory Legal § Continue on improved growth trajectory Growth objectives Exhibitions § Continue on improved long-term growth profile 2024 Revenue £9,434m Format Geographical market Type Print 4% Face-to-face 13% Electronic 83% Rest of world 20% Europe 22% North America 58% Transactional* 47% Subscription 53% * Includes long-term contracts with volumetric elements Market segments Governance and shareholder information Financial statements Financial review Corporate responsibility Overview |
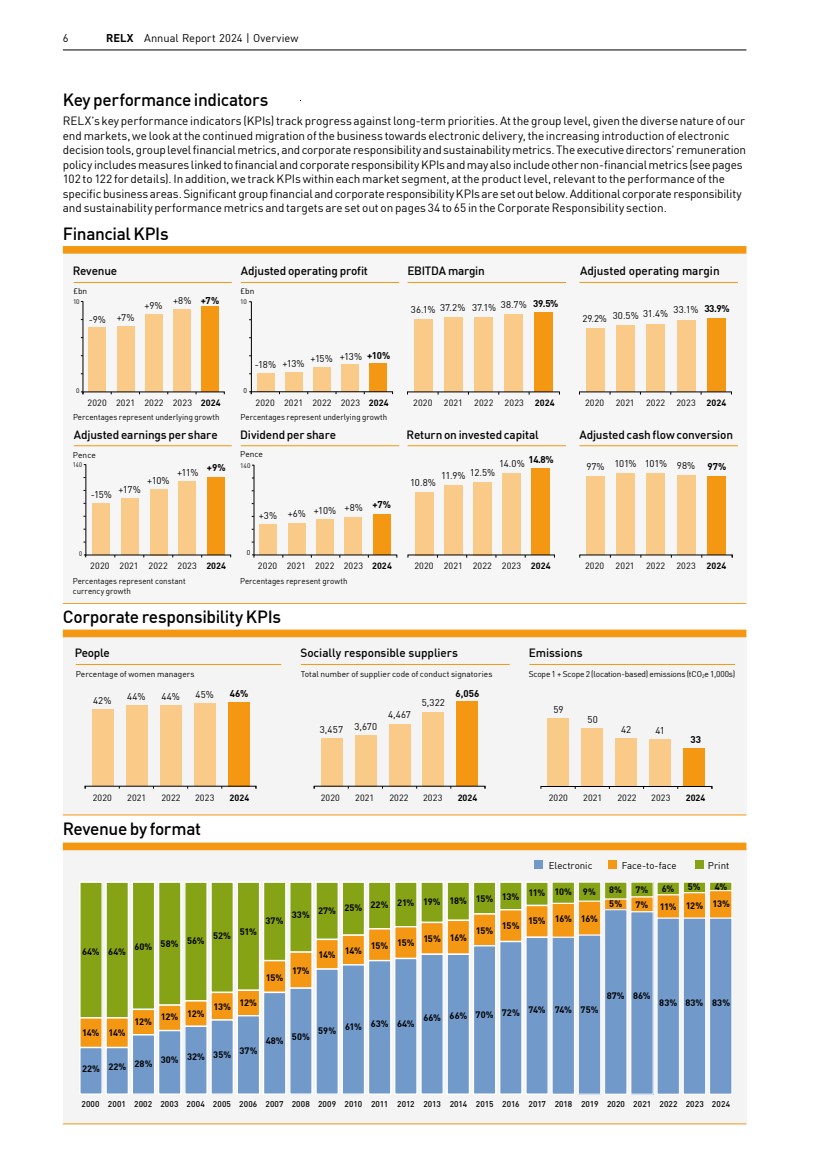
| Key performance indicators RELX’s key performance indicators (KPIs) track progress against long-term priorities. At the group level, given the diverse nature of our end markets, we look at the continued migration of the business towards electronic delivery, the increasing introduction of electronic decision tools, group level financial metrics, and corporate responsibility and sustainability metrics. The executive directors’ remuneration policy includes measures linked to financial and corporate responsibility KPIs and may also include other non-financial metrics (see pages 102 to 122 for details). In addition, we track KPIs within each market segment, at the product level, relevant to the performance of the specific business areas. Significant group financial and corporate responsibility KPIs are set out below. Additional corporate responsibility and sustainability performance metrics and targets are set out on pages 34 to 65 in the Corporate Responsibility section. 6 RELX Annual Report 2024 | Overview Electronic Face-to-face Print 2000 2001 2002 2003 2004 2005 2006 2007 2008 2009 2010 2011 2012 2013 2014 2015 2016 2017 2018 22% 22% 28% 30% 32% 35% 37% 48% 50% 59% 61% 63% 64% 66% 66% 70% 74% 74% 14% 14% 12% 12% 12% 13% 12% 15% 17% 14% 14% 15% 15% 15% 16% 15% 15% 64% 64% 60% 58% 56% 52% 51% 37% 33% 27% 25% 22% 21% 19% 18% 15% 11% 16% 10% 2019 2020 2021 2022 2023 2024 75% 16% 9% 86% 7% 7% 83% 12% 5% 83% 13% 4% 83% 11% 6% 87% 5% 8% 72% 15% 13% 2020 2021 2022 2023 2024 2020 2021 2022 2023 2024 2020 2021 2022 2023 2024 3,457 59 50 3,670 Percentage of women managers Total number of supplier code of conduct signatories Scope 1 + Scope 2 (location-based) emissions (tCO2e 1,000s) 42 42% 44% 44% 45% 46% 6,056 33 4,467 5,322 41 People Socially responsible suppliers Emissions 2020 2021 2022 2023 2024 2020 2021 2022 2023 2024 2020 2021 2022 2023 2024 2020 2021 2022 2023 2024 2020 2021 2022 2023 2024 2020 2021 2022 2023 2024 2020 2021 2022 2023 2024 2020 2021 2022 2023 2024 -9% +7% Percentages represent underlying growth £bn 10 0 +9% +8% +7% +10% 39.5% Revenue -18% +13% Percentages represent underlying growth £bn 10 0 +15% +13% Adjusted operating profit 10.8% 11.9% 12.5% 14.0% Return on invested capital 97% 101% 101% 98% 97% 14.8% +7% +9% Adjusted cash flow conversion -15% Percentages represent constant currency growth Pence 140 0 +17% +10% +11% Adjusted earnings per share +3% +6% Percentages represent growth Pence 140 0 +10% +8% Dividend per share 36.1% 37.2% 37.1% 38.7% EBITDA margin 29.2% 30.5% 31.4% 33.1% 33.9% Adjusted operating margin Financial KPIs Corporate responsibility KPIs Revenue by format |
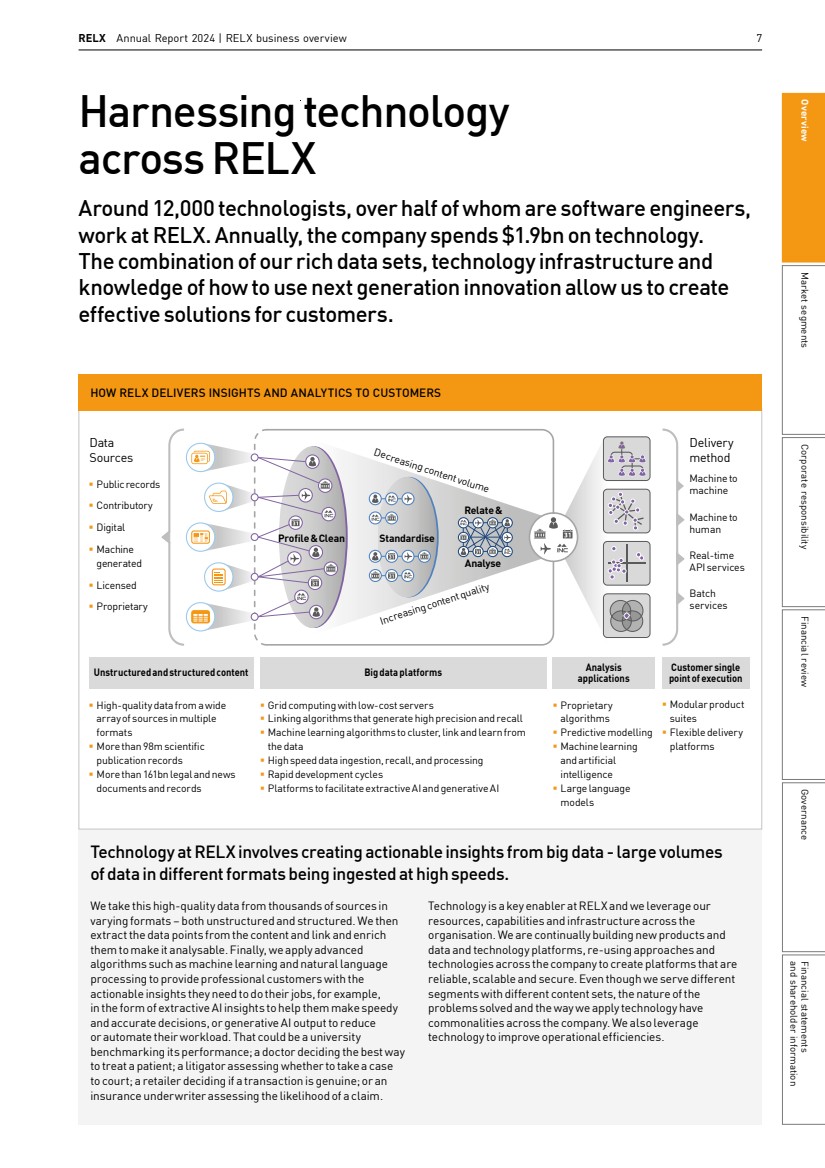
| RELX Annual Report 2024 | RELX business overview 7 Technology at RELX involves creating actionable insights from big data - large volumes of data in different formats being ingested at high speeds. We take this high-quality data from thousands of sources in varying formats – both unstructured and structured. We then extract the data points from the content and link and enrich them to make it analysable. Finally, we apply advanced algorithms such as machine learning and natural language processing to provide professional customers with the actionable insights they need to do their jobs, for example, in the form of extractive AI insights to help them make speedy and accurate decisions, or generative AI output to reduce or automate their workload. That could be a university benchmarking its performance; a doctor deciding the best way to treat a patient; a litigator assessing whether to take a case to court; a retailer deciding if a transaction is genuine; or an insurance underwriter assessing the likelihood of a claim. Technology is a key enabler at RELX and we leverage our resources, capabilities and infrastructure across the organisation. We are continually building new products and data and technology platforms, re-using approaches and technologies across the company to create platforms that are reliable, scalable and secure. Even though we serve different segments with different content sets, the nature of the problems solved and the way we apply technology have commonalities across the company. We also leverage technology to improve operational efficiencies. Harnessing technology across RELX Around 12,000 technologists, over half of whom are software engineers, work at RELX. Annually, the company spends $1.9bn on technology. The combination of our rich data sets, technology infrastructure and knowledge of how to use next generation innovation allow us to create effective solutions for customers. HOW RELX DELIVERS INSIGHTS AND ANALYTICS TO CUSTOMERS § High-quality data from a wide array of sources in multiple formats § More than 98m scientific publication records § More than 161bn legal and news documents and records § Public records § Contributory § Digital § Machine generated § Licensed § Proprietary § Grid computing with low-cost servers § Linking algorithms that generate high precision and recall § Machine learning algorithms to cluster, link and learn from the data § High speed data ingestion, recall, and processing § Rapid development cycles § Platforms to facilitate extractive AI and generative AI § Proprietary algorithms § Predictive modelling § Machine learning and artificial intelligence § Large language models § Modular product suites § Flexible delivery platforms Unstructured and structured content Big data platforms Analysis applications Customer single point of execution Machine to machine Machine to human Real-time API services Batch services Profile & Clean Standardise Relate & Analyse Decreasing content volume Increasing content quality Data Sources Delivery method Market segments Governance and shareholder information Financial statements Financial review Corporate responsibility Overview |
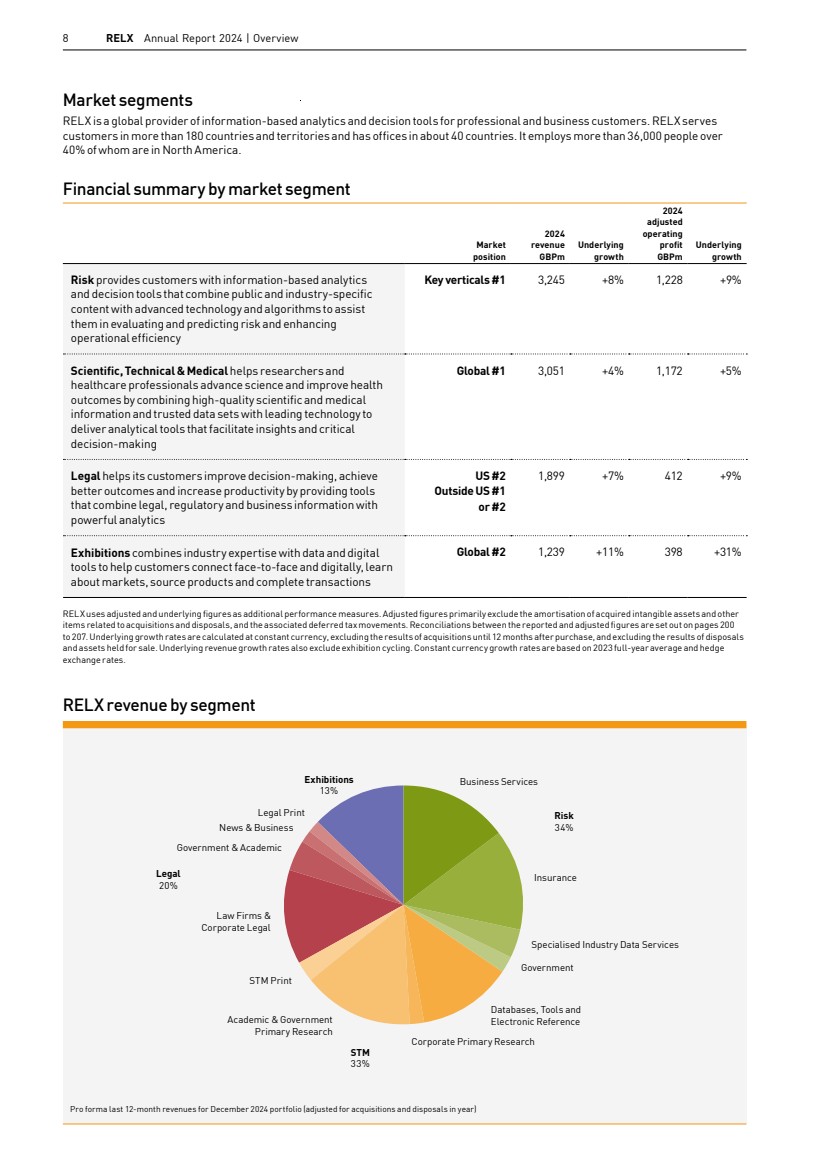
| 8 RELX Annual Report 2024 | Overview Pro forma last 12-month revenues for December 2024 portfolio (adjusted for acquisitions and disposals in year) Business Services Insurance Specialised Industry Data Services Government Academic & Government Primary Research Corporate Primary Research Databases, Tools and Electronic Reference STM Print Law Firms & Corporate Legal Government & Academic News & Business Legal Print Exhibitions 13% Risk 34% Legal 20% STM 33% Market segments RELX is a global provider of information-based analytics and decision tools for professional and business customers. RELX serves customers in more than 180 countries and territories and has offices in about 40 countries. It employs more than 36,000 people over 40% of whom are in North America. RELX revenue by segment Financial summary by market segment Market position 2024 revenue GBPm Underlying growth 2024 adjusted operating profit GBPm Underlying growth Risk provides customers with information-based analytics and decision tools that combine public and industry-specific content with advanced technology and algorithms to assist them in evaluating and predicting risk and enhancing operational efficiency Key verticals #1 3,245 +8% 1,228 +9% Scientific, Technical & Medical helps researchers and healthcare professionals advance science and improve health outcomes by combining high-quality scientific and medical information and trusted data sets with leading technology to deliver analytical tools that facilitate insights and critical decision-making Global #1 3,051 +4% 1,172 +5% Legal helps its customers improve decision-making, achieve better outcomes and increase productivity by providing tools that combine legal, regulatory and business information with powerful analytics US #2 Outside US #1 or #2 1,899 +7% 412 +9% Exhibitions combines industry expertise with data and digital tools to help customers connect face-to-face and digitally, learn about markets, source products and complete transactions Global #2 1,239 +11% 398 +31% RELX uses adjusted and underlying figures as additional performance measures. Adjusted figures primarily exclude the amortisation of acquired intangible assets and other items related to acquisitions and disposals, and the associated deferred tax movements. Reconciliations between the reported and adjusted figures are set out on pages 200 to 207. Underlying growth rates are calculated at constant currency, excluding the results of acquisitions until 12 months after purchase, and excluding the results of disposals and assets held for sale. Underlying revenue growth rates also exclude exhibition cycling. Constant currency growth rates are based on 2023 full-year average and hedge exchange rates. |
| RELX Annual Report 2024 | Market segments 9 Market segments In this section 10 Risk 16 Scientific, Technical & Medical 22 Legal 28 Exhibitions Market segments Overview Corporate responsibility Financial review Governance and shareholder information Financial statements |
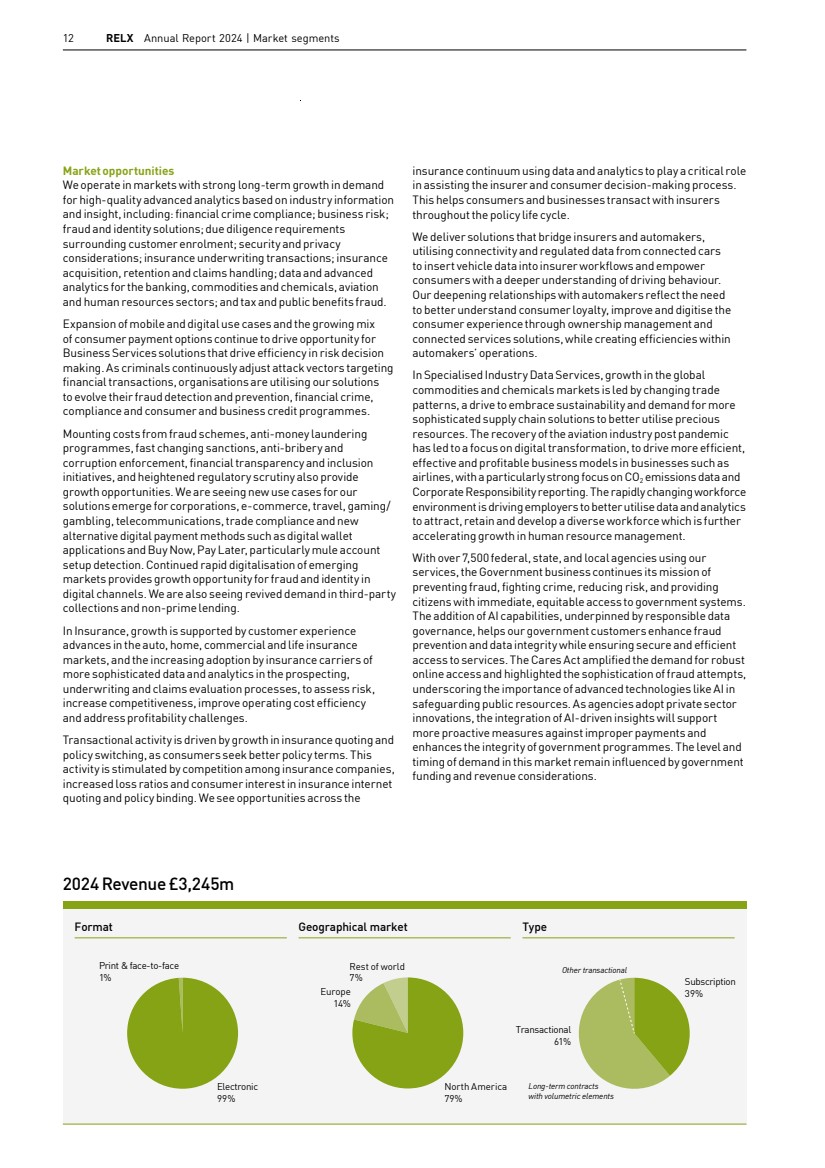
| 10 RELX Annual Report 2024 | Market segments Business overview Risk provides customers with information-based analytics and decision tools that combine public and industry-specific content with advanced technology and algorithms to assist them in evaluating and predicting risk and enhancing operational efficiency. LexisNexis Risk Solutions, headquartered in Alpharetta, Georgia, has principal operations in California, Florida, Illinois, New York and Ohio in North America as well as London and Paris in Europe, São Paulo in Latin America and Beijing and Singapore in Asia Pacific. It has 11,000 employees and serves customers in more than 180 countries and territories. Revenues for the year ended 31 December 2024 were £3,245m, compared with £3,133m in 2023 and £2,909m in 2022. In 2024, 79% of revenue came from North America, 14% from Europe and the remaining 7% from the rest of the world. Subscription revenue represented 39% of the total and transactional revenues, including long-term contracts with volumetric elements, represented 61%. LexisNexis Risk Solutions comprises the following market-facing industry/sector verticals: Business Services, Insurance, Specialised Industry Data Services, and Government Solutions. Business Services, representing around 45% of revenue, enables global financial transparency and inclusion by providing holistic and actionable insights for all risk and compliance segments. We help customers address some of today’s greatest societal challenges, including identifying fraud, cybercrime, bribery, corruption, global terrorism, trafficking and abusive practices. The combination of our proprietary insights and advanced analytics powered by Artificial Intelligence (AI) and Machine Learning (ML) delivers actionable intelligence to customers to help improve decisions and operational efficiency. The cornerstone of our growth strategy in Business Services is maximising penetration in our current markets across our customers’ workflows and through international expansion. In 2024, Business Services further established itself as a platform provider with industry analyst recognition for both its Dynamic Decision Platform and RiskNarrative platform. Across solutions we were recognised as leaders in 19 industry analyst reports, including Juniper Research for both Anti-Money Laundering Systems and Global Fraud Detection and Prevention in Banking, Chartis Research for Watchlist and Adverse Media Monitoring Solutions, Javelin for Authentication and Identity-Proofing, Forrester Research for Enterprise Fraud Management Solutions and Celent for Watchlist Screening. In Q4 2024, LexisNexis Risk Solutions signed a definitive agreement to acquire IDVerse, a provider of AI-powered automated document authentication and fraud detection solutions. Closing is expected in early 2025. Business Services has introduced a number of product enhancements and launches, such as in the UK with ThreatMetrix Payment Defense, a ML model designed to tackle the growing risk of scams across financial industries. Business Services UK modernised its portfolio of tracing, identity authentication and identity data consolidation solutions. We launched three new Firco Continuity modules that focus on reducing false positive alerts and time spent on manual alert reviews and enabling customers to test configurations in a secure environment. We help customers make better decisions and manage risk. We help detect and prevent online fraud and money laundering and deliver insight to insurance companies. We provide digital tools that help industries from aviation to banking improve their operations. § We do business with 91% of the Fortune 100; 85% of the Fortune 500; nine of the world’s top ten banks and 23 of the world’s top 25 insurers § We work with 99% of US personal auto and home insurers, and the top 25 US life and commercial auto insurers, offering a view on 231m+ US insurance purchase decisions a year § The LexisNexis Digital Identity Network analyses more than 345m transactions daily and more than 121bn transactions annually § More than 150,000 websites and mobile applications around the world implement the LexisNexis Digital Identity Network § Our solutions detected around 690m human initiated fraud attacks and more than 2bn automated bot attacks for customers in 2024 § We delivered more than 511m US consumer credit assessments in 2024 § 88% of new US auto insurance policies issued to consumers in 2024 benefited from our products § More than 7,500 federal, state and local government agencies use our solutions to prevent fraud and allow citizens faster access to important government systems, maintain programme integrity, reduce risk and fight crime § ICIS provides actionable intelligence for over 330 commodity markets connecting the global chemical and energy industries, serving 19 of the top 20 chemical companies § Cirium monitors more than 99% of commercial flights worldwide, supplying data and analytics to the majority of the top 100 airlines, which account for over 90% of global airline traffic in 2024 § Brightmine serves more than 34,000 HR professionals in 9,300+ organisations Risk |
| RELX Annual Report 2024 | Risk 11 Insurance, representing just under 40% of revenue, provides comprehensive data, analytics and decision tools for personal auto and home, commercial and life insurance carriers to improve critical aspects of their business. Information solutions help insurers assess risks; improve customer acquisition, experience and retention; identify and intercept fraud; increase efficiency in pricing and underwriting insurance policies; and settle claims in the US and other key markets. Industry-leading products provide real-time information on policy holders, identify insurance coverage details and lapses in coverage, and give insurers access to vehicle and behaviour-centric data, standardised across automakers for the underwriting and claims processes. Innovative decision tools seamlessly integrate into an insurer’s workflow and are delivered through a single point of access within an insurer’s infrastructure. Insurance solutions drive more consistency and efficiency in claims, providing data and decisions for challenging total losses at first notice of loss and throughout the claim life cycle. Insurance solutions provide comprehensive interior and exterior data for home and commercial property insurers and offers AI-enabled insights to fast-track decision-making for new business or renewal underwriting and claims processes. Life insurers use predictive models, public and motor vehicle records to better understand mortality risk, reduce misrepresentation and make life insurance more accessible. In 2024 we integrated and innovated Human API’s proprietary, consumer-driven health data platform and launched evidence-based ordering of behavioural data, enabling more efficient underwriting processes for life insurers. Specialised Industry Data Services, representing just over 10% of revenue, provides critical business intelligence, data, software and analytics solutions to professionals in many of the world’s largest industries. These solutions include: ICIS, an independent source of data and intelligence for the global commodities, chemicals and energy markets; Cirium, the aviation analytics company; Brightmine, a compliance, benchmarking and pay-equity data and analytics business driving global HR topics; and Nextens, a provider of workflow solutions, content and analytics for tax professionals. Government, representing just over 5% of revenue, has helped US agencies shift from identity verification to authentication to confront fraud, waste, and abuse. Front-end identity authentication is central to how the government dispenses hundreds of billions of dollars in entitlements, stimulus, benefits and contracts to people and businesses. LexisNexis Accurint AI Insights is a new, first-to-market AI solutionfor public safety, designed specifically for law enforcement. This advanced tool automates crime trend identification, providing agencies with rapid analysis and actionable intelligence. By enabling proactive responses to emerging threats, Accurint AI Insights streamlines investigative processes and enhances decision-making. The platform offers immediate access to identity and authentication analytics, combining advanced AI with extensive data expertise to support public safety agencies in protecting communities with data-driven insights. Financial Crime Compliance Portfolio Platforms Portfolio Our integrated financial crime compliance offerings deliver comprehensive solutions for addressing financial crime risk. Business Services released three new modules within Firco Continuity. These include the Automated Hit Qualifier, which enables automatic remediation of recurring false positive hits across transactions; the Entity Resolution Filter, which reduces the number of alerts needing manual review and accelerates the handling of true alerts; and the Simulation Manager, which allows clients to test and refine customised configurations in a secure sandbox environment Our platforms provide unified anti-money laundering, fraud, compliance and risk management capabilities with simple integration for customers. We launched several new apps and capabilities to improve our guided image capture for document authentication on RiskNarrative. Platforms added a Model Performance Report to its Dynamic Decisioning Platform, which enables customers to compare the performance of different ThreatMetrix models. The platform generates Model Governance documentation automatically to help ensure transparency and regulatory compliance Fraud and Identity Management Portfolio LexisNexis Claims Compass LexisNexis Total Property Understanding We provide digital, physical, device and behavioural risk signals to help organisations better assess consumers, prevent fraudulent transactions, improve operational efficiencies and protect accounts while minimising friction for trusted users. Fraud and Identity launched additional behavioural biometrics capabilities in 2023 with the completed integration of BehavioSec Our data analytics platform delivers LexisNexis Claims Datafill, VINsights, Carrier Discovery, Claims Clarity and LexisNexis Police Records solutions directly into insurer workflows to improve the claims process from first notice of loss, triage, investigation and resolution, through recovery Our complete property risk assessment solution helps home insurance underwriters more easily identify properties with risk or coverage opportunities and survey those priority properties using consumer-friendly, configurable AI-driven property assessment technology that delivers actionable insights into the underwriting workflow For more information visit relx.com Market segments Governance and shareholder information Financial statements Financial review Corporate responsibility Overview |
| 12 RELX Annual Report 2024 | Market segments Electronic 99% Print & face-to-face Rest of world 7% Europe 14% North America 79% Subscription 39% Other transactional Format Geographical market Type 1% Transactional 61% Long-term contracts with volumetric elements 2024 Revenue £3,245m insurance continuum using data and analytics to play a critical role in assisting the insurer and consumer decision-making process. This helps consumers and businesses transact with insurers throughout the policy life cycle. We deliver solutions that bridge insurers and automakers, utilising connectivity and regulated data from connected cars to insert vehicle data into insurer workflows and empower consumers with a deeper understanding of driving behaviour. Our deepening relationships with automakers reflect the need to better understand consumer loyalty, improve and digitise the consumer experience through ownership management and connected services solutions, while creating efficiencies within automakers’ operations. In Specialised Industry Data Services, growth in the global commodities and chemicals markets is led by changing trade patterns, a drive to embrace sustainability and demand for more sophisticated supply chain solutions to better utilise precious resources. The recovery of the aviation industry post pandemic has led to a focus on digital transformation, to drive more efficient, effective and profitable business models in businesses such as airlines, with a particularly strong focus on CO2 emissions data and Corporate Responsibility reporting. The rapidly changing workforce environment is driving employers to better utilise data and analytics to attract, retain and develop a diverse workforce which is further accelerating growth in human resource management. With over 7,500 federal, state, and local agencies using our services, the Government business continues its mission of preventing fraud, fighting crime, reducing risk, and providing citizens with immediate, equitable access to government systems. The addition of AI capabilities, underpinned by responsible data governance, helps our government customers enhance fraud prevention and data integrity while ensuring secure and efficient access to services. The Cares Act amplified the demand for robust online access and highlighted the sophistication of fraud attempts, underscoring the importance of advanced technologies like AI in safeguarding public resources. As agencies adopt private sector innovations, the integration of AI-driven insights will support more proactive measures against improper payments and enhances the integrity of government programmes. The level and timing of demand in this market remain influenced by government funding and revenue considerations. Market opportunities We operate in markets with strong long-term growth in demand for high-quality advanced analytics based on industry information and insight, including: financial crime compliance; business risk; fraud and identity solutions; due diligence requirements surrounding customer enrolment; security and privacy considerations; insurance underwriting transactions; insurance acquisition, retention and claims handling; data and advanced analytics for the banking, commodities and chemicals, aviation and human resources sectors; and tax and public benefits fraud. Expansion of mobile and digital use cases and the growing mix of consumer payment options continue to drive opportunity for Business Services solutions that drive efficiency in risk decision making. As criminals continuously adjust attack vectors targeting financial transactions, organisations are utilising our solutions to evolve their fraud detection and prevention, financial crime, compliance and consumer and business credit programmes. Mounting costs from fraud schemes, anti-money laundering programmes, fast changing sanctions, anti-bribery and corruption enforcement, financial transparency and inclusion initiatives, and heightened regulatory scrutiny also provide growth opportunities. We are seeing new use cases for our solutions emerge for corporations, e-commerce, travel, gaming/ gambling, telecommunications, trade compliance and new alternative digital payment methods such as digital wallet applications and Buy Now, Pay Later, particularly mule account setup detection. Continued rapid digitalisation of emerging markets provides growth opportunity for fraud and identity in digital channels. We are also seeing revived demand in third-party collections and non-prime lending. In Insurance, growth is supported by customer experience advances in the auto, home, commercial and life insurance markets, and the increasing adoption by insurance carriers of more sophisticated data and analytics in the prospecting, underwriting and claims evaluation processes, to assess risk, increase competitiveness, improve operating cost efficiency and address profitability challenges. Transactional activity is driven by growth in insurance quoting and policy switching, as consumers seek better policy terms. This activity is stimulated by competition among insurance companies, increased loss ratios and consumer interest in insurance internet quoting and policy binding. We see opportunities across the |
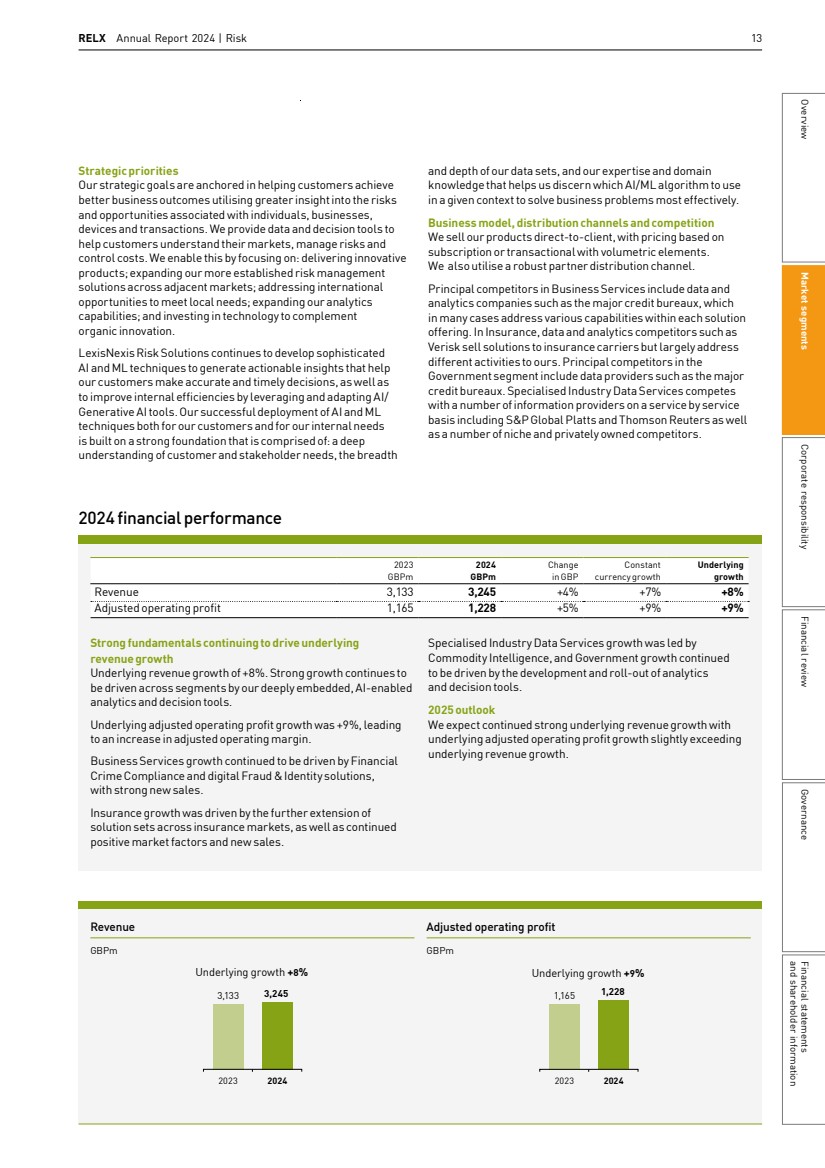
| RELX Annual Report 2024 | Risk 13 Revenue 2024 3,133 3,245 Underlying growth +8% 2023 GBPm Adjusted operating profit 2024 1,165 Underlying growth +9% 2023 GBPm 1,228 Strong fundamentals continuing to drive underlying revenuegrowth Underlying revenue growth of +8%. Strong growth continues to be driven across segments by our deeply embedded, AI-enabled analytics and decision tools. Underlying adjusted operating profit growth was +9%, leading to an increase in adjusted operating margin. Business Services growth continued to be driven by Financial Crime Compliance and digital Fraud & Identity solutions, with strong new sales. Insurance growth was driven by the further extension of solution sets across insurance markets, as well as continued positive market factors and new sales. Specialised Industry Data Services growth was led by Commodity Intelligence, and Government growth continued to be driven by the development and roll-out of analytics and decision tools. 2025 outlook We expect continued strong underlying revenue growth with underlying adjusted operating profit growth slightly exceeding underlying revenue growth. 2024 financial performance 2023 GBPm 2024 GBPm Change in GBP Constant currency growth Underlying growth Revenue 3,133 3,245 +4% +7% +8% Adjusted operating profit 1,165 1,228 +5% +9% +9% Strategic priorities Our strategic goals are anchored in helping customers achieve better business outcomes utilising greater insight into the risks and opportunities associated with individuals, businesses, devices and transactions. We provide data and decision tools to help customers understand their markets, manage risks and control costs. We enable this by focusing on: delivering innovative products; expanding our more established risk management solutions across adjacent markets; addressing international opportunities to meet local needs; expanding our analytics capabilities; and investing in technology to complement organic innovation. LexisNexis Risk Solutions continues to develop sophisticated AI and ML techniques to generate actionable insights that help our customers make accurate and timely decisions, as well as to improve internal efficiencies by leveraging and adapting AI/ Generative AI tools. Our successful deployment of AI and ML techniques both for our customers and for our internal needs is built on a strong foundation that is comprised of: a deep understanding of customer and stakeholder needs, the breadth and depth of our data sets, and our expertise and domain knowledge that helps us discern which AI/ML algorithm to use in a given context to solve business problems most effectively. Business model, distribution channels and competition We sell our products direct-to-client, with pricing based on subscription or transactional with volumetric elements. We also utilise a robust partner distribution channel. Principal competitors in Business Services include data and analytics companies such as the major credit bureaux, which in many cases address various capabilities within each solution offering. In Insurance, data and analytics competitors such as Verisk sell solutions to insurance carriers but largely address different activities to ours. Principal competitors in the Government segment include data providers such as the major credit bureaux. Specialised Industry Data Services competes with a number of information providers on a service by service basis including S&P Global Platts and Thomson Reuters as well as a number of niche and privately owned competitors. Market segments Governance and shareholder information Financial statements Financial review Corporate responsibility Overview |
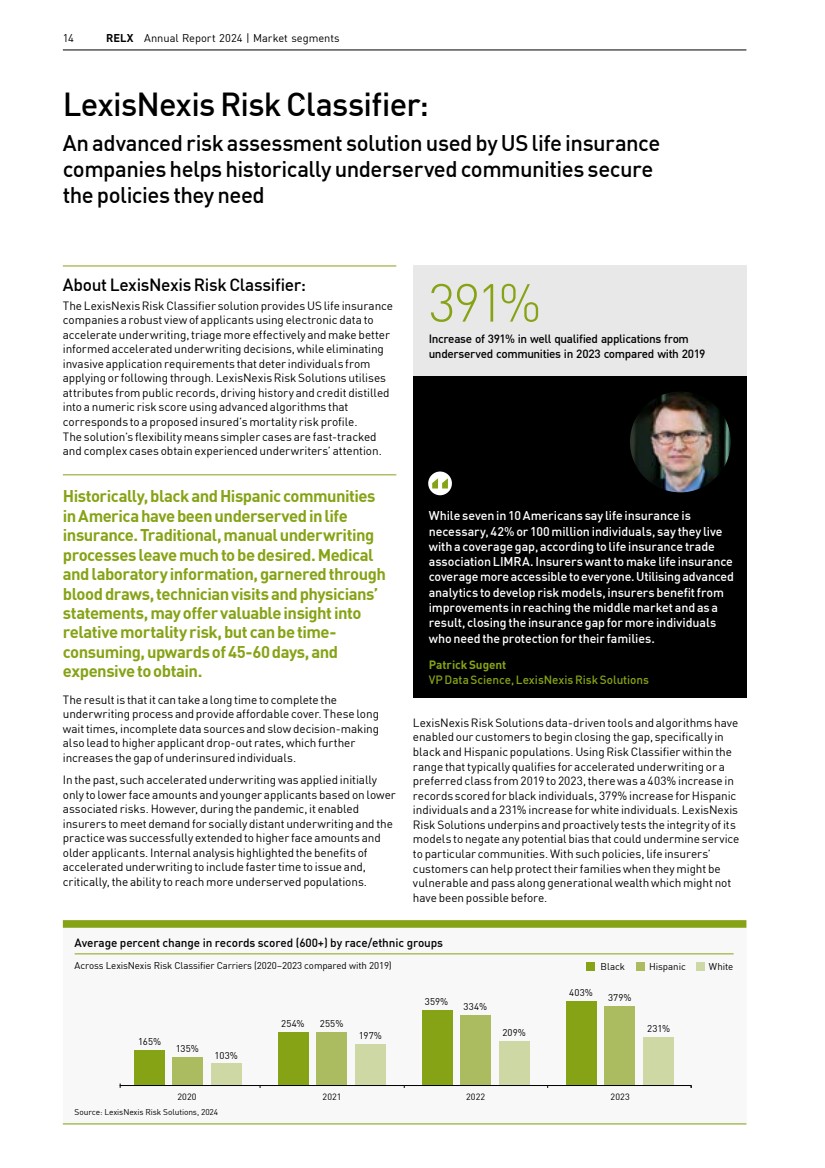
| 391% Increase of 391% in well qualified applications from underserved communities in 2023 compared with 2019 Average percent change in records scored (600+) by race/ethnic groups 165% 135% 103% 254% 197% 255% 359% 209% 334% 403% 231% 379% 2020 2021 2022 2023 Across LexisNexis Risk Classifier Carriers (2020–2023 compared with 2019) Black Hispanic White Source: LexisNexis Risk Solutions, 2024 14 RELX Annual Report 2024 | Market segments About LexisNexis Risk Classifier: The LexisNexis Risk Classifier solution provides US life insurance companies a robust view of applicants using electronic data to accelerate underwriting, triage more effectively and make better informed accelerated underwriting decisions, while eliminating invasive application requirements that deter individuals from applying or following through. LexisNexis Risk Solutions utilises attributes from public records, driving history and credit distilled into a numeric risk score using advanced algorithms that corresponds to a proposed insured’s mortality risk profile. The solution’s flexibility means simpler cases are fast-tracked and complex cases obtain experienced underwriters’ attention. Historically, black and Hispanic communities inAmerica have been underserved in life insurance. Traditional, manual underwriting processes leave much to be desired. Medical and laboratory information, garnered through blood draws, technician visits and physicians’ statements, may offer valuable insight into relative mortality risk, but can be time-consuming, upwards of 45-60 days, and expensive to obtain. The result is that it can take a long time to complete the underwriting process and provide affordable cover. These long wait times, incomplete data sources and slow decision-making also lead to higher applicant drop-out rates, which further increases the gap of underinsured individuals. In the past, such accelerated underwriting was applied initially only to lower face amounts and younger applicants based on lower associated risks. However, during the pandemic, it enabled insurers to meet demand for socially distant underwriting and the practice was successfully extended to higher face amounts and older applicants. Internal analysis highlighted the benefits of accelerated underwriting to include faster time to issue and, critically, the ability to reach more underserved populations. LexisNexis Risk Classifier: An advanced risk assessment solution used by US life insurance companies helps historically underserved communities secure the policies they need LexisNexis Risk Solutions data-driven tools and algorithms have enabled our customers to begin closing the gap, specifically in black and Hispanic populations. Using Risk Classifier within the range that typically qualifies for accelerated underwriting or a preferred class from 2019 to 2023, there was a 403% increase in records scored for black individuals, 379% increase for Hispanic individuals and a 231% increase for white individuals. LexisNexis Risk Solutions underpins and proactively tests the integrity of its models to negate any potential bias that could undermine service to particular communities. With such policies, life insurers’ customers can help protect their families when they might be vulnerable and pass along generational wealth which might not have been possible before. While seven in 10 Americans say life insurance is necessary, 42% or 100 million individuals, say they live with a coverage gap, according to life insurance trade association LIMRA. Insurers want to make life insurance coverage more accessible to everyone. Utilising advanced analytics to develop risk models, insurers benefit from improvements in reaching the middle market and as a result, closing the insurance gap for more individuals who need the protection for their families. Patrick Sugent VP Data Science, LexisNexis Risk Solutions |
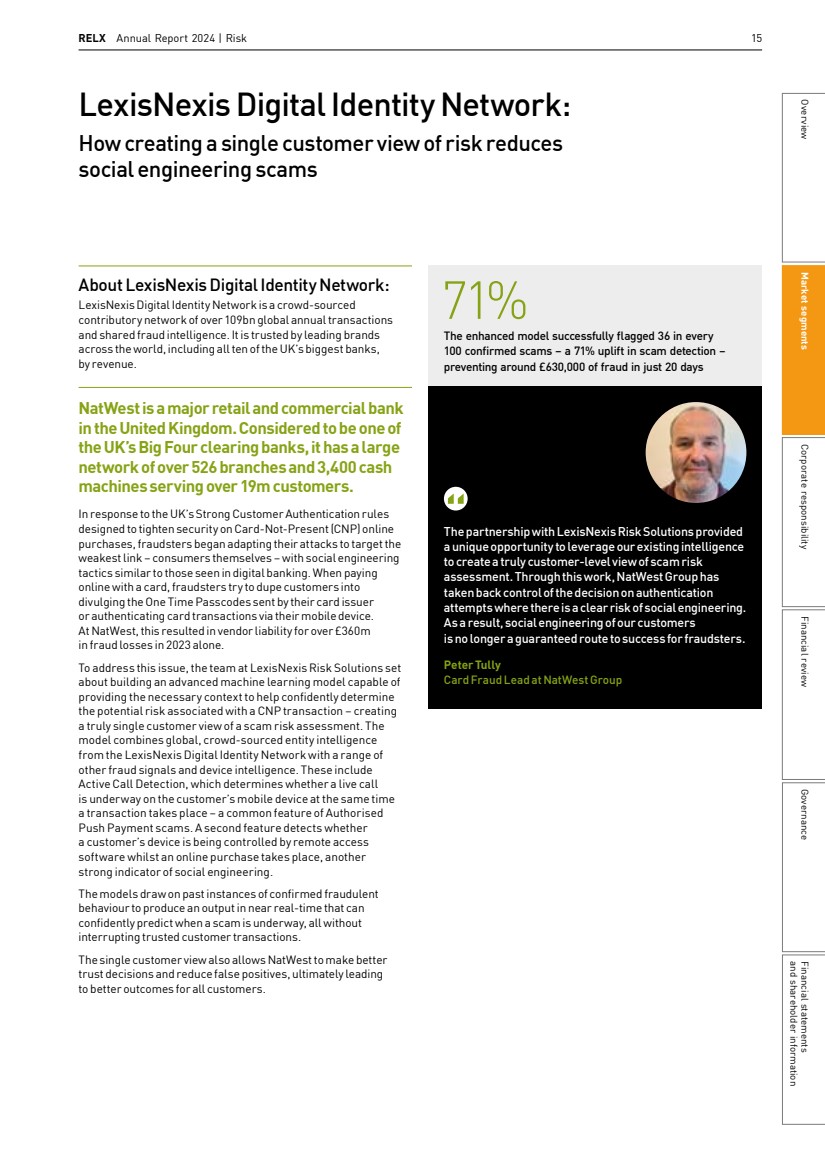
| RELX Annual Report 2024 | Risk 15 About LexisNexis Digital Identity Network: LexisNexis Digital Identity Network is a crowd-sourced contributory network of over 109bn global annual transactions and shared fraud intelligence. It is trusted by leading brands across the world, including all ten of the UK’s biggest banks, by revenue. NatWest is a major retail and commercial bank in the United Kingdom. Considered to be one of the UK’s Big Four clearing banks, it has a large network of over 526 branches and3,400 cash machines serving over 19m customers. In response to the UK’s Strong Customer Authentication rules designed to tighten security on Card-Not-Present (CNP) online purchases, fraudsters began adapting their attacks to target the weakest link – consumers themselves – with social engineering tactics similar to those seen in digital banking. When paying online with a card, fraudsters try to dupe customers into divulging theOne Time Passcodes sent by their card issuer or authenticating card transactions via their mobile device. At NatWest, this resulted in vendor liability for over £360m in fraud losses in 2023 alone. To address this issue, the team at LexisNexis Risk Solutions set about building an advanced machine learning model capable of providing the necessary context to help confidently determine the potential risk associated with a CNP transaction – creating a truly single customer view of a scam risk assessment. The model combines global, crowd-sourced entity intelligence from the LexisNexis Digital Identity Network with a range of other fraud signals and device intelligence. These include Active Call Detection, which determines whether a live call is underway on the customer’s mobile device at the same time a transaction takes place – a common feature of Authorised Push Payment scams. A second feature detects whether a customer’s device is being controlled by remote access software whilst an online purchase takes place, another strong indicator of social engineering. The models draw on past instances of confirmed fraudulent behaviour to produce an output in near real-time that can confidently predict when a scam is underway, all without interrupting trusted customer transactions. The single customer view also allows NatWest to make better trust decisions and reduce false positives, ultimately leading to better outcomes for all customers. The partnership with LexisNexis Risk Solutions provided aunique opportunity to leverage our existing intelligence to create a truly customer-level view of scam risk assessment. Through this work, NatWest Group has takenback control of the decision on authentication attempts where there is a clear risk of social engineering. As a result, social engineering of our customers isnolonger aguaranteed route tosuccess for fraudsters. Peter Tully Card Fraud Lead at NatWest Group LexisNexis Digital Identity Network: How creating a single customer view of risk reduces social engineering scams 71% The enhanced model successfully flagged 36 in every 100 confirmed scams – a 71% uplift in scam detection – preventing around £630,000 of fraud in just 20 days Market segments Governance and shareholder information Financial statements Financial review Corporate responsibility Overview |
| 16 RELX Annual Report 2024 | Market segments Business overview Scientific, Technical & Medical helps researchers and healthcare professionals advance science and improve health outcomes by combining high-quality scientific and medical information and trusted data sets with leading technology to deliver analytical tools that facilitate insights and critical decision-making. Elsevier is headquartered in Amsterdam, with principal sites in Boston, New York, Philadelphia and St. Louis in North America; London, Oxford, Frankfurt, Munich, Madrid and Paris in Europe; Beijing, Shanghai, Chennai, Delhi, Chatswood, Singapore and Tokyo in Asia Pacific, and Rio de Janeiro in South America. It has 9,700 employees with customers in over 170 countries and territories. Revenues for the year ended 31 December 2024 were £3,051m, compared with £3,062m in 2023 and £2,909m in 2022. In 2024, 46% of revenue came from North America, 22% from Europe and the remaining 32% from the rest of the world. Subscription revenue represented 74% of total revenue and transactional revenues represented 26%. Elsevier’s customers are scientists, research leaders, librarians, medical researchers, doctors, nurses, allied health professionals and students, as well as hospitals, academic and research institutions, health insurers, managed healthcare organisations, research-intensive corporations, funders, and governments. Elsevier’s services across Academic & Government, Corporate and Health markets focus on: Databases, Tools and Electronic reference; Primary Research; and Print products. In each of these markets, our objective is to be a trusted partner to the customers we serve and to be known for quality. Databases, Tools and Electronic Reference, together with Corporate Primary Research, accounts for around 45% of STM revenues, with Academic & Government Primary Research accounting for a similar amount, all in electronic format. Under 10% of revenues are derived from Print sales. Databases & Tools & Electronic Reference. Elsevier’s databases, tools and electronic reference products help customers and users solve complex problems and make critical decisions, and we are enhancing these capabilities with generative AI across all our business areas. Solutions include Engineering Village, Interfolio, Pure, SciVal, and Scopus in Academic & Government; Embase, Reaxys, and SciBite in Corporate; and ClinicalKey, ClinicalPath, Complete Anatomy, HESI, Osmosis, Shadow Health, and Sherpath for Health. Elsevier’s research intelligence portfolio of products combines quality, curated content and extensive data sets with responsible AI and large language model (LLM) technology to help researchers, academic leaders, policy-makers, funders and R&D-led corporations to generate insights, set and implement research strategies and make decisions with confidence. This portfolio integrates with and enhances the systems institutions rely on, with interoperability driven by Application Programming Interface technologies (APIs). In early 2024, Elsevier launched Scopus AI, a generative AI-enhanced research tool integrated into the Scopus platform to help academics and researchers get deeper research insights faster, navigate and understand different disciplines more easily and support interdisciplinary collaboration. For Corporate R&D, SciBite tools and the data as a service offering follow Elsevier’s ontology-led approach and support corporate R&D customers in extracting scientific insights from vast amounts of unstructured text and databases. In 2024 Elsevier launched SciBite Chat, a new AI-powered tool built atop SciBite We deliver insights that help universities, research institutions, governments and funders achieve their strategic goals. We help researchers discover and share knowledge, collaborate, and accelerate innovation. We help librarians provide trusted, high-quality information to their universities. We help innovators transform the latest knowledge into new products. We help health professionals improve patient care, and educators train the next generation of doctors and nurses. § We help ensure quality research accelerates progress for society by helping validate, improve and disseminate over 17% of the world’s scientific articles § Elsevier’s over 3,000 journals published more than 720,000 articles in 2024, from over 3.5m submitted § 243 of 244 science and economics Nobel Prize winners since 2000 have published in an Elsevier journal § ScienceDirect, the world’s largest platform dedicated to peer-reviewed primary scientific and medical research, hosts over 22m pieces of content from over 5,100 journals and over 48,000 e-books, and has over 20m monthly researchers. Its Ahrefs ranking places it as one of the Top 200 platforms on the internet § SciVal is a web-based analytics solution that provides insights into the research performance of over 24,500 academic, industry and government research institutions § Scopus is an expertly curated abstract and citation database with content from over 30,000 journals from more than 7,000 publishers to help researchers track and discover global knowledge in all fields § ClinicalKey, the flagship clinical reference platform, is used by doctors, nurses, medical students and educators at over 5,500 institutions in over 80 countries and territories § Sherpath, an adaptive teaching and learning solution for nursing students, provides personalised learning paths at over 700 institutions, supporting more than 300,000 course enrolments § Reaxys, Elsevier’s chemistry research platform, utilises data on 298m substances, 68m reactions, with over 118m documents and 44m patents § Pure is one of the world's leading commercially available Research Information Management Systems integrating a wide range of research databases and research outputs, with more than 1.1m researcher profiles and used by more than 500 of the world’s institutions Scientific, Technical & Medical |
| RELX Annual Report 2024 | Scientific, Technical & Medical 17 Search, SciBite’s award-winning platform, combining semantic search information retrieval with LLMs to interpret natural language questions and generate answers for researchers in Life Sciences. In Health, Elsevier’s clinical solutions include digital solutions for doctors, nurses, care teams and patients. Its clinical reference platform, ClinicalKey, helps doctors, nurses and students find clinically-relevant answers through a range of trusted content across specialties. This includes Elsevier’s vast collection of medical reference content, including over 2,400 clinical overviews, over 6.6m images and over 114,000 medical videos in one integrated platform. ClinicalPath Oncology presents evidence-based oncology pathways embedded in the clinical workflow, and the associated analytics, to help oncology care teams make consistent, well-informed decisions for high quality care. In 2024, Elsevier launched ClinicalKey AI, which combines the latest and most trusted medical content with generative AIto help clinicians at the point of care. ClinicalKey AI won the ‘AI Innovation Award’ in the 8th Annual MedTech Breakthrough Awards Program. Elsevier also serves students of medicine, nursing, and allied health professions. Sherpath, an adaptive teaching and learning solution, provides personalised learning paths at over 700 institutions, supporting more than 300,000 course enrolments, while ClinicalKey Student is used in over 360 medical schools globally. In 2024, Elsevier introduced Sherpath AI, a generative AI chat tool designed specifically for nursing students. The tool integrates Elsevier's nursing education content with advanced generative AI, helping students and nurse educators navigate courses, exam preparation, and the transition into clinical practice. In 2024 Elsevier also launched CompleteHeartX, the world's first heart education experience in spatial computing. The product provides healthcare learners with a unique experience to learn about the heart through interactive 3D models, images and simulations on Apple Vision Pro. In commercial healthcare, identity, claims and provider data is combined with patient information to assist healthcare providers, pharmacies and insurers in delivering improved health outcomes, ensuring accurate and complete provider data and regulatory compliance. In electronic reference, Elsevier provides authoritative reference content to scientific, technical and medical professionals. Flagship titles include Gray’s Anatomy, Nelson’s Pediatrics and Netter’s Atlas of Human Anatomy. Primary Research. Elsevier helps researchers validate, improve and disseminate their scientific findings through its more than 3,000 journals, enhancing the record of scientific knowledge by applying highest standards of quality and ensuring trusted research can be accessed, shared and built upon. Elsevier journals are the foremost publications in their field, including flagship families of journals like Cell Press and The Lancet. Research content is distributed and accessed via ScienceDirect, the world’s largest platform dedicated to peer-reviewed primary scientific and medical research. In 2024, Elsevier received more than 3.5m article submissions, which were rigorously reviewed by our in-house editorial teams in collaboration with 36,000 editors and 1.7 million expert reviewers around the world. The result is over 720,000 articles enhanced, indexed, certified, published and promoted following The world’s largest platform dedicated to peer-reviewed, full-text primary scientific, technical and medical research across all disciplines An expertly curated abstract and citation database with content from over 30,000 academic journals from 7,000 publishers to help track and enhance researcher and institutional data and discover global research in all fields. New Scopus AI helps researchers get deeper research insights faster, navigate and understand different disciplines more easily and support interdisciplinary collaboration Clinical knowledge solution helping healthcare professionals and students find the most clinically relevant answers through a wide breadth and depth of trusted content across specialities. New ClinicalKey AI combines the latest and most trusted medical content with generative artificial intelligence to help clinicians at the point of care The world’s most advanced 3D anatomy platform, Complete Anatomy is revolutionising how students, educators, health professionals and patients understand and interact with anatomy The largest chemical database, Reaxys combines over a billion chemistry data points from journals and patents with AI to support innovation in drug discovery, chemical R&D and academia. Chemists can quickly access relevant patent, substance and bioactivity insights, and an award-winning retrosynthesis tool SciBite’s semantic infrastructure, which combines machine learning with an ontology-led approach, delivers answers to business-critical questions in real-time from unstructured data. New SciBite Chat combines this information retrieval with responsible AI to interpret natural language questions and generate answers for researchers in Life Sciences For more information visit relx.com Market segments Governance and shareholder information Financial statements Financial review Corporate responsibility Overview |
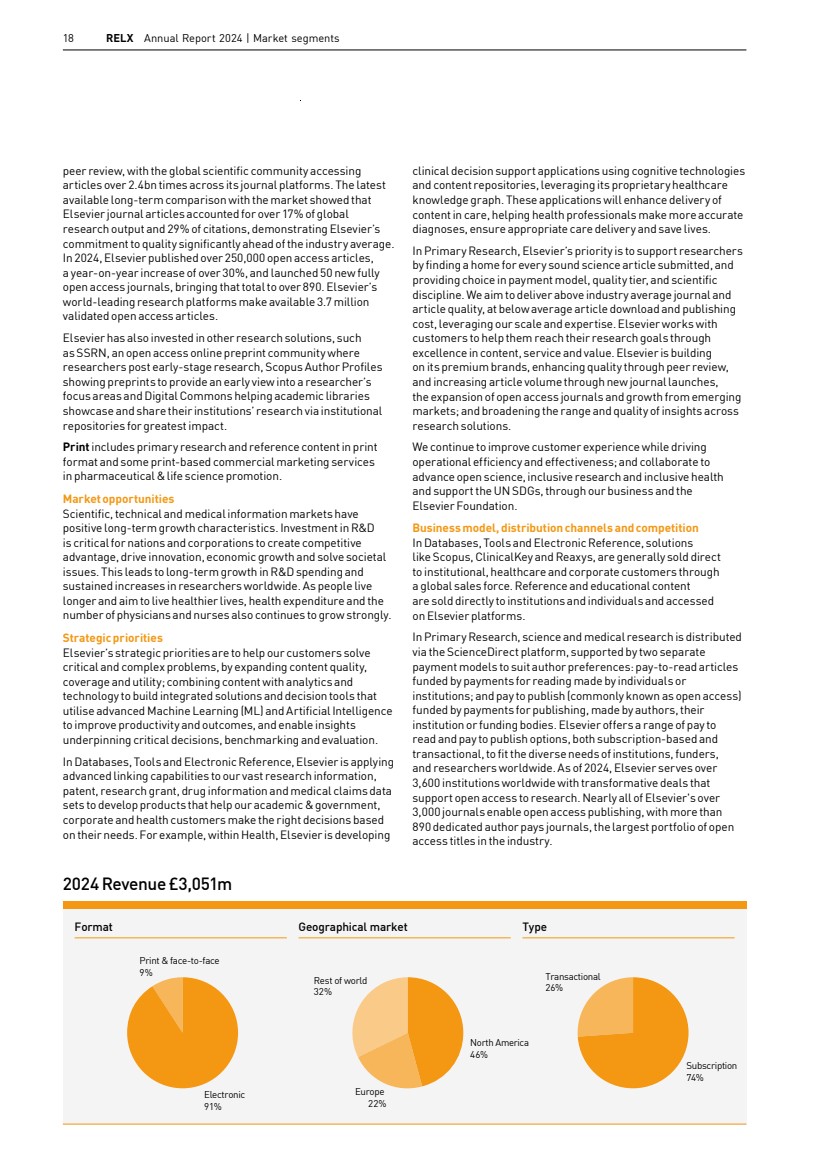
| 18 RELX Annual Report 2024 | Market segments Electronic 91% Transactional 26% Subscription 74% Format Geographical market Type Print & face-to-face 9% Rest of world 32% Europe 22% North America 46% clinical decision support applications using cognitive technologies and content repositories, leveraging its proprietary healthcare knowledge graph. These applications will enhance delivery of content in care, helping health professionals make more accurate diagnoses, ensure appropriate care delivery and save lives. In Primary Research, Elsevier’s priority is to support researchers by finding a home for every sound science article submitted, and providing choice in payment model, quality tier, and scientific discipline. We aim to deliver above industry average journal and article quality, at below average article download and publishing cost, leveraging our scale and expertise. Elsevier works with customers to help them reach their research goals through excellence in content, service and value. Elsevier is building on its premium brands, enhancing quality through peer review, and increasing article volume through new journal launches, the expansion of open access journals and growth from emerging markets; and broadening the range and quality of insights across research solutions. We continue to improve customer experience while driving operational efficiency and effectiveness; and collaborate to advance open science, inclusive research and inclusive health and support the UN SDGs, through our business and the Elsevier Foundation. Business model, distribution channels and competition In Databases, Tools and Electronic Reference, solutions likeScopus, ClinicalKey and Reaxys, are generally sold direct to institutional, healthcare and corporate customers through a global sales force. Reference and educational content are sold directly to institutions and individuals and accessed onElsevier platforms. In Primary Research, science and medical research is distributed via the ScienceDirect platform, supported by two separate payment models to suit author preferences: pay-to-read articles funded by payments for reading made by individuals or institutions; and pay to publish (commonly known as open access) funded by payments for publishing, made by authors, their institution or funding bodies. Elsevier offers a range of pay to read and pay to publish options, both subscription-based and transactional, to fit the diverse needs of institutions, funders, and researchers worldwide. As of 2024, Elsevier serves over 3,600 institutions worldwide with transformative deals that support open access to research. Nearly all of Elsevier's over 3,000 journals enable open access publishing, with more than 890 dedicated author pays journals, the largest portfolio of open access titles in the industry. peer review, with the global scientific community accessing articles over 2.4bn times across its journal platforms. The latest available long-term comparison with the market showed that Elsevier journal articles accounted for over 17% of global research output and 29% of citations, demonstrating Elsevier’s commitment to quality significantly ahead of the industry average. In 2024, Elsevier published over 250,000 open access articles, a year-on-year increase of over 30%, and launched 50 new fully open access journals, bringing that total to over 890. Elsevier’s world-leading research platforms make available 3.7million validated open access articles. Elsevier has also invested in other research solutions, such asSSRN, an open access online preprint community where researchers post early-stage research, Scopus Author Profiles showing preprints to provide an early view into a researcher’s focus areas and Digital Commons helping academic libraries showcase and share their institutions’ research via institutional repositories for greatest impact. Print includes primary research and reference content in print format and some print-based commercial marketing services in pharmaceutical & life science promotion. Market opportunities Scientific, technical and medical information markets have positive long-term growth characteristics. Investment in R&D is critical for nations and corporations to create competitive advantage, drive innovation, economic growth and solve societal issues. This leads to long-term growth in R&D spending and sustained increases in researchers worldwide. As people live longer and aim to live healthier lives, health expenditure and the number of physicians and nurses also continues to grow strongly. Strategic priorities Elsevier’s strategic priorities are to help our customers solve critical and complex problems, by expanding content quality, coverage and utility; combining content with analytics and technology to build integrated solutions and decision tools that utilise advanced Machine Learning (ML) and Artificial Intelligence to improve productivity and outcomes, and enable insights underpinning critical decisions, benchmarking and evaluation. In Databases, Tools and Electronic Reference, Elsevier is applying advanced linking capabilities to our vast research information, patent, research grant, drug information and medical claims data sets to develop products that help our academic & government, corporate and health customers make the right decisions based on their needs. For example, within Health, Elsevier is developing 2024 Revenue £3,051m |
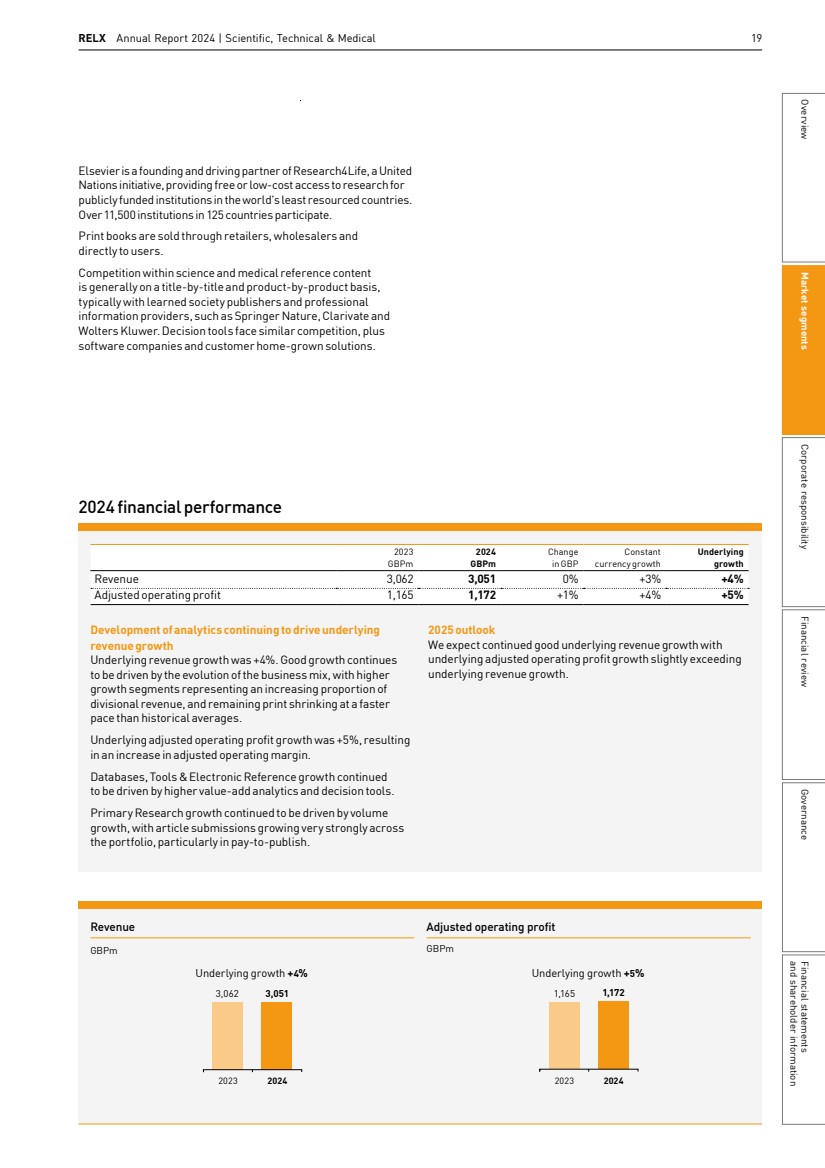
| RELX Annual Report 2024 | Scientific, Technical & Medical 19 Development of analytics continuing to drive underlying revenue growth Underlying revenue growth was +4%. Good growth continues to be driven by the evolution of the business mix, with higher growth segments representing an increasing proportion of divisional revenue, and remaining print shrinking at a faster pace than historical averages. Underlying adjusted operating profit growth was +5%, resulting in an increase in adjusted operating margin. Databases, Tools & Electronic Reference growth continued to be driven by higher value-add analytics and decision tools. Primary Research growth continued to be driven by volume growth, with article submissions growing very strongly across the portfolio, particularly in pay-to-publish. 2025 outlook We expect continued good underlying revenue growth with underlying adjusted operating profit growth slightly exceeding underlying revenue growth. 2024 financial performance 2023 GBPm 2024 GBPm Change in GBP Constant currency growth Underlying growth Revenue 3,062 3,051 0% +3% +4% Adjusted operating profit 1,165 1,172 +1% +4% +5% Revenue 2024 3,062 3,051 Underlying growth +4% 2023 GBPm Adjusted operating profit 2024 1,165 1,172 Underlying growth +5% 2023 GBPm Elsevier is a founding and driving partner of Research4Life, a United Nations initiative, providing free or low-cost access to research for publicly funded institutions in the world’s least resourced countries. Over 11,500 institutions in 125 countries participate. Print books are sold through retailers, wholesalers and directly to users. Competition within science and medical reference content is generally on a title-by-title and product-by-product basis, typically with learned society publishers and professional information providers, such as Springer Nature, Clarivate and Wolters Kluwer. Decision tools face similar competition, plus software companies and customer home-grown solutions. Market segments Governance and shareholder information Financial statements Financial review Corporate responsibility Overview |
| 20 RELX Annual Report 2024 | Market segments About ClinicalKey AI: Launched in February 2024, ClinicalKey AI is Elsevier’s new clinical decision support tool designed specifically for clinicians and powered by responsible generative artificial intelligence. Combining generative AI with the latest evidence-based medical content allows clinicians at the point of care to quickly and easily extract precise knowledge from a vast body of clinical information to help ensure their decisions are based on the latest evidence. For clinicians, access to reliable medical information is critical, especially given the overwhelming volume of complex cases they arerequiredtomanagedaily.Staffing challenges are also placing increasing demands on providers’ time, further amplifying the need for quick and secure access to the rightinformation when caring for patients. ClinicalKey AI addresses these challenges by leveraging a sophisticated conversational search interface using Retrieval Augmented Generation (RAG) to help clinicians find accurate, succinct clinical information that draws from one of the world’s largest and most trusted sources of medical information. The solution has been designed to provide high-quality curated content and constantly refreshed evidence-based research and clinical reference information to help clinicians in offering optimal patient care across a broad range of specialties and sites of care. ClinicalKey AI was developed by Elsevier alongside experts in healthcare and technology. On the healthcare side, Elsevier Health collaborated with and received input from development partners Cone Health and University of New Mexico. On the technology side, ClinicalKey AI was launched in partnership with OpenEvidence, a company specialising in AI for medicine. ClinicalKey AI’s search interface includes many features that help clinicians get the information they need quickly. It generates a summarised response based on multiple evidence-based content sources, including journal abstracts, medical reference texts, full-text articles from the Clinics series, drug information, and select government publications. When prompted, ClinicalKey AI also considers the patient context, such as comorbidities and current medications, and suggests relevant follow-up questions. By combining world-class clinical content with the latest generative AI technology, ClinicalKey AI aims to make it easier and more intuitive for clinicians to find the information they need, allowing them to focus on what truly matters, quality patient care. I think the speed of the answer and the ability to ask questions in natural language gives ClinicalKey AI a real edge over other clinical resources. To be able to ask a question in natural language and get a very prompt answer that is accurate and based on evidence-based, peer-reviewed articles is great. Using ClinicalKey AI I’ve found I’m able to find things inless than a minute or two. Barry Wendt MD CMIO, St. Elizabeth Healthcare 94% Over 65% of physicians and advanced practice providers (APPs) agreed if they had daily access to ClinicalKey AI it would enhance the quality of patient care. Of those who responded, 94% said they were highly satisfied with accuracy ClinicalKey AI: A conversational search tool to support clinical decisions |
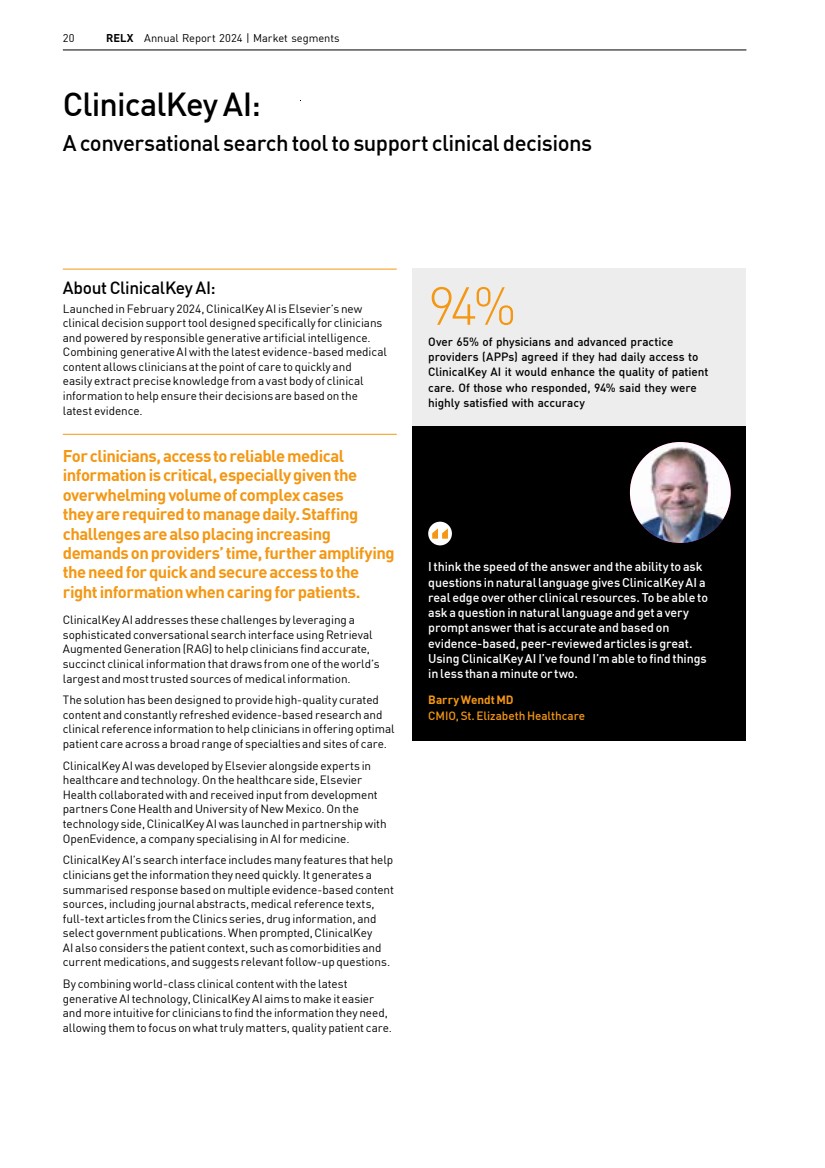
| RELX Annual Report 2024 | Scientific, Technical & Medical 21 We hope that the map and underlying data will help those interested in TIP's investments explore our work and assist researchers in finding others intheir regions or focus areas. Erwin Gianchandani, Assistant Director for Technology, Innovation andPartnerships, US National Science Foundation About Pure: Pure is one of the world's leading commercially available Research Information Management Systems. Pure integrates a wide range of research databases and research outputs to provide analysis that enhances decision-making, enables showcasing and collaboration, and evidence-based execution of research strategy. The US National Science Foundation Directorate for Technology, Innovation and Partnerships (NSF TIP) recently unveiled the TIP Investments pilot, agroundbreaking initiative designed tohelp researchers, practitionersandthewiderpubliceasilyfind and visualise its investments in key technology areas across the US. The NSF Directorate for Technology, Innovation and Partnerships (NSF TIP) engages all Americans in accelerating key technologies to advance US competitiveness. The directorate partners across sectors to advance three primary focus areas – accelerating technology, fostering regional innovation and economic growth, and preparing the American workforce for better-quality, higher-wage jobs. The TIP Investments pilot uses Elsevier's Pure platform to present TIP initiatives, which invest in research and development funding at universities and companies including startups and small businesses, and non-profits, among other organisations. Data are collated and categorised with machine learning to provide a comprehensive view of TIP’s investment landscape. The data and analysis are displayed in a clear, interactive dashboard. The tool illustrates the impact of investments across the 10 Key Technology Areas, like Artificial Intelligence, Robotics and Advanced Manufacturing, and Biotechnology. The dashboard allows users to see the number of awards made,the organisations and researchers that received funding, investment levels, and Key Technology Areas, all broken down byUS states, territories, and congressional districts. Through the TIP Investments pilot, users can access a comprehensive hub to connect with peers, forge partnerships, build regional coalitions and accelerate research, innovation, and impact. Additional data and features will be added over time, evolving the TIP Investments pilot into an ever more dynamic platform that helps unlock technologies, solutions, products and services rooted in the latest scientific and technological breakthroughs. The TIP Investments pilot is available for anyone to access: nsfmap.services.elsevierpure.com 4,777 The TIP Investments pilot includes awards to 4,777 projects focused on research, innovation, workforce development and related capacity-building initiatives Pure: Helping NSF TIP showcase the scale and impact of its investments in key technologies across the US Erwin Gianchandani, NSF Assistant Director for TIP, said: "The pilot allows the American public a new way of seeing the breadth and depth of TIP’s investments in key technology areas and their impacts. We hope that the map and underlying data will help those interested in TIP's investments explore our work and assist researchers in finding others in their regions or focus areas." This case study was approved by NSF. Market segments Governance and shareholder information Financial statements Financial review Corporate responsibility Overview |
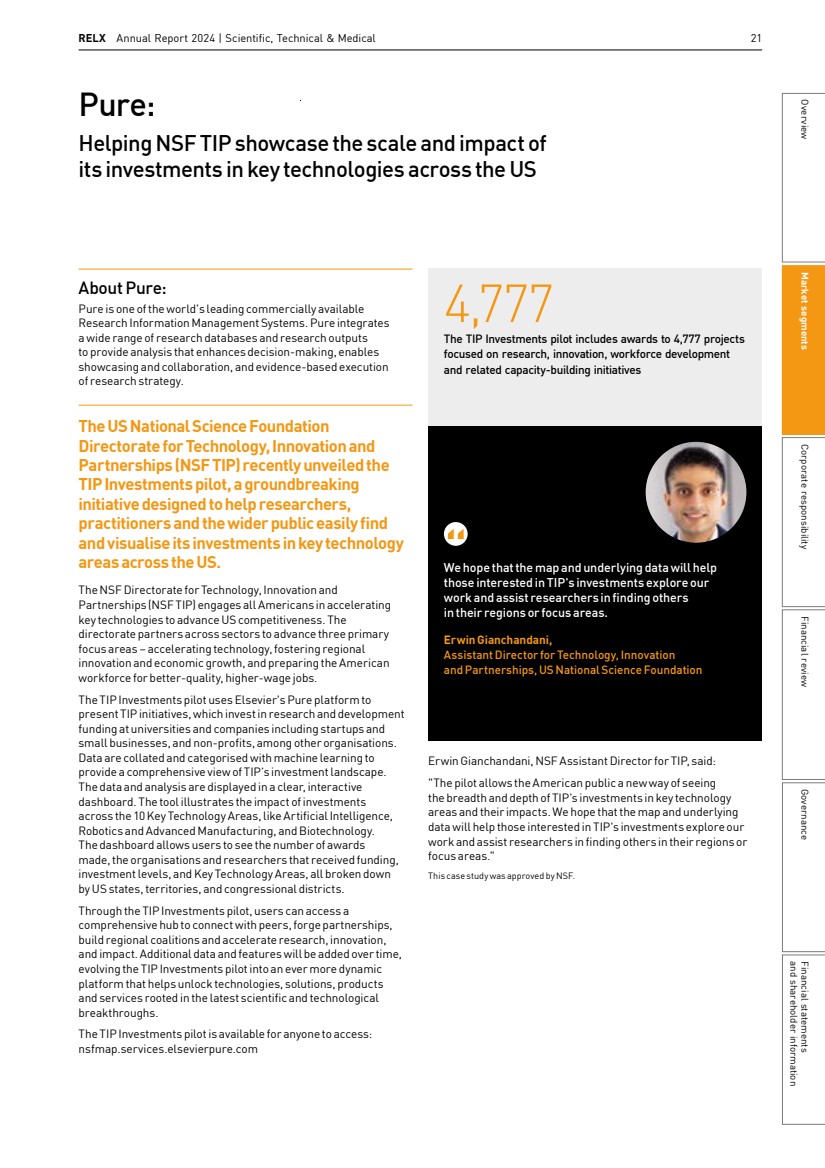
| 22 RELX Annual Report 2024 | Market segments Business overview Legal helps its customers improve decision-making, achieve better outcomes and increase productivity by providing tools that combine legal, regulatory and business information with powerful analytics. LexisNexis Legal & Professional is headquartered in New York and has further principal operations in Dayton, Raleigh, and Toronto in North America, London and Paris in Europe, and cities in several other countries inAfrica andAsiaPacific. It has 11,800 employees worldwide and serves customers in almost 150 countries and territories. Revenues for the year ended 31 December 2024 were £1,899m, compared with £1,851m in 2023 and £1,782m in 2022. In 2024, 68% of revenue came from North America, 21% from Europe, and the remaining 11% from the rest of the world. Subscription represented 80% of revenue and transactional revenues represented 20%. LexisNexis Legal & Professional is organised in market-facing groups, focused on Law Firms & Corporate Legal, Government & Academic, and News & Business markets. Services are delivered primarily in electronic format, with print formats available where there is customer demand. Content and tools are tailored to the specific geographic markets served, supported by global shared services organisations providing platform and product development, operational and distribution services, and other support functions. Law Firms & Corporate Legal, representing over 60% of revenue, provides legal professionals across law firms and corporate legal departments with electronic reference, decision tools, and analytics to help make better informed decisions in the practice of law. Standard products for legal research and analytics include Lexis, Lexis+, and Lexis+AI, which provide statutes and case law combined with analysis and expert commentaries from secondary sources, such as Matthew Bender, and incorporate the leading citation service, Shepard’s, advising on the continuing relevance of case law precedents. Lexis+AI was introduced in theUSin 2023 and is a generative AI platform designed to transform legal work. Itis built and trained on one of the world’s largest repositories of accurate and exclusive legal content, leveraging an extensive collection of documents and records to provide customers with trusted, comprehensive legal results with unmatched speed and precision and backed by verifiable, citable authority. The new Lexis+AItechnology features conversational search, insightful summarisation, uploaded document analysis, and intelligent legal drafting capabilities, all supported by state-of-the-art encryption and privacy technology to keep sensitive data secure. In 2024, Lexis+AI adoption grew in theUS, and it was successfully rolled out across the world. In June 2024, Lexis+ AI was commercially launched to theUKandAustraliamarkets. In July, Lexis+AI was launched in France, with not only primary sources like case law but also secondary doctrinal content like the JurisClasseur. InCanada during September 2024, Lexis+ AI was commercially launched in French, becoming the first comprehensive bilingualCanadian legal generativeAI solution available in the country. Lexis +AIUS was also launched inAsia, with customers inChina, Japan andKorea. We help lawyers win cases, manage their work more efficiently, serve their clients better, and grow their practices by deploying advanced analytics and latest, cutting-edge technology, including artificial intelligence (AI). We assist corporations in better understanding their markets and monitoring relevant news. We partner with leading global associations and customers to help advance the Rule of Law across the world. § LexisNexis hosts over 161bn legal and news documents and records § On average, over 1.6m new legal documents are added daily from over 50,000 sources, generating over 161bn connections with over 38m legal documents processed per day § Nexis news and business content includes over 39,000 premium sources in over 50 languages, covering around 180 countries, with a content archive that dates back 45 years § PatentSight includes ratings on the innovative strength of over 160 patent documents from over 100 countries § LexisNexis content includes more than 322m court dockets and documents, over 172m patent documents, over 5.19m State Trial Orders, and over 1.6m jury verdict and settlement documents § In 2024, Law360 produced over 64,000 news and analysis articles § Lex Machina has normalised over 146m counsel mentions and over 149m party mentions since 2016 § LexisNexis is committed to advancing the Rule of Law through operations and solutions that provide transparency into the law in over 150 countries and territories § There are more than 1.1m Lexis+ users across nine countries including theUS,Canada,UK, Australia, Singapore,HongKong, SouthAfrica, Malaysia and New Zealand Legal |
| RELX Annual Report 2024 | Legal 23 LexisNexisProtégé, a new personalised AI Assistantin Lexis+ AI, was unveiled to the global marketin 2024, setting the stage for a broad-scale release in 2025.Protégé is an AIfeature of LexisNexis that integrates with legal document management system to deliver uniquely personalised work product in a private, secure setting. Lexis+ is the cornerstone of online research and is being rolled out in additional countries and enhanced in existing countries. All customers in theUK were upgraded to Lexis+UK in 2024. Lexis+ Ireland was expanded to coverBanking & Financial Services, Commercial, Corporate, Dispute Resolution and Property. In South Africa, the Lexis+ platform was made available to all customer segments in 2024, paving the way for Lexis+ AI in 2025. In New Zealand, Lexis+ was launched in July 2024. In Malaysia, Lexis+ was also launched in July 2024 with Malaysia Legislation Citator, providing reports of legislative instruments and their provisions. In 2024, LexisNexis continued to broaden the reach ofits decision tools and analytics through Lex Machina. LegalAnalytics forUS federal district courts were expanded to cover findings, remedies and damages for Civil Rights litigation covering First Amendment, Voting, Education, and Housing; as well as Americans with DisabilitiesAct(ADA) and police action cases. It also released Litigation Footprint in March 2024, which provides the most advanced view of company litigation history for business development, competitive analysis and case strategy. In2024,LexisNexis launched Intelligize+AI,thenext generation ofits premier SEC compliance analytics and research platform. The reimagined platformincludes generative artificialintelligence driven capabilities and new search technologies that enable users tofind, analyse, and compare documents quickly and easily. LexisNexis expanded legal news coverage with Law360 in 2024, with the launch ofHealthcareAuthority. In 2024, it also expanded globallegal news coverage with the launch of MLex’s Intellectual Property andArtificialIntelligence coverage. LexisNexis continued to enrich core solutions across global segments in 2024. In July 2024, LexisNexis completed the acquisition of Henchman, a legal tech company that enriches data from Document Management Systems (DMS) for faster document drafting. The acquisition enables legal customers to extract key insights from internal data and combine it with trusted LexisNexis content andAI capabilities for a personalised generativeAI drafting experience. In France, LexisNexis closed the acquisition of Jarvis, a legaltech company with a practice management solution for law firms. In 2024,PracticalGuidance usage reached new record highs, with a 36% year-on-year increase inUS, and a 34% increase inCanada. Practical Guidance expanded its automated template content set by 70% in 2024, producing over 4,500 automated templates across key jurisdictions. In the IntellectualProperty (IP) analytics space, LexisNexis TechDiscovery was launched within the PatentSight+ platform, integratingGenerativeAIto transform patent searching for both patent professionals and the broader innovation community, accelerating speed to insight and decision-making. PatentSight+ provides global innovators with contextualised, evidence-based innovation insights and analytics,leveraging artificialintelligence and powerful visualisations to gain strategic insights from patentinformation. LexisNexis Regulatory Compliance is positioned to support our clients in key regions globally, including theUSandUK, assisting them in maintaining compliance registers across numerous topics including cybersecurity, banking, gambling and more. The continuously expanding content portfolio is focusing on key legal obligations content in highly regulated industries and areas of law. LexisNexis also supplies software solutions for legal spend management, matter management, and client engagement. In 2024, LexisNexis launchedCounselLink+, a fully integrated Enterprise Legal Management and Contract Lifecycle Management platform, featuring interconnectivity to the LexisNexis portfolio, Practical Guidance templates within the Contractmodule, andAsk Legal on Microsoft Teams. InterAction+, a customer relationship management solution that unites a business development tool with a modern user experience, continued to build out capabilities into its solution, enabling customers to migrate to its cloud-based offering. Lexis+AI is a generativeAI platformdesigned to transform legal work with an initial emphasis on enhanced search, summarisation and drafting Lexis+ is a legal analytics ecosystem that uses AI and superior search technology to deliver legal research and news, data-driven insights, and practical guidance seamlessly into legal workflows Intelligize is the leading provider of content, news, regulatory insights, and analytics for compliance,transactional and financial reporting professionals Lex Machina provides Legal Analytics to law firms and companies, enabling them to craft successful strategies, win cases, and close business CounselLink is a leading enterprise legal management solution designed to help corporate legal departments gain 100% visibility into their work, matters, and invoices Nexis is ourflagship business productthat provides access to an expansive collection of news, company, legal, and regulatory data necessary to make smart business decisions For more information visit relx.com Market segments Governance and shareholder information Financial statements Financial review Corporate responsibility Overview |
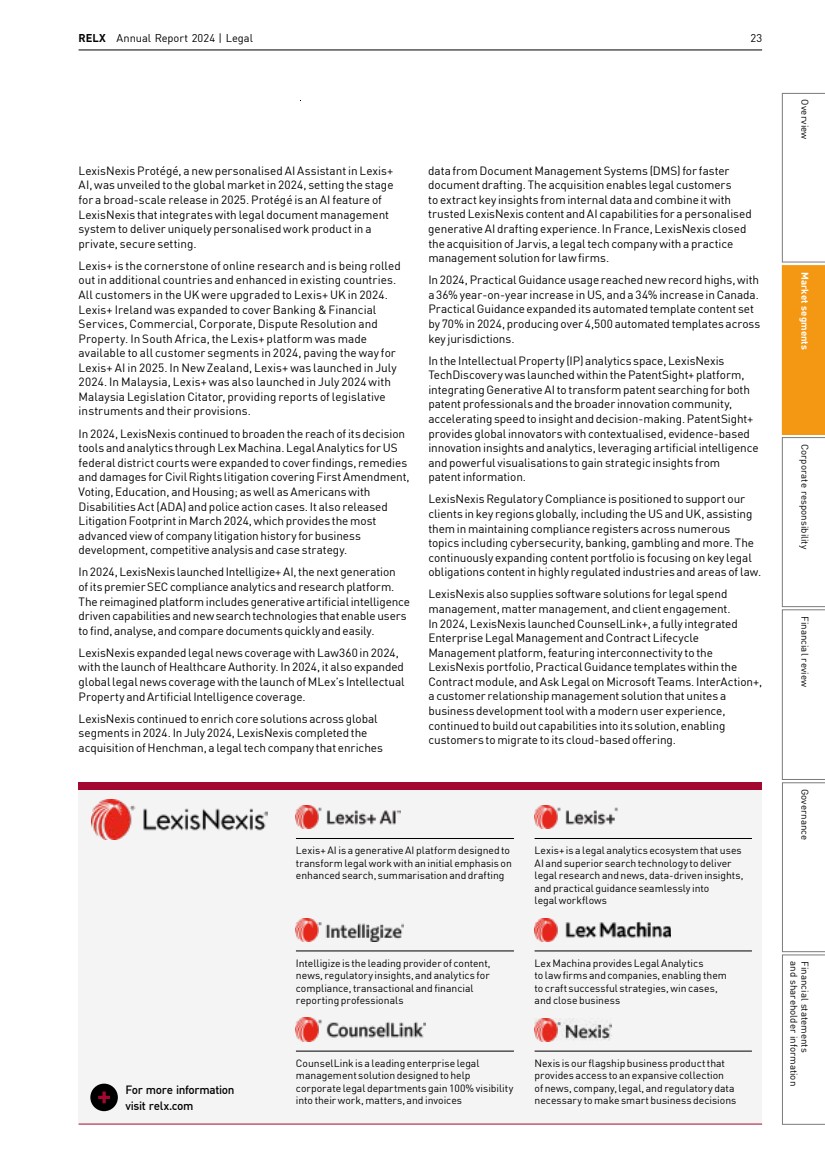
| 24 RELX Annual Report 2024 | Market segments Format Geographical market Type Transactional 20% Subscription 80% Print & face-to-face 9% Electronic 91% Rest of world 11% Europe 21% North America 68% content. Nexis+AIfeatures powerful research, document summarisation, and conversational search features to meet the evolving needs of modern businesses. Nexis Solutions also launched its NexisData+APIs in 2024 that enable access to LexisNexis’s expansive datasets including licensed news sources, legal resources, company and financialinformation, and compliance data and watchlists. Print, representing under 10% of revenue, provides traditional printmaterials as well as e-books with case law, statutes, and other primary law sources that include leading brands such as Matthew Bender, Mealey’s, Michie, LexisNexis A.S. Pratt and LexisNexis Sheshunoff.Inthepast year,theprintteamexpandeditspublishing alliance with the New JerseyStateBarAssociation and signed a publishing agreement with theAmerican Law Institute (ALI)to gradually take overALI’s print publishing activities. Market opportunities Longer-term growth in legal and regulatory markets worldwide is driven by increasing levels of legislation, regulation, regulatory complexity and litigation, and an increasing number of lawyers. Additional market opportunities are presented by the advent of generativeAI and increasing demand for online information solutions, legal analytics, and other solutions, along with decision support solutions that improve the quality and productivity of research, deliver better legal outcomes, and improve business performance. Notwithstanding this, legal activity and legal information markets are also influenced by economic conditions and corporate activity. Strategic priorities LexisNexis Legal & Professional’s strategic goal is to enable better legal outcomes and be the leading provider of workflow and productivity enhancing information, analytics, and information-based decision tools in its market. To achieve this, LexisNexis is focused on introducing next-generation products and solutions on the Lexis platform and infrastructure; incorporating advanced technologies including generativeAI; driving long-term international growth; and upgrading operational infrastructure, improving process efficiency, and gradually improvingmargins. Across segments, LexisNexis is focused on the ongoing development of advanced legal research and practice solutions that help lawyers make data-driven decisions with greater accuracy and efficiency.Globalfunctions and presence enable LexisNexis to effectively launch and scale products such as Lexis+ AI across segments,leveraging shared assets from product design to back-end functionality. The Legal mission to advance the rule of law globally has continued to benefitthe 5.1bn people who are outside ofthe umbrella protections of the Rule of Law. The LexisNexis Rule of Law Foundation contributed towards writing and publishing guidelines on the firstlaw in the world which makes human sacrifice a crime. The VotingRights Tool, which allows review of theUSvoting laws for free, was selected as a finalistin the World JusticeChallenge. The foundation also funded a training to find and assist detainedUkrainian human rights defenders and collaborated with the InternationalBarAssociation to publish new reports inChile,Brazil,SouthKorea, and Mexico analysing, the status of gender equality in the legal profession. Government & Academic, representing around 20% of revenue, serves customers across government organisations and law schools. LexisNexis legal research and analytics tools empower legal professionals across majorUSfederal agencies and state and local government in upholding the rule of law. Products such as Lexis+, Lexis+AI andPracticalGuidance enable efficient research, while CaseMap helps manage and collaborate on legal cases. LexisNexis Reed Tech also provides patent data and documentmanagement services to theUSPatent and TrademarkOffice, with over 50 years of partnership. LexisNexis actively engages with law school users with a focus on product features and research methods, reaching faculty and students across over 210USlaw schools in 2024. Through national marketing and in-person programs, LexisNexis helps students and faculty build search dexterity and use leading legal analytics tools to tackle complex research, deliver quality drafts, and track key issues in the practice of law. LexisNexis launched Lexis+AIto 150,000USlaw school students and faculty in 2024, which helped drive preference to an all-time high. News & Business, representing just under 10% of revenue, provides customers across industries with news and business information and insights, including company information and US PublicRecords. Standard products for business research are Nexis and Nexis+ AI, which provide access to over 39,000 licensed sources, including a 45-year news archive across over 50 different languages. Other core products include Nexis Newsdesk for media monitoring, andNexis Diligence+ for risk assessments. Nexis+AI, a generativeAI platform designed to transform business research, was launched in 2024. Itis built on one of the world’s largest repositories of generativeAIlicensed news 2024 Revenue £1,899m |
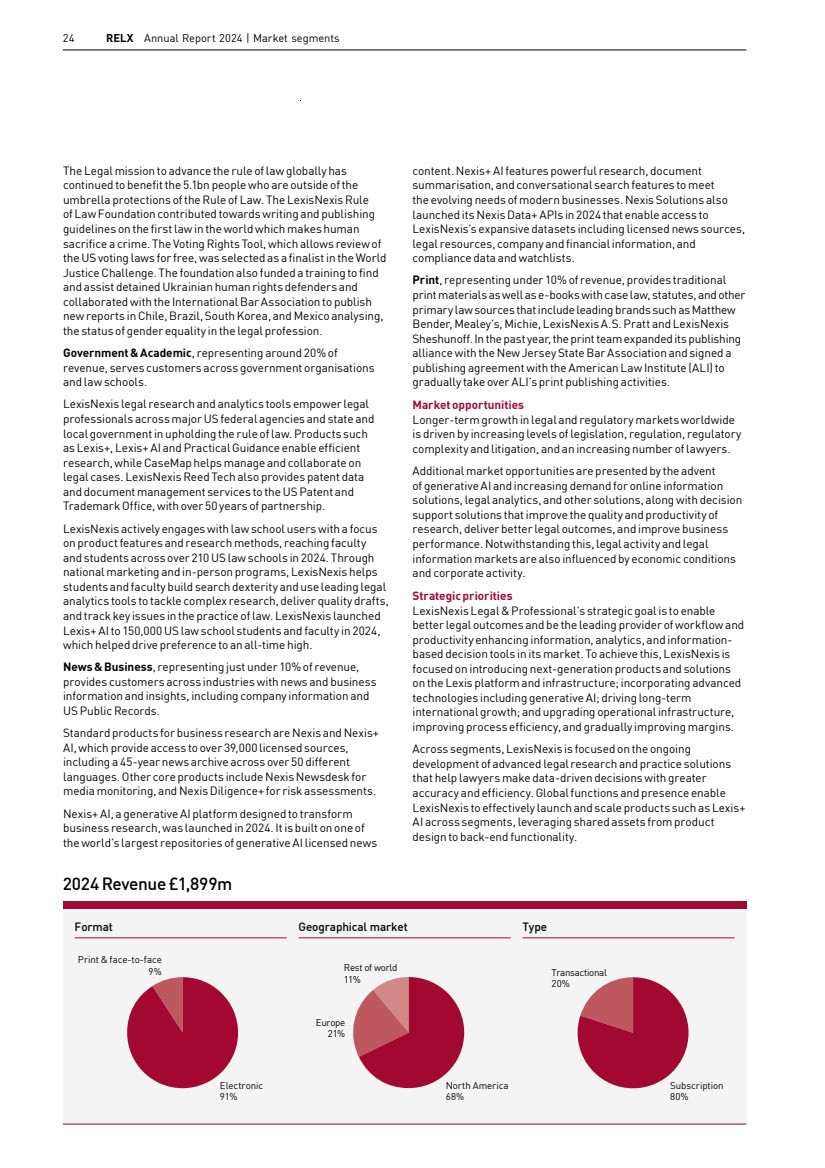
| RELX Annual Report 2024 | Legal 25 Further improvement in underlying revenue growth driven by legal analytics Underlying revenue growth improved to +7%. Strong growth continues to be driven by the shift in business mix towards higher growth, higher value legal analytics and tools. Underlying adjusted operating profit growth was +9%, as we continue to manage underlying cost growth below underlying revenue growth, leading to a further improvement in adjusted operating margin. Lexis+, our integrated platform leveraging extractiveAI, continued to perform well. Lexis+AI, additionally leveraging generativeAI, continued its successful roll-outin theUS and launched in international markets. Protégé, our recently launched next generation generativeAIlegal assistant, has been positively received by customers. Government & Academic and News & Business growth continued to be driven by the further extension of analytics and decision tools. Renewals and new sales remain strong across all key segments. 2025 outlook We expect continued strong underlying revenue growth with underlying adjusted operating profit growth exceeding underlying revenue growth. 2024 financial performance 2023 GBPm 2024 GBPm Change in GBP Constant currency growth Underlying growth Revenue 1,851 1,899 +3% +6% +7% Adjusted operating profit 393 412 +5% +8% +9% Revenue 2024 1,851 1,899 2023 GBPm Underlying growth +7% Adjusted operating profit 393 Underlying growth +9% GBPm 2023 2024 412 LexisNexis is also continuing its mission to advance the Rule of Law around the world through the efforts of the LexisNexis Rule of LawFoundation, a non-profit entity that conducts projects globally to promote transparency of the law, access to legal remedy, equaltreatment under the law, and independent judiciaries. Business model, distribution channels and competition LexisNexis Legal & Professional products and services are generally sold directly to law firms and to corporate, government and academic customers on a paid subscription basis, with subscriptions often under multi-year contracts. Principal competitors for LexisNexis inUSlegal markets are Westlaw (ThomsonReuters),CCH(WoltersKluwer), and Bloomberg. In news and business information, key competitors are Bloomberg, Factiva (News Corporation) and Reuters News (Thomson Reuters). Significantinternational competitors include ThomsonReuters, WoltersKluwer and Factiva. Market segments Governance and shareholder information Financial statements Financial review Corporate responsibility Overview |
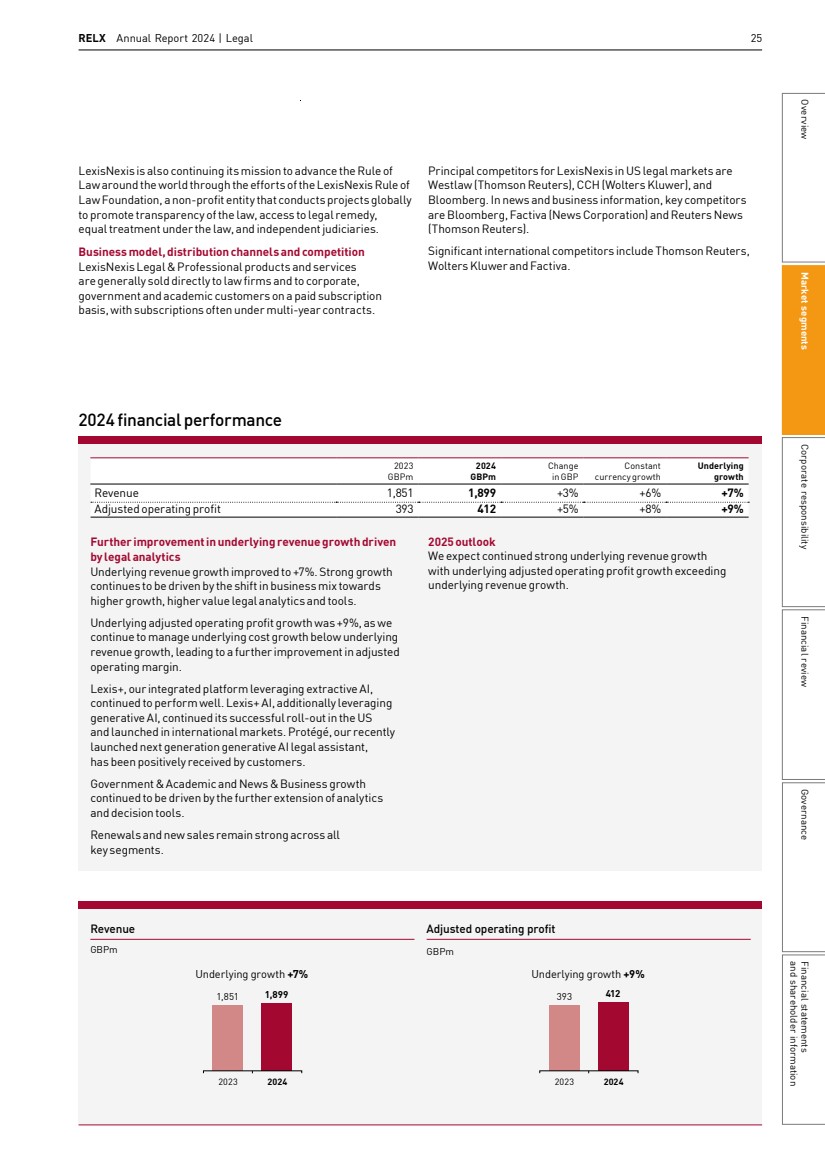
| 26 RELX Annual Report 2024 | Market segments About Lexis+ AI: Lexis+AI is a generativeAI solution designed to transform legal work. Lexis+AI enables conversationallegal research, insightful summarisation, intelligent legal drafting, and document upload and analysis capabilities.Using the LexisNexis proprietary Retrieval Augmented Generation platform, integrated with advancedShepard’sKnowledgeGraph, Lexis+AI answers are grounded in LexisNexis content – one of the world’s largest repositories of current, exclusive legal content – and customers can harness the power of Shepard’s case law relationship information for authoritative, complete, and final AI-generated responses. LexisNexis Legal & Professional has been using extractive AI capabilities for over a decade. Lexis+ AI incorporates generative AI, building on a foundation of prior extractive AIinvestments. Before 2020, LexisNexis’ primary solution was Lexis Advance, a legal electronic reference research platform. The business also offered a set of high-value standalone workflow, analytics, and decision tools using extractiveAItechnology that customers could purchase separately. In 2020, LexisNexis released Lexis+, an integrated platform that combines electronic reference with extractiveAItechnology and advanced analytics insights. Customers using Lexis+ are able to access an entire suite of solutions serving many use cases from a single location. In 2023, Lexis+AI was introduced, a natural progression ofthe LexisNexis platform thatincorporates generativeAItechnology, significantly expanding the universe of use cases available to customers. Lexis+AI is unique in thatitleverages the deepest collection of trusted proprietary legal content and legal metadata to deliver the highest-quality answers and citation references. Research about generativeAI indicates that privacy and security, as well as accuracy, are key considerations for legal customers. Understanding this, LexisNexis made criticaltechnical decisions early on to inform its generativeAI product development. LexisNexis prioritises data privacy and security by ensuring the safe use ofAI in product development, in line with theRELX ResponsibleAIPrinciples. The company also works with cloud providers MicrosoftAzureOpenAI andAmazon Web Services Bedrock and implements extensive state-of-the-art encryption and privacy technology to keep data secure. Additionally, LexisNexis decided on aflexible,multi-model approach to its AI strategy, using the best modelfor each legal use case and enabling the company to evaluate and deploy new models with speed. 100bn + LexisNexis Legal & Professional’s content sets include more than 100bn documents and records The LexisNexis Generative AI Journey: How LexisNexis Legal & Professional built its legal AI model Our legal customers look to us as their trusted adviser in the AI journey. For years, we have rapidly experimented with, deployed, and scaled AI and advanced technologies. Because of our track record ofAI innovation, we are uniquely suited to support our customers’ success with seamless AI solutions that help them deliver real economic value and are personalised to their specific type of legal work. Jeff Reihl Chief Technology Officer, LexisNexis Legal & Professional Comprehensive content and accuracy are critical for creating reliable generativeAI-based solutions. The combination of breadth, depth, type of content, and value-add entity extraction and linking creates unique and powerful assets. LexisNexis content sets include more than 100bn documents and records, with more than 2m documents added every day from over 50,000 sources. The company uses its own content sets to ground large language model (LLM) answers via Retrieval Augmented Generation (RAG). Additionally, LexisNexis employs hundreds oflegal experts and data scientists to improve LLM answers, and fine-tune LLMs. Lexis+AI has been launched in theUS,theUK, France,Australia and Canada, with additional countries coming soon. The product is also available in 100% of American Bar Association-accredited law schools, helping prepare the next generations of lawyers. The generativeAI use cases open new value opportunities for customers. InAugust 2024, LexisNexis announcedProtégé for customer preview. Protégé is a next-generation personalised legal generativeAI assistantthatleverages LexisNexis’ comprehensive repository of authoritative content and the customer’s own proprietary documents, past work, and other firm knowledge. |
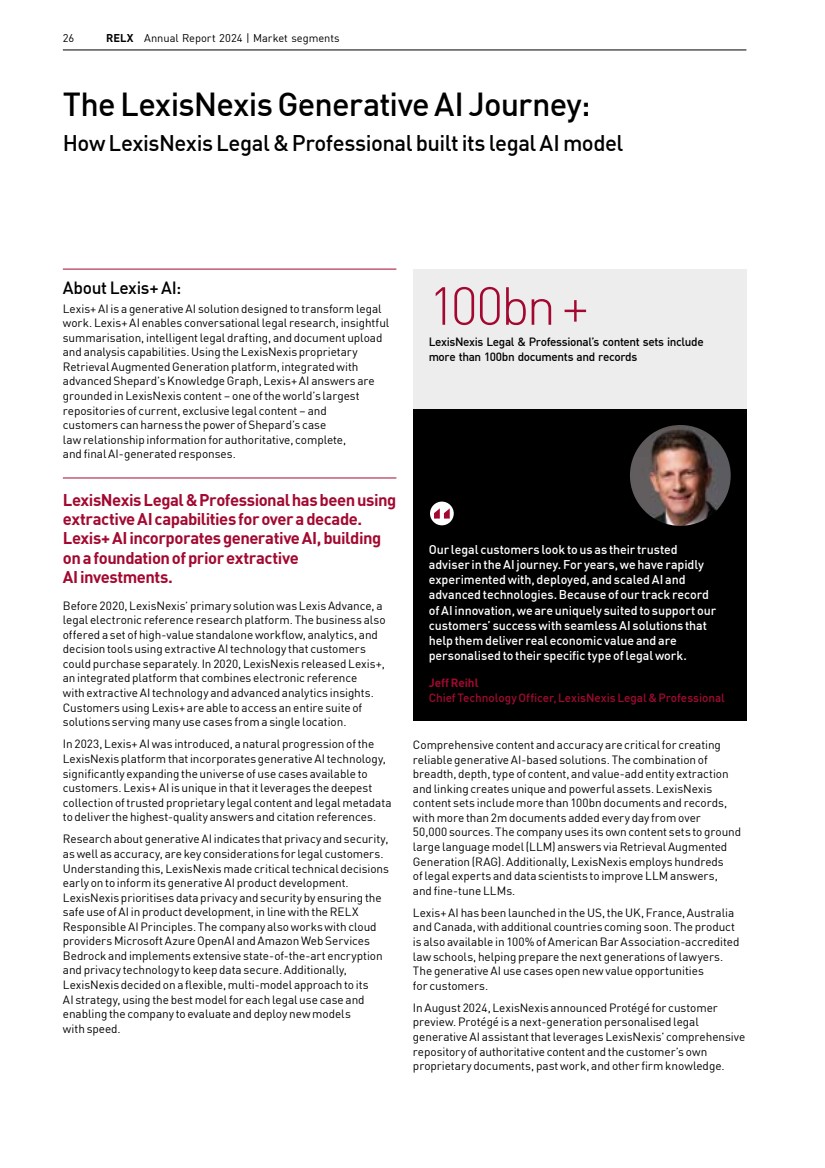
| RELX Annual Report 2024 | Legal 27 200% Lexis+ AI saves Nakat lawyers approximately 3.5 hours a day and has boosted productivity by 200%. This efficiency gain has allowed us to allocate more time to strategic management and proactive client engagement Lexis+ AI has become indispensable for us. By leveraging Lexis+ AI, we have been able to optimise our operational costs. The savings in time and resources have allowed us to offer competitive pricing while maintaining profitability. This has been instrumental indifferentiating us from larger firms and attracting clients seeking value-driven legal services. Adam Nakat Founder, Principal, and Director, Nakat Law About Nakat Law: Adam Nakat is the founder, principal, and director at Nakat Law. Since founding the firm in July 2021 atthe height oftheCovid-19 pandemic, Adam and his team quickly garnered a reputation as a competitive player in the Melbourne, Australia, legal market. Nakat Law prides itself on providing practical, quality end-to-end outcomes for its clients by utilising disruptive technology to assist with navigating complex legal issues. Before adopting Lexis+AI,Adam and his team faced challenges common to smaller firms, such as resource limitations and stringent timeframes. Legal research at Nakat Law was a time-consuming endeavour. Not anymore. “TheAI’s ability to provide instant and reliable responses to complex legal queries has been revolutionary. It not only saves us time but also ensures that our legal advice is backed by the latest and most relevant case law and statutes. The ability to receive instantaneous and reliable responses to legal queries, coupled with theAI’s capability to suggest pertinent case law and summarise complex legal documents, has been immensely valuable.” Lexis+AI’s artificialintelligence-driven legal research, drafting tools and document analysis capabilities have streamlined operations significantly. “Tasks that used to take hours can now be completed in a fraction of the time, thanks to the artificialintelligence’s ability to assistfee earners to generate drafts, review documents for inconsistencies, and suggest improvements based on established legal precedents.” One of the standout features for Nakat Law has been Lexis+ AI’s document comparison and analysis capabilities. In addition to greater efficiency that allows for more hands-on client engagement, Lexis+AI also helpsAdam and his team with risk mitigation. But it’s not just human errors that can be reduced – Lexis+AI delivers search results that minimise hallucinations because its answers are grounded in LexisNexis legal content. The cost savings,too, cannot be understated. For a growing firm like Nakat Law, cost efficiency is paramount.Beyond internal efficiencies, Lexis+AI has also enhancedNakat Law’s client service capabilities and ability to realise value to its clients. By delivering superior client outcomes and greater cost efficiency, Lexis+AI has helpedNakat Law quickly gain a reputation as a formidable contender in Melbourne’s legal market. Adam and his team’s experience with the platform has underscored a pivotal role in client service delivery that would not have been possible withoutthe emergence of generativeAI. Lexis+ AI: How Nakat Law leverages Lexis+ AI to help compete with larger players Market segments Governance and shareholder information Financial statements Financial review Corporate responsibility Overview |
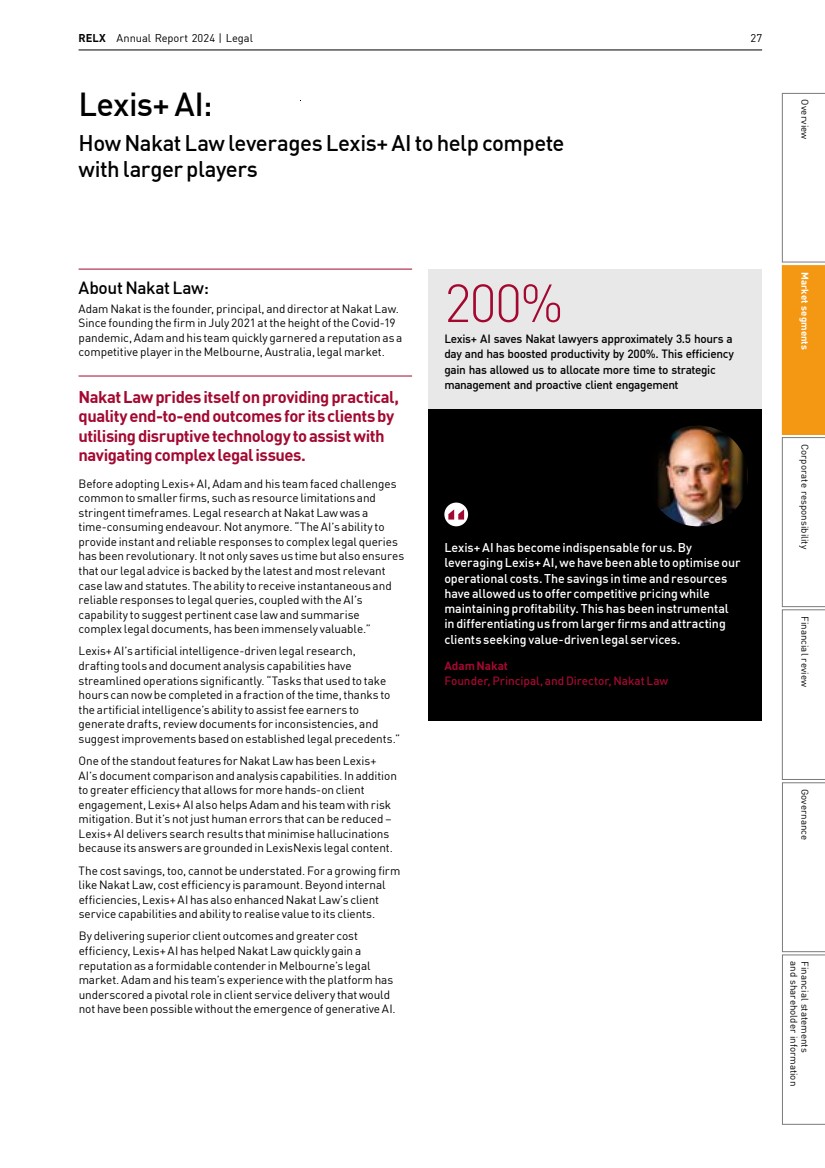
| 28 RELX Annual Report 2024 | Market segments Business overview Exhibitions combines industry expertise with data and digital tools to help customers connect face-to-face and digitally, learn about markets, source products and complete transactions. RX has its headquarters in London and has further principal offices in Paris and Düsseldorf in Europe, Norwalk (Connecticut), Mexico City and São Paulo in the Americas, Beijing, Shanghai, Tokyo and Singapore in Asia, and Sydney, Australia. RX has 3,300 employees worldwide and its portfolio of events serves 41 industry sectors. Revenues for the year ended 31 December 2024 were £1,239m compared with £1,115m in 2023 and £953m in 2022. In 2024, 19% ofRX’s revenue came from North America, 42% from Europe and the remaining 39% from the rest of the world on an event location basis. Over 6m participants welcomed the opportunity to build their businesses at RX face-to-face events. RX ran 282 face-to-face events in 25 countries. In 2024, RX extended the continuous improvement, range and depth of digital and data products offered, increasing their sophistication and the value delivered to customers. RX’s digital products provided increasingly valuable ways to learn, network, source and trade as well as unprecedented insight into customers’ activity, performance and results at its events. Digital products grew in 2024 with electronic revenue accounting for 7% of revenue. RX organises influential events in key markets focused on addressing the needs of each particular industry, where participants from around the world meet face-to-face to learn, network, source products or leads, and trade. Its events encompass a wide range of sectors. They include construction, cosmetics, data analytics, electronics, energy and alternative energy, engineering, entertainment, gifts and jewellery, healthcare, hospitality, interior design, logistics, manufacturing, media, pharmaceuticals, real estate, recreation, security and safety, transport and travel. RX makes selective acquisitions to enter or increase presence in attractive sectors with high growth potential. In 2024 RX acquired Sustainable Energy Conferences (SEC), owner of WorldHydrogen Summit, expanding its access to the high growth market in renewable and alternative energy through events in three key geographies. During 2024, Exhibitions disposed of a small number of strategically non-core assets in Austria, Australia and the UK. Similarly, RX made selective launches to enter new attractive sectors (such as Space Business Expo for space research, Japan) or to extend successful value propositions into new markets (such as Pollutec expanding into Paris, France) or additional calendar slots (such as Japan Food Export Expo into the winter). Exhibitions We help customers build their businesses through face-to-face events and digital tools, enabling innovation and supporting the economic development of local markets and national economies around the world. § In 2024 Exhibitions (RX) ran 282 face-to-face events in 25 countries § In 2024, over 6m participants welcomed the opportunity to build their businesses atRX events § 41 industry sectors are served in 25 countries across the globe § Using attendee data, RX’s event registration system, Mercury, has been deployed at 100 events to recommend exhibitors to visitors |
| RELX Annual Report 2024 | Exhibitions 29 Market opportunities RX is well positioned for further growth in face-to-face events. This will occur in parallel with an increased use of, and revenue from, digital & data tools and platforms, both stand-alone and as part of multi-channel events. These events, combined with digital tools and platforms, are a key lever for RX customers’ businesses and national economies to expand. Growth in the exhibitions market is influenced both by business-to-business marketing spend and by business investment. Historically, these have been driven by levels of corporate profitability, which in turn has followed overall growth in gross domestic product. Emerging markets and higher growth sectors provide additional opportunities. RX’s broad geographical footprint and sector coverage allows it to respond effectively to changes in global trade and capture growth opportunities as they emerge. As some events are held other than annually, growth in any one year is affected by the cycle of non-annual exhibitions. This cycle was disrupted by Covid-19 but re-established in 2023 and continued in 2024, with more revenue from non-annual events in even years. Strategic priorities RX’s long-term strategic goal is to provide discernible and improving value to buyers and sellers by connecting them to build their businesses, through a mixture of learning, networking, sourcing products or leads, and completing trades. We deliver this value through a range of market-leading events and digital tools and platforms in all major geographic markets and higher growth sectors. This allows exhibitors to target and reach new customers quickly and cost-effectively, under one roof and with an integrated set of digital tools, resulting in measurably higher value and improved outcomes. RX focuses on five main areas that position it for long-term success. Value to customers: RX constantly looks for ways to increase the value generated for customers, by innovating the offering and format of its events, and by deploying digital and data tools and platforms to enhance and extend the face-to-face experience. Portfolio development: RX continues to actively shape its portfolio through a combination of new launches, strategic partnerships and selective acquisitions, targeting the optimal mix of industry segments, geographic segments, value propositions and business models. Best in class go-to-market capabilities: RX continues to drive innovative capabilities in a number of areas critical to its performance, including marketing excellence, sales techniques and the use of analytics to generate insights both for RX and its customers. Operational efficiency: a lean, nimble structure is in place, able to respond to changing circumstances and customer needs. RX’s global technology platforms and more specialist functions allow RX to accelerate revenue growth, while controlling costs and embedding sustainability throughout the organisation. It also enables a faster and more agile deployment of digital products, new events and process innovation. Talent: RX is a business which supports and creates opportunities for the very best talent, encouraging customer focus, curiosity and a focus on long-term outcomes. RX continually enhances the value of its face-to-face events using data, analytics, and technology. RX’s digital solutions help customers to better promote their presence at events, create more connections between the right buyers and sellers, and increase the value of leads generated, thereby demonstrably increasing the return on investment of customer spend at RX events. RX’s digital solutions constantly evolve based on data and deep customer insight about the needs and behaviours of buyers and sellers in the different sectors in which it operates. Underlying the customer experience, RX has developed global technology platforms and a single data lake that allow it to efficiently mine data for insights, and to roll out high quality digital services increasingly quickly across the world, including in 2024 expanding its Colleqt service to help visitors capture their event connections more effectively. Over 70% of RX’s revenue is derived from exhibitor fees, with the balance primarily consisting of admission charges, conference fees, sponsorship fees and digital tools. RX often works in collaboration with trade associations, which use the events to promote access for members to domestic and export markets, and with governments, for which events can provide important support to stimulate foreign investment and promote regional and national economic activity. RX increasingly offers visitors and exhibitors the opportunity to interact before and after the show using digital tools and platforms such as online directories, matchmaking and mobile apps. RX is one of the largest global event organisers in a fragmented industry, holding a global market share of less than 10%. Other international exhibition organisers include Informa, Clarion and some of the larger German Messen, including Messe Frankfurt, Messe Düsseldorf and Messe Munich. Competition also comes from industry trade associations and convention centre and exhibition hall owners. Market segments Governance and shareholder information Financial statements Financial review Corporate responsibility Overview |
| 30 RELX Annual Report 2024 | Market segments Format Geographical market Source Face-to-face 93% Electronic 7% Rest of world 39% Europe 42% North America 19% Visitors and other 26% Exhibitors 74% Location: France The world’s property market Location: UK Premier global event for the travel industry Location: UAE The Middle East’s meeting place for the travel trade Location: US The North American jewellery industry’s premier event Location: US International Security Conference & Exhibition Location: Germany Innovations for smart sheet metal working Location: France International exhibition for personal care ingredients Location: Italy International exhibition for companies in the industry of HVAC+R, renewable energy and energy efficiency Location: Japan Japan’s comprehensive exhibition for smart and renewable energy Location: US The East Coast’s largest pop culture convention Location: China One of the largest business gifts & home fairs in China Location: Germany International trade show for fitness, wellness & health Location: Brazil International trade fair for the building industry Location: Netherlands The world’s dedicated hydrogen event Location: Australia Australia’s clean energy event Location: France Europe’s premier in-water boat fair Location: Japan Asia’s Exhibition for Electronics R&D, Manufacturing and Packaging Technology Location: Japan Japan’s one-stop shop for office related products and services Location: China China’s event for suppliers and buyers in the housewares industry For more information visit relx.com 2024 Revenue £1,239m |
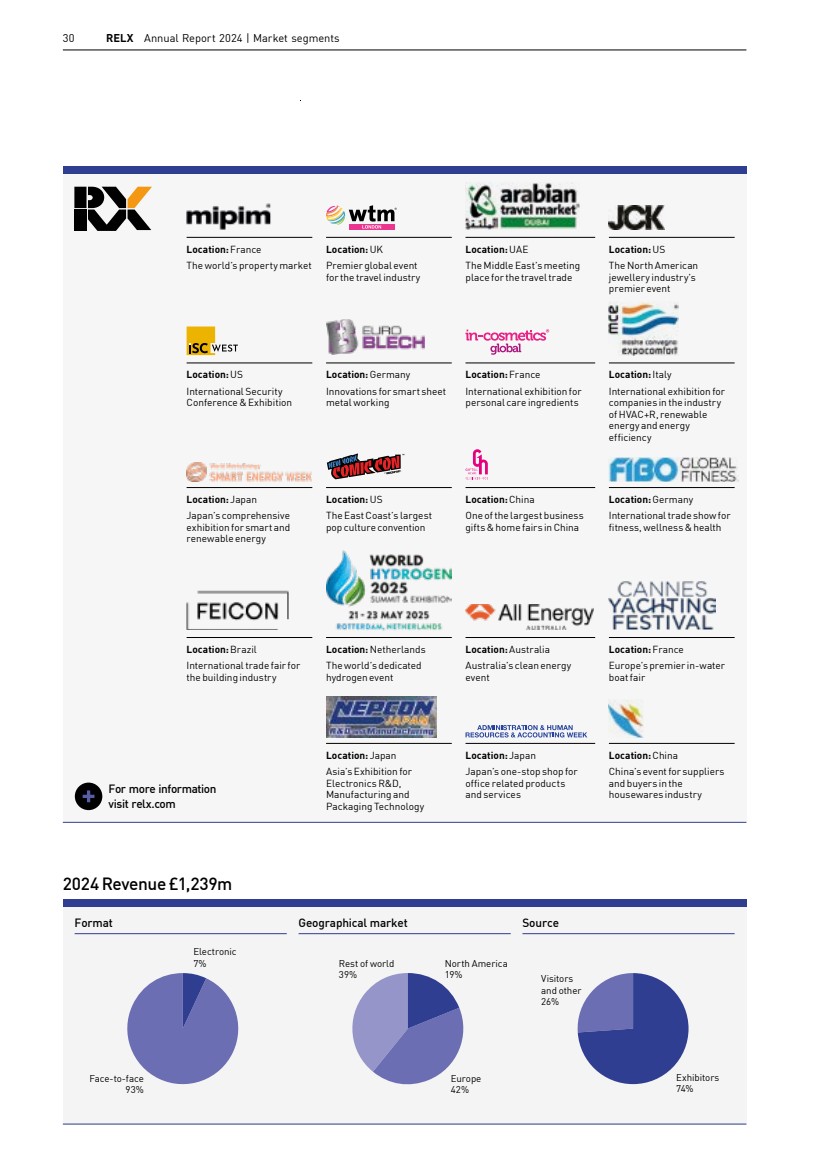
| RELX Annual Report 2024 | Exhibitions 31 Revenue 2024 1,115 2023 Underlying growth +11% GBPm 1,239 Adjusted operating profit 398 319 GBPm 2023 2024 Underlying growth +31% Strong underlying revenue growth and profitability improvement Underlying revenue growth was +11%, reflecting the improved growth profile of our event portfolio and a favourable first half comparison to the prior year. We continue to make good progress on value-enhancing digitalinitiatives, with increased usage of a growing range of digital tools for the customers of our face-to-face events. The improvement in profitability reflects the structurally lower cost base of the streamlined event portfolio. 2025 outlook We expect strong underlying revenue growth with an improvement in adjusted operating margin over the prior full year. 2024 financial performance 2023 GBPm 2024 GBPm Change in GBP Constant currency growth Underlying growth Revenue 1,115 1,239 +11% +16%* +11% Adjusted operating profit 319 398 +25% +32% +31% * includes cycling effects of +6% Market segments Governance and shareholder information Financial statements Financial review Corporate responsibility Overview |
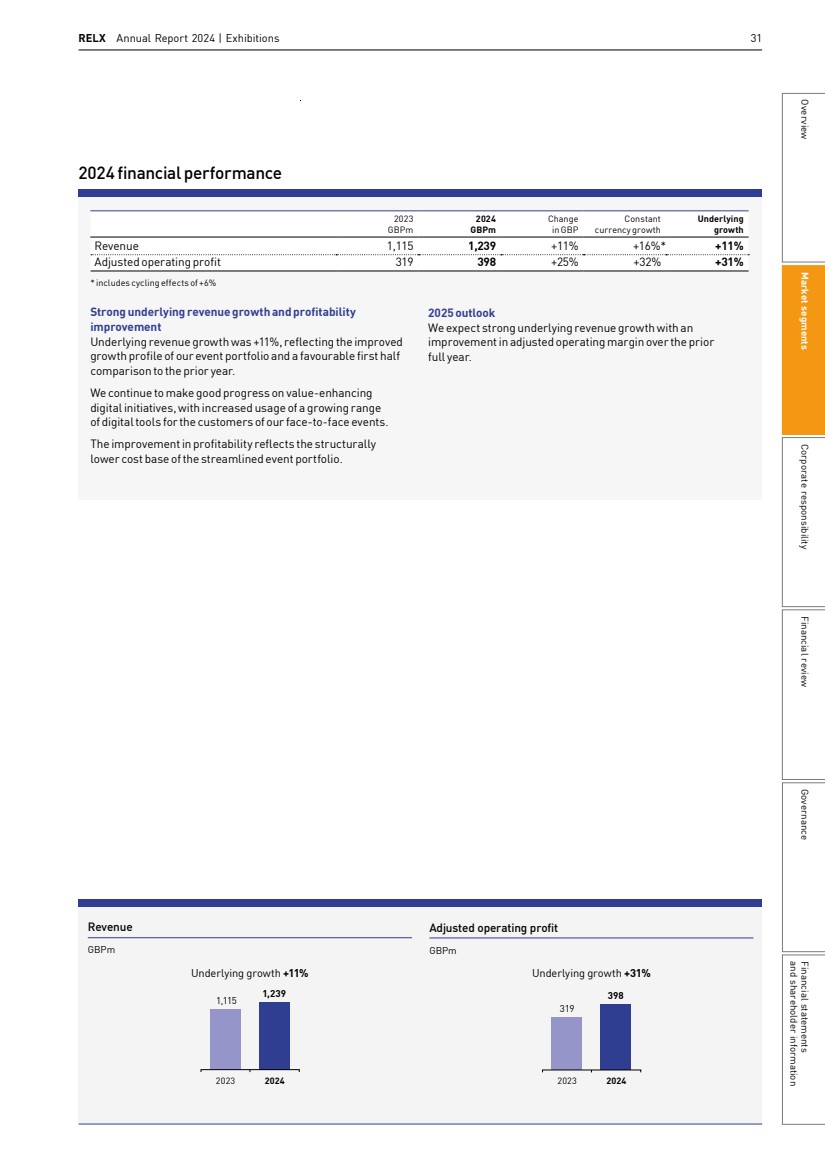
| 32 RELX Annual Report 2024 | Market segments 1.5m 1.5m visitors registered online via Mercury in 2024 Customers tell us that what matters most to them are the leads and new business that they generate from RXevents. So our digital development is focused on driving these outcomes at scale, helping exhibitors and visitors to get more value from the time and money they spend in attending our shows, and to do so in measurable ways. Itis exciting to see our solutions operating at scale across the world, driving year-over-year increases in the number of connections we’re able to create between buyers and sellers. Gaby Appleton Chief Digital Product Officer About Business Builder: Developed in-house, and underpinned by RX’s proprietary web platform, registration system, and lead capture and analysis tools, Business Builder is an integrated suite of digital solutions which enables customers to increase their visibility at RX events, connect with more prospects, and measure their results with precision. By improving the creation, measurement, delivery and capture of value at exhibitions, it supports RX’s digital vision to create value for customers by driving measurable outcomes. Three factors drive exhibitor and visitor satisfaction at face-to-face exhibitions: the number of relevant stands and people at the show; the number of leads and new contacts that they can make, and the overall perception of return on investment (time and money) fromthe show. RX’s digital solutions improve customer outcomes in these three areas. Growing use of technology at exhibitions is supported by three long-term technology trends: widespread use of mobile devices, improved network connectivity at venues, and new mobile browser technology that enables better functionality without native mobile apps. Building on these trends, RX has developed proprietary digital solutions that drive better customer outcomes and create global datasets to help identify new customer needs. For RX’s customers, the Business Builder solution helps exhibitors to increase their visibility to highly targeted buyers, connect with more leads, and use data to measure and benchmark their event performance. Underpinning Business Builder is Mercury, RX’s global registration and badging system which captures attendee data to enrich and qualify the lead data captured by exhibitors and attendees at RX events. Mercury is improving data quality at scale in RX, and its rollout to new geographies such as Japan has accelerated customer adoption of the broader Business Builder solution. Among Business Builder’s solutions, Lead Manager App offers exhibitors a quick, easy and reliable way to capture and qualify leads by scanning attendees’ badges with a mobile phone. The latest addition to the suite, Colleqt QR Code, allows attendees to proactively scan QR codes on exhibitor stands to collect their contact details and product information quickly and sustainably. Their registration data is passed automatically to exhibitors so that they never miss a lead. More than 6m leads were captured using Lead Manager App and Colleqt QR Code in 2024. Business Builder: Mercury global registration system Exhibitor Dashboard is RX’s response to customers’ needs for transparent data which quantifies the business value achieved from the event. Exhibitor Dashboard integrates data from multiple customer touchpoints into one simple-to-use dashboard, so exhibitors can assess their performance in real time and improve their ROI year-on-year. Its usage has increased in 2024 as more exhibitors adopt the tool. |
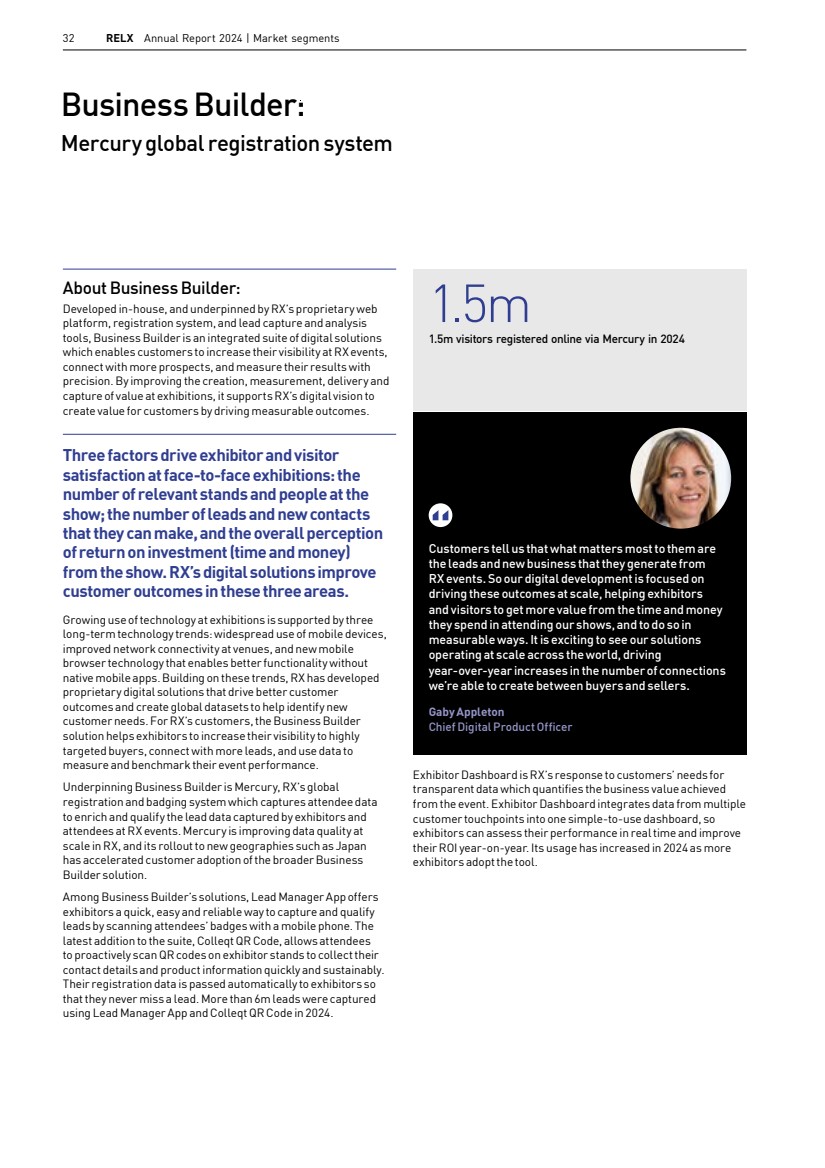
| RELX Annual Report 2024 | Exhibitions 33 64 Antwerp Convention Bureau held 64 pre-scheduled face-to-face meetings with customers and prospects during IBTM World 2024 and generated an average of 32 pre-arranged meetings for each of its stand partners IBTM World 2023 was an invaluable event for Antwerp Convention Bureau. It allowed us to build and strengthen business relationships whilst providing extensive opportunities to communicate our new brand story, The City is Your Venue, to ahighly targeted and engaged in-person and online audience. Tadeja Pivc Coudyser CEO Antwerp Convention Bureau About IBTM World: IBTM World is the leading global event for the meetings, incentives, conferences, events and business travel industry, taking place each year in Barcelona, Spain. The 2024 event, held from 19-21 November, brought together 2,350 exhibitors from over 120 countries with 7,409 visitors to network, learn and do business. A record 73,651 pre-arranged, one-to-one meetings took place during the three day event. The IBTM event brand is also present in Mexico, as IBTM Americas. Known as the diamond capital of the world, Antwerp is a port city in NorthernBelgium with a unique blendof history, culture and modern infrastructure. Antwerp Convention Bureau works toenhance the city’s standing asa destination for international conferences and business meetings, and to attract and support event planners. Antwerp Convention Bureau has been exhibiting at IBTM World, the leading global event for the meetings, incentives, conferences and events industry since 2022. In 2023 Antwerp Convention Bureau underwent a major rebranding to raise awareness of the city’s diverse attractions and facilities, resulting in significant new local conference and event business. The next step was to launch its international offering of world-class event venues, cultural experiences, and services on the global stage at IBTM World 2023 in Barcelona. Antwerp Convention Bureau attended IBTM World with six local partners, including convention centres, hotels and venues. Their objectives were clear cut – to connect with associations, agencies and corporates across different key sectors (port and logistics, healthcare, chemical cluster, digital innovation, creative sector), and to attract new meetings and events to the city, in particular major conferences, meetings and events serving 500+ people. As a Gold partner, its comprehensive sponsorship package combined face-to-face and digital branding opportunities, from digital banners on the event website to branded floor tiles which led attendees directly to their stand. It also hosted an exclusive press launch, gave a presentation on the Impact Stage and took part in a Facebook Live interview with the IBTM World team to increase their visibility and social media reach. This was in addition to a full calendar of pre-scheduled meetings with Hosted Buyers, and additional leads generated by the Lead Manager App, the badge scanning app from RX. So successful was their experience that Antwerp Convention Bureau returned to IBTM World 2024 in Barcelona with a Gold sponsorship package and a larger stand to accommodate more business partners. IBTM World: Launching a new brand for Antwerp at IBTM World Market segments Governance and shareholder information Financial statements Financial review Corporate responsibility Overview |
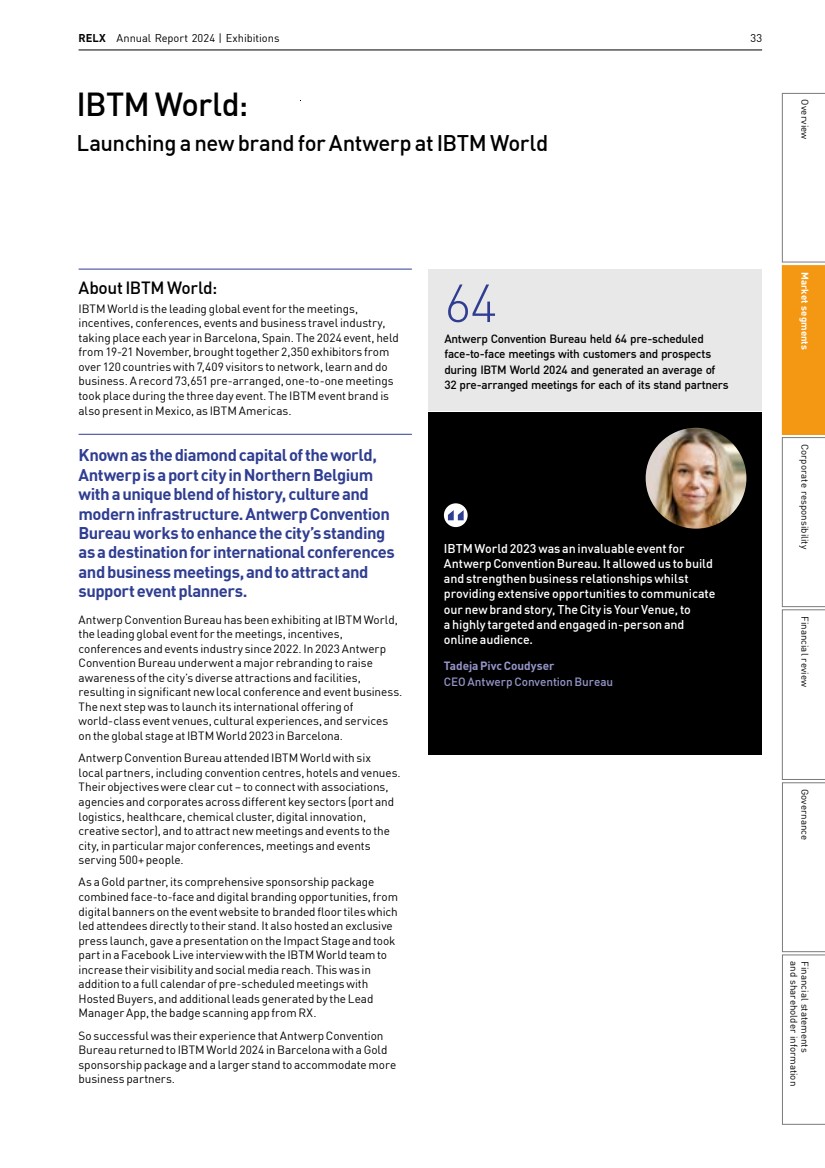
| 34 RELX Annual Report 2024 In this section 35 Corporate responsibility overview 38 Our unique contributions 42 Corporate responsibility governance 46 Customers 50 People 53 Community 57 Supply chain 60 Environment Corporate responsibility Contact details Your views are important to us. Please send your comments to: corporate.responsibility@relx.com Or write to: Dr Márcia Balisciano Global Head ofCorporate Responsibility RELX 1–3 Strand London WC2N 5JR United Kingdom For more information, visit: www.relx.com/corporateresponsibility |
| RELX Annual Report 2024 | Introduction 35 and shareholder information Financial statements Governance Financial review Corporate responsibility Market segments Overview Corporate responsibility overview We also align the objectives we set for our unique contributions, as well as those for the significant areas that affect all companies – governance, people, customers, community, supply chain and environment – with the United Nations Sustainable Development Goals (SDGs) to support the achievement of these 17 global goals by 2030. We pursue robust governance of CR issues for which the CEO is responsible to the Board. The leaders of our four business areas and our functional leaders all have accountability for our CR performance, reinforced by objective setting and monitoring by our CR Forum and the involvement of over 4,800 colleagues in our internal CR networks. Sustainable Development Goals (SDGs) We’re committed to doing our part to advance these essential objectives for the world. Throughout the Corporate Responsibility section of this report, SDG icons highlight the SDGs relevant to the content. Visit the RELX SDG Resource Centre www.sdgresources.relx.com CR priorities In this report we outline our approach to Corporate Responsibility (CR), our principal CR risks and how they map to our CR priorities, including operating with the highest ethical standards, meeting customer needs, attracting and retaining the right people, maintaining an ethical supply chain and managing climate risks. Corporate responsibility begins with the purpose of the company. RELX is a global provider of information-based analytics and decision tools for professional and business customers, enabling them to make better decisions, get better results and be more productive. Our purpose is to benefit society by developing products that help researchers advance scientific knowledge; doctors and nurses improve the lives of patients;lawyers promote the rule oflaw and achieve justice and fair results for their clients; businesses and governments preventfraud; consumers access financial services and getfair prices on insurance; and customers learn about markets, and complete transactions. Our purpose guides our actions beyond the products that we develop. It defines us as a company.AcrossRELX our employees are inspired to undertake initiatives that make unique contributions to society and the communities in which we operate. We act with the highest ethical standards, while using our strengths to make a positive impact on society. To us, CR is not a programme or prescriptive set of activities, it is how we conduct ourselves and our business on a daily basis. It is the responsibility of everyone at RELX. Our focus on CR gives us a long-term sustainable, competitive advantage. It inspires confidence in our stakeholders, and provides a licence to operate in the communities in which we live and work. It underpins our business strategy to deliver improved outcomes for our customers by combining leading content and data sets with powerful technologies. It helps us build leading positions in long-term global growth markets and leverage our skills and assets. We believe in timely, comprehensive reporting.Key non-financial metrics, including for environment, people and supply chain are independently assured. CR is an integral part of the statements ofthe Chair, CEO and CFO (see pages 3, 4, and 68 to 73 ). Corporate Responsibility starts with the positive impact we have on society through our products and services. Our focus on Corporate Responsibility enhances customer trust and underpins our overall business performance. Dr Márcia Balisciano Global Head of Corporate Responsibility, RELX Commitment to the United Nations Global Compact The United Nations Global Compact (UNGC) links businesses around the world with UN agencies, labour and civil society in support of Ten Principles encompassing human rights, labour, the environment and anti-corruption. We work to further UNGC principles within RELX and in our supply chain. We complete the Enhanced Communication onProgress annually and our Global Head of Corporate Responsibility serves on the Board of the Foundation for the Global Compact. For more information visit: www.unglobalcompact.org/ what-is-gc/participants/7909 |
| 36 RELX Annual Report 2024 | Corporate responsibility 2024 key corporate responsibility data 2020 2021 2022 2023 2024 Revenue (GBPm) 7,110 7,244 8,553 9,161 9,434 People Number of full-time equivalent employees (year end) 33,200 33,500 35,700 36,500 36,400 Percentage of women employees (%) 50 50 50 51 51 Percentage of women managers (%) 42 44 44 45 46 Percentage of women senior leaders (%)1 28 30 31 31 32 Percentage of ethnic minority US/UK managers (%) 17 19 19 20 21 Percentage of ethnic minority US/UK senior leaders (%)1 9 10 12 15 17 Community2 Total cash and in-kind donations (products, services and time (GBPm)) 9 10 12 12 12 Market value of cash and in-kind donations (GBPm) 18 21 23 23 23 Percentage of staff volunteering (%)3 26 32 36 36 37 Total number of days volunteered in company time 6,821 10,362 12,830 16,529 16,149 Health and safety (lost time) 4 Incident rate (cases per 1,000 employees) 0.11 0.07 0.17 0.30 0.15 Frequency rate (cases per 200,000 hours worked) 0.01 0.01 0.02 0.03 0.02 Severity rate (lost days per 200,000 hours worked) 0.07 0.02 0.36 0.41 0.25 Number of lost time incidents (>1 day) 3 2 5 9 5 Socially Responsible Suppliers (SRS) Number of key suppliers on SRS database5 412 359 724 796 914 Number of independent external audits6 99 111 119 125 137 Number of signatories to the Supplier Code of Conduct7 3,457 3,670 4,467 5,322 6,056 Environment 8 Total energy (MWh) 142,098 125,095 117,997 110,750 89,745 Renewable electricity purchased (MWh)9 120,710 105,793 98,013 92,621 77,412 Percentage of electricity from renewable sources (%)9 100 100 100 100 100 Waste sent to landfill (t)10 210 150 73 45 44 Percentage of waste diverted from landfill (%)10 91 93 97 97 97 Water usage (m3 ) 226,509 183,575 156,734 142,374 134,716 Climate change (tCO2e)8 Scope 1 (direct) emissions 5,217 5,644 5,211 4,317 2,703 Scope 2 (location-based) emissions 53,740 44,051 37,270 36,616 29,989 Scope 2 (market-based) emissions 11,384 8,321 8,952 8,598 6,971 Scope 3 (flights) Cirium’s EmeraldSky flight emissions methodology11 8,961 3,402 15,879 16,999 19,172 Scope 1 + Scope 2 (location-based) emissions 58,957 49,695 42,481 40,933 32,692 Scope 1 + Scope 2 (location-based) + Scope 3 (flights) emissions 67,918 53,097 58,360 57,932 51,864 Scope 1 + Scope 2 (market-based) + Scope 3 (flights) emissions 25,562 17,367 30,042 29,914 28,846 Paper Production paper (t) 36,259 40,910 28,466 22,561 18,949 Sustainable content (%)12 92 98 99 100 100 SDG Resource Centre Unique users 89,902 133,832 155,082 220,815 303,837 New content items 717 970 658 822 973 1 We define senior leaders as colleagues with a management grade of 17 and above. 2 Reporting period for Community metrics covers 12 months from December 2023 to November 2024. 3 All Group employees can take up to two days off per year, coordinated with line managers, to work on community projects that matter to them. Number of staff volunteering reflects the number of staff using volunteering hours, as well as those who participated in other Company-sponsored volunteer activities. 4 Accident reporting covers 94% of employees. 5 Key suppliers on the SRS list changes year-on-year based on our business needs and changes in country risk designations. 6 RELX utilises a third-party audit platform, which allows sharing of supplier audits across the platform. 7 Signatories to the RELX Supplier Code of Conduct include suppliers who have signed the Supplier Code and suppliers with an equivalent code. 8 Climate change and environmental data (carbon, energy, water, waste) covers the calendar year. 9 We purchase renewable electricity on green tariffs at locations in the UK and Europe. US Green-e certified Renewable Energy Certificates (RECs) are applied to electricity consumption in the US. US Green-e certified RECs are also purchased to equal 100% of any non-renewable electricity consumed outside the US; only location-based emissions factors are applied on this portion of non-US electricity consumption. 10 Waste sent to/diverted from landfill from reporting locations excluding estimates. In the year, the coverage of waste reporting locations represented 74% of total FTEs. 11 Covers all flights booked through our corporate travel partners in the calendar year. Uses the proprietary Cirium fuel-derived methodology, Emerald Sky. 12 Percentage of paper graded as known and responsible sources by the Book Chain Project or certified to Forest Stewardship Council (FSC) or the Programme for the Endorsement of Forest Certification (PEFC). Includes less than 0.1% of paper not yet graded or certified. Independently assured. See Independent Assurance Statement. Reporting guidelines and methodology are available on www.relx.com/additional-cr-resources |
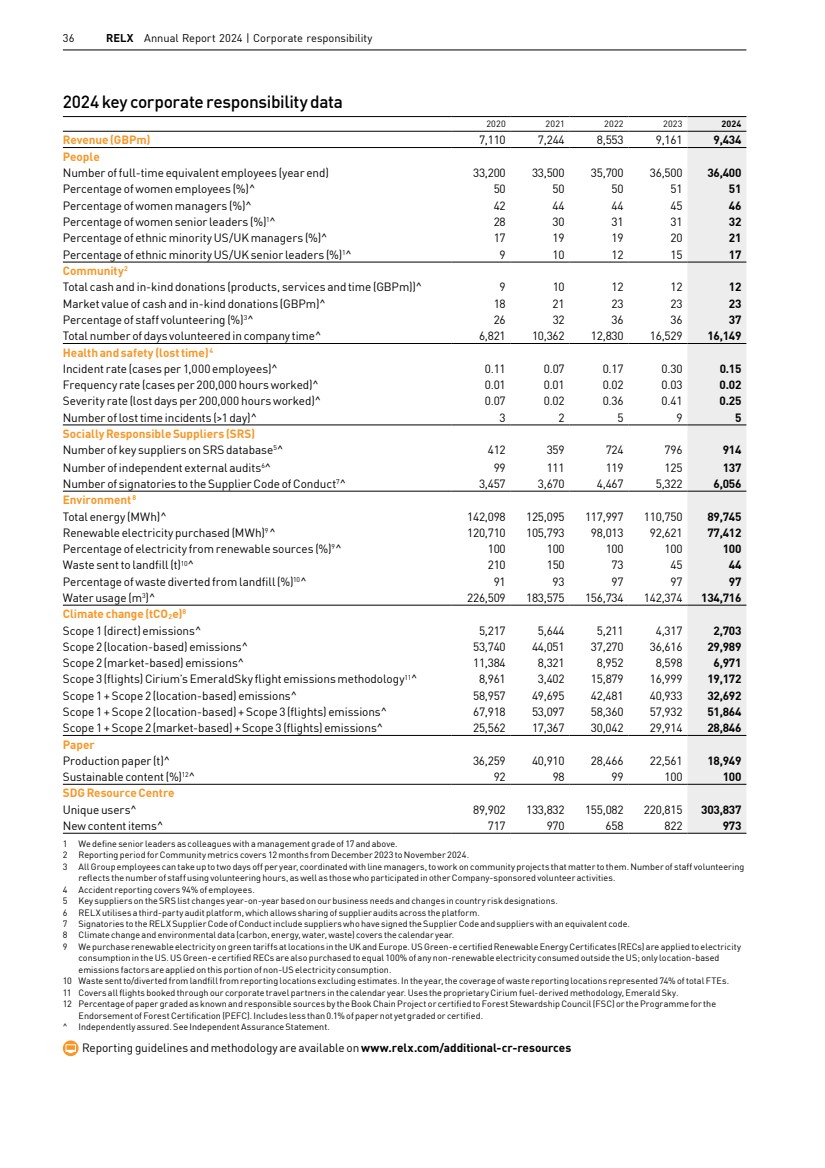
| RELX Annual Report 2024 | Introduction 37 and shareholder information Financial statements Governance Financial review Corporate responsibility Market segments Overview 2024 Corporate Responsibility recognition MSCI ESG Ratings • AAA rating Sustainalytics ESG Risk Rating • Sector (media): 2nd out of 265 S&P Global Sustainability Yearbook • Included Financial Times Europe’s Climate Leaders • Included ISS Corporate ESG Performance • Awarded Prime status FTSE4Good Index Included in: • FTSE4Good UK Index STOXX Global ESG Leaders Indices • Included ECPI World ESG Indices • Included CDP • Climate and Water programmes SOCOTEC ISO14001 •Group certification Workplace Pride Global Benchmark • Awarded Advocate status The Science Based Targets initiative (SBTi) • Near-term science-based emissions reduction targets approved 2024 awards for excellence Risk Scientific, Technical & Medical LexisNexis Risk Solutions won the Governance, Risk and Compliance Solution of the Year category at the Asia RiskAwards LexisNexis Risk Solutions ranked fourth overall in Chartis Research’s 2024 Financial Crime and Compliance 50 Elsevier won gold at the Employer Brand Management Awards for Best Ongoing Commitment to Employer Brand Elsevier’s ClinicalKey AI won the Pioneer in Healthcare AI Award at the Times Network India Health Awards Legal Exhibitions LexisNexis Legal & Professional was named as the Best Overall AI Company at the AI Breakthrough Awards LexisNexis Legal & Professional was named as Best Company for Global Culture by Comparably RX Germany was named the winner of the UFI Marketing Excellence Award RX won the Best Sustainability Initiative Award at the AEO Excellence Awards as well as the Technology Innovation award for MCM Comic Con and Organiser Team of the Year for ReedPop |
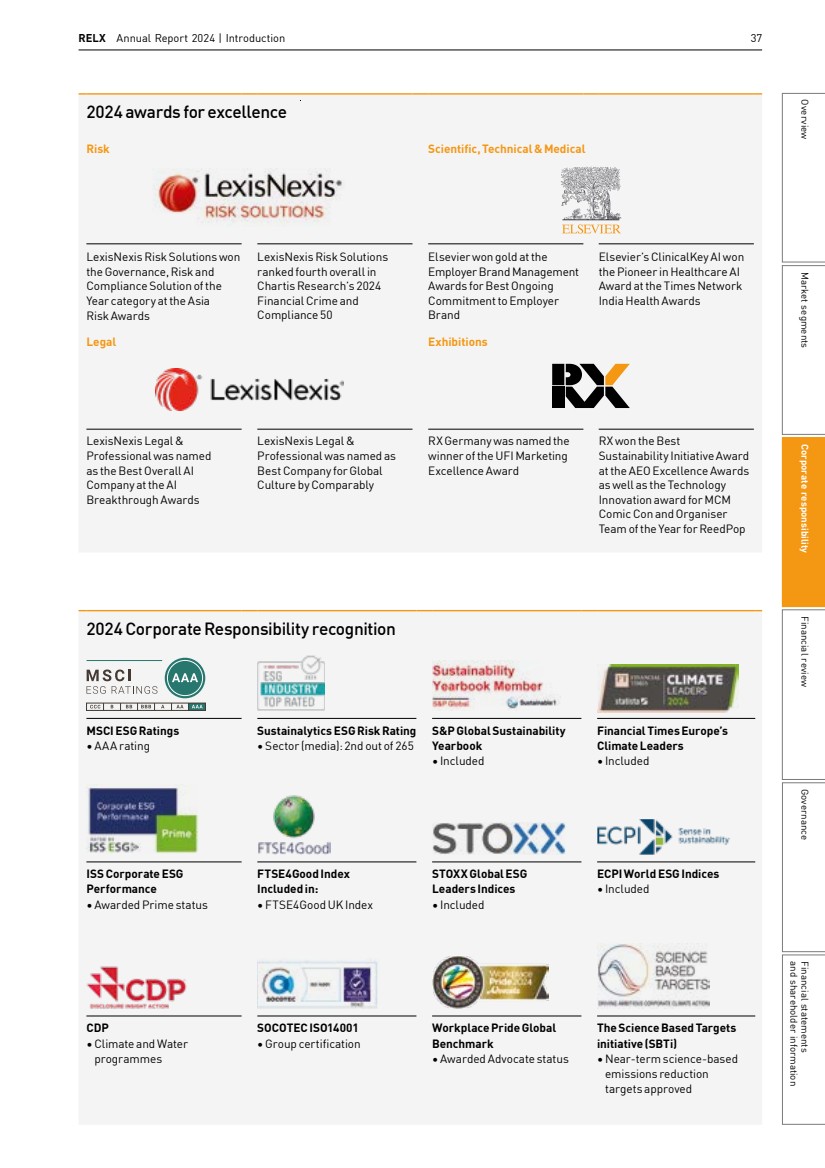
| Relevant SDGs 38 RELX Annual Report 2024 | Corporate responsibility Our solutions increase financial inclusion globally by allowing more people without traditional credit histories to access credit inorder to pursue their aspirations, while lenders gainmore confidence in expanding access to their financial services. Kevin King VP Market Planning, Credit Risk Decisioning LexisNexis Risk Solutions Our unique contributions In the every-day conduct of our business, we make a positive impact on society through our unique contributions. Risk LexisNexis Risk Solutions’ products and services help protect society by detecting and preventing fraud, helping citizens securely access vital government benefits, and assisting law enforcement to keep communities safe. A number of Risk products, such as LexisNexis ThreatMetrix, aim to reduce online fraud or, in the case of LexisNexis Identity Verification Solution, prevent theft, helping customers recognise trusted transactions and reduce fraud losses. LexisNexis Emailage Rapid analyses customer email addresses and other information to flag fraud risks in insurance applications, helping to identify fraudulent activities without disrupting the customer experience. Risk was recognised for its contributions to fraud prevention through data-driven insights at the Insurance Post Claims and Fraud Awards 2024. The ADAM programme was developed by Risk to help the National Center for Missing and Exploited Children (NCMEC) find missing children. Risk technology quickly distributes missing child poster alerts to law enforcement, hospitals, and the public in specific geographic search areas. In 2024, ADAM distributed nearly 1.4malerts featuring over 1,950 missing children which helped NCMEC resolve over 1,380 missing child cases. Our data privacy principles, governance structures and control programmes help ensure data privacy requirements are met and personally identifiable information is protected. We prioritise individuals’ privacy concerns across all jurisdictions where we operate. We work with established privacy advocacy groups, federal and state legislators and other interested parties and always operate within relevant legal, regulatory, ethical and best practice frameworks. Risk’s products and services align with SDG 16 (Peace, Justice and Strong Institutions) and SDG 10 (Reduced Inequalities), among others. 2024 PERFORMANCE DecisionTrust pilots undertaken in eight countries to advance financial inclusion Financial inclusion is fundamental to improving the financial wellbeing of communities around the world. With adequate wages and access to appropriate financial tools, citizens are lifted out of poverty, (SDG 1); avoid hunger (SDG 2); have better health (SDG 3); are more likely to receive quality education (SDG 4); and more women are likely to aid the financial well-being of their communities (SDG 5), among other SDGbenefits. Worldwide, the World Bank estimates that 1.4bn adults lack access to formal financial services. Without access to basic transaction accounts, they lack a traditional credit record and are excluded from financial opportunities. The problem is often magnified in low-income countries, given gaps in identity verification and credit risk assessment. Risk’s DecisionTrust uses transactions across a global digital identity network to provide lenders with enhanced insights thus allowing them to better assess borrowers, particularly people with no credit record. In 2024, DecisionTrust signed three more commercial contracts and conducted 16 additional pilots in Colombia, Italy, Japan, Netherlands, Poland, Portugal, Spain and Mexico. DecisionTrust has now conducted 50 pilots globally reinforcing the use of alternative data in credit decision models, generating positive social impact by giving more people access to credit products that would traditionally be out of their reach. Universal, sustainable access to information Advance of science and health Protection of society Promotion of the rule of law & access to justice Fostering communities |
| RELX Annual Report 2024 | Our unique contributions 39 Legal Through its content, data and analytics, LexisNexis Legal & Professional supports the four components of the Rule of Law:transparency of law, equality under the law, independent judiciaries and accessible legal remedy. Its global legal and news database contains 161bn documents and records providing transparency of the law in around 180 countries and territories, with some 1.6m new legal documents added daily. In the year LexisNexis Legal & Professional completed a five-year project with the Cook Islands to consolidate their laws and make them freely available online, improving transparency and accessibility for citizens, local legal practitioners and the global community. LexisNexis Legal & Professional partners with the International Bar Association (IBA) on the eyeWitness to Atrocities App, which allows human rights defenders to document and report human rights abuses in a secure and verifiable way so information can be used as admissible evidence in relevant forums. LexisNexis Legal & Professional utilises its data hosting capabilities to provide a secure repository for the information collected. Over 70,000 photos and videos have been captured with the app since 2015. In 2024, the LexisNexis Legal & Professional US Voting Laws and Legislation Center was named a finalist by the World Justice Project for the US Building Trust Prize, a global competition for advancing rule of law and democratic resilience. The US Voting Laws and Legislation Center is a free resource offering public access to insights on proposed bills, codes and real-time updates for the most accurate data. Since 2008, LexisNexis Legal & Professional has partnered with leading industry associations to recognise individuals and organisations for their commitment to the Rule of Law. 2024 award honourees include Vineetha MG, recipient of the IBA ProBono Award; Olga Olegovna Mikhaylova, Vadim Dmitrievich Kobzev and Alexey Evgenyevich Liptser, recipients of the Union Internationale des Avocats/LexisNexis Rule of Law Award; and Mashal Aamir, recipient of the IBA Outstanding Young Lawyer ofthe Year Award, jointly established by Legal and the IBA Young Lawyers Committee, to honour young lawyers who have demonstrated excellence, commitment to professional and ethical standards, and dedication to the community at large. LexisNexis Legal & Professional advances SDG 16 (Peace, Justice and Strong Institutions) through its products and services that promote the Rule of Law. Scientific, Technical & Medical Elsevier plays an important role in advancing scientific knowledge and human welfare through its science and health information, which spurs innovation and enables critical decision-making. In serving the global scientific research community, Elsevier published over 720,000 articles in 2024. To broaden access to its content, Elsevier supports programmes in places where resources are often scarce. Among them is Research4Life, a partnership with UN agencies and over 200 publishers through which we provide core and cutting-edge scientific information to researchers in 125 low- and middle-income countries. As a founding partner and leading contributor, Elsevier provides around 16% of the material available in Research4Life, encompassing approximately 5,500 journals and 35,500 e-books. In 2024, there were over 1.3m Research4Life downloads from Elsevier’s research platform, ScienceDirect. In 2024, the Elsevier Foundation supported Research4Life’s Country Connectors initiative, heightening awareness and use of Research4Life content, building communities of users through national focal points across Africa. Connectors create tailored networking, promote skills building and empower users to drive change in their communities. SSRN is Elsevier’s preprint and early-stage research platform. It allows researchers around the world to openly share their work so that it is freely available to others in their field and the wider research community, promoting discussion, collaboration and an exchange of ideas. In 2024, over 1,100 Elsevier journals offered researchers the opportunity to simultaneously submit a paper for publication and also post it as a preprint on SSRN. Elsevier makes a significant contribution to SDG 3 (Good Health and Well-Being), SDG 5 (Gender Equality), SDG 10 (Reduced Inequalities) and SDG 13 (Climate Action). 2024 PERFORMANCE The Elsevier Foundation’s Chemistry forClimate Action Challenge supports women-led projects focused on sustainable solutions to climate change Elsevier works to build capacity and equity in research and health for an inclusive and sustainable future. The Chemistry for Climate Action Challenge is one of the Elsevier Foundation’s flagship partnerships with Elsevier’s chemistry journals, aimed at discovering chemistry-based solutions to advance climate action. In 2024, two projects were selected from over 90 entries and received 25,000 euros in funding. Dr Altantuya Ochirkhuyag, a researcher in environmental chemistry at the Mongolian Academy of Sciences Institute of Chemistry and Chemical Technology, won for their work using volcanic rocks for wastewater treatment, while BIOPOLIMER Research Group at Universidad de Antioquia in Colombia won for using mycelium biomaterials for waste management. The Challenge supports SDG 5, Gender Equality, recognising the role women play in combating climate change. Market segments Governance and shareholder information Financial statements Financial review Corporate responsibility Overview |
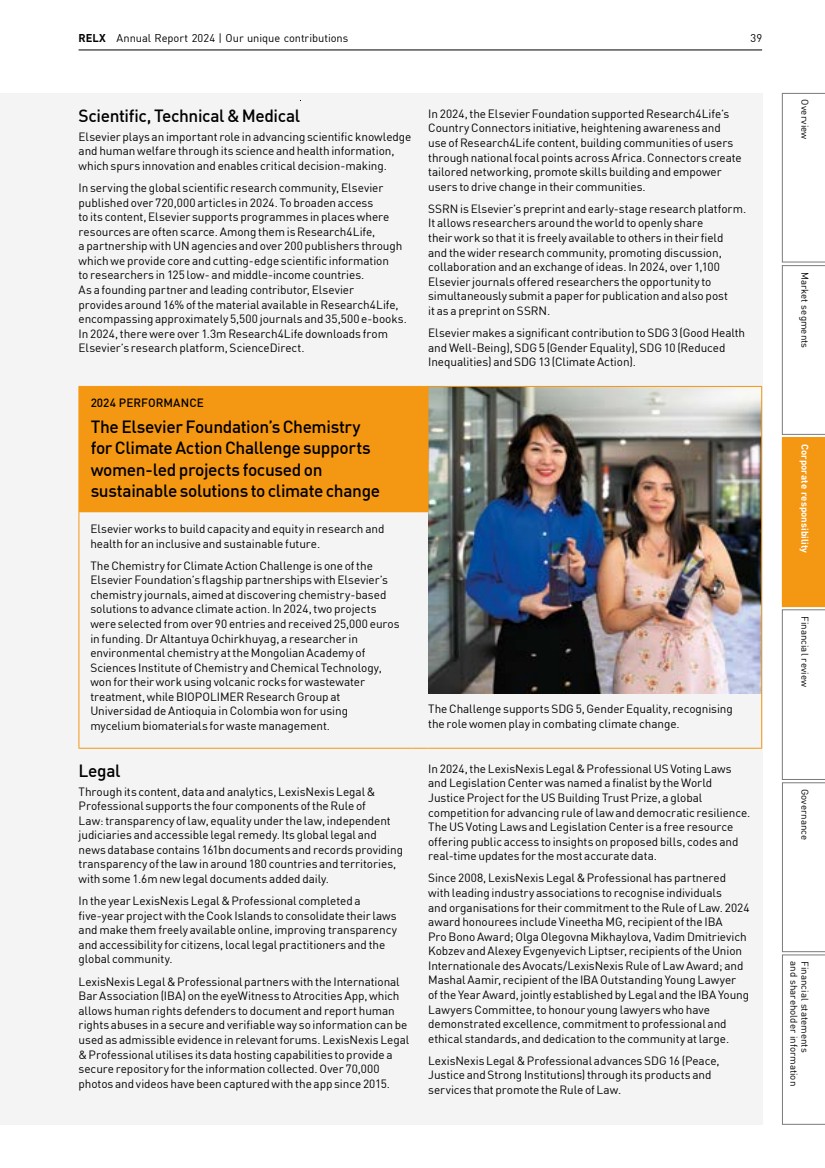
| 40 RELX Annual Report 2024 | Corporate responsibility Exhibitions Exhibitions helps to foster communities by connecting customers face to face and digitally, allowing them to learn about markets, source products and complete transactions. In 2024 performance exceeded pre-pandemic levels, highlighting the importance participants place on connecting and doing business in person, allowing them to see many customers and suppliers at one time. Increasing numbers of customers took advantage of new RX digital and data analysis tools to source business solutions and suppliers, capture and qualify more leads, and analyse and improve their event performance. Among our hundreds of activities and shows there were some remarkable milestones achieved in 2024. RX’s All-Energy and Dcarbonise exhibition broke all previous attendance records in 2024 with more than 7,000 attendees across 57 sessions looking at policy, ambitions, challenges, opportunities and innovative solutions in renewable power, low carbon heat and low carbon transport. The 16th edition of RX’s World Future Energy Summit achieved significant participation, highlighting its importance within the climate change and sustainability ecosystem, with three new forums: Green Finance, eMobility and Pathway to 1.5C. In the year, RX published a Guide to Creating Inclusive Events designed to help event organisers add value by ensuring all attendees and event participants feel welcome, seen, and safe at our events. RX events strengthen communities and support SDG 9 (Industry Innovation and Infrastructure), SDG10 (Reduced Inequalities), SDG 12 (Responsible Consumption and Production) and SDG 17 (Partnerships for theGoals). In addition, RX supports SDG 13 (Climate Action) through our Net Zero Events commitments and by using its event platforms to drive industry engagement in a net zero carbon future. 2024 PERFORMANCE Advance United Nations Global Compact’s transformational governance initiative 2024 PERFORMANCE RX carbon reduction action plan to support RX’s Pathway to Net Zero Roadmap Over a two year period, the UNGC worked with stakeholders to define the concept of transformational governance, which calls on business to be more accountable, ethical, inclusive and transparent to drive responsible business conduct, improve corporate responsibility performance and strengthen public institutions and laws. In the year, we hosted the launch of the Transformational Governance Corporate Toolkit in the United Kingdom, bringing together members of the legal community, customers and peers, to highlight the free tool which helps companies go beyond legal minimums to advance the rule of law. We moderated a panel on transformational governance at the UNGC’s 2024 Leaders Summit and made it a feature of our 2024 Supplier Sessions which engage suppliers in discussions on key sustainability topics. We made relevant content available on the RELX SDG Resource Centre and supported the UNGC’s Think Lab on Business Integrity and new Legal Network. This work supportsSDG 16. In February 2024, RX published its Roadmap to Net Zero in 2040, which outlines key milestones in the journey to decarbonisation. Shared during a Net Zero Carbon Events (NZCE) webinar for the exhibition industry, it builds on RX’s 2023 Sustainability Playbook to guide event and operations teams in making more sustainable choices. The RX Sustainability Council are working to introduce carbon reduction goals to support the roadmap. To celebrate World Environment Day 2024, sessions were held to build internal awareness and share best practices from across the business, including In Cosmetics Global, MIPIM and RX Australia. In the year, RX piloted a Sustainable Stand Award at two shows to incentivise exhibitor best practice and continued to collect data using the stand footprinting tool, developed internally and aligned with NZCE. 190 exhibitions stands have been footprinted, helping RX understand carbon emissions per square metre. Recognising waste is a big challenge for the industry, a number of events concentrated on waste reduction Find out more about the Transformational Governance Corporate Toolkit at www.unglobalcompact.org/what-is-gc/ our-work/governance/transformational-governance/ transformational-governance-corporate-toolkit and management, including ISC East and West which piloted a zero waste to landfill initiative, and ATM at Dubai World Trade Centre which held contractor training sessions to support more sustainable stand materials. RX France was named a finalist in the 2024 UFI Sustainability Awards for innovative approaches to event sustainability; Renodays, one of the first RX France shows designed to be fully eco-responsible and Pollutec, a showcase of innovation in environmental and energy solutions. |
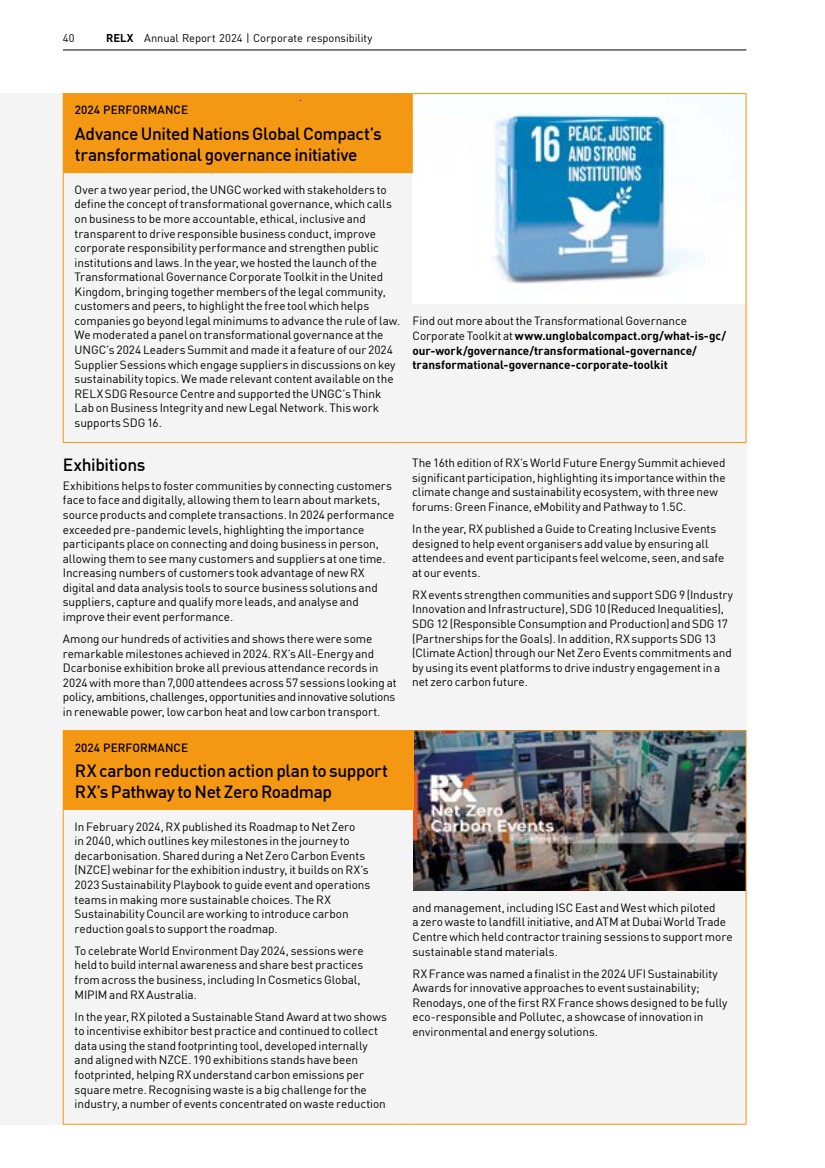
| RELX Annual Report 2024 | Our unique contributions 41 2025 objectives By 2030 Protection of society – Deploy financial inclusion flagship models which allow lenders to more easily detect fraud and other high-risk consumer behaviour, in support of SDG 10 (Reduced Inequalities) Advance of science and health – Advance the research by women scientists in collaboration with the Falling Walls Foundation, providing access to resources, networks and training; partner with Indian public health platform, Swasti, to equip frontline workers with knowledge and skills to address the impact of extreme weather on human health, in support ofSDG 10 (Reduced Inequalities) and SDG 13 (Climate Action) Promotion of the rule of law and access to justice – Provide research and training to Afghan women studying for law degrees in the United States in association with the American Bar Association, in support of SDG 16 (Peace, Justice and Strong Institutions) Fostering communities – Create RX energy and waste emissions dashboard to monitor performance and publish RX event energy and waste emissions, in support of SDG 13 (Climate Action) Universal, sustainable access to information – Increase the number of unique users of the RELX SDG Resource Centre by atleast 10,000 additional unique users in the year Use our products and expertise to advance the SDGs, among them: SDG 3 (Good Health And Well-Being) SDG 10 (Reduced Inequalities) SDG 13 (Climate Action) SDG 16 (Peace, Justice and Strong Institutions) Enrich the SDG Resource Centre to ensure essential content, tools and events on the SDGs are freely available to all RELX SDG Resource Centre, Inspiration Day and Environmental Challenge Recognising that across RELX we have products, services, tools and events that advance the UN’s 17 SDGs, we created the free RELX SDG Resource Centre in 2017 to advance awareness, knowledge and implementation of the SDGs. Since 2017, we have made over 2,300 journal articles and book chapters free to access via the RELX SDG Resource Centre which would have otherwise cost more than £5m to make open access. We held our annual RELX SDG Inspiration Day during the year with a focus on the use of AI to advance the SDGs, giving thought leaders, corporate representatives, investors, governments, and NGOs a platform to discuss challenges and opportunities for collaboration. Keynote speakers included 8th Secretary General of the United Nations, Ban Ki-moon, author and founder of The Futurwise Institute, Dr Mark van Rijmenam and co-founder of Global Citizen, Michael Sheldrick. Since 2011, the RELX Environmental Challenge has been awarded to projects that best demonstrate how they can provide sustainable access to safe water and sanitation where itis presently at risk. In 2024 the $50,000 first prize winner was Living Water Systems which developed a low cost, portable, rainwater harvesting system. The $25,000 second prize winner was Permalution whose innovative technology collects water from fog and clouds. For more information see page 64. 2024 PERFORMANCE Increased number of unique users ofthe RELX SDG Resource Centre In 2024, we added 973 new content items to the RELX SDG Resource Centre bringing the total to 5,794, an increase of 20% over the previous year. We published 14 special issues in 2024 featuring curated articles, book chapters and other content on critical topics. This included an AI special collection to coincide with the RELX SDG Inspiration Day, providing the over 1,100 attendees, and others, with additional resources on the subject. There were more than 300,000 unique users in 2024, a 38% increase over 2023, exceeding our target of 15%. 38% Increase in unique users of the RELX SDG Resource Centre since 2023 Market segments Governance and shareholder information Financial statements Financial review Corporate responsibility Overview |
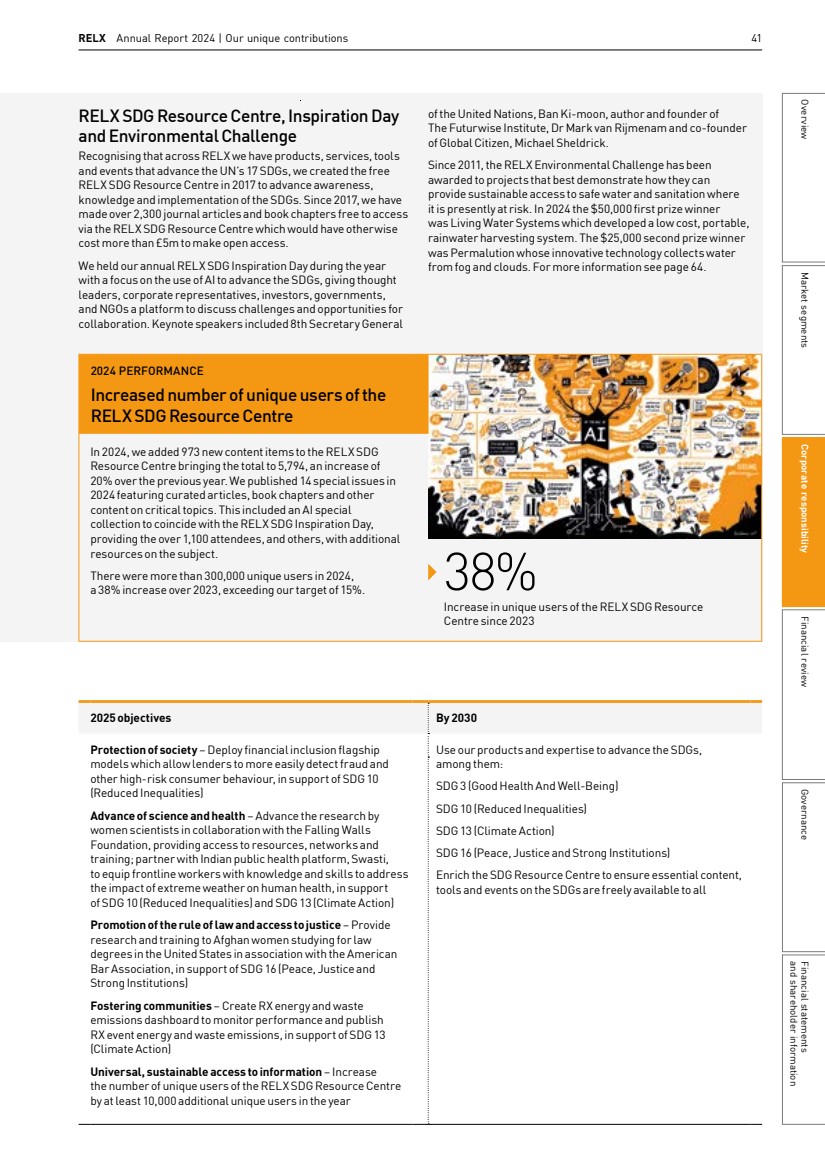
| Relevant SDGs 42 RELX Annual Report 2024 | Corporate responsibility CR Governance and reporting Our Board recognises the importance of maintaining high standards of corporate governance, which underpins our ability to deliver consistent financial performance, and value to our stakeholders, aligned with RELX’s values of doing business with integrity. The Board has oversight responsibility ofRELX’s corporate governance and its role and function is explained fully in the Corporate governance section (see pages 82 to 129). TheBoard and the Audit Committee of the Board regularly receives presentations from the Chief ComplianceOfficer on matters arising under our ethics and compliance programmes. In addition,theChief LegalOfficer & Company Secretary, who reports directly to the CEO and theChair, maintains responsibility for implementing the ethics and compliance programmes. Governing policies set out our stance on key issues and are publicly available at www.relx.com/cr-downloads. These include the RELX Code of Ethics and Business Conduct, the Code ofEthics forSenior FinancialOfficers,the Supplier Code ofConduct, Tax Principles, Privacy Principles, Inclusion andDiversity Policy, Health and Safety Policy, Editorial Policy, ResponsibleArtificialIntelligencePrinciples,Quality First Principles and Product Donation Policy. Helping our people pursue the highest standards of integrity Doing the Right Thing is more than a phrase at RELX, it embodies principles that represent RELX’s culture of integrity. This includes ensuring respect for one another, incorporating ethics in all our actions; growing our business with integrity; holding ourselves and each other accountable; and taking time to ask questions and report concerns. Doing the Right Thing is underpinned by clear actions for employees, among them, being honest in our dealings with others, respecting the law, our policies and colleagues; and courageously speaking out for what is right. RELX in turn provides relevant training and resources; enables a culture where people can feel comfortable speaking up and experience no retaliation when they do; and ensures concerns are listened to and acted on in a fair and timely manner. The RELX Code of Ethics and Business Conduct (the Code) is a guide to our corporate and individual behaviour. In 2024, it was updated and shared with staff globally by the CEO. It is at the heart of our compliance activities, which encompass clear policies and procedures; risk assessments; training and communication; and robust reporting mechanisms, investigations, monitoring and auditing of internal controls. Corporate responsibility governance Our purpose, strategy, values and culture deliver the very highest standards of corporate governance and responsibility. A strong compliance programme isnot only about following the rules. It’s about integrity; creating and keeping trust; and ensuring a business culture based on values that generates long-term success. Alexandra Smyth General Counsel, LexisNexis Legal & Professional and RX Our CR governance framework The CEO has responsibility to the Board for CR. They and senior management, as well as the CR Forum, chaired by a senior leader and involving individuals representing key functions and business areas, set and monitor CR performance. This includes our annual and longer term CR objectives, which reflectthe views of a range of internal and external stakeholders. More information can be found on www.relx.com/additional-cr-resources. The Global Head of Corporate Responsibility provides formal updates to the Board and engages on key issues with senior managers, who have CR-related Key Performance Objectives (see page 106). Board CEO Business area CEOs CR Forum Global Head ofCorporate Responsibility and CR Team Compliance Committees RELX CR networks |
| RELX Annual Report 2024 | Corporate responsibility governance 43 Reports are investigated and action is taken accordingly if reports are substantiated. Substantiated reports result in additional training, coaching, policy changes, control enhancements, and/or disciplinary action. Report themes are reviewed by senior leadership to assist in measuring the effectiveness of reporting channels, identifying risks and areas to allocate Compliance programme resources. RELX has investigated or is in the process of investigating 372 reports of alleged Code violations received in 2024 through the RELX Integrity Line or through the other ReportingChannels identified in theCode.Approximately 48% ofthose reports where the investigation is complete have been substantiated. Public Policy, Anti-Bribery and Sanctions We engage in public policy discussions that matter to our business and our customers. We strive to help policymakers around the world understand our business, innovations and contributions to the public interest. Lobbying activities on behalf of RELX Inc. are managed by theRELX Government Affairs team, and, in coordination with our legal teams, are vetted, tracked and reported as required by law. Consistent with our commitment to fostering a culture of integrity including through good governance, RELX has a supplemental policy and training for our employees that specifically relate to engagement with government officials and agencies. The Code and related supplemental policy also address corporate political contributions, which are strictly prohibited except in the US, where such contributions and activities are permitted in certain states within allowable limits, if they comply with stringent reporting and disclosure regulations. Corporate political contributions require senior level review and approval. Corporate contributions are reported as required by law. Contributions are made on a bipartisan basis and no funds are donated for presidential campaigns or any other federal-level campaigns. We remained diligent through the year in our ongoing efforts to comply with applicable bribery and sanctions laws and mitigate risks in these areas. Our anti-bribery and sanctions programmes include detailed, risk-based internal policies and procedures on topics such as doing business with government officials, gift and entertainment limits, gift registers, and complex sanctions requirements. Relationships with third parties and acquisition targets are evaluated for risk using one or more of the following methods, including questionnaires, references, detailed electronic searches, and Know Your Customer screening tools. We monitor and assess the implementation of our anti-bribery and sanctions programmes by continually reviewing and updating our policies and procedures; conducting periodic programmatic risk assessments; and conducting quality reviews and internal monitoring and audits of the operational aspects ofthe programmes. We engage with our employees about compliance through digital communications and other media, including videos and animation. To raise awareness during Compliance Week 2024, we held the RELX Integrity Challenge and recognised outstanding employee contributions to our culture of integrity with Integrity Hall of Fame inductions. The Code supports the principles of the United Nations Global Compact (UNGC) and stresses our commitment to human rights. In accordance with the UN’s Guiding Principles on Business and Human Rights, we consider where and how we operate to avoid human trafficking and modern slavery in our direct operations and our supply chain. As stated in our Modern Slavery Act Statement, available at www.relx.com, we stand against all forms of slavery and human trafficking. We do nottolerate itin any part of our business, including our supply chain. As a UNGC signatory we uphold its Ten Principles related to human rights, fair and non-discriminatory labour practices, the Ethics and compliance policies, procedures, training, reporting and tracking Read our Code of Ethics and Business Conduct at www.relx.com/cr-downloads Our Code encompasses a wide range of issues including fair competition, anti-bribery, conflicts ofinterest, employment practices, data protection and appropriate use of company property and information. To help employees comply with applicable laws, we supplement the Code with other policies in areas critical to our business, including anti-bribery, competition, doing business with government, data privacy and security, trade sanctions and workplace conduct. We communicate on compliance issues using a range of media, including video. We require cyclical mandatory training on the Code and other policies for all employees, including temporary staff and apprentices, with in-person and other training for those in higher risk roles and locations. We encourage reporting of violations, with an anonymous reporting option where legally allowed. The RELX Integrity Line is available 24 hours per day, 365 days a year, and is maintained by an independent third party. Compliance Committees oversee investigations and help ensure remediation and ongoing monitoring as required. We do not tolerate retaliation for colleagues who raise concerns. The number of reports received is publicly available on our website www.relx.com/investors/corporate-governance/code-of-ethics We formally audit the compliance programme, including the Code, every three years. 99+%� Completion rate for all courses within 90 days ofissuance Independently assured 13 Our Code of Ethics and Business Conduct is available in 13 languages Channels for raising concerns We offer several reporting channels to report Code-related concerns, including managers, human resources staff, Compliance committee members and company lawyers. We also provide the Integrity Line, hosted by an independent third-party, and available to employees, suppliers and other reporting persons by telephone or online 24 hours a day, 365 days a year. The Integrity Line also includes anAskAQuestion feature which allows employees to seek ethical advice before taking action. More information about these reporting channels is detailed in theCode, the RELX Reporting Concerns Policy and supplemental country-specificReportingConcerns Notices available on www.relx.com. These documents prohibit retaliating against individuals who raise concerns or participate in an investigation. Market segments Governance and shareholder information Financial statements Financial review Corporate responsibility Overview |
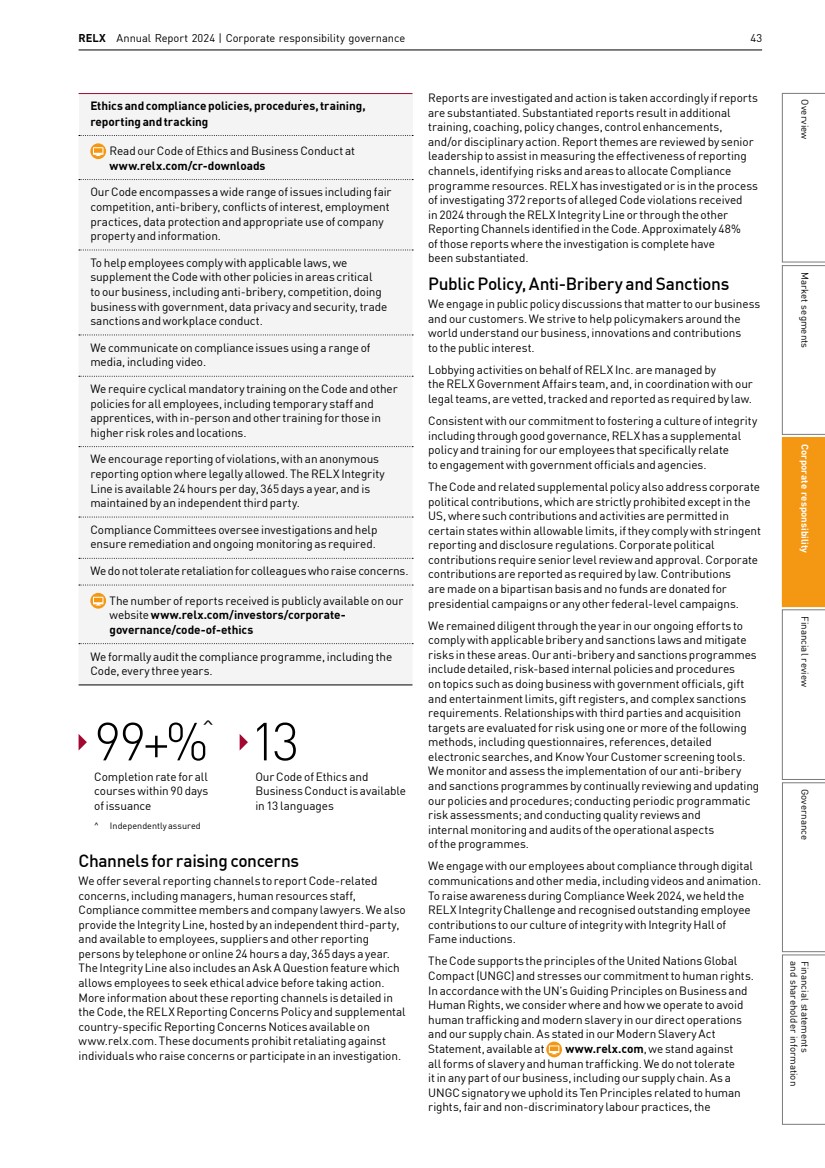
| 44 RELX Annual Report 2024 | Corporate responsibility environment, and anti-corruption. Our policies are also informed by the Universal Declaration of Human Rights, the OECDGuidelines for Multinational Enterprises, the UN Guiding Principles on Business and Human Rights, the International Labour Organisation (ILO) Declaration on Fundamental Principles and Rights at Work and the Women’s Empowerment Principles. Data privacy Data is integral to the solutions we provide that further our unique contributions as a business, including protecting consumers from the risk of fraud; allowing secure online transactions; improving access to financial, healthcare and government benefits; and delivering high quality medical care. Recognising concerns and sensitivities around personal data, our commitment to data privacy remained a critical RELX priority in 2024 and continues to be supported by strong governance, transparency and accountability. Dedicated privacy teams implemented requirements for compliance with personal data protection regulations around the globe. In the United States, RELX continued to advocate for privacy laws that protect consumers, bolster consumer trust and allow businesses to investin data-driven activities that serve the public interest. RELX companies in the US participating in the Data Privacy Framework programme renewed their self-certification in the year. We proactively take into account privacy concerns in developing and offering our solutions. Our Privacy Principles, available at www.relx.com/corporate-responsibility/being-a-responsible-business/privacy-principles, guide our approach to the responsible collection and use of personal data and are supplemented by privacy policies and guidance from our privacy officer to respond to new requirements, best practices and expectations. We undertake activities and training that deepen employee awareness about data privacy. For Data Privacy Day 2024, we celebrated the winners of the annual RELX Privacy Principles Champions Competition, which recognises the achievements of employees in protecting personal data and implementing ourPrivacy Principles. For APAC Privacy Awareness Week 2024, we organised internal panel discussions focused on privacy,AI and trust. 2024 PERFORMANCE Enhanced processes for conducting privacy and data protection impact assessments Privacy impact assessments (PIAs) and data protection impact assessments (DPIAs) are important mechanisms for identifying and mitigating risks arising from the processing of personal data. In 2024, RELX privacy teams enhanced the processes for conducting PIAs and DPIAs by streamlining the questionnaires used to conduct the assessments and by clarifying user guidance used to facilitate their completion. This activity aligns with SDG 16. Cybersecurity We observed CyberSecurity Awareness Month with both central and business specific initiatives aimed atimproving security understanding for employees. The theme for 2024 was Secure Our World. Events included blogs, contests, and games on cybersecurity themes, including emerging threats, the dark web, security best practices, social engineering, malware, and artificial intelligence. We implemented common, consistent sensitivity labels with automated protections for our users in email, document, and spreadsheet applications. In the year, more than 99% of employees were included in monthly phishing simulation exercises. During 2024, we continued to enhance our security efforts with additional infrastructure monitoring capabilities both internally and through third parties. We completed more than 4,000 security related requests, questionnaires and audits for our customers in the year. In addition we engaged third parties to perform independent audits on certain of our products and services, which build trust and assurance in our target markets, especially where sensitive personal information is involved. For example, we have completed external audits on our Risk data centres in the US and our ScienceDirect, Lexis+ and Lexis+ AI products; in addition, ourUK Risk products have been ISO27001 certified. More than 50% of the product revenue from our three largest business areas is covered by a third-party audit. 2024 PERFORMANCE Enhanced our technical resilience posture and expanded applications and products covered by independent third party assessments We invested around $5m in 2024 across our business to enhance our technical resilience posture. This included initiatives in application dependency analysis, defining triage recovery order, implementation of resilient backups, and recovery testing, both desk-based and technical. Additional efforts will follow in 2025 to expand the scope of technical resilience applications and perform robust recovery testing. These activities align with SDG 16. Pensions and investments The Statement of Investment Principles for our UK pension scheme demonstrates that the Trustee recognises that consideration of financially materialfactors, including corporate responsibility and climate risk, is relevant at different stages ofthe investment process. As long-term investors, the Trustee embeds consideration of such factors in its investment decision-making as they can have a material impact on risk and return. The Trustee has produced a Responsible Investment Policy which has been shared with all investment managers. During the year, the Trustee Board received a presentation on responsible investment and the Responsible Investment Sub-Group met on a number of occasions. Furthermore, the Trustee submitted its Taskforce on Climate-Related Financial Disclosures (TCFD) report in the year. CR issues are also relevant to the investment decisions made byRE Venture Partners, RELX’s corporate venture arm. REV continues to invest in ethical AI, sustainable food technology and the creation of inclusive content for language learning. Independently assured |
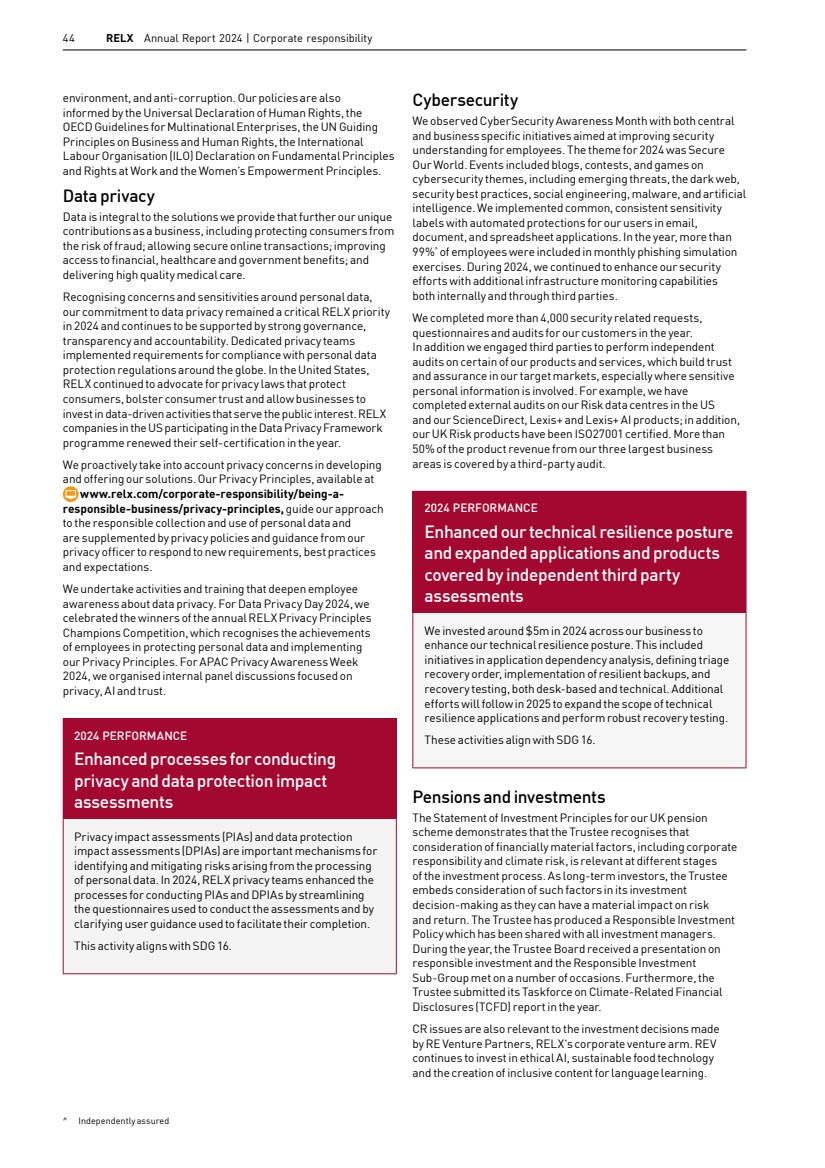
| RELX Annual Report 2024 | Corporate responsibility governance 45 2025 objectives By 2030 Security – Continued enhancement of our technical resilience posture across the business and expansion of products and applications covered by independent third-party assessments, aligned with SDG 16 (Peace, Justice and Strong Institutions) Privacy – Optimise maintenance of records relating to processing activities, aligned with SDG 16 (Peace, Justice andStrong Institutions) Responsible tax – Continue to advance African tax law codification pilot, aligned with SDG16 (Peace, Justice and Strong Institutions) Continued progressive actions that advance excellence in corporate governance within our business and continue providing information, tools and analytics that promote high standards of corporate governance by our customers 2024 PERFORMANCE Continued advancement of African tax law codification pilots Taxes provide governments with the essential revenue necessary for public services that benefittheir citizens. Governments need codified tax laws to know when, how much and from whom they should be collecting.Citizens need codified and transparenttax laws to understand their liabilities and to advocate for fair collection and use of their remittances. Unfortunately, in many countries around the world, it is difficult for tax authorities and taxpayers alike to access tax law in a complete, up-to-date and consolidated form. Over the course of three years, the LexisNexis Rule of Law Foundation, LexisNexis South Africa and the tax team at RELX worked on a pro bono basis with Ethiopia’s government to translate that country’s tax laws from Amharic into English, to consolidate those tax laws in both English and Amharic, and to ensure that,for the firsttime,they are published and freely accessible on the websites of the Ethiopian Ministry of Finance, Ministry of Revenue, and Customs Commission. The consolidated tax laws can now be accessed at www.mofed.gov.et (under ‘Resources’ and ‘Consolidated tax laws’), making an important contribution to Ethiopia’s economic development. When the project was started, it was based on three main objectives: improving accessibility, transparency and efficiency. The fact that the tax laws are translated and organised inEnglish and made accessible to theuser on the website is of great importance to the efforts of Ethiopia to accelerate its growth and development according to the macroeconomic reform and to become a member oftheWorld Trade Organization. The Honourable Dr Eyob Tekalign State Minister of Fiscal Policy and Public Finance, Ethiopia Ministry of Finance A responsible taxpayer Taxation is an important issue for us as well as our stakeholders, including our shareholders, governments, customers, suppliers, employees and the global communities in which we operate. We are transparent about our approach to tax. At www.relx.com/ go/TaxPrinciples we provide details about our tax principles and global tax contribution – broken down by regions and categories – along with our tax risk control framework. There are also case studies showing how RELX has made a positive contribution in tax-related areas to benefit society as a whole.RELX is a signatory to the B Team’s Responsible Tax Principles. TheBTeam is a group of business leaders committed to sustainability, equality and accountability. Globally in 2024, RELX paid £662m in corporate taxes, but also paid and collected much more in payroll taxes and indirect taxes. Market segments Governance and shareholder information Financial statements Financial review Corporate responsibility Overview |
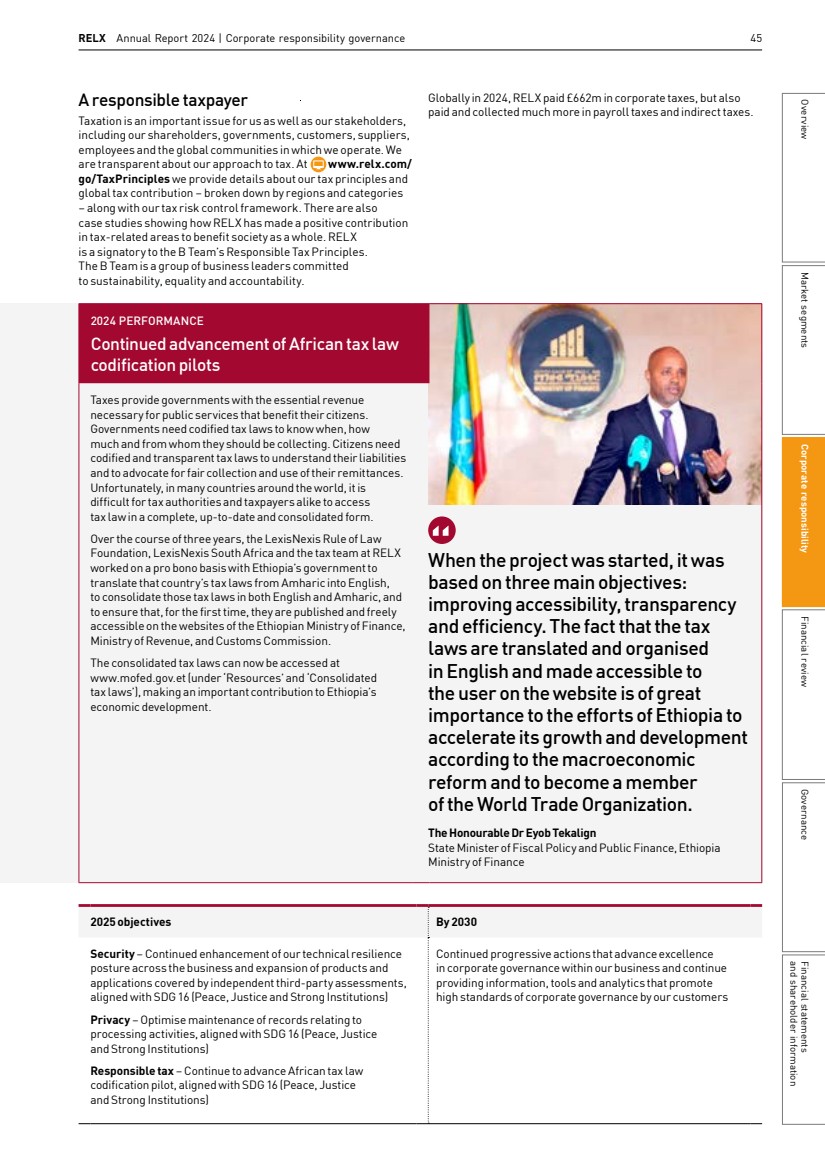
| Relevant SDGs 46 RELX Annual Report 2024 | Corporate responsibility Improving customer outcomes Our goal is to improve outcomes for our customers by providing information-based analytics and decision tools for professional and business customers that benefit their daily work. Digital knowledge and innovation, Artificial Intelligence across RELX: advancing customer goals Across RELX, we work to address customer challenges through digital innovation. In 2024, electronic products and services accounted for 83% of revenue, up from 32% in 2004. Risk LexisNexis Risk Solutions aided in combatting human trafficking-fuelled fraud by utilising behavioural biometrics and location intelligence. Our data scientists discovered a link between low atmospheric air pressure recorded by mobile phone sensors and fraud activity in Southeast Asia. We were able to identify a mountainous region near the Myanmar-Thailand border as a potential scam centre targeting vulnerable refugees as money mules. LexisNexis Risk Solutions analysed data from nearly 7,000 such transactions and found that transactions close to country borders were at a higher risk of being mules. This comprehensive approach includes data sharing, intelligence mining, and customisation to address evolving fraud threats. ICIS, part of Risk, launched Ask ICIS Gen AI assistant. Ask ICIS distils the breadth and depth of ICIS trusted news and analysis to deliver short summaries or detailed reports in the language of the customer’s choice. In-response citations empower customers to delve deeper for swift, confident, data-backed decisions in complex commodity markets. Scientific, Technical & Medical Elsevier introduced Scopus AI in 2024. Scopus AI combines generative AI with Scopus’ trusted content and data to help researchers gain deeper insights faster, facilitate collaboration, and increase the societal impact of research. Scopus AI provides summaries based on abstracts, allows navigation for extended exploration, and cites sources. Elsevier ensures that the content used in Scopus AI is rigorously vetted, based on over 30,000 academic journals from more than 7,000 publishers worldwide. Legal Legal expanded the roll-out of Lexis+ AI in 2024, a generative AI product designed to streamline legal research and drafting. The new platform delivers trusted results in an easy-to-use interface with linked legal citations, combining AI technology with proprietary LexisNexis search technology. It features conversational search, intelligent legal drafting, insightful summarisation and document upload capabilities, all supported by encryption and privacy technology to keep sensitive data secure. Customers We deliver information-based analytics and decision tools in a sustainable way to our customers, driving growth for the long term. Customer insight is essential to ensure user-centred product design that addresses real needs, enhances usability and delivers a better overall experience for our customers. Marta Sivanathan Bid Management Analyst LexisNexis Risk Solutions Legal launched LexisNexis TechDiscovery in 2024, an AI-powered tool designed to simplify patent research. The tool makes patent searches fast and intuitive, allowing both IP experts and business partners to find relevant patents using simple inputs. Users can conduct searches based on single words, brief descriptions, or excepts from patents, articles or non-patent literature. Exhibitions Digital event technology continued to transform the way RX’s customers connect and do business by enabling them to create and capture more value. Among RX’s digital solutions, Lead Manager App offers exhibitors a quick, easy and reliable way to capture and qualify leads by scanning attendees’ badges with a mobile phone. The latest addition to the suite, Colleqt QR Code, allows attendees to proactively scan QR codes on exhibitor stands to collect their contact details and product information quickly and sustainably. Their registration data is passed automatically to exhibitors so that they never miss a lead. More than 6m leads were captured using Lead Manager App and Colleqt QR Code in 2024, an increase of 88% over 2023. RX’s event registration system, Mercury, uses attendee data and AI to recommend exhibitors to individual visitors based on the products and solutions they are searching for. The product has been deployed at 100 events and has achieved strong customer satisfaction scores from visitors and exhibitors with 1.5m visitors registered online via Mercury in 2024. Responding to customer needs Listening to our customers allows us to deepen our understanding of their needs and drive improvements. We do this through regular surveys, customer dashboards and feedback mechanisms. With input from customer insight teams across our company, we calculated a RELX-wide customer satisfaction metric showing that in 2024, 87% of customers would recommend working withRELX. |
| w RELX Annual Report 2024 | Customers 47 2024 PERFORMANCE Updated the RELX Responsible AI Principles to incorporate considerations arising from generative AI We created the RELX Responsible AI Principles in 2022 and they are publicly available at www.relx.com/ corporateresponsibility/engaging-others/policies-anddownloads. The Principles are accompanied by a RELX position paper on AI and a dedicated address that anyone can use to provide feedback or raise queries: ResponsibleAI@relx.com The Principles state: We consider the real-world impact of our solutions on people, we take action to prevent the creation or reinforcement of unfair bias, we can explain how our solutions work, we create accountability through human oversight, we respect privacy and champion robust data governance. Each business area works to implement the Principles. For example The Responsible AI & Data Science team works to implement the RELX Responsible AI Principles across STM. They are responsible for developing policy, processes, tools, resources and training to support teams working with data science, machine learning and AI in embedding the Principles in their day-to-day activities. We are committed to updating our RELX Responsible AI Principles in recognition of the rapidly changing adoption and use of AI. In 2024, we held workshops in conjunction with colleagues across the business to gain feedback on the principles and update them accordingly. We hosted a RELX Responsible AI Summit in the year with sessions covering the RELX Responsible AI Principles, current and pending regulation, internal processes and the application of the Principles to our solutions. This activity supports SDG 8 (Decent Work and Economic Growth). In 2024, Elsevier’s Global Books Digital Archive fulfilled more than 2,000 disability requests. Elsevier was also recertified in the year as a Global Certified Accessible publisher by Benetech, a non-profit organisation based in Palo Alto, California. The certification recognises publishers that meet specific accessibility criteria to support readers with disabilities and learning differences. Relevant file testing received 92% scores in all categories. In 2024, Elsevier undertook research with people with disabilities, including users of Scopus AI, and other products. To improve the compatibility of screen readers with animated 3D simulations, Elsevier’s Shadow Health Digital Clinical Experiences is piloting built-in screen reading functionality. We worked with disability services offices, procurement officials and instructors across the world to provide Accessibility Conformance Reports (ACR). Customers can also utilise a dedicated accessibility email address to connect with an accessibility expert and support ACR requests. In 2024 Risk completed 47 requests including ACR requests, customer accessibility questionnaires and internal requests for product evaluations. Elsevier’s accessibility inbox received over 300 customer inquiries including 86 ACR requests. Legal’s Accessibility UX team resolved over 100 customer enquiries and generated ACRs for 32 products. Accessibility We strive to empower all people, including persons with disabilities, by ensuring our products and services are accessible and easy to use by everyone. Our commitment to accessibility is embedded across RELX and advances our Inclusion and Diversity Policy. We follow the Web Content Accessibility Guidelines (WCAG 2.1 level AA) and are working to ensure we meet the requirements of the upcoming European Accessibility Act and other relevant laws globally. We maintain an Accessibility Policy that highlights industry standards and tools to embed accessibility into our products and our business operations. We apply best practice from the RELX Accessibility Policy across hundreds of digital products and websites. Our Accessibility Policy is available at www.relx.com/cr-downloads. Risk employees continued enhancing our A11yCAT tool to help developers address accessibility bugs in real time, the second edition of the tool was released in the year which includes the ability to highlight code errors and help developers address them. Elsevier empowers all customers by providing features such as full-text search, marked tables, magnifiable content, screen reader compatibility and high-contrast text. Elsevier’s ScienceDirect platform was ranked in the top 1% for most accessible home page by the 2024 WebAIM Million study. TheHealth Education Systems Incorporated (HESI) Delivery Operations team continued to work with students taking the HESI exam to register to take it remotely via our remote proctoring vendors. Since 2019, the team has processed more than 880 candidate accommodation requests, ensuring that these candidates have an accessible and inclusive experience. Market segments Governance and shareholder information Financial statements Financial review Corporate responsibility Overview |
| 48 RELX Annual Report 2024 | Corporate responsibility 2024 PERFORMANCE Advanced product accessibility for customers 400+ Over 400 employees have completed the Elsevier accessibility training programme since 2018 RELX is committed to creating products that are usable by everyone including people who experience a disability. Anetwork of Accessibility Champions advance the RELX Accessibility Policy and encourage product teams to incorporate accessibility requirements from the start and deploy best practices to ensure an optimal experience for disabled users. RELX is committed to growing the expertise of accessibility specialists across our company. In 2024, we created an accessibility specialist career track to define the roles and responsibilities of specialists as they progress their careers. It helps managers support career planning, employee retention, and accessibility recruitment. Roles such as Associate Accessibility Specialist and Principal Accessibility Specialist have now been defined to help employees develop the right skills and responsibilities to meet our commitment to inclusive products and services. Bringing science into society We work closely with journalists to ensure that research findings are accurately and effectively communicated to the public, and that authors receive credit for their work. A number of journalists receive free access to all Elsevier publications via Elsevier’s Media Access programme. Researchers who published an outstanding peer-reviewed article that has significantly impacted people’s lives around the world, or has the potential to do so, are recognised with the Elsevier Atlas Award. The articles are made freely available and translated into everyday language to encourage the dissemination or implementation of their findings. Content is linked to the SDGs and is featured on the RELX SDG Resource Centre. Elsevier’s Library Connect programme and Academy, provides library and information science professionals worldwide with opportunities for knowledge sharing. In 2024, Library Connect Academy launched a GenAI Literacy programme for librarians. Covering Library and Information Science (LIS) best practices, trends and technology, The Library Connect Newsletter had more than 41,000 LIS professionals subscribed globally. The Library Connect website had over 40,000 visitors in the year and is currently ranked seventh in the top 80 librarian blogs and websites for librarians by Feedspot, a content aggregator for blogs and websites. Editorial standards Maintaining the integrity of what RELX publishes is vital to the trust of customers and other stakeholders. Our Editorial Policy, available to all staff (and publicly available on www.relx.com/ corporate-responsibility/engaging-others/policies-and-downloads) makes clear our respect for human rights, pluralism of sources, ideas and voices. Elsevier has dedicated resources and processes to support research integrity. Elsevier’s Research Integrity and Publishing Ethics team supports publishers and editors through their research integrity strategy which focuses on, resolving post-publication ethics cases for publishers and editors, detecting unethical practices during the editorial process to prevent publication and raising awareness within Elsevier and the communities that we serve on best practices. We also believe in editorial independence and keep editorial decision making processes separate from our commercial interests. |
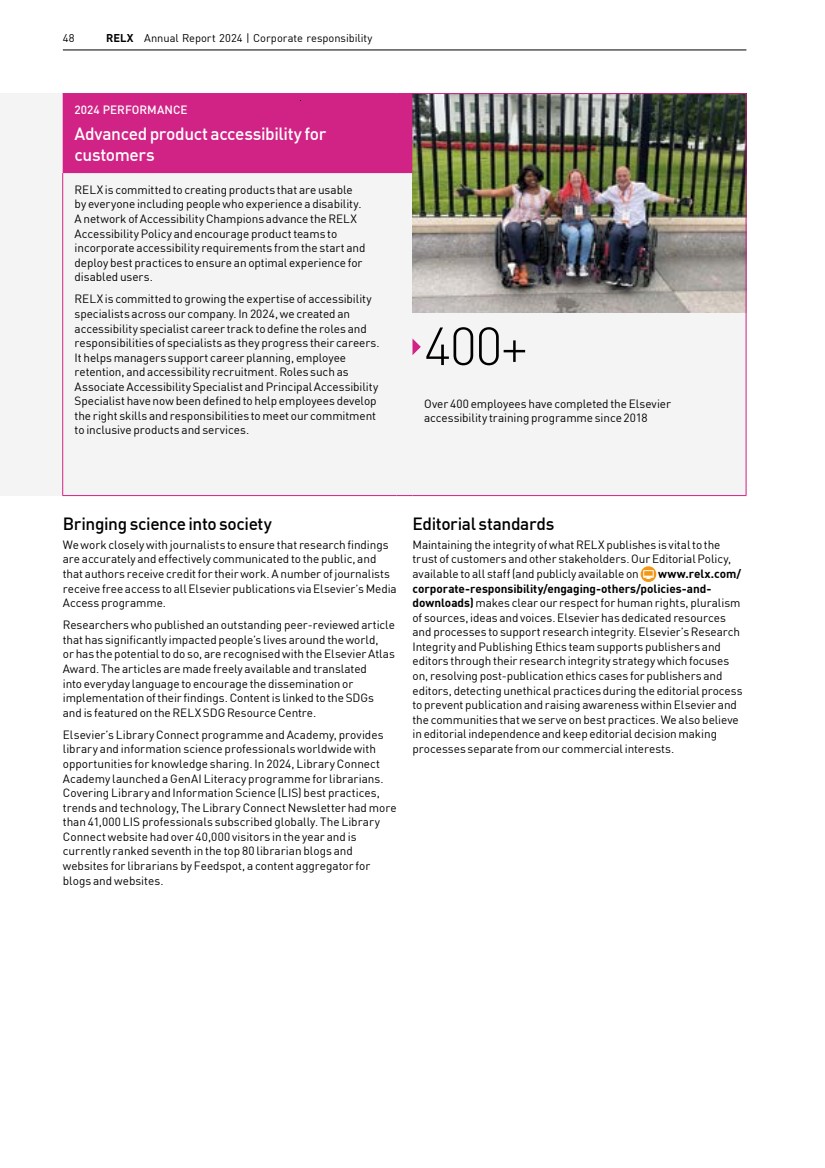
| RELX Annual Report 2024 | Customers 49 2025 objectives By 2030 Customer engagement – Systematic engagement with sales professionals throughout the business on the value of corporate responsibility for our customers, aligned withSDG 17 (Partnership for the Goals) Quality – Update RELX Responsible AI Principles to keep pace with evolving technology, aligned with SDG 8 (Decent Work and Economic Growth) Accessibility – Develop new accessibility design review process, aligned with SDG 10 (Reduced Inequalities) Continue to expand our customer base across our four business areas through excellence in products and services, active listening and engagement, editorial and quality standards, and accessibility; continue to be recognised as an advocate for responsible marketplace practices 2024 PERFORMANCE Creation of a new Sustainability Hub to support customers in getting the sustainability information they need With an increase in sustainability disclosure requirements, our customers need information from us in areas ranging from our environmental performance and their share of our carbon emissions to the steps we take to ensure an ethical supply chain. Since 2021 we have received a 150% increase in customer requests for sustainability data. During 2024, we created an internal Sustainability Hub to make it easier for colleagues across our business to quickly gather relevant data for their customers. Market segments Governance and shareholder information Financial statements Financial review Corporate responsibility Overview |
| Relevant SDGs 50 RELX Annual Report 2024 | Corporate responsibility What makes RELX special Our people tell us, through our annual employee opinion survey, that they are engaged, motivated and committed and believe RELX is a great place to work. We attract and retain talented people, including those whose skills are in high demand. Our competitive advantage is driven by our purpose, culture, talent and a combination of behaviours and attributes, including: § Knowing our products and exactly how they add value for our customers § Understanding emerging technologies and how they might be used to add more value § Being thought leaders § Being intellectually curious and eager to learn § Being fact based, analytical and data driven We owe our success to RELX’s talented employees, including technologists, researchers, event directors, product managers, data scientists and many others. And they count on us to create a fair, challenging, rewarding and supportive work environment where they can achieve their potential. Driving performance through culture In RELX we have a culture of individual ownership and accountability. We set an expectation that everyone should take ownership and be accountable for their actions, decisions and outcomes. Everyone is encouraged to seek never-ending performance improvement in every aspect of what they do, driving execution and achieving results. This is underpinned by defined and measurable goals for everyone, as part of our Enabling Performance approach to performance measurement and personal development. EnablingPerformance allows us to review achievement of goals and identify opportunities for development, recognition and advancement. It encourages regular and impactful performance, development and career conversations for all employees. We recognise the value of leadership, whatever stage of career someone is in: whether this is their first role, or whether they are leading an entire business area. We have a common language and approach to leadership in RELX. For our senior leaders this is backed up with specific behavioural expectations that will help them successfully navigate their careers in RELX. Exceptional leadership is the cornerstone of success at RELX. Our commitment to careers RELX employees are expected to understand their own strengths and areas for improvement and take individual ownership of and accountability for pursuing their own personal development. We ask everyone to proactively look for opportunities to build their career. We aim to provide our people with resources, tools and support to help them perform and grow. In 2024 we invested over $15m and 500,000+ hours in training. This included courses, seminars, one-to-one instruction and tuition reimbursement. We are focused on helping our people build skills for the future such as data analytics, product and technology development (including AI), and product ownership and management. Our CEO and the RELX business leaders care deeply about helping our people to develop and actively participate in regular organisational talent reviews that consider development needs and opportunities at an individual level. We also offer a global mentorship programme, NetWorx, which is open to all, on demand. This digital mentoring platform recommends matches based on individual profiles and specific goals, creating six month long mentoring relationships. In 2024, the platform had more than 3,300 active users. People We owe our success to our people. They are driven by a strong sense of purpose, and a supportive work environment where they can achieve their full potential. Suzanne Perry Group Treasurer, RELX RELX has always ensured I have the training and support to succeed in my job and progress to the next stage of my career. |
| RELX Annual Report 2024 | People 51 Integrity at the heart of our business We embrace integrity and high ethical standards and our RELX Code of Ethics and Business Conduct provides the guidance needed to make ethical business decisions. It explains how we should behave in the workplace and marketplace and describes how each of us should handle various legal and ethical matters, providing helpful scenarios. The principles set out in our Code of Ethics and Business Conduct are firmly embedded in the company and we strongly encourage employees to speak up if they are concerned about potential breaches. We have a number of channels they can use, including our Integrity Line. In 2024 372 concerns were raised and investigated, or are in the process of being investigated. We see this as an important factor in ensuring that our actions are in the best interests of our company, employees, customers and shareholders. Harnessing our diverse talent At the heart of our approach to inclusion, is the belief that everybody should be able to succeed and grow in a business that values them. Inclusion means feeling heard, contributing equally, with equal access to opportunity – regardless of personal characteristics. We encourage and promote diversity of all types and believe RELX derives competitive advantage from the breadth of backgrounds, diverse perspectives, opinions and differing ways of thinking that our people bring to everything they do. Inclusion and diversity policy § Sets out our commitment to an inclusive workforce (available at www.relx.com/cr-downloads) RELX Inclusion Council § Senior leaders from across RELX Employee Resource Groups § 130 active networks including gender, race, ethnicity, age, LGBTQ+ and disability RELX Employee Resource Groups (ERGs) encourage colleagues to collaborate, advocate and engage communities, furthering inclusion and diversity. ERGs help advance a culture of inclusion, and this is recognised by allowing all employees to take two days paid time-off per year for ERG-sponsored activities. In 2024, employees recorded over 22,400 ERG hours. In 2024, the gender diversity of our senior leader population increased to 32%, while our women people managers increased from 45% in 2023 to 46%. At year end, women comprised 40% of the Board. Non-Executive Director, Bianca Tetteroo serves as our Workforce Engagement Director. Our business relies heavily on technologists and we need to attract the best talent to support our business ambitions. We directly employ more than 8,500 technologists, 26% are women and we aim to increase that percentage through a variety of initiatives including a Women in Tech Mentoring programme. Health and safety The importance of employee health and safety is emphasised in the RELX Code of Ethics and Business Conduct and in the RELX Health and Safety Policy available on www.relx.com. These documents commit us to providing a healthy and safe workplace for all employees, as well as safe products and services for clients. The CEO is responsible for health and safety on behalf ofthe Board. We consult with employees globally on health and safety through staff and works councils and reinforce good health and safety practice through regular communications, including a designated site with relevant information. We also hold regular Health and Safety Committee meetings. We provide tailored health and safety training to employees and use the services of third parties to assist us in ensuring compliance with local health and safety rules and to promote best practice. This is particularly important for employees at higher risk of injury in the workplace, including warehouse, facilities and sales employees who regularly lift or carry products. In the US, we engage a third-party specialist to inspect locations that had high incident rates in the previous year. We also provide employee support following any incident or health concern. There were no work related deaths reported in 2024 and our frequency rate (lost time incidents per 200,000 hours worked) was 0.02. The majority of lost time incidents were the result of slips, trips and falls, followed by equipment or tool use and manual handling or repetitive strain. With many employees continuing hybrid working, we provide support on health and safety issues for both office and home working. Over the last two years 6,400 employees have completed the training through our Healthy Working programme which includes personalised risk assessments and action plans. We monitor and ensure our buildings are maintained and comply with relevant health and safety legislation and standards, in conjunction with third parties and landlords, where appropriate. 2024 PERFORMANCE Engaged colleagues globally through our Inspiring Inclusion programme Our 2024 Inspiring Inclusion series of virtual events helped colleagues understand and embrace the diversity of our global business. Sessions, including one with the CEOs of our four business areas, encompassed Inclusion through Technological Innovation and Inclusion through Trailblazing Advocacy. Independently assured Market segments Governance and shareholder information Financial statements Financial review Corporate responsibility Overview |
| 52 RELX Annual Report 2024 | Corporate responsibility 2024 PERFORMANCE Expand World Well-being Week activities across RELX In 2024, RELX held two Fit2Win events. In June, employees formed 68 teams to complete various activities, logging over 3,000 hours of sport. In October, 23 teams took on The Milestone Mastery Challenge, using the Magic Mountain app over a two-week period to log walks, runs, and swims. Creative challenges including completing activities before sunrise or logging a precise number of calories. Winning teams received funds to donate to the charities of their choice. In addition, we held a RELX Well-being Week in the year in partnership with our Living Well, MindLife and Thrive wellness programmes, promoted to all RELX employees. 2024 PERFORMANCE Continue to assess pay competitiveness and pay equity across RELX In 2024 we continued to monitor pay competitiveness and pay equity across RELX. Compensation reviews in March and October allow for pay increases to recognise performance and sustain market competitiveness and internal equity. 2024 RELX people in numbers FTE employees 36,400 Full-time employees (%) 95% Part-time employees (%) 5% Average length of service (years) 8 Total hours worked by all employees in the year 64m Temporary workers (%) 3% Contingent workers 1,300 Employees represented by a collective bargaining agreement (%) 12% Global HR information system coverage 100% Turnover Total turnover rate 11.6% Voluntary turnover rate 7.7% Involuntary turnover rate 3.9% Training and development Investment in training $15m Training hours 500,000 Employee engagement 69% Reward Employees with variable pay opportunities 74% Employees with access to share purchase programmes (US/UK/NL) 58% Absence Absence rate (number of unscheduled absent days out of total days worked in 2024, UK and NL) 1.42% US Family Medical Leave Act requests 1,738 Inclusion and Diversity Employees who are women 51% Managers who are women 46% Senior leaders who are women 32% 2025 objectives By 2030 Inclusion – Continue to engage colleagues globally through our Inspiring Inclusion programme, aligned with SDG 10 (Reduced Inequalities) Pay equity – Continue to assess pay competitiveness and pay equity, aligned with SDG 8 (Decent Work and Economic Growth) Well-being – Hold virtual well-being summit bringing together wellness champions from across the business to share best practice and hear from key partners, in support of SDG 3 (Good Health and Well-Being) Continued high-performing and satisfied workforce through talent development, inclusion and well-being |
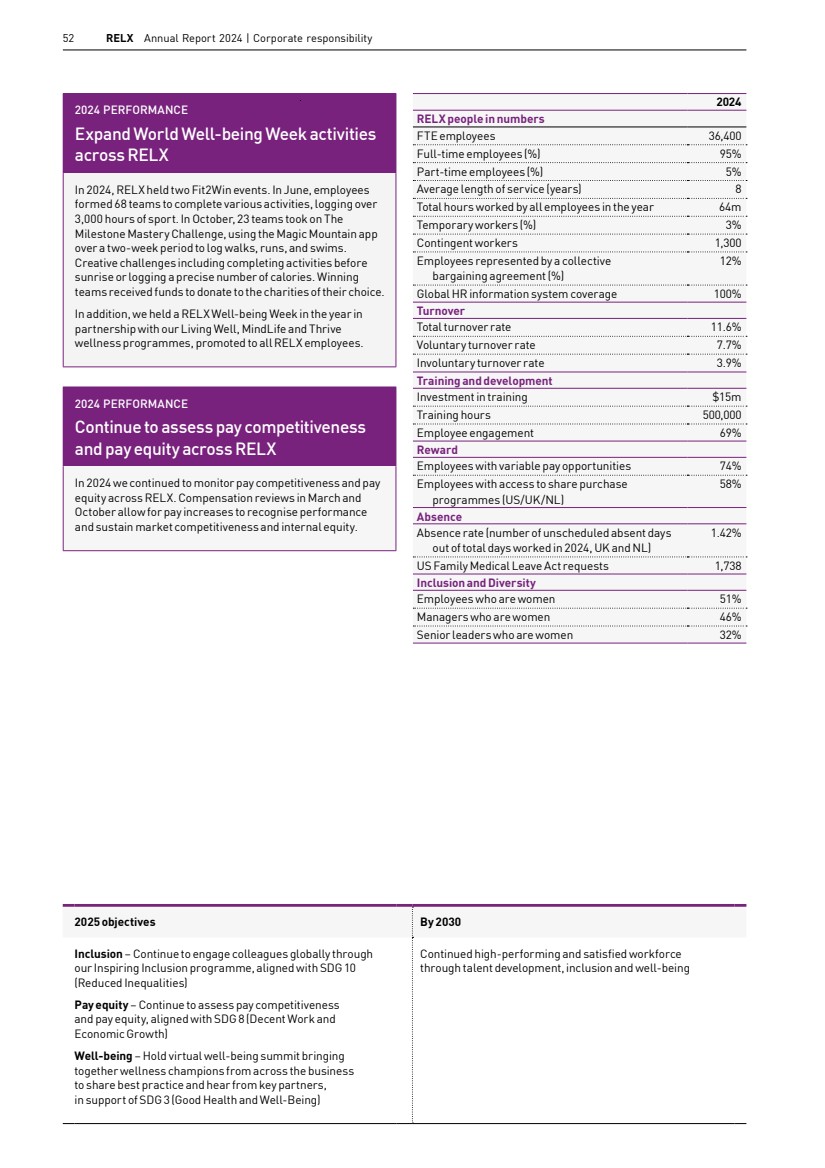
| Relevant SDGs RELX Annual Report 2024 | Community 53 RELX Cares, our global community programme, supports employee volunteering and giving that makes a positive impact on society. The mission of RELX Cares is education for disadvantaged young people that advances one or more of our unique contributions as a business, including protection of society and reducing inequalities, advancing science and improving health outcomes, furthering the Rule of Law and access to justice and fostering communities. Employees have up to two days’ paid leave per year for their own community work. A network of over 245 RELX Cares Champions ensures the vibrancy of our community engagement. In 2024, we held the 14th Recognising Those Who Care Awards to highlight colleagues who have made outstanding contributions to RELX Cares. The eight winners of the individual award travelled to Ghana to take part in volunteering projects with our charity partner Book Aid International. Two other individuals and two teams were given the opportunity to make a donation to the charity of their choice. In August, 35 employees volunteered attheParalympics in Paris. Their roles included welcoming the athletes and visitors and assisting with logistics. Community We help our local and global communities thrive by contributing to their success. Volunteering enables us to work towards a brighter future and there’snothing more rewarding than knowing our efforts contribute to a positive change in our communities. The mission of RELX Cares is education for disadvantaged young people that furthers one or more of our unique contributions as a business, including universal, sustainable access to information. Darshan Sharma Assistant Manager, LexisNexis Legal & Professional 2024 PERFORMANCE Increase internal and external information about our global community activities We showcased the activities of colleagues across the business who took part in RELX Cares activities throughout the year. Using internal and external communication channels, we highlighted RELX Cares stories including Recognising Those Who Cares winners, a roundup of RELX Cares Month activities and celebrated RELX colleagues who ran the London marathon in aid of our global fundraising partner, Save the Children. In 2024, we shared 10 RELX Cares stories (nine in 2023) on our weekly, all-employee Friday Update email; published four RELX ‘Shorthand’ visual stories (three in 2023) on Perspectives at www.relx.com; and posted five RELX Cares stories on LinkedIn in 2024. Using our internal and external communication channels, including social media, to share stories about how our colleagues support their communities, is a powerful way to showcase our strong culture of volunteering and fundraising at RELX. Tracy Rhine Digital Communications Manager, RELX Market segments Governance and shareholder information Financial statements Financial review Corporate responsibility Overview |
| 54 RELX Annual Report 2024 | Corporate responsibility Each September, we hold RELX Cares Month to celebrate our commitment to our communities around the world. During the Month, over 4,100 colleagues across the Company took part in hundreds of volunteering and fundraising events, including RELX employees in the UK who renovated a playground for children with disabilities; colleagues from LexisNexis Risk Solutions in Italy who prepared meals for vulnerable people; Elsevier colleagues in the US who made cards for sick children and RX China who worked with a charity that provides horse riding for children with special needs. 225+ A network of over 225 RELX Cares Champions ensures the vibrancy of our community engagement Giving Our central donations programme aligns with the RELX Cares mission. Employees serve as sponsors for charities seeking funding, which must in turn indicate how they help further one or more of RELX’s unique contributions as a business including protection of society and reducing inequalities, advancing science and improving health outcomes, furthering the Rule of Law and access to justice and fostering communities. RELX Cares Champions vote on submissions using decision criteria such as value to the beneficiary and opportunities for staff engagement. In 2024, RELX Cares Champions donated $332,934 to 28 charities supporting over 43,000 young people. Projects included: § Creating toilet cubicles and handwashing stations for a remote school in Nepal § Upskilling young refugees in the Netherlands with web development training to help them gain employment § Helping underprivileged children in poverty-stricken areas ofQuezon City in The Philippines In managing community involvement, we apply the same rigour as we do to other aspects of our business. Following the B4SI methodology – a global standard for measuring and reporting corporate community investment – we conduct an annual Group Community Survey with RELX Accounting Services and RELX Cares Champions. It divides our aggregate giving into short-term charitable gifts, ongoing community investment and commercial initiatives of direct business benefit. We donated £5m in cash (including through matching gifts), and £18m in products, services and staff time in 2024. Some 37% of employees were engaged in volunteering through RELX Cares. According to 2024 B4SI data, the average volunteering rate was 22.1% for our sector and 21.6% for all sectors. Book donations: supporting education While print is a relatively small portion of our revenue, we continue to minimise the impact of printed product. We focus on techniques such as print on demand or print run control to better match production to demand. We donate excess product to charity partners such as Book Aid International and Books for Africa to avoid waste and benefit communities. In 2024, RELX donated over 158,660 books with a value of over $12m to our charity partners. Book Aid International RELX has been a Book Aid International partner for over 30 years through regular book donations, financial support and staff fundraising and volunteering. RELX donations of medical books are critical to educating the next generation of healthcare providers around the world. In 2024, we donated 88,171 new higher education and medical books. In addition to donating books, we provided a grant to Book Aid International for the creation of a Children’s Corner at Takoradi Library in Ghana. This Children’s Corner provides a dedicated space for children to visit independently or with their school, providing much needed access to a rich collection of books in English and local languages. For over 30 years RELX and Book Aid International have partnered to support schools and universities across sub-Saharan Africa and beyond. From sending much needed medical textbooks helping to improve patient care to generously funding the creation of brand-new reading spaces like the Children’s Corner in the Takoradi Library in Ghana, RELX has helped us to reach thousands of readers. Alongside these donations, RELX employees have continued to volunteer in our warehouse providing vital support for our operations. We are proud to say that they have been an important part of our journey and we hope that together we will continue to meet the need for books around the world. Alison Tweed, Chief Executive, Book Aid International Image credit: Ghana Library Authority. |
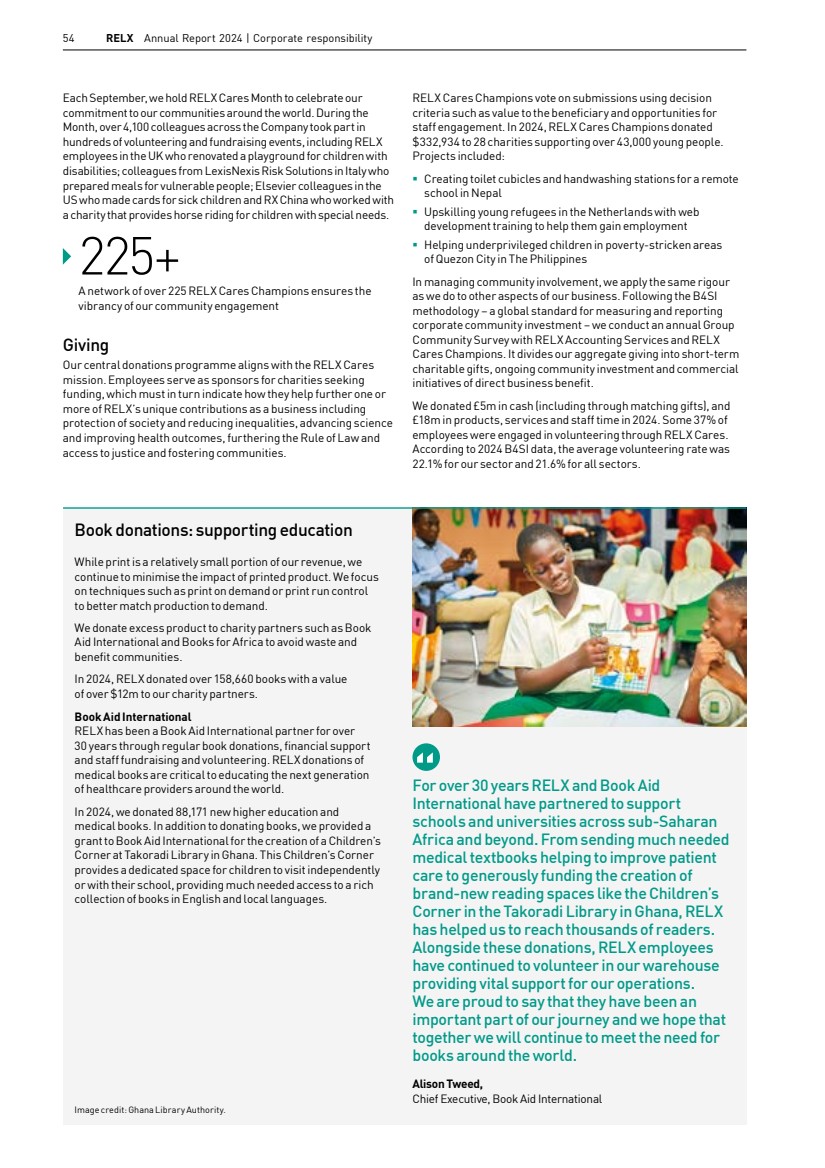
| RELX Annual Report 2024 | Community 55 In 2024, we continued to engage in skills-based volunteering, applying business knowledge and expertise to benefit communities. For example, in the UK, a colleague from LexisNexis Legal & Professional delivered our training course, Introduction to the Law (England and Wales) to staff from the Access to Justice Foundation, which aims to increase the availability of quality legal advice and support. We also encouraged in-kind contributions, such as product and equipment donations, aligned with our Product Donation Policy (available at www.relx.com/cr-downloads), which included books, access to content, and discounted charity rates for some products. Engagement In 2024, we continued to provide opportunities for colleagues to get involved in RELX Cares. In monthly calls for RELX Cares Champions across the company, we provided updates about RELX Cares activities and offered Champions an opportunity to share best practice and learn from their peers. To launch our global RELX Cares Month in September, weshowcased examples of volunteering from across the business. During the Month, we ran our Global Book Drive competition with employees donating over 1,000 books for local charities. Impact In accordance with the B4SI model, we monitor the short- and long-term benefits of the projects with which we are involved. We ask beneficiaries to report on their progress to increase transparency and engagement. In addition, we survey RELX Cares volunteers on the impact the programme has on their work following each volunteer activity. In 2024, we received over 17,900 responses, 91% of respondents said their motivation and pride in RELX had increased as a result of volunteering and 90% said they had experienced a positive change in behaviour or attitude as a result of volunteering. Jeffrey P Mladenik and Andrew Curry-Green Memorial Scholarship As a lasting memorial to our colleagues Jeffrey Mladenik and Andrew Curry-Green, who lost their lives on 9/11, we offer scholarships in their name to children of eligible employees. Shriya Manikonda (left) daughter of Anitha Manikonda, Senior Business Analyst for Risk in Atlanta, is passionate about volunteering and has dedicated over 1,000 hours to community service during her time in high school. She was involved in a variety of societies and clubs including Future Health Professionals and the National Honor Society, where she held leadership positions. She was also an active member in DECA – an association of marketing students, Science National Honor Society, Mu Alpha Theta, National Beta Club, MD Junior, National Technical Honor Society, National English Honor Society, and Rho Kappa. Shriya has placed at international and state levels in relevant events. Shriya is attending the University of Georgia pursuing her aspiration of becoming a dentist. Alexander Van Dyke (right) son of Alice Tank, Telephonic Account Executive for Legal, is studying psychology at Lawrence University in Appleton, Wisconsin. Following his graduation he hopes to pursue his interest in psychology research in graduate school. At Lawrence he has pursued research opportunities in psychology, with specific interests in social and health psychology. Alexander is a member of the Psi Chi Honor Society and co-president of the campus rock climbing club. An honours graduate of Edina High School in Minnesota, he achieved the biliteracy gold seal in Latin comprehension, a varsity letter in Nordic skiing, and was an AP scholar with distinction. Alexander also participated in the dual enrolment programme at the University of Minnesota. In-kind 55% Cash 23% Time 22% What we contributed in 2024 (market value) Market value cash, in-kind and time donations (GBPm) Community involvement Market value cash, in-kind and time donations (GBPm) 2020 2021 2022 2023 2024 18 21 23 23 23 Market segments Governance and shareholder information Financial statements Financial review Corporate responsibility Overview |
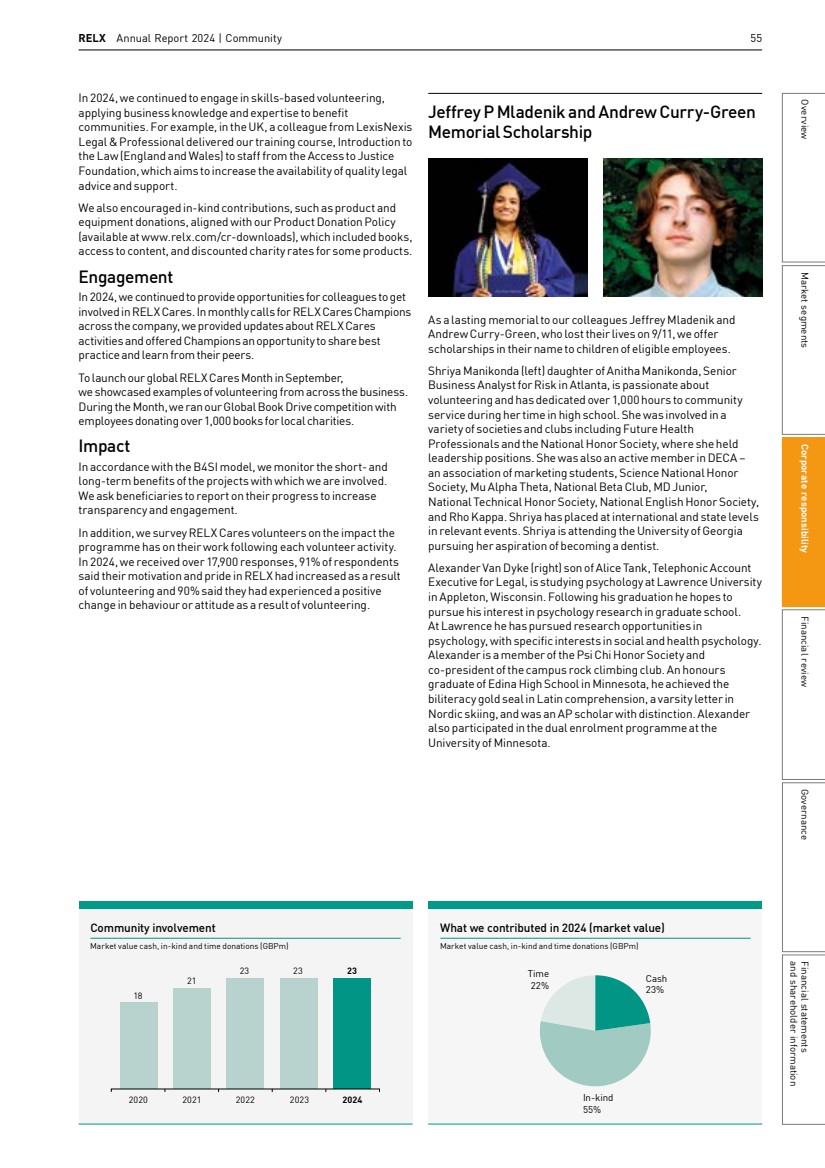
| 56 RELX Annual Report 2024 | Corporate responsibility 2024 PERFORMANCE Strengthened our cross business area philanthropic response to disasters and emergencies For many years, we have donated to different charitable causes in response to humanitarian emergencies caused by conflicts and natural disasters. In 2024 we donated $30,000 to Save the Children to support their relief efforts in Brazil where flooding caused unprecedented devastation. We also continued to support our charity partners such as World Central Kitchen. To further improve our responses, we established a new disaster and emergency committee in the year to bring together business continuity representatives from across the business and their corporate responsibility and philanthropy counterparts. We can now more effectively share updates about affected colleagues and communities and responses by our charity partners to quickly decide a best course of action. To further the relationship between these two areas, our global head of community presented at the cross-business resilience conference about our disaster relief efforts and RELX Cares is now represented on the RELX Business Continuity Forum. Bringing our business continuity teams together with other key colleagues allows us to respond to disasters and emergencies in an agile and timely way, ensuring we use our resources in themost efficientway. Zohar Zacks Senior Director Business Resilience, Elsevier 2025 objectives By 2030 Employee community engagement – Update RELX Cares Champions materials and continue to increase engagement and participation, in support of SDG 17 (Partnerships for the Goals) Philanthropic giving – Continue to improve our capability to respond to disasters and emergencies, exploring how we can donate our products and services to further relief and preparedness, in support of SDG 17 (Partnerships for the Goals) Through our unique contributions, and investments with partners, contribute to significant, measurable advancement of education for disadvantaged young people Image credit: Save the Children. |
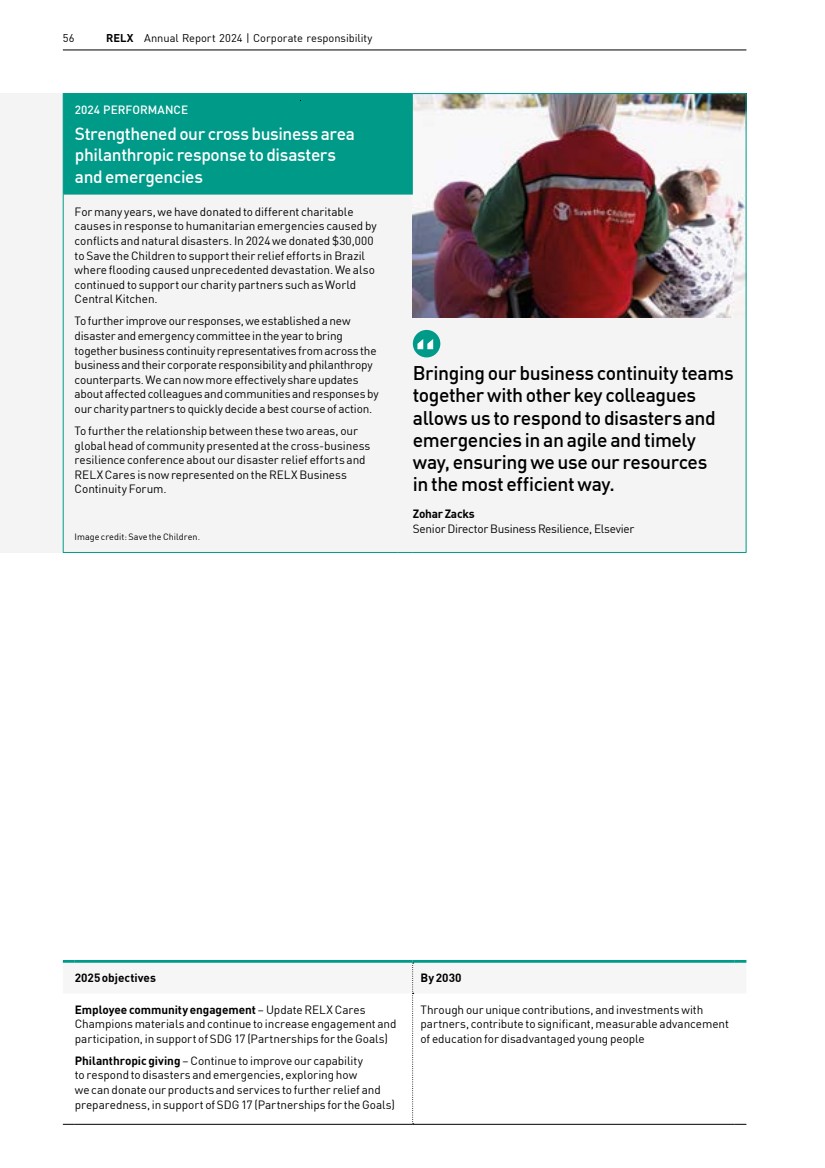
| Relevant SDGs RELX Annual Report 2024 | Supply chain 57 Managing an ethical supply chain RELX has a diverse supply chain with suppliers located in over 150 countries across multiple categories, including technology (e.g. software, cloud, hardware and telecom), indirect (e.g. consulting, marketing, contingent labour and travel), and direct (e.g. data/content and production services, print/paper/bind and distribution). Given the importance of an ethical supply chain, we maintain a Socially Responsible Supplier (SRS) programme encompassing all our business areas, supported by colleagues with expertise in operations and procurement and a dedicated SRS Director from our global procurement function. The VP Global Procurement has operational responsibility for ensuring engagement with suppliers occurs. Monitoring suppliers Our Supplier Code of Conduct (Supplier Code) stipulates our expectations of our suppliers. It incorporates the Ten Principles ofthe UN Global Compact and encompasses key topics such as involuntary labour, non-discrimination, compensation and working hours, coercion and harassment, data security and environment. We require suppliers to ensure the standards of theCode are applied across their own supply chain. Where local industry standards are higher than applicable legal requirements, we expect suppliers to meet the higher standards. Read our Supplier Code of Conduct at www.relx.com/cr-downloads Available in 16 languages, suppliers must display the Code in their workplace SRS tracking list includes suppliers we spend more than $1m with annually; deem critical; and those located in medium and high-risk countries with annual $100,000+ spend for the previous two years We assess risk using our Supplier Risk Tool: 11 indicators, including human trafficking information from US State Department; Environmental Performance Index (Yale University and Columbia University in collaboration with the World Economic Forum). In 2024, over 90% of global spend was risk assessed through this tool SRS tracking list changes year-on-year based on our business needs and changes in country risk designations; in 2024, there were 914 suppliers, 72 in high-risk countries and 698 in medium risk countries, of which 747 (82%) are signatories to our Supplier Code or have equivalent standards in place Supply chain We provide our customers with ethically sourced products and services, andwe insist our suppliers meet the same high standard. David Deadman Director, IT Services Sourcing, Global Procurement, RELX Promoting and maintaining an ethical supply chain enables RELX to work with suppliers that meet shared high standards, benefitting the business aswell as our customers and clients. North America 64.0% South America 0.7% Middle East 0.8% Asia & Pacific 8.1% Europe 26.0% Africa 0.4% RELX supplier locations (% of supplier spend) Based on four quarters ending Q3 2024 Non signatories are primarily new to the SRS tracking list and we are working with them, and other non-signatories, to gain agreement to our Code. In total, at the end of 2024 there were 6,056 signatories to our Supplier Code, or suppliers with an equivalent code, representing an increase of 14% from 5,322 signatories at the close of 2023. We engage specialist supply chain auditors to evaluate compliance with the Supplier Code, and in 2024 there were 137 external audits; 61 onsite and virtual and 76 desktop. During 2024 onsite and virtual onsite audit locations included Brazil, Canada, China, Hungary, India, Mauritius, Nicaragua, Pakistan, Philippines, Singapore, South Africa, United Kingdom and Vietnam. Desktop audits involve supplier responses to an online questionnaire, supporting document uploads, and a risk assessment. Virtual onsite audits involve facility representatives wearing a video and audio source which enables the third-party auditor to assess the facility, conduct interviews, and review documentation. During an onsite audit, the auditor will randomly select employees from a full roster to interview. This provides an opportunity to address the awareness and trust of the process. Market segments Governance and shareholder information Financial statements Financial review Corporate responsibility Overview |
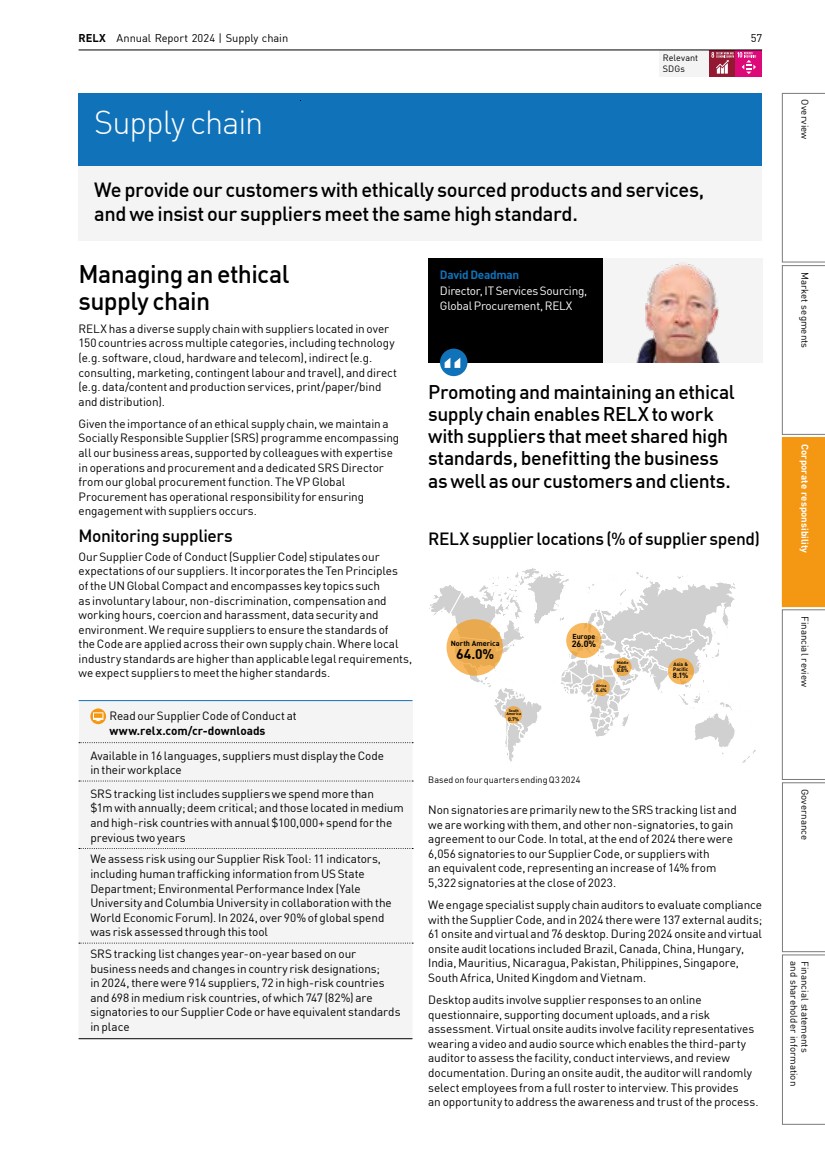
| 58 RELX Annual Report 2024 | Corporate responsibility Responsible Supply Chain Performance Target Measure Results 2020 Actual 2021 Actual 2022 Actual 2023 Actual 2024 Actual Increase # of suppliers as Code signatories Total # of Code signatories 3,457 3,670 4,467 5,322 6,056 Total # of suppliers on tracking list 412 359 724 796 914 Total # of suppliers on tracking list who were Code signatories (or equivalent) 378 343 630 690 747 % of suppliers on tracking list who were Code signatories (or equivalent) 91% 96% 87% 87% 82% Continue using audits to ensure continuous improvement in supplier performance and compliance # of independent audits 99 111 119 125 137 Onsite/virtual onsite 25 28 28 36 61 Desktop 74 83 91 89 76 Continue to advance the US Supplier Inclusion and Diversity Programme % of total US spend with diverse suppliers (Veteran, Minority, Woman-owned businesses) 3% 3% 4% 3% 3% Interviews are confidential, facilitymanagement are not allowed to be present, and the interviews are anonymised. In communicating non-compliance to management, the auditor cannot disclose information which could identify the employee or employees to avoid retaliation against them, which is forbidden by the SupplierCode. If an incidence of noncompliance is found during an audit, a remediation timeline is set where timings are either immediate or from 30-90 days based on the finding. The audit reports provide a summary of findings, local law references based on noncompliance as appropriate, root cause and explanation ofthe noncompliance, follow-up method, timescale, and the recommendations or actions needed to close the finding. Suppliers upload a Corrective Action Plan (CAP) for each noncompliance finding in the audit platform and a follow-up audit is scheduled to confirm action. Auditors work with suppliers until full compliance is reached. Our aim is to work with suppliers to ensure remediation but in instances where the supplier fails to take sufficient action, we will terminate the supplier relationship. To minimise the risks of deforestation in our production paper supply chain, we utilise the Forest Sourcing module of The Book Chain Project, a shared industry resource for sustainable paper we helped establish, to assess the forest sources of our papers. By year end 2024, 100% of RELX’s production paper was graded by The Book Chain Project as known and responsible (sustainable) sources or certified to FSC or PEFC (less than 0.1% not yet graded or certified). During 2024 we held RELX Supplier sessions focused on modern slavery, transformational governance and setting science-based carbon reduction targets. Promoting human rights through the SupplierCode As stated above, the Supplier Code sets out expectations for our suppliers’ ethical conduct. In accordance with the UK’s Modern Slavery Act 2015, our Supplier Code specifically prohibits participation in any activity related to human trafficking, based on the American Bar Association’s Model Business Conduct Standards to Eradicate Labor Human Rights Impacts in Hiring and Supply Chain Practices. In 2024, we updated our RELX Modern Slavery Act Statement (MSA), available at www.relx.com, which states how we are working to avoid human trafficking and modern slavery in our direct operations and in our supply chain. The Supplier Code stipulates that, where required by law, suppliers will have employment contracts signed with all employees and requires mechanisms for reporting grievances. It additionally contains a provision on involuntary labour that states unequivocally that suppliers cannot directly or indirectly use, participate in, or benefit from, involuntary workers and human trafficking-related activities. Suppliers have access to Modern Slavery Awareness training through our audit provider. In addition, we asked 88 suppliers to undergo further training on freely chosen employment and child labour in the year. We use aUK Government definition of modern slavery, particularly ‘the trafficking of people, forced labour, servitude and slavery.’ We did not receive any reports or questions from employees that related to modern slavery in the year. The Supplier Code states that failure to comply may result in termination of the business relationship between RELX and the supplier, it also protects reporting persons from retaliation. Supplier Code of Conduct signatories 2020 2021 2022 2023 2024 3,457 3,670 5,322 6,056 4,467 |
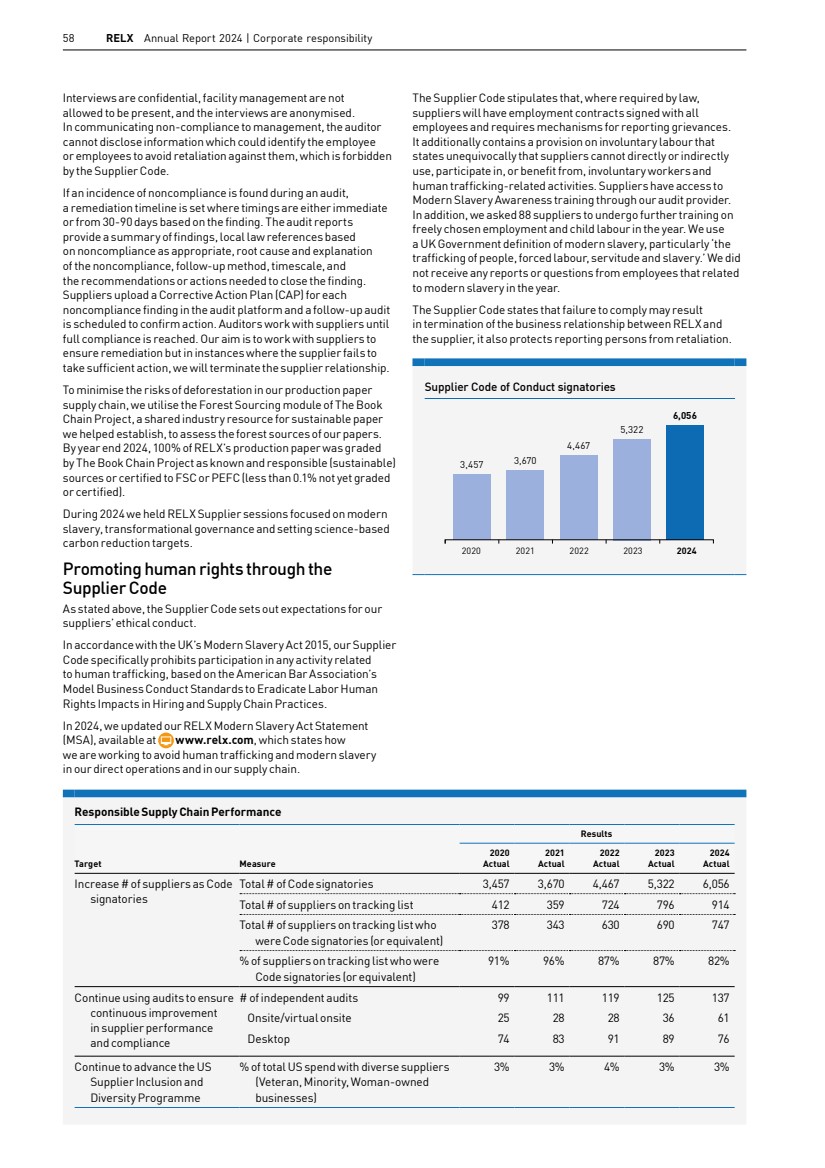
| RELX Annual Report 2024 | Supply chain 59 2024 PERFORMANCE Advance Responsible Supply Chain Programme 2025 objectives By 2030 Responsible Supply Chain – Increase number of suppliers that are Code signatories; continue using audits to ensure continuous improvement in supplier performance and compliance, in support of SDG 8 (Decent Work and EconomicGrowth) Reduce supply chain risks related to human rights, labour, the environment and anti-bribery by ensuring adherence to our Supplier Code of Conduct through training, auditing and remediation; drive supply chain innovation, quality and efficiencies through a strong, diverse network of suppliers ALIGNING WITH GOOD PARTNERS Infosys Infosys, a RELX supplier, is a global leader in next-generation digital services and consulting, enabling clients in more than 56 countries to navigate their digital transformation. With over four decades of experience in managing the systems and workings of global enterprises, Infosys expertly steer clients, as they navigate their digital transformation powered by cloud and AI. Infosys enables them with an AI-first core, empowers the business with agile digital at scale and drives continuous improvement with always-on learning through the transfer of digital skills, expertise, and ideas from their innovation ecosystem. They are also deeply committed to being a well-governed, environmentally sustainable organisation where diverse talent thrives in an inclusive workplace. Infosys turned carbon neutral 30 years ahead of 2050, the timeline set by the Paris Agreement, and is driven by the conviction that ESG, more than a corporate responsibility, is an opportunity to play an active role in making the world more sustainable, inclusive, and equitably prosperous. Advancing this ESG mandate, Infosys Springboard is a digital learning platform that brings free world-class educational resources to students from class 6 to lifelong learners. It empowers them with digital and life skills to be future-ready in the 21st century. Launched in 2021, under the aegis of the Infosys ESG Tech for Good charter, Infosys Springboard offers, beyond training resources, the mentors and career paths to enable learners to become industry-ready in a rapidly changing business world. Today, there are over 12m registered learners on Infosys Springboard. From turning carbon neutral to pushing the boundaries of innovation insustainability, at Infosys, we are constantly working towards realising thenext opportunity to drive more green innovations. It is through continuous, constructive, and responsible engagement that we are able to expand our efforts to realise a sustainable future for ourselves and for our stakeholders. This is a testament to the work done by the founders and other leaders of Infosys for over four decades. Ashiss Kumar Dash EVP & Global Head of Services, Utilities, Resources, Energy and Sustainability, Infosys We are committed to proactive engagement with suppliers to ensure a Responsible Supply Chain that reflects the diversity of our communities. During 2024, we increased the number of suppliers that are signatories to our Supplier Code to 6,056. Additionally, we conducted 137 supplier audits to ensure continuous improvement in supplier performance and compliance. 6,056 Suppliers who have signed the Supplier Code or have an equivalent code Market segments Governance and shareholder information Financial statements Financial review Corporate responsibility Overview |
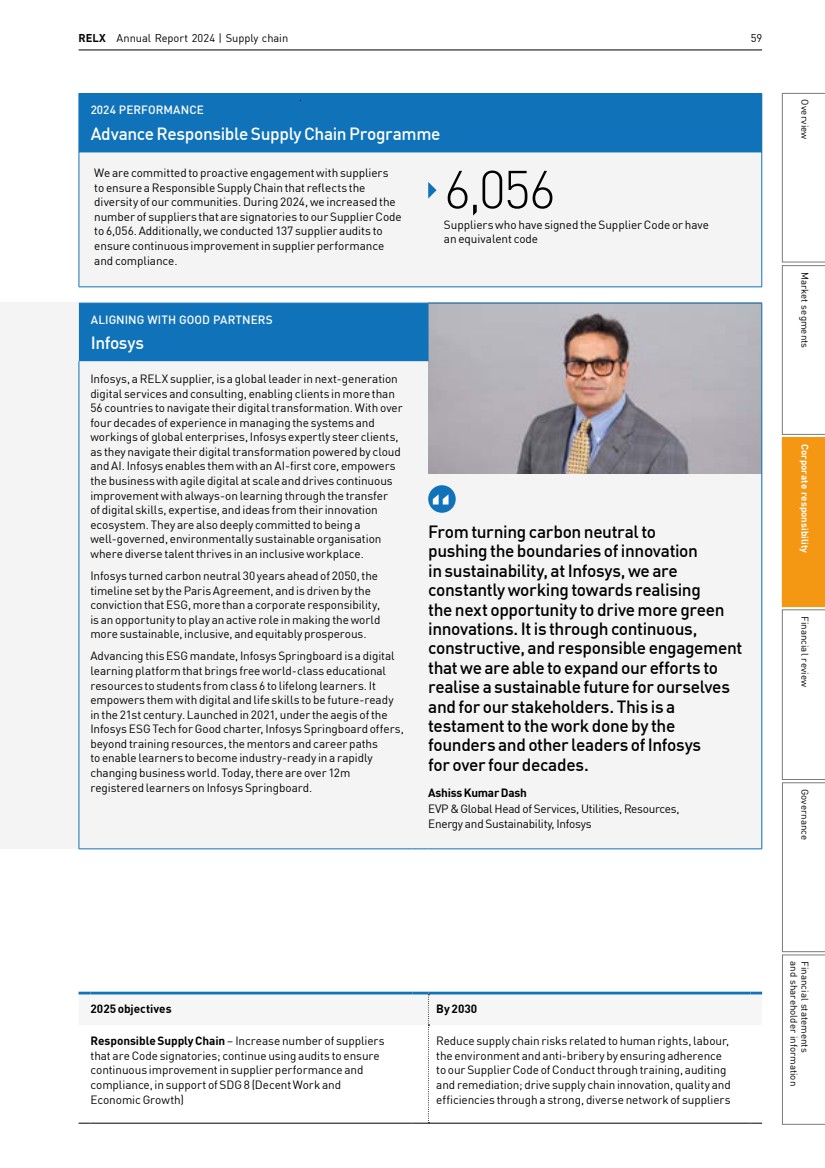
| Relevant SDGs 60 RELX Annual Report 2024 | Corporate responsibility 80% reduction in Scope 1 and Scope 2 (location-based) emissions since 2010 95% reduction in waste sent to landfill since 2018 53% reduction in energy since 2018 A positive environmental impact; Spreading environmental knowledge We provide essential environmental insights through our products and services which inform debate, aid decision makers globally and encourage research and development on environmental issues. Risk Cirium advanced the EmeraldSky methodology which delivers accurate flight emissions data that accounts for variables like aircraft age, engine type, flight stage, and load factor, along with satellite-tracked movements. This provides an independent measure of carbon emissions for the aviation industry. Scientific, Technical & Medical The Lancet published their 2024 Countdown on health and climate change which monitors the evolving health profile of climate change and provides an independent assessment of the delivery of commitments made by governments worldwide under the ParisAgreement. The content, either open access or free to read, covers 53 indicators, drawing on the expertise of 122 scientists and health practitioners across 57 collaborating organisations worldwide. Legal Legal introduced the England and Wales Environment Tracker 2024, which tracks and summarises new and upcoming legislation and consultations linked to climate action and emissions reduction in England and Wales. Exhibitions The 2024 editions of RX’s ISC West and ISC East took steps to tackle event waste, partnering with MeetGreen to stream and sort waste, increase recycling and compost waste. They also produced a Sustainability Guide for exhibitors to educate them on sustainability initiatives. Environment Our products and services help provide essential insights and bring stakeholders together to address critical environmental issues globally, while we continue to reduce our own environmental footprint. Didem Ozlap Sustainability Data Manager, RX Analysing the environmental footprint of key exhibitions enables us and our exhibitors to make informed decisions that can reduce carbon emissions, leading to more sustainable shows. Across RELX The CEO is responsible to the Board for environmental performance; the CEOs of our business areas are responsible for complying with environmental policy, legislation and regulations and the CFO is our most senior environmental advocate. Our Global Head of Corporate Responsibility engages with the Board on environmental issues and we work with Environmental Champions and dedicated engineering, design and real estate specialists to improve efficiency wherever possible in our portfolio. In 2024, we continued our support of the Climate Pledge, aiming to achieve net zero across all carbon scopes by 2040 at the latest. We have committed to measure and report greenhouse gas emissions, implement decarbonisation strategies for emissions reductions and address residual emissions with high quality carbon removals. Details of our net zero transition road map are available on page 220. We were a Taskforce for Climate-related Financial Disclosure (TCFD) Supporter until it was disbanded and have expanded our TCFD disclosure (see page 236). We remain signatories of We AreStill In, a network of more than 3,900 businesses, universities, cities, states and other organisations, committed to combatting climate change. In creating and delivering our products and services we have an impact on the environment through carbon emissions, energy and water usage. But more important is our portfolio of environmental research, products and services, which spread environmental knowledge, good practice and action. |
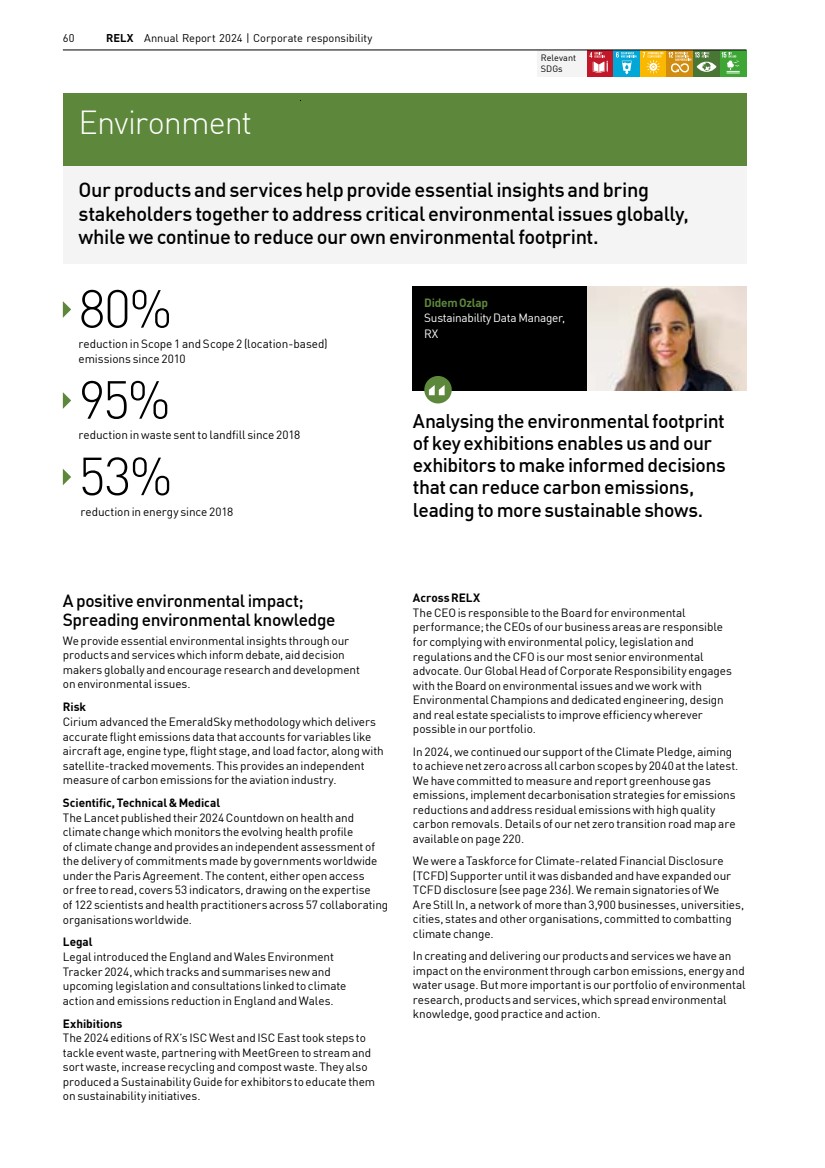
| RELX Annual Report 2024 | Environment 61 2024 Environmental Performance Absolute performance Intensity ratio (absolute/GBPm revenue) 2023 2024 Change 2023 2024 Change Scope 1 (direct emissions) tCO2e 4,317 2,703 -37% 0.47 0.29 -39% Scope 2 (location-based) emissions tCO2e 36,616 29,989 -18% 4.00 3.18 -20% Scope 2 (market-based) emissions tCO2e 8,598 6,971 -20% 0.94 0.74 -21% Scope 1 + Scope 2 (location-based) emissions tCO2e 40,933 32,692 -20% 4.47 3.47 -22% Total energy (MWh) 110,750 89,745 -19% 12.09 9.51 -21% Water (m3 ) 142,374 134,716 -5% 15.54 14.28 -8% Waste sent to landfill (t)* 45 44 -3% <0.01 <0.01 -5% Sustainable production paper (%) 100 100 – – – - * From reporting locations only, excluding estimated data. Actual environmental data covers approximately 85% of occupied floor space based on electricity reporting. When we are unable to obtain reliable data, for example from small serviced offices, we estimate energy consumption and water usage on actual data from our portfolio. In this way, our reported data covers all operations, forwhich we have operational control for the calendar year. Scope 2 (location-based) emissions are calculated using grid average carbon emissions factors for all electricity sources. Scope 2 (market-based) emissions are calculated using supplier-specific carbon emissions factors (where available) for renewable energy purchases. Current environmental targets to 2025 Focus area Targets – 2025 2024 performance Climate change Reduce Scope 1 + 2 (location-based) carbon emissions by 46% against a 2015 baseline -69% Energy Reduce energy and fuel consumption of our locations by 30% against a 2015 baseline -59% Energy Continue to purchase renewable electricity equivalent to 100% of RELX’s global electricity consumption 100% Waste* Decrease waste sent to landfill from reporting locations to 35% below 2015 levels -96% Production paper** 100% of RELX production papers to be graded in Book Chain Project as ‘known and responsible sources’, or certified to FSC or PEFC by 2025 100% New environmental targets to 2030 Focus area Targets – 2030 2024 performance Climate change Reduce Scope 1 + 2 (location-based) carbon emissions by 56% against a 2018 baseline -61% Energy Reduce energy and fuel consumption of our locations by 65% against a 2018 baseline -53% Energy Continue to purchase renewable electricity equivalent to 100% of RELX’s global electricity consumption 100% Waste* Maintain waste sent to landfill from reporting locations at least 95% below 2018 levels -95% Production paper** Maintain 100% of RELX production papers to be graded in Book Chain Project as ‘known and responsible sources’, or certified to FSC or PEFC 100% * From reporting locations, excluding estimated data. ** Percentage of paper graded as known and responsible sources by the Book Chain Project or certified by FSC/PEFC. Includes less than 0.1% of paper not yet graded or certified. Performance Our focus is on delivering continuous improvement in our environmental performance year-on-year. In 2024, we reduced our energy consumption by 19% compared to 2023, with this resulting in a reduction of 20% in our Scope 1 and Scope 2 (location-based) emissions. We also reduced our water consumption by 5% and continued to purchase 100% sustainable production paper. We have achieved all environmental targets we set for 2025, as shown in the table to the left. In the year, the Science Based Targets Initiative validated our new carbon reduction target as aligned with the 1.5°C criteria. New targets for 2030, including the new science-based Scope 1 and 2 emissions reduction target, are listed in the table, below left, and supported by two targets to accelerate reductions in Scope 3 emissions: § Reduce absolute Scope 3 emissions from purchased goods and services (incorporating capital goods), business travel and employee commuting by 30% in 2030 against a 2018 base year § 60% of suppliers by spend covering purchased goods and services, fuel and energy related activities, upstream transportation and distribution and business travel will have science-based targets by 2027 We continue to report on our indirect Scope 3 emissions as indicated below. Market segments Governance and shareholder information Financial statements Financial review Corporate responsibility Overview |
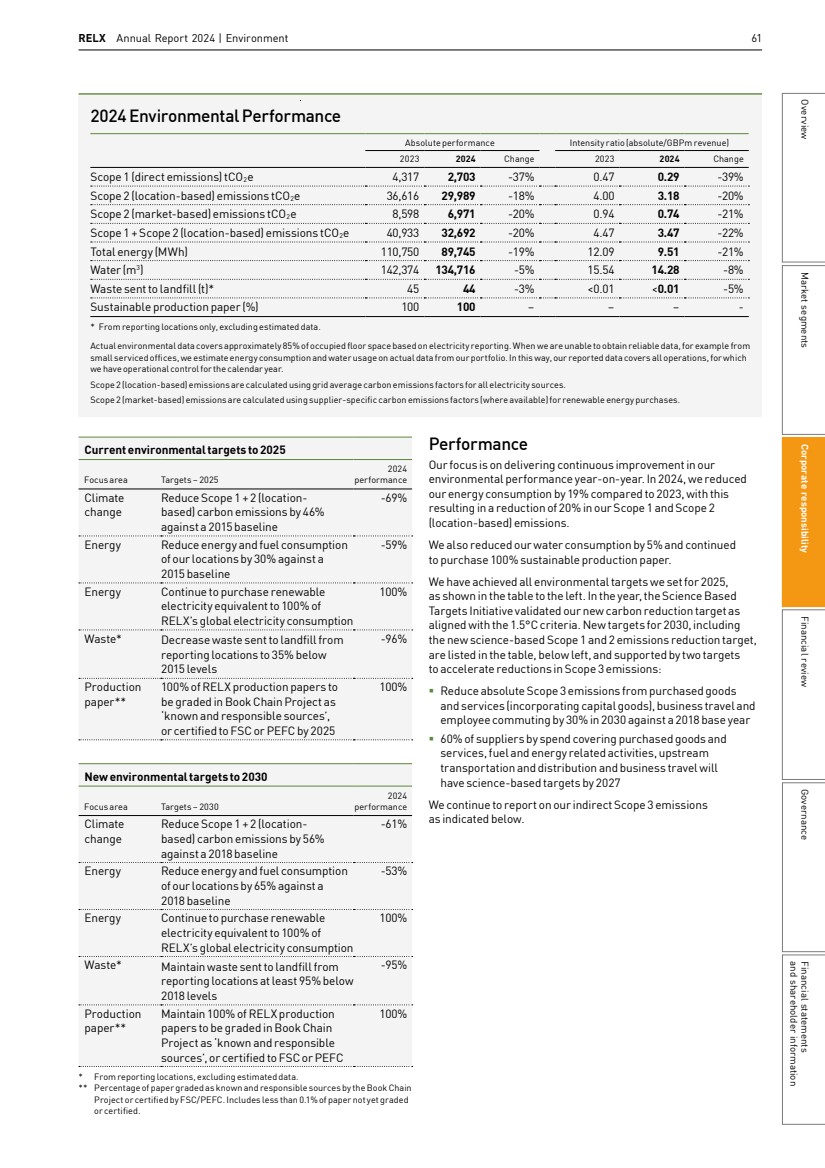
| 62 RELX Annual Report 2024 | Corporate responsibility Climate change Our Climate Change Statement supports the scientific community’s opinion that human activity is contributing to climate change; we support the Paris Agreement’s intention to limit climate change to 1.5°C. The RELX Climate Change Statement is available at www.relx.com/cr-downloads. As a signatory to the Climate Pledge, we are committed to becoming net zero by 2040 at the latest. The main tenets ofthe initiative, a community of more than 500 organisations working to address climate change, is measuring and reporting greenhouse gas emissions and implementing decarbonisation strategies for significant emissions reductions. Since 2010, we have reduced our Scope 1 and 2 location-based carbon emissions by 80%. In 2024, as stated, our new carbon target gained verification by the Science Based Targets Initiative aligned with the 1.5°C goal of the Paris Climate Agreement. It will require us to continue reducing greenhouse gas emissions and maintain our internal carbon pricing scheme, among other measures. Our Net Zero transition plan can be found on page 220. Water The majority of our sites use water from municipal supply and are in developed countries with a high capability for water adaptation and mitigation. Our water usage decreased 5% between 2023 and 2024 due to ongoing office space consolidation. We engage with internal water experts who produce water-related content for our customers. In 2024, we provided customers 24 peer-reviewed journals in water science and technology, including Water Research. Energy As RELX predominantly occupies leased locations with few opportunities for onsite generation, we rely on green tariffs and renewable energy certificates (RECs) to purchase renewables equal to 100% of our global electricity consumption. In 2024, we purchased Green-e certified wind RECs. Energy consumption at our offices, representing around 50% ofthe total, decreased in 2024 due to ongoing office space consolidation. Energy from our owned data centres, representing around 40% of the total, decreased as we continue to move activity to the cloud. We are a member of RE100, a global initiative bringing together businesses committed to 100% renewable electricity. Water usage 226,509 183,575 156,734 142,374 134,716 2020 2021 2022 2023 2024 Cubic metres Energy consumption 2020 2021 2022 2023 2024 142,098 125,095 117,997 110,750 89,745 MWh Absolute emissions 0 110 tCO2e 1,000s 2020 2021 2022 2023 2024 Intensity emissions Scope 1 emissions Scope 2 (location-based) emissions tCO2e per GBPm revenue 0 20 2020 2021 2022 2023 2024 2018 is our baseline year for environment targets. Data available on page 36. Data available on page 61. |
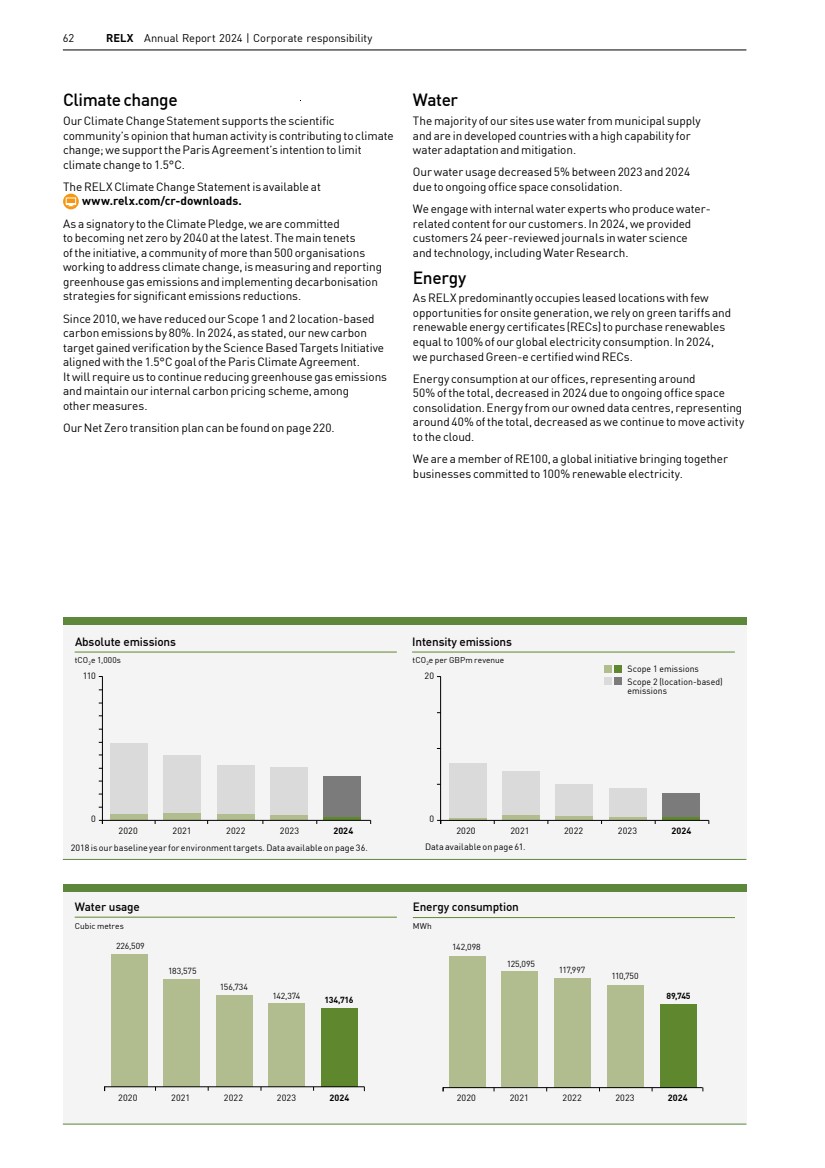
| RELX Annual Report 2024 | Environment 63 Waste Total waste generated across all locations decreased by 8% in 2024, primarily due to changes in how our office space is utilised. Of waste generated across all locations, we estimate 71% was recycled and 93% diverted from landfill through recycling, composting and energy generation from waste. Of the waste produced at our reporting locations, excluding estimated data, 75% was recycled. In 2024, waste sent to landfill from reporting locations, excluding estimated data, decreased by 3% due to careful management of project waste streams and the ongoing office space utilisation projects. Where reliable measurements are not available, we calculate waste based on weight sampling and by counting waste containers leaving our premises. Although local municipalities most often carry out sorting and recycling, we report all waste as going to landfill unless we have robust evidence. For this reason, performance against our waste target is linked to our reporting locations. We work to reduce packaging waste from our physical products. In the UK, we provide information on packaging waste in line with the UK government’s Producer Responsibility Obligations (Packaging Waste) Regulations 2007. As a member of the Biffpack compliance scheme, we report the amount of obligated packaging (as defined in the Packaging Waste Regulations) we generate through selling, pack and fill and importation of our products. Paper The quantity of production paper purchased in 2024 decreased by 16% over 2023 and by 71% since 2010 as we deliver more of our products online, reflecting a circular economy approach to conducting our business. During 2024, we updated the RELX Paper Policy to highlight our commitment to avoiding deforestation and other environmental impacts through the purchase of sustainably sourced papers. 100% of RELX production papers were graded as known and responsible sources or certified to FSC or PEFC. We continue to reduce waste and the environmental impact of producing our products through measures such as smaller print runs, digital over litho printing, print on demand and lighter papers where possible. We are a founding member of the Book Chain Project’s paper module (PREPS) and helped create the PREPS database which identifies the pulps and forest sources of papers. Each paper is given stars according to sustainability criteria: one (unknown or unwanted material), three (known and responsible), or five (recycled, Forest Stewardship Council or Programme for the Endorsement of Forest Certification certified). The RELX Sustainable Production Paper Policy commits us to purchase only sustainable papers – graded three or five inBookchain, or certified to FSC or PEFC. In 2024, we used approximately 95 tonnes of office paper. To reduce paper use at sites with higher consumption levels, we have set specific targets. Waste sent to landfill (reporting locations) 210 150 73 45 Tonnes 2020 2021 2022 2023 2024 44 Energy from waste 20% Landfill 3% Compost 2% Recycling 75% Waste disposal (reporting locations) Reporting locations are those from which we were able to capture primary data in the year and excludes estimated data. Asia Pacific 27% Europe 52% North America 21% Forest source of graded production papers Percentage of paper graded as known and responsible sources by the Book Chain Project or certified by FSC/PEFC. Includes less than 0.1% of paper not yet graded or certified. Sustainable production paper 92 98 99 100 100 Percentage 2020 2021 2022 2023 2024 Market segments Governance and shareholder information Financial statements Financial review Corporate responsibility Overview |
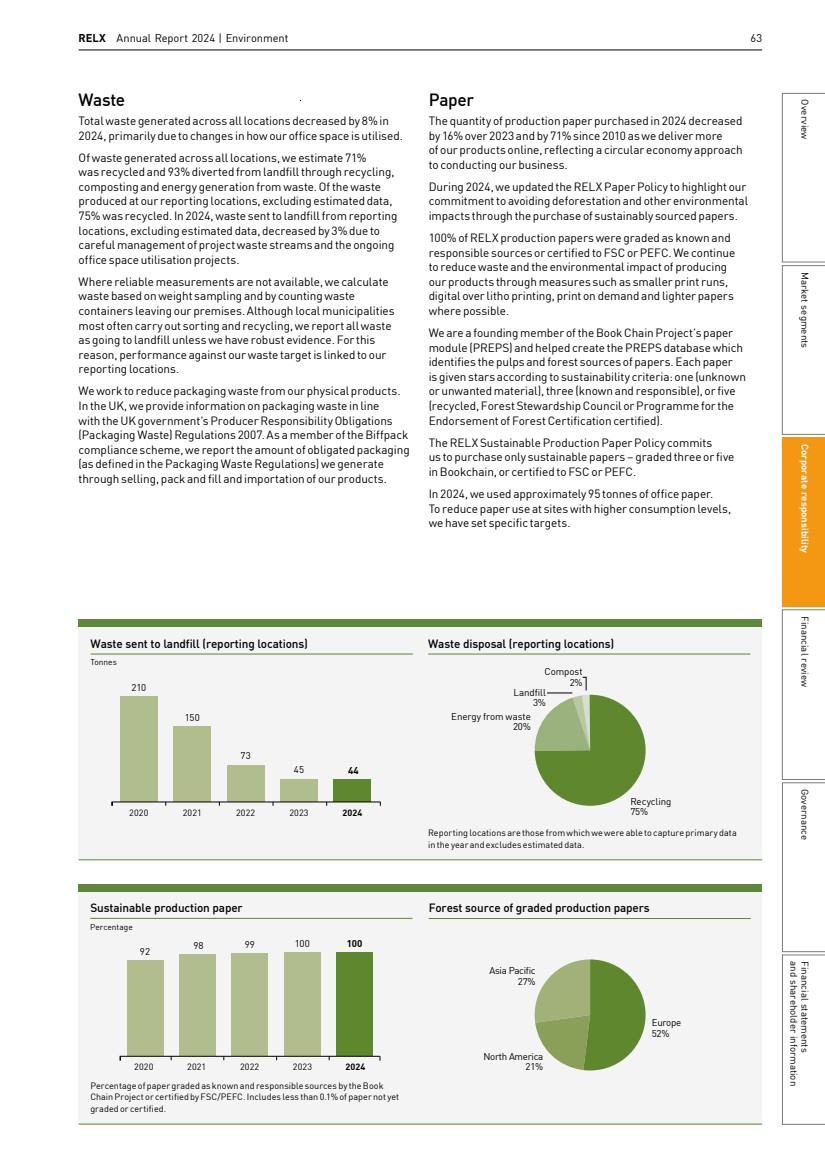
| 64 RELX Annual Report 2024 | Corporate responsibility Through RELX’s Environmental Standards programme, locations are encouraged to develop a local travel plan. Actions from travel plans include publishing information on public transport links, promoting commuter loan schemes and encouraging carpooling. Using daily refreshed office attendance data, we estimated emissions in 2024 to be around 5,900 tCO2e. RX has partnered with peers on Net Zero Carbon Events. Launched at COP26, the initiative aims to develop methodologies to quantify and reduce emissions associated with the events industry. While attendance at one of our events can replace the need for multiple business trips, we are gathering emissions data associated with an event’s value chain. We dispose of defunct hardware and other electronic waste according to local regulations and recycle only if equipment cannot be reused. We partner with Camara Education to donate equipment to provide access to computers for students in Ethiopia, Kenya, Tanzania and Zambia. Equipment is refurbished for use or sold with proceeds going to set up computer labs, train teachers and provide locally relevant educational content. Any equipment that cannot be refurbished is appropriately recycled. RELX Environmental Challenge 2024 marked the fourteenth year of the RELX Environmental Challenge, a competitive grant-making scheme focused onproviding improved and sustainable access to water andsanitation where it is presently at risk. Since 2011, the RELX Environmental Challenge has been awarded to projects that best demonstrate how they can provide sustainable access to safe water or sanitation. A$50,000 prize is granted to the first place entry and a $25,000 prize for the second place entry. The winners also receive free access for one year to ScienceDirect, Elsevier’s database of full text, scientific information. Projects must have clear practical applicability, address identified need and advance related issues such as health, education, or human rights. The 2024 first prize winner was LivingWaters Systems, a low cost, portable, rainwater harvesting guttering system designed to support its own weight without being physically attached to its host housing unit, therefore making it suitable for use on any home with a pitched roof, including refugee tents and less durable informal structures. The second prize winner was Permalution, a start up company harnessing fog and clouds with its innovative technology, collecting between 150-400 litres of water per day per unit. The Environmental Challenge shows the power of knowledge and innovation. Mirieme Hill RELX Environmental Challenge Scope 3 Emissions 2023 2024 Change Category 1 & 2: Purchased goods and services including capital goods (tCO2e) 271,000 272,000 0% Category 6: Business travel (tCO2e) including flights 17,804 19,594 10% Category 7: Employee commuting (tCO2e) 5,100 5,900 16% Scope 3 categories covered by the Scope 3 reduction target, validated by the Science Based Targets Initiative. Impacts in our value chain Scope 3 In 2024, we continued to advance our understanding of our Scope 3 emissions beyond business flights, identifying key areas, refining our methodology and our engagement with suppliers. We used the RELX CO2 Hub, an internal analytics platform, to help quantify our Scope 3 emissions. We have estimated supplier emissions through an improved methodology by collecting data on key suppliers to derive carbon intensity factors. The factors are then extrapolated by spend category to cover our full supply chain. We estimated that our share of the Scope 1 and Scope 2 carbon emissions of our suppliers, excluding business travel, cloud computing services (see below), distribution and events (see below), is approximately 50,000 tCO2e per annum. While RELX continues to undertake energy efficiency projects atits own data centres, some of the energy and carbon reductions atthese facilities have been achieved by moving content to third-party cloud services. With emissions data provided by our primary Infrastructure as a Service (laaS) cloud providers, we estimated 2024 market-based carbon emissions associated with all cloud computing services provided to RELX to be 244 tCO2e. Using location-specific emissions factors and office attendance data, we estimated emissions from home working in the year to be around 12,000 tCO2e. |
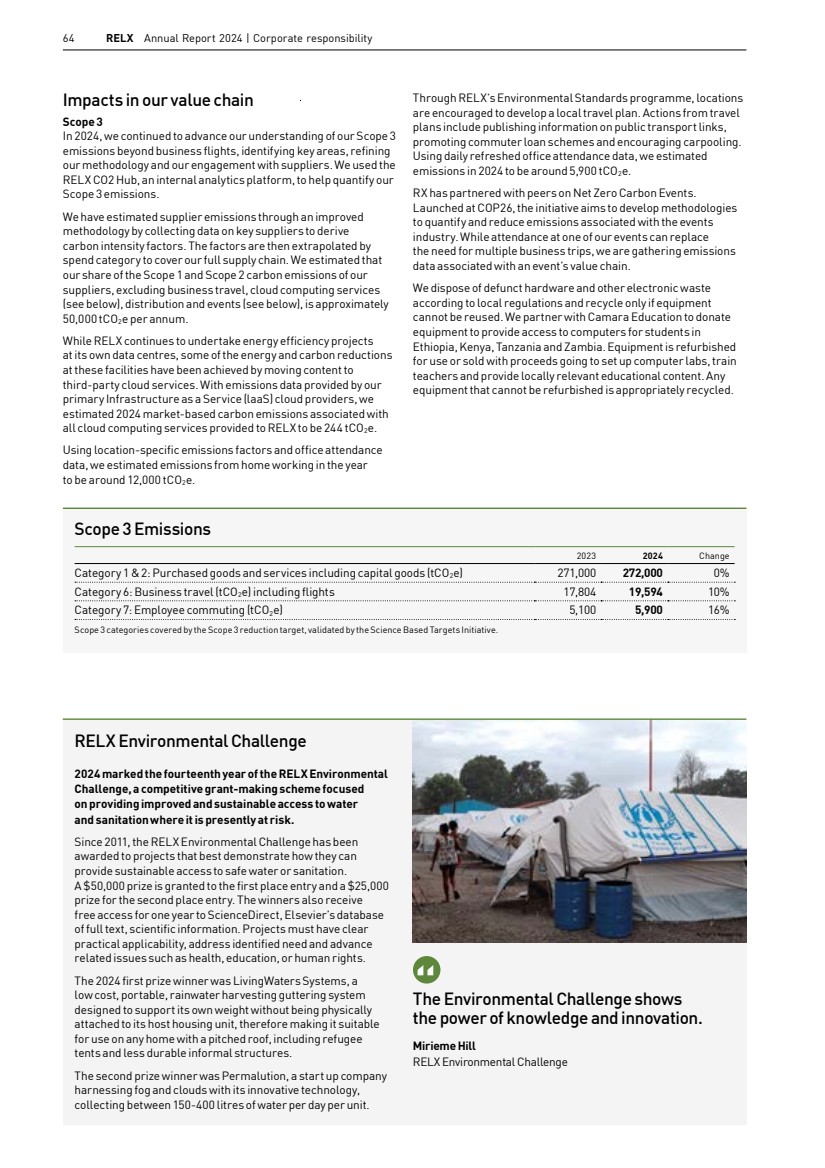
| RELX Annual Report 2024 | Environment 65 2025 objectives By 2030 Environmental responsibility – Implement new environment targets covering energy, waste and management system, in support of SDG 12 (Responsible Consumption and Production) Carbon reduction – Implement employee action budget, funded by internal carbon price, in support of SDG 13 (ClimateAction) Further environmental knowledge and insight globally through our products and services and conduct our business with the lowest environmental impact possible Progress and objectives 2024 PERFORMANCE Implement new SBTi environmental targets 2024 PERFORMANCE Publish RELX net zero transition plan We aim to be net zero by 2040 at the latest. In support of that long-term ambition, we set near term carbon reductions targets. To ensure our targets are in line with the reductions required to meet the aims of the Paris climate agreement, we submitted new targets to the Science Based Targets Institute (SBTi). In the year, the SBTi successfully validated our targets against the 1.5°C criteria. These new targets, as set out on page 61, signal our continued commitment to action on climate change. The new target to engage our suppliers on setting their own science based targets will support our aim to reduce Scope 3 carbon emissions, including emissions across our supply chain. We have made significant progress in minimising our contribution to climate change, achieving a 79% reduction in Scope 1 + Scope 2 (location-based) emissions since 2010. Those improvements have required the sustained efforts of colleagues across the business. As we concentrate on further reducing our remaining emissions, it is important to understand what actions we can take, over what timeframe to help us achieve net zero. We developed a net zero transition plan which builds on our high level roadmap. This lays out a series of possible actions that we can take and how these might reduce our potential emissions in future years to ensure we remain in line with the 1.5°C reduction pathway. See the transition plan on page 220. Market segments Governance and shareholder information Financial statements Financial review Corporate responsibility Overview |
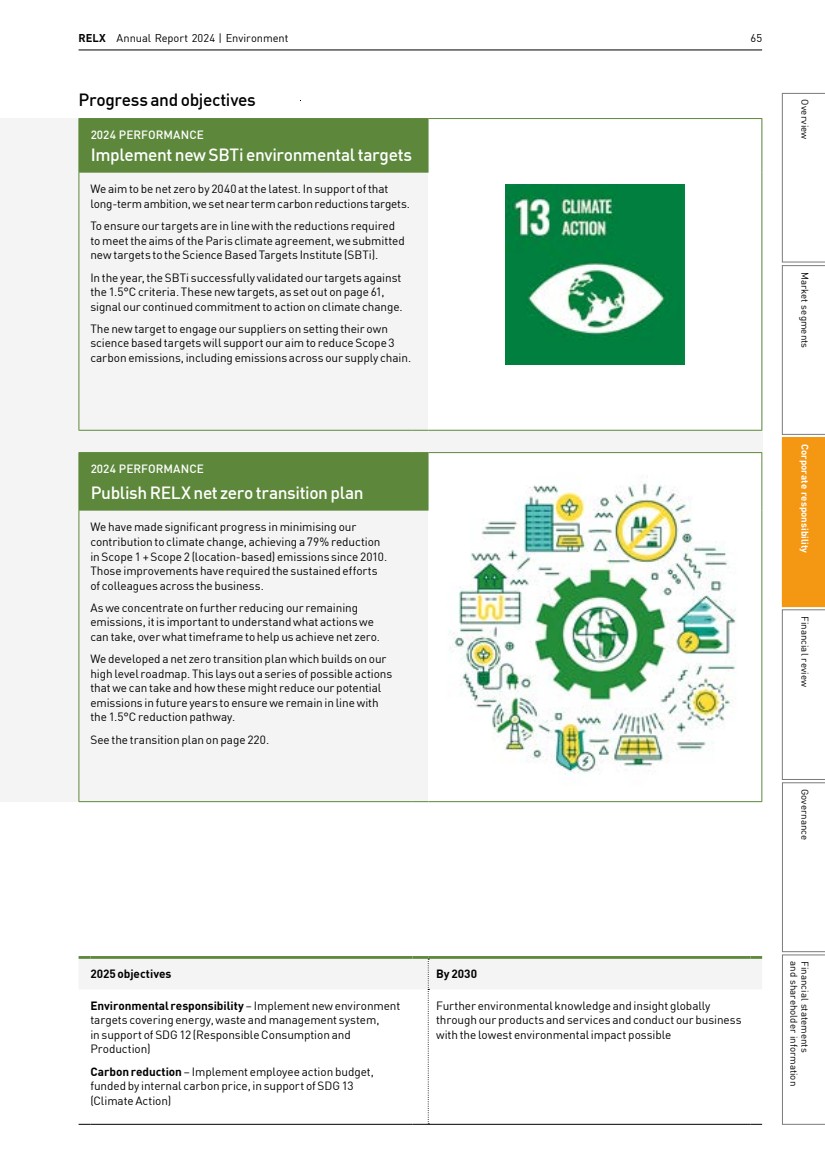
| In this section 68 Chief Financial Officer’s report 74 Principal and emerging risks Financial review 66 RELX Annual Report 2024 |
| Market segments Governance and shareholder information Financial statements Financial review Corporate responsibility Overview RELX Annual Report 2024 67 |
| 68 RELX Annual Report 2024 | Financial review 7,110 7,244 GBPm 8,553 9,161 9,434 Revenue 2020 2021 2022 2023 2024 GBPm Adjusted operating profit 2,076 2,210 2,683 3,030 3,199 2020 2021 2022 2023 2024 92 RELX Annual Report 2024 | Financial review Chief Financial Officer’s report In 2024, underlying revenue growth was 7% and underlying adjusted operating profit growth was 10%, and adjusted earnings per share grew at 9% at constant currency. Nick Luff, Chief Financial Officer Revenue Group underlying revenue growth was 7%, with all four market segments contributing to underlying growth. The underlying growth rate reflects growth in electronic revenue of 7% with strong growth in face-to-face revenues offsetting the print decline. Risk continued to deliver strong growth, STM maintained its improved growth, Legal growth continued to improve and Exhibitions saw strong growth. At group level, the impact on revenue of disposals more than offset that of acquisitions and the benefit of exhibition cycling effects, giving total revenue growth at constant currency of 6%. The impact of currency movements was to decrease revenue by 3%. Total revenue, including the effects of acquisitions, disposals, exhibition cycling and currency movements, was £9,434m (2023: £9,161m), up 3%. Profit Group underlying growth in adjusted operating profit was 10%, with growth in each of Risk, STM and Legal ahead of revenue growth, and the improvement in profitability in Exhibitions, well ahead of revenue growth, reflecting the lower cost structure. Acquisitions and disposals combined decreased adjusted operating profit growth, giving growth at constant currency of 9%. Currency effects decreased adjusted operating profit by 3%. Total adjusted operating profit, including the impact of acquisitions and disposals and currency effects, was £3,199m (2023: £3,030m), up 6%. Operating costs on an underlying basis grew 6%, reflecting investment in global technology platforms, the launch of new products and services and the increased activity levels within Exhibitions, partly offset by the benefits of continued process innovation. Actions continue to be taken across the Group to improve cost-efficiency. Total adjusted operating costs, including the impact of acquisitions, disposals and currency effects, were up 2%. The overall adjusted operating margin was 33.9% (2023: 33.1%). On an underlying basis, including cycling effects, the margin improved by 0.8 percentage points, while portfolio changes improved margin by 0.1 percentage points and currency movements decreased margin by 0.1 percentage points. EBITDA margin also improved, by 0.8 percentage points, to 39.5%. Reported operating profit was £2,861m (2023: £2,682m) up 7%, primarily reflecting the increase in adjusted operating profit and a lower amortisation charge in respect of acquired intangible assets. Adjusted net interest expense was £296m (2023: £314m). In 2023, the adjusted interest expense included a charge of £26m in respect of the early redemption of bonds. Adjusted profit before tax was £2,903m (2023: £2,716m), up 7%. Reported profit before tax was £2,557m (2023: £2,295m) up 11%, reflecting the improvement in reported operating profit, the lower interest expense and the prior year including an impairment charge for some assets held for sale. The amortisation charge in respect of acquired intangible assets, including the share of amortisation in joint ventures and associates, was £258m (2023: £280m). 92 RELX Annual Report 2024 | Financial review Chief Financial Officer’s report In 2024, underlying revenue growth was 7% and underlying adjusted operating profit growth was 10%, and adjusted earnings per share grew at 9% at constant currency. Nick Luff, Chief Financial Officer Revenue Group underlying revenue growth was 7%, with all four market segments contributing to underlying growth. The underlying growth rate reflects growth in electronic revenue of 7% with strong growth in face-to-face revenues offsetting the print decline. Risk continued to deliver strong growth, STM maintained its improved growth, Legal growth continued to improve and Exhibitions saw strong growth. At group level, the impact on revenue of disposals more than offset that of acquisitions and the benefit of exhibition cycling effects, giving total revenue growth at constant currency of 6%. The impact of currency movements was to decrease revenue by 3%. Total revenue, including the effects of acquisitions, disposals, exhibition cycling and currency movements, was £9,434m (2023: £9,161m), up 3%. Profit Group underlying growth in adjusted operating profit was 10%, with growth in each of Risk, STM and Legal ahead of revenue growth, and the improvement in profitability in Exhibitions, well ahead of revenue growth, reflecting the lower cost structure. Acquisitions and disposals combined decreased adjusted operating profit growth, giving growth at constant currency of 9%. Currency effects decreased adjusted operating profit by 3%. Total adjusted operating profit, including the impact of acquisitions and disposals and currency effects, was £3,199m (2023: £3,030m), up 6%. Operating costs on an underlying basis grew 6%, reflecting investment in global technology platforms, the launch of new products and services and the increased activity levels within Exhibitions, partly offset by the benefits of continued process innovation. Actions continue to be taken across the Group to improve cost-efficiency. Total adjusted operating costs, including the impact of acquisitions, disposals and currency effects, were up 2%. The overall adjusted operating margin was 33.9% (2023: 33.1%). On an underlying basis, including cycling effects, the margin improved by 0.8 percentage points, while portfolio changes improved margin by 0.1 percentage points and currency movements decreased margin by 0.1 percentage points. EBITDA margin also improved, by 0.8 percentage points, to 39.5%. Reported operating profit was £2,861m (2023: £2,682m) up 7%, primarily reflecting the increase in adjusted operating profit and a lower amortisation charge in respect of acquired intangible assets. Adjusted net interest expense was £296m (2023: £314m). In 2023, the adjusted interest expense included a charge of £26m in respect of the early redemption of bonds. Adjusted profit before tax was £2,903m (2023: £2,716m), up 7%. Reported profit before tax was £2,557m (2023: £2,295m) up 11%, reflecting the improvement in reported operating profit, the lower interest expense and the prior year including an impairment charge for some assets held for sale. The amortisation charge in respect of acquired intangible assets, including the share of amortisation in joint ventures and associates, was £258m (2023: £280m). RELX Annual Report 2024 | Chief Financial Officer’s report 93 Overview Market segments Corporate responsibility Financial review Governance Financial statements and shareholder information ADJUSTED FIGURES Constant 2023 2024 Change currency Underlying For the year ended 31 December GBPm GBPm in GBP growth growth Revenue 9,161 9,434 +3% +6% +7% EBITDA 3,544 3,724 Operating profit 3,030 3,199 +6% +9% +10% Operating margin 33.1% 33.9% Net interest expense (314) (296) Profit before tax 2,716 2,903 +7% +11% Tax charge (553) (652) Net profit attributable to shareholders 2,156 2,241 +4% +8% Cash flow 2,962 3,101 +5% Cash flow conversion 98% 97% Return on invested capital 14.0% 14.8% Earnings per share 114.0p 120.1p +5% +9% DIVIDEND For the year ended 31 December 2023 2024 Change Ordinary dividend per share 58.8p 63.0p +7% REPORTED FIGURES For the year ended 31 December 2023 2024 Change Revenue 9,161 9,434 +3% Operating profit 2,682 2,861 +7% Profit before tax 2,295 2,557 +11% Net profit attributable to shareholders 1,781 1,934 +9% Net margin 19.4% 20.5% Cash generated from operations 3,370 3,521 +4% Net debt 6,446 6,563 Earnings per share 94.1p 103.6p +10% Summary financial information is presented in US dollars and Euros on pages 198 and 199 respectively. RELX uses adjusted and underlying figures as additional performance measures. Adjusted figures primarily exclude the amortisation of acquired intangible assets and other items related to acquisitions and disposals, and the associated deferred tax movements. Reconciliations between the reported and adjusted figures are set out on pages 200 to 207. Underlying growth rates are calculated at constant currency, excluding the results of acquisitions until 12 months after purchase, and excluding the results of disposals and assets held for sale. Underlying revenue growth rates also exclude exhibition cycling. Constant currency growth rates are based on 2023 full-year average and hedge exchange rates. Acquisition and disposal related costs were £69m (2023: £56m), slightly higher than the prior year due to restructuring costs incurred following the disposal of some of our assets. The adjusted tax charge was £652m (2023: £553m). The adjusted effective tax rate was 22.5% (2023: 20.4%), with the prior year benefitting from non-recurring tax credits arising from the resolution of certain historical tax matters. The adjusted tax charge excludes movements in deferred taxation assets and liabilities related to goodwill and acquired intangible assets, but includes the benefit of tax amortisation where available on those items. Adjusted operating profit from joint ventures and associates is grossed up for our equity share of interest and taxation. The application of tax law and practice is subject to some uncertainty and amounts are provided in respect of this. Discussions with tax authorities relating to cross-border transactions and other matters are ongoing. Although the outcome of open items cannot be predicted, no significant impact on profitability is expected. The reported tax charge was £613m (2023: £507m), including tax associated with the amortisation of acquired intangible assets, disposals and other non-operating items. The adjusted net profit attributable to shareholders was £2,241m (2023: £2,156m), up 4%. Adjusted earnings per share was up 9% at constant currency, and after changes in exchange rates was up 5% at 120.1p (2023: 114.0p). The reported net profit attributable to shareholders was £1,934m (2023: £1,781m) up 9%. Reported earnings per share was 103.6p (2023: 94.1p) up 10%. 92 RELX Annual Report 2024 | Financial review Chief Financial Officer’s report In 2024, underlying revenue growth was 7% and underlying adjusted operating profit growth was 10%, and adjusted earnings per share grew at 9% at constant currency. Nick Luff, Chief Financial Officer Revenue Group underlying revenue growth was 7%, with all four market segments contributing to underlying growth. The underlying growth rate reflects growth in electronic revenue of 7% with strong growth in face-to-face revenues offsetting the print decline. Risk continued to deliver strong growth, STM maintained its improved growth, Legal growth continued to improve and Exhibitions saw strong growth. At group level, the impact on revenue of disposals more than offset that of acquisitions and the benefit of exhibition cycling effects, giving total revenue growth at constant currency of 6%. The impact of currency movements was to decrease revenue by 3%. Total revenue, including the effects of acquisitions, disposals, exhibition cycling and currency movements, was £9,434m (2023: £9,161m), up 3%. Profit Group underlying growth in adjusted operating profit was 10%, with growth in each of Risk, STM and Legal ahead of revenue growth, and the improvement in profitability in Exhibitions, well ahead of revenue growth, reflecting the lower cost structure. Acquisitions and disposals combined decreased adjusted operating profit growth, giving growth at constant currency of 9%. Currency effects decreased adjusted operating profit by 3%. Total adjusted operating profit, including the impact of acquisitions and disposals and currency effects, was £3,199m (2023: £3,030m), up 6%. Operating costs on an underlying basis grew 6%, reflecting investment in global technology platforms, the launch of new products and services and the increased activity levels within Exhibitions, partly offset by the benefits of continued process innovation. Actions continue to be taken across the Group to improve cost-efficiency. Total adjusted operating costs, including the impact of acquisitions, disposals and currency effects, were up 2%. The overall adjusted operating margin was 33.9% (2023: 33.1%). On an underlying basis, including cycling effects, the margin improved by 0.8 percentage points, while portfolio changes improved margin by 0.1 percentage points and currency movements decreased margin by 0.1 percentage points. EBITDA margin also improved, by 0.8 percentage points, to 39.5%. Reported operating profit was £2,861m (2023: £2,682m) up 7%, primarily reflecting the increase in adjusted operating profit and a lower amortisation charge in respect of acquired intangible assets. Adjusted net interest expense was £296m (2023: £314m). In 2023, the adjusted interest expense included a charge of £26m in respect of the early redemption of bonds. Adjusted profit before tax was £2,903m (2023: £2,716m), up 7%. Reported profit before tax was £2,557m (2023: £2,295m) up 11%, reflecting the improvement in reported operating profit, the lower interest expense and the prior year including an impairment charge for some assets held for sale. The amortisation charge in respect of acquired intangible assets, including the share of amortisation in joint ventures and associates, was £258m (2023: £280m). |
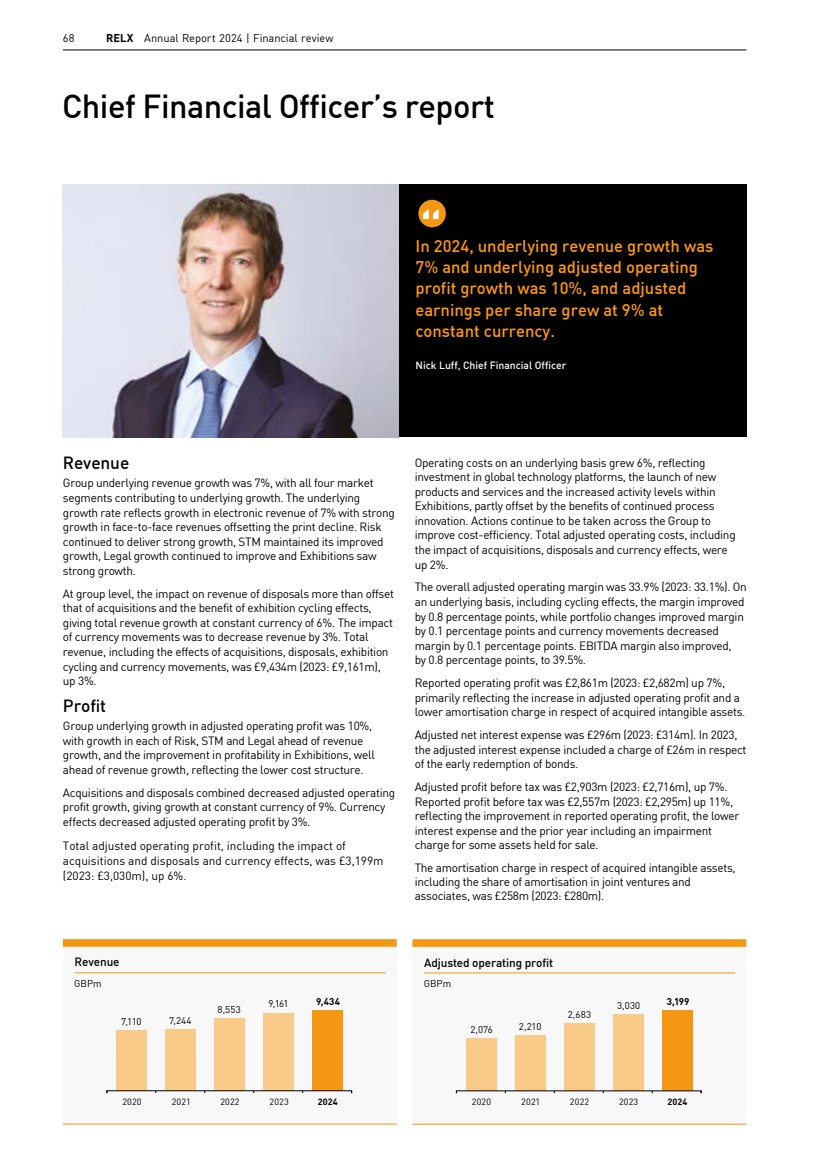
| RELX Annual Report 2024 | Chief Financial Officer’s report 69 Adjusted operating profit margin 33.9% 29.2% 30.5% 31.4% 33.1% 2020 2021 2022 2023 2024 92 RELX Annual Report 2024 | Financial review Chief Financial Officer’s report In 2024, underlying revenue growth was 7% and underlying adjusted operating profit growth was 10%, and adjusted earnings per share grew at 9% at constant currency. Nick Luff, Chief Financial Officer Revenue Group underlying revenue growth was 7%, with all four market segments contributing to underlying growth. The underlying growth rate reflects growth in electronic revenue of 7% with strong growth in face-to-face revenues offsetting the print decline. Risk continued to deliver strong growth, STM maintained its improved growth, Legal growth continued to improve and Exhibitions saw strong growth. At group level, the impact on revenue of disposals more than offset that of acquisitions and the benefit of exhibition cycling effects, giving total revenue growth at constant currency of 6%. The impact of currency movements was to decrease revenue by 3%. Total revenue, including the effects of acquisitions, disposals, exhibition cycling and currency movements, was £9,434m (2023: £9,161m), up 3%. Profit Group underlying growth in adjusted operating profit was 10%, with growth in each of Risk, STM and Legal ahead of revenue growth, and the improvement in profitability in Exhibitions, well ahead of revenue growth, reflecting the lower cost structure. Acquisitions and disposals combined decreased adjusted operating profit growth, giving growth at constant currency of 9%. Currency effects decreased adjusted operating profit by 3%. Total adjusted operating profit, including the impact of acquisitions and disposals and currency effects, was £3,199m (2023: £3,030m), up 6%. Operating costs on an underlying basis grew 6%, reflecting investment in global technology platforms, the launch of new products and services and the increased activity levels within Exhibitions, partly offset by the benefits of continued process innovation. Actions continue to be taken across the Group to improve cost-efficiency. Total adjusted operating costs, including the impact of acquisitions, disposals and currency effects, were up 2%. The overall adjusted operating margin was 33.9% (2023: 33.1%). On an underlying basis, including cycling effects, the margin improved by 0.8 percentage points, while portfolio changes improved margin by 0.1 percentage points and currency movements decreased margin by 0.1 percentage points. EBITDA margin also improved, by 0.8 percentage points, to 39.5%. Reported operating profit was £2,861m (2023: £2,682m) up 7%, primarily reflecting the increase in adjusted operating profit and a lower amortisation charge in respect of acquired intangible assets. Adjusted net interest expense was £296m (2023: £314m). In 2023, the adjusted interest expense included a charge of £26m in respect of the early redemption of bonds. Adjusted profit before tax was £2,903m (2023: £2,716m), up 7%. Reported profit before tax was £2,557m (2023: £2,295m) up 11%, reflecting the improvement in reported operating profit, the lower interest expense and the prior year including an impairment charge for some assets held for sale. The amortisation charge in respect of acquired intangible assets, including the share of amortisation in joint ventures and associates, was £258m (2023: £280m). EBITDA margin 2020 2021 2022 2023 2024 36.1% 37.2% 37.1% 38.7% 39.5% RELX Annual Report 2024 | Chief Financial Officer’s report 93 Overview Market segments Corporate responsibility Financial review Governance Financial statements and shareholder information ADJUSTED FIGURES Constant 2023 2024 Change currency Underlying For the year ended 31 December GBPm GBPm in GBP growth growth Revenue 9,161 9,434 +3% +6% +7% EBITDA 3,544 3,724 Operating profit 3,030 3,199 +6% +9% +10% Operating margin 33.1% 33.9% Net interest expense (314) (296) Profit before tax 2,716 2,903 +7% +11% Tax charge (553) (652) Net profit attributable to shareholders 2,156 2,241 +4% +8% Cash flow 2,962 3,101 +5% Cash flow conversion 98% 97% Return on invested capital 14.0% 14.8% Earnings per share 114.0p 120.1p +5% +9% DIVIDEND For the year ended 31 December 2023 2024 Change Ordinary dividend per share 58.8p 63.0p +7% REPORTED FIGURES For the year ended 31 December 2023 2024 Change Revenue 9,161 9,434 +3% Operating profit 2,682 2,861 +7% Profit before tax 2,295 2,557 +11% Net profit attributable to shareholders 1,781 1,934 +9% Net margin 19.4% 20.5% Cash generated from operations 3,370 3,521 +4% Net debt 6,446 6,563 Earnings per share 94.1p 103.6p +10% Summary financial information is presented in US dollars and Euros on pages 198 and 199 respectively. RELX uses adjusted and underlying figures as additional performance measures. Adjusted figures primarily exclude the amortisation of acquired intangible assets and other items related to acquisitions and disposals, and the associated deferred tax movements. Reconciliations between the reported and adjusted figures are set out on pages 200 to 207. Underlying growth rates are calculated at constant currency, excluding the results of acquisitions until 12 months after purchase, and excluding the results of disposals and assets held for sale. Underlying revenue growth rates also exclude exhibition cycling. Constant currency growth rates are based on 2023 full-year average and hedge exchange rates. Acquisition and disposal related costs were £69m (2023: £56m), slightly higher than the prior year due to restructuring costs incurred following the disposal of some of our assets. The adjusted tax charge was £652m (2023: £553m). The adjusted effective tax rate was 22.5% (2023: 20.4%), with the prior year benefitting from non-recurring tax credits arising from the resolution of certain historical tax matters. The adjusted tax charge excludes movements in deferred taxation assets and liabilities related to goodwill and acquired intangible assets, but includes the benefit of tax amortisation where available on those items. Adjusted operating profit from joint ventures and associates is grossed up for our equity share of interest and taxation. The application of tax law and practice is subject to some uncertainty and amounts are provided in respect of this. Discussions with tax authorities relating to cross-border transactions and other matters are ongoing. Although the outcome of open items cannot be predicted, no significant impact on profitability is expected. The reported tax charge was £613m (2023: £507m), including tax associated with the amortisation of acquired intangible assets, disposals and other non-operating items. The adjusted net profit attributable to shareholders was £2,241m (2023: £2,156m), up 4%. Adjusted earnings per share was up 9% at constant currency, and after changes in exchange rates was up 5% at 120.1p (2023: 114.0p). The reported net profit attributable to shareholders was £1,934m (2023: £1,781m) up 9%. Reported earnings per share was 103.6p (2023: 94.1p) up 10%. 92 RELX Annual Report 2024 | Financial review Chief Financial Officer’s report In 2024, underlying revenue growth was 7% and underlying adjusted operating profit growth was 10%, and adjusted earnings per share grew at 9% at constant currency. Nick Luff, Chief Financial Officer Revenue Group underlying revenue growth was 7%, with all four market segments contributing to underlying growth. The underlying growth rate reflects growth in electronic revenue of 7% with strong growth in face-to-face revenues offsetting the print decline. Risk continued to deliver strong growth, STM maintained its improved growth, Legal growth continued to improve and Exhibitions saw strong growth. At group level, the impact on revenue of disposals more than offset that of acquisitions and the benefit of exhibition cycling effects, giving total revenue growth at constant currency of 6%. The impact of currency movements was to decrease revenue by 3%. Total revenue, including the effects of acquisitions, disposals, exhibition cycling and currency movements, was £9,434m (2023: £9,161m), up 3%. Profit Group underlying growth in adjusted operating profit was 10%, with growth in each of Risk, STM and Legal ahead of revenue growth, and the improvement in profitability in Exhibitions, well ahead of revenue growth, reflecting the lower cost structure. Acquisitions and disposals combined decreased adjusted operating profit growth, giving growth at constant currency of 9%. Currency effects decreased adjusted operating profit by 3%. Total adjusted operating profit, including the impact of acquisitions and disposals and currency effects, was £3,199m (2023: £3,030m), up 6%. Operating costs on an underlying basis grew 6%, reflecting investment in global technology platforms, the launch of new products and services and the increased activity levels within Exhibitions, partly offset by the benefits of continued process innovation. Actions continue to be taken across the Group to improve cost-efficiency. Total adjusted operating costs, including the impact of acquisitions, disposals and currency effects, were up 2%. The overall adjusted operating margin was 33.9% (2023: 33.1%). On an underlying basis, including cycling effects, the margin improved by 0.8 percentage points, while portfolio changes improved margin by 0.1 percentage points and currency movements decreased margin by 0.1 percentage points. EBITDA margin also improved, by 0.8 percentage points, to 39.5%. Reported operating profit was £2,861m (2023: £2,682m) up 7%, primarily reflecting the increase in adjusted operating profit and a lower amortisation charge in respect of acquired intangible assets. Adjusted net interest expense was £296m (2023: £314m). In 2023, the adjusted interest expense included a charge of £26m in respect of the early redemption of bonds. Adjusted profit before tax was £2,903m (2023: £2,716m), up 7%. Reported profit before tax was £2,557m (2023: £2,295m) up 11%, reflecting the improvement in reported operating profit, the lower interest expense and the prior year including an impairment charge for some assets held for sale. The amortisation charge in respect of acquired intangible assets, including the share of amortisation in joint ventures and associates, was £258m (2023: £280m). Market segments Governance and shareholder information Financial statements Financial review Corporate responsibility Overview |
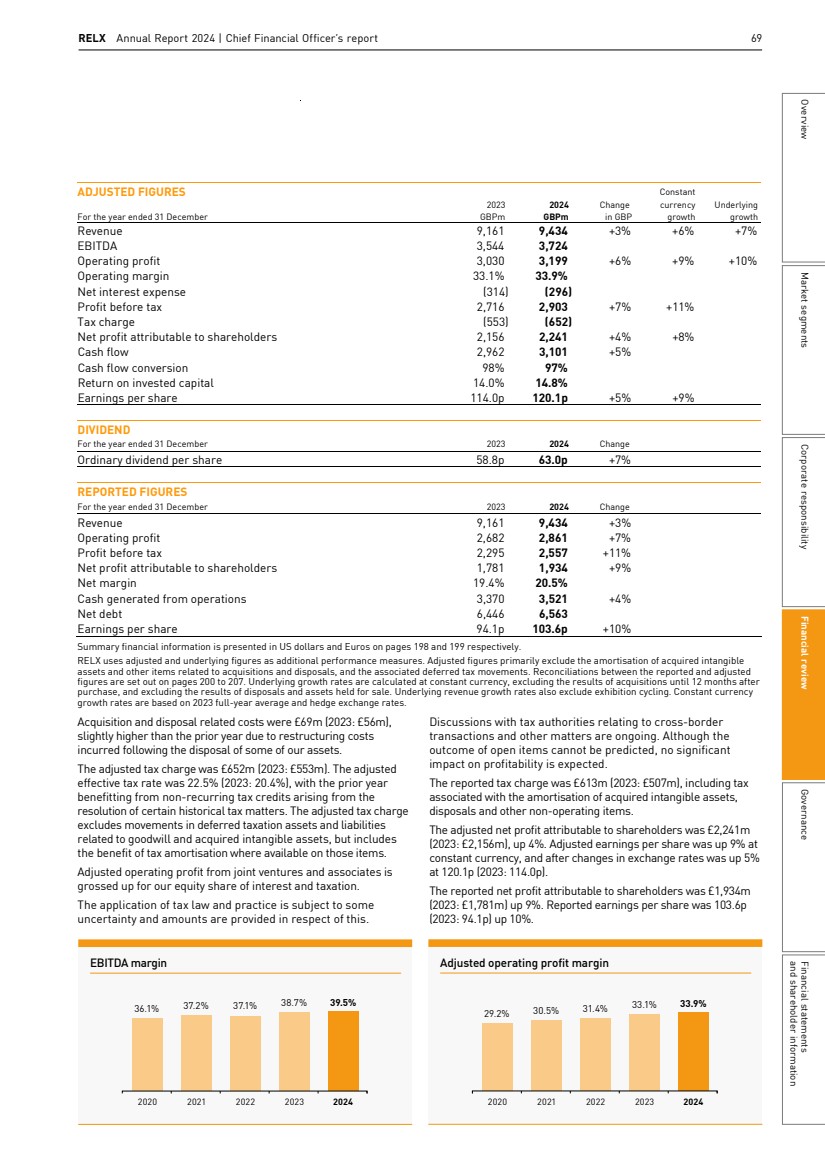
| 70 RELX Annual Report 2024 | Financial review 94 RELX Annual Report 2024 | Financial review Cash flows Adjusted cash flow was £3,101m (2023: £2,962m), up 5% compared with the prior period. The rate of conversion of adjusted operating profit to adjusted cash flow was 97% (2023: 98%). CONVERSION OF ADJUSTED OPERATING PROFIT INTO CASH YEAR TO 31 DECEMBER 2023 2024 GBPm GBPm Adjusted operating profit 3,030 3,199 Depreciation and amortisation 514 525 EBITDA 3,544 3,724 Capital expenditure (477) (484) Repayment of lease principal (net)* (70) (61) Working capital and other items (35) (78) Adjusted cash flow 2,962 3,101 Adjusted cash flow conversion 98% 97% * Net of sublease receipts. Capital expenditure was £484m (2023: £477m), including £464m (2023: £447m) in respect of capitalised development costs, reflecting sustained investment in new products. Capital expenditure was 5.1% of revenue (2023: 5.2%) and excludes pre-publication costs of £92m (2023: £93m) that were capitalised as current assets and principal lease repayments of £61m (2023: £70m). Depreciation and other amortisation charged within adjusted operating profit was £525m (2023: £514m) and represented 5.6% of revenue (2023: 5.6%). This includes amortisation of internally developed intangible assets of £364m (2023: £330m) and depreciation of property, plant and equipment of £34m (2023: £43m) which combined represent 4.2% (2023: 4.1%) of revenue. Interest paid (net) was £251m (2023: £294m), decreasing mainly as a result of the lower interest expense and timing of payments. Tax paid of £662m (2023: £619m) was higher than the income statement charge, with the difference reflecting timing of tax payments. Payments made in respect of acquisition and disposal related items amounted to £62m (2023: £56m). Free cash flow before dividends was £2,126m (2023: £1,988m). Ordinary dividends paid to shareholders in the year, being the 2023 final dividend and 2024 interim dividend, amounted to £1,121m (2023: £1,059m). Free cash flow after dividends was £1,005m (2023: £929m). FREE CASH FLOW YEAR TO 31 DECEMBER 2023 2024 GBPm GBPm Adjusted cash flow 2,962 3,101 Interest paid (net) (294) (251) Cash tax paid* (619) (662) Exceptional costs in Exhibitions (5) - Acquisition and disposal related items (56) (62) Free cash flow before dividends 1,988 2,126 Ordinary dividends (1,059) (1,121) Free cash flow after dividends 929 1,005 * Net of cash tax relief on acquisition and disposal related items and including cash tax impact of disposals. RECONCILIATION OF NET DEBT YEAR-ON-YEAR YEAR TO 31 DECEMBER 2023 2024 GBPm GBPm Net debt at 1 January (6,604) (6,446) Free cash flow post dividends 929 1,005 Acquisitions: total consideration (130) (195) Disposals: total consideration - 95 Share repurchases (800) (1,000) Purchase of shares by the Employee Benefit Trust (50) (75) Other* 25 7 Currency translation 184 46 Movement in net debt 158 (117) Net debt at 31 December (6,446) (6,563) * Includes pension deficit recovery payments, share option exercise proceeds, leases, disposal and acquisition timing effects. Total consideration on acquisitions completed in the year was £195m (2023: £130m). Cash spent on acquisitions was £175m (2023: £132m), including deferred consideration of £5m (2023: £16m) on past acquisitions and investments in joint ventures and associates and venture capital investments of £4m (2023: £8m). Total consideration from disposals completed in the year was £95m (2023: nil). Net cash inflow from disposals after separation and transaction costs was £46m (2023: £12m). Share repurchases in 2024 were £1,000m (2023: £800m) with a further £150m repurchased in 2025 as at 12 February. In addition, the Employee Benefit Trust purchased shares of RELX PLC to meet future obligations in respect of share based remuneration totalling £75m (2023: £50m). Proceeds from the exercise of share options were £47m (2023: £41m). Leverage – Net debt/EBITDA 3.3x 2.4x 2.1x 2.0x 1.8x 2020 2021 2022 2023 2024 Adjusted cash flow conversion 97% 101% 101% 98% 97% 2020 2021 2022 2023 2024 |
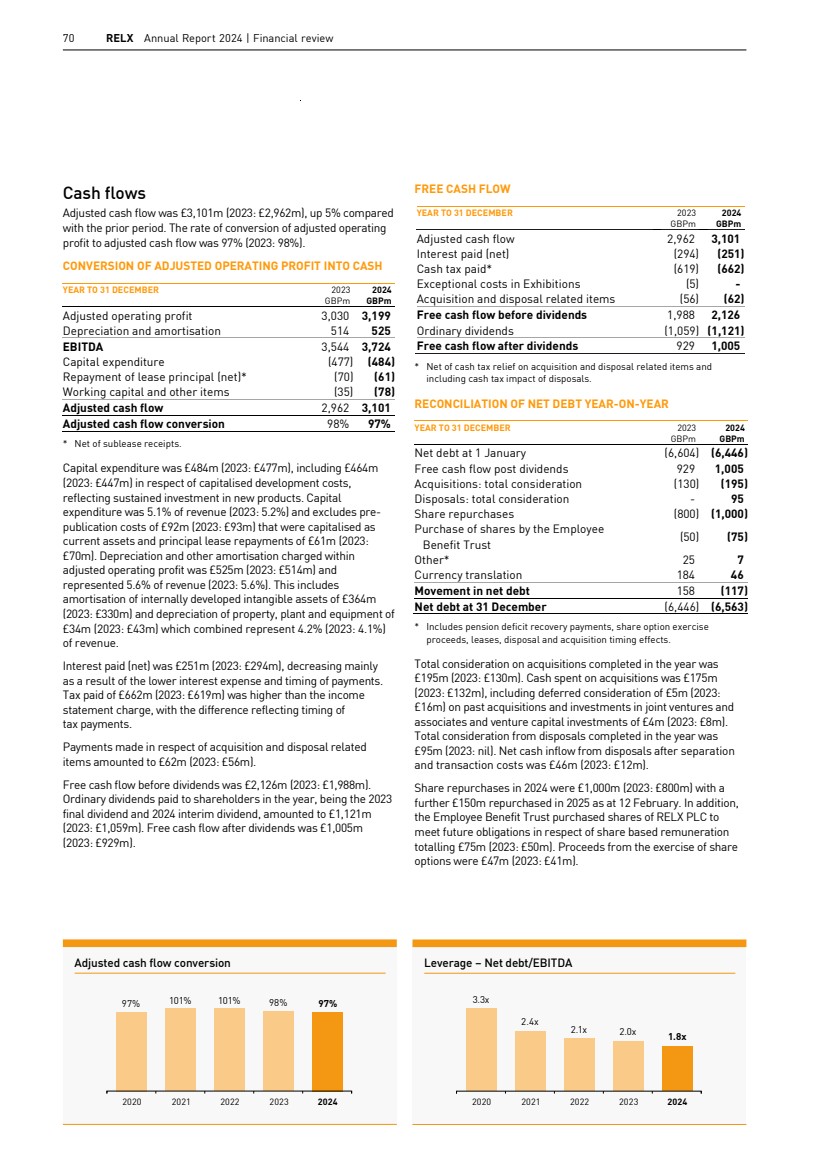
| RELX Annual Report 2024 | Chief Financial Officer’s report 71 RELX term debt maturities at 31 December 2024 776 517 950 828 750 776 1,017 880 7 819 2025 2027 2028 2029 2030 2031 2032 >2033 2026 2033 USDm Term debt translated at 31 December 2024 exchange rates, stated at par value Return on invested capital 10.8% 11.9% 12.5% 14.0% 14.8% 2020 2021 2022 2023 2024 RELX Annual Report 2024 | Chief Financial Officer’s report 95 Overview Market segments Corporate responsibility Financial review Governance Financial statements and shareholder information Funding Debt Net debt at 31 December 2024 was £6,563m, an increase of £117m since 31 December 2023. Excluding currency translation effects, net debt increased by £163m. Expressed in US dollars, net debt at 31 December 2024 was $8,204m, a decrease of $47m since 31 December 2023. Gross debt of £6,544m (2023: £6,497m) is comprised of bank and bond borrowings of £6,441m (2023: £6,356m) and lease liabilities of £103m (2023: £141m). The fair value of related derivative liabilities was £140m (2023: £108m), finance lease receivables totalled £2m (2023: £4m) and cash and cash equivalents totalled £119m (2023: £155m). In aggregate, these give the net debt figure of £6,563m (2023: £6,446m). The effective interest rate on gross bank and bond borrowings was 4.4% in 2024 (2023: 4.6%). As at 31 December 2024, gross bank and bond borrowings had a weighted average life remaining of 4.1 years and a total of 56% of them were at fixed rates, after taking into account interest rate derivatives. The ratio of net debt (including pensions) to EBITDA was 1.8x (2023: 2.0x), calculated in US dollars. At 31 December 2024, there was a net positive pension accounting balance (pension assets less pension obligations) of £21m, compared to a net negative position of £63m as at 31 December 2023 as liabilities have reduced due to an increase in discount rates. Liquidity In March 2024, €850m of euro denominated term debt was issued with a coupon of 3.375% and a maturity of nine years. The Group has ample liquidity and access to debt capital markets, providing the ability to repay or refinance debt as it matures and to fund ongoing requirements. This includes access to a $3bn committed bank facility which provides security of funding for short-term debt, and which remains undrawn. In March 2024 the maturity date of the facility was extended to April 2027. The facility has pricing linked to three Corporate Responsibility performance targets, all of which were achieved in 2024. Invested capital and returns Net capital employed increased by £182m to £10,571m at 31 December 2024 (2023: £10,389m), primarily due to changes in exchange rates, acquisitions completed during the year and an increase in the net pension assets. NET CAPITAL EMPLOYED AS AT 31 DECEMBER 2023 2024 GBPm GBPm Goodwill and acquired intangible assets* 9,784 9,811 Internally developed intangible assets* 1,477 1,569 Property, plant and equipment*, right-of-use assets* and investments 487 432 Net pension (obligations)/asset (63) 21 Working capital (1,296) (1,262) Net capital employed 10,389 10,571 * Net of accumulated depreciation and amortisation. The post-tax return on average invested capital in the year was 14.8% (2023: 14.0%). The increase was driven by growth in adjusted operating profit, and lower average invested capital when retranslated at the average exchange rates for the year. RETURN ON INVESTED CAPITAL AS AT 31 DECEMBER 2023 2024 GBPm GBPm Adjusted operating profit 3,030 3,199 Tax at adjusted effective rate (618) (720) Adjusted effective tax rate 20.4% 22.5% Adjusted operating profit after tax 2,412 2,479 Average invested capital* 17,184 16,743 Return on invested capital 14.0% 14.8% * Average of invested capital at the beginning and the end of the year, retranslated at average exchange rates for the year. Invested capital is calculated as net capital employed, adjusted to add back accumulated amortisation and impairment of acquired intangible assets and goodwill and to exclude the gross up to goodwill in respect of deferred tax. Market segments Governance and shareholder information Financial statements Financial review Corporate responsibility Overview |
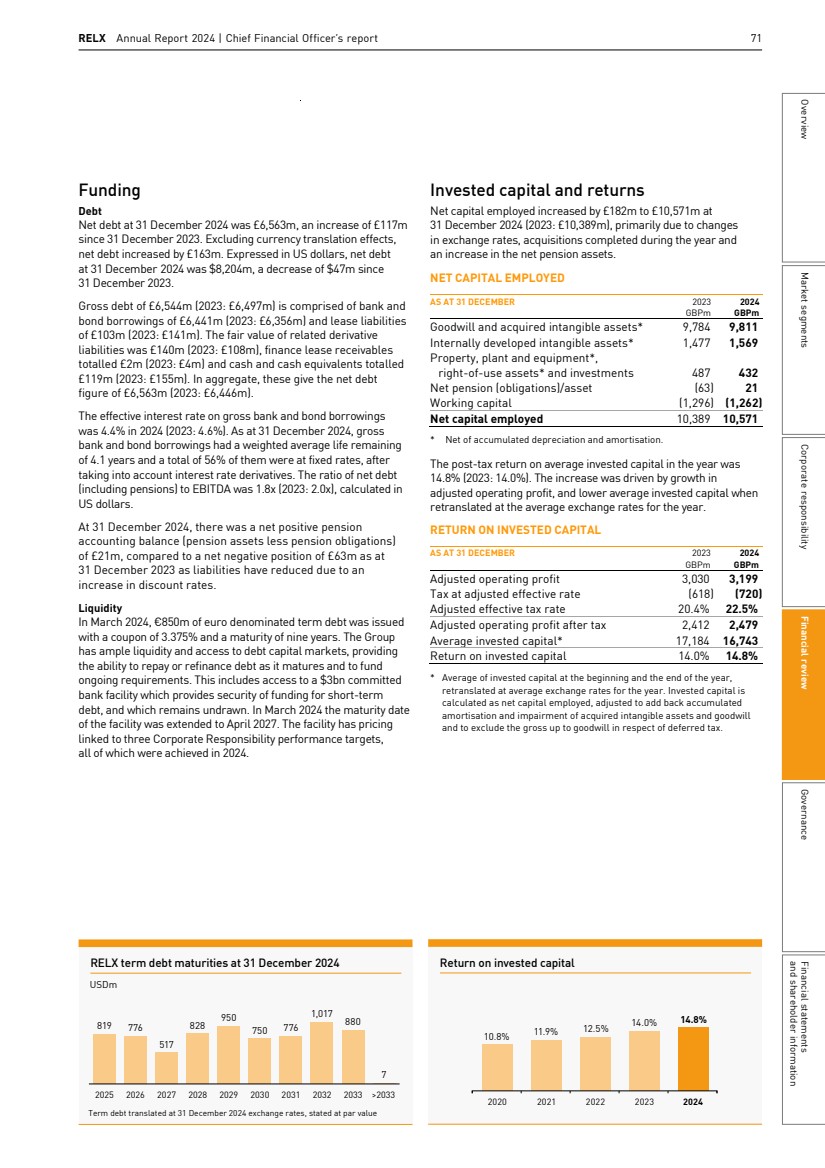
| 72 RELX Annual Report 2024 | Financial review 96 RELX Annual Report 2024 | Financial review Dividends and share repurchases 2023 2024 GBPm GBPm Change Adjusted earnings per share 114.0p 120.1p +5% Reported earnings per share 94.1p 103.6p +10% Ordinary dividend per share 58.8p 63.0p +7% The final dividend proposed by the Board is 44.8p per share. This gives total dividends for the year of 63.0p (2023: 58.8p), 7% higher than the prior year. The dividend policy of RELX PLC is, over the longer term, to grow dividends broadly in line with adjusted earnings per share, paying out approximately half of adjusted earnings in dividend each year. During 2024, a total of 28.9m RELX PLC shares were repurchased at an average price of 3,461p. Total consideration for these repurchases was £1,000m. A further 2.2m (2023: 2.0m) shares were purchased by the Employee Benefit Trust. As at 31 December 2024, total shares in issue, net of shares held in treasury and shares held by the Employee Benefit Trust, amounted to 1,855.9m. A further 3.8m shares have been repurchased in 2025 as at 12 February. Distributable reserves and parent company balance sheet As at 31 December 2024, RELX PLC had distributable reserves of £4.9bn (2023: £6.5bn). In line with UK legislation, distributable reserves are derived from the non-consolidated RELX PLC balance sheet. The consolidated reserves reflect items such as the amortisation of acquired intangible assets that are not taken into account when calculating distributable reserves. The parent company balance sheet net assets are higher than those of the Group due to the investment in RELX Group plc being carried at a value of £18.4bn which is not reflected on the consolidated balance sheet. The parent company balance sheet can be found on page 191. Further information on the distributable reserves can be found in the parent company financial statements on page 192. Alternative performance measures RELX uses a range of alternative performance measures (APMs) in the reporting of financial information, which are not defined by generally accepted accounting principles (GAAP) such as IFRS. These APMs are used by the Board and management as they believe they provide relevant information in assessing the Group’s performance, position and cash flows, enable investors to track more clearly the core operational performance of the Group, and provide a clear basis for assessing RELX’s ability to raise debt and invest in new business opportunities. Management also uses these financial measures, along with IFRS financial measures, in evaluating the operating performance of the Group as a whole and of the individual business areas. These measures should not be considered in isolation from, or as a substitute for, financial information presented in compliance with IFRS. The measures may not be directly comparable to similarly reported measures by other companies. Definitions of alternative performance measures can be found on pages 200 to 207. Accounting policies The consolidated financial statements are prepared in accordance with UK adopted International Accounting Standards in conformity with the requirements of the Companies Act 2006 and IFRS accounting standards as issued by the International Accounting Standards Board (IASB) following the accounting policies shown in the notes to the financial statements on pages 140 to 186. The accounting policies and estimates which require the most significant judgement relate to the capitalisation of development spend and accounting for defined benefit pension schemes. Further detail is provided in the accounting policies on pages 145 and 146 and in the relevant notes to the accounts. Tax Taxation is an important issue for us and our stakeholders, including our shareholders, governments, customers, suppliers, employees and the global communities in which we operate. We have set out our approach to tax in our global tax strategy. This incorporates our Tax Principles along with additional disclosures around where we pay taxes and our broader contribution to society. This is all made publicly available on our website: www.relx.com/go/taxprinciples. We maintain an open dialogue with tax authorities, and are vigilant in ensuring that we comply with current tax legislation. We have clear and consistent tax policies and tax matters are dealt with by a professional tax function, supported by external advisers. We proactively seek to agree arm’s-length pricing with tax authorities to mitigate tax risks of significant cross-border operations. We actively engage with policy makers, tax administrators, industry bodies and international institutions to provide informed input on proposed tax measures, so that we and they can understand how those proposals would affect our business. In addition, we participate in consultations with the Organisation for Economic Co-operation and Development (OECD), European bodies and the United Nations. |
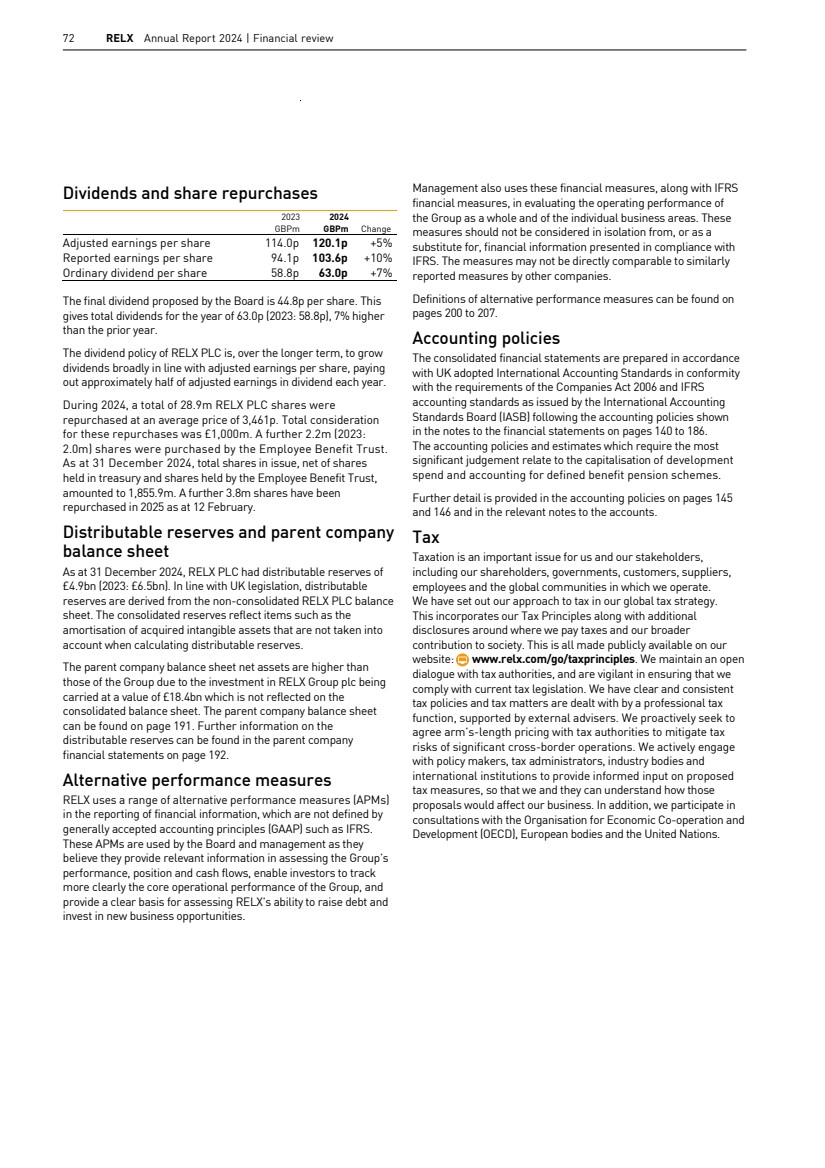
| RELX RELX Annual Report 2024 | Chief Financial Officer’s report 73 Annual Report 2024 | Chief Financial Officer’s report 97 Overview Market segments Corporate responsibility Financial review Governance Financial statements and shareholder information Treasury The Board of RELX PLC agrees policies for managing treasury risks. The key policies address security of funding requirements, the target fixed/floating interest rate exposure for debt and foreign currency hedging and place limits on counterparty exposures. A more extensive summary of these policies is provided in note 17 to the financial statements on pages 169 to 175. Financial instruments are used to finance the RELX businesses and to hedge transactions. The Group’s businesses do not enter into speculative transactions. Liquidity management The capital structure is managed to support RELX’s objective of maximising long-term shareholder value through appropriate security of funding, ready access to debt and capital markets, cost-effective borrowing and flexibility to fund business and acquisition opportunities while maintaining appropriate leverage to ensure an efficient capital structure. Over the long term, RELX seeks to maintain cash flow conversion of 90% or higher and credit rating agency metrics that are consistent with a solid investment grade credit rating. These metrics, as defined by the rating agencies, include net debt to EBITDA and various measures of cash flow as a percentage of net debt. Further detail on liquidity management is provided on pages 170 and 171. Capital management RELX uses the cash flow it generates to fund capital expenditure required to drive organic growth, to make selective acquisitions and to provide a growing dividend to shareholders, while retaining balance sheet strength to maintain access to cost-effective sources of borrowing. Share repurchases are undertaken to maintain an efficient balance sheet. Further detail on capital management is provided on pages 169 and 170. Corporate responsibility Our focus on corporate responsibility continues to underpin our activities. This included in 2024, gaining approval on our Scope 1, 2 and 3 science-based 2030 targets by the Science Based Targets initiative. We continue to hold Group-wide certification of our Environmental Management System. To track our environmental progress through the year, I led quarterly Environmental Checkpoint meetings with senior managers as well as our Net Zero Carbon Events working group to progress a net zero road map for our Exhibitions business. We progressed our working group to advance our Net Zero Carbon Events commitments and our Exhibitions business advanced its net zero roadmap. For World Environment Day, I sent a message to all RELX staff highlighting our environmental performance and priorities, building on the work of Green Teams at more than 50 locations across the Group focused on environmental management at the local level. Our most significant contribution to the environment-related UN Sustainable Development Goals (SDGs), including SDG 7, Clean And Affordable Energy and SDG 13, Climate Action, remains our products and services. We continue to deploy the EmeraldSky methodology developed by Risk’s global flight data business, Cirium, to calculate our Scope 3, business flight travel data. Elsevier’s The Lancet published their 2024 Countdown on health and climate change which monitors the health implications of climate change and assesses progress by governments on commitments under the Paris Agreement. Legal introduced England and Wales Environment Tracker 2024, which tracks and summarises new and upcoming legislation and consultations linked to climate action and emissions reduction in England and Wales. RX’s World Travel Market Africa introduced a Sustainability Village to bring together artisans and thought leaders on responsible tourism. We are committed to transparency. You can find more information and data in the Corporate Responsibility section on pages 34-65, in the Corporate Sustainability Reporting Directive Sustainability Statement on pages 208-231, and our Taskforce on Climate-Related Financial Disclosure (TCFD) on page 236. Nick Luff Chief Financial Officer Market segments Governance and shareholder information Financial statements Financial review Corporate responsibility Overview |
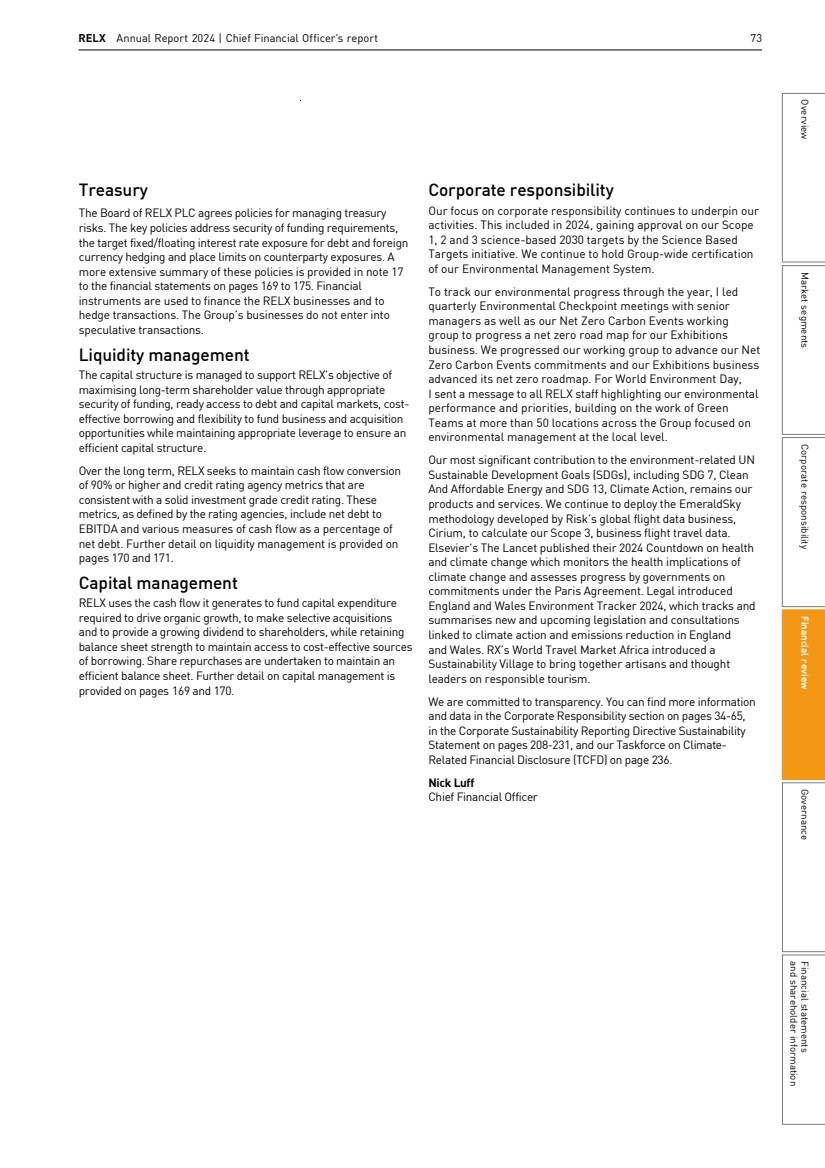
| 74 RELX Annual Report 2024 | Financial review Principal and emerging risks Risk Identification, evaluation, and management RELX has established a well-embedded risk management framework based on the Internal Control-Integrated Framework (2013) by the Committee of Sponsoring Organisations of the Treadway Commission (COSO). Through this framework risks are identified, assessed, mitigated, and monitored in an effective and consistent way across the businesses. RELX uses the 3 Lines of Defence model and aligns its systems of risk management and internal control with the COSO framework. Business Areas are required to maintain systems of risk management and internal control which are appropriate to the nature and scale oftheir activities and address all significant strategic, operational, financial,legal and regulatory compliance and reputational risks that they face. The RELX PLC Board monitors the system of internal control and risk management and performs an annual assessment of its effectiveness. Consideration of current and emerging risks Our risk management process considers the likelihood and impact of risks,the timeline over which a risk could arise,the direction in which risks are trending and the effectiveness of our mitigation efforts. In addition to consideration of current risks, we also identify emerging risks which could impact our business in the next 3-5 years. The development ofArtificialIntelligence (AI), and generativeAI in particular, creates opportunities for us to add more value for our customers, with an associated emerging risk from not capturing those opportunities in a timely manner. In addition, as we develop products for our customers utilisingAI, including with increased customisation, we need to ensure we do so with controls to mitigate emerging risks related to Intellectual property rights and Data privacy. RISK MITIGATION External Risks Data Privacy In the course of our business, we process personal data from customers, end users, employees and other sources.Certain business areas rely extensively upon content that includes personal data from public records, governmental authorities, publicly available information and media, and other information companies, including competitors.Changes in data privacy legislation, regulation, and/or enforcement could impact our ability to collect and use personal data, potentially affecting the availability and effectiveness of our products. Failure or perceived failure, by us, our customers or suppliers,to comply with requirements for proper collection, use, sharing, storage, transfer and other processing of personal data may damage our reputation, diverttime and effort of management and other resources, increase cost of operations, and expose us to risk of loss, fines and penalties,litigation, and increased regulation. We are guided by the RELX Privacy Principles and have implemented governance structures, contractual restrictions, technical measures, and other controls to protect personal data and meet data privacy requirements across all jurisdictions where we operate. We have assurance programmes to monitor compliance and conduct training and awareness programmes for our employees. Our commitmentto fair, explainable, and accountableAI practices as set outin ourResponsibleArtificialIntelligence Principles, helps to ensure that ourAI uses of personal data are subject to robust privacy governance. Intellectual property rights Our products and services include and utilise intellectual property. We rely on trademark, copyright, patent,trade secret and other intellectual property laws to establish and protect our proprietary rights in this intellectual property. There is a risk that our proprietary rights could be challenged,limited, invalidated, infringed, or circumvented, including byAItechnologies, which may impact demand for and pricing of our products and services. Copyrightlaws are subjectto nationallegislative initiatives, as well as cross-border initiatives such as those from the European Commission and increased judicial scrutiny in several jurisdictions in which we operate. This creates additional challenges for us in protecting our proprietary rights in content delivered through the internet and electronic platforms. We actively engage in developing and promoting the legal protection of intellectual property rights. Our contracts with customers contain provisions regarding the use of proprietary content including use by large language models. We are vigilant as to the use of our intellectual property and, as appropriate, take action to challenge illegal content distribution sources. |
| RELX Annual Report 2024 | Principal and emerging risks 75 RISK MITIGATION Geopolitical, economic and market conditions Demand for our products and services, and our ability to operate internationally,may be adversely impacted by geopolitical, economic and market conditions beyond our control. These include acts of war and civil unrest; political conflicts and tensions; international sanctions; economic cycles; the impact of the effect of changes in inflation and interest rates in major economies;trading relations between theUnitedStates,Europe, China and other major economies; as well as levels of government and private funding for our markets. Our businesses are focused on professional markets which have generally been more resilient in periods of economic downturn. We deliver information solutions, many on a subscription and recurring revenue basis, which are importantto our customers’ effectiveness and efficiency. We operate diversified businesses in terms of sectors,markets, customers, geographies and products and services. We have multi-year contracts in place for much of the revenue base, and underlying demand drivers in many areas are not directly exposed to economic growth (e.g., scientific research, healthcare,fraud risk, financial crime compliance). Over the past 15 years,RELX has significantly reduced its dependence on revenue streams that historically have been impacted by economic downturns (e.g., advertising, employment screening). We have extended our position in long-term global growth markets through organic new launches supported by the selective acquisitions. We continuously monitor economic and political developments to assess their impact on our strategy which is designed to mitigate these risks. In response to specific uncertainties, our businesses engage in scenario planning and develop contingency plans where relevant and consider exiting businesses and markets that no longer fit our strategy. Evolution of primary research publishing OurScientific,Technical&Medical(STM)primary research contentpublishing business operates under two payment models: ‘pay-to-read’,wherereadersor their institutions,asusersofthe contentpay,andauthorspublishfor free,or ‘pay-to-publish’, whereauthors or their institutions or funding bodies prefer to pay to publishtheir research, soitis freelyavailabletoread.Thelatter model is commonly referred to as Open Access and now represents asignificantandgrowingportionofthevolumeofprimary research thatwepublish.Rapidchanges incustomer choice, regulation,or technologies in this area could impact the revenue mix and growth in our primary research publishing business. Maintainingresearchintegrity requiresus tomanagerisksaround fraud in research papers in the context of evolving technologies. We engage extensively with stakeholders in the STM community to better understand their needs and deliver value to them. We provide both pay-to-read and pay-to-publish models for our services as well as combinations of the two to support our customers diverse needs and preferences. Both payment models are available on a subscription or transactional basis. We focus on the integrity and quality of research through the editorial and peer review process; we invest in technology to drive innovation in editorial and distribution platforms to make content and data more accessible, trustworthy and actionable; and we develop our systems to provide capabilities to manage different payment models. To meet changing customer needs, we continue to launch new journals across payment models and scientific disciplines. Market segments Governance and shareholder information Financial statements Financial review Corporate responsibility Overview |
| 76 RELX Annual Report 2024 | Financial review RISK MITIGATION Strategic Execution Risks Customer acceptance ofour products Our businesses are dependent on the continued demand by our customers for our products and services and the value placed on them. We operate in highly competitive and dynamic markets, and the means of delivery, customer demand for, and the products and services themselves, continue to change in response to technologicalinnovations, such as the use of artificialintelligence, legislative and regulatory changes,the entrance of new competitors, and other factors. Failure to anticipate and quickly adaptto these changes, or to deliver enhanced value to our customers, could impact demand for our products and services and consequently adversely affect our revenue or the long-term returns from our investment in higher value-add information-based analytics and decision tools. We are focused on the needs and economics of our customers. We gain insights into the markets that we serve, evolving customers’ needs,the potential application of new technologies and businessmodels, and the actions of competitors and disrupters. These insights inform our strategic and operational priorities. We continuously invest significant resources in our products and services, and the infrastructure to supportthem, and we have a long track record of using artificialintelligence. We leverage user centered design and development methods and customer analytics and invest in new and enhanced technologies to provide content and innovative solutions that help them achieve better outcomes and enhance productivity. Acquisitions We supplement our organic development with selected acquisitions. If we are unable to generate the anticipated benefits such as revenue growth and/or cost savings associated with these acquisitions, it could adversely affect return on invested capital and financial condition or lead to an impairment of goodwill or intangibles. Acquisitions are made within the framework of our overall strategy, which emphasises organic development. We have a wellformulated process for reviewing and executing acquisitions and for managing the post-acquisition integration. This process is underpinned with clear strategic, financial and ethical criteria. We closely monitor the integration and performance of acquisitions. Operational Risks Cybersecurity Our businesses maintain and use online databases and platforms delivering our products and services, which we rely on, and provide data to third parties, including customers and service providers. These databases and information are a target for compromise and face a risk of unauthorised access and use by unauthorised parties including through cyber, ransomware, malware, and phishing and other social engineering attacks on us or our third-party service providers. Our cybersecuritymeasures, and the measures used by our third-party service providers, may not detect or prevent all attempts to compromise our systems, which may jeopardise the security or integrity of the data we maintain or may disrupt our systems. Failures of our cybersecurity measures could result in unauthorised access to our systems,misappropriation of our or our users’ data, deletion or modification of stored information or other interruption to our business operations. As techniques used to obtain unauthorised access to or to sabotage systems change frequently and may not be known until launched against us or our third-party service providers we may be unable to anticipate or implement adequate measures to protect against these attacks and our service providers and customers may likewise be unable to do so. Compromises of our or our third-party service providers’ systems could adversely affect our financial performance, damage our reputation and expose us to risk ofloss, fines and penalties, litigation and increased regulation. We have established security programmes which are constantly reviewed and updated to address developments in the threat landscape with the aim of ensuring our ability to prevent, respond to and recover from a cyber-attack or ransomware attack,that data is protected, and our business infrastructures continue to operate. We have governance mechanisms in place to design and monitor common policies and standards across our businesses. We invest in appropriate technological and physical controls which are applied across the enterprise in a risk-based security programme which operates atthe infrastructure, application and user levels. These controls include, but are notlimited to, infrastructure vulnerabilitymanagement, application scanning and penetration testing, network segmentation, encryption and logging and monitoring. We provide regular training and communication initiatives to establish and maintain awareness of risks at all levels of our businesses. We have appropriate incident response plans to respond to threats and attacks which include procedures to recover and restore data and applications in the event of an attack. We maintain appropriate information security policies and contractual requirements for our businesses and run programmes monitoring the application of our data security and resilience policies by third party service providers. We use independent internal and third-party auditors to test, evaluate, and help enhance our procedures and controls. We continuously monitor the global regulatory landscape to identify emerging cybersecurity, data protection and privacy laws, and, as needed, implement plans to comply with them. We procure appropriate cybersecurity insurance to mitigate potential losses arising from a cybersecurity incident. |
| RELX Annual Report 2024 | Principal and emerging risks 77 RISK MITIGATION Face-to-face events Face-to-face events are susceptible to economic cycles, changes in trading relations, communicable diseases, severe weather events and other natural disasters,terrorismand availability of venues. Each or any of these may impact our ability to hold face-to-face events, and exhibitors’ and visitors’ desire and ability to travel in person to events. These factors each have the potential to reduce revenues, increase the costs of organising events and adversely affect cashflows and reputation. We operate a large number of events across a wide variety of venues in many countries, serving both domestic and international exhibitors and attendees. We actively review our ability to host events considering the availability of venues and national and local regulations including those related to health, travel, and security. We operateflexibly, rescheduling or re-locating events when necessary. We take appropriate measures at our events to ensure for the well-being and safety of exhibitors, visitors and employees.Our face-to-face events are supported by enhanced digital services. Supply chain dependencies Our organisational and operational structures depend on suppliers including outsourced and offshored functions, as well as cloud service, software, and large language model providers. Poor performance,failure or breach ofthird parties to whom we have contracted could adversely affect our business performance, reputation and financial condition. We source content to enable information solutions for our professional customers. The disruption or loss of data sources, either because of regulations, or because data suppliers decide notto supply them, may impose limits on our collection and use of certain kinds ofinformation and our ability to communicate, offer or make such information available or useful to our customers. We select our suppliers with care and establish contractual service levels that we closely monitor, including through key performance indicators and targeted supplier audits. We have developed business continuity plans to reduce disruption in the event of a major failure by a supplier. We have a formal supplier resilience program to identify and manage critical suppliers across the business. A risk register is used to document any unique, critical supplier risks and associated mitigation plans, with due diligence performed and resilience discussions held on a regular basis, and our contractualterms enable us to audit supplier resilience plans/procedures. We have a multitude of data sources that we use to develop solutions for our customers and regularly monitor the market for new data sources in order to minimize dependence on any single provider. Where contentis supplied to us by third parties, we aim to have contracts which providemutual commercial benefit. Technology and business resilience Our businesses are dependent on electronic platforms and networks, including our own and third-party data centres, cloud providers, network systems and the internet,for delivery of our products and services. These could be adversely affected if our electronic delivery platforms, networks or supporting infrastructure experience a significantfailure or interruption. We have established procedures for the protection of our businesses and technology assets. These include the development and testing of business continuity plans, including technical resilience plans and back-up delivery systems,to reduce business disruption in the event of major technology or infrastructure failure,terrorism, or adverse weather incidents. Talent The implementation and execution of our strategies and business plans depend on our ability to recruit, motivate, develop, and retain a diverse population of skilled employees and management. We compete globally and across business sectors for diverse, talented management and skilled individuals, particularly those with technology and data analytics capabilities. An inability to recruit, motivate or retain such people could adversely affect our business performance. We monitor capability needs and remuneration schemes are tailored to attract and motivate the best talent available at an appropriate level of cost. We actively seek feedback from employees, which feeds into plans to enhance employee engagement, motivation, and development.Our focus on an inclusive culture results in a diverse workforce and environment that respects individuals and their contributions. Market segments Governance and shareholder information Financial statements Financial review Corporate responsibility Overview |
| 78 RELX Annual Report 2024 | Financial review RISK MITIGATION Financial Risks Tax Our businesses operate globally, and our profits are subjectto taxation in many different jurisdictions and at differing tax rates. Tax laws and tax rates that currently apply to our businesses may be amended by the relevant authorities or interpreted differently by them, and these changes could adversely affect our reported results. We maintain an open dialogue with tax authorities and are vigilant in ensuring that we comply with current tax legislation. We have clear and consistent tax policies and tax matters are dealt with by a professionaltax function, supported by external advisers. As outlined in theChief FinancialOfficer’s report on pages 68 to 73 we engage with tax authorities and international organisations. We continue to monitor legislative developments in the jurisdictions in which we operate and consider the potential impacts of proposed regulation changes under various scenarios. The principles we adopt in our approach to tax matters can be found on our website at www.relx.com/go/taxprinciples. Treasury TheRELXPLCconsolidated financial statements are expressed in pounds sterling and are subject to movements in exchange rates on the translation ofthe financialinformation of businesses whose operational currencies are other than sterling. The United States is our mostimportant market and, accordingly, significant fluctuations in theUSdollar exchange rate could significantly affect our reported results. We also earn revenues and incur costs in a range of other currencies, including theEuro and the Yen, and significantfluctuations in these exchange rates could also significantly impact our reported results. Macroeconomic, political and market conditions may adversely affectthe availability and terms of short- and long-term funding, volatility ofinterest rates,the credit quality of our counterparties, currency exchange rates and inflation. Themajority of our outstanding debtinstruments are, and any of our future debt instruments may be, publicly rated by independent rating agencies. Our borrowing costs and access to capital may be adversely affected if the credit ratings assigned to our debt are downgraded. Our approach to capital structure and funding is described in the Chief FinancialOfficer’s report on pages 68 to 73. The approach to the management of treasury risks is described in note 17 to the consolidated financial statements. Pensions We operate a number of pension schemes around the world, including local versions ofthe defined benefittype in theUnited Kingdom and the United States. The US scheme is closed to future accruals. The UK scheme has been closed to new hires since 2010. The members who continue to accrue benefits now represent a small and reducing portion of the overall UK based workforce. The assets and obligations associated with these pension schemes are sensitive to changes in the market values of the scheme’s investments and the market-related assumptions used to value scheme liabilities.Adverse changes to asset values, discount rates,longevity assumptions or inflation could increase funding requirements. We have professionalmanagement of our pension schemes, and we focus on maintaining appropriate asset allocation and plan designs. We review our funding requirements on a regular basis with the assistance of independent actuaries and ensure that the funding plans are appropriate. We seek to manage pension liabilities by reviewing pension benefits provided to staff as well as the structure of scheme arrangements. Reputational Risks Ethics As a global provider of professionalinformation solutions we, our employees, major suppliers and partners are expected to adhere to high standards ofintegrity and ethical conduct, including those related to anti-bribery and anti-corruption, data protection,fraud, sanctions, competition and principled business conduct. A breach of generally accepted ethical business standards or applicable laws could adversely affect our business performance, reputation, and financial condition. Our Code of Ethics and Business Conduct is provided to every employee and is supported by training and communication. It encompasses such topics as competing fairly,fair employment practices, prohibiting corrupt business practices and encouraging open and principled behaviour. We have well-established processes for monitoring, reporting and investigating instances of unethical conduct. Our major suppliers are required to adhere to our Supplier Code of Conduct. |
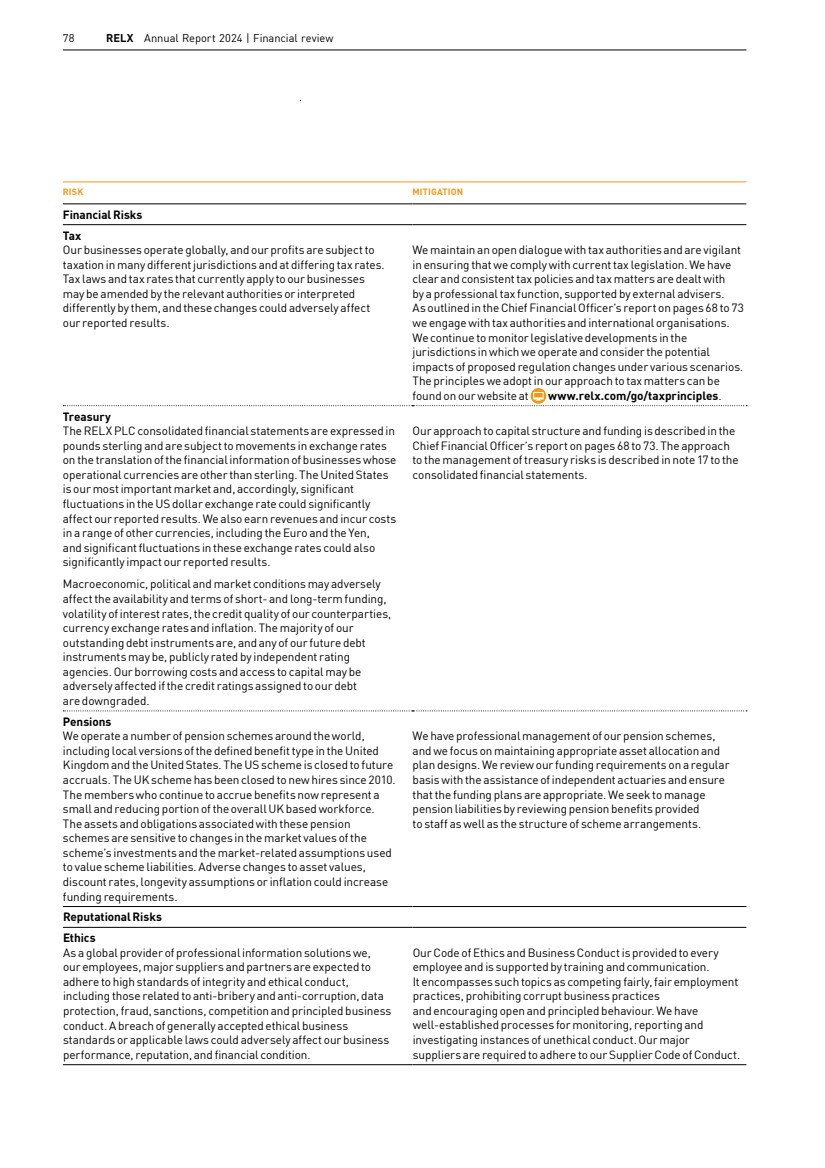
| RELX Annual Report 2024 | Principal and emerging risks 79 Viability statement The UK Corporate Governance Code requires Directors to assess the viability of the Group over an appropriate period of time. The Directors have made the assessment that given the nature oftheGroup’s business with a high proportion of recurring revenue, a typical contractlength ofthree years in many of its subscription agreements and a balanced debt maturity profile, a viability period ofthree years, aligned with theGroup’s annual strategy plan, is suitable to assess the risks outlined on pages 74 to 78. Assessing the Group’s Prospects The Group develops information-based analytics and decision tools for professional and business customers in theRisk, Scientific, Technical & Medical(STM), Legal andExhibitions sectors. The MarketSegments section describes each area’s businessmodel, strategic priorities,market opportunities and competition, showing how theGroup is positioned to create value for shareholders over the longer term. TheGroup’s prospects are assessed annually through the strategic planning process which includes a review of assumptions made and an assessment of each business area’s longer-term plan. The resulting three-year strategy plan forms the basis for Group and divisional targets and in-year budgets. Objectives are set with consideration given to the economic and regulatory environment, and to customer trends, as well as incorporating risks and opportunities. The most recent three-year strategy business plan was agreed by the Directors in September 2024 and updated in February 2025. Separate from the annual strategy plan,theDirectors periodically receive updates from business area management on their operations, prospects and risks. Whilst these reviews and discussions naturally focus more closely on the more immediate risks facing the business within the three-year strategy planning period, they also cover the risks described in the principal risks section on pages 74 to 78. Assessing the Group’s Viability The three-year strategy plan for our business areas includes management’s assessment ofthe anticipated operational risks affecting the business. Managementthen considered the viability ofthe business in various downside scenarios,the most severe of which assumes the simultaneous occurrence of Cybersecurity, Intellectual property rights and Face-to-face events risks resulting in a decline of around 30% in adjusted operating profitin each of 2025 to 2027, and the closure ofthe debt capital markets preventing the refinancing of scheduled liabilities. Itis assumed thattheGroup’s undrawn $3bn revolving creditfacility will be refinanced prior to its maturity inApril 2027. The resulting analysis, which assumed no share buybacks, modest acquisition activity and a growing dividend, determined thattheGroup would have sufficient liquidity to refinance all maturing term debt. We remain focused on successfully pursuing our strategic priority of organically developing increasingly sophisticated information-based analytics and decision tools that deliver enhanced value to our customers, supplemented by selective acquisitions that support our organic growth. We believe the combination of compelling structural opportunities combined with an appropriate capital structure will continue to drive long-term value. Based on this assessment and the scenario modelling that shows sufficientliquidity even with the simultaneous occurrence of principal risks and the closure of the debt capital markets,theDirectors confirmthatthey have a reasonable expectation that the Group will be able to continue its operations and meet its liabilities as they fall due over the next three years and are not aware of any longer-term operational or strategic risks that would result in a different outcome from the three-year review. Going concern The Directors have adopted the going concern basis in preparing these accounts after assessing the potential impact on the business of the principal risks over the 18 months to 30 June 2026 and during the longer period over which the Group’s viability has been assessed, as described above. Managementforecasts reflect a downside scenario which includes the simultaneous occurrence of principal risks, which combined would reduce adjusted operating profit by around 30%. We have also assumed an inability to access the debt capital markets.Under this scenario,theGroup will still have substantial liquidity headroom on its undrawn $3bn revolving creditfacility (which does not contain a financial covenant).Having considered this downside scenario,the Directors believe that the Group is well-positioned to manage its business risks and that adequate resources exist for the Group to continue in operational existence for the foreseeable future. They therefore consider it is appropriate to adopt the going concern basis in preparing the 2024 financial statements. Acommentary on theGroup’s cashflows, financial position and liquidity for the year ended 31 December 2024 is set out in the Chief FinancialOfficer’s report on pages 68 to 73. This shows that after taking account of available cash resources and committed bank facilities that back up short-termborrowings, all oftheGroup’s borrowings that mature in the period to 30 June 2026 can be repaid in full. TheGroup’s policies on liquidity, capital management and management of risks relating to interest rate, foreign exchange and credit exposures are set out on pages 169 to 175. The principal risks facing the Group are set out on pages 74 to 78. Market segments Governance and shareholder information Financial statements Financial review Corporate responsibility Overview |
| 80 RELX Annual Report 2024 | Financial review TheStrategicReport, as set out on pages 2 to 80 has been approved by theBoard ofRELXPLC. By order oftheBoard RegisteredOffice Henry Udow 1-3 Strand Company Secretary London 12 February 2025 WC2N 5JR Non-financial and sustainability information statement RELX is required to comply with the reporting requirements of Sections 414CAand 414CBoftheCompaniesAct 2006, which relate to non-financial and sustainability information. The list below outlines where this information can be found: Reporting requirement: Environmental matters 60-65, 236-241 Employees 50-52 Social matters 38-41 Human rights 38-41, 50-52, 57-59 Anti-corruption and anti-bribery matters 42-45, 57-59 Policies, due diligence processes and outcomes 42-45, 57-59 Description and management of principal and emerging risks and impact of business activity 74-79 Description of business model 4-7 Non-financial metrics 36 Climate-related financialinformation 236-241 Sustainability statement 209-232 Taskforce on Climate-related Financial Disclosure 236-241 Basis of preparation of the Sustainability statement The Sustainability Statement is prepared pursuant to the European Union Corporate Responsibility Directive (CSRD) and in accordance with the requirements of the European Sustainability Reporting Standards and EU Taxonomy disclosure requirements adopted by the European Commission. Directors’ duties and Section 172 Statement The Directors of RELX PLC – and those of all UK companies – mustact in accordance with their duties under the CompaniesAct 2006 (the Act). These include a fundamental duty to promote the successoftheCompany for thebenefitofitsmembersasawhole. TheBoardofRELXPLC,andits individualDirectors, consider that they have done so for the year ending 31December 2024. Details of how theBoard and itsDirectors have fulfilled these duties can be found throughoutthis 2024Report, and therefore the following sections have been incorporated by reference into thisSection 172 Statement and, where necessary,theRELX 2024 Strategic Report: Business model and strategy 4-7 Corporate responsibility report 35-65 Principal risks 74-79 Culture and workforce policies 87-98 Board decision-making 87-98 Stakeholder engagement 87-98 Section 172 of the Act requires the Directors to have regard to, among othermatters,the interests ofthe company’s stakeholders in working to promote the success of the company. The Board recognises the importance of building and maintaining sound relationships withRELX’s key stakeholders in order to achieve its business aims.Among theGroup’s many and varied stakeholders,theBoard has identified investors, employees, customers, suppliers and the communities in which we operate, as the company’s key stakeholders.Given its size, diversity and global business, stakeholder engagementtakes place at alllevels across the Group. To ensure adequate visibility of key stakeholder views,theBoard received a detailed overview in the year covering engagement channels and activities the Company has with each of its key stakeholders. |
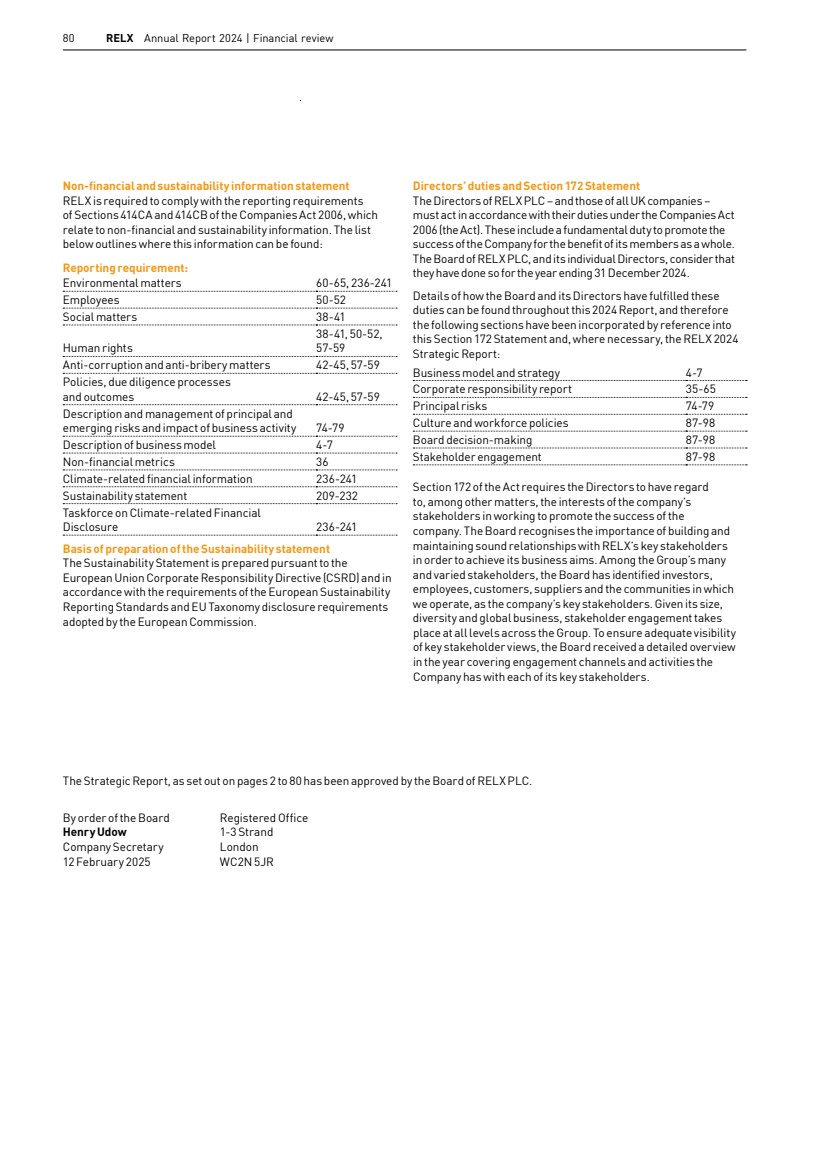
| 81 In this section 82 Board directors 84 RELX senior executives 86 Chair’s introduction to corporate governance 87 Corporate governance review 99 Report of the Nominations Committee 102 Directors’ remuneration report 123 Report of the Audit Committee 127 Directors’ report Governance Market segments Governance and shareholder information Financial statements Financial review Corporate responsibility Overview RELX Annual Report 2024 |
| 82 RELX Annual Report 2024 | Governance Board Directors Executive directors Erik Engstrom (61) Chief Executive Officer Appointed: Chief Executive Officer of RELX since November 2009. Joined as Chief Executive Officer of Elsevier in 2004. Other appointments: None Past appointments: Prior to joining was a partner at General Atlantic Partners. Before that was President and Chief Operating Officer of Random House Inc and President and Chief Executive Officer of Bantam Doubleday Dell, North America. Began his career as a consultant with McKinsey. Formerly a Non-Executive Director of Smith &Nephew plc. Education: Holds a BSc from Stockholm School ofEconomics, an MSc from the Royal Institute of Technology in Stockholm, and gained an MBA from Harvard Business School as a Fulbright Scholar. Nationality: Swedish Nick Luff (57) Chief Financial Officer Appointed: September 2014 Other appointments: Non-Executive Director and Audit Committee Chair of Rolls-Royce Holdings plc Past appointments: Prior to joining the Group was Group Finance Director of Centrica plc from 2007. Before that was Chief Financial Officer at The Peninsular & Oriental Steam Navigation Company (P&O) and its affiliated companies. Began his career as an accountant with KPMG. Formerly aNon-Executive Director of QinetiQ Group plc andLloyds Banking Group plc. Education: Has a degree in Mathematics from University of Oxford and is a qualified UK CharteredAccountant. Nationality: British Non-Executive directors Paul Walker (67) R N C Chair Appointed: March 2021 Other appointments: Chair of Ashtead Group plc Past appointments: Chair of Halma plc and Chief Executive Officer and Chief Financial Officer ofSage Group plc. Non-Executive Director of Experian plc, Diageo plc, Sophos Group plc and Mytravel Group plc. Education: Has a degree in Economics from YorkUniversity, and is a qualified UK CharteredAccountant. Nationality: British Alistair Cox (63) A R C Non-Executive Director; Independent Appointed: April 2023 Other appointments: None Past appointments: Served as Chief Executive of Hays plc from September 2007 to August 2023 and as Chief Executive of Xansa plc from 2002 to 2007. Was previously the Group Strategy Director and Regional Director for Asia Pacific at Blue Circle Industries plc, prior to which worked as a consultant for McKinsey and held various engineering, management and research science roles at Schlumberger Wireline Services and BAE Systems plc. Formerly a Non-Executive Director of Just Eat plc and 3i Group plc. Nationality: British Suzanne Wood (64) A N C Non-Executive Director; Independent, Senior Independent Director Appointed: September 2017 Other appointments: Non-Executive Director ofFerguson plc and H&E Equipment Services, Inc Past appointments: Served as Senior Vice President and Chief Financial Officer of Vulcan Materials Company from September 2018 until September 2022. Served as Group Finance Director of Ashtead Group plc from 2012 to 2018. Chief Financial Officer of Ashtead Group’s largest subsidiary, Sunbelt Rentals Inc, from 2003 until 2012. Previously, also served as Chief Financial Officer of two US publicly listed companies, Oakwood Homes Corporation and TultexCorporation. Nationality: American June Felix (68) A R C Non-Executive Director; Independent Appointed: October 2020 Other appointments: Non-Executive Director ofIron Mountain Incorporated and Hiscox Ltd. Member of the Advisory Board of the London Technology Club Past appointments: Served as a Non-Executive Director of IG Group Holdings plc from 2015 until the time of her appointment as Chief Executive Officer, a position she held from October 2018 toSeptember 2023. Previously held various executive management positions at a number oflarge multinational businesses in Hong Kong, London and New York, including Verifone, IBM, Citibank and Chase Manhattan. Earlier in her career, was a strategy consultant with Booz AllenHamilton. Nationality: American |

| RELX Annual Report 2024 | Board Directors 83 Charlotte Hogg (54) A C Non-Executive Director; Independent Appointed: December2019 Other appointments: Executive Vice President and Chief Executive Officer for the European Region of Visa Inc. Executive Director of Visa Europe Limited Past appointments: Chief Operating Officer at theBank of England. Before that Head of Retail Banking for Santander UK, Managing Director UK and Ireland for Experian plc, and held senior roles at Morgan Stanley in New York and London. Nationality: British, American and Irish Bianca Tetteroo (55) C Non-Executive Director; Independent, Workforce Engagement Director Appointed: July 2024 Other appointments: Chief Executive Officer andChair of the Executive Board of Achmea BV Past appointments: Served with Achmea BV for 12 years in a variety of senior executive and financial roles prior to taking up the role of Chief Executive Officer in 2021. Previously spent 13 years with the Fortis Group, working across multiple business lines including banking, insurance and investments. Qualified as a Chartered Accountant at Fortis, prior to which she worked at international accountancy firm, Mazars. Nationality: Dutch Robert MacLeod (60) R N C Non-Executive Director; Independent Appointed: April 2016 Other appointments: Non-Executive Director of Vesuvius plc and Balfour Beatty plc Past appointments: Was previously Chief Executive of Johnson Matthey plc for eight years after five years as Group Finance Director. Prior to this spent five years as Group Finance Director of WS Atkins plc, having joined as Group Financial Controller in 2003. From 1993 to 2002, held a variety of senior finance and M&A roles with Enterprise Oil plc in the UK and US. Formerly aNon-Executive Director of Aggreko plc. Nationality: British Andrew Sukawaty (69) A C Non-Executive Director; Independent Appointed: April 2019 Other appointments: Director of Hg Capital LLP, Viasat and Cobuilder. Founding Partner ofCorten Capital Past appointments: Was formerly the Chair ofInmarsat between 2003 and 2023 until its acquisition by Viasat in May 2023 and was Senior Independent Director of Sky plc between 2013 and 2018. Previously was Chair of Ziggo NV, XyratexGroup Ltd and Telenet Group holdings NV, and deputy Chair of O2 plc. Also served as aNon-Executive Director of Telefonica Europe (following its acquisition of O2 plc) and Powerwave Technologies Inc, and additionally as Chief Executive of Inmarsat plc, Sprint Inc. and NTLGroup Ltd. Nationality: American Board Committee membership key A Audit Committee N Nominations Committee C Corporate Governance Committee R Remuneration Committee Committee Chair Market segments Governance and shareholder information Financial statements Financial review Corporate responsibility Overview |
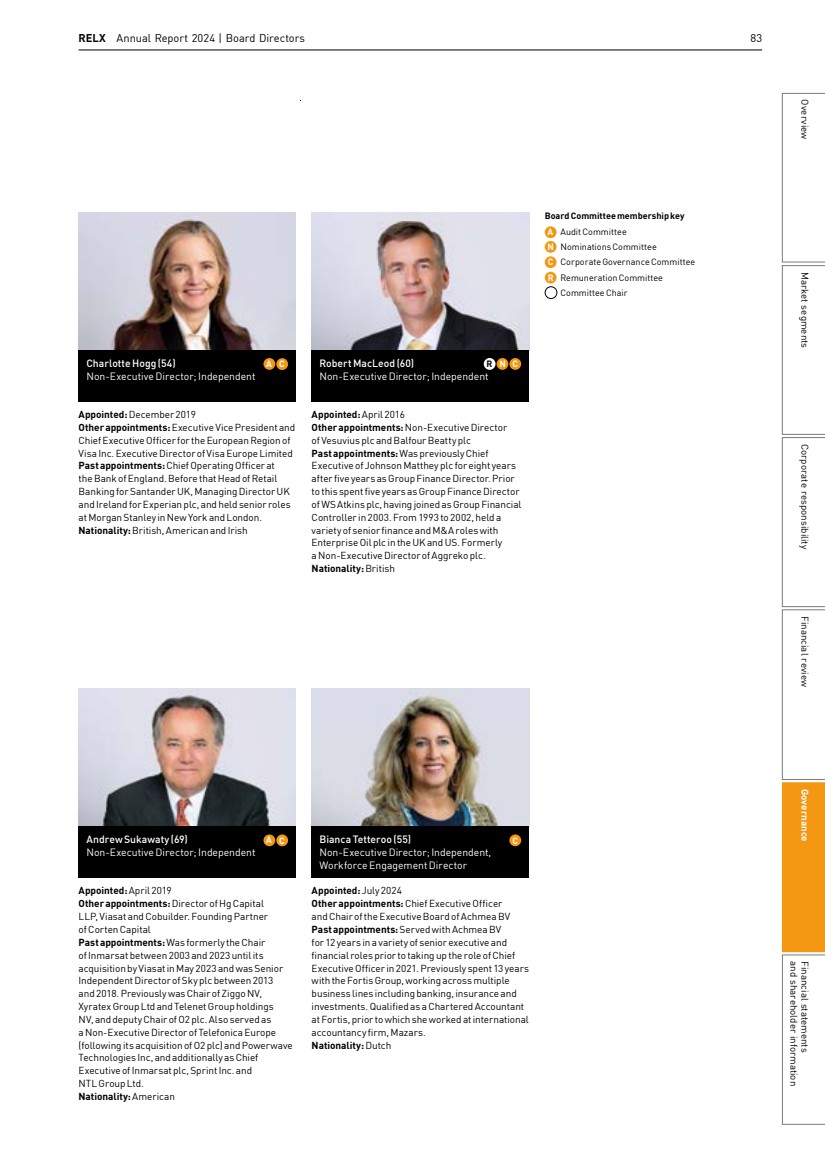
| 84 RELX Annual Report 2024 | Governance RELX Senior Executives W Mark Kelsey Chief Executive Officer Risk Kumsal Bayazit Chief Executive Officer Scientific, Technical & Medical Mike Walsh Chief Executive Officer Legal Hugh M Jones IV Chief Executive Officer Exhibitions Joined in 1983. Appointed to current position in 2012. Joined in 2004. Appointed to current position in 2019. Joined in 2003. Appointed to current position in 2011. Joined in 2011. Appointed to current position in 2020. Has held a number of senior positions across the Group over the past 40 years. Previously Chief Operating Officer and then Chief Executive Officer of Reed Business Information. Studied at Liverpool University and received his MBA from Bradford University. Previously President, Exhibitions Europe, Chief Strategy Officer, RELX, Chair, RELX Technology Forum and Executive Vice President of Global Strategy and Business Development for LexisNexis. Prior to that worked with Bain & Company in New York, Los Angeles, Johannesburg and Sydney. Holds an MBA from Harvard Business School and is a graduate of the University of California at Berkeley. Previously CEO of LexisNexis US Legal Markets and Director of Strategic Business Development Home Depot. Prior to that was a practising attorney at Weil, Gotshal and Manges in Washington DC and served as a consultant with The Boston Consulting Group. Holds a Juris Doctor degree from Harvard Law School and is a graduate of Yale University. Previously Group Managing Director, Accuity, ICIS, Cirium, and EG within Risk. Prior to that was Chief Executive Officer, Accuity. Holds an MBA from the Ross School of Business at the University of Michigan and is a graduate of Yale University. |
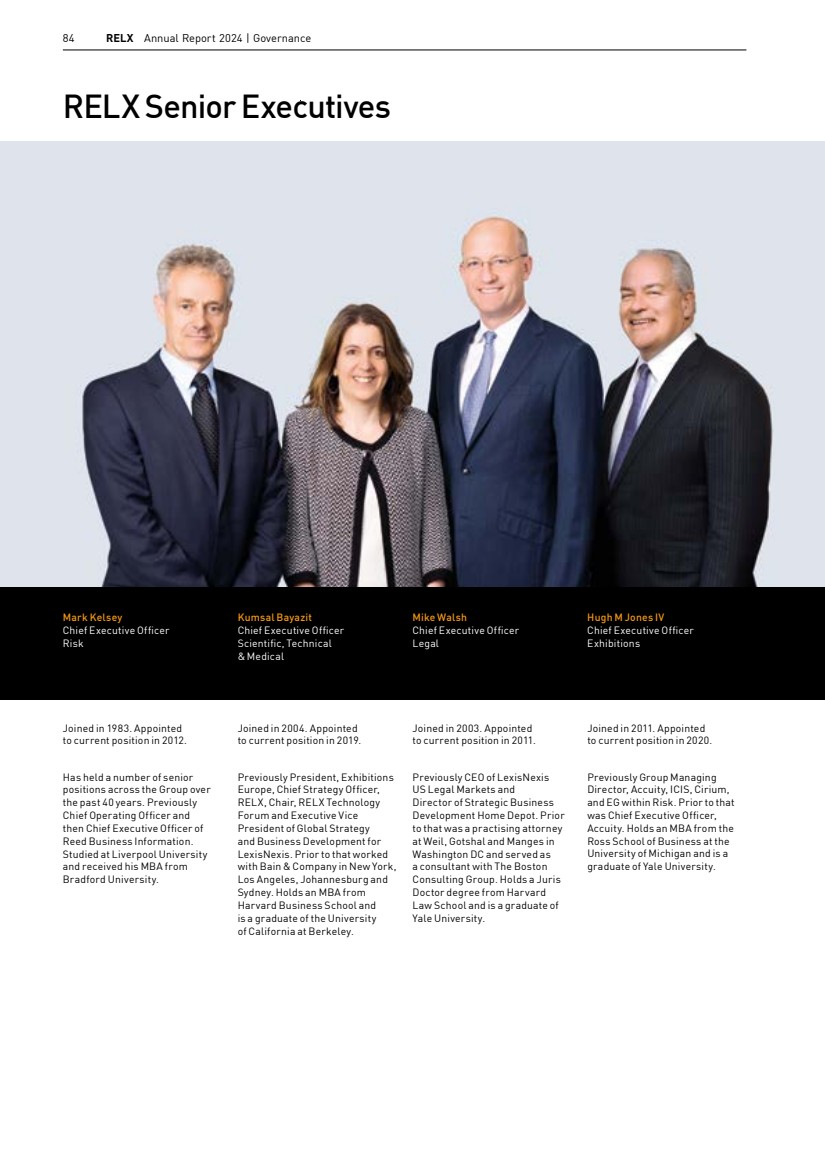
| RELX Annual Report 2024 | RELX Senior Executives 85 W Rose Thomson Chief Human Resources Officer Vijay Raghavan Chair, RELX Technology Forum and Chief Technology Officer, Risk Henry Udow Chief Legal Officer and Company Secretary Shweta Vyas Chief Strategy Officer Youngsuk ‘YS’ Chi Director of RELX Corporate Affairs and Chair, Elsevier Joined in 2021. Appointed to current position at that time. Joined in 2002. Appointed to current position in 2019. Joined in 2011. Appointed to current position at that time. Joined in 2010. Appointed to current position in 2025. Joined in 2005. Appointed to current position in 2011. Previously Chief Human Resources Officer at Standard Life Aberdeen. Before that, held various senior human resources roles at Travelport International, Barclays Bank, The Coca-Cola Company, Coles Group and The Walt Disney Company. Holds an MA in business management from Macquarie University Graduate School of Management and a BA in Psychology, Macquarie University. Previously Vice President of Technology, LexisNexis Insurance Solutions. Prior technology executive positions at ChoicePoint, Paragon Solutions, Primus Knowledge Solutions, and McKesson. Holds a bachelor’s degree in electrical and electronics engineering from the Birla Institute of Technology and Science, Pilani, a master’s degree in cybersecurity from the Georgia Institute of Technology, and completed an advanced management program for executives at MIT Sloan School of Management. Previously Chief Legal Officer and Company Secretary of Cadbury plc having spent 23 years working with the company. Prior to that worked at Shearman & Sterling in New York and London. Holds a Juris Doctor degree from the University of Michigan Law School and a bachelor’s degree from the University of Rochester. Previously Chief Strategy Officer at Risk. Prior to that held various strategy and commercial roles at Risk. Previously worked at LEK and Lucent Technologies. Holds an MBA from the Kellogg School of Business at Northwestern University as well as an MSc in Finance from Babson College and a BA in Economics from Emory University. Previously was President andChiefOperating Officer ofRandom House, founding Chairman of Random House Asia and Chief Operating Officer for Ingram Book Group. Holds an MBA from Columbia University and is a graduate of Princeton University. Market segments Governance and shareholder information Financial statements Financial review Corporate responsibility Overview |

| 86 RELX Annual Report 2024 | Governance Chair’s introduction to corporate governance On 13 February 2025, we announced that Andy Halford will join theBoard as a Non-Executive Director, with effect from the conclusion of the 2025 AGM, subject to his election by shareholders. We look forward to welcoming him to the Board. Further information about our Board appointment process is available in our Nominations Committee Report on page 99. Stakeholder engagement and Board decision-making The views and interests of RELX’s stakeholders are a key element of the Board’s decision-making process. We are focused on ensuring that the interests of our stakeholders are duly taken into account during Board discussions. Across RELX we engage with our stakeholders throughout the year, and we rely on this engagement to ensure we continue to provide solutions and services that meet the evolving needs of our customers and that we continue to effectively support our workforce. We actively listen to our investors, employees, customers, suppliers and the communities that we serve and in which we operate, and we have appropriate mechanisms in place to ensure that the outcomes of such engagement are available to the Board. Information about our approach to stakeholder engagement is on pages 93 to 96. Regulatory developments In January 2024, the Financial Reporting Council published the 2024 Corporate Governance Code. This applies to RELX from 1 January 2025, with the exception of the revisions to Provision 29, which relates to a company’s internal control environment and theBoard’s role in monitoring, reviewing and declaring its effectiveness in the Annual Report, which are applicable from 1 January 2026. A management steering committee has been established, reporting to the Audit Committee, to review the Company’s current practices and recommend any changes that may be required by the revisions to Provision 29. The Audit Committee has also attended technical briefings with our external advisers on the impact of the reforms on RELX. For further details, refer to pages 123 to 126. RELX has robust governance processes in place with respect to corporate responsibility matters and the Board has engaged withmanagement during the year on the regulatory developments in sustainability reporting, in particular the introduction of the European Sustainability Reporting Standards and the EU Corporate Sustainability Reporting Directive. A new Sustainability Statement is included in this year’s Annual Report (see pages 208 to 231) which is in accordance with the new reporting requirements. Board effectiveness As Chair, I am responsible for ensuring that the Board operates effectively, and that the Board, its Committees and each individual Director is evaluated on an annual basis. For 2024, an internal evaluation process was carried out. The outcome of the evaluation confirmed that all of our Directors contribute effectively and continue to demonstrate commitment to their roles, and that theBoard and its Committees continue to operate effectively. Theevaluation process and its outcomes are described on page 97. Paul Walker Chair 12 February 2025 Our approach to corporate governance is structured, disciplined and dynamic. Introduction On behalf of the Board, I am pleased to introduce our Corporate Governance Review for the year ended 31 December 2024. The following pages provide an overview of our corporate governance framework and of the work undertaken by the Board and its Committees during the year. Together with the reports of the Audit, Nominations and Remuneration Committees, our corporate governance review sets out our approach to effective governance and demonstrates how we have complied with the 2018 UK Corporate Governance Code. Corporate governance The Board is responsible for overseeing the effectiveness of RELX’s governance framework. Our approach to corporate governance is structured, disciplined and dynamic. RELX’s governance framework provides a clear mandate to the Board and our employees, defining responsibilities and accountabilities and adapting to meet the evolving demands of the world in which we operate. This enables RELX’s leadership to focus on the key issues facing the business and to apply their expertise where most needed. Effective governance, and the policies and practices that support it, is fundamental to RELX’s culture of acting with integrity in all that we do, and it supports the Company’s purpose to benefit society through its unique contributions (as set out on pages 38 to 41). The Board believes that attaining the highest levels of corporate responsibility helps enable excellent financial performance. We believe that pursuing both goals in tandem will result in long-term sustainable shareholder value creation and will also provide our stakeholders with confidence that the governance ofRELX is appropriate for its size and profile as a listed company, helps manage risks and opportunities, and ensures that key stakeholders are appropriately considered in the decisions that we make. Board changes and succession planning There have been several changes to the composition of our Board and Committees during the year. Marike van Lier Lels retired following the conclusion of our AGM in April, after serving as a Director since 2015. On behalf of the Board, I would like to thank Ms van Lier Lels for her valued contributions to the Board and to the Committees on which she served, and for her work as RELX’s Workforce Engagement Director, a role she held since 2018. We are pleased to have welcomed Bianca Tetteroo to the Board this year. Following her appointment as a Non-Executive Director in July, Ms Tetteroo has joined the Corporate Governance Committee and has succeeded Ms van Lier Lels as RELX’s Workforce Engagement Director. Robert MacLeod will retire from the Board at the conclusion of theCompany’s AGM in April 2025, having joined the RELX PLC Board in 2016. Since 2023, he has served as Chair of the Remuneration Committee. On behalf of the Board, I would like to thank Mr MacLeod for his valued contributions to the Board, to the Committees on which he served and for serving as Chair ofthe Remuneration Committee. Alistair Cox will succeed Mr MacLeod as Chair of the Remuneration Committee following the conclusion of the Company’s AGM in April 2025. |
| 87 There is a clearly defined schedule of matters over which the Board retains responsibility and endorses all final decisions, which is available to view at www.relx.com/investors. Suchmatters include: § Approval of RELX’s strategy and annual budget and changes to the corporate or capital structure of the Company § Approval of RELX’s risk appetite, oversight of risk management framework including principal and emerging risks, fraud risk and internal control systems § Corporate governance arrangements, including Board and Committee composition and terms of reference § Approval of key policies, including RELX’s Code of Ethics and Business Conduct (the Code), Operating and Governance Principles, Tax and Dividend Policies and Inclusion and Diversity Policies § Approval of the Company’s Annual Report and periodic financial statements and trading updates § Oversight of the Code reporting channels for our workforce to raise concerns, and ensuring workplace policies and practices align with the Company’s values and intended culture § Oversight of RELX’s corporate responsibility activities and its reporting thereon § Other matters deemed material to the delivery of RELX’s strategy or future financial performance, such as approval of material acquisitions, major capital expenditure and investments RELX Annual Report 2024 Corporate governance review The Board The Board determines RELX’s purpose and values and sets and oversees delivery of its strategic aims and objectives for long-term, sustainable success. The Board monitors and oversees RELX’s governance, risk management and internal controls processes and culture. Board leadership The Board is responsible for promoting the long-term sustainable success of the Company. To ensure the Board operates effectively and efficiently it has established four principal Committees to provide focused oversight, each with delegated authority to oversee and report to the Board on material and relevant matters, as appropriate. The roles and responsibilities of each Committee are set out in their individual terms of reference which are available on the Company’s website www.relx.com. A summary of the Committees’ key responsibilities is set out below. Audit Committee Reviews and monitors the integrity of financial reporting, internal control and risk management systems, the effectiveness of the internal audit process and the performance, independence and effectiveness of the external auditor. The Committee comprises only independent Non-Executive Directors. Remuneration Committee Determines, monitors and oversees the implementation of RELX’s remuneration policy for the CEO, CFO, the Chair, and Senior Executives below Board level. The Committee reviews the ongoing appropriateness of the remuneration policy. The Committee comprises only the Chair and Non-Executive Directors. Nominations Committee Keeps under review the composition of the Board and its Committees; ensures orderly succession plans are in place for the Board and senior management and ensures a diverse pipeline for such succession; and oversees the recruitment of new Directors. The Committee comprises only the Chair and Non-Executive Directors. Corporate Governance Committee Responsible for developing andrecommending corporate governance principles to the Board; reviewing ongoing developments and best practice in corporate governance, and monitoring the structure and operation of the Board Committees. The Committee comprises only the Chair and Non-Executive Directors. Further information about the work of the Audit Committee is in its report on pages 123 to 126 The Directors’ Remuneration Report isset out on pages 102 to122 Further information about the work of the Nominations Committee isin its report on pages 99 to 101 RELX Senior Executives To enable efficient day-to-day management of RELX’s business areas, there is a structure of delegated authorities in place from the Board to the Chief Executive Officer, the Chief Financial Officer and a team of Senior Executives (shown on pages 82 to 85). This delegated authority framework, which is reviewed and approved by the Board each year, allows the necessary operational and management decisions to be taken by the right people, at the appropriate time to execute the Company’s strategy. There are appropriate controls in place to ensure such decisions remain consistent with the risk appetite, policies and objectives established by the Board. Our governance framework Matters reserved to the Board Market segments Governance and shareholder information Financial statements Financial review Corporate responsibility Overview |
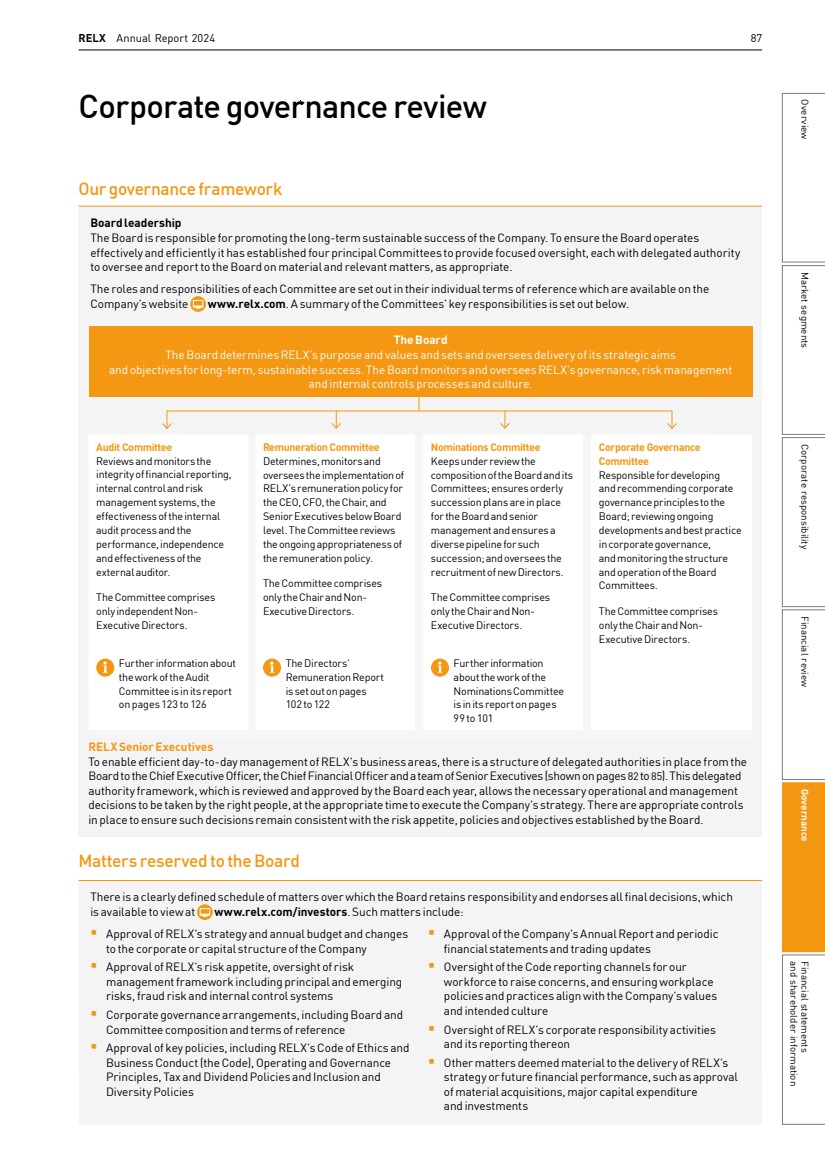
| 88 RELX Annual Report 2024 | Governance Board roles As at the date of this report, the Board comprised the Chair, two Executive Directors and seven Non-Executive Directors, who bring a wide range of skills, experience, industry expertise and professional knowledge to their roles. An overview of the gender balance, length of tenure and nationalities on the Board is provided in the Nominations Committee Report on pages 99 to 101. Division of responsibilities There is clear separation of the roles of the Chair, who leads the Board, and the Chief Executive Officer, who is responsible for the day-to-day management of RELX. The key responsibilities of each of the director roles on the Board is summarised below. Chair § Provides leadership of the Board and ensures its overall effectiveness § Ensures that all Directors are sufficiently apprised of matters to make informed judgements, through the provision of accurate, timely and clear information § Promotes high standards of corporate governance, demonstrates objective judgement and promotes a culture of openness and debate § Sets the agenda and chairs meetings of the Board § Chairs the Nominations and Corporate Governance Committees § Facilitates constructive Board relations and the effective contribution of all Directors § Ensures effective dialogue with shareholders § Ensures the performance of the Board, its Committees and individual Directors is assessed annually § Ensures effective induction and development of Directors Chief Executive Officer § Day-to-day management of RELX, within the delegated authority limits set by the Board § Develops RELX’s strategy for consideration and approval by theBoard § Ensures that the decisions of the Board are implemented § Consults with the Chair and Nominations Committee on executive succession planning § Leads communication with shareholders § Promotes and conducts the affairs of the Company with the highest standards of integrity, probity and corporate governance Chief Financial Officer § Day-to-day management of RELX’s financial affairs § Responsible for RELX’s financial planning, reporting and analysis § Ensures that a robust system of internal control and risk management is in place § Maintains high-quality reporting of financial and environmental performance internally and externally § Supports the Chief Executive Officer in developing and implementing strategy Senior Independent Director § Leads the Board’s annual assessment of the performance of the Chair § Available to meet with shareholders on matters where usual channels are deemed inappropriate § Deputises for the Chair, as necessary § Serves as a sounding board for the Chair and acts as an intermediary between the other Directors, when necessary Non-Executive Directors § Bring external perspectives and a broad range of experience to the Board § Provide constructive challenge and input to the development of strategy § Scrutinise the performance of management in meeting agreed goals and monitor the delivery of RELX’s strategy § Serve as members of Board Committees as required and Chair the Audit and Remuneration Committees Governance structure RELX’s corporate governance framework consists of leadership bodies and well-documented comprehensive processes and procedures which ensure that RELX is appropriately directed, led and controlled at all levels, with appropriate oversight and involvement by the Board and senior management. It is designed to safeguard and enhance the creation of long-term, sustainable shareholder value and to enable our business areas to operate with the required agility and flexibility to address the needs of our customers effectively, while taking into account all applicable statutory and regulatory requirements. The rights, responsibilities and accountabilities of those who work for and on behalf of RELX are clearly established through delegated authorities, corporate policies and codes of ethics and conduct, which promote the protection of RELX’s reputation and our commitment to acting with integrity in all that we do. The RELX Operating and Governance Principles set out the processes, policies, controls and related assurance activities that have been put in place to mitigate risk, covering key functions and operations of the Group. The Principles serve as a first point of reference for management and provide our workforce with a clear overview of the policies and practices with which they must comply. The Principles are reviewed biennially by the Board and are updated as required. The Code of Ethics and Business Conduct sets out the core principles and standards of professional conduct by which RELX operates and provides a framework for building and maintaining the desired culture of RELX. The Code provides all those who work for RELX with clear guidelines for how to conduct themselves in the workplace and across our broader operating environments, to inspire trust among all our stakeholders and to demonstrate commitment to our core value of ‘Do the Right Thing’. There are mechanisms in place to help our workforce to understand and comply with their obligations under the Code, which include ongoing training and established communication channels to ask questions and report concerns. We endeavour to ensure that our workplace policies are user-friendly, clear and accessible. The Code is reviewed and approved by the Board triennially and is available at www.relx.com. Internal control and risk management arrangements are a central part of our governance framework. These are monitored by the Audit Committee and overseen by theBoard (further information is on pages 98 and 123 to 126). |
| RELX Annual Report 2024 | Corporate Governance Review 89 Compliance with the UK Corporate Governance Code RELX PLC applies the principles and provisions of the 2018 UK Corporate Governance Code (the UK Governance Code), a copy of which is available on the FRC’s website, www.frc.org.uk. For the year ended 31 December 2024, the Board considers that the Company fully complied with the principles and provisions of the UK Governance Code that are applicable at the date of this report. Board programme The Board met formally seven times during the year. Five meetings were held in person, in London, Amsterdam and in Alpharetta. Through a structured programme of scheduled meetings, the Board oversees RELX’s financial performance and ensures its systems of risk management, internal control and corporate governance are fit for purpose and effectively underpin the delivery of its strategy. There are processes in place to manage the Board’s annual agenda, to ensure that all necessary items are submitted for its consideration at the appropriate time with sufficient supporting information, and to allow the Board adequate time to discuss and challenge strategic or material issues. The Board’s annual programme, and the agendas for the Committees are prepared by their respective Chairs with support from the Company Secretary. Board Committees are principally supported by theChief Executive Officer, Chief Financial Officer, Chief Legal Officer and Company Secretary, and the Chief Human Resources Officer, and other senior managers are invited to attend meetings where appropriate. Board discussions are informed through regular reports and presentations from senior management at Board and Committee meetings, and through deep-dive sessions into individual business areas, topics of strategic relevance, and future developments that may impact RELX. Regular reports are provided, covering business area and overall strategies and financials, along with relevant regulatory, legislative and governance updates. RELX’s annual strategy review process comprehensively assesses its strategic position and key strategic options, considering opportunities and risks to its future success and the long-term sustainability and viability ofits business model. The Board engaged in a two-day, in-depth strategy session in September. Information and support There are processes in place to ensure that the Board and its Committees receive relevant information at the right time and with the appropriate level of detail to inform decision-making and enable effective monitoring of management’s progress in accordance with agreed strategy. The Directors are provided with papers ahead of all scheduled Board and Committee meetings, containing management updates, relevant context and market information, and other supporting information and reports, as appropriate. All the Directors have access to the advice of the Company Secretary and may also take independent professional advice at the Company’s expense where they deem this to be necessary for the furtherance of their duties to the Company. The Company Secretary advises the Board on all corporate governance matters and ensures that all Board procedures are followed correctly. TheDirectors also have access to other members of RELX’s management, staff and external advisers. Each of the Directors is expected to attend all meetings of the Board and of the Committees of which they are a member. However, in circumstances where a Director is unable to attend a meeting, they are provided with the relevant papers and have the opportunity to discuss any matters arising with the respective Chair and with their fellow Board and Committee members. All Directors are provided with a copy of the minutes of each meeting. Director induction Following appointment, and as required, all Directors receive a full, formal induction, that is tailored to their individual requirements, based on existing knowledge and experience. TheChair and Company Secretary are responsible for ensuring that an effective induction programme takes place for all new Directors. During the year, Bianca Tetteroo (appointed in July 2024) was provided with a comprehensive briefing pack including detailed information about each of RELX’s business areas, governance and internal controls, and recent reporting and investor materials, together with access to historical Board papers and minutes. To provide a sufficiently in-depth and current understanding of our operations, a number of meetings were organised with senior management from RELX’s business areas and corporate functions, as well as with the external auditor. Ongoing development For Directors to effectively discharge their responsibilities, it is important that they regularly refresh and update their skills and knowledge. The Board’s annual programme is designed with this in mind and support the Directors to maintain sufficiently in-depth knowledge of RELX’s business areas and their operations, and to keep apprised of relevant events and changes in RELX’s operating environment and markets. In 2024, the Directors took part in deep-dives into the Risk and Elsevier business areas, covering financial and operational performance by segment, product development and strategic plans. In addition, the Board conducted a review of Exhibitions and specific segments of Legal. The Audit Committee also attended a series of technical deep-dive briefing sessions. Further information about the work and activities of the Audit Committee is available in the Audit Committee Report on pages 123 to 126. Market segments Governance and shareholder information Financial statements Financial review Corporate responsibility Overview |
| 90 RELX Annual Report 2024 | Governance Purpose, strategy, values and culture RELX places significant emphasis and importance on the way we do business. We are clear and unequivocal about our commitment to do so with integrity and in accordance with the highest ethical standards. Purpose RELX is a global provider of information-based analytics and decision tools for professional and business customers, enabling them to make better decisions, get better results and be more productive. Our purpose is to benefit society by developing products that help researchers advance scientific knowledge; doctors and nurses improve the lives of patients; lawyers promote the rule of law and achieve justice and fair results for their clients; businesses and governments prevent fraud; consumers access financial services and get fair prices on insurance, and customers learn about markets and complete transactions. Our purpose guides our actions beyond the products that we develop. It defines us as a company. Every day across RELX our employees are inspired to undertake initiatives that make unique contributions to society and the communities in which we operate. Strategy Our number one strategic priority is the organic development ofincreasingly sophisticated information-based analytics and decision tools that deliver enhanced value to professional and business customers. We do this by leveraging deep customer understanding to build innovative solutions which combine leading content and data sets with powerful technologies. We aim to achieve leading positions in long-term global growth markets and leverage our skills, assets and resources across RELX, both to build solutions for our customers and to pursue cost efficiencies. We are transforming our core business, building out new products and expanding into higher growth adjacencies and geographies. We are supplementing this organic development with selective acquisitions of targeted data sets and analytics, and assets in high-growth markets that support our organic growth strategies and are natural additions to our existing business. Our improving long-term growth trajectory is being driven by the ongoing shift in our business mix towards higher growth analytics and decision tools. When combined with our strategy of driving continuous process innovation to manage cost growth below revenue growth, the result is continued strong earnings growth, with improving returns. Values We strive to do business with integrity. Our principle ‘Do the Right Thing’ embraces behaviours such as being honest in dealing with others, respecting each other, and courageously speaking out for what is right; thereby guiding our commitment to achieve business goals in an open, honest, ethical, and principled way. We ask our suppliers to meet the same standards, and provide support for them to do so as necessary. Culture As a provider of information-based analytics and decision tools, our corporate culture is fact-based, data-driven and analytical. We are transparent and non-political in our decision-making. We seek never-ending performance improvement in everything we do. We are passionate about making a positive impact on society through our unique contributions as a business and our employees feel a strong sense of engagement with the business and its purpose. We focus on improving customer outcomes while emphasising corporate responsibility and acting with integrity.Our culture encourages community engagement, environmental responsibility, inclusion and the well-being of our people. How the Board monitors culture RELX’s standards and values are defined on a group-wide basis, however the Board acknowledges that cultural practices and preferred ways of working can vary across the geographies of our business areas. The Board helps to build the culture of the organisation from the top down, by ensuring that it takes decisions that are aligned with RELX’s values. The Board regularly reviews RELX’s policies and Code of Ethics and Business Conduct (the Code) to ensure the right framework is in place for RELX to operate with integrity, and that its working practices effectively promote a culture of strong engagement with our business and purpose, and with the communities that we serve and in which we operate. We strive to continually improve customer outcomes through a culture that is fact-based, data-driven and analytical. The Board has appointed a Non-Executive Workforce Engagement Director to engage directly with employee representatives from across RELX and to report back to the Board (further information about this engagement is on page 94). This provides the Board with insights into how culture is embedded across RELX’s business areas and functions and any issues that need to be addressed. The views of employees are also measured through annual employee pulse surveys, and a broader triennial opinion survey, designed to gauge how employees feel about the organisation, how well they understand its direction, and their level of satisfaction and engagement with their work. An analysis of the results is presented to the Board. The Board also receives regular updates on culture-related issues and updates on corporate responsibility activities from across each of RELX’s business areas. Such updates include progress against our people objectives in areas such as well-being, pay equity and reducing inequalities through inclusion. This contributes to the Board’s assessment of the culture at RELX and provides a context against which the Board has taken a number of its principal decisions during the year. Through the activities of the Audit Committee, the Board receives updates on alleged and substantiated violations of the Code and significant matters raised through reporting channels, which provide insights into governance and compliance behaviours. |
| RELX Annual Report 2024 | Corporate Governance Review 91 Board activities during the year Purpose and strategy The Company’s purpose, strategy, values and culture statement is on page 90 Read more about RELX’s strategy and business model on pages 5 to 8 § At a two-day strategy session in September, the Board discussed strategic initiatives for RELX and debated and approved RELX’s three year strategic plan for 2025 to 2027. RELX’s strategic priority remains focused on organic growth, supported by targeted acquisitions. The Board reviewed RELX’s financial performance, customer markets, shareholder value creation, capital expenditure, potential acquisitions and areas for potential growth across all four business areas. The Board also reviewed management’s operating plans. § In June and September, the Directors attended deep-dive business review sessions into the Risk and Scientific, Technical & Medical (STM) business areas, led by respective senior management. These included updates on strategy and innovations supplemented by presentations from subject matter experts on key products, review of talent resources, and a final session for the Board to provide their feedback to senior management. § The Board conducted reviews of RELX’s invested capital and capital structure during the year, including financial performance, potential and completed acquisitions, net debt, returns on invested capital, credit ratings, forecasts and financial market conditions and approved the annual budget. § The Board reviewed the Company’s purpose, strategy, values and culture statement and confirmed that it continues to represent why and how RELX operates and the standards to which those who work for and who represent RELX are held in the course of conducting our business and operations. People, values and culture Information about Board engagement with our workforce is on page 94 How we invest in and reward our workforce is on page 52 RELX’s approach to I&D and how we monitor our progress is set out on pages 50 to 52 and 100 and 101 § The Board oversaw Director succession planning arrangements during the year. § Having the right people in leadership roles is an important factor in embedding the desired culture forRELX. The Nominations Committee and the Board were updated on the ongoing leadership talent reviews undertaken by management and plans for talent development across RELX’s business and functional areas. § The RELX and Board Inclusion and Diversity Policies were reviewed by the Board to ensure they remain fit for purpose and continue to align with our desired culture and effectively support our purpose and strategy. § The Board considered the results of the company-wide employee opinion survey conducted during 2024 (further information is on page 50). Corporate Responsibility/ Sustainability Information about RELX’s corporate responsibility and sustainability activities is available in the Corporate Responsibility Report on pages 35 to 65, the TCFD disclosures on pages 236 to 241 and the Sustainability Statement on pages 208 to 231 § RELX’s corporate responsibility activities formed a significant part of the Board’s agenda during the year and these are overseen by the Board on an ongoing basis. Detailed information about RELX’s corporate responsibility objectives, and its progress towards these, can be found in the Corporate Responsibility Report on pages 35 to 65, the Sustainability Statement on pages 208 to 231, and the TCFD disclosures on pages 236 to 241, each as approved by the Board. § The Board reviewed and approved the Company’s Modern Slavery Act Statement, which describes the steps taken by the Company and its subsidiaries to ensure that modern slavery and human trafficking were not taking place in the context of RELX’s business operations and its supply chain during the previous year. Further information about how RELX manages an ethical and socially responsible supply chain is available on pages 57 to 59. Risk management andinternal control The Company’s principal and emerging risks and mitigation strategies are set out on pages 74 to 78 The Company’s Viability Statement is on page 79 Further information about RELX’s internal controls is on pages 74, 98 and 125 § The Audit Committee and the Board reviewed the effectiveness of the systems of risk management and internal control in operation during 2024 and determined that RELX’s control systems provided reasonable assurance against material inaccuracies or loss and have functioned properly and effectively throughout the year. § The Board, supported by the work of the Audit Committee, reviewed and agreed RELX’s principal and emerging risks and mitigation strategies. Following a robust and thorough assessment of the risks identified, together with a detailed review of RELX’s financial position, the Board considered RELX’s ongoing viability and approved the Company’s Viability Statement. § The Board received a comprehensive presentation on RELX’s assessment of material cybersecurity risks, threat landscape and incident trends, and approach to mitigation and cybersecurity controls from the Head of Information Assurance and Data Protection. Cybersecurity and data privacy are considered principal risks for RELX. Market segments Governance and shareholder information Financial statements Financial review Corporate responsibility Overview |
| 92 RELX Annual Report 2024 | Governance Shareholder matters Details of the Board’s engagement with investors during the year are on page 93 Information about the Company’s dividend policy is on page 72 § Following a robust assessment of RELX’s financial position, in February the Board approved a share buyback programme for 2024 of £1bn. The programme was completed in December, at which point 29m shares held in treasury were cancelled. At its December meeting, the Board approved an initial £150m for the 2025 share buyback programme, with this initial amount to be deployed prior to the announcement of the 2024 full year results in February 2025. § The Board considered and approved the proposed resolutions to be put to shareholders at the 2024 AGM, which included the distribution of a final dividend for the year ended 31 December 2023. Each of the proposed resolutions was subsequently approved by shareholders at the meeting. The Board also considered and approved the payment of an interim dividend during the year. § The Board received a presentation from investor relations covering trading in RELX PLC shares and changes in the shareholder register. Director attendance at Board and Committee meetings The following table shows the attendance by Directors at Board and Committee meetings during the year. Attendance is expressed as the number of meetings attended by each Director out of the number of meetings they were eligible to attend. Directors Committee appointments Board (1) Audit Committee Remuneration Committee Nominations Committee Corporate Governance Committee Paul Walker (Chair) N C R 7/7 4/4 4/4 5/5 Erik Engstrom 7/7 Nick Luff 7/7 Alistair Cox A R C 7/7 4/4 4/4 5/5 June Felix A R C 7/7 4/4 4/4 5/5 Charlotte Hogg A C 7/7 4/4 5/5 Robert MacLeod R N C 7/7 4/4 4/4 5/5 Andrew Sukawaty A C 7/7 4/4 5/5 Bianca Tetteroo (2) C 4/4 2/2 Marike van Lier Lels (3) N C 2/2 1/1 1/1 Suzanne Wood A A N C 7/7 4/4 4/4 5/5 Committee membership key A Audit Committee R Remuneration Committee N Nominations Committee C Corporate Governance Committee Committee Chair (1) In addition to the seven scheduled Board meetings, the Directors also attended two full-day strategy and business review meetings. (2) Marike van Lier Lels retired from the Board and stepped down from the Nominations and Corporate Governance Committees with effect from the conclusion oftheCompany’s AGM on 25 April 2024. (3) Bianca Tetteroo was appointed to the Board on 1 July 2024 and was appointed as Workforce Engagement Director with effect from the same date. |
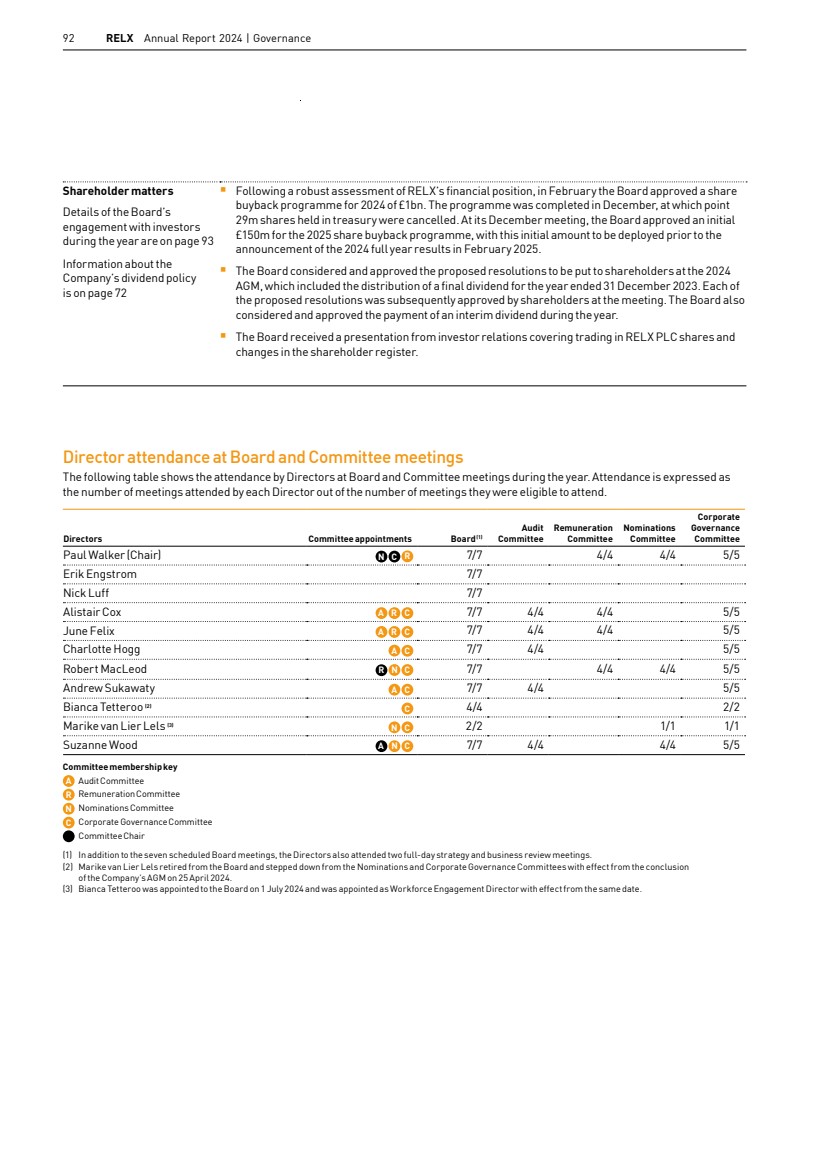
| RELX Annual Report 2024 | Corporate Governance Review 93 Stakeholder engagement During the year, the Board undertook a review of RELX’s key stakeholders and concluded that they remain unchanged from the previous year. The Board received a detailed overview of stakeholder engagement channels and activities and confirmed that it has adequate visibility of the views of key stakeholders, which are taken into consideration in its decision-making. Further information about the nature and outcomes of the Company’s engagement with its stakeholders are detailed throughout this Annual Report and examples oftheBoard’s engagement with key stakeholders are set out on the following pages. Investors Why effective engagement is important How we engage, outcomes and impact Engagement with our investors helps them to understand our strategy, performance and governance arrangements, and to make informed decisions concerning the Company. It also makes clear our prioritisation of the long term in our decision-making and focus on delivery of consistent financial performance. Our investors provide us with input and feedback concerning the development and implementation of our strategy, and we consider their views when making investment decisions. Engagement with our investors is undertaken by members of the Board and at a business level by senior management and our Investor Relations, Corporate Responsibility and Treasury teams. TheBoard is updated with feedback and commentary received from investors through business engagement, investor roadshows and meetings with institutional shareholders. The Board receives regular reports on the Company’s share price and shareholder return performance and a review of analyst commentary in response to the Company’s market announcements and results publications. Executive Directors and senior management gave a number of investor and analyst presentations during the year to provide further detail and context to our published results and strategy plans. During the year: § Our engagement processes confirmed that investors in the main continue to understand and support our organic growth strategy. The Board considered this when approving RELX’s three-year strategic plan for 2025 to 2027, which leaves our strategic focus, and our priorities for uses of cash generated by RELX, broadly unchanged. § In response to interest from the investment community, RELX held an investor seminar on the Legal business, presenting customer use cases and a demonstration of Lexis + AI and Protégé, a new product which further expands on the Generative AI capabilities of Lexis+ AI. The event was attended by over 180 investors and analysts. The presentation demonstrated the strategic position of our Legal business in the AI space and the Board were provided with the feedback from attendees. The presentation is available at www.relx.com/investors. Further information about Lexis+ AI and Protégé is on pages 22 and 23. § The Company held its AGM with shareholders in April. § RELX’s material communications to investors, including the Full-Year and Interim Results Announcements, trading updates, the Annual Report and the Notice of AGM were reviewed and approved by the Board prior to release. § In response to requests from some shareholders, the Chair of the Board held virtual meetings to discuss general governance and other topics with shareholders. § In respect of shareholder returns, the Board took into account a range of stakeholder views when considering the interim and final dividend payments during the year, and the quantum of the Company’s share buyback programme for 2024. Market segments Governance and shareholder information Financial statements Financial review Corporate responsibility Overview |
| 94 RELX Annual Report 2024 | Governance Employees Why effective engagement is important How we engage, outcomes and impact Our people’s well-being and their commitment to the work they do are essential to our future growth and our aim to successfully build long-term leading positions in global growth markets. We strive to foster an environment in which our employees feel a strong sense of engagement with our business and share a passion for making a positive impact on society through our unique contributions. RELX actively seeks feedback from employees to understand their key challenges and concerns and how we can work to address these. Hearing their views on what we do well, and what we can do better, is an important driver for improvement and enables us to take action to retain our best talent. Effective engagement helps to mitigate the risk of not being able to recruit, motivate and retain skilled employees and management, which is recognised as a principal risk (see page 77). Employee engagement routinely takes place within the business areas and matters of concern are cascaded up through our management framework. The Board receives regular management reports which cover employee engagement, turnover and demographic analysis, updates on workplace initiatives, progress towards I&D objectives, and concerns raised through our Code ofEthics and Business Conduct reporting channels. The Board reviews employee engagement and workforce data and takes these into consideration in its decision-making. RELX has a dedicated intranet for employees which is kept updated with financial and performance information, news of business developments and workforce initiatives and events (including in inclusion and diversity) and other important messages from senior management. Bianca Tetteroo was appointed as our Non-Executive Workforce Engagement Director upon her appointment to the Board in July 2024, taking over the responsibility previously assumed by Marike van Lier Lels up to her retirement from the Board in April 2024. The transition was supported by the Chief Human Resources Officer. The Workforce Engagement Director engaged directly with employee representatives from across RELX and reported to the Board on the progress of RELX’s workforce initiatives, together with the challenges, concerns and priorities raised by employees. Where challenges and concerns were discussed, as appropriate, the Board was also informed of the actions taken or plans developed to address them. This provides the Board with insight into the culture across RELX, how our working practices and initiatives have been received and highlights any issues that need to be addressed. During the year: § Ms Tetteroo met with workforce representatives to learn about the experiences of employees while working at RELX. The matters discussed were reported to the Board, including positive feedback about Employee Resource Groups and senior leaders’ involvement in these. Further matters included hybrid working arrangements, pay, benefits, and career development through training and networking opportunities. § The results of our triennial employee opinion survey was presented to the Board in December. The survey indicated strong Net Promoter Scores, which had increased from the previous survey for nearly all individual business areas. § Board reports from the Chief Human Resources Officer highlighted the steps taken to identify, support and develop current and future leaders across the business through the Organisational Talent Review and Management Development Planning processes. This focus has seen increased internal talent mobility through cross-divisional promotions and lateral moves, providing wider career development opportunities. § The Board reviewed the Board and RELX Inclusion and Diversity Policies and determined that these continue to be fit for purpose and effective. § The Board received presentations from the Head of Corporate Communications on focus areas for 2024. These continue to be fostering engagement and advocacy supported by data-driven storytelling in selected focus areas, such as our strategy, innovation and personal growth. Employee understanding and engagement with our purpose and strategy is monitored through our employee opinion survey scores over time. § Employee involvement in the Company’s performance is encouraged through RELX’s employee share schemes. RELX currently operates three all employee share plans, one in each of the UK, the Netherlands and the USA, providing RELX employees with the opportunity to obtain its shares at a discounted price. The Board received updates on annual participation rates. |
| RELX Annual Report 2024 | Corporate Governance Review 95 Customers Why effective engagement is important How we engage, outcomes and impact Our goal is to help customers make better decisions, get better results and be more productive. We do this by leveraging deep customer understanding to build innovative solutions which combine leading content and data sets with powerful technologies. Collaborating closely with our customers is crucial for us to understand where and how we can improve the quality of our services and products, and enables us to make targeted investment decisions, such as to develop new or emerging technologies or complement our existing capabilities through acquisition activity. Our engagement with customers takes place at an operational level across our business areas, through our dedicated sales and operations teams and through customer training and workshops. Material customer issues are cascaded up to the appropriate senior management. The Board received presentations during the year from customer-facing employees which detailed the nature of our customer engagement and the actions taken by the business areas as a result. In 2024, the Board received analyses of customers by sector and geography and data concerning the resilience of the markets in which we operate. The Board reviewed customer survey data, Customer Net Promoter Scores, and customer usage volumes across our business areas. During the year: § The Board continued to monitor current and anticipated future customer demand and market activity together with customer feedback, to understand how our product offerings address customer requirements. This information informed the areas of focus for product development and acquisitions and the level of investment required. RELX made several acquisitions during the year that complement its existing product range and enhance value for our customers. More information about our acquisitions during the year can be found on pages 23 and 28. § Feedback from our customers informed the Board and management’s assessment of the areas in which RELX should build out new products and services, the speed at which this should be undertaken, and where it should look to expand into higher growth adjacencies and geographies over varying time horizons. § The Board received an update on ongoing customer engagement on sustainability issues from RELX’s Corporate Responsibility Team. Suppliers Why effective engagement is important How we engage, outcomes and impact RELX has a diverse supply chain with suppliers located in over 150 countries across multiple categories, which RELX categorises as content suppliers and non-content suppliers. Collaboration and two-way dialogue with our suppliers help ensure that we are able to maintain and improve the quality of products and services we provide to our customers. Effective engagement underpins our ability to maintain an ethical supply chain, giving us visibility of our suppliers’ commitment to good practices. Engagement with our content suppliers, which include the companies we license content or data from, as well as authors, editors, content reviewers and product designers, takes place principally through ongoing dialogue with the relevant business area to which the content is provided. Content supplier feedback is collected through direct relationships and regular business reviews, and presented to the Board through updates from our business area leaders. Our non-content suppliers represent more typical vendor-type relationships, such as IT software and cloud service providers, or third parties to whom we have outsourced support function activities. Engagement takes place at various levels throughout RELX. Feedback is reported to theBoard by business area leaders and the Global Head of Purchasing and Property. During the year: § Outcomes of ongoing business engagement with our content suppliers, including Net Promoter Scores and the outcomes of business reviews, informed the Board’s discussions during its consideration of RELX’s three-year strategy plan for 2025 to 2027, and its assessment of mitigations in place for our principal risks of customer acceptance of our products and supply chain dependencies. § Our Supplier Code of Conduct has been translated into 16 languages for use across RELX. The Board received updates on the progress of our Socially Responsible Supplier (SRS) programme, including numbers of signatories and audits conducted (further details are on pages 57 to 59). The Board continued to support the programme. The Board also reviewed and approved our Modern Slavery Act Statement, available from www.relx.com, which sets out the steps taken by the Company and its subsidiaries to prevent modern slavery and human trafficking in its business and supply chain. § The result of our annual Supplier Survey programme, involving feedback from over 100 key suppliers, provided the Board with insight into the views of RELX’s major suppliers. Market segments Governance and shareholder information Financial statements Financial review Corporate responsibility Overview |
| 96 RELX Annual Report 2024 | Governance Community Why effective engagement is important How we engage, outcomes and impact Our focus on community includes those where we, our customers and suppliers work around the world, as well as the communities we serve, including in science, academia, risk, law and many other fields. We prioritise positive dialogue with our community stakeholders as we believe they, collectively, provide our ‘licence to operate’. Our efforts are informed by our commitment to the United Nations Global Compact and its ten principles, focused on human rights, labour, the environment and anti-corruption – all issues with wide societal impact. We engage with our community stakeholders through our unique contributions to society, and through our comprehensive global community programme, RELX Cares. TheRELX Cares mission is the education of disadvantaged young people. Further information about our RELX Cares projects and its contributions to the communities in which we operate is on pages 53 to 56. In accordance with the Business for Societal Impact model, we monitor the short- and long-term benefits of our community engagement. We survey RELX Cares volunteers to understand the impact of the programme on their personal development and how it affects the way they feel about working at RELX. During the year: § The Board considered RELX’s environmental performance and supported ongoing initiatives to minimise our environmental impact, and continued to endorse our commitment to our reaching net zero by 2040. More information is in our Corporate Responsibility Report on pages 35 to 65 and the Sustainability Statement on pages 208 to 231. § The Board was updated on the requirements of the EU Corporate Sustainability Reporting Directive (CSRD). Our CSRD Sustainability Statement was reviewed by the Audit Committee and approved by the Board. § The Board received detailed updates on community engagement during the year, including key metrics, objectives and outcomes. Board feedback and support for community engagement shapes the direction of our charitable programmes and future plans. § The Board continued to endorse RELX’s volunteering policy through which RELX employees receive two days paid leave each year to undertake community volunteering work. The Board received reports on the outcome of the programme, such as employee engagement rates and donations raised. § The Board continues to support the business areas utilising their unique product offerings to support causes in their communities. During the year the Board received reports from the Global Head of Corporate Responsibility on RELX’s achievements in this area against its 2024 objectives, the objectives for 2025 and for the years to 2030. This included examples of how RELX’s products and services positively impact climate-related issues. § The Board was updated on the ongoing initiatives to decrease office energy consumption. External appointments and Non-Executive Director independence The Board has in place formal procedures to evaluate and review the external commitments of Directors, each of whom are required to obtain the Board’s approval prior to accepting new significant external appointments. During the year, the Board reviewed the proposed external appointment of June Felix. It was concluded that this appointment would not impact the Director’s ability to perform effectively on the RELX PLC Board, and accordingly theBoard gave its approval. When Directors take up new external appointments, any related commercial relationships with RELX are reviewed, and any potential conflicts of interest are dealt with following formal procedures. In accordance with the Company’s Articles of Association, Directors who are not conflicted may authorise, as appropriate, situations where a Director has an interest that conflicts, or may possibly conflict, with those of RELX, and may impose conditions on such authorisations. Supported by the Nominations Committee, the Board monitors the independence of the Non-Executive Directors in line with the relevant provisions of the UK Corporate Governance Code. An annual evaluation, led by the Nominations Committee, considered whether length of service or any other factor has impacted or may impact the ability of any Non-Executive Director to remain independent in character and judgement in the furtherance of his or her duties to the Company. The Board determined that each of the Non-Executive Directors is considered to be independent of management and free from any business or other relationship which could materially interfere with their ability to exercise independent judgement (with the exception of the Chair, whose independence was not assessed, but who was deemed to be independent upon appointment). |
| RELX Annual Report 2024 | Corporate Governance Review 97 Board evaluation The Directors consider the evaluation of the Board, its Committees and members to be an important aspect of corporate governance. The Board undertakes an annual evaluation of its own effectiveness and performance, and that of its Committees and individual Directors. Actions from the 2023 Board evaluation The 2023 evaluation, which was externally facilitated by an independent consultancy, Manchester Square Partners, concluded that the Board and its Committees were operating effectively and did not highlight any significant areas for improvement. The review demonstrated that the Board ensures good governance and oversight and provides important challenge and support, especially around key decisions. An open and participative boardroom culture exists which promotes effective challenge and debate. In addition, the Board Committees are well chaired and are operating effectively. The Board agreed that it should continue to focus on cybersecurity and the Board’s role in the event of a significant incident, future growth areas for the Company, and succession planning. As part of the 2024 evaluation, the Board members confirmed that these actions had been appropriately addressed during 2024 through regular reporting, presentations and deep dives provided by senior management. 2024 Evaluation process In 2024, the Board evaluation process was conducted internally, supported by the Company Secretary. Questionnaires were completed by all Directors to provide feedback and commentary on the following areas: § Board composition and effectiveness § The effectiveness of the Board’s oversight of strategy development, setting and monitoring RELX’s culture and values, financial performance, market developments, stakeholder relations (including the Board’s understanding and visibility of the views of RELX’s stakeholders and how these inform its decision-making process), talent and succession, reputation, inclusion and diversity, risk and governance § Quality of information provided by management § Boardroom culture and dynamics § The performance of the Chair § The structure, leadership and overall effectiveness of each ofthe Board’s Committees The Chair conducted individual performance reviews with each Non-Executive Director and the Senior Independent Director led the appraisal of the Chair’s performance by the other Directors. Chair’s Performance Directors commended the Chair for his leadership of the Board and for facilitating the effective contribution of each Non-Executive Director and for fostering constructive relationships and communications within the Board. Directors felt that a particular strength of the Chair is in enabling issues and questions to be raised and debated while maintaining a focus on appropriate discussion areas. Individual Director performance Individual Director performance and contributions were assessed through one-to-one meetings with the Chair. The evaluation facilitated reflection on personal development and discussion and feedback on Board matters. The evaluation found that each director continues to contribute positively and effectively to Board and Committee discussions, providing external insights and constructive challenge to management on matters of strategy and governance. Through the evaluation process it was also confirmed that each Non-Executive Director (with the exception of the Chair) remains independent. Each Director was also found to have sufficient time to devote to their role. Conclusions from the 2024 Board evaluation The internal evaluation found a high level of satisfaction collectively among the Directors with the way in which the Board and its Committees operate. There were no significant areas identified as requiring immediate attention. The Directors felt thatthe Board discharges its oversight responsibilities effectively across all categories and particularly in the areas of finance, performance, talent, people, inclusion and diversity, and risk. The Directors viewed the Board’s involvement in the development and approval of the Group’s strategic, financial and business objectives and in setting and maintaining culture across the Group and ensuring its alignment with RELX’s purpose, values and strategy, as appropriate. Directors had a clear understanding of the performance targets for the Company and were satisfied that the Board monitors this on a regular basis. Directors observed that the Board has a strong awareness of market developments and the Company’s performance relative to its competitors and agreed that this should remain a focus. Directors noted they were well-informed regarding RELX’s engagement with key stakeholders and its outcomes, and able to apply their understanding of stakeholder views in the Board’s decision making. Through continuous oversight, Directors felt they gained a deeper understanding of customers, key employee measures, and the continued progress that was made on talent management and on inclusion and diversity. Directors were satisfied that the Board was sufficiently engaged in overseeing key risks and in ensuring that appropriate risk management processes are in place. The Directors thought that the Board’s composition, including its diversity and collective skills, and its dynamics and culture of openness and debate, all contributed to highly effective meetings which were found to be well governed and chaired. In particular, Directors commented that meeting agendas focus on the most appropriate topics and that sufficient time is allowed for discussion of critical issues. Papers and presentations addressed the key issues in appropriate detail and were provided on a timely basis. The induction process for new Board members was commended, with particular value gleaned from the strategic deep dives, the product reviews and the meetings with business leaders. The outcome of the Board evaluation confirmed that the Board and its Committees continue to function effectively and collaboratively, with an appropriate level of engagement with management. While there were no specific areas identified in the review where significant improvement is required, continued focus on key issues with open and transparent dialogue continue to be recognised as key drivers of the Board’s effectiveness. Market segments Governance and shareholder information Financial statements Financial review Corporate responsibility Overview |
| 98 RELX Annual Report 2024 | Governance Audit, risk and internal control Internal control and risk management The Board has overall responsibility for overseeing RELX’s systems of risk management and internal control and for monitoring the processes for identifying, assessing and managing the principal and emerging risks faced by the Company. These systems are designed to manage and mitigate, rather than totally eliminate, risks to the business. Accordingly, they can provide reasonable, but not absolute, assurance against material misstatement or loss. These processes were in place throughout the year ended 31 December 2024, and up to the date of approval ofthe 2024 Annual Report. Further details of RELX’s risk management systems and the principal and emerging risks facing the Company, together with our mitigation strategies are set out on pages 74 to 78 of this Report. Risk management and control procedures are embedded into the operations of the business and include the monitoring of progress in areas for improvement that come to management andBoard attention. To provide reasonable assurance against material inaccuracies or loss, and of the effectiveness of the systems of internal control and risk management, RELX has adopted the three lines of defence assurance model as set out below. System of Internal Control 1st line of defence RELX business areas maintain systems of internal control which are appropriate to the nature and scale of their activities and address significant strategic, operational, financial, legal and compliance risks that they face 2nd line of defence Central functions that are responsible for 1) designing policies, 2) introducing and sharingbest practice, 3) monitoring and evaluating compliance with RELX policies and relevant legislation and regulation and appropriate remediation RELX Operating and Governance Principles 3rd line of defence Internal audit provides independent assurance on the effectiveness of the 1st and 2nd lines of defence The Board and Audit Committee Note: In addition to RELX’s internal controls, RELX is also audited externally. The report of the external auditor has been included from page 132. RELX operates authorisation and approval processes throughoutits operations. Access controls exist where processes have been automated to ensure the security of data. Management information systems have been developed to identify risks and enable the assessment of the effectiveness of internal control systems. With the close involvement of operating management and central functions, the risk management and control procedures aim to ensure that RELX is managing its business risks effectively and in a coordinated manner across the business areas with clarity on the respective responsibilities and interdependencies. Litigation, and other legal and regulatory matters, are managed by legal functions within the business areas. The Audit Committee has responsibility for monitoring RELX’s risk management and internal control procedures and reports to the Board, as appropriate. The Audit Committee receives periodic updates from RELX’s Chief Compliance Officer on alleged and substantiated violations of the Code of Ethics and Business Conduct, and related training, monitoring and communications programmes. Such updates covered the volume, type and circumstances surrounding substantiated violations, subsequent actions and lessons learnt. US certificates As required by Section 302 of the US Sarbanes-Oxley Act 2002 and by related rules issued by the US Securities and Exchange Commission (the Commission), the Chief Executive Officer and Chief Financial Officer of the Company certify in the 2024 Annual Report on Form 20-F to be filed with the Commission that they are responsible for establishing and maintaining disclosure controls and procedures and that they have: § designed such disclosure controls and procedures to ensure that material information relating to RELX is made known to them § evaluated the effectiveness of RELX’s disclosure controls and procedures § based on their evaluation, disclosed to the Audit Committee and the external auditors, all significant deficiencies in the design or operation of disclosure controls and procedures and any frauds, whether or not material, that involve management or other employees who have a significant role in RELX’s internal controls § presented in the 2024 Annual Report on Form 20-F their conclusions about the effectiveness of the disclosure controls and procedures § designed internal controls over financial reporting, or caused such internal control over financial reporting to be designed under their supervision, to provide reasonable assurance regarding the reliability of financial reporting A Disclosure Committee, comprising the Company Secretary and other senior managers, provides assurance to the Chief Executive Officer and Chief Financial Officer regarding their Section 302 certifications. Section 404 of the US Sarbanes-Oxley Act 2002 requires the ChiefExecutive Officer and Chief Financial Officer of the Company to certify in the 2024 Annual Report on Form 20-F that they are responsible for maintaining adequate internal control structures and procedures for financial reporting and to conduct an assessment of their effectiveness. The conclusions of the assessment of internal control structures and financial reporting procedures, which are unqualified, are presented in the 2024 Annual Report on Form 20-F. |
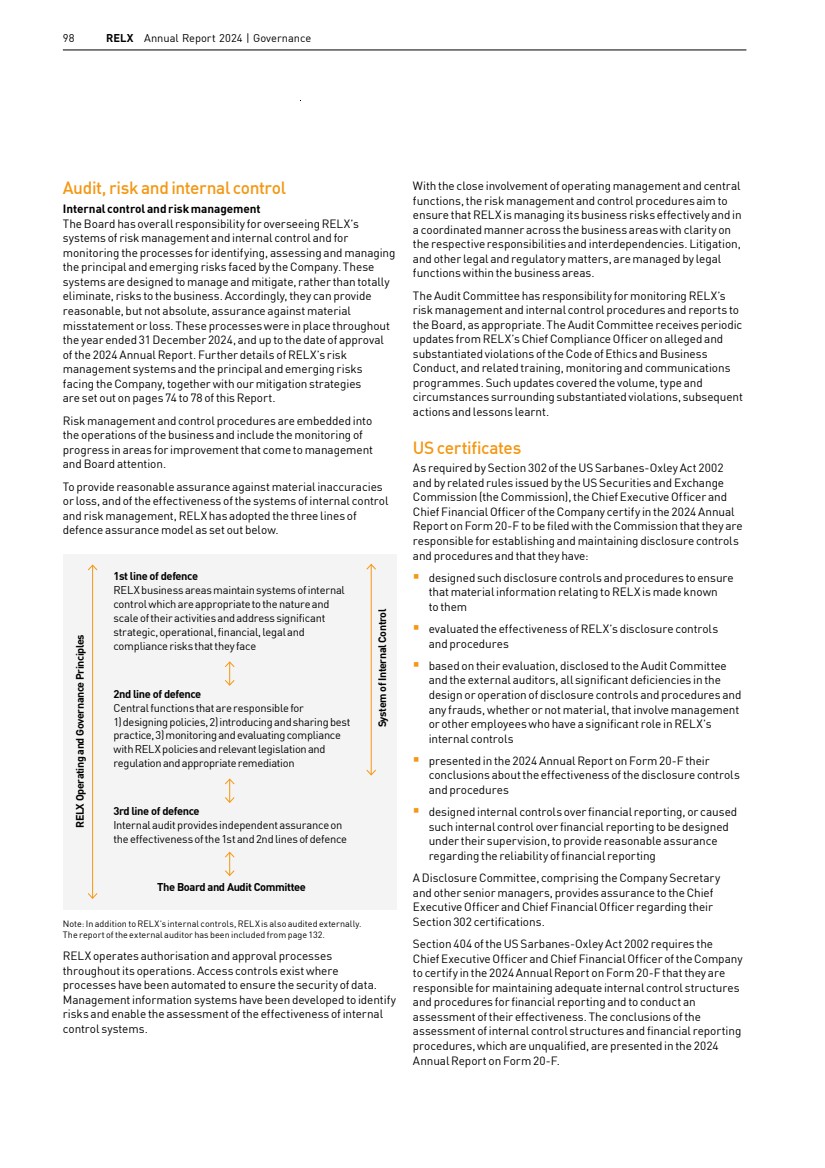
| 99 This report has been prepared by the Nominations Committee and has been approved by the Board. Membership The Nominations Committee comprises independent Non-Executive Directors (NEDs) and the Chair of the Board. The Directors who served on the Committee during the year were: § Paul Walker (Chair of the Committee) § Robert MacLeod § Marike van Lier Lels (until 25 April 2024) § Suzanne Wood Role of the Nominations Committee The role and responsibilities of the Nominations Committee are set out in written Terms of Reference which are available on the Company’s website at www.relx.com. The principal purpose of the Committee is to assist the Board by leading the process for appointments to Board roles and overseeing a diverse pipeline for succession. The Committee’s main responsibilities are: § Reviewing the size and composition of the Board, ensuring that it comprises the appropriate balance of skills, experience, knowledge and diversity § Reviewing the external commitments of the Directors to ensure that they each have sufficient time to effectively discharge their duties to RELX § Ensuring plans are in place for orderly Board and senior management succession and to oversee a diverse pipeline for such succession § Overseeing the recruitment of new Directors and recommending candidates to the Board § To make recommendations to the Board in relation to the re-appointment of any NED at the conclusion of his/her specified term of office and the election or re-election of Directors following a review of the performance of individual Directors from the Board evaluation process § Reviewing the Board and RELX Inclusion and Diversity Policies, to ensure they continue to be effective and fit for purpose § Making recommendations to the Board about the authorisation of Directors’ conflicts of interest, including any terms to be imposed in relation to a Director’s conflict of interest Activities of the Committee during the year The Committee met four times in 2024. The activities of the Committee during the year included: § Reviewing the size, composition and balance of the Board and the membership of its Committees § Succession planning for a new NED § Ongoing succession planning for Board and senior management roles § Monitoring the Directors’ actual and potential conflicts ofinterest § Recommending to the Board the suitability of Directors’ external director appointments § Recommending to the Board that each current Director be put forward for re-election at the Company’s AGM, other than Robert MacLeod, who, having served as a Director since 2016, will be retiring from the Board following the conclusion of the Company’s AGM to be held in April 2025 § Reviewing the Committee’s Terms of Reference and determining that they continue to be fit for purpose and effective § Recommending to the Board the inclusion of this report in the 2024 Annual Report Report of the Nominations Committee Board composition as at 31 December 2024 Balance of Executive/Non-Executive Directors Non-Executive: 7 Executive: 2 Non-Executive Chair: 1 Tenure of Non-Executive Directors (including Chair) 6–9 years: 2 0–3 years: 2 3–6 years: 4 Market segments Governance and shareholder information Financial statements Financial review Corporate responsibility Overview RELX Annual Report 2024 |
| 100 RELX Annual Report 2024 | Governance Board and Committee composition The Nominations Committee is responsible for keeping the size and composition of the Board and the membership ofitsCommittees under review, to ensure that each has an appropriate balance of skills, knowledge and experience to effectively discharge its respective duties. The Committee considers the competencies required both now and in the future to support the Company’s purpose, strategy, values and culture. The Committee also seeks to maintain a diverse pipeline for senior leadership succession. The Board collectively has a diverse range of relevant skills and experience which includes: § Strategy and governance § Expertise in finance and technology § Operational experience in RELX’s product markets § Executive and non-executive Board and leadership experience in large, international listed groups § Audit, risk and regulatory expertise § Workforce relations management and engagement § Executive remuneration Biographical information for each of the Directors is on pages 82 to 83. Further information about the skills and experience of the Directors standing for election and re-election at the 2025 AGM is in the Notice of Meeting available at www.relx.com. Inclusion and Diversity (I&D) RELX’s Board I&D Policy aims to promote a working environment that is respectful and inclusive of individuals and their contributions, regardless of gender, ethnic origin, disability, nationality, age, sexual orientation or any other individual characteristic. The Board recognises the benefits that diversity brings to the effectiveness of Board and Committee discussions and the quality of decision-making, through the incorporation of different perspectives and ideas. The Nominations Committee monitors the composition of the Board and membership of its Committees with a view to ensuring that each has the appropriate balance of skills and expertise. The Committee also oversees the Director recruitment process on behalf of the Board. Consistent with the recommendations of the FCA set out in LR6.6.6(R)(9), as at 31 December 2024: § the Board comprises 40% women § the role of Senior Independent Director is held by a woman § at least one Board member is from a minority ethnic background The Nominations Committee reviews and recommends to the Board both the Board and Group I&D Policies. The Group I&D Policy is aligned with the Board I&D Policy and aims to promote a positive working environment that is inclusive, fair and equitable. It prohibits discrimination and requires that RELX recruits, trains, develops, promotes, and provides conditions of employment without regard to race, colour, creed, religion, national origin, gender, gender identity or expression, sexual orientation, marital status, age, disability, or any other characteristic protected by law. RELX relies on the contributions of individuals with a collectively broad range of experience, skills and ideas to consistently deliver on its strategic priorities and provide real innovation for customers around the world. The Company is committed to an ongoing review of policies and practices in the areas of recruitment, talent development, promotion and reward to ensure that opportunities across our business areas are fair and equitable. During the year, RELX has continued to implement its inclusion strategy to advance progress towards its 2020 to 2025 inclusion goals. This covers all aspects of inclusion and aims to translate theGroup I&D Policy into tangible and measurable actions. Workforce policies and practices are regularly reviewed to ensure RELX is delivering on its inclusion goals and effectively monitoring available data. Nationalities on the Board British, American, Irish: 1 Swedish: 1 Dutch: 1 American: 3 British: 4 Board and Executive Management diversity characteristics as at 31 December 2024 Number of Board members Percentage of the Board No. of senior positions on the Board (CEO, CFO, SID, Chair) No. in executive management Percentage of executive management Ethnic background White 8 80% 3 7 70% Asian 1 10% – 1 10% Black – – – – – Mixed/multiple ethnicity – – – – – Other – – – 1 10% Not specified/prefer not to say 1 10% 1 1 10% Gender identity or sex Men 6 60% 3 7 70% Women 4 40% 1 3 30% Not specified/prefer not to say – – – – – |
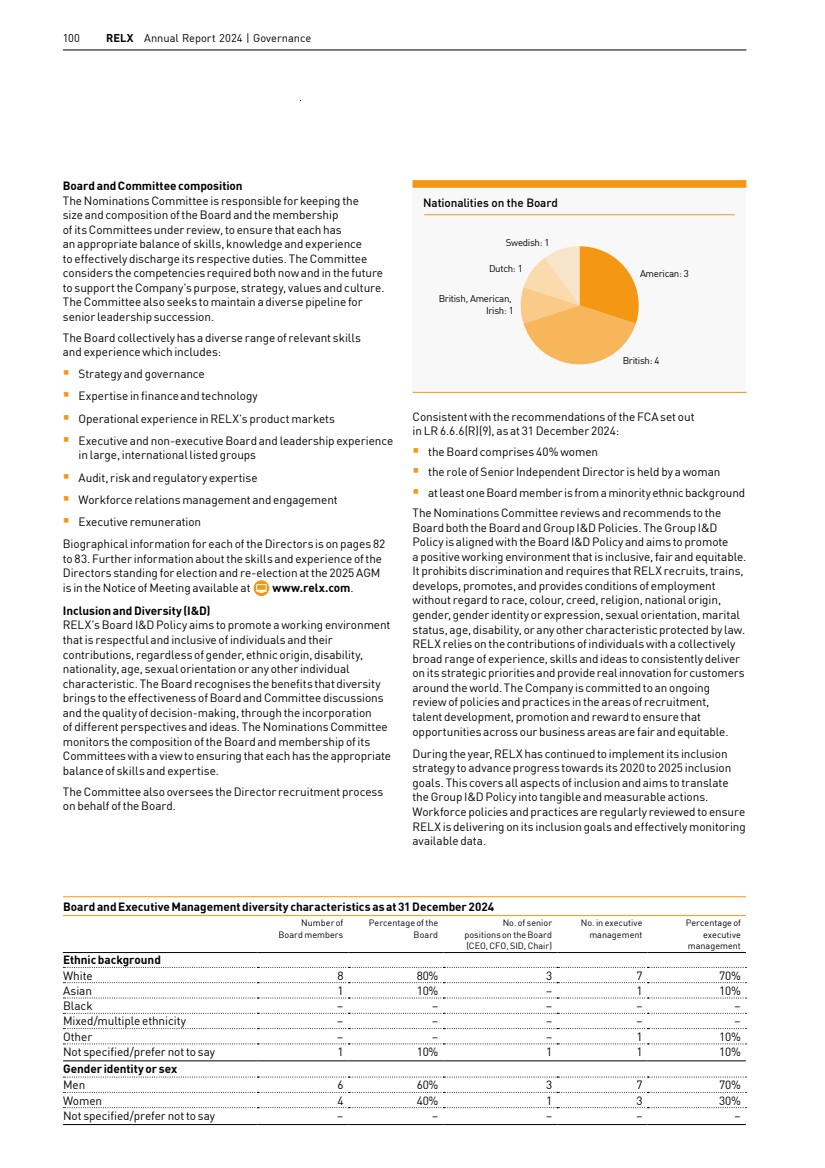
| 101 Across our business areas, we are committed to providing regular best practice and awareness training in areas such as inclusive leadership and unconscious bias and we promote and encourage inclusive networking groups and sponsorship and mentoring programmes. Details of the strategy and progress towards fulfilling our I&D initiatives is set out in our Corporate Responsibility Report on pages 50 to 52. Data for the diversity characteristics table on page 100 was drawn from HR information where consents are in place to use the data on an anonymised basis and through a survey with categories aligned to those set out in the LRs. Board and Committee succession When reviewing the composition of the Board and its Committees, the Nominations Committee considers, among other things, the length of tenure of each Director and the need for, and benefits of, membership being regularly refreshed. The Committee is cognisant of the skills and experience required for effective leadership and oversight of RELX’s strategy and success in the long term, as well as the Board I&D Policy and the UK Listing Rules I&D related recommendations. All appointments to the RELX Board, and each of its Committees, are based primarily on merit and the suitability of an individual for any given role. Board succession planning and refreshment was a regular agenda item at the Committee’s meetings during 2024. Director appointment process A rigorous search and selection process is followed for each new Director, starting with the preparation of a search specification, based on the Committee’s assessment of the skills, capabilities and experience required on the Board at the time. An executive search firm is engaged to support the search. A long-list of potentially suitable individuals is initially reviewed. From this, a short-list of potentially suitable individuals is considered in detail by the Committee and preferred candidates are invited to meet with Board members, including the Chair and Chief Executive Officer, together with the Chief Legal Officer and Company Secretary. Following feedback from these sessions, the Nominations Committee makes its recommendations to the Board. The Board then has a further opportunity to review and discuss the recommendations, and subsequently approves the proposed appointment. The Board may appoint Directors (subject to a maximum upper limit) to fill a vacancy at any time, although any Director so appointed shall only hold office until the following AGM of the Company, at which his or her election shall be voted upon by shareholders. Directors are then required to seek re-election by shareholders at each subsequent AGM of the Company. As a general rule, letters of appointment for NEDs provide that, subject to annual re-election by shareholders, individuals will serve for an initial period of three years, and are typically expected to be available to serve for a second three-year period. If invited to do so, they may also serve for a third three-year period. The notice period applicable to the NEDs is one month. RELX’s Non-Executive Letter of Appointment sets out the time commitment required by the Company from its Non-Executive Directors. Executive and management succession The Board is committed to recognising and nurturing talent across RELX and overseeing the development of a strong talent pipeline to senior leadership and executive roles. The Committee received detailed updates during the year from the Chief Executive Officer regarding succession plans for senior management roles. The Committee is satisfied that appropriate succession planning arrangements were in place during the year to facilitate appropriate and effective succession across senior management roles, supported by a strong pipeline of candidates. Conflicts of interest The Directors have a statutory duty to avoid situations in which they have, or could have, a direct or indirect interest that conflicts with the interests of the Company and, if potential for such a conflict arises, must make such situations known to the Board. In accordance with its terms of reference, the Nominations Committee considers the circumstances of any such actual or potential conflicts of interest and makes a recommendation to the Board as to whether to authorise the conflict, as permitted under the Company’s Articles. The Committee may recommend that the Board imposes certain limits or conditions in respect of the conflict. There is a procedure in place for Directors to disclose any potential conflict to the Board and each Director is required to review and confirm their actual and potential conflicts annually. During the year, the Committee conducted a formal review of the conflict of interest authorisations granted by the Board to each individual Director. Committee evaluation The evaluation of the Committee determined that it was well governed and effective in carrying out its role in accordance with its Terms of Reference. Details of the Board and Committee evaluation process are on page 97. Market segments Governance and shareholder information Financial statements Financial review Corporate responsibility Overview RELX Annual Report 2024 | Report of the Nominations Committee |
| 102 RELX Annual Report 2024 | Governance Directors’ Remuneration Report The Directors’ Remuneration Report has been prepared by the Remuneration Committee (the Committee) in accordance with theUKCorporate Governance Code, the UK Listing Rules and Schedule 8 of the Large and Medium-sized Companies and Groups (Accounts and Reports) Regulations 2008, as amended (the UK Regulations). The Report was approved by the Board. I am pleased to present the Remuneration Report for the year ended 31 December 2024. As you will have seen earlier in the annual report, the Company delivered strong revenue and profit growth in 2024, driven by the ongoing shift in business mix towards higher growth analytics and decision tools that deliver enhanced value to our customers across market segments. We develop and deploy these tools across the company by leveraging deep customer understanding to combine leading content and data sets with powerful artificial intelligence and other technologies. This has been a key driver of the evolution of our business for well over a decade, and will remain a key driver of customer value and growth in our business for many years to come. Underlying revenue growth was 7%, underlying adjusted operating profit growth was 10% and at constant currency, adjusted EPSgrowth was 9%. We are proposing an increase in the full-year dividend of 7%. Our Total Shareholder Return outperformed the FTSE100 over the last three, five and ten year periods as shown on page 112. The purpose of RELX is to benefit society by developing products that help researchers advance scientific knowledge; doctors and nurses improve the lives of patients; lawyers promote the rule of law and achieve justice and fair results for their clients; businesses and governments prevent fraud; consumers access financial services and get fair prices on insurance; and customers learn about markets and complete transactions. Our purpose guides our actions beyond the products that we develop. It defines us as a company. Every day across RELX our employees are inspired to undertake initiatives that make unique contributions to society and the communities in which we operate. We see what we do as a company as being an integral part of our commitment to corporate responsibility. We have set sustainability objectives which reflect our focus on our unique contributions to society. New environment targets were set for 2030 (see page 61) and we are continuing to reduce our environmental impact to meet these targets. Our performance was again recognised by external rating agencies: RELX has an AAA Corporate Responsibility rating with MSCI which it has held for nine consecutive years and was ranked second in our sector by Sustainalytics, and was included in the S&P Global Sustainability Yearbook. More information can be found on pages 35 to 65. Remuneration policy and implementation The current policy was approved by shareholders at the 20 April 2023 Annual General Meeting (AGM) and is set out on pages 116 to 122 ofthis report. The first awards under the policy were granted in the first quarter of 2024. The level of vesting for threshold performance in the LTIP was reduced from 25% of the maximum opportunity to 20% and incentives are subject to broader malus and clawback provisions. Shareholders will be invited to vote (by way of an advisory vote) on the 2024 Annual Remuneration Report at the 2025 AGM. Our strategic priority is the organic development of increasingly sophisticated information-based analytics and decision tools that deliver enhanced value to professional and business customers. We supplement this organic growth with selective acquisitions of targeted data sets and analytics. When combined with our strategy of driving continuous process innovation to manage cost growth below revenue growth, the result is continued strong earnings growth with improving returns. The performance measures in the incentive plans align with the strategy and the financial key performance indicators on page 6 of the annual report, by focusing on sustained earnings growth, return on invested capital and shareholder returns in the LTIP. The AIP is based on revenue, profit, cash flow and sustainability metrics and focuses on annual objectives and milestones and creates a platform for sustainable future performance. The performance measures are based on adjusted figures as they provide relevant information in assessing the Company’s performance, position and cash flows and we believe they track the core operational performance of RELX and how it contributes to shareholder value creation. The Annual Report includes a reconciliation of adjusted measures to IFRS measures. |
| RELX Annual Report 2024 | Directors’ Remuneration Report 103 2024 outcomes RELX delivered strong organic revenue and adjusted operating profit growth rates. These results drove an AIP payout of 80% of the maximum. Details of our targets and achievements for the year are shown on pages 105 and 106. Financial and share price performance was very strong over the past three years, with TSR outperforming our UK, US and European peer groups. As a result, the LTIP payout is 97% of the maximum. Details of our targets and achievements are shown on page 107. In determining the level of payout under the annual and the multi-year incentives, the Committee took into account RELX’s overall business performance and value created for shareholders and other relevant factors and determined that the outcomes were fair and appropriate and applied no discretion to the payouts. Broader employee considerations The Board reviews information on employee metrics and updates on employee related matters, as well as outcomes of employee surveys conducted during the year. Marike van Lier Lels stepped down from the Board at the 2024 AGM and our new designated Non-Executive Director responsible for workforce engagement, Bianca Tetteroo, met with employee groups during 2024 and reported back to the Board. Further information on the workforce engagement process is provided in the Governance section on page 94. The Committee also reviews annual salary increase guidelines globally. When determining the remuneration for Executive Directors and Senior Executives, the Committee considers business and individual performance as well as other factors including broader employee reward. The Committee is satisfied that the overall remuneration for Executive Directors is appropriate and fair having considered external and internal relativities. The Committee is satisfied that the incentive schemes drive the desired behaviours to support the Company’s purpose, values and strategy. Implementation of the Remuneration Policy in 2025 The Committee has approved 2025 salary increases for the Executive Directors of 2.5%. Further details regarding the implementation of the policy in 2025 can be found on page 114. This will be my last Directors’ Remuneration Report as I will be stepping down from the Board after the AGM. I will be succeeded byAlistair Cox who has served on the Committee for two years. It has been a great pleasure to work alongside my fellow committee members, and to serve as a member and then Chair of the Committee. Robert MacLeod Chair, Remuneration Committee Market segments Governance and shareholder information Financial statements Financial review Corporate responsibility Overview |

| 104 RELX Annual Report 2024 | Governance Annual Remuneration Report Single Total Figure of Remuneration – Executive Directors Annual incentive Share based awards(3) Pension(4) GBP’000 Salary Benefits Total (1) Cash Deferred Shares(2) Total fixed remuneration(5) Total variable remuneration(5) Erik Engstrom 2024 1,413 94 1,125 1,125 9,607 155 13,521 1,663 11,858 2023 1,379 82 1,198 1,198 10,980 152 14,989 1,613 13,377 Nick Luff 2024 832 15 663 663 4,715 92 6,979 939 6,040 2023 812 15 706 706 5,388 89 7,715 916 6,800 (1) Benefits are typically comprised of a car allowance, private medical/dental insurance and the cost of tax return preparation. (2) 50% of the AIP is paid in shares deferred for three years. Dividend equivalents accrue on these shares. (3) The 2024 figures reflect the vesting of the 2022–2024 cycle of the LTIP. As the LTIP vests after the approval date of this Report, the average share price for the last quarter of 2024 has been used to arrive at an estimated figure in respect of these awards, in line with the methodology prescribed by the UK Regulations. The estimated figures for 2023 disclosed in last year’s Report have been restated to reflect the actual amount of the 2021-2023 cycle of the LTIP vested and the actual share price, which increased the 2023 disclosed figure by £1.4m for theCEO and by £0.7m for the CFO. The vesting percentage was determined on 16 February 2024 and was in line with the one disclosed on page 133 of the 2023 Remuneration Report. For Erik Engstrom, the amount that directly reflects share price appreciation is £4.7m for 2023 and £3.5m for 2024. For Nick Luff, these numbers are £2.3m for 2023 and £1.7m for 2024. The awards are due to vest in February 2025 and the 2024 figures will be restated in next year’s report to reflect actual values at vesting. (4) Erik Engstrom and Nick Luff received cash in lieu of pension of 11% of base salary. (5) Total fixed remuneration includes base salary, benefits and pension. Total variable remuneration includes annual incentive and share based awards. Some figures and subtotals add up to different amounts than the totals due to rounding. The total remuneration for Directors is set out in note 25 to the consolidated financial statements. The AIP and LTIP performance measures and targets are shown on the following pages. |
| RELX Annual Report 2024 | Directors’ Remuneration Report 105 2024 Annual Incentive Set out below is a summary of performance against each financial and non-financial measure and the resulting payout for 2024: Performance measure Relative weighting % at target Financial targets (1) Achievement Achievement % vs target Payout % vs target Payout % of max (2) Threshold Target Maximum Revenue 30% 8,868 9,434 9,906 9,434 100.0% 100.0% 66.7% Adjusted net profit after tax 30% 2,061 2,193 2,302 2,241 102.2% 122.0% 81.3% Cash flow 30% 2,806 2,985 3,134 3,101 103.9% 139.0% 92.7% Financial measures 90% 120.3% 80.2% Non-financial measures 10% A detailed description of the non-financial measures and achievement against those is set out on the next page. 97.5% 65.0% Total 100% 118.0% 79.7% (1) Targets are set on an underlying basis for revenue and on a constant currency basis for adjusted net profit, and reflect targeted growth, with cash flow based on the targeted cash conversion. Target amounts presented in sterling reflect actual movements in exchange rates relative to their equivalent constant currency amounts. (2) The maximum for each measure is 150% of on target. The overall maximum is 200% of salary. As highlighted earlier, underlying revenue growth was 7%. Underlying adjusted operating profit growth was 10 % and at constant currency, adjusted EPS growth was 9%. Some figures add up to different amounts than the totals due to rounding. 50% of the AIP will be paid in cash in Q1 2025 and the remainder is paid in Deferred Shares which will be released in Q1 2028. The release of Deferred Shares is not subject to any further performance conditions but is subject to malus and clawback. Market segments Governance and shareholder information Financial statements Financial review Corporate responsibility Overview |
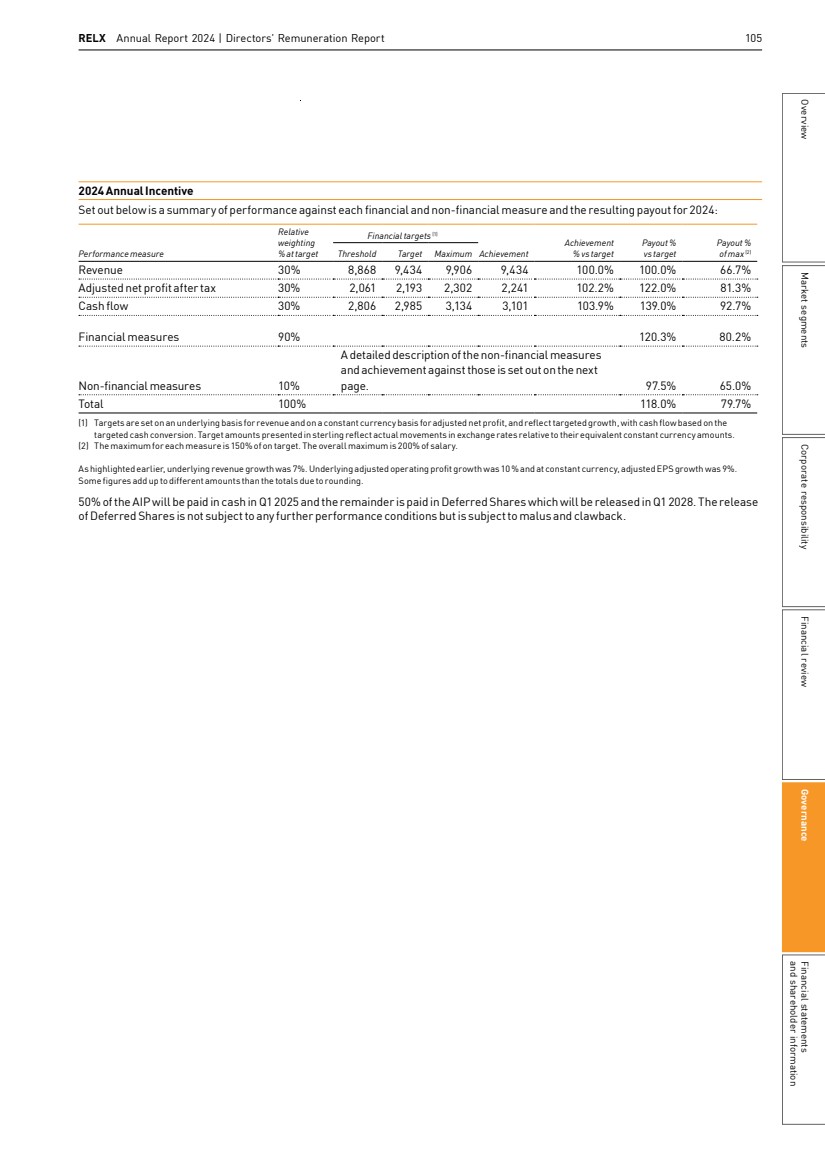
| 106 RELX Annual Report 2024 | Governance Non-financial measures Non-financial measures represent 10% of the AIP. Of this component, achievements and payouts are outlined below. The targets for 2024 were focused on sustainability metrics and are consistent with our glidepath to achieving the 2030 targets. Payout for carbon reduction and for paper usage and waste was capped at 95% of target in the year in recognition of the changes in office work patterns and business travel. More information can be found on pages 60 to 73. Non-financial measures Relative weighting Target Achievement Payout % of target Payout % of max Carbon reduction 25% § Reduce Scope 1 (direct) and Scope 2 (location-based) carbon emissions by 28% against a 2018baseline. § Reduce energy and fuel consumption by 24% against a 2018baseline. § Carbon emissions reduced by 61%. § Energy and fuel consumption reduced by 53%. 95% 63.3% Paper usage and waste 25% § Decrease total waste sent to landfill from reporting locations by 40% against a 2018 baseline. § 100% of RELX production papers, graded in PREPS, to be rated as ‘known and responsible sources’ or certified FSC or PEFC. § Total waste sent to landfill reduced by 95%. § 100% of RELX production papers graded in PREPS, rated as ‘known and responsible sources’ or certified FSC or PEFC. 95% 63.3% Socially responsible suppliers 25% § Increase the number of suppliers as Code signatories to 5,500. § Increase the number of independent external audits of suppliers to 125. § Suppliers Code signatories increased to 6,056. § 137 audits of suppliers completed. 100% 66.7% Universal access to information 25% § Increase the content on the free RELX SDG Resource Centre by 500 new content items. § Increase the number of users of SDG Resource centre by 15% over 2023. § Content on the free RELX SDG Resource Centres increased by 973. § Number of users of SDG Resource centre increased by 38%. 100% 66.7% Total 100% 97.5% 65.0% |
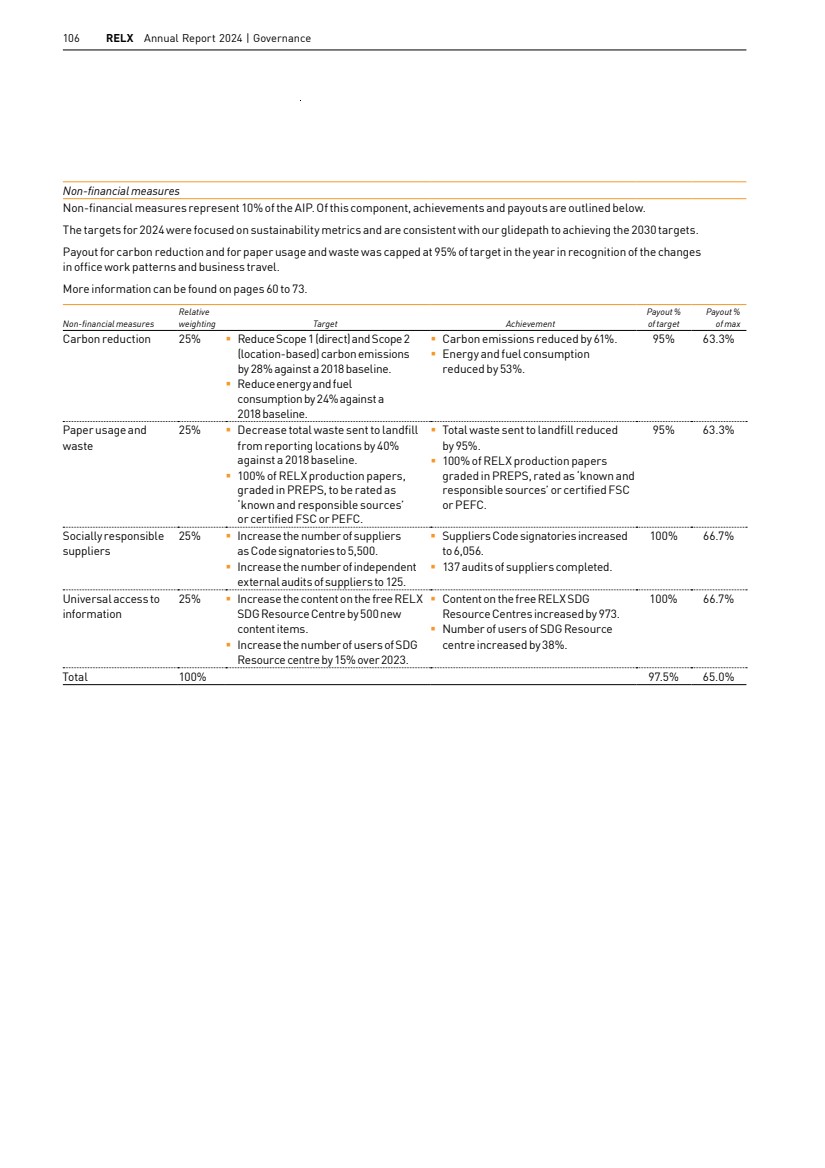
| RELX Annual Report 2024 | Directors’ Remuneration Report 107 2022–2024 LTIP Set out below is a summary of performance against each measure of the LTIP cycle 1 January 2022–31 December 2024. The targets remained unchanged from when these were set at the beginning of 2022. As noted in the Chair letter, financial performance was very strong and significant value was generated for shareholders through share price appreciation and dividends over the performance period. RELX’s TSR outperformed the UK, US and European peer groups over the period. The payout is 97% of maximum. Performance measure Weighting Performance range and vesting levels set at grant (1) Achievement against the performance range Resulting vesting percentage TSR over the three-year performance period 20% below median median upper quartile 0% 25% 100% UK group: upper quartile; European group: upper quartile; US group: upper quartile 100% Average growth in adjusted EPS over the three-year performance period (2) 40% below 5% p.a. 5% p.a. 6% p.a. 7% p.a. 8% p.a. 9% p.a. 10% p.a. 11% p.a. and above 0% 25% 50% 65% 75% 85% 92.5% 100% 10% 92.5% ROIC in the third year of the performance period (2) 40% below 11.0% 11.0% 11.5% 12.0% 12.5% 13.0% 13.5% 14.0% and above 0% 25% 50% 65% 75% 85% 92.5% 100% Above 14% 100% Total vesting percentage: 97.0% (1) Calculated on a straight-line basis for performance between the points. (2) Growth in adjusted EPS at constant currency and ROIC are calculated as set out in the Chief Financial Officer’s report and note 10 to the consolidated financial statements, with adjustments made to remove the effect on ROIC of changes in exchange rates, pension deficits and accounting standards over the three-year performance period. The performance measures used in incentive plans are based on adjusted figures as they provide relevant information in assessing the Company’s performance, position and cash flows and we believe they track the core operational performance of RELX and how it contributes to shareholder value creation. The Annual Report includes a reconciliation of adjusted measures to IFRS measures. Market segments Governance and shareholder information Financial statements Financial review Corporate responsibility Overview |
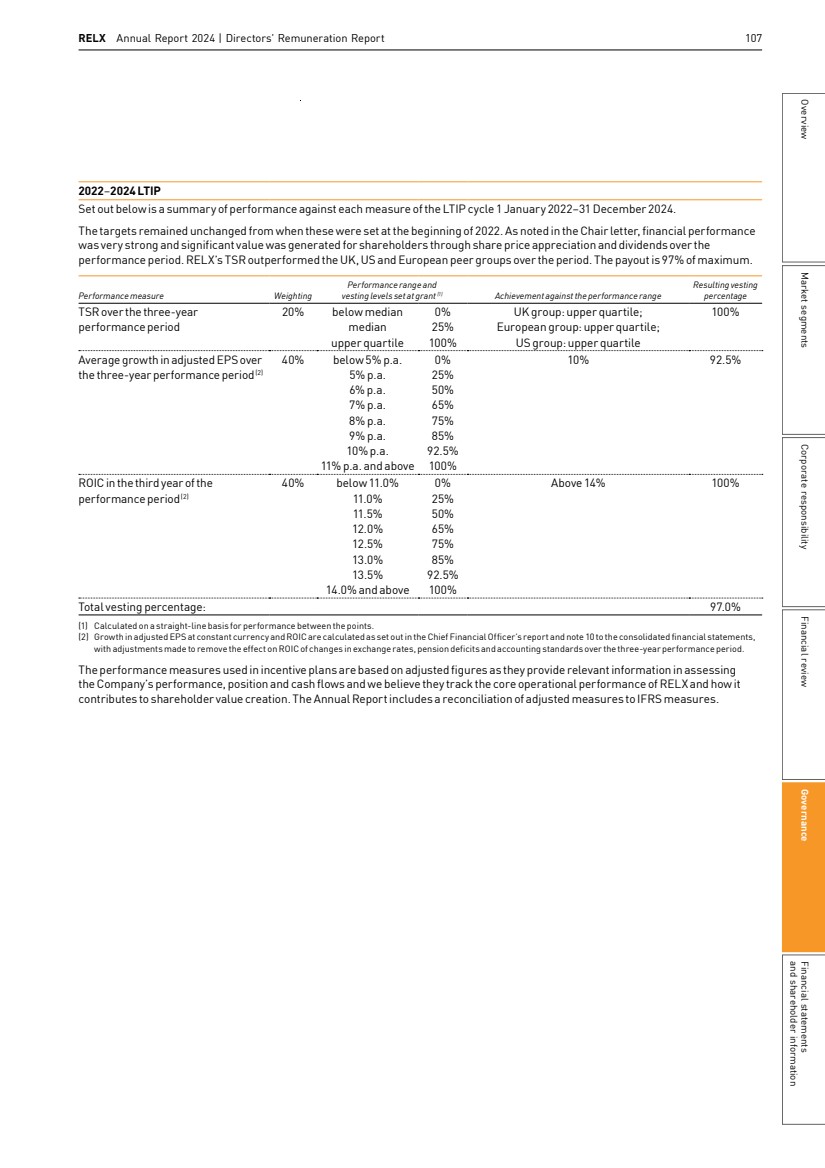
| 108 RELX Annual Report 2024 | Governance Single Total Figure of Remuneration – Non-Executive Directors Total fee Benefits(1) Total GBP 2023 2024 2023 2024 2023 2024 Paul Walker 650,000 725,000 879 1,017 650,879 726,017 Alistair Cox (2) 88,776 152,000 88,776 152,000 June Felix 125,000 161,000 125,000 161,000 Charlotte Hogg 112,000 127,000 112,000 127,000 Marike van Lier Lels 122,000 44,599 840 840 122,840 45,439 Robert MacLeod (3) 130,670 157,000 130,670 157,000 Andrew Sukawaty 121,000 140,500 121,000 140,500 Bianca Tetteroo(4) N/A 61,250 N/A 61,250 Suzanne Wood (5) 165,744 210,500 165,744 210,500 (1) Benefits comprise the notional benefit of tax filing support provided to Non-Executive Directors for filings outside their home country resulting from their directorships with RELX. The incremental assessable benefit charge per tax return for 2024 was £840 (unchanged from 2023) for a UK tax return. Paul Walker’s benefits relate to private medical insurance. Further, the Company meets all reasonable travel, subsistence, accommodation and other expenses, including any tax where such expenses are deemed taxable, incurred by the Non-Executive Directors and the Chair in the course of performing their duties. (2) Appointed to the Board at the AGM on 20 April 2023. (3) Appointed Chair of the Remuneration Committee from the AGM on 20 April 2023. (4) Appointed to the Board on 1 July 2024. (5) Appointed Senior Independent Director and became a member of the Nomination Committee from the AGM on 20 April 2023. The total remuneration for Directors is set out in note 25 to the consolidated financial statements. Non-Executive Directors’ fees The fees in the Single Total Figure table for Non-Executive Directors reflect the following fees in 2024: GBP Annual fee 2024 Annual fee 2025 Chair 725,000 725,000 Non-Executive Directors 97,500 97,500 Senior Independent Director 40,000 40,000 Chair of: – Audit Committee 40,000 40,000 – Remuneration Committee 40,000 40,000 Workforce engagement fee 25,000 25,000 Committee membership fee: – Audit Committee 25,000 25,000 – Remuneration Committee 25,000 25,000 – Nominations Committee 15,000 15,000 In addition, an intercontinental travel fee of £4,500 was payable to any Non-Executive Director (excluding the Chair) in respect of each transatlantic journey made in order to attend a RELX Board or Committee meeting during 2024. Fees may be reviewed annually, although in practice they have changed on a less frequent basis. |
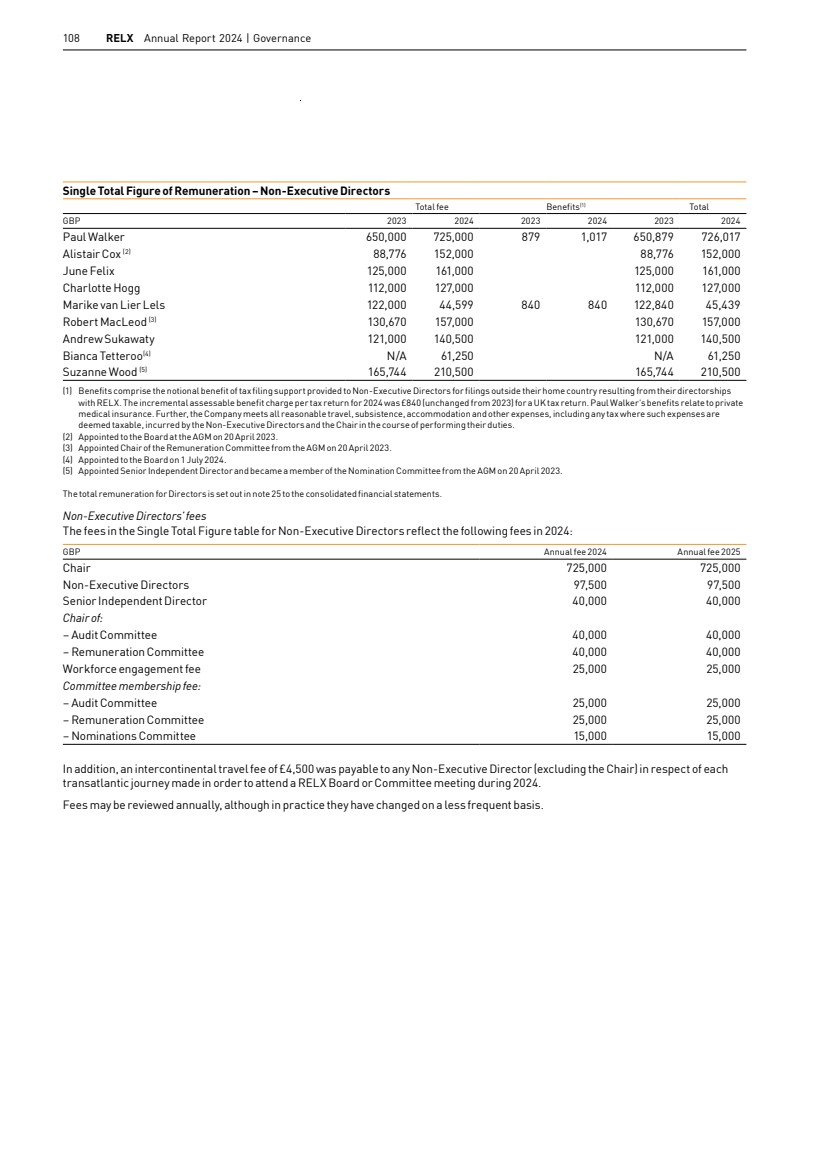
| RELX Annual Report 2024 | Directors’ Remuneration Report 109 Statement of Directors’ shareholdings and other share interests Shareholding requirement The Committee believes that a closer alignment of interests can be created between senior management and shareholders if executives build and maintain a significant personal stake in RELX. The shareholding requirements applicable to the Executive Directors are set out in the table below. Shares that count for this purpose are (i) any type of RELX security of which the Director, their spouse, civil partner or dependent child has beneficial ownership of and (ii) AIP deferred shares which are within their three-year deferral period, on a notional net (after tax) basis. There has been no change to the interests reported below between 31 December 2024 and the date ofthisReport. Meeting the shareholding requirement is both a vesting condition for LTIP awards granted and a requirement to maintain eligibility for future LTIP awards. On termination of employment, Executive Directors are to maintain their full shareholding requirement (or, if lower, their actual level of shareholding at the time of leaving) for two years after leaving employment. On 31 December 2024, the Executive Directors’ shareholdings were as follows: Shareholding requirement (% of 2024 annual base salary) Shareholding as at 31 December 2024 (% of 2024 annual base salary) (1) Erik Engstrom 450% 3185% Nick Luff 300% 1419% (1) Includes AIP deferred shares which are within their three-year deferral period, on a notional net (after tax) basis (66,882 for Erik Engstrom and 39,384 for Nick Luff). For disclosure purposes, any PLC ADRs held are included as ordinary shares. Share interests (number of RELX ordinary shares held) 1 January 2024 31 December 2024 Erik Engstrom 1,174,668 1,175,520 Nick Luff 280,365 286,267 Paul Walker 16,000 16,000 Alistair Cox 1,540 3,170 June Felix 6,100 7,500 Charlotte Hogg 4,750 4,750 Marike van Lier Lels (2) 11,718 N/A Robert MacLeod 6,950 6,950 Andrew Sukawaty 30,000 30,000 Bianca Tetteroo (3) N/A 0 Suzanne Wood 5,100 5,100 (1) Number excludes AIP deferred shares which are within their three-year deferral period. If these were included on a notional net (after tax) basis, the totals at 31 December 2024 would be 1,242,402 for Erik Engstrom and 325,651 for Nick Luff. (2) Retired from the Board at the AGM on 25 April 2024. (3) Appointed to the Board on 1 July 2024. Scheme interests awarded during the financial year LTIP – PERFORMANCE SHARE AWARDS Basis on which award is made Face value of award at grant(1) Percentage of maximum vesting for threshold performance End of performance period Erik Engstrom 450% of salary £6,203,275 If each measure pays out at threshold, the overall payout is 20% 31 December 2026 Nick Luff 375% of salary £3,044,076 AIP – DEFERRED SHARES Erik Engstrom 1/2 of 2023 AIP payout £1,198,457 N/A. The release of AIP deferred shares in Q1 2027 is not subject to any Nick Luff 1/2 of 2023 AIP payout £705,745 further performance conditions, but is subject to malus and clawback. (1) The face value of the LTIP awards and AIP deferred shares granted in February 2024 was calculated using the middle market quotation of a PLC ordinary share (£34.02). This share price was used to determine the number of awards granted. The LTIP awards granted in 2024 are based on ROIC, EPS and TSR weighted 40%:40%:20% respectively and assessed independently. The targets and vesting scales applicable to these awards are set out on page 140 of the 2023 Remuneration Report. Market segments Governance and shareholder information Financial statements Financial review Corporate responsibility Overview |
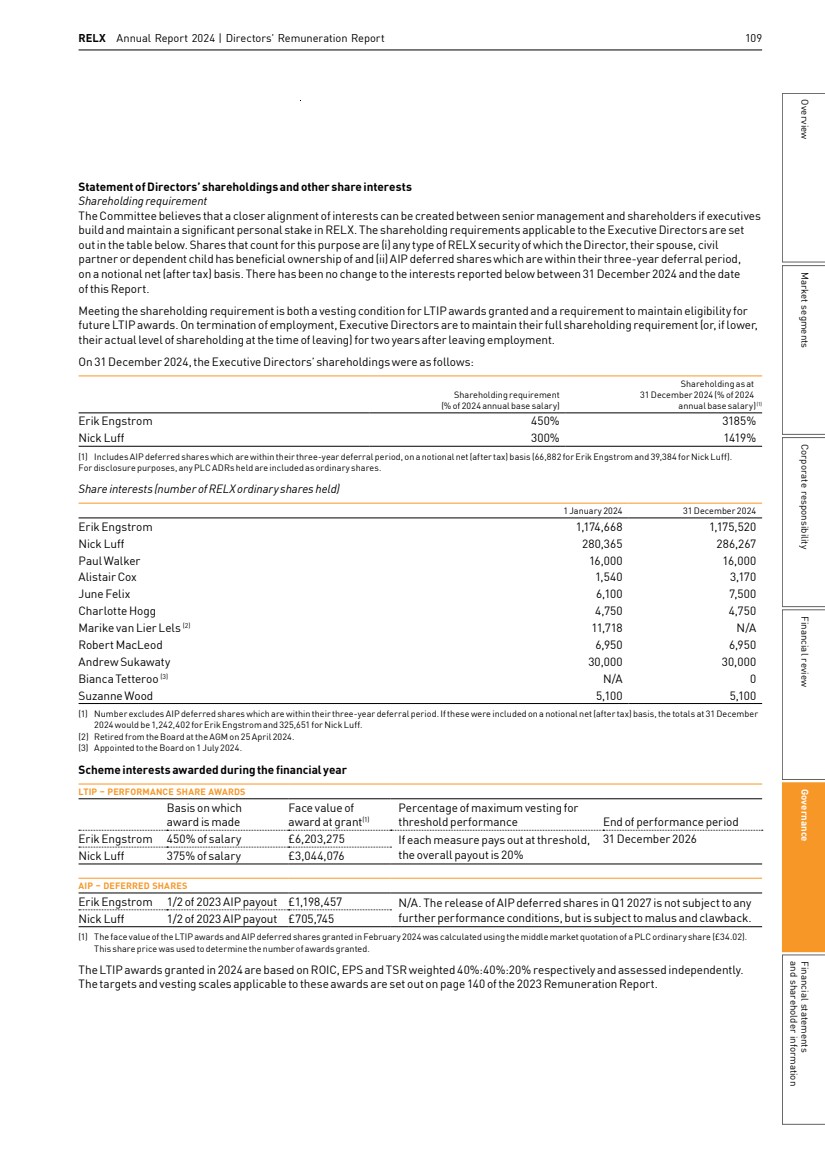
| 110 RELX Annual Report 2024 | Governance Multi-year incentive interests The tables below and on the next page set out unvested LTIP share awards, AIP deferred shares and vested but unexercised options held by the Executive Directors, including details of awards granted, vested and options exercised during the year. All outstanding LTIP share awards are subject to performance conditions. Between 31 December 2024 and the date of this Report, there have been no changes in the share awards or options held by the ExecutiveDirectors. Erik Engstrom LTIP SHARES Year of grant No. of unvested shares held on 1 Jan 2024 No. of shares awarded during 2024 Market price per share at award No. of shares vested during 2024 Market price per share at vesting No. of unvested shares held on 31 Dec 2024 End of performance period Date of vesting 2024 182,342 £34.020 182,342 Dec 2026 Feb 2027 2023 242,857 £24.920 242,857 Dec 2025 Feb 2026 2022 259,819 £22.725 259,819 Dec 2024 Feb 2025 2021 308,702 £18.660 308,702 £34.020 Total 811,378 182,342 308,702 685,018 DEFERRED SHARES(1) Year of grant No. of shares held on 1 Jan 2024 No. of shares awarded during 2024 Market price per share at award No. of shares released during 2024 Market price per share at release No. of shares held on 31 Dec 2024 Date of release 2024 35,228 £34.020 35,228 Feb 2027 2023 41,054 £24.920 41,054 Feb 2026 2022 49,912 £22.725 49,912 Feb 2025 2021 29,498 £18.660 29,498 £34.020 Total 120,464 35,228 29,498 126,194 (1) Part of the AIP is paid in deferred shares released after three years. The amount at grant was already included in the AIP in the single figure table of the relevant year. OPTIONS Year of grant No. of options held on 1 Jan 2024 No. of options granted during 2024 Option price on date of grant No. of options exercised during 2024 Market price per share at exercise No. of options held on 31 Dec 2024 Options exercisable until 2017 85,356 £14.945 85,356 27 Feb 27 90,116 €16.723 90,116 27 Feb 27 2016 101,421 £12.550 101,421 £33.491 107,380 €15.285 107,380 €39.295 2015 114,584 £11.520 114,584 £33.491 120,886 €15.003 120,886 €39.295 Total 619,743 444,271 175,472 |
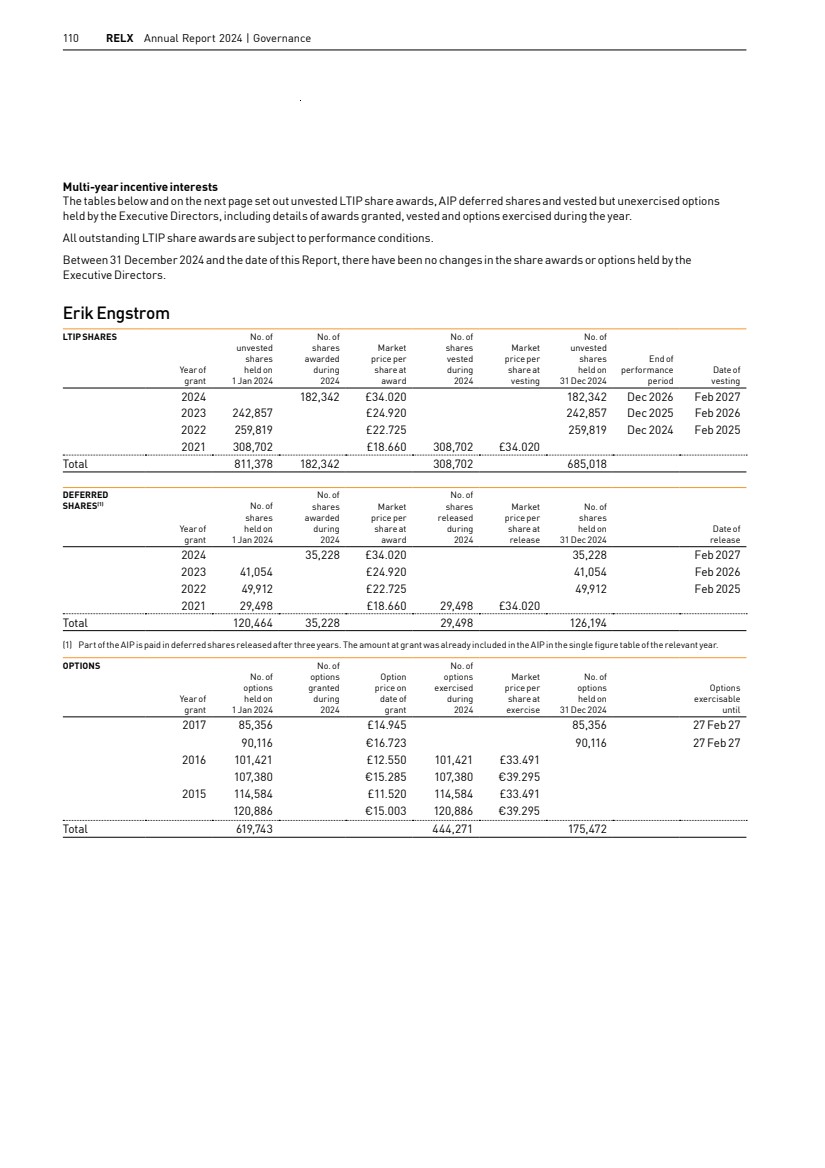
| RELX Annual Report 2024 | Directors’ Remuneration Report 111 Nick Luff LTIP SHARES Year of grant No. of unvested shares held on 1 Jan 2024 No. of shares awarded during 2024 Market price per share at award No. of shares vested during 2024 Market price per share at vesting No. of unvested shares held on 31 Dec 2024 End of performance period Date of vesting 2024 89,479 £34.020 89,479 Dec 2026 Feb 2027 2023 119,175 £24.920 119,175 Dec 2025 Feb 2026 2022 127,499 £22.725 127,499 Dec 2024 Feb 2025 2021 151,487 £18.660 151,487 £34.020 Total 398,161 89,479 151,487 336,153 DEFERRED SHARES(1) Year of grant No. of shares held on 1 Jan 2024 No. of shares awarded during 2024 Market price per share at award No. of shares released during 2024 Market price per share at release No. of shares held on 31 Dec 2024 Date of release 2024 20,745 £34.020 20,745 Feb 2027 2023 24,175 £24.920 24,175 Feb 2026 2022 29,391 £22.725 29,391 Feb 2025 2021 17,370 £18.660 17,370 £34.020 Total 70,936 20,745 17,370 74,311 (1) Part of the AIP is paid in deferred shares released after three years. The amount at grant was already included in the AIP in the single figure table of the relevant year. OPTIONS Year of grant No. of options held on 1 Jan 2024 No. of options granted during 2024 Option price on date of grant No. of options exercised during 2024 Market price per share at exercise No. of options held on 31 Dec 2024 Options exercisable until 2017 40,210 £14.945 40,210 27 Feb 27 42,452 €16.723 42,452 27 Feb 27 2016 47,778 £12.550 47,778 15 Mar 26 50,586 €15.285 50,586 15 Mar 26 2015 53,979 £11.520 53,979 £33.750 56,948 €15.003 56,948 €39.372 Total 291,953 110,927 181,026 Market segments Governance and shareholder information Financial statements Financial review Corporate responsibility Overview |
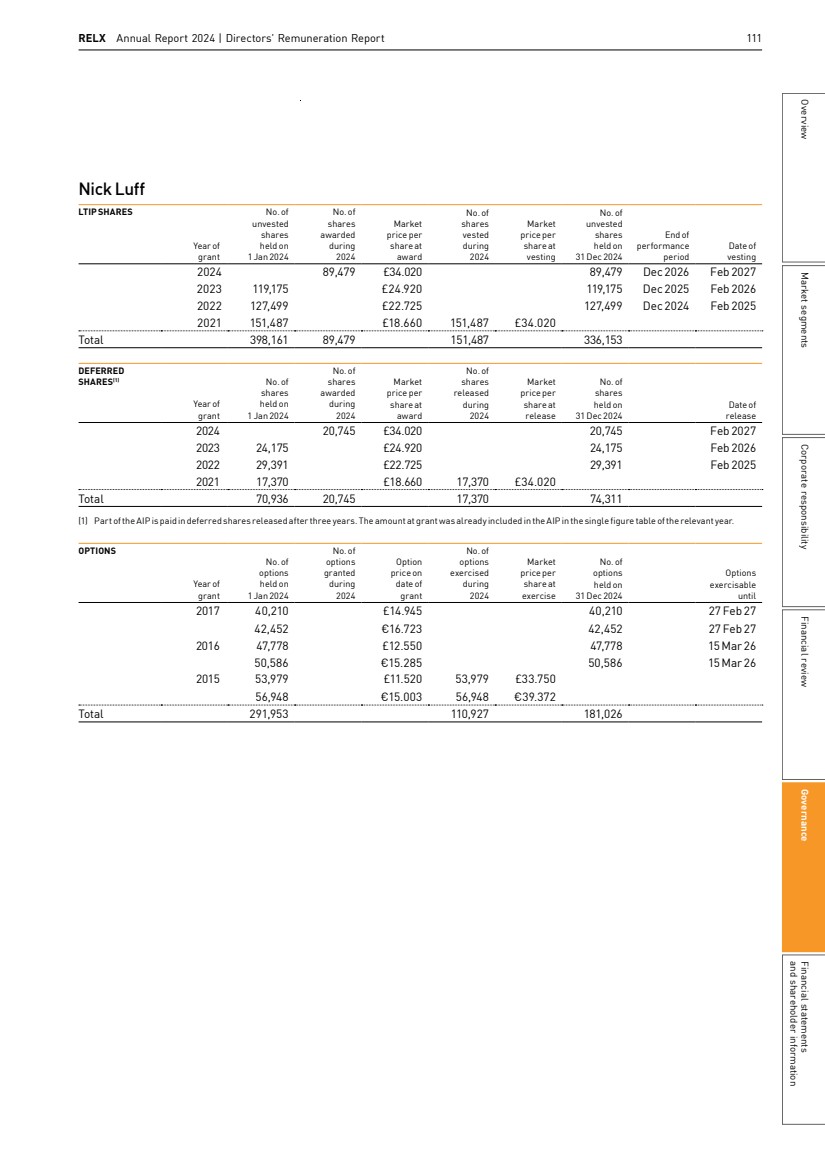
| 112 RELX Annual Report 2024 | Governance Performance graphs The graphs below show total shareholder returns for RELX calculated on the basis of the average share price in the 30 trading days before the respective year end and assuming dividends were reinvested. RELX’s performance is compared with the FTSE 100. The three-year chart covers the performance period of the 2022–2024 cycle of the LTIP. 3 years 5 years 10 years 0 25 50 75 100 125 150 175 % +26% Dec-24 RELX vs FTSE 100 – 3-YEAR TSR Dec-21 Dec-22 Dec-23 RELX FTSE 100 ∆=39% +65% % Dec-19 Dec-20 Dec-21 Dec-22 Dec-23 Dec-24 0 25 50 75 100 125 150 175 200 225 RELX FTSE 100 +33% RELX vs FTSE 100 – 5-YEAR TSR ∆=88% +121% RELX FTSE 100 Dec-14 Dec-15 Dec-16 Dec-17 Dec-18 Dec-19 Dec-20 Dec-21 Dec-22 Dec-23 Dec-24 % ∆=245% +83% 0 100 200 300 400 500 RELX vs FTSE 100 – 10-YEAR TSR +328% CEO historical pay table The table below shows the historical CEO pay over a ten-year period. GBP’000 2015 2016 2017 2018 2019 2020 2021 2022 2023 2024 Base salary 1,131 1,160 1,189 1,218 1,249 1,280 1,312 1,345 1,379 1,413 Annual incentive payout as a % of maximum 70% 68% 69% 78% 77% 65% 86% 76% 87% 80% Multi-year incentive vesting as a % of maximum (1) 97% 97% 92% 81% 81% 6% 71% 70% 100% 97% CEO total 11,416 11,399 8,748 9,141 9,346 3,980 9,560 8,597 14,989 13,521 (1) From 2020 onwards, amounts above reflect LTIP vesting. Prior periods also include vesting of awards under ESOS and BIP plans which were discontinued for Directors since 2017 (with the final vesting of awards under those plans occurring in 2019). |
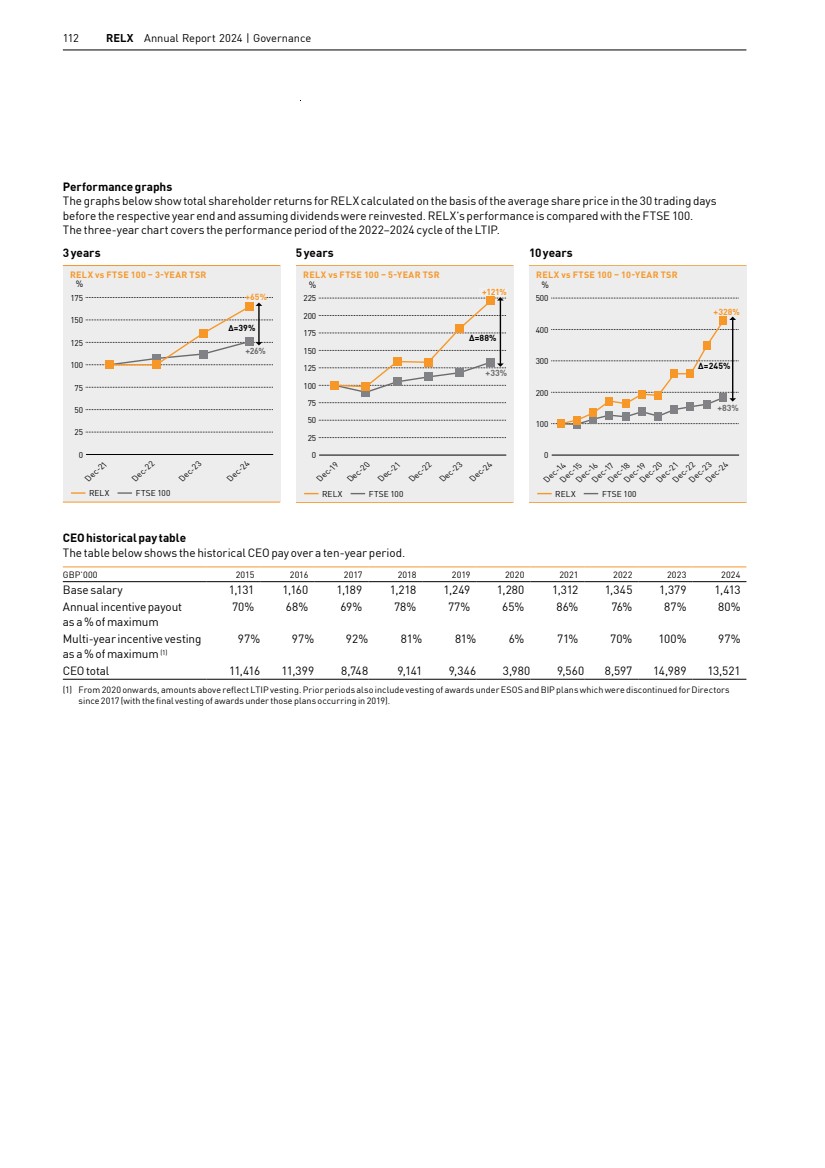
| RELX Annual Report 2024 | Directors’ Remuneration Report 113 Comparison of change in Directors’ pay with change in employee pay The UK Regulations require companies to disclose the percentage change in remuneration from 2023 to 2024 for each director compared with the employees of the listed company, excluding directors. RELX PLC has no employees and Executive Directors are the only employees of RELX Group PLC. We therefore have no data to report but have chosen to continue to report data on changes in base salary of the CEO compared with changes in base salary of a broader employee population. The salary increase for the CEO of 2.5% for 2024 was in line with the salary increase budget for the UK and the US where the majority of our employees are based. UK pay ratios The UK Regulations require the disclosure of the ratio of total CEOremuneration to median (P50), 25th percentile (P25) and 75th percentile (P75) UK employee total remuneration (calculated on a full-time equivalent basis). UK employees represent less than 20% of our global employee population. Pay ratios for total remuneration are likely to vary, potentially significantly, over time, since the CEO’s total remuneration each year is driven largely by performance-related pay outcomes and is affected by share price movements. We have therefore also shown the UK ratios for the salary component. For the purposes of the ratios below, the CEO’s 2024 total remuneration is the total single figure and salary as disclosed on page 104. The P25, P50 and P75 were selected from the UK employee population as at 1 October 2024. Ratios for prior years are as disclosed in the respective reports. Total remuneration Pay ratios All UK employees GBP’000 Year Method P25 P50 P75 P25 P50 P75 2024 A 269:1 183:1 131:1 50 74 103 2023 A 294:1 198:1 140:1 46 69 97 2022 A 188:1 129:1 89:1 44 64 93 2021 A 223:1 151:1 104:1 43 64 92 2020 A 98:1 67:1 46:1 40 59 86 2019 A 225:1 149:1 100:1 39 58 86 Salary Pay ratios All UK employees GBP’000 Year Method P25 P50 P75 P25 P50 P75 2024 A 32:1 23:1 17:1 44 62 83 2023 A 33:1 24:1 17:1 42 58 80 2022 A 34:1 25:1 18:1 39 55 76 2021 A 35:1 25:1 18:1 38 52 74 2020 A 35:1 25:1 18:1 37 52 72 2019 A 35:1 25:1 18:1 35 51 71 Slight differences compared with ratios calculated using data shown in the tables are due to rounding. The ratios are calculated using Option A, meaning that the median, 25th and 75th percentiles were determined based on total remuneration using the single total figure valuation methodology, except for annual incentives (other than sales incentives) which are based on estimated payout as individual final payout levels are still to be finalised. We chose Option A as we believe it is the most robust and accurate way to identify the median, 25th percentile and 75th percentile UKemployee. The Committee is satisfied that the overall picture presented by the 2024 pay ratios is consistent with the pay, reward and progression policies for the Group’s UK employees. § Salaries for all UK employees, including the Executive Directors, are set based on a wide range of factors, including market practice, scope and impact of the role and experience. § The provision of certain benefits and the level of benefit provided vary depending on the role and level of seniority. § Participation in annual incentive plans varies by business and reflects the culture and the nature of the business, as well as role. § Whilst none of the comparator employees participate in the executive share plans, they do have the opportunity to receive company shares via the UK Sharesave Option Plan. A greater proportion of performance-related variable pay and share based awards applies to more senior executives, including theExecutive Directors, who have a greater influence over performance outcomes. Relative importance of spend on pay The following table sets out the total employee costs for all employees, as well as the amounts paid in dividends and share repurchases. 2023 GBPm 2024 GBPm % change Employee costs(1) 3,108 3,120 0% Dividends 1,059 1,121 6% Share repurchases 800 1,000 25% (1) Employee costs include wages and salaries, social security costs, pensions and share based and related remuneration. Payments to past Directors and payments for loss of office There have been no payments for loss of office in 2024. Market segments Governance and shareholder information Financial statements Financial review Corporate responsibility Overview |
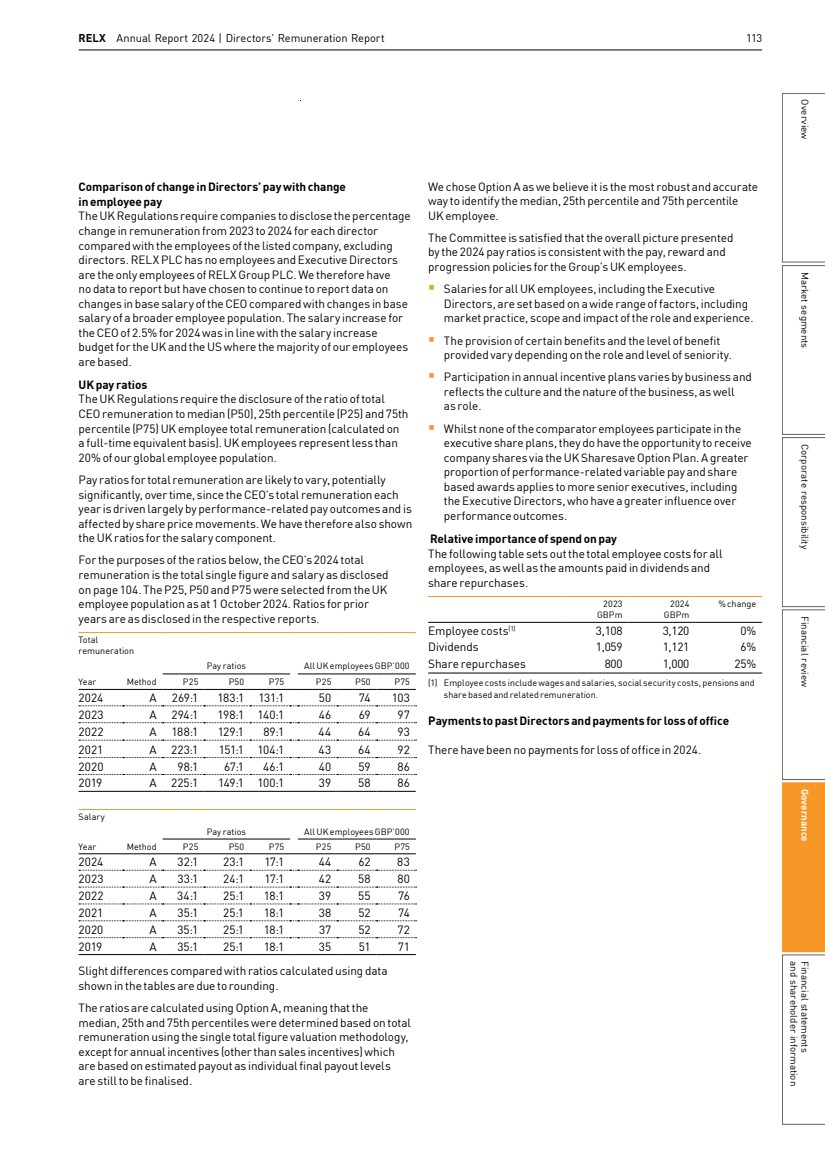
| 114 RELX Annual Report 2024 | Governance Implementation of the remuneration policy in 2025 Salary: The Committee has awarded a salary increase of 2.5% to each Executive Director, which means that, from 1 January 2025, Erik Engstrom’s salary rose to £ 1,448,298 and Nick Luff’s salary to £ 852,856. Benefits: The benefits provided to the Executive Directors are unchanged for 2025. Annual incentive: The AIP payout at target performance is 135% of base salary and the maximum 200% of base salary, with 50% ofthe AIPearned deferred into shares. Revenue, adjusted net profit after tax and cash flow each have a weight of 30% and non-financial measures a weight of 10%. Details of the 2025 annual financial targets and non-financial metrics will be disclosed in the 2025 Remuneration Report. Pension: Erik Engstrom and Nick Luff will receive cash in lieu of pension of 11% of their salary. Share based awards: As in 2024, we will be granting LTIP awards with face values of 450% of salary to Erik Engstrom and 375% to Nick Luff in 2025. The awards are subject to a three-year performance period and the net (after tax) vested shares are to be retained for a further two-year holding period. The following metrics, weightings, targets and vesting scales apply to LTIP awards granted in 2025 for the 2025–2027 cycle. The vesting of LTIP awards is dependent on three separate performance measures: ROIC, EPS and TSR weighted 40%:40%:20% respectively and assessed independently. The TSR measure comprises three comparators (sterling, euro and US dollar) reflecting the fact that RELX accesses equity capital markets through three exchanges – London, Amsterdam and New York – in three currency zones. RELX’s TSR performance is measured separately against each comparator group and each ranking achieved will produce a payout, if any, in respect of one-third of the TSR measure. The proportion of the TSR measure that vests will be the sum of the three payouts. The averaging period applied for TSR measurement purposes is the three months before the start of the financial year in which the award is granted and the last three months of the third financial year of the performance period. The companies for the TSR comparator groups for the 2025–2027 LTIP cycle were selected on the following basis (substantially unchanged from prior year): (a) they were in a relevant market index or were the largest listed companies on the relevant exchanges at the end of the year before the start of the performance period: the FTSE 100 for the sterling group; the Euronext100 and Dax40 for the euro group; and the S&P 500 for the USdollar group; (b) certain companies were then excluded: § those with mainly domestic or single country revenues (as they do not reflect the global nature of RELX’s customer base); § those engaged in extractive industries (as they are exposed to commodity cycles); and § financial services companies (as they have a different risk/reward profile). (c) the remaining companies were then ranked by market capitalisation and, for each comparator group, around 50 companies with market capitalisations above and below that of RELX were taken; and (d) relevant listed global peers operating in businesses similar to those of RELX, but not otherwise included, were added. Vesting percentage of each third of the TSR tranche(1) TSR ranking within the relevant TSRcomparator group 0% Below median 20% Median 100% Upper quartile (1) Vesting is on a straight-line basis for performance between the minimum and maximum levels. The calculation methodology for the EPS and ROIC measures is set out in the 2013 Notices of Annual General Meetings, which can be found on RELX’s website. The targets and vesting scales applicable to the EPS and ROIC are set out below. Vesting percentage of EPS and ROIC tranches(1) Average growth in adjusted EPS over the three-year performance period Average ROIC over the three-year performance period 0% below 5% p.a. below 11.2% 20% 5% p.a. 11.2% 50% 6% p.a. 11.8% 65% 7% p.a. 12.4% 75% 8% p.a. 13.0% 85% 9% p.a. 13.6% 92.5% 10% p.a. 14.2% 100% 11% p.a. or above 14.8% or above (1) Vesting is on a straight-line basis for performance between the stated average adjusted EPS growth/ROIC percentages. |
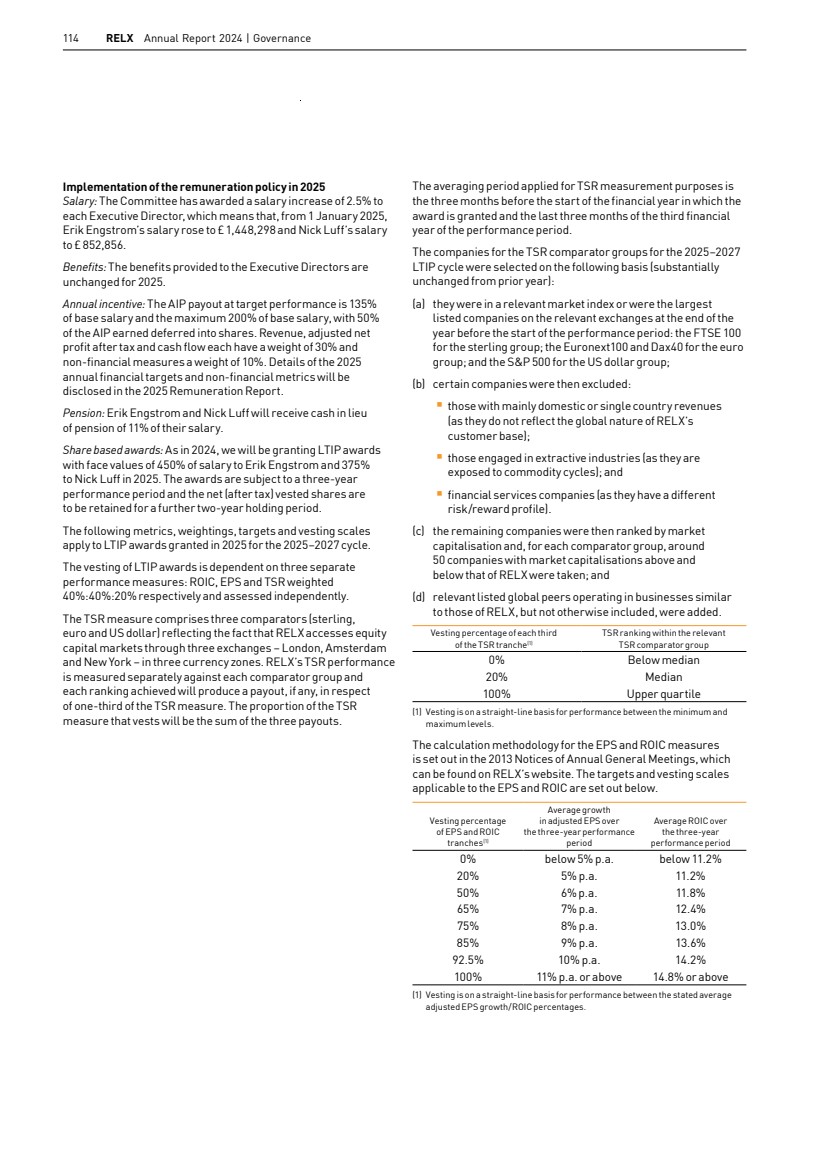
| RELX Annual Report 2024 | Directors’ Remuneration Report 115 Remuneration Committee advice The Committee consists of independent Non-Executive Directors and the Chair of RELX. Details of members and their attendance are contained in the Corporate Governance Review on page 92. The Chief Legal Officer and Company Secretary attends meetings as secretary to the Committee. At the invitation of the Chair of theCommittee, the CEO attends appropriate parts of the meetings. The CEO is not in attendance during discussions about his remuneration. The Chief Human Resources Officer advised the Committee during the year. Willis Towers Watson is the external adviser, appointed by the Committee through a competitive process. Willis Towers Watson also provided actuarial and other human resources consultancy services to some RELX companies during the year. The Committee is satisfied that the firm’s advice continues to be objective and independent, and that no conflict of interest exists. The individual consultants who work with the Committee do not provide advice to the Executive Directors or act on their behalf. Willis Towers Watson is a member of the Remuneration Consultants’ Group and conducts its work in line with the UK Code of Conduct for executive remuneration consulting. During 2024, Willis Towers Watson received fees of £3,000 for advice given to the Committee, charged on a time and expense basis. Shareholder voting at 2024 Annual General Meeting At the Annual General Meeting of RELX PLC on 25 April 2024, votes cast by proxy and at the meeting in respect of the Directors’ Remuneration Report were as follows: Resolution Votes For % For Votes Against % Against Total votes cast Votes Withheld Remuneration Report (advisory) 1,513,406,755 96.05% 62,241,449 3.95% 1,575,648,204 180,316 At the Annual General Meeting of RELX PLC on 20 April 2023, votes cast by proxy and at the meeting in respect of the Directors’ Remuneration Policy were as follows: Resolution Votes For % For Votes Against % Against Total votes cast Votes Withheld Remuneration Policy (binding) 1,528,240,789 95.87% 65,765,933 4.13% 1,594,006,722 2,416,183 Robert MacLeod Chair, Remuneration Committee 12 February 2025 Market segments Governance and shareholder information Financial statements Financial review Corporate responsibility Overview |
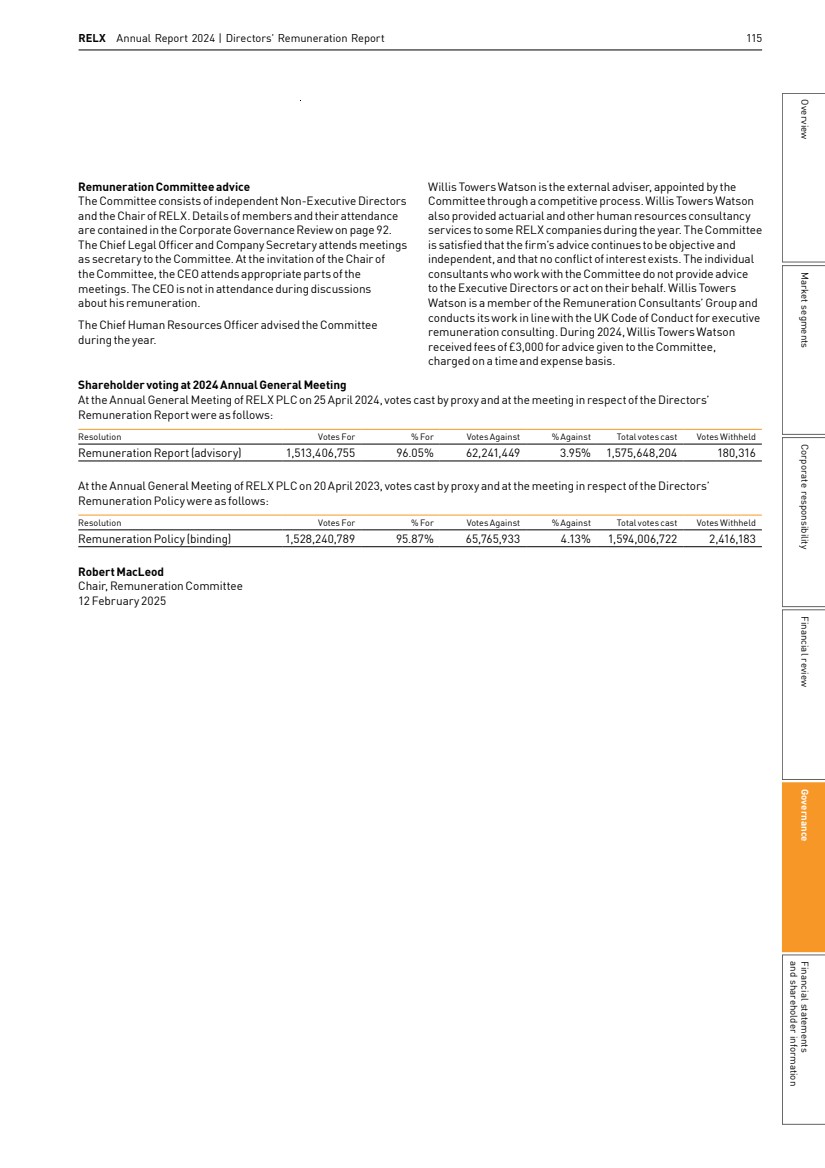
| 116 RELX Annual Report 2024 | Governance Set out in this section is the Company’s Remuneration Policy for Directors, as approved by shareholders at the 20 April 2023 Annual General Meeting, and which is intended to apply for three years from the 2023 AGM and to awards granted from the first quarter of 2024. The policy is as reported in the 2022 annual report. Remuneration policy table – Executive Directors ANNUAL BASE SALARY Purpose and link to strategy To recruit and retain the best executive talent globally to execute our strategic objectives at appropriate cost. Operation Salaries for Executive Directors are set and reviewed annually by the Remuneration Committee (the Committee) with changes typically taking effect on 1 January. In exceptional circumstances, the Committee may review salaries more frequently. When reviewing salaries, the Committee considers the executive’s role and sustained value to the Company in terms of skill, experience and overall contribution and the Company’s guidelines for salaries for all employees for the year. Periodically, competitiveness with companies which are comparable in respect of industry, size, international scope and complexity is also considered in order to ensure the Company’s ability to attract and retain executives. Performance framework N/A Maximum value Salary increases will continue to be aligned with the range of increases for the wider employee population and subject to annual all-employee guidelines. However, as for all employees, the Committee has discretion to exceed this to take account of individual circumstances such as change in responsibility, increases in scale or complexity of the business or alignment to market level. Recovery of sums paid No provision. RETIREMENT BENEFITS Purpose and link to strategy Retirement plans are part of remuneration packages designed to recruit and retain the best executive talent at appropriate cost. Operation Executive Directors receive pension benefits up to the value equivalent to the maximum level of pension benefits provided under the Company’s regular defined contribution pension plans as may be in effect or amended from time to time (currently 11% of base salary in the UK). The defined contribution pension plans are designed to be competitive and sustainable long-term. Any amount payable may be paid wholly or partly as cash in lieu. Performance framework N/A Maximum value The maximum value is equivalent to the maximum level of pension benefits provided under the Company’s regular defined contribution pension plans as may be in effect or amended from time to time (currently capped at 11% of base salary in the UK). Recovery of sums paid No provision. Remuneration Policy Report |
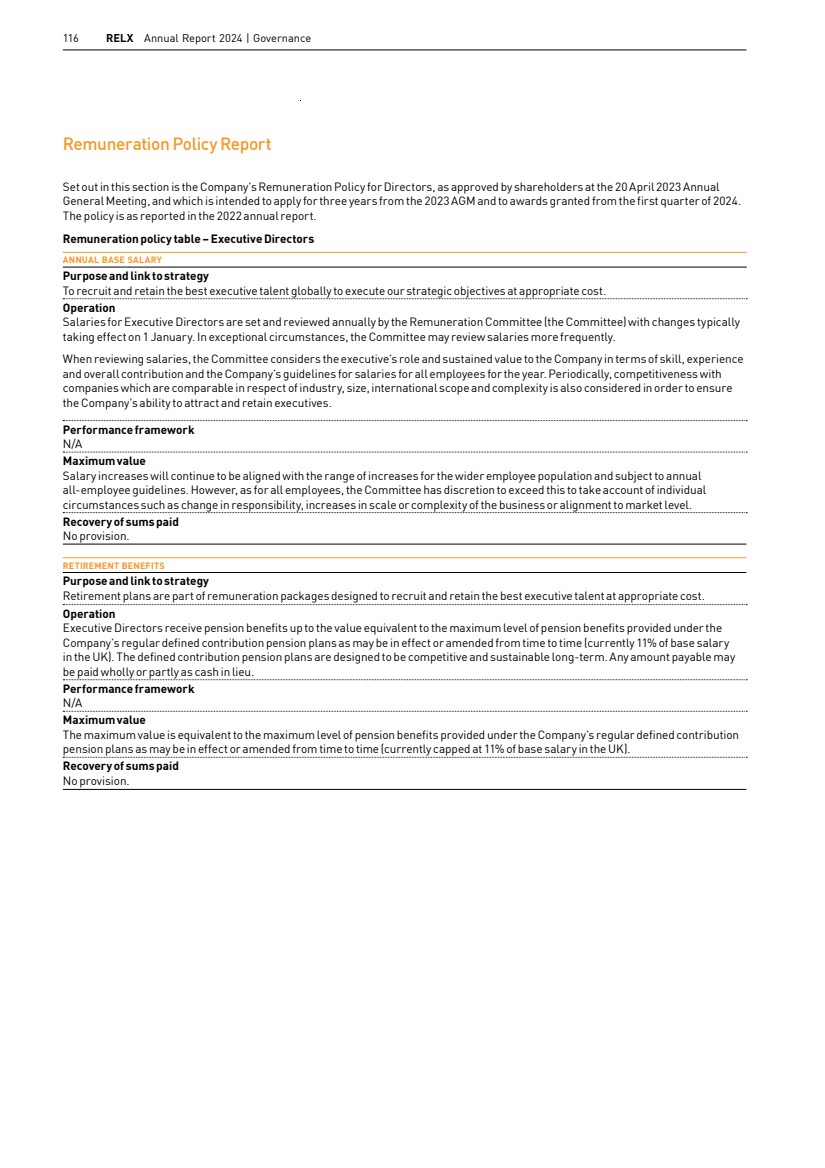
| RELX Annual Report 2024 | Directors’ Remuneration Report 117 OTHER BENEFITS Purpose and link to strategy To provide competitive benefits at appropriate cost. Operation Other benefits, subject to periodic review, may include private medical and dental cover, life assurance, tax return preparation costs, car benefits, directors’ and officers’ liability insurance, relocation benefits and expatriate allowances and other benefits available to employees generally, including, where appropriate, the tax on such benefits. Performance framework N/A Maximum value The maximum for ongoing benefits for Executive Directors will not normally exceed 10% of salary (excluding any one-off items, such as immigration support or relocation benefits, and any tax related charge on benefits which is met by the Company). However, theCommittee may provide reasonable benefits beyond this amount in exceptional situations, such as a change in the individual’s circumstances caused by the Company, or if there is a significant increase in the cost of providing the agreed benefit. ANNUAL INCENTIVE PLAN (AIP) Purpose and link to strategy The annual incentive provides focus on the delivery of annual financial targets and the achievement of annual objectives and milestones which are chosen to align with the Company’s strategy and create a platform for sustainable future performance. The compulsory deferral of 50% of any annual incentive earned into RELX shares for three years promotes longer-term alignment of Executive Directors’ interests with shareholders’ interests, including an element of post-termination shareholding. Why performance measures are chosen and how targets are set Performance measures include a balanced set of financial measures which are appropriately weighted and which support current strategy and incentivise the Executive Directors to achieve the desired outcomes without undue risk of focusing on any one financial measure. The financial targets are designed to be challenging and are set with reference to the previous year’s performance and internal and external forecasts for the following year. Performance measures may also include non-financial measures, for example linked to sustainability. Operation The Committee reviews and sets the financial targets and, if applicable, non-financial targets, annually, taking into account internal forecasts and strategic plans. Following year end, the Committee compares actual performance with the financial targets and assesses the achievement of any non-financial targets. The targets and outcomes are fully disclosed in the Remuneration Report published after year end. 50% of any annual incentive earned is paid in cash to the Executive Director and the remaining 50% is deferred into RELX shares, which are released to the Executive Director after three years. Dividend equivalents accrued during the deferral period are payable in respect of the shares. On a change in control, the default position is that deferred shares are released to the Executive Director. Alternatively, theCommittee may determine that deferred shares will instead be exchanged for equivalent share awards in the acquiring company. Performance framework The AIP includes financial measures with a weighting of at least 85% and may also include non-financial measures with a weighting of up to 15%. Each measure is assessed separately. § The minimum payout is zero. § Each measure is assessed independently and payout for each measure at threshold is 10% of the maximum opportunity for that measure. § Payout for target performance is 135% of salary. Following an assessment of financial achievement, and scoring of any non-financial measures, the Committee agrees the overall level of earned incentive for each Executive Director. Committee discretion applies.1,2,3 Maximum value The maximum potential annual incentive is 200% of annual base salary. This includes the deferred share element but excludes dividend equivalents payable in respect of the deferred shares. Recovery of sums paid Clawback applies.4 Market segments Governance and shareholder information Financial statements Financial review Corporate responsibility Overview |
| 118 RELX Annual Report 2024 | Governance LONG-TERM INCENTIVE PLAN (LTIP) Purpose and link to strategy The Long-Term Incentive Plan (LTIP) is designed to provide a long-term incentive for Executive Directors to achieve the key performance measures that support the Company’s strategy, and to align their interests with shareholders. Why performance measures are chosen and how targets are set Our strategic focus is on continuing to transform the core business through organic investment and the build-out of new products into adjacent markets and geographies, supplemented by selective portfolio acquisitions and divestments. The performance measures in the LTIP are chosen to support this strategy by focusing on sustained earnings growth, return on invested capital and shareholder return. Targets are set with regard to previous results and internal and external forecasts for the performance period and the strategic plan for the business. They are designed to provide exceptional reward for exceptional performance, whilst allowing a reasonable expectation that reward at the lower end of the scale is attainable, subject to robust performance. Operation Annual awards of performance shares, with vesting subject to: § performance measured over three financial years § continued employment (subject to the provisions set out in the Policy on payments for loss of office section) § meeting shareholding requirements (450% of salary for the CEO and 300% of salary for the CFO) Executive Directors are to retain their net (after tax) vested shares for a holding period of two years after vesting. Dividend equivalents accrued during the performance period are payable in respect of the performance shares that vest. On a change of control, the default position is that awards vest on a pro-rated basis, subject to an assessment of performance against targets at that time. Alternatively, the Committee may determine that the awards will not vest and will instead be exchanged for equivalent awards in the acquiring company. Performance framework The performance measures are EPS, ROIC and relative TSR, weighted 40%:40%:20% respectively and assessed independently, such that a payout can be received under any one of the measures (or, for TSR, in respect of one of the three comparator groups). § The minimum payout is zero. § Each measure is assessed independently and payout for each measure at threshold is 20% of the maximum opportunity for that measure. § Payout in line with expectations is 50% of the maximum award. Dividend equivalents are not taken into account in the above payout levels. Committee discretion applies.1,2,3 Maximum value The maximum grant in any year is up to 450% of base salary for the CEO and up to 375% of base salary for other Executive Directors (notincluding dividend equivalents). Recovery of sums paid Clawback applies.4 Notes to the Remuneration policy table (1) Discretion in respect of AIP and LTIP payout levels: In determining the level of payout under the AIP and vesting under the LTIP, the Committee takes into account RELX’s overall business performance and value created for shareholders over the period in review and other relevant factors. It has discretion to adjust the vesting and payout levels (subject always to the maximum individual limits) ifit believes this would result in a fairer outcome. This discretion will only be used in exceptional circumstances and the Committee will explain in the next Remuneration Report the extent to which it has been exercised and the reasons for doing so. (2) Discretion to vary performance measures under the AIP and the LTIP: The Committee may vary the financial measures applying to a current annual incentive year and performance measures for LTIP awards already granted if a change in circumstances leads it to believe that the arrangement is no longer a fair measure of performance. Any new measures will not be materially less, or more, challenging than the original ones. (3) Discretion on termination of employment under the AIP and the LTIP: The Committee’s discretion on termination of employment is described under the ‘Policy on payments for loss of office’ section. (4) Malus and clawback under the AIP and the LTIP: Under the AIP and the LTIP, the Committee has discretion to apply malus and clawback in case of material misstatement of results or erroneous calculation in incentive payout; breach of post-termination restrictive covenants; misconduct; fraud or conduct which results in (i) significant reputational damage; (ii) material adverse effect on the financial position of the Company; or (iii) corporate failure. These apply for three years following the AIP cash payment and five years from the start of each LTIP performance period and, in the case of a breach of restrictive covenants, to the end of the restriction period. If a participant is subject to an internal investigation regarding a serious breach of any of the above matters, the vesting of their awards and the application of malus and clawback may be delayed until the outcome of that investigation. (5) Explanation of differences between the Company’s policy on Executive Directors’ remuneration and the policy for other employees: Alarger percentage of Executive Directors’ remuneration is performance related than that of other employees. All managers participate in an annual incentive plan. Participation levels, measures and targets vary according to their role, seniority and local business priorities. Senior executives may also participate in multi-year equity plans. Grant levels under the plans vary according to roles and seniority. The range and level of retirement and other benefits provided to employees vary according to local market practice. |
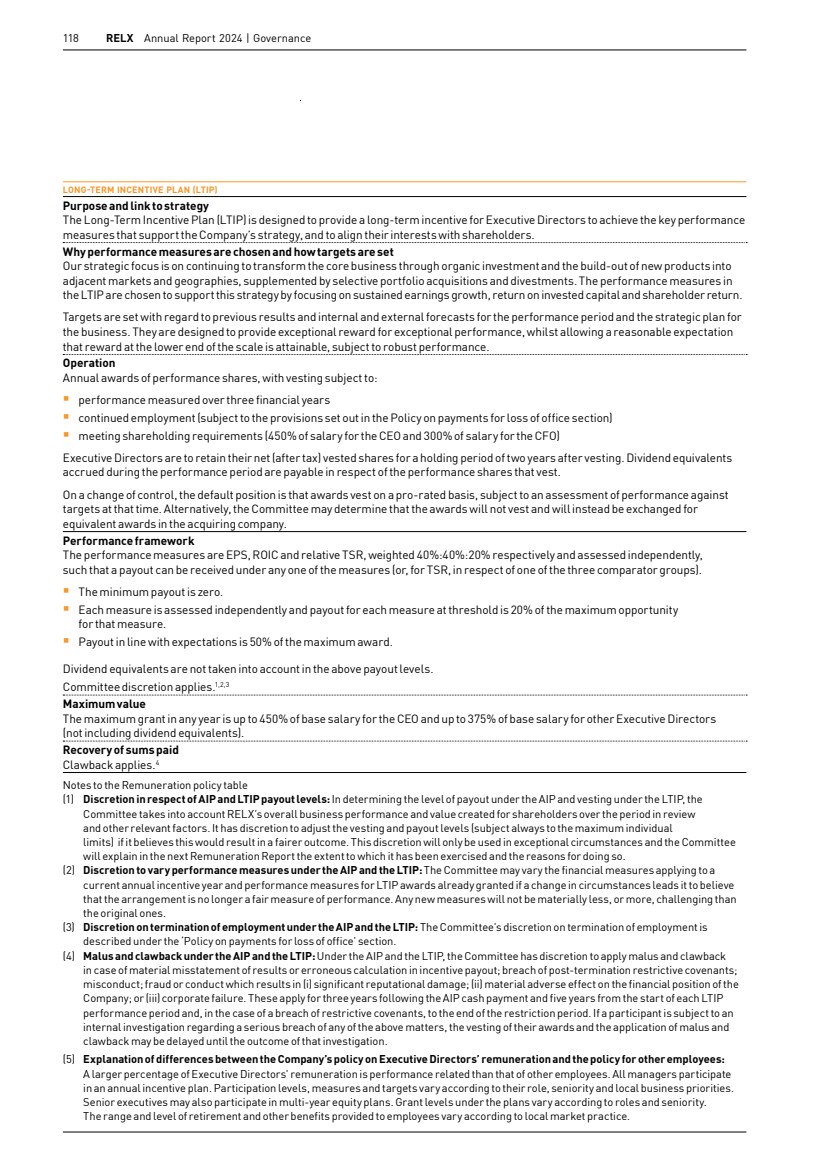
| RELX Annual Report 2024 | Directors’ Remuneration Report 119 Remuneration outcomes in different performance scenarios The Committee considers the level of remuneration that may be paid in the context of the performance delivered and value added for shareholders. The charts below are an illustration of how the CEO’s and CFO’s regular annual remuneration could vary under different performance scenarios. The salary, benefits and pension levels are the same in all three scenarios in each chart and are based on 2023 salary, benefits as shown in the 2022 Single Total Figure table and cash in lieu of pension of 11% of base salary. Annual incentive amounts include the portion which is subject to compulsory deferral into RELX shares for three years. The performance assumptions which have been used are as follows: Minimum means no AIP payout and no LTIP vesting. In line with expectations means AIP payout at 135% of salary (of which 50% is deferred into shares) and LTIP vesting at 50% of the award. Maximum means AIP payout at 200% of salary (of which 50% is deferred into shares) and LTIP vesting at 100% of the award. The three bars in each chart assume no share price movement. As required by the UK Regulations, assuming maximum performance achievement (as described above) and 50% share price growth over the performance period, the CEO’s maximum remuneration would increase to £13.7 m and the CFO’s maximum remuneration to £7.1m. Any dividend equivalents payable in respect of the AIP deferred shares and the LTIP are not included. CEO remuneration (GBP’000) LTIP AIP cash and deferred shares Salary, benefits, pension Minimum In line with expectations Maximum 100% 25% 15% 28% 47% 26% 59% 1,612 6,575 10,572 CFO remuneration (GBP’000) Minimum In line with expectations Maximum 100% 26% 16% 31% 43% 29% 55% 916 3,534 5,583 LTIP AIP cash and deferred shares Salary, benefits, pension Shareholding requirement The Executive Directors are subject to shareholding requirements. These are a minimum of 450% of annual base salary for the CEO and 300% of annual base salary for other Executive Directors. On joining or promotion to the Board, Executive Directors are given a period of time, typically up to five years, to build up to their requirement. On termination of employment, Executive Directors are to maintain their full shareholding requirement (or, if lower, their actual level of shareholding at the time of leaving) for two years after leaving employment. Shares which count for shareholding purposes are shares beneficially owned by the Executive Director, their spouse, civil partner or dependent child and AIP deferred shares which are within their three-year deferral period, on a notional net of tax basis. Market segments Governance and shareholder information Financial statements Financial review Corporate responsibility Overview |
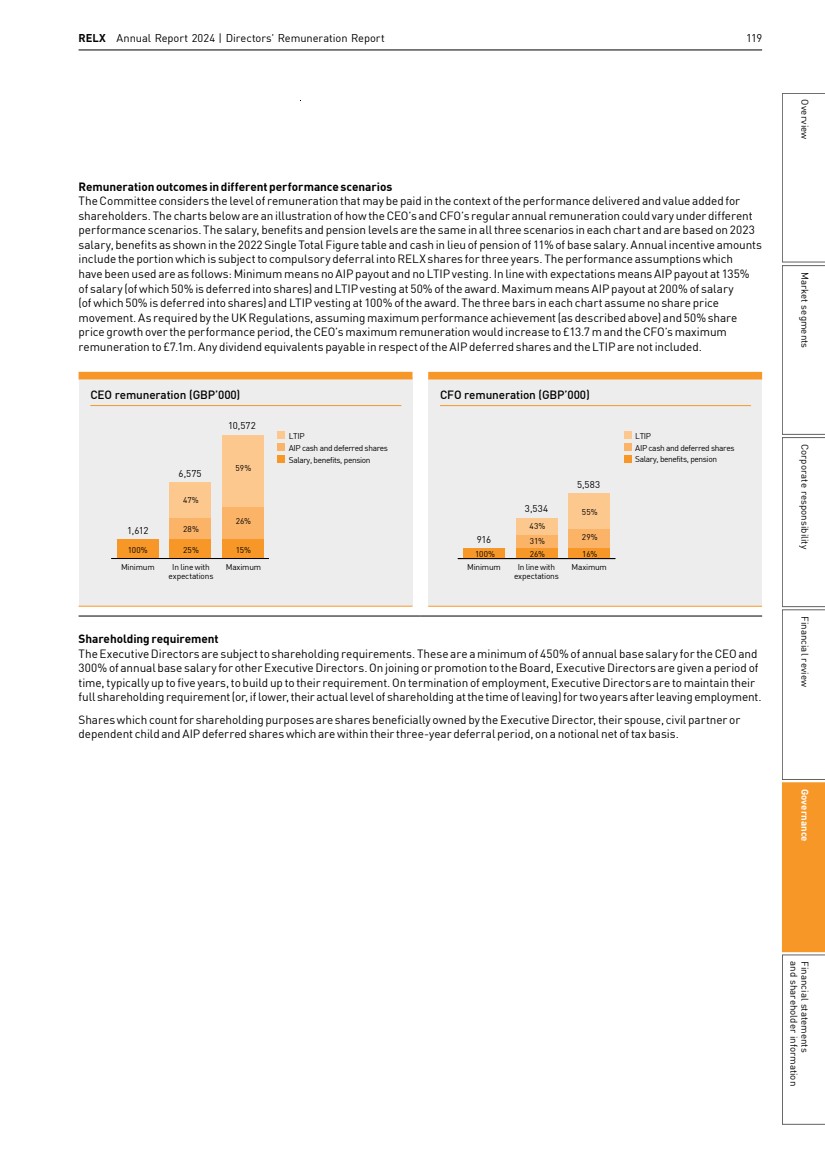
| 120 RELX Annual Report 2024 | Governance Approach to recruitment remuneration – Executive Directors When agreeing the components of a remuneration package on the appointment of a new Executive Director, or an internal promotion to the Board, the Committee would seek to align the package with the remuneration policy stated in the policy table. The Committee’s general principle on recruitment is to offer a competitive remuneration package to attract high-calibre candidates from a global talent pool. Basic salary would be set at an appropriate level for the candidate, taking into account all relevant factors. As a data analytics and technology-driven business, with over half of its revenue in the US, the Company primarily competes for talent with global information and technology companies. The various components and the Company’s approach are as follows: REMUNERATION COMPONENTS The remuneration would include base salary, retirement benefits, other benefits, AIP and LTIP in line with the policy table, taking into account the principles set out above. COMPENSATION FOR FORFEITED ENTITLEMENTS The Committee may make awards and payments on hiring an external candidate to compensate him or her for entitlements forfeited on leaving the previous employer. If such a decision is made, the Committee will attempt to reflect previous entitlements as closely as possible using a variety of tools, including cash and share based awards. Malus and clawback provisions will apply where appropriate. If necessary to facilitate the grant of awards, the Committee may rely on the one person exemption from shareholder approval in the UK Listing Rules. RELOCATION ALLOWANCES AND EXPENSES The type and size of relocation allowances and expenses will be determined by the specific circumstances of the new recruit. Policy on payments for loss of office In line with the Company’s policy, the service contracts of the existing Executive Directors contain 12-month notice periods. The circumstances in which an Executive Director’s employment is terminated will affect the Committee’s determination of any payment for loss of office, but it expects to apply the principles outlined in the table on the next page. The Committee reserves the right to depart from these principles where appropriate in light of any taxation requirements to which the Company or the Executive Director is subject (including, without limitation, section 409A of the US Internal Revenue Code), or other legal obligations. |
| RELX Annual Report 2024 | Directors’ Remuneration Report 121 Policy on payments for loss of office (continued) GENERAL(1) INCENTIVES Mutually agreed termination/termination by the Company other than for cause(2) (includes retirement with customary notice) The Executive Director would be entitled to salary, benefits and other contractual payments in the normal way up to the termination date and would be paid for any accrued but untaken holiday. Salary: Payment of up to 12 months’ salary to reflect the notice period or payment in lieu of notice. Other benefits: Where possible, benefits would be continued for up to the duration of any unworked period of notice (not exceeding the maximum stated in the policy table) or the Executive Director would receive a cash payment (not exceeding the cost to the Company of providing those benefits). Pension: Deferred or immediate pension in accordance with scheme rules, with a credit in respect of, or payment for up to, the full period of any unworked period of notice. There is provision under the defined benefit pension scheme for members leaving Company service by reason of permanent incapacity to make an application to the scheme trustee for early payment of their pension. Other: The Company may pay compensation in respect of any statutory employment rights and may make other appropriate and customary payments. The Company would have due regard to principles of mitigation ofloss. Reductions would be applied to reflect any portion of the notice period that is worked and/or spent on gardening leave. On injury, disability, ill-health or death, the Committee reserves the right to vary the treatment outlined in this section. Annual incentive: Any unpaid annual incentive for the previous year and a pro-rata payment in respect of the part of the financial year up to the termination date would generally be payable (subject to the deferral provisions), with the amount being determined by reference to the original performance criteria. However, the Committee has discretion to decide otherwise depending on the reason for termination and other specific circumstances. TheCompany would not pay any annual incentive in respect of any part of the financial year following the termination date (e.g. for any unworked period of notice). AIP deferred shares would be released to the Executive Directors in full at the end of the deferral period. The annual incentive clawback provisions would apply. LTIP: The default position is that unvested LTIP awards would be pro-rated to reflect time employed and would vest subject to performance measured at the end of the relevant performance period and subject to the Executive Director continuing to meettheir full shareholding requirement for two years after the termination date. The Committee has discretion to allow unvested LTIP awards to vest earlier and to adjust the application of time pro-rating and performance conditions, subject to the plan rules. The requirement to retain net (after tax) vested LTIP shares for a holding period of two years after vesting ceases to apply on termination of employment. Employee instigated resignation The Executive Director would not receive any payments for loss of office. The Executive Director would be entitled to salary, benefits and other contractual payments in the normal way up to the termination date and would be paid for any accrued but untaken holiday. Pension: A deferred or immediate pension would be payable in accordance with the scheme rules. Annual incentive: The Executive Director would be entitled to receive an annual incentive for a completed previous year (subject to the deferral provisions), but not a pro-rated annual incentive in respect of a part year up to the termination date, unless the Committee decides otherwise in the specific circumstances. Any AIP deferred shares would be released to the Executive Director in full at the end of the deferral period. Annual incentive clawback provisions would apply. LTIP: All outstanding LTIP awards would lapse on the date of notice. Dismissal for cause The Executive Director would be entitled to salary, benefits and other contractual payments in the normal way up to the termination date and would be paid for any accrued but untaken holiday but would not receive any payments for loss of office. Pension: A deferred or immediate pension would be payable in accordance with the scheme rules. Annual incentive: The Executive Director would not receive any unpaid annual incentive. Any AIP deferred shares lapse on the date of dismissal. LTIP: All outstanding LTIP awards would lapse on the date of dismissal. (1) In addition to what is set out in this section, on termination for any reason, Erik Engstrom will be entitled to payment of amounts held in his ‘Retirement Account’. (2) In cases where the approved leaver treatment applies, the AIP and LTIP have a default position as well as giving the Committee discretion to adjust the default treatment within certain parameters. The Committee would only expect to exercise such discretion where the Committee believes the personal circumstances of the Executive Director so require. Market segments Governance and shareholder information Financial statements Financial review Corporate responsibility Overview |
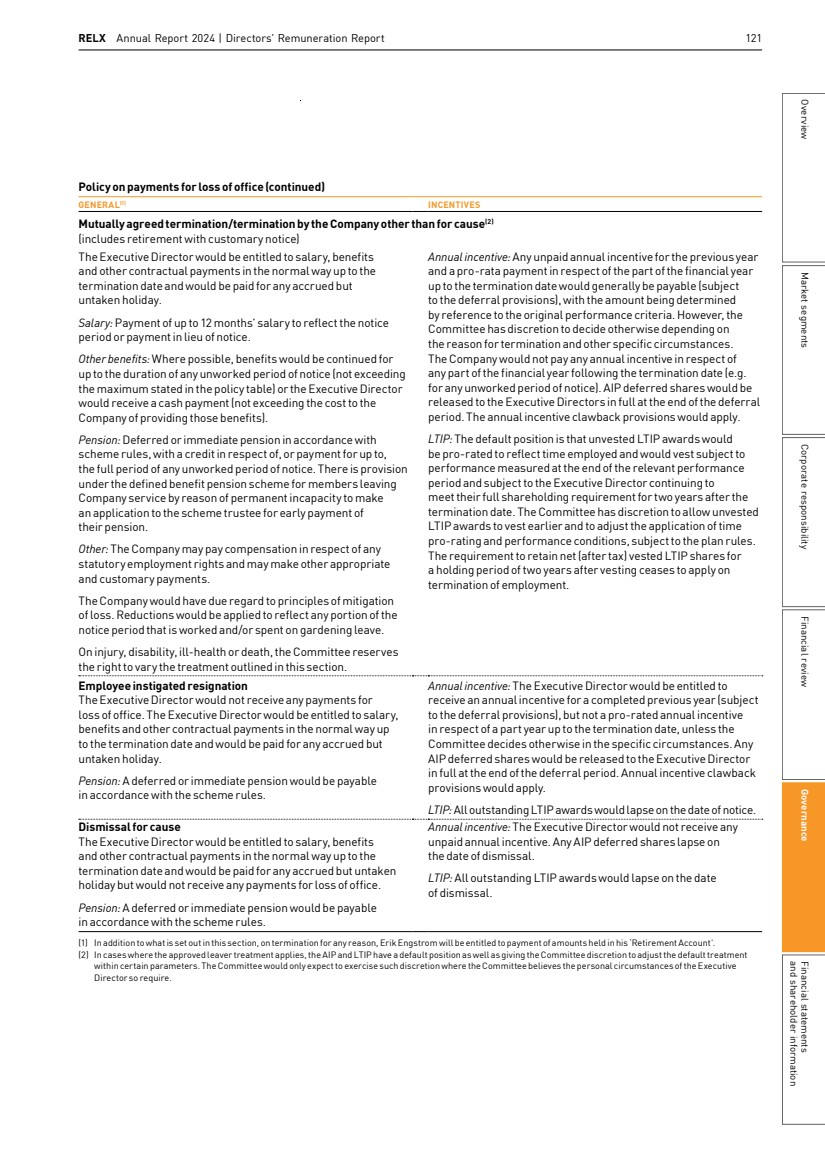
| 122 RELX Annual Report 2024 | Governance Remuneration policy table – Non-Executive Directors FEES Purpose and link to strategy To enable RELX to recruit Non-Executive Directors with the right balance of personal skills and experience to make a major contribution to the Board and Committees of a global business which is listed in London, Amsterdam and New York. Operation RELX Chair: Receives an aggregate annual fee with no additional fees, for example, Committee Chair fees. The Committee determines the Chair’s fee on the advice of the Senior Independent Director. Other Non-Executive Directors: Receive an annual fee with additional fees payable as appropriate for specific roles and duties. These additional fees include fees for the Senior Independent Director and Committee Chairs, for membership of Board Committees, as well as a workforce engagement fee and international travel fees. In future, other fees may be payable, for example attendance fees. The Board determines the level of fees, subject to applicable law. Fees may be reviewed annually, although in practice they have changed on a less frequent basis. When reviewing fees, consideration is given to the time commitment required, the complexity of the role and the calibre of the individual. Periodically, comparative market data is also reviewed, the primary source for which is the practice of FTSE 30 companies. Maximum value The aggregate annual fee limit for fees paid to the Chair and the Non-Executive Directors is £2m. Additional fees for membership of or chairing Board Committees and assuming additional responsibilities such as acting as Senior Independent Director, are not subject to this maximum limit. OTHER BENEFITS Purpose and link to strategy To provide competitive benefits at appropriate cost. Operation Other benefits for Non-Executive Directors are reviewed periodically and may include private medical cover, tax return preparation costs, secretarial benefits, car benefits, travel and related subsistence costs, including, where appropriate, the tax on such benefits. Maximum value There is no prescribed maximum amount. Approach to recruitment remuneration – Non-Executive Directors Following recruitment, a new Non-Executive Director will be entitled to fees and other benefits in accordance with the Company’s remuneration policy. No additional remuneration is paid on recruitment. However, any reasonable expenses incurred during the recruitment process will be reimbursed. Policy on payments for loss of office – Non-Executive Directors In addition to unpaid accrued fees, the Non-Executive Directors are entitled to receive one month’s fees for loss of office if their appointment is terminated before the end of its term. Service contracts and letters of appointment There are no further obligations in the Directors’ service contracts and letters of appointment which are not otherwise disclosed in this Report which could give rise to a remuneration payment or loss of office payment. All Directors’ service contracts and letters of appointment are available for inspection at the Company’s registered office. The Executive Directors’ service contracts do not have a fixed expiry date. Consideration of employment conditions elsewhere in theCompany When the Committee reviews the Executive Directors’ salaries annually, it takes into account the Company’s guidelines for salaries for all employees in the Company’s major operating locations for the forthcoming year. The Committee also considers market practice in the FTSE 30 as well as pay practices of other global information and technology companies when determining the quantum and structure of Directors’ pay. The Committee annually reviews various aspects of workforce remuneration and related policies in order to deepen its understanding of pay structures throughout the organisation. Our designated Non-Executive Director responsible for workforce engagement meets with employees representing our global employee population in order to understand a wide range of employee views on a variety of topics. The feedback is reported back to the Board at least once per year and forms part of the Board’s discussions and decision making. As part of this process, the Non-Executive Director explains how executive remuneration aligns with wider pay policy. Consideration of shareholder views Our practice is to consult shareholders and consider their views when formulating, or changing, our policy. The Committee took into account feedback received from shareholders since the prior policy was approved when reviewing the current policy. Previous remuneration policies and prior commitments Any payments which are still to be made under arrangements made and awards granted under previous remuneration policies will be made consistent with the applicable policy. The provisions of the previous policies which relate to arrangements and awards granted under those previous policies will therefore continue to apply until all payments in relation to those arrangements and awards have been made. The Committee also reserves the right to make any remuneration or loss of office payments if the terms were agreed prior to the approval of the 2013 or 2016 policy or prior to an individual being appointed as aDirector. Minor amendments The Committee may make minor amendments for regulatory, tax or administrative purpose. |
| RELX Annual Report 2024 Report of the Audit Committee RELX Annual Report 2024 149 Overview Market segments Corporate responsibility Financial review Governance Financial statements and shareholder information - Report of the Audit Committee This report has been prepared by the Audit Committee and has been approved by the Board. It provides an overview of the membership, responsibilities and activities of the Committee. Membership Responsibilities The Committee comprises independent Non-Executive Directors. The members of the Committee who served during the year were: The main role and responsibility of the Committee is to assist the Board in fulfilling its oversight responsibilities regarding: Suzanne Wood (Chair) Alistair Cox June Felix Charlotte Hogg Andrew Sukawaty Of the current members of the Committee, Suzanne Wood, a Certified Public Accountant, is considered to have significant, recent and relevant financial experience. The Committee as a whole is deemed to have competence relevant to the sectors in which RELX operates. Please see pages 82 and 83 for full profiles of Audit Committee members. the integrity of the interim and full-year financial statements and financial reporting processes risk management and internal controls, and effectiveness of internal auditors the performance of the external auditors and the effectiveness of the external audit process, including monitoring the independence and objectivity of Ernst & Young LLP (EY) The Committee reports to the Board on its activities, identifying any matters in respect of which it considers that action or improvement is needed and making recommendations as to the steps to be taken. The terms of reference of the Audit Committee are reviewed annually and a copy is published on the RELX website, www.relx.com Financial reporting In discharging its responsibilities in respect of the 2024 interim and full-year financial statements, the Committee reviewed the following: AREAS OF SIGNIFICANT JUDGEMENT AND ESTIMATION NOTE AND PAGE REFERENCE IN ANNUAL REPORT Specific areas of significant accounting judgement and estimation, as set out in note 1 on page 145-146, reviewed and challenged by the Committee were: Capitalisation of internally developed intangible assets: The capitalisation of costs related to the development of new products and business infrastructure, together with the useful economic lives applied to the resulting assets, requires the exercise of judgement. The Committee received reports from the Group Financial Controller on the amounts capitalised and asset lives selected for major projects and outcome of impairment assessment performed. Note 14 165-167 Defined benefit pension obligation: The valuation of pension scheme liabilities is subject to judgement and estimation. The discount rate, inflation rate and mortality assumptions may have a material effect in determining the defined benefit pension obligation and costs which are reported in the financial statements. The Committee received and discussed regular reports from the Group Financial Controller on the methodology and the basis of the assumptions used. Note 6 152-156 The Committee discussed and challenged management’s assessment and was satisfied that all judgements and estimations had been appropriately made and the financial statement disclosures were appropriate. The Committee also discussed with the external auditor how management’s judgments and assertions were challenged and how professional scepticism was demonstrated during their audit of these areas. Market segments Governance and shareholder information Financial statements Financial review Corporate responsibility Overview 123 |
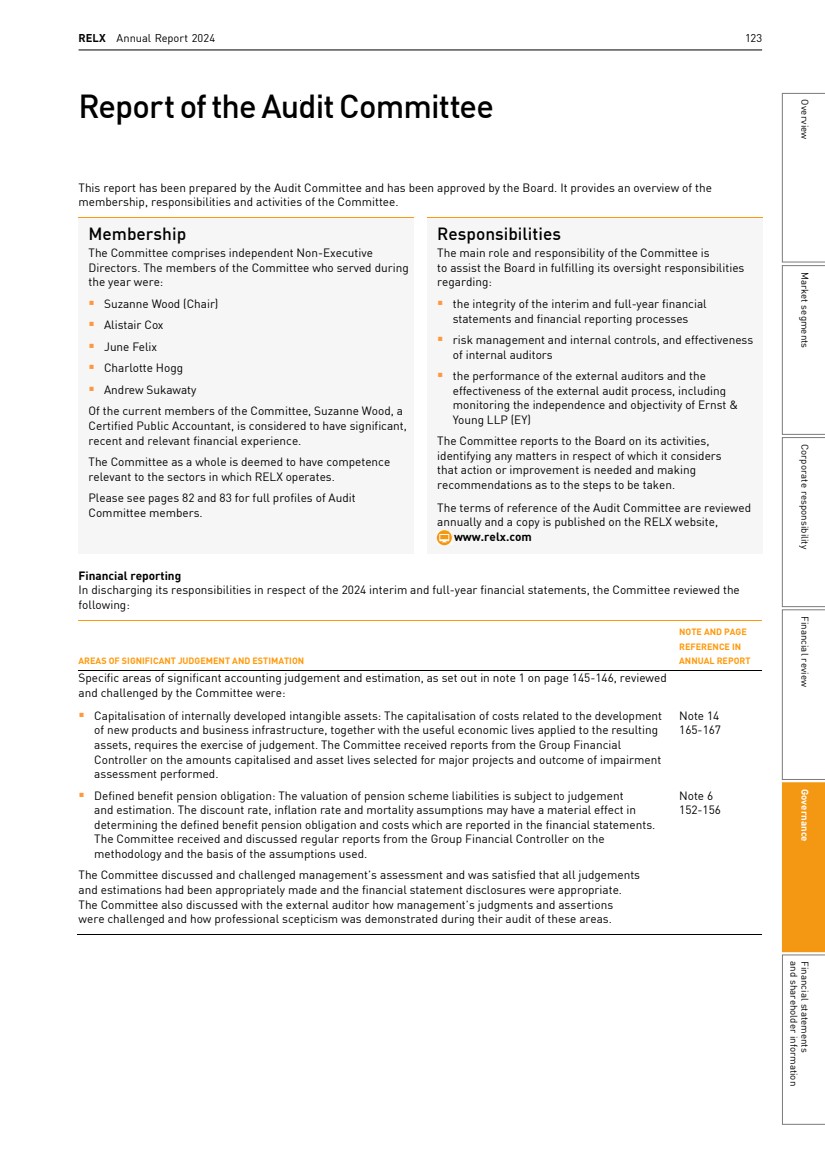
| 150 RELX Annual Report 2024 | Governance OTHER AREAS OF FOCUS PAGE REFERENCE IN ANNUAL REPORT Other areas reviewed by the Committee during the year were: Taxation: The valuation of provisions in relation to uncertain tax positions involves estimation. The Committee received and discussed reports from the Head of Tax on the potential liabilities identified and assumptions used. Carrying value of goodwill and intangible assets: The judgements and estimates in respect of asset carrying values relate to the assumptions underlying the value in use calculations such as discount rates and long-term growth assumptions. The Committee received and discussed reports from the Group Financial Controller on the methodology, the basis of assumptions used and headroom resulting from the annual impairment assessment. The Committee challenged management’s application of IAS 36 which allows a prior year detailed calculation of the recoverable amount of a Cash Generating Unit (CGU) to be used in the current year and were satisfied that all the required criteria were met. 158-161 165-167 Acquired intangible assets: The identification of separate intangible assets on acquisition requires judgement. Estimation is required in determining the future cash flows and discount rates used to value these assets. The Committee received and discussed reports from the Group Financial Controller on the methodology and the basis of the assumptions used. 165-167 Financing: Judgement is required in assessing the sufficiency and adequacy of current and future liquidity and funding requirements of the Group. The Committee received and discussed reports from the Group Treasurer on the Group’s financing including the issue of €850m euro-denominated term debt with a coupon of 3.375% and maturity of nine years and extension of the maturity date on the $3bn revolving credit facility to April 2027. See below for further information in respect of the Committee’s review of the going concern and viability assessments and related disclosure. Corporate Sustainability Reporting Directive (CSRD): For the year ended 31 December 2024, RELX has disclosed material sustainability information in accordance with the European Sustainability Reporting Standards (ESRS) for the first time. The Committee reviewed the Double Materiality Assessment completed by management and supported management’s conclusion on the identification of material sustainability matters. See below for further information in respect of the Committee’s review of the related disclosure. 169-175 208-231 The Committee was satisfied that all the above items had been appropriately considered and presented in this Annual Report. DISCLOSURE AND PRESENTATION PAGE REFERENCE IN ANNUAL REPORT As well as considering the Annual Report as a whole (see ‘Fair, balanced and understandable’ section below) the Committee focused on the following areas of disclosure and presentation: Reviewed the critical accounting policies and compliance with applicable accounting standards, reviewed other disclosure requirements and received regular update reports on accounting and regulatory developments 145-146 Reviewed the disclosures made in relation to internal control, risk management, the going concern statement and the viability statement. The Committee received and discussed reports from the Group Treasurer on the processes undertaken and assumptions used in formulating these disclosures 74-80 The going concern and viability statements were subject to a detailed review, including a review and challenge of the various adverse scenarios modelled to ensure that the statements made in relation to going concern and viability are robust 79-80 Considered the calculation and presentation of alternative performance measures in the Annual Report and results announcement, including associated reconciliations to GAAP measures 200-207 Reviewed the disclosures made in the Annual Report which incorporates: − The Corporate Responsibility Report − Disclosures in respect of the European Sustainability Reporting Standards (ESRS) and related material sustainability information; and − Disclosures in respect of the Task Force on Climate-Related Financial Disclosures (TCFD) recommendations. The Committee agreed with management’s conclusion that climate change risk is not material 35-65 208-231 236-241 The Committee was satisfied that all relevant disclosures have been appropriately made. 124 RELX Annual Report 2024 | Governance |
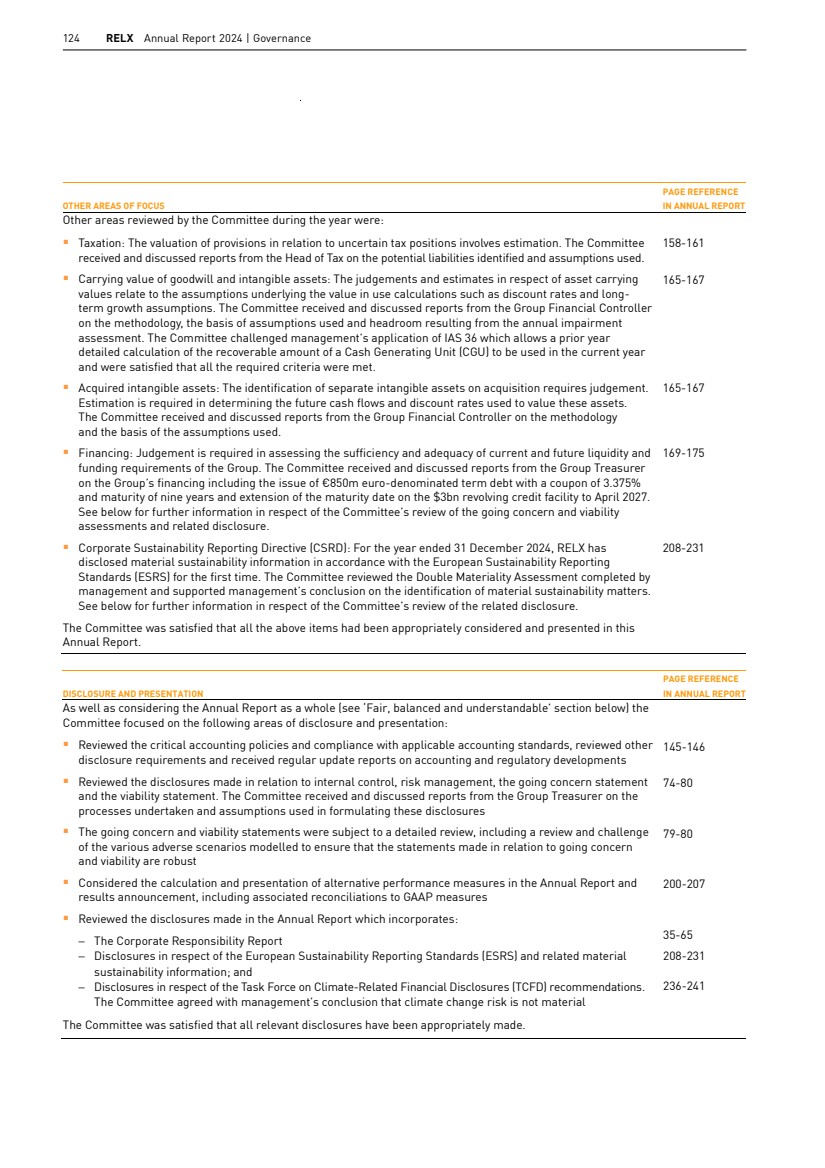
| RELX Annual Report 2024 151 Overview Market segments Corporate responsibility Financial review Governance Financial statements and shareholder information FAIR, BALANCED AND UNDERSTANDABLE The Committee considered whether the 2024 Annual Report is fair, balanced and understandable. In making this assessment, the Committee considered the following areas: The process for preparing the Annual Report, including the contributors, the internal review process and how feedback is addressed throughout the process The business review narratives presented for each Business Area The discussion of reported and underlying results throughout the report The Committee was satisfied that, taken as a whole, the Annual Report is fair, balanced and understandable. This conclusion has been reported to the Board. The Committee also received detailed written reports from the external auditors on these matters and discussed all areas with both management and the external auditors. The Committee was satisfied with the explanations provided and conclusions reached. Risk management and internal controls With respect to their oversight of risk management and internal controls, the Committee has: received and discussed regular reports summarising the status of the Group’s risk management activities including procedures to prevent and detect fraud, identification of emerging risks and actions to mitigate risks, and the findings from internal audits and status of actions agreed with management. Areas of focus in 2024 included: cybersecurity (including the ability to prevent, respond to and recover from a cyber-attack or ransomware attack); data privacy; the operational, financial and IT control environment; the use of technology including machine learning and operation of AI tools in line with RELX Responsible AI principles; regulatory compliance; business continuity and resilience (including supplier resilience and plans for extreme weather events); the ability to adapt to geopolitical, economic and market conditions; integrity of published Corporate Responsibility data; and continued compliance with the requirements of Section 404 of the US Sarbanes-Oxley Act relating to the documentation and testing of internal controls over financial reporting received regular updates from the Group Financial Controller and Group Treasurer on the Group’s financial position including on liquidity, extension of maturity of the revolving credit facility to April 2027, the bond issue, credit ratings and ability to access debt capital markets; changes to the regulatory reporting landscape including the approach to identifying material sustainability matters and compliance with the EU’s Corporate Sustainability Reporting Directive (CSRD); risk management and compliance with treasury policies, and pension arrangements and funding received presentations from the Head of Tax on tax matters and the Group’s tax principles reviewed and approved the internal audit plan for 2025 and monitored execution of the 2024 plan, including progress in respect of actions agreed and discussing and confirming any changes proposed received presentations from the Chief Compliance Officer on the compliance programme, including the operation of the RELX Code of Conduct, training programmes, whistleblowing arrangements and investigations being conducted received presentations from the Chief Legal Officer on legal issues and claims participated in ‘deep dive’ briefing sessions with senior management from the Business Areas on a variety of topics received comprehensive briefings from the external auditor and RELX management on the FRC’s UK Corporate Governance Code (UKCG) published in January 2024. This is applicable to RELX from 1 January 2025, excluding the enhanced internal control requirements where implementation is required for the year ended 31 December 2026. The Committee will work with management to identify the scope of material internal controls and the level of internal attestation work that will be performed in order to support the Board’s declaration of effectiveness of internal controls. This will build on the established risk and control framework which underpins existing US reporting obligations. received comprehensive briefings on the ‘Failure to Prevent Fraud’ offence enacted in October 2023 and applicable to RELX from 1 September 2025. Following its review of the Group’s risk management activities, the Committee were satisfied there are appropriate procedures in place to prevent and detect fraud. The Committee will work with management to identify enhancements that can be made to existing processes and procedures. Committee meetings The Committee met four times during 2024. The items of business to be considered at each meeting are set out in a schedule which is reviewed and approved by the Committee annually. The Audit Committee meetings are typically attended by the Board Chair, the Chief Executive Officer, the Chief Financial Officer, the Group Financial Controller, the Chief Legal Officer, the Head of Internal Audit & Assurance (IAA), and audit partners from the external auditors. External audit effectiveness and independence The Group has a well-established policy on audit effectiveness and independence of auditors that sets out among other things: the responsibilities of the Audit Committee in the selection of auditors to be proposed for appointment or re-appointment and for agreement on the terms of their engagement, scope and remuneration; the auditor independence requirements and the policy on the provision of non-audit services; the rotation of audit partners and staff; and the conduct of meetings between the auditors and the Audit Committee. The Committee’s policy on the use of the external auditor to provide non-audit services is in accordance with applicable laws and takes into account the relevant ethical guidance for auditors. Any permissible non-audit services must be pre-approved by the Chief Financial Officer and above £50,000, by the Chair of the Audit Committee. All non-audit services provided and fees are presented to the Committee on a regular basis. The policy is available on the website, www.relx.com. Market segments Governance and shareholder information Financial statements Financial review Corporate responsibility Overview RELX Annual Report 2024 | Report of the Audit Committee 125 |
| 152 RELX Annual Report 2024 | Governance The Committee has conducted its review of the performance of the external auditors and effectiveness of the external audit process for the year ended 31 December 2024. In doing so, the Committee has considered the independence, objectivity and level of professional scepticism exercised by the external auditor. The review included: an assessment of the quality of the auditor’s reporting to and interaction with the Audit Committee review of the responses to a detailed questionnaire covering a range of key audit areas which was completed by key stakeholders review of the completion of the audit plan and changes to risks identified or work performed a request for a presentation and discussion with EY on data analytics tools used in the audit consideration of public reports by regulatory authorities on key EY member firms and their view on the effectiveness of EY’s audits a survey of key stakeholders across RELX evaluating the performance of each audit team In 2024, the lead audit partner brought it to our attention that EY had been involved in a service which, whilst permissible under the SEC independence rules and the International Ethics Standards Board for Accountants (IESBA), was not permissible under the Financial Reporting Council (FRC) independence rules. The details are set out in the Independent Auditor’s Report on pages 132 to 139. The Committee agreed that this activity did not impact the independence of EY for the purposes of the audit. The Audit Committee holds private meetings with the external auditor to encourage open and transparent feedback. The Chair of the Committee also met with the external auditors outside of Committee meetings supporting effective and timely communication. Based on all the evidence presented, the Audit Committee was satisfied that the external audit has been conducted effectively, with appropriate rigour and challenge, and that EY had applied appropriate professional scepticism throughout the audit process. The external auditors have confirmed their independence and compliance with the policy on auditor independence to the Audit Committee. Non-audit services The external auditors are precluded from engaging in non-audit services that would compromise their independence or violate any professional requirements or regulations affecting their appointment as auditors. The auditors may, however, provide non-audit services which do not conflict with their independence. The Committee has reviewed and agreed the non-audit services provided in 2024 together with the associated fees. The non-audit services provided were very limited and, in line with the latest FRC guidance, linked to audit work such as a bond issue and corporate responsibility data assurance. The total fees payable to EY for the year ended 31 December 2024 were £9.0m of which £0.9m related to non-audit work. Further details are provided in note 4 to the financial statements. The non-audit fees remain below the 70% threshold as per the most recent FRC guidance. Auditor appointment EY were first appointed auditor of RELX PLC for the financial year ended 31 December 2016. The auditor is required to rotate the lead audit partner responsible for the engagement every five years. The year ended 31 December 2024 was the fourth year for the lead audit partner, Colin Brown. The Audit Committee confirms that RELX was in compliance with the provisions of The Statutory Audit Services for Large Companies Market Investigation (Mandatory Use of Competitive Tender Processes and Audit Committee Responsibilities) Order 2014 during the financial year ended 31 December 2024. In accordance with the terms of this Order, the Audit Committee conducted a comprehensive and competitive tender process during the year for the external audit for the financial year ending 31 December 2026. A decision to reappoint EY was recommended by the Committee and was approved by the Board of RELX. The decision was based on EY’s performance during the tender process across a comprehensive set of criteria and the Committee’s satisfaction with their effectiveness as our current auditor. The Committee has recommended to the Board that a Resolution to re-appoint EY as auditors for the year ending 31 December 2025 be proposed at the 2025 AGM which the Board has accepted and endorsed. Internal audit The Audit Committee’s terms of reference requires an annual review of internal audit effectiveness. RELX has an established Internal Audit function governed by a formal charter which requires an external assessment at least once every five years to consider and report on conformance with the Institute of Internal Auditors International Professional Practices Framework (IPPF) and UK Chartered Institute of Internal Auditors Internal Audit Code of Practice (CoP). The most recent external assessment of internal audit was carried out in 2022. The assessment identified areas of enhancement related to strategy, planning, operational excellence, and talent. All recommendations have been implemented. The Audit Committee annually receives and considers a report from the Head of the internal audit function on: the independence of the internal audit activity; a review of the internal audit Charter; conformance with the mandatory elements of the IPPF and CoP including the adequacy of resourcing of the internal audit function; and the results of its quality assurance and improvement programme. The Committee receives regular updates on talent management and succession planning within the internal audit function and on the continual monitoring of skill sets and capabilities to ensure that these remain appropriate. Audit Committee effectiveness The effectiveness of the Audit Committee was reviewed as part of the 2024 evaluation of the Board which confirmed that the Committee continues to function effectively. Details of the evaluation are set out on page 87. Suzanne Wood Chair of the Audit Committee 12 February 2025 126 RELX Annual Report 2024 | Governance |
| RELX Annual Report 2024 127 Directors’ Report The Directors’ Report for the year ended 31 December 2024 has been prepared in accordance with the requirements of the Companies Act 2006 (the Act), the UK Listing Rules (the LRs) andDisclosure Guidance and Transparency Rules (the DTRs). TheDirectors’ Report, together with the Strategic Report on pages 2 to 80, forms the management report for the purposes of the Financial Conduct Authority’s Disclosure and Transparency Rules 4.1.5R(2) and 4.1.8R. For the purposes of the Directors’ Report, RELX PLC and its subsidiaries, joint ventures and associates are together known as ‘RELX’ or the ‘Group’. RELX PLC (the Company) is a public company, limited by shares, and registered in England and Wales under registered number 77536. The Company’s registered office is 1-3 Strand, London, WC2N 5JR. Other disclosures Certain information required by the Act, LRs and DTRs is disclosed elsewhere in this Annual Report and incorporated by reference into this Directors’ Report in Table 1. Table 1 Disclosure Page(s) § Names of Directors during the year 92 § Corporate governance statement 86 to 98 § Dividends 72 and 164 § Financial instruments, financial risk management and hedging arrangements 169 to 175 § Future developments 2 to 33 § Employee engagement 50 to 52 and 94 § Engagement with customers, suppliers and others 46 to 49, 53 to 59, 93 to 96 § Employment of disabled persons 51 § Greenhouse gas emissions and energy consumption 53 to 56 and 243 Articles of Association Amendment The Company’s Articles of Association (the Articles) may only be amended by a special resolution of shareholders passed at a general meeting of the Company. Directors Appointment and replacement of Directors The appointment, re-appointment and replacement of Directors is governed by the Articles, the Companies Act 2006 and related legislation. Shareholders maintain their right to appoint and re-appoint Directors by way of an ordinary resolution in accordance with the Articles. The Directors may appoint additional or replacement Directors, who may only serve until the following AGM of the Company, at which time they must retire and, if appropriate, seek election by the Company’s shareholders. A Director may be removed from office by the Company as provided for by applicable law, in certain circumstances set out in the Articles, and at a general meeting of the Company by the passing of an ordinary resolution. The Articles provide for a Board of Directors consisting of not fewer than five, but not more than 20 Directors, who manage the business and affairs of the Company. Powers of Directors Subject to the provisions of the Companies Act 2006, the Articles and any directions given by special resolutions, the business of the Company shall be managed by the Board which may exercise all the powers of the Company. Directors’ indemnities In accordance with its Articles, the Company has granted its Directors an indemnity, to the extent permitted by law, in respect of liabilities incurred as a result of their office. This indemnity was in place for Directors that served at any time during the 2024 financial year, and also for each serving Director as at the date of approval of this report. The Company also purchased, and maintained throughout the year, directors’ and officers’ liability insurance in respect of its Directors. Shares Share capital The Company’s issued share capital comprises a single class of ordinary shares of 14 51⁄116 p each listed on the London and Amsterdam Stock Exchanges. The Company also has securities in the form of American Depositary Shares traded on the New York Stock Exchange. All issued shares are fully paid up and rank pari passu. The Company’s share capital as at the 31 December 2024 and details of share capital movements during the year are set out in note 23 to the consolidated financial statements. Rights and obligations The rights of holders of ordinary shares in the Company, in addition to those conferred under UK law, are set out in the Company’s Articles which are available at www.relx.com. In summary, holders of ordinary shares are entitled to: one vote for each ordinary share held; the right to attend and speak at general meetings of the Company or to appoint one or more proxies or, if they are a corporation, a corporate representative; and to exercise their voting rights. At a general meeting, on a show of hands every member who is present in person shall have one vote and every proxy present who has been duly appointed by one or more members entitled to vote on the resolution has one vote (although a proxy has one vote for and one vote against the resolution if: (i) the proxy has been duly appointed by more than one member entitled to vote on the resolution; and (ii) the proxy has been instructed by one or more of those members to vote for the resolution and by one or more other of those members to vote against it). On a vote on a resolution on a poll every member present in person or by proxy shall have one vote for every share of which he/she is the holder. Proxy appointments and voting instructions must be received by the Company’s registrars not less than 48 hours before the general meeting. Restrictions on the transfer of shares There are no restrictions on the sale or transfer of ordinary shares in the Company, or on the size of a holding. The Company is not aware of any agreements between shareholders that may result in a restriction in the transfer of shares or voting rights. Market segments Governance and shareholder information Financial statements Financial review Corporate responsibility Overview |
| 128 RELX Annual Report 2024 | Governance Authority to purchase own shares At the Company’s 2024 AGM, shareholders passed a resolution authorising the purchase of up to 190,700,000 ordinary shares in the Company (representing approximately 10% of the issued ordinary shares) by way of market purchase. This authority will expire at the 2025 AGM, when a resolution to renew the authority to purchase Company shares will be submitted to shareholders. During the year, 28,895,477 ordinary shares of 14 51⁄116 p each (representing 1.5% of the ordinary shares in issue at 31 December 2024) were purchased by the Company for a total consideration of £1bn, including expenses, and subsequently transferred to be held in treasury. A further 3.8m shares were purchased between 2 January 2025 and the date of this report. On 5 December 2024, the Company cancelled 29mordinary shares held in treasury. Therefore, as at 31 December 2024 there were 19,607,670 ordinary shares held in treasury, representing 1% of the ordinary shares in issue. The purpose of the share buyback programme is to reduce the capital of the Company. Share issuance At the 2024 AGM, shareholders passed a resolution authorising the Directors to issue shares for cash on a non-pre-emptive basis up to a nominal value of £13,500,000, representing approximately 5% of the Company’s issued share capital, and authorising the Directors to issue up to an additional 5% of the issued share capital for cash on a non-pre-emptive basis in connection with an acquisition or specified investment. Since the 2024 AGM, no shares have been issued under this authority. The shareholder authority also permits the Directors to issue shares in order to satisfy entitlements under employee share plans and details of such allotments are described below. During the year, 2,937,114 ordinary shares in the Company were issued in order to satisfy entitlements under employee share plans as follows: 600,732 under the UK SAYE Share Option Scheme at prices between 1,178.8p and 2,792.0p per share; 158,465 under the legacy Dutch Debenture Scheme at prices between 13.735 EUR and 19.235 EUR per share, which is satisfied by way of Company shares; 1,891,247 under executive share option schemes at prices between 924.5p and 3,402p per share; and 286,670 under the Employee Share Purchase Plan at $33.473 per share. Substantial share interests As at 31 December 2024, the Company had received the following notifications of interests in its share capital pursuant to Rule 5 of the Disclosure and Transparency Rules (DTRs): % of voting rights Date of notification BlackRock, Inc 9.67% 17 May 2022 Invesco Ltd. 4.99% 1 October 2019 The percentage interests stated above are as disclosed at the date on which the interests were notified to the Company and, as at the date of this report, the Company had not received any further notifications under DTR 5. These percentages do not reflect changes to the Company’s total voting rights since the date of notification or any subsequent changes to share interests not notified to the Company under DTR 5 and therefore may not reflect the interests held as at 31 December 2024, or at the date ofthis report. Employee Benefit Trust As at 31 December 2024, the Employee Benefit Trust trustee held an interest in 5,295,154 ordinary shares in the Company, representing 0.3% of the issued ordinary shares. The trustee may vote or abstain from voting any shares it holds in any way it sees fit. Other information Branches Our activities and interests are operated through subsidiaries, branches of subsidiaries, joint arrangements and associates which are subject to the laws and regulations of many different jurisdictions. Disclosures required under UK Listing Rule 6.6.1 The information required by Listing Rule 6.6.1 is set out on the pages below: Information required Page (1) Interest capitalised by the Group n/a (2) Publication of unaudited financial information n/a (4) Long-term incentive schemes n/a (5) Waiver of emoluments by a director n/a (6) Waiver of future emoluments by a director n/a (7) Non pro-rata allotments for cash (issuer) n/a (8) Non pro-rata allotments for cash (major subsidiaries) n/a (9) Parent participation in a placing by a listed subsidiary n/a (10) Contracts of significance n/a (11) Provision of services by a controlling shareholder n/a (12) Shareholder waiver of dividends 164 (13) Shareholder waiver of future dividends 164 (14) Agreements with controlling shareholders n/a Significant agreements and change of control There are a number of borrowing agreements including credit facilities that, in the event of a change of control of RELX PLC and, in some cases, a consequential credit rating downgrade to sub-investment grade may, at the option of the lenders, require repayment and/or cancellation as appropriate. There are no arrangements between the Company and its Directors or employees providing for compensation for loss of office or employment that occurs specifically because of a takeover, merger or amalgamation with the exception of provisions in the Company’s share plans which could result in options or awards vesting or becoming exercisable on a change of control. No contract existed during the year in relation to the Company’s business in which any Director was materially interested. Political donations RELX does not make donations to UK or European Union (EU) political organisations or incur UK or EU political expenditure. Inthe US in 2024, RELX Inc. made contributions to state candidates, state political parties and related state organisations totalling $198,000 (2023: $194,000). |
| RELX Annual Report 2024 | Directors’ Report 129 Research and development RELX undertakes research and development activities in the areas of machine learning, natural language processing, predictive analytics, content search, and other technologies to innovate and enhance our product offering and customer experience across our business areas. 2025 AGM The next AGM of the Company will be held at 9.30 am on Thursday, 24April 2025 at Lexis House, 30 Farringdon Street, London EC4A4HH. Auditor re-appointment Resolutions for the re-appointment of Ernst & Young LLP as auditor of the Company and to authorise the Audit Committee, on behalf of the Board, to determine the external auditor’s remuneration, will be put to shareholders at the Company’s 2025 AGM. Disclosure of information to auditors Each of the directors in office as at the date of this Annual Report confirms that: § so far as the Director is aware, there is no relevant audit information of which the Company’s auditors are unaware; and § he/she has taken all the steps that he/she ought to have taken as a Director to make himself/herself aware of any relevant audit information and to establish that the Company’s auditors are aware of that information. Statement of Directors’ responsibilities The Directors are responsible for preparing the Annual Report and financial statements in accordance with applicable law and regulations. Company law requires the Directors to prepare financial statements for each financial year. Under that law, the Directors have prepared consolidated financial statements in accordance with UK adopted International Accounting Standards (IAS) in conformity with the requirements of the Companies Act 2006 and IFRS accounting standards as issued by the International Accounting Standards Board. Under company law the Directors must not approve the accounts unless they are satisfied that they give a true and fair view of the state of affairs of the Company and of the Group and of the profit or loss of the Company and of the Group for that period. In preparing the individual Company’s financial statements, the Directors are required to: § select suitable accounting policies and then apply them consistently; § make judgements and accounting estimates that are reasonable and prudent; § state whether UK adopted IAS in conformity with the requirements of the Companies Act 2006 and IFRS accounting standards as issued by the International Accounting Standards Board has been followed, subject to any material departures being disclosed and explained in the financial statements; and § prepare the financial statements on a going concern basis unless it is inappropriate to presume that the Company will continue in business. In preparing the Group financial statements, IAS 1 requires that Directors: § select suitable accounting policies and then apply them consistently; § properly select and apply accounting policies; present information, including accounting policies, in a manner that provides relevant, reliable, comparable and understandable information; § provide additional disclosures when compliance with the specific requirements of IFRS are insufficient to enable users to understand the impact of particular transactions or other events and conditions on the entity’s financial position and financial performance; and § make an assessment of the Group’s ability to continue as a going concern. The Directors are responsible for keeping adequate accounting records that are sufficient to show and explain the Group and Company’s transactions and disclose with reasonable accuracy at any time the financial position of the Group and the Company and enable them to ensure that the Annual Report and financial statements comply with the Companies Act 2006. They are also responsible for safeguarding the assets of the Company and hence for taking reasonable steps for the prevention and detection of fraud and other irregularities. The Directors are also responsible for preparing a Strategic report, Directors’ report, Annual report on remuneration, and Corporate governance statement in compliance with applicable laws and regulations. The Directors are responsible for the maintenance and integrity of the Company’s website. Legislation in the United Kingdom governing the preparation and dissemination of financial statements may differ from legislation in other jurisdictions. Each of the Directors confirms that, to the best of their knowledge: § the consolidated and parent company financial statements, prepared in accordance with UK adopted IAS in conformity with the requirements of the Companies Act 2006 and IFRS accounting standards as issued by the International Accounting Standards Board, give a true and fair view of the assets, liabilities, financial position and profit or loss of the Group; § the Strategic report includes a fair review of the development and performance of the business and the position of the Group, together with a description of the principal and emerging risks and uncertainties that it faces; and § the Annual Report and Financial Statements, taken as a whole, is fair, balanced and understandable and provides the information necessary for shareholders to assess the Company’s position and performance, business model and strategy. By order of the Board Henry Udow Company Secretary 12 February 2025 Market segments Governance and shareholder information Financial statements Financial review Corporate responsibility Overview |
| 130 RELX Annual Report 2024 Financial statements and other information In this section 140 Consolidated financial statements 145 Notes to the consolidated financial statements 187 5 year summary |
| RELX Annual Report 2024 131 Financial review and shareholder information Financial statements Governance Corporate responsibility Overview Market segments |

| THIS PAGE IS INTENTIONALLY BLANK 132 RELX Annual Report 2024 | Financial statements and other information |

| THIS PAGE IS INTENTIONALLY BLANK and shareholder information Financial statements Governance Market segments Financial review Corporate responsibility Overview RELX Annual Report 2024 | Independent auditor’s report to the members of RELX PLC 133 |

| THIS PAGE IS INTENTIONALLY BLANK 134 RELX Annual Report 2024 | Financial statements and other information |

| THIS PAGE IS INTENTIONALLY BLANK and shareholder information Financial statements Governance Market segments Financial review Corporate responsibility Overview RELX Annual Report 2024 | Independent auditor’s report to the members of RELX PLC 135 |

| THIS PAGE IS INTENTIONALLY BLANK 136 RELX Annual Report 2024 | Financial statements and other information |

| THIS PAGE IS INTENTIONALLY BLANK and shareholder information Financial statements Governance Market segments Financial review Corporate responsibility Overview RELX Annual Report 2024 | Independent auditor’s report to the members of RELX PLC 137 |

| THIS PAGE IS INTENTIONALLY BLANK 138 RELX Annual Report 2024 | Financial statements and other information |

| THIS PAGE IS INTENTIONALLY BLANK and shareholder information Financial statements Governance Market segments Financial review Corporate responsibility Overview RELX Annual Report 2024 | Independent auditor’s report to the members of RELX PLC 139 |
| 140 RELX Annual Report 2024 | Financial statements and other information Consolidated income statement FOR THE YEAR ENDED 31 DECEMBER Note 2022 GBPm 2023 GBPm 2024 GBPm Revenue 2 8,553 9,161 9,434 Cost of sales (3,045) (3,216) (3,300) Gross profit 5,508 5,945 6,134 Selling and distribution costs (1,385) (1,459) (1,470) Administration and other expenses (1,819) (1,850) (1,846) Share of results of joint ventures and associates 19 46 43 Operating profit 2, 3 2,323 2,682 2,861 Finance income 7 4 8 6 Finance costs 7 (205) (323) (304) Net finance costs (201) (315) (298) Disposals and other non-operating items 8 (9) (72) (6) Profit before tax 2,113 2,295 2,557 Current tax (534) (575) (607) Deferred tax 53 68 (6) Tax expense 9 (481) (507) (613) Net profit for the year 1,632 1,788 1,944 Attributable to: Shareholders 1,634 1,781 1,934 Non-controlling interests (2) 7 10 Net profit for the year 1,632 1,788 1,944 Earnings per share FOR THE YEAR ENDED 31 DECEMBER 2022 2023 2024 Basic earnings per share 10 85.2p 94.1p 103.6p Diluted earnings per share 10 84.7p 93.6p 103.1p 140 RELX Annual Report 2024 | Financial statements and other information Consolidated income statement FOR THE YEAR ENDED 31 DECEMBER Note 2022 GBPm 2023 GBPm 2024 GBPm Revenue 2 8,553 9,161 9,434 Cost of sales (3,045) (3,216) (3,300) Gross profit 5,508 5,945 6,134 Selling and distribution costs (1,385) (1,459) (1,470) Administration and other expenses (1,819) (1,850) (1,846) Share of results of joint ventures and associates 19 46 43 Operating profit 2, 3 2,323 2,682 2,861 Finance income 7 4 8 6 Finance costs 7 (205) (323) (304) Net finance costs (201) (315) (298) Disposals and other non-operating items 8 (9) (72) (6) Profit before tax 2,113 2,295 2,557 Current tax (534) (575) (607) Deferred tax 53 68 (6) Tax expense 9 (481) (507) (613) Net profit for the year 1,632 1,788 1,944 Attributable to: Shareholders 1,634 1,781 1,934 Non-controlling interests (2) 7 10 Net profit for the year 1,632 1,788 1,944 Earnings per share FOR THE YEAR ENDED 31 DECEMBER 2022 2023 2024 Basic earnings per share 10 85.2p 94.1p 103.6p Diluted earnings per share 10 84.7p 93.6p 103.1p 140 RELX Annual Report 2024 | Financial statements and other information Consolidated income statement FOR THE YEAR ENDED 31 DECEMBER Note 2022 GBPm 2023 GBPm 2024 GBPm Revenue 2 8,553 9,161 9,434 Cost of sales (3,045) (3,216) (3,300) Gross profit 5,508 5,945 6,134 Selling and distribution costs (1,385) (1,459) (1,470) Administration and other expenses (1,819) (1,850) (1,846) Share of results of joint ventures and associates 19 46 43 Operating profit 2, 3 2,323 2,682 2,861 Finance income 7 4 8 6 Finance costs 7 (205) (323) (304) Net finance costs (201) (315) (298) Disposals and other non-operating items 8 (9) (72) (6) Profit before tax 2,113 2,295 2,557 Current tax (534) (575) (607) Deferred tax 53 68 (6) Tax expense 9 (481) (507) (613) Net profit for the year 1,632 1,788 1,944 Attributable to: Shareholders 1,634 1,781 1,934 Non-controlling interests (2) 7 10 Net profit for the year 1,632 1,788 1,944 Earnings per share FOR THE YEAR ENDED 31 DECEMBER 2022 2023 2024 Basic earnings per share 10 85.2p 94.1p 103.6p Diluted earnings per share 10 84.7p 93.6p 103.1p 140 RELX Annual Report 2024 | Financial statements and other information |
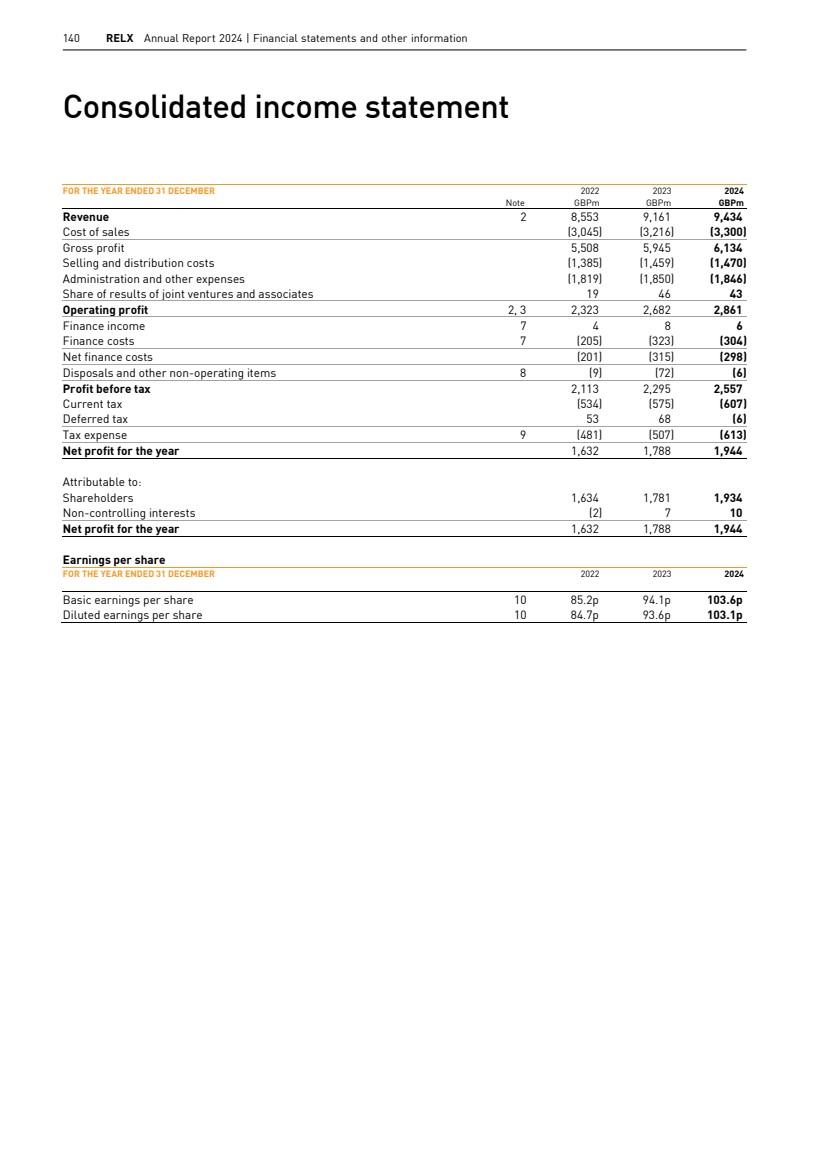
| RELX Annual Report 2024 141 Overview Market segments Corporate responsibility Financial review Governance Financial statements and shareholder information Consolidated statement of comprehensive income FOR THE YEAR ENDED 31 DECEMBER Note 2022 GBPm 2023 GBPm 2024 GBPm Net profit for the year 1,632 1,788 1,944 Items that will not be reclassified to profit or loss: Actuarial gains/(losses) on defined benefit pension schemes 6 164 (75) 43 Tax on items that will not be reclassified to profit or loss 9 (43) 19 (11) Total items that will not be reclassified to profit or loss 121 (56) 32 Items that may be reclassified subsequently to profit or loss: Exchange differences on translation of foreign operations 427 (285) 175 Fair value movements on cash flow hedges 17 (18) 29 11 Transfer to profit from cash flow hedge reserve 17 (17) 18 (20) Tax on items that may be reclassified to profit or loss 9 8 (12) 3 Total items that may be reclassified to profit or loss 400 (250) 169 Other comprehensive income/(loss) for the year 521 (306) 201 Total comprehensive income for the year 2,153 1,482 2,145 Attributable to: Shareholders 2,155 1,475 2,135 Non-controlling interests (2) 7 10 Total comprehensive income for the year 2,153 1,482 2,145 RELX Annual Report 2024 141 Overview Market segments Corporate responsibility Financial review Governance Financial statements and shareholder information Consolidated statement of comprehensive income FOR THE YEAR ENDED 31 DECEMBER Note 2022 GBPm 2023 GBPm 2024 GBPm Net profit for the year 1,632 1,788 1,944 Items that will not be reclassified to profit or loss: Actuarial gains/(losses) on defined benefit pension schemes 6 164 (75) 43 Tax on items that will not be reclassified to profit or loss 9 (43) 19 (11) Total items that will not be reclassified to profit or loss 121 (56) 32 Items that may be reclassified subsequently to profit or loss: Exchange differences on translation of foreign operations 427 (285) 175 Fair value movements on cash flow hedges 17 (18) 29 11 Transfer to profit from cash flow hedge reserve 17 (17) 18 (20) Tax on items that may be reclassified to profit or loss 9 8 (12) 3 Total items that may be reclassified to profit or loss 400 (250) 169 Other comprehensive income/(loss) for the year 521 (306) 201 Total comprehensive income for the year 2,153 1,482 2,145 Attributable to: Shareholders 2,155 1,475 2,135 Non-controlling interests (2) 7 10 Total comprehensive income for the year 2,153 1,482 2,145 and shareholder information Financial statements Governance Market segments Financial review Corporate responsibility Overview RELX Annual Report 2024 141 |
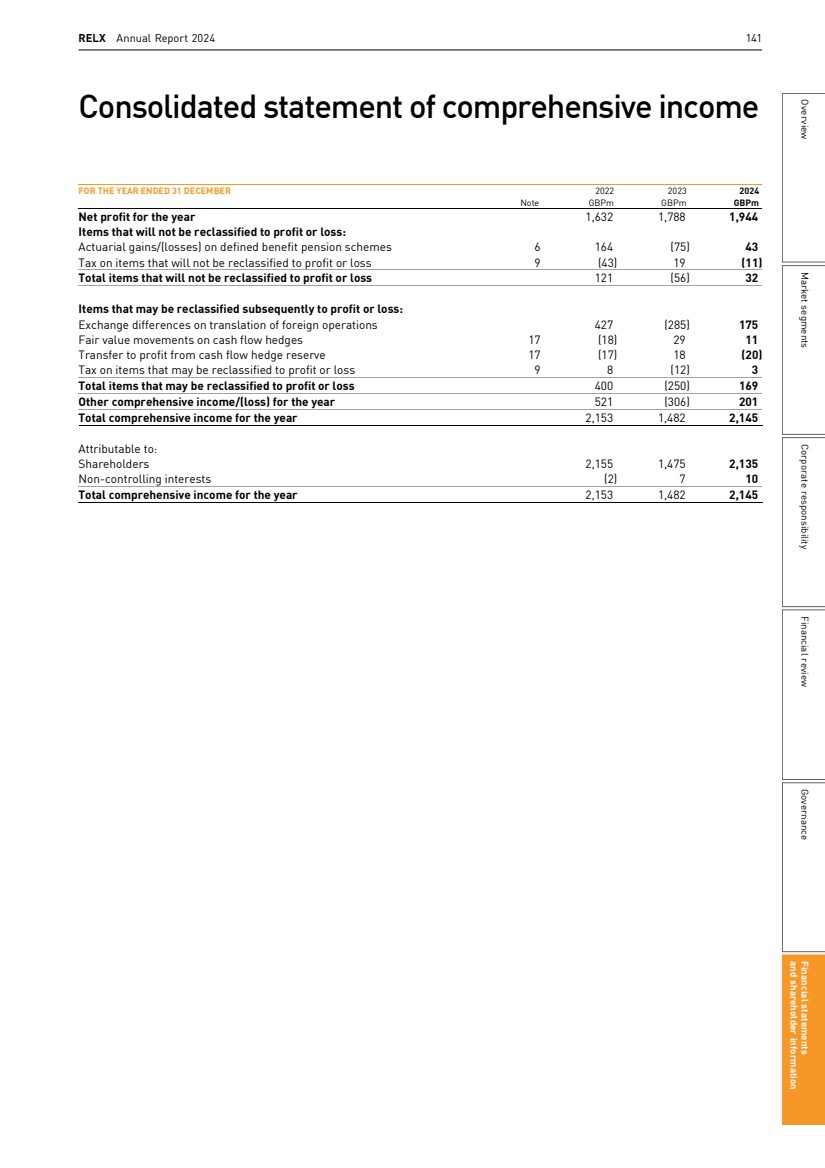
| 142 RELX Annual Report 2024 | Financial statements and other information Consolidated statement of cash flows FOR THE YEAR ENDED 31 DECEMBER Note 2022 GBPm 2023 GBPm 2024 GBPm Cash flows from operating activities Cash generated from operations 11 3,061 3,370 3,521 Interest paid (including lease interest) (169) (303) (257) Interest received 4 9 6 Tax paid (net) (495) (619) (662) Net cash from operating activities 2,401 2,457 2,608 Cash flows from investing activities Acquisitions 11 (394) (124) (170) Purchases of property, plant and equipment 16 (36) (30) (20) Expenditure on internally developed intangible assets 14 (400) (447) (464) Purchase of investments (66) (8) (4) Proceeds from disposals of property, plant and equipment - 7 - Gross proceeds from business disposals and sale of investments 19 21 74 Payments on business disposals (15) (9) (28) Dividends received from joint ventures and associates 33 21 37 Net cash used in investing activities (859) (569) (575) Cash flows from financing activities Dividends paid to shareholders 13 (983) (1,059) (1,121) Distributions to non-controlling interests (9) (7) (9) (Decrease)/increase in short-term bank loans, overdrafts and commercial paper 11 (101) 84 461 Issuance of term debt 11 397 651 711 Repayment of term debt 11 (35) (847) (1,017) Repayment of leases 11 (79) (72) (63) Receipts in respect of subleases 11 1 2 2 Acquisition of non-controlling interest (1) - (1) Repurchase of ordinary shares 23 (500) (800) (1,000) Purchase of shares by Employee Benefit Trust 23 (50) (50) (75) Proceeds on issue of ordinary shares 26 41 47 Net cash used in financing activities (1,334) (2,057) (2,065) Increase/(decrease) in cash and cash equivalents 11 208 (169) (32) Movement in cash and cash equivalents At start of year 113 334 155 Increase/(decrease) in cash and cash equivalents 208 (169) (32) Exchange translation differences 13 (10) (4) At end of year 334 155 119 142 RELX Annual Report 2024 | Financial statements and other information Consolidated statement of cash flows FOR THE YEAR ENDED 31 DECEMBER Note 2022 GBPm 2023 GBPm 2024 GBPm Cash flows from operating activities Cash generated from operations 11 3,061 3,370 3,521 Interest paid (including lease interest) (169) (303) (257) Interest received 4 9 6 Tax paid (net) (495) (619) (662) Net cash from operating activities 2,401 2,457 2,608 Cash flows from investing activities Acquisitions 11 (394) (124) (170) Purchases of property, plant and equipment 16 (36) (30) (20) Expenditure on internally developed intangible assets 14 (400) (447) (464) Purchase of investments (66) (8) (4) Proceeds from disposals of property, plant and equipment - 7 - Gross proceeds from business disposals and sale of investments 19 21 74 Payments on business disposals (15) (9) (28) Dividends received from joint ventures and associates 33 21 37 Net cash used in investing activities (859) (569) (575) Cash flows from financing activities Dividends paid to shareholders 13 (983) (1,059) (1,121) Distributions to non-controlling interests (9) (7) (9) (Decrease)/increase in short-term bank loans, overdrafts and commercial paper 11 (101) 84 461 Issuance of term debt 11 397 651 711 Repayment of term debt 11 (35) (847) (1,017) Repayment of leases 11 (79) (72) (63) Receipts in respect of subleases 11 1 2 2 Acquisition of non-controlling interest (1) - (1) Repurchase of ordinary shares 23 (500) (800) (1,000) Purchase of shares by Employee Benefit Trust 23 (50) (50) (75) Proceeds on issue of ordinary shares 26 41 47 Net cash used in financing activities (1,334) (2,057) (2,065) Increase/(decrease) in cash and cash equivalents 11 208 (169) (32) Movement in cash and cash equivalents At start of year 113 334 155 Increase/(decrease) in cash and cash equivalents 208 (169) (32) Exchange translation differences 13 (10) (4) At end of year 334 155 119 142 RELX Annual Report 2024 | Financial statements and other information |
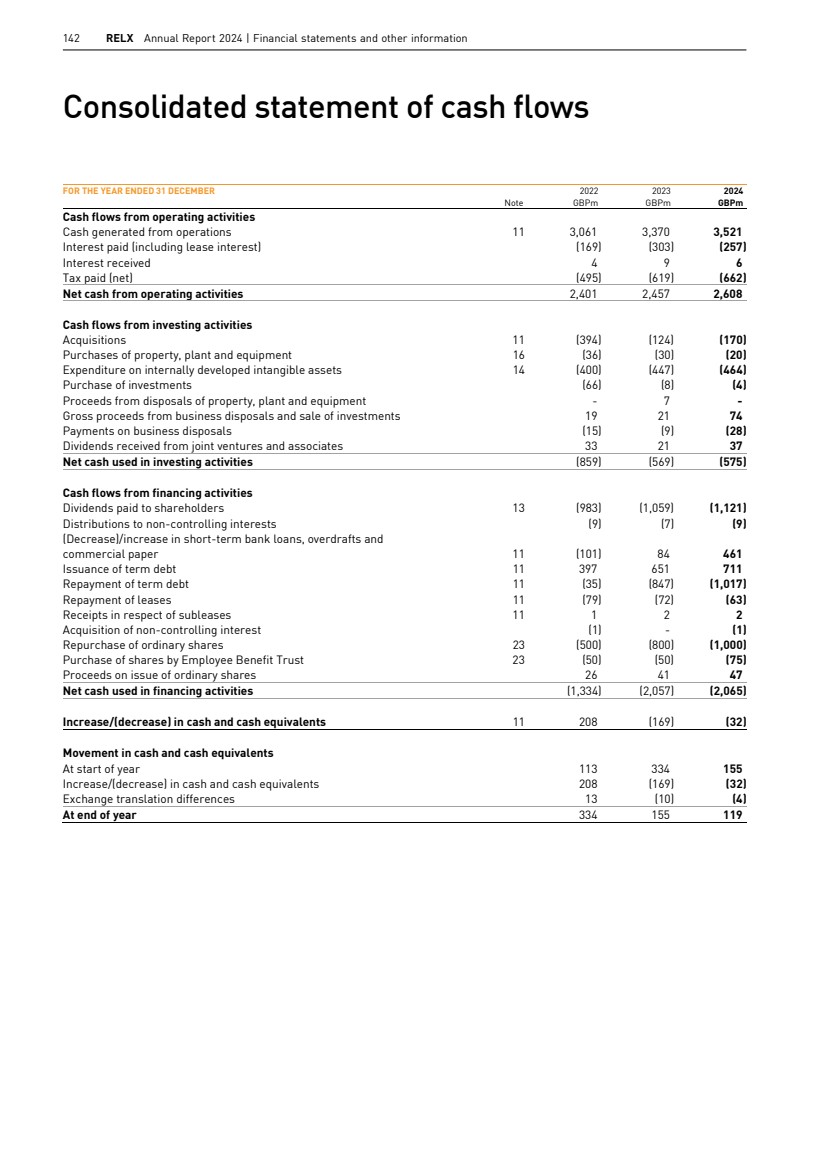
| RELX Annual Report 2024 143 Overview Market segments Corporate responsibility Financial review Governance Financial statements and shareholder information Consolidated statement of financial position AS AT 31 DECEMBER Note 2023 GBPm 2024 GBPm Non-current assets Goodwill 14 8,023 8,216 Intangible assets 14 3,238 3,164 Investments in joint ventures and associates 15 178 169 Other investments 15 97 92 Property, plant and equipment 16 99 82 Right-of-use assets 22 113 89 Other receivables 1 16 Deferred tax assets 9 128 84 Net pension assets 6 119 186 Derivative financial instruments 17 47 39 12,043 12,137 Current assets Inventories and pre-publication costs 18 318 331 Trade and other receivables 19 2,323 2,511 Derivative financial instruments 17 34 35 Cash and cash equivalents 11 155 119 2,830 2,996 Assets held for sale 44 - 2,874 2,996 Total assets 14,917 15,133 Current liabilities Trade and other payables 20 3,971 4,122 Derivative financial instruments 17 16 59 Debt 21 1,313 1,412 Taxation 9 163 119 Provisions 13 6 5,476 5,718 Liabilities associated with assets held for sale 14 - 5,490 5,718 Non-current liabilities Derivative financial instruments 17 131 126 Debt 21 5,184 5,132 Deferred tax liabilities 9 473 473 Net pension obligations 6 182 165 Other payables 11 13 Provisions 7 2 5,988 5,911 Total liabilities 11,478 11,629 Net assets 3,439 3,504 Capital and reserves Share capital 23 275 272 Share premium 1,558 1,605 Shares held in treasury 23 (553) (722) Translation reserve 392 567 Other reserves 24 1,788 1,759 Shareholders’ equity 3,460 3,481 Non-controlling interests (21) 23 Total equity 3,439 3,504 The consolidated financial statements were approved by the Board of Directors and authorised for issue on 12 February 2025. They were signed on its behalf by: N L Luff Chief Financial Officer RELX Annual Report 2024 143 Overview Market segments Corporate responsibility Financial review Governance Financial statements and shareholder information Consolidated statement of financial position AS AT 31 DECEMBER Note 2023 GBPm 2024 GBPm Non-current assets Goodwill 14 8,023 8,216 Intangible assets 14 3,238 3,164 Investments in joint ventures and associates 15 178 169 Other investments 15 97 92 Property, plant and equipment 16 99 82 Right-of-use assets 22 113 89 Other receivables 1 16 Deferred tax assets 9 128 84 Net pension assets 6 119 186 Derivative financial instruments 17 47 39 12,043 12,137 Current assets Inventories and pre-publication costs 18 318 331 Trade and other receivables 19 2,323 2,511 Derivative financial instruments 17 34 35 Cash and cash equivalents 11 155 119 2,830 2,996 Assets held for sale 44 - 2,874 2,996 Total assets 14,917 15,133 Current liabilities Trade and other payables 20 3,971 4,122 Derivative financial instruments 17 16 59 Debt 21 1,313 1,412 Taxation 9 163 119 Provisions 13 6 5,476 5,718 Liabilities associated with assets held for sale 14 - 5,490 5,718 Non-current liabilities Derivative financial instruments 17 131 126 Debt 21 5,184 5,132 Deferred tax liabilities 9 473 473 Net pension obligations 6 182 165 Other payables 11 13 Provisions 7 2 5,988 5,911 Total liabilities 11,478 11,629 Net assets 3,439 3,504 Capital and reserves Share capital 23 275 272 Share premium 1,558 1,605 Shares held in treasury 23 (553) (722) Translation reserve 392 567 Other reserves 24 1,788 1,759 Shareholders’ equity 3,460 3,481 Non-controlling interests (21) 23 Total equity 3,439 3,504 The consolidated financial statements were approved by the Board of Directors and authorised for issue on 12 February 2025. They were signed on its behalf by: N L Luff Chief Financial Officer and shareholder information Financial statements Governance Market segments Financial review Corporate responsibility Overview RELX Annual Report 2024 143 |
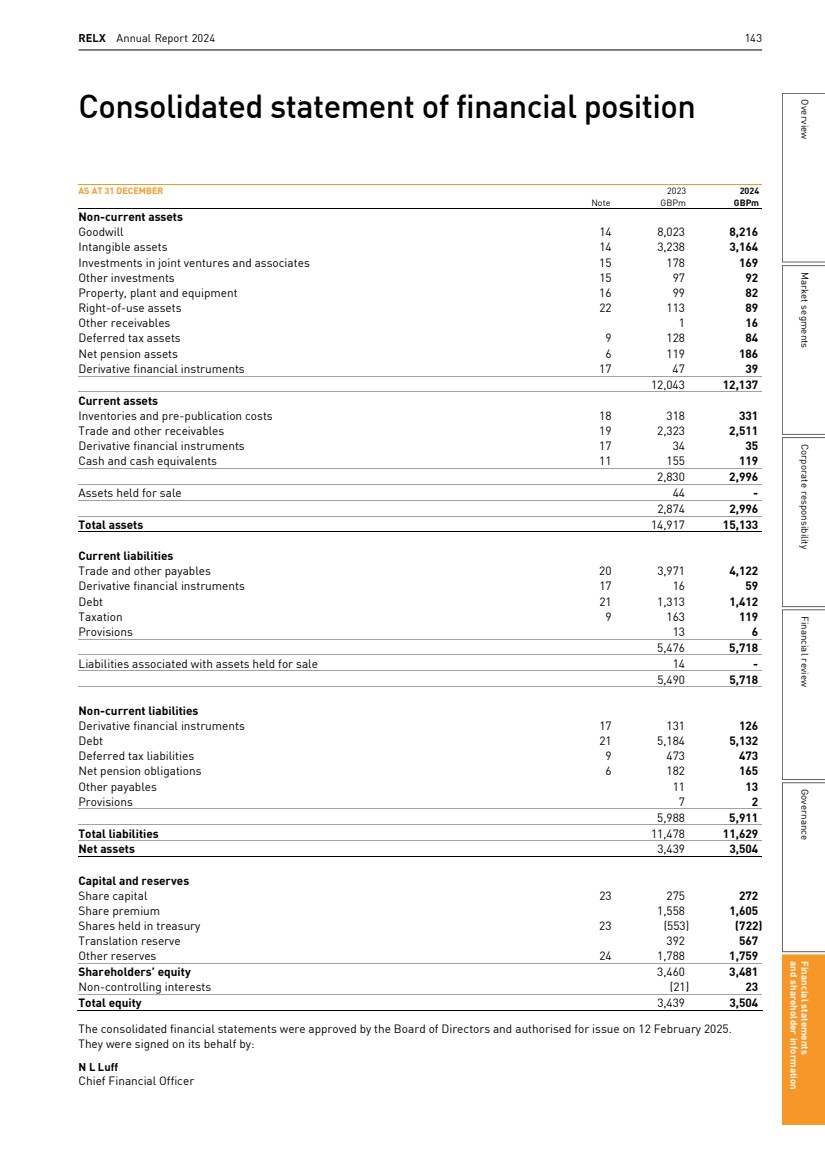
| 144 RELX Annual Report 2024 | Financial statements and other information Consolidated statement of changes in equity Note Share capital GBPm Share premium GBPm Shares held in treasury GBPm Translation reserve GBPm Other reserves GBPm Shareholders’ equity GBPm Non-controlling interests GBPm Total equity GBPm Balance at 1 January 2022 286 1,491 (876) 250 2,081 3,232 (8) 3,224 Total comprehensive income for the year - - - 427 1,728 2,155 (2) 2,153 Dividends paid 13 - - - - (983) (983) (9) (992) Issue of ordinary shares, net of expenses 23 - 26 - - - 26 - 26 Repurchase of ordinary shares - - (650) - - (650) - (650) Purchase of shares by the employee benefit trust 23 - - (50) - - (50) - (50) Cancellation of shares 23 (7) - 1,127 - (1,120) - - - Increase in share based remuneration reserve (including tax) - - - - 47 47 - 47 Settlement of share awards - - 35 - (35) - - - Acquisition of non-controlling interest - - - - (1) (1) - (1) Exchange differences on translation of capital and reserves - - - - - - (3) (3) Balance at 1 January 2023 279 1,517 (414) 677 1,717 3,776 (22) 3,754 Total comprehensive income for the year - - - (285) 1,760 1,475 7 1,482 Dividends paid 13 - - - - (1,059) (1,059) (7) (1,066) Issue of ordinary shares, net of expenses 23 - 41 - - - 41 - 41 Repurchase of ordinary shares - - (800) - - (800) - (800) Purchase of shares by the employee benefit trust 23 - - (50) - - (50) - (50) Cancellation of shares 23 (4) - 677 - (673) - - - Increase in share based remuneration reserve (including tax) - - - - 77 77 - 77 Settlement of share awards - - 34 - (34) - - - Exchange differences on translation of capital and reserves - - - - - - 1 1 Balance at 1 January 2024 275 1,558 (553) 392 1,788 3,460 (21) 3,439 Total comprehensive income for the year - - - 175 1,960 2,135 10 2,145 Dividends paid 13 - - - - (1,121) (1,121) (9) (1,130) Issue of ordinary shares, net of expenses 23 - 47 - - - 47 - 47 Repurchase of ordinary shares - - (1,000) - - (1,000) - (1,000) Purchase of shares by the employee benefit trust 23 - - (75) - - (75) - (75) Cancellation of shares 23 (3) - 853 - (850) - - - Increase in share based remuneration reserve (including tax) - - - - 79 79 - 79 Settlement of share awards - - 53 - (53) - - - Acquisition of non-controlling interest - - - - (44) (44) 43 (1) Balance at 31 December 2024 272 1,605 (722) 567 1,759 3,481 23 3,504 144 RELX Annual Report 2024 | Financial statements and other information Consolidated statement of changes in equity Note Share capital GBPm Share premium GBPm Shares held in treasury GBPm Translation reserve GBPm Other reserves GBPm Shareholders’ equity GBPm Non-controlling interests GBPm Total equity GBPm Balance at 1 January 2022 286 1,491 (876) 250 2,081 3,232 (8) 3,224 Total comprehensive income for the year - - - 427 1,728 2,155 (2) 2,153 Dividends paid 13 - - - - (983) (983) (9) (992) Issue of ordinary shares, net of expenses 23 - 26 - - - 26 - 26 Repurchase of ordinary shares - - (650) - - (650) - (650) Purchase of shares by the employee benefit trust 23 - - (50) - - (50) - (50) Cancellation of shares 23 (7) - 1,127 - (1,120) - - - Increase in share based remuneration reserve (including tax) - - - - 47 47 - 47 Settlement of share awards - - 35 - (35) - - - Acquisition of non-controlling interest - - - - (1) (1) - (1) Exchange differences on translation of capital and reserves - - - - - - (3) (3) Balance at 1 January 2023 279 1,517 (414) 677 1,717 3,776 (22) 3,754 Total comprehensive income for the year - - - (285) 1,760 1,475 7 1,482 Dividends paid 13 - - - - (1,059) (1,059) (7) (1,066) Issue of ordinary shares, net of expenses 23 - 41 - - - 41 - 41 Repurchase of ordinary shares - - (800) - - (800) - (800) Purchase of shares by the employee benefit trust 23 - - (50) - - (50) - (50) Cancellation of shares 23 (4) - 677 - (673) - - - Increase in share based remuneration reserve (including tax) - - - - 77 77 - 77 Settlement of share awards - - 34 - (34) - - - Exchange differences on translation of capital and reserves - - - - - - 1 1 Balance at 1 January 2024 275 1,558 (553) 392 1,788 3,460 (21) 3,439 Total comprehensive income for the year - - - 175 1,960 2,135 10 2,145 Dividends paid 13 - - - - (1,121) (1,121) (9) (1,130) Issue of ordinary shares, net of expenses 23 - 47 - - - 47 - 47 Repurchase of ordinary shares - - (1,000) - - (1,000) - (1,000) Purchase of shares by the employee benefit trust 23 - - (75) - - (75) - (75) Cancellation of shares 23 (3) - 853 - (850) - - - Increase in share based remuneration reserve (including tax) - - - - 79 79 - 79 Settlement of share awards - - 53 - (53) - - - Acquisition of non-controlling interest - - - - (44) (44) 43 (1) Balance at 31 December 2024 272 1,605 (722) 567 1,759 3,481 23 3,504 144 RELX Annual Report 2024 | Financial statements and other information |
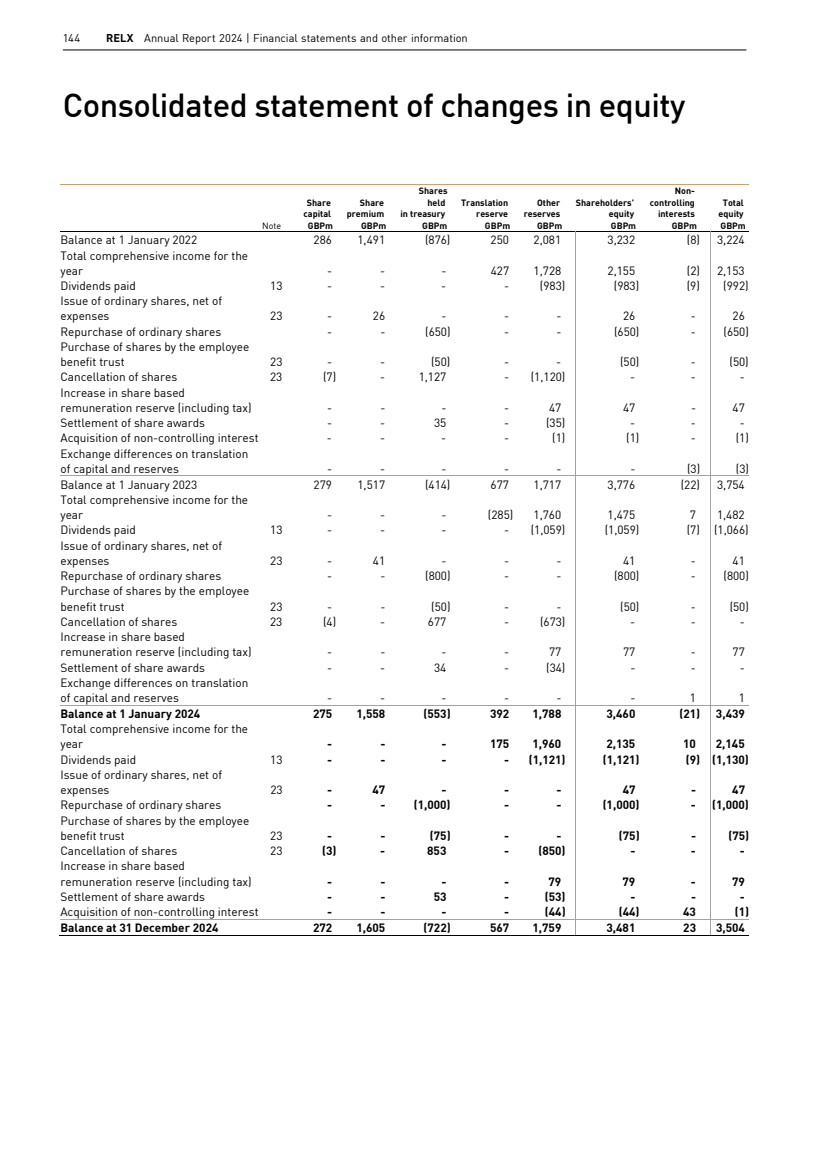
| RELX Annual Report 2024 145 Overview Market segments Corporate responsibility Financial review Governance Financial statements and shareholder information Notes to the consolidated financial statements for the year ended 31 December 2024 1 Basis of preparation and accounting policies Basis of preparation The shares of RELX PLC are traded on the London, Amsterdam and New York stock exchanges. RELX PLC and its subsidiaries, joint ventures and associates are together known as ‘RELX’. In preparing the consolidated financial statements, subsidiaries are accounted for under the acquisition method and investments in joint ventures and associates are accounted for under the equity method. All intra-group transactions and balances are eliminated. On acquisition of a subsidiary, or interest in a joint venture or associate, fair values, reflecting conditions at the date of acquisition, are attributed to the net assets, including identifiable intangible assets acquired. Adjustments are made to bring accounting policies into line with those of the Group. The results of subsidiaries sold or acquired are included in the consolidated financial statements up to or from the date that control passes from or to the Group. Non-controlling interests in the net assets of the Group are identified separately from shareholders’ equity. Non-controlling interests consist of the amount of those interests at the date of the original acquisition and the non-controlling share of changes in equity since the date of acquisition. Acquisition of non-controlling interests represents the acquisition of minority interest holdings in subsidiaries already controlled by the Group. The directors of RELX PLC, having made appropriate enquiries, consider that adequate resources exist for the Group to continue in operational existence for the foreseeable future and that, therefore, it is appropriate to adopt the going concern basis in preparing the consolidated financial information for the year ended 31 December 2024. As part of the going concern assessment the directors considered the sufficiency of the Group’s liquidity resources, including committed credit facilities, over the 18 month period to 30 June 2026. Please refer to page 79 for further disclosure in respect of going concern. In preparing the Group financial statements management has considered the impact of climate change, taking into account the relevant disclosures in the Strategic Report, including those made in accordance with the recommendations of the Taskforce on Climate-related Financial Disclosure. This included an assessment of assets with indefinite and long lives and how they could be impacted by measures taken to address global warming. Recognising that the Group's operations, and the use of the Group's products, have a relatively low environmental impact, no issues were identified that would impact the carrying values of such assets or have any other material impact on the financial statements. Accounting policies The Group’s consolidated financial statements are prepared in accordance with UK adopted International Accounting Standards in conformity with the requirements of the Companies Act 2006 and IFRS accounting standards as issued by the International Accounting Standards Board. The accounting policies under IFRS are included in the relevant notes to the consolidated financial statements. The accounting policies below are applied throughout the financial statements and are unchanged from those applied in preparing the consolidated financial statements for the year ended 31 December 2023. Foreign exchange translation The consolidated financial statements are presented in pound sterling. Unless otherwise stated, all amounts in the financial statements are in millions of pounds. Differences in subtotals in the financial statements may arise due to rounding adjustments applied during calculations. The symbols GBP and £ used throughout the financial statements relate to pound sterling. Summary consolidated financial information presented on pages 198 and 199 shows a simple translation of the Group’s consolidated financial statements into US dollars and euros respectively and do not form part of these financial statements. Transactions in foreign currencies are recorded at the rate of exchange prevailing on the date of the transaction. Non-monetary assets and liabilities that are measured at historical cost in foreign currencies are translated using the exchange rate at the date of the transaction. At each statement of financial position date, monetary assets and liabilities that are denominated in foreign currencies are retranslated at the rate prevailing on the statement of financial position date. Exchange differences arising are recorded in the income statement other than where hedge accounting applies, as set out on pages 169 to 175. Assets and liabilities of foreign operations are translated at exchange rates prevailing on the statement of financial position date. Income and expense items and cash flows of foreign operations are translated at the average exchange rate for the period. Significant individual items of income and expense and cash flows in foreign operations are translated at the rate prevailing on the date of transaction. Exchange differences arising are classified as equity and transferred to the translation reserve. When foreign operations are disposed of, the related cumulative translation differences are recognised within the income statement in the period. The Group uses derivative financial instruments, primarily forward contracts, to hedge its exposure to certain foreign exchange risks. Details of the Group’s accounting policies in respect of derivative financial instruments are set out on page 169. Critical judgements and key sources of estimation uncertainty The preparation of financial statements requires management to make judgements and estimates in the application of accounting policies used to report the financial position, results and cash flows of the Group. The actual outcome may differ to these estimates. The critical judgements and key sources of estimation uncertainty are summarised below. Key sources of estimation uncertainty are significant accounting estimates with a significant risk of a material change to the carrying value of assets and liabilities within the next year. Further detail is provided in the notes to the financial statements as referenced. Critical judgements ■ Capitalisation of development spend: assessing the potential value of a development project, determining the costs which are eligible for capitalisation and the selection of appropriate asset lives (see note 14) Key sources of estimation uncertainty ■ Defined benefit pension obligation: determining an appropriate rate at which the future pension payments are discounted, mortality and inflation assumptions (see note 6) RELX Annual Report 2024 145 Overview Market segments Corporate responsibility Financial review Governance Financial statements and shareholder information Notes to the consolidated financial statements for the year ended 31 December 2024 1 Basis of preparation and accounting policies Basis of preparation The shares of RELX PLC are traded on the London, Amsterdam and New York stock exchanges. RELX PLC and its subsidiaries, joint ventures and associates are together known as ‘RELX’. In preparing the consolidated financial statements, subsidiaries are accounted for under the acquisition method and investments in joint ventures and associates are accounted for under the equity method. All intra-group transactions and balances are eliminated. On acquisition of a subsidiary, or interest in a joint venture or associate, fair values, reflecting conditions at the date of acquisition, are attributed to the net assets, including identifiable intangible assets acquired. Adjustments are made to bring accounting policies into line with those of the Group. The results of subsidiaries sold or acquired are included in the consolidated financial statements up to or from the date that control passes from or to the Group. Non-controlling interests in the net assets of the Group are identified separately from shareholders’ equity. Non-controlling interests consist of the amount of those interests at the date of the original acquisition and the non-controlling share of changes in equity since the date of acquisition. Acquisition of non-controlling interests represents the acquisition of minority interest holdings in subsidiaries already controlled by the Group. The directors of RELX PLC, having made appropriate enquiries, consider that adequate resources exist for the Group to continue in operational existence for the foreseeable future and that, therefore, it is appropriate to adopt the going concern basis in preparing the consolidated financial information for the year ended 31 December 2024. As part of the going concern assessment the directors considered the sufficiency of the Group’s liquidity resources, including committed credit facilities, over the 18 month period to 30 June 2026. Please refer to page 79 for further disclosure in respect of going concern. In preparing the Group financial statements management has considered the impact of climate change, taking into account the relevant disclosures in the Strategic Report, including those made in accordance with the recommendations of the Taskforce on Climate-related Financial Disclosure. This included an assessment of assets with indefinite and long lives and how they could be impacted by measures taken to address global warming. Recognising that the Group's operations, and the use of the Group's products, have a relatively low environmental impact, no issues were identified that would impact the carrying values of such assets or have any other material impact on the financial statements. Accounting policies The Group’s consolidated financial statements are prepared in accordance with UK adopted International Accounting Standards in conformity with the requirements of the Companies Act 2006 and IFRS accounting standards as issued by the International Accounting Standards Board. The accounting policies under IFRS are included in the relevant notes to the consolidated financial statements. The accounting policies below are applied throughout the financial statements and are unchanged from those applied in preparing the consolidated financial statements for the year ended 31 December 2023. Foreign exchange translation The consolidated financial statements are presented in pound sterling. Unless otherwise stated, all amounts in the financial statements are in millions of pounds. Differences in subtotals in the financial statements may arise due to rounding adjustments applied during calculations. The symbols GBP and £ used throughout the financial statements relate to pound sterling. Summary consolidated financial information presented on pages 198 and 199 shows a simple translation of the Group’s consolidated financial statements into US dollars and euros respectively and do not form part of these financial statements. Transactions in foreign currencies are recorded at the rate of exchange prevailing on the date of the transaction. Non-monetary assets and liabilities that are measured at historical cost in foreign currencies are translated using the exchange rate at the date of the transaction. At each statement of financial position date, monetary assets and liabilities that are denominated in foreign currencies are retranslated at the rate prevailing on the statement of financial position date. Exchange differences arising are recorded in the income statement other than where hedge accounting applies, as set out on pages 169 to 175. Assets and liabilities of foreign operations are translated at exchange rates prevailing on the statement of financial position date. Income and expense items and cash flows of foreign operations are translated at the average exchange rate for the period. Significant individual items of income and expense and cash flows in foreign operations are translated at the rate prevailing on the date of transaction. Exchange differences arising are classified as equity and transferred to the translation reserve. When foreign operations are disposed of, the related cumulative translation differences are recognised within the income statement in the period. The Group uses derivative financial instruments, primarily forward contracts, to hedge its exposure to certain foreign exchange risks. Details of the Group’s accounting policies in respect of derivative financial instruments are set out on page 169. Critical judgements and key sources of estimation uncertainty The preparation of financial statements requires management to make judgements and estimates in the application of accounting policies used to report the financial position, results and cash flows of the Group. The actual outcome may differ to these estimates. The critical judgements and key sources of estimation uncertainty are summarised below. Key sources of estimation uncertainty are significant accounting estimates with a significant risk of a material change to the carrying value of assets and liabilities within the next year. Further detail is provided in the notes to the financial statements as referenced. Critical judgements ■ Capitalisation of development spend: assessing the potential value of a development project, determining the costs which are eligible for capitalisation and the selection of appropriate asset lives (see note 14) Key sources of estimation uncertainty ■ Defined benefit pension obligation: determining an appropriate rate at which the future pension payments are discounted, mortality and inflation assumptions (see note 6) and shareholder information Financial statements Governance Market segments Financial review Corporate responsibility Overview RELX Annual Report 2024 145 |
| 146 RELX Annual Report 2024 | Financial statements and other information 1 Basis of preparation and accounting policies (continued) Other areas of judgement and accounting estimates The consolidated financial statements include other areas of judgement and accounting estimates. These include: ■ Taxation: The valuation of provisions related to uncertain tax positions involves estimation (see note 9) ■ Goodwill: The assessment of the carrying value of goodwill requires management judgement and estimation to determine the value in use of the businesses (see note 14) ■ Acquired intangible assets: Judgement is involved in identification of separate intangible assets on acquisition and estimation is required to determine future cashflows and discount rates used in valuation (see note 14) Standards and amendments effective for the year The following accounting standards and amendments were adopted during the year and had no significant impact on the Group’s accounting policies or reporting: ■ Amendment to IAS 1 Presentation of Financial Statements – Classification of Liabilities as Current or Non-current; ■ Amendment to IAS 1 Presentation of Financial Statements – Non-current Liabilities with Covenants; ■ Amendment to IFRS 16 Leases – Lease Liability in a Sale and Leaseback; and ■ Amendment to IAS 7 Statement of Cash Flows and IFRS 7 Financial Instruments – Disclosures – Supplier Finance Arrangements. Standards, amendments and interpretations not yet effective The following amendments and interpretations will become effective for the 2025 financial year. These are not expected to have a significant impact on the accounting policies and reporting: ■ Amendment to IAS 21 The Effects of Changes in Foreign Exchange Rates – Lack of exchangeability ■ IFRS 18 – Presentation and Disclosure in Financial Statements has been issued in 2024 and is effective from 1 January 2027. We are in the process of assessing the impact of IFRS 18 on the presentation of and disclosures in the financial statements. 2 Revenue, operating profit and segment analysis Accounting policy The Group’s reported segments are based on the internal reporting structure and financial information provided to the Board. Adjusted operating profit is the key segmental profit measure used by the Group in assessing performance. Adjusted operating profit is reconciled to operating profit on page 149. Revenue arises from the provision of products and services under contracts with customers. In all cases, revenue is recognised to depict the transfer of promised goods or services to customers in an amount that reflects the consideration to which the entity expects to be entitled in exchange for those goods or services, and is recognised when the customer obtains control of the goods or service. Revenue is stated at the transaction price, which includes allowance for anticipated discounts and returns and excludes customer sales taxes and other amounts to be collected on behalf of third-parties. Where the goods or services promised within a contract are distinct, they are identified as separate performance obligations and are accounted for separately. Where separate performance obligations are identified, total revenue is allocated on the basis of relative standalone selling prices or management’s best estimate of relative value where standalone selling prices do not exist. Management estimates may include a cost-plus method or comparable product approach, but must be supported by objective evidence. A residual approach may be applied where it is not possible to derive a reliable management estimate for a specific component. Our subscription and exhibition related revenue streams generally require payment in advance of the service being provided. Payment terms offered to customers are in line with the standard in the markets and geographies we operate in, and contracts do not contain significant financing components. Contracts for our transactional electronic revenue streams generally have payments that vary with volume of usage. Other than that, our contracts do not involve variable consideration. Revenue is recognised for the various categories as follows: ■ Subscriptions – revenue comprises income derived from the periodic distribution or update of a product. Subscription revenue is generally invoiced in advance and recognised systematically over the period of the subscription. Recognition is either on a straight-line basis where the transaction involves the transfer of goods and services to the customer in a consistent manner over a specific period of time; or based on the value received by the customer where the goods and services are not delivered in a consistent manner ■ Transactional – revenue is recognised when control of the product is passed to the customer or the service has been performed. For exhibitions, revenue primarily comprises income from exhibitors and attendees at exhibitions. Exhibition revenue is recognised on occurrence of the exhibition 146 RELX Annual Report 2024 | Financial statements and other information |
| RELX Annual Report 2024 | Notes to the consolidated financial statements 147 Overview Market segments Corporate responsibility Financial review Governance Financial statements and shareholder information 2 Revenue, operating profit and segment analysis (continued) RELX is a global provider of information-based analytics and decision tools for professional and business customers. RELX operates in four major market segments: Risk provides customers with information-based analytics and decision tools that combine public and industry-specific content with advanced technology and algorithms to assist them in evaluating and predicting risk and enhancing operational efficiency; Scientific, Technical & Medical (STM) helps researchers and healthcare professionals advance science and improve health outcomes by combining high-quality scientific and medical information and trusted data sets with leading technology to deliver analytical tools that facilitate insights and critical decision-making; Legal helps its customers improve decision-making, achieve better outcomes and increase productivity by providing tools that combine legal, regulatory and business information with powerful analytics; and Exhibitions combines industry expertise with data and digital tools to help customers connect face-to-face and digitally, learn about markets, source products and complete transactions. ANALYSIS BY BUSINESS SEGMENT Revenue Adjusted operating profit 2022 GBPm 2023 GBPm 2024 GBPm 2022 GBPm 2023 GBPm 2024 GBPm Risk 2,909 3,133 3,245 1,078 1,165 1,228 Scientific, Technical & Medical 2,909 3,062 3,051 1,100 1,165 1,172 Legal 1,782 1,851 1,899 372 393 412 Exhibitions 953 1,115 1,239 162 319 398 Sub-total 8,553 9,161 9,434 2,712 3,042 3,210 Unallocated central costs and other operating items - - - (29) (12) (11) Total 8,553 9,161 9,434 2,683 3,030 3,199 The share of post-tax results of joint ventures and associates included in operating profit was £43m (2023: £46m; 2022: £19m). This comprised of profit/(loss) relating to Risk of nil (2023: £(1)m; 2022: £2m), Legal £7m (2023: £10m; 2022: £7m) and Exhibitions £36m (2023: £37m; 2022: £10m). In 2022, unallocated central costs and other operating items includes a charge of £24m relating to STM incurred from exchange rate movements from the translation of working capital items such as accounts receivable and payable, and intercompany balances, into relevant functional currencies and the outcome of STM’s hedging programme. The net effect of these amounts was higher in 2022 due to the extent and timing of exchange rate movements in the year and such amounts were insignificant in 2023 and 2024. 2022 Risk Scientific, Technical & Medical Legal Exhibitions Total Revenue by geographical market North America 2,317 1,391 1,213 180 5,101 Europe 384 614 357 445 1,800 Rest of world 208 904 212 328 1,652 Total revenue 2,909 2,909 1,782 953 8,553 Revenue by format Electronic 2,890 2,573 1,582 67 7,112 Face-to-face 11 5 10 886 912 Print 8 331 190 - 529 Total revenue 2,909 2,909 1,782 953 8,553 Revenue by type Subscriptions 1,135 2,139 1,381 - 4,655 Transactional 1,774 770 401 953 3,898 Total revenue 2,909 2,909 1,782 953 8,553 and shareholder information Financial statements Governance Market segments Financial review Corporate responsibility Overview RELX Annual Report 2024 | Notes to the consolidated financial statements 147 |
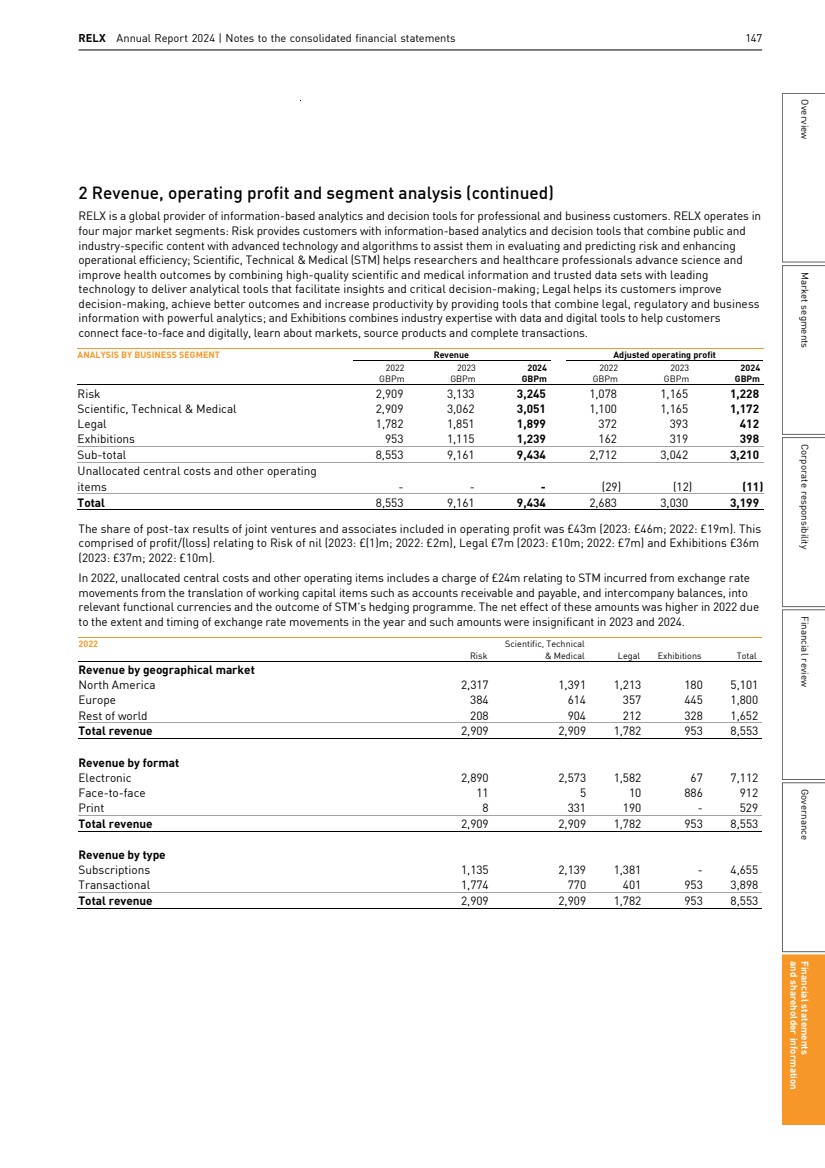
| 148 RELX Annual Report 2024 | Financial statements and other information 2 Revenue, operating profit and segment analysis (continued) 2023 Risk Scientific, Technical & Medical Legal Exhibitions Total Revenue by geographical market North America 2,476 1,439 1,254 217 5,386 Europe 429 666 386 427 1,908 Rest of world 228 957 211 471 1,867 Total revenue 3,133 3,062 1,851 1,115 9,161 Revenue by format Electronic 3,111 2,762 1,667 85 7,625 Face-to-face 14 7 9 1,030 1,060 Print 8 293 175 - 476 Total revenue 3,133 3,062 1,851 1,115 9,161 Revenue by type Subscriptions 1,255 2,261 1,460 - 4,976 Transactional 1,878 801 391 1,115 4,185 Total revenue 3,133 3,062 1,851 1,115 9,161 2024 Risk Scientific, Technical & Medical Legal Exhibitions Total Revenue by geographical market North America 2,563 1,411 1,290 231 5,495 Europe* 443 656 399 527 2,025 Rest of world 239 984 210 481 1,914 Total revenue 3,245 3,051 1,899 1,239 9,434 Revenue by format Electronic 3,226 2,785 1,730 83 7,824 Face-to-face 16 6 11 1,156 1,189 Print 3 260 158 - 421 Total revenue 3,245 3,051 1,899 1,239 9,434 Revenue by type Subscriptions 1,260 2,250 1,515 - 5,025 Transactional 1,985 801 384 1,239 4,409 Total revenue 3,245 3,051 1,899 1,239 9,434 * Europe includes revenue of £613m from the United Kingdom (2023: £602m; 2022: £544m). Over half of RELX’s revenue comes from subscription arrangements, and revenue for these is generally recognised on a straight-line basis over the time period covered by the agreement, in line with the provision of services. There are a number of multi-year contracts, mainly in Risk, where revenue is recognised on the achievement of delivery milestones or other specified performance obligations. As at 31 December 2024, the aggregate amount of the transaction price of such contracts which relates to performance obligations which have not yet been delivered was approximately £55m (2023: £83m). It is expected that revenue will be recognised in relation to this amount over the next four years. ANALYSIS OF REVENUE BY GEOGRAPHICAL ORIGIN 2022 GBPm 2023 GBPm 2024 GBPm North America 5,002 5,325 5,461 Europe 2,974 3,117 3,270 Rest of world 577 719 703 Total 8,553 9,161 9,434 Revenue by geographical origin from the United Kingdom in 2024 was £1,789m (2023: £1,703m; 2022: £1,481m). 148 RELX Annual Report 2024 | Financial statements and other information |
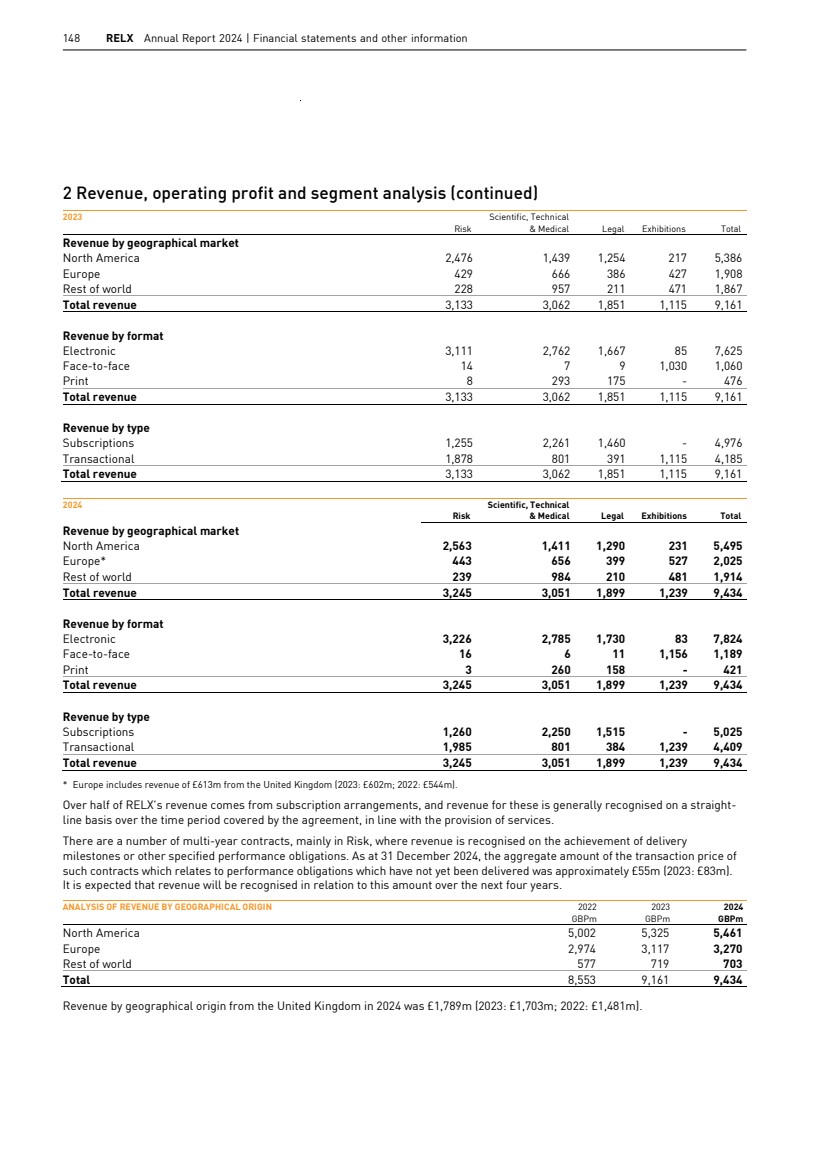
| RELX Annual Report 2024 | Notes to the consolidated financial statements 149 Overview Market segments Corporate responsibility Financial review Governance Financial statements and shareholder information 2 Revenue, operating profit and segment analysis (continued) ANALYSIS BY BUSINESS SEGMENT Expenditure on acquired goodwill and intangible assets Capital expenditure additions Amortisation of acquired intangible assets Total depreciation and other amortisation 2022 GBPm 2023 GBPm 2024 GBPm 2022 GBPm 2023 GBPm 2024 GBPm 2022 GBPm 2023 GBPm 2024 GBPm 2022 GBPm 2023 GBPm 2024 GBPm Risk 155 79 - 122 139 148 204 194 184 94 92 99 Scientific, Technical & Medical 206 3 8 103 108 104 60 59 44 119 136 125 Legal 33 42 145 186 193 203 12 11 15 229 247 256 Exhibitions - 8 65 28 37 29 20 16 15 49 39 45 Total 394 132 218 439 477 484 296 280 258 491 514 525 Capital expenditure comprises additions to property, plant and equipment and internally developed intangible assets. Depreciation and other amortisation includes depreciation on property, plant and equipment and right-of-use assets and amortisation of internally developed intangible assets and pre-publication costs. ANALYSIS OF NON-CURRENT ASSETS BY GEOGRAPHICAL LOCATION 2023 GBPm 2024 GBPm North America 9,149 9,131 Europe 2,141 2,259 Rest of world 459 438 Total 11,749 11,828 Non-current assets held in the United Kingdom totalled £1,242m (2023: £1,209m; 2022: £1,253m). Non-current assets by geographical location exclude amounts relating to deferred tax, pension assets and derivative financial instruments. Operating profit is reconciled to adjusted operating profit as follows: RECONCILIATION OF OPERATING PROFIT TO ADJUSTED OPERATING PROFIT 2022 GBPm 2023 GBPm 2024 GBPm Operating profit 2,323 2,682 2,861 Adjustments: Amortisation of acquired intangible assets 296 280 258 Acquisition and disposal related items 62 56 69 Reclassification of tax in joint ventures and associates 4 12 12 Reclassification of finance income in joint ventures and associates (2) - (1) Adjusted operating profit 2,683 3,030 3,199 In 2024, restructuring costs were incurred due to the disposal of some of our assets. These costs are included within acquisition and disposal related items and are excluded from adjusted operating profit. In the prior years there were no such costs. and shareholder information Financial statements Governance Market segments Financial review Corporate responsibility Overview RELX Annual Report 2024 | Notes to the consolidated financial statements 149 |
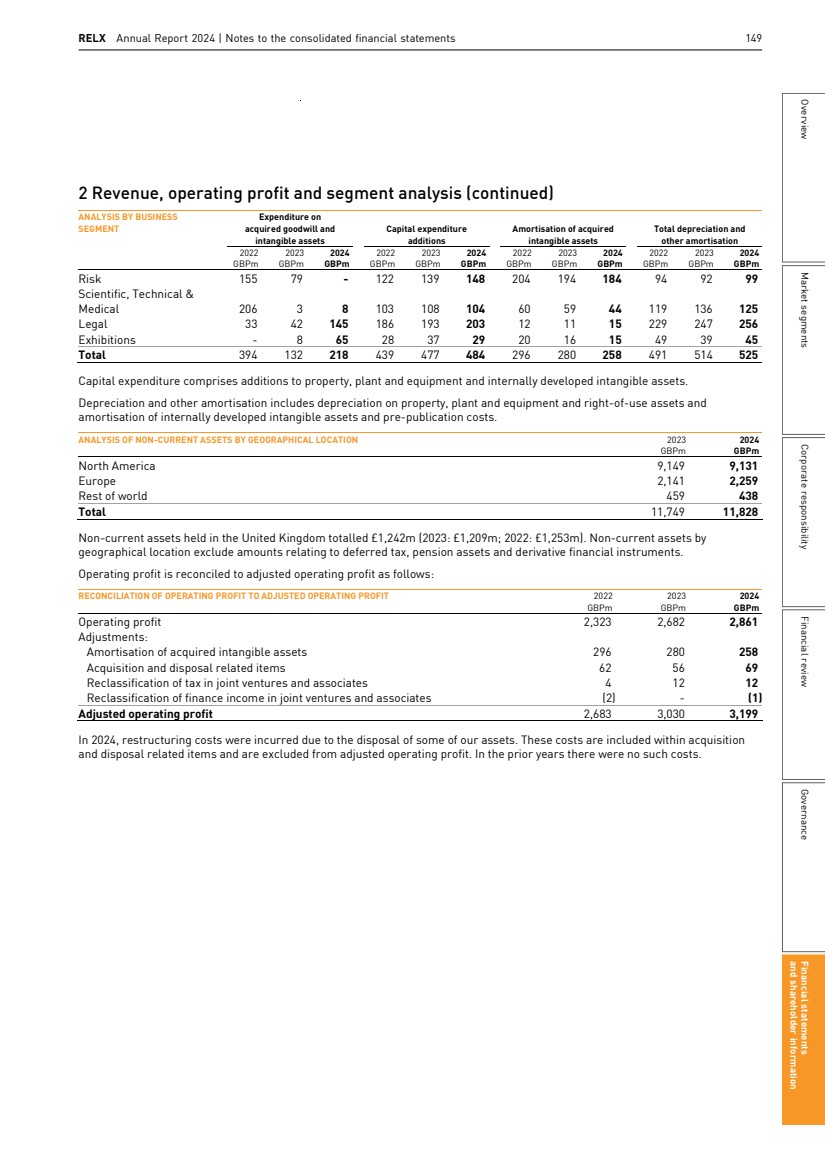
| 150 RELX Annual Report 2024 | Financial statements and other information 3 Operating expenses Operating profit is stated after charging the following: Note 2022 GBPm 2023 GBPm 2024 GBPm Total staff costs 5 2,906 3,108 3,120 Depreciation and amortisation Amortisation of acquired intangible assets 14 294 279 258 Share of joint ventures and associates' amortisation of acquired intangible assets 2 1 - Amortisation of acquired intangible assets including joint ventures and associates' share 296 280 258 Amortisation of internally developed intangible assets 14 309 330 364 Depreciation of property, plant and equipment 16 47 43 34 Depreciation of right-of-use assets 63 65 50 Pre-publication amortisation 72 76 77 Total depreciation and other amortisation 2 491 514 525 Total depreciation and amortisation (including amortisation of acquired intangibles) 787 794 783 Other expenses and income Cost of sales including pre-publication costs and inventory expenses 3,045 3,216 3,300 Short-term and low value lease expenses 19 18 16 The amortisation of acquired intangible assets is included within administration and other expenses. The amortisation of internally generated intangible assets is included within cost of sales, selling and distribution costs and administration and other expenses. 4 Auditor’s remuneration 2022 GBPm 2023 GBPm 2024 GBPm Auditor’s remuneration Payable to the auditors of RELX PLC 0.9 0.9 0.9 Payable to the auditors of the Group’s subsidiaries 8.4 8.0 7.2 Audit services 9.3 8.9 8.1 Audit-related assurance services 0.6 0.5 0.4 Other assurance services* - 0.2 0.5 Total auditor’s remuneration 9.9 9.6 9.0 * Includes EY assurance work on the Sustainability Statement and selected data included in the Corporate Responsibility Report. Amounts payable to the auditors of the Group’s subsidiaries include amounts for the audit of internal controls over financial reporting in accordance with the US Sarbanes-Oxley Act. The decrease in the 2024 audit fee is mainly due to changes in scope and foreign exchange movements. The previously reported 2023 fees paid to EY for audit services have been revised to include final fees for statutory audits which took place subsequent to the audit of the RELX consolidated accounts. 150 RELX Annual Report 2024 | Financial statements and other information 3 Operating expenses Operating profit is stated after charging the following: Note 2022 GBPm 2023 GBPm 2024 GBPm Total staff costs 5 2,906 3,108 3,120 Depreciation and amortisation Amortisation of acquired intangible assets 14 294 279 258 Share of joint ventures and associates' amortisation of acquired intangible assets 2 1 - Amortisation of acquired intangible assets including joint ventures and associates' share 296 280 258 Amortisation of internally developed intangible assets 14 309 330 364 Depreciation of property, plant and equipment 16 47 43 34 Depreciation of right-of-use assets 63 65 50 Pre-publication amortisation 72 76 77 Total depreciation and other amortisation 2 491 514 525 Total depreciation and amortisation (including amortisation of acquired intangibles) 787 794 783 Other expenses and income Cost of sales including pre-publication costs and inventory expenses 3,045 3,216 3,300 Short-term and low value lease expenses 19 18 16 The amortisation of acquired intangible assets is included within administration and other expenses. The amortisation of internally generated intangible assets is included within cost of sales, selling and distribution costs and administration and other expenses. 4 Auditor’s remuneration 2022 GBPm 2023 GBPm 2024 GBPm Auditor’s remuneration Payable to the auditors of RELX PLC 0.9 0.9 0.9 Payable to the auditors of the Group’s subsidiaries 8.4 8.0 7.2 Audit services 9.3 8.9 8.1 Audit-related assurance services 0.6 0.5 0.4 Other assurance services* - 0.2 0.5 Total auditor’s remuneration 9.9 9.6 9.0 * Includes EY assurance work on the Sustainability Statement and selected data included in the Corporate Responsibility Report. Amounts payable to the auditors of the Group’s subsidiaries include amounts for the audit of internal controls over financial reporting in accordance with the US Sarbanes-Oxley Act. The decrease in the 2024 audit fee is mainly due to changes in scope and foreign exchange movements. The previously reported 2023 fees paid to EY for audit services have been revised to include final fees for statutory audits which took place subsequent to the audit of the RELX consolidated accounts. 150 RELX Annual Report 2024 | Financial statements and other information |
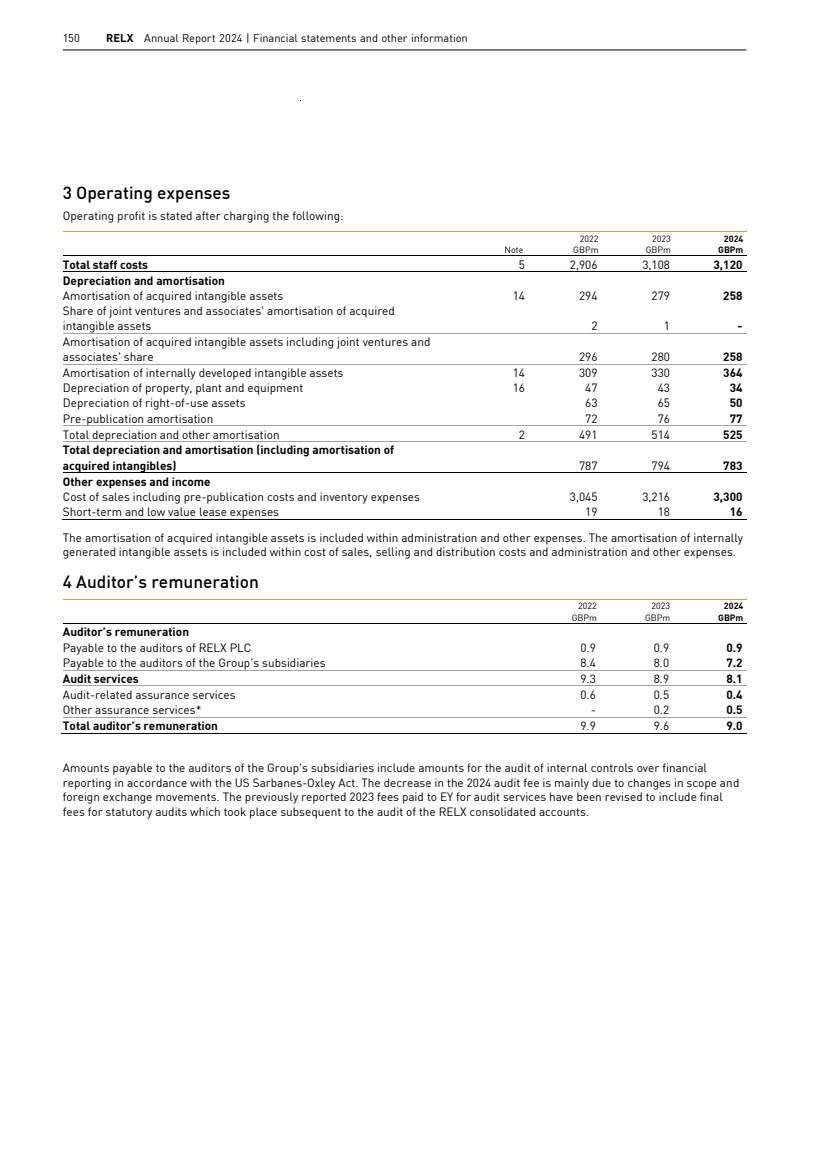
| RELX Annual Report 2024 | Notes to the consolidated financial statements 151 Overview Market segments Corporate responsibility Financial review Governance Financial statements and shareholder information 5 Personnel Accounting policy Share based remuneration The fair value of share based remuneration is determined at the date of grant and recognised as an expense in the income statement on a straight-line basis over the vesting period, taking account of the estimated number of shares that are expected to vest. Market based performance criteria are taken into account when determining the fair value at the date of grant. Non-market based performance criteria are taken into account when estimating the number of shares expected to vest. The fair value of share based remuneration is determined by use of a binomial or Monte Carlo simulation model as appropriate. All of the Group’s share based remuneration is equity settled. Note 2022 GBPm 2023 GBPm 2024 GBPm Staff costs Wages and salaries 2,453 2,636 2,630 Social security costs 257 274 280 Pensions 6 150 142 144 Share based remuneration 46 56 66 Total staff costs 2,906 3,108 3,120 Staff costs above exclude cost of contractors and employer costs of benefits provided to employees but include amounts that are capitalised as part of capitalised development spend. The Group provides a number of share based remuneration schemes to directors and employees. The principal share based remuneration schemes are the Executive Share Option Schemes (ESOS), the Long-Term Incentive Plan (LTIP) and the Retention Share Plan (RSP). Share options granted under ESOS are exercisable after three years and up to ten years from the date of grant at a price equivalent to the market value of the shares at the date of grant. Conditional shares granted under LTIP and RSP are exercisable after three years for nil consideration if conditions are met. Other awards principally relate to all employee share based saving schemes in the UK, the US and the Netherlands. Further details are provided in the Remuneration Report on pages 102 to 122 “audited sections”. NUMBER OF PEOPLE EMPLOYED: FULL-TIME EQUIVALENTS* At 31 December Average during the year 2022 2023 2024 2022 2023 2024 Business segment Risk 10,800 11,100 11,000 10,400 10,900 11,000 Scientific, Technical & Medical 9,500 9,500 9,700 9,300 9,600 9,600 Legal 11,300 11,800 11,800 10,900 11,900 11,800 Exhibitions 3,300 3,500 3,300 3,300 3,500 3,500 Sub-total 34,900 35,900 35,800 33,900 35,900 35,900 Corporate/shared functions 800 600 600 800 600 600 Total 35,700 36,500 36,400 34,700 36,500 36,500 Geographical location North America 14,900 14,900 14,700 14,500 15,000 14,900 Europe 9,800 10,000 9,300 9,500 9,900 9,600 Rest of world 11,000 11,600 12,400 10,700 11,600 12,000 Total 35,700 36,500 36,400 34,700 36,500 36,500 * Reported to the nearest 100. The number of UK full-time equivalents as at 31 December 2024 was 5,600 (2023: 6,000; 2022: 5,800) and the average during the year was 5,700 (2023: 5,900; 2022: 5,600). RELX Annual Report 2024 | Notes to the consolidated financial statements 151 Overview Market segments Corporate responsibility Financial review Governance Financial statements and shareholder information 5 Personnel Accounting policy Share based remuneration The fair value of share based remuneration is determined at the date of grant and recognised as an expense in the income statement on a straight-line basis over the vesting period, taking account of the estimated number of shares that are expected to vest. Market based performance criteria are taken into account when determining the fair value at the date of grant. Non-market based performance criteria are taken into account when estimating the number of shares expected to vest. The fair value of share based remuneration is determined by use of a binomial or Monte Carlo simulation model as appropriate. All of the Group’s share based remuneration is equity settled. Note 2022 GBPm 2023 GBPm 2024 GBPm Staff costs Wages and salaries 2,453 2,636 2,630 Social security costs 257 274 280 Pensions 6 150 142 144 Share based remuneration 46 56 66 Total staff costs 2,906 3,108 3,120 Staff costs above exclude cost of contractors and employer costs of benefits provided to employees but include amounts that are capitalised as part of capitalised development spend. The Group provides a number of share based remuneration schemes to directors and employees. The principal share based remuneration schemes are the Executive Share Option Schemes (ESOS), the Long-Term Incentive Plan (LTIP) and the Retention Share Plan (RSP). Share options granted under ESOS are exercisable after three years and up to ten years from the date of grant at a price equivalent to the market value of the shares at the date of grant. Conditional shares granted under LTIP and RSP are exercisable after three years for nil consideration if conditions are met. Other awards principally relate to all employee share based saving schemes in the UK, the US and the Netherlands. Further details are provided in the Remuneration Report on pages 102 to 122 “audited sections”. NUMBER OF PEOPLE EMPLOYED: FULL-TIME EQUIVALENTS* At 31 December Average during the year 2022 2023 2024 2022 2023 2024 Business segment Risk 10,800 11,100 11,000 10,400 10,900 11,000 Scientific, Technical & Medical 9,500 9,500 9,700 9,300 9,600 9,600 Legal 11,300 11,800 11,800 10,900 11,900 11,800 Exhibitions 3,300 3,500 3,300 3,300 3,500 3,500 Sub-total 34,900 35,900 35,800 33,900 35,900 35,900 Corporate/shared functions 800 600 600 800 600 600 Total 35,700 36,500 36,400 34,700 36,500 36,500 Geographical location North America 14,900 14,900 14,700 14,500 15,000 14,900 Europe 9,800 10,000 9,300 9,500 9,900 9,600 Rest of world 11,000 11,600 12,400 10,700 11,600 12,000 Total 35,700 36,500 36,400 34,700 36,500 36,500 * Reported to the nearest 100. The number of UK full-time equivalents as at 31 December 2024 was 5,600 (2023: 6,000; 2022: 5,800) and the average during the year was 5,700 (2023: 5,900; 2022: 5,600). RELX Annual Report 2024 | Notes to the consolidated financial statements 151 Overview Market segments Corporate responsibility Financial review Governance Financial statements and shareholder information 5 Personnel Accounting policy Share based remuneration The fair value of share based remuneration is determined at the date of grant and recognised as an expense in the income statement on a straight-line basis over the vesting period, taking account of the estimated number of shares that are expected to vest. Market based performance criteria are taken into account when determining the fair value at the date of grant. Non-market based performance criteria are taken into account when estimating the number of shares expected to vest. The fair value of share based remuneration is determined by use of a binomial or Monte Carlo simulation model as appropriate. All of the Group’s share based remuneration is equity settled. Note 2022 GBPm 2023 GBPm 2024 GBPm Staff costs Wages and salaries 2,453 2,636 2,630 Social security costs 257 274 280 Pensions 6 150 142 144 Share based remuneration 46 56 66 Total staff costs 2,906 3,108 3,120 Staff costs above exclude cost of contractors and employer costs of benefits provided to employees but include amounts that are capitalised as part of capitalised development spend. The Group provides a number of share based remuneration schemes to directors and employees. The principal share based remuneration schemes are the Executive Share Option Schemes (ESOS), the Long-Term Incentive Plan (LTIP) and the Retention Share Plan (RSP). Share options granted under ESOS are exercisable after three years and up to ten years from the date of grant at a price equivalent to the market value of the shares at the date of grant. Conditional shares granted under LTIP and RSP are exercisable after three years for nil consideration if conditions are met. Other awards principally relate to all employee share based saving schemes in the UK, the US and the Netherlands. Further details are provided in the Remuneration Report on pages 102 to 122 “audited sections”. NUMBER OF PEOPLE EMPLOYED: FULL-TIME EQUIVALENTS* At 31 December Average during the year 2022 2023 2024 2022 2023 2024 Business segment Risk 10,800 11,100 11,000 10,400 10,900 11,000 Scientific, Technical & Medical 9,500 9,500 9,700 9,300 9,600 9,600 Legal 11,300 11,800 11,800 10,900 11,900 11,800 Exhibitions 3,300 3,500 3,300 3,300 3,500 3,500 Sub-total 34,900 35,900 35,800 33,900 35,900 35,900 Corporate/shared functions 800 600 600 800 600 600 Total 35,700 36,500 36,400 34,700 36,500 36,500 Geographical location North America 14,900 14,900 14,700 14,500 15,000 14,900 Europe 9,800 10,000 9,300 9,500 9,900 9,600 Rest of world 11,000 11,600 12,400 10,700 11,600 12,000 Total 35,700 36,500 36,400 34,700 36,500 36,500 * Reported to the nearest 100. The number of UK full-time equivalents as at 31 December 2024 was 5,600 (2023: 6,000; 2022: 5,800) and the average during the year was 5,700 (2023: 5,900; 2022: 5,600). and shareholder information Financial statements Governance Market segments Financial review Corporate responsibility Overview RELX Annual Report 2024 | Notes to the consolidated financial statements 151 |
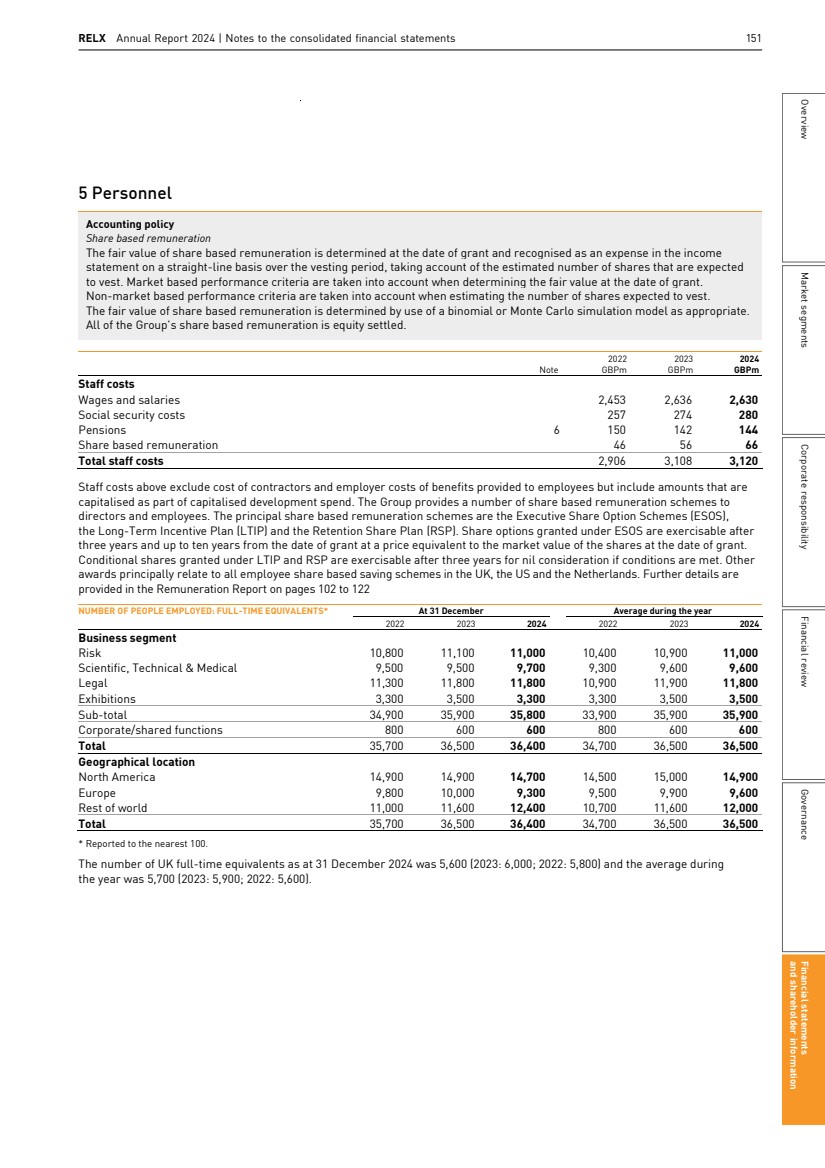
| 152 RELX Annual Report 2024 | Financial statements and other information 6 Pension schemes Accounting policy The expense of defined benefit pension schemes and other post-retirement employee benefits is determined using the projected unit credit method and charged in the income statement as an operating expense, based on actuarial assumptions reflecting market conditions at the beginning of the financial year. Actuarial gains and losses are recognised in full in the statement of comprehensive income in the period in which they occur. Past service costs and credits are recognised immediately at the earlier of when plan amendments or curtailments occur and when related restructuring costs or termination benefits are recognised. Settlements are recognised when they occur. Net pension obligations in respect of defined benefit schemes are included in the statement of financial position at the present value of scheme liabilities, less the fair value of scheme assets. Where schemes are in surplus, i.e. assets exceed liabilities, the net pension assets are separately included in the statement of financial position. Any net pension asset is limited to the extent that the asset is recoverable. The expense of defined contribution pension schemes and other employee benefits is charged in the income statement as incurred. At 31 December 2024, the Group operates defined benefit pension schemes in the UK and the US. These schemes require management to exercise judgement in: estimating the ultimate cost of providing post-employment benefits, especially given the length of each scheme’s liabilities and; for funded schemes in an accounting surplus position, whether the surplus can be recognised. Key source of estimation uncertainty Accounting for defined benefit pension schemes involves judgement and estimation about uncertain events, including the life expectancy of the members, inflation and the rate at which the future pension payments are discounted. Estimates for these factors are used in determining the pension cost and liabilities reported in the financial statements. The estimates made around future developments of each of the critical assumptions are made in conjunction with independent actuaries. Each scheme is subject to a periodic review by independent actuaries. The discount rate, inflation rate and mortality assumptions may have a material effect in determining the defined benefit pension obligation and costs which are reported in the financial statements. Information regarding the more significant assumptions used for valuation is provided below, together with a sensitivity analysis. A number of pension schemes are operated around the world. The largest funded defined benefit schemes as at 31 December 2024 were in the UK and the US, and are summarised below. In addition, there are a number of smaller unfunded schemes in the UK and the US. Major defined benefit schemes in place at 31 December 2024 The UK scheme is a final salary scheme and is closed to new hires. Members accrue a portion of their final pensionable earnings based on the number of years of service. The US scheme is a cash balance scheme and is closed to future accruals effective 1 January 2019. Each of the major defined benefit schemes is administered by a separate fund that is legally separated from the Group. The trustees of the pension funds in the UK and plan fiduciaries of the US scheme are required by law to act in the interest of the funds’ beneficiaries. In the UK, the trustees of the pension fund are responsible for the investment policy with regard to the assets of the fund. The board of trustees consists of an equal number of company-appointed and member-nominated Directors. In the US, the fiduciary duties for the scheme are allocated between committees which are staffed by senior employees of the Group; the investment committee has the primary responsibility for the investment and management of plan assets. The funding of the Group’s major schemes reflects the different rules within each jurisdiction. In the UK, the level of funding is determined by statutory triennial actuarial valuations in accordance with pensions legislation. Where the scheme falls below 100% funded status, the Group and the scheme trustees must agree on how the deficit is to be remedied. The UK Pensions Regulator has significant powers and sets out in codes and guidance the parameters for scheme funding. RELX provides a guarantee in respect of scheme liabilities up to a maximum amount whereby debt is calculated under Section 75 of the Pensions Act 1995. No liability has been recognised in respect of this guarantee as any possibility of triggering Section 75 is considered remote and RELX expect the scheme to continue operating with more than sufficient liquidity to meet liabilities as they fall due for the foreseeable future. The US scheme has an annual statutory valuation which forms the basis for establishing the employer contribution each year (subject to ERISA and IRS minimums). Should the statutory funded status fall to below 100%, the US Pension Protection Act requires the deficit to be rectified with additional contributions over a seven-year period. The US scheme’s funded status is in excess of 100%. The Group and the trustees of the UK scheme expect to finalise the 2024 triennial valuation in the first half of 2025 and no deficit funding contributions to the scheme are required in the period 2025 to 2027. Employer cash contributions to defined benefit pension schemes in respect of 2025 are expected to be approximately £7m. 152 RELX Annual Report 2024 | Financial statements and other information |
| RELX Annual Report 2024 | Notes to the consolidated financial statements 153 Overview Market segments Corporate responsibility Financial review Governance Financial statements and shareholder information 6 Pension schemes (continued) The pension expense (excluding interest amounts) recognised in the income statement consists of: 2022 GBPm 2023 GBPm 2024 GBPm Defined benefit pension expense 19 5 4 Defined contribution pension expense 131 137 140 Total 150 142 144 All of the pension expense is recognised within operating profit. The amounts recognised in the income statement in respect of defined benefit pension schemes during the year are presented by major scheme as follows: 2022 2023 2024 UK GBPm US GBPm Total GBPm UK GBPm US GBPm Total GBPm UK GBPm US GBPm Total GBPm Service cost 16 3 19 2 3 5 1 3 4 Defined benefit pension expense 16 3 19 2 3 5 1 3 4 Net interest on net defined benefit pension balance 4 1 5 1 - 1 - 1 1 Net defined benefit pension expense 20 4 24 3 3 6 1 4 5 Net interest on the net defined benefit pension balance is presented within net finance costs in the income statement. The net defined benefit pension expense for each year is based on the assumptions and scheme valuations set at 31 December of the prior year. The significant valuation assumptions, determined for each major scheme in conjunction with the respective independent actuaries, are presented below. AS AT 31 DECEMBER 2022 2023 2024 UK US UK US UK US Discount rate 4.90 % 5.35% 4.60 % 5.05 % 5.55% 5.55% Inflation 3.20 % 2.50% 3.05 % 2.50 % 3.15% 2.50% Discount rates are set by reference to high-quality corporate bond yields of a currency and a term consistent with the Group’s pension schemes. High quality corporate bonds are those for which at least one of the main ratings agencies in a given region considers to be AA-rated (or equivalent). For the UK, future price inflation, as measured by the Retail Prices Index (RPI), has been derived with regard to the term of pension liabilities, the inflation implied by redemption yields on fixed interest and index-linked gilts and allowing for inflation risk premium. The price inflation assumptions allow for the expected impact of RPI reform, in particular expectations that future levels of RPI and CPI will be broadly aligned after 2030. For the US, inflation is based on the statutory limits on compensation and benefits. Mortality assumptions make allowance for future improvements in longevity and have been determined by reference to applicable mortality statistics. Future improvements for the 2024 year-end for the UK are in line with the CMI 2023 Core Projections Model, with a long-term rate of improvement of 1.5 per cent p.a., and for the US are in line with the Mortality Improvements Scale MP-2021 developed by the Retirement Plans Experience Committee of the Society of Actuaries. The average life expectancy assumptions are set out below: AS AT 31 DECEMBER 2022 Male average life expectancy Female average life expectancy UK US UK US Member currently aged 60 years 85 86 89 88 Member currently aged 45 years 87 86 90 89 AS AT 31 DECEMBER 2023 Male average life expectancy Female average life expectancy UK US UK US Member currently aged 60 years 85 86 88 88 Member currently aged 45 years 86 86 90 89 AS AT 31 DECEMBER 2024 Male average life expectancy Female average life expectancy UK US UK US Member currently aged 60 years 85 86 89 88 Member currently aged 45 years 86 86 90 89 and shareholder information Financial statements Governance Market segments Financial review Corporate responsibility Overview RELX Annual Report 2024 | Notes to the consolidated financial statements 153 |
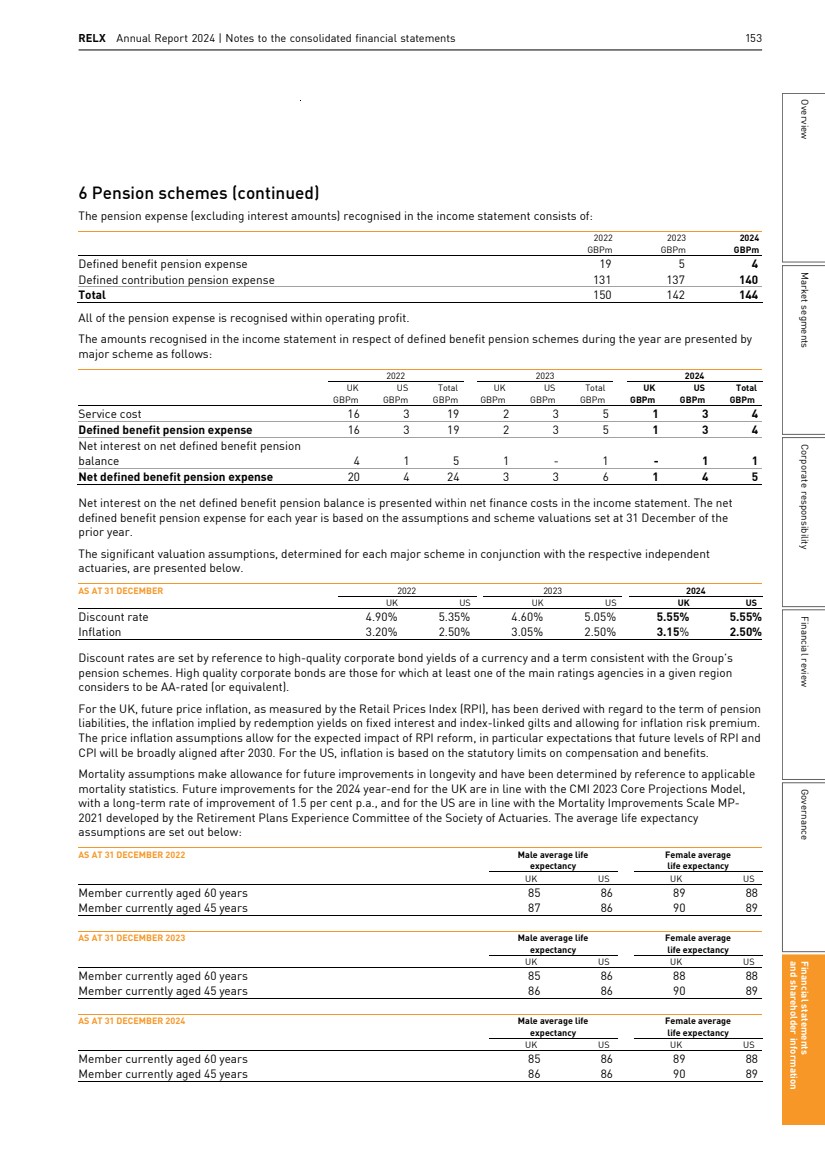
| 154 RELX Annual Report 2024 | Financial statements and other information 6 Pension schemes (continued) The amount recognised in the statement of financial position in respect of defined benefit pension schemes at the start and end of the year and the movements during the year were as follows: 2023 2024 UK GBPm US GBPm Total GBPm UK GBPm US GBPm Total GBPm Defined benefit obligation At start of year (2,887) (865) (3,752) (2,984) (822) (3,806) Service cost (2) (3) (5) (1) (3) (4) Interest on pension scheme liabilities (138) (43) (181) (133) (40) (173) Actuarial (losses)/gains on financial assumptions (61) (19) (80) 301 20 321 Actuarial (losses)/gains arising from experience assumptions (16) 5 (11) (20) (3) (23) Contributions by employees (8) - (8) (7) - (7) Benefits paid 128 57 185 134 61 195 Exchange translation differences - 46 46 - (16) (16) At end of year (2,984) (822) (3,806) (2,710) (803) (3,513) Fair value of scheme assets At start of year 2,852 854 3,706 2,937 834 3,771 Interest income on plan assets 137 43 180 133 39 172 Return on assets excluding amounts included in interest income 1 34 35 (240) (33) (273) Contributions by employer 67 6 73 41 7 48 Contributions by employees 8 - 8 7 - 7 Benefits paid (128) (57) (185) (134) (61) (195) Exchange translation differences - (46) (46) - 14 14 At end of year 2,937 834 3,771 2,744 800 3,544 Opening net balance (35) (11) (46) (47) 12 (35) Service cost (2) (3) (5) (1) (3) (4) Net interest on net defined benefit balance (1) - (1) - (1) (1) Contributions by employer 67 6 73 41 7 48 Actuarial (losses)/gains (76) 20 (56) 41 (16) 25 Exchange translation differences - - - - (2) (2) Net pension balance (47) 12 (35) 34 (3) 31 Impact of asset ceiling (6) (22) (28) (4) (6) (10) Overall net pension balance (53) (10) (63) 30 (9) 21 As at 31 December 2024, the defined benefit obligations comprised £3,348m (2023: £3,626m) in relation to funded schemes and £165m (2023: £180m) in relation to unfunded schemes. The weighted average duration of defined benefit scheme liabilities is 13 years in the UK (2023: 14 years) and 9 years in the US (2023: 9 years). Net deferred tax liabilities of £4m (2023 net deferred tax assets: £16m) are recognised in respect of the net pension balance. A net pension asset has been recognised in relation to the UK and US funded schemes after considering the guidance in IAS 19 – Employee Benefits and IFRIC 14. The UK funded scheme moved into a surplus position for the first time at the interim reporting date of 30 June 2022. The split between net pension obligations and net pension assets is as follows: 2023 GBPm 2024 GBPm Net pension asset recognised 119 186 Net pension obligation (182) (165) Overall net pension balance (63) 21 154 RELX Annual Report 2024 | Financial statements and other information |
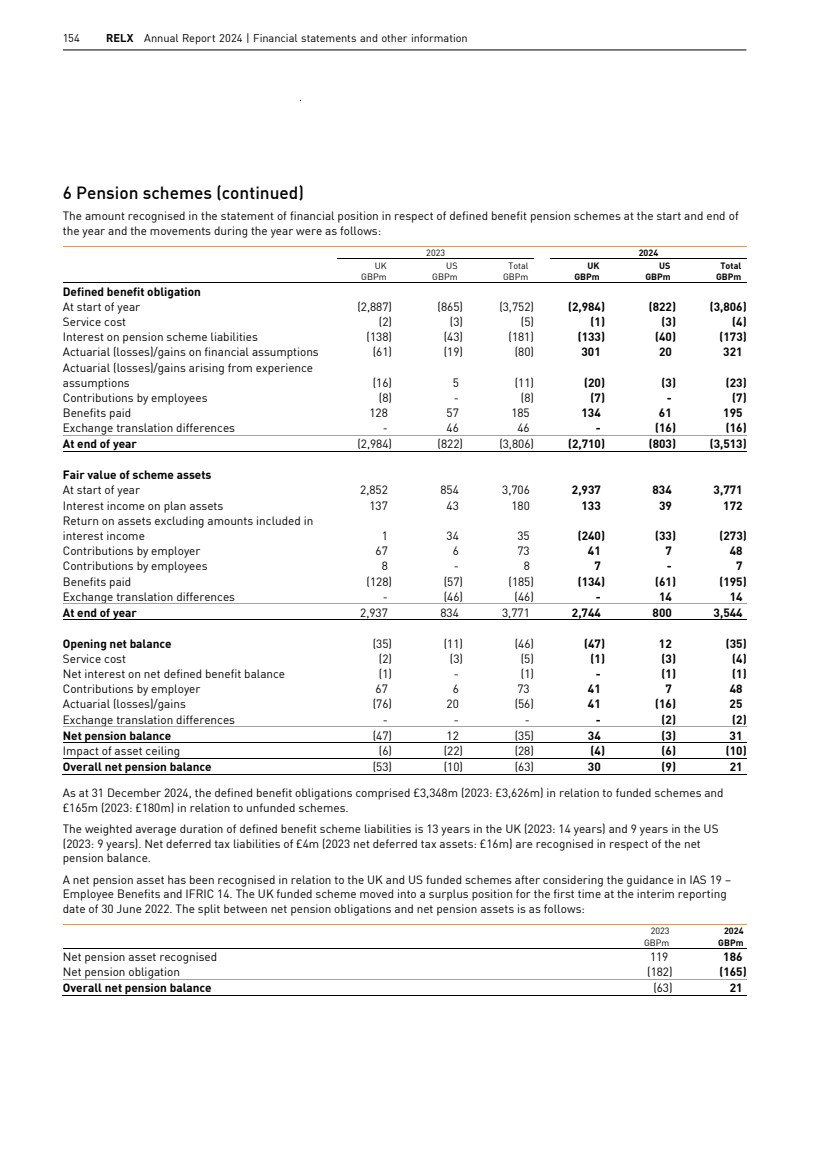
| RELX Annual Report 2024 | Notes to the consolidated financial statements 155 Overview Market segments Corporate responsibility Financial review Governance Financial statements and shareholder information 6 Pension schemes (continued) Amounts recognised in the statement of comprehensive income are set out below: 2022 GBPm 2023 GBPm 2024 GBPm Gains and losses arising during the year: Experience losses on scheme liabilities (88) (11) (23) Experience (losses)/gains on scheme assets (1,820) 35 (273) Actuarial gains/(losses) on the present value of scheme liabilities due to changes in: – discount rates 2,000 (145) 374 – inflation 32 15 (36) – other actuarial assumptions 1 50 (17) 125 (56) 25 The total actuarial gain recognised in the statement of comprehensive income of £43m (2023: a loss of £75m) also includes a gain of £18m (2023: a loss of £19m) in relation to the asset ceiling. As at 31 December 2024, the impact of the asset ceiling on the overall net pension obligation is £10m (2023: £28m). The major categories and fair values of scheme assets at the end of the reporting period are as follows: FAIR VALUE OF SCHEME ASSETS 2023 2024 UK GBPm US GBPm Total GBPm UK GBPm US GBPm Total GBPm Equities¹ 431 3 434 419 2 421 Liability matching assets² 1,760 804 2,564 1,716 784 2,500 Property funds and ground leases³ 406 - 406 172 - 172 Direct lending and multi-asset credit funds 229 - 229 333 - 333 Cash and cash equivalents⁴ 98 27 125 96 14 110 Other 13 - 13 8 - 8 Total 2,937 834 3,771 2,744 800 3,544 (1) Assets are held in unquoted funds which invest in equities with quoted prices. (2) Within the UK scheme are asset backed securities totalling £481m (2023: £247m), other credit assets of £487m (2023: £452m) and government bonds totalling £1,881m (2023: £1,962m) offset by forward foreign currency contracts of £2m (2023: £4m) and short-term sale and repurchase agreements totalling £1,131m (2023: £910m) whereby the UK scheme funds the purchase of government bonds using existing bonds as security. In the US, the assets primarily relate to government bonds, corporate bonds and interest rate swaps. Of the gross assets, £2,049m (2023: £2,169m) are assets with quoted prices in active markets. (3) Assets without quoted prices in active markets. (4) Includes £44m (2023: £83m) of assets with quoted prices in an active market. The remainder are held in funds which do not have quoted prices. and shareholder information Financial statements Governance Market segments Financial review Corporate responsibility Overview RELX Annual Report 2024 | Notes to the consolidated financial statements 155 |
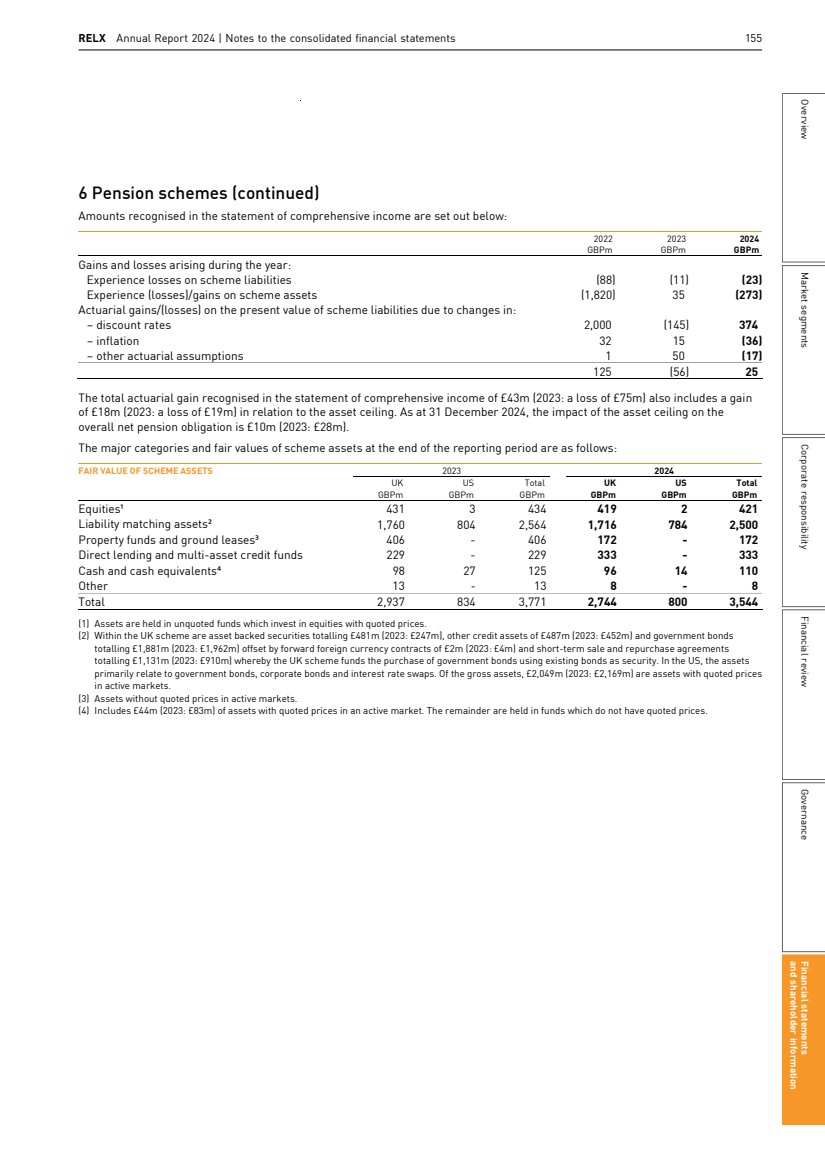
| 156 RELX Annual Report 2024 | Financial statements and other information 6 Pension schemes (continued) Assets and obligations associated with the schemes are sensitive to changes in the market values of assets and the market-related assumptions used to value scheme liabilities. In particular, adverse changes to asset values, discount rates or inflation could increase future pension costs and funding requirements. Typically, the Group’s schemes are exposed to: investment risks, whereby actual rates of return on plan assets may be below those rates used to determine the defined benefit obligations; and interest rate risks, whereby scheme deficits may increase if bond yields in the UK and the US decline and are not offset by returns in liability matching and other assets. The schemes are also exposed to other risks, such as unanticipated future increases in member longevity patterns and inflation, all potentially leading to an increase in scheme liabilities. Investment policies of each scheme are intended to ensure continuous payment of defined benefit pensions in the short term and long term. Efforts are made to limit risks on marketable securities by adopting investment policies that diversify assets across geographies and among equities, liability matching assets, property funds, cash and other assets. Asset allocations are dependent on a variety of factors including the duration of scheme liabilities and the funded position of the plan. The primary UK scheme uses a liability driven investment (LDI) approach for part of the portfolio, investing primarily in government bonds so that the value of scheme assets change in the same way as the scheme’s liabilities and achieve a matching effect for the most significant plan liability assumptions of interest rates and inflation rates. Sensitivity analysis The valuation of the Group’s pension scheme liabilities involves significant actuarial assumptions, being the life expectancy of the members, inflation and the rate at which the future pension payments are discounted. Differences arising from actual experience or future changes in assumptions may materially affect future pension charges. In particular, changes in assumptions for discount rates, inflation and life expectancies that are reasonably possible would have the following approximate effects on the defined benefit pension obligations: GBPm Increase/decrease of 0.5% in discount rate 124 Increase/decrease of 0.25% in the expected inflation rate 55 Increase/decrease of one year in assumed life expectancy 55 The above analysis has been calculated on the same basis used to determine the defined benefit obligation recognised in the statement of financial position. There has been no change in the methods used to prepare the analysis compared with prior years. This sensitivity analysis may not be representative of the actual change in the defined benefit obligation as it is unlikely that changes in the above assumptions would occur in isolation as some of the assumptions may be correlated. 156 RELX Annual Report 2024 | Financial statements and other information |
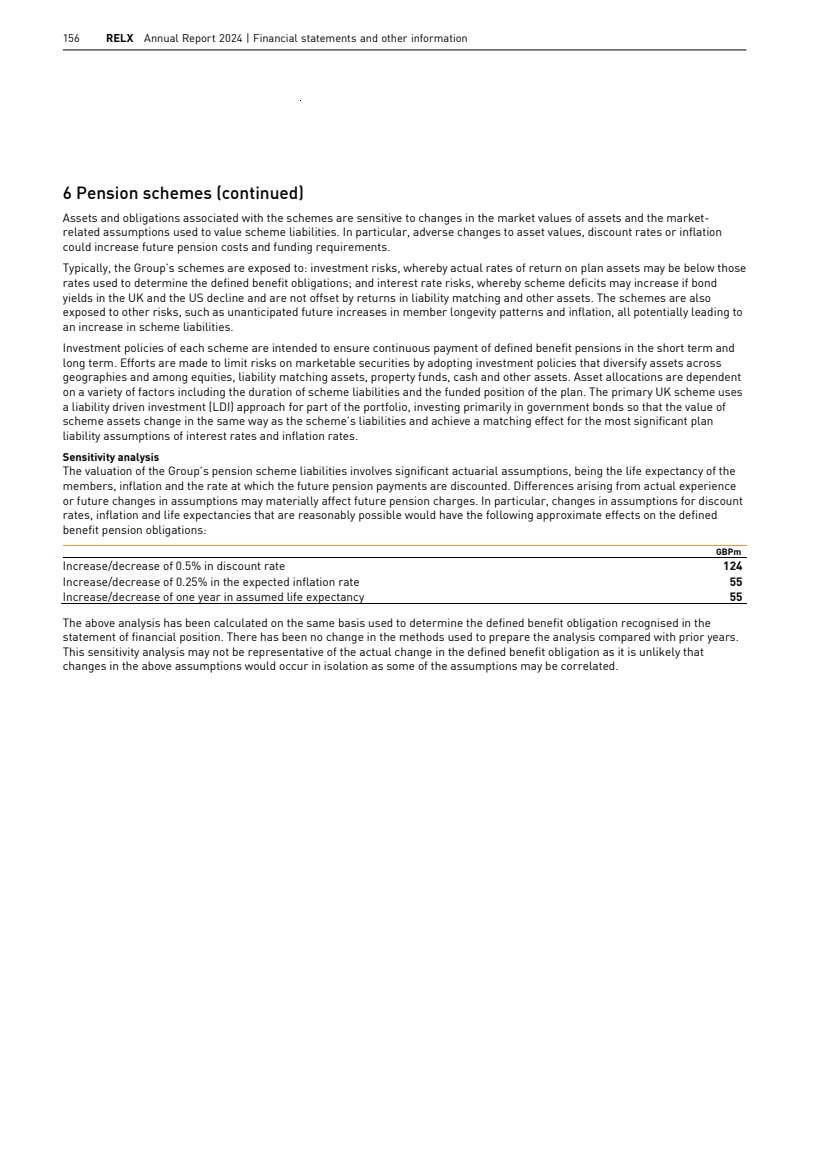
| RELX Annual Report 2024 | Notes to the consolidated financial statements 157 Overview Market segments Corporate responsibility Financial review Governance Financial statements and shareholder information 7 Net finance costs Accounting policy Interest on borrowings is expensed as incurred. The cost of issuing borrowings is generally expensed over the period of borrowing to produce a constant periodic rate of charge. 2022 GBPm 2023 GBPm 2024 GBPm Interest on short-term bank loans, overdrafts and commercial paper (19) (31) (48) Interest on term debt (157) (263) (228) Interest on lease liabilities (6) (6) (5) Total borrowing costs (182) (300) (281) Losses on loans and derivatives not designated as hedges (9) (20) (20) Fair value losses on designated fair value hedge relationships (9) (2) (2) Net financing charge on defined benefit pension schemes (5) (1) (1) Finance costs (205) (323) (304) Interest on bank deposits 4 8 6 Finance income 4 8 6 Net finance costs (201) (315) (298) Gains of £1m (2023: losses of £2m; 2022: gains of £2m) on derivatives designated as cash flow hedges were recognised in other comprehensive income and accumulated in the hedge reserve, and may be reclassified to the income statement in future periods. Losses of £2m (2023: £1m; 2022: £1m) in total were transferred from the hedge reserve in the period. In 2023, the interest charge on term debt includes a charge of £26m in respect of the early redemption of bonds that were due to be repaid in August 2027. 8 Disposals and other non-operating items Accounting policy Assets of businesses that are available for immediate sale in their current condition and for which a sales process is considered highly probable to complete are classified as assets held for sale and are carried at the lower of carrying value and fair value less costs to sell. Fair value is based on anticipated disposal proceeds, typically derived from firm or indicative offers from potential acquirers. Non-current assets are not amortised or depreciated following their classification as held for sale. Liabilities of businesses held for sale are also separately classified on the statement of financial position. Fair value movements in the venture capital portfolio are reported within disposals and other items. See note 15 for further details. 2022 GBPm 2023 GBPm 2024 GBPm Revaluation of investments 9 (11) (2) Loss on disposal of businesses and assets held for sale (18) (61) (4) Net loss on disposals and other non-operating items (9) (72) (6) The revaluation of investments relates to venture fund investments. During the year goodwill was impaired by £36m (2023: £42m) as the result of a number of disposals. In 2023, the impairment of goodwill of £42m was in relation to some assets held for sale within Risk which were subsequently disposed of. and shareholder information Financial statements Governance Market segments Financial review Corporate responsibility Overview RELX Annual Report 2024 | Notes to the consolidated financial statements 157 |
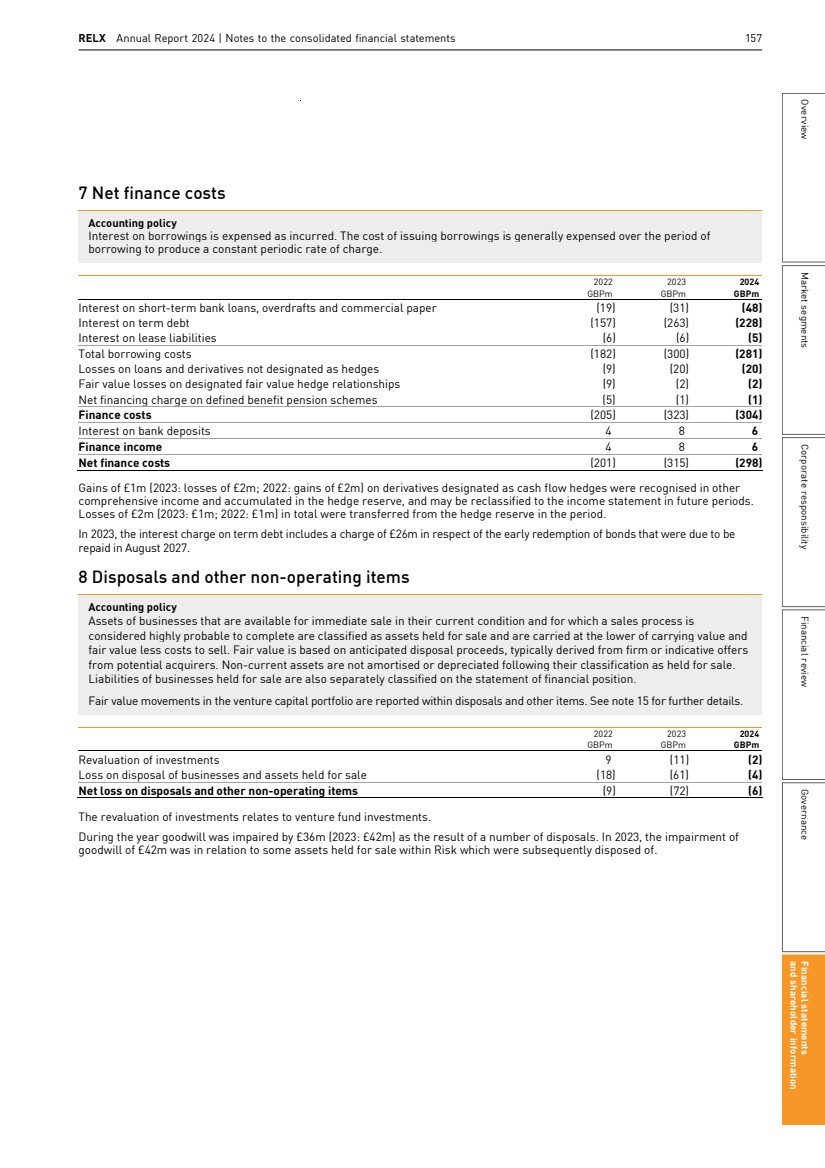
| 158 RELX Annual Report 2024 | Financial statements and other information 9 Taxation Accounting policy Tax expense comprises current and deferred tax. Current and deferred tax are charged or credited in the income statement except to the extent that the tax arises from a transaction or event which is recognised, in the same or a different period, outside the income statement (either in other comprehensive income, directly in equity, or through a business combination), in which case the tax appears in the same statement as the transaction that gave rise to it. Current tax is the amount of corporate income taxes expected to be payable or recoverable based on the profit for the period as adjusted for items that are not taxable or not deductible, and is calculated using tax rates and laws that were enacted or substantively enacted at the date of the statement of financial position. Management periodically evaluates positions taken in tax returns with respect to situations in which applicable tax regulation is subject to interpretation. Provisions are established where appropriate on the basis of amounts expected to be paid to the tax authorities. Current tax includes amounts provided in respect of uncertain tax positions when management expects that, upon examination of the uncertainty by a tax authority in possession of all relevant knowledge, it is more likely than not that an economic outflow will occur. Changes in facts and circumstances underlying these provisions are reassessed at the date of each statement of financial position, and the provisions are remeasured as required to reflect current information. Deferred tax is recognised on temporary differences arising between the tax bases of assets and liabilities and their carrying amounts in the statement of financial position. Deferred tax is calculated using tax rates and laws that have been enacted or substantively enacted at the end of the reporting period, and which are expected to apply when the related deferred tax asset is realised or the deferred tax liability is settled. Deferred tax liabilities are generally recognised for all taxable temporary differences but not recognised for taxable temporary differences arising on investments in subsidiaries, joint ventures and associates where the reversal of the temporary difference can be controlled and it is probable that the difference will not reverse in the foreseeable future. Deferred tax assets are recognised to the extent it is probable that taxable profits will be available against which the deductible temporary differences can be utilised, and are reviewed at the end of each reporting period and reduced to the extent that it is no longer probable that sufficient taxable profits will be available to allow all or part of the asset to be recovered. The availability of suitable taxable profit is considered probable when an entity has taxable temporary differences (i.e. deferred tax liabilities) relating to the same taxation authority and the same taxable entity, that are expected to reverse in the same period as the deductible temporary difference or unused tax losses or credit. Deferred tax assets and liabilities are not recognised in respect of temporary differences that arise on initial recognition of assets and liabilities acquired other than in a business combination. Deferred tax is not discounted. When the acquisition of an asset qualifies to be accounted for as a business combination, deferred tax is generally required to be recognised on the difference between the tax base and the book base of the assets and liabilities acquired and assumed. The assets acquired often include identifiable intangible assets as well as goodwill. In many jurisdictions, the manner in which a business combination is effected will impact the tax deductibility and therefore the deferred tax recognised in relation to such intangibles and goodwill. In an ‘asset acquisition’, where the buyer acquires the trade and assets of a business, there is often a tax deduction available for the amortisation of the identifiable intangible assets and sometimes for the goodwill. In this situation, deferred tax is recognised on the difference between the tax base and the book base of the assets. In a ‘share acquisition’, where the buyer acquires the share capital of a legal entity that continues to own the trade and assets, tax deductions for amortisation are usually not available. Intangibles which do not qualify for tax deductions therefore give rise to a deferred tax liability. However, deferred tax liabilities are not recognised on temporary differences that arise from goodwill where that is not deductible for tax purposes. Other areas of accounting judgement The Group is subject to tax in numerous jurisdictions, giving rise to complex tax issues. As a multinational enterprise, the Group’s tax returns in the countries in which it operates are subject to tax authority audits as a matter of routine. While the Group is confident that tax returns are appropriately prepared and filed, amounts are provided in respect of uncertain tax positions that reflect the risk with respect to tax matters under active discussion with tax authorities, or which are otherwise considered to involve uncertainty. The valuation of provisions required in relation to uncertain tax positions involves estimation. Provisions against uncertain tax positions are measured using one of the following methods, depending on which of the methods management expects will better predict the amount it will pay over to the tax authority: ■ The Single Best Estimate – where there is a single outcome that is more likely than not to occur. This will happen, for example, where the tax outcome is binary (such as whether an entity can deduct an item of expenditure) or the range of possible outcomes is narrow or concentrated on a single value. The most likely outcome may be that no tax is expected to be payable, in which case the provision is nil; or ■ A Probability-Weighted Expected Value – where, on the balance of probabilities, something will be paid to the tax authority but the possible outcomes are widely dispersed with low individual probabilities (i.e. there is no single outcome more likely than not to occur). In this case, the provision is the sum of the probability-weighted amounts in the range. 158 RELX Annual Report 2024 | Financial statements and other information |
| RELX Annual Report 2024 | Notes to the consolidated financial statements 159 Overview Market segments Corporate responsibility Financial review Governance Financial statements and shareholder information 9 Taxation (continued) In assessing provisions against uncertain tax positions, management uses in-house tax experts, professional firms and previous experience to inform the evaluation of risk. However, it remains possible that uncertainties will ultimately be resolved at amounts greater or smaller than the liabilities recorded. In particular, although the Group reports cross-border transactions undertaken between Group subsidiaries on an arm’s-length basis in tax returns in accordance with OECD guidelines, transfer pricing relies on the exercise of judgement and it is frequently possible for there to be a range of legitimate and reasonable views. This means that it is impossible to be certain that the returns basis will be sustained on examination. Discussions with tax authorities relating to cross-border transactions and other matters are ongoing in a number of our major trading jurisdictions. Although the timing and amount of final resolution of these uncertain tax positions cannot be reliably predicted, no significant impact on the results of the Group is expected in the next year or foreseeable future. Estimation of income taxes also includes assessments of the recoverability of deferred tax assets, consistent with the Group’s forecasts and annual strategy plan used in the preparation of the annual report and accounts. Deferred tax assets are only recognised to the extent that they are considered recoverable based on existing tax laws and forecasts of future taxable profits against which the underlying tax deductions can be utilised. The recoverability of these assets is reassessed at the end of each reporting period, and changes in recognition of deferred tax assets will affect the tax liability in the period of that reassessment. 2022 GBPm 2023 GBPm 2024 GBPm Current tax Current year (564) (652) (661) Prior years 30 77 54 Total current tax charge (534) (575) (607) Deferred tax 53 68 (6) Tax expense (481) (507) (613) The UK current tax charge was £187m (2023: £157m; 2022: £102m). Cash tax paid (net) in the year was £662m (2023: £619m; 2022: £495m), which is different to the tax expense for the year set out above. There are a number of reasons why the cash tax payments in a particular year will be different from the tax expense in the accounts: ■ Tax payments relating to a particular year’s profits are typically due partly in the year and partly in the following year. ■ Tax expense includes deferred tax, an accounting adjustment where an item is included in the income statement in one year but is taxed in another year. The acquisition of intangible assets often results in deferred tax liabilities, the unwind of which does not result in tax payments. ■ Current tax expense is the best estimate at the end of the period of cash tax expected to be paid. To the extent the final tax liability is different, any cash tax impact will occur in a later period. ■ Some of the benefits of tax deductions related to share based payments, pensions and hedging are credited to equity or other comprehensive income rather than to tax expense. Set out below is a reconciliation of the difference between tax expense for the period and the theoretical expense calculated by multiplying accounting profit by the applicable tax rate. The Group believes the most meaningful applicable rate is that obtained by multiplying the accounting profits and losses of all consolidated entities by the applicable domestic rate in each of those entities’ jurisdictions. The net tax expense charged on profit before tax differs from the theoretical amount that would arise using the weighted average of tax rates applicable to accounting profits and losses of the consolidated entities, as follows: 2022 2023 2024 GBPm % GBPm % GBPm % Profit before tax 2,113 2,295 2,557 Tax at average applicable rates (498) 23.6 % (571) 24.9 % (647) 25.3 % Tax effect of share of results of joint ventures and associates 3 (0.1)% 8 (0.3)% 9 (0.4)% Income not taxable and expenses not deductible 21 (1.0)% 20 (0.9)% 16 (0.6)% Non-deductible costs of share based remuneration (1) 0.0 % (1) 0.0 % (2) 0.1 % Non-deductible disposal-related gains and losses (2) 0.1 % (22) 1.0 % (7) 0.3 % Deferred tax assets of the period not recognised (17) 0.8 % (3) 0.1 % (18) 0.7 % Change in recognition and measurement of deferred tax 5 (0.2)% 4 (0.2)% 13 (0.5)% Movements in provisions and prior year items 8 (0.4)% 58 (2.5)% 23 (0.9)% Tax expense (481) 22.8 % (507) 22.1 % (613) 24.0 % and shareholder information Financial statements Governance Market segments Financial review Corporate responsibility Overview RELX Annual Report 2024 | Notes to the consolidated financial statements 159 |
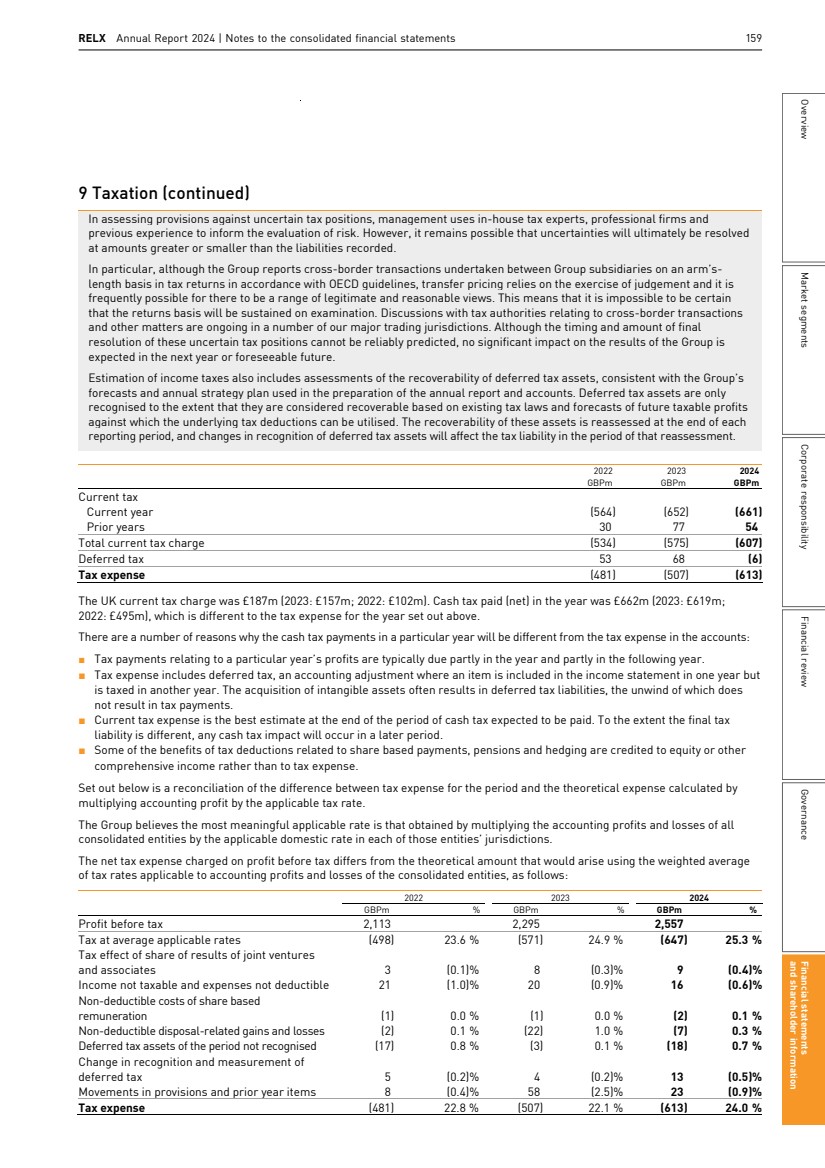
| 160 RELX Annual Report 2024 | Financial statements and other information 9 Taxation (continued) The weighted average applicable tax rate for the year was 25.3% (2023: 24.9%; 2022: 23.6%), reflecting the applicable rates in the countries where the Group operates. The Group’s future tax charge will be sensitive to the geographic mix of profits and losses and the tax rates and laws in force in the jurisdictions in which the Group operates. The BEPS Pillar Two Minimum Tax legislation was enacted in July 2023 in the UK with effect from 2024. The Group has applied the temporary exception under IAS 12 in relation to the accounting for deferred taxes arising from the implementation of the Pillar Two rules. The new rules do not have a significant impact on the tax charge for the Group. In the US, the Inflation Reduction Act enacted in August 2022 introduced a corporate alternative minimum tax. This does not have any significant impact on the Group. With the advent of the new administration the Group will continue to monitor US developments. In the UK, an increase in the corporation tax rate from 19% to 25% from April 2023 was enacted in 2021. In the Netherlands, an increase in the corporation tax rate from 25% to 25.8% from 2022 and changes to loss recognition rules were also enacted in 2021. In total, the deferred tax effect of changes in tax rates for the year was a tax credit of nil (2023: nil; 2022: £3m) in the income statement. The effective tax rate of 24.0% (2023: 22.1%; 2022: 22.8%) was lower than the weighted average applicable rate of 25.3%. Income not taxable and expenses not deductible include a credit of £21m (2023: £21m; 2022: £13m) relating to research and development. In 2023, there were tax credits arising from the substantial resolution of prior year tax matters. The following tax has been recognised in other comprehensive income or directly in equity during the year: 2022 GBPm 2023 GBPm 2024 GBPm Tax on items that will not be reclassified to profit or loss Tax on actuarial movements on defined benefit pension schemes (43) 19 (11) Tax on items that may be reclassified to profit or loss Tax on fair value movements on cash flow hedges 8 (12) 3 Net tax (charge)/credit recognised in other comprehensive income (35) 7 (8) Tax credit on share based remuneration recognised directly in equity - 24 20 2023 GBPm 2024 GBPm Current tax assets 6 42 Current tax liabilities (163) (119) Total (157) (77) Current tax assets and liabilities are net amounts in countries where there is a legally enforceable right to offset assets and liabilities on a net basis. The Group maintained provisions for uncertain tax positions. The total carrying amount of these provisions of £168m (2023: £173m) is comprised of a number of individually immaterial amounts. It is not expected that any resolution of the matters to which the provisions relate, or changes in assumptions relating to the provisions, will have a material impact on the Group’s financial results in the next year. 2023 GBPm 2024 GBPm Deferred tax assets 128 84 Deferred tax liabilities (473) (473) Total (345) (389) 160 RELX Annual Report 2024 | Financial statements and other information |
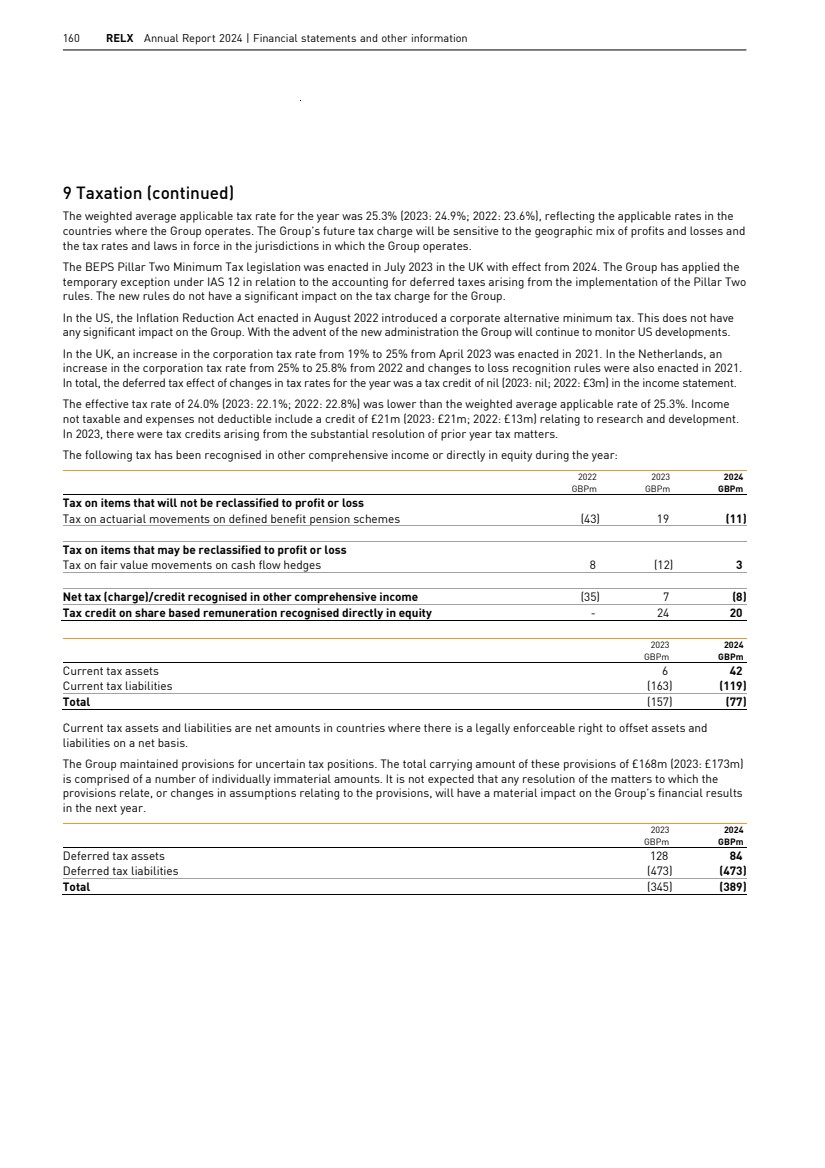
| RELX Annual Report 2024 | Notes to the consolidated financial statements 161 Overview Market segments Corporate responsibility Financial review Governance Financial statements and shareholder information 9 Taxation (continued) Movements in deferred tax liabilities and assets (before taking into consideration the offsetting of balances within the same jurisdiction) are summarised as follows: Deferred tax liabilities Deferred tax assets Acquired intangible assets GBPm Other temporary differences GBPm Acquired intangible assets GBPm Losses and other tax attributes GBPm Pension balances GBPm Other temporary differences GBPm Total GBPm Deferred tax (liability)/asset at 1 January 2023 (735) (231) 132 118 49 223 (444) Credit/(charge) to profit 63 40 (31) (26) (1) 23 68 (Charge)/credit to equity/other comprehensive income - (2) - - (1) 11 8 Acquisitions (16) 1 - 9 - - (6) Disposals and other 3 - - - - - 3 Exchange translation differences 33 10 (2) (5) - (10) 26 Deferred tax (liability)/asset at 1 January 2024 (652) (182) 99 96 47 247 (345) Credit/(charge) to profit 52 14 (31) (31) (10) - (6) (Charge)/credit to equity/other comprehensive income - (14) - - 6 1 (7) Acquisitions (16) - - 1 - - (15) Disposals and other - - - - - (2) (2) Exchange translation differences (10) (1) (2) (2) - 1 (14) Deferred tax (liability)/asset at 31 December 2024 (626) (183) 66 64 43 247 (389) The closing deferred tax liability balance of other temporary differences includes those relating to capitalised development costs of £86m (2023: £120m) and pension surplus of £47m (2023: £30m). The closing deferred tax asset balance of other temporary differences includes those relating to accruals and provisions of £124m (2023: £128m), share based remuneration provisions of £63m (2023: £59m) and intercompany interest of £14m (2023: £21m). As a result of exemptions on dividends from subsidiaries and capital gains on disposal there are no significant taxable temporary differences associated with investments in subsidiaries, branches, associates and interests in joint arrangements. Deferred tax assets have been recognised for losses and other tax attributes in countries including the US and the Netherlands, the majority of which are expected to have been utilised by 2029. Deferred tax assets in respect of tax losses and other deductible temporary differences have only been recognised to the extent that it is more likely than not that sufficient taxable profits will be available to allow the asset to be recovered. Losses and other tax attributes for which no deferred tax asset was recognised: 2023 2024 GBPm Gross amount GBPm Tax effected GBPm Gross amount GBPm Tax effected Trading losses and temporary differences expiring Within 10 years 93 26 55 15 More than 10 years 14 4 13 3 Available indefinitely 246 66 185 51 Total 353 96 253 69 State and local tax losses expiring Within 10 years 21 1 18 1 More than 10 years 63 4 57 3 Available indefinitely - - - - Total 84 5 75 4 Capital losses expiring Within 10 years - - - - More than 10 years - - - - Available indefinitely 27 7 140 31 Total 27 7 140 31 and shareholder information Financial statements Governance Market segments Financial review Corporate responsibility Overview RELX Annual Report 2024 | Notes to the consolidated financial statements 161 |
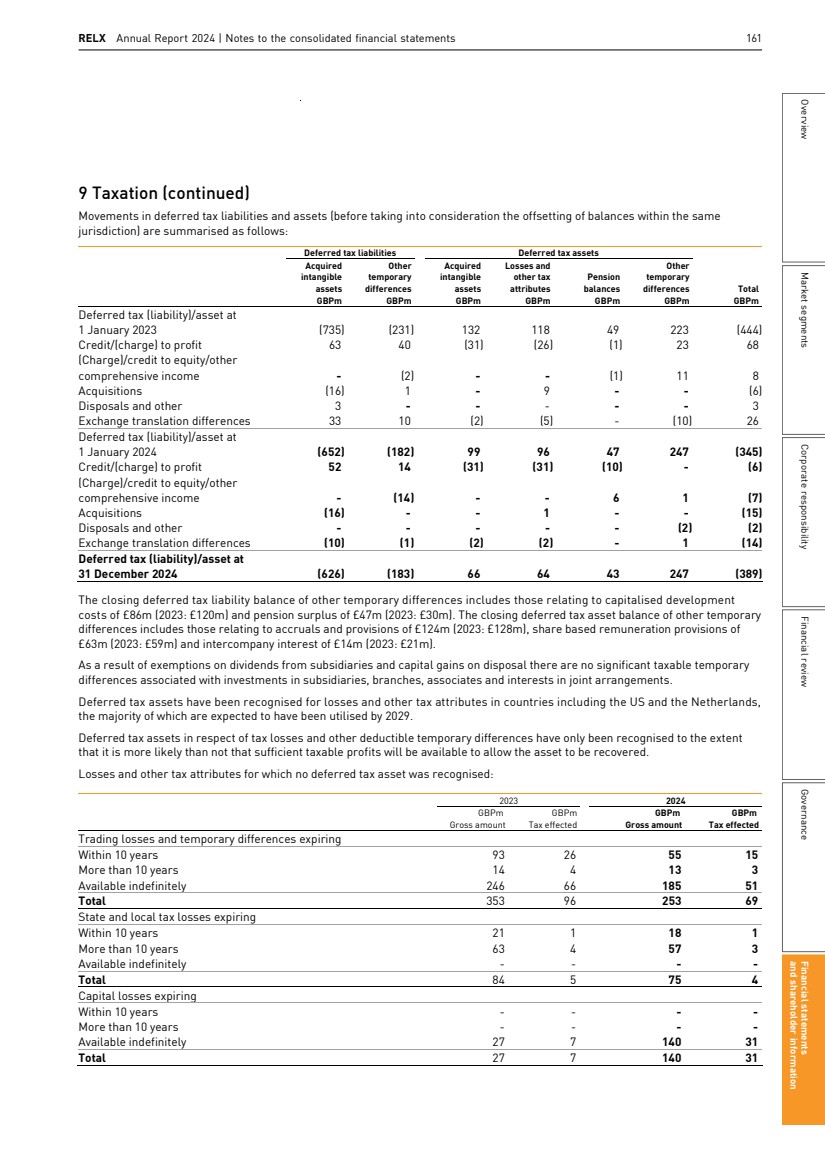
| 162 RELX Annual Report 2024 | Financial statements and other information 10 Earnings per share Accounting policy Earnings per share (EPS) is calculated by taking the reported net profit attributable to shareholders and dividing this by the total weighted average number of shares. The diluted figures are calculated after taking account of potential additional ordinary shares arising from share options and conditional shares. The dilutive impact is calculated as the weighted average of all potentially dilutive shares EARNINGS PER SHARE – FOR THE YEAR ENDED 31 DECEMBER 2022 2023 2024 Net profit attributable to shareholders GBPm Weighted average number of shares (millions) EPS (pence) Net profit attributable to shareholders GBPm Weighted average number of shares (millions) EPS (pence) Net profit attributable to shareholders GBPm Weighted average number of shares (millions) EPS (pence) Basic earnings per share 1,634 1,918.5 85.2p 1,781 1,891.8 94.1p 1,934 1,865.9 103.6p Diluted earnings per share 1,634 1,929.3 84.7p 1,781 1,902.8 93.6p 1,934 1,876.7 103.1p 11 Statement of cash flows Accounting policy Cash and cash equivalents comprise cash balances, call deposits and other short-term highly liquid investments and are held in the statement of financial position at fair value. RECONCILIATION OF OPERATING PROFIT TO CASH GENERATED FROM OPERATIONS 2022 GBPm 2023 GBPm 2024 GBPm Operating profit 2,323 2,682 2,861 Share of results of joint ventures and associates (19) (46) (43) Amortisation of acquired intangible assets 294 279 258 Amortisation of internally developed intangible assets 309 330 364 Amortisation of pre-publication costs 72 76 77 Depreciation of property, plant and equipment 47 43 34 Depreciation of right-of-use assets 63 65 50 Share based remuneration 46 56 66 Total non-cash items 831 849 849 Increase in inventories and pre-publication costs (103) (90) (83) Increase in receivables (251) (24) (173) Increase/(decrease) in payables 280 (1) 110 Increase in working capital (74) (115) (146) Cash generated from operations 3,061 3,370 3,521 CASH FLOW ON ACQUISITIONS Note 2022 GBPm 2023 GBPm 2024 GBPm Purchase of businesses 12 (373) (108) (165) Deferred payments relating to prior year acquisitions (21) (16) (5) Total (394) (124) (170) 162 RELX Annual Report 2024 | Financial statements and other information |
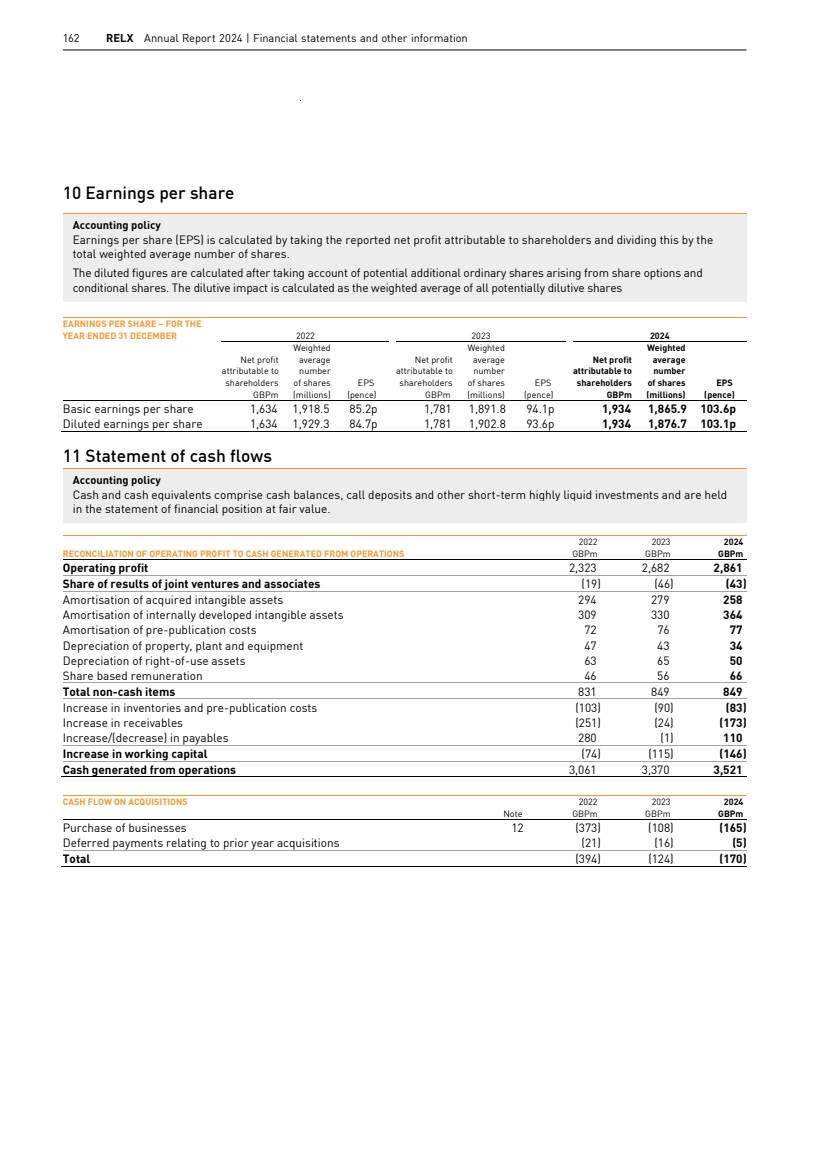
| RELX Annual Report 2024 | Notes to the consolidated financial statements 163 Overview Market segments Corporate responsibility Financial review Governance Financial statements and shareholder information 11 Statement of cash flows (continued) RECONCILIATION OF NET DEBT Cash and cash equivalents GBPm Debt GBPm Related derivative financial instruments GBPm Finance Lease receivable GBPm Total GBPm At 1 January 2023 334 (6,730) (213) 5 (6,604) Decrease in cash and cash equivalents (169) - - - (169) Increase in short-term bank loans, overdrafts and commercial paper - (84) - - (84) Issuance of term debt - (651) - - (651) Repayment of term debt - 847 - - 847 Repayment of leases - 72 - (2) 70 Change in net debt resulting from cash flows (169) 184 - (2) 13 Borrowings in disposed businesses - 1 - - 1 Inception of leases - (38) - 1 (37) Fair value and other adjustments to debt and related derivatives - (100) 97 - (3) Exchange translation differences (10) 186 8 - 184 At 1 January 2024 155 (6,497) (108) 4 (6,446) Decrease in cash and cash equivalents (32) - - - (32) Increase in short-term bank loans, overdrafts and commercial paper - (461) - - (461) Issuance of term debt - (711) - - (711) Repayment of term debt - 1,017 - - 1,017 Repayment of leases - 63 - (2) 61 Change in net debt resulting from cash flows (32) (92) - (2) (126) Borrowings in disposed businesses - 8 - - 8 Remeasurement and derecognition of leases - (4) - - (4) Inception of leases - (32) - - (32) Fair value and other adjustments to debt and related derivatives - 19 (28) - (9) Exchange translation differences (4) 54 (4) - 46 At 31 December 2024 119 (6,544) (140) 2 (6,563) Net debt comprises cash and cash equivalents, loan capital, lease liabilities and receivables, promissory notes, bank and other loans and derivative financial instruments that are used to hedge certain borrowings. The Group monitors net debt as part of capital and liquidity management. and shareholder information Financial statements Governance Market segments Financial review Corporate responsibility Overview RELX Annual Report 2024 | Notes to the consolidated financial statements 163 |
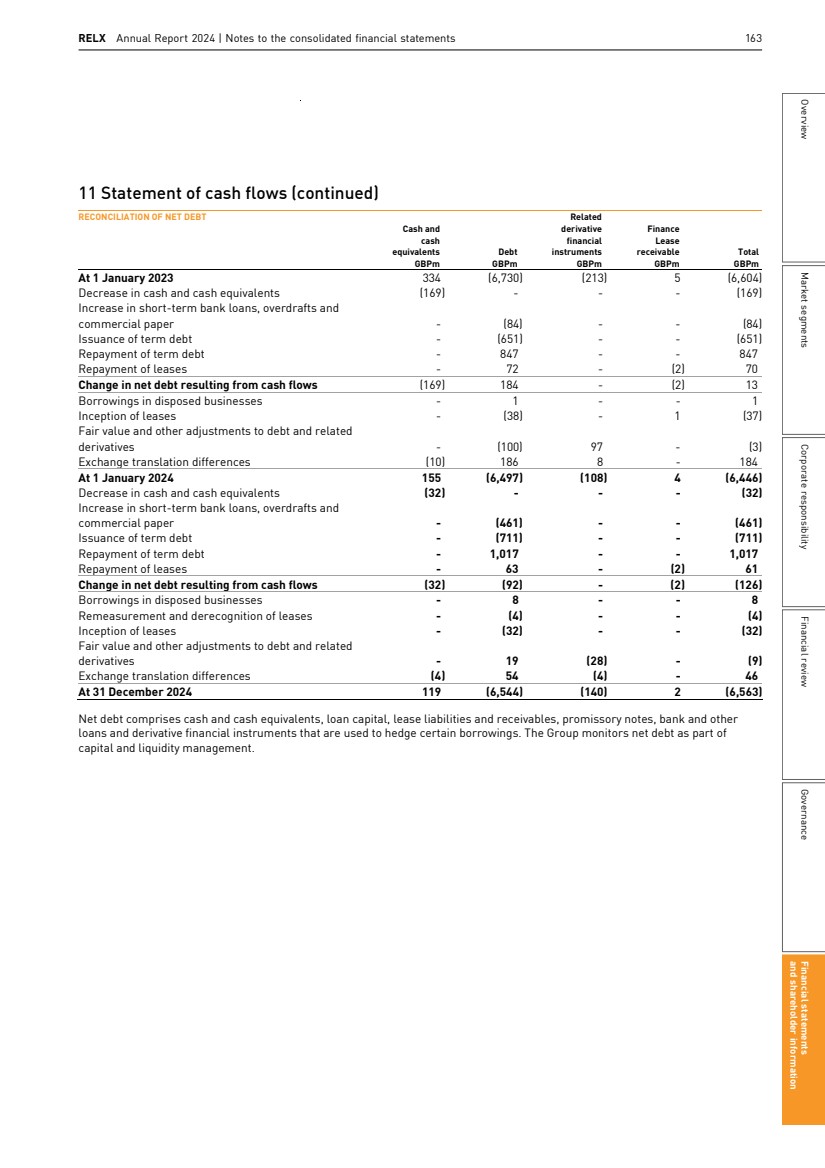
| 164 RELX Annual Report 2024 | Financial statements and other information 12 Acquisitions Accounting policy Goodwill, being the excess of the consideration over the net tangible and intangible assets acquired, represents benefits which do not qualify for recognition as intangible assets, including: the ability of a business to generate higher returns than individual assets; skilled workforces; and acquisition synergies that are specific to the Group. In addition, goodwill arises on the recognition of deferred tax liabilities in respect of intangible assets for which amortisation does not qualify for tax deductions. During the year, a number of acquisitions were made. The net assets of the businesses acquired are incorporated at their fair value to the Group. The fair values of the consideration given and of the assets and liabilities acquired are summarised below. Fair value 2022 GBPm Fair value 2023 GBPm Fair value 2024 GBPm Goodwill 269 68 146 Intangible assets 125 64 72 Property, plant and equipment 1 1 - Other non-current assets 3 - - Current assets 8 3 6 Current liabilities (21) (10) (14) Borrowings (3) - - Deferred tax (13) (6) (15) Net assets acquired 369 120 195 Consideration (after taking account of £7m net cash acquired (2022: £6m; 2023: £4m)) 369 120 195 Change in consideration deferred to future years and changes in contingent consideration relating to prior year acquisitions 4 (12) (30) Net cash flow 373 108 165 During 2024, RELX completed several acquisitions for total consideration of £195m (2023: £130m), or £188m (2023: £126m) adjusted for cash acquired. Total cash spent on acquisitions was £170m (2023: £124m) including deferred consideration of £5m (2023: £16m) on past acquisitions. The businesses acquired in 2024 contributed £11m to revenue, increased adjusted operating profit by £5m, decreased net profit by £2m (after charging £6m of integration costs and amortisation of acquired intangibles) and increased net cash inflow from operating activities by £4m for the part year under the Group’s ownership and before taking account of acquisition financing costs. Had the businesses been acquired at the beginning of the year, on a pro forma basis the Group revenues, adjusted operating profit and net profit attributable to shareholders for the year would have been £9,437m, £3,197m and £1,932m respectively, before taking account of acquisition financing costs. 13 Equity dividends ORDINARY DIVIDENDS PAID IN THE YEAR 2022 GBPm 2023 GBPm 2024 GBPm RELX PLC 983 1,059 1,121 Ordinary dividends declared and paid in the year ended 31 December 2024, in amounts per ordinary share, comprise: a final dividend for 2023 of 41.8p (2023: final dividend for 2022 of 38.9p; 2022: final dividend for 2021 of 35.5p) and a 2024 interim dividend for 2024 of 18.2p (2023: 17.0p; 2022: 15.7p), giving a total of 60.0p (2023: 55.9p; 2022: 51.2p). The Directors of RELX PLC have proposed a final dividend for 2024 of 44.8p per ordinary share (2023: 41.8p; 2022: 38.9p), giving a total for the financial year of 63.0p per ordinary share (2023: 58.8p; 2022: 54.6p). The total cost of funding the proposed final dividend is expected to be £831m, for which no liability has been recognised at the statement of financial position date. The Employee Benefit Trust has currently waived the right to receive dividends on RELX PLC shares. This waiver has been applied to dividends paid in 2022, 2023 and 2024. 164 RELX Annual Report 2024 | Financial statements and other information |
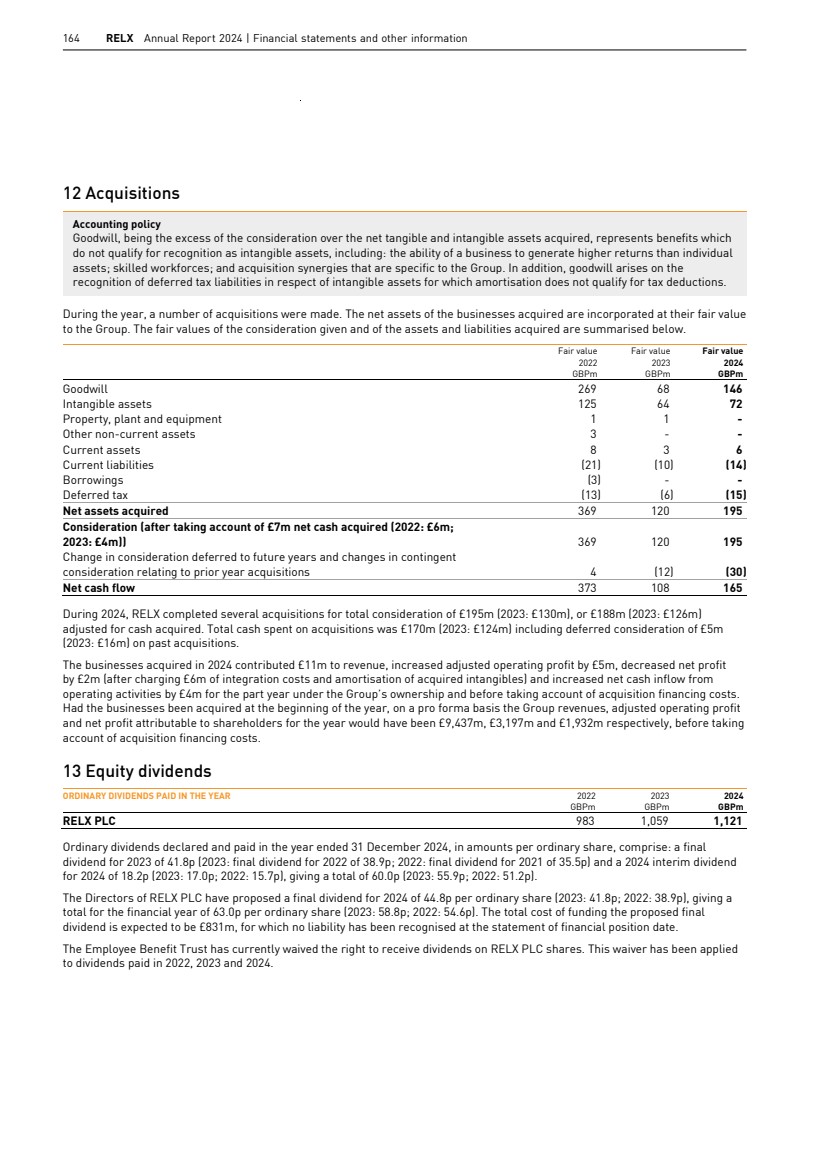
| RELX Annual Report 2024 | Notes to the consolidated financial statements 165 Overview Market segments Corporate responsibility Financial review Governance Financial statements and shareholder information 14 Intangible assets Accounting policy On acquisition of a subsidiary or business, the purchase consideration is allocated between the tangible and intangible assets other than goodwill on a fair value basis, with any excess purchase consideration representing goodwill. Goodwill is carried at fair value as at the date of acquisition less impairment charges. Acquired intangible assets are carried at their fair value as at the date of acquisition less accumulated amortisation (including impairment). On disposal, the amount of goodwill attributable to a subsidiary or business is included in the calculation of profit or loss recognised in the income statement. Management judgement is required to identify intangible assets acquired as part of business combinations which comprise: market-related assets (e.g. trademarks, imprints, brands); customer-related assets (e.g. subscription bases, customer lists, customer relationships); editorial content; software and systems (e.g. application infrastructure, product delivery platforms, in-process research and development); and other intangible assets mainly comprising contract and rights-related assets. The valuation of acquired intangible assets represents the estimated economic value in use, using standard valuation methodologies, including as appropriate, discounted cash flow and comparable market transactions. Judgements involved in estimating valuation of the intangible assets include growth in cash flows over the forecast period, the long-term growth rate assumed thereafter and the discount rate applied to the forecast cash flows. The selection of appropriate amortisation periods for acquired intangible assets requires management to assess the longevity of brands and imprints, the strength and stability of customer relationships, the market positions of the acquired intangible assets and the technological and competitive risks that they face. Certain intangible assets in relation to acquired science and medical publishing businesses have been determined to have indefinite lives. The longevity of these assets is evidenced by their long-established and well regarded journal titles, and their characteristically stable market positions. Journal titles determined to have indefinite lives are not amortised and are subject to impairment review at least annually, including a review of events and circumstances to ensure that they continue to support an indefinite useful life. Intangible assets, other than journal titles determined to have indefinite lives, are amortised on a straight-line basis over their estimated useful lives. The estimated useful lives of intangible assets with finite lives are: ■ Market-related assets – 1 to 40 years ■ Customer-related assets – 1 to 20 years ■ Editorial content – 1 to 40 years ■ Software and systems – 1 to 10 years ■ Other – 3 to 20 years Internally developed intangible assets (development spend) typically comprise software and systems development where an identifiable asset is created that is probable to generate future economic benefits and are carried at cost less accumulated amortisation. Internally developed intangible assets are amortised on a straight-line basis over their estimated useful lives of three to 10 years. Impairment reviews are carried out at where indicators of impairment are identified. Impairment reviews Goodwill and acquired intangible assets with an indefinite life are allocated to cash generating units (CGUs) and tested for impairment at least annually or when there is an indicator that the asset may be impaired. An impairment loss is recognised in the income statement in administration and other expenses to the extent the carrying value of goodwill exceeds its recoverable amount and not subsequently reversed. The recoverable amount is the higher of fair value less costs to sell and value in use. The carrying amounts of all other intangible assets are tested for impairment where there are indications of possible impairment. An impairment review involves a comparison of the carrying value of the asset with estimated values in use based on management’s cash flow projections, approved by the Board. Key areas of judgement in estimating the values in use of businesses are the growth in cash flows over a forecast period of up to five years, the long-term growth rate assumed thereafter and the discount rate applied to the forecast cash flows. These calculations require the use of estimates in respect of forecast cash flows and discount rates. Where the asset does not generate cash flows that are independent from other assets, value in use estimates are made based on the cash flows of the CGU to which the asset belongs. As permitted by IAS 36, the most recent detailed calculation of the recoverable amount of a CGU (to which goodwill and acquired intangibles with indefinite lives are allocated) is used in the impairment test for that CGU in the current period where the required criteria have been met. The three required criteria to be met are: there have been no significant changes in the assets and liabilities; the most recent recoverable amount exceeds the carrying amount by a substantial margin; and the likelihood that the recoverable amount would be less than the carrying amount is remote. Critical judgement Development spend Development spend encompasses investment in new products and other initiatives, ranging from the building of online delivery platforms, to launch costs of new services, to building new infrastructure and applications. Launch costs and other ongoing operating expenses of new products and services are expensed as incurred. The costs of building product applications, platforms and infrastructure are capitalised as internally generated intangible assets, where the investment they represent has demonstrable value and the technical and commercial feasibility is assured. Costs eligible for capitalisation must be incremental, clearly identified and directly attributable to a particular project. The resulting assets are amortised over their estimated useful lives. Judgement is required in the assessment of the potential value of a development project, the identification of costs eligible for capitalisation and the selection of appropriate asset lives. In the impairment reviews where indicators of impairment are identified, estimates relating to the future cash flows and discount rates used in calculating the value in use of the intangible asset may have a material effect on the reported amounts of intangible assets. and shareholder information Financial statements Governance Market segments Financial review Corporate responsibility Overview RELX Annual Report 2024 | Notes to the consolidated financial statements 165 |
| 166 RELX Annual Report 2024 | Financial statements and other information 14 Intangible assets (continued) Goodwill GBPm Market related GBPm Customer related GBPm Editorial content GBPm Software and technology GBPm Other GBPm Total acquired intangible assets GBPm Total internally developed intangible assets GBPm Total intangible assets excluding goodwill GBPm COST As at 1 January 2023 8,388 2,699 2,076 690 845 2,518 8,828 4,120 12,948 Acquisitions 68 1 28 1 31 3 64 - 64 Additions - - - - - - - 447 447 Disposals and other¹ (51) (28) (29) (11) (4) (9) (81) (59) (140) Exchange translation differences (382) (132) (96) (22) (37) (86) (373) (165) (538) At 1 January 2024 8,023 2,540 1,979 658 835 2,426 8,438 4,343 12,781 Acquisitions 146 10 14 10 38 - 72 - 72 Additions - - - - - - - 464 464 Disposals and other² (36) (71) (8) (6) (23) (110) (218) (87) (305) Exchange translation differences 83 36 25 4 5 7 77 2 79 At 31 December 2024 8,216 2,515 2,010 666 855 2,323 8,369 4,722 13,091 ACCUMULATED AMORTISATION As at 1 January 2023 - 1,718 1,332 617 572 2,500 6,739 2,685 9,424 Charge for the year - 116 73 15 63 12 279 330 609 Disposals and other¹ - (16) (19) (5) (8) (9) (57) (41) (98) Exchange translation differences - (87) (63) (20) (27) (87) (284) (108) (392) At 1 January 2024 - 1,731 1,323 607 600 2,416 6,677 2,866 9,543 Charge for the year - 111 71 13 62 1 258 364 622 Disposals and other² - (69) (8) (5) (23) (110) (215) (71) (286) Exchange translation differences - 23 15 3 6 7 54 (6) 48 At 31 December 2024 - 1,796 1,401 618 645 2,314 6,774 3,153 9,927 NET BOOK AMOUNT At 31 December 2023 8,023 809 656 51 235 10 1,761 1,477 3,238 At 31 December 2024 8,216 719 609 48 210 9 1,595 1,569 3,164 (1) Includes goodwill of £51m (before an impairment of £42m) and intangible assets of £31m classified as held for sale within Risk. (2) Includes goodwill impairments of £36m as the result of a number of disposals. The Legal business area has £645m (2023: £636m) of capitalised development costs associated with platforms and infrastructure, with a remaining amortisation period of up to ten years. Included in market-related intangible assets are £121m (2023: £119m) of journal titles relating to Scientific, Technical & Medical determined to have indefinite lives based on an assessment of their historical longevity and stable market positions. Impairment review There were no charges for impairment of goodwill or indefinite lived intangible assets in 2024 (2023: nil) identified during the annual impairment review. As permitted by IAS 36, the detailed calculations including key assumptions used to determine the recoverable amounts and sensitivity analysis performed in 2023 were used as a basis for the 2024 impairment tests as the criteria of IAS 36 were satisfied. For all CGUs tested: there have been no significant changes in the assets and liabilities in 2024 included in the CGUs compared to 2023; the headroom was substantial in 2023; and the likelihood that the recoverable amount would be less than the carrying amount in 2024 is remote. Goodwill and indefinite lived intangible assets are compiled and assessed among groups of CGUs, which represent the lowest level at which goodwill is monitored by management. Typically, acquisitions are integrated into existing business areas, and the goodwill arising is allocated to the groups of CGUs that are expected to benefit from the synergies of the acquisition. As the business areas have become increasingly integrated and globalised, the current CGU allocation reflects the global leverage of assets, skills, knowledge and technology platforms, and the monitoring of goodwill by management. GOODWILL 2023 GBPm 2024 GBPm Risk 3,950 4,004 Scientific, Technical & Medical 1,923 1,948 Legal 1,524 1,640 Exhibitions 626 624 Total 8,023 8,216 166 RELX Annual Report 2024 | Financial statements and other information |
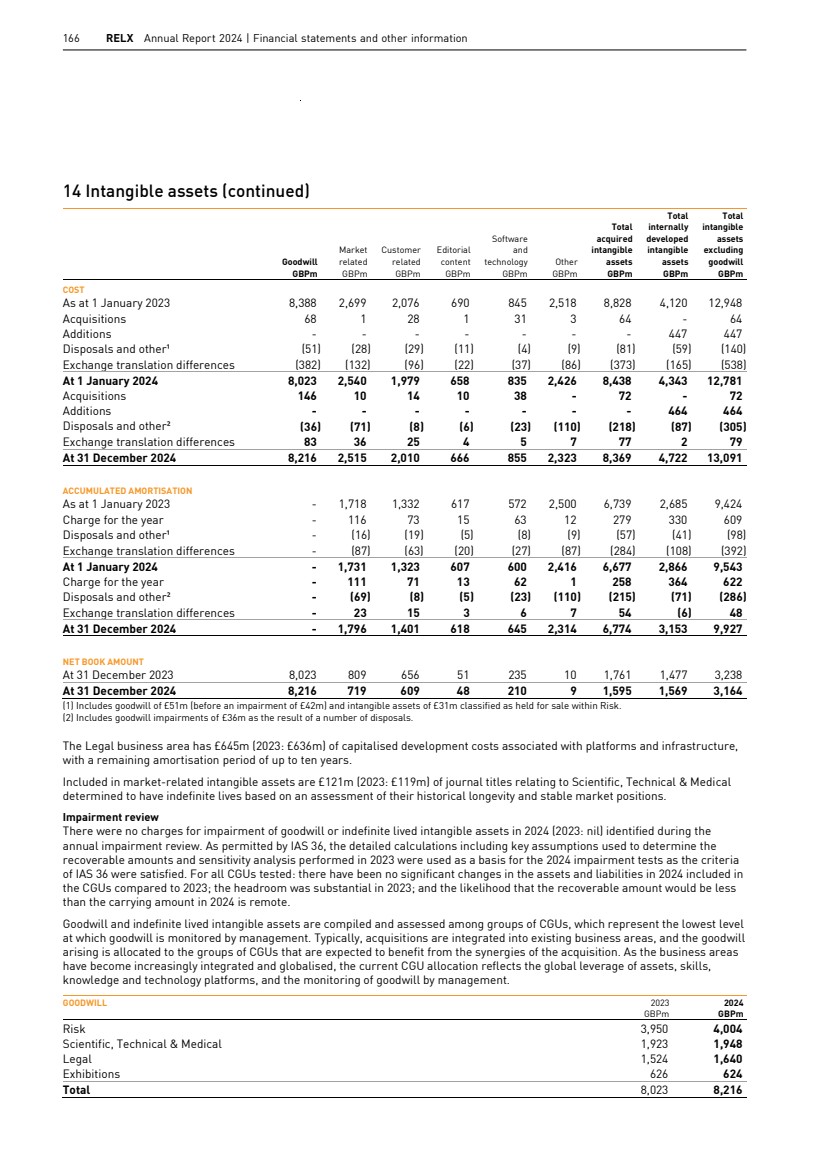
| RELX Annual Report 2024 | Notes to the consolidated financial statements 167 Overview Market segments Corporate responsibility Financial review Governance Financial statements and shareholder information 14 Intangible assets (continued) The key assumptions used for each group of CGUs are disclosed below: KEY ASSUMPTIONS 2023 2024 Pre-tax discount rate Nominal long-term market growth rate Pre-tax discount rate Nominal long-term market growth rate Risk 11.3% 4% 11.3% 4% Scientific, Technical & Medical 10.6% 3% 10.6% 3% Legal 10.9% 4% 10.9% 4% Exhibitions 12.3% 4% 12.3% 4% The pre–tax discount rates used are based on the Group’s weighted average cost of capital, adjusted to reflect a risk premium specific to each business. A post-tax discount rate was applied to post-tax cash flows. The equivalent pre-tax discount rate has been estimated by grossing up the post-tax rate. The Group’s weighted average cost of capital is derived from a risk free rate, a market risk premium, a risk adjustment (beta) and a cost of debt adjustment. The discount rates and the cash flow projections are in nominal terms and therefore, take into account the impact of inflation. As the IAS 36 criteria are satisfied for all CGUs, the 2023 recoverable amount calculation (including the discount rate and growth rate assumptions) have been used in the 2024 impairment testing calculations. The key assumptions within the forecast growth in the cash flows over a forecast period of up to five years are revenue growth, operating margin and cash conversion. Revenue growth and operating profit margin forecasts for each CGU are derived from past results adjusted by management based on salient current and future considerations. Cash conversion rates for each CGU are based on historical cash conversion rates. Nominal long-term market growth rates, which are applied after the forecast period of up to five years, are broadly in line with the long-term average growth prospects for the sectors and territories in which the businesses operate. A sensitivity analysis has been performed based on changes in key assumptions considered to be reasonably possible by management: an increase in the discount rate of 1.5%; a decrease in the compound annual growth rate for cash flow in the five-year forecast period of 2%; a decrease in the nominal long-term market growth rates of 1%; and a combined increase in discount rate of 1% and a decrease in the nominal long-term market growth rates of 1%. These sensitivity analyses show that no impairment charges would result from these scenarios. 15 Investments Accounting policy Investments, other than investments in joint arrangements and associates, are stated in the statement of financial position at fair value. Changes in the fair value of investments held as part of the venture capital portfolio are reported in disposals and other non-operating items in the income statement. All items recognised in the income statement relating to investments, other than investments in joint arrangements and associates, are reported as disposals and other non-operating items. Venture capital investments represent interests in listed and unlisted securities. The fair value of listed securities is based on quoted prices in active markets. The fair value of unlisted securities is based on management’s estimate of fair value based on standard valuation techniques, including market comparisons and discounts of future cash flows, having regard to maximising the use of observable inputs and adjusting for risk. Advice from valuation experts is used as appropriate. Refer to note 17 for further information. All joint arrangements are classified as joint ventures because the Group shares joint control and has rights to the net assets of the arrangements. Investments in joint ventures and associates are accounted for under the equity method and stated in the statement of financial position at cost as adjusted for post-acquisition changes in the Group’s share of net assets, less any impairment in value. 2023 GBPm 2024 GBPm Investments in joint ventures and associates 178 169 Venture capital and other investments 97 92 Total 275 261 and shareholder information Financial statements Governance Market segments Financial review Corporate responsibility Overview RELX Annual Report 2024 | Notes to the consolidated financial statements 167 |
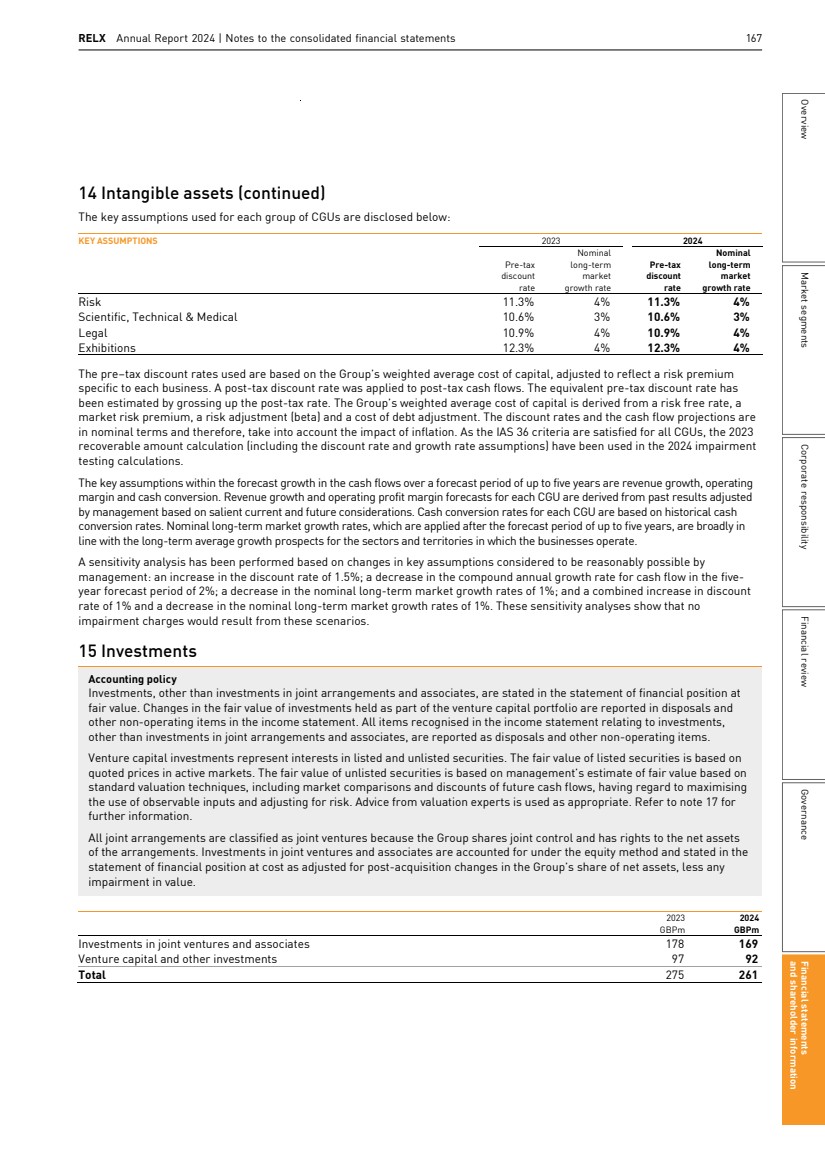
| 168 RELX Annual Report 2024 | Financial statements and other information 15 Investments (continued) An analysis of changes in the carrying value of investments in joint ventures and associates is set out below: 2023 GBPm 2024 GBPm At start of year 159 178 Share of results of joint ventures and associates 46 43 Dividends received from joint ventures and associates (21) (37) Exchange translation differences (6) (15) At end of year 178 169 Summarised aggregate information in respect of the Group’s share of joint ventures and associates is set out below: RELX’s share 2023 GBPm 2024 GBPm Revenue 123 121 Net profit for the year 46 43 Total assets 200 198 Total liabilities (61) (97) Net assets 139 101 Goodwill 39 68 Total 178 169 The Group’s consolidated other comprehensive income includes no income or losses relating to joint ventures and associates in 2024 and 2023. 16 Property, plant and equipment Accounting policy Property, plant and equipment are stated at cost less accumulated depreciation. No depreciation is provided on freehold land. Freehold buildings and long leaseholds are depreciated over their estimated useful lives up to a maximum of 50 years. Short leases are written off over the duration of the lease. Depreciation is provided on other assets on a straight-line basis over their estimated useful lives as follows: ■ land and buildings: land – not depreciated; leasehold improvements – shorter of life of lease and 10 years ■ fixtures and equipment: plant – 3 to 20 years; office furniture, fixtures and fittings – 5 to 10 years; computer systems, communication networks and equipment – 3 to 7 years 2023 2024 Land and buildings GBPm Fixtures and equipment GBPm Total GBPm Land and buildings GBPm Fixtures and equipment GBPm Total GBPm Cost At start of year 166 452 618 134 373 507 Acquisitions - 1 1 - - - Capital expenditure 5 25 30 1 19 20 Disposals (30) (88) (118) (25) (104) (129) Exchange translation differences (7) (17) (24) - - - At end of year 134 373 507 110 288 398 Accumulated depreciation At start of year 115 377 492 92 316 408 Charge for the year 5 38 43 5 29 34 Disposals (23) (85) (108) (23) (103) (126) Exchange translation differences (5) (14) (19) - - - At end of year 92 316 408 74 242 316 Net book amount 42 57 99 36 46 82 Included in land and buildings is freehold land of £7m (2023: £8m). Amounts relating to right-of-use assets under IFRS 16 can be found in note 22. 168 RELX Annual Report 2024 | Financial statements and other information |
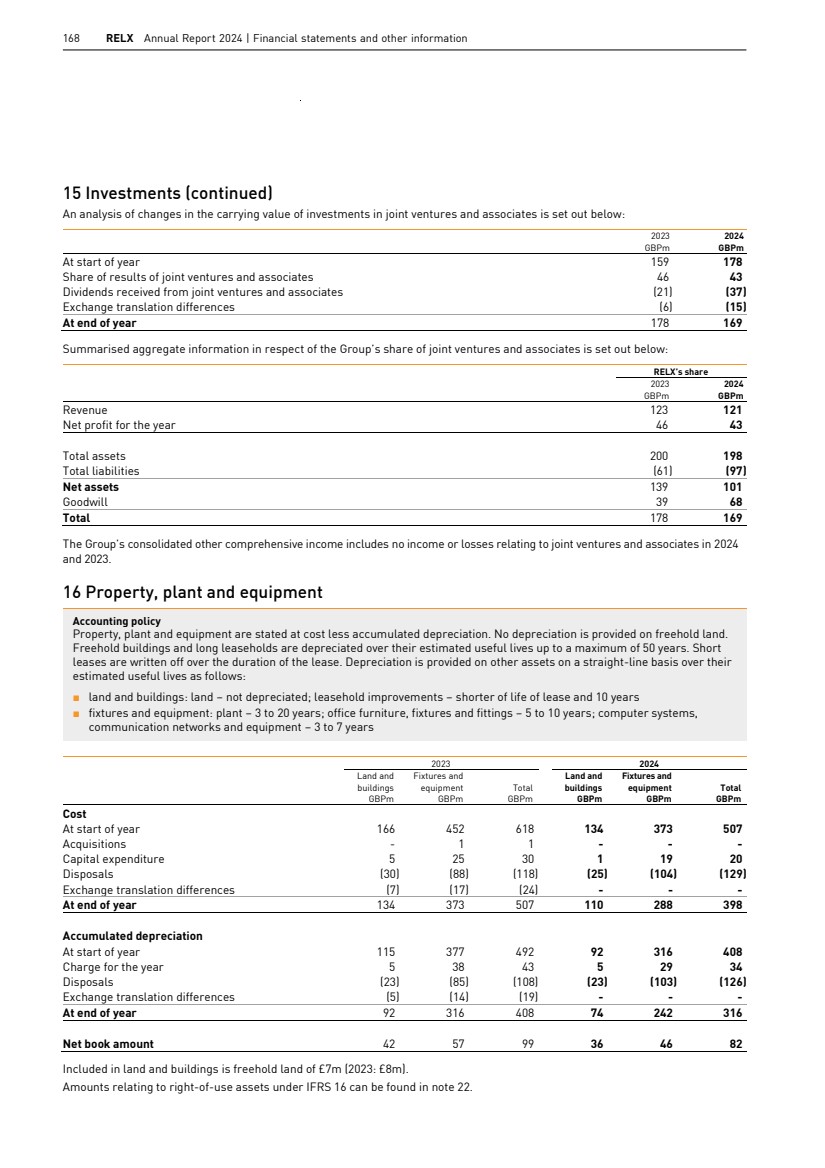
| RELX Annual Report 2024 | Notes to the consolidated financial statements 169 Overview Market segments Corporate responsibility Financial review Governance Financial statements and shareholder information 17 Financial instruments Accounting policy Financial instruments comprise investments (other than investments in joint ventures or associates), trade receivables, cash and cash equivalents, payables and accruals, borrowings and derivative financial instruments. Investments are described in note 15. The fair value of such investments is based on standard valuation techniques, including market comparisons and discounts of future cash flows, having regard to maximising the use of observable inputs and adjusting for risk. These investments are typically classified as either Level 1 or 2 in the IFRS 13 fair value hierarchy. Trade receivables are carried in the statement of financial position at invoiced value less allowance for expected credit losses. Expected credit losses are based on the ageing of trade receivables, experience and circumstance. Borrowings and payables are recorded initially at fair value and subsequently carried at amortised cost (other than fixed rate borrowings in designated hedging relationships for which the carrying amount of the hedged portion of the borrowings is subsequently adjusted for the gain or loss attributable to the hedged risk). Derivative financial instruments are used to hedge interest rate and foreign exchange risks. Where an effective hedge is in place against changes in the fair value of fixed rate borrowings, the hedged borrowings are adjusted for changes in fair value attributable to the risk being hedged with a corresponding income or expense included in the income statement within finance costs. The offsetting gains or losses from remeasuring the fair value of the related derivatives are also recognised in the income statement within finance costs. When the related derivative expires, is sold or terminated, or no longer qualifies for hedge accounting, the cumulative change in fair value of the hedged borrowing is amortised in the income statement over the period to maturity of the borrowing using the effective interest method. Changes in the fair value of derivative financial instruments that are designated and effective as hedges of future cash flows are recognised (net of tax) in other comprehensive income and accumulated in the hedge reserve. The fair value amounts relating to foreign currency basis spreads are recorded in a separate component of equity in the cost of hedging reserve. If a hedged firm commitment or forecasted transaction results in the recognition of a non-financial asset or liability, then, at the time that the asset or liability is recognised, the associated gains or losses on the derivative that had previously been recognised in other comprehensive income are included in the initial measurement of the asset or liability. For hedges that do not result in the recognition of an asset or a liability, amounts deferred in the hedge reserve are recognised in the income statement in the same period in which the hedged item affects net profit or loss. Any ineffective portion of hedges is recognised immediately in the income statement. Cash flow hedge accounting is discontinued when a hedging instrument expires or is sold, terminated or exercised, or no longer qualifies for hedge accounting. At that time, any cumulative gain or loss on the hedging instrument recognised in other comprehensive income is either retained in the hedge reserve until the firm commitment or forecasted transaction occurs, or, where a hedged transaction is no longer expected to occur, is immediately credited or expensed in the income statement. Derivative financial instruments that are not designated as hedging instruments are recorded in the statement of financial position at fair value, with changes in fair value recognised in the income statement. The fair values of derivative financial instruments represent the replacement costs calculated using observable market rates of interest and exchange. These instruments are accordingly classified as Level 2 in the IFRS 13 fair value hierarchy. The fair value of long-term borrowings is based on quoted prices in active markets. These instruments are accordingly classified as Level 1 in the IFRS 13 fair value hierarchy. The main financial risks faced by the Group are liquidity risk, market risk – comprising interest rate risk and foreign exchange risk – and credit risk. Financial instruments are used to finance the Group’s businesses and to manage interest rate and foreign exchange risks. The Group’s businesses do not enter into speculative derivative transactions. Details of financial instruments subject to liquidity, market and credit risks are described below. and shareholder information Financial statements Governance Market segments Financial review Corporate responsibility Overview RELX Annual Report 2024 | Notes to the consolidated financial statements 169 |
| 170 RELX Annual Report 2024 | Financial statements and other information 17 Financial instruments (continued) Liquidity risk The Group maintains a range of borrowing facilities and debt programmes to fund its requirements at competitive rates. The balance of long-term debt, short-term debt and committed bank facilities is managed to provide security of funding, taking into account the cash generation cycle of the business and the uncertain size and timing of acquisition spend. To accommodate the significant free cash flow generated by the Group and to capitalise on an inexpensive source of funding, a meaningful portion of the overall debt portfolio is typically kept short term as long as there exists acceptable liquidity in the commercial paper markets and sufficient capacity under committed credit lines. The Group’s treasury policies ensure adequate liquidity by requiring that (a) no more than $2bn of term debt matures in any 12-month period, (b) the sum of term debt maturing over the ensuing 12 months plus short-term borrowings is less than the sum of available cash plus committed facilities and (c) minimum levels of borrowing with maturities over three and five years are maintained. The treasury policies ensure debt efficiency by (a) targeting certain levels of short-term borrowings across a given year, (b) maintaining a weighted average maturity of the gross debt portfolio of approximately five years and (c) minimising surplus cash balances. From time to time, based on cash flow and market conditions, the Group may redeem term debt early or repurchase outstanding debt in the open market. Debt is issued to meet the funding requirements of various jurisdictions and in the currencies that are needed. It is recognised that debt can act as a natural translation hedge of earnings, net assets and net cash flow in currencies other than the reporting currency. For this reason, the majority of the Group’s net debt is denominated in US dollars and euros, reflecting the Group’s largest geographical markets. There were no changes to the Group’s long-term approach to capital and liquidity management during the year. The remaining contractual maturities for borrowings and derivative financial instruments are shown in the table below. The table shows undiscounted principal and interest cash flows and includes contractual gross cash flows to be exchanged as part of cross-currency interest rate swaps and forward foreign exchange contracts where there is a legal right of set-off. AT 31 DECEMBER 2023 Contractual cash flow (including interest) Carrying Within More than amount 1 year 1-2 years 2-3 years 3-4 years 4-5 years 5 years Total GBPm GBPm GBPm GBPm GBPm GBPm GBPm GBPm Borrowings Fixed rate borrowings (6,136) (1,174) (762) (764) (538) (792) (3,037) (7,067) Floating rate borrowings (220) (220) - - - - - (220) Lease liabilities (141) (66) (45) (17) (12) (6) (28) (174) (6,497) Derivative financial liabilities Cash inflows 621 92 14 3 - - 730 Cash outflows (632) (94) (14) (3) - - (743) Forward foreign exchange contracts (16) (11) (2) - - - - (13) Interest rate derivatives (104) (35) (17) (13) (13) (14) (27) (119) Cross-currency interest rate swaps (27) (34) (539) - - - - (573) (147) Derivative financial assets Cash inflows 1,149 364 199 30 - - 1,742 Cash outflows (1,111) (339) (186) (29) - - (1,665) Forward foreign exchange contracts 62 38 25 13 1 - - 77 Interest rate derivatives 19 - 4 6 5 4 19 38 Cross-currency interest rate swaps - 7 527 - - - - 534 81 Total (6,563) (1,495) (809) (775) (557) (808) (3,073) (7,517) 170 RELX Annual Report 2024 | Financial statements and other information |
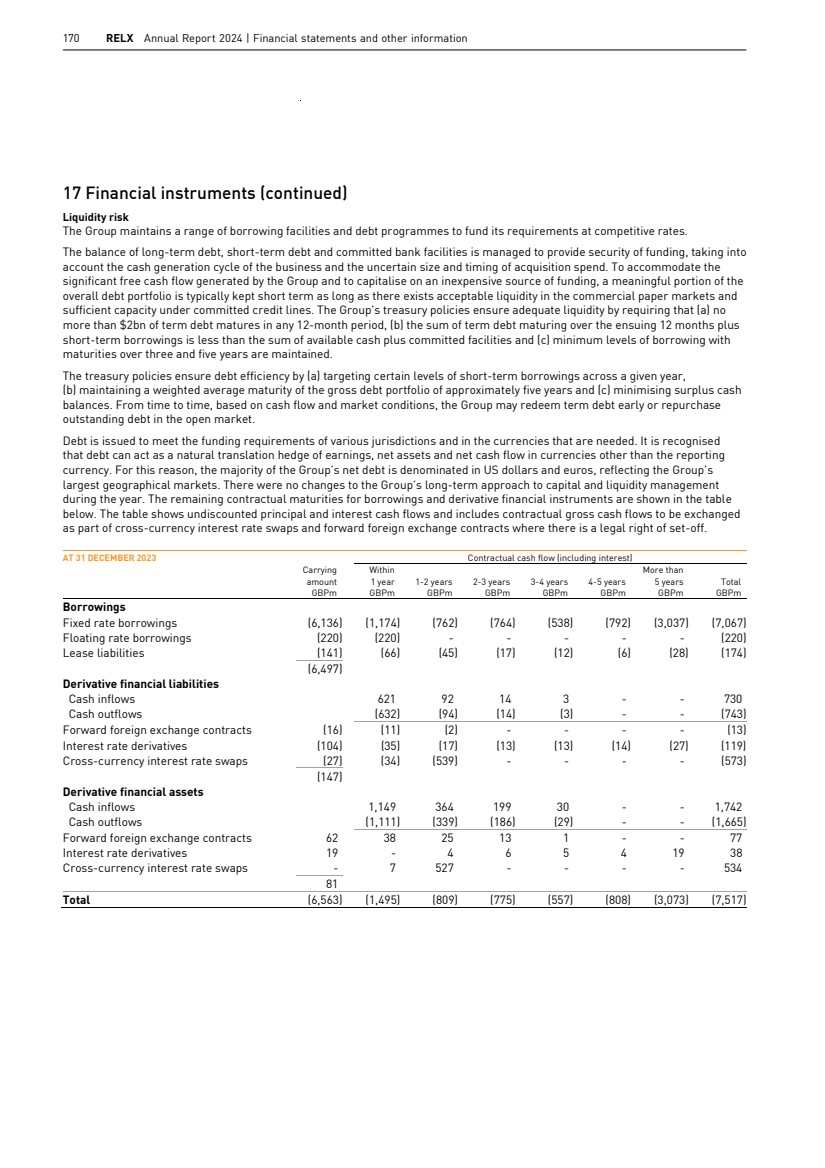
| RELX Annual Report 2024 | Notes to the consolidated financial statements 171 Overview Market segments Corporate responsibility Financial review Governance Financial statements and shareholder information 17 Financial instruments (continued) AT 31 DECEMBER 2024 Contractual cash flow (including interest) Carrying amount GBPm Within 1 year GBPm 1-2 years GBPm 2-3 years GBPm 3-4 years GBPm 4-5 years GBPm More than 5 years GBPm Total GBPm Borrowings Fixed rate borrowings (5,679) (763) (756) (541) (783) (862) (2,979) (6,684) Floating rate borrowings (762) (762) - - - - - (762) Lease liabilities (103) (43) (28) (19) (10) (4) (27) (131) (6,544) Derivative financial liabilities Cash inflows 1,560 180 124 17 - - 1,881 Cash outflows (1,575) (184) (126) (17) - - (1,902) Forward foreign exchange contracts (23) (15) (4) (2) - - - (21) Interest rate derivatives (119) (25) (22) (22) (22) (22) (22) (135) Cross-currency interest rate swaps (43) (550) - - - - - (550) (185) Derivative financial assets Cash inflows 827 274 85 6 - - 1,192 Cash outflows (788) (251) (77) (6) - - (1,122) Forward foreign exchange contracts 53 39 23 8 - - - 70 Interest rate derivatives 21 3 5 5 4 3 16 36 Cross-currency interest rate swaps - 502 - - - - - 502 74 Total (6,655) (1,614) (782) (571) (811) (885) (3,012) (7,675) The carrying amount of derivative financial liabilities comprises £162m (2023: £130m) in relation to fair value hedges, £15m (2023: £14m) in relation to cash flow hedges and £8m (2023: £3m) not designated as hedging instruments, totalling £185m (2023: £147m), of which £59m (2023: £16m) have been classified as current and £126m (2023: £131m) as non-current liabilities in the statement of financial position. The carrying amount of derivative financial assets comprises £21m (2023: £19m) in relation to fair value hedges, £43m (2023: £53m) in relation to cash flow hedges and £10m (2023: £9m) not designated as hedging instruments, totalling £74m (2023: £81m), of which £35m (2023: £34m) have been classified as current and £39m (2023: £47m) as non-current assets in the statement of financial position. The Group has ample liquidity and access to debt capital markets, providing the ability to repay or refinance borrowings as they mature and to fund ongoing requirements. At 31 December 2024, the Group had access to a $3.0bn committed bank facility maturing in April 2027, which was undrawn. This facility backs up short-term borrowings, and has pricing linked to three Corporate Responsibility performance targets, all of which were achieved in 2024. All borrowings that mature within the next two years can be covered by the facility and by utilising available cash resources. The committed bank facility is not subject to a financial covenant and there are no financial covenants in any outstanding public bonds. Market risk The Group’s primary market risks are interest rate fluctuations and exchange rate movements. Derivatives are used to manage the risks associated with interest rate and exchange rate movements and the Group does not enter into speculative derivatives. Where the impact of derivatives on the income statement and the statement of financial position could be significant, hedge accounting is applied (subject to satisfying the required criteria) as described in ‘Hedge accounting’ below. Derivatives used by the Group for hedging a particular risk are not specialised and are generally available from numerous sources. The Group is also exposed to changes in the market value of its venture capital investments as described in note 15. The impact of market risks on net post-employment benefit obligations and taxation is excluded from the following market risk sensitivity analysis. Interest rate exposure management The Group’s interest rate exposure management policy aims to minimise interest costs with an acceptable level of year-on-year volatility. To achieve this, the Group uses fixed rate term debt and interest rate swaps to give a target mix of fixed rate and floating rate borrowings. Interest rate derivatives are used only to hedge an underlying risk and no net market positions are held. At 31 December 2024, including the effect of interest rate swaps, 56% of gross bank and bond borrowings were at fixed rates. A 100 basis point reduction in short-term interest rates would result in an estimated decrease in annual net finance costs of £28m (2023: £26m), based on the composition of financial instruments including cash, cash equivalents, bank loans and commercial paper borrowings at 31 December 2024. A 100 basis point rise in short-term interest rates would result in an estimated increase in net finance costs of £28m (2023: £26m). and shareholder information Financial statements Governance Market segments Financial review Corporate responsibility Overview RELX Annual Report 2024 | Notes to the consolidated financial statements 171 |
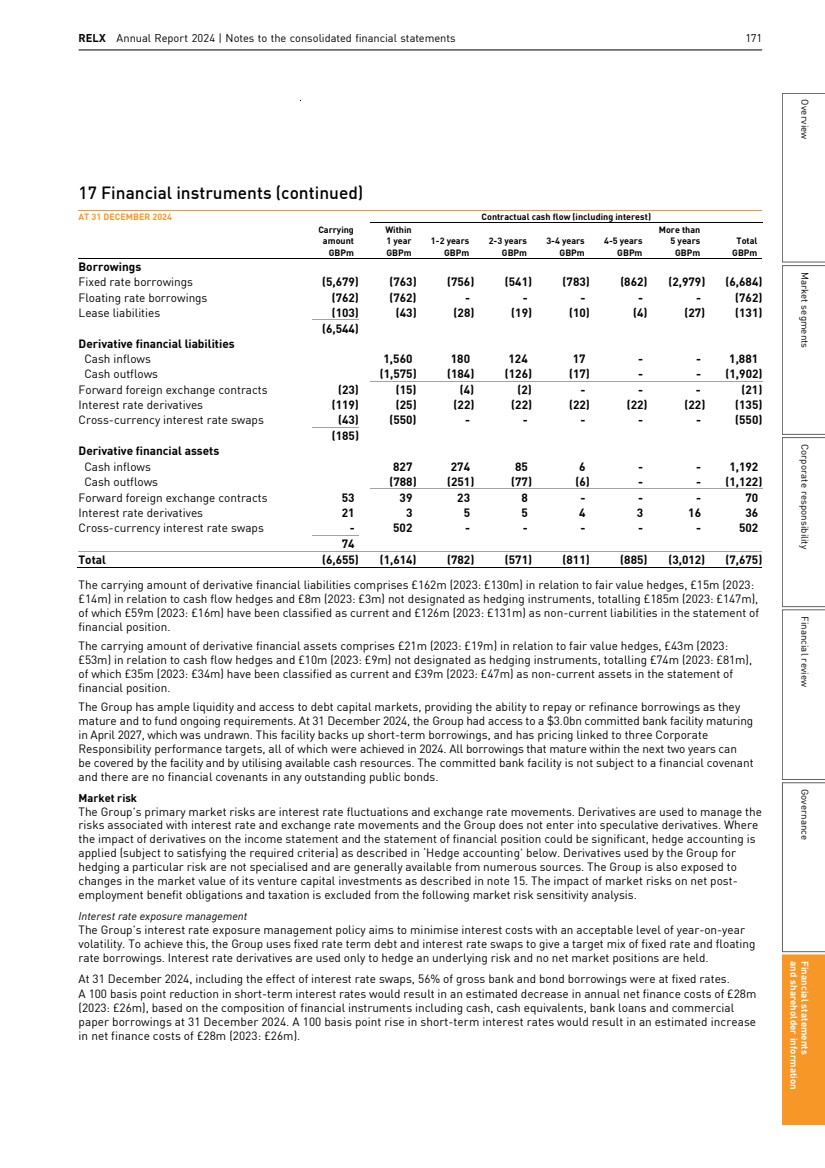
| 172 RELX Annual Report 2024 | Financial statements and other information 17 Financial instruments (continued) The impact on net equity of a theoretical change in interest rates as at 31 December 2024 is restricted to the change in carrying value of floating rate to fixed rate interest rate derivatives in a designated cash flow hedge relationship. A 100 basis point reduction in interest rates would result in an estimated decrease in net equity of nil (2023: nil) and a 100 basis point increase in interest rates would increase net equity by an estimated amount of nil (2023: nil). The impact of a change in interest rates on the carrying value of fixed rate borrowings in a designated fair value hedge relationship would be offset by the change in carrying value of the related interest rate derivative. Fixed rate borrowings not in a designated hedging relationship are carried at amortised cost. The Group has assessed the ongoing impact of the Interbank Offered Rates (IBOR) reform and there has been no significant impact on the financial statements. The Group is primarily exposed to IBOR through its derivatives which swap fixed rate bond issuances to a floating rate of interest and which are designated in fair value hedge relationships. The Group has adopted the ISDA fallback protocol in respect of these derivatives and the fair value hedge designations are expected to remain highly effective throughout the transition to alternative risk free rates. The table on page 173 details these interest rate derivatives which, at the year end, swap £1,134m of bonds with weighted average maturity of 3.0 years to a floating rate of interest previously referencing US dollar LIBOR (3 months) and swap £620m of bonds with weighted average maturity of 6.4 years to a floating rate of interest referencing Euribor (3 months). The interest rate derivatives which referenced US dollar LIBOR have been transitioned to US dollar SOFR since 30 June 2023 with the floating rates shown in the table on page 173 updated accordingly. Foreign currency exposure management Translation exposures arise on the earnings and net assets of individual businesses whose operational currencies are other than sterling. Some of these exposures are offset by denominating borrowings in US dollars, euros and other currencies. Currency exposures on transactions denominated in a foreign currency are generally hedged using forward contracts. In addition, recurring transactions and future investment exposures may be hedged, in advance of becoming contractual. The precise policy differs according to the specific circumstances of the individual businesses. Highly predictable future cash flows may be covered for transactions expected to occur during the next 24 months (50 months for the Scientific, Technical & Medical subscription businesses) within limits defined according to the period before the transaction is expected to become contractual. Cover takes the form of foreign exchange forward contracts. Further information is provided in ‘Cash flow hedges’ below. A theoretical weakening of all currencies by 10% against sterling at 31 December 2024 would decrease the carrying value of net assets, excluding net borrowings, by £852m (2023: £835m). This would be offset to a degree by a decrease in net borrowings of £683m (2023: £716m). A strengthening of all currencies by 10% against sterling at 31 December 2024 would increase the carrying value of net assets, excluding net borrowings, by £852m (2023: £835m) and increase net borrowings by £683m (2023: £716m). A retranslation of the Group’s net profit for the year, assuming a 10% weakening of all foreign currencies against sterling but excluding transactional exposures, would reduce net profit by £156m (2023: £145m). A 10% strengthening of all foreign currencies against sterling on this basis would increase net profit for the year by £156m (2023: £145m). Credit risk The Group seeks to manage interest rate risk and limit foreign exchange risks described above by the use of financial instruments and as a result has a credit risk from the potential non-performance by the counterparties to these financial instruments, which are unsecured. The amount of this credit risk is normally restricted to the amounts of any hedge gain and not the principal amount being hedged. The Group also has a credit exposure to counterparties for the full principal amount of cash and cash equivalents. Credit risks are controlled by monitoring the credit quality of these counterparties, principally licensed commercial banks and investment banks with strong long-term credit ratings, and the amounts outstanding with each of them. The Group has treasury policies in place which do not allow concentrations of risk with individual counterparties and do not allow significant treasury exposures with counterparties which are rated lower than A-/A3 by Standard & Poor’s, Moody’s and Fitch. At 31 December 2024, cash and cash equivalents totalled £119m (2023: £155m), of which 91% (2023: 91%) was held with banks rated A-/A3 or better. The Group also has credit risk with respect to trade receivables due from its customers, which include national and state governments, academic institutions and large and small enterprises including insurance companies, law firms and life science companies. The concentration of credit risk from trade receivables is limited due to the large and broad customer base. Trade receivable exposures are managed locally in the business areas where they arise. Where appropriate, business areas seek to minimise this exposure by taking payment in advance and through management of credit terms. Expected credit losses are based on management’s assessment of the risk taking into account the ageing profile, experience and circumstance. The maximum exposure to credit risk is represented by the carrying amount of each financial asset, including derivative financial instruments, recorded in the statement of financial position. Included within trade receivables are the following amounts which are past due, after considering loss allowance: 2022 GBPm 2023 GBPm 2024 GBPm Up to one month 265 259 217 2 to 3 months 115 130 130 4 to 6 months 46 56 57 Greater than 6 months 23 35 24 Total past due 449 480 428 172 RELX Annual Report 2024 | Financial statements and other information |
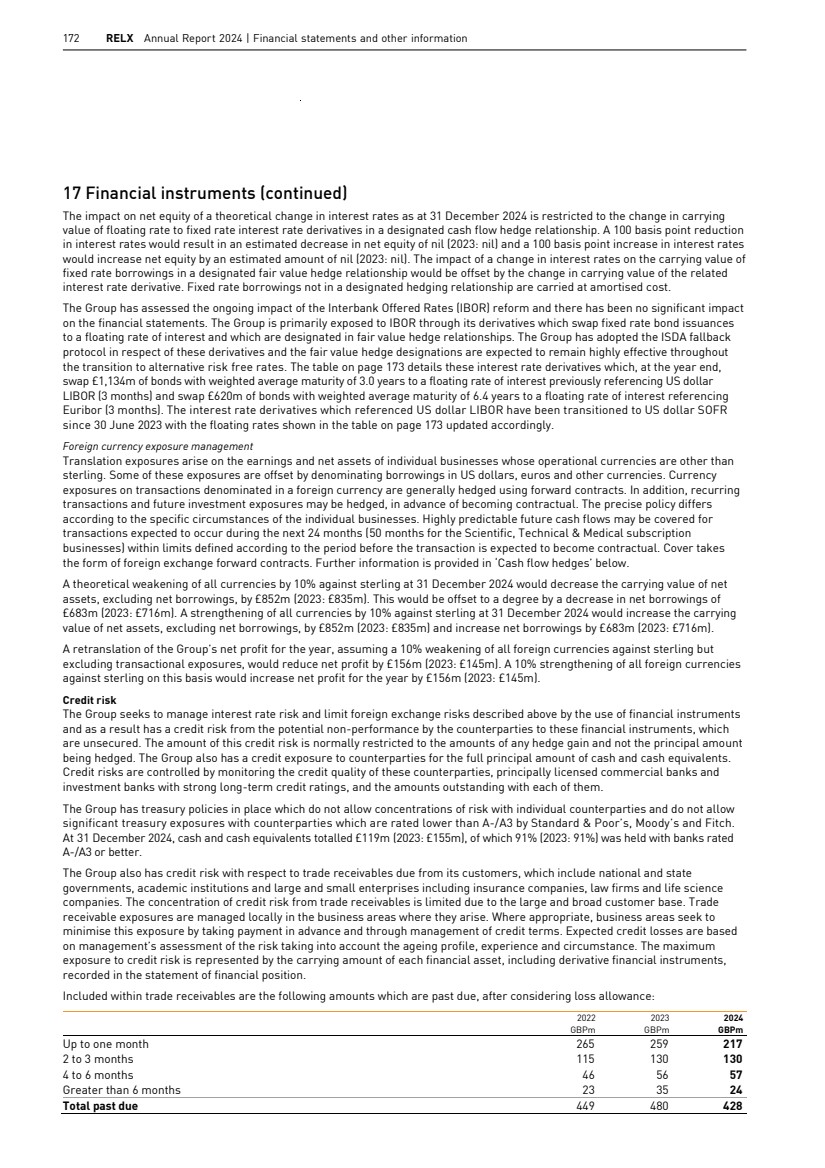
| RELX Annual Report 2024 | Notes to the consolidated financial statements 173 Overview Market segments Corporate responsibility Financial review Governance Financial statements and shareholder information 17 Financial instruments (continued) Hedge accounting The hedging relationships that are designated under IFRS 9 – Financial Instruments are described below. Fair value hedges The Group has entered into interest rate swaps and cross-currency interest rate swaps to hedge the exposure to changes in the fair value of fixed rate borrowings due to interest rate and foreign currency movements which could affect the income statement. The table below details the designated fair value hedge relationships that were in place at 31 December 2024, swapping fixed rate term debt issues denominated in US dollars (USD) and euros to floating rate USD and euro debt respectively for the whole or part of their term, together with the related fixed and floating rates. FAIR VALUE HEDGE RELATIONSHIPS 31 December 2023 Principal amount GBPm 31 December 2024 Principal amount GBPm Fixed rate Floating rate €500m bond and €500m interest rate swaps maturing 2024 (433) - 1.0% Euribor+0.7% €600m bond and €600m/$669.3m cross-currency interest rate swaps maturing 2025 (524) (535) 1.3% USD SOFR+1.5% $750m bond and $750m interest rate swaps maturing 2030 (588) (599) 3.0% USD SOFR+1.8% €750m bond and €750m interest rate swaps maturing 2031 (650) (620) 3.8% Euribor+0.9% $500m bond and $500m interest rate swaps maturing 2032 (392) (399) 4.8% USD SOFR+2.0% (2,587) (2,153) The gains and losses on the borrowings and related derivatives designated as fair value hedges, which are included in the income statement as part of finance costs, together with the total carrying values of the borrowings and related derivatives included in the statement of financial position, for the three years ended 31 December 2022, 2023 and 2024 were as follows: GAINS/(LOSSES) ON BORROWINGS AND RELATED DERIVATIVES AND CARRYING VALUES 1 January 2022 GBPm Fair value movement gain/(loss) GBPm Exchange gain/(loss) GBPm 31 December 2022 GBPm Carrying values GBPm USD debt (1) 140 2 141 (1,630) Related interest rate swaps 8 (149) (2) (143) (143) 7 (9) - (2) (1,773) EUR debt (27) 96 1 70 (924) Related interest rate swaps 27 (96) (1) (70) (70) - - - - (994) Total relating to USD and EUR debt (28) 236 3 211 (2,554) Total related interest rate swaps 35 (245) (3) (213) (213) Net gain on borrowings and related derivatives/total carrying value 7 (9) - (2) (2,767) and shareholder information Financial statements Governance Market segments Financial review Corporate responsibility Overview RELX Annual Report 2024 | Notes to the consolidated financial statements 173 |
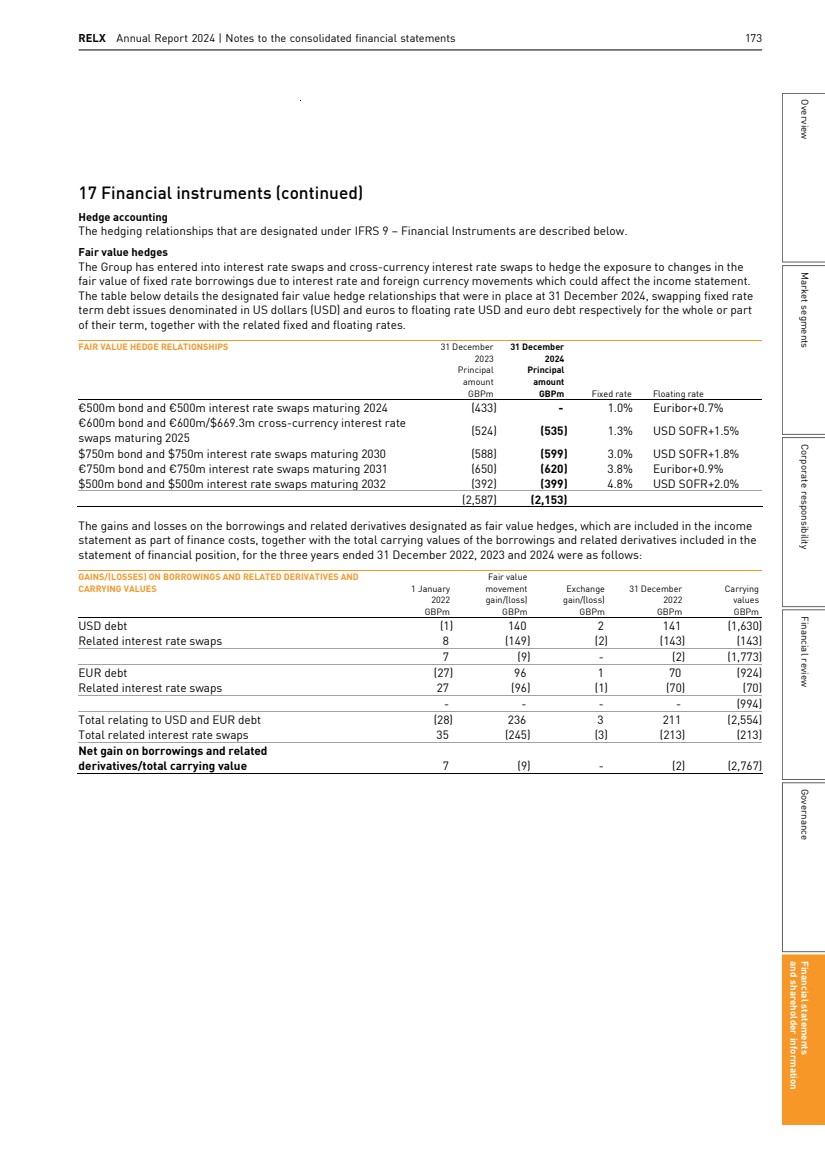
| 174 RELX Annual Report 2024 | Financial statements and other information 17 Financial instruments (continued) GAINS/(LOSSES) ON BORROWINGS AND RELATED DERIVATIVES AND CARRYING VALUES 1 January 2023 GBPm Fair value movement gain/(loss) GBPm Redemption/ close-out GBPm Exchange gain/(loss) GBPm 31 December 2023 GBPm Carrying values GBPm USD debt 141 (22) (16) (6) 97 (871) Related interest rate swaps (143) 21 16 6 (100) (100) (2) (1) - - (3) (971) EUR debt 70 (61) - (2) 7 (1,600) Related interest rate swaps (70) 60 - 2 (8) (8) - (1) - - (1) (1,608) Total relating to USD and EUR debt 211 (83) (16) (8) 104 (2,471) Total related interest rate swaps (213) 81 16 8 (108) (108) Net gain/(loss) on borrowings and related derivatives/total carrying value (2) (2) - - (4) (2,579) GAINS/(LOSSES) ON BORROWINGS AND RELATED DERIVATIVES AND CARRYING VALUES 1 January 2024 GBPm Fair value movement gain/(loss) GBPm Redemption/ close-out GBPm Exchange gain/(loss) GBPm 31 December 2024 GBPm Carrying values GBPm USD debt 97 14 - 3 114 (875) Related interest rate swaps (100) (16) - (3) (119) (119) (3) (2) - - (5) (994) EUR debt 7 12 - 1 20 (1,133) Related interest rate swaps (8) (12) - (1) (21) (21) (1) - - - (1) (1,154) Total relating to USD and EUR debt 104 26 - 4 134 (2,008) Total related interest rate swaps (108) (28) - (4) (140) (140) Net loss on borrowings and related derivatives/total carrying value (4) (2) - - (6) (2,148) All fair value hedges were highly effective throughout the three years ended 31 December 2024. $200m of bonds that were due to be repaid in August 2027 were redeemed early in December 2023. These bonds had been swapped to floating rate in a fair value hedge relationship as described above, and on the early redemption the fair value adjustment to the bonds of £16m was expensed in full to the income statement as part of finance costs. The related derivatives were closed out with a cash outflow of £16m. Gross borrowings as at 31 December 2024 included nil (2023: £1m) in relation to fair value adjustments to borrowings previously designated in a fair value hedge relationship which were de-designated in 2008. The related derivatives were closed out on de-designation with a cash inflow of £62m. £1m of these fair value adjustments were amortised in the year as a reduction to finance costs (2023: £9m, including £6m in relation to the early redemption of the 2027 bonds). Cash flow hedges As part of the Group’s interest rate exposure management, it has entered into certain cross-currency interest rate derivatives, individual components of which have been accounted for as cash flow hedges (with the remaining components accounted for as fair value hedges, as described above). These comprised interest rate derivatives which swapped a fixed rate €600m bond, issued in May 2015 and maturing in May 2025, to floating rate USD debt for the whole of its term. The component relating to the swap of the euro credit margin to USD is being accounted for as a cash flow hedge under IFRS 9, with the amount associated with foreign currency basis spreads recorded in the cost of hedging reserve. As part of the Group’s foreign currency exposure management, it has entered into forward foreign exchange contracts which fix the exchange rate on a portion of future foreign currency subscription revenues forecast by the businesses for up to 50 months. These have been accounted for as cash flow hedges under IFRS 9 of the forecast foreign currency revenues, with gains and losses on the forward contracts deferred in the hedge reserve until the related revenue is recognised, at which time the accumulated gains and losses are reclassified to the income statement. 174 RELX Annual Report 2024 | Financial statements and other information |
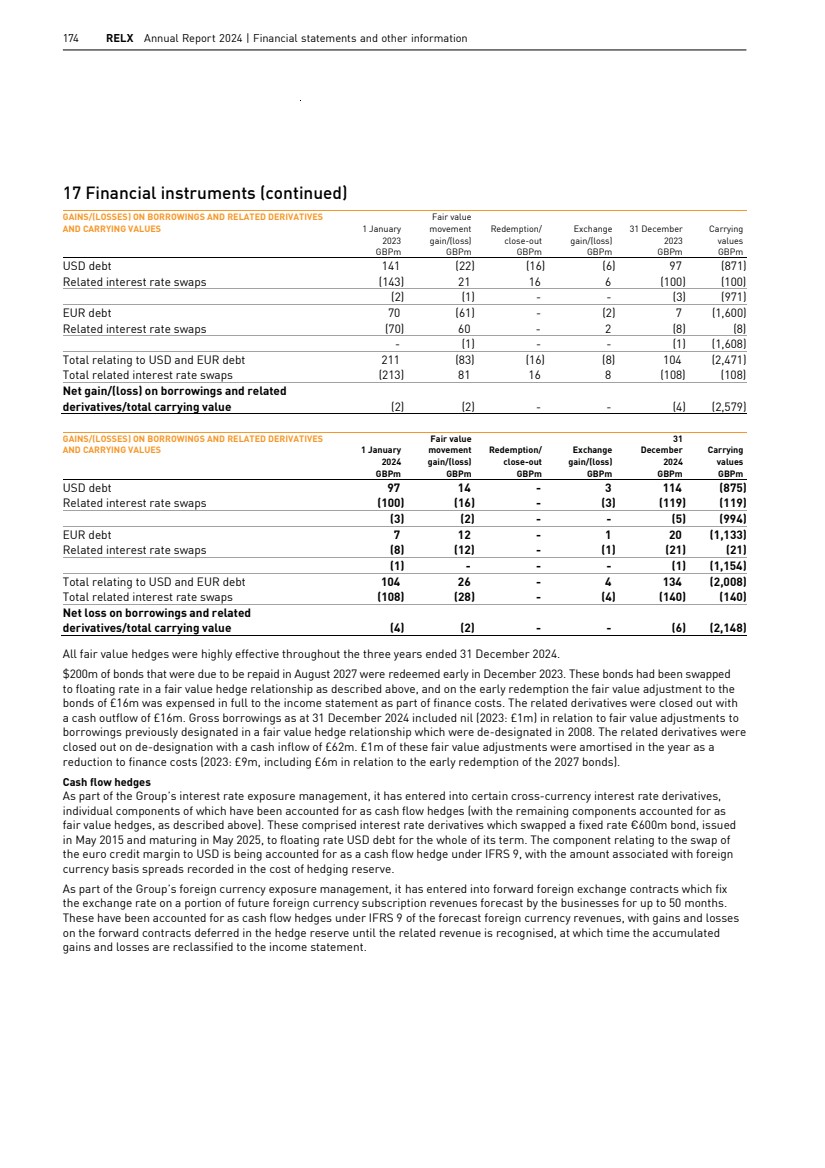
| RELX Annual Report 2024 | Notes to the consolidated financial statements 175 Overview Market segments Corporate responsibility Financial review Governance Financial statements and shareholder information 17 Financial instruments (continued) Movements in the hedge reserve and the cost of hedging reserve in 2023 and 2024, including gains and losses on cash flow hedging instruments, were as follows: Interest rate hedge reserve GBPm Cost of hedging reserve GBPm Foreign currency hedge reserve GBPm Total GBPm Hedge reserve at 31 December 2022: losses deferred (2) (1) (8) (11) Gains/(losses) arising in 2023 1 (3) 31 29 Amounts recognised in income statement 1 - 17 18 Hedge reserve at 31 December 2023: (losses)/gains deferred - (4) 40 36 (Losses)/gains arising in 2024 (5) 6 10 11 Amounts recognised in income statement 2 - (22) (20) Hedge reserve at 31 December 2024: (losses)/gains deferred (3) 2 28 27 All cash flow hedges were highly effective throughout the two years ended 31 December 2024. A deferred tax debit of £6m (2023: £9m) in respect of the above gains and losses at 31 December 2024 was also deferred in the hedge reserve. Of the amounts recognised in the income statement in the year, gains of £22m (2023: losses of £17m) were recognised in revenue, and losses of £2m (2023: £1m) were recognised in finance costs. A tax debit of £5m (2023: credit of £4m) was recognised in relation to these items. The deferred gains and losses on foreign currency cash flow hedges at 31 December 2024 are currently expected to be recognised in the income statement in future years as shown in the table below, together with the principal amount of hedges relating to each year and their total carrying values included within derivative assets and liabilities in the statement of financial position: Foreign currency hedge reserve GBPm Principal amount of hedges GBPm Carrying values GBPm 2025 17 465 25 2026 11 501 11 2027 - 268 - 2028 - 30 - Total 28 1,264 36 The cash flows for these hedges are expected to occur in line with the recognition of the gains and losses in the income statement, or in the preceding year. These cash flows are included in the table on page 171. 18 Inventories and pre-publication costs Accounting policy Inventories and pre-publication costs are stated at the lower of cost, including appropriate attributable overhead, and estimated net realisable value. Such costs typically comprise direct internal labour costs and externally commissioned editorial and other fees. Pre-publication costs, representing costs incurred in the origination of content prior to publication, are expensed systematically reflecting the expected sales profile over the estimated economic lives of the related products, generally up to five years. Annual reviews are carried out to assess the recoverability of carrying amounts. 2023 GBPm 2024 GBPm Raw materials 1 - Pre-publication costs 278 302 Finished goods 39 29 Total 318 331 During the year, pre-publication costs of £92m (2023: £93m) were capitalised. The related amortisation charge was £77m (2023: £76m). and shareholder information Financial statements Governance Market segments Financial review Corporate responsibility Overview RELX Annual Report 2024 | Notes to the consolidated financial statements 175 |
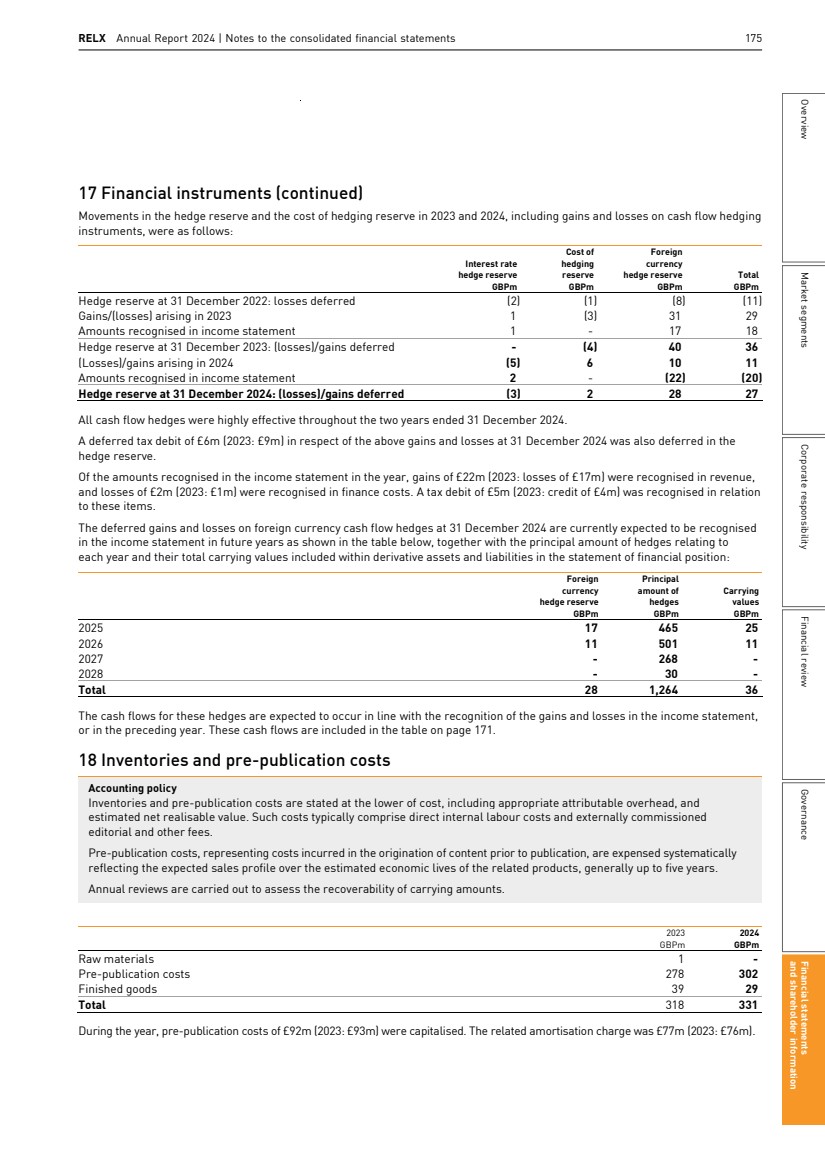
| 176 RELX Annual Report 2024 | Financial statements and other information 19 Trade and other receivables Accounting policy Trade receivables are stated net of a loss allowance for expected credit losses. 2023 GBPm 2024 GBPm Trade receivables 2,144 2,306 Loss allowance (119) (122) 2,025 2,184 Prepayments and accrued income 288 283 Current tax receivable 6 42 Net finance lease receivable 4 2 Total 2,323 2,511 Trade receivables are predominantly non-interest bearing and their carrying amounts approximate to their fair value. The movements in the loss allowance during the year were as follows: 2023 GBPm 2024 GBPm At start of year 118 119 Charge for the year 8 17 Trade receivables written off (3) (13) Exchange translation differences (4) (1) At end of year 119 122 20 Trade and other payables Accounting policy Deferred income is recognised when either a customer has paid consideration, or RELX has an unconditional right to an amount of consideration, in advance of the goods and services being delivered. Trade payables, accruals and other payables are predominantly non-interest-bearing and are stated at their nominal values. 2023 GBPm 2024 GBPm Trade payables 171 223 Accruals 842 851 Social security and other taxes 174 181 Other payables 487 539 Deferred income 2,297 2,328 Total 3,971 4,122 Trade and other payables are predominantly non-interest bearing and their carrying amounts approximate to their fair value. Materially all of the opening deferred income balance has been recognised in the reporting period. 21 Debt Accounting policy Borrowings are recorded initially at fair value and subsequently carried at amortised cost, other than fixed rate borrowings in designated hedging relationships for which the carrying amount of the hedged portion of the borrowings is subsequently adjusted for the gain or loss attributable to the hedged risk. When the related derivative in such a hedging relationship expires, is sold or terminated, or no longer qualifies for hedge accounting, the cumulative change in fair value of the hedged borrowing is amortised in the income statement over the period to maturity of the borrowing using the effective interest method. 176 RELX Annual Report 2024 | Financial statements and other information |
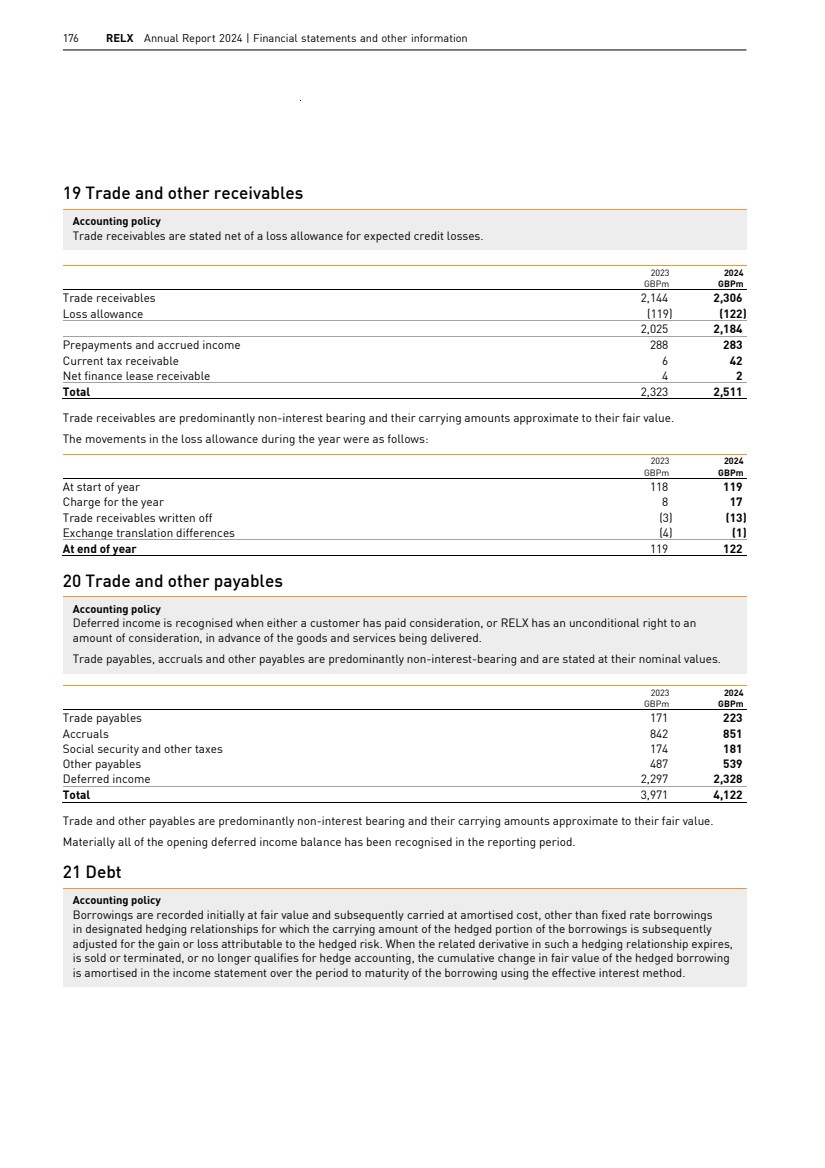
| RELX Annual Report 2024 | Notes to the consolidated financial statements 177 Overview Market segments Corporate responsibility Financial review Governance Financial statements and shareholder information 21 Debt (continued) 2023 2024 Falling due within 1 year GBPm Falling due in more than 1 year GBPm Total GBPm Falling due within 1 year GBPm Falling due in more than 1 year GBPm Total GBPm Financial liabilities measured at amortised cost: Short-term bank loans, overdrafts and commercial paper 220 - 220 762 - 762 Term debt 606 2,940 3,546 - 3,551 3,551 Lease liabilities 57 84 141 38 65 103 Term debt in fair value hedging relationships 430 2,041 2,471 492 1,516 2,008 Term debt previously in fair value hedging relationships - 119 119 120 - 120 Total 1,313 5,184 6,497 1,412 5,132 6,544 The total fair value of financial liabilities measured at amortised cost (excluding lease liabilities) is £4,193m (2023: £3,610m). The total fair value of term debt in fair value hedging relationships is £2,068m (2023: £2,576m). The total fair value of term debt previously in fair value hedging relationships is £121m (2023: £122m). RELX PLC has given guarantees in respect of certain long-term and short-term borrowings issued by subsidiaries. Included within term debt above are debt securities issued by RELX Capital Inc., a 100% indirectly owned finance subsidiary of RELX PLC, which have been registered with the US Securities and Exchange Commission. RELX PLC has fully and unconditionally guaranteed these securities, which are not guaranteed by any other subsidiary of RELX PLC. Analysis by year of repayment 2023 2024 Short-term bank loans, overdrafts and commercial paper GBPm Term debt GBPm Lease liabilities GBPm Total GBPm Short-term bank loans, overdrafts and commercial paper GBPm Term debt GBPm Lease liabilities GBPm Total GBPm Within 1 year 220 1,036 57 1,313 762 612 38 1,412 Within 1 to 2 years - 620 19 639 - 619 13 632 Within 2 to 3 years - 647 18 665 - 412 12 424 Within 3 to 4 years - 432 17 449 - 658 12 670 Within 4 to 5 years - 689 9 698 - 753 9 762 After 5 years - 2,712 21 2,733 - 2,625 19 2,644 After 1 year - 5,100 84 5,184 - 5,067 65 5,132 Total 220 6,136 141 6,497 762 5,679 103 6,544 Short-term bank loans, overdrafts and commercial paper were backed up at 31 December 2024 by a $3.0bn (£2.4bn) committed bank facility maturing in 2027. The committed bank facility was undrawn as at 31 December 2024 (2023: undrawn). In March 2024, €850m of euro denominated term debt was issued with a coupon of 3.375% and a maturity of nine years. Analysis by currency 2023 2024 Short-term bank loans, overdrafts and commercial paper GBPm Term debt GBPm Lease liabilities GBPm Total GBPm Short-term bank loans, overdrafts and commercial paper GBPm Term debt GBPm Lease liabilities GBPm Total GBPm US dollar 188 2,234 37 2,459 446 2,246 21 2,713 Pound sterling - - 29 29 8 - 30 38 Euro 24 3,902 47 3,973 295 3,433 29 3,757 Other currencies 8 - 28 36 13 - 23 36 Total 220 6,136 141 6,497 762 5,679 103 6,544 Included in the US dollar amounts for term debt above is £493m (2023: £501m) of debt denominated in euros (€600m) (2023: €600m) that was swapped into US dollars on issuance and against which there are related derivative financial instruments, which, as at 31 December 2024, had a fair value of £42m (2023: £23m). and shareholder information Financial statements Governance Market segments Financial review Corporate responsibility Overview RELX Annual Report 2024 | Notes to the consolidated financial statements 177 |
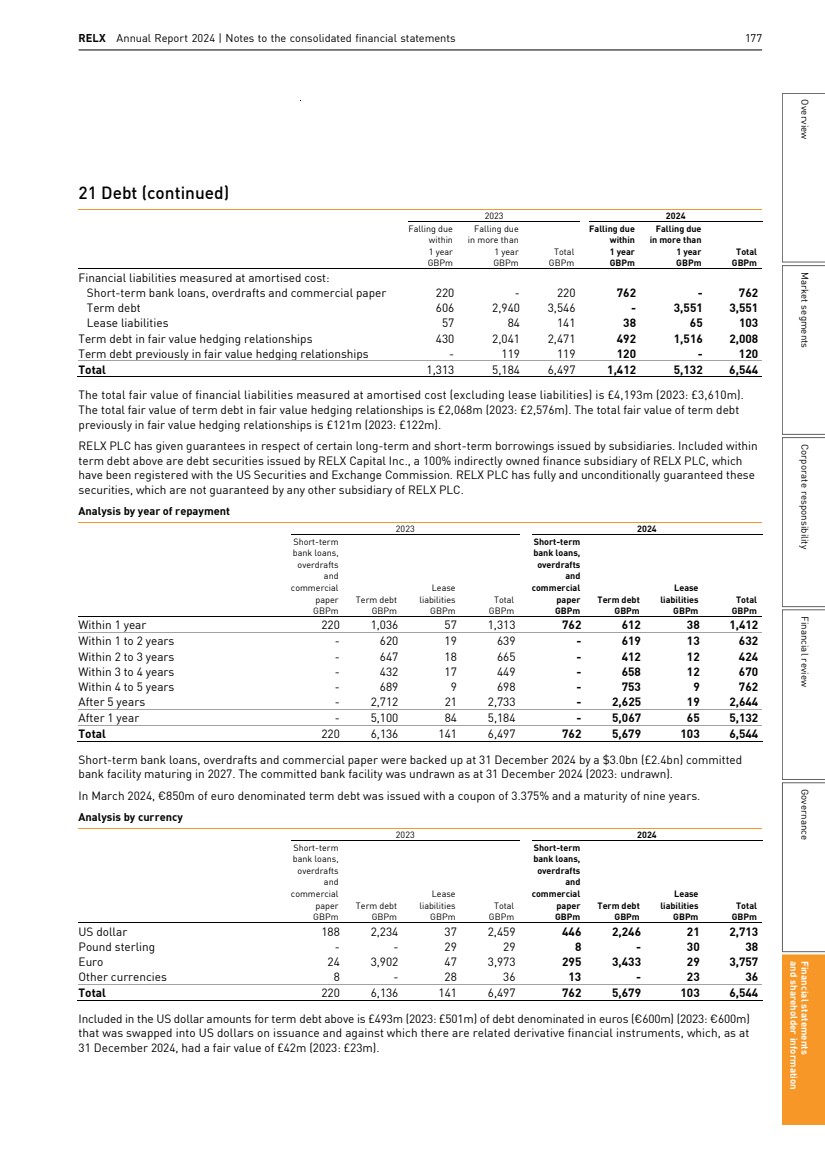
| 178 RELX Annual Report 2024 | Financial statements and other information 22 Lease arrangements Accounting policy All leases where RELX is the lessee (with the exception of short-term and low-value leases) are recognised in the statement of financial position. A lease liability is recognised based on the present value of the future lease payments, and a corresponding right-of-use asset is recognised. The right-of-use asset is depreciated over the shorter of the lease term or the useful life of the asset. Lease payments are apportioned between finance charges and a reduction of the lease liability. Low-value items and short-term leases with a term of 12 months or less are not required to be recognised in the statement of financial position and payments made in relation to these leases are recognised on a straight-line basis in the income statement. The leases held by the Group can be split into two categories: property and non-property. The Group leases various properties, principally offices, which have varying terms and renewal rights that are typical to the territory in which they are located. Non-property includes all other leases, such as cars and printers. Right-of-use assets 2023 GBPm 2024 GBPm At start of year 145 113 Additions 38 32 Remeasurement 6 5 Disposals (7) (9) Depreciation (65) (50) Exchange translation differences (4) (2) At end of year 113 89 Lease liability 2023 GBPm 2024 GBPm Current Property (55) (37) Non-property (2) (1) Non-current Property (82) (63) Non-property (2) (2) Total (141) (103) Interest expense on the lease liabilities recognised within finance costs was £5m (2023: £6m; 2022: £6m). As at 31 December 2024, RELX was committed to leases with future cash outflows totalling £7m (31 December 2023: £6m) which had not yet commenced and as such are not accounted for as a liability as at 31 December 2024. A liability and corresponding right-of-use asset will be recognised for these leases at the lease commencement date. Short-term and low-value lease expenses have been included in note 3. Interest income recognised in relation to finance lease receivables is disclosed in note 7. 178 RELX Annual Report 2024 | Financial statements and other information |
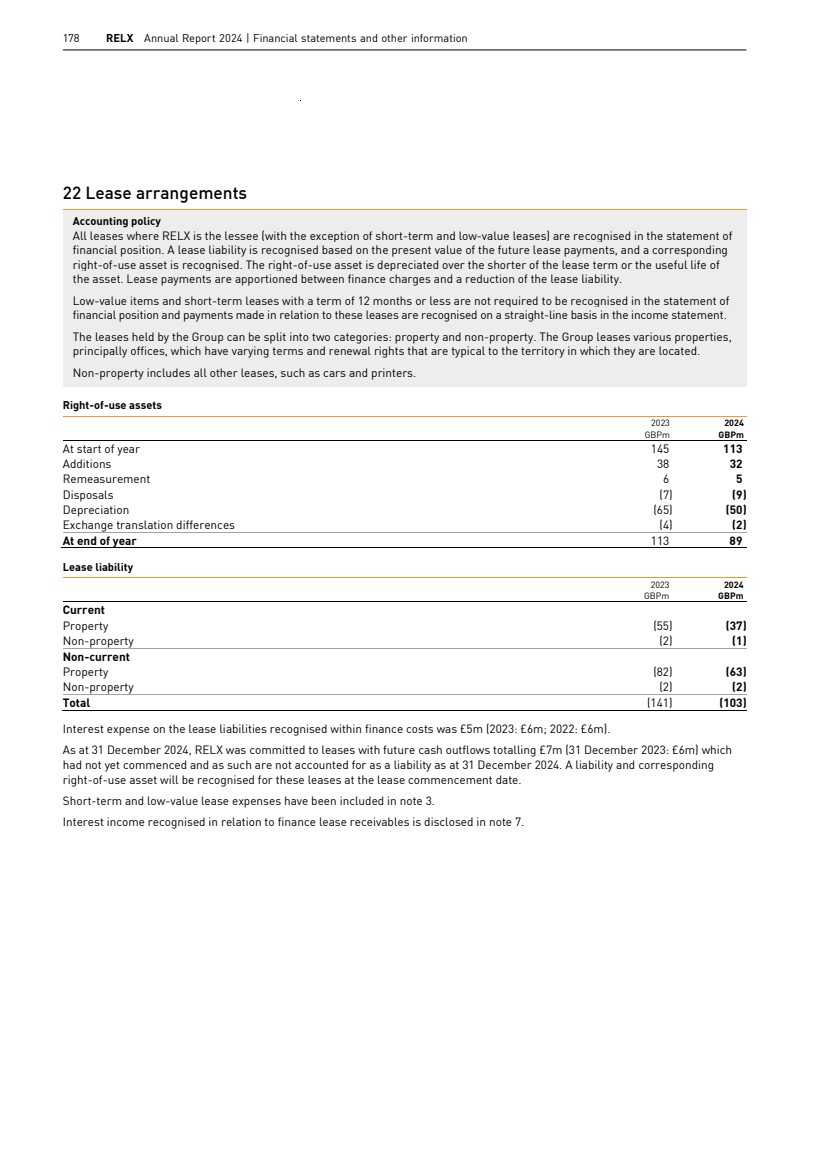
| RELX Annual Report 2024 | Notes to the consolidated financial statements 179 Overview Market segments Corporate responsibility Financial review Governance Financial statements and shareholder information 23 Share capital and shares held in treasury Accounting policy Ordinary shares are classified as equity. Incremental costs directly attributable to the issue of ordinary shares are recognised as a deduction from equity, net of any tax effects. Share premium is the excess of the consideration received over the nominal value of the shares issued. Shares of RELX PLC that are repurchased and not cancelled are classified as shares held in treasury. The consideration paid, including directly attributable costs, is recognised as a deduction from equity. Shares of RELX PLC that are purchased by the Employee Benefit Trust are also classified as shares held in treasury, with the cost recognised as a deduction from equity. RELX PLC CALLED UP SHARE CAPITAL – ORDINARY SHARES OF UK 14 ⁵¹/₁₁₆ PENCE EACH ALLOTTED, ISSUED AND FULLY PAID No. of shares 2023 GBPm No. of shares 2024 GBPm At start of year 1,934,880,088 279 1,906,907,605 275 Issue of ordinary shares 3,027,517 - 2,937,114 - Cancellation of ordinary shares (31,000,000) (4) (29,000,000) (3) At end of year 1,906,907,605 275 1,880,844,719 272 NUMBER OF ORDINARY SHARES Year ended 31 December 2023 Shares in issue net of treasury shares* (millions) Shares in issue (millions) Treasury shares (millions) 2024 Shares in issue net of treasury shares* (millions) At start of year 1,909.5 1,906.9 (25.4) 1,881.5 Issue of ordinary shares 3.0 2.9 - 2.9 Repurchase of ordinary shares (30.9) - (28.9) (28.9) Net (purchase)/release of shares by the Employee Benefit Trust (0.1) - 0.4 0.4 Cancellation of ordinary shares - (29.0) 29.0 - At end of year 1,881.5 1,880.8 (24.9) 1,855.9 * At 31 December 2024 the total shares in issue net of treasury shares is 1,855,941,895 (2023: 1,881,531,883). All of the ordinary shares rank equally with respect to voting rights and rights to receive dividends, except for the shares held in treasury, which do not attract voting or dividend rights. There are no restrictions on the rights to transfer shares. The issue of ordinary shares in the year relates to the exercise of share options. During the year, RELX PLC repurchased 28.9m (2023: 30.9m; 2022: 21.7m) ordinary shares for an average price of 3,461p. Total consideration for these repurchased shares was £1,000m (2023: £800m; 2022: £500m). On 6 December 2024, RELX PLC announced a non-discretionary programme to repurchase further ordinary shares up to the value of £150m. At 31 December 2024, an accrual of £150m was recognised in respect of this non-discretionary commitment. A further 3.8m RELX PLC ordinary shares have been repurchased in January and February 2025 under this programme. The Employee Benefit Trust purchases RELX PLC shares which, at the trustees’ discretion, can be used in respect of the exercise of share options and to meet commitments under conditional share awards. During the year, the Employee Benefit Trust purchased 2.2m shares for a total cost of £75m (2023: £50m; 2022: £50m). At 31 December 2024, shares held by the Employee Benefit Trust were £139m (2023: £117m; 2022: £101m) at cost. During 2024, 29m (2023: 31m) ordinary shares held in treasury were cancelled. At 31 December 2024, RELX PLC shares held in treasury related to 5,295,154 (2023: 5,663,529; 2022: 5,553,401) ordinary shares held by the Employee Benefit Trust; and 19,607,670 (2023: 19,712,193; 2022: 19,800,067) ordinary shares held by the parent company. and shareholder information Financial statements Governance Market segments Financial review Corporate responsibility Overview RELX Annual Report 2024 | Notes to the consolidated financial statements 179 |
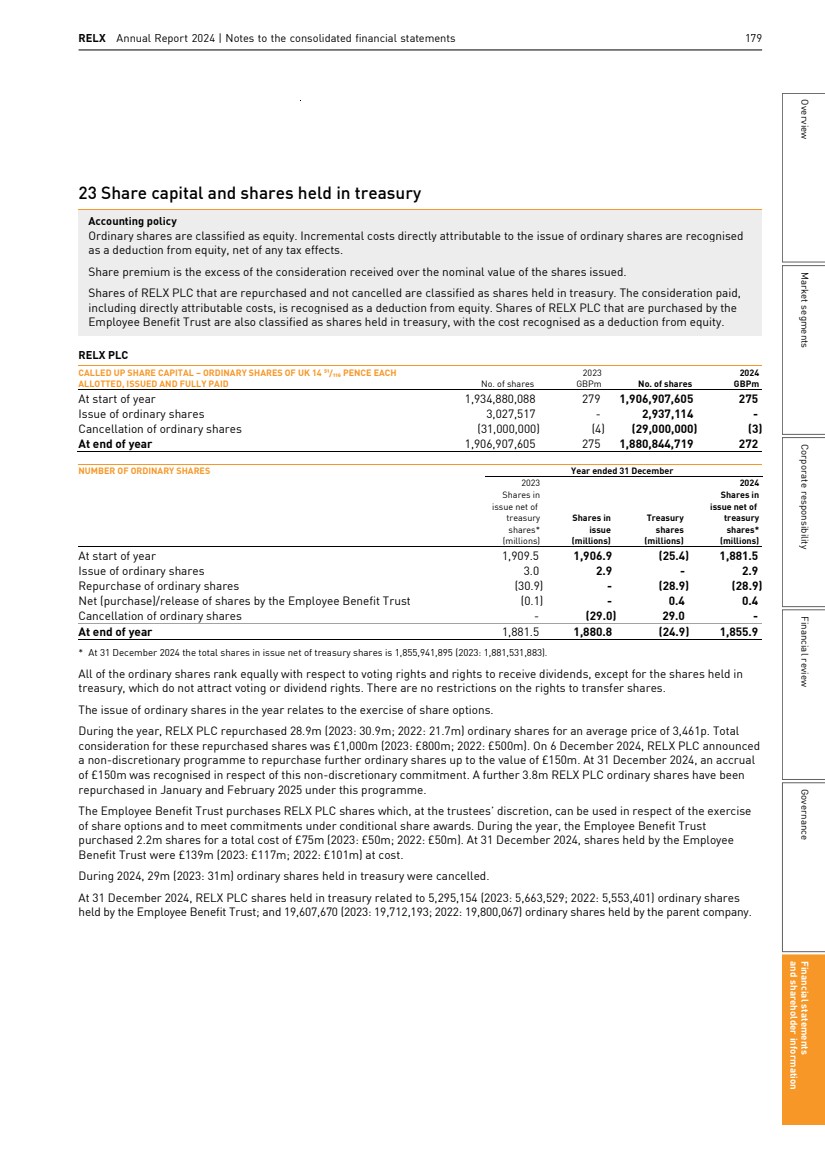
| 180 RELX Annual Report 2024 | Financial statements and other information 24 Other reserves and translation reserve Total 2023 GBPm Translation reserve 2024 GBPm Hedge reserve 2024 GBPm Other reserves 2024 GBPm Total 2024 GBPm At start of year 2,394 392 27 1,761 2,180 Profit attributable to shareholders 1,781 - - 1,934 1,934 Dividends paid (1,059) - - (1,121) (1,121) Actuarial (losses)/gains on defined benefit pension schemes (75) - - 43 43 Fair value movements on cash flow hedges 29 - 11 - 11 Transfer to profit from cash flow hedge reserve 18 - (20) - (20) Tax recognised in other comprehensive income 7 - 3 (11) (8) Exchange differences on translation of foreign operations (285) 175 - - 175 Cancellation of shares (673) - - (850) (850) Increase in share based remuneration reserve (including tax) 77 - - 79 79 Settlement of share awards (34) - - (53) (53) Acquisition of non‐controlling interests - - - (44) (44) At end of year 2,180 567 21 1,738 2,326 The closing balance of other reserves in the consolidated statement of changes in equity of £1,759m (2023: £1,788m) is comprised of the hedge reserve £21m (2023: £27m); and other reserves £1,738m (2023: £1,761m). Other reserves principally comprise retained earnings and the share based remuneration reserve. Movements in reserves during the period include the effects of profits generated during the period, share repurchases, changes in exchange rates and other items. Dividends paid during 2024 were £1,121m (2023: £1,059m). Refer to note 13 for further details. 29m (2023: 31m) ordinary shares held in treasury were cancelled resulting in a transfer of £850m between other reserves and shares held in treasury. The increase of £175m in the translation reserve is due to the net effect of changes in exchange rates during the period which decreased net debt by £46m and increased assets (net of other liabilities) by £129m. 180 RELX Annual Report 2024 | Financial statements and other information |
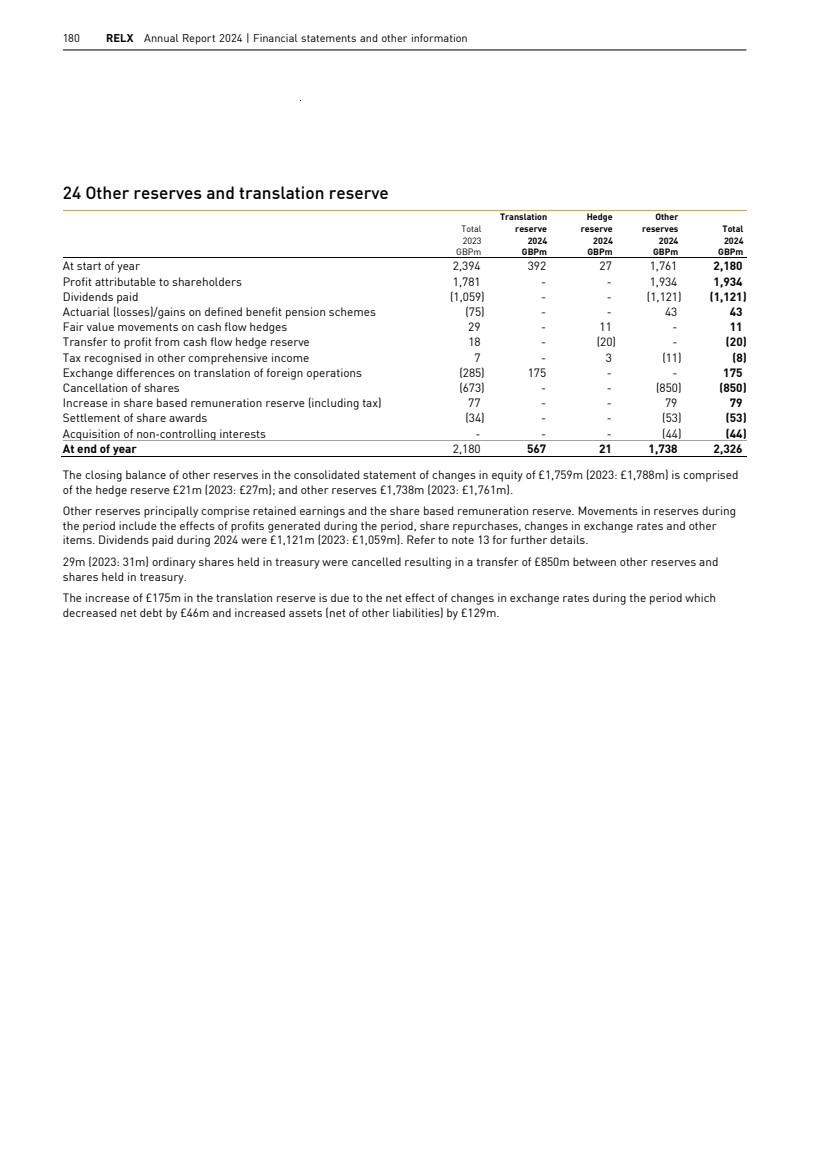
| RELX Annual Report 2024 | Notes to the consolidated financial statements 181 Overview Market segments Corporate responsibility Financial review Governance Financial statements and shareholder information 25 Related party transactions Transactions with related parties were made on normal market terms of trading. Transactions between RELX PLC and subsidiaries of the Group have been eliminated within the consolidated financial statements. Transactions with joint ventures and associates comprise sales of goods and services of £23.3m (2023: £17.4m; 2022: £0.4m). As at 31 December 2024, amounts owed by joint ventures and associates were £6.6m (2023: £6.6m; 2022: £4.2m) and amounts due to joint ventures and associates were £1.6m (2023: £2.3m; 2022: £1.2m). See note 6 for details of the Group’s participation in defined benefit pension schemes. Key management personnel are also related parties as defined by IAS 24 – Related Party Disclosures and comprise the Executive and Non-Executive Directors of RELX PLC. Key management personnel remuneration is set out below. For reporting purposes, salary, benefits and annual incentive payments are considered short-term employee benefits. KEY MANAGEMENT PERSONNEL REMUNERATION 2022 GBPm 2023 GBPm 2024 GBPm Salaries, other short-term employee benefits and non-executive fees 7 8 8 Share based remuneration* 7 14 14 Total 14 22 22 EXECUTIVE DIRECTORS Salary GBP’000 Benefits GBP’000 Annual incentive GBP’000 Share based remuneration* GBP’000 Pension* GBP’000 Total GBP’000 Total Executive Directors 2022 2,137 97 3,251 6,857 268 12,610 2023 2,190 97 3,808 14,354 241 20,690 2024 2,245 109 3,576 14,322 247 20,499 * The figures for share based awards are calculated in accordance with the methodology set out in the UK adopted International Accounting Standards and International Financial Reporting Standards as issued by the International Accounting Standards Boards (IASB). The figure for performance-related share based awards includes share price appreciation since the date the award was granted. Please see page 104 for further details. Pension is calculated in accordance with the methodology set out in the UK Regulations. NON-EXECUTIVE DIRECTORS 2022 GBP’000 2023 GBP’000 2024 GBP’000 Fees and benefits 1,566 1,566 1,781 The remuneration of non-executive directors comprises fees for services, and benefits primarily relating to tax filing support in respect of filings resulting from their directorships. No deemed benefits were provided during 2024 to former directors (2023: nil; 2022: nil). No loans, advances or guarantees have been provided on behalf of any director. The aggregate gains made by Executive Directors on the exercise of options during 2024 were £11.7m (2023: £6.7m; 2022: nil). 26 Exchange rates The following exchange rates have been applied in preparing the consolidated financial statements: Income statement Statement of financial position 2022 2023 2024 2023 2024 Euro to sterling 1.17 1.15 1.18 1.15 1.21 US dollar to sterling 1.24 1.24 1.28 1.28 1.25 27 Approval of financial statements The consolidated financial statements were approved and authorised for issue by the Board of Directors on 12 February 2025. and shareholder information Financial statements Governance Market segments Financial review Corporate responsibility Overview RELX Annual Report 2024 | Notes to the consolidated financial statements 181 |
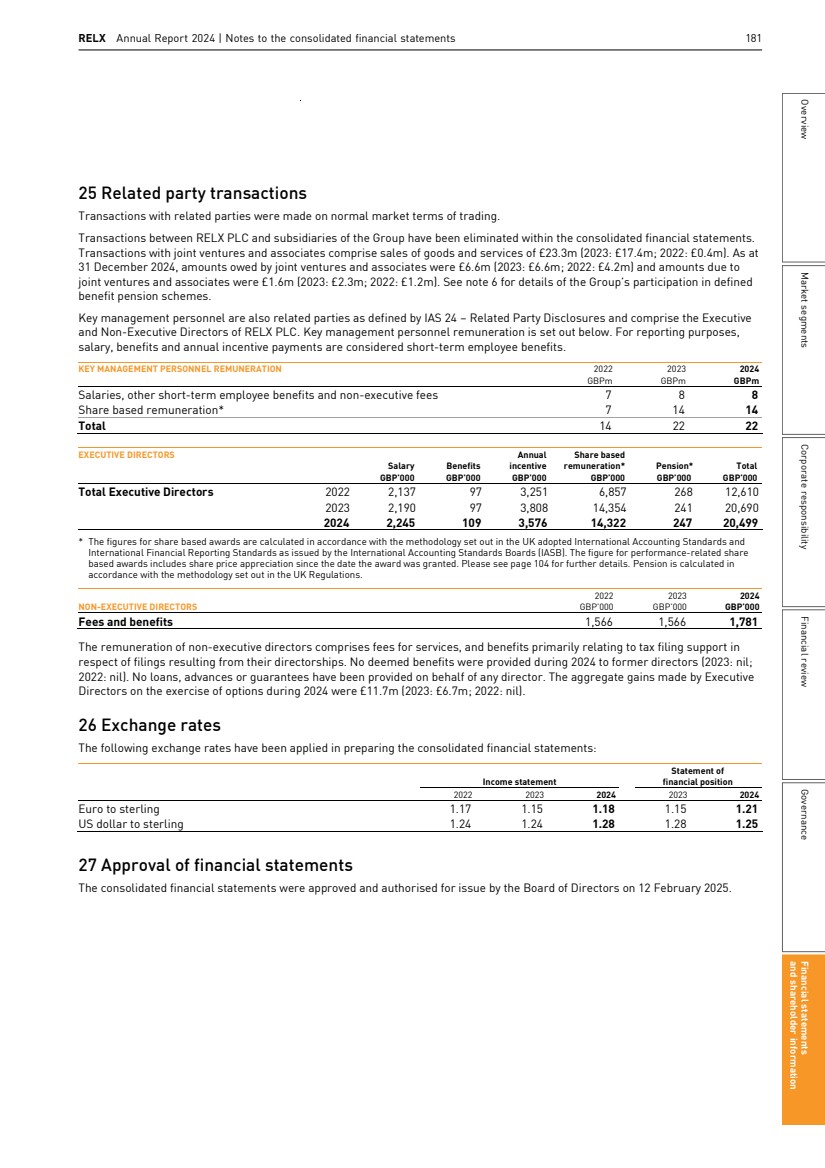
| 182 RELX Annual Report 2024 | Financial statements and other information 28 Related undertakings A full list of related undertakings (comprising subsidiaries, joint ventures, associates and other significant holdings) as at 31 December 2024 is set out below. Unless where otherwise stated, all undertakings are held indirectly by RELX PLC, and the effective interest held by the Group is 100%. Company name Share class Reg office Australia LNRS Data Services (Australia) Pty Ltd Ordinary AUS1 Reed Exhibitions Australia Pty Limited Ordinary AUS2 RELX Holdings Australia Pty Ltd Ordinary AUS2 RELX Trading Australia Pty Limited Ordinary AUS2 Austria LexisNexis Verlag ARD ORAC GmbH & Co KG Partnership Interest AUT2 ORAC GmbH Ordinary AUT2 RELX Austria GmbH Ordinary AUT3 RX CEE GmbH Ordinary AUT1 RX Salzburg GmbH Ordinary AUT3 Seminar Oberlaa GmbH Ordinary AUT4 Belgium LexisNexis BV Ordinary BEL1 Henchman B.V. Ordinary BEL2 Brazil Elsevier Editora Limiteda Quotas BRA1 Gestora de Inteligencia de Credito S.A. (20%) Preferred, Ordinary BRA6 LexisNexis Informacoes e Sistemas Empresariais Limiteda Quotas BRA4 LexisNexis Servicos de Analise de Risco Limiteda Quotas BRA5 MLex Brasil Midia Mercadologica Limiteda Quotas BRA3 Reed Exhibitions Alcantara Machado Limiteda Quotas BRA2 Canada Corps Events IntCan Class A Voting CAN3 Elsevier Canada Inc. Class A Common CAN2 Human API Technologies Inc. Voting CAN4 LexisNexis Canada Inc. Class B Voting CAN1 PCLaw Time Matters Canada Inc. Common CAN5 China Bakery China Exhibitions Co., Limited (25%) Ordinary CHN1 Beijing Medtime Elsevier Education Technology Co., Limited (49%) Common CHN2 Beijing Reed Elsevier Science and Technology Co Ltd1 Common CHN19 C-One Energy (Guangzhou) Co., Limited Ordinary CHN5 Jingxunlingsi (Beijing) Information Technology Co Ltd1 Ordinary CHN4 KeAi Communications Co., Limited (49%) Ordinary CHN15 LexisNexis Information Technology Co. Limited Ordinary CHN4 LexisNexis Risk Solutions (Shanghai) Information Technologies Co Limited Common CHN7 LNRS Data Services (Shanghai) Co Limited Ordinary CHN13 Peili Computer Co Ltd1 Ordinary CHN13 Reed Elsevier Information Technology (Beijing) Co Limited Common CHN3 Reed Exhibitions (China) Co., Limited Ordinary CHN4 Reed Exhibitions Hengjin Co., Limited (51%) Ordinary CHN12 Reed Exhibitions Kuozhan (Shanghai) Co., Limited (60%) Ordinary CHN8 Reed Huabai Exhibitions (Beijing) Co., Limited (51%) Ordinary CHN4 RX Huabo Exhibitions (Shenzhen) Co., Limited (65%) Ordinary CHN16 Reed Huaqun Exhibitions Co., Limited (52%) Ordinary CHN4 Reed Sinopharm Exhibitions Co., Limited (50%) Ordinary CHN4 RX (China) Investment Co., Limited Ordinary CHN9 RX (Shenzhen) Co., Limited Ordinary CHN6 RX Huabo (Shenzhen) Technology Co. Limited1 Ordinary CHN16 RX Technology (Shanghai) Co. Limited1 Ordinary CHN18 Shanghai Datong Medical Information Technology Co., Limited Ordinary CHN17 Shanghai SinoReal Exhibitions Co., Limited (27.5%) Ordinary CHN11 Tianjin Beikeqilong Exhibition Services Limited (12.5%) Ordinary CHN10 Z&R Exhibitions Co., Limited (27.5%) Ordinary CHN14 Colombia LexisNexis Risk Solutions SAS Ordinary COL1 Denmark Elsevier A/S Ordinary DNK1 Egypt Elsevier Egypt LLC Ordinary EGY1 Company name Share class Reg office France Elsevier Holding France SAS Ordinary FRA1 Elsevier Masson SAS Ordinary FRA1 Fircosoft SAS Ordinary FRA6 GIE EDI Data (83%) Ordinary FRA2 GIE Juris Data Ordinary FRA2 LexisNexis Business Information Solutions SA Ordinary FRA2 LexisNexis Business Information Solutions Holding SA Ordinary FRA4 LexisNexis SA Ordinary FRA2 Reed Exhibitions ISG SARL Ordinary FRA3 RELX France SAS Ordinary FRA3 RELX France Services SAS Ordinary FRA6 RX France SAS Ordinary FRA3 SAFI Salon Français et Internationaux (50%) Ordinary FRA5 Germany Elsevier GmbH Ordinary DEU2 IPlytics GmbH Ordinary DEU6 LexisNexis GmbH Ordinary DEU3 PatentSight GmbH Ordinary DEU5 RELX Deutschland GmbH Ordinary DEU1 RX Deutschland GmbH Ordinary DEU7 Tschach Solutions GmbH Ordinary DEU4 Hong Kong Ascend China Holding Limited (deregistration in progress) Ordinary HNK4 JC Exhibition and Promotion Limited (65%) Ordinary HNK4 JYLN Sager Limited Ordinary HNK2 LNRS Data Services (China) Limited Ordinary HNK1 Reed Exhibitions Limited Ordinary HNK4 RELX (Greater China) Limited Ordinary HNK3 India FircoSoft India Private Limited (liquidation in progress) Ordinary IND2 Reed Elsevier Publishing (India) Private Limited Ordinary IND1 Reed Manch Exhibitions Private Limited Ordinary IND1 Reed Triune Exhibitions Private Limited Ordinary IND1 RELX India Private Limited Ordinary IND1 Indonesia PT Reed Exhibitions Indonesia (70%) Series A, Series B IDN1 PT RELX Information Analytics Indonesia Common IDN2 Irish Republic Elsevier (Ireland) Limited Ordinary IRL2 LexisNexis Risk Solutions (Europe) Limited Ordinary IRL1 RELX International Finance Designated Activity Company Ordinary IRL1 Israel LexisNexis Israel Ltd Ordinary ISR1 Italy Elsevier SRL Registered Capital ITA1 ICIS Italia SRL Ordinary ITA2 RX Italy SRL Ordinary ITA1 Japan Elsevier Japan KK Ordinary JPN1 LexisNexis Japan KK Ordinary JPN2 RX Japan Ltd Ordinary JPN2 Kingdom of Saudi Arabia RX Arabia LLC Ordinary KSA1 Korea (Republic of) Elsevier Korea LLC Ordinary KOR1 LexisNexis Legal and Professional Service Korea Limited Ordinary KOR1 Reed Exhibitions Korea Limited Ordinary KOR2 Reed Exporum Limited (60%) Ordinary KOR3 Reed K. Fairs Limited (70%) Ordinary KOR4 182 RELX Annual Report 2024 | Financial statements and other information |
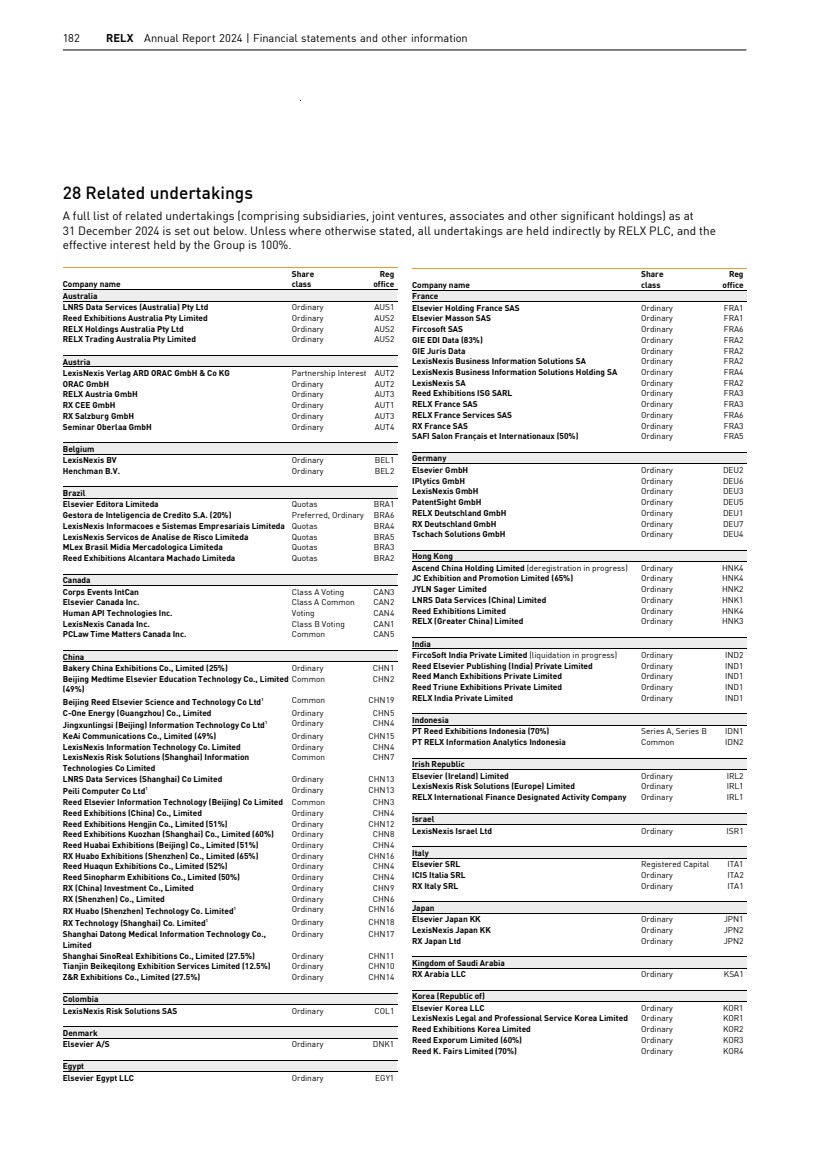
| RELX Annual Report 2024 | Notes to the consolidated financial statements 183 Overview Market segments Corporate responsibility Financial review Governance Financial statements and shareholder information 28 Related undertakings (continued) Company name Share class Reg office Macau Reed Exhibitions Macau Limited Ordinary MAC1 Malaysia LexisNexis Malaysia Sdn Bhd Ordinary MYS1 Mexico Human API Technologies, S. de R.L. de C.V. Fixed MEX2 Masson-Doyma Mexico, S.A. Ordinary MEX1 Reed Exhibitions Mexico S.A. de C.V. Fixed MEX1 Netherlands AGRM Solutions C.V. Partnership Interest NLD1 Caselex B.V. Ordinary NLD1 Elsevier B.V. Ordinary NLD1 ICIS Benchmarking Europe B.V. Ordinary NLD1 LexisNexis Business Information Solutions B.V. Ordinary NLD1 LNRS Data Services B.V. Ordinary NLD1 Misset Uitgeverij B.V. (49%) Ordinary NLD2 RELX Employment Company B.V. Ordinary NLD1 RELX Finance B.V. Ordinary NLD1 RELX Holdings B.V. Ordinary NLD1 RELX Nederland B.V. Ordinary NLD1 RELX Overseas B.V. Ordinary RE NLD1 New Zealand LexisNexis NZ Limited Ordinary NZL1 Philippines Reed Elsevier Shared Services (Philippines) Inc. Common PHL1 Poland AI Digital Contracts Sp. z.o.o. Ordinary POL1 Elsevier Sp. z.o.o. Ordinary POL2 Singapore Elsevier (Singapore) Pte Limited Ordinary SGP1 LNRS Data Services Pte Limited Ordinary SGP1 RE (HAPL) Pte Limited Ordinary SGP1 RELX (Singapore) Pte Limited Ordinary SGP2 South Africa LexisNexis (Pty) Limited (78%) Ordinary ZAF1 LexisNexis Risk Management (Pty) Limited (78%) Ordinary ZAF1 LexisNexis South Africa Shared Services (Pty) Limited Ordinary ZAF1 Reed Events Management (Pty) Limited (90%) Ordinary ZAF1 Reed Exhibitions (Pty) Limited (90%) Ordinary ZAF1 Reed Exhibitions Group (Pty) Limited (90%) Ordinary ZAF1 Reed Venue Management (Pty) Limited (90%) Ordinary ZAF1 RELX (Pty) Limited Ordinary ZAF1 Spain Elsevier Espana S.L.U Participations ESP1 Sweden Behaviometrics AB A, B, and C shares SWE1 Taiwan Elsevier Taiwan LLC Ordinary TWN1 Thailand Reed Tradex Company Limited (49%) Ordinary THA1 RELX Holding (Thailand) Co., Limited Ordinary THA2 RELX Information Analytics (Thailand) Co., Limited Ordinary THA3 Turkey Elsevier STM Bilgi Hizmetleri Limited Sirketi Ordinary TUR1 Reed Tuyap Fuarcilik A.S. (50%) A Ordinary, B Ordinary TUR2 United Arab Emirates Reed Exhibitions FZ-LLC Ordinary UAE1 RELX Middle East FZ-LLC Ordinary UAE2 Company name Share class Reg office United Kingdom Aistemos Limited Ordinary GBR3 Butterworths Limited Ordinary GBR3 Cordery Compliance Limited (71%) Ordinary GBR3 Cordery Limited (71%) (in dissolution) Ordinary GBR3 Crediva Limited Ordinary GBR4 Elsevier Limited Ordinary GBR5 Interfolio UK Limited (in dissolution) Ordinary GBR6 LexisNexis Risk Solutions UK Limited Ordinary GBR4 LNRS Data Services Holdings Limited Ordinary GBR1 LNRS Data Services Limited Ordinary GBR1 Mack-Brooks Exhibitions Limited Ordinary GBR2 MLex Limited Ordinary GBR3 Offshore Europe (Management) Limited Ordinary GBR2 Offshore Europe Partnership (50%) Partnership Interest GBR2 RE (HPL) Limited Ordinary GBR1 RE (RCB) Limited Ordinary GBR1 RE Secretaries Limited Ordinary GBR1 RE (SOE) Limited Ordinary GBR2 Reed Events Limited Ordinary GBR2 Reed Exhibitions Limited Ordinary GBR2 RELX Finance Limited Ordinary GBR1 RELX Group plc2 Ordinary GBR1 RELX (Holdings) Limited Ordinary GBR1 RELX (Investments) plc Ordinary GBR1 Reed Nominees Limited (in dissolution) Ordinary GBR1 RELX Overseas Holdings Limited Ordinary GBR1 RELX (UK) Limited Ordinary GBR1 REV GP (UK) LLP (50%) Membership Interest GBR1 REV Venture Partners Limited Ordinary GBR1 REV V LP Partnership Interest GBR1 SciBite Limited Ordinary GBR6 Sustainable Energy Conferences Limited Ordinary GBR3 Tracesmart Limited Ordinary GBR4 United States Accuity Asset Verification Services Inc. Common Stock USA1 American Textile Machinery Exhibition-International, Inc. (40%) Common Stock USA2 Aries Systems Corporation Common Stock USA2 Dunlap-Hanna Publishers (50%) Partnership Interest USA2 Elsevier Holdings Inc. Common Stock USA3 Elsevier Inc. Common Stock USA2 Elsevier STM Inc. Common Stock USA3 Enclarity, Inc. Common Stock USA1 Gaming Business Asia, LLC (50%) Membership Interest USA2 Health Market Science, Inc. Common Stock USA1 HumanAPI Inc. Common Stock USA1 ID Analytics, LLC Membership Interest USA1 Jarvis Software LLC Membership Interest USA2 Knovel Corporation Common Stock USA2 Knowable Inc Common Stock USA2 Legal InQuery Solutions Inc. Common Stock USA5 LexisNexis Claims Solutions Inc. Common Stock USA1 LexisNexis Coplogic Solutions Inc. Common Stock USA1 LexisNexis of Puerto Rico, Inc. Common Stock USA7 LexisNexis Risk Data Management, LLC Membership Interest USA1 LexisNexis Risk Holdings Inc. Common Stock USA1 LexisNexis Risk Solutions Inc. Common Stock USA1 LexisNexis Risk Solutions FL Inc. Common Stock USA1 LexisNexis Special Services Inc. Common Stock USA4 LexisNexis VitalChek Network Inc. Common Stock USA1 LNRS Data Services Inc. Common Stock USA1 Matthew Bender & Company, Inc. Common Stock USA2 MLex US, Inc. Common Stock USA2 PCLaw Time Matters LLC (51%) Membership Interest USA8 Portfolio Media, Inc. Common Stock USA2 Reed Technology and Information Services LLC Membership Interest USA2 RELX Capital Inc. Common Stock USA3 RELX Inc. Common Stock USA2 RELX Risks Inc. Common Stock USA6 and shareholder information Financial statements Governance Market segments Financial review Corporate responsibility Overview RELX Annual Report 2024 | Notes to the consolidated financial statements 183 |
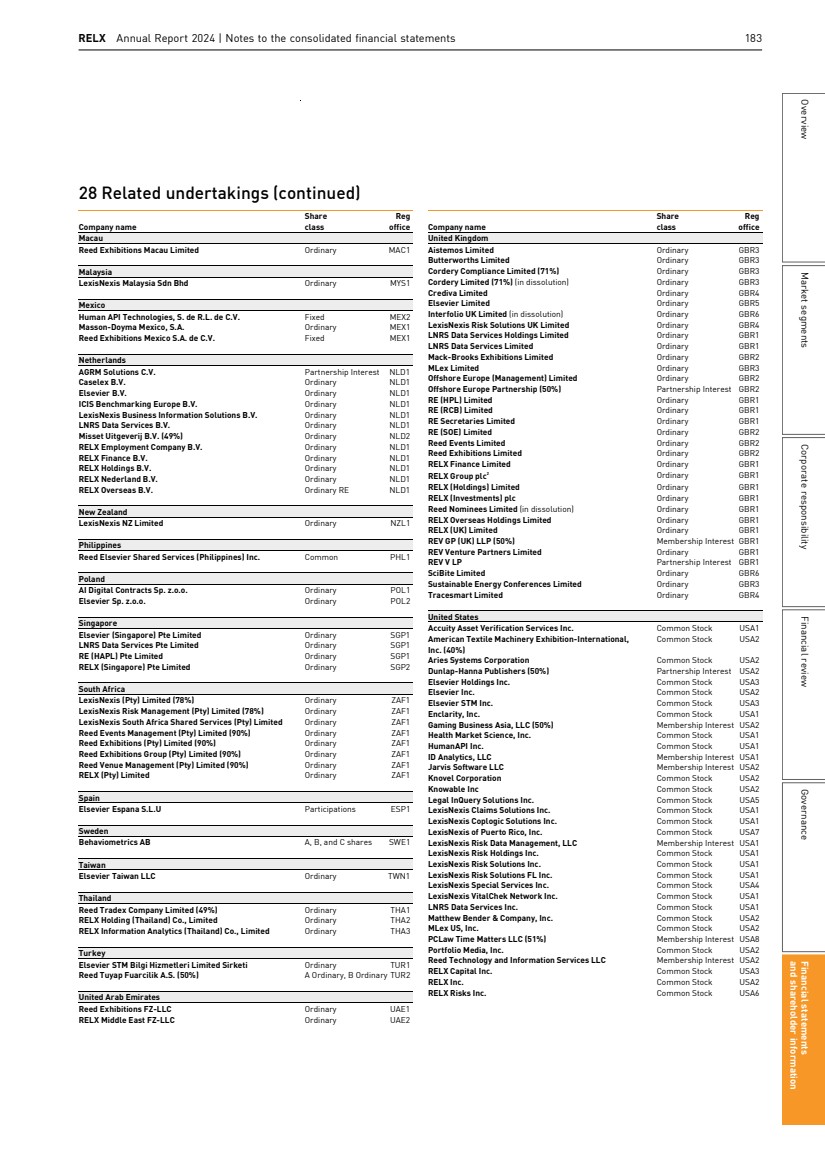
| 184 RELX Annual Report 2024 | Financial statements and other information 28 Related undertakings (continued) Company name Share class Reg office United States REV IV Partnership LP Partnership Interest USA3 SAFI Americas LLC (50%) Membership Interest USA2 SageStream, LLC Membership Interest USA1 The Reed Elsevier Ventures 2011 Partnership LP Partnership Interest USA3 The Reed Elsevier Ventures 2013 Partnership LP Partnership Interest USA3 The Remick Publishers (50%) Partnership Interest USA2 ThreatMetrix, Inc. Common Stock USA1 World Compliance, Inc. Common Stock USA1 Vietnam Reed Tradex Vietnam LLC Ordinary VIE1 Registered offices Australia AUS1: Building B, Level 2, Unit 11, 1 Maitland Place, Baulkham Hills, NSW 2153 AUS2: Tower 2, Level 1, 475 Victoria Avenue, Chatswood NSW 2067 Austria AUT1: Messeplatz 1, 1020, Vienna AUT2: Trabrennstrasse 2A,1020, Vienna AUT3: Am Messezentrum 6, 5021, Salzburg AUT4: Nikolaus-Pytty-Gasse 9, 1140 Wien Belgium BEL1: Oudenaardseheerweg 129, 9810 Nazareth BEL2: Moutstraat 64, bus 502, 9000 Ghent, Belgium Brazil BRA1: Av. Almirante Barroso 81, Sala 33A114, 20031-004 Centro, Rio de Janeiro BRA2: Rua Bela Cintra no. 1200, 10th floor, Sao Paulo, 01415-002 BRA3: Avenida Paulista 2300, Andar Pilotis, Sao Paulo, SP 01 310-300 BRA4: Rua Funchal, 538, 4º Andar, Conj. 42, Salas 4, 5 e 6, Vila Olímpia, Sao Paulo, 04551-060 BRA5: Alameda Rio Negro, 161 Alphaville Industrial, Barueri, Sao Paulo 06.454-000 BRA6: Alameda Araguaia, Alphaville, Conjuntos 81-84, Centro Empresarial Araguaia, Barueri, Sao Paulo 2104, 8-9 Andar Canada CAN1: 111 Gordon Baker Road, Suite 900, Toronto, Ontario, M2H 3R1 CAN2: 26E-1501 av. McGill College, Montreal, Quebec, H3A 3N9 CAN3: 555 Richmond Street West, Suite 405, Toronto ON M5V 3B1 CAN4: 20th Floor, 250 Howe Street, Vancouver BC, V6C 3R8 CAN5: 199 Bay Street, 4000, Toronto, Ontario, M5L 1A9 China CHN1: Zhongkun Building, Room 612, Gaoliangqiaoxie Street, No. 59, Haidan District, Beijing, 100044 CHN2: Room 516, 5th Floor, Building 22, Area 11, No. 38, Xueyuan Road, Haidian District, Beijing, 100191 CHN3: Oriental Plaza, No. 1 East Chang An Ave, Tower W1, 7th Floor, Unit 1-7, Dong Cheng District, Beijing, 100738 CHN4: Ping An International Finance Centre, Room 1504-1505, 15th Floor, Tower A-101, 3-24 Floor, Xinyuan South Road, Chaoyang District, Beijing, 100027 CHN5: Unit B1303-1 & 1305, 13F Center Plaza, 161 Linhe Road West, Tianhe District Guangzhou CHN6: Unit 303, 3F, Tower 3 Kerry Plaza ,No.1 Zhong Xin Si Road, Fu Tian District, Shenzhen CHN7: Unit A-1, 5th Floor, No. 567, Tianshan West Road, Changning District, Shanghai CHN8: Intercontinental Center, 42F, 100 Yutong Road, Zhabei District, Shanghai, 200070 CHN9: Room 319, 238 Jiangchangsan Road, Jing’an District, Shanghai CHN10: Room 1201, Yinhe Building, Yuexiu Road, Hexi District, Tianjin, 300201 CHN11: Building 2, Room No. 3895, Changjiang Avenue, No. 161, Changliang Farm, Chongming County, Shanghai CHN12: Floor 2, No.979, Yunhan Road, Nicheng Town, Pudong New District, Shanghai, 200000 CHN13: 4/F Block 3, No 999 Jingzhong Road, Changning District, Shanghai CHN14: A0208, 1st Floor, Building 2, Yard 66, Yanfu Road, Yancun Tow, Fangshan District, Beijing CHN15: 16 Donghuangchenggen North Street, Beijing, 100717 CHN16: Shenzhen International Chamber of Commerce Tower, Room 1801-1802, 1805, Fuhua 3rd Road, Futian District, Shenzhen, 518048 CHN17: 5/F Unit A, Digital China Centre No. 567 Tianshan West Road, ChangNing District, Shanghai, 200335 CHN18: Room 726, 1256-1258 Wan Rong Road, Jing An District, Shanghai CHN19: Oriental Plaza, No. 1 East Chang An Ave, Tower W1, 7th Floor, Unit 12C, Dong Cheng District, Beijing, 100738 Colombia COL1: Philippe Prietocarrizosa & Uria Abogados, Carrera 9 No. 74-08 Oficina 105, Bogota, d.c., 76600 Denmark DNK1: Niels Jernes Vej 10, 9220, Aalborg East Egypt EGY1: Land Mark Office Building, 2nd Floor, 90th Street, City Center, 5th Settlement, New Cairo, Cairo 184 RELX Annual Report 2024 | Financial statements and other information |
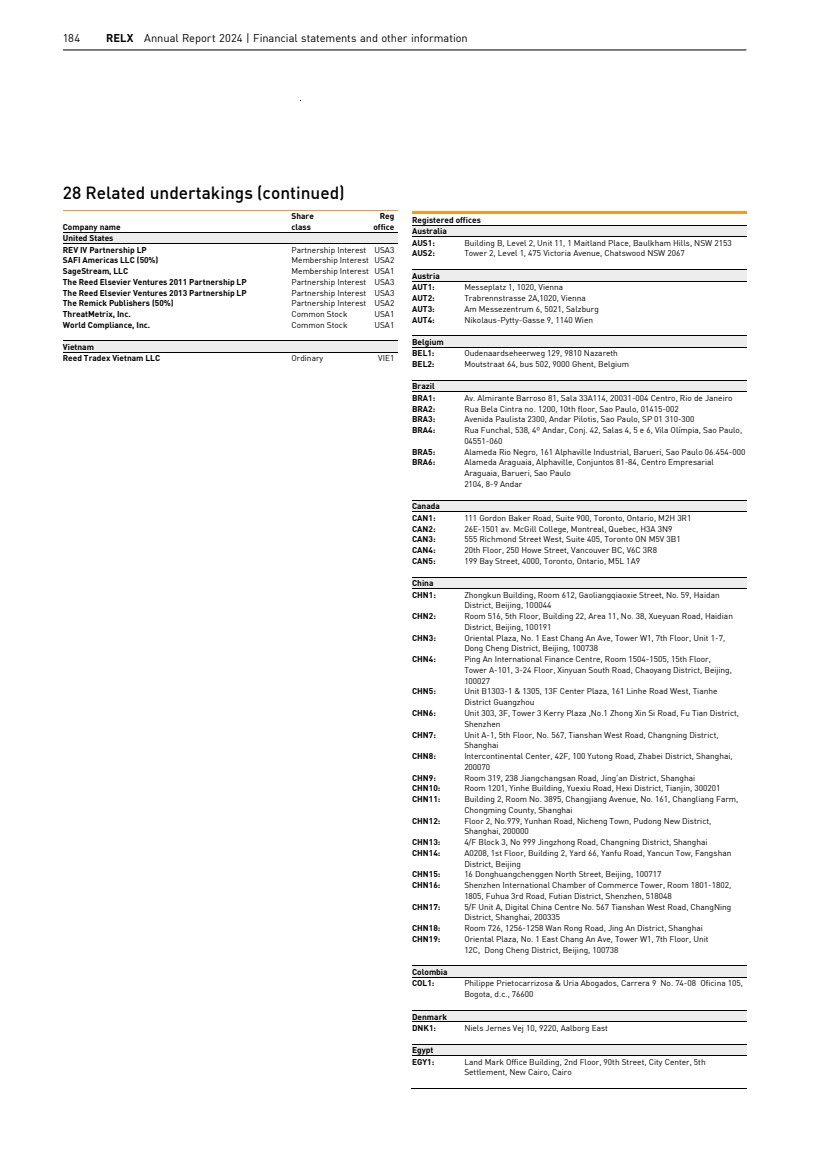
| RELX Annual Report 2024 | Notes to the consolidated financial statements 185 Overview Market segments Corporate responsibility Financial review Governance Financial statements and shareholder information 28 Related undertakings (continued) Registered offices France FRA1: 65 Rue Camille Desmoulins, 92130, Issy les Moulineaux FRA2: 141 rue de Javel, 75015, Paris FRA3: 52 Quai de Dion Bouton, 92800, Puteaux FRA4: Immeuble Technopolis, 350 rue Georges Besse, 30000, Nimes FRA5: 6-8 rue Chaptal, 75009, Paris FRA6: Immeuble Vivacity, 151-155 rue de Bercy, 75012, Paris Germany DEU1: Volklinger Strasse 4, 40219, Dusseldorf DEU2: Bernhard-Wicki-Strasse 3/5 80636 München DEU3: Heerdter Sandberg 30, 40549, Dusseldorf DEU4: Stephanienstrasse 86, 76133 Karlsruhe DEU5: Joseph-Schumpeter-Allee 33, 53227, Bonn DEU6: Ohlauer Str. 43, Aufgang C, c/o Thunderbolt Collective, 10999, Berlin DEU7: Johannstrasse 1, 40476 Düsseldorf Hong Kong HNK1: Room 1917, 19/F, Lee Garden One, 33 Hysan Avenue, Causeway Bay HNK2: 1505,15th Floor, Tower A, Ping An International Finance Center HNK3: 11/F Oxford House, Taikoo Place, 979 King’s Road, Quarry Bay HNK4: 17th Floor, One Island East, Taikoo Place, 18 Westlands Road, Quarry Bay India IND1: 818, 8th Floor, Indraprakash Building, 21 Barakhamba Road, New Delhi, Delhi, 110001 IND2: Ascendas International Tech Park, Crest Building 12th Floor, Taramani Road, Taramani, Chennai, 600113 Indonesia IDN1: APL Tower Central Park 26th Floor Unit T3 Jl. S. Parman Kav., 28, Grogol, Pertamburan Jakarta Barat 11470 IDN2: Gedung World Trade Center, 3 Lt. 20 Spaces JL Jend Sudirman Kav 29-31, Karet Kuningan, Setiabudi,Kota Adm. Jakarta Selatan, DKI Jakarta 12940 Irish Republic IRL1: Riverside One, Sir John Rogerson’s Quay, Dublin 2, DO2 X576 IRL2: 4th Floor, South Block, Rockfield Central, Dundrum, Dublin, D16 R6VO Israel ISR1: Meitar, Attorneys at Law, 16 Abba Hillel Road, Ramat Gan 5250608 Italy ITA1: Via Marostica 1, 20146, Milan ITA2: Studio Colombo e Associati, Via San Damiano 9, 20122, Milan Japan JPN1: 1-9-15 Higashi-Azabu, Minato-Ku Tokyo 106-0044 JPN2: 11F, Yaesu Central Tower, Tokyo Midtown Yaesu, 2-2-1 Yaesu Chuo-ku, Tokyo 104-0028 Kingdom of Saudi Arabia KSA1: Riyadh, Financial Boulevard 13519, Al Aqeeq District Korea (Republic of) KOR1: 206 Noksapyeong-daero, Yongsan-gu, 140-861, Seoul KOR2: 1622-24 Block A, Tera Tower II, 201 Songpa-daero, Songpa-gu, Seoul KOR3: Story 2003 Bldg, 5, Baekjegobun-ro 9-gil, Songpa-gu, Seoul, 05561, Republic of Korea KOR4: 1602-03 Block A, Tera Tower II, 201 Songpa-daero, Songpa-gu, Seoul, Korea Macau MAC1: Rua De Xangai, No. 175 Edif. Associacao Comercial de Macau, 11 Andar, Bloco K Malaysia MYS1: Suite 29-1, Level 29, Vertical Corporate, Tower B, Avenue 10, The Vertical, 59200 Bangsar South City, Kuala Lumpur Mexico MEX1: Avenida Paseo de la Reforma 243, Piso 15, Col. Cuauhtemoc, Mexico City, 06500 MEX2: Av. Miguel Hidalgo y Costilla 1995, piso 6 oficina 10 , Ladron de Guevara, Guadalajara, Jalisco, 44600 Netherlands NLD1: Radarweg 29, 1043 NX Amsterdam NLD2: Hanzestraat 1, 7006RH Doetinchem Registered offices New Zealand NZL1: Level 1, 138 The Terrace, P.O. Box 472, Wellington 6011 Philippines PHL1: Building H, 2nd Floor, U.P. Ayalaland TechnoHub, Commonwealth Avenue, Quezon City, Metro Manila, 1101 Poland POL1: Plac Grunwaldzki 23-27, 50-365 Wroclaw POL2: Al. JJana Pawla II, 22, 00-133, Warszawa Singapore SGP1: 3 Killiney Road, #08-01, Winsland House 1, 239519 SGP2: 9 Raffles Place, #26-01, Republic Plaza, 048619 South Africa ZAF1: Building 8, Country Club Estate Office Park, 21 Woodlands Drive, Woodmead, Gauteng, 2191 Spain ESP1: C/ Josep Tarradellas 20-30, 1º / 20029, Barcelona Sweden SWE1: Aurorum 8, 977 75 Lulea Taiwan TWN1: RM. N905, 9F., No. 96, Sec. 2, Zhongshan N. Rd., Zhongshan Dist, Taipei, 10449 Thailand THA1: Sathorn Nakorn Building, Floor 32, No. 100/68-69 North Sathon Road, Silom, Bangrak, Bangkok, 10500 THA2: 14th Floor, CTI Tower, 191/70-73 Ratchadapisek Road, Khwaeng Klongtoey, Klongtoey, Bangkok, 10110 THA3: The Offices at Central World, Office R06, 999/9 Rama I Road, Pathumwan, Bangkok 10330 Turkey TUR1: Maslak Mah. Bilim Sokak Sun Plaza Kat:13 Sisli-Maslak, Istanbul TUR2: Tuyap Fuar ve Kongre Merkezi, Cumhuriyet Mah. Hadimkoy Yolu Cad. No:9/4 , 34500 Buyukcekmece, Istanbul United Arab Emirates UAE1: Office 303, 3rd Floor Arjaan Office Tower Al Sufouh Complex, PO Box 502425, Dubai Media City, Dubai UAE2: Al Sufouh Complex, Office nos. 404, 405, 406 & 407, Dubai Media City, Dubai United Kingdom GBR1: 1-3 Strand, London, WC2N 5JR GBR2: Gateway House, 28 The Quadrant, Richmond, Surrey, TW9 1DN GBR3: Lexis House, 30 Farringdon Street, London, EC4A 4HH GBR4: Global Reach, Dunleavy Drive, Cardiff, CF11 0SN GBR5: 125 London Wall, London, EC2Y 5AS GBR6: Biodata Innovation Centre Wellcome Genome Campus, Hinxton, Cambridge, CB10 1DR United States USA1: 1000 Alderman Dr., Alpharetta, GA 30005 USA2: 230 Park Ave, New York, NY 10169 USA3: Suite 501, 1105 North Market St, Wilmington, DE 19801 USA4: 1150 18th St, NW, Washington, DC 20036 USA5: 9443 Springboro Pike, Miamisburg, OH 45342 USA6: c/o Aon Insurance Managers (USA) Inc, 100 Bank Street, Suite 630 Burlington, Vermont 05401 USA7: #1095 Wilson, Ste 3, San Juan, PR 00907 USA8: 2235 Gateway Access Point, Suite 300, Raleigh, NC, 27607 Vietnam VIE1: 2nd Floor, Kova Center, 92G-92H Nguyen Huu Canh Street, Ward no. 22, District. Binh Thanh, Ho Chi Minh City 1 Nominee companies controlled by the group based on management's assessments 2 Directly held by the Company and shareholder information Financial statements Governance Market segments Financial review Corporate responsibility Overview RELX Annual Report 2024 | Notes to the consolidated financial statements 185 |
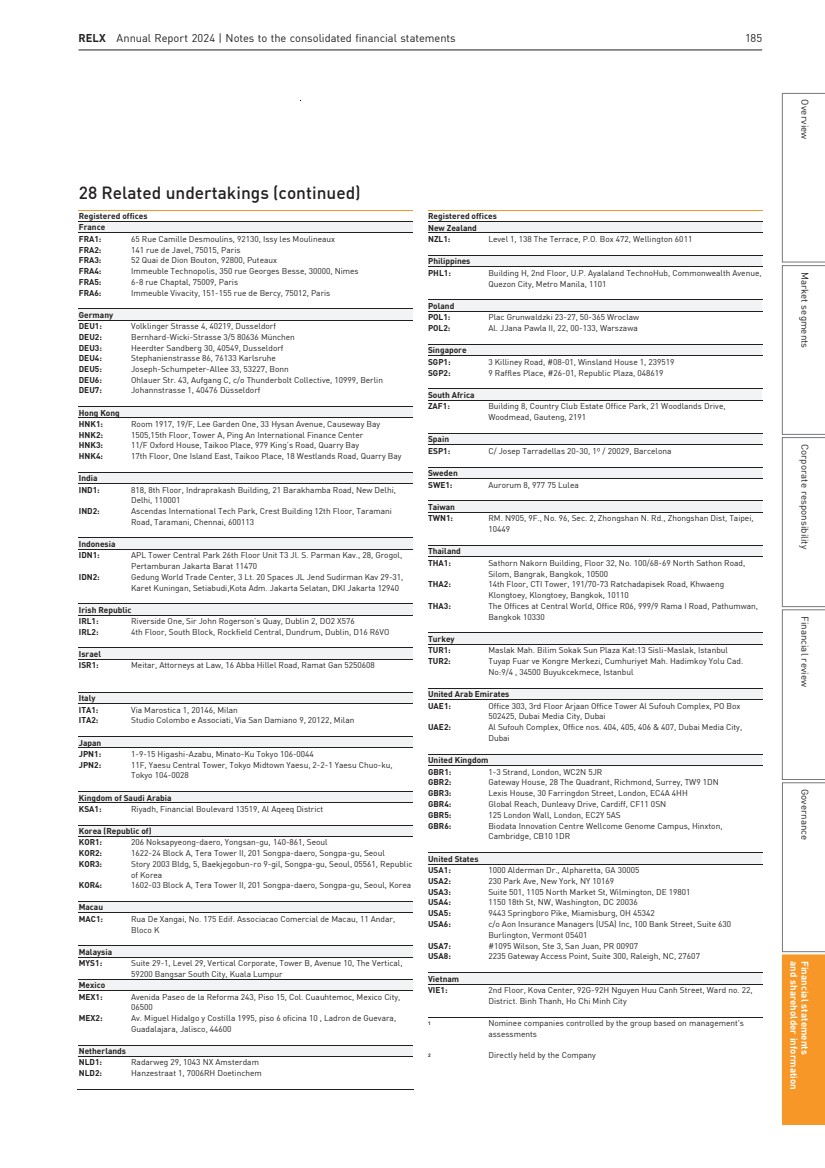
| 186 RELX Annual Report 2024 | Financial statements and other information 28 Related undertakings (continued) The following UK subsidiaries will take advantage of the audit exemption set out within Section 479A of the Companies Act 2006 supported by guarantees issued by RELX PLC over their liabilities for the year ended 31 December 2024. Company name Registration number Aistemos Limited 08644182 Butterworths Limited 02826955 Cordery Compliance Limited 07931532 Crediva Limited 06567484 Interfolio UK Ltd (in dissolution) 07820803 LNRS Data Services Holdings Limited 00052790 Mack-Brooks Exhibitions Limited 00967560 MLex Limited 05488651 Offshore Europe (Management) Limited 02318214 RE (HPL) Limited 00598514 RE (RCB) Limited 03396524 RE (SOE) Limited 02330299 Reed Events Limited 05893942 Reed Nominees Limited (in dissolution) 00251020 RELX (Holdings) Limited 05807690 RELX (Investments) plc 05810043 RELX Overseas Holdings Limited 09489059 REV Venture Partners Limited 04226986 SciBite Limited 07778456 Sustainable Energy Conferences Limited 12157497 Tracesmart Limited 03827062 186 RELX Annual Report 2024 | Financial statements and other information 28 Related undertakings (continued) The following UK subsidiaries will take advantage of the audit exemption set out within Section 479A of the Companies Act 2006 supported by guarantees issued by RELX PLC over their liabilities for the year ended 31 December 2024. Company name Registration number Aistemos Limited 08644182 Butterworths Limited 02826955 Cordery Compliance Limited 07931532 Crediva Limited 06567484 Interfolio UK Ltd (in dissolution) 07820803 LNRS Data Services Holdings Limited 00052790 Mack-Brooks Exhibitions Limited 00967560 MLex Limited 05488651 Offshore Europe (Management) Limited 02318214 RE (HPL) Limited 00598514 RE (RCB) Limited 03396524 RE (SOE) Limited 02330299 Reed Events Limited 05893942 Reed Nominees Limited (in dissolution) 00251020 RELX (Holdings) Limited 05807690 RELX (Investments) plc 05810043 RELX Overseas Holdings Limited 09489059 REV Venture Partners Limited 04226986 SciBite Limited 07778456 Sustainable Energy Conferences Limited 12157497 Tracesmart Limited 03827062 186 RELX Annual Report 2024 | Financial statements and other information |
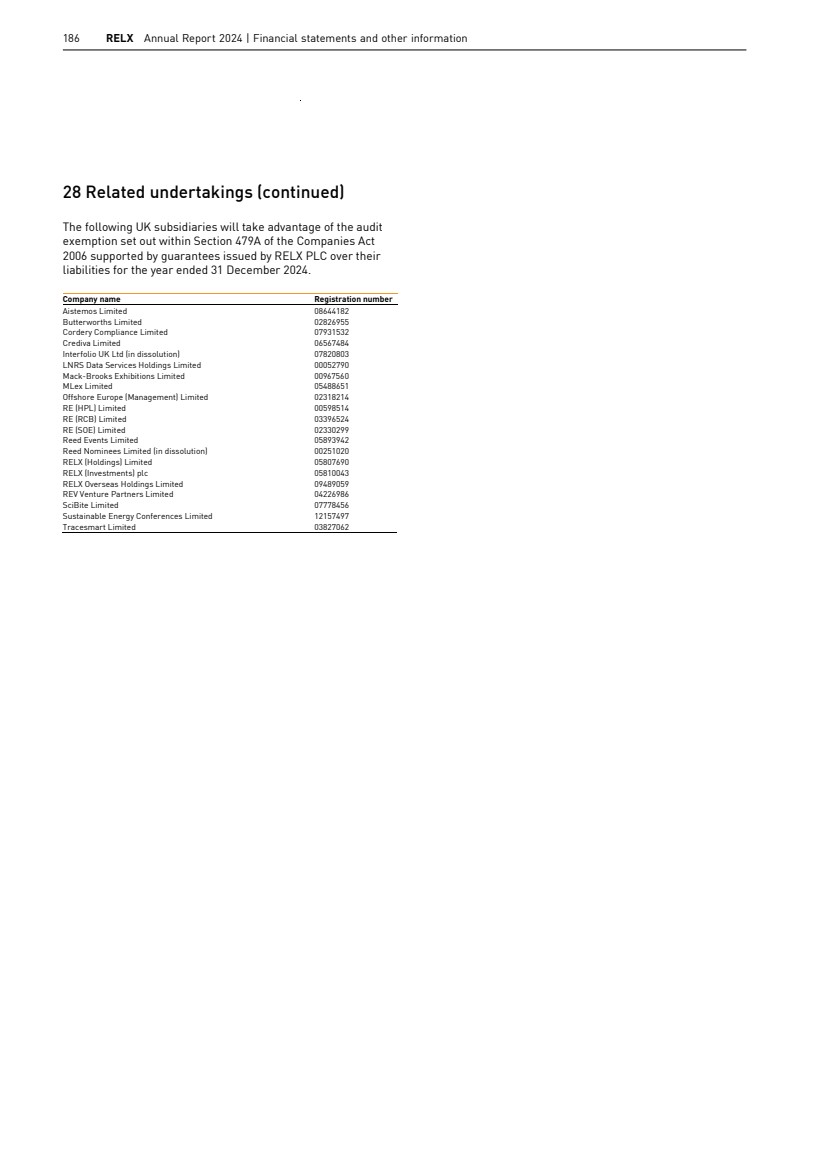
| 187 RELX Annual Report 2024 | Financial statements and other information 5 year summary 2020 GBPm 2021 GBPm 2022 GBPm 2023 GBPm 2024 GBPm RELX consolidated financial information Growth rates Underlying revenue growth -9% +7% +9% +8% +7% Underlying adjusted operating profit growth -18% +13% +15% +13% +10% Adjusted earnings per share growth (at constant currency) -15% +17% +10% +11% +9% Adjusted figures¹ Revenue 7,110 7,244 8,553 9,161 9,434 EBITDA 2,567 2,697 3,174 3,544 3,724 Operating profit 2,076 2,210 2,683 3,030 3,199 Operating margin 29.2% 30.5% 31.4% 33.1% 33.9% Profit before tax 1,916 2,077 2,489 2,716 2,903 Net profit attributable to shareholders 1,543 1,689 1,961 2,156 2,241 Net margin 21.7% 23.3% 22.9% 23.5% 23.8% Cash flow 2,009 2,230 2,709 2,962 3,101 Cash flow conversion 97% 101% 101% 98% 97% Return on invested capital 10.8% 11.9% 12.5% 14.0% 14.8% Earnings per share 80.1p 87.6p 102.2p 114.0p 120.1p Dividend² Ordinary dividend per share 47.0p 49.8p 54.6p 58.8p 63.0p Reported figures Revenue 7,110 7,244 8,553 9,161 9,434 Operating profit 1,525 1,884 2,323 2,682 2,861 Profit before tax 1,483 1,797 2,113 2,295 2,557 Net profit attributable to shareholders 1,224 1,471 1,634 1,781 1,934 Net margin 17.2% 20.3% 19.1% 19.4% 20.5% Net debt 6,898 6,017 6,604 6,446 6,563 Earnings per share (pence) 63.5p 76.3p 85.2p 94.1p 103.6p (1) Adjusted figures are presented as additional performance measures used by management. Further details on the adjusted measures can be found in the Alternative performance measures section on pages 200 to 207. (2) Dividend per ordinary share is based on the interim dividend and proposed final dividend for the relevant year. 187 RELX Annual Report 2024 | Financial statements and other information 5 year summary 2020 GBPm 2021 GBPm 2022 GBPm 2023 GBPm 2024 GBPm RELX consolidated financial information Growth rates Underlying revenue growth -9% +7% +9% +8% +7% Underlying adjusted operating profit growth -18% +13% +15% +13% +10% Adjusted earnings per share growth (at constant currency) -15% +17% +10% +11% +9% Adjusted figures¹ Revenue 7,110 7,244 8,553 9,161 9,434 EBITDA 2,567 2,697 3,174 3,544 3,724 Operating profit 2,076 2,210 2,683 3,030 3,199 Operating margin 29.2% 30.5% 31.4% 33.1% 33.9% Profit before tax 1,916 2,077 2,489 2,716 2,903 Net profit attributable to shareholders 1,543 1,689 1,961 2,156 2,241 Net margin 21.7% 23.3% 22.9% 23.5% 23.8% Cash flow 2,009 2,230 2,709 2,962 3,101 Cash flow conversion 97% 101% 101% 98% 97% Return on invested capital 10.8% 11.9% 12.5% 14.0% 14.8% Earnings per share 80.1p 87.6p 102.2p 114.0p 120.1p Dividend² Ordinary dividend per share 47.0p 49.8p 54.6p 58.8p 63.0p Reported figures Revenue 7,110 7,244 8,553 9,161 9,434 Operating profit 1,525 1,884 2,323 2,682 2,861 Profit before tax 1,483 1,797 2,113 2,295 2,557 Net profit attributable to shareholders 1,224 1,471 1,634 1,781 1,934 Net margin 17.2% 20.3% 19.1% 19.4% 20.5% Net debt 6,898 6,017 6,604 6,446 6,563 Earnings per share (pence) 63.5p 76.3p 85.2p 94.1p 103.6p (1) Adjusted figures are presented as additional performance measures used by management. Further details on the adjusted measures can be found in the Alternative performance measures section on pages 200 to 207. (2) Dividend per ordinary share is based on the interim dividend and proposed final dividend for the relevant year. and shareholder information Financial statements Governance Market segments Financial review Corporate responsibility Overview RELX Annual Report 2024 187 |
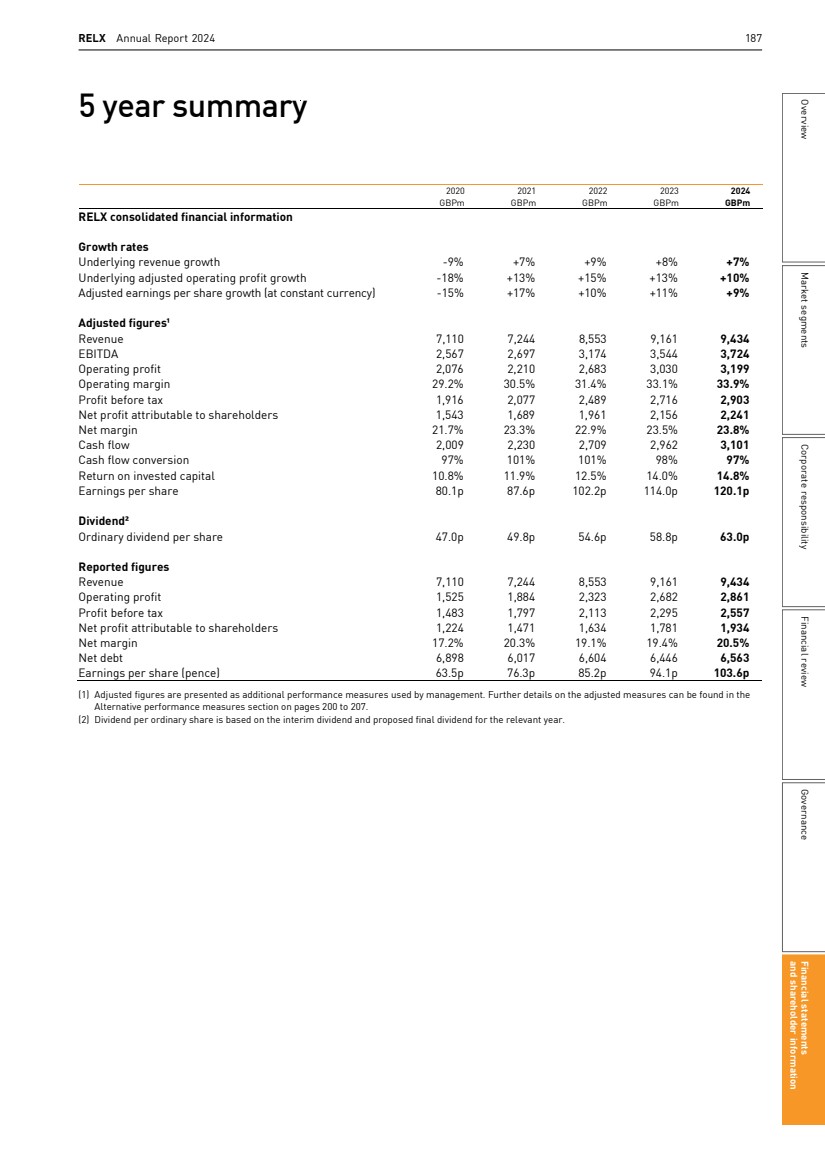
| 188 RELX Annual Report 2024 RELX PLC company only financial statements In this section 190 RELX PLC statement of total comprehensive income 190 RELX PLC statement of cash flows 191 RELX PLC statement of financial position 192 RELX PLC statement of changes in equity 193 Notes to the RELX PLC financial statements |
| RELX Annual Report 2024 189 Financial review and shareholder information Financial statements Governance Corporate responsibility Overview Market segments |
| 190 RELX Annual Report 2024 | Financial statements and other information RELX PLC statement of total comprehensive income FOR THE YEAR ENDED 31 DECEMBER 2023 2024 Note GBPm GBPm Dividend income 12 1,800 549 Administration and other expenses (4) (4) Other income 63 70 Operating profit 1,859 615 Finance income - - Finance costs - - Net finance income - - Profit before tax 1,859 615 Current tax 4 (13) (17) Tax expense (13) (17) Net profit for the year 1,846 598 There is no other comprehensive income other than the profit stated above. RELX PLC statement of cash flows FOR THE YEAR ENDED 31 DECEMBER Note 2023 GBPm 2024 GBPm Cash flows from operating activities Cash generated from operations 5 59 65 Tax paid (net) 13 (27) Net cash from operating activities 72 38 Cash flows from investing activities Dividends received 12 1,800 549 (Increase)/decrease in amounts due from subsidiary undertakings 12 (54) 1,487 Cash generated from investing activities 1,746 2,036 Cash flows from financing activities Dividends paid to shareholders 5 (1,059) (1,121) Repurchase of ordinary shares 10 (800) (1,000) Proceeds on issue of ordinary shares 10 41 47 Net cash used in financing activities (1,818) (2,074) Net cash used in activities - - Cash and cash equivalents at the start and end of the year - - 190 RELX Annual Report 2024 | Financial statements and other information RELX PLC statement of total comprehensive income FOR THE YEAR ENDED 31 DECEMBER 2023 2024 Note GBPm GBPm Dividend income 12 1,800 549 Administration and other expenses (4) (4) Other income 63 70 Operating profit 1,859 615 Finance income - - Finance costs - - Net finance income - - Profit before tax 1,859 615 Current tax 4 (13) (17) Tax expense (13) (17) Net profit for the year 1,846 598 There is no other comprehensive income other than the profit stated above. RELX PLC statement of cash flows FOR THE YEAR ENDED 31 DECEMBER Note 2023 GBPm 2024 GBPm Cash flows from operating activities Cash generated from operations 5 59 65 Tax paid (net) 13 (27) Net cash from operating activities 72 38 Cash flows from investing activities Dividends received 12 1,800 549 (Increase)/decrease in amounts due from subsidiary undertakings 12 (54) 1,487 Cash generated from investing activities 1,746 2,036 Cash flows from financing activities Dividends paid to shareholders 5 (1,059) (1,121) Repurchase of ordinary shares 10 (800) (1,000) Proceeds on issue of ordinary shares 10 41 47 Net cash used in financing activities (1,818) (2,074) Net cash used in activities - - Cash and cash equivalents at the start and end of the year - - 190 RELX Annual Report 2024 | Financial statements and other information |
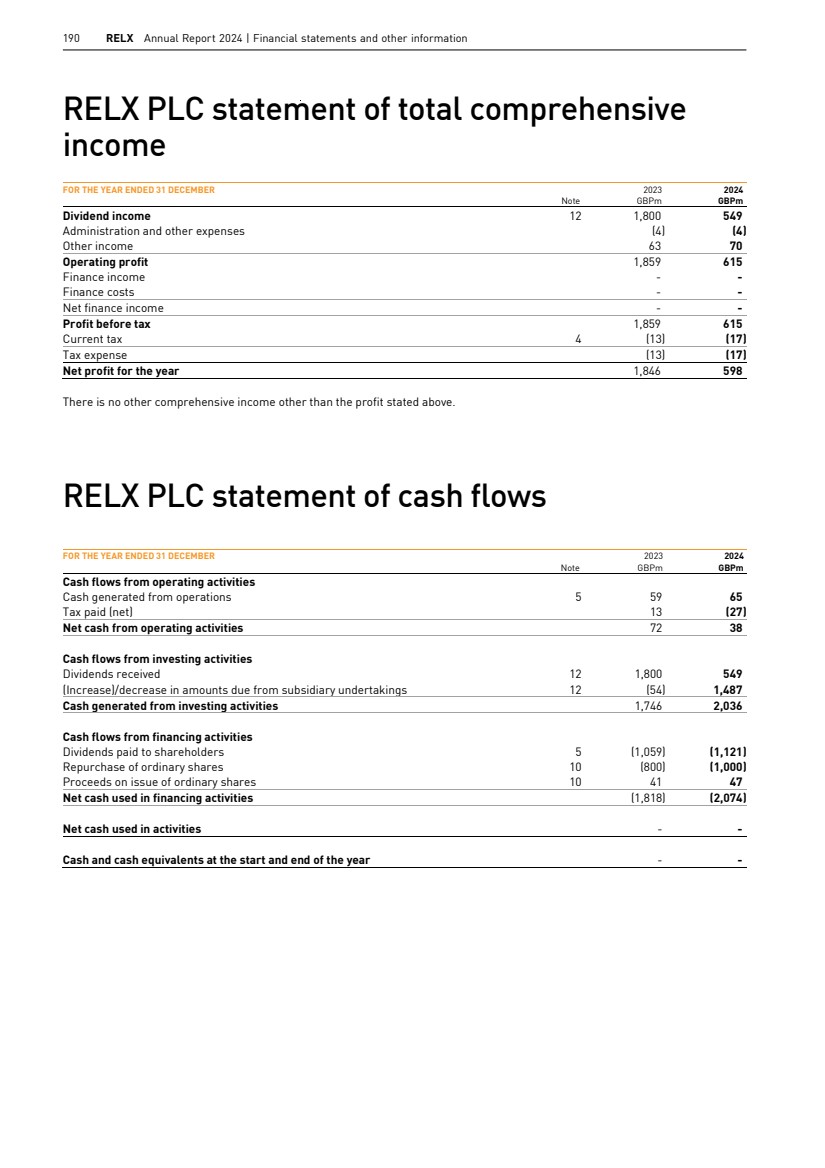
| RELX Annual Report 2024 191 Overview Market segments Corporate responsibility Financial review Governance Financial statements and shareholder information RELX PLC statement of financial position AS AT 1 Jan 2023 31 Dec 2023 31 Dec 2024 Note GBPm GBPm GBPm Non-current assets Investments in subsidiary undertakings 7 18,333 18,339 18,351 18,333 18,339 18,351 Current assets Receivables: amounts due from subsidiary undertakings 12 1,469 1,513 26 Total assets 19,802 19,852 18,377 Current liabilities Taxation 4 1 27 17 Other payables 8 154 154 153 Payables: amounts owed to subsidiary undertakings 12 10 - - 165 181 170 Total liabilities 165 181 170 Net assets 19,637 19,671 18,207 Capital and reserves Share capital 10 279 275 272 Share premium 10 1,517 1,558 1,605 Shares held in treasury 10 (312) (435) (582) Capital redemption reserve 43 47 50 Other reserves 183 189 201 Merger reserve 11,150 11,150 11,150 Net profit 1,056 1,846 598 Reserves 5,721 5,041 4,913 Shareholders’ equity 19,637 19,671 18,207 Total equity 19,637 19,671 18,207 The RELX PLC Company financial statements were approved by the Board of Directors and authorised for issue on 12 February 2025. They were signed on its behalf by: N L Luff Chief Financial Officer RELX Annual Report 2024 191 Overview Market segments Corporate responsibility Financial review Governance Financial statements and shareholder information RELX PLC statement of financial position AS AT 1 Jan 2023 31 Dec 2023 31 Dec 2024 Note GBPm GBPm GBPm Non-current assets Investments in subsidiary undertakings 7 18,333 18,339 18,351 18,333 18,339 18,351 Current assets Receivables: amounts due from subsidiary undertakings 12 1,469 1,513 26 Total assets 19,802 19,852 18,377 Current liabilities Taxation 4 1 27 17 Other payables 8 154 154 153 Payables: amounts owed to subsidiary undertakings 12 10 - - 165 181 170 Total liabilities 165 181 170 Net assets 19,637 19,671 18,207 Capital and reserves Share capital 10 279 275 272 Share premium 10 1,517 1,558 1,605 Shares held in treasury 10 (312) (435) (582) Capital redemption reserve 43 47 50 Other reserves 183 189 201 Merger reserve 11,150 11,150 11,150 Net profit 1,056 1,846 598 Reserves 5,721 5,041 4,913 Shareholders’ equity 19,637 19,671 18,207 Total equity 19,637 19,671 18,207 The RELX PLC Company financial statements were approved by the Board of Directors and authorised for issue on 12 February 2025. They were signed on its behalf by: N L Luff Chief Financial Officer and shareholder information Financial statements Governance Market segments Financial review Corporate responsibility Overview RELX Annual Report 2024 | RELX PLC company only financial statements 191 |
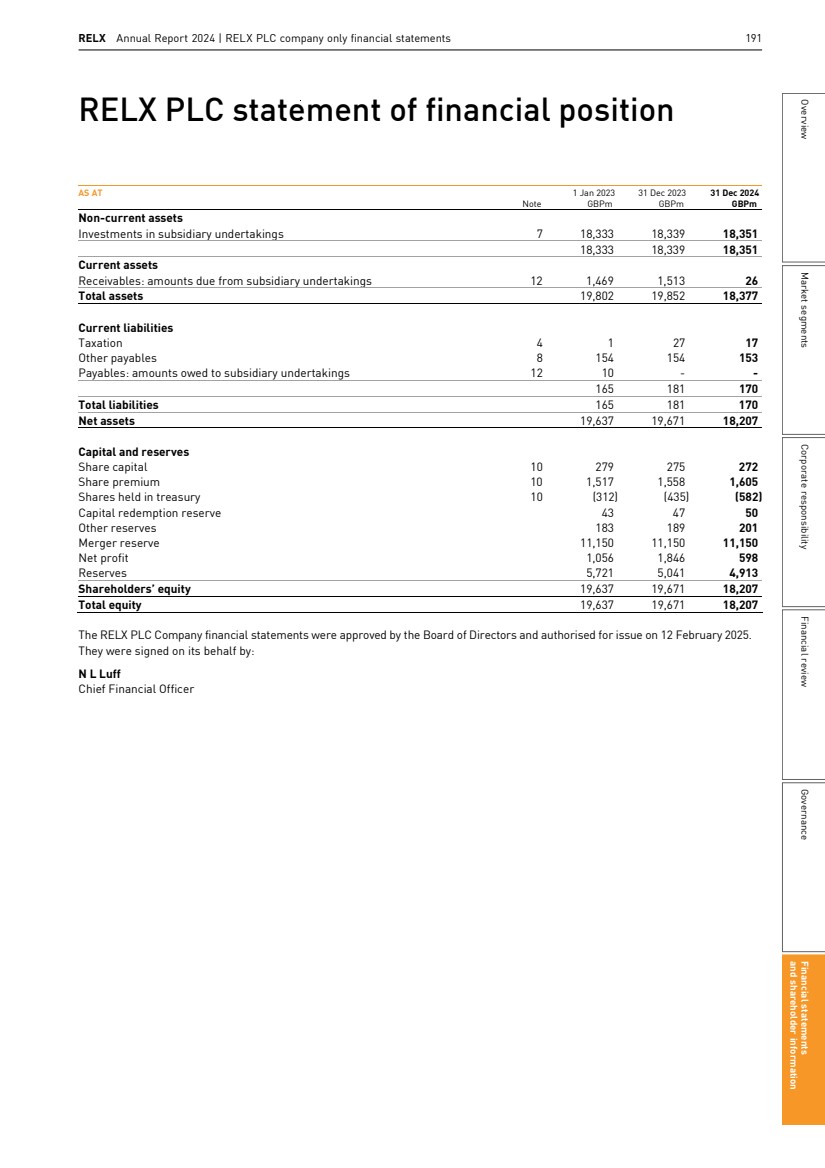
| RELX Annual Report 2024 | RELX PLC Annual Report and Financial Statements 192 RELX PLC statement of changes in equity M Shares Capital Share Share held in redemption Other Merger Net capital premium treasury reserve (1) reserves (2) reserve (1) profit Reserves (3) Total Note GBPm GBPm GBPm GBPm GBPm GBPm GBPm GBPm GBPm Balance at 1 January 2023 279 1,517 (312) 43 183 11,150 1,056 5,721 19,637 Total comprehensive income for the year - - - - - - 1,846 - 1,846 Dividends paid (4) 6 - - - - - - - (1,059) (1,059) Repurchase of ordinary shares 10 - - (800) - - - - - (800) Cancellation of shares 10 (4) - 677 4 - - - (677) - Issue of ordinary shares, net of expenses 10 - 41 - - - - - - 41 Equity instruments granted to employees of the Group 7 - - - - 6 - - - 6 Transfer of net profit to reserves - - - - - - (1,056) 1,056 - Balance at 1 January 2024 275 1,558 (435) 47 189 11,150 1,846 5,041 19,671 Total comprehensive income for the year - - - - - - 598 - 598 Dividends paid (4) 6 - - - - - - - (1,121) (1,121) Repurchase of ordinary shares 10 - - (1,000) - - - - - (1,000) Cancellation of shares 10 (3) - 853 3 - - - (853) - Issue of ordinary shares, net of expenses 10 - 47 - - - - - - 47 Equity instruments granted to employees of the Group 7 - - - - 12 - - - 12 Transfer of net profit to reserves - - - - - - (1,846) 1,846 - Balance at 31 December 2024 272 1,605 (582) 50 201 11,150 598 4,913 18,207 (1) The capital redemption and merger reserve do not form part of the distributable reserves balance. (2) Other reserves relate to equity instruments granted to employees of the Group under shared based remuneration arrangements, and do not form part of the distributable reserves balance. (3) Distributable reserves at 31 December 2024 were £4,929m (2023: £6,452m) comprising net profit and reserves, net of shares held in treasury. (4) Refer to note 13 of the RELX consolidated financial statements on page 164 for further dividend disclosure. RELX Annual Report 2024 | RELX PLC Annual Report and Financial Statements 192 RELX PLC statement of changes in equity M Shares Capital Share Share held in redemption Other Merger Net capital premium treasury reserve (1) reserves (2) reserve (1) profit Reserves (3) Total Note GBPm GBPm GBPm GBPm GBPm GBPm GBPm GBPm GBPm Balance at 1 January 2023 279 1,517 (312) 43 183 11,150 1,056 5,721 19,637 Total comprehensive income for the year - - - - - - 1,846 - 1,846 Dividends paid (4) 6 - - - - - - - (1,059) (1,059) Repurchase of ordinary shares 10 - - (800) - - - - - (800) Cancellation of shares 10 (4) - 677 4 - - - (677) - Issue of ordinary shares, net of expenses 10 - 41 - - - - - - 41 Equity instruments granted to employees of the Group 7 - - - - 6 - - - 6 Transfer of net profit to reserves - - - - - - (1,056) 1,056 - Balance at 1 January 2024 275 1,558 (435) 47 189 11,150 1,846 5,041 19,671 Total comprehensive income for the year - - - - - - 598 - 598 Dividends paid (4) 6 - - - - - - - (1,121) (1,121) Repurchase of ordinary shares 10 - - (1,000) - - - - - (1,000) Cancellation of shares 10 (3) - 853 3 - - - (853) - Issue of ordinary shares, net of expenses 10 - 47 - - - - - - 47 Equity instruments granted to employees of the Group 7 - - - - 12 - - - 12 Transfer of net profit to reserves - - - - - - (1,846) 1,846 - Balance at 31 December 2024 272 1,605 (582) 50 201 11,150 598 4,913 18,207 (1) The capital redemption and merger reserve do not form part of the distributable reserves balance. (2) Other reserves relate to equity instruments granted to employees of the Group under shared based remuneration arrangements, and do not form part of the distributable reserves balance. (3) Distributable reserves at 31 December 2024 were £4,929m (2023: £6,452m) comprising net profit and reserves, net of shares held in treasury. (4) Refer to note 13 of the RELX consolidated financial statements on page 164 for further dividend disclosure. 192 RELX Annual Report 2024 | Financial statements and other information |
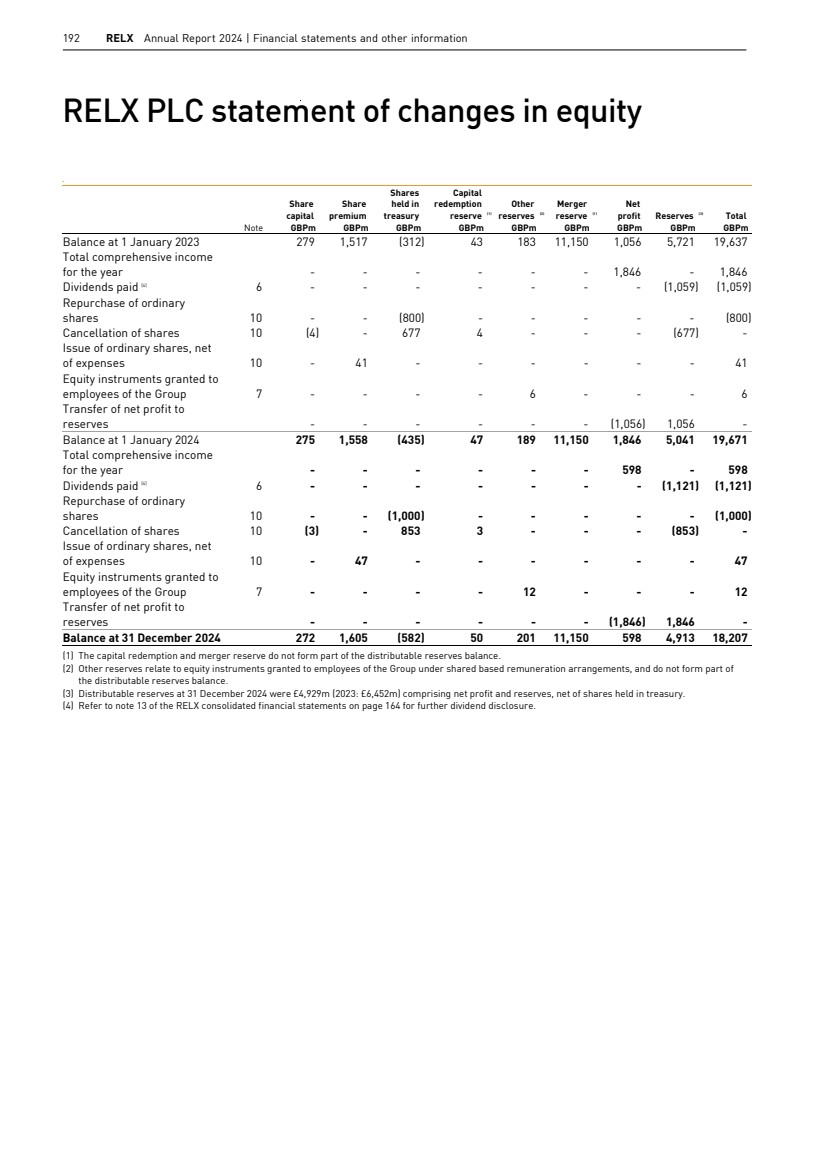
| RELX Annual Report 2024 193 Overview Market segments Corporate responsibility Financial review Governance Financial statements and shareholder information Notes to the RELX PLC financial statements 1 Basis of preparation and accounting policies The financial statements of RELX PLC are prepared in accordance with UK adopted International Accounting Standards in conformity with the requirements of the Companies Act 2006 and IFRS accounting standards as issued by the International Accounting Standards Board. The RELX PLC financial statements should be read in conjunction with the Group consolidated financial statements and notes presented on pages 140 to 186, which are also presented as the RELX PLC consolidated financial statements. See the Basis of preparation of the Group consolidated financial statements on page 145. The financial results of RELX PLC are included in the Group consolidated financial statements on pages 140 to 186. The principal activity of RELX PLC is being the parent company for RELX, as described in note 1 of the Group consolidated financial statements on page 145. The RELX PLC financial statements are prepared on a going concern basis, as explained on page 79. The RELX PLC financial statements are prepared on the historical cost basis. First-time adoption of IFRS RELX PLC has prepared its company financial statements in accordance with IFRS accounting standards. In accordance with IFRS 1 ‘First-time Adoption of International Financial Reporting Standards’, RELX PLC has applied IFRS retrospectively with the transition date being I January 2023. The conversion from UK Financial Reporting Standard 101 (FRS 101) to IFRS does not change the financial position, financial performance and cash flows of RELX PLC as there are no significant differences in the recognition and measurement principles. Accounting policies Foreign exchange translation Unless otherwise indicated, all amounts in the financial statements are in millions of pound sterling. Differences in subtotals in the financial statements may arise due to rounding adjustments applied during calculations. The symbols GBP and £ used throughout the financial statements relate to pound sterling. Transactions in foreign currencies are recorded at the rate of exchange prevailing on the date of the transaction. Non-monetary assets and liabilities that are measured at historical cost in foreign currencies are translated using the exchange rate at the date of the transaction. At each statement of financial position date, monetary assets and liabilities that are denominated in foreign currencies are retranslated at the rate prevailing on the statement of financial position date. Exchange differences arising are recorded in the income statement. Taxation Refer to note 9 of the Group consolidated financial statements on pages 158 to 161 for the taxation accounting policies. Investment in subsidiary undertaking The investment in the subsidiary undertaking is stated at cost, less provision, if appropriate, for any impairment in value. The fair value of the award of share options and conditional shares over RELX PLC ordinary shares to employees of the Group are treated as a capital contribution to the investment. RELX PLC has applied the deemed cost exemption available under IFRS 1 and has measured investments in subsidiaries at the carrying amounts previously disclosed under FRS 101. Impairment reviews RELX PLC assesses the investment in the subsidiary undertaking for impairment whenever events or changes in circumstances indicate that the carrying value of the investment may not be recoverable. If any such indication of impairment exists, RELX PLC makes an estimate of the recoverable amount. If the recoverable amount of the investment is less than the value of the investment, the investment is considered to be impaired and is written down to its recoverable amount. An impairment loss is recognised immediately in the income statement. Financial instruments Financial instruments comprise receivables from subsidiaries and other payables. Financial assets and liabilities are initially recognised on the date that the Company becomes a party to the contractual provisions of the instrument. A financial asset is derecognised when the rights to receive cash flows from the asset have expired. A financial liability is derecognised when the obligation under the liability is discharged, cancelled or expires. Receivables from subsidiaries are recorded initially at fair value and subsequently carried at amortised cost, after allowing for any impairment losses calculated using the expected credit loss model on a forward-looking basis. Other payables are predominantly non-interest-bearing and are stated at their nominal values. Credit risk management RELX PLC’s main exposure to credit risk relates to amounts due from subsidiaries. Amounts due from subsidiaries are stated net of provisions for bad and doubtful debts. The credit risk of each subsidiary is influenced by the industry and country in which they operate; however, the company considers the credit risk of subsidiaries to be low as it has visibility of, and the ability to influence, their cash flows. Share capital, share premium and shares held in treasury Ordinary shares are classified as equity. Incremental costs directly attributable to the issue of ordinary shares are recognised as a deduction from equity, net of any tax effects. Share premium is the excess of the consideration received over the nominal value of the shares issued. Shares of RELX PLC that are repurchased and not cancelled are classified as shares held in treasury. The consideration paid, including directly attributable costs, is recognised as a deduction from equity. Guarantees and contingent liabilities Financial guarantee contracts are recorded at fair value on initial recognition and subsequently assessed for any changes in the risk of default which would result in an expense recorded in the income statement. RELX Annual Report 2024 193 Overview Market segments Corporate responsibility Financial review Governance Financial statements and shareholder information Notes to the RELX PLC financial statements 1 Basis of preparation and accounting policies The financial statements of RELX PLC are prepared in accordance with UK adopted International Accounting Standards in conformity with the requirements of the Companies Act 2006 and IFRS accounting standards as issued by the International Accounting Standards Board. The RELX PLC financial statements should be read in conjunction with the Group consolidated financial statements and notes presented on pages 140 to 186, which are also presented as the RELX PLC consolidated financial statements. See the Basis of preparation of the Group consolidated financial statements on page 145. The financial results of RELX PLC are included in the Group consolidated financial statements on pages 140 to 186. The principal activity of RELX PLC is being the parent company for RELX, as described in note 1 of the Group consolidated financial statements on page 145. The RELX PLC financial statements are prepared on a going concern basis, as explained on page 79. The RELX PLC financial statements are prepared on the historical cost basis. First-time adoption of IFRS RELX PLC has prepared its company financial statements in accordance with IFRS accounting standards. In accordance with IFRS 1 ‘First-time Adoption of International Financial Reporting Standards’, RELX PLC has applied IFRS retrospectively with the transition date being I January 2023. The conversion from UK Financial Reporting Standard 101 (FRS 101) to IFRS does not change the financial position, financial performance and cash flows of RELX PLC as there are no significant differences in the recognition and measurement principles. Accounting policies Foreign exchange translation Unless otherwise indicated, all amounts in the financial statements are in millions of pound sterling. Differences in subtotals in the financial statements may arise due to rounding adjustments applied during calculations. The symbols GBP and £ used throughout the financial statements relate to pound sterling. Transactions in foreign currencies are recorded at the rate of exchange prevailing on the date of the transaction. Non-monetary assets and liabilities that are measured at historical cost in foreign currencies are translated using the exchange rate at the date of the transaction. At each statement of financial position date, monetary assets and liabilities that are denominated in foreign currencies are retranslated at the rate prevailing on the statement of financial position date. Exchange differences arising are recorded in the income statement. Taxation Refer to note 9 of the Group consolidated financial statements on pages 158 to 161 for the taxation accounting policies. Investment in subsidiary undertaking The investment in the subsidiary undertaking is stated at cost, less provision, if appropriate, for any impairment in value. The fair value of the award of share options and conditional shares over RELX PLC ordinary shares to employees of the Group are treated as a capital contribution to the investment. RELX PLC has applied the deemed cost exemption available under IFRS 1 and has measured investments in subsidiaries at the carrying amounts previously disclosed under FRS 101. Impairment reviews RELX PLC assesses the investment in the subsidiary undertaking for impairment whenever events or changes in circumstances indicate that the carrying value of the investment may not be recoverable. If any such indication of impairment exists, RELX PLC makes an estimate of the recoverable amount. If the recoverable amount of the investment is less than the value of the investment, the investment is considered to be impaired and is written down to its recoverable amount. An impairment loss is recognised immediately in the income statement. Financial instruments Financial instruments comprise receivables from subsidiaries and other payables. Financial assets and liabilities are initially recognised on the date that the Company becomes a party to the contractual provisions of the instrument. A financial asset is derecognised when the rights to receive cash flows from the asset have expired. A financial liability is derecognised when the obligation under the liability is discharged, cancelled or expires. Receivables from subsidiaries are recorded initially at fair value and subsequently carried at amortised cost, after allowing for any impairment losses calculated using the expected credit loss model on a forward-looking basis. Other payables are predominantly non-interest-bearing and are stated at their nominal values. Credit risk management RELX PLC’s main exposure to credit risk relates to amounts due from subsidiaries. Amounts due from subsidiaries are stated net of provisions for bad and doubtful debts. The credit risk of each subsidiary is influenced by the industry and country in which they operate; however, the company considers the credit risk of subsidiaries to be low as it has visibility of, and the ability to influence, their cash flows. Share capital, share premium and shares held in treasury Ordinary shares are classified as equity. Incremental costs directly attributable to the issue of ordinary shares are recognised as a deduction from equity, net of any tax effects. Share premium is the excess of the consideration received over the nominal value of the shares issued. Shares of RELX PLC that are repurchased and not cancelled are classified as shares held in treasury. The consideration paid, including directly attributable costs, is recognised as a deduction from equity. Guarantees and contingent liabilities Financial guarantee contracts are recorded at fair value on initial recognition and subsequently assessed for any changes in the risk of default which would result in an expense recorded in the income statement. and shareholder information Financial statements Governance Market segments Financial review Corporate responsibility Overview RELX Annual Report 2024 | RELX PLC company only financial statements 193 |
| RELX Annual Report 2024 | RELX PLC Annual Report and Financial Statements 194 2 Auditors remuneration The parent company financial statements of RELX PLC are required to comply with the Companies (Disclosure of Auditor Remuneration and Liability Limitation Agreements) Regulations 2008. For details of the remuneration of the auditors, please refer to note 4 of the consolidated financial statements on page 150. 3 Directors remuneration Remuneration paid to the directors in respect of their services to RELX PLC is borne by other group companies. Information about the remuneration of directors is provided in the Remuneration Report on pages 102 to 126 “audited sections”. Information on key management compensation is provided in note 25 of the Group consolidated financial statements. 4 Taxation 2023 GBPm 2024 GBPm Current tax Current year (14) (17) Prior years 1 - Total current tax charge (13) (17) The current year tax charge is £17m (2023: £13m). The BEPS Pillar Two Minimum Tax legislation was enacted in July 2023 in the UK with effect from 2024. RELX PLC has applied the temporary exception under IAS 12 in relation to the accounting for deferred taxes arising from the implementation of the Pillar Two rules. The new rules do not have a significant impact on the tax charge for RELX PLC. The net tax expense charged on profit before tax differs from the theoretical amount that would arise using the weighted average of tax rates applicable to accounting profits and losses of the company, as follows: 2023 2024 GBPm % GBPm % Profit before tax 1,859 615 Tax at applicable rate of 25% (2023: 23.5%) (437) 23.5 % (154) 25.0 % Non-taxable income 423 (22.8)% 137 (22.3)% Adjustments in respect of prior periods 1 (0.1)% - - % Tax expense (13) 0.6 % (17) 2.8 % 5 Statement of cash flows The difference between operating profit and cash generated from operations is driven by dividends received of £549m (2023: £1,800m). 6 Dividends Refer to note 13 of the Group consolidated financial statements on page 164. RELX Annual Report 2024 | Financial statements and other information 195 Overview Market segments Corporate responsibility Financial review Governance Financial statements and shareholder information 7 Investment in subsidiary undertaking GBPm At 1 January 2023 18,333 Equity instruments granted to employees of the Group 6 At 1 January 2024 18,339 Equity instruments granted to employees of the Group 12 At 31 December 2024 18,351 As at 31 December 2024, the market capitalisation of the Group was higher than the Company's carrying value of its investment in the Group. No indicators of impairment were identified during the year. 8 Other payables This primarily relates to the accrual for share repurchases of £150m (2023: £150m). Refer to note 23 of the Group consolidated financial statements. 9 Financial instruments Financial assets and liabilities measured at amortised cost in RELX PLC’s statement of financial position comprise amounts due from subsidiaries (see note 12) and certain amounts reported within accounts payable and accrued liabilities (see note 8). The fair value of financial assets and liabilities measured at amortised cost at 31 December 2024 and 31 December 2023 approximates their carrying amount. Information on financial risk management is presented in note 17 of the Group consolidated financial statements. No derivative financial instruments were held at 31 December 2024 or 31 December 2023. 10 Share capital, share premium and shares held in treasury CALLED UP SHARE CAPITAL – ORDINARY SHARES OF UK 14 ⁵¹/₁₁₆ PENCE EACH ALLOTTED, ISSUED AND FULLY PAID No. of shares 2023 GBPm No. of shares 2024 GBPm At start of year 1,934,880,088 279 1,906,907,605 275 Issue of ordinary shares 3,027,517 - 2,937,114 - Cancellation of ordinary shares (31,000,000) (4) (29,000,000) (3) At end of year 1,906,907,605 275 1,880,844,719 272 NUMBER OF ORDINARY SHARES Year ended 31 December 2023 Shares in issue net of treasury shares* (millions) Shares in issue (millions) Treasury shares (millions) 2024 Shares in issue net of treasury shares* (millions) At start of year 1,915.1 1,906.9 (19.7) 1,887.2 Issue of ordinary shares 3.0 2.9 - 2.9 Repurchase of ordinary shares (30.9) - (28.9) (28.9) Cancellation of ordinary shares - (29.0) 29.0 - At end of year 1,887.2 1,880.8 (19.6) 1,861.2 *At 31 December 2024 the total shares in issue net of treasury shares is 1,861,237,049 (2023: 1,887,195,412). In 2024 the total consideration for share repurchases was £1,000m (2023: £800m). The issue of ordinary shares in the year relates to the exercise of share options. All of the ordinary shares rank equally with respect to voting rights and rights to receive dividends, except for shares held in treasury, which do not attract voting or dividend rights. There are no restrictions on the rights to transfer shares. During 2024, 29m (2023: 31m) ordinary shares held in treasury were cancelled. 194 RELX Annual Report 2024 | Financial statements and other information |
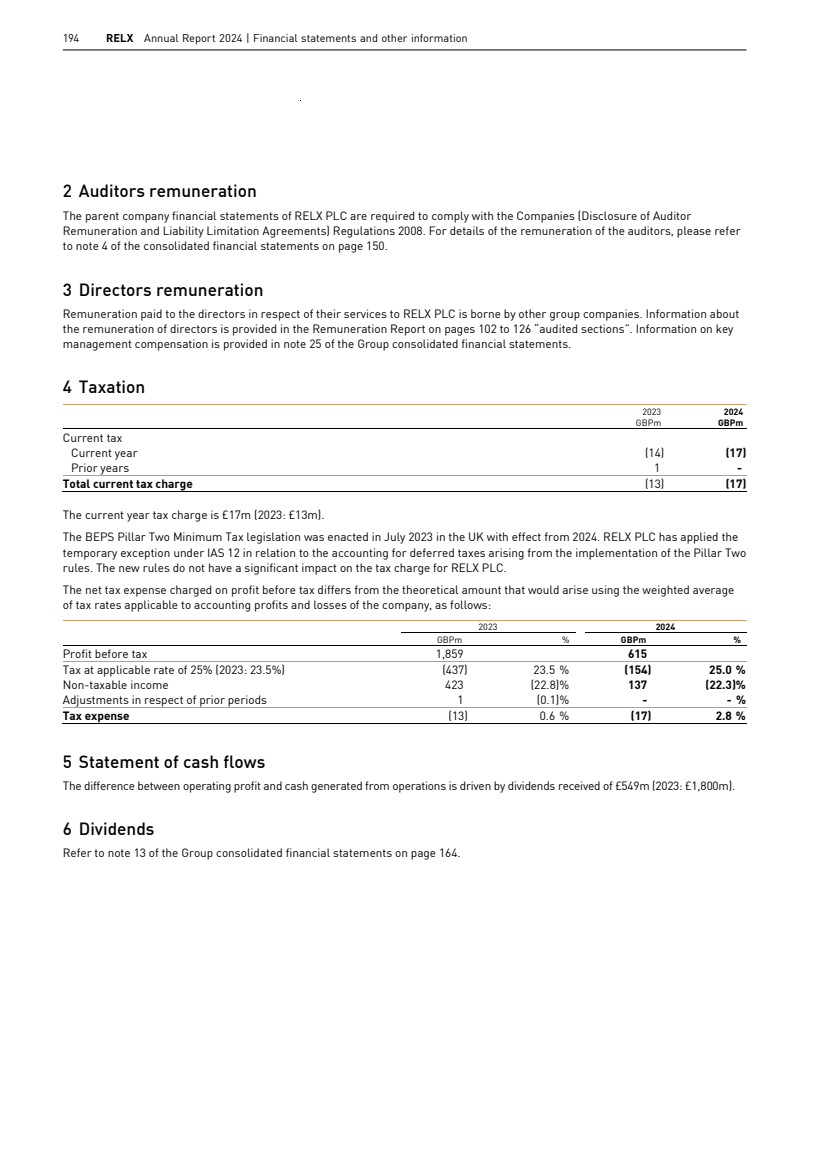
| RELX Annual Report 2024 | Financial statements and other information 195 Overview Market segments Corporate responsibility Financial review Governance Financial statements and shareholder information 7 Investment in subsidiary undertaking GBPm At 1 January 2023 18,333 Equity instruments granted to employees of the Group 6 At 1 January 2024 18,339 Equity instruments granted to employees of the Group 12 At 31 December 2024 18,351 As at 31 December 2024, the market capitalisation of the Group was higher than the Company's carrying value of its investment in the Group. No indicators of impairment were identified during the year. 8 Other payables This primarily relates to the accrual for share repurchases of £150m (2023: £150m). Refer to note 23 of the Group consolidated financial statements. 9 Financial instruments Financial assets and liabilities measured at amortised cost in RELX PLC’s statement of financial position comprise amounts due from subsidiaries (see note 12) and certain amounts reported within accounts payable and accrued liabilities (see note 8). The fair value of financial assets and liabilities measured at amortised cost at 31 December 2024 and 31 December 2023 approximates their carrying amount. Information on financial risk management is presented in note 17 of the Group consolidated financial statements. No derivative financial instruments were held at 31 December 2024 or 31 December 2023. 10 Share capital, share premium and shares held in treasury CALLED UP SHARE CAPITAL – ORDINARY SHARES OF UK 14 ⁵¹/₁₁₆ PENCE EACH ALLOTTED, ISSUED AND FULLY PAID No. of shares 2023 GBPm No. of shares 2024 GBPm At start of year 1,934,880,088 279 1,906,907,605 275 Issue of ordinary shares 3,027,517 - 2,937,114 - Cancellation of ordinary shares (31,000,000) (4) (29,000,000) (3) At end of year 1,906,907,605 275 1,880,844,719 272 NUMBER OF ORDINARY SHARES Year ended 31 December 2023 Shares in issue net of treasury shares* (millions) Shares in issue (millions) Treasury shares (millions) 2024 Shares in issue net of treasury shares* (millions) At start of year 1,915.1 1,906.9 (19.7) 1,887.2 Issue of ordinary shares 3.0 2.9 - 2.9 Repurchase of ordinary shares (30.9) - (28.9) (28.9) Cancellation of ordinary shares - (29.0) 29.0 - At end of year 1,887.2 1,880.8 (19.6) 1,861.2 *At 31 December 2024 the total shares in issue net of treasury shares is 1,861,237,049 (2023: 1,887,195,412). In 2024 the total consideration for share repurchases was £1,000m (2023: £800m). The issue of ordinary shares in the year relates to the exercise of share options. All of the ordinary shares rank equally with respect to voting rights and rights to receive dividends, except for shares held in treasury, which do not attract voting or dividend rights. There are no restrictions on the rights to transfer shares. During 2024, 29m (2023: 31m) ordinary shares held in treasury were cancelled. and shareholder information Financial statements Governance Market segments Financial review Corporate responsibility Overview RELX Annual Report 2024 | RELX PLC company only financial statements 195 |
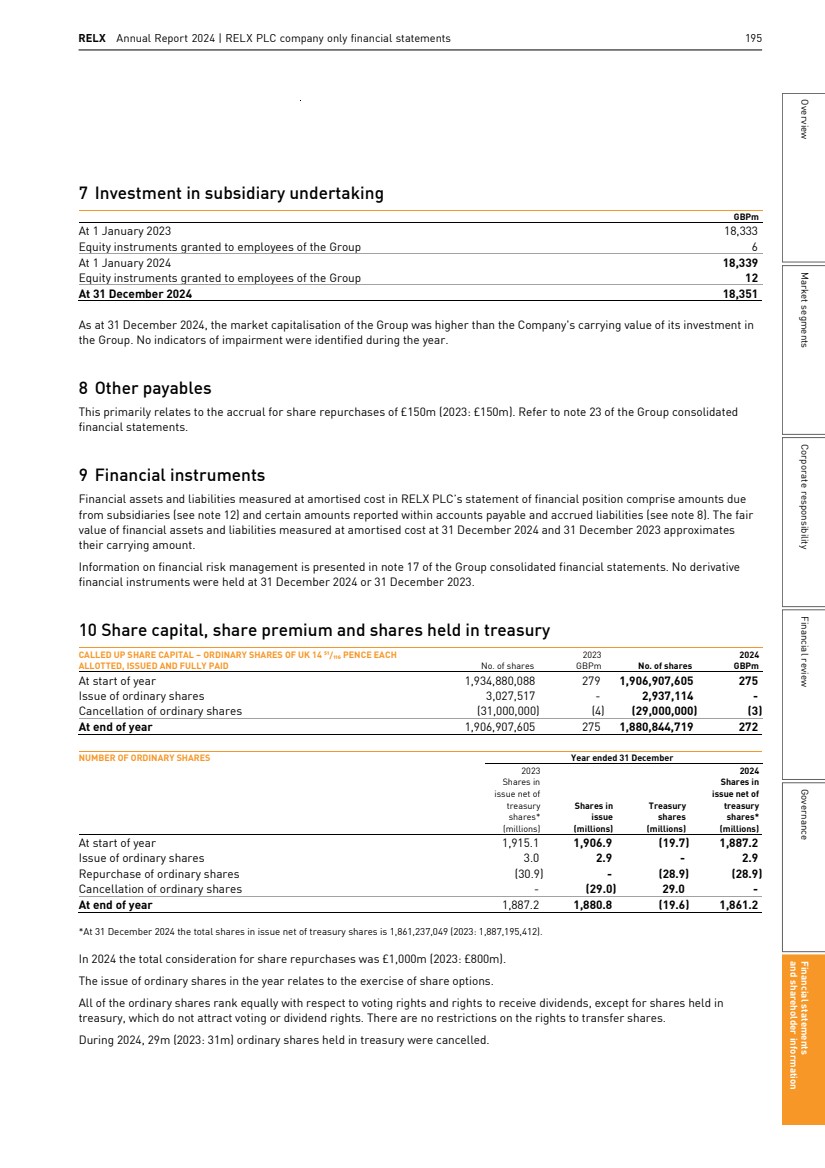
| 196 RELX Annual Report 2024 11 Guarantees and contingent liabilities There are financial guarantees given by RELX PLC in respect of debt within subsidiary undertakings: 2023 2024 GBPm GBPm Contingent liabilities guaranteed by RELX PLC 6,446 6,524 Financial instruments disclosures in respect of the debt covered by the above guarantees are given in note 17 of the consolidated financial statements. The probability of default is remote and there was no change in the assessment of the risk of default during the year. RELX PLC has issued guarantees over the liabilities of 21 of its UK subsidiaries which will be taking advantage of the audit exemption set out within Section 479A of the Companies Act 2006 for the year ended 31 December 2024. Refer to note 28 of the consolidated financial statements on page 186 for further details. 12 Related party transactions Amounts due from subsidiary undertakings comprise receivables for guarantee fees, which are settled shortly after the end of the year, and balances with other Group companies in the UK resulting from cash pooling arrangements. These balances are non-interest-bearing and repayable on demand. RELX PLC considers the fair value of the above receivables approximates to their carrying value. As these are amounts due from other entities within the Group, RELX PLC has estimated the expected credit losses to be immaterial. Our historical experience of collecting these balances supported by the level of default confirms that the credit risk is low. The following related party balances existed with Group companies at 31 December: 2023 2024 GBPm GBPm Amounts due from subsidiary undertakings 1,513 26 Transactions between RELX PLC and its subsidiaries were made in the normal course of business on normal market terms of trading and were as follows: 2023 2024 GBPm GBPm Dividends received from shares in Group undertakings 1,800 549 Guarantee fee income from subsidiary undertakings 63 70 Information on key management personnel has been given in note 25 of the consolidated financial statements on page 181. All transactions with subsidiaries and the Group’s employees, which are related parties of RELX PLC, are reflected in these financial statements. 13 Related undertakings Refer to note 28 of the Group consolidated financial statements on pages 182 to 186. 196 RELX Annual Report 2024 | Financial statements and other information |
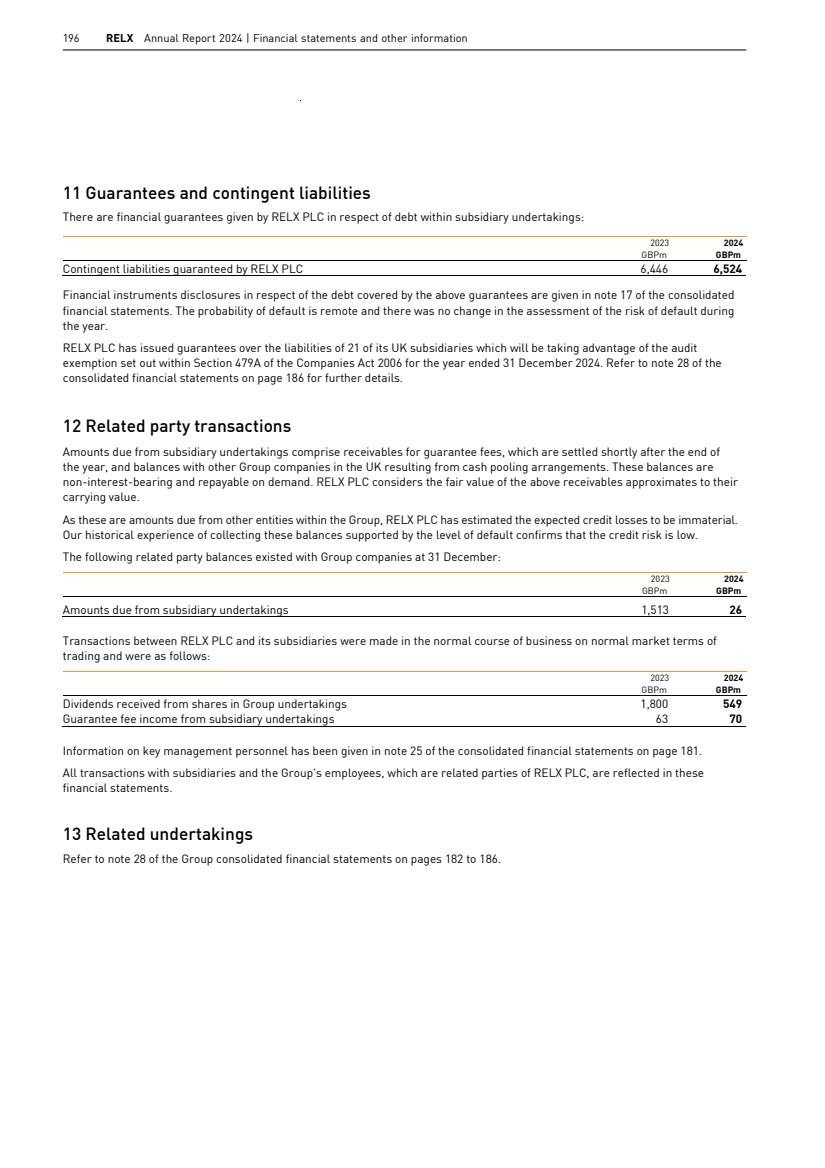
| RELX Annual Report 2024 197 Other financial information In this section 198 Summary consolidated financial information in US dollars 199 Summary consolidated financial information in euros 200 Alternative performance measures Financial review and shareholder information Financial statements Governance Corporate responsibility Overview Market segments |
| 198 RELX Annual Report 2024 | Financial statements and other information Summary consolidated financial information in US dollars Basis of preparation The Group’s consolidated financial information is presented in sterling. The summary financial information is a simple translation of the Group’s consolidated financial statements into US dollars at the stated rates of exchange. It does not represent a restatement under US GAAP which would be different in some significant respects. EXCHANGE RATES FOR TRANSLATION Income statement Statement of financial position 2022 2023 2024 2022 2023 2024 US dollars to sterling 1.24 1.24 1.28 1.21 1.28 1.25 Consolidated income statement FOR THE YEAR ENDED 31 DECEMBER 2022 2023 2024 USDm USDm USDm Revenue 10,606 11,360 12,076 Operating profit 2,881 3,326 3,662 Profit before tax 2,620 2,846 3,273 Net profit attributable to shareholders 2,026 2,208 2,476 EBITDA 3,936 4,395 4,767 Adjusted operating profit 3,327 3,757 4,095 Adjusted profit before tax 3,086 3,368 3,716 Adjusted net profit attributable to shareholders 2,432 2,673 2,868 Adjusted earnings per American Depositary Share (ADS) $1.268 $1.413 $1.537 Basic earnings per ADS $1.056 $1.167 $1.327 Net dividend per ADS paid in the year $0.635 $0.693 $0.768 Net dividend per ADS paid and proposed in relation to the financial year $0.677 $0.729 $0.806 Consolidated statement of cash flows FOR THE YEAR ENDED 31 DECEMBER 2022 2023 2024 USDm USDm USDm Net cash from operating activities 2,977 3,047 3,338 Net cash used in investing activities (1,065) (706) (736) Net cash used in financing activities (1,654) (2,551) (2,643) Increase/(decrease) in cash and cash equivalents 258 (210) (41) Movement in cash and cash equivalents At start of year 153 404 198 Increase/(decrease) in cash and cash equivalents 258 (210) (41) Exchange translation differences (7) 4 (8) At end of year 404 198 149 Adjusted cash flow 3,359 3,673 3,969 Consolidated statement of financial position AS AT 31 DECEMBER 2022 2023 2024 USDm USDm USDm Non-current assets 15,440 15,415 15,171 Current assets 3,713 3,622 3,745 Assets held for sale - 56 - Total assets 19,153 19,093 18,916 Current liabilities 6,276 7,009 7,148 Liabilities associated with assets held for sale - 18 - Non-current liabilities 8,334 7,665 7,389 Total liabilities 14,610 14,692 14,537 Net assets 4,543 4,401 4,379 198 RELX Annual Report 2024 | Financial statements and other information Summary consolidated financial information in US dollars Basis of preparation The Group’s consolidated financial information is presented in sterling. The summary financial information is a simple translation of the Group’s consolidated financial statements into US dollars at the stated rates of exchange. It does not represent a restatement under US GAAP which would be different in some significant respects. EXCHANGE RATES FOR TRANSLATION Income statement Statement of financial position 2022 2023 2024 2022 2023 2024 US dollars to sterling 1.24 1.24 1.28 1.21 1.28 1.25 Consolidated income statement FOR THE YEAR ENDED 31 DECEMBER 2022 2023 2024 USDm USDm USDm Revenue 10,606 11,360 12,076 Operating profit 2,881 3,326 3,662 Profit before tax 2,620 2,846 3,273 Net profit attributable to shareholders 2,026 2,208 2,476 EBITDA 3,936 4,395 4,767 Adjusted operating profit 3,327 3,757 4,095 Adjusted profit before tax 3,086 3,368 3,716 Adjusted net profit attributable to shareholders 2,432 2,673 2,868 Adjusted earnings per American Depositary Share (ADS) $1.268 $1.413 $1.537 Basic earnings per ADS $1.056 $1.167 $1.327 Net dividend per ADS paid in the year $0.635 $0.693 $0.768 Net dividend per ADS paid and proposed in relation to the financial year $0.677 $0.729 $0.806 Consolidated statement of cash flows FOR THE YEAR ENDED 31 DECEMBER 2022 2023 2024 USDm USDm USDm Net cash from operating activities 2,977 3,047 3,338 Net cash used in investing activities (1,065) (706) (736) Net cash used in financing activities (1,654) (2,551) (2,643) Increase/(decrease) in cash and cash equivalents 258 (210) (41) Movement in cash and cash equivalents At start of year 153 404 198 Increase/(decrease) in cash and cash equivalents 258 (210) (41) Exchange translation differences (7) 4 (8) At end of year 404 198 149 Adjusted cash flow 3,359 3,673 3,969 Consolidated statement of financial position AS AT 31 DECEMBER 2022 2023 2024 USDm USDm USDm Non-current assets 15,440 15,415 15,171 Current assets 3,713 3,622 3,745 Assets held for sale - 56 - Total assets 19,153 19,093 18,916 Current liabilities 6,276 7,009 7,148 Liabilities associated with assets held for sale - 18 - Non-current liabilities 8,334 7,665 7,389 Total liabilities 14,610 14,692 14,537 Net assets 4,543 4,401 4,379 198 RELX Annual Report 2024 | Financial statements and other information |
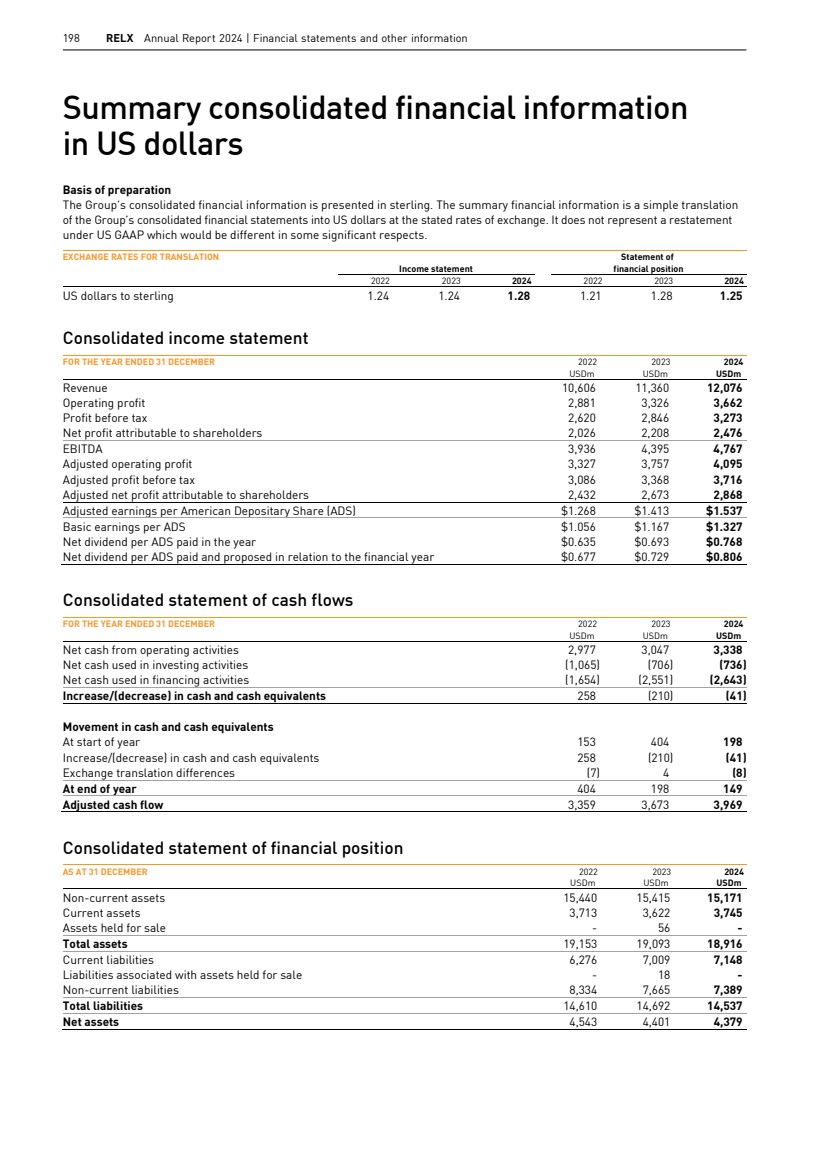
| RELX Annual Report 2024 | Summary consolidated financial information 199 Overview Market segments Corporate responsibility Financial review Governance Financial statements and shareholder information Summary consolidated financial information in euros Basis of preparation The Group’s consolidated financial information is presented in sterling. The summary financial information is a simple translation of the Group’s consolidated financial statements into euros at the stated rates of exchange. EXCHANGE RATES FOR TRANSLATION Income statement Statement of financial position 2022 2023 2024 2022 2023 2024 Euro to sterling 1.17 1.15 1.18 1.13 1.15 1.21 Consolidated income statement FOR THE YEAR ENDED 31 DECEMBER 2022 2023 2024 EURm EURm EURm Revenue 10,007 10,535 11,132 Operating profit 2,718 3,084 3,376 Profit before tax 2,472 2,639 3,017 Net profit attributable to shareholders 1,912 2,048 2,282 EBITDA 3,714 4,076 4,394 Adjusted operating profit 3,139 3,485 3,775 Adjusted profit before tax 2,912 3,123 3,426 Adjusted net profit attributable to shareholders 2,294 2,479 2,644 Adjusted earnings per share €1.196 €1.310 €1.417 Basic earnings per share €0.997 €1.083 €1.223 Net dividend per share paid in the year €0.599 €0.643 €0.708 Net dividend per share paid and proposed in relation to the financial year €0.639 €0.676 €0.743 Consolidated statement of cash flows FOR THE YEAR ENDED 31 DECEMBER 2022 2023 2024 EURm EURm EURm Net cash from operating activities 2,809 2,826 3,077 Net cash used in investing activities (1,005) (654) (679) Net cash used in financing activities (1,561) (2,366) (2,437) Increase/(decrease) in cash and cash equivalents 243 (194) (39) Movement in cash and cash equivalents At start of year 134 377 178 Increase/(decrease) in cash and cash equivalents 243 (194) (39) Exchange translation differences - (5) 5 At end of year 377 178 144 Adjusted cash flow 3,170 3,406 3,659 Consolidated statement of financial position AS AT 31 DECEMBER 2022 2023 2024 EURm EURm EURm Non-current assets 14,419 13,849 14,686 Current assets 3,468 3,255 3,625 Assets held for sale - 51 - Total assets 17,887 17,155 18,311 Current liabilities 5,861 6,297 6,919 Liabilities associated with assets held for sale - 16 - Non-current liabilities 7,783 6,886 7,152 Total liabilities 13,644 13,199 14,071 Net assets 4,243 3,956 4,240 RELX Annual Report 2024 | Summary consolidated financial information 199 Overview Market segments Corporate responsibility Financial review Governance Financial statements and shareholder information Summary consolidated financial information in euros Basis of preparation The Group’s consolidated financial information is presented in sterling. The summary financial information is a simple translation of the Group’s consolidated financial statements into euros at the stated rates of exchange. EXCHANGE RATES FOR TRANSLATION Income statement Statement of financial position 2022 2023 2024 2022 2023 2024 Euro to sterling 1.17 1.15 1.18 1.13 1.15 1.21 Consolidated income statement FOR THE YEAR ENDED 31 DECEMBER 2022 2023 2024 EURm EURm EURm Revenue 10,007 10,535 11,132 Operating profit 2,718 3,084 3,376 Profit before tax 2,472 2,639 3,017 Net profit attributable to shareholders 1,912 2,048 2,282 EBITDA 3,714 4,076 4,394 Adjusted operating profit 3,139 3,485 3,775 Adjusted profit before tax 2,912 3,123 3,426 Adjusted net profit attributable to shareholders 2,294 2,479 2,644 Adjusted earnings per share €1.196 €1.310 €1.417 Basic earnings per share €0.997 €1.083 €1.223 Net dividend per share paid in the year €0.599 €0.643 €0.708 Net dividend per share paid and proposed in relation to the financial year €0.639 €0.676 €0.743 Consolidated statement of cash flows FOR THE YEAR ENDED 31 DECEMBER 2022 2023 2024 EURm EURm EURm Net cash from operating activities 2,809 2,826 3,077 Net cash used in investing activities (1,005) (654) (679) Net cash used in financing activities (1,561) (2,366) (2,437) Increase/(decrease) in cash and cash equivalents 243 (194) (39) Movement in cash and cash equivalents At start of year 134 377 178 Increase/(decrease) in cash and cash equivalents 243 (194) (39) Exchange translation differences - (5) 5 At end of year 377 178 144 Adjusted cash flow 3,170 3,406 3,659 Consolidated statement of financial position AS AT 31 DECEMBER 2022 2023 2024 EURm EURm EURm Non-current assets 14,419 13,849 14,686 Current assets 3,468 3,255 3,625 Assets held for sale - 51 - Total assets 17,887 17,155 18,311 Current liabilities 5,861 6,297 6,919 Liabilities associated with assets held for sale - 16 - Non-current liabilities 7,783 6,886 7,152 Total liabilities 13,644 13,199 14,071 Net assets 4,243 3,956 4,240 and shareholder information Financial statements Governance Market segments Financial review Corporate responsibility Overview RELX Annual Report 2024 | Summary consolidated financial information 199 |
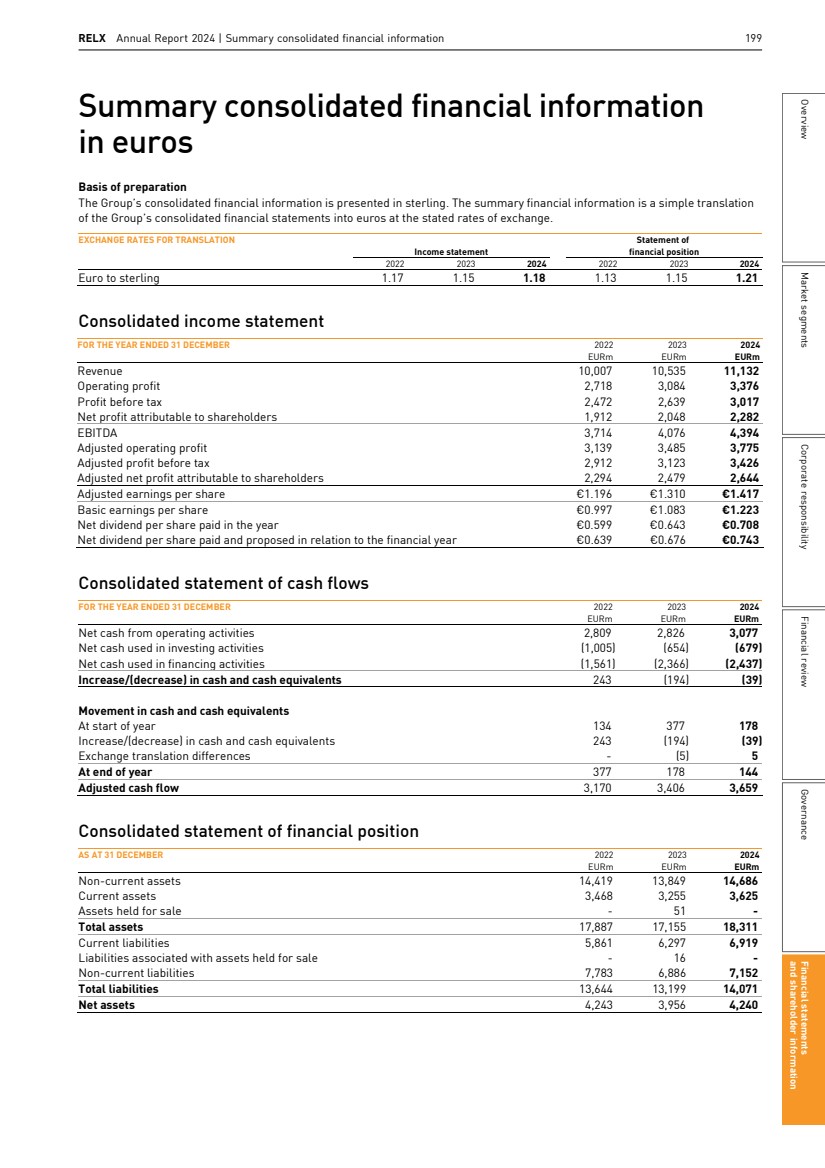
| 200 RELX Annual Report 2024 | Financial statements and other information Alternative performance measures RELX uses a range of alternative performance measures (APMs) in the reporting of financial information, which are not defined by generally accepted accounting principles (GAAP) such as IFRS. These APMs are used by the Board and management as they believe they provide relevant information in assessing the Group’s performance, position and cash flows, enable investors to track more clearly the core operational performance of the Group, and provide a clear basis for assessing RELX’s ability to raise debt and invest in new business opportunities. Management also uses these financial measures, along with IFRS financial measures, in evaluating the operating performance of the Group as a whole and of the individual business areas. These measures should not be considered in isolation from, or as a substitute for, financial information presented in compliance with IFRS. The measures may not be directly comparable to similarly reported measures by other companies. See below for a list of key APMs used by the Group, along with a description of each measure, its purpose, details of the closest equivalent IFRS measure (where applicable) and a reference to where it has been used in the financial statements. APM CLOSEST EQUIVALENT IFRS MEASURE DEFINITION AND RECONCILIATION TO CLOSEST EQUIVALENT IFRS MEASURE PURPOSE ANNUAL REPORT AND ACCOUNTS REFERENCE Income statement Constant currency growth No direct equivalent Constant currency growth measures are calculated using the previous financial year’s full-year average and hedge exchange rates Provides a measure of year-on-year growth excluding the impact of exchange rate movements Financial highlights Chair’s statement CEO report Business overview Market segments Financial review Directors’ remuneration report Underlying growth No direct equivalent Underlying growth rates are calculated at constant currency, excluding the results of acquisitions until 12 months after purchase, and excluding the results of disposals and assets held for sale. Underlying revenue growth rates also exclude exhibition cycling This is a key financial measure as it provides an assessment of year-on-year growth excluding the impact of acquisitions, disposals, exhibition cycling and exchange rate movements Financial highlights Chair’s statement CEO report Business overview Market segments Financial review Directors’ remuneration report 2023 2024 2023 2024 Note GBPm GBPm % % Reported revenue growth 2 608 273 +7% +3% Components of reported revenue growth Underlying revenue growth 635 569 +8% +7% Exhibitions cycling (52) 69 -1% 0% Acquisitions 28 15 0% 0% Disposals (18) (89) 0% -1% Total revenue growth at constant currency 593 564 +7% +6% Currency effect 15 (291) 0% -3% Reported revenue growth 608 273 +7% +3% 200 RELX Annual Report 2024 | Financial statements and other information |
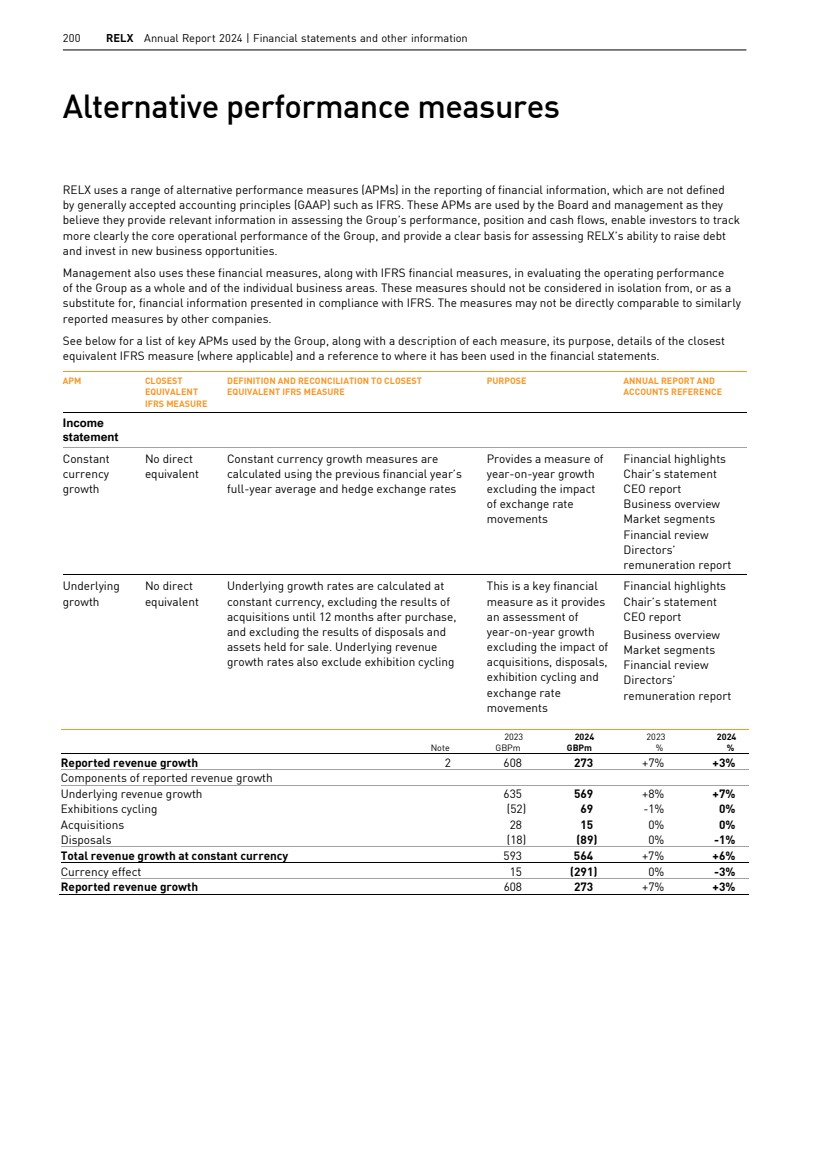
| RELX Annual Report 2024 201 Overview Market segments Corporate responsibility Financial review Governance Financial statements and shareholder information APM CLOSEST EQUIVALENT IFRS MEASURE DEFINITION AND RECONCILIATION TO CLOSEST EQUIVALENT IFRS MEASURE PURPOSE ANNUAL REPORT AND ACCOUNTS REFERENCE Underlying growth (continued) 2023 2024 2023 2024 GBPm GBPm % % Reported adjusted operating profit growth 347 169 +13% +6% Components of adjusted operating profit growth Underlying adjusted operating profit growth 335 287 +13% +10% Acquisitions (8) 2 -1% 0% Disposals (3) (12) 0% -1% Total adjusted operating profit growth at constant currency 324 277 +12% +9% Currency impact 23 (108) +1% -3% Reported adjusted operating profit growth 347 169 +13% +6% Adjusted operating profit Operating profit Operating profit before amortisation of acquired intangible assets, acquisition and disposal related items, and grossed up to exclude the equity share of finance income, finance costs and taxes in joint ventures and associates This is the key financial measure used by management to evaluate performance and allocate resources Financial highlights Chair’s statement CEO report Business overview Market segments Financial review Directors’ remuneration report note 2 2023 2024 Note GBPm GBPm Operating profit 2,3 2,682 2,861 Adjustments: Amortisation of acquired intangible assets 2 280 258 Acquisition and disposal related items¹ 56 69 Reclassification of tax in joint ventures and associates 12 12 Reclassification of net finance income in joint ventures and associates - (1) Adjusted operating profit 3,030 3,199 and shareholder information Financial statements Governance Market segments Financial review Corporate responsibility Overview RELX Annual Report 2024 | Alternative performance measures 201 |
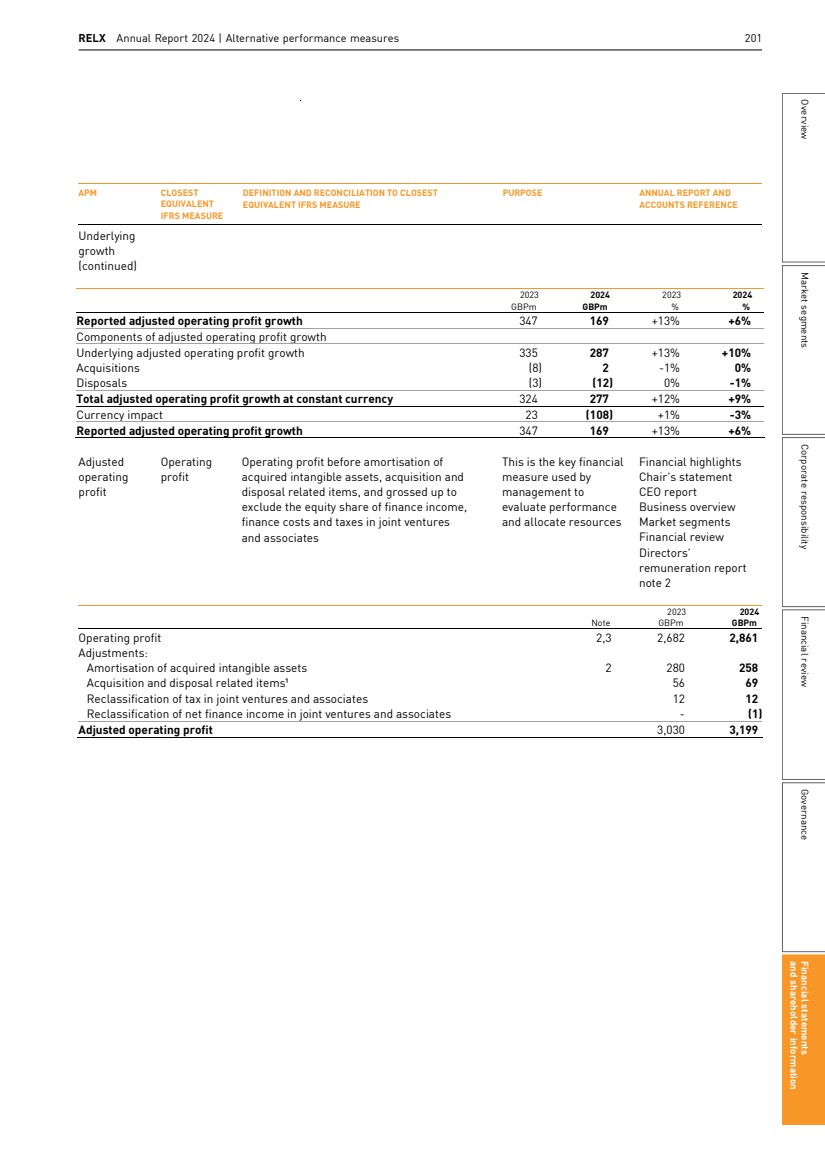
| 202 RELX Annual Report 2024 | Financial statements and other information APM CLOSEST EQUIVALENT IFRS MEASURE DEFINITION AND RECONCILIATION TO CLOSEST EQUIVALENT IFRS MEASURE PURPOSE ANNUAL REPORT AND ACCOUNTS REFERENCE Adjusted operating margin No direct equivalent Calculated as adjusted operating profit divided by revenue As above Financial highlights Business overview Financial review Earnings before interest, tax, depreciation and amortisation (EBITDA) No direct equivalent Calculated as adjusted operating profit before depreciation of property, plant and equipment (PPE) and right-of-use assets and amortisation of internally developed intangible assets, including pre-publication costs Provides a measure of the operating performance of the business that is widely used by relevant stakeholders in evaluating company performance Chair’s statement Financial review 2023 2024 Note GBPm GBPm Adjusted operating profit 2 3,030 3,199 Total depreciation and other amortisation² 2,3 514 525 EBITDA 3,544 3,724 EBITDA Margin No direct equivalent Calculated as EBITDA divided by revenue As above Business overview Financial review Adjusted interest expense Interest expense Reported interest expense, less net interest on the defined benefit pension balance, plus the share of net finance income from joint ventures and associates Provides a measure of the Group’s interest expense for the funding of business operations that is comparable from year to year Financial review 2023 2024 Note GBPm GBPm Interest expense 7 315 298 Pension financing charge 6 (1) (1) Share of net finance income from joint ventures and associates - (1) Adjusted interest expense 314 296 Adjusted profit before tax Profit before tax Profit before tax before amortisation of acquired intangible assets, acquisition and disposal related items, reclassification of taxes in joint ventures and associates, net interest on the net defined benefit pension balance and disposals and other non-operating items Provides a measure used by management to evaluate performance and allocate resources Financial highlights Financial review 2023 2024 Note GBPm GBPm Profit before tax 2,295 2,557 Adjustments: Amortisation of acquired intangible assets 2 280 258 Acquisition and disposal related items¹ 2 56 69 Reclassification of tax in joint ventures and associates 12 12 Net interest on net defined benefit pension balance 6 1 1 Net loss on disposals and other non‑operating items 8 72 6 Adjusted profit before tax 2,716 2,903 202 RELX Annual Report 2024 | Financial statements and other information |
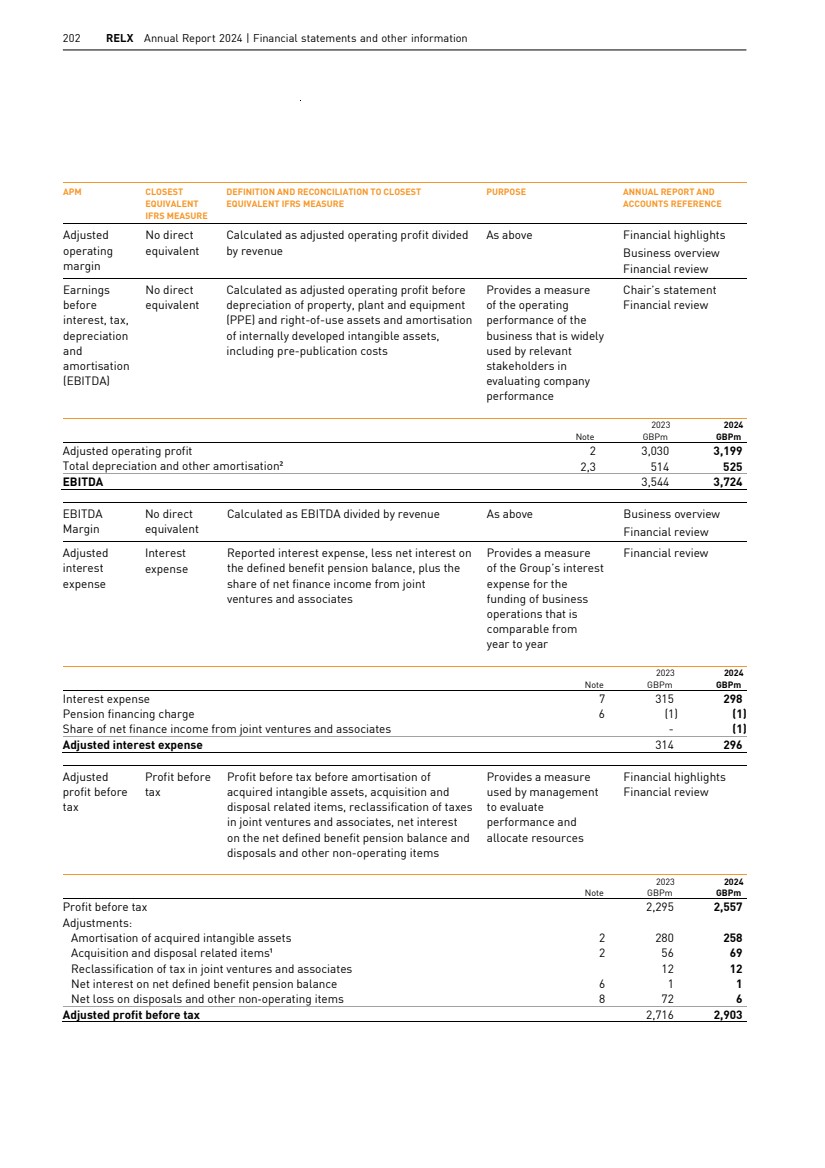
| RELX Annual Report 2024 203 Overview Market segments Corporate responsibility Financial review Governance Financial statements and shareholder information APM CLOSEST EQUIVALENT IFRS MEASURE DEFINITION AND RECONCILIATION TO CLOSEST EQUIVALENT IFRS MEASURE PURPOSE ANNUAL REPORT AND ACCOUNTS REFERENCE Adjusted tax charge Income tax expense Tax expense excluding the deferred tax movements associated with goodwill and acquired intangible assets, tax on other acquisition and disposal related items, reclassification of tax on joint ventures and associates, tax on net interest payments on the net defined benefit pension balance and on disposals and other non-operating items Provides a measure of the Group’s tax expense relating to operating activities Financial review 2023 2024 Note GBPm GBPm Tax charge 9 (507) (613) Adjustments: Deferred tax movements on goodwill and acquired intangible assets³ 32 32 Other deferred tax credits from intangible assets⁴ (61) (56) Tax on acquisition and disposal related items¹ (8) (14) Reclassification of tax in joint ventures and associates (12) (12) Tax on loss on disposals and other non-operating items 3 11 Adjusted tax charge (553) (652) Effective tax rate Income tax rate Income tax expense expressed as a percentage of profit before tax. For a reconciliation between the net tax expense charged on profit before tax and the theoretical amount that would arise using the weighted average of tax rates applicable to accounting profits and losses of the consolidated entities, refer to note 9 Provides a measure of the Group’s tax charge relative to its profit before tax that is comparable from year to year Financial review note 9 Adjusted effective tax rate No direct equivalent Calculated as the adjusted tax charge as a percentage of adjusted profit before tax Provides a measure of the Group’s tax charge relative to its profit before tax that is comparable from year to year Financial review and shareholder information Financial statements Governance Market segments Financial review Corporate responsibility Overview RELX Annual Report 2024 | Alternative performance measures 203 |
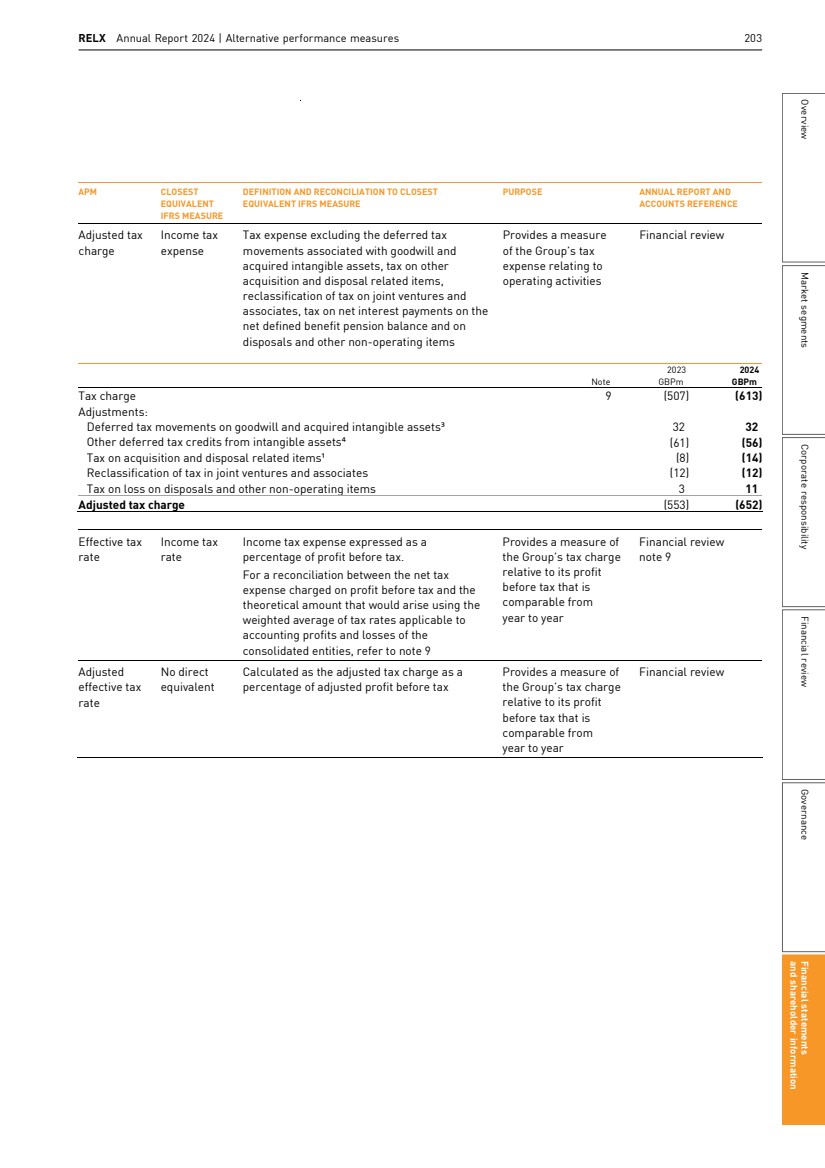
| 204 RELX Annual Report 2024 | Financial statements and other information APM CLOSEST EQUIVALENT IFRS MEASURE DEFINITION AND RECONCILIATION TO CLOSEST EQUIVALENT IFRS MEASURE PURPOSE ANNUAL REPORT AND ACCOUNTS REFERENCE Adjusted net profit attributable to shareholders Net profit attributable to shareholders Net profit attributable to shareholders before amortisation of acquired intangible assets, other deferred tax credits from intangible assets and items treated as exceptional, acquisition and disposal related items, net interest on the net defined benefit pension balance, disposals and other non-operating items Provides a measure of the Group’s profitability after tax attributable to shareholders Financial highlights Financial review 2023 2024 GBPm GBPm Net profit attributable to shareholders 1,781 1,934 Adjustments (post-tax): Amortisation of acquired intangible assets 312 290 Other deferred tax credits from intangible assets⁴ (61) (56) Acquisition and disposal related items¹ 48 55 Net interest on net defined benefit pension balance 1 1 Loss on disposals and other non-operating items 75 17 Adjusted net profit attributable to shareholders 2,156 2,241 Adjusted earnings per share Earnings per share Adjusted net profit attributable to shareholders divided by the weighted average number of shares Provides a measure of the Group’s earnings per share that is comparable from year to year Financial highlights Chair’s statement CEO report Business overview Financial review Note 2023 2024 Adjusted net profit attributable to shareholders (GBPm) 2,156 2,241 Weighted average number of shares (m) 10 1,891.8 1,865.9 Adjusted earnings per share (p) 114.0 120.1 204 RELX Annual Report 2024 | Financial statements and other information |
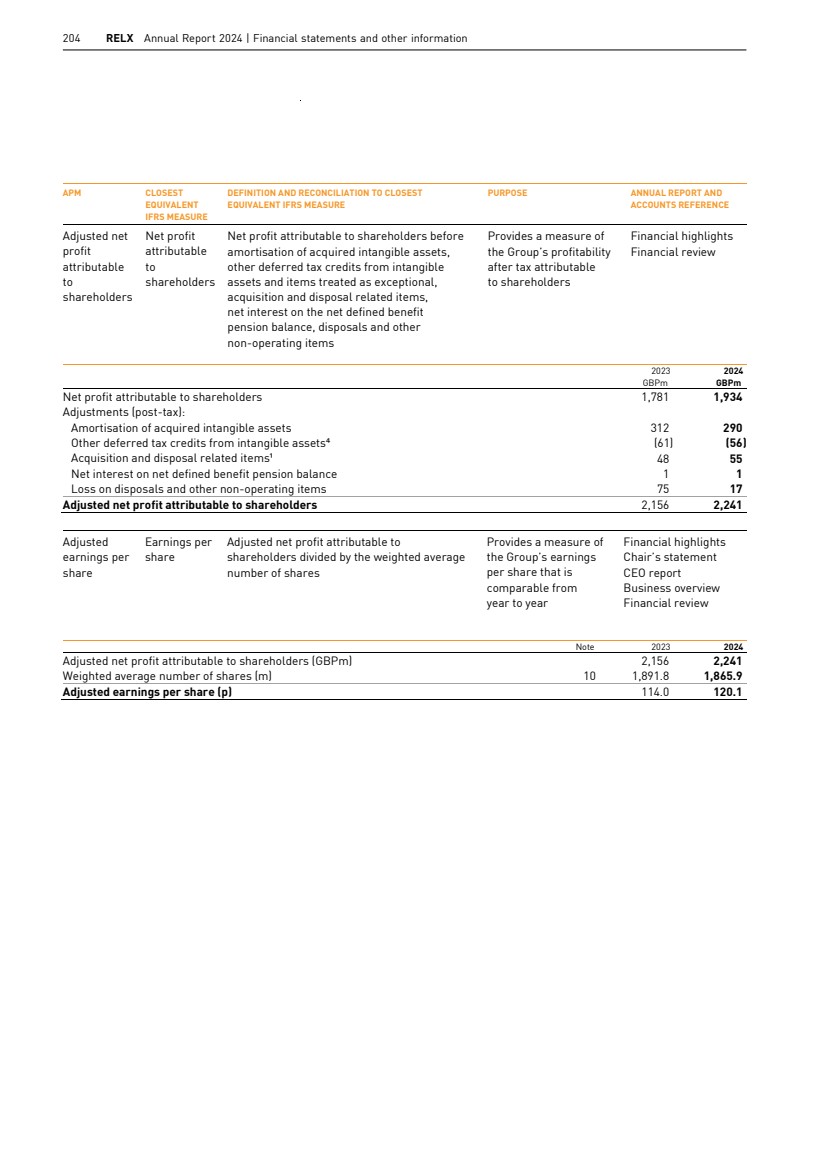
| RELX Annual Report 2024 205 Overview Market segments Corporate responsibility Financial review Governance Financial statements and shareholder information APM CLOSEST EQUIVALENT IFRS MEASURE DEFINITION AND RECONCILIATION TO CLOSEST EQUIVALENT IFRS MEASURE PURPOSE FINANCIAL STATEMENT REFERENCE Cash flow statement Adjusted cash flow Cash generated from operations Cash generated from operations plus dividends from joint ventures and associates less net capital expenditure on property, plant and equipment (PPE) and internally developed intangible assets, repayment of lease principal and sublease payments received and excluding pension deficit payments and payments in relation to acquisition and disposal related items. Exceptional cash costs in the Exhibitions business have also been excluded Provides a measure of the Group’s operating cash flow that is comparable from year to year Financial highlights Financial review 2023 2024 Note GBPm GBPm Cash generated from operations 11 3,370 3,521 Adjustments: Dividends received from joint ventures and associates 15 21 37 Purchases of PPE 16 (30) (20) Proceeds from disposals of PPE 7 - Expenditure on internally developed intangible assets (447) (464) Payments in relation to acquisition and disposal related items 56 62 Pension recovery payment 50 26 Repayment of lease principal (72) (63) Sublease payments received 2 2 Exceptional costs in Exhibitions 5 - Adjusted cash flow 2,962 3,101 Adjusted cash flow conversion No direct equivalent Adjusted cash flow divided by adjusted operating profit Provides a measure of turning operating profit into cash Financial highlights Business overview Financial review 2023 2024 Note GBPm GBPm Adjusted cash flow 2,962 3,101 Adjusted operating profit 2 3,030 3,199 Adjusted cash flow conversion 98% 97% Free cash flow Cash inflow from operating activities Adjusted cash flow less net interest paid, cash tax paid, acquisition and disposal related payments and exceptional costs paid in relation to the Exhibitions business Provides a measure of cash flows that could be used for organic investment in the business, acquisitions and disposals, distribution of dividends, share buybacks or the repayment of debt Financial review note 17 2023 2024 Note GBPm GBPm Adjusted cash flow 2,962 3,101 Interest paid (net) (294) (251) Cash tax paid⁵ 9 (619) (662) Exceptional costs in Exhibitions (5) - Acquisition and disposal related items¹ (56) (62) Free cash flow 1,988 2,126 and shareholder information Financial statements Governance Market segments Financial review Corporate responsibility Overview RELX Annual Report 2024 | Alternative performance measures 205 |
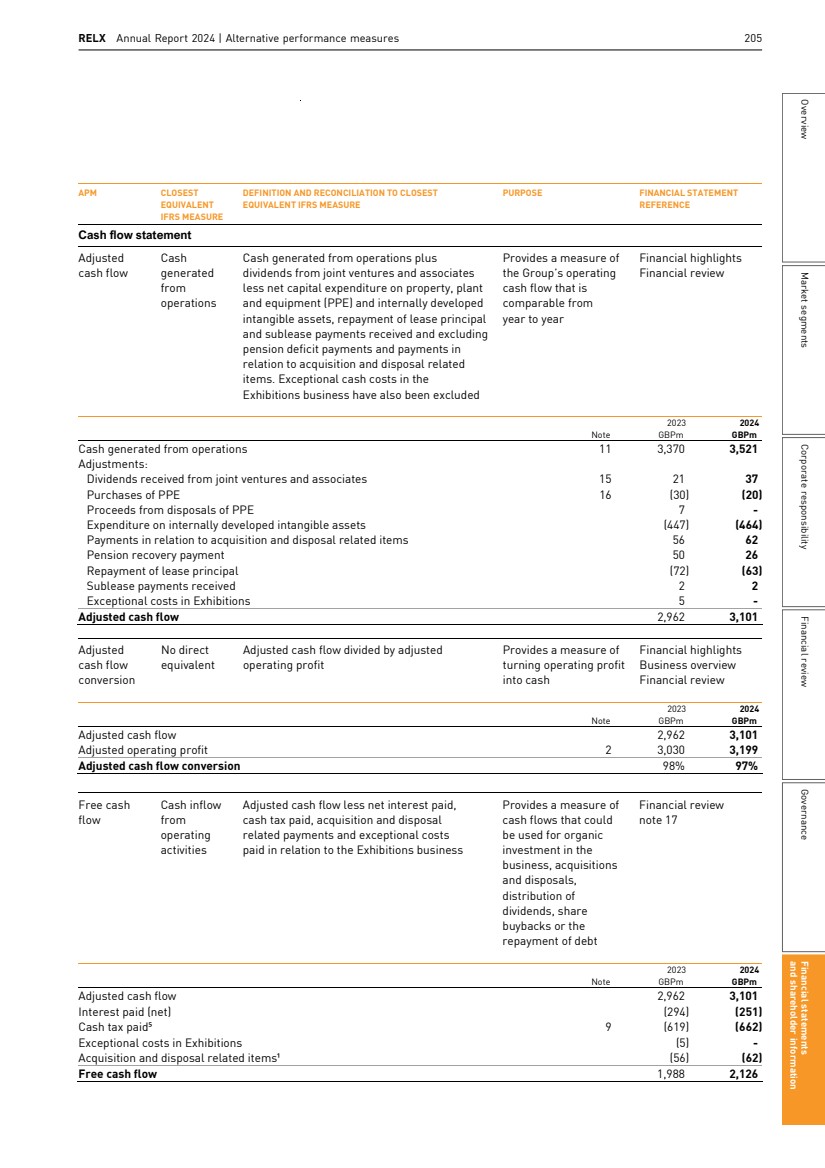
| 206 RELX Annual Report 2024 | Financial statements and other information APM CLOSEST EQUIVALENT IFRS MEASURE DEFINITION AND RECONCILIATION TO CLOSEST EQUIVALENT IFRS MEASURE PURPOSE FINANCIAL STATEMENT REFERENCE Net capital employed No direct equivalent Net goodwill and acquired intangible assets, net internally developed intangible assets, net property, plant and equipment, right-of-use assets and investments less net pension balances and working capital Provides a measure of the capital used in operations Financial review 2023 2024 Note GBPm GBPm Goodwill and acquired intangible assets⁶ 9,784 9,811 Internally developed intangible assets⁶ 14 1,477 1,569 Property, plant and equipment⁶, right-of-use assets⁶ and investments 487 432 Net pension balances 6 (63) 21 Working capital (1,296) (1,262) Net capital employed 10,389 10,571 Invested capital No direct equivalent Net capital employed, adjusted to add back accumulated amortisation and impairment of acquired intangible assets and goodwill, to remove non-operating investments and the gross up to goodwill in respect of deferred tax, and other items Used to calculate the return on invested capital (see below) Financial review Directors’ report 2023 2024 Note GBPm GBPm Net capital employed 10,389 10,571 Accumulated amortisation and impairment of acquired intangible assets and goodwill 7,885 7,985 Non-operating investments 15 (97) (88) Deferred tax on goodwill and other (1,336) (1,371) Invested capital 16,841 17,097 Return on invested capital (ROIC) No direct equivalent Post tax adjusted operating profit expressed as a percentage of average invested capital This is a key financial measure used by management that demonstrates the efficiency of the use of capital Financial highlights Business overview Financial review Note 2023 2024 Adjusted operating profit (GBPm) 2 3,030 3,199 Tax at adjusted effective rate (GBPm) (618) (720) Adjusted effective tax rate 20.4% 22.5% Adjusted operating profit after tax (GBPm) 2,412 2,479 Average invested capital (GBPm)⁷ 17,184 16,743 ROIC 14.0% 14.8% Capital expenditure No direct equivalent Additions to property, plant and equipment and internally developed intangible assets Provides a measure of the amounts invested in new products and related infrastructure across the business Chair’s statement Financial review Directors’ report Governance note 2 2023 2024 Note GBPm GBPm Additions to property, plant and equipment 16 30 20 Additions to internally developed intangible assets 14 447 464 Capital expenditure 477 484 206 RELX Annual Report 2024 | Financial statements and other information |
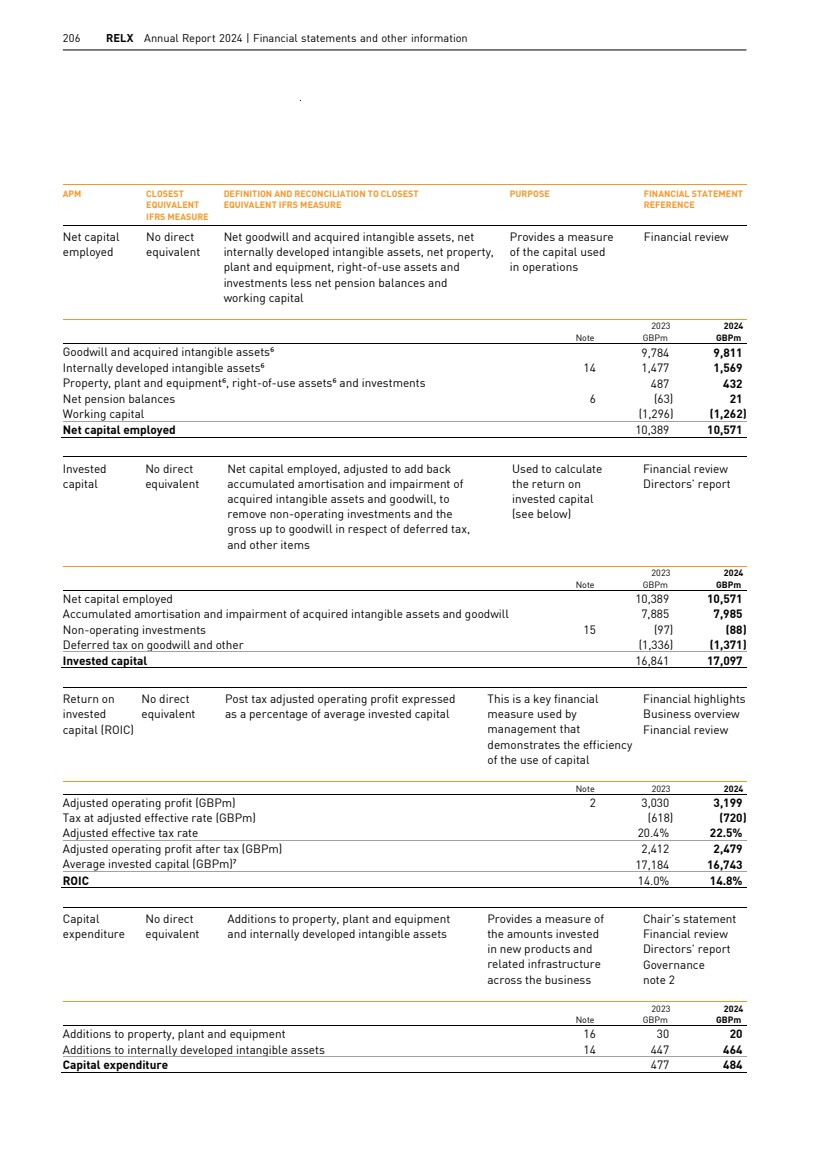
| RELX Annual Report 2024 207 Overview Market segments Corporate responsibility Financial review Governance Financial statements and shareholder information APM CLOSEST EQUIVALENT IFRS MEASURE DEFINITION AND RECONCILIATION TO CLOSEST EQUIVALENT IFRS MEASURE PURPOSE FINANCIAL STATEMENT REFERENCE Statement of financial position Net debt / net debt for leverage ratio No direct equivalent Net debt: debt less cash and cash equivalents, related derivative financial instruments and finance lease receivables Provides a measure of the Group’s level of indebtedness Financial highlights Chair’s statement Financial review Governance Directors’ report note 17 2023 2024 Note GBPm GBPm Debt 11,21 6,497 6,544 Cash and cash equivalents 11 (155) (119) Related derivative financial instruments 11 108 140 Finance lease receivables 11 (4) (2) Net debt 11 6,446 6,563 Net pension balance 6 182 165 Net debt for leverage ratio 6,628 6,728 Leverage ratios No direct equivalent For details of the closest equivalent IFRS measures to net debt and EBITDA, see above. For the purpose of calculating leverage ratios, share of results in joint ventures and associates, the equity share of finance income, finance costs, taxes and amortisation in joint ventures and associates, and acquisition and disposal related items are deducted from EBITDA Provides a measure of the financial leverage of the Group Chair’s statement Financial review Governance 2023 2024 2023 2024 Note GBPm GBPm USDm⁸ USDm⁸ EBITDA 3,544 3,724 4,395 4,767 Less joint venture and associates adjusted operating profit (59) (54) (73) (69) Acquisition and disposal related items 2 (56) (69) (69) (88) EBITDA for leverage ratio 3,429 3,601 4,253 4,610 Net debt for leverage ratio 6,628 6,728 8,484 8,410 EBITDA for leverage ratio 3,429 3,601 4,253 4,610 Leverage ratio 2.0x 1.8x Notes to the alternative performance measures tables (1) In 2024, restructuring costs were incurred due to the disposal of some of our assets. These costs are included within acquisition and disposal related items and are excluded from adjusted operating profit. In the prior year there were no such costs. (2) Excludes amortisation of acquired intangibles. (3) The adjusted tax charge excludes the movements in deferred tax assets and liabilities related to goodwill and acquired intangible assets, but includes the benefit of tax amortisation where available on acquired goodwill and intangible assets. (4) Movements on deferred tax liabilities arising on acquired intangible assets that do not qualify for tax amortisation. (5) Net of cash tax relief on acquisition-related items and including cash tax impact of disposals. (6) Net of accumulated depreciation and amortisation. (7) Average of invested capital at the beginning and the end of the year, retranslated at average exchange rates for the year. Invested capital is calculated as net capital employed, adjusted to add back accumulated amortisation and impairment of acquired intangible assets and goodwill and to exclude the gross up to goodwill in respect of deferred tax, and to add back exceptional restructuring costs. (8) EBITDA and net debt have been translated from sterling to US dollars using, respectively, average and year end exchange rates, as shown on page 181. and shareholder information Financial statements Governance Market segments Financial review Corporate responsibility Overview RELX Annual Report 2024 | Alternative performance measures 207 |
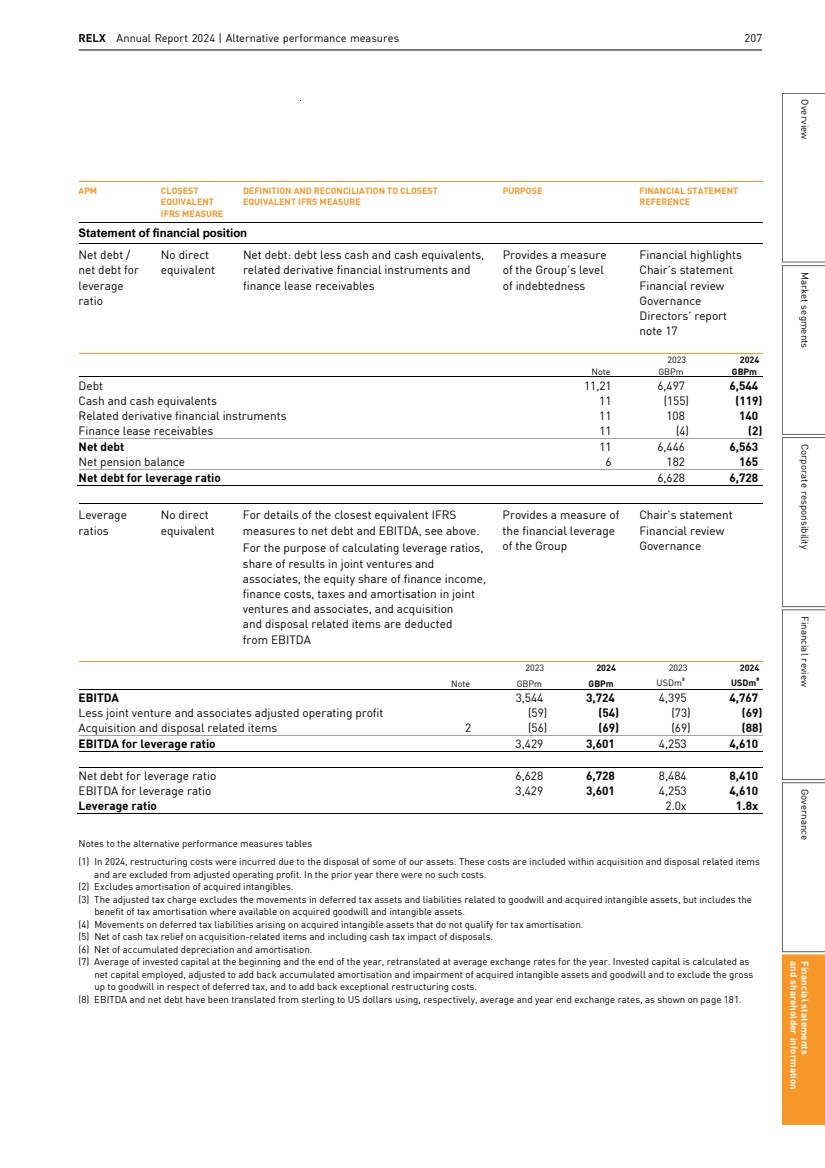
| 208 RELX Annual Report 2024 Sustainability Statement and other Corporate Responsibility Disclosures In this section 209 Sustainability statement 236 Taskforce on climate-related financial disclosure 242 Sustainability accounting standards board 243 Global reporting initiative |
| 209 Sustainability Statement General Disclosures (ESRS 2) Contents Page number General information ESRS 2 General disclosures 210 Environmental information ESRS E1 Climate change 219 ESRS E2 Pollution Not material ESRS E3 Water and marine resources Not material ESRS E4 Biodiversity and ecosystems Not material ESRS E5 Resource use and circular economy Not material Disclosures pursuant to Article 8 of Regulation 2020/852 (Taxonomy disclosures) 222 Social information ESRS S1 Own workforce 224 ESRS S2 Workers in the value chain 227 ESRS S3 Affected communities Not material ESRS S4 Consumers and end-users 228 Governance information ESRS G1 Business conduct 230 General information Disclosures stemming from other legislation or sustainability reporting ESRS Reference Datapoint Page number ESRS 2 GOV-1 Board’s gender diversity paragraph 21 (d) 213 ESRS 2 GOV-1 Percentage of board members who are independent paragraph 21 (e) 212 ESRS 2 GOV-4 Statement on due diligence paragraph 30 218 ESRS 2 SBM-1 Involvement in activities related to fossil fuel activities paragraph 40 (d) i Not material ESRS 2 SBM-1 Involvement in activities related to chemical production paragraph 40 (d) ii Not material ESRS 2 SBM-1 Involvement in activities related to controversial weapons paragraph 40 (d) iii Not material ESRS 2 SBM-1 Involvement in activities related to cultivation and production of tobacco paragraph 40 (d) iv Not material ESRS E1-1 Transition plan to reach climate neutrality by 2050 paragraph 14 220 ESRS E1 Undertakings excluded from Paris-aligned benchmarks Not material ESRS E1-4 GHG emission reduction targets paragraph 34 217 ESRS E1-5 Energy consumption from fossil sources disaggregated by sources (only high climate impact sectors) paragraph 38 Not material ESRS E1-5 Energy consumption and mix paragraph 37 220 ESRS E1-5 Energy intensity associated with activities in high climate impact sectors paragraphs 40 to 43 Not material ESRS E1-6 Gross Scope 1, 2, 3 and Total GHG emissions paragraph 44 221 ESRS E1-6 Gross GHG emissions intensity paragraphs 53 to 55 221 ESRS E1-7 GHG removals and carbon credits paragraph 56 Not material ESRS E1-9 Exposure of the benchmark portfolio to climate-related physical risks paragraph 66 Not material ESRS E1-9 Disaggregation of monetary amounts by acute and chronic physical risk paragraph 66 (a) Location of significant assets at material physical risk paragraph 66 (c). Not material ESRS E1-9 Degree of exposure of the portfolio to climate-related opportunities paragraph 69 Not material ESRS S1-1 Human rights policy commitments paragraph 20 217, 224 ESRS S1-1 Due diligence policies on issues addressed by the fundamental International Labor Organisation Conventions 1 to 8, paragraph 21 217-218, 224 ESRS S1-1 S1-1 processes and measures for preventing trafficking in human beings paragraph 22 224 ESRS S1-1 S1-1 workplace accident prevention policy or management system paragraph 23 224 ESRS S1-3 S1-3 grievance/complaints handling mechanisms paragraph 32 (c) 225 ESRS S1-14 Number of fatalities and number and rate of work-related accidents paragraph 88 (b) and (c) Not material ESRS S1-14 Number of days lost to injuries, accidents, fatalities or illness paragraph 88 (e) Not material ESRS S1-16 Unadjusted gender pay gap paragraph 97 (a) Not material ESRS S1-16 CEO pay ratio paragraph 97 (b) Not material ESRS S1-17 Incidents of discrimination paragraph 103 (a) Not material ESRS S1-17 Non- respect of UNGPs on Business and Human Rights and OECD paragraph 104 (a) 226 ESRS 2- SBM3 Significant risk of child labour or forced labour in the value chain paragraph 11 (b) 227 ESRS S2-1 Human rights policy commitments paragraph 17 227 ESRS S2-1 Policies related to value chain workers paragraph 18 227 ESRS S2 Rights principles and OECD guidelines benchmarks 227 ESRS S2-1 Due diligence policies on issues addressed by the fundamental International Labor Organisation Conventions 1 to 8, paragraph 19 227 ESRS S2-4 Human rights issues and incidents connected to its upstream and downstream value chain paragraph 36 227 ESRS S4-1 Policies related to consumers and end-users paragraph 16 228 ESRS S4-1 Non-respect of UNGPs on Business and Human Rights and OECD guidelines paragraph 17 228-229 ESRS S4-4 Human rights issues and incidents paragraph 35 228-229 ESRS G1 United Nations Convention against Corruption paragraph 10 (b) 230-231 ESRS G1-1 Protection of whistle- blowers paragraph 10 (d) 230-231 ESRS G1-4 Fines for violation of anti-corruption and anti-bribery laws paragraph 24 (a) 231 ESRS G1-4 Standards of anti-corruption and anti- bribery paragraph 24 (b) 230-231 Market segments Governance and shareholder information Financial statements Financial review Corporate responsibility Overview RELX Annual Report 2024 | Sustainability Statement and other Corporate Responsibility Disclosures |
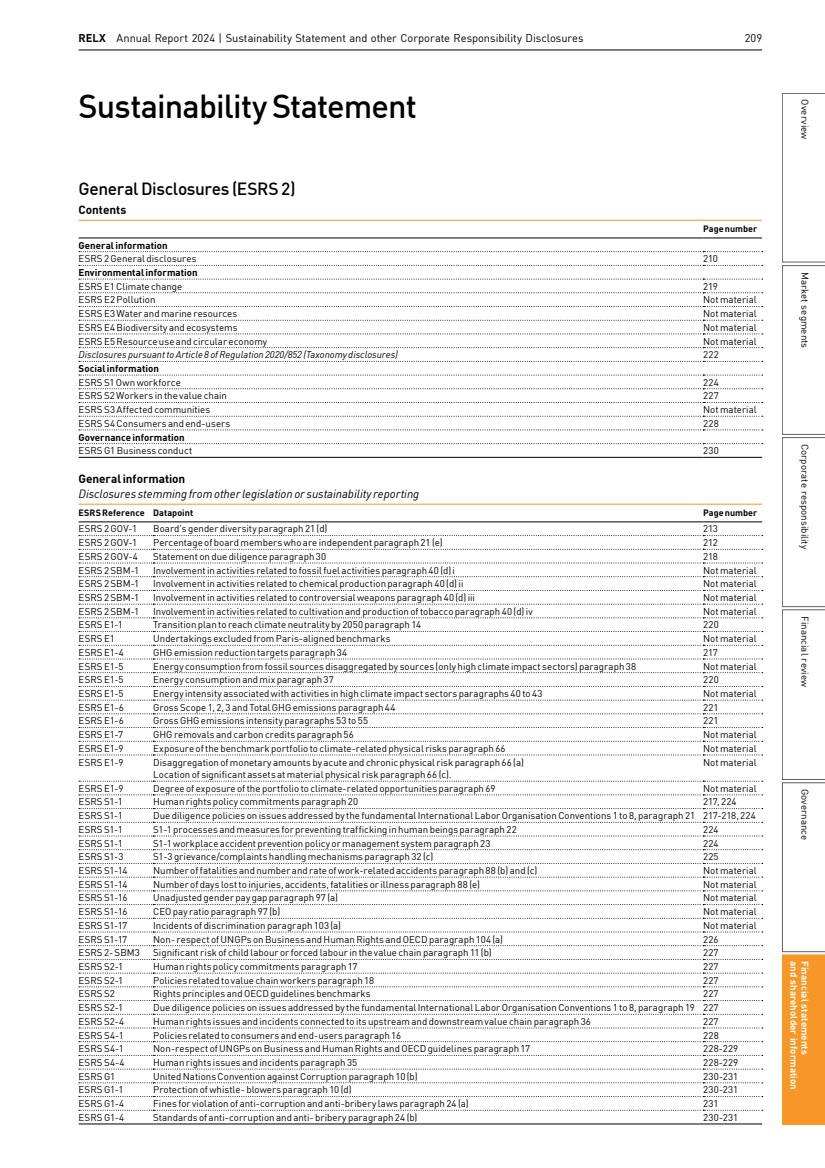
| 210 RELX Annual Report 2024 | Financial statements and shareholder information Basis of preparation General basis for preparation (BP 1, BP 2) This Sustainability Statement (the Sustainability Statement) has been prepared pursuant to the European Union Corporate Sustainability Reporting Directive (CSRD) and in accordance with the requirements of the European Sustainability Reporting Standards (ESRS) and EU Taxonomy disclosure requirements adopted by the European Commission. While RELX has comprehensively reported on its sustainability activities for over ten years,this is the first year of reporting pursuant to these new requirements. As is often the case with new regulations, it is possible reporting will evolve as additional implementation guidance becomes available in subsequent years. As year-over-year comparative information becomes available trends presented may be more useful to users of the Sustainability Statement. The Sustainability Statement has been prepared on a consolidated basis covering global operations, on the same basis as theGroup financial statements. It covers theGroup’s activities and its upstream and downstream value chain. The upstream value chain includes direct suppliers and the downstream value chain includes our direct customers. No data requirements have been omitted using the option to omit a specific piece ofinformation corresponding to intellectual property, know-how or the result of innovation. Short, medium and long-term time horizons are defined in line withESRSstipulations i.e. one year or less, one to five years, and over five years, respectively. In some instances, itis not possible to collect primary data from all areas of the value chain for Scope 3 carbon emissions. Where suppliers are able to provide actual emissions data, this is used in our Scope 3 reporting. Where accurate data cannot be collected, we use GHG Protocol compliant methodologies using sector average factors to calculate the emissions. Further details are available in the Reporting Guidelines and Methodology on www.relx.com. The Corporate Responsibility Report (pages 34-65) contains information on key non-financial metrics including environment, people, community and supply chain. Within this Sustainability Statement we have incorporated by reference to other parts of theAnnual Report where possible. Please see the table on page 232 for a list of the data requirements that are incorporated by reference and their locations. Strategy, business model and value chain (SBM 1) For more detailed information on our strategy and business model please see page 5. RELX operates in four major market segments. According to the ESRSsector classification guidance, ourRisk andExhibitions (RX) business areas are categorised as Professional and CommercialServices and ourScientific, Technical and Medical (STM) and Legal business areas are categorised as Media and Communications. Revenue by business segment can be found in Note 2 of the Financial Statements on page 147. Risk provides customers with information-based analytics and decision tools that combine public and industry-specific content with advanced technology and algorithms to assist them in evaluating and predicting risk and enhancing operational efficiency.Risk products and services align withSDG16 (Peace, Justice andStrong Institutions) andSDG10 (Reduced Inequalities), among others. STM helps researchers and healthcare professionals advance science and improve health outcomes by combining high-quality scientific and medicalinformation and trusted data sets with leading technology to deliver analytical tools that facilitate insights and critical decision-making. Elsevier makes a significant contribution to SDG3 (GoodHealth and Well-Being), SDG5 (GenderEquality),SDG10 (Reduced Inequalities) andSDG 13 (Climate Action). Legal helps its customers improve decision-making, achieve better outcomes and increase productivity by providing tools that combine legal, regulatory and business information with powerful analytics. LegalpromotesSDG16(Peace, JusticeandStrongInstitutions). Exhibitions combines industry expertise with data and digital tools to help customers connect face-to-face and digitally, learn about markets, source products and complete transactions. RX helps advance SDG9 (Industry Innovation and Infrastructure),SDG10 (Reduced Inequalities), SDG12 (ResponsibleConsumption and Production) andSDG17 (Partnerships for theGoals). In addition, RX supports SDG 13 (Climate Action) through its Net Zero Events commitments and by using its event platforms to drive industry engagement in a net zero carbon future. RELXhas offices in38 countries and 36,400 employees.For details on employee headcount by geographical area see page 151. Upstream, RELX has a diverse supply chain with suppliers located in over 150 countries. These suppliers are spread across multiple categories including technology (e.g. software, cloud, hardware, and telecom), indirect (e.g. consulting, marketing, contingent labour and travel), and direct (e.g. data/content and production services, print/paper/bind, distribution). Downstream, RELX serves professional and business customers in theRisk,Scientific, Technical & Medical, Legal andExhibitions sectors. |
| 211 Sustainability related goals We set CR related objectives and monitor progress against them, performance in these areas is highlighted in the Corporate ResponsibilityReport(see pages 34-65).Below is a summary of our 2024CRobjectives. Unique Contributions Universal, sustainable access to information Increase the number of unique users oftheRELXSDGResource Centre by 15% over 2023 Protection of society Complete four new financialinclusion pilots in low-income countries, working to provide lenders with improved risk information from alternative data to benefit more people, in support ofSDG10 (Reduced Inequalities) Advance of science and health Advance inclusive research and health by engaging key partners and convening changemakers to advance health equity, in support of SDG 3 (Good Health and Wellbeing); SDG 10 (Reduced Inequalities) andSDG13 (ClimateAction) Promotion of the rule of law and access to justice Support dissemination oftheUnited NationsGlobalCompact’s Transformational Governance Corporate Toolkit, including by engaging customers, in support of SDG 16 (Peace, Justice and Strong Institutions) Fostering communities Launch carbon reduction action plan in support of RX Pathway to Net Zero Roadmap and introduce exhibitor education on sustainable stands, in support of SDG 13 (Climate Action) CR Governance Security – Continued enhancement of our technical resilience posture across the business and expansion of applications and products covered by independent third-party assessments, aligned withSDG16 (Peace, Justice andStrong Institutions) Privacy – Enhance processes for conducting privacy and data protection impact assessments, aligned with SDG 16 (Peace, Justice andStrong Institutions) Responsible tax –Continue to advanceAfrican tax lawcodification pilots, aligned withSDG16 (Peace, Justice andStrong Institutions) Customers Customer engagement – Create internal Sustainability Hub to support customer enquiries and engagement, aligned with SDG 17 (Partnership for the Goals) Quality –UpdateRELXResponsibleAIPrinciples to keep pace with evolving technology, aligned withSDG8 (Decent Work and Economic Growth) Accessibility – Develop accessibility specialist career track for RELX employees, aligned withSDG10 (Reduced Inequalities) People Inclusion – Continue to engage colleagues globally through our Inspiring Inclusion programme, aligned withSDG10 (Reduced Inequalities) Pay equity – Continue to assess pay competitiveness and pay equity, aligned with SDG8 (Decent Work andEconomicGrowth) Well-being – Expand World Well-being Week activities across RELX through enhanced programming with greater reach, in support of SDG3 (GoodHealth and Well-Being) Community Employee community engagement – Increase internal and external information about our global community activities, in support of SDG 17 (Partnerships For The Goals) Philanthropic giving – Strengthen our cross-business philanthropic response to disasters and emergencies, in support of SDG 17 (Partnerships For The Goals) Supply chain Responsible Supply Chain – Increase number of suppliers that are Code signatories; continue using audits to ensure continuous improvement in supplier performance and compliance, in support ofSDG8 (Decent Work andEconomicGrowth) Supplier Diversity –AdvanceSupplier Inclusion andDiversity programme, in support of SDG10 (Reduced Inequalities) Environment Environmental responsibility – Implement new SBTi environmental targets, in support of SDG 12 (Responsible Consumption and Production) Carbon reduction – Publish RELX net zero transition plan, in support of SDG 13 (Climate Action) Mapping the value chain Procure Produce Distribute Use Post-use Electronic Face-to-face Print § Data/content § Materials/ Services § Audit and monitoring § Digital development § Print § Production § Digital networks § Logistics § Sales § Professional customers § Government § Other § Further innovation and research § New customer relationships Market segments Governance and shareholder information Financial statements Financial review Corporate responsibility Overview RELX Annual Report 2024 | Sustainability statement and other corporate responsibility disclosures |
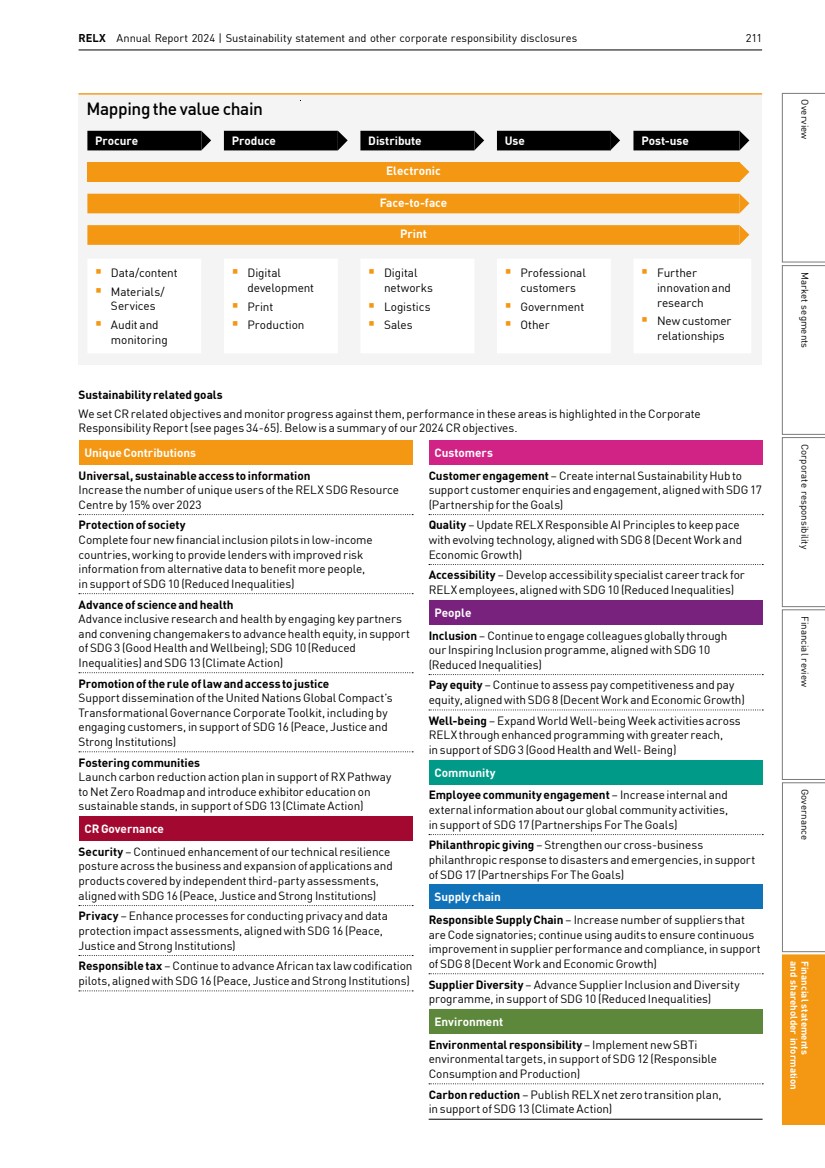
| 212 RELX Annual Report 2024 | Financial statements and shareholder information Governance (GOV 1, 2, 3, 5) RELX has a robust governance structure described in the GovernanceReport on pages 87-88. TheBoard is comprised of ten members, 80% of which are independent or, in the case ofthe Chair, were considered independent upon appointment under the UKCorporateGovernanceCode. TheBoard has four committees that oversee the operation of the company: Audit, Remuneration, Nominations andCorporateGovernance. TheBoard and its Committees are subject to an annual review of effectiveness and performance. Areview by an external independent party is carried out every three years. The consultancy carrying out the external review has no other connections with RELX and is given full access to theBoard andCommittee papers for the relevant period. TheCEOhas responsibility to theBoard for corporate responsibility (CR) matters. The CEO and senior management, as well as the RELX CR Forum, chaired by the Director of RELX Corporate Affairs and involving individuals representing key functions and business areas, set and monitor CR performance. This includes our annual and longer term CR objectives, which reflectthe views of a range ofinternal and external stakeholders. More information can be found on www.relx.com/ additional-cr-resources. TheGlobal Head of Corporate Responsibility provides formal updates to theBoard and engages on key issues with senior managers, who have CR-related Key Performance Objectives. Adedicated CR team with expertise in a wide range of sustainability matters serves as a resource within the company. They draw on internal expertise and external resources such as the United Nations Global Compact to which RELX has been a signatory since 2003, the CR and Sustainability Council oftheConferenceBoard,AldersgateGroup on environmental matters, and the Responsible Media Forum, of whichRELX is a foundingmember. TheBoard receives updates from relevant stakeholders on material impacts, risks and opportunities (IROs) during the year including updates on leadership talent reviews from the Chief Human Resources Officer and cybersecurity risks from theRELXHead of InformationAssurance andDataProtection andChief Technology Officers from the business areas. More information about Board activities in the year can be found on pages 91 and 92. In addition to theCRForum, IROs aremonitored through Environmental Checkpoint meetings on environmental targets chaired by theChief FinancialOfficer (CFO);theRELX Inclusion Council for progress on inclusion goals, and through banks which agreed certainCorporateResponsibilityKPIs as part ofthe Company’sRevolvingCredit Facility. Sustainability objectives which reflect our focus on our unique contributions to society, as well as our other sustainability objectives align to the United Nations Sustainable Development Goals (SDGs) in order to do our part to advance this ambitious global agenda by 2030. The annual incentive programme provides focus on the delivery of annual financialtargets and the achievement of annual objectives and milestones which align with the RELX strategy and create a platform for sustainable future performance. The compulsory deferral of 50% of any annual incentive earned into RELX shares for three years, along with the three year cycle of the long-term incentive plan, promotes longer term alignment of ExecutiveDirectors’ interests with shareholders’ interests. For details on sustainability-related performance metrics in remuneration, see page 106. Other controls related to the management of impacts, risks and opportunities include internal and external assurance processes, and certifications, such as ISO27001 for cybersecurity and ISO140001 covering theRELXEnvironmental Management System. IROs follow the risk review process and are reviewed by theBoard. MaterialIROs were reviewed by the SeniorCSRDSteering Committee which includes theCFO,theChief LegalOfficer,the ChiefStrategyOfficer and theChiefHROfficer. TheGlobalHead ofCorporate Responsibility reported outcomes of the Double MaterialityAssessmentto theBoard, updating them on the IROs listed in the table on page 216. The Senior Executive management team and theBoard consider these IROs as part of ongoing strategy reviews. Our CR governance framework Board CEO Business area CEOs CR Forum Global Head of Corporate Responsibility and CR Team Compliance Committees RELX CR networks |
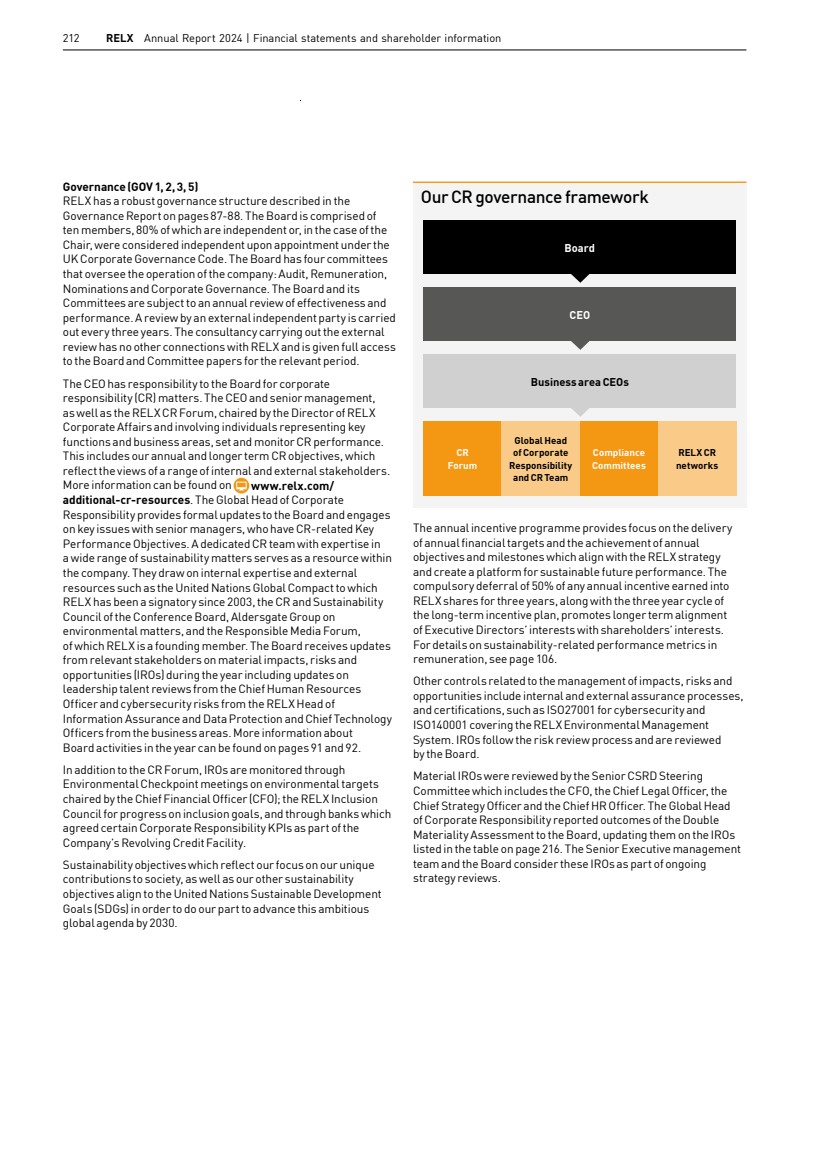
| 213 TheBoardregularly reviewsRELX’spoliciesandCodeofEthics and BusinessConducttoensuretherightframeworkis inplace topromote a culture of integrity, strong commitment to ourpurpose, and engagement with our customers and the communities inwhichweoperate.TheBoardhasaNon-Executive Workforce Engagement Director who engages directly with employeerepresentatives from across RELX and reports back to theBoard.Theviewsofemployeesarealsomeasured through annual employee surveys, and a broader triennial opinionsurvey, designed to gauge how employees feel about the organisation, how well they understand its direction, and their levelof satisfaction and engagement with their work. An analysis ofthe results is presented to theBoard. TheBoard also receives regular updates about culture within the company and on corporate responsibility activities from across each of RELX’s business areas.Such reports include progress against our people objectives in areas such as well-being, pay equity and reducing inequalities through inclusion. This contributes to the Board’s assessment of culture atRELX and provides a context against which theBoard takes decisions. For details on composition and diversity oftheBoard and Executive Management, see page 100. Stakeholder engagement (SBM 2) Our stakeholder engagement efforts are informed by our commitment to the United Nations Global Compact and its ten principles, focused on human rights, labour, the environment and anti-corruption – all issues with wide societal impact. Throughout the period, we engaged with our stakeholders – investors, employees, customers, suppliers and communities – to understand their views. Details of our stakeholder engagement, and the relevant outputs, can be found on pages 93 to 96. Double Materiality Assessment Given that the Double Materiality Assessment (DMA) process under CSRD involves judgements, the list of material impacts, risks, and opportunities may change over time. In undertaking theDMA, we considered our sustainability-related impacts (on people and the planet), as well as IROs linked to our business model, value chain and operations. The assessment was informed by a range ofinputs such as specific business activities, relationships and geographies. Inputs included: External § Responsible Media Forum Materiality Report § S&PGlobalCorporate SustainabilityAssessment § Other corporate responsibility ratings reports § SASBFramework § ESRS list of topics, sub-topics, and sub-sub topics Internal § RELX Principal Risk Register § RELX Corporate Responsibility Report (within the RELX AnnualReport) § Records of sustainability-related customer and investor requests § Existing management processes for identifying key issues The work encompassed internal and external engagement on RELX’s materialIROs originating from our strategy and business model in order to categorise whether they were negative and/or positive, potential or actual. This built on previous biennial materiality assessments we have undertaken over the past decade to ensure we continuously act and report on the sustainability topics of most relevance to the business and its stakeholders. Following extensive internal and external consultation, we prepared a long-list ofissues which were filtered for relevance to develop a short-list of issues that stakeholders could consider and challenge through a survey tool and direct interviews to substantiate our selection and to understand whether any issues were missed. Allfeedback was integrated into the assessment. Double materiality assessment stakeholder engagement process 1 Understand the context 2 Develop list of relevant sustainability issues 3 Internal and external interviews 4 Develop, assess and score shortlist of IROs 5 Survey & additional interviews 6 Review & finalise assessment Market segments Governance and shareholder information Financial statements Financial review Corporate responsibility Overview RELX Annual Report 2024 | Sustainability statement and other corporate responsibility disclosures |
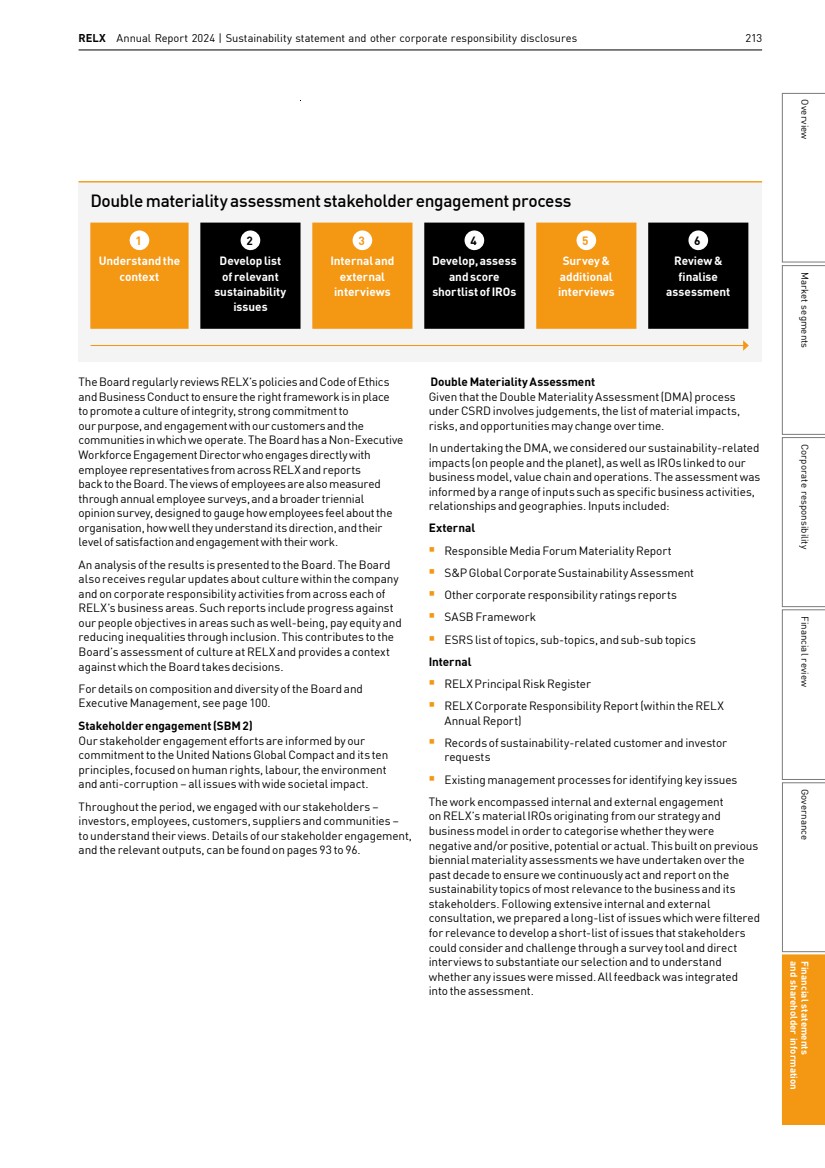
| 214 RELX Annual Report 2024 | Financial statements and shareholder information Impact materiality: Scoring and threshold RELX has engaged with stakeholders who rely on and use the company’s public sustainability reporting and data, such as existing and potential investors as well as with affected stakeholders (individuals or groups that have interests that are affected or could be affected – positively or negatively – by RELX’s activities and through the value chain). The internal and external stakeholder groups, as well as the format of engagement, are outlined below. Internal group Engagement type Senior Leadership 1-1 Interviews Senior Managers 1-1 interviews and consultation through Review Group (focus group-style) Wider colleagues as well as some external stakeholders A survey was sent to wider colleague networks and a small number of external stakeholders External group Engagement type Investors 1-1 Interviews Suppliers and partners 1-1 Interviews Customers 1-1 Interviews NGOs, Partners 1-1 Interviews We then aligned the scoring of issues to the ESRS framework. This involved rating impacts using three criteria – scope, scale and irremediability. This was completed using available evidence, and input from interviews and feedback from an internal review group, representing colleagues in key functions and representatives from across the four business areas. We determined impact materiality by calculating an impact score based on ESRS2 requirements and then reviewed scores qualitatively to determine scope and scale for all impacts and irremediability for negative impacts. We determined financial materiality using the RELX Risk Management Framework (see page 74) and flagged sustainability-related risks and opportunities that aligned with a current RELX Principal Risk. We used judgement to determine which impacts, risks and opportunities were material, using both quantitative and qualitative criteria. We used qualitative criteria that took precedence over the quantitative assessment. The qualitative criteria used to exclude an IRO was if RELX is connected to an issue, but does not have a substantial direct or indirect impact on it. The three qualitative inclusion criteria were: § Regulatory requirements that require the Group to report againstthe issue § Evidence that investors are using the information to make decisions about RELX § Strong dependency between the issue and another materialissue. Based on the above criteria, we overrode the quantitative assessment for the negative impact of our carbon emissions on climate change. Given RELX is an office-based business with limited impact on climate change, it did not emerge as a materialIRO in the quantitative scoring, however, because climate change is an issue of importance to investors and reporting requirements for other regulations, we will report on climate change in this disclosure. Material matters identified as part of the DMA had strong alignment with previous assessments. We recategorised some material matters to align more closely with the ESRS. For example, security-related impacts (protection of society) and promotion of the rule oflaw were combined into a new material issue of ‘other information-related impacts’ to align more closely with topical standard ESRS S4, Consumers and end-users. Another example is a challenge to the scale rating of human rights in the value chain. Based on internal risk tools, and the wording ofthe ESRS, we decided that the issue remained material based on potential indirect impacts in the RX and print value chains. In accordance with ESRS guidance, we have prioritised the severity of the issue in its inclusion over its likelihood or the number of workers it may impact. There were no material issues arising from the DMA that were not already on the short-list that would require an amendment of our strategy and business model, or which present a significant risk to RELX’s financial position, performance and cashflows over the short, medium and long-term, or that would require a material adjustment within the next annual reporting period to the carrying amounts of assets and liabilities reported in the related financial statements. Scope How widespread is the impact? Scale How severe/beneficial is the impact? Irremediability* Resources required to remediate 0 No people or nature are/would be affected 0 None – people and/or nature are not affected 0 Very easy to remedy with little or no resource required 1 <1,000 people affected Impacts isolated to one site 1 Minimal impact, not affecting daily life or nature beyond tolerable levels 1 Relatively easy to remedy in the short-term with minimal resource 2 1,000 – 20,000 people affected Isolated to a small number of sites/operations 2 Minor discomfort or benefit to quality of life or nature 2 Able to be remedied with some effort and resource 3 20,000 – 1m people affected Regional impacts, or several operations 3 Substantial changes to people’s quality of life or nature 3 Difficult to remedy without significant investment 4 1m – 10m people affected Impact present in a significant proportion of the business 4 Significant changes to people’s quality of life or nature exceeding national laws and regulations 4 Very difficult or expensive to remedy 5 10m+ people affected RELX-wide and significant external impact 5 Catastrophic/hugely beneficial changes to nature or people’s quality of life and/or violation of international human rights 5 No ability to remedy to the same or equivalent state * Irremediability only relates to negative impacts |
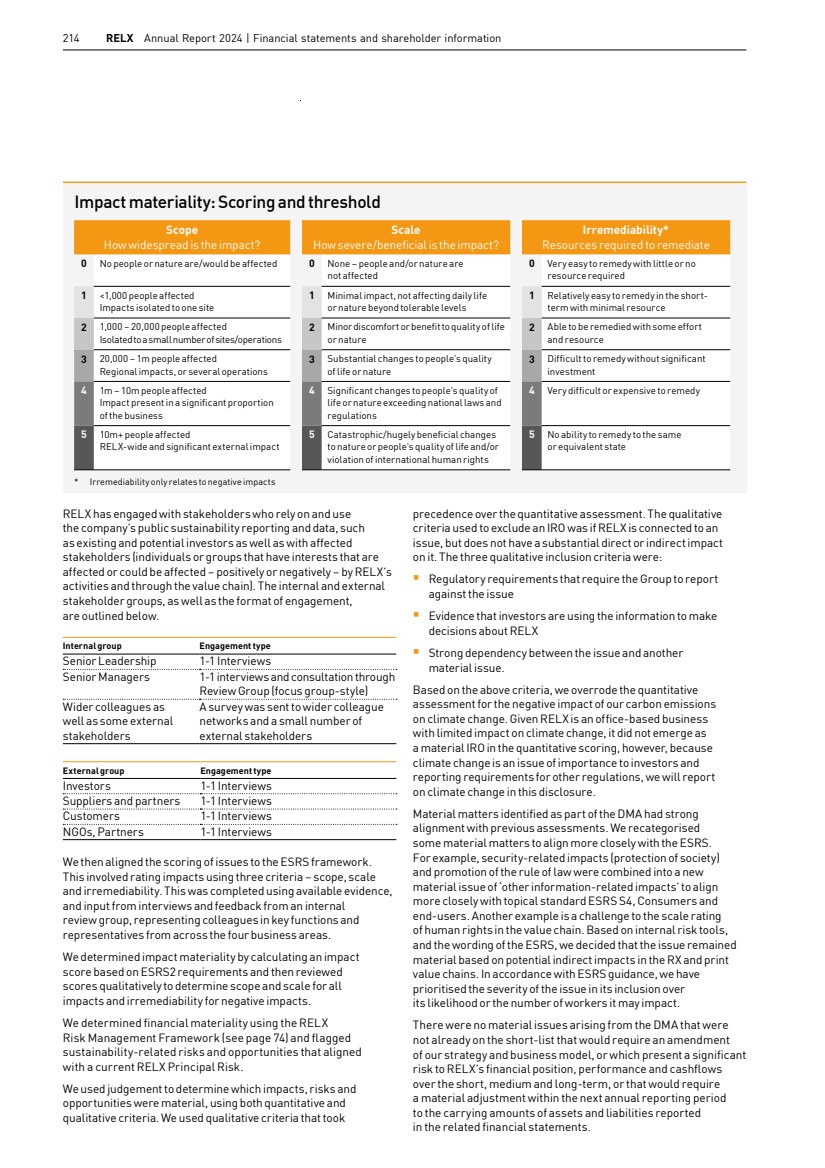
| 215 Summary of identified material matters Impact on the value chain Trending* Topic Identified material matter Upstream Own operations Downstream Medium (2–5 yrs) Long (5+ yrs) E1 - Environment Climate change ● ● ● ↓ ** S1 - Own Workforce Talent attraction & retention, incl Inclusion and Diversity ● ● S2 - Workers in the valuechain Working conditions ● Human rights, labour rights and child labour ● S4 - Consumers and end-users Access to (quality) information ● ● Social and environmental impacts of content ● ● ● ↑ (I) (F) Other information-related impacts (rule of law, security-related impacts) ● ● ↑ Social inclusion of consumers ● ● ↑ Privacy-related impacts ● ● ● ↑ G1 - Business Conduct All sub-topics, excluding animal welfare ● ● ● ● ● ● * All matters were considered in the short-term, trends show trajectory from the current status ** Decreasing in the mid-term as share of revenue from print products decreases and continued migration to more efficient cloud services Link to RELX unique contributions Universal, sustainable access to information Advance of science and health Protection of society Promotion of the rule of law & access to justice Fostering communities Key ● Positive impact/opportunity ● Potential negative impact/risk ● Negative impact/risk Key ↑ Increasing materiality ↓ Decreasing materiality Remaining the same If differing trends: (I) Impact trend (F) Financial trend * These issues were identified as opportunities and as such show as financially material but are not directly linked to Principal Risks. ** Climate change was not assessed as material for RELX, but has been overridden due to our requirements to report on climate from other regulations and the importance of this topic to investors. Link to RELX unique contributions Prioritisation of material matters Impact materiality (increasing impact on society) Financial materiality (increasing impact on RELX) Financially material Double material Impact material Human rights, labour rights and child labour (value chain) Working conditions Business conduct Social inclusion of consumers and end-users* Climate change** Privacy-related impacts Access to (quality) information Talent Attraction and Retention, and Inclusion and Diversity Other information-related impacts Social and Environmental Impacts of Content* Current ‘impact materiality threshold’ Universal, sustainable access to information Advance of science and health Protection of society Promotion of the rule of law & access to justice Fostering communities RELX has the capacity to address its material impacts and risks andto take advantage of its material opportunities. Its resilience isdemonstrated by nine consecutive years of a AAA MSCI rating, indicative of the lowest level of Corporate Responsibility risk over time. As stated the DMA follows on from many years of stakeholder engagement efforts and will be updated at regular intervals. Market segments Governance and shareholder information Financial statements Financial review Corporate responsibility Overview RELX Annual Report 2024 | Sustainability statement and other corporate responsibility disclosures |
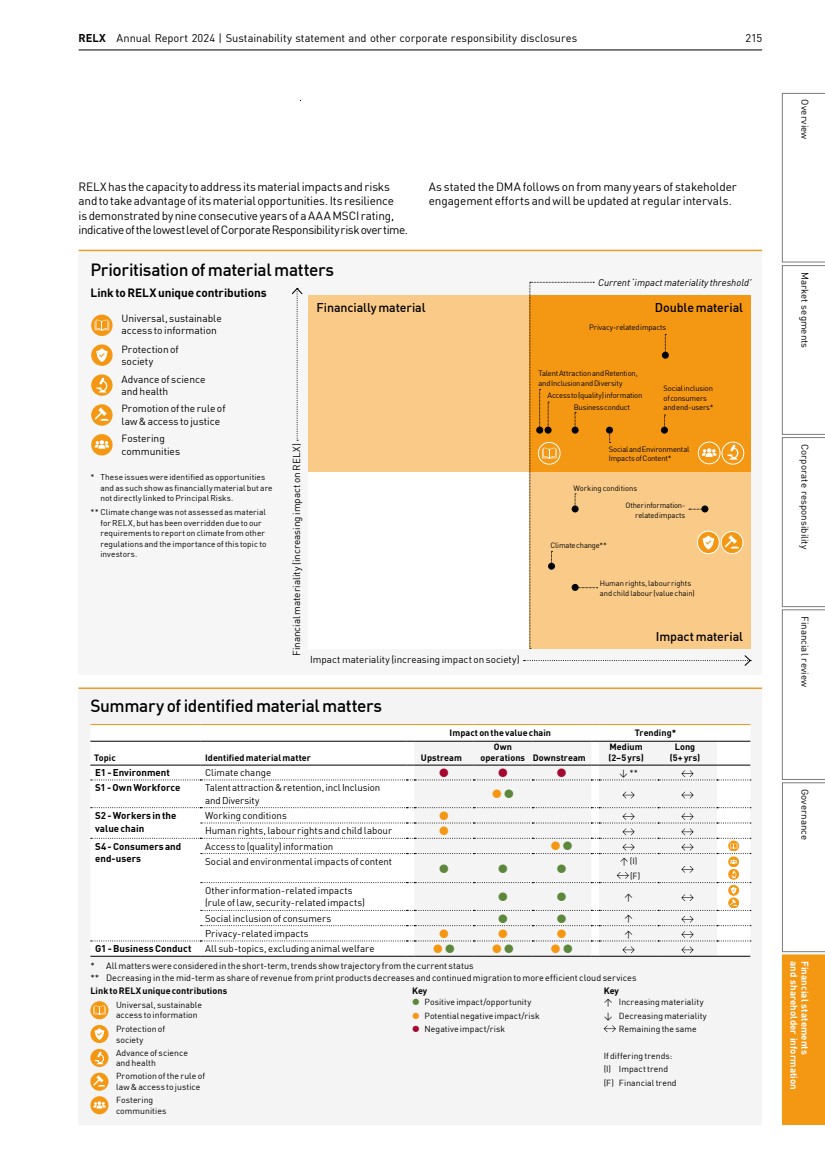
| 216 RELX Annual Report 2024 | Financial statements and shareholder information Material impacts, risks and opportunities (SBM-3) The following table lists the sustainability related IROs we have identified and assessed as material. Please see our topical sections for more information on our response to our impacts and risks. Material matter Impact/Risk/Opportunity RELX Context Relevant policies (see table below for more detail) E1 - Environment Climate change Carbon emissions contributing to climate change Business activities contributing to the emission of greenhouse gases 1 S1 - Own workforce Talent Attraction and Retention including Inclusion and Diversity Employee recruitment and retention through a work environment which includes learning and development, inclusion and employee well-being. Increased (or decreased) access to talent in providing (or failing to provide) an engaging, diverse workplace that promotes wellbeing and development 2 3 4 S2 - Workers in the value chain Working conditions Risk of injury to workers in the value chain due to work-related accidents Some companies in the RELX value chain operate in industries with a higher risk of workplace accidents 5 6 Human rights, labour rights and child labour Use of transient and migrant workforces in some sectors in the value chain increases the risk of incidents of forced/ bonded labour Some companies in the RELX value chain operate in industries or geographies with higher risk of human rights incidents including forced labour, child labour 4 5 S4 - Consumers and end-users Information-related impacts Use of products and services for public safety and to promote the rule of law RELX products and services used by organisations to strengthen public institutions and promote the rule of law 4 6 7 8 9 12 Access to (quality) information Reduce inequalities and advance knowledge by providing access to information of societal benefit in low and middle-income countries or opposite Research institutions in low and middle-income geographies could lack resources to access RELX products of societal benefit; importance of editorial and other standards to ensure quality content 4 6 7 8 9 12 Efficacy of, and trust in, content and services is ensured through the deployment of editorial and other standards Research institutions in low and middle-income geographies could lack resources to access RELX products of societal benefit; importance of editorial and other standards to ensure quality content 4 6 7 8 9 12 Privacy-related impacts Robust data privacy and security policies and procedures to avoid unauthorised access to Personal Identifiable Information (PII) to build trust with stakeholders, avoid litigation and fines and reputational damage or opposite Requirement for transparent and responsible management of personally identifiable information (PII) used in some RELX products (e.g., to avert fraud, reduce insurance risk, etc.) 4 6 7 8 9 12 Social inclusion of consumers and end-users Product offerings aligned with the UN Sustainable Development Goals can support research, policy and financial inclusion RELX products and services such as credit referencing and fraud prevention enable effective operation of financial systems and act as a spur to sustainable development 4 6 7 8 9 12 G1 - Business conduct Business conduct Effective governance policies and procedures build trust with stakeholders, avoid litigation and fines and reputational damage or opposite Legal requirements and ethical considerations require high standards of business performance overseen by Board 4 10 11 |
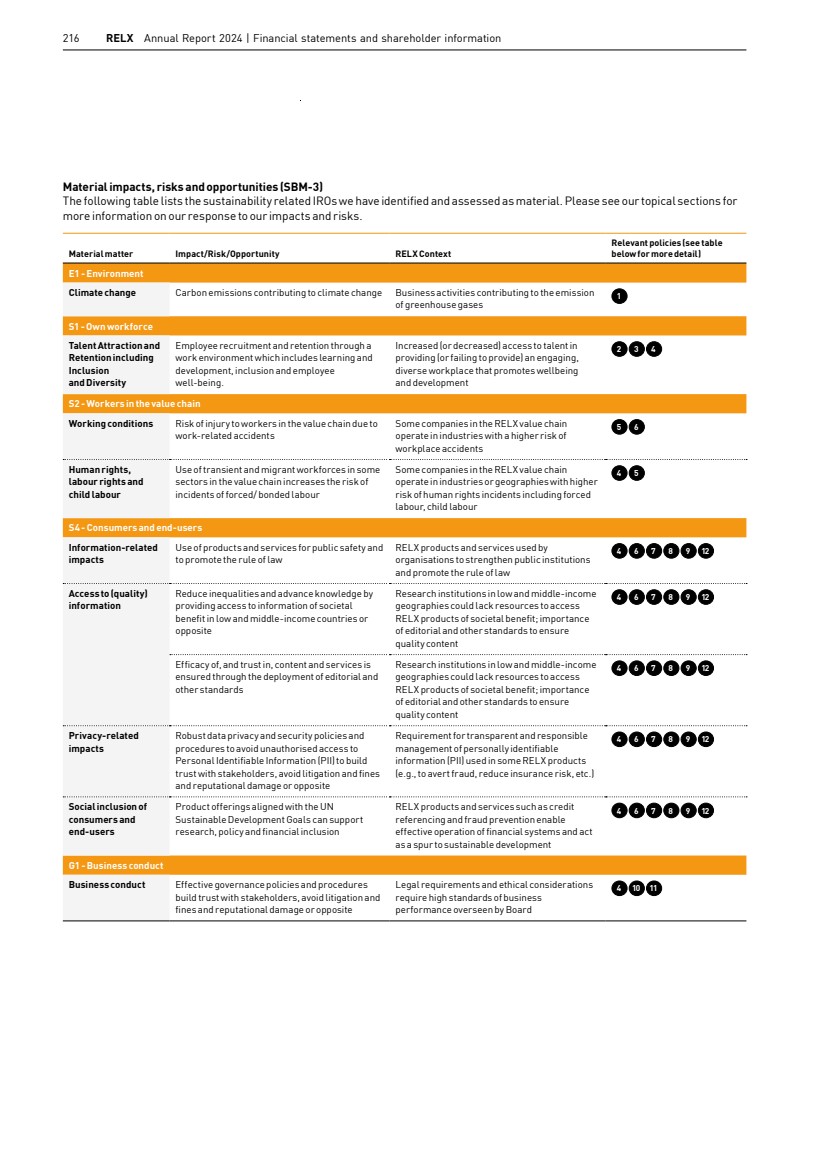
| 217 The following table details the key policies relating to the IROs outlined above. Description of policy Scope and exclusions Most senior person accountable for implementation ofPolicy Oversight and monitoring (Forum/ committee and relevant chair) Targets (if applicable) 1 Global Environmental Policy Commits RELX to minimising its contribution to climate change, in line with the scale of action deemed necessary by science. This commitment requires environmental targets which address climate change mitigation through the reduction of absolute carbon emissions and purchase of renewable energy, climate adaptation through reducing energy consumption and improving energy efficiency, and other measures such as the use of sustainable papers. Whole business with no exclusions Global Head of Corporate Responsibility RELX Environmental Checkpoint Group chaired by CFO Our approved SBTi targets are: (1) Reduce absolute Scope 1 andScope 2 (location-based) carbon emissions by 56% in 2030 from a 2018 base year (2) Reduce absolute Scope 3 carbon emissions from purchased goods and services, capital goods, business travel and employee commuting by 30% in 2030 against a 2018 base year 2 Recruitment and Selection Policy Includes job criteria and qualification assessment, use oftests, the recruitment process, sourcing applicants, eligibility to apply for internal vacancies, candidate screening, job offers, background checks and re-location support. All employees Global Head of Talent Acquisition HR Leadership Team 3 Inclusion and Diversity Policy Promotes equal opportunities, advances inclusion and diversity. All employees Chief HR Officer Approved by theBoard 4 RELX Code of Ethics and Business Conduct (the Code) Sets the standards of behaviour for all RELX employees. Among other topics, the Code addresses fair competition, respect for human rights, anti-bribery, conflicts of interest, employment practices, data protection and appropriate use of company property and information. It also encourages reporting of violations – with an anonymous reporting option where legally permissible. All employees Chief Compliance Officer Approved by theBoard 5 Supplier Code of Conduct (Supplier Code) Sets expectations for all RELX suppliers to commit to standards that ensure legal, ethical and responsible conductin all operations, safety, respect for the rights of allindividuals including protection of human rights and fair and non-discriminatory labour practices and respect and care for the environment. Requested of all suppliers VP Global Procurement RELX Corporate Responsibility (CR) Forum (1) Achieve 5,500 supplier signatories to our Supplier Code of Conduct in 2024 (2) Complete 125 supplier audits in 2024 6 Responsible AI Principles When designing, developing and deploying machine-driven insights the principles set out our commitment to consider the real-world impact of solutions on people, take action to prevent the creation or reinforcement of unfair bias, explain how solutions work, create accountability through human oversight and respect privacy and champion robust data governance. RELX employees working on machine-driven insights Chair, Chief Technology Officer (CTO) Forum CTO Forum 7 Privacy Principles Commitment to proper collection, use and handling of personal information. Principles guide our approach to data protection and privacy, covering accountability, design, purpose, transparency, choice, access, accuracy, security and disposal. Supplemental privacy policies and guidelines support the Principles. All employees and contractors handling PII for RELX Chief Privacy Officer RELX Privacy Officer Market segments Governance and shareholder information Financial statements Financial review Corporate responsibility Overview RELX Annual Report 2024 | Sustainability statement and other corporate responsibility disclosures |
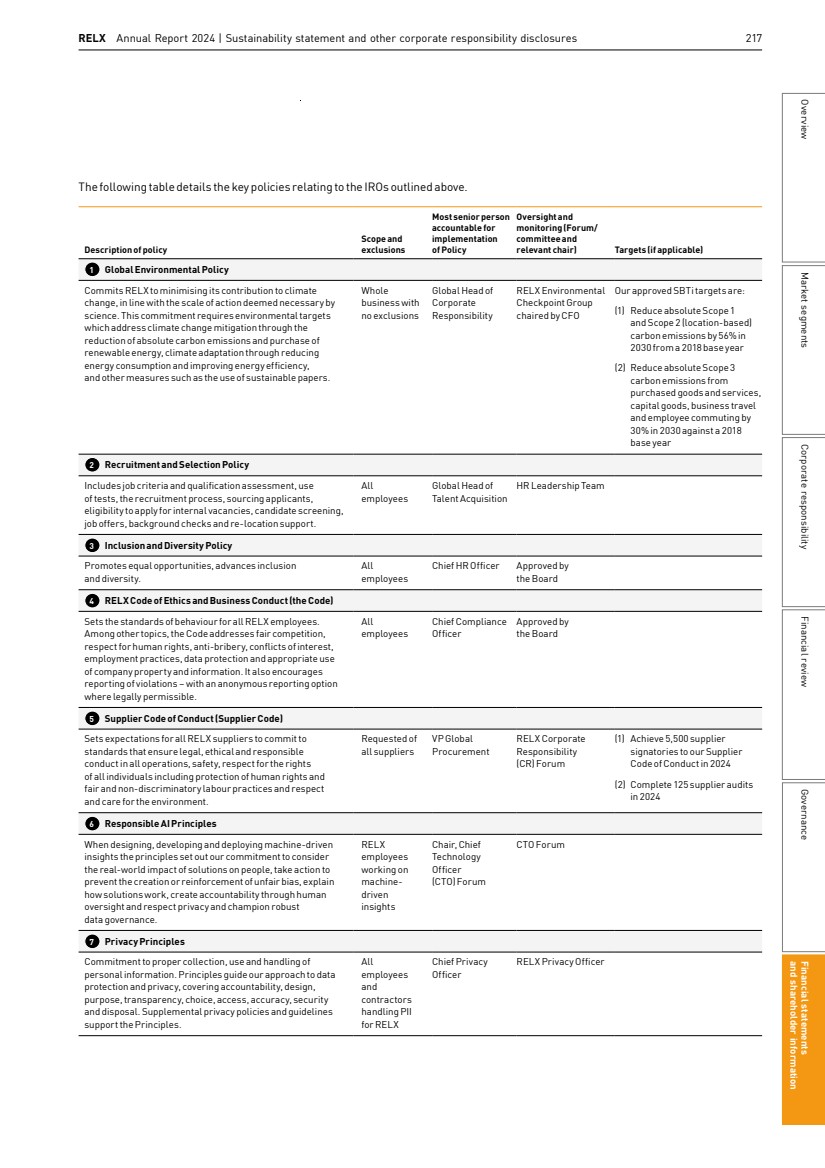
| 218 RELX Annual Report 2024 | Financial statements and shareholder information Description of policy Scope and exclusions Most senior person accountable for implementation ofPolicy Oversight and monitoring (Forum/ committee and relevant chair) Targets (if applicable) 8 Information Security Policy Outlines controls to protect Company information and preserve its confidentiality, integrity and availability for ongoing operational use to be established according to the value of the information, any legal or regulatory requirements and the severity of the total risks (real or potential) that could result from breaches of security. All employees Head of Information Assurance and Data Protection Information Security Council 9 Editorial Policy Outlines the principles of editorial independence and our responsibility to produce high quality information and our commitment to universal, sustainable access to information. All employees Global Head of Corporate Responsibility CR Forum and Editorial Policy Working Group 10 RELX Reporting Concerns Policy Explains the process for reporting suspected violations oftheCode, Code-related policies, or the law (‘concerns’). The purpose of this policy is to encourage the reporting of suspected misconduct, provide examples of the types of concerns that should be reported, and explains the avenues available to report concerns. This policy also describes how RELX investigates concerns reported by employees and non-employees. All employees Chief Compliance Officer RELX Compliance Committee 11 Preventing Bribery and Corruption Policy Sets standards for ethical business dealings and ensures that we have in place the necessary and adequate procedures to comply with the UK and US anti-bribery and related laws, as well as similar laws in other jurisdictions in which we operate. All employees Chief Compliance Officer RELX Compliance Committee 12 Accessibility Policy Outlines our commitment to ensuring products and services are accessible and easy to use for everyone by using industry standards and tools for embedding accessibility into our products and business operations. All employees Global Head of Corporate Responsibility RELX CR Forum and RELX Accessibility Working Group Due Diligence (GOV-4) The core elements of our due diligence process with regard to sustainability matters are signposted below. Core elements of due diligence Pages in the sustainability statements a) Embedding due diligence in governance, strategy and business model 210, 212 b) Engaging with affected stakeholders in all key steps of the due diligence 213-214 c) Identifying and assessing adverse impacts 214-216 d) Taking actions to address those adverse impacts 219, 225, 227, 228, 230 e) Tracking the effectiveness of these efforts and communicating 218 The RELX Operating and Governance Principles set out the processes, policies, controls and related assurance activities that have been put in place to mitigate risk and serve as a first point of reference for management. They also provide our workforce with the corporate policies and practices with which they must comply. The Principles are reviewed, updated and approved by the Board every two years. The process used to identify, assess, prioritise and monitor risks and opportunities that have or may have financial effects was aligned with the RELX risk assessment process and informed by RELX’s Head of Insurance and Risk with review by the Audit Committee. For details on our risk management framework including risk identification, evaluation and management and consideration of current and emerging risks see page 74. We also consider climate risk in our Taskforce for Climate-related Financial Disclosure (see our TCFD Statement on pages 236-241). All risks, including those with a sustainability dimension, are considered as part of the RELX risk management process, and those that meet a financial materiality test are identified as principal risks including data privacy and cybersecurity; customer acceptance of our products; talent; supply chain dependencies; and ethics more generally. The RELX Code of Ethics and Business Conduct states that before engaging a third-party who will be acting on behalf of RELX appropriate due diligence must be conducted in accordance with the RELX Preventing Bribery Due Diligence Guidance and related materials. We also consider potential impacts when entering into other business relationships, such as joint ventures. The process to identify, assess and manage opportunities is integrated into our overall management processes including business area strategy teams and the RELX Sustainability Product Group and similar networks. |
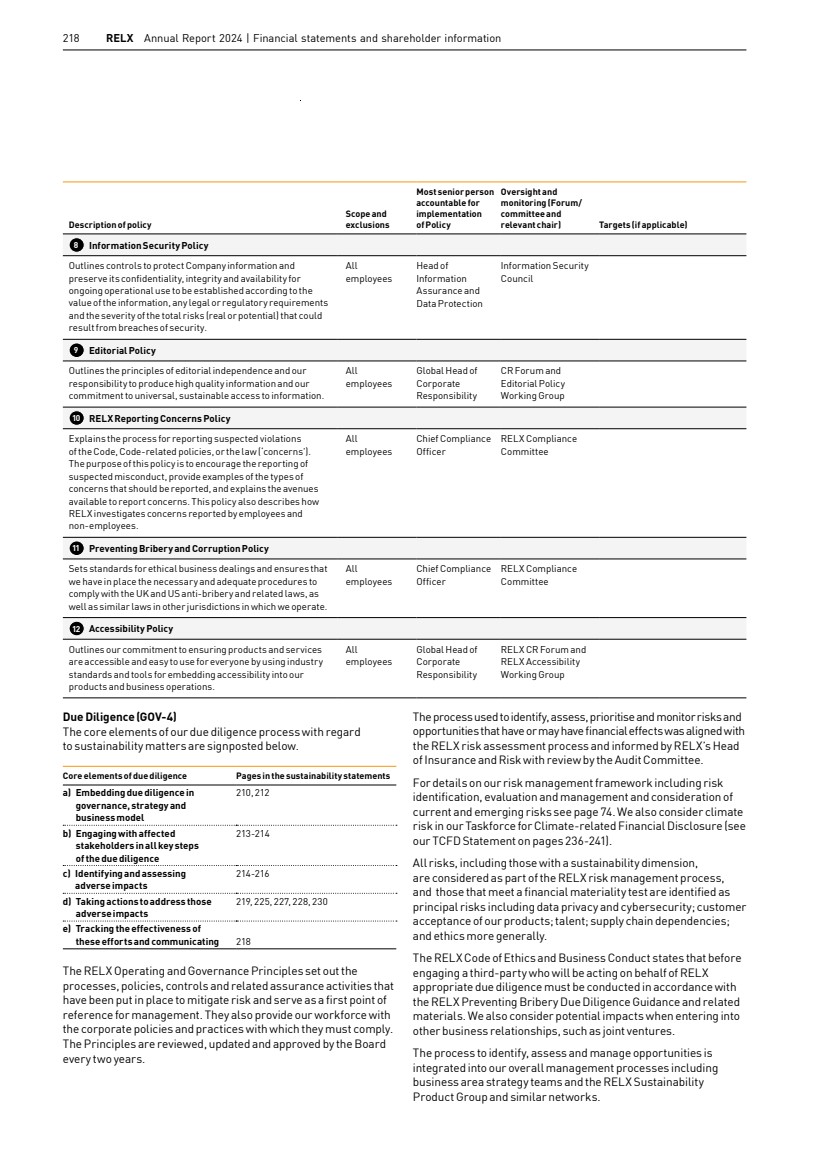
| Material IROs (ESRS 2 SBM-3) We strive to reduce our environmental footprint across the company and value chain and have achieved an 80% reduction in Scope 1 and Scope 2 (location-based) carbon emissions since 2010. Carbon emissions associated with our business activities, such as electricity consumption or emissions from suppliers, contribute to climate change. While the DMA did not find carbon emissions to be material to RELX based on the volume of emissions, they have been included due to their importance for investors and other stakeholders as indicated inESRS 2, page 215. IROs have been identified through the risk assessment process, as described above and detailed on page 74; the certified ISO14001 Environmental Management System and through working groups such as the CR Forum and other networks. For an outline of the process to identify risks and details of our transition and physical risks see the RELX TCFD statement on page 236. No climate-related risks, whether physical or transitional, have been identified as material. As no climate-related risks were found to be material, there are no critical climate assumptions in the financial statements. For a detailed description of the three possible future climate change related scenarios that we have considered, please see page 238. While there may be some potential incremental cost to ensure our operational resilience associated with some of these scenarios, in the context of RELX’s overall cost base, we would not expect any such incremental cost to be significant. We believe our strategy will be resilient even in the most challenging future scenario. Governance As RELX’s senior environmental champion, the CFO leads the RELX Environmental Checkpoint Group which sets strategy and targets for measuring and reducing the company’s environmental impact. The Group monitors performance throughout the year, tracking emissions across all scopes and performance relative to our targets. Management in each operational area support our environmental goals. They are responsible for ensuring the continuity of our operations, including resilience in response to potential events caused by extreme weather. The RELX Business Continuity Forum brings together specialists from across the company to identify risks, assess continuity and incident response plans, learn from incidents and share best practice. We recognise climate change intersects with other environmental and sustainability issues. For this reason, climate change is also considered by the RELX Corporate Responsibility (CR) Forum, with oversight by the Head of Corporate Affairs who reports directly to the CEO, and led by the Global Head of Corporate Responsibility. The CR Forum meets twice per year and comprises more than 75 participants including function heads and business area leads from across theCompany. ESRS E1 Climate change Integration of sustainability-related performance in incentive schemes (Gov-3) For a description of how sustainability related performance considerations are incorporated into the remuneration ofExecutive Directors, see page 106. Strategy Policies related to climate change mitigation and adaptation (E1-2) We have a Global Environmental Policy, for more information see page 217. Through this policy the company is committed to supporting the aims of the Paris Climate Agreement, to maintaining a certified ISO14001 environmental management system and to responsible engagement with stakeholders such as customers, suppliers and contractors. In the year, a number of actions were conducted covering the entire business. The annual external audit was conducted to maintain certification of the Group-wide ISO14001 environmental management system, with the company recommended for continued certification; quarterly Environmental Checkpoint meetings were held to monitor performance throughout the year, and to make decisions and plans relating to performance and strategy. No additional financial resources were required to complete the actions. Targets related to climate change mitigation and adaptation (E1-4) RELX has a validated near-term science-based carbon emissions reduction target. The target was defined using the Science Based Targets Initiative (SBTi) methodology v5.1 and in 2024 was validated by SBTi as aligned with the 1.5°C pathway. Emissions reductions targets apply to the same Scope 1 and Scope 2 boundary as our emissions reporting and Scope 3 emissions boundary align with the SBTi requirements. In setting targets, we have assumed there would be no significant change to our business model or other factors over the target period. Of the emissions covered by the Scope 1 and 2 (location-based) emissions reduction target in the year, 8% are from Scope 1 and 92% are from Scope 2. The significant Scope 3 categories identified, based on the size of emissions and their inclusion in the Scope 3 emissions reduction target are: Category 1 Purchased Goods and Services (also incorporating Category 2 Capital Goods), Category 6 Business Travel and Category 7 Employee Commuting. Our primary climate action focus is reducing emissions. Our approved SBTi targets are detailed on page 217. Transition plan for climate change mitigation (E1-1) and Actions and resources in relation to climate change policies (E1-3) Performance against our Net Zero Transition Plan is reviewed in quarterly Environmental Checkpoint meetings. Management in each business area identifies customer needs and develops relevant products to address climate change. These include RELX Annual Report 2024 | Sustainability statement and other corporate responsibility disclosures 219 Market segments Governance and shareholder information Financial statements Financial review Corporate responsibility Overview |
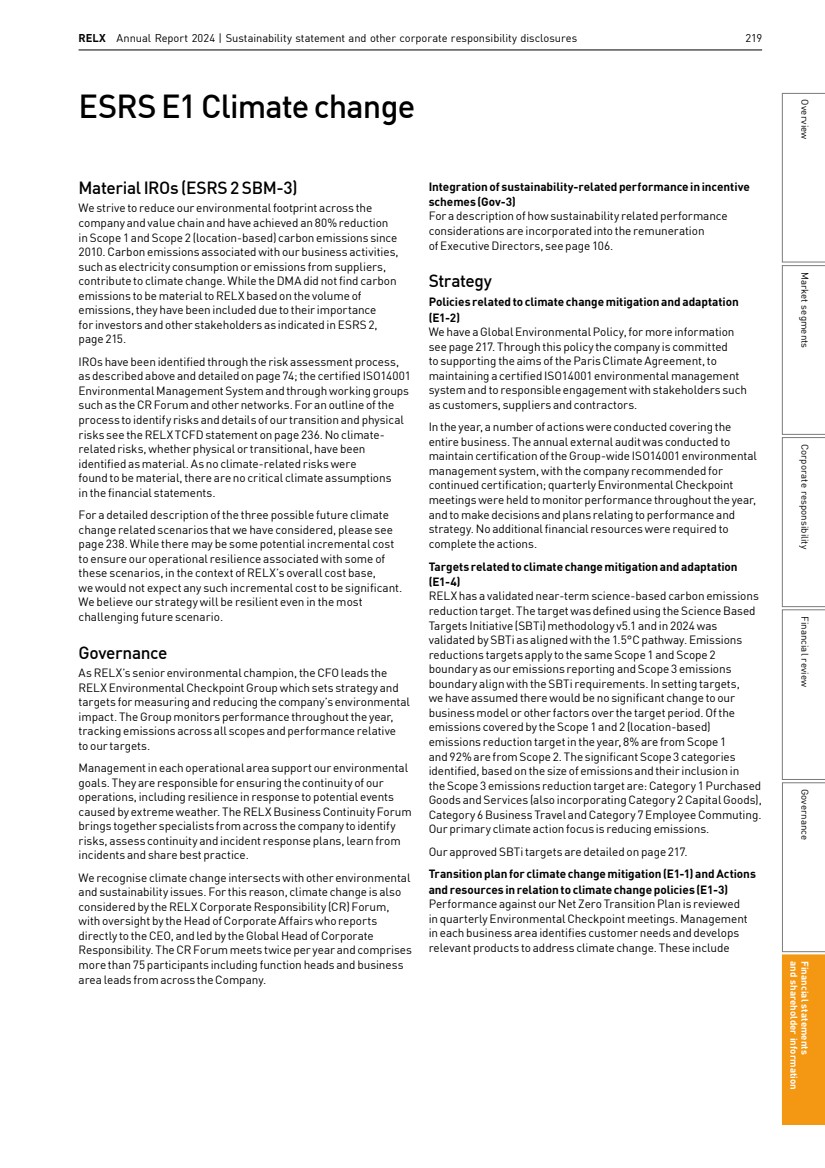
| launching and advancing scientific journals with articles on climate change, energy efficiency, and other climate-related topics; providing data and analytics that support customers in reducing their environmental impact; providing information and analytics on climate law and regulations; and holding exhibitions focused on renewable energy and low carbon solutions. As a low impact business, RELX does not assign specific capital expenditure for climate mitigation and adaptation activities. Mitigation activities, such as energy efficiency and environmental management system certification, are part of standard operating expenses. As no significant CapEx is required, this is not expected to restrict climate action. RELX has no EU Taxonomy-aligned activities against which to disclose specific CapEx spend and does not foresee its economic activities changing sufficiently to encompass taxonomy-aligned activities. RELX is not excluded from the Paris-aligned benchmarks (EU) 2020/1818 and does not have carbon intensive assets or products, therefore no significant locked-in emissions are associated with its assets and products. See our TCFD disclosure on pages 236-241 for details of our strategy to address climate-related risks. Our principal risks are described on pages 74 to 80. Energy consumption and mix (E1-5) ENERGY CONSUMPTION AND MIX MWh Total energy consumption from fossil sources 13,471 Purchased heat 1,509 Total electricity from renewable sources 60,853 Total electricity from non-renewable sources 16,603 Internal carbon pricing (E1-8) RELX operates a real internal carbon pricing scheme, levying a fee on Scope 1, Scope 2 and certain Scope 3 emissions categories for all RELX businesses globally. For more information see our TCFD disclosure on pages 236-241. Actions 1 Reduce office space footprint and improve energy efficiency 2 Migration away from RELX data centres to more efficient cloud services 3 Set science based carbon reductions targets aligned to 1.5°C 4 Migration of car fleet to electric vehicles 5 Renewable energy purchases become increasingly market specific 6 Purchase of carbon removals for residual emissions Actions 1 Supplier Code of Conduct including environmental responsibility 2 Value chain reporting and engagement 3 Supplier carbon reduction target setting and monitoring 4 Encourage supplier renewable energy purchases 5 Purchase of carbon removals for residual emissions The net zero transition plan assumes there will be no material change to the business model or operations and that policy will develop in line with the expectations of a 1.5°C scenario. Development of new technologies is not required in own operations or the value chain under this plan nor is significant expenditure beyond typical operational expenditure. All actions shown as current are underway and contributed to emissions reductions within the year. The above charts do not show net emissions achieved through future use of carbon removals. Consistent with our carbon reduction targets, the chart above shows location-based emissions until 2030 and market-based emissions thereafter. 0 0 300K 600K 90K 180K 2010 2015 2020 2025 2030 2035 2040 2045 2050 2010 2015 2020 2025 2030 2035 2040 2045 2050 RELX net zero transition plan Supply chain transition plan Emissions Scope 1 &2 tCO2e Emissions Scope 3 tCO2e We aim to achieve net zero by 2040 at the latest Actions Year Year Actions 1 2 3 4 5 We aim to achieve net zero by 2040 at the latest 1 2 3 4 5 6 220 RELX Annual Report 2024 | Financial statements and shareholder information |
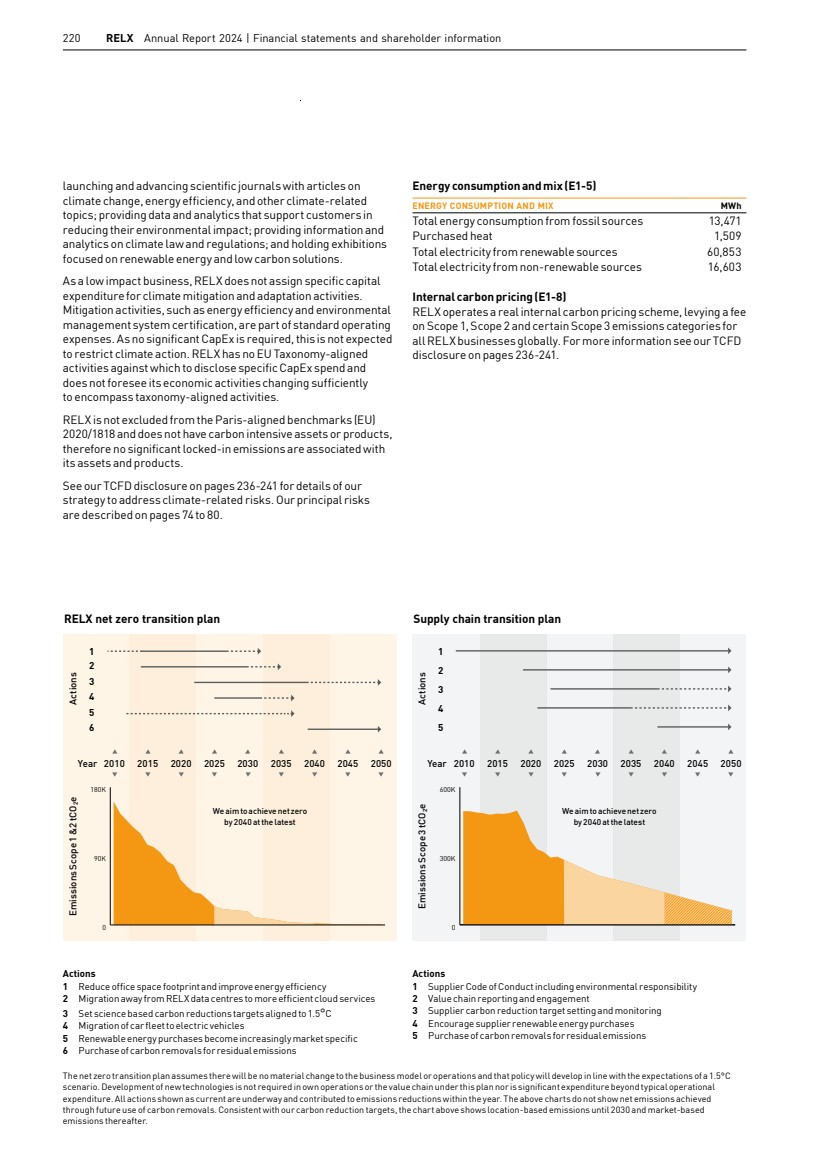
| Gross Scopes 1, 2, 3 and Total GHG emissions (E1-6) 2018 (base year) 2023 2024 % change 2024 v 2023 Gross Scope 1 emissions (tCO2e)* 8,126 4,317 2,703 -37% Gross location-based Scope 2 emissions (tCO2e) 75,194 36,616 29,989 -18% Gross market-based Scope 2 emissions (tCO2e)** 16,818 8,598 6,971 -19% Total Scope 1 + Scope 2 (location-based) emissions tCO2e 83,320 40,933 32,692 -20% Category 1: Purchased goods and services (incl. capital goods) (tCO2e) † 405,000 271,000 272,000 0% Category 6: Business travel (tCO2e) 69,664 17,804 19,594 10% Category 7: Employee commuting (tCO2e) 24,000 5,100 5,900 16% Total gross indirect (Scope 3) emissions (tCO2e)*** 498,664 293,904 297,494 1% Total carbon emissions (location-based) (tCO2e) 581,984 334,837 330,186 -1% Total carbon emissions (market-based) (tCO2e) 523,608 306,819 307,168 0% * In all years, 0% of Scope 1 emissions were regulated under an emissions trading scheme ** Market-based emissions account for renewable energy consumed in the market where it is purchased as zero carbon, representing 79% of global electricity consumption *** Categories in scope of science-based emissions reduction targets. Base year emissions estimated using a Scope 3 screening methodology before our current reporting methodology was developed † Includes estimated upstream emissions of approximately 220,000 tCO2 e in the year RELX’s reporting methodology and guidelines are available here. GHG INTENSITY PER NET REVENUE 2023 2024 % change Revenue (GBPm) (see note 2 in the financial statements) 9,161 9,434 3% Total emissions (location-based) per net revenue (tCO2e/GBPm) 36.55 35.00 -4% Total emissions (market-based) per net revenue (tCO2e/GBPm) 33.49 32.56 -3% RELX Annual Report 2024 | Sustainability statement and other corporate responsibility disclosures 221 Market segments Governance and shareholder information Financial statements Financial review Corporate responsibility Overview |
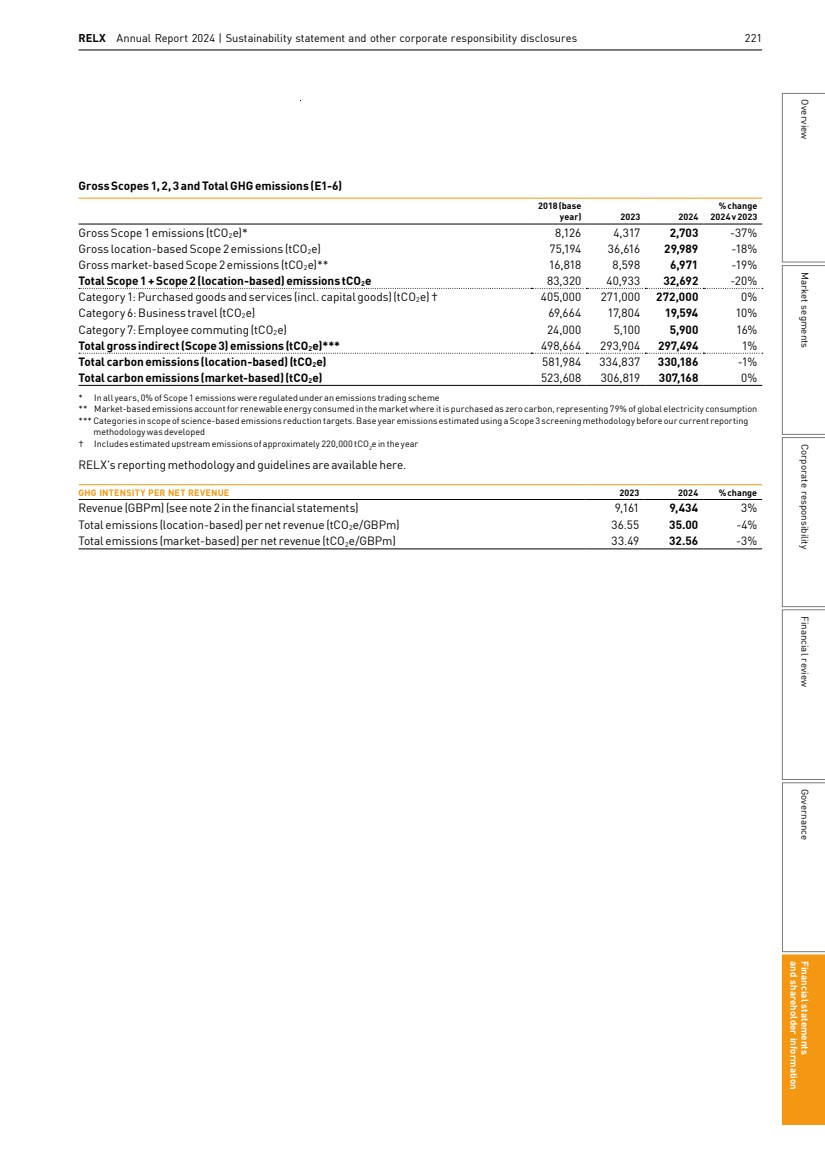
| EU Taxonomy disclosures The EU Taxonomy (Regulation (EU) 2020/852) and Delegated Acts are a framework to classify turnover, capital expenditure and operating expenditure against a defined list of economic activities which support the European Union’s sustainability objectives. Eligibility and alignment An activity listed in the Delegated Acts is Taxonomy-eligible. This activity is deemed to be Taxonomy-aligned if it meets specified technical criteria, does no significant harm (DNSH) and meets other social specifications. We conducted an initial scoping to identify those activities with potential relevance to our business. These activities were then reviewed to determine whether any ofthe KPIs were eligible. We have applied a strict interpretation of each activity to ensure a conservative approach to claiming eligibility of KPIs under the EU Taxonomy. This means RELX products and services may not be eligible for the EU Taxonomy due to the type of product, despite containing content pertinent to sustainability. This approach will be reviewed each year as industry understanding and standard practice develops. Turnover Turnover arises from the provision of products and services under contracts with customers and is reconciled to revenue in the financial statements as shown in note 2. Capital expenditure Capital expenditure includes additions to property, plant and equipment and is reconciled to capital expenditure in the financial statements as shown in notes 14, 16 and 22. Operating expenditure Operating expenditure, as defined by the EU Taxonomy, does not reconcile directly to the financial statements. See the Operating Expenditure table below for further details. Turnover related to EU Taxonomy activities Substantial contribution criteria DNSH criteria Economic activities Code(s) Absolute turnover Proportion of turnover Climate change mitigation Climate change adapt-ation Water and marine resources Circular economy Pollution Biodiver-sity and ecosys-tems Climate change mitigation Climate change adapt-ation Water and marine resources Circular economy Pollution Biodiver-sity and ecosys-tems Minimum safe-guards Taxonomy aligned propor-tion of turnover Year N Taxonomy aligned propor-tion of turnover Year N-1 Category (enabling activity) Category (transi-tional activity) GBPm % % % % % % % Y/N Y/N Y/N Y/N Y/N Y/N Y/N % % E T A. TAXONOMY-ELIGIBLE ACTIVITIES* A.1. Environmentally-sustainable activities (Taxonomy-aligned) Turnover of environmentally sustainable activities (Taxonomy-aligned) (A.1) 0 0% 0% 0% 0% 0% 0% 0% - - - - - - - 0% 0% - - A.2 Taxonomy-eligible but not environmentally sustainable activities (not Taxonomy-aligned activities) Turnover of not environmentally-sustainable activities (not Taxonomy-aligned) (A.2) 0 0% 0% 0% 0% 0% 0% 0% - - - - - - - 0% 0% - - Total turnover of Taxonomy-eligible activities (A.1 + A.2) 0 0% 0% 0% 0% 0% 0% 0% - - - - - - - 0% 0% - - B. TAXONOMY-NON-ELIGIBLE ACTIVITIES Turnover of Taxonomy-non-eligible activities (B) 9,434 100% Total (A+B) 9,434 100% * Activities assessed as potentially relevant include: Activity 8.1 ‘Data processing, hosting and related activities‘ which was interpreted to represent cases where the product was the provision of data centre services. While data centres are utilised in the delivery of our digital products, we have not claimed Taxonomy-eligible KPIs against this activity to more accurately reflect our offering of digital products rather than data centre services. Activity 8.2 ‘Data-driven solutions for GHG emissions reductions’. While some RELX products and services will lead to reduced emissions through innovation and improved processes of stakeholders in the value chain, the emissions reduction is not the primary purpose of those products and so we do not claim any taxonomy-eligible turnover. 222 RELX Annual Report 2024 | Financial statements and shareholder information |
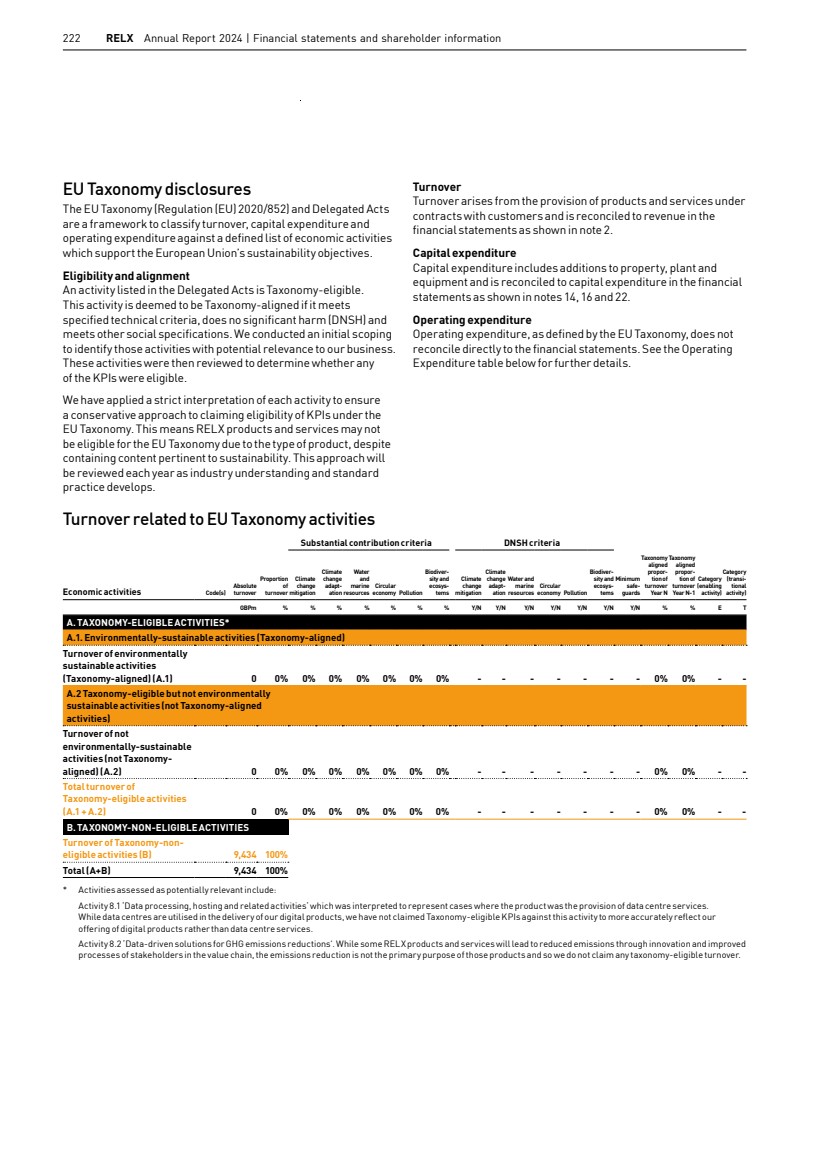
| Capital expenditure related to EU Taxonomy activities Substantial contribution criteria DNSH criteria Economic activities Code(s) Absolute CapEx Proportion of CapEx Climate change mitigation Climate change adapt-ation Water and marine resources Circular economy Pollution Biodiver-sity and ecosys-tems Climate change mitigation Climate change adapt-ation Water and marine resources Circular economy Pollution Biodiver-sity and ecosys-tems Minimum safe-guards Taxonomy aligned propor-tion of CapEx Year N Taxonomy aligned propor-tion of CapEx Year N-1 Category (enabling activity) Category (transi-tional activity) GBPm % % % % % % % Y/N Y/N Y/N Y/N Y/N Y/N Y/N % % E T A. TAXONOMY-ELIGIBLE ACTIVITIES A.1. Environmentally sustainable activities (Taxonomy-aligned) CapEx of environmentally sustainable activities (Taxonomy-aligned) (A.1) 0 0% 0% 0% 0% 0% 0% 0% - - - - - - - 0% 0% - - A.2 Taxonomy-eligible but not environmentally sustainable activities (not Taxonomy-aligned activities) Renovation of existing buildings* 7.2 20 4% 100% 0% 0% 0% 0% 0% - - - - - - - 0% 0% - - CapEx of Taxonomy-eligible but notenvironmentally sustainable activities (not Taxonomy-aligned activities) (A.2) 20 4% 100% 0% 0% 0% 0% 0% - - - - - - - 0% 0% - - Total CapEx of Taxonomy-eligible activities (A.1 + A.2) 20 4% 100% 0% 0% 0% 0% 0% - - - - - - - 0% 0% - - B. TAXONOMY-NON-ELIGIBLE ACTIVITIES CapEx of Taxonomy-non-eligible activities (B)** 496 96% Total (A+B) 516 100% * The eligible capital expenditure shown comprises office renovation projects and projects related to plant, fixtures and fittings. The proportion of spend on the energy efficiency elements of the projects is not separately monitored and so this figure represents the spend on the wider projects and equipment. Capital expenditure associated with activity 8.1 and activity 8.2 is not claimed to be taxonomy-eligible under our interpretation of the activity descriptions, as above. ** Non-eligible capital expenditure includes rights of use assets. Operating expenditure related to EU Taxonomy activities Substantial contribution criteria DNSH criteria Economic activities Code(s) Absolute OpEx Proportion of OpEx Climate change mitigation Climate change adapt-ation Water and marine resources Circular economy Pollution Biodiver-sity and ecosys-tems Climate change mitigation Climate change adapt-ation Water and marine resources Circular economy Pollution Biodiver-sity and ecosys-tems Minimum safe-guards Taxonomy aligned propor-tion of OpEx Year N Taxonomy aligned propor-tion of OpEx Year N-1 Category (enabling activity) Category (transi-tional activity) GBPm % % % % % % % Y/N Y/N Y/N Y/N Y/N Y/N Y/N % % E T A. TAXONOMY-ELIGIBLE ACTIVITIES A.1. Environmentally sustainable activities (Taxonomy-aligned) OpEx of environmentally sustainable activities (Taxonomy-aligned) (A.1) 0 0% 0% 0% 0% 0% 0% 0% - - - - - - - 0% 0% - - A.2 Taxonomy-eligible but not environmentally sustainable activities (not Taxonomy-aligned activities) OpEx of Taxonomy-eligible but notenvironmentally sustainable activities (not Taxonomy-aligned activities) (A.2) 0 0% 0% 0% 0% 0% 0% 0% - - - - - - - 0% 0% - - Total OpEx of Taxonomy-eligible activities (A.1 + A.2)* 0 0% 0% 0% 0% 0% 0% 0% - - - - - - - 0% 0% - - B. TAXONOMY-NON-ELIGIBLE ACTIVITIES OpEx of Taxonomy-non-eligible activities (B) 16 100% Total (A+B) 16 100% * Operating expenditure within the EU Taxonomy encompasses: direct non-capitalised costs that relate to research and development, building renovation measures, short-term lease, maintenance and repair, and any other direct expenditures relating to the day-to-day servicing of assets of property, plant and equipment. A review ofthese items found the expenditure to be immaterial to the total operating expenditure of the business and so we have claimed no eligibility for this KPI. RELX Annual Report 2024 | Sustainability statement and other corporate responsibility disclosures 223 Market segments Governance and shareholder information Financial statements Financial review Corporate responsibility Overview |
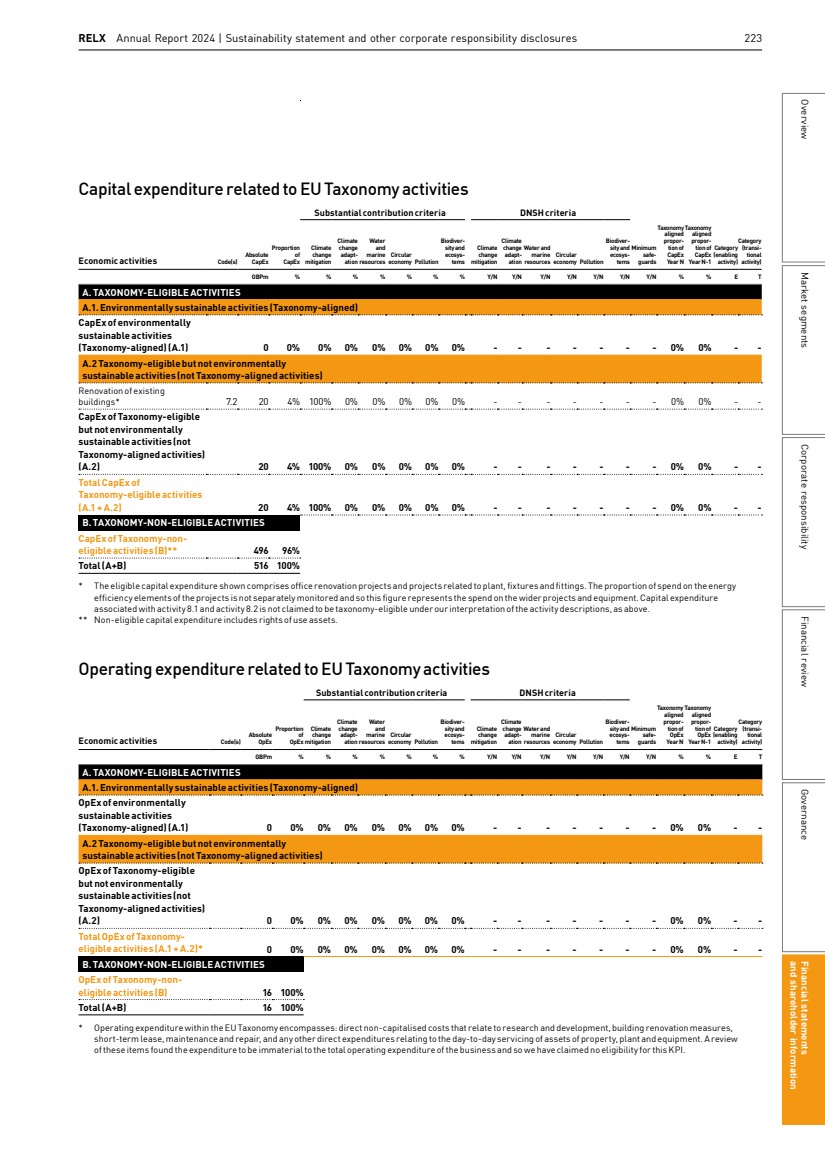
| Material IROs (ESRS 2 SBM-3) Our success as a business relies on our ability to recruit, motivate, develop and retain a diverse population of skilled employees and managers. We compete for talent globally and across business sectors in particular for technology and data analytics capabilities. In preparing the Sustainability Statement we have considered all of our direct employees who are likely to be materially impacted. Own workforce material impacts potentially relate to all employees. As a global provider of information-based analytics and decision tools for professional and business customers, RELX attracts and develops highly skilled professionals. Given the nature of our work and workforce, the risk is low for human trafficking and modern slavery in our direct operations. Policies related to own workforce (S1-1) We have a wide range of policies intended to ensure adherence to legislation and to ensure that employees are treated fairly and equitably in the workplace. For information on key policies relating to own workforce see the table on pages 217-218. Our focus on an inclusive culture, results in a diverse workforce and environment that respects individuals and their contributions. Employees have access to all relevant policies (based on location and business area) through the HR Policy Hub. They also have access to a help library in our HR information system. We want to hire the right people, with the rights skills to support our ongoing business growth, and our hiring process reflects our commitment to an inclusive workforce. We have a Recruitment andSelection policy (see pages 217-218 for details). We have a Talent Acquisition Hub to provide hiring managers with the right training and tools to find the best people to fill open positions. AHiring Manager Toolkit supports this structured approach, especially in relation to interview and selection, helping managers make strong, inclusive and successful hiring decisions. The toolkit includes interview guides to ensure a carefully planned interview that is consistent for all candidates. We also provide Hiring Manager training as part of our Manager CORE training programme and Recruiters have access to a Talent Acquisition SharePoint to mitigate candidate, employee and talent recruitment process risk. We have an employee referral policy which allows all our people to help us recruit talent to enable our business to thrive and grow, overseen by the Global Head of Talent Acquisition. Recruitment data is regularly reviewed by senior managers. We do not have a standalone development policy, however development is available and encouraged for all employees, with a full spectrum of self-service training and development tools accessible online through our HR information system and online learning platform. Managers may also directly enrol team members when specific learning needs are identified. Around 59,000 learning experiences are available on-demand, including digital courses, books, audiobooks, lab environments (to allow practice of practical skills) and skills assessment videos along with a range of in-person courses where needed. RELX-specific learning sits alongside industry-standard modules curated by a specialist third party provider and freely accessible to all employees via our intranet. Managers and leaders are active in supporting employee development, through the annual performance cycle and through Organisational Talent Reviews led by our most senior leaders. We have succession planning guidelines available for managers to identify, prioritise and develop employees with advancement potential. Retention is the outcome of a wide range of inputs including (but not limited to) business culture, reward, career opportunity, people manager expertise and trust in leadership. As a result, we do not have a standalone retention policy. We actively seek to identify issues that might jeopardise our ongoing productive relationship with our people and our annual employee survey has measures related to many drivers of retention. Results from the survey allow us to track our effectiveness, with action-planning at a team and business level to understand more, and drive any necessary remedial action. Our remuneration schemes are designed to attract and motivate the best talent available at an appropriate level of cost, and we continuously benchmark to ensure remuneration remains competitive. We have various processes in place to identify what action is needed and appropriate in response to actual or potential negative impact on our own workforce including our reporting channels described below. Our Code explains how employees should behave in the workplace. The Code specifically prohibits discrimination on the basis of race, colour, creed, religion, national origin, gender, gender identity or expression, sexual orientation, marital status, age, disability, or any other category protected by law. In addition to the Code, theRELX Inclusion and Diversity Policy aims to promote equal opportunities and advance inclusion and diversity. People managers play a vital role in ensuring a positive environment for members of their team, and we provide specific training to build their effectiveness at every stage of their career. RELX also has a number of business specific inclusion and wellbeing programmes including; Elsevier’s Inclusion Programme, LexisNexis Legal and Professional’s Thrive Wellbeing Programme and LexisNexis Legal and Professional Inclusive Global Community Programme. As a signatory of the United Nations Global Compact, we are committed to respecting human rights across our value chain including in our workforce. This commitment is reflected in ourCode which has been informed by the UN Guiding Principles on Business and Human Rights. Our Code covers employment conditions and labour standards. An internal working group is consulted on triennial updates to theCode. Engaging with own workforce (S1-2) Bianca Tetteroo is our Non-Executive Workforce Engagement Director. In this capacity she regularly engages directly with employee representatives from across RELX and reports to theBoard on the progress of RELX’s workforce initiatives and feedback received from her employee engagement. The Board receives regular reports on employee engagement, turnover and demographic analysis, updates on workplace initiatives, and concerns raised through our Code reporting channels. TheBoard takes this information into consideration during wider discussions. Across the business we have various works and staff councils which represent the views of employees at a country and/or a business level. The members of these councils are often elected by employees to represent their views and to discuss topics that matter to the employees they represent. These councils also serve as forums for the business to explain and sometimes consult on future changes. They are important connection points between our businesses and our people. ESRS S1 Own workforce 224 RELX Annual Report 2024 | Financial statements and shareholder information |
| A summary of culture and employee engagement can be found on page 3 and a summary of why effective engagement is important, including how we engage, outcomes and impact, can be found on page 94. We run an annual Employee Opinion Survey and a broader triennial opinion survey, to measure employee sentiment, and all people managers participate in post-survey action planning to help address employee concerns. Results of this survey focus on key metrics including net promoter score (eNPS), employee satisfaction and engagement. In 2024 our employee survey received responses from 89% of our global employee population. We take steps to gain insight into the perspectives of people in our own workforce who may be particularly vulnerable to impacts. We have over 130 Employee Resource Groups that allow colleagues to collaborate, advocate and engage communities, furthering inclusion and diversity at RELX. Channels for raising concerns (S1-3) The Code sets the standards of behaviour for allRELX employees and is reviewed regularly, most recently updated in 2024 and disseminated to all staff in a communication from the CEO. For more information on the code see pages 88 and 217. In some regions, grievance mechanisms are available for employees to raise concerns about their employment. RELX also offers several reporting channels for employees to report Code-related concerns, including managers, human resources staff, compliance committee members, company lawyers as well as the RELX Integrity Line, available to employees, suppliers, and other reporting persons. For more information on the Integrity Line see page 43. Taking action on material IROs (S1-4) In 2024, we undertook our most recent triennial global Employee Opinion Survey. An analysis of the results of the survey was presented to the Board in December and confirmed positive trends across all business areas in the key metrics of engagement, advocacy and employee net promoter scores. Board reports from the Chief Human Resources Officer highlight the steps taken to identify, support and develop current and future leaders across the business through Organisational Talent Review and Management Development Planning processes. This focus has seen increased gender diversity across internal succession pipelines. For more information on employee engagement, outcomes and impact see page 94. We have an Inclusion Council consisting of 17 leaders from across the business and run a variety of wellbeing programmes with a network of mental health first aiders. All RELX business units have dedicated programmes to manage inclusion. For example, the Elsevier I&D Forum has five key pillars (Race/ Ethnicity, Gender, Sexual Orientation, Disability, Generations) and each pillar has a business champion, executive sponsor andHR leader. RELX places significant emphasis on the way we do business, acting with integrity and in accordance with high ethical standards. We maintain a comprehensive set of policies and procedures in support of the Code and our risk areas which are reviewed and updated periodically to ensure they remain current and effective. For more information on the Code and ourCompliance Programme see pages 217, 218 and 230. Targets (S1-5) Across RELX we have a culture of continuous improvement. Accordingly, we generally do not set specific targets to drive the success of our actions. Rather, we measure effectiveness and track trends to ensure we are improving continually and take remedial action when necessary. Characteristics of employees (S1-6) Reporting guidelines and methodology are available on www.relx. com/additional-cr-resources. Employees by gender GENDER Number of employees (FTEs) Male 17,000 Female 18,500 Other - Not reported 900 Total 36,400 Employees in countries representing at least 10% oftotal number of employees COUNTRY Number of employees (FTEs) USA 14,400 UK 5,600 Philippines 5,400 This information aligns with the data reported on page 151 of the financial statements. Employees by contract type, broken down by gender Female Male Unknown Not Declared Total Total (FTEs) 18,500 17,000 900 - 36,400 Permanent 17,650 16,680 870 - 35,200 Temporary 700 230 10 - 940 Fixed contract 150 90 20 - 260 Data is reported at the end of the reporting period. Employees by contract type broken down by region USA UK Philippines Total (FTEs) 14,400 5,600 5,400 Permanent 13,500 5,530 5,400 Temporary 900 - - Fixed contract - 70 - Turnover rates Total leavers during reporting period 4,219 Total turnover rate 11.6% Voluntary turnover rate 7.7% Involuntary turnover rate 3.9% Collective bargaining (S1-7, S1-8) 12% of our employees are covered by a collective bargaining agreement. RELX Annual Report 2024 | Sustainability statement and other corporate responsibility disclosures 225 Market segments Governance and shareholder information Financial statements Financial review Corporate responsibility Overview |
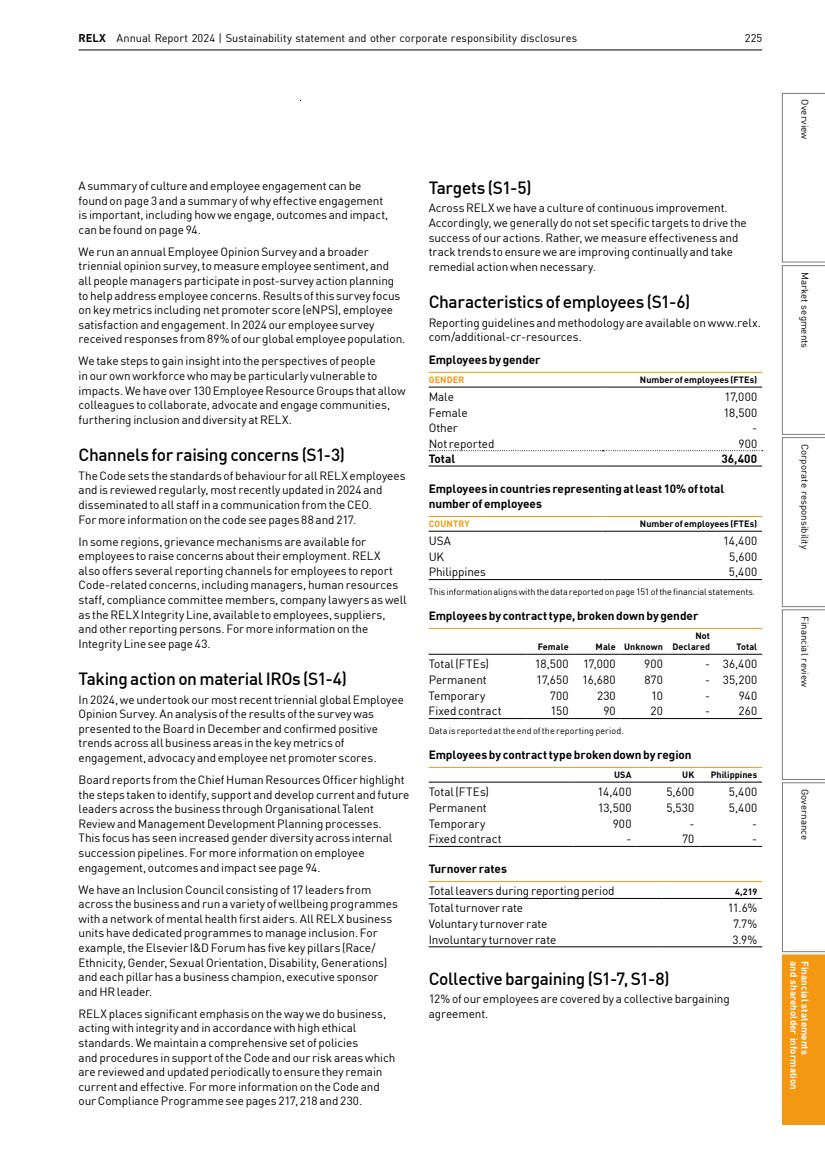
| Diversity metrics (S1-9) Gender distribution of senior leadership TOTAL NUMBER OF SENIOR LEADERS Men Women Number of senior leaders 286 137 % 68 32 Our definition of senior leaders is colleagues with a management grade of 17 or above. Distribution of employees by age group AGE RANGE % Under 30 19 30–50 61 Over 50 20 Adequate wages and remuneration metrics (S1-10, S1-16) We have completed living wage assessments in all countries where RELX has more than 50 employees, representing 99% of our employee population which confirms that we pay above the living wage in all locations. CSRD introduces a requirement for companies in scope to disclose pay ratios and pay gaps. RELX is a UK headquartered company and has published pay ratios and pay gaps according to the UK legal requirements for a number of years. The UK pay ratio is disclosed on page 113 of the remuneration report and UK pay gaps are published on our website. Pay data and pay gaps on a country level are more meaningful than broad global data which fails to differentiate among pay markets, purchasing power and foreign currency differences. As more guidance is provided, we will review how pay gaps are to be calculated and disclosed. The UK pay ratio is calculated on a total compensation basis, using an established and accepted methodology in the UK and covers 15% of our workforce. Human rights impacts (S1-17) RELX publishes the number of Code of Conduct reports it investigates on a yearly basis as well as the percentage of those reports that are substantiated. For more information see the CRGovernance section, page 43. There were no severe human rights incidents connected with our own workforce during the reporting period. 226 RELX Annual Report 2024 | Financial statements and shareholder information |
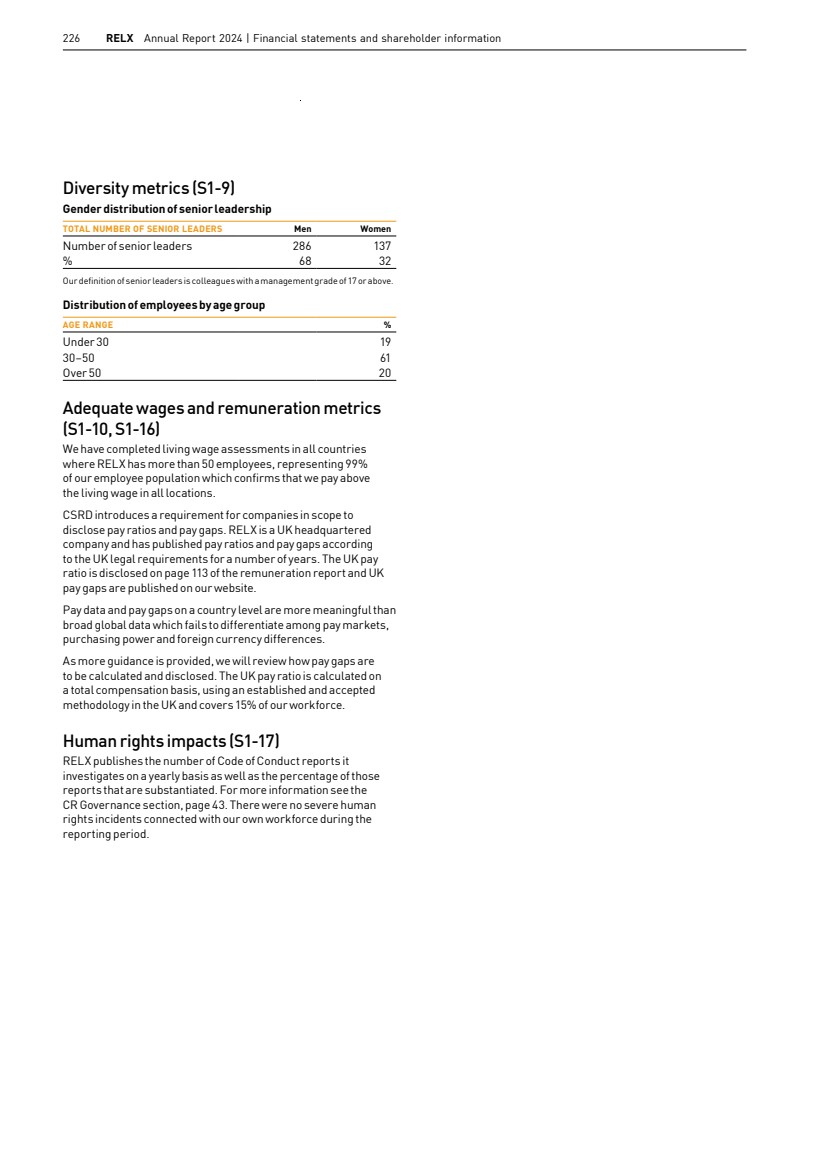
| Material IROs (ESRS 2 SBM-3) Material negative impacts in the value chain are neither widespread nor systemic. Where individual incidents occur they are addressed by the supplier audit programme which audits against the Supplier Code. The audit programme also enables us to identify any particular contexts or activities in which value chain workers may be at a greater risk of harm. Any discrepancies or non-compliance found from the audit is addressed through aCorrective Action Plan (CAP) to ensure that suppliers maintain compliance with the standards set forth by the Supplier Code and they conduct their business at the same high standards we set for ourselves as detailed in the RELX Code of Ethics and Business Conduct. Areas covered during the audit include labour standards, health & safety, business ethics, and the environment. We also have a risk rating process to identify any geographies or sectors where there is a higher risk of forced labour, regions include Africa, Asia and South America. We have over 1,300 contingent workers who provide support such as editorial, technical, project management, and administration. Contingent workers are engaged through a centralised Group-wide programme, and their providers are subject to our Supplier Code. When considering impacts on value chain workers we consider workers engaged through our central programme for contingent labour and those of our direct suppliers. We consider value chain workers who may be at an increased risk of workplace injury or forced labour such as those engaged in the construction or dismantling of an exhibition event. Policies related to value chain workers (S2-1) We have a comprehensive Supplier Code of Conduct, available on www.relx.com in 16 languages, which all suppliers are requested to sign. For more information on the Supplier Code of Conduct see the policies table on page 217 and the Supply Chain section on page 57. The Supplier Code requires respect for the rights of all individuals, including protection of human rights. It also specifically addresses involuntary labour, human trafficking and child labour. Suspected violations can be reported to the RELX Socially Responsible Supplier network through a dedicated email address or to RELX’s Integrity Line. Engaging with value chain workers (S2-2), remediation and raising concerns (S2-3) and taking action on IROs (S2-4) The Socially Responsible Supplier Programme mitigates potential impacts on workers in the value chain. We engage a specialist supply chain auditor to conduct audits and assessments on our behalf using their platform. Supplier audits take place throughout the year once a supplier is already established. An audit can be triggered based on the country risk rating, previous audit findings, supplier category risk, request by the business or Global Procurement. For more information on the audit process see the Supply Chain section pages 57-58. The RELX Integrity Line is available for workers in the value chain to report concerns. For more information, see page 43. In 2024 we did not receive any reports that related to modern slavery. As stated in our Modern Slavery Act Statement, available at www.relx.com, we stand against all forms of slavery and human trafficking. We do not tolerate it in any part of our business, including our supply chain. As aUN Global Compact signatory our Supplier Code is informed by its TenPrinciples related to human rights, fair and non-discriminatory labour practices, the environment, and anti-corruption. Targets (S2-5) We have annual supply chain targets. For 2024 these were to achieve 5,500 supplier signatories to our Supplier Code of Conduct and to complete 125 supplier audits, for performance against these targets see page 58. These targets are group-wide and set to drive continuous improvement. Value chain workers are not involved in the setting of annual targets, these are determined by internal subject matter experts informed by prior year feedback and audit outcomes. ESRS S2 Workers in the value chain RELX Annual Report 2024 | Sustainability statement and other corporate responsibility disclosures 227 Market segments Governance and shareholder information Financial statements Financial review Corporate responsibility Overview |
| Material IROs (ESRS 2 SBM-3) In preparing the Sustainability Statement, no consumers or end-users who are likely to be materially impacted have been excluded from the disclosure. RELX’s products and services are typically used by professionals and business customers, posing limited risk of harm or negative impact on vulnerable groups or individuals. RELX makes a positive impact on society through its unique contributions, including protecting society, advancing science and health, promoting the rule of law and access to justice, fostering communities, and providing universal sustainable access to information. Policies related to consumers and end-users (S4-1) and Taking action on IROs (S4-4) We have a range of policies that apply to consumers and end-users. For more details see pages 217-218. These policies, with a direct or indirect impact on consumers and end users, are informed by the UN Guiding Principles on Business and Human Rights, the ILO Declaration on Fundamental Principles and Rights at Work and OECD Guidelines for Multinational Enterprises. The IRO, efficacy of, and trust in, content and services is ensured through the deployment of editorial and other standards. For information on the RELX Editorial Policy see page 218. We ensure awareness of our editorial standards among employees and relevant stakeholders, including relevant suppliers. The RELX Editorial Policy is reviewed annually and its efficacy is assessed by the Editorial Policy Working Group. TheCR Forum identifies appropriate actions and recommends annual objectives and monitors performance against them. Material matters relevant to ESRS S4 cover data privacy and security and artificial intelligence. For more information on theRELX Responsible Artificial Intelligence Principles see page 217. We have robust data privacy and security policies and procedures to avoid unauthorised access to Personal Identifiable Information (PII) to build trust with stakeholders, avoid litigation and fines and reputational damage. For more information on the RELX Privacy Principles and the Information Security Policy see pages 217 and 218. In the year, we conducted privacy and data protection impact assessments and provided related training to employees. Dedicated privacy teams implemented requirements for compliance with global personal data protection regulations. No specific policies have been developed for the following IROs as the positive impact resulting from use of RELX’s products and solutions does not require a policy for effective implementation: Use of products and services for public safety and to promote the rule of law. No additional actions beyond standard day-to-day actions are necessary to support this IRO. Effectiveness is tracked and assessed as part of regular business reviews. Throughout the year, we engaged in numerous efforts to advance the rule of law, including through our support ofthe LexisNexis Rule of Law Foundation. Reduce inequalities and advance knowledge by providing access to information of societal benefit in low and middle-income countries. We provide access to information to benefit low and middle-income countries. Throughout the year, we continued to engage with key partners such as Research4Life and BookAid to expand access to information. Further detail is available on pages 39 and 54. We track the effectiveness of these actions through ongoing engagement with relevant partners. Product offerings aligned with the UN Sustainable Development Goals can support research, policy and financial inclusion. Anetwork of SDG Champions across the business supports our focus on advancing sustainable development. The RELX SDG Resource Centre showcases content in science, law, business and events that can advance the SDGs, drawing on content from across the company and key partners to broaden awareness and understanding of the SDGs by our customers, governments, researchers, companies, NGOs and individuals. We also provide specific products and solutions that generate positive social impact, such as our alternative credit solutions which enable a greater portion of the ‘unbanked’ population or those without a credit record, to access financial products. Engaging with consumers and end-users (S4-2) Management responsibility for customer engagement rests with the Business Areas CEOs. Customer acceptance of our products is one of our principal risks, see page 76 for more information. RELX considers the interests of customers and end users at all operational levels across our business. Dedicated sales, customer service and operations teams obtain customer views through regular quantitative and qualitative surveys, interviews and customer training and workshops. Customer metrics, including Net Promoter Score, are regularly reviewed by business area CEOs and their direct reports, by geography and sector, to spur continuous improvement in our products and service levels and inform our strategy, business decisions, and product roadmap. We offer comprehensive customer support using multiple channels, including phone, email, chat, and web forms so customers can choose their preferred modes of communication. Support professionals receive training and development to ensure they can respond to inquiries, from troubleshooting access and usability issues to resolving account management and other concerns. We track customer support metrics, including customer satisfaction, first call resolution, and quality. By continuously capturing insights into the markets we serve, evolving customer needs, the potential application of new technologies and business models, and the actions of competitors and disrupters, we inform our strategic and operational priorities. This includes organic investments and strategic acquisitions. (Information about our acquisitions during the year can be found on page 164). We invest significant resources in our products and services, and the infrastructure to support them. Responsibilities for product development encompass numerous colleagues and is overseen by business area CEOs. We leverage user-centred design and agile development methods and customer analytics to invest in new and enhanced technologies to provide content and innovative solutions that help our customers achieve better outcomes and enhance productivity. ESRS S4 Consumers and end users 228 RELX Annual Report 2024 | Financial statements and shareholder information |
| We engage externally to understand the perspectives of potentially vulnerable customers and end-users, where appropriate. For example, we apply best practice from the RELXAccessibility Policy across hundreds of digital products and websites. We work closely with university disability services departments, using surveys and interviews to understand how to better serve students with disabilities. For more information on the RELX Accessibility Policy see page 218. As a global provider of information-based analytics and decision tools for professional and business customers, we adhere to applicable laws and regulation on data protection and privacy. Channels to raise concerns (S4-3) Customers and end-users can report Code-related concerns, including about human rights in relation to RELX operations, through the RELX Integrity Line. In 2024 we did not receive any reports through the Integrity Line or other reporting channels from individuals who self-identified as customers. For more information on the Integrity Line see page 43. Reporting persons are protected against retaliation through provisions in our Code ofEthics and Business Conduct and in accordance with relevant locallegislation. Concerns related to our product offerings or content can be raised directly with sales and customer service representatives or through the mechanisms available on the RELX website. Consumers and end-users are made aware of reporting channels through clear and publicly available information. Targets (S4-5) We set annual objectives that advance positive impacts on consumers and end-users. These objectives are informed by customer engagement metrics and set by our internal Corporate Responsibility Forum. Progress against objectives are reported back to this group twice a year. Targets relating to customers, our unique contributions and our governance structures can be found on page 211. For 2024 our target was to increase the number of unique users ofthe RELX SDG Resource Centre by 15% over the prior year. For performance against these targets see page 41. No targets have been set in relation to other IROs associated with consumers and end-users as the relevant policies have already been adopted across the business and do not require target setting for effective implementation. The use of annual objectives monitored by the CRForum provides necessary momentum. RELX Annual Report 2024 | Sustainability statement and other corporate responsibility disclosures 229 Market segments Governance and shareholder information Financial statements Financial review Corporate responsibility Overview |
| Material IROs (ESRS 2 SBM-3) Effective governance policies and procedures enable us to build our business for long-term sustainable growth, build trust with stakeholders, avoid reputational damage, litigation and fines. Our culture of integrity demands high ethical standards in the conduct of our business overseen by the Board. Business conduct (G1-1) RELX has a fully engaged Board comprising qualified professionals, with diverse backgrounds, perspectives and skill sets whose range of expertise includes: § Considerable operational experience gained in a wide range of commercial sectors and industries § Extensive experience in positions of strategic oversight and ofleading global, complex organisations through periods of transformation and disruption § A deep understanding of working with big data technologies and of leveraging technology to transform and drive value in a business § A broad understanding and significant experience of the sustainability, risk and corporate governance requirements for international listed companies § A deep familiarity with the financial and regulatory environment in the UK and US and broad international accounting, finance and tax expertise and acumen § A proven track record in implementing cultural change within organisations and an understanding of the importance of aligning business success and stakeholder interests Our Board recognises the importance of maintaining high standards of business conduct, which underpins our ability to deliver consistent financial performance, and value to our stakeholders in a manner that is aligned with RELX’s culture of integrity. For information on our corporate culture and how the Board monitors corporate culture see page 90. The Board has oversight responsibility of RELX’s corporate governance and their role and function is explained fully in the Corporate governance section (see pages 87-88). Business Conduct is a part of the RELX Compliance Programme. The Chief Compliance Officer presents to the Board once a year and the Board’s Audit Committee twice a year on alleged violations of the Code and substantiated violations of the Code. The RELX Chief Compliance Officer reports to the RELX Chief Legal Officer and Company Secretary, who is a direct report to the CEO and a member of the RELX Business Leaders, providing oversight of the RELX Compliance function. The RELX Compliance Committee is made up of senior Legal, Compliance, Finance, and HR representatives from RELX and its business areas. Each RELX business area has its own Compliance Committee comprised of senior leaders in the business. These compliance committees help to provide oversight over business conduct and the implementation of the compliance programme. The Code also requires our leaders and managers to act as role models with respect to the Code’s principles and to help employees understand and uphold the Code’s ethical standards. The pillars of our compliance activities include conducting periodic compliance risk assessments; implementing effective policies, procedures, training and communications; overseeing misconduct reporting channels, investigations processes and remediation efforts; and monitoring and auditing internal controls. We engage in a legal and compliance risk assessment twice a year to identify the top legal and compliance risks to the Company. The RELX Operating and Governance Principles further describe the process, policies and controls to manage risk. OurCode sets the standards of behaviour for all RELX employees and is reviewed by the Board every three years. The Code addresses business conduct issues such as fair competition, anti-bribery, conflicts of interest, employment practices, data protection and appropriate use of company property and information. It also encourages reporting of violations – with an anonymous reporting option where legally permissible. We maintain a comprehensive set of other compliance policies and procedures in support of the Code and our risk areas that are reviewed annually. The RELX Compliance Programme is reviewed by an independent third party every three years and assessed internally in years between independent reviews. Full and part-time employees receive mandatory training onthe Code – both as new hires and regularly throughout their employment – on key Code topics such as maintaining a respectful workplace, preventing bribery, competing fairly, and protecting personal and company data. Mandatory training is supplemented by advanced in-person training for those in higher-risk roles or regions. Temporary staff and apprentices are also assigned training. We offer several reporting channels to report Code-related concerns, including managers, human resources staff, Compliance Committee members, Company lawyers as well as an Integrity Line. For more information on reports of violations of the Code and the Integrity Line see page 43. Prevention and detection of corruption and bribery (G1-3, G1-4) To manage bribery risk, RELX maintains a robust anti-bribery compliance programme, including compliance leads within each business and a centralised compliance team within the Corporate function, led by the Chief Compliance Officer (CCO). RELX maintains and implements its anti-bribery compliance programme at a central level and has developed a suite of compliance tools to support that programme. The efforts described below are how RELX manages its material impacts, risks and opportunities related to preventing corruption and bribery. We remain diligent in our ongoing efforts to ensure compliance with applicable anti-bribery laws. Our preventing bribery programme includes a policy; due diligence guidance and forms; gifts and entertainment limits; a Gifts and Hospitality Register; an annual all-staff gifts and hospitality certification process; biennial risk assessment; and rules on doing business with Government officials. Each RELX business area conducts risk-based due diligence on certain third parties who represent us or act on our behalf. Such due diligence includes the use of third party-questionnaires, references and detailed electronic searches using a RELX product marketed and sold specifically for this purpose. Anti-bribery training is delivered to all employees every other year, it will next be conducted in 2025. Higher risk functions and regions are identified at business level and they are given advanced bribery training. The functions which tend to receive supplemental anti-bribery training are business development, sales, marketing, government affairs, and procurement. RELX Compliance conducts a biennial Bribery Risk Assessment, ESRS G1 Business conduct 230 RELX Annual Report 2024 | Financial statements and shareholder information |
| designed to ensure that management has clear visibility regarding material inherent bribery risks to the business, as well as the status and effectiveness of ongoing mitigation efforts to address the risks. RELX Compliance conducts a biennial quality review to assess and report on the extent to which each RELX business area follows policy and procedures to ensure that effective due diligence is conducted on their respective intermediary and high-risk distributor populations. RELX has established processes and procedures for investigating bribery-related concerns, including implementing recommendations arising from those investigations. RELX Compliance is responsible for investigating or overseeing the investigation of bribery-related allegations that arise in the business areas to ensure objectivity and impartiality. Alternative escalated investigation channels are available if the implicated individual is of a particular level of seniority or other concerns about objectivity are present. The CCO reports violations trends to the Compliance Committees and the Audit Committee. RELX has had no convictions, fines, or penalties associated with violating anti-corruption and/or anti-bribery laws in 2024. Management of relationships with suppliers (G1-2, G1-6) RELX has a diverse supply chain with suppliers located in over 150 countries. These suppliers are spread across multiple categories including technology (e.g. software, cloud, hardware, and telecom), indirect (e.g. consulting, marketing, contingent labour and travel), and direct (e.g. data/content and production services, print/paper/bind, distribution). Our SupplierCode of Conduct terms, committing suppliers to certain social and environmental requirements, are included in RELX contract templates. For more information on the Supplier Code ofConduct see the policies table on page 217 and the Supply Chain section on page 57. Standard payment terms are also included in RELX contract templates and PO terms. RELX’s standard payment terms are net 45 days from receipt of a valid invoice. RELX is committed to paying all suppliers regardless of size within agreed payment terms and our payment practices/operations are designed to pay within the terms contained in the various vendor contracts. The average time to pay an invoice in 2024 was 25 days. While we aim for consistency across the supply base, different payment terms are sometimes agreed with certain suppliers. The largest volume of suppliers having different terms are STM Editors and Authors who in aggregate account for around 18% of all supplier payments and were, on average, paid in under 15 days in 2024. This data is based on payments made across our largest finance systems representing approximately 90% of total invoices paid across the group. RELX works with numerous suppliers globally and engages in ethical pay practices, as noted above. While at any given time there could be an occasional invoice dispute with a supplier that we work to mutually resolve, such instances are de minimis. Political influence and lobbying activities (G1-5) We engage in public policy discussions when relevant to our business areas. These topics include data security, data privacy, access to quality information, and policies that enable and support institutions to identify and combat fraud and corruption at scale. We strive to help policymakers around the world understand our business, innovations and our contributions to the public interest. We engage directly as well as through trade associations, policy organisations and third parties. Lobbying activities are managed by the RELX Government Affairs teams under the oversight of the Director of Corporate Affairs and, in coordination with our legal teams, are vetted, tracked and reported as required by law. RELX is registered in the EU Transparency Register (Registration Number 338398611148-62). The Code and a related supplemental policy also address corporate political contributions. Corporate political contributions are strictly prohibited except in the US, where contributions and activities are permitted in certain US states within allowable limits, if they comply with stringent reporting and disclosure regulations. RELX Inc. corporate political contributions require senior level review and approval and are reported as required by law. In 2024, RELX Inc. made $198,000 of political contributions in states where permissible and made no in-kind political contributions. Corporate contributions are made on a bipartisan basis and no funds are donated for presidential campaigns or any other federal-level campaigns. We define the administrative, management and supervisory bodies as the Board and senior executives. No members of these bodies have held comparable positions in public administration in the two years preceding their appointment. RELX Annual Report 2024 | Sustainability statement and other corporate responsibility disclosures 231 Market segments Governance and shareholder information Financial statements Financial review Corporate responsibility Overview |
| Information incorporated by reference The following disclosure requirements are incorporated by reference to other parts of the Annual Report: Standard Disclosure requirement AR Page ESRS 2 SBM-1 Total revenue 147 ESRS 2 GOV-3 Integration of sustainability-related performance in incentive schemes 106 ESRS 2 GOV-5 Description of scope, main features and components of risk management and internal control processes and systems in relation to sustainability reporting 74 ESRS 2 SBM-1 Number of employees (head count) by geography 151 ESRS 2 SBM-2 Description of stakeholder engagement 93-96 ESRS 2 GOV-1 Diversity of the Board and Executive Management 100 ESRS E1 SBM-3 Type of climate-related risk 240-241 ESRS E1 SBM-3 Climate resilience analysis 238 ESRS E1 SBM-3 Time horizons applied for resilience analysis 236 ESRS E1 GOV-3 Disclosure of whether and how climate-related considerations are factored into remuneration of members of administrative, management and supervisory bodies 106 ESRS E1 IRO-1 The undertaking shall describe the process to identify and assess climate-related impacts, risks and opportunities 74, 239 ESRS E1 IRO-1 Explanation of how climate-related scenario analysis has been used to inform identification and assessment of physical risks over short, medium and long-term 237 ESRS E1-8 Carbon pricing scheme by type 237 ESRS S1-17 Number of complaints filed through channels for people in own workforce to raise concerns 43 ESRS S2-1 Disclosure of general approach in relation to respect for human rights relevant to value chain workers 57-58 ESRS S2-1 Disclosure of general approach in relation to measures to provide and (or) enable remedy for human rights impacts 57-58 ESRS S2-1 Disclosure of extent and indication of nature of cases of non-respect of the UN Guiding Principles onBusiness and Human Rights, ILO Declaration on Fundamental Principles and Rights at Work orOECD Guidelines for Multinational Enterprises that involve value chain workers 57-58 ESRS S2-2 The undertaking shall disclose whether and how the perspectives of value chain workers inform its decisions or activities aimed at managing the actual and potential impacts on value chain workers 57-58 ESRS S2-3 Disclosure of processes through which undertaking supports or requires availability of channels 43, 57-58 ESRS S2-3 Disclosure of whether and how it is assessed that value chain workers are aware of and trust structures or processes as way to raise their concerns or needs and have them addressed Policies regarding protection against retaliation for individuals that use channels to raise concerns or needs are in place 57-58 ESRS S2-4 Taking action on material impacts on value chain workers, and approaches to managing material risks and pursuing material opportunities related to value chain workers, and effectiveness of those actions 57-58 ESRS S2-4 Description of processes to identifying what action is needed and appropriate in response to particular actual or potential material negative impact on value chain workers 57-58 ESRS S2-5 Performance against targets set to manage material IROs related to value chain workers 58 ESRS S4-3 Disclosure of processes through which undertaking supports or requires availability of channels Disclosure of how issues raised and addressed are tracked and monitored and how effectiveness of channels is ensured 43 ESRS S4-5 Performance against targets set to manage material IROs relating to consumers and end-users 41 ESRS GOV-1 The role of the administrative, management and supervisory bodies 87-88 ESRS G1-1 Description of how the undertaking establishes, develops, promotes and evaluates its corporate culture 90 ESRS G1-1 Description of the mechanisms for identifying, reporting and investigating concerns about unlawful behaviour or behaviour in contradiction of its code of conduct or similar internal rules 43 ESRS G1-1 Disclosure of safeguards for reporting irregularities including whistleblowing protection Undertaking is committed to investigate business conduct incidents promptly, independently and objectively 43 232 RELX Annual Report 2024 | Financial statements and shareholder information |
| RELX Annual Report 2024 233 THIS PAGE IS INTENTIONALLY BLANK Market segments Governance and shareholder information Financial statements Financial review Corporate responsibility Overview |
| 234 RELX Annual Report 2024 | Financial statements and shareholder information THIS PAGE IS INTENTIONALLY BLANK |

| RELX Annual Report 2024 | Independent Assurance Report to the Directors of RELX PLC on the Sustainability Statement 235 THIS PAGE IS INTENTIONALLY BLANK Market segments Governance and shareholder information Financial statements Financial review Corporate responsibility Overview |
| 236 RELX Annual Report 2024 | Financial statements and shareholder information CR Disclosure Standards 1 Taskforce on Climate-related Financial Disclosure (TCFD) RELX makes the following disclosures, consistent with the recommendations of the Taskforce on Climate-related FinancialDisclosure (TCFD) All Sector Guidance as required by the UK Listing Rules (Disclosure of Climate-Related FinancialInformation) (No 2) Instrument 2021. I. Governance a. Board oversight of climate-related risks and opportunities This statement has been reviewed and approved by the Board. The RELX Board oversees the internal controls and risk management practices as described on page 74. In addition, climate risk and opportunity is subject to our CR governance processes, see page 42. During 2024, the Company’s management of its climate change risks and opportunities was reviewed by the Board through discussions with and papers from the Chief Financial Officer (CFO), who is responsible to the Board for performance against climate targets; the Global Head ofCorporate Responsibility; and the Head of Group Insurance andRisk, as part of theRELX Audit Committee review of the Company’s risk management process. The Board has concluded from these reviews, that climate change has no material impact on RELX’s business in the short term and will be unlikely to have a significant impact in the medium and longer term. This is based on the review of RELX’s low sector exposure to climate change and consideration of climate change by the business in its strategy, activities, policies, annual budgets, and business plans, setting and monitoring of performance objectives, major capital expenditures, acquisitions and divestitures. During 2024, the company continued to mitigate the effect of transition and physical climate change risks as described in this statement and in the Corporate Responsibility Report. b. Management’s role in assessing and managing climate-related risks and opportunities Management in each business area is responsible for identifying customer needs and developing relevant products related to climate change. This ranges from launching and advancing scientific journals with articles on climate change, energy efficiency, and other climate-related topics; providing data and analytics that support customers in reducing their environmental impact; providing information and analytics on laws and regulations related to the environment; and holding exhibitions focused on renewable energy and low carbon solutions. Management is informed about climate-issues through quarterly business climate reporting, the certified ISO14001 Environmental Management System and by engagement with internal and external networks. For further detail of management’s role in assessing and managing climate related risks and opportunities, please see the Governance section of the Sustainability Statement on page 212. II. Strategy a. Climate-related risks and opportunities in the short, medium, and long term While we are in a low carbon intensive sector, the Board and the Environmental Checkpoint Committee continued to consider our climate-related risks and opportunities based on the scenarios in section c below. Examples of our findings for various timeframes are outlined below. The long-term time horizon aligns with the timeframe of the Paris Climate Agreement and the medium-term with our ambition to achieve net zero by 2040. Short (<10 years) – Transition risks: Policy and legal requirements relative to climate change will continue to increase, particularly in the area of climate change related disclosures. As an opportunity we anticipate increasing customer and stakeholder interest in our products and services that help customers accelerate the green transition in carbon intensive and other industries. Physical risks: Variability in weather patterns and more frequent extreme weather events mean we must advance both mitigation and adaptation strategies, including through our business continuity planning. See page 240 for further information on TCFD risks. Medium (10 to 20 years) – Transition risks: There will likely be increased pricing of GHG emissions and enhanced reporting obligations, particularly in areas like supply chain emissions; reputational damage could result if we do not show medium-term results for meeting our obligations as a signatory of The Climate Pledge and similar initiatives. Physical risks: Gradual increase of average temperatures will affect businesses we operate in some locations more than others, so we are developing country and local response plans; mean temperature rise will likely affect our suppliers as well and we will continue our due diligence related to exposure in our supply chain. Long term (20 years +) – Transition risks: Stigmatisation could result if our products and services are not seen as part of the solution to climate change; this creates an opportunity for us to increase offerings that support a lower carbon future. Physical risks: Sea level rise will be varying but worse under the business as usual scenario which will increase risk of business interruption and damage to property; we recognise that this must be part of our planning for the places where we will operate. Risks and opportunities have been identified through the risk management process, as described in Governance above and detailed on page 74, and through working groups such as the Corporate Responsibility Product Group, CR Forum and other networks. |
| RELX Annual Report 2024 | CR Disclosure Standards 237 Our carbon action hierarchy is to first, reduce our carbon emissions; second, to purchase increasing amounts of green tariff energy as availability improves in global markets where we operate; and third, to purchase certified renewable energy certificates where necessary. Our performance reporting is based on our gross emissions. RELX is committed to achieving net zero emissions following our carbon action hierarchy across all Scopes by 2040 at the latest, including through our participation in The Climate Pledge. b. Impact of climate-related risks and opportunities on our business, strategy, and financial planning In 2024, energy represented less than 1% of the RELX cost base. Although energy costs, and associated carbon costs, may increase substantially, the impact on RELX’s financial results is likely to remain limited and will not have a material impact onRELX financial planning as described in Governance above. While we do not believe climate risk will have a material impact on our revenue, there is careful review within the relevant business areas to assess impacts of providing products and services that help customers with their energy transition. We are using the climate scenarios we outline below to inform strategy and financial planning at both the Board and business area level. In the year, we continued a cross-business review of climate-related risks and opportunities. Printed and face-to-face products and events, responsible for 17% of total revenue, face more exposure to risks such as weather-related logistics disruption than do our digital offerings; see Principal Risks on page 74. We operate a real internal carbon pricing scheme, levying a fee onScope 1, Scope 2 and certain Scope 3 emissions categories for all RELX businesses globally. The proceeds of the internal carbon pricing scheme form the carbon fund which is used to finance sustainability-related projects as funds allow. The internal carbon price was set in line with the UN Global Compact ambition to reach $100/tCO2e over time. RELX uses an escalating carbon price which increases each year. In the reporting period the internal carbon price was $40/tCO2e, applied to 37,790 tCO2e equating to 100% of Scope 1, 100% of Scope 2 and 9% of Scope 3 emissions. We are factoring climate change into strategy planning for our portfolio as our scientific research information, analysis of environmental law, tracking of carbon and recycling markets, among other products and services, becomes increasingly important for our customers, investors and other stakeholders in their own responses to climate change. A small proportion of customers operate in carbon intensive industries, including agriculture and aviation, and we are committed to supporting them, and those in other industries, with their energy transition. In Risk, Cirium, which serves the aviation sector, has advanced its improved methodology for calculating flight emissions; helping airlines better plan and conduct maintenance of their fleetto ensure efficient operation; and identifying flight routes for maximum occupancy so emissions per passenger are lower. Elsevier is working to support clean energy. It continues to implement its Energy with Purpose mission statement to commission only new book content that advances the energy transition and reduction of carbon emissions. Environmental science journals include a focus on renewable and clean energy. Among these are the flagship Cell Press title, One Earth, and Solar Compass, launched in conjunction with the International Solar Alliance, Joule, and new journal Nexus. The Lancet Countdown monitors the impact of climate change on global health. We also continue to review our editorial boards to ensure they include expertise in these areas and include a greater representation from the global south. The Elsevier Energy Books team likewise will only commission new content that advances emissions reductions and the energy transition. Elsevier discontinued Geofacets, an earth science tool, in 2023 and discontinued Gulf Professional Publishing in 2024. LexisNexis Legal & Professional provides LexisPSL Environment to help clients identify environmental liabilities, understand the commercial implications of environmental law and keep track of current developments with daily news feeds on new cases, legislation, and consultations as well as practice notes, Q&As, and legal precedents. RX holds World Future Energy Summit, a portfolio of events specifically designed to combat climate change, in line with theUnited Nations Sustainable Development Goals (SDGs) and theParis Agreement. As part of its Net Zero Carbon Events commitments requiring signatories to reach net zero by 2050 atthe latest and to halve greenhouse gas emissions by 2030, RX continued participation in working groups to advance measurement of event-related emissions in the year. All RELX business areas are contributing content to the RELX SDG Resource Centre which provides free access to news, research, tools and events on the SDGs, including SDG 7 Clean and Affordable Energy and SDG 13 Climate Action. The site also incorporates relevant content from key partners, including the UN Global Compact (UNGC). In support of COP29, we released a climate change special issue on the RELX SDG Resource Centre, a curated list of journal articles and book chapters to inspire positive environmental action and further climate research. Market segments Governance and shareholder information Financial statements Financial review Corporate responsibility Overview |
| 238 RELX Annual Report 2024 | Financial statements and shareholder information c. Resilience of the organisation’s strategy, taking into consideration different climate-related scenarios, including a 2°C or lower scenario We have a threefold strategy to address climate-related risks: 1.Minimising our environmental impact through measures such as energy efficiency, renewable energy, reducing waste and other measures. This reduces our exposure to future legislation and the rising price of carbon 2. Providing products and services which support customers through their transition to a low-carbon economy. We anticipate demand for these offerings to continue to increase over time 3. Supporting wider action on climate change through collaboration, partnerships and initiatives such as the Digital Impact of Media Project in conjunction with the Responsible Media Forum, comprised of industry peers, and Bristol University The Board and the Audit Committee as part of robust risk control measures covering our products and operations (including our property portfolio and supply chain) ensures management of both the transition and physical risks of climate change. The Environmental Checkpoint group provides data on climate change metrics and advice to the Board and also engages people throughout the business. We gain and share best practice through engagement with the UNGC, the Climate Pledge, Media Climate Pact, Net Zero Carbon Events, and the Science-based Targets initiative, among others. We have considered three possible future scenarios and estimated possible timeframes. They are not exact descriptions of an expected future, but provide an outline description of each based on certain assumptions. In scenarios where extreme weather events occur more frequently, we may see increased incidents that disrupt our operations, necessitating additional measures, with some potential cost, to ensure our operational resilience. However, in the context of RELX’s overall cost base, we would not expect any such incremental cost to be significant. We believe our strategy will be resilient even in the most challenging future scenario. Scenario 1: Business as usual (RCP 8.5). In this scenario, carbon emissions continue to increase at current rates and temperature increases exceed 4°C by the year 2100. Short term: While some policies could be introduced to reduce carbon emissions, action is limited. Some countries may price carbon emissions and set standards for building and vehicle energy efficiency. Medium term: The availability of renewable energy may grow, butthe share of energy from fossil fuels will remain sizeable. With this level of warming, extreme and severe weather events will likely increase. Drought and increased precipitation will impact agriculture. Severe storms will interfere with our supply chains and logistics. The heightened need for innovation in climate adaptation infrastructure may increase demand for our environmental products and services for the scientific, technical and other communities. Long term: Rising sea levels will affect land use of coastal and low-lying regions where we may have operations, requiring investment to protect or relocate key company facilities to ensure business continuity. Significant government investment will be required to mitigate the impacts, for example in strengthening flood and coastal defences or securing reliable water supplies, with follow-on effects for places where we and future customers operate. Political instability in some regions may increase as populations compete for resources such as fresh water supplies and as large numbers of people move from regions most heavily impacted by climate change. Global economic uncertainty will likely become the norm, with limited growth at best and decline at worst. There will likely be significant health impacts as well. As impacts become more apparent, public sentiment may favour organisations such as RELX that have taken action to limit the impact of climate change. We would continue to pursue measures such as science-based carbon reductions, implementation of innovative technological solutions, carbon sequestration and (re)forestation, but without the catalyst of global government investment in these areas. Scenario 2: 2°C climate change (RCP 2.6). In this scenario, carbon emissions are halved by 2050 and climate change does not exceed 2°C by the year 2100. Short term: Countries would introduce more challenging carbon targets as they update their Nationally Determined Contributions under the 2015 Paris Climate Agreement. A range of new policies would most likely be introduced across many countries to control carbon emissions including carbon pricing, higher standards on building and vehicle energy efficiency, with increased renewable energy generation in global power grids. Such developments will be reflected in our policies and procedures, and could increase the demand for our climate-related products and services. Medium term: There would likely be public and private investmentin greater carbon sequestration, capture and storage, (re)forestation, and other measures. Long term: The frequency of extreme weather events will increase but not as much as under Scenario 1. There will still be disruption to transport and logistics through storms, but sea level rise will be more limited, as will costs we may face associated with adaptation and mitigation projects. With reduced climate impacts, political and economic instability will be lessened. Climate-related migration will still be a factor but to a smaller degree than anticipated under Scenario 1. Scenario 3: 1.5°C climate change (RCP1.9). In this scenario, to achieve a 66% chance of avoiding more than 1.5°C warming by 2100, inclusive and sustainable development will be a key consideration for policy makers with high levels of international cooperation. Short term: Emissions must peak before 2025 to achieve net zero emissions by 2050, These ambitious carbon reductions would be supported by new policies (with carbon prices reaching as much or more than four times the price under the 2°C scenario) and strong regulation. Medium term: Buildings will be subject to tougher standards to achieve carbon reductions of nearly three times those under the 2°C degree scenario. Energy costs and associated carbon costs could be higher than in Scenario 1 or 2, but this is unlikely to have a major impact for RELX as energy is not a significant part of our cost base as indicated above. The transport sector will see significant change, with the majority of vehicles powered by alternative sources. Nature-based solutions to climate change, such as forestation, are also likely to play an important role. In this scenario, RELX products that help customers reduce emissions, find technology-driven carbon solutions and pursue nature-based decarbonisation will be in greater demand. Long term: By 2050, approximately 80% of global energy should be from renewable sources. Use of coal will decrease significantly and use of oil will drop to very low levels by 2060, which may impact the energy costs paid by RELX. After 2050, technologies such as bioenergy and carbon capture and storage will need to be widespread to remove excess carbon from the atmosphere to ensure emissions are net negative. |
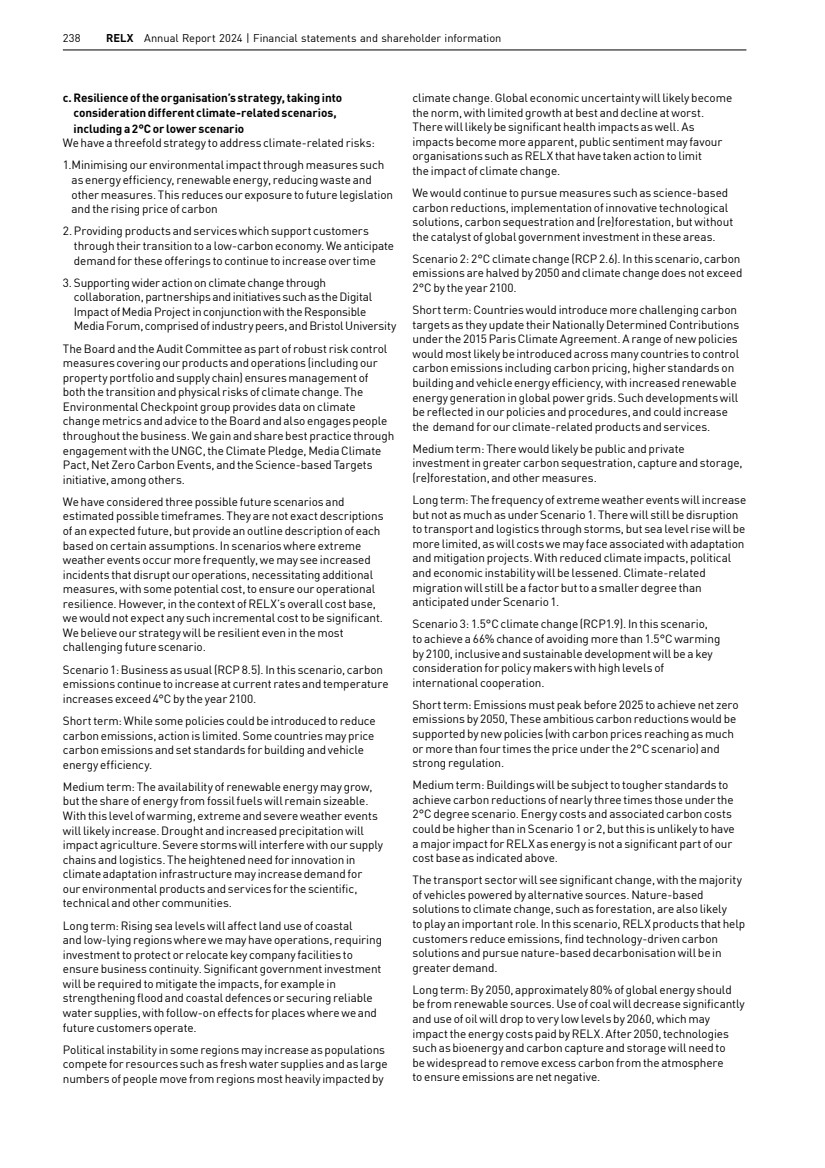
| RELX Annual Report 2024 | CR Disclosure Standards 239 III. Risk management a. Our processes for identifying and assessing climate-relatedrisks The principal and emerging risks facing the business, which have been assessed by the Audit Committee and Board, are described on pages 74 to 79. The Directors have considered the risk of climate change to the business, including the positive contribution that RELX makes through activities such as supporting academic research, pricing recyclable materials, and enabling customers to access our products electronically. Climate-related risks are assessed as part of the RELX risk management process. Risks are formally reviewed every six months. Each risk is assigned a significance based on the potential impact to revenue and the likelihood of that risk being realised. As part of our Environmental Management System, climate risk assessment covers transition and physical risks as described above and below, and also includes the assessment of existing and emerging regulatory requirements related to climate change. These include carbon pricing schemes, taxes and additional reporting requirements. No operations are excluded from the assessment. Risks are considered in the short term, medium term and long term. b. Our processes for managing climate-related risks Climate change responsibilities are assigned to key roles, including the CFO at the executive level. Performance is monitored and evaluated throughout the year by the Environmental Checkpoint Group, chaired by the CFO, and new programmes are introduced as required to control climate-related transition and physical risks. On legislative and product trends, we gain insights through our Government Affairs teams, external fora such as the Aldersgate Group, and ISO 14001 environmental certification of our EMS. We speak with experts in the business, our climate-related Employee Resource Groups including Green Teams and Elsevier’s Climate Board, and learn through industry specific networks such as the Responsible Media Forum’s Climate Pact and cross-sector networks like the CR and Sustainability Council of the Conference Board. The business continuity programme, under the direction of the RELX Business Continuity Forum, oversees mitigations of climate change physical risks on our operations through business continuity plans which include remote working and detailed employee information. We mitigate potential climate-related risks on our supply chain through supplier management practices in the Global Procurement team, the Supplier Resiliency Working Group, theBusiness Continuity Forum and the Socially Responsible Supplier programme, which includes supplier engagement on their activities and policies, and a risk-based programme of supplier audits and remediation. High-level net zero roadmap RELX carbon emissions are in line with the reductions required to ensure climate change of no more than 1.5ºC. To achieve net zero across all Scopes by 2040 at the latest, we are following a broad programme of action to achieve further reductions. This will include developing products and services that support the transition to a net zero economy, alongside actions to reduce our emissions. Short term § Continue office space consolidation in line with the working preferences of colleagues § Migration from owned data centres to more energy efficient third party cloud providers § Purchase of renewable energy equal to RELX’s global electricity consumption § Continue to quantify and report on Scope 3 emissions from our supply chain and value chain § Engage suppliers to adopt 1.5ºC aligned carbon reduction targets Medium term § Transition company car fleet to zero emission (e.g. electric) vehicles § RELX renewable energy purchases in more markets § Encourage purchase of renewable energy by suppliers Longer term § Purchase of carbon neutralisation offsets for residual emissions IV. Metrics and targets We aim to provide additional insight into revenue from products and services designed for a low carbon economy in subsequent disclosures. Scope 1 and 2 (location-based) emissions reduction targets and energy reduction targets are set out on page 61. The remuneration of the CEO and the CFO is linked to the achievement of environment targets. These included in 2024, a key performance objective to reduce Scope 1 and Scope 2 (location-based) carbon emissions by 28% against a 2018 baseline, with 61% achievement and to reduce energy and fuel consumption by 24% against a 2018 baseline, with 53% achievement. See page 160 for further details. In the year, we reported performance against our $3bn committed bank facility which has pricing linked to three sustainability performance targets. In each year, the cost of the facility is reduced if two or more sustainability targets are achieved and increased if two or more of the targets are missed. The targets relate to carbon emissions reduction, as well as increasing the unique users and the amount of content available on the RELXSDG Resource Centre. All three targets were achieved. See page 36 for performance reporting. Market segments Governance and shareholder information Financial statements Financial review Corporate responsibility Overview |
| 240 RELX Annual Report 2024 | Financial statements and shareholder information TCFD Risks We have considered climate-related risk areas detailed in the TCFD guidance as detailed below. While we do not believe climate-related risks will have a material impact on our business, we have highlighted risks areas which present the most opportunity for us to support the net zero transition. Risk group Type Climate-related risk Implication Opportunity Transition risks Policy and legal Increased pricing of GHG emissions: The rapid transition to a low carbon energy system could require higher energy prices and a higher carbon price to disincentivise the use offossil fuels RELX has low exposure to energy and carbon pricing (less than 1% of total spend) and has achieved significant reductions in energy consumption since 2010. For this reason, moderate to significant increases in energy costs will have a limited impact on RELX. There will be an increased need for information on energy and carbon pricing; research on energy transition and zero carbon; and the need for events which bring stakeholders together to showcase related technological innovation are likely to increase the demand for RELXproducts and services. Enhanced emissions-reporting obligations: Anincreasing number of governments are likely to impose requirements on business to achieve the low carbon transition. New requirements are likely to include additional reporting and transparency requirements for GHGemissions RELX has processes in place for carbon reporting and disclosure aligned with various best practice frameworks. Additional reporting requirements are expected to have insignificant financialimplications. Widespread introduction of different reporting regimes in the countries where we operate could increase the risk of non-compliance (and therefore the risk of fines). However, RELXoperates an environmental management system certified to ISO 14001 which requires a compliance assessment with environmental legislation. This reduces the risk of non-compliancewith future reporting regulations. As new regulations are introduced, there will be a greater need for guidance; this could result in an increased demand for our risk, science, legal and other products and services. Mandates and regulation affecting existing products and services: New regulations may be introduced for products to support the transition to a low-carbon economy RELX delivers products and service primarily in three ways: i) online/digital; ii) printed products; iii) in-person events. Increasing regulation on products in these areas could result in an increased cost for providing those products and services. Online/digital: Products served by RELX-owned data centres are covered by the purchase of renewable electricity and RELX’s net zero commitment. RELX is engaging with Scope 3 suppliers for greater transparency on our share of their carbon emissions and renewable energy. Printed products: Revenue from printed products has decreased significantly since 2010 as more product offerings are made online. Paper used in RELX’s printed products complies with the RELX Sustainable Paper Policy which requires all papers are from known and sustainable sources and/or certified to a recognised standard. In person: Exhibitions is part of an events industry initiative, NetZero Carbon Events, working to achieve net zero by 2040. This commitment requires significant reductions in carbon emissions and partnerships with other industries to minimise events-related emissions. A small proportion of our customers operate in carbon-intensive industries, and less than 1% of the journals we produce specifically cover content related to hydrocarbon; we continue to ensure they focus on supporting relevant customers in their energy transition. New regulations on products will, in many cases, be best addressed through industry collaboration. Our convening power in the markets we serve can support such industry collaboration. Technology Substitution of existing products and services with lower emissions options RELX has largely transitioned from printed physical products to online/digital products and services. This avoids the emissions associated with the manufacture and distribution of printed products but introduces emissions associated with the use of data centres for the digital offerings. RELX-owned data centres are covered by renewable electricity and RELX’s net zero commitment. As described, we are engaging with our cloud providers for greater transparency on carbon emissions and renewable energy. Our products, services and events aid the low-carbon transition benefitting our customers and society. Costs to transition to lower emissions technology The cost implications for transitioning to new technology are primarily in our supply chain. Printed products are manufactured and distributed by suppliers onbehalf of RELX. RELX engages its suppliers through the Socially Responsible Suppliers programme andhas processes in place for reporting on its supply chain-related emissions. Detailed energy and carbon market insights we can provide through our products, services and events will allow companies to better assess the risks and costs of transitioning to lower emissions technologies. |
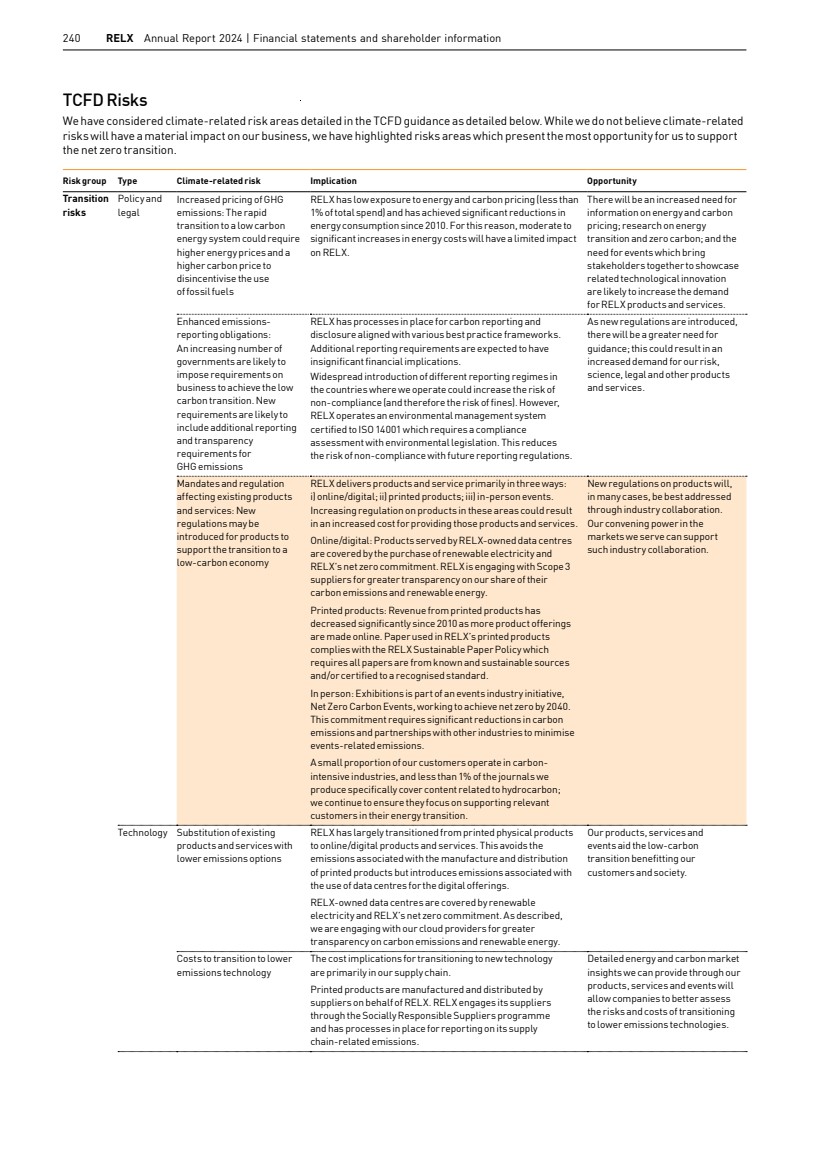
| RELX Annual Report 2024 | CR Disclosure Standards 241 Risk group Type Climate-related risk Implication Opportunity Market Changing customer behaviour Significant increases to the cost of air travel due to the factoring in of carbon charges may discourage business travel in favour of virtual meetings. This could lead to a reduction in the number of attendees at in-person events affecting our events business. We offer virtual attendance options and in-person participation allows exhibitors and attendees tohold numerous meetings during one event. The ability for an exhibitor or event attendee to maximise engagement by attending one event, for example, with customers, prospects, and suppliers, can become more valuable as the cost of travel increases. Uncertainty in market signals As businesses take action to combat climate change, they might need to change business models or practices to ensure their success in a low-carbon economy. Some of these changes may raise questions for investors or other stakeholders and reduce visibility ofthe business’s strategy. RELX provides detailed and transparent disclosure on climate change to provide clarity to investors and other stakeholders. Businesses can develop new disclosures to effectively communicate plans with stakeholders. The demand for our products which provide company and market insights could grow as investors’ requirements for reliable information and data increases. Increased cost of rawmaterials: Low-carbon requirements on the use, and distribution, of raw materials could lead to an increase in their cost RELX does not manufacture products from raw materials. Anincrease in the cost of raw materials would primarily impact RELX via higher prices in our supply chain. Pricing insights in key supply chains such as chemicals and plastics are provided within our Risk business. If cost and price volatility increases, there could be a greater demand for such products and services. Reputation Shifts in consumer preferences Business customers may become more aware of environmental concerns and expect a high standard of performance from companies. Over time, this may lead to a decrease in demand for carbon intensive products as consumers move to low emissionalternatives. While we do not produce consumer products, we do serve a variety of industries and can support their efforts to decarbonise through our products, services and events. Stigmatisation of sector: Products and services offered to carbon-intensive industries could result in negative public reaction We offer products and services across a wide range of industries, some of which are carbon-intensive industries. We are working to support these industries in their transition to a low-carbon economy. Industries which face the greatest challenges in decarbonisation will need support, information and tools. We will continue developing new products and services to assist these industries in their decarbonisation efforts. Increased stakeholder concern or negative stakeholder feedback: Poor performance could result in negative feedback from stakeholders such as investors or colleagues RELX sets environmental targets on a five-year cycle and has a validated Science Based Target which aligns its emissions reductions with those required to meet the 1.5°C ambition of the Paris Agreement. Maintaining good environmental performance provides a reputational benefit with our stakeholders, including investors. Strong environmental performance and commitments may be reflected in improved or lower cost financing. Physical risks Acute Increased severity of extreme weather events such as cyclones and floods: severe weather could interrupt normal business operations RELX operates a comprehensive business continuity programme to ensure colleagues can work remotely and be informed should a location be impacted by severe weather conditions. This allows the business to function despite the impact of the severe weather. As risks associated with weather events increases, insurance premiums paid by RELX could increase. We provide products that help to assess and quantify insurance perils. As insurance premiums increase, demand for these products will likely grow as insurance providers seek more accurate weather-related risk assessments. Chronic Changes in precipitation patterns and extreme variability in weather patterns: Such changes could affect agricultural processes Printed products require supply of wood from sustainable forest sources. Changes in precipitation and weather patterns could disrupt the growth in forest sources known to be sustainably managed which could increase the price of sustainable paper. RELX has flexibility in the types of paper used and the forest sources of these papers which allows purchases to be made elsewhere should the need arise. As amember of the Book Chain Project, we assess the sustainability of a large number of papers, allowing us to consider alternatives. We offer products that use data analytics to help increase the efficiency of land use in areas such as water consumption. Demand for such products could grow as a response to decreasing yields due to weather. Rising mean temperatures: The gradual increase of average temperatures is a factor of climate change Climate change will affect temperatures differently in different locations. This means that, over time, the operation of some offices will become less efficient as they may need to maintain physical working conditions close to or outside the range for which they were designed. This could lead to an increase in operational costs as more energy will be required for cooling. Rising mean temperatures will require government to review, and businesses to implement, new building standards and guidelines. Our business areas would produce guidance to assist customers to interpret associated new standards and planning regimes. Rising sea levels If sea levels rise significantly there is increased risk of property damage to any RELX locations in low-lying coastal regions. This could increase insurance premiums or disrupt the working arrangements of colleagues in those locations. We have a comprehensive business continuity programme inplace to mitigate such impacts and consider climate risk inthe siting of our offices. We offer products that help to assess and quantify insurance perils risk. As insurance premiums increase, demand for these products could grow. Market segments Governance and shareholder information Financial statements Financial review Corporate responsibility Overview |
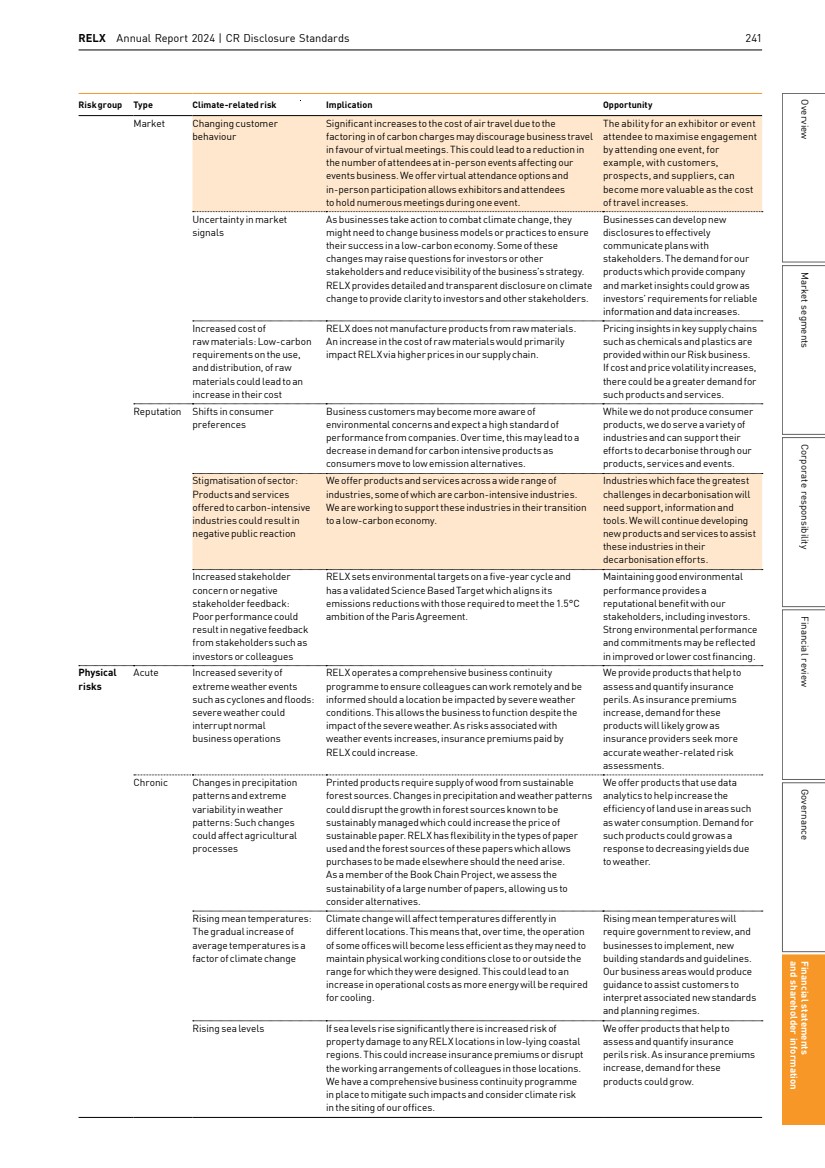
| 242 RELX Annual Report 2024 | Financial statements and shareholder information CR Disclosure Standards 2 Sustainability AccountingStandards Board (SASB) disclosure SASB Standards enable businesses around the world to identify, manage and communicate financially material sustainability information to their investors. The SASB standards are industry specific and identify the minimal set of financially material sustainability topics and their associated metrics for the typical company in an industry. SASB assigns RELX to the Professional and Commercial Services sector. The following disclosure is made according to the SASB standard for that sector. Topic Accounting metric Code Disclosure/Disclosure location Data security Description of approach to identifying and addressing data security risks SV-PS-230a.1 See page 44 Description of policies and practices relating to collection, usage and retentionof customer information SV-PS-230a.2 See page 44 (1) Number of data breaches, (2) percentage involving customers’ confidential business information (CBI) or personally identifiable information (PII), (3) number of customers affected SV-PS-230a.3 Except as a matter of public record, RELX does not disclose this information for reasons of commercial confidentiality Workforce diversity and engagement Percentage of gender and racial/ethnic group representation for (1) executive management and (2) all other employees SV-PS-330a.1 See page 36 (1) Voluntary and (2) involuntary turnover rate for employees SV-PS-330a.2 See page 52 Employee engagement as a percentage SV-PS-330a.3 See page 52 Professional integrity Description of approach to ensuring professional integrity SV-PS-510a.1 See pages 5-44 Total amount of monetary losses as a result of legal proceedings associated with professional integrity SV-PS-510a.2 Except as a matter of public record, RELX does not disclose this information for reasons of commercial confidentiality Activity metrics Number of employees by (1) full-time and part-time, (2)temporary, and (3) contract SV-PS-000.A See page 52 Employee hours worked, percentage billable SV-PS-000.B See page 52 |
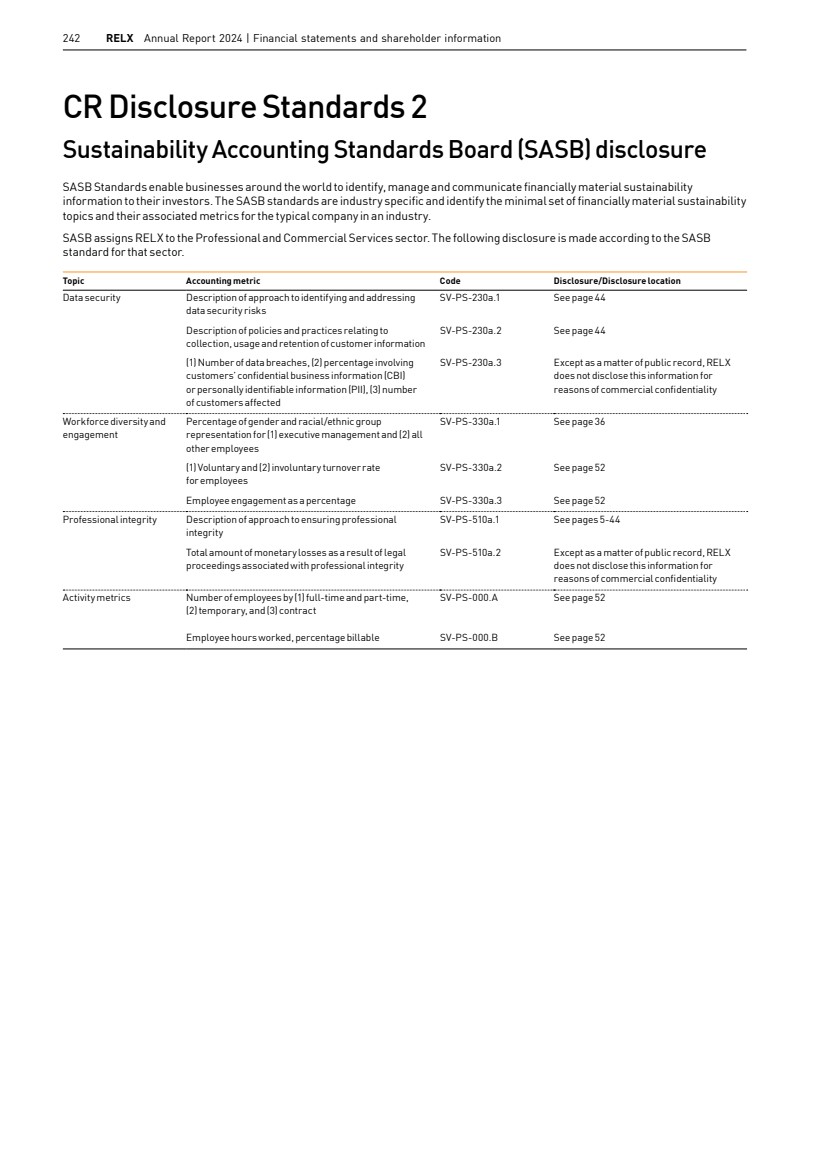
| RELX Annual Report 2024 | CR Disclosure Standards 243 CR Disclosure Standards 3 Global Reporting Initiative (GRI) Content Index and Streamlined Energy and Carbon Reporting (SECR) This report has been prepared in accordance with the GRI Standards: Core option GRI Standard Number GRI Standard Title Disclosure Title Page number GRI 102 General Disclosures Name of the organisation Title page GRI 102 General Disclosures Activities, brands, products, and services 5-33 GRI 102 General Disclosures Location of headquarters 34 GRI 102 General Disclosures Location of operations 8 GRI 102 General Disclosures Ownership and legal form 127 GRI 102 General Disclosures Markets served 8 GRI 102 General Disclosures Scale of the organisation 8 GRI 102 General Disclosures Information on employees and other workers 50-52 GRI 102 General Disclosures Supply chain 57-59 GRI 102 General Disclosures Significant changes to the organisation and its supply chain 57-59 GRI 102 General Disclosures Precautionary Principle or approach 60-65, 236-241 GRI 102 General Disclosures External initiatives 35 GRI 102 General Disclosures Membership of associations 35 GRI 102 General Disclosures Statement from senior decision-maker 3-4 GRI 102 General Disclosures Values, principles, standards, and norms of behaviour 4, 42-45, 50-52 GRI 102 General Disclosures Governance structure 35, 42-47, 86-90 GRI 102 General Disclosures List of stakeholder groups 87-98 GRI 102 General Disclosures Collective bargaining agreements 52 GRI 102 General Disclosures Identifying and selecting stakeholders 86, 93 GRI 102 General Disclosures Approach to stakeholder engagement 86, 93, 213 GRI 102 General Disclosures Key topics and concerns raised 215 GRI 102 General Disclosures Entities included in the consolidated financial statements 140-144 GRI 102 General Disclosures Defining report content and topic Boundaries 24-25 GRI 102 General Disclosures List of material topics 215 GRI 102 General Disclosures Restatements of information 36 GRI 102 General Disclosures Changes in reporting 36 GRI 102 General Disclosures Reporting period 36 GRI 102 General Disclosures Date of most recent report 22/02/24 GRI 102 General Disclosures Reporting cycle Annual GRI 102 General Disclosures Contact point for questions regarding the report 34 GRI 102 General Disclosures Claims of reporting in accordance with the GRI Standards 35, 243 GRI 103 Management Approach Explanation of the material topic and its Boundary 215, 61 GRI 103 Management Approach The management approach and its components 35, 87 GRI 103 Management Approach Evaluation of the management approach 35, 97 Streamlined Energy and Carbon Reporting (SECR) Absolute performance Intensity ratio (per GBPm revenue) 2023 2024 Change 2023 2024 Change Global Scope 1 (direct emissions) tCO2e 4,317 2,703 -37% 0.47 0.29 -39% Global Scope 2 (indirect location-based emissions) tCO2e 36,616 29,989 -18% 4.00 3.18 -20% Global energy (including vehicle fuels) MWh 115,264 92,393 -20% 12.58 9.79 -22% UK energy (including vehicle fuels) MWh 11,844 6,707 -43% 1.29 0.71 -45% UK Scope 1 and Scope 2 emissions tCO2e 2,315 1,313 -43% 0.25 0.14 -45% We report on all global operations for which we have operational control following the GHG Protocol Corporate Accounting and Reporting Standard (revised edition). Market segments Governance and shareholder information Financial statements Financial review Corporate responsibility Overview |
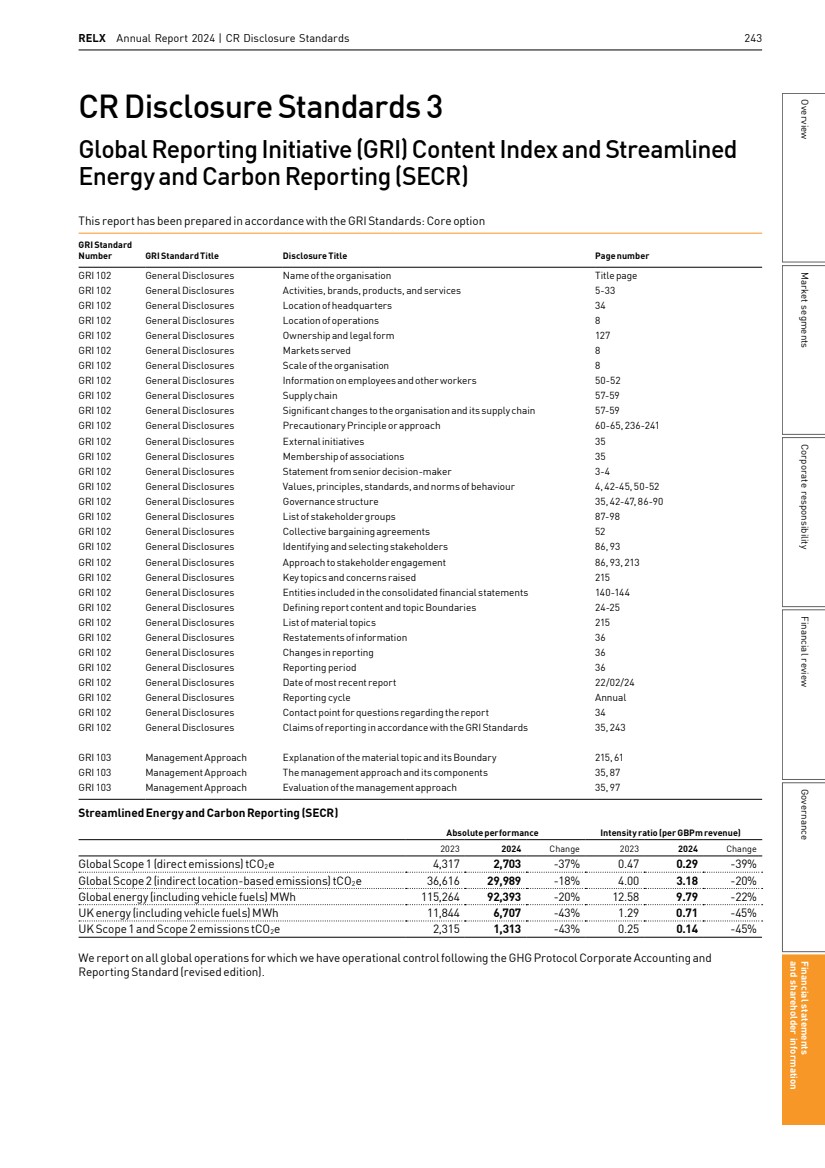
| 244 RELX Annual Report 2024 | Financial statements and shareholder information THIS PAGE IS INTENTIONALLY BLANK |

| RELX Annual Report 2024 245 Shareholder information In this section 245 Shareholder information 248 Shareholder information and contacts 249 2025 financial calendar Market segments Governance and shareholder information Financial statements Financial review Corporate responsibility Overview |
| 246 RELX Annual Report 2024 | Financial statements and other information Annual Report 2024 (the Annual Report) The Annual Report for RELX PLC (the Company) for the year ended 31 December 2024 is available on the Company’s website, and from the registered office of RELX PLC shown on page 248. Additional financial information, including the interim and full-year results announcements, trading updates and presentations, is also available on the Company’s website www.relx.com. The consolidated financial statements set out in the Annual Report are expressed in sterling, with summary financial information expressed in Euro and US dollars. Share price information RELX PLC’s ordinary shares are traded on the London Stock Exchange. RELX PLC Trading symbol REL ISIN GB00B2B0DG97 RELX PLC’s ordinary shares are traded on the EuronextAmsterdam Stock Exchange. RELX PLC Trading symbol REN ISIN GB00B2B0DG97 RELX PLC’s ordinary shares are traded on the New YorkStock Exchange in the form of American Depositary Shares (ADSs), evidenced by American Depositary Receipts (ADRs). RELX PLC ADRs Ratio to ordinary shares 1:1 Trading symbol RELX CUSIP code 759530108 The RELX PLC ordinary share price and the ADS price may be obtained from the Company’s website, other online sources and the financial pages of some newspapers. For further information visit the ‘Investor Centre’ section oftheCompany’s website www.relx.com/investorcentre Information for registered ordinary shareholders Shareholder services The RELX PLC ordinary share register is administered by Equiniti Limited. Equiniti provides a free online portal for shareholders at www.shareview.co.uk. Shareview allows shareholders to monitor the value of their shareholdings, view their dividend payments and submit dividend mandate instructions. Shareholders can also submit their proxy voting instructions ahead of Company meetings and update their personal contact details. Shareview Dealing provides a share purchase and sale facility. Equiniti’s contact details are shown on page 248. Electronic communications While hard copy shareholder communications continue to be available to those shareholders requesting them, in accordance with the Companies Act 2006 and the Company’s Articles of Association, the Company uses its website as the main method of communicating with shareholders. By registering their details online at Shareview, shareholders can be notified by email when shareholder communications are published on the Company’s website. Shareholders can also use the Shareview website to appoint a proxy to vote on their behalf at shareholder meetings. Shareholders who hold their Company shares through CREST may appoint proxies for shareholder meetings through the CREST electronic proxy appointment service by using the procedures described in the CREST manual. Dividend mandates Since June 2024, dividends have been paid by direct credit. To continue to receive RELX PLC dividends and any monies payable in connection with RELX PLC shares, shareholders must provide UK bank or building society account details to the Company’s registrar, Equiniti, so that payments can be made directly into this account. A dividend mandate form can be obtained online at www.shareview.co.uk, or by contacting Equiniti. Equiniti has established a service for overseas shareholders in over 90 countries, which enables shareholders to have their dividends automatically converted from sterling and paid directly into their nominated bank account. Further details of this service, and the fees applicable, are available at www.shareview.co.uk/info/ops or by contacting Equiniti at the address shown on page 248. Dividend Reinvestment Plan Shareholders can choose to reinvest their Company dividends by purchasing further shares through the Dividend Reinvestment Plan (DRIP) provided by Equiniti. Further information concerning the DRIP facility, together with the terms and conditions and an application form can be obtained online at www.shareview.co.uk/info/drip or by contacting Equiniti at the address shown on page 248. Shareholder information |
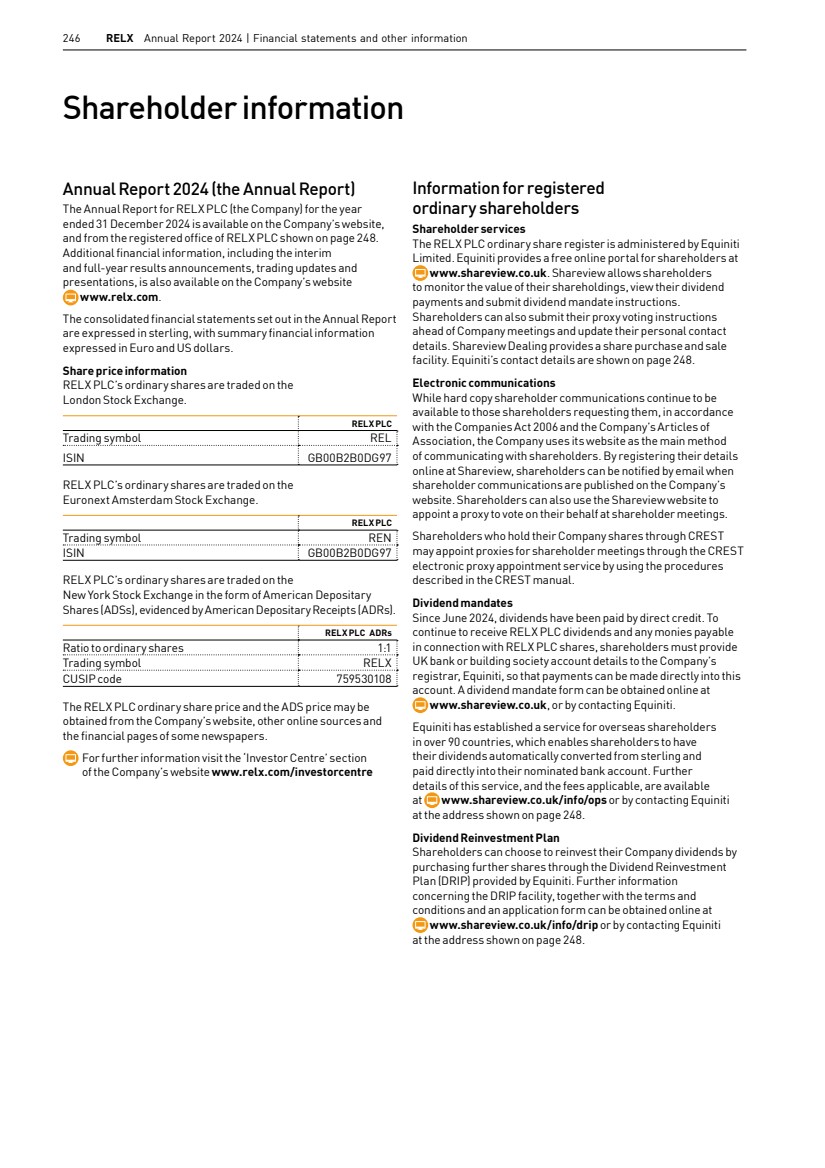
| RELX Annual Report 2024 | Shareholder information 247 Share dealing service A telephone and internet dealing service is available through Equiniti, which provides a simple way for UK resident shareholders to buy or sell their shares. For telephone dealing call +44 (0)345 603 7037 between 8.30am and 5.30pm (UK time), Monday to Friday (excluding public holidays in England and Wales), and for internet dealing log on to www.shareview.co.uk/dealing. You will need your shareholder reference number as shown on your dividend confirmation. ShareGift The Orr Mackintosh Foundation operates a scheme for shareholders with small shareholdings, that may be too small to sell economically, to make donations of shares. Details of the scheme can be obtained from the ShareGift website at www.sharegift.org, or by telephoning ShareGift on +44 (0)20 7930 3737. Sub-division of ordinary shares and share consolidation On 28 July 1986, each RELX PLC ordinary share of £1 nominal value was sub-divided into four ordinary shares of 25p each. On 2 May 1997, each 25p ordinary share was sub-divided into two ordinary shares of 12.5p each. On 7 January 2008, the ordinary shares of 12.5p each were consolidated on the basis of 58 new ordinary shares of 1451⁄ 116p nominal value for every 67 ordinary shares of 12.5p each held. Capital gains tax The mid-market price of RELX PLC’s £1 ordinary shares on 31 March 1982 was 282p. Adjusting for the sub-divisions and share consolidation referred to above results in an equivalent mid-market price of 40.72p for each existing ordinary share of 1451⁄ 116p nominal value. Warning to shareholders – unsolicited investment advice § From time to time shareholders may receive unsolicited calls from fraudsters § Fraudsters use persuasive and high-pressure tactics to lure investors into scams, sometimes known as boiler room scams § They may offer to sell shares that turn out to be worthless or non-existent, or to buy shares at an inflated price in return for an upfront payment § While high profits are promised, if you buy or sell shares in this way you will probably lose your money § Thousands of people contact the Financial Conduct Authority (FCA) about investment fraud each year How to avoid share fraud and boiler room scams The FCA has issued some guidance on how to recognise and avoid investment fraud: § Legitimate firms authorised by the FCA are unlikely to contact you unexpectedly with an offer to buy or sell shares § If you receive an unsolicited phone call, do not get into a conversation, note the name of the person and firm contacting you and then end the call § Check the Financial Services Register available at register.fca.org.uk to see if the person and firm contacting you is authorised by the FCA. If you wish to call the person or firm back, only use the contact details listed on the Register § Call the FCA on 0800 111 6768 if the firm does not have any contact details on the Register, or if you are told that they are out of date § Search the list of unauthorised firms to avoid at www.fca.org.uk/consumers/unauthorised-firms-individuals#list § If you do buy or sell shares through an unauthorised firm, you will not have access to the Financial Ombudsman Service or the Financial Services Compensation Scheme § Consider obtaining independent financial and professional advice before you hand over any money. If it sounds too good to be true, it probably is How to report a scam If you are approached by fraudsters, please tell the FCA using the share fraud reporting form at www.fca.org.uk/ consumers/report-scam-unauthorised-firm, where you can find out more about investment scams. You can also call the FCA Consumer Helpline on 0800 111 6768. If you have already paid money to share fraudsters, you should contact Action Fraud on 0300 123 2040 or use its online tool: www.actionfraud.police.uk/report_fraud Market segments Governance and shareholder information Financial statements Financial review Corporate responsibility Overview |
| 248 RELX Annual Report 2024 | Financial statements and other information Shareholder information and contacts Information for holders of ordinary shares held through Euroclear Nederland Shareholders with enquiries concerning RELX PLC ordinary shares that are not held directly on the Register of Members and are ultimately held through Nederlands Centraal Instituut voor Giraal Effectenverkeer BV (Euroclear Nederland) should direct their enquiries to the broker, financial intermediary, bank or other financial institution that holds the shares on their behalf. Dividend Reinvestment Plan Shareholders can choose to reinvest Company dividends by purchasing shares through the Dividend Reinvestment Plan (DRIP) provided by ABN AMRO Bank NV. Further information concerning the DRIP facility can be obtained via as.exchange. agency@nl.abnamro.com. Information for ADR holders ADR shareholder services Enquiries concerning RELX PLC ADRs should be addressed to the ADR Depositary, Citibank NA, at the address shown below. Dividend payments on RELX PLC ADRs are converted into US dollars by the ADR Depositary. Annual Report on Form 20-F The RELX Annual Report on Form 20-F is filed electronically with the United States Securities and Exchange Commission and is available on the Company’s website, or from the ADR Depositary at the address shown below. Dividend currency elections Shareholders appearing on the Register of Members or holding their shares through CREST will continue to receive their dividends in Pounds Sterling, but will have the option to elect to receive their dividends in Euro. Euro payments will be made by cheque only. Shareholders who appear on the Register of Members and wish to receive their dividend in Euro should contact our Registrar, Equiniti on +44 (0)371 384 2960 for a dividend election form and further information regarding the Euro dividend option. Alternatively, shareholders can view and update their current dividend elections by registering for a Shareview Portfolio at www.shareview.co.uk/register. Shareholders who hold their shares through CREST and wish to receive their dividend in Euro, must do so by following the CREST Elections process. Shareholders who hold RELX PLC shares through Euroclear Nederland (via banks and brokers), will automatically receive their dividends in Euro, but will have the option to elect to receive their dividends in Pounds Sterling. Shareholders who hold their shares through Euroclear Nederland and wish to receive their dividends in Pounds Sterling should contact their broker, financial intermediary, bank or other financial institution that holds the shares on their behalf. Contacts RELX PLC Head Office and Registered Office 1-3 Strand London WC2N 5JR United Kingdom Tel: +44 (0)20 7166 5500 Auditor Ernst & Young LLP 1 More London Place London SE1 2AF United Kingdom Registrar Equiniti Limited Aspect House Spencer Road Lancing BN99 6DA West Sussex United Kingdom www.shareview.co.uk Equiniti provide a range of services to shareholders. Extensive information including answers to frequently asked questions can be found online at www.shareview.co.uk Tel: +44 (0)371 384 2960 * Lines are open from 8.30am to 5.30pm, UK time Monday to Friday (excluding public holidays in England and Wales). Please use the country code when dialling from outside the UK. Listing/paying agent for shares listed on Euronext Amsterdam held through Euroclear Nederland ABN AMRO Bank NV Department Corporate Broking and Issuer Services HQ7212 Gustav Mahlerlaan 10 1082 PP Amsterdam The Netherlands Email: as.exchange.agency@nl.abnamro.com RELX PLC ADR Depositary Citibank Shareholder Services PO Box 43077 Providence, RI 02940-3077 USA www.citi.com/dr Email: citibank@shareholders-online.com Tel: +1 877 248 4237 +1 781 575 4555 (callers outside the US) |
| 2025 financial calendar 13 February Results announcement for the year ended 31 December 2024 24 April Trading update issued in relation to the 2025 financial year 24 April Annual General Meeting 8 May Ex-dividend date – 2024 final dividend, ordinary shares 9 May Record date – 2024 final dividend, ordinary shares 9 May Ex-dividend date & Record date – 2024 final dividend, ADRs 27 May Dividend currency and DRIP election deadline 3 June Euro dividend equivalent announcement 19 June Payment date – 2024 final dividend, ordinary shares 25 June Payment date – 2024 final dividend, ADRs 24 July Interim results announcement for the six months to 30 June 2025 31 July* Ex-dividend date – 2025 interim dividend, ordinary shares 1 August* Record date – 2025 interim dividend, ordinary shares 1 August* Ex-dividend date & Record date – 2025 interim dividend, ADRs * Please note thatthese dates are provisional and subjectto change. The 2025 interimdividend payment dates in respect of ordinary shares andADRs will be confirmed by the Company in its 2025 Interim Results announcement, currently scheduled for release on 24 July 2025. Dividend history The following tables set out dividends paid (or proposed) in relation to the three financial years 2022–2024. ORDINARY SHARES Pence per PLC ordinary share Euro equivalent (€) Payment date Final dividend for 2024** 44.8 *** 19 June 2025 Interim dividend for 2024 18.2 0.213 5 September 2024 Final dividend for 2023 41.8 0.490 13 June 2024 Interim dividend for 2023 17.0 0.199 7 September 2023 Final dividend for 2022 38.9 0.447 7 June 2023 Interim dividend for 2022 15.7 0.186 8 September 2022 ADRS $ per PLC ADR Payment date Final dividend for 2024** **** 25 June 2025 Interim dividend for 2024 0.239236 10 September 2024 Final dividend for 2023 0.533962 18 June 2024 Interim dividend for 2023 0.211761 12 September 2023 Final dividend for 2022 0.483332 12 June 2023 Interim dividend for 2022 0.180188 13 September 2022 ** Proposed dividend payment subject to shareholder approval at the Annual General Meeting of RELX PLC in April 2025. *** Euro equivalent amount will be determined using the appropriate exchange rate on 3 June 2025. **** ADR US$ equivalent amount will be determined using the appropriate exchange rate on 20 June 2025. Credits Designed and produced by Conran Design Group Photography: Board by Douglas Fry, Piranha Photography Printed by Pureprint Group, ISO14001, FSC® certified and CarbonNeutral® Printed on Revive 100 Silk which is made from 100% recovered waste. All of the pulp is bleached using an elemental chlorine free process (ECF). Printed in the UK by Pureprint using its environmental printing technology; vegetable inks were used throughout. Pureprint is a CarbonNeutral® company. Both manufacturing mill and printer are ISO14001 registered and are Forest Stewardship Council® (FSC®) chain-of-custody certified. |
| www.relx.com |