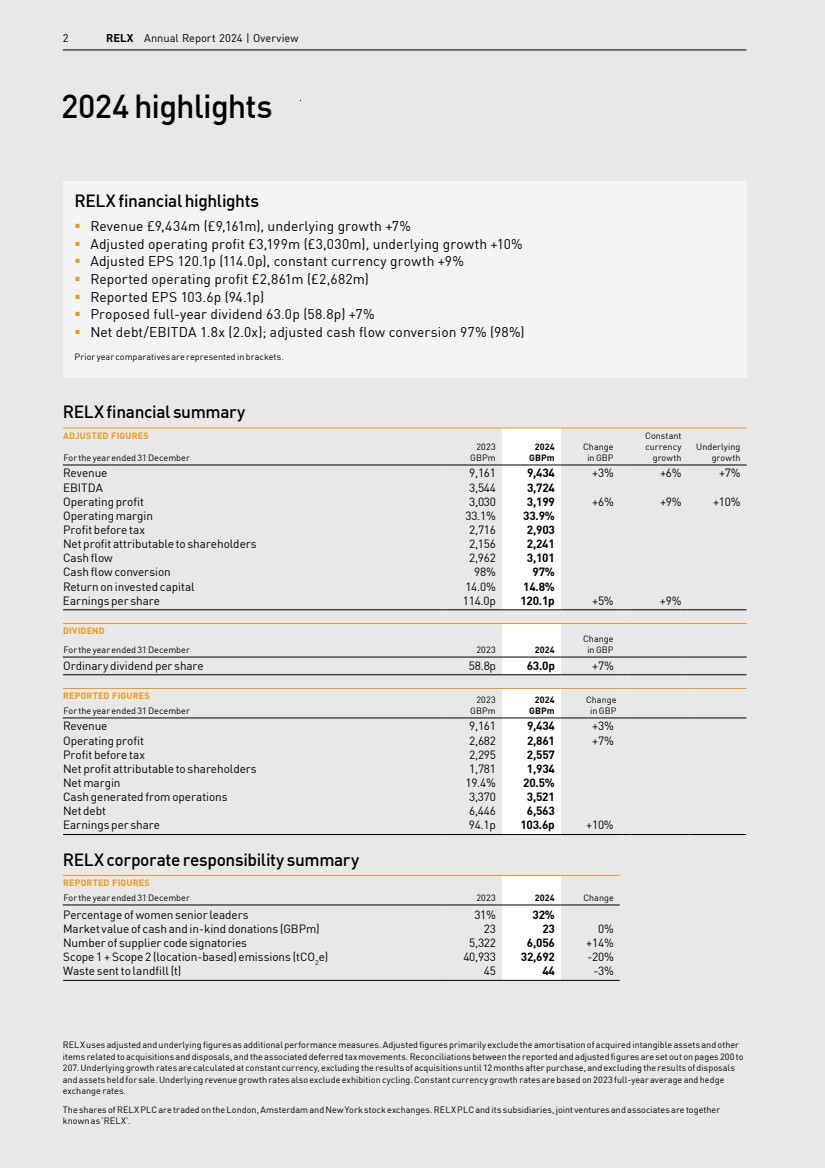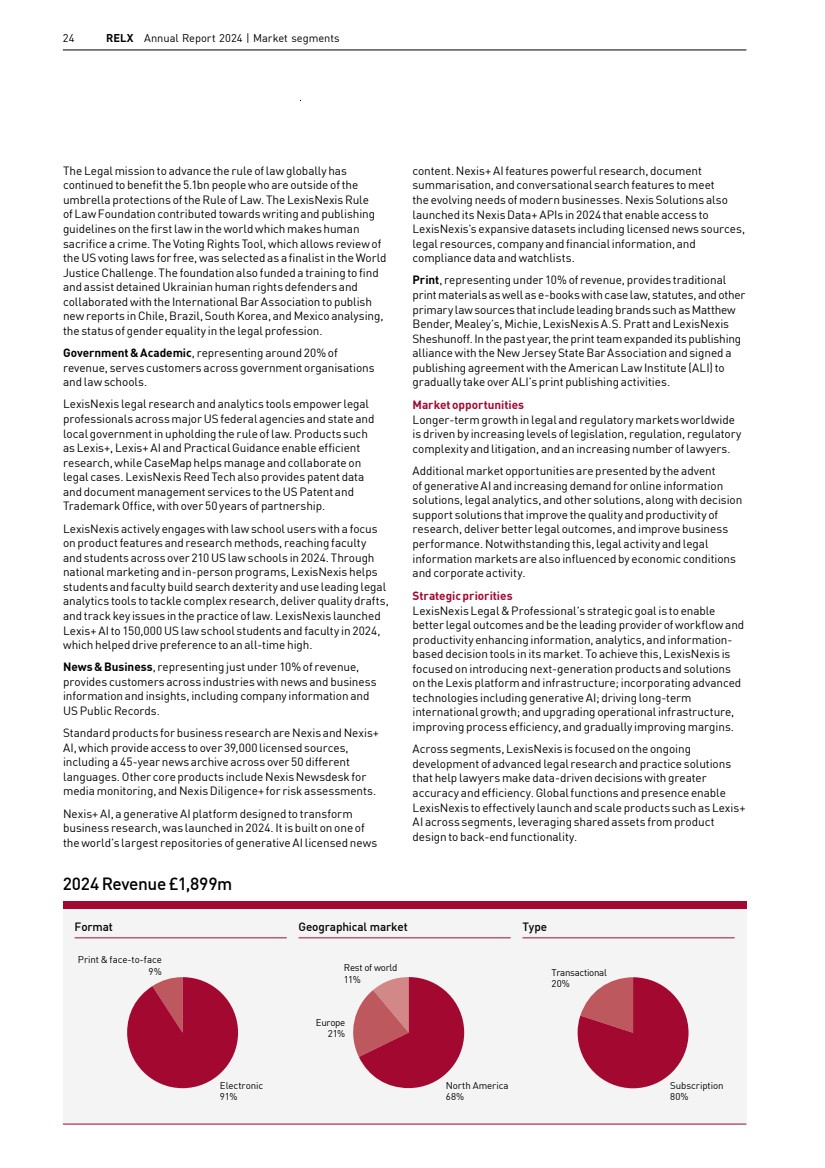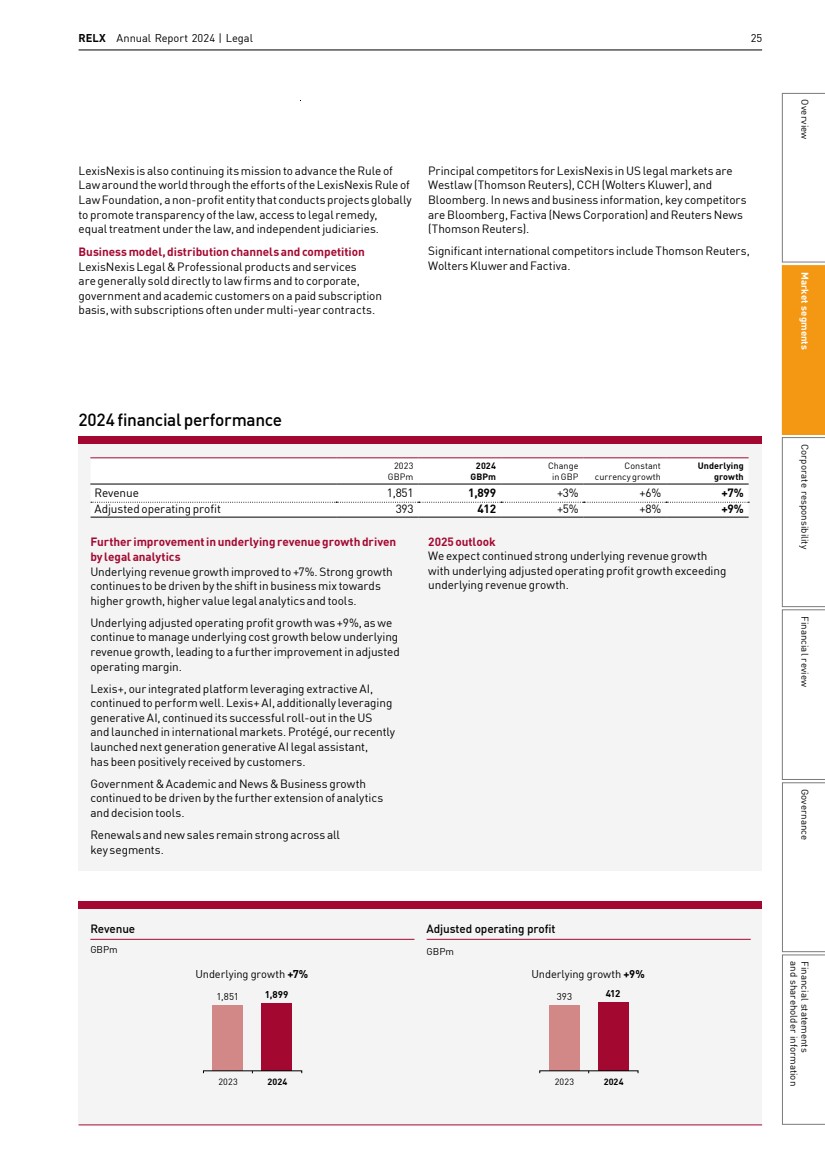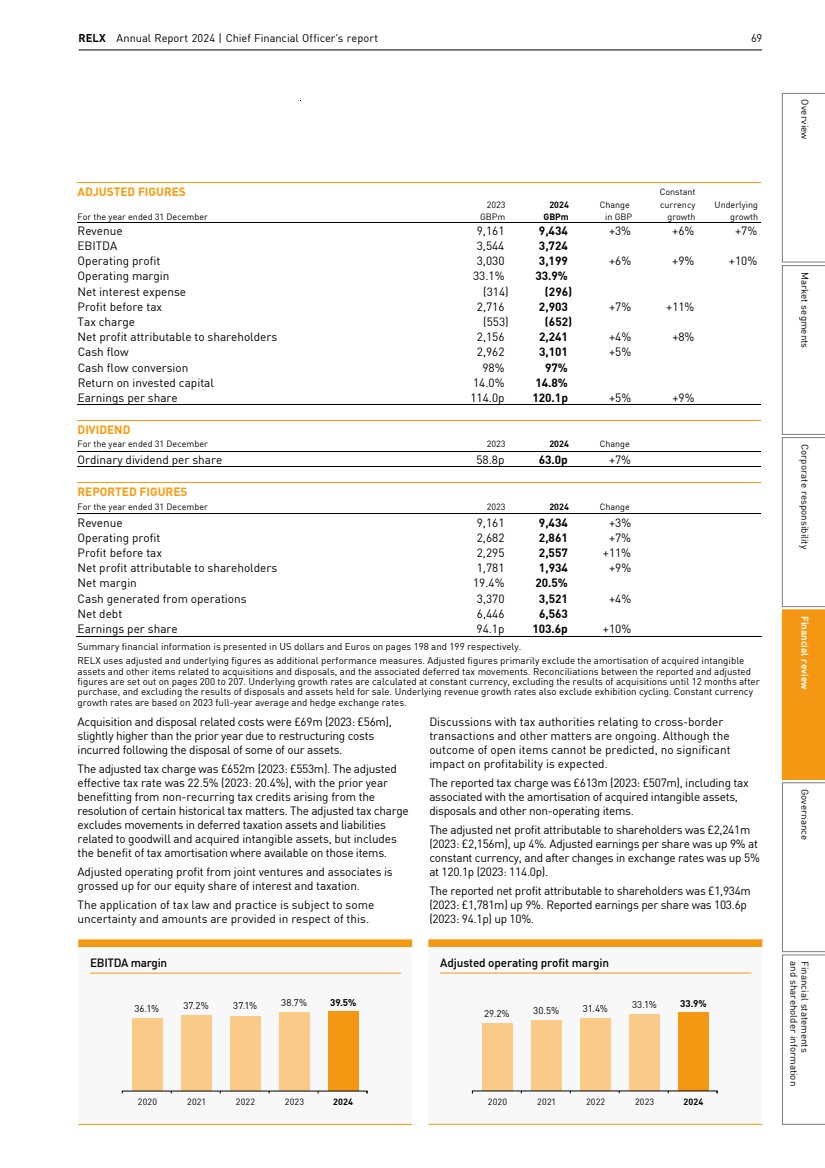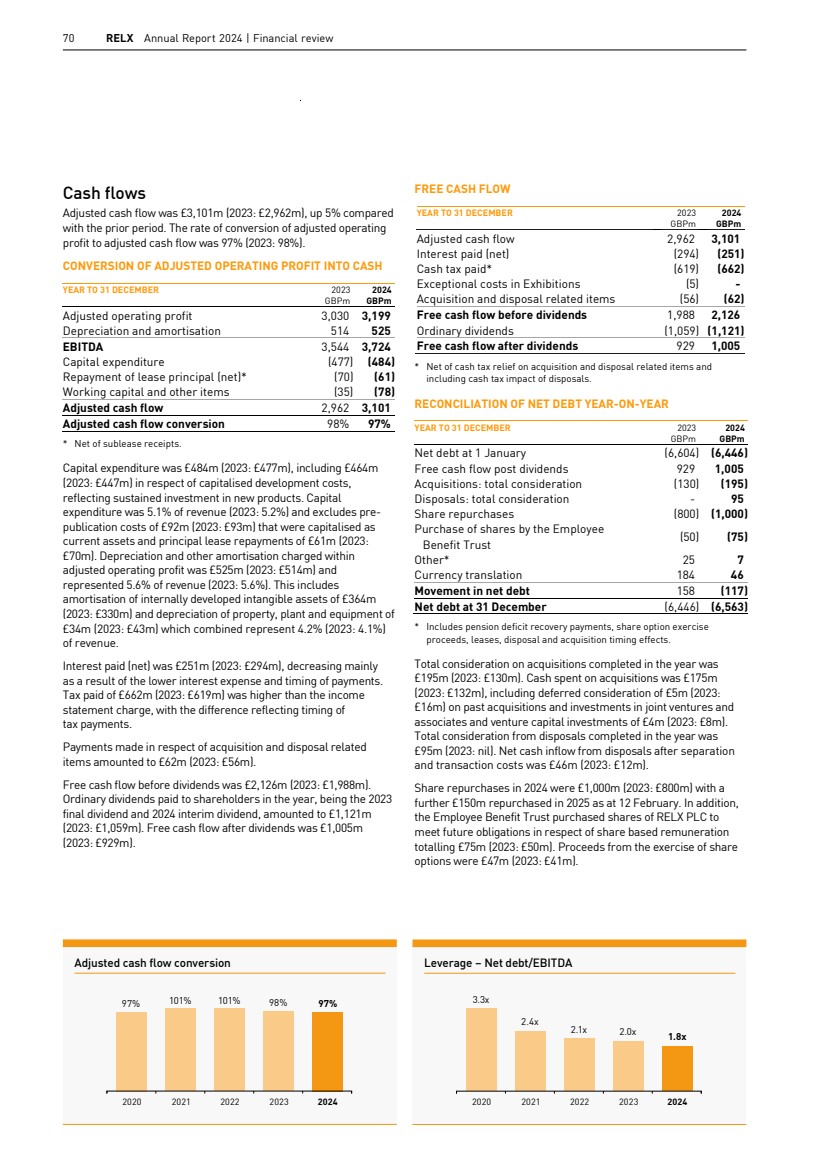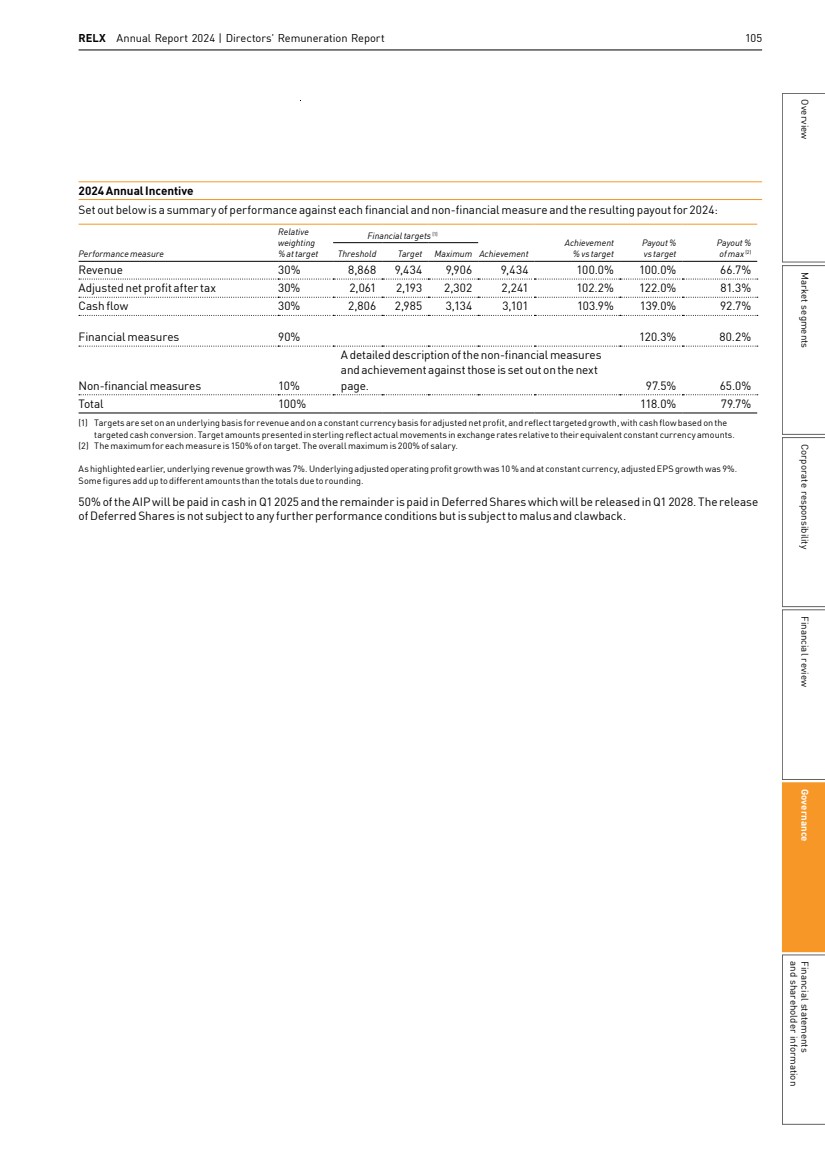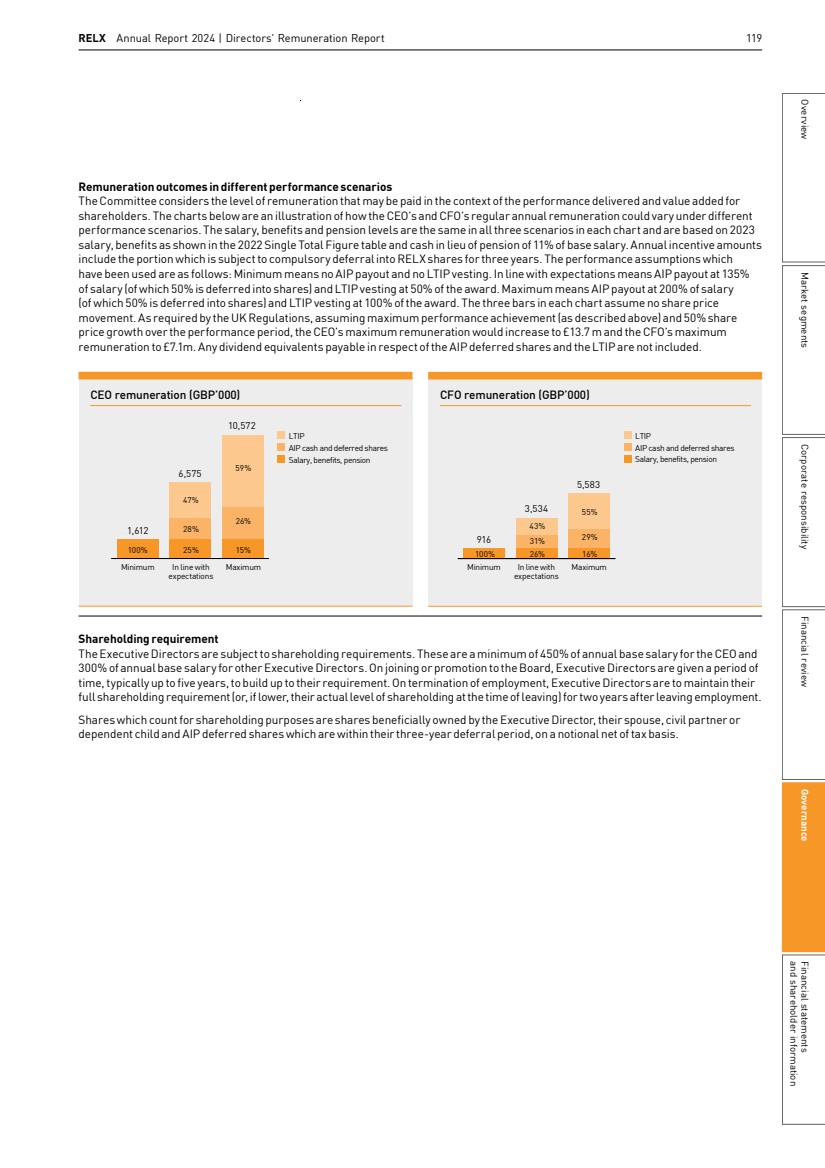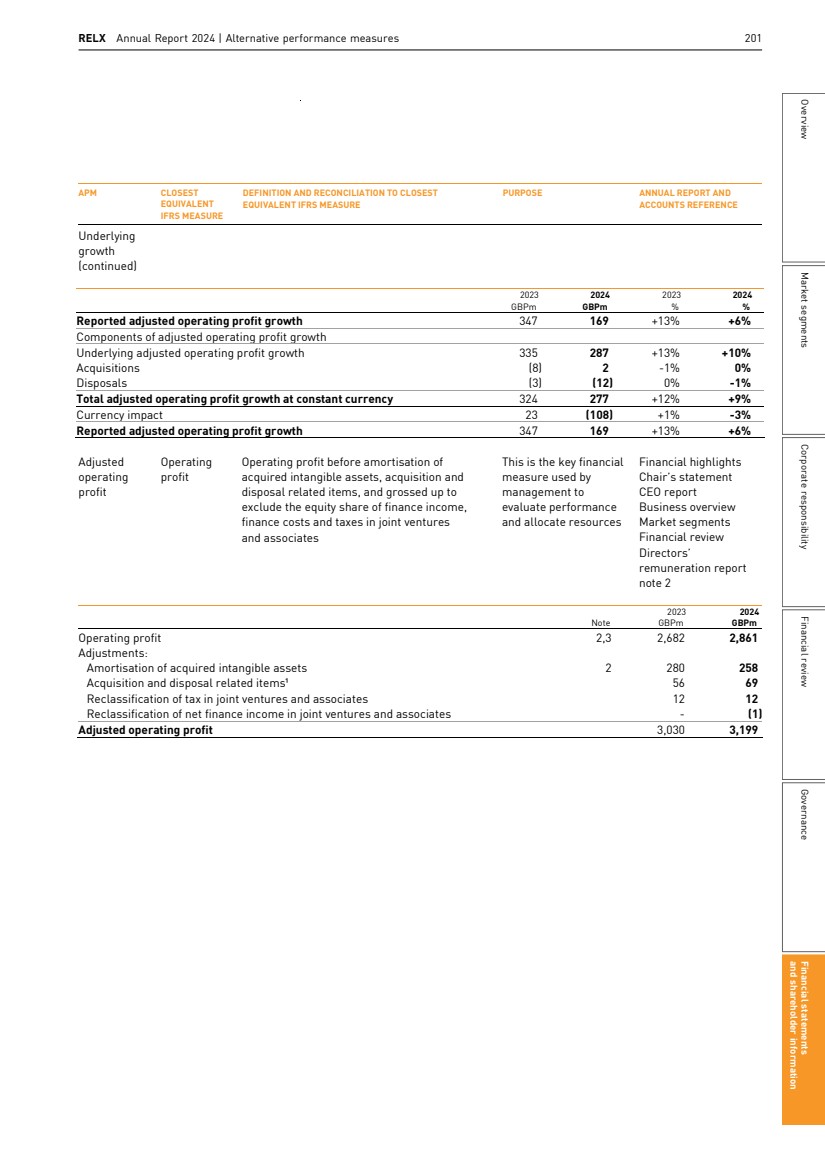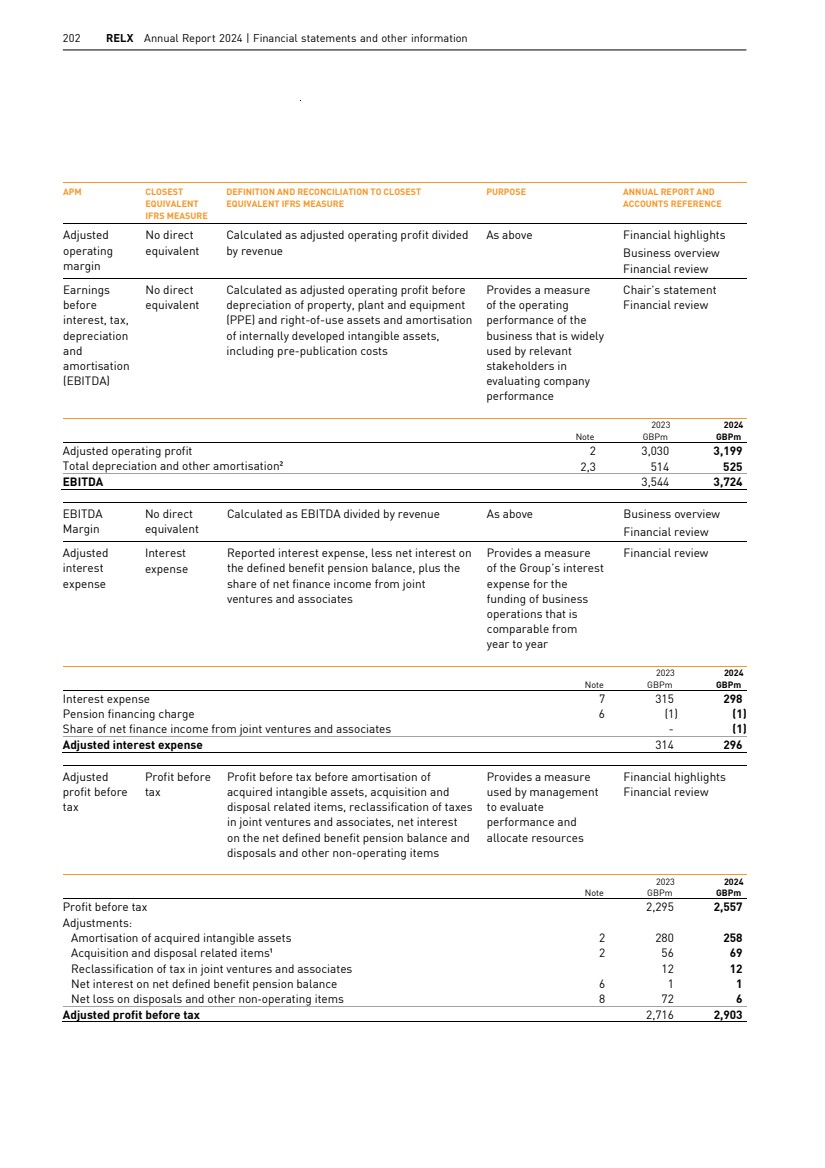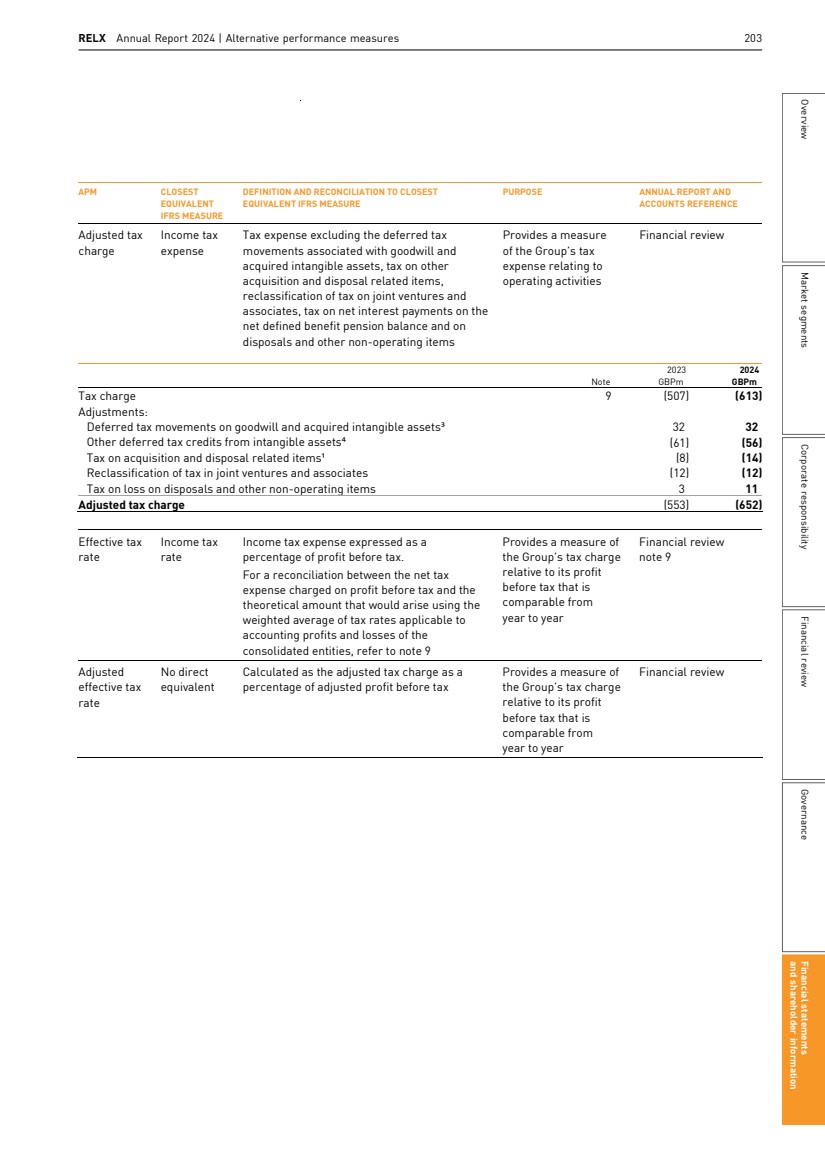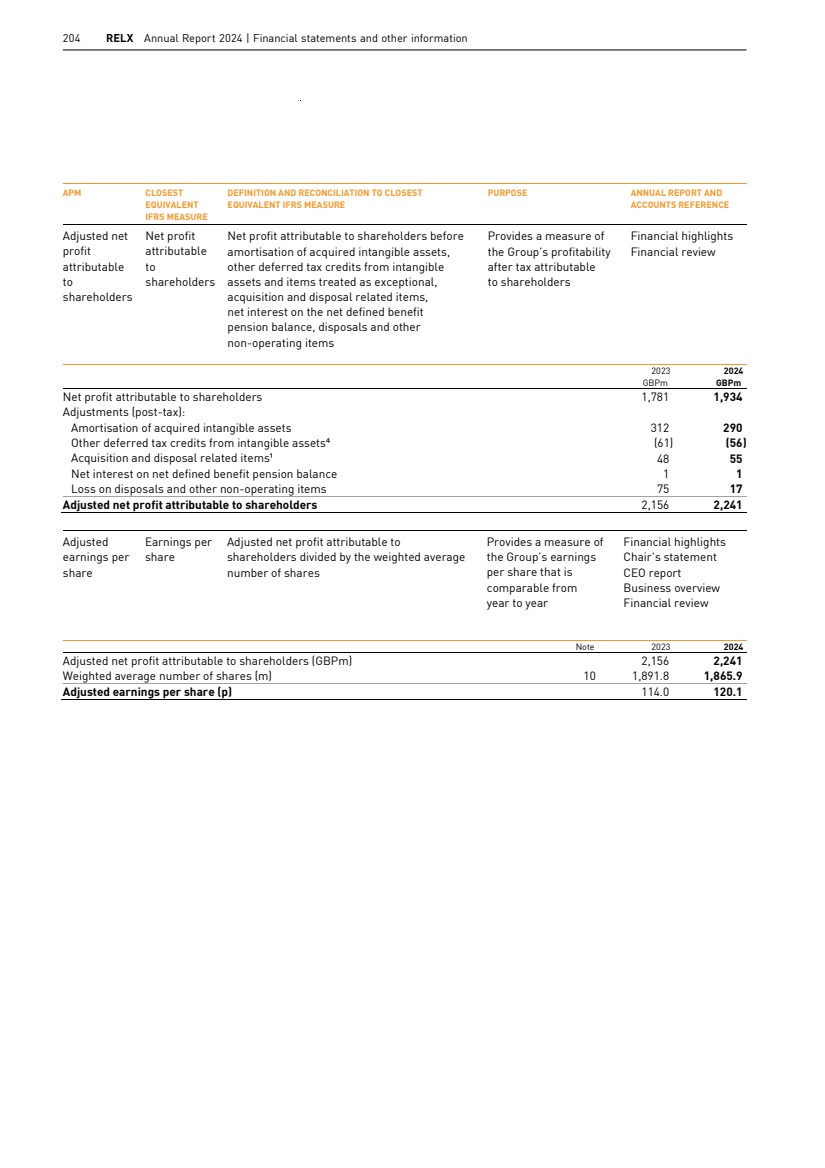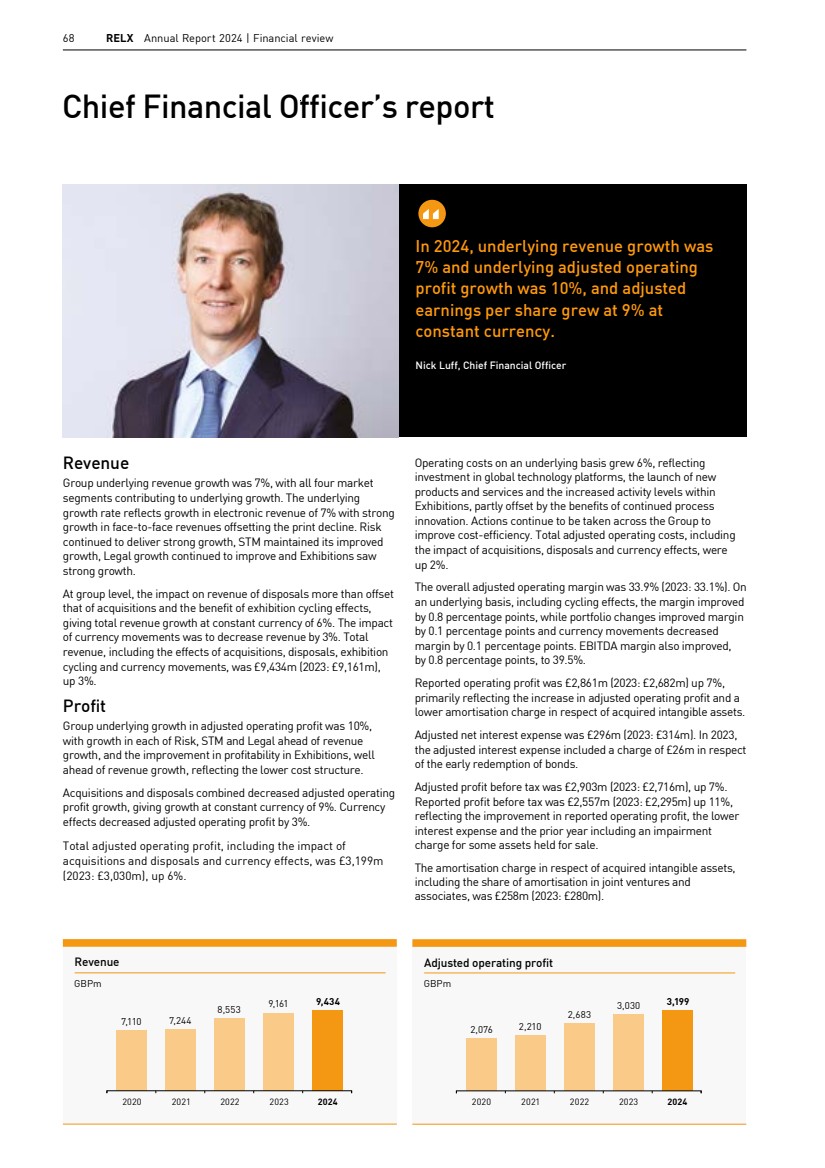
| 68 RELX Annual Report 2024 | Financial review 7,110 7,244 GBPm 8,553 9,161 9,434 Revenue 2020 2021 2022 2023 2024 GBPm Adjusted operating profit 2,076 2,210 2,683 3,030 3,199 2020 2021 2022 2023 2024 92 RELX Annual Report 2024 | Financial review Chief Financial Officer’s report In 2024, underlying revenue growth was 7% and underlying adjusted operating profit growth was 10%, and adjusted earnings per share grew at 9% at constant currency. Nick Luff, Chief Financial Officer Revenue Group underlying revenue growth was 7%, with all four market segments contributing to underlying growth. The underlying growth rate reflects growth in electronic revenue of 7% with strong growth in face-to-face revenues offsetting the print decline. Risk continued to deliver strong growth, STM maintained its improved growth, Legal growth continued to improve and Exhibitions saw strong growth. At group level, the impact on revenue of disposals more than offset that of acquisitions and the benefit of exhibition cycling effects, giving total revenue growth at constant currency of 6%. The impact of currency movements was to decrease revenue by 3%. Total revenue, including the effects of acquisitions, disposals, exhibition cycling and currency movements, was £9,434m (2023: £9,161m), up 3%. Profit Group underlying growth in adjusted operating profit was 10%, with growth in each of Risk, STM and Legal ahead of revenue growth, and the improvement in profitability in Exhibitions, well ahead of revenue growth, reflecting the lower cost structure. Acquisitions and disposals combined decreased adjusted operating profit growth, giving growth at constant currency of 9%. Currency effects decreased adjusted operating profit by 3%. Total adjusted operating profit, including the impact of acquisitions and disposals and currency effects, was £3,199m (2023: £3,030m), up 6%. Operating costs on an underlying basis grew 6%, reflecting investment in global technology platforms, the launch of new products and services and the increased activity levels within Exhibitions, partly offset by the benefits of continued process innovation. Actions continue to be taken across the Group to improve cost-efficiency. Total adjusted operating costs, including the impact of acquisitions, disposals and currency effects, were up 2%. The overall adjusted operating margin was 33.9% (2023: 33.1%). On an underlying basis, including cycling effects, the margin improved by 0.8 percentage points, while portfolio changes improved margin by 0.1 percentage points and currency movements decreased margin by 0.1 percentage points. EBITDA margin also improved, by 0.8 percentage points, to 39.5%. Reported operating profit was £2,861m (2023: £2,682m) up 7%, primarily reflecting the increase in adjusted operating profit and a lower amortisation charge in respect of acquired intangible assets. Adjusted net interest expense was £296m (2023: £314m). In 2023, the adjusted interest expense included a charge of £26m in respect of the early redemption of bonds. Adjusted profit before tax was £2,903m (2023: £2,716m), up 7%. Reported profit before tax was £2,557m (2023: £2,295m) up 11%, reflecting the improvement in reported operating profit, the lower interest expense and the prior year including an impairment charge for some assets held for sale. The amortisation charge in respect of acquired intangible assets, including the share of amortisation in joint ventures and associates, was £258m (2023: £280m). 92 RELX Annual Report 2024 | Financial review Chief Financial Officer’s report In 2024, underlying revenue growth was 7% and underlying adjusted operating profit growth was 10%, and adjusted earnings per share grew at 9% at constant currency. Nick Luff, Chief Financial Officer Revenue Group underlying revenue growth was 7%, with all four market segments contributing to underlying growth. The underlying growth rate reflects growth in electronic revenue of 7% with strong growth in face-to-face revenues offsetting the print decline. Risk continued to deliver strong growth, STM maintained its improved growth, Legal growth continued to improve and Exhibitions saw strong growth. At group level, the impact on revenue of disposals more than offset that of acquisitions and the benefit of exhibition cycling effects, giving total revenue growth at constant currency of 6%. The impact of currency movements was to decrease revenue by 3%. Total revenue, including the effects of acquisitions, disposals, exhibition cycling and currency movements, was £9,434m (2023: £9,161m), up 3%. Profit Group underlying growth in adjusted operating profit was 10%, with growth in each of Risk, STM and Legal ahead of revenue growth, and the improvement in profitability in Exhibitions, well ahead of revenue growth, reflecting the lower cost structure. Acquisitions and disposals combined decreased adjusted operating profit growth, giving growth at constant currency of 9%. Currency effects decreased adjusted operating profit by 3%. Total adjusted operating profit, including the impact of acquisitions and disposals and currency effects, was £3,199m (2023: £3,030m), up 6%. Operating costs on an underlying basis grew 6%, reflecting investment in global technology platforms, the launch of new products and services and the increased activity levels within Exhibitions, partly offset by the benefits of continued process innovation. Actions continue to be taken across the Group to improve cost-efficiency. Total adjusted operating costs, including the impact of acquisitions, disposals and currency effects, were up 2%. The overall adjusted operating margin was 33.9% (2023: 33.1%). On an underlying basis, including cycling effects, the margin improved by 0.8 percentage points, while portfolio changes improved margin by 0.1 percentage points and currency movements decreased margin by 0.1 percentage points. EBITDA margin also improved, by 0.8 percentage points, to 39.5%. Reported operating profit was £2,861m (2023: £2,682m) up 7%, primarily reflecting the increase in adjusted operating profit and a lower amortisation charge in respect of acquired intangible assets. Adjusted net interest expense was £296m (2023: £314m). In 2023, the adjusted interest expense included a charge of £26m in respect of the early redemption of bonds. Adjusted profit before tax was £2,903m (2023: £2,716m), up 7%. Reported profit before tax was £2,557m (2023: £2,295m) up 11%, reflecting the improvement in reported operating profit, the lower interest expense and the prior year including an impairment charge for some assets held for sale. The amortisation charge in respect of acquired intangible assets, including the share of amortisation in joint ventures and associates, was £258m (2023: £280m). RELX Annual Report 2024 | Chief Financial Officer’s report 93 Overview Market segments Corporate responsibility Financial review Governance Financial statements and shareholder information ADJUSTED FIGURES Constant 2023 2024 Change currency Underlying For the year ended 31 December GBPm GBPm in GBP growth growth Revenue 9,161 9,434 +3% +6% +7% EBITDA 3,544 3,724 Operating profit 3,030 3,199 +6% +9% +10% Operating margin 33.1% 33.9% Net interest expense (314) (296) Profit before tax 2,716 2,903 +7% +11% Tax charge (553) (652) Net profit attributable to shareholders 2,156 2,241 +4% +8% Cash flow 2,962 3,101 +5% Cash flow conversion 98% 97% Return on invested capital 14.0% 14.8% Earnings per share 114.0p 120.1p +5% +9% DIVIDEND For the year ended 31 December 2023 2024 Change Ordinary dividend per share 58.8p 63.0p +7% REPORTED FIGURES For the year ended 31 December 2023 2024 Change Revenue 9,161 9,434 +3% Operating profit 2,682 2,861 +7% Profit before tax 2,295 2,557 +11% Net profit attributable to shareholders 1,781 1,934 +9% Net margin 19.4% 20.5% Cash generated from operations 3,370 3,521 +4% Net debt 6,446 6,563 Earnings per share 94.1p 103.6p +10% Summary financial information is presented in US dollars and Euros on pages 198 and 199 respectively. RELX uses adjusted and underlying figures as additional performance measures. Adjusted figures primarily exclude the amortisation of acquired intangible assets and other items related to acquisitions and disposals, and the associated deferred tax movements. Reconciliations between the reported and adjusted figures are set out on pages 200 to 207. Underlying growth rates are calculated at constant currency, excluding the results of acquisitions until 12 months after purchase, and excluding the results of disposals and assets held for sale. Underlying revenue growth rates also exclude exhibition cycling. Constant currency growth rates are based on 2023 full-year average and hedge exchange rates. Acquisition and disposal related costs were £69m (2023: £56m), slightly higher than the prior year due to restructuring costs incurred following the disposal of some of our assets. The adjusted tax charge was £652m (2023: £553m). The adjusted effective tax rate was 22.5% (2023: 20.4%), with the prior year benefitting from non-recurring tax credits arising from the resolution of certain historical tax matters. The adjusted tax charge excludes movements in deferred taxation assets and liabilities related to goodwill and acquired intangible assets, but includes the benefit of tax amortisation where available on those items. Adjusted operating profit from joint ventures and associates is grossed up for our equity share of interest and taxation. The application of tax law and practice is subject to some uncertainty and amounts are provided in respect of this. Discussions with tax authorities relating to cross-border transactions and other matters are ongoing. Although the outcome of open items cannot be predicted, no significant impact on profitability is expected. The reported tax charge was £613m (2023: £507m), including tax associated with the amortisation of acquired intangible assets, disposals and other non-operating items. The adjusted net profit attributable to shareholders was £2,241m (2023: £2,156m), up 4%. Adjusted earnings per share was up 9% at constant currency, and after changes in exchange rates was up 5% at 120.1p (2023: 114.0p). The reported net profit attributable to shareholders was £1,934m (2023: £1,781m) up 9%. Reported earnings per share was 103.6p (2023: 94.1p) up 10%. 92 RELX Annual Report 2024 | Financial review Chief Financial Officer’s report In 2024, underlying revenue growth was 7% and underlying adjusted operating profit growth was 10%, and adjusted earnings per share grew at 9% at constant currency. Nick Luff, Chief Financial Officer Revenue Group underlying revenue growth was 7%, with all four market segments contributing to underlying growth. The underlying growth rate reflects growth in electronic revenue of 7% with strong growth in face-to-face revenues offsetting the print decline. Risk continued to deliver strong growth, STM maintained its improved growth, Legal growth continued to improve and Exhibitions saw strong growth. At group level, the impact on revenue of disposals more than offset that of acquisitions and the benefit of exhibition cycling effects, giving total revenue growth at constant currency of 6%. The impact of currency movements was to decrease revenue by 3%. Total revenue, including the effects of acquisitions, disposals, exhibition cycling and currency movements, was £9,434m (2023: £9,161m), up 3%. Profit Group underlying growth in adjusted operating profit was 10%, with growth in each of Risk, STM and Legal ahead of revenue growth, and the improvement in profitability in Exhibitions, well ahead of revenue growth, reflecting the lower cost structure. Acquisitions and disposals combined decreased adjusted operating profit growth, giving growth at constant currency of 9%. Currency effects decreased adjusted operating profit by 3%. Total adjusted operating profit, including the impact of acquisitions and disposals and currency effects, was £3,199m (2023: £3,030m), up 6%. Operating costs on an underlying basis grew 6%, reflecting investment in global technology platforms, the launch of new products and services and the increased activity levels within Exhibitions, partly offset by the benefits of continued process innovation. Actions continue to be taken across the Group to improve cost-efficiency. Total adjusted operating costs, including the impact of acquisitions, disposals and currency effects, were up 2%. The overall adjusted operating margin was 33.9% (2023: 33.1%). On an underlying basis, including cycling effects, the margin improved by 0.8 percentage points, while portfolio changes improved margin by 0.1 percentage points and currency movements decreased margin by 0.1 percentage points. EBITDA margin also improved, by 0.8 percentage points, to 39.5%. Reported operating profit was £2,861m (2023: £2,682m) up 7%, primarily reflecting the increase in adjusted operating profit and a lower amortisation charge in respect of acquired intangible assets. Adjusted net interest expense was £296m (2023: £314m). In 2023, the adjusted interest expense included a charge of £26m in respect of the early redemption of bonds. Adjusted profit before tax was £2,903m (2023: £2,716m), up 7%. Reported profit before tax was £2,557m (2023: £2,295m) up 11%, reflecting the improvement in reported operating profit, the lower interest expense and the prior year including an impairment charge for some assets held for sale. The amortisation charge in respect of acquired intangible assets, including the share of amortisation in joint ventures and associates, was £258m (2023: £280m). |