Exhibit 15.2

RELX Group is a global provider of information and analytics for professional and business customers across industries.
We help scientists make new discoveries, lawyers win cases, doctors save lives and insurance companies offer customers lower prices. We save taxpayers and consumers money by preventing fraud and help executives forge commercial relationships with their clients.
In short, we enable our customers to make better decisions, get better results and be more productive.
RELX PLC is a London listed holding company which owns 52.9% of RELX Group.
RELX NV is an Amsterdam listed holding company which owns 47.1% of RELX Group.
Forward-looking statements
The Reports and Financial Statements 2017 contains forward-looking statements within the meaning of Section 27A of the US Securities Act of 1933, as amended, and Section 21E of the US Securities Exchange Act of 1934, as amended. These statements are subject to a number of risks and uncertainties that could cause actual results or outcomes to differ materially from those currently being anticipated. The terms “outlook”, “estimate”, “project”, “plan”, “intend”, “expect”, “should be”, “will be”, “believe”, “trends” and similar expressions identify forward-looking statements. Factors which may cause future outcomes to differ from those foreseen in forward-looking statements include, but are not limited to: current and future economic, political and market forces; changes in law and legal interpretations affecting the RELX Group intellectual property rights; regulatory and other changes regarding the collection, transfer or use of third party content and data; demand for the RELX Group products and services; competitive factors in the industries in which the RELX Group operates; compromises of our data security systems and interruptions in our information technology systems; legislative, fiscal, tax and regulatory developments and political risks; exchange rate fluctuations; and other risks referenced from time to time in the filings of RELX PLC and RELX N.V. with the US Securities and Exchange Commission.

| | |
| 2 | | RELX Group Annual reports and financial statements 2017 |
|
|
2017 Financial highlights
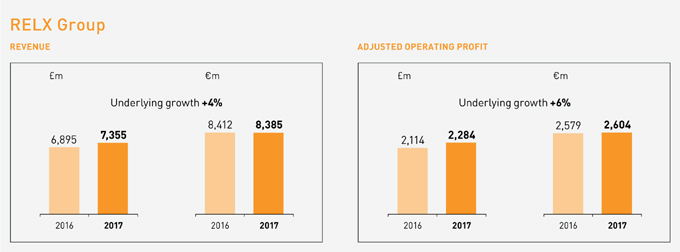
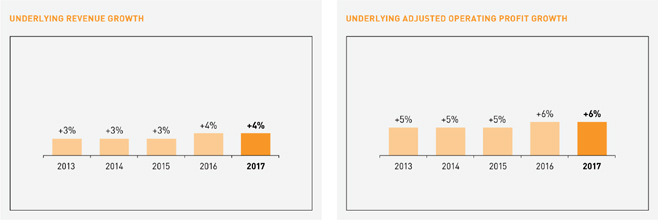
| ◾ | | Underlying revenue up 4% |
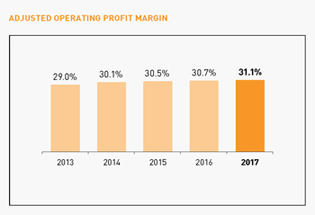
| ◾ | | Underlying adjusted operating profit up 6% |
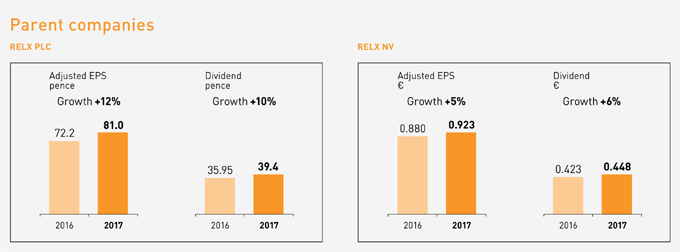
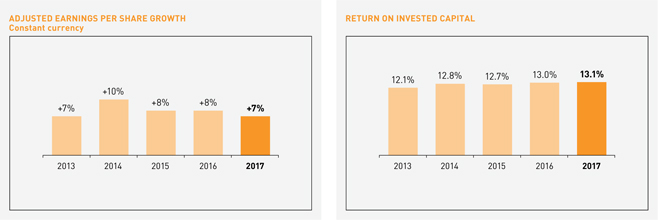
| ◾ | | Adjusted EPS up 12% to 81.0p (72.2p); up 5% to€0.923 (€0.880); up 7% constant currency |
| ◾ | | Reported EPS 82.2p (56.3p) for RELX PLC;€0.936 (€0.687) for RELX NV |
| ◾ | | Full-year dividend up 10% to 39.4p for RELX PLC and up 6% to€0.448 for RELX NV |
| ◾ | | Strong financial position and cash flow; leverage 2.2x EBITDA pensions and lease adjusted (1.9x unadjusted) |
RELX Group encompasses RELX PLC, RELX NV, RELX Group plc and its subsidiaries, associates and joint ventures. The corporate structure is set out on page 71.
RELX Group uses adjusted and underlying figures as additional performance measures. Adjusted figures primarily exclude the amortisation of acquired intangible assets and other items related to acquisitions and disposals, and the associated deferred tax movements. In 2017, we have excluded the exceptional tax credit arising as a result of the US Tax Cuts and Jobs Act. Reconciliations between the reported and adjusted figures are set out on page 186. Underlying growth rates are calculated at constant currencies, and exclude the results of acquisitions and disposals made in both the year and prior year and of assets held for sale. Underlying revenue growth rates also exclude the effects of exhibition cycling. Constant currency growth rates are based on 2016 full-year average and hedge exchange rates.
| | |
| Overview Chairman’s statement | | 3 |
|
|
Chairman’s statement

Sir Anthony Habgood
Chairman
We achieved good underlying revenue growth in 2017, and continued to generate underlying adjusted operating profit growth ahead of revenue growth. We are proposing a set of measures that will further simplify our corporate structure into a single parent company.
RELX Group continued to execute well on its strategic priorities aimed at achieving more predictable revenues, a higher growth profile and improving returns. As a result, growth of underlying revenues was again +4%. Underlying adjusted operating profits grew +6%, as we continued to grow revenues ahead of costs.
Adjusted earnings per share in constant currencies grew +7%. Adjusted EPS expressed in sterling was 81.0p (+12%) or in euros€0.923 (+5%). Reported earnings per share expressed in sterling was 82.2p (56.3p) and expressed in euros was€0.936 (€0.687). The difference in growth rates between the sterling and euro EPS reflects the movement in exchange rates.
Dividends
We are proposing a full year dividend increase of 10% to 39.4p for RELX PLC and 6% to€0.448 for RELX NV. The difference in growth rates between the two dividends reflects movement in the sterling/euro exchange rate since the payments a year earlier. The long-term dividend policy is unchanged.
Balance sheet
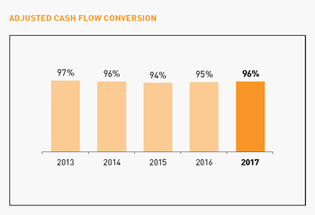
With the majority of our debts dollar denominated, net debt was £4.7bn/€5.3bn on 31 December 2017, compared with £4.7bn/€5.5bn last year, with the difference between the sterling and euro increases reflecting movements in exchange rates. Net debt/EBITDA on a pensions and lease adjusted basis for 2017 was 2.2x, the same level
as last year, and, on an unadjusted basis was 1.9x, compared with 1.8x last year. Adjusted cash flow conversion was 96%, compared with 95% in 2016, with capital expenditure at 5% of revenues.
Share buybacks
In 2017, we deployed £700m on share buybacks. In 2018, we intend to deploy a total of £700m. By February, £100m of this year’s total had already been completed, leaving a further £600m to be deployed during the year.
The Boards
We continue to refresh the Boards. In September 2017, we welcomed Suzanne Wood to the boards as anon-executive director. Suzanne is Group Finance Director at Ashtead Group plc and brings extensive board experience on both sides of the Atlantic. In 2018, Adrian Hennah will become Chairman of the Audit Committees, replacing Ben van der Veer, who will have been on the Boards for nine years in September 2018 and has been Chairman of the Audit Committees since 2010.
Parent company structure
We are proposing a set of measures that will further simplify our corporate structure into a single parent company. We believe this is a natural next step for RELX Group, removing complexity and increasing transparency. The changes will be cost and profit neutral on an ongoing basis and will not impact the economic interests of any shareholder. RELX NV shareholders will receive one new RELX PLC share in exchange for each RELX NV share held and will, following the additional listing of RELX PLC shares on Euronext Amsterdam, have the option of trading new RELX PLC shares on Euronext Amsterdam, priced in euros, and receive dividend payments in euros. RELX PLC will continue to have a premium listing on the London Stock Exchange and we will be applying for an additional listing of RELX PLC on Euronext Amsterdam. RELX NV ADRs will be convertedone-for-one to RELX PLC ADRs which will continue to be listed on the New York Stock Exchange. There will be no changes to the locations, activities or staffing levels of RELX Group or its four business areas. The simplification is subject to the approval of both RELX PLC and RELX NV shareholders. We expect a circular to be sent to shareholders in Q2 2018, with implementation in Q3 2018.
Corporate responsibility
We prioritise excellence in corporate governance across RELX Group. In 2017, we advanced a more structured approach to compliance training for employees in higher-risk roles and locations by creating a resource library with presentations on competition law, anti-bribery, anti-harassment, trade sanctions and fostering a culture of compliance. Over 2,400 colleagues received advancedin-person compliance training.
Diversity and inclusion remain critical to our business to ensure we reflect the diversity of our customers and communities. Over 44% ofnon-executive directors on the Board are women. In the year, we expanded our women in technology mentor pilot to include mentees in the US and China as well as the UK, and developed a new mentor programme for high potential women.
We focus on our unique contributions to society, such as fostering communities, applying our expertise, and using our convening power, to address key challenges across our market sectors. We discuss our efforts to avoid human trafficking and slavery in our direct employment and our supply chain in our Modern Slavery Act Statement, approved by the Board, and available on the RELX Group homepage.
Anthony Habgood
Chairman
| | |
| 4 | | RELX Group Annual reports and financial statements 2017 |
|
|
Chief Executive Officer’s report

Erik Engstrom
Chief Executive Officer
Our number one priority is the organic development of increasingly sophisticated information-based analytics and decision tools that deliver enhanced value to our customers.
Strategic direction
Our number one strategic priority is the organic development of increasingly sophisticated information-based analytics and decision tools that deliver enhanced value to professional and business customers across the industries that we serve.
Our goal is to help our customers make better decisions, get better results and be more productive. We do this by leveraging a deep understanding of our customers to create innovative solutions which combine content and data with analytics and technology in global platforms. These solutions often account for about 1% of our customers’ total cost base but can have a significant and positive impact on the economics of the remaining 99%.
We aim to build leading positions in long-term global growth markets and leverage our skills, assets and resources across RELX Group, both to build solutions for our customers and to pursue cost efficiencies.
We are systematically migrating all of our information solutions across RELX Group towards highervalue-add decision tools, adding broader datasets, embedding more sophisticated analytics and leveraging more powerful technology, primarily through organic development.
We are transforming our core business, building out new products and expanding into higher growth adjacencies and geographies. We are supplementing this organic development with selective acquisitions of targeted data sets and analytics, and assets in high-growth markets that support our organic growth strategies, and are natural additions to our existing businesses.
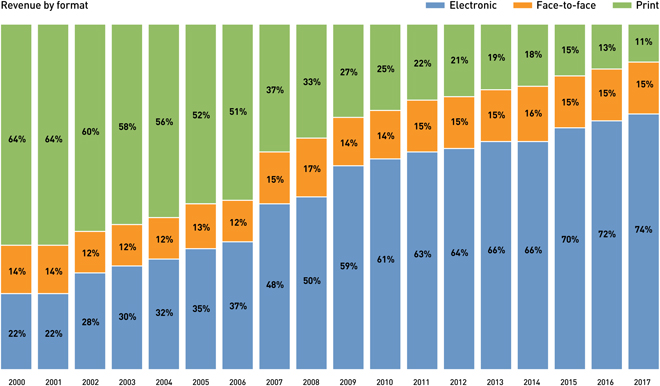
By focusing on evolving the fundamentals of our business we believe that, over time, we are improving our business profile and the quality of our earnings. This is leading to more predictable revenues through a better asset mix and geographic balance; a higher growth profile by expanding in higher growth segments, exiting from structurally challenged businesses and gradually reducing the drag from print format declines; and improved returns by focusing on organic development with strong cash generation.
| | |
| Overview Chief Executive Officer’s report | | 5 |
|
|
2017 progress
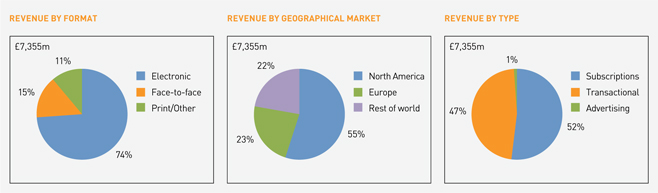
We achieved good underlying revenue growth in 2017, and continued to generate underlying adjusted operating profit growth ahead of revenue growth. The underlying growth rate reflects good growth in electronic andface-to-face revenues (89% of the total), and the further development of our analytics and decision tools.
With a strong balance sheet and an inherently cash-generative business, the strategic priority order for using our cash is unchanged. First, to invest in the organic development of our businesses to drive underlying revenue growth; second to support our organic growth strategy with targeted acquisitions; third to grow dividends predictably, broadly in line with EPS growth; fourth to maintain our leverage in a comfortable range; and finally use any remaining cash to buy back shares. As part of this we bought back shares for £700m in 2017, and announced £700m in buy backs for 2018.
We continued to focus our acquisitions on select, targeted data sets and analytics, and assets in high growth markets that support our organic growth strategies. We completed eight acquisitions of small content, data analytics and exhibition assets for a total consideration of £123m, and disposed of 17 assets for a total of £87m. Since the year end, we have entered into an agreement to acquire ThreatMetrix, a leader in the global risk-based authentication sector, for £580m.
Financial performance
Our positive financial performance continued throughout 2017, with underlying revenue and operating profit growth across all four business areas. Underlying revenue growth was 4%. Underlying operating profit growth was 6%, and adjusted earnings per share grew 7% at constant currencies.
Key business trends in ourScientific, Technical & Medicalbusiness remained positive, with underlying profit growth slightly exceeding underlying revenue growth.
Underlying revenue growth remained strong across all key segments atRisk & Business Analytics. Underlying profit growth broadly matched underlying revenue growth.
Underlying revenue growth inLegal was in line with the prior year with continued efficiency gains driving strong underlying operating profit growth.
Exhibitions achieved strong underlying revenue growth, slightly ahead of the prior year, with underlying operating profit growth reflectingcycling-out effects.

| | |
| 6 | | RELX Group Annual reports and financial statements 2017 |
|
|
Corporate responsibility
In 2017, we undertook a corporate responsibility stakeholder survey to understand the issues employees, customers, investors, suppliers, peers and others feel are important to RELX Group. They identified data privacy and security and having the right people as having the biggest potential impact on RELX Group, and RELX Group’s unique contributions – universal, sustainable access to information, advance of science and health, protection of society, promotion of the rule of law and access to justice and fostering communities – as our biggest impact on society.
We advanced corresponding objectives in the year, including expanding fraud prevention and progressing cyber security awareness. We continued to tighten technology controls, and provided training, including through employee simulations, to reduce susceptibility to phishing attacks.
Outlook
Key business trends in the early part of 2018 are consistent with 2017, and we are confident that, by continuing to execute on our strategy, we will deliver another year of underlying growth in revenue and in adjusted operating profit, together with growth in adjusted earnings per share on a constant currency basis.
Erik Engstrom
Chief Executive Officer

| | |
| 8 | | RELX Group Annual reports and financial statements 2017 |
|
|
RELX Group business overview
RELX Group is a global provider of information and analytics for professional and business customers across industries.
The Group serves customers in more than 180 countries and has offices in about 40 countries. It employs about 30,000 people of whom almost half are in North America.
| | | | | | | | | | | | | | | | | | | | | | | | | | | | | | | | |
RELX Group financial summary | | | | | | | | | | | | | | | | | | | | | |
| REPORTED FIGURES | | £ | | | € | | | Change at | | | | |
| For the year ended 31 December | | 2017
£m | | | 2016
£m | | | Change | | | 2017
€m | | | 2016
€m | | | Change | | | constant
currencies | | | Change
underlying | |
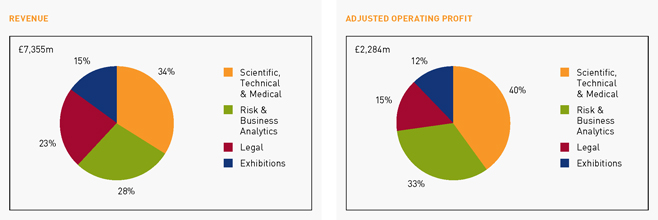
Revenue | | | 7,355 | | | | 6,895 | | | | +7% | | | | 8,385 | | | | 8,412 | | | | 0% | | | | +2% | | | | +4% | |
Operating profit | | | 1,905 | | | | 1,708 | | | | +12% | | | | 2,172 | | | | 2,084 | | | | +4% | | | | | | | | | |
Profit before tax | | | 1,734 | | | | 1,473 | | | | +18% | | | | 1,977 | | | | 1,797 | | | | +10% | | | | | | | | | |
| Net profit attributable to RELX PLC and RELX NV shareholders | | | 1,659 | | | | 1,161 | | | | | | | | 1,891 | | | | 1,416 | | | | | | | | | | | | | |
Net margin | | | 22.6% | | | | 16.8% | | | | | | | | 22.6% | | | | 16.8% | | | | | | | | | | | | | |
Net borrowings | | | 4,732 | | | | 4,700 | | | | | | | | 5,300 | | | | 5,499 | | | | | | | | | | | | | |
| | | | | | | | | | | | | | | | | | | | | | | | | | | | | | | | |
| ADJUSTED FIGURES | | £ | | | € | | | Change at | | | | |
| For the year ended 31 December | | 2017 £m | | | 2016 £m | | | Change | | | 2017 €m | | | 2016 €m | | | Change | | | constant
currencies | | | Change
underlying | |
Operating profit | | | 2,284 | | | | 2,114 | | | | +8% | | | | 2,604 | | | | 2,579 | | | | +1% | | | | +3% | | | | +6% | |
Operating margin | | | 31.1% | | | | 30.7% | | | | | | | | 31.1% | | | | 30.7% | | | | | | | | | | | | | |
Profit before tax | | | 2,118 | | | | 1,934 | | | | +10% | | | | 2,415 | | | | 2,359 | | | | +2% | | | | +4% | | | | | |
| Net profit attributable to RELX PLC and RELX NV shareholders | | | 1,635 | | | | 1,488 | | | | +10% | | | | 1,864 | | | | 1,815 | | | | +3% | | | | +5% | | | | | |
Net margin | | | 22.2% | | | | 21.6% | | | | | | | | 22.2% | | | | 21.6% | | | | | | | | | | | | | |
Cash flow | | | 2,192 | | | | 2,016 | | | | +9% | | | | 2,500 | | | | 2,460 | | | | +2% | | | | +3% | | | | | |
Cash flow conversion | | | 96% | | | | 95% | | | | | | | | 96% | | | | 95% | | | | | | | | | | | | | |
Return on invested capital | | | 13.1% | | | | 13.0% | | | | | | | | 13.1% | | | | 13.0% | | | | | | | | | | | | | |
RELX PLC and RELX NV | | | | | | | | | | | | | | | | | | | | | |
| | | | | | RELX PLC | | | RELX NV | | | Change at constant | |
| | | | | | 2017 | | | 2016 | | | Change | | | 2017 | | | 2016 | | | Change | | | currencies | |
Adjusted earnings per share | | | | | | | 81.0p | | | | 72.2p | | | | +12% | | | | €0.923 | | | | €0.880 | | | | +5% | | | | +7% | |
Reported earnings per share | | | | | | | 82.2p | | | | 56.3p | | | | +46% | | | | €0.936 | | | | €0.687 | | | | +36% | | | | | |
Ordinary dividend per share | | | | | | | 39.4p | | | | 35.95p | | | | +10% | | | | €0.448 | | | | €0.423 | | | | +6% | | | | | |
| | | | | | | | | | | | | | | | | | | | | | | | | | | | | | | | |
RELX PLC and RELX NV are separate, publicly held entities. RELX PLC’s ordinary shares are listed in London and New York, and RELX NV’s ordinary shares are listed in Amsterdam and New York. In New York the listings are in the form of American Depositary Shares (ADSs), evidenced by American Depositary Receipts (ADRs). RELX PLC and RELX NV jointly own RELX Group plc. One RELX PLC ordinary share confers an equivalent economic interest to one RELX NV ordinary share. RELX PLC, RELX NV, RELX Group plc and its subsidiaries, joint ventures and associates are together known as “the Group”.
| | |
| Business review RELX Group business overview | | 9 |
|
|
Market segments*
| | |
| | | Segment position |
| | |
Scientific, Technical & Medicalis a global information and analytics business that helps institutions and professionals advance healthcare, open science, and improve performance for the benefit of humanity. | | Global #1 |
| | |
Risk & Business Analyticsprovides customers with solutions and decision tools that combine public and industry specific content with advanced technology and analytics to assist them in evaluating and predicting risk and enhancing operational efficiency. | | Key verticals #1 |
| | |
Legalis a leading global provider of legal, regulatory and business information and analytics that helps customers increase productivity, improve decision-making and outcomes and advance the rule of law around the world. | | US #2 Outside US #1 or 2 |
| | |
Exhibitionsis the world’s leading events business, enhancing the power offace-to-face through data and digital tools at over 500 events, in 30 countries, attracting more than 7m participants. | | Global #1 |
* For additional information regarding revenue from our business activities and geographical markets, see market segments section starting on page 13.
Financial summary by market segment
| | | | | | | | | | | | | | |
| | | Revenue | | | | Adjusted operating profit |
| | | 2017 £m | | | Change underlying* | | | | 2017 £m | | | Change underlying* |
Scientific, Technical & Medical | | | 2,478 | | | +2% | | | | | 913 | | | +3% |
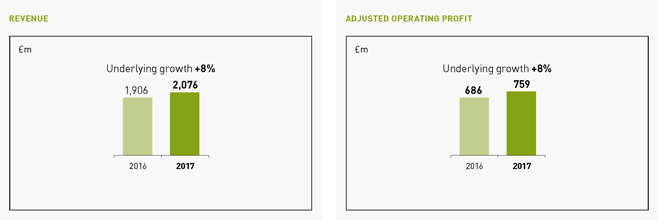
Risk & Business Analytics | | | 2,076 | | | +8% | | | | | 759 | | | +8% |
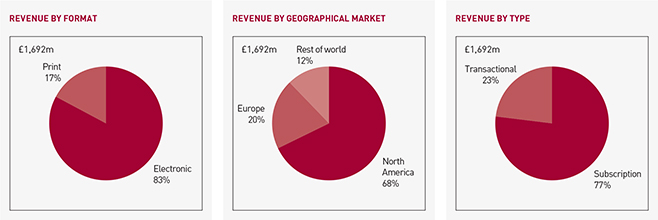
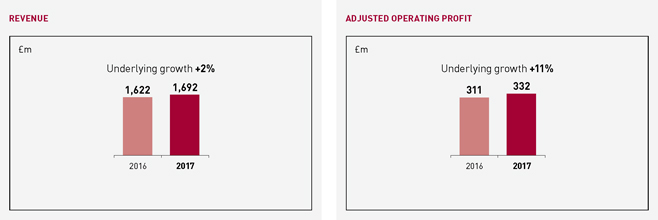
Legal | | | 1,692 | | | +2% | | | | | 332 | | | +11% |
Exhibitions | | | 1,109 | | | +6% | | | | | 285 | | | +2% |
Unallocated items | | | | | | | | | | | (5) | | | |
| | | | 7,355 | | | +4% | | | | | 2,284 | | | +6% |
| * | RELX Group uses adjusted and underlying figures as additional performance measures. These measures are used by management, alongside the comparable GAAP measures, in evaluating the business performance. Adjusted figures primarily exclude the amortisation of acquired intangible assets and other items related to acquisitions and disposals, and the associated deferred tax movements. In 2017, we have excluded the exceptional tax credit arising as a result of the US Tax Cuts and Jobs Act. Reconciliations between the reported and adjusted figures are set out on page 186. Underlying growth rates are calculated at constant currencies, and exclude the results of all acquisitions and disposals made in both the year and prior year and of assets held for sale. Underlying revenue growth rates also exclude exhibition cycling. Constant currency growth rates are based on 2016 full year average and hedge exchange rates. |

| | |
| 10 | | RELX Group Annual reports and financial statements 2017 |
|
|
Harnessing big data
across RELX Group:
HPCC Systems (High Performance Computing Cluster) is RELX Group’s open source big data technology. It is used to analyse structured and unstructured data, giving our customers the information and insight they need. Each of our market segments benefits from this technology, allowing our customers around the world to make better decisions, get better results and be more productive.
State of Florida fights public benefits fraud with LexisNexis Risk Solutions
Florida’s Department of Children and Families provides a range of programmes, including food assistance tolow-income families. With nearly 93% of all Florida public assistance benefit applications received electronically, there is a risk for abuse by identity fraudsters. Additionally, the state has the largest percentage of elderly residents in the US, who are attractive targets for fraud schemes. The population is also highly transient and many do not have conventional bank accounts, rendering most identity management solutions useless.
To combat this threat, in 2013 the state of Florida selected LexisNexis Risk Solutions to support its Customer Authentication Program to verify food assistance applicants’ identities. When a person goes online to Florida’s integrated eligibility system to apply for benefits, the state is able to quickly authenticate the applicant’s identity via Identity Management solutions powered by HPCC Systems. The applicant answers a series of questions that only the owner of the identity would be able to answer.
By the end of 2013, just five months after state-wide implementation of the Customer Authentication Program, the state estimated it had saved nearly $15m by preventing fraud and improving efficiencies, and received the Governor’s Savings Award. Since then, the total cost avoidance associated with the programme is over $840m in taxpayer benefits not issued due to suspected fraud. That amounts to a 194 to 1 return on investment.

| | |

| | |
| |
| These Identity Management solutions help us to achieve our goal, which is to safeguard the integrity of public assistance benefits to ensure benefits only go to Floridians who truly are in need. | | |
| |
Andrew McClenahan Director, Office of Public Benefits Integrity Florida Department of Children and Families | | |
| | |

| | |
| $840m+ | | |
| |
more than $840m saved by the state of Florida since 2013 using LexisNexis Risk Solutions technology | | |
| | |
| Business review RELX Group business overview | | 11 |
|
|

Cook County, Illinois and LexisNexis Risk Solutions
Residential property tax fraud, also called homestead exemption fraud, occurs in US counties when taxpayers wrongly receive residential property tax breaks on homes they don’t live in as their primary residence or receive tax exemptions for which they otherwise don’t qualify, such as those for senior citizens.
This type of fraud costs US counties millions each year, which has a significant impact on funding for public services, including schools, public safety and other local needs. In the state of Illinois, the Cook County Assessor’s Office needed an investigative tool to help detect these fraudulent tax filings, so it implemented the LexisNexis Homestead Exemption Fraud Detection Solution. Powered by HPCC Systems, the solution examines the homestead exemption filings of the county’s more than 1.4m residential properties to ensure compliance with State of Illinois tax laws. Over the last four years LexisNexis Risk Solutions has helped the county bill more than $47 million in lost revenue. helped the county bill more than $47 million in lost revenue.
With recovered revenue returned directly to school districts and other community taxing bodies, the program has already had a huge impact. And, this is not aone-time recovery of revenue; the savings continue because erroneous exemptions remain eliminated from future years. The solution is helping us recover millions of dollars for taxpayers at a time when Cook County schools and municipalities struggle with budget issues. We respect honest taxpayers while continuing our commitment to aggressively detect and pursue tax cheats.
Joseph Berrios
Cook County Assessor
$47m+
more than $47m billed by
Cook County using LexisNexis
Risk Solutions technology
| | |
| 12 | | RELX Group Annual reports and financial statements 2017 |
|
|


| | |
| 14 | | RELX Group Annual reports and financial statements 2017 |
|
|
Scientific, Technical & Medical
| | |
| |
We help researchers make new discoveries, collaborate with their colleagues and give them the knowledge they need to find funding. We help governments and universities evaluate and improve their research strategies. We help doctors save lives, providing insight for physicians to find the right clinical answers and we support nurses and other healthcare professionals throughout their careers. Our goal is to expand the boundaries of knowledge for the benefit of humanity. |
| | |
| | |
| ∎ | | We enhance the quality of research output by organising the review, editing and dissemination of 17% of the world’s scientific articles |
| |
| ∎ | | ScienceDirect, the world’s largest database of peer-reviewed primary scientific and medical research, has 14m monthly unique visitors |
| |
| ∎ | | Scopus is the leading abstract and citation database of research literature, with over 70m publications and 1.4bn citation records from 5,000 publishers |
| |
| ∎ | | SciVal offers insights into the research performance of over 9,000 research institutions |
| |
| ∎ | | ClinicalKey, the flagship clinical reference platform, is accessed by more than 4,400 institutions |
| |
| ∎ | | Elsevier journals have at some point featured articles by 173 of 174 science and economics Nobel prize winners since 2000 |
Business overview
Scientific, Technical & Medical is a global information and analytics business that helps institutions and professionals advance healthcare, open science, and improve performance for the benefit of humanity.
Elsevier is headquartered in Amsterdam, with further principal operations in Boston, New York, Philadelphia, St. Louis and Berkeley in North America, London, Oxford, Frankfurt, Munich, Madrid and Paris in Europe, Bejing, Chennai, Delhi, Singapore and Tokyo in Asia Pacific and Rio de Janeiro in South America. It has 7,500 employees and serves customers in over 180 countries.
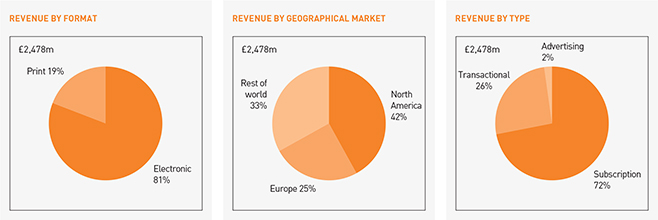
Revenues for the year ended 31 December 2017 were £2,478m, compared with £2,320m in 2016 and £2,070m in 2015. In 2017, 42% of revenue by geographical market was derived from North America, 25% from Europe and the remaining 33% from the rest of the world. Subscription sales generated 72% of revenue, transactional sales 26% and advertising 2%.
Elsevier serves the needs of scientific, technical and medical markets by organising the review, editing and disseminating of primary research, reference and professional education content, as well as by providing a range of database and decision tools.
Elsevier’s customers are scientists, academic institutions, research leaders and administrators, medical researchers, doctors, nurses, allied health professionals and students, as well as hospitals, research institutions, health insurers, managed healthcare organisations, research-intensive corporations and governments. All these customers rely on Elsevier to provide high-quality content and critical information for making scientific and medical decisions and create innovative tools to help focus research strategies, increase research effectiveness, improve medical outcomes, and enhance the efficiency of healthcare and healthcare education.
In the primary research market during 2017, 1.6m research papers were submitted to Elsevier. More than 20,000 editors managed the peer review and selection of these papers, resulting in the publication of over 430,000 articles in about 2,500 journals, many of which are the foremost publications in their field and a primary point of reference for new research. This content was accessed by about 14m unique visitors on average per month, with over 900m full-text article downloads last year. In 2017, Elsevier launched 26 new subscription and open access journals, including Materials Today Physics, Joule from Cell Press and The Lancet Planetary Health.
ScienceDirect, the world’s largest database of peer-reviewed primary scientific and medical research, hosts over 15m pieces of content and 38,000e-books. Flagship journals include Cell and The Lancet family of titles.
Elsevier is also a global leader in scientific, technical and medical reference markets, providing authoritative and current professional reference content. Flagship titles include works such as Gray’s Anatomy, Nelson’s Pediatrics and Netter’s Atlas of Human Anatomy.
| | |
| Business review Scientific, Technical & Medical | | 15 |
|
|
For academic and corporate researchers, significant products include Scopus, Reaxys and Knovel. Scopus, the leading abstract and citation database of peer-reviewed literature with over 70m publications from more than 22,500 active journals and 5,000 international publishers, allows researchers to track, analyse and visualise the world’s research output. Reaxys enables the shortest path to chemistry research answers, supporting the early stages of drug development in the pharmaceutical industry, exploratory chemistry research in academia, and product development in industries such as chemicals and oil & gas. Knovel is a decision support tool for engineers that helps them to select the right materials, a mission-critical use case in product development across chemicals, oil & gas and other engineering-focused industries.
Elsevier serves academic and government research administrators through its Research Intelligence suite of products. Leveraging bibliometric data from Scopus and other data types such as patent citations and usage data, SciVal is a decision tool that helps institutions to establish, execute and evaluate research strategies. Pure is an enterprise research management solution that aggregates an organisation’s research information from numerous internal and external sources into a single platform and ensures the data that drives strategic decisions is trusted, comprehensive and accessible in one place. Our Analytical Services team provides accurate, unbiased analysis on research performance by combining high-quality data sources with technical and research metrics expertise. Expert LookUp is an online tool that helps funding bodies find the best peer reviewers for evaluating grant applications.
Elsevier’s flagship clinical reference platform, ClinicalKey, provides physicians, nurses, and pharmacists with access to leading Elsevier and third-party reference and evidence-based medical content in a single, fully integrated site. ClinicalKey is growing well, and is currently accessed by more than 4,400 institutions.
In medical education, Elsevier serves students of medicine, nursing and allied health professions in a number of formats including electronic books and electronic solutions. For example, Sherpath, an adaptive teaching and learning solution for nursing and health education, provided highly focused, personalised and adaptive learning paths for over 33,000 users at over 400 institutions in 2017.
For healthcare professionals, Elsevier develops products to deliver patient-specific solutions at the point of care to improve patient outcomes. Its clinical solutions include Interactive Patient Education, which provides patient education and discharge information, and Care Planning, which provides a data-driven framework to support nurses in undertaking procedures.
Arezzo, an active clinical decision support engine integrated with clinical care systems, matches evidence-based guidelines with patient and disease information and dynamically evaluates best-practice treatment options.


| | |
| 16 | | RELX Group Annual reports and financial statements 2017 |
|
|
In every market, Elsevier is applying advanced machine learning (ML) and natural language processing (NLP) techniques to help researchers, engineers and clinicians perform their work better. For example, in research, NLP and ML techniques classify scientific content and organise it thematically, enabling the users to get faster access to relevant results and related scientific topics. In parallel, advanced information extraction and NLP techniques are applied to extract the most important information for scientific concepts in concise summaries. Elsevier also applies advanced ML techniques that detect trending topics per domain, helping researchers decide where to focus their research. Coupled with the automated profiling and extraction of funding body information from scientific articles, this process supports the whole researcher journey; from planning, to execution and funding.
In health, Elsevier uses machine learning to enable clinicians to search for both images and text, improving the success rates in the retrieval of the right content with sufficient associated sources. This helps health professionals perform their work better, get the latest high quality information on best practices and state-of-the-art care, and save more human lives.
Market opportunities
Scientific, technical and medical information markets have good long-term growth characteristics. The importance of research and development to economic performance and competitive positioning is well understood by governments, academic institutions and corporations. This is reflected in the long-term growth in research and development spending and in the number of researchers worldwide. Growth in health markets is driven by ageing populations in developed markets, rising prosperity in developing markets and the increasing focus on improving medical outcomes and efficiency. Given that a significant proportion of scientific research and healthcare is funded directly or indirectly by governments, spending is influenced by governmental budgetary considerations. The commitment to research and health provision does, however, remain high, even in more difficult budgetary environments.
Strategic priorities
Elsevier’s strategic goal is to lead the way in providing information solutions that advance science, technology and health. To achieve this, Elsevier creates solutions that reflect deep insight into the way its users work and the outcomes they are seeking to achieve; strives for excellence in content, service and execution; constantly adapts and revitalises its products, business models and technology; and leverages its institutional skills, assets and resources to promote innovation and efficiency.
Elsevier’s strategic priorities are to: continue to increase content volume and quality; expand content coverage, building out integrated solutions and decision tools combining Elsevier, third-party and customer data; increase content utility, using “Smart Content” to enable new e-solutions; combine content with analytics and technology, focused on measurably improving productivity and outcomes for customers; and continue to drive operational efficiency and effectiveness.
In the primary research market, Elsevier aims to grow volume through new journal launches, expansion of author-pays journals and growth from emerging markets; enhance quality by building on our premium brands; and add value to core platforms by implementing new capabilities such as advanced recommendations on ScienceDirect and social collaboration through Mendeley.
In clinical reference markets, priorities are to expand content coverage and ensure consistent and seamless linking of content assets across products.
Business model, distribution channels and competition
Science and medical research is principally disseminated on a paid subscription basis to the research facilities of academic institutions, governments and corporations and, in the case of medical and healthcare journals, to individual practitioners and medical society members. For the past decade content has been provided free or at very low cost in over 100 countries and territories in the developing world through Research4Life, a United Nations partnership initiative. For a number of journals, advertising and promotional income represents a small proportion of revenues, predominantly from pharmaceutical companies in healthcare titles.
| | |
| Business review Scientific, Technical & Medical | | 17 |
|
|
Over the past 15 years, alternative models for the dissemination of research have emerged. While it is expected that paid subscription will remain the primary distribution model, Elsevier has long invested in alternative business models to address the needs of customers and researchers. Open access journals are one such example. In 2017, we published over 27,000 open access articles, a double-digit growth on the previous year, making us the second largest open access publisher in the world. Over 1,890 of Elsevier’s journals now offer the option of funding publication and distribution via a sponsored article fee.
Next to subscription and open access journals, Elsevier has also invested in other models to address the needs of the research community. SSRN for example is an open-access online preprint community where researchers post early-stage research, prior to publication in academic journals. Mendeley data enables researchers to make their research data publicly available by providing an open research data repository. Bepress, which joined Elsevier in 2017, helps academic libraries showcase and share
their institutions’ research via institutional repositories for greatest impact.
Electronic products, such as ScienceDirect, Scopus and ClinicalKey, are generally sold direct to customers through a dedicated sales force that has offices around the world. Subscription agents sometimes facilitate the sales and administrative process for remaining print sales. Reference and educational content is sold directly to institutions and individuals and accessed on Elsevier platforms. Sometimes it is still sold in printed book form through retailers, wholesalers or directly to end users.
Competition within science and medical reference content is generally on atitle-by-title andproduct-by-product basis. Competition in research and reference products is typically with learned societies and professional information providers, such as Springer Nature, Clarivate Analytics and Wolters Kluwer. Decision tools face similar competition, as well as from software companies and internal solutions developed by customers.
2017 financial performance
| | | | | | | | | | | | |
| | | 2017 £m | | 2016 £m | | Underlying growth | | Acquisitions/
disposals | | Currency effects | | Total growth |
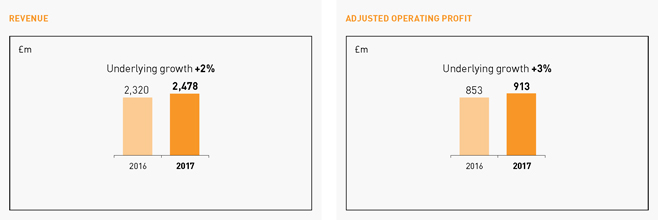
Revenue | | 2,478 | | 2,320 | | +2% | | 0% | | +5% | | +7% |
Adjusted operating profit | | 913 | | 853 | | +3% | | -1% | | +5% | | +7% |
Key business trends remained positive in 2017, with underlying profit growth slightly exceeding underlying revenue growth.
Underlying revenue growth was +2%. The difference between the reported and underlying growth rates primarily reflects the impact of exchange rate movements and portfolio changes, including the acquisitions of Plum Analytics and bepress, and the disposal of certain international pharma promotion assets.
Underlying adjusted operating profit growth of +3% was slightly ahead of revenue growth, with an underlying margin improvement offset by portfolio effects.
Electronic revenues saw continued good growth, partially offset by further print declines. In primary research we continued to enhance customer value by providing broader content sets across our research offering, increasing the sophistication of our
analytics, and evolving our technology platforms. Databases & tools continued to drive growth across market segments through the launch of enhanced functionality and content development.
Print books, which now represent around 10% of divisional revenues, saw continued sales declines with return rates at historical levels, following higher than average return rates in the prior year. The decline in print pharma promotion revenues, which represent less than 5% of the divisional total, returned to historical rates of decline after a stronger prior year.
2018 outlook
Our customer environment remains largely unchanged. Overall we expect another year of modest underlying revenue growth, with underlying operating profit growth continuing to exceed underlying revenue growth.

| | |
| 18 | | RELX Group Annual reports and financial statements 2017 |
|
|

| | |
Business review Scientific, Technical & Medical | | 19 |

| | |
| 20 | | RELX Group Annual reports and financial statements 2017 |
|
|
Risk & Business Analytics
| | |
| |
We use the power of data and advanced analytics to help our customers make better, timelier decisions. Our innovative solutions enable organisations to manage risks like identity theft, fraud, money laundering and terrorism, and prevent financial crimes, and insurance and government benefit scams. We help those without traditional credit histories obtain access to funds, assist agencies to find uncollected revenue, and research ways to improve business outcomes for healthcare companies. We also work with law enforcement to solve crimes. We advise farmers with their efforts in precision agriculture and work with airlines to improve their operations and services for passengers. We help customers in the petrochemicals, energy and fertiliser industries to make better trading and planning decisions. By bringing clarity to information, we ultimately help make communities safer, insurance rates more accurate, commerce more transparent, business decisions easier and processes more efficient. |
| | |
| | |
| ∎ | | LexisNexis Risk Solutions maintains over 78bn records |
| |
| ∎ | | Since 2013, the Florida Department of Children and Families has used our identity management solutions to prevent food stamp fraud, achieving a total cost avoidance of over $840m in taxpayer benefits not issued due to suspected fraud |
| |
| ∎ | | LexisNexis Risk Solutions performs over 100m identity verification checks and over 100bn customer and transaction screening requests annually, supporting industries such as banking, fintech ande-commerce |
| |
| ∎ | | LexisNexis Risk Solutions works with more than 75% of Fortune 500 companies, eight out of 10 of the world’s top banks and 95 out of the top 100 personal lines insurance companies |
| |
| ∎ | | Accuity has information on 22,000 banks and 95 of the world’s largest 100 banks use its data |
| |
| ∎ | | FlightGlobal analyses 2.5bn travel segments every year worth about $385bn and tracks 100,000 commercial flights daily, or more than 35m a year |
Business overview
Risk & Business Analytics provides customers with solutions and decision tools that combine public and industry specific content with advanced technology and analytics to assist them in evaluating and predicting risk and enhancing operational efficiency.
Risk & Business Analytics is headquartered in Alpharetta (Georgia), with further principal operations in Florida, Illinois and Ohio in North America, London and Amsterdam in Europe and Shanghai in Asia Pacific. It has 8,100 employees and serves customers in more than 170 countries.
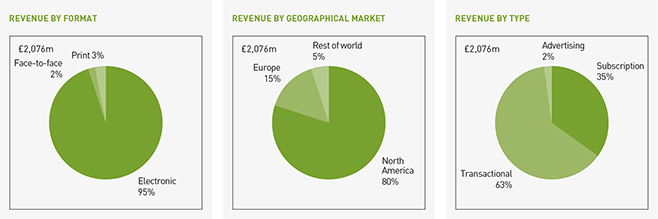
Revenues for the year ended 31 December 2017 were £2,076m, compared with £1,906m in 2016 and £1,601m in 2015. In 2017, 80% of revenue came from North America, 15% from Europe and the remaining 5% from the rest of the world. Subscription sales generated 35% of revenues, transactional sales 63% and advertising 2%.
The business is organised around market-facing industry/sector groups: Insurance Solutions, Business Services, Government Solutions, Health Care Solutions, as well as Data Services (including banking, energy and chemicals, aviation, agriculture and human resources).
Insurance Solutions, the largest segment, provides comprehensive data, analytics and decision tools for personal, commercial and life insurance carriers in the US to improve critical aspects of their business. Information solutions, including the most comprehensive US personal loss history database, C.L.U.E., help insurers assess risks and provide important inputs to pricing and underwriting insurance policies. Additional key products include LexisNexis Data Prefill, which provides information on customers directly into the insurance workstream and LexisNexis Current Carrier, which identifies insurance coverage details and any lapses in coverage.
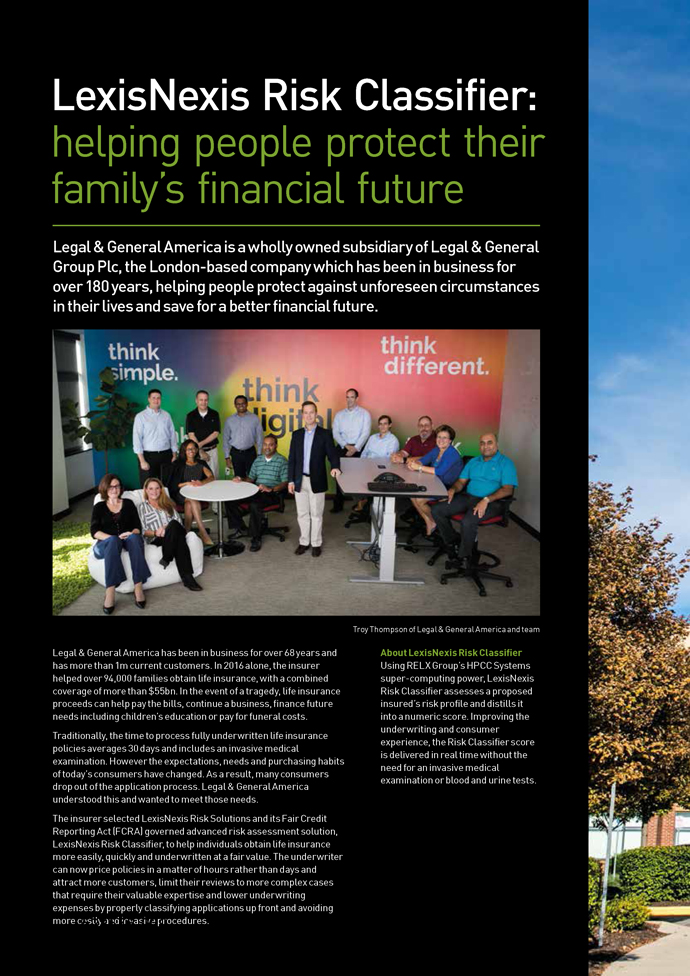
In the US, we are focused on delivering innovative decision tools through a single point of access within an insurer’s infrastructure. LexisNexis Active Insights, our solution for active risk management, connects proprietary linking algorithms with vast amounts of data to proactively inform insurers of key events impacting their policyholders. We are advancing our strategy to drive more consistency and efficiency in claims through our solution suite, Claims Compass. Our Risk Classifier solution, which uses public and motor vehicle records and predictive modelling, is used by more than 20% of the top 50 life insurers to better understand risk and improve underwriting efficiency.
We continue to make progress outside the US. In the UK, contributory solutions including No Claims Discount module, which automates verification of claims history, and new offering Policy Insights, a predictor of motor claims loss, are being integrated into the LexisNexis Informed Quotes platform to deliver data in real-time into the quoting process of an insurance transaction. In China, the Genilex joint venture is delivering key vehicle data to auto insurers and is looking to add more analytics solutions. In India, our Intelligence Exchange contributory platform and Risk Insights solution are used by life insurers to predict, better assess and manage risk within the underwriting and claims management processes.
| | |
| Business review Risk & Business Analytics | | 21 |
|
|
Business Services provides organisations withstate-of-the-art risk management, including: financial crime compliance, fraud and identity management, consumer and business credit risk assessment, and collections. These include solutions for watch-list screening, due diligence, identify verification and authentication, credit scoring and skip tracing. Our big data technology (HPCC Systems), vast alternative data repository and analytic linking capabilities provide valuable information and analytics that are used to help solve complex global issues, like financial inclusion and financial transparency.
The investments we made in business risk over the past few years continue to bear fruit with the launch of additional products in 2017. We brought to market the latest version of our Business Instant ID offering and broadened data coverage in our business risk suite. The launch of our Risk Defense Platform has proven successful with the delivery of holistic fraud prevention solutions for large enterprise customers. Global expansion continues to accelerate Business Services growth with increasing adoption of our products by leading and innovative global companies.
In January 2018, RELX Group announced it had agreed to acquire ThreatMetrix, a leader in the global risk-based authentication sector, headquartered in San Jose, California. ThreatMetrix’s technology analyses connections among devices, locations, anonymised identity information and threat intelligence, and combines this data with behavioural analytics to identify high-risk digital behaviour and transactions in real time.
Government Solutions provides identity intelligence to US federal, state and local law enforcement and government agencies to help solve criminal cases and identify fraud, waste and abuse in government programmes. In addition to providing identity theft solutions for tax agencies to help ensure legitimate taxpayers receive tax refunds, the group began providing business intelligence solutions allowing government agencies to find additional fraud and property tax.
The Public Safety Data Exchange (PSDEX) is a contributory database of more than 1,300 law enforcement agencies. The PSDEX compiles data from law enforcement agencies across the US to help them solve crimes, identify threats and anticipate future threats. It is also linked to public records data and served back to agencies to accelerate criminal investigations through key solutions, such as Accurint Virtual Crime Center.
In the healthcare sector, Government Solutions gained momentum in educating government healthcare agencies on the value of using robust, accurate data and analytics to identify relationships and patterns among healthcare providers, pharmacies and patients to pinpoint illegal distribution of opioids. Government Solutions continued to grow its contributory database footprint in the health, human services; tax and revenue; and public safety markets.
Health Care Solutions utilises socioeconomic, consumer, provider and medical claims data to deliver leading identity, fraud, compliance and health risk analytics solutions across key stages of healthcare to enable intelligent decision-making for payers, providers, life sciences organisations and pharmacies. In 2017, we enhanced our LexisNexis Socioeconomic Health Score and Attributes to patients’ health risk based on their socioeconomic profile.

| | |
| 22 | | RELX Group Annual reports and financial statements 2017 |
|
|
Data Services include: Accuity, a provider of services and solutions to the banking and corporate sectors focused on payment efficiency, Know Your Customer (KYC), Anti-Money Laundering (AML) and compliance; ICIS, an information and data service in chemicals, energy and fertilisers; XpertHR, an online service providing regulatory guidance, best practices and tools for human resource professionals; Nextens, a provider of tools and services for tax professionals; FlightGlobal, a leading provider of data and analytics for the global commercial aviation and travel industry; Proagrica, a provider of software, connectivity solutions, data, analytics and media streams for the global agriculture sector; and EG, which delivers a mix of high-quality data, decision tools and high-value news and information to the UK’s commercial real estate market.
In 2017, we continued to reshape our portfolio, exiting areas not core to our strategy. A number of media titles and brands were divested, including New Scientist, Personnel Today, Community Care and Landleven.
Market opportunities
We operate in markets with strong long-term growth in demand for high-quality advanced analytics based on industry information and insight, including: insurance underwriting transactions; insurance acquisition, retention and claims handling; healthcare, tax and public benefits fraud; financial crime compliance; business risk; fraud and identity solutions; due diligence requirements surrounding customer enrolment; security and privacy considerations; and data and advanced analytics for the banking, energy and chemicals, human resources and aviation sectors.
In the insurance segment, growth is supported by increasing transactional activity in the auto, property and life insurance markets and the increasing adoption by insurance carriers of more sophisticated data and analytics in the prospecting, underwriting and claims evaluation processes, to assess underwriting risk, increase competitiveness and improve operating cost efficiency. Transactional activity is driven by growth in insurance quoting and policy switching, as consumers seek better policy terms.
This activity is stimulated by competition among insurance companies, high levels of carrier advertising and rising levels of internet quoting and policy binding. As a result, we continue to expand our services to make it easier for the consumer to transact with an insurer throughout the insurance process.
A number of factors support growth in banking and financial services markets, including cross-border payments and trade finance levels. Escalating anti-money laundering fines, high-profile anti-bribery and corruption cases, growth through consumer and business credit expansion, increased fraud losses and heightened regulatory scrutiny impact growth opportunities for us with all entities, including financial institutions, e-commerce, retail, communications, mobile and media companies. The rise in fintech and alternative lending also positively influences our trajectory. In collections, demand is driven mainly by the elevated levels of consumer debt and the prospect of recovering that debt.
Growth in government markets is driven by the increasing demand for our contributory solutions to combat criminal activity, fraud and tax evasion. The level and timing of demand in this market is influenced by government funding and revenue considerations. In healthcare, there are numerous growth drivers for identity and fraud analytic solutions including the expansion of compliance requirements driven by new regulations.
Growth in the global energy and chemicals markets is driven by increasing trade and demand for more sophisticated information solutions. Aviation information markets are being driven by increases in air traffic and in the number of aircraft transactions. Growth in agriculture markets is being driven by adoption of technology and data solutions plus increasing supply chain connectivity.
| | |
| Business review Risk & Business Analytics | | 23 |
|
|
Strategic priorities
Our strategic goal is to help businesses and governments achieve better outcomes with information and decision support in their individual markets through better understanding of the risks and opportunities associated with individuals, other businesses, transactions and regulations. By providing the highest quality industry data and decision tools, we assist customers in understanding their markets and managing risks efficiently and cost effectively. To achieve this, we are focused on: delivering innovative new products; expanding the range of risk management solutions across adjacent markets; addressing international opportunities in selected markets to meet local needs; further growing our data services businesses; and continuing to strengthen our content, technology and analytical capabilities.
Business model, distribution channels and competition
Our products are for the most part sold directly, typically on a subscription or transactional basis. Pricing is predominantly on a transactional basis for insurance carriers and corporations, and primarily on a subscription basis for government entities.
In the insurance sector, our competitor Verisk sells data and analytics solutions to insurance carriers but largely addresses different activities to ours. Principal competitors in Business Services and government segments include Thomson Reuters and major credit bureaus, which in many cases address different activities in these segments as well.
Data Services competes with a number of information providers on a service andtitle-by-title basis including: Platts, Thomson Reuters and IHS as well as many niche and privately owned competitors.
2017 financial performance
| | | | | | | | | | | | | | | | | | | | | | | | |
| | | 2017
£m | | | 2016
£m | | | Underlying
growth | | | Acquisitions/
disposals | | | Currency
effects | | | Total
growth | |
Revenue | | | 2,076 | | | | 1,906 | | | | +8% | | | | -4% | | | | +5% | | | | +9% | |
| Adjusted operating profit | | | 759 | | | | 686 | | | | +8% | | | | -2% | | | | +5% | | | | +11% | |
Underlying revenue growth remained strong across all key segments in 2017. Underlying profit growth broadly matched underlying revenue growth.
Underlying revenue growth was +8%. The difference between the reported and underlying growth rates primarily reflects the impact of exchange rate movements and portfolio changes including the disposal of New Scientist and other magazines, and the sale of our majority stake in a property title services joint venture to our partner.
Underlying adjusted operating profit growth broadly matched underlying revenue growth as we continued to pursue our organic development strategy. The margin improvement reflects a positive effect from portfolio changes.
In Insurance we continued to drive growth through enhanced analytics, the extension of datasets, and by further expansion in
adjacent verticals. The US market environment returned to historical trends in the fourth quarter, having been not quite as favourable earlier in the year. The international initiatives continued to progress well.
In Business Services, further development of analytics that help our customers to detect and prevent fraud and to manage risk across the financial and corporate sectors continued to drive growth, in a positive US and international market environment.
Growth in the government and healthcare segments was driven by continued development of sophisticated analytics, and other Data Services continued to drive growth through organic development.
2018 outlook
The fundamental growth drivers of Risk & Business Analytics remain strong, and we expect underlying operating profit growth to continue to broadly match underlying revenue growth.

| | |
| 24 | | RELX Group Annual reports and financial statements 2017 |
|
|
| | |
Business review Risk & Business Analytics | | 25 |

| | |
| 26 | | RELX Group Annual reports and financial statements 2017 |
|
|

| | |
Business review Risk & Business Analytics | | 27 |

| | |
| 28 | | RELX Group Annual reports and financial statements 2017 |
|
|
Legal
| | |
| |
We help lawyers win cases, manage their work more efficiently, serve their clients better and grow their practices. We assist corporations in better understanding their markets and preventing bribery and corruption within their supply chains. We partner with leading global associations and customers to help collect evidence against war criminals and provide tools to combat human trafficking. We endeavour to advance the rule of law across the world. |
| | |
| | |
| ∎ | | The LexisNexis legal and news database contains 81bn documents and records |
| |
| ∎ | | 1.5m new legal documents are added daily to the database from 54,000 sources, generating 20bn connections. In all, 20m legal documents are processed daily |
| |
| ∎ | | Nexis news and business content includes 40,000 premium sources in 30 languages, covering more than 150 countries. It has data including 320m company profiles with a content archive that dates back 40 years |
| |
| ∎ | | The LexisNexis database includes more than 220m court dockets and documents, 110m patent documents, 1.9m State Trial Orders and 1.2m Jury verdict and settlement documents |
| |
| ∎ | | LexisNexis is committed to advancing the rule of law through operations and solutions that provide transparency into the law in more than 130 countries |
Business overview
Legal is a leading global provider of legal, regulatory and business information and analytics that helps customers increase productivity, improve decision-making and outcomes and advance the rule of law around the world.
LexisNexis Legal & Professional is headquartered in New York and has further principal operations in Ohio, North Carolina and Toronto in North America, London and Paris in Europe, and cities in several other countries in Africa and Asia Pacific. It has 10,600 employees worldwide and serves customers in more than 130 countries.
Revenues for the year ended 31 December 2017 were £1,692m, compared with £1,622m in 2016 and £1,443m in 2015. By geographical market, 68% of revenue in 2017 was derived from North America, 20% from Europe and the remaining 12% from the rest of the world. In 2017, 77% of revenue came from subscription sales and 23% from transactional sales.
LexisNexis Legal & Professional is organised in market-facing groups. These are supported by global shared services organisations providing platform and product development, operational and distribution services, and other support functions.
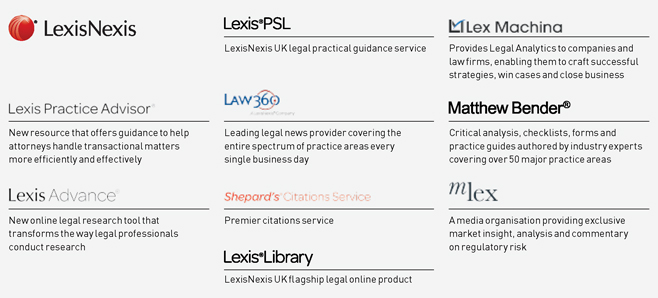
In North America, electronic reference, decision tools and analytics help legal and business professionals make better informed decisions in the practice of law and in managing their businesses. The flagship product for legal research and analytics is Lexis Advance, which provides statutes and case law together with analysis and expert commentaries from secondary sources such as Matthew Bender. In addition, Lexis Advance includes the leading citation service, Shepard’s, which advises on the continuing relevance of case law precedents. In North America, we also provide customers with news and business information, ranging from daily news to company filings, public records information, legal analytics tools, practical guidance and efficiency solutions. LexisNexis also partners with law schools to provide services to students as part of their training.
In 2017, LexisNexis continued to release new versions of Lexis Advance, an innovative web and mobile application designed to transform how legal professionals conduct research and use analytics and data to drive decision-making. Built on the New Lexis advanced technology platform, Lexis Advance allows customers within legal and professional organisations to find relevant information more easily and efficiently, helping to drive better outcomes. Future releases will continue to expand content and add new innovative analytical tools extensively using machine learning and natural language processing. LexisNexis employs lawyers and trained editors with professional legal backgrounds who review, annotate and update its legal content to help ensure each document in the collection is current and comprehensive. This domain expertise combined with Artificial Intelligence and RELX Group’s big data HPCC Systems technology enables LexisNexis to update its entire legal collection faster and more efficiently than before, while also identifying and linking content, enabling customers to identify previously undiscovered relationships between documents.
New analytical tools and content sets are regularly introduced on Lexis Advance. For example, in 2017 LexisNexis released Lexis Answers, which leverages advanced natural language processing technologies to deliver concise and authoritative answers to users’ questions alongside comprehensive search results. In 2017 LexisNexis also continued to make enhancements to Lexis Practice Advisor by integrating Lexis Search Advantage, a tool that enriches search and analytics across firm documents and LexisNexis content, and launching a redesigned user interface with improved browsing capabilities.
LexisNexis continues to expand the reach of its analytical decision tools. For instance, in 2017 Lex Machina, a legal analytics tool providing actionable insights about judges, lawyers, parties and cases, expanded its practice area coverage to include Commercial, Employment, and Bankruptcy Litigation. In 2017, LexisNexis also acquired Ravel Law, a legal research, analytics and visualisation platform that mines published case opinions, providing a wealth of information that helps litigators quickly uncover new insights and build specific arguments for use in court. The acquisition will expand the LexisNexis Legal Analytics suite of products through full integration of Ravel Law’s judicial analytics, data visualisation technology and unique case law PDF content from the Harvard Law Library into Lexis Litigation Profile Suite and Lexis Advance. These tools complement the Lex Machina analytics solution and strengthen the LexisNexis position as a leader in the legal analytics space.
In Canada, LexisNexis released new versions of Lexis Advance Quicklaw with significant content and functionality enhancements, including improved search and browsing andpoint-in-time and aggregated views of legislation. LexisNexis Canada also released The Lawyer’s Daily, the first online-only daily legal news service in the market, and continued to build out Lexis Practice Advisor Canada with additional modules, tools and content.
LexisNexis also supplies Business of Law Software Solutions to law firms and corporate legal departments. These solutions include practice management solutions, including time and billing systems, case management, cost recovery and document management services.
In international markets outside North America, LexisNexis serves legal, corporate, government, accounting and academic markets in Europe, Africa and Asia Pacific with local and international legal, regulatory and business information. The most significant of these businesses are in the UK, France, Australia and South Africa.
LexisNexis focuses on providing customers with leading collections of content and innovative online solutions to help legal and business professionals make better decisions more efficiently.
In the UK, LexisNexis is a leading legal information provider offering an unrivalled collection of primary and secondary legislation, case law, expert commentary, practical guidance and current awareness. Its extensive portfolio includes a number of leading brands: Halsbury’s, Butterworths, Tolley, MLex and Jordan Publishing. Jordan Publishing‘s market-leading content offering includes flagship titles such as Family Court Practice, Family Law Reports and Gore-Browne on Companies.
In 2017, LexisNexis UK continued to build on its LexisPSL practical guidance product suite by launching new sector specific content modules in Technology, Media and Telecommunications (TMT), Financial Services, and Risk and Compliance. LexisNexis UK continued to expand LexisPSL functionality, improving search performance by further optimising practice note content retrieval. Contract productivity and proof reading tool, LexisDraft has become firmly embedded in the UK legal services market. MLex continues to break market-moving news and has become a regularly cited source for mainstream news outlets. Tolley, the LexisNexis tax intelligence suite, continued to expand its reach in 2017, with TolleyGuidance expanding its presence across multiple customer segments.
| | |
| 30 | | RELX Group Annual reports and financial statements 2017 |
|
|
In France, LexisNexis is a leading online provider of information to lawyers, notaries and courts. JurisClasseur and other leading authoritative content such as JurisData are provided through multiple formats. These content sources have been combined with new content and innovative decision tools to develop practical guidance and practice management solutions. LexisNexis France’s main offering is Lexis360, which combines legal information, practical content and results from the web. In 2017, LexisNexis launched a Lexis360 version adapted for Austria.
In 2017, LexisNexis France integrated the first predictive analytics indemnity calculation tool in France on Lexis360 and launched Lexis Actu, a real-time legal news service.
In South Africa, LexisNexis launched Lexis Assure, a compliance planning solution. In the Middle East, LexisNexis launched a news mobile app to enrich Lexis Middle East Law.
In the Asia Pacific region, LexisNexis continued to focus on providing authoritative local online content embedded in decision tools for legal professionals. As of 2017, Lexis Advance has launched in Australia and New Zealand, enabling improved analytics, data visualisation and user experience. Lexis Advance will continue to roll out in Asia Pacific with launches in Hong Kong, Singapore and Malaysia to commence in 2018. In 2017, Lexis China launched a new big data solution to improve citation processing speed and LexisNexis was recognised by the Australian Centre for Corporate Social Responsibility as one of the Top 10 socially responsible companies in Australia, due to LexisNexis’s commitment to the Rule of Law.
Market opportunities
Longer-term growth in legal and regulatory markets worldwide is driven by increasing levels of legislation, regulation, regulatory complexity and litigation, and an increasing number of lawyers. Additional market opportunities are presented by the increasing demand for online information solutions, legal analytics and other solutions as well as practice management tools that improve the quality and productivity of research, deliver better legal outcomes and improve business performance. Notwithstanding this, legal activity and legal information markets are also influenced by economic conditions and corporate activity, as has been seen with the continued subdued environment in North America and Europe.
Strategic priorities
LexisNexis Legal & Professional’s strategic goal is to enable better legal outcomes and be the leading provider of productivity-enhancing information, analytics and information-based decision tools in its market. To achieve this, LexisNexis is focused on introducing next-generation products and solutions on the global New Lexis platform and infrastructure; leveraging New Lexis globally to continue to drive print-to-electronic migration and long-term international growth; and upgrading operational infrastructure, improving process efficiency and gradually improving margins.
In the US, LexisNexis is focused on the continuing development of legal research and practice solutions that help lawyers make data-driven decisions. Over the coming years, progressive product introductions, based on the New Lexis platform and powered by big data HPCC Systems technology, will combine advanced technologies, enriched content and sophisticated analytics to enable LexisNexis customers to make data-driven legal decisions and drive better outcomes for their organisations and clients.
Outside the US, LexisNexis is focused on growing online services and developing further high-quality actionable content and decision tools, including the continuous development of practical guidance and practice management applications. In 2018, LexisNexis will continue to expand the New Lexis platform globally. Additionally, LexisNexis is focusing on the expansion of its activities in emerging markets.
Business model, distribution channels and competition
LexisNexis Legal & Professional products and services are generally sold directly to law firms and to corporate, government, accounting and academic customers on a paid subscription basis, with subscriptions with law firms often under multi-year contracts.
Principal competitors for LexisNexis in US legal markets are Westlaw (Thomson Reuters), CCH (Wolters Kluwer) and Bloomberg. In news and business information key competitors are Bloomberg and Factiva (News Corporation).
Significant international competitors include Thomson Reuters, Wolters Kluwer and Factiva.
2017 financial performance
| | | | | | | | | | | | |
| | | 2017 £m | | 2016 £m | | Underlying growth | | Acquisitions/
disposals | | Currency effects | | Total growth |
Revenue | | 1,692 | | 1,622 | | +2% | | -3% | | +5% | | +4% |
Adjusted operating profit | | 332 | | 311 | | +11% | | -10% | | +6% | | +7% |
Underlying revenue growth in 2017 was in line with the prior year, with continued efficiency gains driving strong underlying operating profit growth.
Underlying revenue growth was +2%. The difference between the reported and underlying growth rates reflects the impact of exchange rate movements and portfolio changes including the acquisition of Ravel Law, the disposal of several print and services assets, and the final exit from the Martindale Hubbell joint venture.
Underlying adjusted operating profit growth was +11%. The increase in operating profit margin reflects ongoing organic process improvement and decommissioning of systems which, together with currency movements, more than offset a lower profit contribution from joint ventures and other portfolio effects.
Electronic revenues saw continued growth, partially offset by print declines. Theroll-out of new platform releases across our US and international markets continued, with broader datasets and the continued expansion of early stage legal analytics. The usage migration of US legal customers onto Lexis Advance is now substantially complete.
US and European markets remained stable. Other international markets continued to grow well.
2018 outlook
Trends in our major customer markets are unchanged, continuing to limit the scope for underlying revenue growth. We expect underlying profit growth to remain strong.
| | |
| 32 | | RELX Group Annual reports and financial statements 2017 |
|
|


| | |
| 34 | | RELX Group Annual reports and financial statements 2017 |
|
|
Exhibitions
| | |
| |
We help match customers with the right solution. Our events enable customers to learn about a market, source products and complete transactions, generating billions of dollars of revenues for the economic development of local markets and national economies around the world. |
| | |
| | |
| ∎ | | More than 500 events are in the Reed Exhibitions portfolio |
| |
| ∎ | | 43 industry sectors are served in 30 countries across the globe |
| |
| ∎ | | Each year we host around 130,000 exhibitors attracting more than 7m participants |
| |
| ∎ | | Our digital products increase the value of our events to participants, enabling them to make new contacts and meetface-to-face to do business . In 2017, 200 events offered matchmaking and the vast majority of customers using the matchmaking service reported higher value and satisfaction |
Business overview
Exhibitions is the world’s leading events business, enhancing the power offace-to-face through data and digital tools at over 500 events, in 30 countries, attracting more than 7m participants.
Reed Exhibitions is a global business, headquartered in London and has further principal offices in Paris, Vienna, Moscow, Norwalk (Connecticut), Mexico City, São Paulo, Abu Dhabi, Beijing, Tokyo and Sydney. Reed Exhibitions has 4,000 employees worldwide, and its portfolio of events serves 43 industry sectors in 30 countries.
Revenues for the year ended 31 December 2017 were £1,109m compared with £1,047m in 2016 and £857m in 2015. In 2017, 21% of Reed Exhibitions’ revenue came from North America, 39% from Europe and the remaining 40% from the rest of the world on an event location basis.
Reed Exhibitions organises market-leading events which are relevant to industry needs, where participants from around the world meetface-to-face to do business, to network and to learn. Its events encompass a wide range of sectors. They include construction, cosmetics, electronics, energy and alternative energy, engineering, entertainment, gifts and jewellery, healthcare, hospitality, interior design, logistics, manufacturing, pharmaceuticals, real estate, recreation, security and safety, transport and travel.
Market opportunities
Growth in the exhibitions market is influenced both bybusiness-to-business marketing spend and by business investment. Historically, these have been driven by levels of corporate profitability, which in turn has followed overall growth in gross domestic product. Emerging markets and higher growth sectors provide additional opportunities. Reed Exhibitions’ broad geographical footprint allows it to effectively and efficiently capture growth opportunities globally as they emerge.
As some events are held other than annually, growth in any one year is affected by the cycle ofnon-annual exhibitions.
| | |
| Business review Exhibitions | | 35 |
|
|
Strategic priorities
Reed Exhibitions’ strategic goal is to deliver measurably higher value and improved outcomes to its customers. It is achieving this by being the best at understanding and responding to those customers’ needs and business objectives and the changing markets it serves.
Reed Exhibitions delivers a platform for industry communities to conduct business, to network and to learn through a range of market-leading events in all major geographic markets and higher growth sectors, enabling exhibitors to target and reach new customers quickly and cost effectively.
Organic growth will be achieved by continuing to generate greater customer value through combining the best offace-to-face with data and decision tools, launching new events, and by leveraging its global network and technology platforms for faster and more agile development and deployment of innovation. Reed Exhibitions is also actively shaping its portfolio through a combination of strategic partnerships and acquisitions in faster growing sectors and geographies, as well as by withdrawing from markets and industries with lower long-term growth prospects.
Reed Exhibitions is committed to continuously improving customer solutions and experience by developing global technology platforms based on industry databases, digital tools and analytics. By providing a variety of services, including its integrated web platform, the company continues to drive up customer satisfaction by proactively putting the right buyers and sellers together on the event floor. Increasingly, digital and multichannel services such as active matchmaking are becoming a normal part of the customer expectation and product offering, enhancing the value delivered through attendance at the event. Using customer insights, Reed Exhibitions has developed an innovative product offering that underpins the value proposition for exhibitors by broadening their options in terms of the type and location of stand they take and the channels through which they can address potential buyers.
In 2017 Reed Exhibitions launched 36 new events. These included many events which delivered on the strategy of taking sector expertise, customer relationships and leading brands from one market and extending them into new geographies using local operational capability.
Strong brands and value propositions in long established areas continued to be expanded into new geographic markets such as Oceanology International in the USA.
Reed Exhibitions is active in developing exhibition markets with launches in Mexico, Brazil, South Korea, South Africa, UAE, Indonesia and China.
Emerging high potential sectors were served through innovative and highly curated launches such as Esports Bar and MIPIM Property Tech Summit.
Reed Exhibitions Japan continued its successful launch programme, with 14 launches in multiple segments and locations.
After the successful 2016 launch of ComplexCon the fashion portfolio Agenda continued to reflect the changing nature of the fashion industry by launching thedirect-to-consumer Agenda Festival.
The POP culture portfolio continued its successful run of launches with new events in South Korea (Comic Con Seoul) and by serving newsub-sectors such as table top gaming through the PAX Unplugged launch.
A number of acquisitions and investments were completed during 2017. These included MCM Comic Con in the UK, Café Seoul in South Korea and three fitness shows in Australia.

| | |
| 36 | | RELX Group Annual reports and financial statements 2017 |
|
|
Business model, distribution channels and competition
Over 70% of Reed Exhibitions’ revenue is derived from exhibitor fees, with the balance primarily consisting of admission charges, conference fees, sponsorship fees and online and offline advertising. Exhibition space is sold directly or through local agents where applicable. Reed Exhibitions often works in collaboration with trade associations, which use the events to promote access for members to domestic and export markets, and with governments, for which events can provide important support to stimulate foreign investment and promote regional and national enterprise. Increasingly, Reed Exhibitions is offering visitors and exhibitors the opportunity to interact before and after the show through the use of digital tools such as online directories, matchmaking and mobile apps.
Reed Exhibitions is the global market leader in a fragmented industry, holding less than a 10% global market share. Other international exhibition organisers include UBM, Informa and some of the larger German Messen, including Messe Frankfurt, Messe Düsseldorf and Messe Munich. Competition also comes from industry trade associations and convention centre and exhibition hall owners.
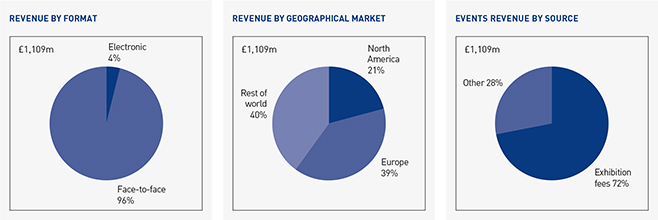
| | |
| Business review Exhibitions | | 37 |
|
|
2017 financial performance
| | | | | | | | | | | | |
| | | 2017 £m | | 2016 £m | | Underlying growth | | Acquisitions/ disposals | | Currency effects | | Total growth |
Revenue | | 1,109 | | 1,047 | | +6% | | +1% | | +5% | | +6% |
Adjusted operating profit | | 285 | | 269 | | +2% | | -1% | | +5% | | +6% |
Underlying revenue growth rates exclude exhibition cycling effects.
Exhibitions achieved strong underlying revenue growth in 2017, a slight acceleration from the prior year, with underlying operating profit growth reflectingcycling-out effects.
Underlying revenue growth was +6%. After portfolio changes and six percentage points ofcycling-out effects, constant currency revenue growth was +1%. The difference between the reported and constant currency growth rates reflects the impact of exchange rate movements and portfolio changes, including the acquisition of MCM Comic Con (UK), Cafe Seoul (South Korea) and Fitness (Australia), and the disposal of a number of small events.
Underlying adjusted operating profit growth was +2% reflectingcycling-out effects.
We continued to pursue organic growth opportunities, launching 36 new events, and piloting several data analytics opportunities.
Overall growth remained good in Europe and strong in Japan and China. The US continued to see differentiated growth rates by industry sector. Revenues in Brazil continued to reflect the general weakness of the wider economy. Most other markets continued to grow strongly.
2018 outlook
We expect underlying revenue growth trends to continue. In 2018 we expectcycling-in effects to increase the reported revenue growth rate by four to five percentage points.
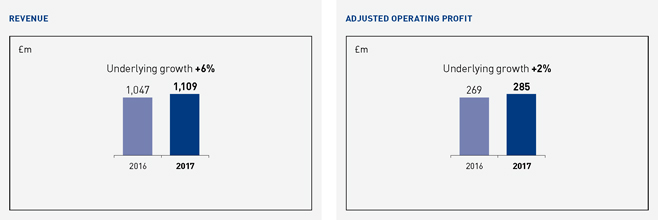
| | |
| 38 | | RELX Group Annual reports and financial statements 2017 |
|
|

| | |
Business review Exhibitions | | 39 |

| | |
| 40 | | RELX Group Annual reports and financial statements 2017 |
|
|


| | |
Corporate Responsibility The Corporate Responsibility Report is an integral part of our Annual Reports and Financial Statements. This section highlights progress on our 2017 corporate responsibility objectives. The full 2017 Corporate Responsibility Report is available at www.relx.com/go/CRReport | | |
| | |
| 42 | | RELX Group Annual reports and financial statements 2017 |
|
|
Corporate responsibility
We define corporate responsibility (CR) as the way we do business and our efforts to increase our positive impact and reduce any negative impact. It ensures good management of risks and opportunities, helps us attract and retain the best people and strengthens our corporate reputation.
It means performing to the highest commercial and ethical standards and channelling our knowledge and strengths, as global leaders in our industries, to make a difference to society.
We regularly survey key stakeholders, including in 2017, shareholders, employees, governments and communities where we operate, to help us identify our material corporate responsibility issues and to set and test our CR objectives. The Board of Directors, senior management and our Corporate Responsibility Forum oversee CR objectives and performance.
We concentrate on the contributions we make as a business and on good management of the material areas that affect all companies:
| | 1. | Our unique contributions |
We are committed to the United Nations (UN) Global Compact to which we are a signatory and are dedicated to advancing the UN’s Sustainable Development Goals (SDGs) by 2030.
1. Our unique contributions
We make a positive impact on society through our knowledge, resources and skills, including:
∎ universal sustainable access to information
∎ advancing of science and health
∎ protection of society
∎ promotion of the rule of law and justice
∎ fostering communities
Scientific, Technical & Medical
Elsevier, the world’s leading provider of scientific, technical and medical information, plays an important role in advancing human welfare and economic progress through its science and health information, which spurs innovation and enables critical decision-making. To broaden access to its content, Elsevier supports programmes where resources are often scarce. Among them is Research4Life, a partnership with UN agencies and approximately 200 publishers; we provide core and cutting-edge scientific information to researchers in 100 developing countries. As a founding partner and the leading contributor, Elsevier provides over a quarter of the material available in Research4Life, encompassing approximately 3,000 Elsevier journals and 20,000e-books. In 2017, there were 2.4m Research4Life article downloads from ScienceDirect.
In the year, we expanded Research without Borders which pairs our colleagues’ research expertise with the needs of the African health science community. Working with the African Journal Partnership Program, Elsevier contributed 20 volunteers for a total of 48 weeks to help African journals boost their research impact through the Elsevier Foundation’s Research without Borders programme. According to Dr. Lucinda Manda-Taylor,Editor-in-Chief of the Malawi Medical Journal who worked with Cynthia Clark, Director of Digital Journals at Elsevier, “I cannot stress enough how helpful it was to have a volunteer Elsevier publisher for the Malawi Medical Journal. It helped the editorial team implement some key tasks that will improve our digital connection with the outside world through interactions on our website and social media pages.”
Risk & Business Analytics
Risk & Business Analytics’ tools and resources help law enforcement keep communities safe and help protect society by detecting and preventing fraud across a range of business sectors and at the US federal, state and local government levels. For example, since 2015, the city of Stockton, California’s police department has been using LexisNexis Accurint Crime Analysis predictive analytics to help reduce violent gun crime.
In the year, colleagues at Accuity, which provides comprehensive data and software to support financial processing risk and compliance, collaborated with policy makers on the European Union’s 5th Anti-Money Laundering Directive, to halt money laundering and terrorist financing.
We developed the ADAM programme more than 17 years ago to help the National Centre for Missing & Exploited Children in the US find missing children. ADAM distributes missing child alert posters to law enforcement, hospitals, libraries and businesses within specific geographic search areas. The system was expanded to allow individuals to receive an alert via email when a child is reported missing near to them. In 2017, 14 children were found through ADAM, bringing the total number of children recovered to 177 since the start of the programme in 2000. We also worked with Amber Alert Europe and Portsmouth University to scope a training course for UK police forces and other agencies involved in missing cases such as social services, schools and health professionals.
In 2017, Proagrica, dedicated to feeding the world sustainably through its content and solutions, launched Future Farming, to help farmers use local, national and international field, crop and other data to make better farming decisions.
| | |
Business review Corporate Responsibility | | 43 |
RELX Group SDG
Resource Centre:
informing the world

| | | | |
In 2017, we launched the free RELX Group SDG Resource Centre (sdgresources.relx.com) to advance awareness, understanding and implementation of the 17 UN Sustainable Development Goals (SDGs) which aim to end poverty, protect the planet, and ensure prosperity for all people by 2030. To illuminate the SDGs, the site provides leading edge articles, reports, tools, events, videos and legal practical guidance from across RELX Group. It also features content from partners, the United Nations Global Compact and the United Nations Development Programme. It contains unique research from Elsevier on the state of science underpinning the SDGs; Risk and Business Analytics content from Proagrica that combines data and analysis to improve agricultural yields and ensure sustainable land use; the Rule of Law Impact Tracker developed by LexisNexis Legal & Professional and the World Justice Project; and information on shows like Reed Exhibitions’ World Future Energy Summit focused on affordable, clean energy and World Travel Market dedicated to sustainable tourism. The SDG Resource Centre is also fostering rich discussion about SDG solutions through our Mendeley reference management and online social networking platform. | | 
|
| | What we do impacts the world. Our products and services shed light on some of the most pressing global issues. The RELX Group SDG Resource Centre will aid researchers and the public by giving them access to critical content that informs understanding about the SDGs. |
| | Erik Engstrom | | |
| | CEO, RELX Group | | |
| | 
| | |
| | 77,000 | | |
| | sources in the RELX Group SDG Resource Centre’s SDG News Tracker for up to the minute news on the SDGs from around the world | | |
| | |
| 44 | | RELX Group Annual reports and financial statements 2017 |
|
|
1. Our unique contributions (continued)
During 2017, RBI continued to support the Tech Talent Charter, committed to increasing the ratio of women and under-represented groups in technology. RBI women in technology, who comprise 26% of the business unit’s UK technology workforce (17% national average), held a Tech Day for girls from local schools.
Legal
LexisNexis Legal & Professional promotes the rule of law and access to justice through its products and services. During 2017, we collaborated with the Republic of Fiji to consolidate the country’s laws and make them publicly available for the first time.
We assisted the United Nations Global Compact (UNGC) and other UN agencies to promote business engagement on the rule of law throughout the year, including by supporting the documentation of land rights in Myanmar. In the year, we launched the Rule of Law Café, in partnership with the UNGC Network UK, giving peers and members of the legal community an opportunity to share their efforts to advance the rule of law. In 2017, LexisNexis Legal & Professional received Freedom House’s Corporate Leadership Award for its work to advance the rule of law.
Exhibitions
Reed Exhibitions’ events strengthen communities and support our CR focus areas.
Each year, World Travel Market (WTM), Reed Exhibitions’ flagship show for the travel and tourism industry, holds World Responsible Tourism Day, which includes the Responsible Tourism awards. In recognition of the 2017 International Year of Sustainable Tourism for Development, leaders were chosen for how they are demonstrating impact and their alignment with one or more of the SDGs. Winners included Village Ways, India, named best for poverty reduction and Chobe Game Lodge, Botswana, named best for carbon reduction. In 2017, WTM also held a roundtable at the UK House of Lords, hosted by Baroness Morris of Bolton, with leaders in tourism and other fields to discuss tangible ways of addressing child trafficking and tourism and orphanage tourism.
Also in 2017, more than 1,700 science and marine technology professionals from 46 countries attended Reed Exhibitions’ inaugural Oceanology International North America conference and exhibition in San Diego. Among conference topics was sustainable port management and environmental protection.
Across RELX Group
In 2017, we launched the free RELX Group SDG Resource Centre www.sdgresources.relx.com to advance awareness, understanding and implementation of the 17 SDGs to end poverty, protect the planet, and ensure prosperity for all people by 2030. The site features articles, tools, news, events, networking and original research, including in 2017, a review of education and sustainable development (SDG 4) with citable statistics on scholarly output, impact and collaboration.
2017 marked the seventh year of the RELX Group Environmental Challenge, focused on providing improved and sustainable access to water and sanitation where it is presently at risk. The $50,000 first prize winner, eWATER, uses leading-edge mobile and
contactless payment technology for accountable revenue collection and data management to sustain urban and rural water systems throughout the developing world. They will use the prize to install 60 eWATERtaps and to repair three large solar pumped water systems, benefiting over 8,000 people in the Upper River and Lower River of The Gambia.
| | |
| 2017 OBJECTIVES | | Achievement |
| Advance of science and health: expand “Research Without Borders” to build editorial skills through journal mentoring and training | | ∎ 20 Elsevier research experts spent a combined 48 weeks training African health journal teams in DRC, Ethiopia, Ghana, Kenya, Malawi, Mali, Rwanda and Uganda ∎ Additional training held in Amsterdam for editors from Mali Medical Journal and the DRC’s Annales Africaines de Medecine |
| Protection of society: help broaden reach of ADAM programme; new training programme on missing people for UK law enforcement | | ∎ ADAM programme platform extended to allow individuals to receive missing child email alerts; 14 children found through ADAM ∎ Supporting new missing child cases training course for UK policing |
| Promotion of the rule of law and access to justice: assist UNGC in embedding Business for the Rule of Law and work with UN Development Programme and Member States to support reporting progress on SDGs | | ∎ Micro-site created on SDG Resource Centre for Global Alliance on Reporting Progress on Just, Peaceful and Inclusive Societies as a repository to aid member state reporting on SDG16 ∎ Created Business for the Rule of Law Café in partnership with UNGC Network UK with participation from customers, peers, academia and colleagues to share information on going beyond legal minimums to advance the rule of law |
| Fostering communities: World Travel Market (WTM) to convene travel industry roundtable for collaboration on responsible tourism key challenges, including anti- trafficking initiatives | | ∎ Largest responsible tourism programme at WTM London to date with 27 sessions, including two focused on increasing awareness of modern slavery, trafficking, human rights and orphanage tourism ∎ Roundtable at House of Lords with leaders in tourism and other fields to discuss tangible ways of addressing child trafficking and tourism and orphanage tourism |
| Universal, sustainable access to information: launch free access SDG Resource Centre | | ∎ RELX Group SDG Resource Centre launched at Inspiration Day drawing 100+ attendees ∎ Nearly 10,000 unique visitors byyear-end; 34% of visitors via organic search |
| | |
| Business review Corporate Responsibility | | 45 |
|
|
2018 OBJECTIVES
| ∎ | Advance and make publicly available, research on the state of science underpinning the SDGs |
| ∎ | Partner with the National Centre for Missing and Exploited Children to expand ADAM programme email alerts to US consumers; advance training course for UK policing on missing cases |
| ∎ | Roll out RELX Group Rule of Law Cafes across multiple jurisdictions |
| ∎ | Advance sustainability content across show portfolios |
| ∎ | New functionality for SDG Resource Centre including integration of UN and other partner content |
OUR 2030 VISION
Use our products and expertise to advance the SDGs, among them:
| ∎ | SDG 3: Good health and well-being |
| ∎ | SDG 4: Quality education |
| ∎ | SDG 10: Reduced inequalities |
| ∎ | SDG 16: Peace, justice and strong institutions |
Enrich the SDG Resource Centre to ensure essential content, tools and events on the SDGs are freely available to all.
2. Governance
Our Code of Ethics and Business Conduct (the Code) is disseminated to every employee and sets the standards for our corporate and individual conduct. Among other topics, the Code continues to address fair competition, anti-bribery, conflicts of interest, employment practices, data protection and appropriate use of company property and information. It also encourages reporting of violations – with an anonymous reporting option – and prohibits retaliation against anyone who believes and reports a potential violation of the Code or law.
The Code incorporates the principles of the UNGC and stresses our commitment to human rights. In accordance with the UN’s Guiding Principles on Business and Human Rights, we have considered where and how we operate and have concluded that there is low human rights risk in our direct employment activities (for more information on human rights see “Supply chain” on page 49). In 2017, we updated our Modern Slavery Act Statement which highlights how we are working internally, through our supply chain and externally with partners to address the risk of slavery and human trafficking.
We maintain a comprehensive set of compliance policies and procedures in support of the Code. These are reviewed at least annually to ensure they remain current and effective. They help us comply with the law and conduct our business in an open, honest, ethical and principled way. In the case of our anti-bribery efforts, they comprise part of our adequate procedures for compliance with applicable laws.
Employees receive mandatory training on the Code – both new hires and at regular intervals for all employees – in order to maintain a respectful workplace, prevent bribery and protect personal and company data. Mandatory periodic training covers key Code topics in depth, such as competition law and records management, which is supplemented byin-person training for higher-risk roles.
In 2017, we took a number of steps to further enhance and embed our culture of compliance across RELX Group, including reorganising the RELX Group Compliance function around globally recognised compliance principles and creating a central compliance team devoted to training, communications and investigations and a second team devoted to risk assessment and monitoring; increasing the number of employees devoted to compliance and increasing collaboration among RELX Group compliance committees.
Reports of violations of the Code or related policies are promptly investigated, with careful tracking and monitoring of violations and related mitigation and remediation efforts by Compliance teams across the business. In 2017, we continued training of investigators who handle employee relations and financial misconduct matters.
We remained diligent in our ongoing efforts to ensure compliance with applicable bribery and sanctions laws and to mitigate bribery risks. We continue to monitor and assess the implementation of our anti-bribery requirements, including developing detailed, risk-based internal policies and procedures for key compliance-related business processes and functions; conducting periodic risk assessments; establishing gift and entertainment limits; and enforcing clear rules on doing business with Government officials. In addition, intermediary relationships and acquisition targets are specifically evaluated for risk using third-party questionnaires, references and detailed electronic searches. Similarly, in the area of sanctions compliance, we refreshed our internal policies and guidance to comport with changes in applicable regulations, implemented “Know Your Customer” tools to enhance customer screening efforts, and enhanced quality assurance reviews and risk assessments.
In 2017, we expanded fraud prevention and cyber security awareness efforts and continued to tighten related controls through mandatory training Group-wide, with risk-based information security presentations for finance and HR teams across the business and employees in Manila and Chennai. We also began rolling out a PhishMe button integrated into our email client to allow employees to make an immediate report, and provided a Group-wide phishing simulation.
As a signatory to the UNGC and its principles, encompassing labour, environment, anti-corruption and human rights, we demonstrated leadership by becoming a LEAD company, taking part in their SDG Action Platforms, including the Blueprint for SDG Leadership. We also served in the year on the Board of the UNGC UK Network and spoke on panels at their Making Global Goals Local Business conference in New Delhi and the Leaders Summit during the UN General Assembly in New York, when Teresa Jennings of LexisNexis Legal & Professional was named an SDG Pioneer for her efforts to advance the rule of law. UNGC peers judged our Communication on Progress, required of signatories annually, to have attained Advanced Level. We were also active in the Dutch UNGC network.
In 2017, the RELX Group global business paid £449m in corporate taxes. We are a responsible corporate taxpayer and conduct our tax affairs to ensure compliance with all laws and relevant regulations in the countries in which we operate. Tax is an important issue for our stakeholders and society at large. We have set out our approach to tax in our global tax strategy. This incorporates our Tax Principles along with additional disclosures around where we pay taxes and our broader contribution to society. This is made publicly available on our website (www.relx.com/go/TaxPrinciples).
| | |
| 46 | | RELX Group Annual reports and financial statements 2017 |
|
|
2. Governance (continued)
In addition, the RELX Tax team continued to engage with policymakers and special interest groups on all sides of the debate to provide practical experience on how companies interact with tax laws and to suggest ways such laws can advance governments’ policy objectives.
The Statement of Investment Principles for the UK pension scheme indicates that the extent to which social, environmental or ethical issues may have a financial impact on the portfolio, or a detrimental effect on the strength of the employer covenant, is taken into account when making investment decisions. CR issues are relevant to other investment decisions we make. Among our sustainable investments is Agworld, a farm management software platform that allows farmers, agronomists and farm contractors to capture, manage and shareon-farm data and recommendations to improve the sustainability of land and better yields.
| | |
| 2017 OBJECTIVES | | Achievement |
| Expand fraud prevention and cyber security awareness efforts and continue to tighten related controls | | ∎ Continued programme of technology controls, training, reporting and investigations, with employee simulations to reduce susceptibility to phishing attacks ∎ Less than 4% susceptible on a benchmark simulation (industry average 21%) |
| More structured approach to compliance training for employees in higher risk roles and locations across the Group | | ∎ Established resource library containing 35 presentations encompassing competition law anti-bribery, culture of compliance, harassment, trade sanctions and management ∎ More than 2,400 employees received advancedin-person compliance training conducted by RELX Compliance in collaboration with business unit leads |
| Broaden awareness of RELX Tax Principles in external communications, with internal training for relevant staff | | ∎ Tax Principles refreshed and incorporated into tax strategy published on RELX Group website ∎ Briefings for key internal stakeholders;roll-out of interactive training underway |
| | |
2018 OBJECTIVES |
| |
| ∎ | | Expand corporate security incident response preparedness using a combination of technology, awareness training and simulations |
| |
| ∎ | | Establish risk mitigation framework for monitoring operational effectiveness of key internal compliance controls |
| |
| ∎ | | Engagement on rule of tax law |
| |
OUR 2030 VISION Undertake consistent actions that reinforce excellence in corporate governance, data privacy and security, and compliance with all applicable legislation and our principles and policies |
3. People
Our people are our strength. Our workforce of about 30,000 people is 51% female and 49% male, with an average length of service of nine years. There were 43% female and 57% male managers, and 29% female and 71% male senior operational managers.
| | | | | | | | | | | | | | | | |
| | | | | | Female | | | | | | Male | |
Board of Directors | | | 4 | | | | 36% | | | | 7 | | | | 64% | |
Senior operational managers* | | | 93 | | | | 29% | | | | 223 | | | | 71% | |
All employees** | | | 15,850 | | | | 51% | | | | 15,150 | | | | 49% | |
| * | Senior operational managers are defined as those managers up to and including three reporting lines from the CEO |
Atyear-end 2017, women made up more than 35% of the members of the RELX Boards. The two Executive Directors on the Boards are male. The Nominations Committee considers the knowledge, experience and background of individual Board directors.
Our Diversity and Inclusion (D&I) Statement articulates our commitment to a diverse workforce and an environment that respects individuals and their contributions, regardless of gender, race or other characteristics. Our D&I Strategy is focused on translating the Statement into practical action. Among its commitments is maintaining a D&I Advisory Group composed of a senior business and HR leader from each business unit, supported by a broader D&I Working Group. We encourage more than 35 Employee Resource Groups (ERGs) across the Group, such as women’s forums and pride groups, to facilitate support, mentoring and community involvement.
In 2017, we expanded our women in technology mentoring programme formid-career women in technology across our four business units to participants in the US as well as the UK. All mentors are internal, and 44% of mentors are women in technology. A webinar series for participants showcases the tech career journeys of senior women, including members of the RELX Group Boards, and is made available to all employees. Based on the success of our women in technology mentoring, in the year, we launched a mentoring programme for high potential women.
RELX Group is a signatory to the Women’s Empowerment Principles (WEPs), a UNGC and UN Women initiative to help companies empower women and promote gender equality. In the year, we tested a WEPs benchmarking tool to understand gaps between the principles and our performance.
Elsevier has attained the first level of the EDGE gender equality certification, which involved employee surveys across eight countries, an external review of policies and procedures and gender pay benchmarking. An EDGE focus area is flexible working and in 2017, we mapped our flexible working policies across the business as the first step in creating a RELX Group flexible working policy.
| | |
| Business review Corporate Responsibility | | 47 |
|
|
We comply with all employee-related reporting requirements. From 2018, this will include the new UK requirement to publish our UK gender pay gap data.
In 2017, we conducted pulse surveys across the business to hear from employees about how we are doing to make RELX Group a great place to work.
Our employees have the right to a healthy and safe workplace, as outlined in our Global Health and Safety Policy. We concentrate on areas of greatest risk for example, warehouses, events and exhibitions. As a primarilyoffice-based company, we also focus on manual handling, slips, trips and falls. To reduce our severity rate (lost days per 200,000 hours worked), we conduct risk assessments and work with a third party in the US to assign a nurse case manager to each complex or severe claim. There were 17 lost time reportable cases in the year.
In the US, where we have the largest concentration of employees, the CareConnect and REACH programmes promote workplace well-being through health screenings, online assessments, stress awareness training and smoking cessation courses, with financial incentives for participation.
Our annual Fit2Win global well-being competition encourages employees to establish fitness teams to compete for cash prizes for charities of their choice. Across the Group, 106 teams took part and ran, walked, cycled and swam a total of 93,457 miles (150,405 km), to win $1,000 for the charity of their choice.
Dedicated health and well-being programmes are now available to more than 19,000 employees around the world, equating to over 60% of our employees. We also maintain a network of more than 90 Wellness Champions. We introduced a workplace well-being award scheme which allows all employees, in partnership with their local Wellbeing Champion, to submit a proposal for a wellbeing initiative at their location. The proposals are judged with the winning proposals granted funding.
| | |
| 2017 OBJECTIVES | | Achievement |
| Scale women in technology mentoring programme; mentor pilot for high-potential women | | ∎ New cohort of 27mid-career women in tech mentees and 27 tech mentors from US, UK and China (16 mentors/mentees in 2017) ∎ Mentoring programme for high-potential womenco-sponsored by two senior female leaders: RELX Group Global HR Director and Reed Exhibitions’ EMEA President |
| Enhance flexible working policies | | ∎ Mapping of flexible working policies across all business units to understand policies and tracking in place ∎ Flexible working case studies highlighted on global intranet |
| Introduce a workplace well-being award scheme | | ∎ 60 applications received for wellness project funding ∎ Review by RELX Group Wellness Champions |
| | |
2018 OBJECTIVES |
| |
| ∎ | | Conduct a Global Employee Opinion Survey including questions on culture, ethics and well-being |
| |
| ∎ | | Update D&I Strategy including launch of D&I progress indicators |
| |
| ∎ | | External partnership to raise awareness of mental health across RELX Group |
| |
OUR 2030 VISION Respect the human rights of all our employees, with a focus on talent development, diversity and inclusion and well-being, to ensure a high-performing and satisfied workforce. |
| | |
| 48 | | RELX Group Annual reports and financial statements 2017 |
|
|
Gender:
in the Global Research
Landscape
In 2017, Elsevier released Gender in the Global Research Landscape, providing insight and guidance on gender research and policy for governments, funders and institutions worldwide. It covers 20 years, 12 geographies and 27 subject areas.

Download Gender in the Global Research Landscape at elsevier.com/genderreport
| | | | | | |
The report uncovers progress between 1996 and 2000, among the 12 countries and regions studied, only Portugal had a women researcher population greater than 40%; by the period 2011–2015, there were nine countries and regions with 40% or more. The study leverages the power of Elsevier’s Scopus citation database and SciVal research performance tool, among other sources, including input from the World Intellectual Property Organization. It shows the global share of women inventors listed in patent applications increased between 1996-2000 (10%) and 2011-2015 (14%), yet women remain strongly underrepresented across all intellectual property comparators. The report is available for free download worldwide. | | | | 
|
| | | Gender in a Global Research Landscape brings empirical insight to gender disparity. It is data that can be used by those – including researchers and policy makers – working on issues critical to science. |
| | | Dr. Holly J. Falk-Krzesinski |
| | | Vice President , Research Intelligence, Global Strategic Networks, Elsevier |
| | | 
| | |
| | | 25% | | |
| | | less than 25% of researchers in physical sciences are women | | |
| | |
| Business review Corporate Responsibility | | 49 |
|
|
4. Customers
In 2017, we surveyed approximately 450,000 customers through Net Promoter Score (measuring customer advocacy) and business dashboard programmes. This allows us to deepen our understanding of customer needs and drives improvements. Results are reviewed by the CEO and senior operational managers and communicated to staff. To aid colleagues, during the year our CR as a Sales Tool Working Group produced short videos on the competitive advantage of our CR focus, with role plays showcasing how to engage customers on CR issues, helping build deeper relationships through discussion of shared values.
Our 2017 CR Forum Stakeholder Session, Truth and Trust and Reliable Content, engaged members of our CR Forum, Editorial Policy Working Group employees, peers and sector stakeholders for a practical discussion on this key issue for RELX Group. Participant Charlie Beckett, founding director of POLIS, the think-tank for research and debate in international journalism and society at the London School of Economics noted, “it is entirely the responsibility of anybody who produces information, not just journalists, but governments and corporations, to make their information intelligible, accessible and critically accountable.” The event was simulcast for employees and made available for download on the RELX Group global intranet.
We advanced our Quality First Principles (QFPs) in the year to include more areas of the business including supplier management and customer support. In 2017, we applied for a Philippines Quality Award which involved demonstrating excellence in managing and delivering quality throughout the business.
We are committed to improving access to our products and services for all users, regardless of physical ability. Our Accessibility Policy aims to lead the industry in providing accessibility solutions to customers, with products that are operable, understandable and robust. In 2017, members of the Accessibility Working Group logged over 200 accessibility projects and Elsevier’s Global Books Digital Archive fulfilled more than 5,000 disability requests, 77% of them through AccessText.org, a service we helped establish.
In the year, to improve our reporting on compliance with customer accessibility requests, we refined our accessibility review toolkit to include product scorecards with ratings on process maturity, fix lists, customer inquiries and revenue at stake.
| | |
| 2017 OBJECTIVES | | Achievement |
| Pursue Philippine Quality Award (PQA) as a demonstration of drive for quality excellence | | ∎ Application submitted; PQA site visit following; decision in 2018 |
| Create role plays for sales staff showing CR as a Sales Tool in action | | ∎ CR as a Sales Tool video featuring colleagues across RELX Group ∎ Created CR at RELX Group desk drop; guidance to sales colleagues on fostering CR dialogue with customers |
| Improve reporting on compliance with customer accessibility requests | | ∎ New accessibility report breaks down customer Voluntary Product Accessibility Template (VPAT), showing alignment with each criteria of Section 508 Standards of the US Workforce Rehabilitation Act |
| | |
2018 OBJECTIVES |
| |
| ∎ | | RELX Group Editorial Policy update and training |
| |
| ∎ | | New CR as a Sales Tool curriculum: Customers and the SDGs |
| |
| ∎ | | Introduce RELX Group Accessibility awards to recognise exceptional employee efforts to advance accessibility |
| |
OUR 2030 VISION Increase our customer base across our four business units through provision of critical products, services and events, with active listening and engagement, and a focus on editorial and quality standards and accessibility. |
5. Community
RE Cares, our global community programme, supports employee volunteering and giving that makes a positive impact on society. In addition to local initiatives of importance to employees, the programme’s core focus is on education for disadvantaged young people that advances one or more of our unique contributions as a business. Staff have up to two days’ paid leave per year for their own community work. We donated £3.4m in cash (including through matching gifts) and the equivalent of £9.2m in products, services and staff time in 2017. 45% of employees were engaged in volunteering through RE Cares and we reached more than 24,000 disadvantaged young people through time, in-kind and cash donations. In 2017, we increased skills-based volunteering, as defined as “applying business knowledge and expertise to benefit communities”. For example, colleagues at Risk & Business Analytics built the Global Business Coalition for Education’s Rapid Education Action (REACT) database to record private sector educational contributions and assets that can be deployed quickly in an emergency.
| | |
| 50 | | RELX Group Annual reports and financial statements 2017 |
|
|
5. Community (continued)
A network of over 220 RE Cares Champions ensures the vibrancy of our community engagement. In 2017, 72% of our offices across the world had an RE Cares Champion.
Each September, we hold RE Cares Month to celebrate our community commitment. During the Month, we raised funds ($96,700 to date) to help global fundraising partner, SOS Children’s Villages, enable girls working in dangerous conditions in Yamoussoukro, Ivory Coast to pursue an education. We held our annual global book drive, yielding over 6,600 books for local and developing world readers, and announced the winners of the seventh Recognising Those Who Care Awards to highlight the exceptional contributions to RE Cares of ten individuals and four RE Cares teams. Individual winners from across the business travelled to our office in Durban, South Africa to work with several local charities with a focus on anti-human trafficking, including survivor rehabilitation. The trip has been led since its inception by senior leader Youngsuk “YS” Chi, Director of Corporate Affairs.
| | |
| 2017 OBJECTIVES | | Achievement |
| Ensure at least 60% of offices have an RE Cares Champion | | ∎ 72% of offices have an RE Cares Champion ∎ Expansion to new locations including Russia, South Korea, Taiwan and the UAE |
| Increase skills-based volunteering | | ∎ Six percentage point increase ∎ 34% of RE Cares Champions organised at least one skills-based volunteer event vs. 28% in 2016 |
| | |
2018 OBJECTIVES |
| |
| ∎ | | Foster development of youth employability skills |
| |
| ∎ | | Research impact of RE Cares on staff retention |
| |
OUR 2030 VISION Use our unique contributions to advance education for disadvantaged young people, tracking the impact on our communities near and far. |
6. Supply chain
We require our suppliers to meet the high standards we set for ourselves. Our Supplier Code of Conduct stipulates adherence to all laws and best practice in areas such as human rights, labour and the environment. Through our Socially Responsible Supplier (SRS) database, in 2017 we tracked 344 key suppliers and those located in high-risk countries as designated by our Supplier Risk Tool incorporating eight indicators, including human trafficking information from the US State Department and Environmental Performance Index results produced by Yale University and
partners. The tracking list changes year-on-year based on the number of suppliers we do business with who meet the required criteria. We ended 2017 with 91% of suppliers on the SRS tracking list as signatories to the Supplier Code vs. 89% in 2016. We have embedded signing the Supplier Code into our sourcing process as a criterion for doing business with us, and have an additional 2,624 suppliers not on the SRS tracking list who have signed the Supplier Code.
Specialist supply chain auditors, Intertek, undertook 83 external audits of suppliers as part of their comprehensive Workplace Conditions Assessment and Corrective and Preventative Actions programme. Any incidence of non-compliance identified in the audit process triggers a corrective action plan agreed with the supplier, with remediation required on all issues.
The roll-out of our US Supplier Diversity programme continued in 2017 with efforts to improve the mix of diverse suppliers. Our focus was on minority, woman, and veteran-owned businesses and in 2017, resulting in an 8% increase in spend with suppliers in these categories. Overall, 11.4% of total US spend was with diverse suppliers.
| | |
| 2017 OBJECTIVES | | Achievement |
| Increase number of suppliers as Code signatories | | ∎ 91% on tracking list versus 89% in 2016 |
| Continue using Corrective and Preventative Actions tool to ensure continuous improvement in audit results | | ∎ 83 audits completed |
| Continue to advance US Supplier Diversity and Inclusion programme | | ∎ Minority, woman, and veteran-owned spend increased by 8% ∎ Spend with diverse suppliers was 11.4% of total US spend |
| | |
2018 OBJECTIVES |
| |
| ∎ | | Increase number of suppliers as Code signatories |
| |
| ∎ | | Continue using audits to ensure continuous improvement in supplier performance and compliance |
| |
| ∎ | | Continue to advance the US Supplier Diversity and Inclusion programme |
| |
OUR 2030 VISION Reduce supply chain risks related to human rights, labour, the environment and anti-bribery by ensuring adherence to our Supplier Code of Conduct through training, auditing and remediation; drive supply chain innovation, quality and efficiencies through a strong and diverse network of suppliers. |
| | |
| Business review Corporate Responsibility | | 51 |
|
|
7. Environment
Our environmental targets, reflecting our impact, with input from stakeholders, can be found along with full performance data in the 2017 Corporate Responsibility Report at www.relx.com/go/ CRReport. Targets are science-based, and include a commitment to certify 50% of the business against the ISO 14001 environmental management system standard by 2020. In 2017, we purchased 72% of our electricity from renewable energy and Renewable Energy Certificates. We attained A-, in CDP’s Climate Change programme.
Our Environmental Champions network, employee-led Green Teams and networks such as the Publishers’ Database for Responsible Environmental Paper Sourcing provide significant insight into managing our environmental impacts. Our Environmental Standards programme sets benchmark performance and inspires green competition between offices. In 2017, 37 sites (36% of key locations) achieved five or more standards and attained green status. On World Environment Day, the Chief Financial Officer wrote to all staff to share these results and to recognise the achievements of Green Heroes from across the Group chosen by peers for their environmental efforts. In addition, Green Teams submitted environmental engagement ideas and winners received funding to carry out their plans.
We have a positive environmental impact through our environmental products and services, which spread good practice, encourage debate and aid researchers and decision makers. The most recent results from the independent Market Analysis System show that our share of citations in environmental science represented 40% of the total market, and 65% in energy and fuels. The winner of Elsevier’s 2017 Green and Sustainable Chemistry Challenge was Dr. Dênis Pires de Lima from the Federal University of Mato Grosso do Sul in Brazil for his project using natural waste from locally sourced cashew nuts and castor oil to produce environmentally friendly insecticides against mosquitoes carrying Zika and Dengue fever, a sustainable alternative to conventional toxic insecticides.
| | |
| 2017 OBJECTIVES | | Achievement |
| 35% of locations to achieve five or more new Group Environmental Standards | | ∎ 36% of locations achieved five or more standards |
| Purchase renewable electricity equal to 70% of Global consumption | | ∎ Achieved through purchase of European green tariff, green-e certified US RECs and Gold Power |
| Achieve ISO 14001 Environmental Management System certification at three additional locations | | ∎ Achieved at three additional locations in the UK and US, total coverage of the ISO 14001 certified system is now 19% by headcount |
| | |
2018 OBJECTIVES |
| |
| ∎ | | Purchase renewable electricity equal to 80% of global consumption |
| |
| ∎ | | 40% of locations to achieve five or more new Group Environmental Standards |
| |
| ∎ | | Achieve ISO 14001 certification at an additional three locations |
| |
OUR 2030 VISION Meet long-range environmental targets that will contribute to keeping global average climate warming to below two degrees Celsius and help others do so through our environmental content and services. |
| | | | | | | | | | | | | | | | | | | | | | | | |
2017 ENVIRONMENTAL PERFORMANCE | | | | | | | | | |
| | | Absolute performance | | | Intensity ratio | |
| | | 2017 | | | variance | | | 2016 | | | 2017 | | | variance | | | 2016 | |
| Scope 1 (direct emissions) tCO2e | | | 8,231 | | | | 3% | | | | 7,966 | | | | 1.12 | | | | -3% | | | | 1.16 | |
| Scope 2 (location-based emissions) tCO2e | | | 84,590 | | | | -8% | | | | 91,913 | | | | 11.50 | | | | -14% | | | | 13.33 | |
| Scope 2 (market-based emissions) tCO2e | | | 21,831 | | | | -32% | | | | 32,153 | | | | 2.97 | | | | -36% | | | | 4.66 | |
| Total energy (MWh) | | | 186,228 | | | | -5% | | | | 195,556 | | | | 25.32 | | | | -11% | | | | 28.36 | |
| Water (m3) | | | 344,918 | | | | 2% | | | | 337,889 | | | | 46.90 | | | | -4% | | | | 49.00 | |
| Waste sent to landfill (%)* | | | 24% | | | | 0 %pts | | | | 24% | | | | 0.22 | | | | -12% | | | | 0.25 | |
| Production paper (t) | | | 36,484 | | | | -21% | | | | 46,128 | | | | 4.96 | | | | -26% | | | | 6.69 | |
| * | Intensity metric shows tonnes of waste sent to landfill/ £m revenue |
| | |
| 52 | | RELX Group Annual reports and financial statements 2017 |
|
|
7. Environment (continued)
| | | | | | |
| ENVIRONMENTAL TARGETS | | | | |
| Focus area | | Targets 2020 | | 2017
performance | |
Climate change | | Reduce Scope 1 and 2 location based carbon emissions by 40% against a 2010 baseline | | | -42% | |
Energy | | Reduce energy and fuel consumption by 30% against a 2010 baseline | | | -32% | |
| | Purchase renewable electricity equivalent to 100% of RELX Group’s global electricity consumption | | | 72% | |
Waste | | Decrease total waste generated at reporting locations by 40% against a 2010 baseline | | | -47% | |
| | 90% of waste from reporting locations to be diverted from landfill | | | 87% | |
Production paper* | | 100% of RELX Group production papers, graded in PREPS, to be rated as ‘known and responsible sources’ | | | 100% | |
Environmental Management System | | Achieve ISO 14001 certification for 50% of the business by 2020 | | | 19% | |
* All paper we graded in 2017 - 90% of total production stock - was graded 3 or 5 stars (known and responsible sources).
We have reported on all emission sources required under the Companies Act 2006 (Strategic Report and Directors’ Report) Regulations 2013. We have included emissions from all operating companies within the Group.
We have used the GHG Protocol Corporate Accounting and Reporting Standard (revised edition) and the data has been assured by an independent third party, EY. Details on methodology and the assurance statement can be viewed in the 2017 Corporate Responsibility Report at www.relx.com/go/CRReport.
| | |
 | | The full 2017 Corporate Responsibility Report is available atwww.relx.com/go/crreport |
D
| | |
| 54 | | RELX Group Annual reports and financial statements 2017 |
|
|
Chief Financial Officer’s report
| | |

Nick Luff Chief Financial Officer | | |
In 2017 we maintained the trends in financial performance seen in 2016. Underlying revenue and adjusted operating profit growth were 4% and 6% respectively. The capital structure of the Group continues to be managed to increase long-term shareholder value whilst maintaining appropriate leverage. Our balance sheet remains strong, with Return on Invested Capital of 13.1%.
Revenue
Underlying growth of revenue was 4%, with all four market segments contributing to underlying growth. The underlying growth rate reflects good growth in electronic and face-to-face revenues, partially offset by continued print revenue declines.
Reported revenue, including the effects of exhibition cycling, portfolio changes and currency movements, was £7,355m (2016: £6,895m), up 7%.
Exhibition cycling effects reduced revenue growth by 1%, and the net impact of acquisitions and disposals reduced revenue growth by 1%. The impact of currency movements was to increase revenue by 5%, principally due to the US dollar and euro being stronger against sterling on average during 2017.
Profit
Underlying adjusted operating profit grew ahead of revenue at 6%, reflecting the benefit of tight cost control across the Group.
Total adjusted operating profit, including the impact of acquisitions and disposals and currency effects, was £2,284m (2016: £2,114m), up 8%.
Acquisitions and disposals decreased adjusted operating profit by 3%. Currency effects increased adjusted operating profit by 5%, in line with the impact on revenue.
Underlying operating cost growth was 2%, reflecting investment in global technology platforms and the launch of new products and services, partly offset by continued process innovation. Actions continue to be taken across our businesses to improve cost-efficiency. Total operating costs, including the impact of acquisitions, disposals and currency effects, increased by 6%.
The overall adjusted operating margin of 31.1% was 0.4 percentage points higher than in the prior year. On an underlying basis, including cycling effects, the margin improved by 0.7 percentage points. Acquisitions and disposals reduced the margin by 0.4 percentage points and currency effects increased the margin by 0.1 percentage points.
Reported operating profit, after amortisation of acquired intangible assets and acquisition-related costs, was £1,905m (2016: £1,708m).
| | |
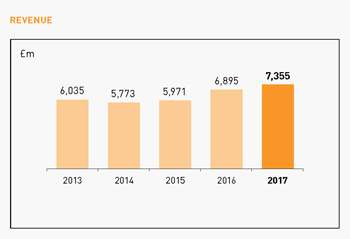 | | 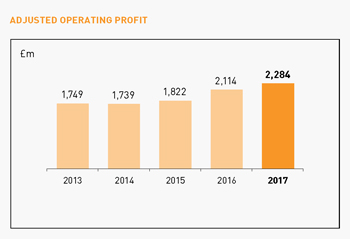 |
| | |
| Financial review Chief Financial Officer’s report | | 55 |
|
|
| | | | | | | | | | | | | | | | | | | | |
| | | 2017
£m | | | 2016
£m | | | Change | | | Change
at constant
currencies | | | Change
underlying | |
Reported figures | | | | | | | | | | | | | | | | | | | | |
Revenue | | | 7,355 | | | | 6,895 | | | | 7% | | | | 2% | | | | 4% | |
Operating profit | | | 1,905 | | | | 1,708 | | | | 12% | | | | | | | | | |
Profit before tax | | | 1,734 | | | | 1,473 | | | | 18% | | | | | | | | | |
Net profit attributable to RELX PLC and RELX NV shareholders | | | 1,659 | | | | 1,161 | | | | 43% | | | | | | | | | |
Net margin | | | 22.6% | | | | 16.8% | | | | | | | | | | | | | |
Net borrowings | | | 4,732 | | | | 4,700 | | | | | | | | | | | | | |
Earnings per share | | | 82.2p | | | | 56.3p | | | | 46% | | | | | | | | | |
Adjusted figures | | | | | | | | | | | | | | | | | | | | |
Operating profit | | | 2,284 | | | | 2,114 | | | | 8% | | | | 3% | | | | 6% | |
Operating margin | | | 31.1% | | | | 30.7% | | | | | | | | | | | | | |
Profit before tax | | | 2,118 | | | | 1,934 | | | | 10% | | | | | | | | | |
Net profit attributable to RELX PLC and RELX NV shareholders | | | 1,635 | | | | 1,488 | | | | 10% | | | | | | | | | |
Net margin | | | 22.2% | | | | 21.6% | | | | | | | | | | | | | |
Cash flow | | | 2,192 | | | | 2,016 | | | | 9% | | | | | | | | | |
Cash flow conversion | | | 96% | | | | 95% | | | | | | | | | | | | | |
Return on invested capital | | | 13.1% | | | | 13.0% | | | | | | | | | | | | | |
Earnings per share | | | 81.0p | | | | 72.2p | | | | 12% | | | | 7% | | | | | |
RELX Group uses adjusted and underlying figures as additional performance measures. Adjusted figures primarily exclude the amortisation of acquired intangible assets and other items related to acquisitions and disposals, and the associated deferred tax movements. In 2017, we have excluded the exceptional tax credit arising as a result of the US Tax Cuts and Jobs Act . Reconciliations between the reported and adjusted figures are set out on page 186. Underlying growth rates are calculated at constant currencies, and exclude the results of all acquisitions and disposals made in both the year and prior year and of assets held for sale. Underlying revenue growth rates also exclude the effects of exhibition cycling. Constant currency growth rates are based on 2016 full-year average and hedge exchange rates.
The amortisation charge in respect of acquired intangible assets, including the share of amortisation in joint ventures, decreased to £314m (2016: £346m), primarily reflecting certain assets becoming fully amortised, partially offset by currency effects and acquisitions. Acquisition-related costs were £56m (2016: £51m).
Adjusted interest expense, excluding the net pension financing charge of £15m (2016: £14m) and including finance income in joint ventures of £1m (2016: £1m), was £166m (2016: £180m). The decrease primarily reflects a lower average interest rate on borrowings, partly offset by currency translation effects.
Reported net finance costs were £182m (2016: £195m).
Net pre-tax disposal gains were £11m (2016: £40m loss) arising largely from the sale of Risk & Business Analytics businesses and revaluation of investments held. These gains are offset by an associated tax charge of £16m (2016: £34m credit).
Adjusted profit before tax was £2,118m (2016: £1,934m), up 10%.
The reported profit before tax was £1,734m (2016: £1,473m).
The adjusted effective tax rate on adjusted profit before tax was 22.5%, 0.2 percentage points lower than the prior year rate of 22.7%. The adjusted effective tax rate excludes movements in deferred taxation assets and liabilities related to goodwill and acquired intangible assets, but includes the benefit of tax amortisation where available on those items. Adjusted operating profits and taxation are grossed up for the equity share of taxes in joint ventures. The application of tax law and practice is subject to some uncertainty and amounts are provided in respect of this. Discussions with tax authorities relating to cross-border transactions and other matters are ongoing. Although the outcome of open items cannot be predicted, no significant impact on profitability is expected.

| | |
| 56 | | RELX Group Annual reports and financial statements 2017 |
|
|
The reported tax charge was £67m (2016: £304m). The decrease in the tax charge is due to the US Tax Cuts and Jobs Act, which includes a reduction in the federal corporate tax rate from 35% to 21% from January 2018. Consequently, the Group has measured its US deferred tax assets and liabilities at the end of the reporting period at a combined tax rate (including state taxes) of 26%. This resulted in the recognition of an exceptional tax credit of £346m in the income statement.
The adjusted net profit attributable to RELX PLC and RELX NV shareholders of £1,635m (2016: £1,488m) was up 10%. Adjusted earnings per share were up 12% at 81.0p (2016: 72.2p) when expressed in sterling and 5% at€0.923 (2016:€0.880) when expressed in euros. At constant rates of exchange, adjusted earnings per share increased by 7%.
The reported net profit attributable to RELX PLC and RELX NV shareholders was £1,659m (2016: £1,161m).
Cash flows
Adjusted cash flow was £2,192m (2016: £2,016m), up 9% compared with the prior year and up 3% at constant currencies. The rate of conversion of adjusted operating profit to adjusted cash flow was 96% (2016: 95%).
CONVERSION OF ADJUSTED OPERATING PROFIT INTO CASH
| | | | | | | | |
| YEAR TO 31 DECEMBER | | 2017
£m | | | 2016
£m | |
Adjusted operating profit | | | 2,284 | | | | 2,114 | |
Capital expenditure | | | (354 | ) | | | (333 | ) |
Depreciation and amortisation of internally developed intangible assets | | | 272 | | | | 257 | |
Working capital and other items | | | (10 | ) | | | (22 | ) |
Adjusted cash flow | | | 2,192 | | | | 2,016 | |
Cash flow conversion | | | 96% | | | | 95% | |
Capital expenditure was £354m (2016: £333m), including £303m (2016: £282m) in respect of capitalised development costs. This reflects sustained investment in new products and related infrastructure across the business. Depreciation and the amortisation of internally developed intangible assets was £272m (2016: £257m). Capital expenditure was 4.8% of revenue (2016: 4.8%). Depreciation and amortisation was 3.7% of revenue (2016: 3.7%).
Tax paid, excluding tax relief on acquisition-related costs and on disposals, of £472m (2016: £423m) increased as a result of improved profits and movements in exchange rates. Interest paid was £148m (2016: £152m).
Payments made in respect of acquisition-related costs amounted to £42m (2016: £40m).
Free cash flow before dividends was £1,544m (2016: £1,414m). Ordinary dividends paid to shareholders in the year, being the 2016 final and 2017 interim dividends, amounted to £762m (2016: £683m). Free cash flow after dividends was £782m (2016: £731m).
RECONCILIATION OF CASH GENERATED FROM OPERATIONS TO ADJUSTED CASH FLOW
| | | | | | | | |
| YEAR TO 31 DECEMBER | | 2017
£m | | | 2016
£m | |
Cash generated from operations | | | 2,445 | | | | 2,236 | |
Dividends received from joint ventures | | | 38 | | | | 44 | |
Purchases of property, plant and equipment | | | (51 | ) | | | (51 | ) |
Expenditure on internally developed intangible assets | | | (303 | ) | | | (282 | ) |
Payments in relation to acquisition-related costs/other | | | 62 | | | | 68 | |
Proceeds from disposals of property, plant and equipment | | | 1 | | | | 1 | |
Adjusted cash flow | | | 2,192 | | | | 2,016 | |
FREE CASH FLOW
| | | | | | | | |
| YEAR TO 31 DECEMBER | | 2017
£m | | | 2016
£m | |
Adjusted cash flow | | | 2,192 | | | | 2,016 | |
Interest paid (net) | | | (148 | ) | | | (152 | ) |
Tax paid | | | (472 | ) | | | (423 | ) |
Acquisition-related costs* | | | (28 | ) | | | (27 | ) |
Free cash flow before dividends | | | 1,544 | | | | 1,414 | |
Ordinary dividends | | | (762 | ) | | | (683 | ) |
Free cash flow post dividends | | | 782 | | | | 731 | |
* Including cash tax relief.
Total consideration on acquisitions completed in the year was £123m (2016: £338m). Cash spent on acquisitions was £141m (2016: £367m), including deferred consideration of £13m (2016: £24m) on past acquisitions and spend on venture capital investments of £10m (2016: £6m).
Total consideration for the disposal of non-strategic assets in 2017 was £87m (2016: £16m). Net cash inflow after timing differences and separation and transaction costs was £34m (2016: £13m outflow).
Share repurchases by RELX PLC and RELX NV in 2017 were £700m (2016: £700m), with a further £100m repurchased in 2018 as at 14 February. In addition, the Employee Benefit Trust purchased shares of RELX PLC and RELX NV to meet future obligations in respect of share based remuneration totalling £39m (2016: £29m). Proceeds from the exercise of share options were £32m (2016: £23m).
| | |
| Financial review Chief Financial Officer’s report | | 57 |
|
|
RECONCILIATION OF NET DEBT YEAR-ON-YEAR
| | | | | | | | |
| YEAR TO 31 DECEMBER | | 2017
£m | | | 2016
£m | |
Net debt at 1 January | | | (4,700 | ) | | | (3,782 | ) |
Free cash flow post dividends | | | 782 | | | | 731 | |
Net disposal proceeds/(payments) | | | 34 | | | | (13 | ) |
Acquisition cash spend | | | (141 | ) | | | (367 | ) |
Share repurchases | | | (700 | ) | | | (700 | ) |
Purchase of shares by the Employee | | | | | | | | |
Benefit Trust | | | (39 | ) | | | (29 | ) |
Other* | | | - | | | | (31 | ) |
Currency translation | | | 32 | | | | (509 | ) |
Movement in net debt | | | (32 | ) | | | (918 | ) |
Net debt at 31 December | | | (4,732 | ) | | | (4,700 | ) |
* Cash tax relief on disposals, distributions to non-controlling interests, pension deficit payments, finance leases and share option exercise proceeds.
Funding
Debt
Gross borrowings at 31 December 2017 amounted to £4,886m (2016: £4,843m). The fair value of related derivative net assets was £43m (2016: net liabilities of £19m). Cash and cash equivalents totalled £111m (2016: £162m). In aggregate, these give the net borrowings figure of £4,732m (2016: £4,700m).
The effective interest rate on gross borrowings was 3.2% in 2017, 0.6 percentage points lower than the prior year, reflecting the benefit of refinancing historical bonds that had higher rates of interest. As at 31 December 2017, gross borrowings had a weighted average life remaining of 4.6 years and a total of 44% of them were at fixed rates, after taking into account interest rate derivatives.
The ratio of net debt to 12-month trailing EBITDA (adjusted earnings before interest, tax, depreciation and amortisation) was 1.9x (2016: 1.8x), calculated in US dollars. Incorporating the capitalisation of operating leases and the net pension deficit, in line with the approach taken by credit rating agencies, the ratio was 2.2x (2016: 2.2x).
Liquidity
The Group has a $2.0bn committed bank facility, maturing in July 2020, which provides security of funding for short-term debt. At 31 December 2017, this facility was undrawn. In March 2017,€1.0bn in total of euro denominated fixed rate term debt was issued with coupons of 0.375% and 1.000% and maturities of four years and seven years, respectively. The Group has ample liquidity and access to debt capital markets, providing the ability to repay or refinance borrowings as they mature and to fund ongoing requirements.
Invested capital and returns
Net capital employed was £8,016m at 31 December 2017 (2016: £8,484m), a reduction of £468m. The carrying value of goodwill and acquired intangible assets decreased by £888m, reflecting the weakening of the dollar against sterling from the beginning to the end of 2017, partly offset by acquisitions. An amount of £56m was capitalised in the year in respect of acquired intangible assets and £77m was recorded as goodwill.
SUMMARY BALANCE SHEET
| | | | | | | | |
| AS AT 31 DECEMBER | | 2017
£m | | | 2016
£m | |
Goodwill and acquired intangible assets* | | | 8,023 | | | | 8,911 | |
Internally developed intangible assets* | | | 1,136 | | | | 1,085 | |
Property, plant and equipment* and investments | | | 452 | | | | 481 | |
Net assets held for sale | | | – | | | | 1 | |
Net pension obligations | | | (328 | ) | | | (636 | ) |
Working capital | | | (1,267 | ) | | | (1,358 | ) |
Net capital employed | | | 8,016 | | | | 8,484 | |
* Net of accumulated depreciation and amortisation.
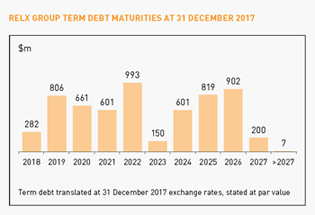
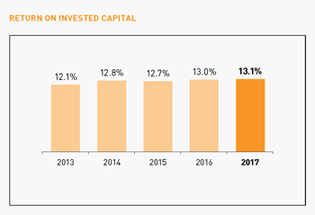

| | |
| 58 | | RELX Group Annual reports and financial statements 2017 |
|
|
Development costs of £304m (2016: £280m) were capitalised within internally developed intangible assets, most notably investment in new products and related infrastructure in the Legal and Scientific, Technical & Medical businesses.
Net pension obligations, i.e. pension obligations less pension assets, decreased to £328m (2016: £636m). There was a net deficit of £89m (2016: £393m) in respect of funded schemes, which were on average 98% funded at the end of the year on an IFRS basis. The lower deficit mainly reflects strong asset performance in both the UK and the US schemes, and changes to the UK scheme resulting in a £42m credit and a corresponding reduction in the liability.
The post-tax return on average invested capital in the year was 13.1% (2016: 13.0%).
RETURN ON INVESTED CAPITAL
| | | | | | | | |
| AS AT 31 DECEMBER | | 2017 £m | | | 2016
£m | |
Adjusted operating profit | | | 2,284 | | | | 2,114 | |
Tax at effective rate | | | (514 | ) | | | (480 | ) |
Effective tax rate | | | 22.5% | | | | 22.7% | |
Adjusted operating profit after tax | | | 1,770 | | | | 1,634 | |
Average invested capital* | | | 13,501 | | | | 12,538 | |
Return on invested capital | | | 13.1% | | | | 13.0% | |
* Average of invested capital at the beginning and the end of the year, retranslated at average exchange rates for the year. Invested capital is calculated as net capital employed, adjusted to add back accumulated amortisation, impairment of acquired intangible assets and goodwill and to exclude the gross up to goodwill in respect of deferred tax.
Reported earnings per share and dividends
| | | | | | | | | | | | |
| RELX PLC | | 2017 £m | | | 2016 £m | | | Change | |
Reported earnings per share | | | 82.2p | | | | 56.3p | | | | +46% | |
Ordinary dividend per share | | | 39.4p | | | | 35.95p | | | | +10% | |
| | | |
| RELX NV | | €m | | | €m | | | Change | |
Reported earnings per share | | € | 0.936 | | | | €0.687 | | | | +36% | |
Ordinary dividend per share | | € | 0.448 | | | | €0.423 | | | | +6% | |
The reported earnings per share for RELX PLC was 82.2p (2016: 56.3p) and for RELX NV was€0.936 (2016:€0.687). The high growth in the year reflects the impact of the exceptional tax credit recognised as a result of the US Tax Cuts and Jobs Act.
The final dividends proposed by the respective Boards are 27.7p per share for RELX PLC and€0.316 per share for RELX NV, 8% and 5% higher respectively compared with the prior year final dividends. This gives total dividends for the year of 39.4p (2016: 35.95p) and€0.448 (2016:€0.423). The difference in growth rates in the final dividends reflects changes in the euro:sterling exchange rate since the prior year final dividend announcement date.
Dividend cover, based on adjusted earnings per share and the total interim and proposed final dividends for the year, is 2.1x. The dividend policy of RELX PLC and RELX NV is, subject to currency considerations, to grow dividends broadly in line with adjusted earnings per share while maintaining dividend cover (being the number of times the annual dividend is covered by the adjusted earnings per share) of at least two times over the longer term.
During 2017, a total of 44.5m RELX PLC and RELX NV shares were repurchased. Total consideration for these repurchases was £700m. A further 1.2m RELX PLC shares and 1.3m RELX NV shares were purchased by the Employee Benefit Trust. During 2017, 22.5m RELX PLC and 22m RELX NV shares held in treasury were cancelled. As at 31 December 2017, total shares in issue for RELX Group, net of shares held in treasury and shares held by the Employee Benefit Trust, amounted to 2,004m; represented by 1,060m RELX PLC shares and 944m RELX NV shares. A further 3.3m RELX PLC shares and 2.9m RELX NV shares have been repurchased in 2018 as at 14 February.
Distributable reserves
As at 31 December 2017, RELX PLC and RELX NV each had distributable reserves of over £1.5bn (€1.7bn). In line with respective legislation in the UK and the Netherlands, distributable reserves are derived from the non-consolidated RELX PLC and RELX NV balance sheets. The consolidated Group reserves reflect adjustments such as the amortisation of acquired intangible assets that are not taken into account when calculating distributable reserves.
Further information on the distributable reserves of RELX PLC and RELX NV can be found in the parent company financial statements on pages 173 and 180 respectively.
Alternative performance measures
The Group uses adjusted figures, which are not defined by generally accepted accounting principles (“GAAP”) such as IFRS. Adjusted figures and underlying growth rates are presented as additional performance measures used by management, as they provide relevant information in assessing the Group’s performance, position and cash flows. We believe that these measures enable investors to more clearly track the core operational performance of the Group, by separating out items of income or expenditure relating to acquisitions, disposals and capital items, while providing our investors with a clear basis for assessing our ability to raise debt and invest in new business opportunities. In 2017, we have excluded the exceptional tax credit arising as a result of the US Tax Cuts and Jobs Act from our adjusted measures.
Our management uses these financial measures, along with IFRS financial measures, in evaluating the operating performance of the Group as a whole and the individual business segments. Adjusted financial measures should not be considered in isolation from, or as a substitute for, financial information presented in compliance with IFRS. The measures may not be directly comparable to similarly reported measures by other companies. Please see page 186 for reconciliations of adjusted measures.
| | |
| Financial review Chief Financial Officer’s report | | 59 |
|
|
Accounting policies
The consolidated financial statements are prepared in accordance with International Financial Reporting Standards as adopted by the European Union and as issued by the International Accounting Standards Board following the accounting policies shown in the notes to the financial statements on pages 122 to 164. The accounting policies and estimates which require the most significant judgement relate to the valuation of goodwill and intangible assets, the capitalisation of development costs, taxation and accounting for defined benefit pension schemes. Further detail is provided in the accounting policies on pages 122 and 123 and in the relevant notes to the accounts.
New accounting standards
RELX Group will adopt IFRS 9, 15 and 16 from 1 January 2018. For IFRS 16 this is one year earlier than its mandatory adoption date. Please see note 1 to the consolidated financial statements for further details on the impact of these new standards.
Tax principles
Taxation is an important issue for us and our stakeholders, including our shareholders, governments, customers, suppliers, employees and the broader, global communities in which we operate. We have set out our approach to tax in our global tax strategy. This incorporates our Tax Principles along with additional disclosures around where we pay taxes and our broader contribution to society. This is all made publicly available on our website: (www.relx.com/go/TaxPrinciples).
We maintain an open dialogue with tax authorities, and are vigilant in ensuring that we comply with current tax legislation. We have clear and consistent tax policies and tax matters are dealt with by a professional tax function, supported by external advisers. We proactively seek to agree arm’s length pricing with tax authorities to mitigate tax risks of significant cross-border operations. We actively engage with policy makers, tax administrators, industry bodies and international institutions to provide informed input on proposed tax measures, so that we and they can understand how those proposals would affect our businesses. In addition, we participate in consultations with the Organisation for Economic Co-operation and Development (“OECD”), European bodies and the United Nations.
Treasury policies
The Boards of RELX PLC, RELX NV and RELX Group plc agree policies for managing treasury risks. The key policies address security of funding requirements, the target fixed/floating interest rate exposure for debt and foreign currency hedging and place limits on counterparty exposures. A more extensive summary of these policies is provided in note 19 to the financial statements on pages 147 to 152. Financial instruments are used to finance the RELX Group businesses and to hedge transactions. The Group’s businesses do not enter into speculative transactions.
Capital and liquidity management
The capital structure is managed to support the Group’s objective of maximising long-term shareholder value through appropriate security of funding, ready access to debt and capital markets, cost-effective borrowing and flexibility to fund business and acquisition opportunities while maintaining appropriate leverage to ensure an efficient capital structure.
Over the long-term, the Group seeks to maintain cash flow conversion of 90% or higher and credit rating agency metrics that are consistent with a solid investment grade credit rating. These metrics as defined by the rating agencies include net debt to EBITDA, on a pensions and lease adjusted and on an unadjusted basis, and various measures of cash flow as a percentage of net debt.
The Group’s uses of free cash flow over the longer term balance the dividend policy, selective acquisitions and share repurchases, while retaining the balance sheet strength to maintain access to cost-effective sources of borrowing. Further detail on the Group’s capital and liquidity management is provided on pages 147 and 148.
Corporate responsibility
We work to minimise any negative environmental impact of conducting our business, not least by continuing to expand our purchase of renewable energy, which equated to 72% of our global electricity consumption in 2017.
We also achieved our goal of having 35% of our reporting locations achieve green status by meeting five or more of our environmental standards, which set target energy and water usage and waste levels per person. In the year, three additional locations gained ISO 14001 Environmental Management System certification.
We make a positive environmental impact through our products and services which inform environmental debate, aid decision makers and encourage research and development. In 2017, this included more than 100 environmental sciences journals and shows like World Efficiency Solutions, which allows environmental innovators to meet business and government representatives, among others, seeking environmental solutions.
Our Green Teams, local level environmental networks, representing nearly 19,000 colleagues across the business, advance environmental good practice. In 2017, I chaired regular Environmental Checkpoint meetings to track progress against our environmental objectives. I highlighted our environmental targets and performance in an email to all staff globally on World Environment Day in June.
Nick Luff
Chief Financial Officer

| | |
| 60 | | RELX Group Annual reports and financial statements 2017 |
|
|
Principal risks
The Group has established risk management practices that are embedded into the operations of the businesses, based on the Internal Control-Integrated Framework (2013) by the Committee of Sponsoring Organisations of the Treadway Commission (COSO). The principal risks facing the business, which have been assessed by the Audit Committees and Boards, are described below. The Directors confirm this process is robust and includes consideration of risks, including long-term systemic risks and risks arising from the impact the Group has on external parties, that could threaten the Group’s business models, future performance, solvency or liquidity. It is not possible to identify every risk that could affect our businesses, and the actions taken
to mitigate the risks described below cannot provide absolute assurance that a risk will not materialise and/or adversely affect our business or financial performance. Our risk management and internal control processes are described in the Corporate Governance section. A description of the business and a discussion of factors affecting performance is set out in the Chief Executive Officer’s report and the Business Review. Treasury risks are further discussed in the Chief Financial Officer’s report and in note 19 to the consolidated financial statements. Our approach to managing environmental and other non-financial risks is set out in the Business Review and the separate Corporate Responsibility Report.
| | | | |
| EXTERNAL RISKS | | | | |
| Risk | | Description and impact | | Mitigation |
| Economy and market conditions | | Demand for our products and services may be adversely impacted by factors beyond our control, such as the economic environment in the United States, Europe and other major economies, political uncertainties (including the potential consequences of the United Kingdom’s withdrawal from the European Union under Article 50 of the Treaty of Lisbon), acts of war, terrorism and civil unrest as well as levels of government and private funding provided to academic and research institutions. | | Our businesses are focused on professional markets which have generally been more resilient in periods of economic downturn. We deliver information solutions, many on a subscription basis, which are important to our customers’ effectiveness and efficiency. We have extended our position in long-term global growth markets through organic new launches supported by the selective acquisition of content and data sets. We continue to dispose of businesses that no longer fit our strategy. We continuously monitor economic and political developments to assess their impact on our strategy which is designed to mitigate these risks. |
| Intellectual property rights | | Our products and services include and utilise intellectual property. We rely on trademark, copyright, patent and other intellectual property laws to establish and protect our proprietary rights in this intellectual property. There is a risk that our proprietary rights could be challenged, limited, invalidated or circumvented, which may impact demand for and pricing of our products and services. Copyright laws are subject to national legislative initiatives, as well as cross border initiatives such as those from the European Commission, and increased judicial scrutiny in several jurisdictions in which we operate. This creates additional challenges for us in protecting our proprietary rights in content delivered through the internet and electronic platforms. | | We actively engage in developing and promoting the legal protection of intellectual property rights. Our subscription contracts with customers contain provisions regarding the use of proprietary content. We are vigilant as to the use of our intellectual property and, as appropriate, take legal action to challenge illegal content distribution sources. |
| Data resources | | A number of our businesses rely extensively upon content and data from external sources. Data is obtained from public records, governmental authorities, customers and other information companies, including competitors. Legal regulations, such as the European Union’s General Data Protection Regulation (“GDPR”), relating to internet communications, privacy and data protection, e-commerce, information governance and use of public records, are becoming more prevalent worldwide. The disruption or loss of data sources, either because of changes in the law or because data suppliers decide not to supply them, may impose limits on our collection and use of certain kinds of information about individuals and our ability to communicate such information effectively with our customers. | | We seek as far as possible to have proprietary content. Where content is supplied to us by third parties, we aim to have contracts which provide mutual commercial benefit. We also maintain an active dialogue with regulatory authorities on privacy and other data related issues, and promote, with others, the responsible use of data. We have a global privacy programme in place, designed to comply with applicable privacy regulations including GDPR, which applies from 25 May 2018. |
| Paid subscriptions | | Our Scientific, Technical & Medical (STM) primary research content, like that of most of our competitors, is sold largely on a paid subscription basis. There is continued debate in government, academic and library communities, which are the principal customers for our STM content, regarding to what extent such content should be funded instead through fees charged to authors or authors’ funders and/or made freely available in some form after a period following publication. Some of these methods, if widely adopted, could adversely affect our STM revenue from paid subscriptions. | | We engage extensively with stakeholders in the STM community to better understand their needs and deliver value to them. We are open to serving the STM community under any payment model that can sustainably provide researchers with the critical information tools that they need. We focus on the integrity and quality of research through the editorial and peer review process; we invest in efficient editorial and distribution platforms and in innovation in platforms and tools to make content and data more accessible and actionable; and we ensure vigilance on plagiarism and the long-term preservation of research findings. |
| | |
Financial review Principal risks | | 61 |
| | | | |
| STRATEGIC RISKS | | | | |
| Risk | | Description and impact | | Mitigation |
| Customer acceptance of products | | Our businesses are dependent on the continued acceptance by our customers of our products and services and the value placed on them. Failure to meet evolving customer needs could impact demand for our products and services and consequently adversely affect our revenue or the long-term returns from our investment in electronic product and platform initiatives. | | We are focused on the needs and economics of our customers. We leverage user centred design and development methods and customer analytics and invest in new and enhanced technologies to provide content and innovative solutions that help them achieve better outcomes and enhance productivity. |
| Competition | | Our businesses operate in highly competitive markets, and the means of delivering our products and services, and the products and services themselves, continue to change in response to rapid technological innovations, legislative and regulatory changes, the entrance of new competitors and other factors. Failure to anticipate and quickly adapt to these changes could impact the competitiveness of our products and services and consequently adversely affect our revenue. | | We gain insights into our markets, evolving customers’ needs, the potential application of new technologies and business models, and the actions of competitors. These insights inform our market strategies and operational priorities. We continuously invest significant resources in our products and services, and the infrastructure to support them. |
| Acquisitions | | We supplement our organic development with selected acquisitions. If we are unable to generate the anticipated benefits such as revenue growth and/or cost savings associated with these acquisitions this could adversely affect return on invested capital and financial condition, or lead to an impairment of goodwill. | | Acquisitions are made within the framework of our overall strategy, which emphasises organic development. We have a well formulated process for reviewing and executing acquisitions and for managing thepost-acquisition integration. This process is underpinned with clear strategic, financial and ethical criteria. We closely monitor the integration and performance of acquisitions. |
| | | | | |
| OPERATIONAL RISKS | | | | |
| Risk | | Description and impact | | Mitigation |
| Technology failure | | Our businesses are dependent on electronic platforms and networks, primarily the internet, for delivery of our products and services. These could be adversely affected if our electronic delivery platforms or networks experience a significant failure, interruption or security breach. | | We have established procedures for the protection of our technology assets. These include the development of business continuity plans, including IT disaster recovery plans and back-up delivery systems, to reduce business disruption in the event of a major technology failure. |
| Cyber security | | Our businesses maintain online databases and information, including public records and other personal information. As part of maintaining this information and delivering our products and services, we rely on and provide data to third parties, including customers and service providers. These databases and information are a target for compromise and face a risk of unauthorised access and use by unauthorised parties. Our cyber security measures, and the measures used by our third-party service providers, may not detect or prevent all attempts to compromise our systems, which may jeopardise the security of the data we maintain or may disrupt our systems. Failures of our cyber security measures could result in unauthorised access to our systems, misappropriation of our or our users’ data, deletion or modification of stored information or other interruption to our business operations. As techniques used to obtain unauthorised access to or to sabotage systems change frequently, and may not be known until launched against us or our third-party service providers, we may be unable to anticipate or implement adequate measures to protect against these attacks and our service providers and customers may likewise be unable to do so. Compromises of our or our third-party service providers’ systems, or failure to comply with applicable legislation or regulatory or contractual requirements could adversely affect our financial performance, damage our reputation and expose us to risk of loss, fines and penalties, litigation and increased regulation. | | We have established data privacy and security programmes with the aim of ensuring that data is protected and that we comply with relevant legislative, regulatory and contractual requirements. We have governance mechanisms in place to design and monitor common policies and standards across our businesses. We invest in appropriate administrative, technical and physical controls which are applied across the enterprise in a risk based security programme which operates at the infrastructure, application and user levels. These controls include, but are not limited to, infrastructure vulnerability management, application scanning and penetration testing, network segmentation, encryption and logging and monitoring. Our administrative controls include training and communication initiatives to establish awareness of risks at all levels of our businesses. The RELX Group Privacy Principles include the requirement for transparency, accountability and Privacy by Design. We have appropriate incident response plans to respond to threats and attacks, including internal reporting channels and appropriate external advisors and support services. We maintain appropriate data privacy and information security policies and contractual requirements for our businesses and run programmes monitoring the application of our data privacy and information security policies by third-party service providers. We use independent internal and third-party auditors to regularly test, evaluate and help enhance our procedures and controls. We have established procedures for incorporating the requirements of relevant laws and regulations into our overall security programme, including into our policies and procedures. Our compliance with these is also regularly reviewed and tested. |

| | |
| 62 | | RELX Group Annual reports and financial statements 2017 |
|
|
| | | | |
| OPERATIONAL RISKS | | | | |
| Risk | | Description and impact | | Mitigation |
| Supply chain dependencies | | Our organisational and operational structures depend on outsourced and offshored functions, including use of cloud service providers. Poor performance, failure or breach of third parties to whom we have outsourced activities could adversely affect our business performance, reputation and financial condition. | | We select our vendors with care and establish contractual service levels that we closely monitor, including through key performance indicators and targeted supplier audits. We have developed business continuity plans to reduce disruption in the event of a major failure by a vendor. |
| Talent | | The implementation and execution of our strategies and business plans depend on our ability to recruit, motivate and retain skilled employees and management. We compete globally and across business sectors for talented management and skilled individuals, particularly those with technology and data analytics capabilities. An inability to recruit, motivate or retain talent could adversely affect our business performance. Failure to recruit and develop a diverse and inclusive workforce could adversely affect our reputation and business performance. | | We have well-established management development and talent review programmes. We monitor capability needs and remuneration schemes are tailored to attract and motivate the best talent available at an appropriate level of cost. We actively seek feedback from employees, which feeds into plans to enhance employee engagement and motivation. Our Diversity and Inclusion strategy aims to create a diverse workforce and an environment that respects individuals and their contribution and fosters innovation. |
| | | | | |
| FINANCIAL RISKS | | | | |
| Risk | | Description and impact | | Mitigation |
| Pensions | | We operate a number of pension schemes around the world, including local versions of the defined benefit type in the UK and the United States. The assets and obligations associated with those pension schemes are sensitive to changes in the market values of the scheme’s investments and the market-related assumptions used to value scheme liabilities. Adverse changes to asset values, discount rates, longevity assumptions or inflation could increase future pension costs and funding requirements. | | We have professional management of our pension schemes and we focus on maintaining appropriate asset allocation and plan designs. We review our funding requirements on a regular basis with the assistance of independent actuaries and ensure that the funding plans are appropriate. We seek to manage pension liabilities by reviewing pension benefits provided to staff as well as the structure of scheme arrangements. |
| Tax | | Our businesses operate globally and our profits are subject to taxation in many different jurisdictions and at differing tax rates. The Organisation for Economic Co-operation and Development (OECD)’s reports on Base Erosion and Profit Shifting suggest a range of new approaches that national governments might adopt when taxing the activities of multinational enterprises. The OECD continues to explore options around the taxation of the digital economy. As a result of the OECD’s work and other international initiatives, tax laws that currently apply to our businesses may be amended by the relevant authorities or interpreted differently by them, and these changes could adversely affect our reported results. | | We maintain an open dialogue with tax authorities, and are vigilant in ensuring that we comply with current tax legislation. We have clear and consistent tax policies and tax matters are dealt with by a professional tax function, supported by external advisers. As outlined in the Chief Financial Officer’s report on page 59 we participate in consultations with tax authorities and international organisations. The principles we adopt in our approach to tax matters can be found on our website at: www.relx.com/go/taxprinciples. |
| Treasury | | The RELX Group consolidated financial statements are expressed in pounds sterling and are subject to movements in exchange rates on the translation of the financial information of businesses whose operational currencies are other than sterling. The United States is our most important market and, accordingly, significant fluctuations in the US dollar exchange rate could significantly affect our reported results. We also earn revenues and incur costs in a range of other currencies, including the euro and the yen, and significant fluctuations in these exchange rates could also significantly impact our reported results. Macroeconomic, political and market conditions may adversely affect the availability and terms of short and long-term funding, volatility of interest rates, the credit quality of our counterparties, currency exchange rates and inflation. The majority of our outstanding debt instruments are, and any of our future debt instruments may be, publicly rated by independent rating agencies. Our borrowing costs and access to capital may be adversely affected if the credit ratings assigned to our debt are downgraded. | | Our approach to capital structure and funding is described in the Chief Financial Officer’s report on pages 54 to 59. The approach to the management of treasury risks is described in note 19 to the consolidated financial statements. |
| | |
Financial review Principal risks | | 63 |
| | | | |
| REPUTATIONAL RISKS | | |
| Risk | | Description and impact | | Mitigation |
| Ethics | | As a world-leading provider of professional information solutions to the STM, risk and business analytics, legal and exhibitions markets we, our employees and major suppliers are expected to adhere to high standards of independence and ethical conduct, including those related to anti-bribery and anti-corruption, promoting human rights and principled business conduct. A breach of generally accepted ethical business standards or applicable anti-bribery and anti-corruption or competition statutes could adversely affect our business performance, reputation and financial condition. | | Our Code of Ethics and Business Conduct is provided to every employee and is supported by training. It encompasses such topics as competing fairly, prohibiting corrupt business practice, promoting human rights and fair employment practices and encouraging open and principled behaviour. We have well-established processes for reporting and investigating instances of unethical conduct. Our major suppliers are required to adhere to our Supplier Code of Conduct. |
| Environmental | | Our businesses have an impact on the environment, principally through the use of energy and water, waste generation and, in our supply chain, through paper use and print and production technologies. Failure to manage our environmental impact could adversely affect our reputation. | | We are committed to reducing these environmental impacts by limiting resource use and efficiently employing sustainable materials and technologies. We require our major suppliers and contractors to meet the same objectives. We seek to ensure that all our businesses are compliant with relevant environmental regulation. |
The Strategic Report, as set out on pages 2 to 63, has been approved by the Board of RELX PLC.
| | |
| By order of the Board | | Registered Office |
| Henry Udow | | 1–3 Strand |
| Company Secretary | | London |
| 14 February 2018 | | WC2N 5JR |

| | |
| 64 | | RELX Group Annual reports and financial statements 2017 |
|
|


| | |
| 66 | | RELX Group Annual reports and financial statements 2017 |
|
|
Board Directors
| | | | | | | | | | | | | | | | |
| Executive Directors | | | | Non-Executive Directors | | | | | | | | |
| | | | | | | | | | | | | | | | |
 | | | |  | | | |  | | |
Erik Engstrom (54) | | | | | | Sir Anthony Habgood (71) | |  | | | | Wolfhart Hauser (68) | |  | | |
Chief Executive Officer Appointed: Chief Executive Officer of RELX Group since November 2009. Joined the Group as Chief Executive Officer of Elsevier in 2004. Other appointments: Non-Executive Director of Smith & Nephew plc. Past appointments:Prior to joining the Group was a partner at General Atlantic Partners. Before that was President and Chief Operating Officer of Random House Inc and President and Chief Executive Officer of Bantam Doubleday Dell, North America. Began his career as a consultant with McKinsey. Served as a Non-Executive Director of Eniro AB and Svenska Cellulosa Aktiebolaget SCA. Education:Holds a BSc from Stockholm School of Economics, an MSc from the Royal Institute of Technology in Stockholm, and gained an MBA from Harvard Business School as a Fulbright Scholar. Nationality: Swedish | | | | Chairman Appointed: June 2009 Other appointments: Chairman of: Court of the Bank of England and Preqin Holding Limited. Past appointments: Previously was Chairman of Whitbread plc, Bunzl plc, Mölnlycke Health Care Limited and Norwich Research Partners LLP and served as Chief Executive of Bunzl plc, Chief Executive of Tootal Group plc and a Director of The Boston Consulting Group. Formerly Non-Executive Director of Geest plc, Marks and Spencer plc, National Westminster Bank plc, Powergen plc, SVG Capital plc, and Norfolk and Norwich University Hospitals Trust. Education: Holds an MA in Economics from Cambridge University, an MS in Industrial Administration from Carnegie Mellon University and an Honorary Doctorate of Civil Law from the University of East Anglia. He is a visiting Fellow at Oxford University. Nationality: British | | | | Non-Executive Director Senior Independent Director Chairman of the Remuneration Committee Appointed:April 2013 Other appointments:Chairman of FirstGroup plc and a Non-Executive Director of Associated British Foods plc. Past appointments:Chief Executive Officer of Intertek Group plc from 2005 until 2015. Prior to that he was Chief Executive Officer of TÜV Sud AG between 1998 and 2002 and Chief Executive Officer of TÜV Product Service GmbH for ten years. Formerly a Non-Executive Director of Logica plc. Education: Holds a master’s degree in Medicine from Ludwig-Maximilian-University Munich and a Medical Doctorate from Technical University Munich. Nationality:German | | |
| | | | | | | | | | | | | | | | |
| | | | | | | | | | | | | | | | |
 | | | |  | | | |  | | |
Nick Luff (50) Chief Financial Officer | | | | | | Robert MacLeod (53) Non-Executive Director | |  | | | | Carol Mills (64) Non-Executive Director | |  | | |
Appointed:September 2014 Past appointments:Prior to joining the Group was Group Finance Director of Centrica plc from 2007. Before that was Chief Financial Officer at The Peninsular & Oriental Steam Navigation Company (P&O) and its affiliated companies, having previously held a number of senior finance roles at P&O. Began his career as an accountant with KPMG. Formerly a Non-Executive Director of QinetiQ Group plc and Lloyds Banking Group plc. Education:Has a degree in Mathematics from Oxford University and is a qualified UK Chartered Accountant. Nationality:British | | | | Appointed:April 2016 Other appointments:Chief Executive of Johnson Matthey Plc. Past appointments:Prior to joining Johnson Matthey, spent five years as Group Finance Director of WS Atkins plc, having joined as Group Financial Controller in 2003. From 1993 to 2002, held a variety of senior finance and M&A roles with Enterprise Oil plc in the UK and US. Formerly a Non-Executive Director of Aggreko plc. Nationality:British | | | | Appointed:April 2016 Other appointments:Independent Director of Zynga Inc. Past appointments:A member of the Boards of Adobe Systems, Alaska Communications, Tekelec Corporation, Blue Coat Systems, Xactly Corporation, WhiteHat Security and Ingram Micro. From 2004 to 2006, was Executive Vice President and General Manager of the Infrastructure Products Group at Juniper Networks. From 1998 to 2002 was Chief Executive Officer of Acta Technology, and before Acta, spent 16 years at Hewlett-Packard in a number of executive roles. Nationality:American | | |
| | |
| Governance Board Directors | | 67 |
|
|
| | | | | | | | |
 | | | |  | | | |  |
| Adrian Hennah (60) | | | | Marike van Lier Lels (58) | | | | Suzanne Wood (57) |
Non-Executive Director Appointed:April 2011 Other appointments:Chief Financial Officer of Reckitt Benckiser Group plc. Past appointments:Chief Financial Officer of Smith & Nephew plc from 2006 to 2012. Before that was Chief Financial Officer of Invensys plc, having previously held various senior finance and management positions with GlaxoSmithKline for 18 years. Formerly, a Non-Executive Director of Indivior PLC. Nationality:British | | | | Non-Executive Director Appointed:RELX NV, January 2010 RELX PLC and RELX Group plc, July 2015. Other appointments:Member of the Supervisory Boards of TKH Group NV, Eneco Holding NV and NS (Dutch Railways), and a member of the Executive Committee of Aegon Association. Past appointments:Member of the Supervisory Boards of Royal Imtech NV, Maersk BV, KPN NV and USG People NV, and Executive Vice President and Chief Operating Officer of the Schiphol Group. Prior to joining Schiphol Group, was a member of the Executive Board of Deutsche Post Euro Express and held various senior positions with Nedlloyd. Member of various Dutch governmental advisory boards. Nationality:Dutch | | | | Non-Executive Director Appointed:September 2017 Other appointments: Group Finance Director of Ashtead Group plc. Past appointments: Chief Financial Officer of Ashtead Group’s largest subsidiary, Sunbelt Rentals Inc, from 2003 until 2012. Previously, she also served as Chief Financial Officer of two US publicly-listed companies, Oakwood Homes Corporation and Tultex Corporation. Nationality: American |
| | | | | | | | |
 | | | |  | | | | |
Linda Sanford (65)   Non-Executive Director | | | | Ben van der Veer (66)  Non-Executive Director Chairman of the Audit Committees | | | | |
Appointed:December 2012 Other appointments:An independent Director of Consolidated Edison, Inc, Pitney Bowes, Inc and ION Trading UK Limited, and a consultant to The Carlyle Group. Serves on the board of trustees of the New York Hall of Science. Past appointments:Senior Vice President, Enterprise Transformation, IBM Corporation until 2014, having joined the company in 1975. Formerly a Non-Executive Director of ITT Corporation, served on the boards of directors of The Business Council of New York State and the Partnership for New York City, and on the boards of trustees of the State University of New York, St John’s University and Rensselaer Polytechnic Institute. Nationality: American | | | | Appointed:September 2009 Other appointments:Member of the Supervisory Boards of Aegon NV and Koninklijke FrieslandCampina NV. Past appointments:Chairman of the Executive Board of KPMG in the Netherlands and a member of the Management Committee of the KPMG International board until his retirement in 2008, having joined KPMG in 1976. Formerly a member of the Supervisory Boards of Royal Imtech NV, Siemens Nederland NV and Tom Tom NV. Nationality:Dutch | | | | Board Committee membership key  Audit Committees Audit Committees
Remuneration Committee  Nominations Committee Nominations Committee
Corporate Governance Committee  Committee Chairman Committee Chairman
All of the Directors are directors of RELX Group plc, RELX PLC and RELX NV. |

| | |
| 68 | | RELX Group Annual reports and financial statements 2017 |
|
|
RELX Group Business Leaders
Senior Business Executives

| | | | | | | | | | | | |
Ron Mobed Chief Executive Officer Scientific, Technical & Medical | | | | Mark Kelsey Chief Executive Officer Risk & Business Analytics | | | | Chet Burchett Chief Executive Officer Exhibitions | | | | Mike Walsh Chief Executive Officer Legal |
| | | | | | | | | | | | |
Joined in 2011. Appointed to current position in 2012. | | | | Joined in 1989. Appointed CEO Business Information in 2010 and CEO Risk Solutions in 2012. | | | | Joined in 2004. Appointed to current position in 2015. | | | | Joined in 2003. Appointed to current position in 2011. |
| | | | | | |
| Previously President of Cengage Learning’s Academic & Professional Group and Co-President and Co-Chief Operating Officer with information services company IHS. Holds a degree from Trinity College, Cambridge, and a master’s degree from Imperial College, London. | | | | Has held a number of senior positions across the Group over the past 30 years. Studied at Liverpool University and received his MBA from Bradford University. | | | | Previously President of the Americas for Reed Exhibitions. Prior to that was President and Chief Executive Officer, USA, for Burson-Marsteller, a leading global public relations agency. Holds a degree from Baylor University. | | | | Previously CEO of LexisNexis US Legal Markets and Director of Strategic Business Development Home Depot. Prior to that was a practising attorney at Weil, Gotshal and Manges in Washington DC and served as a consultant with The Boston Consulting Group. Holds a Juris Doctor degree from Harvard Law School and is a graduate of Yale University. |
| | |
| Governance RELX Group Business Leaders | | 69 |
|
|
Corporate Executives

| | | | | | | | | | | | | | | | |
Kumsal Bayazit Chairwoman, RELX Technology Forum and President, Exhibitions Europe | | | | Youngsuk “YS” Chi Director of RELX Corporate Affairs and Chairman Elsevier | | | | Gunjan Aggarwal Chief Human Resources Officer | | | | Henry Udow Chief Legal Officer and Company Secretary | | | | Andrew Matuch Chief Strategy Officer |
| | | | | | | | | | | | | | | | |
| | | | | | | | |
| Joined in 2004. Appointed to current position in 2016. | | | | Joined in 2005. Appointed to current position in 2011. | | | | Joined in 2017. Appointed to current position at that time. | | | | Joined in 2011. Appointed to current position at that time. | | | | Joined in 2012. Appointed to current position in 2016. |
| | | | | | | | |
| Previously Chief Strategy Officer, RELX Group, and Executive Vice President of Global Strategy and Business Development for LexisNexis Legal & Professional. Prior to that worked with Bain & Company in New York, Los Angeles, Johannesburg and Sydney. Holds an MBA from Harvard Business School and is a Graduate of the University of California at Berkeley. | | | | Previously was President and Chief Operating Officer of Random House, founding Chairman of Random House Asia and Chief Operating Officer for Ingram Book Group. Holds an MBA from Columbia University and is a graduate of Princeton University. | | | | Previously head of Human Resources for Ericsson’s global media business based in Santa Clara, Silicon Valley and before that head of Human Resources for Ericsson North America. Career includes a number of Human Resources positions in Asia, Europe and North America at Unilever and Novartis. Holds an MBA from Xavier School of Management, Jamshedpur, India, and is a graduate from JMI Institute of Technology. | | | | Previously Chief Legal Officer and Company Secretary of Cadbury plc having spent 23 years working with the company. Prior to that worked at Shearman & Sterling in New York and London. Holds a Juris Doctor degree from the University of Michigan Law School and a bachelor’s degree from the University of Rochester. | | | | Previously was Executive Vice President Global Strategy and Business Development for LexisNexis Legal and Professional. Prior to that was a partner at OC&C Strategy Consultants. Holds an MBA from Harvard Business School and a bachelor’s degree from Williams College. |
| | |
70 | | RELX Group Annual reports and financial statements 2017 |
Chairman’s introduction to Corporate Governance
The Boards remain committed to maintaining high standards of corporate governance, and also to its simplification by removing complexity from our structure and processes, and in doing so increasing transparency.
Our governance framework
I am pleased to present our Corporate Governance Report for 2017.
The role of the Boards is to provide effective leadership for the Group, and to oversee our strategy and the management of risks to its delivery. This report sets out how the Boards performed these functions. It summarises their principal activities and those of the Committees during the year. It also explains in more detail the Group’s corporate governance arrangements, and provides an explanation of how both RELX PLC and RELX NV (the Companies), have applied the main principles of the 2016 UK Corporate Governance Code (the Code) during the year. To find information on the application of the Dutch Corporate Governance Code 2016 by RELX NV, please see the Corporate Governance Statement of RELX NV which is available on our website,www.relx.com
The Boards remain committed to maintaining high standards of corporate governance across the Group, which they view as essential to delivering long-term success and protecting shareholder value. With this in mind, I am pleased to report that the Companies complied with each of the provisions of the Code in 2017. The Boards are also committed to the simplification of the Group’s governance arrangements by removing complexity from our structure and processes, and in doing so increasing transparency. The Boards are, therefore, proposing to shareholders to move from our current dual parent holding company structure to a single parent company. These changes are described in more detail in the Chairman’s Statement on page 3.
As part of their leadership role, the Boards are responsible for developing a culture of appropriate behaviour within RELX Group. Therefore, they have established comprehensive systems of corporate governance, which include policies and procedures that promote corporate responsibility, transparency and accountability. Central to these policies is the Group’s Code of Ethics and Business Conduct, which sets out clearly the standards expected for corporate and individual behaviour. The Code of Ethics and Business Conduct applies to all Directors and employees of the Group, and is available on our website atwww.relx.com. More information on its application can be found in the Corporate Responsibility section on page 45.
The Group’s securities are listed in the UK, US and the Netherlands and therefore the Companies are subject to applicable corporate governance requirements of those jurisdictions. These requirements, which are continually evolving, are reviewed and monitored by the Corporate Governance Committee. The Boards delegate a number of other responsibilities to their Committees, to enable them to carry out their functions effectively. The Boards’ Committee structure is set out on page 72.
Board changes and succession
During the year, the Nominations Committee continued to keep the composition of the Boards and their committees under review to ensure their composition remained appropriate. I am pleased to report that Suzanne Wood, Chief Financial Officer of Ashtead Group plc, joined the Boards as a Non-Executive Director in September 2017. Looking ahead, Ben van der Veer will step down as Chairman of the Audit Committees in April 2018 and Adrian Hennah will be appointed as his replacement. I would like to welcome Suzanne to the Boards and thank Ben for his significant contribution during his eight years as Chairman of the Audit Committees.
As a consequence, the composition of the Boards’ Committees was also reviewed by the Nominations Committee, with a small number of other changes being made to their membership. The Nominations Committee will continue to monitor Board and Committee composition and review succession planning arrangements on an ongoing basis.
Biographical details of each of the Directors are set out on pages 66 and 67. The membership of the Boards’ Committees as at 31 December 2017 can also be found on pages 66 and 67.
Board Evaluation and Effectiveness
As Chairman, I am also responsible for ensuring that the effectiveness of the Boards, their Committees and the individual Directors are evaluated annually. An externally facilitated evaluation was last undertaken in 2014/15. Therefore, in accordance with the Code, the Corporate Governance Committee appointed an external facilitator, Lorna Parker, to conduct an independent effectiveness review for 2017/18. Details of the review, which confirmed that the Boards and their Committees continue to function effectively, and each Director continues to be effective and to demonstrate commitment to their roles, are set out on page 77.
Having reviewed the results of the review, and taking into account the changes made to the Boards and Committees during the year, I believe that the Boards and their Committees continue to operate effectively, and have an appropriate balance of skills, experience, independence, knowledge of the Group and diversity to ensure that they continue to do so.
I also remain satisfied that the Non-Executive Directors have sufficient time to undertake their roles.
Therefore, on the recommendation of the Nominations Committee, all Directors will stand for election or re-election at the Annual General Meetings in 2018.
Sir Anthony Habgood
Chairman
14 February 2018
| | |
| Governance Corporate Governance Review | | 71 |
|
|
Corporate Governance Review
Overview
Corporate structure
RELX PLC is a publicly-listed holding company with its shares traded on the London and New York stock exchanges. Its principal asset is the shares that it owns in RELX Group plc, which represent 52.9% of the outstanding shares of RELX Group plc.
RELX NV is a publicly-listed holding company with its shares traded on the Euronext Amsterdam and New York stock exchanges. Its principal asset is the shares that it owns in RELX Group plc, which represent 47.1% of the outstanding shares of RELX Group plc.
RELX Group plc holds all of the operating businesses, subsidiaries and financing activities of the Group. The Group’s corporate structure is shown below:
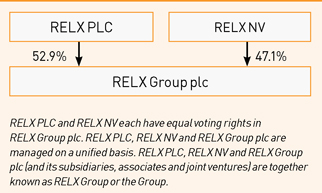
In 2013, RELX NV adopted a unitary Board structure. In 2015, we implemented a number of significant steps to simplify and modernise our corporate structure, which resulted in all of our businesses being owned by one company, RELX Group plc, with consolidated accounts, all share listings having a 1 to 1 equalisation ratio and the membership of the Boards being fully aligned. In 2016, the dividends between the shareholders of the two parent companies were fully equalised.
Approach to corporate governance
The Boards of RELX PLC and RELX NV have implemented standards of corporate governance and disclosure policies applicable to companies listed on the London, Amsterdam and New York stock exchanges. The effect of this is that a standard applying to one will, where not in conflict, also be observed by the other.
In 2016, revised versions of the UK Corporate Governance Code (the UK Code) and the Dutch Corporate Governance Code (the Dutch Code) were published by the UK Financial Reporting Council (FRC) and the Dutch Monitoring Committee respectively, with the UK Code applying to RELX PLC and the Dutch Code applying to RELX NV from 1 January 2017. The Boards of RELX PLC and RELX NV support the principles of corporate governance set out in the revised codes.
Corporate governance compliance and statements
|
RELX PLC, which has its primary listing on the main market of the London Stock Exchange, has complied with the provisions of the UK Code during the year ended 31 December 2017. RELX NV, which has its primary listing on the Euronext Amsterdam Stock Exchange, has also complied throughout the year with the UK Code. A description of how both RELX PLC and RELX NV have applied the main principles of the UK Code is set out on pages 72 to 80. A copy of the UK Code can be found on the FRC website at www.frc.org.uk www.frc.org.uk For information on the application of the Dutch Code by RELX NV, please see the Corporate Governance Statement of RELX NV which is available on our website,www.relx.com |
The Directors of RELX PLC and RELX NV are required by the UK Code to make certain statements in relation to provisions contained in the UK Code. The locations of those statements are as follows:
| ◾ | | Page 2 to 63 for the Strategic Report explaining the Group’s business model and the strategy for delivering the objectives of the Group |
| ◾ | | Page 60 for confirmation that the Directors have carried out a robust assessment of the principal risks facing the Group, including those that would threaten its business model, future performance, solvency or liquidity |
| ◾ | | Page 79 for confirmation that the Annual Report and Accounts is fair, balanced and understandable and provides the information necessary for shareholders to assess the Group’s position and performance, business model and strategy |
| ◾ | | Page 80 for an explanation of how the Directors have assessed the prospects of the Group, taking into account the Group’s current position and its principal risks |
| ◾ | | Page 79 for the statement on the status of the Group as a going concern |
| | |
72 | | RELX Group Annual reports and financial statements 2017 |
Application of UK Corporate Governance Code Principles
Leadership
Role of the Boards and its Committees
The Boards of RELX PLC, RELX NV and RELX Group plc (the Boards), which are managed on a unified basis, are responsible for providing leadership of the Group within a framework of appropriate and effective controls that enable risk to be assessed, and then managed in a manner which promotes the success of the Group. The Boards are also responsible for overseeing the Group’s strategy and performance, financial reporting, internal control and risk management framework, and corporate governance processes.
Their oversight role is implemented on a day-to-day basis through the operation of a framework of responsibilities and delegated authorities. There is a schedule of matters reserved for the approval of the Boards, which generally includes those matters that are considered material to the current or future financial performance of the Group. These include matters such as the approval of material acquisitions, major capital expenditure, Group strategy and budgets, the Group’s financial statements and its dividend policy. In order to allow the Boards sufficient time to give these matters due attention, a number of other responsibilities have been delegated to four principal Board Committees.
These are set out in the Terms of Reference for each Committee which can be found on our website at www.relx.com. The membership and activities of these Committees are described on pages 81, 83 and 103.
There are additionally a number of approved delegated authorities in place from the Boards to the Chief Executive Officer and other senior executives which relate principally to the day-to-day management of the business.
Chairman and Chief Executive – division of responsibilities
There is a clear separation of the roles of the Chairman, who leads the Boards, and the Chief Executive Officer, who is responsible for the day-to-day management of the Group, which are set out in writing. The adjacent table illustrates the key responsibilities of the Directors. This division of responsibilities, in addition to the schedule of matters reserved for the Boards and Terms of Reference for each Committee, ensures that there are appropriate controls in place to prevent any individual from having unfettered powers of decision.
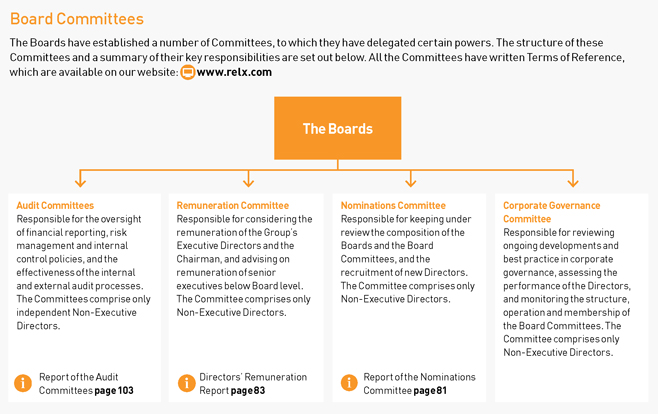
| | |
| Governance Corporate Governance Review | | 73 |
|
|
|
Roles of the Directors Chairman ◾ Provides leadership of the Boards, ensuring that they function effectively ◾ Ensures that all Directors are sufficiently appraised of matters to make informed judgements, through the provision of accurate, timely and clear information ◾ Promotes high standards of corporate governance ◾ Sets the agenda and chairs meetings of the Boards ◾ Chairs the Nominations and Corporate Governance Committees ◾ Facilitates the effective contribution of all of the Directors ◾ Ensures effective dialogue with shareholders ◾ Ensures the performance of the Boards is assessed annually ◾ Ensures effective induction and development of Directors Chief Executive Officer ◾ Day-to-day management of the Group ◾ Develops and ensures implementation of the Group’s strategy and commercial objectives ◾ Ensures that the decisions of the Boards are implemented ◾ Promotes high standards of corporate governance ◾ Informs and advises the Chairman and Nominations Committee on executive succession planning ◾ Leads communication with shareholders Chief Financial Officer ◾ Day-to-day management of the Group’s financial affairs ◾ Ensures that a robust system of internal control and risk management is in place ◾ Maintains high-quality reporting of financial and environmental performance internally and externally ◾ Supports the Chief Executive Officer in developing and implementing strategy Senior Independent Director ◾ Leads the Boards’ annual assessment of the performance of the Chairman ◾ Available to meet with shareholders on matters where usual channels are deemed inappropriate ◾ Deputises for the Chairman, as necessary ◾ Serves as a sounding board for the Chairman and acts as an intermediary between the other Directors, when necessary Non-Executive Directors ◾ Constructively challenge and provide advice to the Executive Directors ◾ Effectively contribute to the development of strategy ◾ Scrutinise the performance of management in meeting agreed goals and monitor the delivery of the Group’s strategy ◾ Serve as members of Board Committees and chair the Audit and Remuneration Committees |
Effectiveness
Board composition
The Boards of RELX PLC, RELX NV and RELX Group plc are unitary boards and are comprised of the same Directors. In order for the Boards to discharge their duties and responsibilities effectively, they have an appropriate balance of skills, experience, independence and knowledge of the Group. The Nominations Committee reviews, on an ongoing basis, the composition of the Boards and their committees to ensure that balance remains appropriate.
The name of each Director, their role on the Boards and their biographical details as at the date of this report appear on pages 66 to 67. The Boards currently comprise the Chairman, two Executive Directors and eight independent Non-Executive Directors, who bring a wide range of skills and experience to their roles. A profile which identifies the skills and experience of each Director is available on our website at www.relx.com. A summary of the balance of skills of the Non-Executive Directors can be found on page 74.
The Nominations Committee and the Boards also consider diversity, including gender, length of tenure and nationality as important factors when reviewing the composition of the Boards. A summary of these can be found on page 74. Currently, 36% of the Boards are made up of women, compared to the Group’s target of 30%.

| | |
| 74 | | RELX Group Annual reports and financial statements 2017 |
|
|
Balance of our Boards
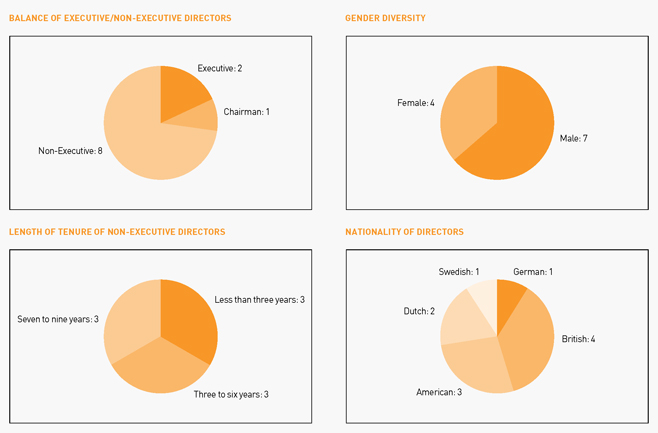
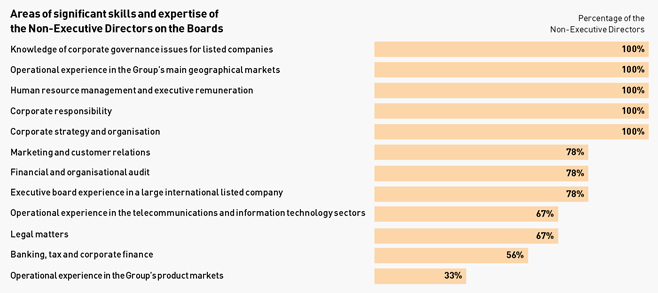
| | |
| Governance Corporate Governance Review | | 75 |
|
|
Key activities of the Boards
The Boards meet regularly throughout the year and, in 2017, held seven scheduled meetings. The Boards’ schedule ensures that all relevant matters are considered during those meetings. The Boards’ schedule is set by the Chairman, with support from the relevant Company Secretary. Additionally, throughout the year, the Non-Executive Directors meet without the Executive Directors present on a regular basis.
In 2017, the Board considered the following:
| | | | | | |
Business and Financial Performance ◾ Reports from the Chief Executive Officer and Chief Financial Officer on the Group’s actual and forecasted operational and financial performance ◾ Annual and Interim Financial Results ◾ Annual Review of Invested Capital | | Strategy, Business and Functional Reviews ◾ Strategy and business presentations, including two full-day strategy reviews ◾ Budgets and Annual Strategy Plan 2017-2020 ◾ Updates on major acquisitions, investments and disposals ◾ Capital Structure and Funding requirements | | Risk, Legal, Governance and Regulatory Matters ◾ The Group’s principal risks and ongoing monitoring of risk management and internal control ◾ The Group’s Operating and Governance Principles ◾ Board succession and executive talent management ◾ Appointments and re-appointments to the Boards and appointment to Boards’ Committees ◾ Litigation update ◾ Reports from the Committee Chairmen on the key activities of the Boards Committees ◾ The Terms of Reference for each Board Committee | | Shareholders ◾ Investor Relations activities ◾ Dividend declarations and policy ◾ Share buyback programme ◾ Approval of shareholder communications, such as the Annual Report and Notice of General Meetings |
Independence of the Non-Executive Directors
The Boards review the independence of the Non-Executive Directors every year, based on the criteria as set out in the UK Code. In accordance with the UK Code, the independence criteria are not applied in respect of the Chairman after his appointment. Notwithstanding this, Sir Anthony Habgood met the independence criteria contained in the UK Code when he was appointed Chairman in 2009. The Boards consider all Non-Executive Directors (other than the Chairman) to be independent of management and free from any business or other relationship which could materially interfere with their ability to exercise independent judgement. The membership of the Audit, Remuneration and Nominations Committees also meet the independence criteria under the Code.
Succession planning
The Nominations Committee regularly reviews the composition of the Boards and the status of succession plans. The Boards are updated annually on senior management succession planning, and during the year, they received a detailed presentation from the Chief Human Resources Officer on the first three tiers of management below the Chief Executive Officer. Directors also have regular contact with succession candidates for senior and executive management positions.
Board appointments
RELX PLC and RELX NV shareholders maintain their rights to appoint individuals to their respective Boards in accordance with the provisions of the articles of association of these companies. However, no individual may be appointed to the Boards unless recommended by the joint Nominations Committee. Members of that Committee abstain when their own re-appointment is being considered.
As a general rule, letters of appointment for Non-Executive Directors provide that, subject to annual re-election by shareholders, individuals will serve for an initial period of three years, and are typically expected to be available to serve for a second three-year period, if invited to do so. They may also be invited to serve for a third period of three years. The Non-Executive Directors’ letters of appointment set out the expected time commitment required by the Company to fulfil their duties. The notice period applicable to the Non-Executive Directors is one month. The notice period applicable to the service contracts of the Executive Directors is 12 months. Details of the terms of appointment and the remuneration of both Executive and Non-Executive Directors are set out in the Directors’ Remuneration Report, on pages 83 to 95.
| | |
| 76 | | RELX Group Annual reports and financial statements 2017 |
|
|
In compliance with the UK Code, all Directors seek re-election by shareholders annually, except for those Directors retiring immediately after the respective Annual General Meetings.
Board and Committee changes
Changes during the year in the composition of the Boards and Board Committees are set out in the table on page 77.
The ongoing evolution of the Boards continued in 2017, with Suzanne Wood appointed as an independent Non-Executive Director. Ms Wood was also appointed as a member of the Audit Committees, which will benefit from her significant financial experience at Board level in publicly-listed companies, both in the UK and US.
Following a review of the composition of the Boards’ Committees in anticipation of Ms Wood’s appointment to the Audit Committees, the Boards accepted a recommendation from the Nominations Committee that with effect from 26 September 2017: (i) Linda Sanford join the Remuneration Committee and step down from the Audit Committees; and (ii) Carol Mills step down from the Remuneration Committee and remain on the Audit Committees.
In accordance with the articles of association of RELX PLC, Directors are normally subject to election by shareholders at the first Annual General Meeting following their appointment to the Board. Therefore, Ms Wood will stand for election by shareholders at the 2018 RELX PLC Annual General Meeting.
In accordance with the UK Code, all other Directors will retire from the Board of RELX PLC at the Annual General Meeting and will offer themselves for re-election. All Directors of RELX NV, including Ms Wood who was appointed by shareholders in September 2017, will retire from the RELX NV Board at the 2018 Annual General Meeting and will offer themselves for re-appointment. Based on the results of an independent external evaluation of the Boards, their Committees and each Director seeking re-election at the 2018 Annual General Meeting, the Boards have accepted a recommendation from the Nominations Committee that each of those Directors be proposed for re-election at the 2018 Annual General Meeting of the respective companies. Details of the independent external evaluation of the Boards completed in respect of 2017/18 are set out on page 77.
Board induction and development
The Chairman and the Company Secretary are responsible for ensuring that an effective induction programme takes place for all new Directors. Following appointment and as required, all Directors receive a full, formal and tailored induction, which is designed to meet their individual needs based on their knowledge and experience. This includes the provision of a comprehensive briefing pack which contains information on the Group’s businesses, as well as other relevant information to assist that Director in performing their duties.
Upon joining the Boards as a Non-Executive Director in September 2017, an induction programme for Ms Wood was designed taking into account her previous knowledge and experience and the role that she was being asked to undertake for RELX Group. This included meetings with the leadership teams of the main business operating units, and also with the Chief Strategy Officer, in order to enhance and deepen her understanding of RELX Group, its businesses and the competitive environment in which it operates. She also received presentations from the Group’s key corporate functions, including Finance and Internal Audit & Risk Management, and from a number of the Group’s principal external advisers. Given her first-time appointment to the Board of a Dutch-listed company, Ms Wood was provided with an in-depth briefing on her duties as a Director under Dutch law. She further undertook a comprehensive Audit Committee programme including a briefing from the external auditor, designed to ensure familiarisation with the Committee’s oversight responsibilities.
To ensure that the Directors continually update their skills, knowledge and familiarity with the Group, they attend meetings in addition to scheduled Board and Committee meetings and participate in site visits. Additionally, Non-Executive Directors also have opportunities to meet RELX Group Business Leaders and other senior executives. As part of the annual Board evaluation, Directors are invited to discuss with the Chairman their training and development needs.
Board information and support
All Directors have complete and timely access to the information required to discharge their responsibilities fully and effectively. They have access to the services of the respective Company Secretaries, who are responsible for the accurate and timely flow of information to the Boards and advising the Chairman on all corporate governance matters. The Company Secretary of each Board attends all of its meetings. The Directors also have access to other members of the Group’s management, staff and external advisers, and may take independent professional advice in the furtherance of their duties, at the relevant company’s expense.
Each of the Directors is expected to attend all meetings of the Board and Committees of which they are a member. Where a Director is unable to attend a Board or Committee meeting, they are provided with the papers relating to that meeting and are able to discuss issues arising with the respective chairman and other Board and Committee members. They are also provided with a copy of the meeting minutes.
| | |
| Governance Corporate Governance Review | | 77 |
|
|
Attendance at meetings of the Boards and Board Committees
The table below shows the attendance of Directors at meetings of the Boards and the Board Committees during the year.
Attendance is expressed as the number of meetings attended out of the number eligible to be attended.
| | | | | | | | | | | | | | | | | | | | | | | | | | | | | | |
| Director | | Committee appointments | | | Boards (1) | | | Audit | | | Remuneration | | | Nominations | | | Corporate Governance | | | | | | |
Anthony Habgood (Chairman) | | | | | | | 7/7 | | | | – | | | | 3/3 | | | | 3/3 | | | | 5/5 | | | | | | | |
Erik Engstrom | | | – | | | | 7/7 | | | | – | | | | – | | | | – | | | | – | | | | | | | |
Nick Luff | | | – | | | | 7/7 | | | | – | | | | – | | | | – | | | | – | | | | | | | |
Wolfhart Hauser | | |  | | | | 7/7 | | | | – | | | | 3/3 | | | | 3/3 | | | | 5/5 | | | | | | | |
Adrian Hennah | | | | | | | 7/7 | | | | 3/4 | (5) | | | – | | | | – | | | | 5/5 | | | Board Committee | |
Marike van Lier Lels | | | | | | | 7/7 | | | | 4/4 | | | | – | | | | – | | | | 5/5 | | | membership key | |
Robert MacLeod | | |  | | | | 7/7 | | | | – | | | | 3/3 | | | | – | | | | 5/5 | | | | | | Audit | |
Carol Mills(2) | | |  | | | | 7/7 | | | | 4/4 | | | | 1/1 | | | | – | | | | 5/5 | | | | | | Remuneration | |
Linda Sanford(3) | | | | | | | 7/7 | | | | 3/3 | | | | 2/2 | | | | – | | | | 5/5 | | | | | | Nominations | |
Ben van der Veer | | |  | | | | 7/7 | | | | 4/4 | | | | – | | | | 3/3 | | | | 5/5 | | | | | | Corporate Governance | |
Suzanne Wood(4) | | | | | | | 3/3 | | | | 1/1 | | | | – | | | | – | | | | 2/2 | | | | | | Committee Chairman | |
| (1) | The Boards of RELX PLC, RELX NV and RELX Group plc. In addition to the seven scheduled meetings above, in 2017 serving Directors attended two full-day strategy and business review meetings. |
| (2) | Ms Mills stepped down as a member of the Remuneration Committee with effect from 26 September 2017. |
| (3) | Ms Sanford joined the Remuneration Committee and stepped down as a member of the Audit Committees, both with effect from 26 September 2017. |
| (4) | Ms Wood was appointed as a Non-Executive Director of the Boards and as a member of the Audit Committees with effect from 26 September 2017. |
| (5) | Mr Hennah was unable to attend the February meetings of the Audit Committees due to an unexpected conflict which arose at short notice. He was provided with the papers in advance of the meeting for his review and comment (which was provided to the Audit Committee Chairman), and subsequent to the meeting taking place was provided with a copy of the minutes. |
Board evaluation
The Directors consider the evaluation of the Boards, its Committees and members to be an important aspect of corporate governance. In 2017, the Corporate Governance Committee appointed an external facilitator to carry out an independent effectiveness review of the Boards, their Committees and each Director. The facilitator was Lorna Parker, an independent practitioner with no other connection to the Group. Ms Parker’s review took the form of structured interviews with Directors and the Company Secretaries, supported by individual questionnaires completed by all participants. Access to Board and Committee papers for the prior 12 months was provided to Ms. Parker.
The review explored the following key areas:
| ◾ | | Board performance and effectiveness of decision-making |
| ◾ | | Board composition and succession planning |
| ◾ | | Talent management and executive succession leadership |
| ◾ | | Risk management, corporate governance and compliance |
| ◾ | | Agenda planning and quality of information provided by management |
| ◾ | | Committee effectiveness |
The principal findings and recommendations from the evaluation were discussed with the Chairman and Senior Independent Director, following which they were presented to a meeting of the Boards.
The review of the performance of the Chairman of the Boards was led by the Senior Independent Director. The Chairman was not present during discussion among the Non-Executive Directors relating to his performance. The conclusions of the review were subsequently considered at a meeting of the Boards.
|
Conclusions of the 2017 review The review confirmed that the Boards are functioning effectively, underpinned by an appropriate blend of experience, skills, gender and nationality, and an efficient and thorough operating style led by the Chairman and Chief Executive Officer. It further confirmed that the Directors continue to be appropriately involved in key decisions taken by the Group, monitoring the performance of the Group and developing the Group’s strategy, and that a sound decision-making process is in place which takes account of feedback and challenge provided by the Non-Executive Directors. An engaged and respectful atmosphere exists where openness and debate are encouraged in Board discussions. There continued to be clarity and alignment around strategy and the key risks and challenges facing the Group. In line with evolving best practice Corporate Governance, in 2018 an area of increased focus for the Boards will be the Group’s culture and values. Additionally, the Board and their Committees will also focus on the revised UK Corporate Governance Code, currently expected to be published in 2018. Based on the findings of the review, the Corporate Governance Committee concluded that the Boards and their Committees function effectively and collaboratively and with an appropriate level of engagement with management. The Committee also concluded that the performance of each Director continues to be effective and that they demonstrate commitment to their respective roles. |
| | |
| 78 | | RELX Group Annual reports and financial statements 2017 |
|
|
Accountability
Internal control and risk management
RELX Group has established internal controls and risk management practices that are embedded into the operations of the businesses, based on the Internal Control – Integrated Framework (2013) issued by the Committee of Sponsoring Organisations of the Treadway Commission (COSO). Details of the principal risks facing the Group and how these are mitigated are set out on pages 60 to 63.
Additionally, in order to provide reasonable assurance against material inaccuracies or loss, and on the effectiveness of the systems of internal control and risk management, the Group has adopted the three lines of defence assurance model shown below.
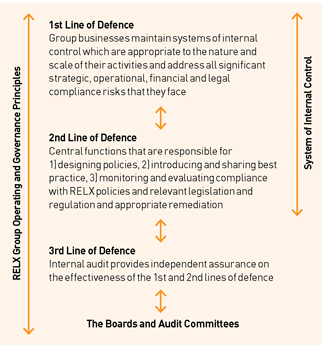
Note: In addition to the Group’s internal controls, the Group is also audited externally. The report of the external auditor has been included from pages 106 to 116.
RELX PLC and RELX NV
The Boards of RELX PLC and RELX NV have each adopted a schedule of matters which are required to be brought to them for decision. During 2017, the Boards of RELX PLC and RELX NV exercised independent supervisory roles over the activities and systems of internal control of RELX Group plc. The Boards of RELX PLC and RELX NV also approved the strategy and the annual budgets of RELX Group plc, and received regular reports on its operations, including treasury and risk management activities.
Major transactions proposed by the Board of RELX Group plc required the approval of the Boards of both RELX PLC and RELX NV. The RELX PLC and RELX NV Audit Committees met on a regular basis to review the systems of internal control and risk management of RELX Group plc.
RELX Group plc
The Board of RELX Group plc is responsible for the system of risk management and internal control of the Group and has implemented an ongoing process for identifying, assessing, monitoring and managing the principal risks faced by its businesses. This process was in place throughout the year ended 31 December 2017, and up to the date of the approvals of the Annual Reports and Financial Statements 2017. The Board monitors these systems of internal control and risk management and annually carries out a review of their effectiveness.
RELX Group plc has an established framework of procedures and internal control, with which the management of each business is required to comply. The Board has adopted a schedule of matters that are required to be brought to it for decision. The Group operates authorisation and approval processes throughout all of its operations. Access controls exist where processes have been automated to ensure the security of data. Management information systems have been developed to identify risks and to enable assessment of the effectiveness of the systems of internal control.
RELX Group plc has a Code of Ethics and Business Conduct that provides a guide for achieving its business goals and requires officers and employees to behave in an open, honest, ethical and principled manner. The Code also outlines confidential procedures enabling employees to report any concerns about compliance, or about the Group’s financial reporting practice. The Code is available on our website atwww.relx.com
Each business area has identified and evaluated its principal risks, the controls in place to manage those risks and the levels of residual risk accepted. Risk management and control procedures are embedded into the operations of the business and include the monitoring of progress in areas for improvement that come to management and Board attention.
The principal risks facing RELX Group businesses are regularly reported to and assessed by the Board and Audit Committee. With the close involvement of business management and central functions, the risk management and control procedures ensure that the Group is managing its business risks effectively and in a coordinated manner across the businesses with clarity on the respective responsibilities and interdependencies. Litigation and other legal regulatory matters are managed by legal directors in the business.
The RELX Group plc Audit Committee receives regular reports on the identification and management of principal risks, and reviews these reports. The Audit Committee also receives regular reports from both internal and external auditors on internal control and risk management matters. In addition, each business area is required, at the end of the financial year, to review the effectiveness of internal controls and risk management and report its findings on a detailed basis to the management of RELX Group plc. These reports are summarised and, as part of the annual review of effectiveness, submitted to the Audit Committee. The Chairman of the Audit Committee reports to the Board on any significant internal control matters arising.
| | |
| Governance Corporate Governance Review | | 79 |
|
|
Annual review
As part of the year-end procedures, the RELX PLC and RELX NV Audit Committees and Boards reviewed the effectiveness of the systems of internal control and risk management, during the 2017 financial year. This included consideration of risk appetite (defined as the Group’s willingness to take on risk) for each principal risk. Risk appetite is based on an assessment of the level of residual risk, taking account of inherent risk and mitigation effort. The assessment is rated, in relation to the Group’s objectives for the current level of residual risk, in three broad categories: reduce, accept and willing to extend. The level of residual risk which the Group is prepared to accept will vary, with a high level of mitigation effort over operational, financial and compliance risks. The residual risk level for external and strategic risks may be extended if doing so is in line with the Group’s strategic objectives, values and stakeholder interests and if shareholder returns could be increased. As part of the annual review, the Boards considered the Group’s culture. The objective of these systems of internal control and risk management is to manage, rather than eliminate, the risk of failure to achieve business objectives. Accordingly, they can only provide reasonable, but not absolute, assurance against material mis-statement or loss. The Boards have confirmed, subject to the above, that as regards financial reporting risks, the respective risk management and control systems provide reasonable assurance against material inaccuracies or loss and have functioned properly during the year. In accordance with the Code, the Board has also considered the Group’s long-term viability, following a robust and thorough assessment of its principal risks. The resulting Viability Statement is set out on page 80.
Responsibilities in respect of the financial statements
The Directors of RELX PLC, RELX NV and RELX Group plc are required to prepare financial statements as at the end of each financial period, in accordance with applicable law and regulations, which give a true and fair view of the state of affairs, and of the profit or loss, of the respective companies and their subsidiaries, joint ventures and associates. They are responsible for maintaining proper accounting records, for safeguarding assets, and for taking reasonable steps to prevent and detect fraud and other irregularities.
The Directors are also responsible for selecting suitable accounting policies and applying them on a consistent basis, and making judgements and estimates that are prudent and reasonable. Applicable accounting standards have been followed and the RELX Group consolidated financial statements, which are the responsibility of the Directors of RELX PLC, RELX NV and RELX Group plc, are prepared using accounting policies which comply with International Financial Reporting Standards as issued by the International Accounting Standards Board and as adopted by the European Union. Having taken into account all of the matters considered by the Boards and brought to the attention of the Boards, the Directors are satisfied that the Annual Report and Accounts, taken as a whole, is fair, balanced and understandable, and provides the information necessary for shareholders to assess the Group’s position and performance, business model and strategy.
Going concern
The Directors of RELX PLC, RELX NV and RELX Group plc, having made appropriate enquiries, consider that adequate resources exist for the Group to continue in operational existence for the foreseeable future and that, therefore, it is appropriate to adopt the going concern basis in preparing the 2017 financial statements. In reaching these conclusions, the Directors of RELX PLC, RELX NV and RELX Group plc have had due regard to the Group’s financial position as at 31 December 2017, the strong free cash flow of the Group, the Group’s ability to access capital markets and the principal risks facing the Group.
A commentary on the Group’s cash flows, financial position and liquidity for the year ended 31 December 2017 is set out in the Chief Financial Officer’s report on pages 54 to 59. This shows that after taking account of available cash resources and committed bank facilities that back up short-term borrowings, all of the Group’s borrowings that mature within the next two years can be covered. The Group’s policies on liquidity, capital management and management of risks relating to interest rate, foreign exchange and credit exposures are set out on pages 147 to 152. The principal risks facing the Group are set out on pages 60 to 63.
US certificates
As required by Section 302 of the US Sarbanes-Oxley Act 2002 and by related rules issued by the US Securities and Exchange Commission (the Commission), the Chief Executive Officer and Chief Financial Officer of RELX PLC and RELX NV certify in the respective Annual Reports 2017 on Form 20-F to be filed with the Commission that they are responsible for establishing and maintaining disclosure controls and procedures and that they have:
| ◾ | | designed such disclosure controls and procedures to ensure that material information relating to the Group is made known to them |
| ◾ | | evaluated the effectiveness of the Group’s disclosure controls and procedures |
| ◾ | | based on their evaluation, disclosed to the Audit Committees and the external auditors all significant deficiencies in the design or operation of disclosure controls and procedures and any frauds, whether or not material, that involve management or other employees who have a significant role in the Group’s internal controls |
| ◾ | | presented in the RELX Group Annual Report 2017 on Form 20-F their conclusions about the effectiveness of the disclosure controls and procedures |
A Disclosure Committee, comprising the Company Secretaries of RELX PLC and RELX NV and other senior managers of the Group, provides assurance to the Chief Executive Officer and Chief Financial Officer regarding their Section 302 certifications.
Section 404 of the US Sarbanes-Oxley Act 2002 requires the Chief Executive Officer and Chief Financial Officer of RELX PLC and RELX NV to certify in the respective Annual Reports 2017 on Form 20-F that they are responsible for maintaining adequate internal control structures and procedures for financial reporting and to conduct an assessment of their effectiveness. The conclusions of the assessment of internal control structures and financial reporting procedures, which are unqualified, are presented in the RELX Group Annual Report 2017 onForm 20-F.

| | |
| 80 | | RELX Group Annual reports and financial statements 2017 |
|
|
| | |
Viability statement | | |
Each year management develops a three-year strategy plan that reflects the expected operating environment. This plan forms the basis for Group and divisional targets. In 2017, our strategy is unchanged. Our objective is to deliver improved outcomes for professional and business customers across industries, to help them make better decisions, get better results and be more productive. We do this by leveraging a deep understanding of our customers to develop increasingly sophisticated information based analytics and decision tools which combine content and data with analytics and technology in global platforms. We aim to build leading positions in long-term global growth markets and leverage our skills, assets and resources, both to build solutions for our customers and to pursue cost efficiencies. Further details on our strategy and 2017 progress are on pages 4 and 5. Whilst management selected three years for its review and quantitative testing of the Group’s viability, reflecting the length of the annual strategy plan period, it also considered longer-term developments. The three-year strategic plan for our businesses includes management’s assessment of the anticipated operational risks affecting the business and assumes that current economic conditions broadly persist, financing will be available on similar terms to those negotiated recently and interest rates will follow market expectations. Management then considers the viability of the business should unexpected events arise. A full description of the principal risks facing our business is set out on pages 60 to 63 along with the mitigating controls. In assessing viability, a cross-functional team comprised of business unit, risk, strategy and treasury personnel estimate the quantitative impact of each individual risk on the Group’s revenue and profit. | | The analysis then considers the effect of various sets of multiple risks occurring simultaneously, combined with the inability to access the debt capital markets to refinance scheduled liabilities as they become due. Reflecting the importance of proprietary data and potential disruption or loss of data sources, we modelled the impact of a worst-case scenario assuming the invalidation of certain intellectual property rights and inability to use certain third-party information. The analysis concluded that even with the simultaneous occurrence of these risks and no access to the debt capital markets, the Group would still have sufficient funds to trade, settle its liabilities as they come due and remain compliant with its financial covenants. In addition to scenario modelling, the Directors bi-annually review the Group’s principal risks, assess the likelihood and impact of each risk together with the effectiveness of mitigating controls. The Directors also receive regular updates from management on treasury, tax, acquisitions and divestments and periodic briefings on significant risk areas including information security, technology and legal and regulatory matters. Finally, separate from the annual strategy plan, the Directors periodically receive updates from business area management on their operations, prospects and risks. Whilst these reviews and discussions naturally focus more closely on the quantifiable risks facing the business, they also cover risks that may occur outside of the three-year planning period. As a result of stress-testing the three-year strategic plan and supported by regular reviews of risk during the year, the Directors confirm that they have a reasonable expectation that the Group will be able to continue its operations and meet its liabilities as they fall due over the next three years and are not aware of any longer-term operational or strategic risks that would result in a different outcome from the three-year review. |
Shareholder engagement | | |
RELX PLC and RELX NV participate in regular dialogue with their shareholders. Each listed company reports to its shareholders through the publication of the Group’s interim and full-year reports, following which presentations are made by the Chairman, Chief Executive Officer and Chief Financial Officer on the Group’s business, and these are simultaneously webcast. In addition, quarterly trading updates are provided ahead of the Annual General Meetings of the two listed companies and towards the end of the financial year, and a conference call with investors was held following the third-quarter trading update for 2017. In addition, a teach-in focused on developments in the Exhibitions business was held for analysts and investors in November 2017, which was also made available on our website at www.relx.com The Chief Executive Officer, the Chief Financial Officer and the investor relations team meet institutional shareholders on a regular basis and the Chairman also makes himself available to major institutions as appropriate. The interim and annual results announcements and presentations, together with the trading updates, other important announcements and corporate governance documents concerning the Group, are available on our website. RELX NV has adopted a bilateral shareholder contact policy, which is also available on our website. | | The Boards of RELX PLC and RELX NV commission periodic reports on the attitudes and views of the companies’ institutional shareholders and the results are presented to the respective Boards. The Boards also receive regular updates from the Group’s Head of Investor Relations on the views of shareholders through a briefing which is a standing agenda item for all meetings of the Boards. Annual General Meetings The Annual General Meetings provide an opportunity for the Boards to communicate with individual shareholders. The Chairman, the Chief Executive Officer, the Chief Financial Officer, the Chairmen of the Board Committees, other Directors and a representative of the external auditors are available to answer questions from shareholders. Both RELX PLC and RELX NV offer electronic voting facilities in relation to proxy voting at shareholder meetings. All shareholders have an opportunity at the AGM to put questions to members of the Boards about RELX’s performance. In line with the UK Corporate Governance Code, details of proxy voting by shareholders, including votes withheld, are given at the AGM and are posted on our website following the AGM. |
| | |
| Governance Report of the Nominations Committee | | 81 |
|
|
Report of the Nominations Committee
This report has been prepared by the joint Nominations Committee of RELX PLC and RELX NV and has been approved by the respective Boards.
|
Membership The Committee comprises only Non-Executive Directors. The members of the Committee who served during the year were: ◾ Anthony Habgood (Committee Chairman) ◾ Ben van der Veer ◾ Wolfhart Hauser |
|
Responsibilities The principal role and responsibilities of the Committee are to provide assistance to the Boards by identifying individuals qualified to become Directors and recommending to the Boards the appointment of such individuals. The responsibilities of the Committee are set out in written Terms of Reference (available at www.relx.com) and include: www.relx.com) and include: ◾ to keep under review the size and composition of the Boards ◾ to develop and agree the specification for the recruitment of new Directors ◾ to procure the recruitment of new Directors ◾ to recommend to the Boards the appointment of candidates subject, where appropriate, to the approval of shareholders of RELX PLC and RELX NV ◾ to recommend Directors to serve on the Committees of the Boards, having regard to the criteria for service on each Committee as set out in the Terms of Reference for such Committees, and to recommend members to serve as the Chair of those Committees ◾ to make recommendations to the Boards in relation to the re-appointment of any non-executive Director at the conclusion of his/her specified term of office and the election or re-election of Directors at the Annual General Meetings of RELX PLC and RELX NV ◾ to review and make recommendations to the Boards in relation to any Directors’ actual or potential conflicts of interest |
Activities of the Committee
During the year, the Committee met three times and its main areas of focus were:
| ◾ | | the re-appointment of Adrian Hennah as a Non-Executive Director at the conclusion of his specified term of office |
| ◾ | | the appointment of Suzanne Wood as a Non-Executive Director |
| ◾ | | a review of the composition of the Audit and Remuneration Committees resulting in the following changes: Linda Sanford stepped down as a member of the Audit Committees and joined the Remuneration Committee; Suzanne Wood was appointed as a member of the Audit Committees; and Carol Mills stepped down as a member of the Remuneration Committee and remained a member of the Audit Committees |
| ◾ | | a review of the Committee’s Terms of Reference |
| ◾ | | succession planning for Non-Executive Directors |
| ◾ | | the recommendation to the Boards of the suitability of Directors’ external non-executive director appointments |
Composition and diversity of the Boards
The Committee seeks to ensure that the Boards and their Committees comprise an appropriate balance of skills, experience, independence, knowledge of RELX Group’s businesses, and diversity, including gender. The Committee has established a formal, rigorous and transparent procedure for the recruitment of candidates to the Boards and recommendations by the Committee are made principally on the basis of a candidate’s merit, against objective criteria and with due regard for the benefits of diversity.
The Group’s Diversity and Inclusion (D&I) Statement applies across RELX Group, including to the Boards and their Committees. The objective of the Statement is to articulate the Group’s commitment to a diverse workforce and to an environment that respects individuals and their contributions, regardless of gender, race or other characteristics, and to ensure the implementation of that commitment. The Committee takes the D&I Statement into consideration when discussing the composition of the Boards and their Committees, and any appointments or changes to them, and this helps the Committee ensure that there is an appropriate balance of skills, experience, independence and knowledge of the Group and diversity including gender, background and nationality. The results of the implementation of the D&I Statement during the year can be found within the ‘Balance of our Boards’ section set out on page 74.
The Committee recognises the benefits that diversity on the Boards can bring and has noted the recommendations set out in the Hampton-Alexander Review on improving gender balance in FTSE leadership and the Parker Report into ethnic diversity of UK Boards. The Committee will continue to monitor developments in relation to Board diversity. Details of the Group’s approach to diversity and inclusion more generally in its workforce can be found in the Corporate Responsibility Report on page 42.
| | |
| 82 | | RELX Group Annual reports and financial statements 2017 |
|
|
The Committee retained The Zygos Partnership, an independent recruitment consultancy specialising in non-executive appointments with no other connection to RELX Group, to carry out the search for a new Non-Executive Director. Following a rigorous and transparent process of assessments and interviews, the Committee recommended to the Boards that Suzanne Wood be appointed as a Non-Executive Director. The Boards accepted this recommendation and following approval by the shareholders of RELX NV, Ms Wood joined the Boards in September 2017. As part of the selection process, the Committee considered, among other things, Ms Wood’s ability to devote sufficient time to the role of Non-Executive Director, her existing external interests, and her independence as defined under the UK Code.
The charts on page 74 illustrate in more detail the composition of the Boards.
Conflicts of interest
During the year, the Committee monitored Directors’ conflicts of interest in respect of their external appointments, and undertook an annual review of these. No actual conflicts were identified. However, situations were identified which could potentially give rise to a conflict of interest, and the Boards authorised those situations and put in place appropriate procedures to manage any potential conflicts at the recommendation of the Committee. More information on conflicts of interest can be found in the RELX PLC Directors’ Report on page 168.
Director re-elections
The Committee reviewed the results of the evaluation of the effectiveness and performance of the Boards, their Committees and the individual Directors, which had been facilitated by Lorna Parker, an independent external practitioner, and overseen by the Corporate Governance Committee. Details of the 2017/18 Board evaluation can be found on page 77. Following this review, the Committee recommended that each Director on the Boards as at 31 December 2017 be put forward for election or re-election at the 2018 Annual General Meetings.
| | |
| Governance Directors’ Remuneration Report | | 83 |
|
|
Directors’ Remuneration Report
The Directors’ Remuneration Report (the Report) describes how the Group applies the principles of good governance relating to Directors’ remuneration. This Report has been prepared by the Remuneration Committee of RELX Group plc (the Committee) in accordance with the UK Corporate Governance Code, the UK Listing Rules, the Large andMedium-sized Companies and Groups (Accounts and Reports) (Amendment) Regulations 2013 (the UK Regulations) and the Dutch Corporate Governance Code (the Dutch Code).
The Report was approved by the Boards of RELX PLC, RELX NV and RELX Group plc.
Introduction from the Remuneration Committee Chairman
The attached Report reflects the annual incentives earned and the vesting outcomes for multi-year incentives granted under the remuneration policy applicable to the 2015-2017 cycle of the multi-year plans.
For 2017, underlying revenue growth was 4%. Underlying operating profit growth was 6%, and adjusted earnings per share (EPS) at constant currencies grew 7%. The performance measures used in our incentive plans (annual and multi-year) are based on adjusted figures as they provide relevant information in assessing the Group’s performance, position and cash flows. We believe that our adjusted measures track the core operational performance of the Group and how it contributes to shareholder value creation. The RELX Annual Report includes a reconciliation of adjusted measures to IFRS measures.
These results carry forward the strong financial results of the company over the preceding six years, with consistent revenue, profit and earnings per share growth. With more predictable revenues, a higher growth profile and improving returns the company continues to improve its quality of earnings. This consistent strong financial performance is reflected in good achievements against targets under the multi-year incentive plans.
2017 Outcomes
The 2017 annual incentive payments to the Executive Directors were just above target, resulting in payouts of around 69% of the maximum opportunity, which is a level that has been relatively consistent over the past seven years and is in line with the consistent annual financial progress made by the business during this time.
The2015-17 cycle of the Long Term Incentive Plan (LTIP) vested at 88.1%, with the return on invested capital (ROIC) target having been fully achieved, EPS just below the middle of the target range and total shareholder return (TSR) above the upper quartile of the sterling and euro comparator groups and just below the upper quartile for the US dollar comparator group. On average, over the three-year period, adjusted EPS growth at constant currencies was 7.6% p.a. ROIC and EPS performance in respect of the2015-17 cycle of the Bonus Investment Plan (BIP) and the Executive Share Option Scheme (ESOS) resulted in respective vesting percentages of 92.8% and 95.7% of the awards granted. These outcomes reflect the strong and consistent returns and earnings growth achieved by the business and how the challenging targets set by the Committee have been perceived by the market. Over the2015-17 period, ROIC increased from 12.8% to 13.1% while in the eight years since it was introduced as a metric into our multi-year incentives, ROIC has increased from 10.4% to 13.1%, demonstrating the Group’s commitment to improved returns.
In line with increases for the wider employee population, the Committee has approved 2018 salary increases for the Executive Directors of 2.5%.
2018 Implementation of simplified Remuneration Policy
In April 2017 our shareholders approved a new remuneration policy for Executive Directors by a vote of 95% of the shares voted. The new policy simplifies the incentive framework for Executive Directors by reducing the number of incentive plans in which they participate from four (one annual and three multi-year incentive plans) to two (one annual and one multi-year incentive plan). Accordingly, commencing with the 2018 grants, the Executive Directors will no longer receive grants under the BIP and the ESOS. A description of the Remuneration Policy as approved by RELX PLC and RELX NV shareholders at the April 2017 Annual General Meetings is included on pages 96 to 102 of this Report.
The audited sections of the Report are clearly marked.
Wolfhart Hauser
Chairman, Remuneration Committee

| | |
| 84 | | RELX Group Annual reports and financial statements 2017 |
|
|
Annual Remuneration Report
Single Total Figure of Remuneration – Executive Directors (audited)
| | | | | | | | | | | | | | | | | | | | | | | | | | | | | | | | | | | | |
| | | | | | (a) | | | (b) | | | (c) | | | (d) | | | (e) | | | (f) | | | (g) | | | (h) | |
| | | | | | | | | | | | | | | | | | Share based awards | | | Total | |
| | | | | | | | | | | | Annual | | | | | | UK statutory | | | Dutch Civil | | | UK statutory | | | Dutch Civil | |
| £’000 | | | | | Salary | | | Benefits(4) | | | incentive | | | Pension(5) | | | basis(1,3) | | | Code basis(2) | | | basis(1) | | | Code basis(2) | |
Erik Engstrom | | | 2017 | | | | 1,189 | | | | 84 | | | | 1,238 | | | | 779 | | | | 6,630 | | | | 3,522 | | | | 9,920 | | | | 6,812 | |
| | | 2016 | | | | 1,160 | | | | 73 | | | | 1,184 | | | | 847 | | | | 8,135 | | | | 3,461 | | | | 11,399 | | | | 6,725 | |
Nick Luff | | | 2017 | | | | 700 | | | | 17 | | | | 726 | | | | 204 | | | | 3,325 | | | | 2,027 | | | | 4,972 | | | | 3,674 | |
| | | | 2016 | | | | 683 | | | | 15 | | | | 697 | | | | 205 | | | | 3,903 | | | | 1,948 | | | | 5,503 | | | | 3,548 | |
| (1) | UK statutory basis (columns (e) and (g)): These figures are calculated in accordance with the methodology set out in the UK Regulations. The figure for performance-related share based awards includes share price appreciation since the date the award was granted. In the case of Erik Engstrom’s figures, the amount included that relates to share price appreciation is £4.2m for 2016 and £2.9m for 2017. For Nick Luff, the amount included that relates to share price appreciation is £1.9m for 2016 and £1.4m for 2017. |
| | The figures for 2016 in column (e) disclosed in last year’s Report were, as required by the UK Regulations, based on an estimate using prescribed average share prices and exchange rates and have been restated in this Report to reflect the actual amount vested and the actual share prices and exchange rates on the vesting dates of the2014-16 cycle of BIP, LTIP and ESOS. The vesting percentages under these plans were determined on 24 February 2017 and were in line with those disclosed on page 94 in the 2016 Remuneration Report. Using the share prices and exchange rates on the vesting dates and the actual dividend equivalents paid in respect of this cycle increased the 2016 disclosed figure by £836k for Erik Engstrom and by £529k for Nick Luff. |
| | The 2017 figures reflect the vesting of the2015-17 cycle of BIP, LTIP and ESOS. As the BIP, LTIP and ESOS vest after the approval date of this Report, the average share prices and exchange rates for the last quarter of 2017 have been used to arrive at an estimated figure under the UK statutory basis in respect of these awards. |
| (2) | Dutch Civil Code basis (columns (f) and (h)):These figures comply with the requirements of the Dutch Civil Code. The figures for share based awards comprise the multi-year incentive charges in accordance with IFRS 2 – Share based Payment. These IFRS 2 charges do not reflect the actual value received on vesting. |
| (3) | Exchange rates used for share based awards (column (e)):The exchange rates used to convert share based awards to pounds sterling are (i) for the UK statutory basis, those that applied at the vesting dates or, if vesting has not occurred at the time of sign off of this Report, the average exchange rates for the last quarter of 2017; (ii) for dividend equivalents, the actual gross pounds sterling payment; and (iii) for estimated dividend equivalents in respect of awards for which vesting has not occurred at the time of sign off of this Report and which are yet to be paid, the average exchange rates for the last quarter of 2017. |
| (4) | Benefits:Each Executive Director receives a car allowance, private medical/dental insurance and the company meets the cost of tax return preparation. |
| (5) | Pension:The figures are calculated in accordance with the methodology set out in the UK Regulations. For defined benefit schemes, in which Erik Engstrom participates, the calculation in the table is reduced by the Director’s contributions and participation fee. For Erik Engstrom both of these charges increase each year. Details of the increases are set out in the Remuneration Policy Report on page 96. Nick Luff receives a cash allowance in lieu of pension which reduced to 29% of salary effective 1 March 2017 (from 30% of salary previously) and will reduce by a further two percentage points on 1 March 2018 and 2019 respectively (down to 25% on 1 March 2019). |
| (6) | Total remuneration for Directors:This is set out in note 28 to the consolidated financial statements on pages 158 to 159. |
| | |
| Governance Directors’ Remuneration Report | | 85 |
|
|
2017 Annual Incentive
Set out below is a summary of performance against each financial measure and the resulting annual incentive payments for 2017 (payable in March 2018):
| | | | | | | | |
| Performance measure | | Relative
weighting | | Achievement vs target | | Payout as %
of salary
Erik Engstrom | | Payout as %
of salary
Nick Luff |
| Revenue | | 30% | | Revenue was £7,355m versus a target(1)of £7,363m, resulting in achievement versus target of 99.9% and a payout(2)of 98.5% of 30%. | | 29.6% | | 29.6% |
| Adjusted net profit after tax | | 30% | | Adjusted net profit after tax was £1,635m versus a target(1)of £1,624m, resulting in achievement versus target of 100.7% and a payout(2)of 107.0% of 30%. | | 32.1% | | 32.1% |
| Cash conversion | | 10% | | Cash flow was £2,192m (96% conversion) versus a target(1)of £2,117m, resulting in achievement versus target of 103.5% and a payout(2)of 135% of 10%. | | 13.5% | | 13.5% |
Key Performance Objectives
(KPOs)(3) Erik Engstrom (six KPOs) | | 30% | | The first KPO, related to organic expansion of analytics and decision tools, was fully achieved. The second KPO, related to specific disposals and exits from joint ventures, was slightly exceeded. The third KPO, related to improvement in the Group’s corporate functions, was slightly exceeded. The fourth KPO, related to technology initiatives across the Company, was fully achieved. The fifth KPO, related to specific priorities and market segment milestones and metrics within each business area, was almost fully achieved. The sixth KPO, related to meeting the quantified targets and completing the actions listed as 2017 objectives in the Corporate Responsibility Report. The targets, and achievements against those targets, are summarised on pages 44 to 51 in this Annual Reports and Financial Statements 2017 and are more fully set out in detail on pages 11 to 67 in the Corporate Responsibility Report which can be found at www.relx.com/go/CRReport. This KPO was almost fully achieved. | | 29.0% | | |
Key Performance Objectives
(KPOs)(3) Nick Luff (six KPOs) | | 30% | | The first KPO, related to 2017 financial performance and acquisitions and disposals, was slightly exceeded. The second KPO, related to tax and accounting matters and procedures, was fully achieved. The third KPO, related to achieving specific deliverables on balance sheet priorities, was slightly exceeded. The fourth KPO, related to achieving specific deliverables on shareholder and analyst engagement, was almost fully achieved. The fifth KPO, related to specific deliverables and metrics for the finance function including talent development, was fully achieved. The sixth KPO, related to meeting the quantified targets and completing the actions listed as 2017 objectives in the Corporate Responsibility Report. The targets, and achievements against those targets, are summarised on pages 44 to 51 in this Annual Reports and Financial Statements 2017 and are more fully set out in detail on pages 11 to 67 in the Corporate Responsibility Report which can be found at www.relx.com/go/CRReport. This KPO was almost fully achieved. | | | | 28.5% |
| | | | | | | 104.2% | | 103.7% |
| Total payment | | | | | | £1,238,028 | | £725,528 |
| (1) | On an equivalent basis (at actual exchange rates and after the net impact of acquisitions and disposals completed during the year). |
| (2) | For achievement above target, each 0.1% of overachievement increased the payout ratio for that component by 1 percentage point up to a maximum payout ratio of 150% at 105% achievement versus target. For achievement below target, each 0.1% of underachievement reduced the payout ratio by 1.5 percentage points down to a threshold payout ratio of 10% at 94% achievement versus target. |
| (3) | The maximum payout for the KPO component is 100% of 30%. |
The Board believes that disclosing details beyond the level of specificity that is included above would be commercially sensitive and would give competitors an unfair insight into our strategic direction and annual execution plans.
| | |
| 86 | | RELX Group Annual reports and financial statements 2017 |
|
|
Multi-year incentives (granted under the Remuneration Policy in effect prior to the approval by shareholders of the new Remuneration Policy at the Annual General Meetings in April 2017)
Multi-year incentives with a performance period ended 31 December 2017 were the 2015 BIP, LTIP and ESOS granted to Executive Directors.
The Committee assessed the performance measures for these awards and made an overall assessment of underlying business performance and other relevant factors. The vesting outcome resulting from this review is summarised below.
LTIP:2015-17 cycle performance outcome
| | | | | | | | | | |
Performance measure | | Weighting | | Performance range and vesting levels set at grant(1) | | Achievement against the performance range | | Resulting vesting
percentage |
TSR over the three-year performance period | | 1/3rd | | below median median upper quartile | | 0% 30% 100% | | In upper quartile of sterling and euro comparator groups and just below the upper quartile in US dollar comparator group | | 93.6% |
Average growth in adjusted EPS over | | 1/3rd | | below 5% p.a. | | 0% | | 7.6% p.a. | | 70.7% |
the three-year performance period(2) | | | | 5% p.a. | | 33% | | | | |
| | | | 6% p.a. | | 52.5% | | | | |
| | | | 7% p.a. | | 65% | | | | |
| | | | 8% p.a. | | 75% | | | | |
| | | | 9% p.a. | | 85% | | | | |
| | | | 10% p.a. | | 92.5% | | | | |
| | | | | 11% p.a. and above | | 100% | | | | |
ROIC in the third year of the | | 1/3rd | | below 12.3% | | 0% | | 13.8%(3 | | 100.0% |
performance period(2) | | | | 12.3% | | 33% | | | | |
| | | | 12.55% | | 52.5% | | | | |
| | | | 12.8% | | 65% | | | | |
| | | | 13.05% | | 75% | | | | |
| | | | 13.3% | | 85% | | | | |
| | | | 13.55% | | 92.5% | | | | |
| | | | | 13.8% and above | | 100% | | | | |
Total vesting percentage: | | | | | | | | | | 88.1% |
| (1) | Calculated on a straight-line basis for performance between the points. |
| (2) | Growth in adjusted EPS at constant currencies and ROIC are calculated as set out in the Chief Financial Officer’s report on pages 54 to 59 and note 11 to the consolidated financial statements on pages 138 to 139, with adjustments made to remove the effect on ROIC of changes in exchange rates, pension deficits and accounting standards over the three-year performance period. |
| (3) | For 2017, ROIC on pages 57 to 58 of the Chief Financial Officer’s report of 13.1% equates to 13.8% under the plan methodology, the difference primarily reflecting changes in exchange rates between 2014 and 2017. |
BIP:2015-17 cycle performance outcome
| | | | | | | | | | |
Performance measure | | Weighting | | Performance range and vesting levels set at grant(1) | | Achievement against the performance range | | Resulting vesting
percentage |
Average growth in adjusted EPS over | | 50% | | below 4% p.a. | | 0% | | 7.6% p.a. | | 85.7% |
the three-year performance period(2) | | | | 4% p.a. | | 50% | | | | |
| | | | 6.5% p.a. | | 75% | | | | |
| | | | | 9% p.a. or above | | 100% | | | | |
ROIC in the third year of the | | 50% | | below 12.3% | | 0% | | 13.8%(3) | | 100.0% |
performance period(2) | | | | 12.3% | | 50% | | | | |
| | | | 12.8% | | 75% | | | | |
| | | | | 13.3% or above | | 100% | | | | |
Total vesting percentage: | | | | | | | | | | 92.8% |
| (1) | Calculated on a straight-line basis for performance between the points. |
| (2) | Growth in adjusted EPS at constant currencies and ROIC are calculated as set out in the Chief Financial Officer’s report on pages 54 to 59 and note 11 to the consolidated financial statements on pages 138 to 139, with adjustments made to remove the effect on ROIC of changes in exchange rates, pension deficits and accounting standards over the three-year performance period. |
| (3) | For 2017, ROIC on pages 57 to 58 of the Chief Financial Officer’s report of 13.1% equates to 13.8% under the plan methodology, the difference primarily reflecting changes in exchange rates between 2014 and 2017. |
| | |
| Governance Directors’ Remuneration Report | | 87 |
|
|
ESOS:2015-17 cycle performance outcome
| | | | | | | | | | |
Performance measure | | Weighting | | Performance range and vesting levels set at grant(1) | | Achievement against the
performance range | | Resulting vesting
percentage |
Average growth in adjusted EPS over | | 100% | | below 4% p.a. | | 0% | | 7.6% p.a. | | 95.7% |
the three-year performance period(2) | | | | 4% p.a. | | 33% | | | | |
| | | | 6% p.a. | | 80% | | | | |
| | | | | 8% p.a. or above | | 100% | | | | |
| (1) | Calculated on a straight-line basis for performance between the stated average adjusted EPS growth percentages. |
| (2) | Growth in adjusted EPS at constant currencies is calculated as set out in the Chief Financial Officer’s report on pages 54 to 59 and note 11 to the consolidated financial statements on pages 138 to 139. |
Single Total Figure of Remuneration –Non-Executive Directors (audited)
| | | | | | | | | | | | |
| | | Total fee | | Benefits(1) | | Total |
| | | 2017 | | 2016 | | 2017 | | 2016 | | 2017 | | 2016 |
Anthony Habgood | | £625,000 | | £625,000 | | £2,381 | | £2,305 | | £627,381 | | £627,305 |
Wolfhart Hauser | | £140,000 | | £130,808 | | £780 | | £780 | | £140,780 | | £131,588 |
Adrian Hennah | | £90,000 | | £90,000 | | £780 | | £780 | | £90,780 | | £90,780 |
Marike van Lier Lels(2) | | €115,000 | | €115,000 | | €958 | | €1,025 | | €115,958 | | €116,025 |
Robert MacLeod | | £90,000 | | £62,423 | | £780 | | | | £90,780 | | £62,423 |
Carol Mills | | £101,000 | | £72,827 | | £1,620 | | | | £102,620 | | £72,827 |
Linda Sanford | | £90,000 | | £90,000 | | £1,620 | | £1,620 | | £91,620 | | £91,620 |
Ben van der Veer(2) | | €142,500 | | €142,500 | | €958 | | €1,025 | | €143,458 | | €143,525 |
Suzanne Wood(3) | | £24,000 | | N/A | | | | N/A | | £24,000 | | N/A |
| (1) | Benefits comprise the notional benefit of tax filing support provided toNon-Executive Directors for filings outside their home country resulting from their directorships with the Group. The incremental assessable benefit charge per tax return for 2017 was £840 (unchanged from 2016) for a UK tax return and £780 (unchanged from 2016) for a Netherlands tax return. Anthony Habgood’s benefits also include £1,601 (£1,525 in 2016) in respect of private medical insurance. Further, the company meets all reasonable travel, subsistence, accommodation and other expenses, including any tax where such expenses are deemed taxable, incurred by theNon-Executive Directors and the Chairman in the course of performing their duties. |
| (2) | The pounds sterling equivalent of the total fees and benefits for Marike van Lier Lels and Ben van der Veer (converted at the average exchange rate applicable to the years of reporting) were £101,717 (£95,102 in 2016) and £125,840 (£117,643 in 2016) respectively for 2017. For the purposes of reporting the total fees and benefits for the two Directors, the pounds sterling benefit relating to the UK tax return preparation has been converted into euros at the average exchange rate for the relevant year. |
| (3) | Appointed on 26 September 2017. |
| (4) | The total remuneration for Directors is set out in note 28 to the consolidated financial statements on pages 158 to 159. |
| N/A denotes that the individual was not a Director at the relevant date. | |
Non-Executive Directors’ fees
The fees in the Single Total Figure table forNon-Executive Directors reflect the following fees in 2017:
| | | | |
| | | Annual fee 2018 | | Annual fee 2017 |
| Chairman | | £650,000 | | £625,000 |
| Non-Executive Directors | | £85,000/€97,500 | | £75,000/€95,000 |
| Senior Independent Director | | £30,000 | | £30,000 |
| Chairman of: | | | | |
| – Audit Committee | | €37,500 | | €35,000 |
| – Remuneration Committee | | £30,000 | | £25,000 |
| Committee membership fee: | | | | |
| – Audit Committee | | £17,500/€20,000 | | £15,000/€20,000 |
| – Remuneration Committee | | £17,500 | | £15,000/€20,000 |
| – Nominations Committee | | £10,000/€12,500 | | £10,000/€12,500 |
In addition, effective from 1 January 2018 an intercontinental travel fee of £4,500/€5,000 will be payable to anyNon-Executive Director (excluding the Chairman) in respect of each transatlantic journey made in order to attend a RELX board or committee meeting.
Fees may be reviewed annually, although in practice they have changed on a less frequent basis. At the end of 2017, theNon-Executive Director and Chairman fees were reviewed against comparative benchmark data; taking account of market practice and general governance trends. As a result a number of changes were approved which took effect on 1 January 2018 as set out above. Prior to that, the last review took place during 2015 as a result of which a number of adjustments were made to the fees which took effect on 1 January 2016.
| | |
| 88 | | RELX Group Annual reports and financial statements 2017 |
|
|
Total pension entitlements (audited)
Erik Engstrom is a member of the Group’s UK defined benefit pension arrangements. Mr Engstrom pays a participation fee on the amount of his pensionable base salary which exceeds the scheme earnings cap.
This fee was 7% until 28 February 2017, increased to 10% on 1 March 2017 and will be 13% from 1 March 2018. Further details are provided in the Remuneration Policy on page 96.
| | | | | | | | |
| Pension – Standard information |
| Age at | | Normal | | Director’s | | Participation | | Total of Director’s |
| December | | retirement | | contributions | | fee | | contributions and |
| 2017 | | age | | | | | | participation fee |
| 54 | | 60 | | £16,582 | | £98,303 | | £114,885 |
| | | | |
| Pension – UK statutory basis | | |
| Accrued annual | | Accrued annual | | Single figure |
| pension at | | pension at | | pensions value |
| 31 December 2016 | | 31 December 2017 | | |
| £357,912 | | £402,605 | | £778,970(1) |
(1) Net of Director’s contribution and participation fee.
Scheme interests awarded during the financial year (audited)
| | | | | | | | | | |
| CURRENT MULTI-YEAR INCENTIVE PLANS | | | | | | | | |
| | Basis on which | | Face value of | | Value of awards | | Percentage of maximum that | | End of |
| | award is made | | award at
grant(1) | | if vest in line with expectations(2) | | would be received if threshold performance achieved(3) | | performance period |
| BIP – matching share awards | | | | | | | | |
| Erik Engstrom | | Opportunity to invest cash and/or shares up to value of annual incentive target | | £1,159,686 | | £776,990 | | If one measure pays out at threshold, the overall payout is 25%. If both measures pay out at threshold, the overall payout is 50%. | | 31 December 2019 |
| Nick Luff | | opportunity and receive up to 1 for 1 matching award | | £682,897 | | £457,541 | | | | |
| LTIP – performance share awards | | | | | | | | |
| Erik Engstrom | | 250% of salary | | £2,899,215 | | £1,449,608 | | If the measure with the lowest payout at threshold pays out at threshold, the overall payout is 3%. If each measure pays out at threshold, the overall payout is 32% | | 31 December 2019 |
| Nick Luff | | 200% of salary | | £1,365,794 | | £682,897 | | | | |
| ESOS – market value options | | | | | | | | |
| Erik Engstrom | | 250% of salary | | £2,899,215 | | £463,874 | | 33% | | 31 December |
| | | | | | | | | | 2019 |
| Nick Luff | | 200% of salary | | £1,365,794 | | £218,527 | | | | |
| (1) | The face value of the LTIP and ESOS awards is calculated using (i) the middle market quotation of a PLC ordinary share (£14.945); (ii) the closing price of a NV ordinary share (€16.7225); and (iii) the GBP:EUR exchange rate on the trading day before grant (24 February 2017). These share prices are used to determine the number of awards granted, as well as to set option exercise prices. The face value of the ESOS options shown in this column has not been reduced to reflect the fact that the aggregate option price is payable on exercise. The face value of the BIP matching award to Erik Engstrom, who invested in NV ADRs, is calculated using (i) the closing price of a NV ADR ($17.695); and (ii) the GBP:USD exchange rate on the trading day before grant (24 February 2017). The face value for Nick Luff’s BIP matching award, who invested in PLC and NV ordinary shares, is calculated on the same basis as the LTIP and ESOS face values. |
| (2) | For BIP, LTIP and ESOS, vesting in line with expectations is as per the performance scenario chart disclosed on page 83 of the 2013 Remuneration Report, i.e. 67% for BIP and 50% for LTIP. For ESOS, vesting in line with expectations means that 80% of the face value of the award at grant vests to which a valuation factor of 20% has been applied. |
| (3) | Threshold payout levels for each measure have been included. Where there are multiple measures, it is possible to achieve threshold, and hence payout, in respect of just one of the measures (or, for TSR, in respect of one of the three TSR comparator groups). |
The LTIP awards granted in 2017 are based on ROIC, EPS and TSR and the 2017 BIP awards on EPS and ROIC, with the respective metrics weighted equally in each plan and assessed independently. The targets and vesting scales applicable to these awards are set out on page 103 of the 2016 Remuneration Report. In respect of ESOS awards granted in 2017, 33% of the award vests for achieving average growth in adjusted EPS over the three-year performance period of 4% p.a.; 80% vests for 6% p.a. and 100% for 8% p.a.
| | |
| Governance Directors’ Remuneration Report | | 89 |
|
|
External appointments
The Committee believes that the experience gained by allowing Executive Directors to serve asNon-Executive Directors on the boards of other organisations is of benefit to the Group.
Accordingly, Executive Directors may, subject to the approval of the Chairman and the CEO (or the Chairman only in the case of the CEO), serve asNon-Executive Directors on the boards of up to twonon-associated companies (of which only one may be a major company) and they may retain remuneration arising from such appointments.
Erik Engstrom is aNon-Executive Director of Smith & Nephew plc and received fees of £75,135 for 2017 (£71,785 in 2016).
Nick Luff was aNon-Executive Director of Lloyds Banking Group plc until 11 May 2017. He received fees of £69,007 for 2017
(£165,000 in 2016).
Payments to past Directors and payments for loss of office (audited)
Robert Polet and Lisa Hook who retired from the Boards on 21 April 2016 received tax return preparation assistance of £1,620 and £840 respectively. There have been no payments for loss of office in 2017.
Statement of Directors’ shareholdings and other share interests (audited)
Shareholding requirement
The Committee believes that a closer alignment of interests can be created between senior management and shareholders if executives build and maintain a significant personal stake in the Group. The shareholding requirements applicable to the Executive Directors are set out in the table below. Shares that count for this purpose are any type of RELX PLC or RELX NV security of which the Director, their spouse, civil partner or dependent child has beneficial ownership on an unencumbered basis. There has been no change to the interests reported below between 31 December 2017 and 14 February 2018.
Meeting the shareholding requirement is both a vesting condition for awards granted and a requirement to maintain eligibility for future awards.
On 31 December 2017, the Executive Directors’ shareholdings were as follows (valued using the middle market closing prices of the relevant securities):
| | | | |
| | | Shareholding
requirement (% of
31 December 2017
annual base salary) | | Actual shareholding as at
31 December 2017 (% of
31 December 2017
annual base salary) |
Erik Engstrom | | 400% | | 1,466% |
Nick Luff | | 300% | | 637% |
Share interests (number of shares held)
| | | | | | | | | | | | | | | | | | | | | | | | |
| | | RELX PLC ordinary shares | | | RELX NV ordinary shares | | | TOTAL RELX ordinary shares | |
| | | 1 January
2017 | | | 31 December
2017 | | | 1 January
2017 | | | 31 December
2017 | | | 1 January
2017 | | | 31 December
2017 | |
Erik Engstrom | | | 160,036 | | | | 200,490 | | | | 803,742 | | | | 804,181 | | | | 963,778 | | | | 1,004,671 | |
Anthony Habgood | | | 50,000 | | | | 50,000 | | | | 38,450 | | | | 38,450 | | | | 88,450 | | | | 88,450 | |
Wolfhart Hauser | | | 11,542 | | | | 11,542 | | | | 3,091 | | | | 3,091 | | | | 14,633 | | | | 14,633 | |
Adrian Hennah | | | 10,508 | | | | 10,508 | | | | | | | | | | | | 10,508 | | | | 10,508 | |
Marike van Lier Lels | | | | | | | | | | | 3,000 | | | | 8,000 | | | | 3,000 | | | | 8,000 | |
Nick Luff | | | 100,010 | | | | 124,847 | | | | 108,960 | | | | 136,095 | | | | 208,970 | | | | 260,942 | |
Robert MacLeod | | | 3,250 | | | | 6,950 | | | | | | | | | | | | 3,250 | | | | 6,950 | |
Carol Mills | | | 6,500 | | | | 9,700 | | | | | | | | | | | | 6,500 | | | | 9,700 | |
Linda Sanford | | | 6,700 | | | | 6,700 | | | | 3,000 | | | | 3,000 | | | | 9,700 | | | | 9,700 | |
Ben van der Veer | | | | | | | | | | | 10,766 | | | | 10,766 | �� | | | 10,766 | | | | 10,766 | |
Suzanne Wood (from 26 September 2017) | | | N/A | | | | 3,500 | | | | N/A | | | | | | | | N/A | | | | 3,500 | |
N/A denotes that the individual was not a Director at the relevant date.

| | |
| 90 | | RELX Group Annual reports and financial statements 2017 |
|
|
Multi-year incentive interests (audited)
The tables below and on page 91 set out vested but unexercised and unvested options and unvested share awards held by the Executive Directors including details of options and awards granted and options exercised and options and awards vested during the year of reporting.
All outstanding unvested options and share awards are subject to performance conditions. For disclosure purposes, any PLC and NV ADRs awarded under the multi-year plans are included as ordinary shares. Between 31 December 2017 and the date of this Report, there have been no changes in the options or share awards held by the Executive Directors.
Erik Engstrom
| | | | | | | | | | | | | | | | | | | | | | | | | | | | | | | | | | | | | | | | |
| OPTIONS | | Year of
grant | | | Type of
security | | | No. of
options
held on
1 Jan 2017 | | | No. of
options
granted
during
2017 | | | Option
price on
date of
grant | | | No. of
options
exercised
during 2017 | | | Market price per
share at
exercise | | | No. of
options held on 31 Dec 2017 | | | Unvested
options
vesting in | | | Options
exercisable
until | |
ESOS | | | 2013 | | | | PLC ord | | | | 178,799 | | | | | | | | £7.345 | | | | 178,799 | | | | £15.038 | | | | | | | | | | | | | |
| | | | | | | NV ord | | | | 191,230 | | | | | | | | €8.147 | | | | 191,230 | | | | €16.665 | | | | | | | | | | | | | |
| | | 2014 | (1) | | | PLC ord | | | | 145,604 | | | | | | | | £9.245 | | | | | | | | | | | | 145,604 | | | | | | | | 07 Apr 24 | |
| | | | | | | NV ord | | | | 158,166 | | | | | | | | €10.286 | | | | | | | | | | | | 158,166 | | | | | | | | 07 Apr 24 | |
| | | 2015 | | | | PLC ord | | | | 119,771 | | | | | | | | £11.520 | | | | | | | | | | | | 119,771 | | | | Apr 18 | | | | 02 Apr 25 | |
| | | | | | | NV ord | | | | 126,358 | | | | | | | | €15.003 | | | | | | | | | | | | 126,358 | | | | Apr 18 | | | | 02 Apr 25 | |
| | | 2016 | | | | PLC ord | | | | 112,690 | | | | | | | | £12.550 | | | | | | | | | | | | 112,690 | | | | Mar 19 | | | | 15 Mar 26 | |
| | | | | | | NV ord | | | | 119,312 | | | | | | | | €15.285 | | | | | | | | | | | | 119,312 | | | | Mar 19 | | | | 15 Mar 26 | |
| | | 2017 | | | | PLC ord | | | | | | | | 96,996 | | | | £14.945 | | | | | | | | | | | | 96,996 | | | | Feb 20 | | | | 27 Feb 27 | |
| | | | | | | | NV ord | | | | | | | | 102,405 | | | | €16.723 | | | | | | | | | | | | 102,405 | | | | Feb 20 | | | | 27 Feb 27 | |
Total PLC ords | | | | | | | | | | | 556,864 | | | | 96,996 | | | | | | | | 178,799 | | | | | | | | 475,061 | | | | | | | | | |
Total NV ords | | | | | | | | | | | 595,066 | | | | 102,405 | | | | | | | | 191,230 | | | | | | | | 506,241 | | | | | | | | | |
(1) The performance outcome for the ESOS 2014 was disclosed on page 94 of the 2016 Remuneration Report. | |
| SHARES | | Year of
grant | | | Type of
security | | | No. of
unvested
shares
held on
1 Jan 2017 | | | No. of
shares
awarded
during
2017 | | | Market
price per
share at
award | | | No. of shares
vested/
performance tested during
2017 | | | Market price
per share at
vesting/
performance
testing | | | No. of
unvested/
non-
performance
tested
shares
held on
31 Dec 2017 | | | End of performance
period | | | Date of
release | |
BIP | | | 2014 | (1) | | | NV ord | | | | 125,174 | | | | | | | | €10.286 | | | | 123,083 | | | | €16.723 | | | | | | | | | | | | | |
| | | 2015 | | | | NV ord | | | | 97,607 | | | | | | | | €15.003 | | | | | | | | | | | | 97,607 | | | | Dec 2017 | | | | H1 2018 | |
| | | 2016 | | | | NV ord | | | | 94,965 | | | | | | | | €15.285 | | | | | | | | | | | | 94,965 | | | | Dec 2018 | | | | H1 2019 | |
| | | 2017 | | | | NV ord | | | | | | | | 81,781 | | | | €16.723 | | | | | | | | | | | | 81,781 | | | | Dec 2019 | | | | H1 2020 | |
LTIP | | | 2014 | (1) | | | PLC ord | | | | 145,604 | | | | | | | | £9.245 | | | | 136,707 | | | | £14.945 | | | | | | | | | | | | | |
| | | | | | | NV ord | | | | 158,166 | | | | | | | | €10.286 | | | | 148,502 | | | | €16.723 | | | | | | | | | | | | | |
| | | 2015 | | | | PLC ord | | | | 119,771 | | | | | | | | £11.520 | | | | | | | | | | | | 119,771 | | | | Dec 2017 | | | | H1 2018 | |
| | | | | | | NV ord | | | | 126,359 | | | | | | | | €15.003 | | | | | | | | | | | | 126,359 | | | | Dec 2017 | | | | H1 2018 | |
| | | 2016 | | | | PLC ord | | | | 112,690 | | | | | | | | £12.550 | | | | | | | | | | | | 112,690 | | | | Dec 2018 | | | | H1 2019 | |
| | | | | | | NV ord | | | | 119,312 | | | | | | | | €15.285 | | | | | | | | | | | | 119,312 | | | | Dec 2018 | | | | H1 2019 | |
| | | 2017 | | | | PLC ord | | | | | | | | 96,996 | | | | £14.945 | | | | | | | | | | | | 96,996 | | | | Dec 2019 | | | | H1 2020 | |
| | | | | | | | NV ord | | | | | | | | 102,405 | | | | €16.723 | | | | | | | | | | | | 102,405 | | | | Dec 2019 | | | | H1 2020 | |
Total PLC ords | | | | | | | | | | | 378,065 | | | | 96,996 | | | | | | | | 271,585 | | | | | | | | 329,457 | | | | | | | | | |
Total NV ords | | | | | | | | | | | 721,583 | | | | 184,186 | | | | | | | | 136,707 | | | | | | | | 622,429 | | | | | | | | | |
| (1) | The performance outcomes for the BIP and LTIP 2014 were disclosed on page 94 of the 2016 Remuneration Report. |
| | |
| Governance Directors’ Remuneration Report | | 91 |
|
|
Nick Luff
| | | | | | | | | | | | | | | | | | | | | | | | | | | | | | | | | | | | | | | | |
| OPTIONS | | Year of
grant | | | Type of
security | | | No. of
options
held on
1 Jan 2017 | | | No. of
options
granted
during
2017 | | | Option
price on
date of grant | | | No. of
options
exercised
during 2017 | | | Market price per
share at
exercise | | | No. of
options
held on
31 Dec 2017 | | | Unvested
options
vesting in | | | Options
exercisable
until | |
ESOS | | | 2014 | (1) | | | PLC ord | | | | 65,656 | | | | | | | | £9.900 | | | | | | | | | | | | 65,656 | | | | | | | | 02 Sep 24 | |
| | | | | | | NV ord | | | | 72,228 | | | | | | | € | 11.378 | | | | | | | | | | | | 72,228 | | | | | | | | 02 Sep 24 | |
| | | 2015 | | | | PLC ord | | | | 56,423 | | | | | | | £ | 11.520 | | | | | | | | | | | | 56,423 | | | | Apr 18 | | | | 02 Apr 25 | |
| | | | | | | NV ord | | | | 59,526 | | | | | | | € | 15.003 | | | | | | | | | | | | 59,526 | | | | Apr 18 | | | | 02 Apr 25 | |
| | | 2016 | | | | PLC ord | | | | 53,087 | | | | | | | £ | 12.550 | | | | | | | | | | | | 53,087 | | | | Mar 19 | | | | 15 Mar 26 | |
| | | | | | | NV ord | | | | 56,207 | | | | | | | € | 15.285 | | | | | | | | | | | | 56,207 | | | | Mar 19 | | | | 15 Mar 26 | |
| | | 2017 | | | | PLC ord | | | | | | | | 45,694 | | | £ | 14.945 | | | | | | | | | | | | 45,694 | | | | Feb 20 | | | | 27 Feb 27 | |
| | | | | | | | NV ord | | | | | | | | 48,242 | | | € | 16.723 | | | | | | | | | | | | 48,242 | | | | Feb 20 | | | | 27 Feb 27 | |
Total PLC ords | | | | | | | | | | | 175,166 | | | | 45,694 | | | | | | | | | | | | | | | | 220,860 | | | | | | | | | |
Total NV ords | | | | | | | | | | | 187,961 | | | | 48,242 | | | | | | | | | | | | | | | | 236,203 | | | | | | | | | |
(1) The performance outcome for the ESOS 2014 was disclosed on page 94 of the 2016 Remuneration Report. | |
| SHARES | | Year of
grant | | | Type of
security | | | No. of
unvested
shares
held on
1 Jan 2017 | | | No. of
shares
awarded
during
2017 | | | Market
price per
share at
award | | | No. of shares
vested/
performance
tested during
2017 | | | Market price
per share at
vesting/
performance
testing | | | No. of
unvested/
non-
performance
tested
shares
held on
31 Dec 2017 | | | End of
performance
period | | | Date of
release | |
BIP | | | 2014 | (1) | | | PLC ord | | | | 32,630 | | | | | | | | £9.900 | | | | 32,085 | | | £ | 14.945 | | | | | | | | | | | | | |
| | | | | | | NV ord | | | | 35,174 | | | | | | | € | 11.378 | | | | 34,586 | | | € | 16.723 | | | | | | | | | | | | | |
| | | 2015 | | | | PLC ord | | | | 28,187 | | | | | | | £ | 11.520 | | | | | | | | | | | | 28,187 | | | | Dec 2017 | | | | H1 2018 | |
| | | | | | | NV ord | | | | 29,520 | | | | | | | € | 15.003 | | | | | | | | | | | | 29,520 | | | | Dec 2017 | | | | H1 2018 | |
| | | 2016 | | | | PLC ord | | | | 26,543 | | | | | | | £ | 12.550 | | | | | | | | | | | | 26,543 | | | | Dec 2018 | | | | H1 2019 | |
| | | | | | | NV ord | | | | 28,103 | | | | | | | € | 15.285 | | | | | | | | | | | | 28,103 | | | | Dec 2018 | | | | H1 2019 | |
| | | 2017 | | | | PLC ord | | | | | | | | 22,847 | | | £ | 14.945 | | | | | | | | | | | | 22,847 | | | | Dec 2019 | | | | H1 2020 | |
| | | | | | | NV ord | | | | | | | | 24,121 | | | € | 16.723 | | | | | | | | | | | | 24,121 | | | | Dec 2019 | | | | H1 2020 | |
LTIP | | | 2014 | (1) | | | PLC ord | | | | 65,656 | | | | | | | £ | 9.900 | | | | 61,644 | | | £ | 14.945 | | | | | | | | | | | | | |
| | | | | | | NV ord | | | | 72,229 | | | | | | | € | 11.378 | | | | 67,815 | | | € | 16.723 | | | | | | | | | | | | | |
| | | 2015 | | | | PLC ord | | | | 56,423 | | | | | | | £ | 11.520 | | | | | | | | | | | | 56,423 | | | | Dec 2017 | | | | H1 2018 | |
| | | | | | | NV ord | | | | 59,526 | | | | | | | € | 15.003 | | | | | | | | | | | | 59,526 | | | | Dec 2017 | | | | H1 2018 | |
| | | 2016 | | | | PLC ord | | | | 53,087 | | | | | | | £ | 12.550 | | | | | | | | | | | | 53,087 | | | | Dec 2018 | | | | H1 2019 | |
| | | | | | | NV ord | | | | 56,207 | | | | | | | € | 15.285 | | | | | | | | | | | | 56,207 | | | | Dec 2018 | | | | H1 2019 | |
| | | 2017 | | | | PLC ord | | | | | | | | 45,694 | | | £ | 14.945 | | | | | | | | | | | | 45,694 | | | | Dec 2019 | | | | H1 2020 | |
| | | | | | | | NV ord | | | | | | | | 48,242 | | | € | 16.723 | | | | | | | | | | | | 48,242 | | | | Dec 2019 | | | | H1 2020 | |
Total PLC ords | | | | | | | | | | | 262,526 | | | | 68,541 | | | | | | | | 93,729 | | | | | | | | 232,781 | | | | | | | | | |
Total NV ords | | | | | | | | | | | 280,759 | | | | 72,363 | | | | | | | | 102,401 | | | | | | | | 245,719 | | | | | | | | | |
| (1) | The performance outcomes for the BIP and LTIP 2014 were disclosed on page 94 of the 2016 Remuneration Report. |
| | |
| 92 | | RELX Group Annual reports and financial statements 2017 |
|
|
Performance graphs
The graphs below show total shareholder returns for RELX PLC and RELX NV, calculated on the basis of the average share price in the 30 trading days before the respective year end and assuming dividends were reinvested. RELX PLC’s performance is compared with the FTSE 100 and RELX NV with the AEX Index (to reflect their respective memberships of those indices). The three-year charts cover the performance period of the2015-17 cycle of the LTIP.
3 years
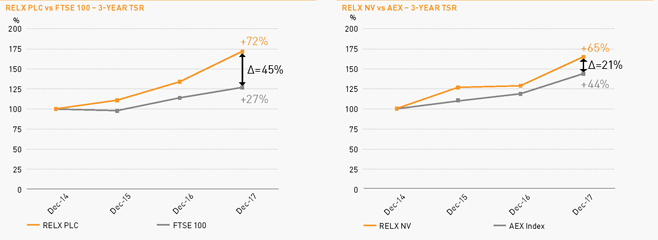
5 years
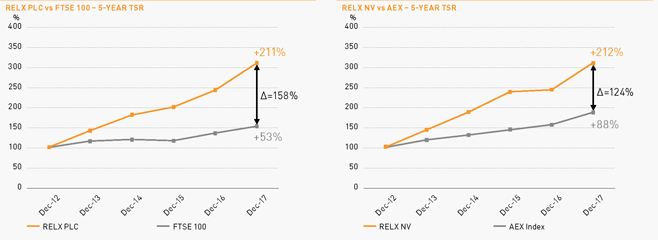
10 years
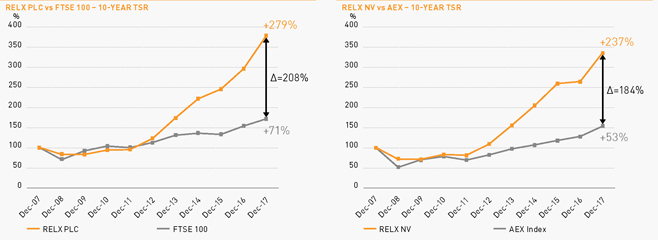
UK Regulations require disclosure of the relative share performance for the nine calendar years ended 31 December 2017, of RELX PLC. During that period the total return for the FTSE 100 was 148% while TSR for RELX PLC was 364%, an outperformance of 216 percentage points.
| | |
| Governance Directors’ Remuneration Report | | 93 |
|
|
CEO historical pay table
The table below shows the historical CEO pay over aten-year period. The year 2008 has been included to show thepre-2009 position, as 2009 was a transition year with three CEO incumbents.
| | | | | | | | | | | | | | | | | | | | | | | | | | | | | | | | | | | | | | | | | | | | | | | | |
| £’000 | | 2008 | | | 2009(3) | | | 2010 | | | 2011 | | | 2012 | | | 2013 | | | 2014 | | | 2015 | | | 2016 | | | 2017 | |
| CEO | | Sir Crispin
Davis | | | Sir Crispin
Davis | | | Ian
Smith | | | Erik
Engstrom | | | Erik
Engstrom | | | Erik
Engstrom | | | Erik
Engstrom | | | Erik
Engstrom | | | Erik
Engstrom | | | Erik
Engstrom | | | Erik
Engstrom | | | Erik
Engstrom | |
| Annualised | | | 1,181 | | | | 1,181 | | | | 900 | | | | 1,000 | | | | 1,000 | | | | 1,025 | | | | 1,051 | | | | 1,077 | | | | 1,104 | | | | 1,131 | | | | 1,160 | | | | 1,189 | |
| base salary | | | | | | | | | | | | | | | | | | | | | | | | | | | | | | | | | | | | | | | | | | | | | | | | |
| | | | | | | | | | | | |
| Annual incentive payout as a % of maximum | | | 61% | | | | 30% | | | | 37% | | | | 71% | | | | 67% | | | | 66% | | | | 73% | | | | 70% | | | | 71% | | | | 70% | | | | 68% | | | | 69% | |
| | | | | | | | | | | | |
| Multi-year | | | 100% | | | | 0% | | | | 0% | | | | 0% | | | | 0% | | | | 0% | | | | 70% | (4) | | | 96% | (4) | | | 90% | (4) | | | 97% | (4) | | | 97% | (4) | | | 92% | (4) |
| incentive vesting as a % of maximum | | | | | | | | | | | | | | | | | | | | | | | | | | | | | | | | | | | | | | | | | | | | | | | | |
| | | | | | | | | | | | |
| CEO total (UK) | | | 7,193 | | | | 706 | | | | 1,033 | | | | 426 | | | | 3,140 | | | | 2,738 | | | | 11,145 | (5) | | | 5,463 | | | | 17,447 | (6) | | | 11,416 | (7) | | | 11,399 | (8) | | | 9,920 | |
statutory
basis)(1) | | | | | | | | | | | | | | | | | | | | | | | | | | | | | | | | | | | | | | | | | | | | | | | | |
| | | | | | | | | | | | |
| CEO total (Dutch | | | 6,631 | | | | (514 | ) | | | 1,033 | | | | 431 | | | | 2,675 | | | | 5,045 | | | | 5,443 | | | | 6,100 | | | | 6,839 | | | | 6,412 | | | | 6,725 | | | | 6,812 | (9) |
Civil Code
basis)(2) | | | | | | | | | | | | | | | | | | | | | | | | | | | | | | | | | | | | | | | | | | | | | | | | |
| (1) | UK statutory basis: This is described in footnote (1) to the Single Total Figure of Remuneration table on page 84. |
| (2) | Dutch Civil Code basis: This is described in footnote (2) to the Single Total Figure of Remuneration table on page 84. |
| (3) | Sir Crispin Davis was CEO from 1 January to 31 March, Ian Smith was CEO from 1 April to 10 November and Erik Engstrom was CEO from 11 November to 31 December. |
| (4) | The 2017, 2016 and 2015 percentages reflect BIP, LTIP and ESOS. The 2014 percentage reflects the final tranche of the discontinued Reed Elsevier Growth Plan (REGP), BIP and ESOS. The 2013 percentage reflects BIP and ESOS only and the 2012 figure reflects BIP and the first tranche of the discontinued REGP. |
| (5) | The 2012 figure reflects the vesting of the first tranche of the discontinued REGP and includes the entire amount that was performance tested over the2010-12 period, including the 50% of shares deferred until 2015 in accordance with the plan rules including £3m attributed to share price appreciation. |
| (6) | The 2014 figure includes the vesting of the second and final tranche of the discontinued REGP and includes £8.8m attributed to share price appreciation. |
| (7) | The 2015 figure includes £4.4m attributed to share price appreciation. |
| (8) | The 2016 figure includes £4.2m attributed to share price appreciation. The UK statutory basis has been restated for actual share prices and exchange rates applicable on the dates of vesting (see page 84 for further detail). |
| (9) | The 2017 figure includes £2.9m attributed to share price appreciation. |
| | |
| 94 | | RELX Group Annual reports and financial statements 2017 |
|
|
Comparison of change in CEO pay with change in employee pay
The table below shows the percentage change in remuneration (salary, benefits and annual incentive) from 2016 to 2017 for the CEO compared with the average employee.*
| | | | | | | | |
| | | % change from 2016 to 2017 | |
| | | CEO | | | Average
employee(1) | |
Salary | | | 2.5% | | | | 2.5% | |
Benefits | | | 15.8% | (2) | | | 2.5% | |
Annual incentive | | | 4.6% | | | | 5.8% | |
| (1) | This reflects a substantial proportion of our global employee population. |
| (2) | The increase relates to an increase in the deemed benefit of tax return preparation services. Services provided to Mr Engstrom have not changed. |
| * | From financial year 2017, the new Dutch Corporate Governance Code recommends companies describe pay ratios within the company. Total employee costs are disclosed below; remuneration for the CEO is disclosed on page 84 and the total average number of employees (on a full time equivalent basis) during 2017 was 31,200. The Committee believes these disclosures provide a meaningful description of the relative pay of the CEO compared with that of the average employee. |
Relative importance of spend on pay
The following table sets out the total employee costs for all employees, as well as the amounts paid in dividends and share repurchases.
| | | | | | |
| | | 2017 (£m) | | 2016 (£m) | | % change |
Employee costs(1) | | 2,273 | | 2,114 | | +8% |
Dividends | | 762 | | 683 | | +12% |
Share repurchases | | 700 | | 700 | | – |
| (1) | Employee costs include wages and salaries, social security costs, pensions and share based and related remuneration. After adjusting for fluctuations in the Group’s principal currencies, employee costs rose 3% in constant currency. |
Implementation of remuneration policy in 2018
Salary: The Committee has awarded a salary increase of 2.5% to each Executive Director, which means that, from 1 January 2018, Erik Engstrom’s salary rose to £1,218,403 and Nick Luff’s salary to £717,478. This is in line with the guidelines agreed for employees in the Group’s most significant locations globally for 2018.
AIP: The operation of the AIP in 2018 changes in accordance with the terms of the new policy set out on page 97 of this Report. Details of the 2018 annual financial targets and KPOs will be disclosed in the 2018 Remuneration Report.
LTIP: In accordance with the terms of the new policy, we will be granting LTIP awards with a face value of 450% of salary to Erik Engstrom and 375% to Nick Luff (see page 98). The awards are subject to a three-year performance period and the net (after tax) vested shares are to be retained for a furthertwo-year holding period.
The following metrics, weightings, targets and vesting scales apply to LTIP awards granted in 2018.
The vesting of LTIP awards is dependent on three separate performance measures: TSR, EPS and ROIC, weighted 20%:40%:40% respectively and assessed independently.
The TSR measure comprises three comparators (sterling, euro and US dollar) reflecting the fact that the Group accesses equity capital markets through three exchanges – London, Amsterdam and New York – in three currency zones. The Group’s TSR performance is measured separately against each comparator group and each ranking achieved will produce a payout, if any,
in respect ofone-third of the TSR measure. The proportion of the TSR measure that vests will be the sum of the three payouts.
The averaging period applied for TSR measurement purposes is the three months before the start of the financial year in which the award is granted and the last three months of the third financial year of the performance period.
The companies for the2018-20 LTIP cycle were selected on the following basis (unchanged from prior year):
| (a) | they were in a relevant market index or were the largest listed companies on the relevant exchanges at the end of the year before the start of the performance period: the FTSE 100 for the sterling group; the Euronext100 (including the AEX) and DAX30 for the euro group; and the S&P 500 for the US dollar group; |
| (b) | certain companies were then excluded: |
| | • | | those with mainly domestic revenues (as they do not reflect the global nature of the Group’s customer base); |
| | • | | those engaged in extractive industries (as they are exposed to commodity cycles); and |
| | • | | financial services companies (as they have a different risk/ reward profile). |
| (c) | the remaining companies were then ranked by market capitalisation and, for each comparator group, approximately 40 companies with market capitalisations above and below that of the Group were taken; and |
| (d) | relevant listed global peers operating in businesses similar to those of the Group but not otherwise included were added. |
Each comparator group comprises approximately 40 companies.
| | |
Vesting percentage of each third of the TSR tranche* | | TSR ranking within the relevant TSR comparator group |
0% | | Below median |
25% | | Median |
100% | | Upper quartile |
| * | Vesting is on a straight-line basis for performance between the minimum and maximum levels. |
The calculation methodology for the EPS and ROIC measures is set out in footnotes (2) and (3) on page 86 and the 2013 Notices of Annual General Meetings, which can be found on the Group’s website. The targets and vesting scales applicable to the EPS and ROIC tranches of the 2018 LTIP awards reflect the company’s approach to acquisitions, disposals and share buybacks and are set out below.
| | | | |
Vesting percentage of EPS and ROIC tranches* | | Average growth in
adjusted EPS over
the three-year
performance period | | ROIC in the third
year of the
performance period |
0% | | below 5% p.a. | | below 12.0% |
25% | | 5% p.a. | | 12.0% |
50% | | 6% p.a. | | 12.4% |
65% | | 7% p.a. | | 12.8% |
75% | | 8% p.a. | | 13.2% |
85% | | 9% p.a. | | 13.6% |
92.5% | | 10% p.a. | | 14.0% |
100% | | 11% p.a. or above | | 14.4% or above |
| * | Vesting is on a straight-line basis for performance between the stated average adjusted EPS growth/ROIC percentages. |
| | |
| Governance Directors’ Remuneration Report | | 95 |
|
|
Remuneration Committee advice
The Committee consists of independentNon-Executive Directors and the Chairman of RELX Group plc. Details of members and their attendance are contained in the Corporate Governance section on page 77. The Chief Legal Officer & Company Secretary attends meetings as secretary to the Committee. At the invitation of the Chairman of the Committee, the CEO of RELX Group plc attends appropriate parts of the meetings. The CEO of RELX Group plc is not in attendance during discussions about his remuneration.
The Human Resources Director advised the Committee during the year.
Willis Towers Watson is the external adviser, appointed by the Committee through a competitive process. Willis Towers Watson also provided actuarial and other human resources consultancy services to some Group companies during the year. The Committee is satisfied that the firm’s advice continues to be objective and independent, and that no conflict of interest exists. The individual consultants who work with the Committee do not provide advice to the Executive Directors, or act on their behalf. Willis Towers Watson is a member of the Remuneration Consultants’ Group and conducts its work in line with the UK Code of Conduct for executive remuneration consulting. During 2017, Willis Towers Watson received fees of £14,489 for advice given to the Committee, charged on a time and expense basis.
Shareholder voting at 2017 Annual General Meetings
At the Annual General Meeting of RELX NV, on 19 April 2017, votes cast by proxy and at the meeting in respect of the Directors’ remuneration were as follows:
| | | | | | | | | | | | | | | | | | | | | | | | |
| Resolution | | Votes For | | | % For | | | Votes Against | | | % Against | | | Total votes cast | | | Votes Withheld | |
Amendments to the Remuneration Policy (binding) | | | 670,276,345 | | | | 95.70% | | | | 30,141,484 | | | | 4.30% | | | | 700,417,829 | | | | 5,371,474 | |
Amendments to the RELX Group plc Long-Term Incentive Plan (binding) | | | 675,218,276 | | | | 96.19% | | | | 26,749,717 | | | | 3.81% | | | | 701,967,993 | | | | 3,821,310 | |
Addition of a deferred share element to the Annual Incentive Plan (binding) | | | 692,611,396 | | | | 98.23% | | | | 12,504,128 | | | | 1.77% | | | | 705,115,524 | | | | 673,779 | |
At the Annual General Meeting of RELX PLC, on 20 April 2017, votes cast by proxy and at the meeting in respect of the Directors’ remuneration were as follows: | |
| Resolution | | Votes For | | | % For | | | Votes Against | | | % Against | | | Total votes cast | | | Votes Withheld | |
Remuneration Policy (binding) | | | 788,804,530 | | | | 94.95% | | | | 41,992,841 | | | | 5.05% | | | | 830,797,371 | | | | 26,762,399 | |
Amendments to the RELX Group plc Long-Term Incentive Plan (binding) | | | 787,817,896 | | | | 94.61% | | | | 44,903,327 | | | | 5.39% | | | | 832,721,223 | | | | 24,841,362 | |
Remuneration Report (advisory) | | | 772,674,562 | | | | 92.88% | | | | 59,274,998 | | | | 7.12% | | | | 831,949,560 | | | | 25,619,005 | |
Wolfhart Hauser
Chairman, Remuneration Committee
14 February 2018
| | |
| 96 | | RELX Group Annual reports and financial statements 2017 |
|
|
Remuneration Policy Report
Set out in this section is a description of the company’s remuneration policy for Directors, as approved by RELX PLC and RELX NV shareholders at the April 2017 Annual General Meetings. (Its wording has been updated solely to reflect the passage of time since the policy was first published.) The original wording, as first published, can be found on pages 84 to 90 of the 2016 Annual Reports and Financial Statements.
Remuneration policy table – Executive Directors
All footnotes to the policy table can be found on pages 98 to 99.
ANNUAL BASE SALARY
Purpose and link to strategy
To recruit and retain the best executive talent globally to execute our strategic objectives at appropriate cost.
Operation
Salaries for Executive Directors are set and reviewed annually by the Remuneration Committee (the Committee) with changes typically taking effect on 1 January. In exceptional circumstances, the Committee may review salaries more frequently.
When reviewing salaries, the Committee considers the executive’s role and sustained value to the company in terms of skill, experience and overall contribution and the company’s guidelines for salaries for all employees for the year. Periodically, competitiveness with companies which are comparable in respect of industry, size, international scope and complexity is also considered in order to ensure the company’s ability to attract and retain executives.
For the last six years, Executive Directors’ salary increases have been 2.5% per annum.
Performance framework
N/A
Maximum value
Salary increases to Executive Directors will remain within the range of increases for the wider employee population. However, the Committee has discretion to exceed this to take account of individual circumstances such as change in responsibility, increases in scale or complexity of the business, inflation or alignment to market level.
Recovery of sums paid
No provision.
RETIREMENT BENEFITS
Purpose and link to strategy
Retirement plans are part of remuneration packages designed to recruit and retain the best executive talent at appropriate cost.
Operation
Our policy is to offer competitive long-term sustainable defined contribution plans. Any amount above applicable limits, for example HMRC’s annual allowance in the UK, will be paid in cash and will be subject to tax and social security deductions. In certain circumstances, executives can take cash instead of pension contributions.
The UK defined benefit schemes are closed to new hires. Continued membership of legacy defined benefit schemes requires annual increases to contributions and participation fees from all members, who have a choice to switch to the defined contribution plan at any time.
The CEO is a member of a UK legacy defined benefit pension arrangement, accruing 1/30th of final year pensionable earnings for each year(pro-rated for part years) of service, with a normal retirement age of 60. In line with all UK defined benefit scheme members, the CEO’s contributions have been increasing annually since 2011 and were 11% of pensionable earnings up to the base scheme’s earnings cap as of 1 March 2017. The contribution rate increases by two percentage points each year during the policy period to 13% as of 1 March 2018 , 15% as of 1 March 2019 and 17% as of 1 March 2020. The CEO also pays a participation fee which, from 1 March 2017, was 10% of the amount of his pensionable earnings in excess of the base scheme’s earnings cap. The participation fee increases by three percentage points each year during the policy period to 13% as of 1 March 2018 , 16% as of 1 March 2019 and 19% as of 1 March 2020. In addition, since March 2017, a cap applies of 2% per annum on the increase in the CEO’s pensionable earnings.
Performance framework
N/A
Maximum value
Defined contribution plan – maximum company contribution of 25% of salary per annum or equivalent cash in lieu. The CFO received 30% of salary under an arrangement which was made pursuant to the previous remuneration policy, which contained a 30% of salary maximum. During the policy period, the CFO’s company contribution decreases by one percentage point to 29% from March 2017, by two percentage points to 27% from March 2018 and by a further two percentage points to 25% from March 2019.
Defined benefit scheme – accrual of 1/30th of final year pensionable earnings for every year of service up to a maximum of 2/3rds of pensionable earnings. As noted above under “Operation”, the CEO is subject to increases in his contributions and in the participation fee, as well as a cap on annual increases in pensionable earnings, as part of his ongoing membership of this scheme.
Recovery of sums paid
No provision.
| | |
| Governance Directors’ Remuneration Report | | 97 |
|
|
OTHER BENEFITS
Purpose and link to strategy
To provide competitive benefits at appropriate cost.
Operation
Other benefits, subject to periodic review, may include private medical and dental cover, life assurance, tax return preparation costs, car benefits, directors’ and officers’ liability insurance, relocation benefits and expatriate allowances and other benefits available to employees generally, including, where appropriate, the tax on such benefits.
Performance framework
N/A
Maximum value
The maximum for ongoing benefits for Executive Directors will not normally exceed 10% of salary (excluding relocation benefits and any tax related charge on benefits which is met by the company). However, the Committee may provide reasonable benefits beyond this amount in exceptional situations, such as a change in the individual’s circumstances caused by the company, or if there is a significant increase in the cost of providing the agreed benefit.1
Recovery of sums paid
No provision.
AIP (ANNUAL INCENTIVE PLAN)
Purpose and link to strategy
The annual incentive provides focus on the delivery of annual financial targets and the achievement of annual objectives and milestones which are chosen to align with the company’s strategy and create a platform for sustainable future performance. The compulsory deferral ofone-third of any annual incentive earned into RELX shares for three years promotes longer-term alignment of Executive Directors’ interests with shareholders’ interests, including an element of post-termination shareholding.
Why performance measures are chosen and how targets are set
Performance measures include a balanced set of financial targets and Key Performance Objectives (KPOs), which are appropriately weighted and which support current strategy and incentivise the Executive Directors to achieve the desired outcomes without undue risk of focusing on any one financial measure.
The targets are designed to be challenging. They are set with reference to the previous year’s performance and internal and external forecasts for the following year.
Operation
The Committee reviews and sets the financial targets and KPOs annually, taking into account internal forecasts and strategic plans. It approves four to six KPOs for each Executive Director, reflecting critical business priorities for which each is accountable. At least one KPO will relate to the achievement of sustainability targets.
Following year end, the Committee compares actual performance with the financial targets and assesses the achievement of individual KPOs.Two-thirds of any annual incentive earned is paid in cash to the Executive Director and the remainingone-third is deferred into RELX shares, which are not released to the Executive Director for three years.
Dividend equivalents accrued during the deferral period are payable in respect of the shares that vest.
On a change in control, the default position is that deferred shares vest. Alternatively, the Committee may determine that deferred shares will not vest and will instead be exchanged for equivalent awards in the acquiring company.
Performance framework
The measures include financial targets, which have a weighting of at least 70%, and individual KPOs, with each element assessed separately.
| ◾ | The minimum payout is zero. |
| ◾ | If threshold is reached for each of the financial measures, the overall payout for the financial measures is 10.5% of salary. If the financial measure with the lowest weighting pays out at threshold and the others do not pay out at all, the overall payout for financial measures is 1.5% of salary. There is no threshold level for KPOs. |
| ◾ | Payout for target performance is 150% of salary. |
Following an assessment of achievement and scoring of KPOs, the Committee agrees the overall level of earned incentive for each Executive Director.
Committee discretion applies.2,3,4
Maximum value
The maximum potential annual incentive is 200% of annual base salary. This includes the deferred share element but excludes dividend equivalents payable in respect of the deferred shares.
Recovery of sums paid
Claw-back applies.5
| | |
| 98 | | RELX Group Annual reports and financial statements 2017 |
|
|
LONG TERM INCENTIVE PLAN
Purpose and link to strategy
The Long Term Incentive Plan (LTIP) is designed to provide a long-term incentive for Executive Directors to achieve the key performance measures that support the company’s strategy, and to align their interests with shareholders.
Why performance measures are chosen and how targets are set
Our strategic focus is on continuing to transform the core business through organic investment and the build out of new products into adjacent markets and geographies, supplemented by selective portfolio acquisitions and divestments. The performance measures in the LTIP are chosen to support this strategy by focusing on sustained earnings growth, return on invested capital and shareholder return.
Targets are set with regard to previous results and internal and external forecasts for the performance period and the strategic plan for the business. They are designed to provide exceptional reward for exceptional performance, whilst allowing a reasonable expectation that reward at the lower end of the scale is attainable, subject to robust performance.
Operation
Annual awards of performance shares, with vesting subject to:
| ◾ | performance measured over three financial years |
| ◾ | continued employment (subject to the provisions set out in the Policy on payments for loss of office section) |
| ◾ | meeting shareholding requirements (400% of salary for the CEO and 300% of salary for the CFO) |
Executive Directors are to retain their net (after tax) vested shares for a holding period of two years after vesting.
Dividend equivalents accrued during the performance period are payable in respect of the performance shares that vest.
On a change of control, the default position is that awards vest on apro-rated basis, subject to an assessment of performance against targets at that time. Alternatively, the Committee may determine that the awards will not vest and will instead be exchanged for equivalent awards in the acquiring company.
Performance framework
The performance measures are EPS, ROIC and relative TSR, weighted 40%:40%:20% respectively and assessed independently, such that a payout can be received under any one of the measures (or, for TSR, in respect of one of the three comparator groups).
| ◾ | The minimum payout is zero. |
| ◾ | If each of the measures vests at threshold, the overall payout is 25% of the award. If the measure with the lowest weighting vests at threshold and the others do not vest at all, the overall payout is 2% of the award. |
| ◾ | Payout in line with expectations is 50% of the maximum award. |
Dividend equivalents are not taken into account in the above payout levels.
Committee discretion applies.2,3,4
Maximum value
The maximum grant in any year is up to 450% of base salary for the CEO and up to 375% of base salary for other Executive Directors (not including dividend equivalents).
Recovery of sums paid
Claw-back applies.5
| 1. | Other benefits: Maximum value was increased from 5% under the previous policy to 10% under the current policy to reflect increases in the cost of providing the agreed benefits. The level of benefits provided to Executive Directors was not changed. |
| 2. | Discretion in respect of AIP and LTIP payout levels: In determining the level of payout under the AIP and vesting under the LTIP, the Committee takes into account RELX’s overall business performance and value created for shareholders over the period in review and other relevant factors. It has discretion to adjust the vesting and payout levels (subject always to the maximum individual limits) if it believes this would result in a fairer outcome. This discretion will only be used in exceptional circumstances and the Committee will explain in the next Remuneration Report the extent to which it has been exercised and the reasons for doing so. |
| 3. | Discretion to vary performance measures under the AIP and the LTIP:The Committee may vary the financial measures applying to a current annual incentive year and performance measures for LTIP awards already granted if a change in circumstances leads it to believe that the arrangement is no longer a fair measure of performance. Any new measures will not be materially less, or more, challenging than the original ones. |
| 4. | Discretion on termination of employment under the AIP and the LTIP:The Committee’s discretion on termination of employment is described under the “Policy on payments for loss of office” section on page 101. |
| 5. | Malus and claw-back under the AIP and the LTIP:Under the AIP and the LTIP, the Committee has discretion to apply malus and claw-back (i) if the payout (including the AIP deferred shares element) was calculated on the basis of materially misstated financial or other data, in which case it can withhold a payout and can seek to recover the difference in value between the incorrect payout and the amount that would have been paid had the correct data been used or (ii) if there has been serious misconduct on the part of the individual, in which case the Committee may withhold an AIP payout, lapse unvested LTIP awards and may require repayment of AIP and LTIP gains arising during a specified period. Under the LTIP, the Committee also has discretion to apply malus and claw-back if a participant breaches post-termination restrictive covenants, in which case unvested awards would lapse and the Committee may require repayment of gains arising during the period beginning six months before termination and ending on the date the post-termination restrictive covenants are stated to expire. Serious misconduct has been added as a trigger event under the AIP and the LTIP since the previous policy to increase the circumstances in which we can apply malus and claw-back. |
| | |
| Governance Directors’ Remuneration Report | | 99 |
|
|
| 6. | Explanation of differences between the company’s policy on Executive Directors’ remuneration and the policy for other employees:Incentives: A larger percentage of Executive Directors’ remuneration is performance related than that of other employees. All managers participate in an annual incentive plan, but participation levels, measures and targets vary according to their role, seniority and local business priorities. Approximately 100 senior executives currently participate in the LTIP and about 1,000 participate in the Executive Share Option Scheme (ESOS). Grant levels under the plans vary according to role and seniority. In considering the remuneration policy for Executive Directors, under which the Executive Directors only participate in the AIP and the LTIP, the Committee considered the incentive plan participation for the wider senior management population.Other benefits: The range and level of retirement and other benefits provided to employees vary according to role, seniority and local market practice. This is to ensure that we provide competitive packages which are appropriate to specific roles. In reducing the maximum company contribution for Executive Directors under the defined contribution pension plan, the Committee took into account the contribution rates for Executive Directors and for the wider employee population. |
| 7. | Changes to pay components: The changes which were made since the previous remuneration policy, together with the rationale for the changes, are described in the Committee Chairman’s introduction on pages 81 to 83 of the Annual Reports and Financial Statements 2016 and in notes 1 and 5 above. |
Remuneration outcomes in different performance scenarios
The Committee considers the level of remuneration that may be paid in the context of the performance delivered and value added for shareholders. The charts below are an illustration of how the CEO’s and CFO’s regular annual remuneration could vary under different performance scenarios. The salary, benefits and pension levels are the same in all three scenarios in each chart. Salary is based on 2017 salary. Benefits is based on the 2016 Single Total Figure table. Pension, annual incentive and LTIP are all based on the policy table’s award levels and percentages applied to the 2017 salary. Annual incentive amounts include theone-third portion which is subject to compulsory deferral into RELX shares for three years, although the deferral portion is separately identified within the annual incentive amount in the charts. The performance assumptions which have been used are as follows: Minimum means no AIP payout and no LTIP vesting. In line with expectations means AIP payout at 150% of salary (of whichone-third is deferred into shares) and LTIP vesting at half of the award. Maximum means AIP payout at 200% of salary (of whichone-third is deferred into shares) and LTIP vesting at 100% of the award.
No share price movement is assumed and any dividend equivalents payable in respect of the AIP deferred shares and the LTIP are not included.
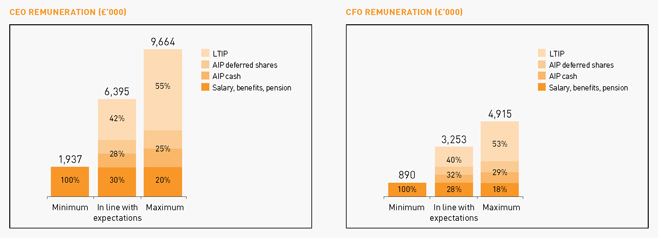
| | |
| 100 | | RELX Group Annual reports and financial statements 2017 |
|
|
Approach to recruitment remuneration – Executive Directors
When agreeing the components of a remuneration package on the appointment of a new Executive Director, or an internal promotion to the Board, the Committee would seek to align the package with the remuneration policy stated in the policy table. However, on an internal promotion to the Board, any existing contractual obligations and commitments may continue to be honoured, even if not consistent with the prevailing policy. For example, if the individual is a member of the legacy defined benefit pension scheme, the Committee will consider the pension arrangements in the context of the package as a whole and may allow continued participation.
The Committee’s general principle on recruitment is to offer a competitive remuneration package to attract high-calibre candidates from a global talent pool. Basic salary would be set at an appropriate level for the candidate, taking into account all relevant factors. As a data analytics and technology-driven business, with half of its revenue in the US, the company primarily competes for talent withUS-based information and technology companies.
The various components and the company’s approach are as follows:
Standard package on recruitment*
To offer remuneration in line with the policy table (including the limits), taking into account the principles set out above.
Compensation for forfeited entitlements
The Committee may make awards and payments on hiring an external candidate to compensate him or her for entitlements forfeited on leaving the previous employer. If such a decision is made, the Committee will attempt to reflect previous entitlements as closely as possible using a variety of tools, including cash and share based awards. Malus and claw-back provisions will apply where appropriate. If necessary to facilitate the grant of awards, the Committee may rely on the one person exemption from shareholder approval in the UK Listing Rules.
Relocation allowances and expenses
The type and size of relocation allowances and expenses will be determined by the specific circumstances of the new recruit.
*The standard package comprises annual base salary, retirement benefits, other benefits, AIP and LTIP.
Shareholding requirement
The Executive Directors are subject to shareholding requirements. These are a minimum of 400% of annual base salary for the CEO and 300% of annual base salary for other Executive Directors. On joining or promotion to the Board, Executive Directors are given a period of time, typically up to five years, to build up to their requirement.
Policy on payments for loss of office
In line with the company’s policy, the service contracts of the existing Executive Directors contain12-month notice periods.
The circumstances in which an Executive Director’s employment is terminated will affect the Committee’s determination of any payment for loss of office, but it expects to apply the principles outlined in the table on the next page. The Committee reserves the right to depart from these principles where appropriate in light of any taxation requirements to which the company or the Executive Director is subject (including, without limitation, section 409A of the US Internal Revenue Code), or other legal obligations. Treatment of legacy awards granted under multi-year incentive plans in which the Executive Directors no longer participate will be in accordance with those plans and the policy on payments for loss of office summarised in the Remuneration Policy Report in the 2013 Annual Reports and Financial Statements.
| | |
| Governance Directors’ Remuneration Report | | 101 |
|
|
Policy on payments for loss of office (continued)
| | |
GENERAL1 | | INCENTIVES |
| Mutually agreed termination/termination by the company other than for cause2 |
The Executive Director would be entitled to salary, benefits and other contractual payments in the normal way up to the termination date and would be paid for any accrued but untaken holiday. Salary:Payment of up to 12 months’ salary to reflect the notice period or payment in lieu of notice. Other benefits:Where possible, benefits would be continued for up to the duration of any unworked period of notice (not exceeding the maximum stated in the policy table) or the Executive Director would receive a cash payment (not exceeding the cost to the company of providing those benefits). | | Annual incentive:Any unpaid annual incentive for the previous year and apro-rata payment in respect of the part of the financial year up to the termination date would generally be payable (subject to the deferral provisions), with the amount being determined by reference to the original performance criteria. However, the Committee has discretion to decide otherwise depending on the reason for termination and other specific circumstances. The company would not pay any annual incentive in respect of any part of the financial year following the termination date (e.g. for any unworked period of notice). Any unvested AIP deferred shares would vest in full at the end of the deferral period. The annual incentive claw-back provisions would apply. |
Pension:Deferred or immediate pension in accordance with scheme rules, with a credit in respect of, or payment for up to, the full period of any unworked period of notice. There is provision under the defined benefit pension scheme for members leaving company service by reason of permanent incapacity to make an application to the scheme trustee for early payment of their pension. Other:The company may pay compensation in respect of any statutory employment rights and may make other appropriate and customary payments. The company would have due regard to principles of mitigation of loss. Reductions would be applied to reflect any portion of the notice period that is worked and/or spent on gardening leave. On injury, disability,ill-health or death, the Committee reserves the right to vary the treatment outlined in this section. | | LTIP:The default position is that unvested LTIP awards would bepro-rated to reflect time employed and would vest subject to performance measured at the end of the relevant performance period and subject to the Executive Director continuing to meet his shareholding requirement on apro-rated basis. The Committee has discretion to allow unvested LTIP awards to vest earlier and to adjust the application of timepro-rating and performance conditions, subject to the plan rules. |
Employee instigated resignation The Executive Director would not receive any payments for loss of office. The Executive Director would be entitled to salary, benefits and other contractual payments in the normal way up to the termination date and would be paid for any accrued but untaken holiday. Pension:A deferred or immediate pension would be payable in accordance with the scheme rules. | | Annual incentive:The Executive Director would be entitled to receive an annual incentive for a completed previous year (subject to the deferral provisions), but not apro-rated annual incentive in respect of a part year up to the termination date, unless the Committee decides otherwise in the specific circumstances. Any unvested AIP deferred shares would vest in full at the end of the deferral period. Annual incentive claw-back provisions would apply. LTIP:All outstanding LTIP awards would lapse on the date of notice. |
Dismissal for cause The Executive Director would be entitled to salary, benefits and other contractual payments in the normal way up to the termination date and would be paid for any accrued but untaken holiday, but would not receive any payments for loss of office. Pension:A deferred or immediate pension would be payable in accordance with the scheme rules. | | Annual incentive:The Executive Director would not receive any unpaid annual incentive. Any unvested AIP deferred shares lapse on the date of dismissal. LTIP:All outstanding LTIP awards would lapse on the date of dismissal. |
| 1. | In addition to what is set out in this section, on termination for any reason, Erik Engstrom will be entitled to payment of amounts held in his “Retirement Account”. Before he joined the company’s UK defined benefit scheme, he was not a member of any company pension scheme and RELX made annual contributions of 19.5% of base salary to a deferred compensation plan. Contributions to this Retirement Account ceased when he became a member of the UK defined benefit arrangement. |
| 2. | In cases where the approved leaver treatment applies, the AIP and LTIP have a default position as well as giving the Committee discretion to adjust the default treatment within certain parameters. The Committee would only expect to exercise such discretion where the Committee believes the personal circumstances of the Executive Director so require. |
| | |
| 102 | | RELX Group Annual reports and financial statements 2017 |
|
|
Remuneration policy table –Non-Executive Directors
FEES
Purpose and link to strategy
To enable RELX to recruitNon-Executive Directors with the right balance of personal skills and experience to make a major contribution to the Boards and Committees of a global business which is listed in London, Amsterdam and New York.
Operation
RELX Chairman: Receives an aggregate annual fee with no additional fees, e.g. Committee Chairman fees. In respect of RELX PLC and RELX Group plc, the Committee determines, on the advice of the Senior Independent Director, the Chairman’s fee. In respect of RELX NV, the Committee makes a recommendation, on the advice of the Senior Independent Director, to the Board of RELX NV, which determines the Chairman’s fee.
OtherNon-Executive Directors: Receive an aggregate annual fee in respect of their memberships of the Boards of RELX PLC, RELX NV and RELX Group plc. Additional fees are payable to the Senior Independent Director and Committee Chairmen. Fees are also payable for membership of Board Committees. In future, attendance or international travel fees may be paid. The Boards determine the level of fees, subject to applicable law.
Fees may be reviewed annually, although in practice they have changed on a less frequent basis. When reviewing fees, consideration is given to the time commitment required, the complexity of the role and the calibre of the individual. Periodically, comparative market data is also reviewed, the primary source for which is the practice of FTSE 30 companies, with reference also to the Euronext Amsterdam (AEX) index andUS-listed companies.
Maximum value
The aggregate annual fee limit for fees paid to the Chairman and theNon-Executive Directors in respect of their memberships of the Boards of RELX PLC, RELX NV and RELX Group plc is approximately £2m. The shareholders of RELX PLC and RELX Group plc have approved a maximum total annual fee limit of £500,000 and £1,000,000 respectively. Additional fees for membership of or chairing Board Committees and assuming additional responsibilities such as acting as Senior Independent Director, are not subject to these maximum limits. The shareholders of RELX NV have approved a maximum annual fee limit of€600,000 for all fees borne by RELX NV.
OTHER BENEFITS
Purpose and link to strategy
To provide competitive benefits at appropriate cost.
Operation
Other benefits forNon-Executive Directors are reviewed periodically and may include private medical cover, tax return preparation costs, secretarial benefits, car benefits, travel and related subsistence costs, including, where appropriate, the tax on such benefits.
Maximum value
There is no prescribed maximum amount.
Approach to recruitment remuneration –Non-Executive Directors
Following recruitment, a newNon-Executive Director will be entitled to fees and other benefits in accordance with the company’s remuneration policy. No additional remuneration is paid on recruitment. However, any reasonable expenses incurred during the recruitment process will be reimbursed.
Policy on payments for loss of office –Non-Executive Directors
In addition to unpaid accrued fees, theNon-Executive Directors are entitled to receive one month’s fees for loss of office if their appointment is terminated before the end of its term.
Service contracts and letters of appointment
There are no further obligations in the Directors’ service contracts and letters of appointment which are not otherwise disclosed in this Report which could give rise to a remuneration payment or loss of office payment. All Directors’ service contracts and letters of appointment are available for inspection at the company’s registered office. The Executive Directors’ service contracts do not have a fixed expiry date.
Consideration of employment conditions elsewhere in the company
When the Committee reviews the Executive Directors’ salaries annually, it takes into account the company’s guidelines for salaries for all employees for the forthcoming year. We do not currently use any other remuneration comparison metrics when determining the quantum and structure of Directors’ pay. We have not consulted with employees in connection with our policy on Directors’ remuneration.
Consideration of shareholder views
Our practice is to consult shareholders and consider their views when formulating, or changing, our policy. Before the current policy was approved by shareholders at the 2017 AGMs, the Committee consulted extensively with shareholders (representing a total of over 45% of the company’s combined PLC and NV issued share capital) and shareholder representative bodies in the UK, the Netherlands and the US on the proposed new remuneration policy. We were grateful for the constructive feedback, which was taken into account in our final proposals.
Previous remuneration policy and prior commitments
Any payments which are still to be made under arrangements made and awards granted under the previous remuneration policy (which is included in the 2013 Annual Reports and Financial Statements and was approved by RELX PLC shareholders at the 2014 Annual General Meeting) will be made consistent with that policy. The provisions of the previous policy which relate to arrangements and awards granted under the previous policy will therefore continue to apply until all payments in relation to those arrangements and awards have been made.
The Committee also reserves the right to make any remuneration or loss of office payments if the terms were agreed prior to the approval of the previous policy or prior to an individual being appointed as a Director.
| | |
| Governance Report of the Audit Committees | | 103 |
|
|
Report of the Audit Committees
This report has been prepared by the Audit Committees of RELX PLC and RELX NV in conjunction with the Audit Committee of RELX Group plc (the Committees) and has been approved by the respective Boards. It provides an overview of the membership, responsibilities and activities of the Committees. The RELX PLC and RELX NV Audit Committees fulfil their roles from the perspective of the respective companies and both Committees have access to the reports to and the work of the RELX Group plc Audit Committee in this respect.
|
Membership The Committees comprise at least three independentNon-Executive Directors. The members of each of the Committees who served during the year were: ◾ Ben van der Veer (Chairman of the Committees) ◾ Adrian Hennah ◾ Linda Sanford (until 26 September 2017) ◾ Marike van Lier Lels ◾ Carol Mills ◾ Suzanne Wood (from 26 September 2017) Adrian Hennah, a UK chartered accountant, Suzanne Wood, a US chartered accountant, and Ben van der Veer, a registered accountant in the Netherlands, are considered to have significant, recent and relevant financial experience. The Committees as a whole are deemed to have competence relevant to the sectors in which RELX operates. Please see pages 66 and 67 for full profiles of Audit Committee members. |
|
Responsibilities The main role and responsibilities of the Committees are to assist the respective Boards in fulfilling their oversight responsibilities regarding: ◾ the integrity of the Group’s interim and full year financial statements and financial reporting processes; ◾ risk management and internal controls, and the effectiveness of the internal auditors; and ◾ the performance of the external auditors and the effectiveness of the external audit process, including monitoring the independence and objectivity of Ernst & Young. The Committees report to the respective Boards on their activities, identifying any matters in respect of which they consider that action or improvement is needed and making recommendations as to the steps to be taken. The terms of reference of each Audit Committee are reviewed annually and a copy of each is published on the Group’s website,www.relx.com |
Committee meetings
The Committees met four times during 2017. The Audit Committee meetings are typically attended by the RELX Chief Executive Officer, the RELX Chief Financial Officer, the RELX Financial Controller, the RELX Chief Legal Officer, the RELX Head of Audit and Risk, and audit partners from the external auditors.
Financial reporting
In discharging their responsibilities in respect of the 2017 interim and full year financial statements, the Committees have:
| ◾ | | reviewed and discussed areas of significant judgement in the preparation of the financial statements, including in particular: |
| | i. | the carrying values of goodwill and intangible assets – the significant judgements in respect of asset carrying values relate to the assumptions underlying the value in use calculations including discount rates and long-term growth assumptions. The Committees received and discussed reports from the RELX Financial Controller on the methodology and the basis of the assumptions used; |
| | ii. | capitalisation of internally generated intangible assets – the capitalisation of costs related to the development of new products and business infrastructure, together with the useful economic lives applied to the resulting assets, requires the exercise of judgement. The Committees received reports from the RELX Financial Controller on the amounts capitalised and asset lives selected for major projects; |
| | iii. | uncertain tax positions – assessing potential liabilities across numerous jurisdictions is complex and requires judgement in making tax determinations. The Committees received and discussed reports from the RELX Head of Taxation on the potential liabilities identified and judgements applied; |
| | iv. | reviewed the recognition of certain pension scheme liabilities which are subject to judgement. The Committees received and discussed reports from the RELX Financial Controller on the methodology and the basis of the assumptions used; |
| ◾ | | reviewed the critical accounting policies and compliance with applicable accounting standards, including the preparations for IFRS 9, 15 and 16, reviewed other disclosure requirements and received regular update reports on accounting and regulatory developments, including a review of compliance with the Dutch Corporate Governance Code which was issued on 8 December 2016; |
| ◾ | | received and considered the Financial Reporting Council’s audit quality review of Ernst & Young’s audit of the Group’s financial statements for the year ended 31 December 2016. There were no significant findings from the review; |
| ◾ | | reviewed the disclosures made in relation to internal control, risk management, the going concern statement and the viability statement. The Committees received and discussed reports from the RELX Head of Audit and Risk and the RELX Treasurer on the processes undertaken and assumptions used in formulating these disclosures; and |
| ◾ | | considered whether the Annual Report taken as a whole was fair, balanced and understandable. |
The Committees also received detailed written and verbal reports from the external auditors on these matters. The Committees were satisfied with the explanations provided and conclusions reached.
| | |
| 104 | | RELX Group Annual reports and financial statements 2017 |
|
|
Risk management and internal controls
With respect to their oversight of risk management and internal controls, the Committees have:
| ◾ | | received and discussed regular reports summarising the status of the Group’s risk management activities, including actions to mitigate risks, and the findings from internal audit reviews and the actions agreed with management. Areas of focus in 2017 included: operational and financial controls; regulatory compliance; business continuity and resilience; review of information (cyber) security; data privacy (including the EU General Data Protection Regulation readiness); post acquisition integration; and continued compliance with the requirements of Section 404 of the US Sarbanes-Oxley Act relating to the documentation and testing of internal controls over financial reporting; |
| ◾ | | reviewed and approved the internal audit plan for 2018 and monitored execution of the 2017 plan, including progress in respect of recommendations made; |
| ◾ | | reviewed the resources, terms of reference and effectiveness of the RELX Group plc risk management and internal audit functions, including the results of an independent external review of the internal audit function; |
| ◾ | | received presentations from: the RELX Chief Compliance Officer on the compliance programmes, including the operation of the Group’s codes of conduct, training programmes and whistleblowing arrangements and the RELX Chief Legal Officer on legal issues and claims; |
| ◾ | | received reports from the RELX Chief Strategy Officer and Chief Legal Officer on information security and other technology-related risks; |
| ◾ | | received updates from the RELX Treasurer on pension arrangements and funding, treasury policies and risk management and compliance with treasury policies; |
| ◾ | | received presentations from the RELX Head of Taxation on tax policies and related matters; |
| ◾ | | received regular updates from the RELX Chief Financial Officer on developments within the finance function; and |
| ◾ | | received presentations from chief financial officers of major businesses. |
External audit effectiveness
The Group has a well-established policy on audit effectiveness and independence of auditors that sets out amongst other things: the responsibilities of each Audit Committee in the selection of auditors to be proposed for appointment orre-appointment and for agreement on the terms of their engagement, scope and remuneration; the auditor independence requirements and the policy on the provision ofnon-audit services; the rotation of audit partners and staff; and the conduct of meetings between the auditors and the Audit Committees. The policy is available on the website, www.relx.com
The auditors are precluded from engaging innon-audit services that would compromise their independence or violate any professional requirements or regulations affecting their appointment as auditors. The auditors may, however, providenon-audit services which do not conflict with their independence, and where their skills and experience make them a logical supplier, subject topre-approval by the Audit Committees.
Non-audit services performed in the Netherlands are limited to audit assurance activities. The Committees will continue to review the policy on the provision ofnon-audit services in the light of ongoing regulatory developments.
The Committees have, each quarter, reviewed and agreed thenon-audit services provided in 2017, together with the associated fees which are set out in note 4 to the consolidated financial statements. Thenon-audit services provided were in the areas of audit-related activities, such as royalty assurance, and compliance, due diligence and other transaction-related services.
The external auditors have confirmed their independence and compliance with the Group policy on auditor independence to the Audit Committees.
Ernst &Young LLP and Ernst & Young Accountants LLP were first appointed auditors of RELX PLC, RELC NV and RELX Group plc for the financial year ended 31 December 2016. The auditors are required to rotate the lead audit partners responsible for the audit engagements every five years. The year ended 31 December 2017 was the second year for the lead engagement partner for RELX PLC, Nigel Jones, and for the lead engagement partner for RELX NV, Guus van Eimeren. The Audit Committees confirm that they were in compliance with the provisions of The Statutory Audit Services for Large Companies Market Investigation (Mandatory Use of Competitive Tender Processes and Audit Committee Responsibilities) Order 2014 during the financial year ended 31 December 2017.
The Committees have conducted their review of the performance of the external auditors and the effectiveness of the external audit process for the year ended 31 December 2017. The review was based on a survey of key stakeholders across the Group, consideration of public reports by regulatory authorities on key Ernst & Young member firms and the quality of the auditors’ reporting to and interaction with the Audit Committees. Based on this review, the Audit Committees were satisfied with the performance of the auditors and the effectiveness of the audit process.
Audit Committee effectiveness
The effectiveness of the Audit Committees was reviewed as part of the 2017 evaluation of the Boards which confirmed that the Committees continue to function effectively. Details of the evaluation are set out on page 77.
Ben van der Veer
Chairman of the Audit Committees
14 February 2018
| | |
| Financial statements and other financial information | | 105 |
|
|

Financial
statements
and other
information
In this section
| | |
| 106 | | RELX Group Annual reports and financial statements 2017 |
|
|
Independent auditors’ report
| | |
UNITED KINGDOM – Ernst & Young LLP TO: THE MEMBERS OF RELX PLC | | NETHERLANDS – Ernst & Young Accountants LLP TO: THE GENERAL MEETING OF RELX NV |
For the purpose of these reports, the terms ‘we’ and ‘our’ denote Ernst & Young LLP in relation to the UK responsibilities and reporting obligations to the Members of RELX PLC and Ernst & Young Accountants LLP in relation to Dutch responsibilities and reporting obligations to the General Meeting of RELX NV. RELX PLC and RELX NV jointly own RELX Group plc, which holds all the operating businesses and financing activities. RELX PLC, RELX NV, RELX Group plc and its subsidiaries, joint ventures and associates are together known as ‘the Group’. The reports of Ernst & Young LLP and Ernst & Young Accountants LLP are presented in the left and right hand columns of this report respectively. Where separate columns are not presented, the content of the reports of Ernst & Young LLP and Ernst & Young Accountants LLP are identical unless clearly marked otherwise.
The financial statements (‘the Financial Statements’), which are defined below, comprise:
| ◾ | | the consolidated financial statements of the Group (‘the Consolidated Financial Statements’); |
| ◾ | | the parent company financial statements of RELX PLC (‘the PLC Company Accounts’); and |
| ◾ | | the parent company financial statements of RELX NV (‘the NV Company Accounts’). |
1. OPINIONS
We have audited the Consolidated Financial Statements of the Group, which is based in London and Amsterdam, for the year ended 31 December 2017 which comprise the consolidated statement of financial position as at 31 December 2017, the consolidated income statement, the consolidated statement of comprehensive income, the consolidated statement of cash flows, and the consolidated statement of changes in equity for the year then ended and notes to the Consolidated Financial Statements 1 to 32, including a summary of the significant accounting policies and other explanatory information.
In addition, Ernst & Young LLP has audited the PLC Company Accounts (which comprise the company statement of financial position as at 31 December 2017, the company statement of changes in equity for the year ended 31 December 2017 and the notes 1 to 5 including a summary of the significant accounting policies and other explanatory information) and Ernst & Young Accountants LLP has audited the NV Company Accounts, based in Amsterdam, (which comprise the company statement of financial position as at 31 December 2017, the company statement of comprehensive income, and the company statement of changes in equity for the year ended 31 December 2017 and the notes 1 to 8 to the NV Company Accounts, including the summary of the significant accounting policies and other explanatory information).
| | | | |
| RELX PLC | | | | RELX NV |
| In our opinion: | | | | In our opinion: |
◾ the Consolidated Financial Statements and the PLC Company Accounts give a true and fair view of the state of the Group’s and of RELX PLC’s affairs as at 31 December 2017 and of the Group’s profit for the year then ended; ◾ the Consolidated Financial Statements have been properly prepared in accordance with International Financial Reporting Standards (‘IFRS’) as adopted by the European Union; ◾ the PLC Company Accounts have been properly prepared in accordance with United Kingdom Generally Accepted Accounting Practice; and ◾ both the Consolidated Financial Statements and the PLC Company Accounts have been prepared in accordance with the requirements of the Companies Act 2006, and, as regards the group financial statements, Article 4 of the IAS Regulation. | | | | ◾ the Consolidated Financial Statements give a true and fair view of the financial position of the Group as at 31 December 2017 and of its result and its cash flows for the year then ended in accordance with International Financial Reporting Standards (‘IFRS’) as adopted by the European Union and as issued by the International Accounting Standards Board and with Part 9 of Book 2 of the Dutch Civil Code; and ◾ the NV Company Accounts give a true and fair view of the financial position of RELX NV as at 31 December 2017 and of its result for 2017 in accordance with FRS 101 ‘Reduced Disclosure Framework’ as a result of applying Section 362 (1) of Book 2 of the Dutch Civil Code. |
The financial reporting framework that has been applied in the preparation of the group financial statements is applicable law and International Financial Reporting Standards (IFRSs) as adopted by the European Union. The financial reporting framework that has been applied in the preparation of the PLC Company Accounts and the NV Company Accounts financial statements is applicable law and United Kingdom Accounting Standards, including FRS 101 “Reduced Disclosure Framework” (United Kingdom Generally Accepted Accounting Practice).
| | |
| Financial statements and other information Independent auditors’ report | | 107 |
|
|
2. BASIS FOR OPINIONS
| | | | |
| RELX PLC | | | | RELX NV |
We conducted our audit in accordance with International Standards on Auditing (UK) (ISAs (UK)) and applicable law. Our responsibilities under those standards are further described in the Auditor’s responsibilities for the audit of the financial statements section 10 of our report below. We are independent of RELX Group and RELX PLC in accordance with the ethical requirements that are relevant to our audit of the financial statements in the UK, including the FRC’s Ethical Standard as applied to listed public interest entities, and we have fulfilled our other ethical responsibilities in accordance with these requirements. We believe that the audit evidence we have obtained is sufficient and appropriate to provide a basis for our opinion. | | | | We conducted our audit in accordance with Dutch law, including the Dutch Standards on Auditing. Our responsibilities under those standards are further described in the ‘Auditor’s responsibilities’ section 10 of our report. We are independent of RELX Group in accordance with the Verordening inzake de onafhankelijkheid van accountants bij assurance-opdrachten (ViO, Code of Ethics for Professional Accountants, a regulation with respect to independence) and other relevant independence regulations in the Netherlands. Furthermore we have complied with the Verordeninggedrags-en beroepsregels accountants (VGBA, Dutch Code of Ethics). We believe that the audit evidence we have obtained is sufficient and appropriate to provide a basis for our opinion. |
3. USE OF OUR REPORT
| | | | |
| RELX PLC | | | | |
| This report is made solely to the company’s members, as a body, in accordance with Chapter 3 of Part 16 of the Companies Act 2006. Our audit work has been undertaken so that we might state to the company’s members those matters we are required to state to them in an auditor’s report and for no other purpose. To the fullest extent permitted by law, we do not accept or assume responsibility to anyone other than the company and the company’s members as a body, for our audit work, for this report, or for the opinions we have formed. | | | | |
4. CONCLUSIONS RELATING TO PRINCIPAL RISKS, GOING CONCERN AND VIABILITY STATEMENT
| | | | |
| RELX PLC | | | | |
We have nothing to report in respect of the following information in the annual report, in relation to which the ISAs(UK) require us to report to you whether we have anything material to add or draw attention to: ◾ the disclosures in the annual report set out on pages 60 to 63 that describe the principal risks and explain how they are being managed or mitigated; ◾ the directors’ confirmation set out on page 60 in the annual report that they have carried out a robust assessment of the principal risks facing the entity, including those that would threaten its business model, future performance, solvency or liquidity; ◾ the directors’ statement set out on page 79 in the financial statements about whether they considered it appropriate to adopt the going concern basis of accounting in preparing them, and their identification of any material uncertainties to the entity’s ability to continue to do so over a period of at least twelve months from the date of approval of the financial statements ◾ whether the directors’ statement in relation to going concern required under the Listing Rules in accordance with Listing Rule 9.8.6R(3) is materially inconsistent with our knowledge obtained in the audit; or ◾ the directors’ explanation set out on page 80 in the annual report as to how they have assessed the prospects of the entity, over what period they have done so and why they consider that period to be appropriate, and their statement as to whether they have a reasonable expectation that the entity will be able to continue in operation and meet its liabilities as they fall due over the period of their assessment, including any related disclosures drawing attention to any necessary qualifications or assumptions. | | | | |

| | |
| 108 | | RELX Group Annual reports and financial statements 2017 |
|
|
5. OVERVIEW OF OUR AUDIT APPROACH
| | |
| Key audit matters | | ◾ Uncertain tax positions |
| |
| | ◾ Internally developed intangible assets |
| |
| | ◾ Aspects of revenue recognition |
| |
| | ◾ Carrying value of goodwill and acquired intangible assets |
| |
| | ◾ Finance systems |
| |
| Audit scope | | ◾ We performed an audit of the complete financial information of 6 components and audit procedures on specific balances for a further 5 components. |
| |
| | ◾ The components where we performed full or specific audit procedures accounted for 79% of absolute profit before tax, 78% of revenue and 78% of total assets. |
| |
| Materiality | | ◾ Overall Group materiality of £86.7m which represents approximately 5% of profit before tax. |
6. KEY AUDIT MATTERS
Key audit matters are those matters that, in our professional judgment, were of most significance in our audit of the financial statements of the current period and include the most significant assessed risks of material misstatement (whether or not due to fraud) that we identified. These matters included those which had the greatest effect on: the overall audit strategy, the allocation of resources in the audit; and directing the efforts of the engagement team. These matters were addressed in the context of our audit of the financial statements as a whole, and in our opinion thereon, and we do not provide a separate opinion on these matters. We have communicated the key audit matters to the Boards. The key audit matters are not a comprehensive reflection of all matters discussed.
| | | | |
RISK | | OUR RESPONSE TO THE RISK | | KEY OBSERVATIONS COMMUNICATED TO THE AUDIT COMMITTEES |
Uncertain tax positions | | | | Risk direction: |
Refer to the Report of the Audit Committees on page 103 and note 10 Taxation of the Consolidated Financial Statements on page 134 |
The Group is subject to tax in numerous jurisdictions. Its complex organisation and operational structure gives rise to potential tax exposures that require management to exercise judgement in making determinations as to the amount of tax that is payable. The Group reports cross-border transactions undertaken between subsidiaries on anarm’s-length basis in tax returns in accordance with Organisation for EconomicCo-operation and Development (OECD) guidelines. However, transfer pricing relies on the exercise of judgement and it is frequently possible for there to be a range of legitimate and reasonable views. The Group is subject to tax authority audits as a matter of routine and has a number of open tax enquiries. As a result, it has recognised a number of provisions against uncertain tax positions, the valuation of which requires significant judgement. We focused on this area due to the significance of the balance and the subjectivity in determining the quantification of the provision and the judgement around the trigger for recognition or release. There is a risk that the tax provisions may be incorrectly quantified, impacting the provision and the effective tax rate. | | Procedures on the uncertain tax positions were performed centrally by the Group team supported by overseas teams including specialists: ◾ We assessed the processes and tested controls over the tax provisioning process. ◾ We met with tax management to understand the Group cross-border transactions, status of all significant provisions, and any changes to management’s judgements in the year. ◾ We read correspondence with tax authorities and external advisors to inform our assessment of recorded estimates and evaluate the completeness of the provisions recorded. ◾ We evaluated management’s methodology to record or release provisions following tax audits, settlements and the expiry of timeframes. ◾ We tested the calculation of the year end provisions by inspecting underlying documentation and supporting schedules. | | We concluded that management’s judgements in relation to the extent of provisions for uncertain tax positions are appropriate. |
| | |
| Financial statements and other information Independent auditors’ report | | 109 |
|
|
| | | | |
RISK | | OUR RESPONSE TO THE RISK | | KEY OBSERVATIONS COMMUNICATED TO THE AUDIT COMMITTEES |
Internally developed intangible assets | | | | Risk direction: |
Refer to the Report of the Audit Committees on page 103 and note 16 Intangible assets of the Consolidated Financial Statements on page 143 |
The Group capitalised internally developed intangible assets of £304 million in the current year (2016: £280 million). The capitalisation of costs related to the development of new products and business infrastructure, together with the useful economic lives applied to the resulting assets, requires the exercise of judgement. We focused on this area as the Group has invested significantly in a number of projects across the business. It is inherently judgemental with respect to technical feasibility, intention and ability to complete the intangible asset, ability to use or sell the asset, generation of future economic benefits and the ability to measure the costs reliably. This results in a risk that expenditures may be inappropriately capitalised, amortised or valued. | | We performed full and specific scope audit procedures over this risk area in 6 locations, which covered 86% of the account balance: ◾ We assessed the processes and tested controls for the capitalisation of internally generated intangible assets and identification of indicators of impairment. ◾ We assessed the accounting policy and methodology for capitalisation of expenditures. ◾ We evaluated the accuracy and valuation of amounts capitalised to assess that costs are directly attributable and necessary to create, produce, and prepare the asset to be capable of operating in the manner intended by management. ◾ We assessed management’s consideration as to whether indicators of impairment existed based on the ongoing business rationale, including the stage of completion for internally developed intangible assets. Where indicators were present, we assessed management’s recovery projections to determine the reasonableness of judgements on expected cash flows that support recovery of the intangible balance. | | We did not identify any evidence of material misstatement in the internally developed intangible assets balance. |
Aspects of revenue recognition | | | | Risk direction: |
Refer to note 2 Segment Analysis of the Consolidated Financial Statements on page 124 |
The Group earns revenue from a variety of sources among the different business areas, including annual subscriptions, transactional usage and exhibition fees. The nature of the risk associated with the accurate recording of revenue varies. We recognise that revenue is a key metric upon which the Group is judged, that the Group has annual internal targets, and that the Group has incentive schemes that are partially impacted by revenue growth. We have determined that there is a risk in relation to each of the business areas reflective of the opportunity to commit fraud in the respective revenue streams through manual adjustments or override of controls by management. | | We performed full and specific scope audit procedures over this risk area in 10 locations, which covered 78% of the risk amount. We performed procedures to address the specific risk in each business area. ◾ We assessed the processes and tested controls over each significant revenue stream. ◾ We evaluated the appropriateness of journal entries impacting revenue, as well as other adjustments made in the preparation of the financial statements. We considered unusual journals such as those posted outside of expected days, or by unexpected individuals. We also evaluated management’s controls over such adjustments. ◾ We inspected a sample of contracts to check that revenue recognition was in accordance with the contract terms and the group’s revenue recognition policies. ◾ We tested a sample of transactions around period end to test that revenue was recorded in the correct period. ◾ For revenue streams which have judgemental elements, we evaluated management’s assumptions. | | We did not identify evidence of material misstatement in the revenue recognised in the year. |
| | |
| 110 | | RELX Group Annual reports and financial statements 2017 |
|
|
6. KEY AUDIT MATTERS (CONTINUED)
| | | | |
| RISK | | OUR RESPONSE TO THE RISK | | KEY OBSERVATIONS COMMUNICATED |
| | | | | TO THE AUDIT COMMITTEES |
Carrying value of goodwill and acquired intangible assets | | Risk direction: |
Refer to the Report of the Audit Committees on page 103 and note 15 Goodwill and note 16 Intangible assets of the Consolidated Financial Statements on pages 142 and143, respectively |
| We focused on this area due the size of the goodwill balance of £5,965 million (2016: £6,392 million) and acquired intangible assets net book amount of £2,058 million (2016: £2,519 million) and because the Directors’ assessment of the value in use of the Group’s Cash Generating Units (‘CGU’) involves judgement about the future results of the Group and the discount rates applied to cash flow forecasts, and any consequential impairment that may be necessary. | | We assessed the key information used in determining the valuation including the weighted average cost of capital, cash flow forecasts and the implicit growth, utilising our specialist support as necessary. We also conducted a sensitivity analysis to understand how much these projections would need to change by for there to be an impairment. We assessed management’s annual goodwill and indefinite lived acquired intangible asset impairment review as well as management’s consideration as to whether indicators of impairment existed for finite lived acquired intangible assets. Where indicators were present for acquired intangible assets, we focused on the key judgements in the impairment review calculations, for example, the expected cash flows and future benefits as compared to the costs where applicable. | | We noted the assumptions relating to the impairment models fell within acceptable ranges. We agree with management’s conclusion that no material impairment of goodwill or intangible assets were required in the year. |
Finance systems | | | | Risk direction: |
| The Group has many IT systems which are vital to the ongoing operations and to the integrity of the financial reporting process. Due to the global nature of the Group and its operations, the applications, associated infrastructure and IT processes which support significant business and financial processes are spread across a number of locations. These are delivered by a mix ofin-house teams and third party support providers who on occasion reside in different countries from the physical location of the IT infrastructure or the location of the RELX business users. Understanding the IT environment including interfaces between them was an area of audit focus to assess if transactions are being processed accurately. | | We utilised IT auditors to support our evaluation of the design and operation of IT controls to address the Group’s control objectives and financial reporting risks. ◾ We made inquiries of management to understand the IT environment and walked through the financial processesend-to-end in order to understand where IT systems were integral to the Group accounting processes, as applicable. ◾ We performed data analytic procedures in certain locations and business areas to understand the flow of transactions and perform specific test procedures. ◾ We tested the IT general controls environment for the key applications. ◾ Where appropriate, we received reports from the service auditors of the outsourced systems and evaluated the adequacy of the work performed and followed up on matters arising, performing further procedures as necessary. ◾ Where required, we tested compensating controls or performed alternative procedures to complement the controls based audit approach. | | Our understanding and testing of IT systems and controls supported our audit approach. |
In the prior year, our auditor’s report included a key audit matter in relation to Transition as auditor, including auditing opening balances. As this is our second year auditing the Group, the key audit matter relating to audit transition is no longer applicable.
| | |
| Financial statements and other information Independent auditors’ report | | 111 |
|
|
7. AN OVERVIEW OF THE SCOPE OF OUR AUDIT
Tailoring the scope
Our assessment of audit risk, our evaluation of materiality and our allocation of performance materiality determine our audit scope for each entity within the Group. Taken together, this enables us to form an opinion on the consolidated financial statements. We take into account size, risk profile, the organisation of the group and effectiveness of group-wide controls, changes in the business environment and other factors such as recent Internal audit results when assessing the level of work to be performed at each entity.
The Group has centralised processes for key judgements and determination of accounting policies. Certain areas of audit focus, namely internally developed intangible assets, revenue recognition, and IT system management are decentralised processes delineated by business area. We have tailored our audit response accordingly and procedures for the areas of focus were performed or directed by the Group audit team.
In assessing the risk of material misstatement to the Group financial statements, and to ensure we had adequate quantitative coverage of significant accounts in the financial statements, of the reporting components of the Group, we selected eleven components covering entities within United Kingdom, the Netherlands, the United States, France, and Switzerland, which represent the principal business units within the Group.
Of the eleven components selected, we performed an audit of the complete financial information of six components (“full scope components”) which were selected based on their size or risk characteristics. For the remaining five components (“specific scope components”), we performed audit procedures on specific accounts within that component that we considered had the potential for the greatest impact on the significant accounts in the financial statements either because of the size of these accounts or their risk profile.
The reporting components where we performed audit procedures accounted for 79% (2016: 83%) of the Group’s profit before tax on an absolute basis1, 78% (2016: 83%) of the Group’s Revenue and 78% (2016: 82%) of the Group’s Total assets. For the current year, the full scope components contributed 57% (2016: 57%) of the Group’s profit before tax on an absolute basis, 70% (2016: 75%) of the Group’s revenue and 70% (2016: 72%) of the Group’s total assets. The specific scope component contributed 22% (2016: 26%) of the Group’s profit before tax on an absolute basis, 8% (2016: 8%) of the Group’s revenue and 8% (2016: 10%) of the Group’s total assets. The audit scope of these components may not have included testing of all significant accounts of the component but will have contributed to the coverage of significant accounts tested for the Group.
Of the remaining components that together represent 21% of the Group’s profit before tax on an absolute basis, none are individually greater than 2.1% of the Group’s profit before tax on an absolute basis. For these components, we performed other procedures, including analytical review, review of internal audit reports, and testing of consolidation journals, intercompany eliminations and foreign currency translation recalculations at the Group level to respond to any potential risks of material misstatement to the Group financial statements.
The charts below illustrate the coverage obtained from the work performed by our audit teams.
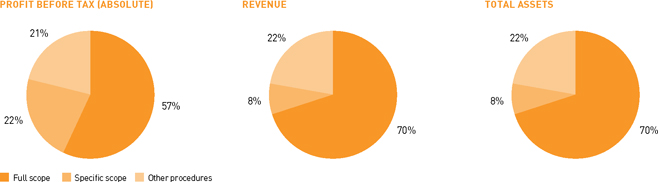
Changes from the prior year
Changes from the prior year include reducing two components from full to specific scope and reducing three components from specific scope to other procedures scope as part of our risk focused approach which reflects the experience gained from being in our second year as auditors.
Integrated team structure
The overall audit strategy is determined by the UK senior statutory auditor, Nigel Jones and Dutch statutory auditor Guus van Eimeren.
RELX Group plc is based in the UK, however, due to the structure of the RELX PLC and RELX NV ownership, the Group team includes members from both the UK and the Netherlands. The Dutch auditor travelled to the UK many times during the current year’s audit and members of the Group audit team in both jurisdictions work together as an integrated team. Both partners attended certain Audit Committee meetings during the course of the audit and concluded on key judgements.
| 1. | Coverage of profit before tax measured on an absolute basis for each component (components with a loss would be added to both the numerator and denominator). |
| | |
| 112 | | RELX Group Annual reports and financial statements 2017 |
|
|
7. AN OVERVIEW OF THE SCOPE OF OUR AUDIT (CONTINUED)
Involvement with component teams
In establishing our overall approach to the Group audit, we determined the type of work that needed to be undertaken at each of the components by us, as the primary audit engagement team, or by component auditors from other EY global network firms operating under our instruction. Of the six full scope components, audit procedures were performed on three of these directly by the Group audit team. For the five specific scope components, where the work was performed by component auditors, we determined the appropriate level of involvement to enable us to determine that sufficient audit evidence had been obtained as a basis for our opinion on the Group as a whole.
The Group audit team continued to follow a programme of planned visits that has been designed to ensure that the Senior Statutory Auditors, or another group audit partner, visit all full scope locations and specific scope locations on a rotational basis. During the current year’s audit cycle, visits were undertaken by the Group audit team to the component teams in United Kingdom, the Netherlands, the United States, France, and Switzerland. These visits involved meeting local management and discussing the audit approach with the component audit team and any issues arising from their work. The Group audit team also participated in key discussions, via conference calls with all full and specific scope locations. The primary team interacted regularly with the component teams where appropriate during various stages of the audit, reviewed key working papers and were responsible for the scope and direction of the audit process. This, together with the additional procedures performed at Group level, gave us appropriate evidence for our opinion on the Group financial statements.
8. OUR APPLICATION OF MATERIALITY
We apply the concept of materiality in planning and performing the audit, in evaluating the effect of identified misstatements on the audit and in forming our audit opinion.
Materiality
The magnitude of an omission or misstatement that, individually or in the aggregate, could reasonably be expected to influence the economic decisions of the users of the financial statements. Materiality provides a basis for determining the nature and extent of our audit procedures.
We determined materiality for the Group to be £86.7 million (2016: £74.0 million), which is 5% (2016: 5%) of profit before tax. We believe that this materiality basis provides us with the best assessment of the requirements of the users of the financial statements.
| | | | |
| RELX PLC | | | | RELX NV |
| We determined materiality for the PLC Company Accounts to be £63.4 million (2016: £31.3million), which is 2% (2016: 1%) of equity. Materiality has increased due to this being our second year auditing the company. | | | | We determined materiality for the NV Company Accounts to be€87.4 million (2016:€43.1 million), which is 2% (2016: 1%) of equity. Materiality has increased due to this being our second year auditing the company. |
Performance materiality
The application of materiality at the individual account or balance level. It is set at an amount to reduce to an appropriately low level the probability that the aggregate of uncorrected and undetected misstatements exceeds materiality.
On the basis of our risk assessments, together with our assessment of the Group’s overall control environment, our judgement was that performance materiality was 75% (2016: 75%) of our materiality, namely £65.0m (2016: £56.0m). We have set performance materiality at this percentage due to our assessment of the control environment and the historic lack of significant audit findings.
Audit work at component locations for the purpose of obtaining audit coverage over significant financial statement accounts is undertaken based on a percentage of total performance materiality. The performance materiality set for each component is based on the relative scale and risk of the component to the Group as a whole and our assessment of the risk of misstatement at that component. In the current year, the range of performance materiality allocated to components was £19.5m to £48.7m (2016: £13.5m to £33.8m).
Reporting threshold
An amount below which identified misstatements are considered as being clearly trivial.
We agreed with the Audit Committee that we would report to them all uncorrected audit differences in excess of £4.35m (2016: £3.7m), which is set at 5% of materiality, as well as differences below that threshold that, in our view, warranted reporting on qualitative grounds.
We evaluate any uncorrected misstatements against both the quantitative measures of materiality discussed above and in light of other relevant qualitative considerations in forming our opinion.
| | |
| Financial statements and other information Independent auditors’ report | | 113 |
|
|
9. OTHER REPORTING
| | | | |
| RELX PLC | | | | RELX NV |
Other information The other information comprises the information included in the annual report as set out on pages2-104, other than the financial statements and our auditor’s report thereon. The directors are responsible for the other information. Our opinion on the financial statements does not cover the other information and, except to the extent otherwise explicitly stated in this report, we do not express any form of assurance conclusion thereon. In connection with our audit of the financial statements, our responsibility is to read the other information and, in doing so, consider whether the other information is materially inconsistent with the financial statements or our knowledge obtained in the audit or otherwise appears to be materially misstated. If we identify such material inconsistencies or apparent material misstatements, we are required to determine whether there is a material misstatement in the financial statements or a material misstatement of the other information. If, based on the work we have performed, we conclude that there is a material misstatement of the other information, we are required to report that fact. We have nothing to report in this regard. In this context, we also have nothing to report in regard to our responsibility to specifically address the following items in the other information and to report as uncorrected material misstatements of the other information where we conclude that those items meet the following conditions: ◾ Fair, balanced and understandable set out on page 79– the statement given by the directors that they consider the annual report and financial statements taken as a whole is fair, balanced and understandable and provides the information necessary for shareholders to assess the group’s performance, business model and strategy, is materially inconsistent with our knowledge obtained in the audit; or ◾ Audit committee reporting set out on pages 103- 104 – the section describing the work of the audit committee does not appropriately address matters communicated by us to the audit committee; or ◾ Directors’ statement of compliance with the UK Corporate Governance Code set out on page 71 – the parts of the directors’ statement required under the Listing Rules relating to the company’s compliance with the UK Corporate Governance Code containing provisions specified for review by the auditor in accordance with Listing Rule 9.8.10R(2) do not properly disclose a departure from a relevant provision of the UK Corporate Governance Code. | | | | Report on other information included the annual report and financial statements In addition to the financial statements and our auditors’ report thereon, the annual reports and financial statements contain other information that consists of: ◾ Report of the Board of RELX NV; ◾ Other information pursuant to Part 9 of Book 2 of the Dutch Civil Code; ◾ 5 year summary; ◾ Other financial information; ◾ Shareholder information. Based on the following procedures performed, we conclude that the other information: ◾ is consistent with the financial statements and does not contain material misstatements; ◾ contains the information as required by Part 9 of Book 2 of the Dutch Civil Code. We have read the other information. Based on our knowledge and understanding obtained through our audit of the financial statements or otherwise, we have considered whether the other information contains material misstatements. By performing these procedures, we comply with the requirements of Part 9 of Book 2 of the Dutch Civil Code and the Dutch Standard 720. The scope of the procedures performed is less than the scope of those performed in our audit of the financial statements. Engagement We have been engaged by the General Meeting at 13 January 2016 as auditor of RELX NV since the audit of the year 2016 and we are the statutory auditor since that date up until today. |
| | |
| 114 | | RELX Group Annual reports and financial statements 2017 |
|
|
9. OTHER REPORTING (CONTINUED)
| | | | |
| Opinions on other matters prescribed by the Companies Act 2006 | | | | |
| | |
| In our opinion, the part of the directors’ remuneration report to be audited has been properly prepared in accordance with the Companies Act 2006. | | | | |
| | |
| In our opinion, based on the work undertaken in the course of the audit: | | | | |
| | |
◾ the information given in the strategic report and the directors’ report for the financial year for which the financial statements are prepared is consistent with the financial statements; and | | | | |
| | |
◾ the strategic report and the directors’ report have been prepared in accordance with applicable legal requirements. | | | | |
Matters on which we are required to report by exception | | | | |
| In the light of the knowledge and understanding of the group and the parent company and its environment obtained in the course of the audit, we have not identified material misstatements in the strategic report or the directors’ report. | | | | |
| | |
| We have nothing to report in respect of the following matters in relation to which the Companies Act 2006 requires us to report to you if, in our opinion: | | | | |
| | |
◾ adequate accounting records have not been kept by the parent company, or returns adequate for our audit have not been received from branches not visited by us; or | | | | |
| | |
◾ the parent company financial statements and the part of the Directors’ Remuneration Report to be audited are not in agreement with the accounting records and returns; or | | | | |
| | |
◾ certain disclosures of directors’ remuneration specified by law are not made; or | | | | |
| | |
◾ we have not received all the information and explanations we require for our audit. | | | | |
| | | | |
| | |
| Financial statements and other information Independent auditors’ report | | 115 |
|
|
10. SCOPE AND RESPONSIBILITIES
| | | | |
| RELX PLC | | | | RELX NV |
| Responsibilities of directors | | | | Directors’ and Audit Committee’s responsibilities |
As explained more fully in the directors’ responsibilities statement set out on page 171, the directors are responsible for the preparation of the financial statements and for being satisfied that they give a true and fair view, and for such internal control as the directors determine is necessary to enable the preparation of financial statements that are free from material misstatement, whether due to fraud or error. In preparing the financial statements, the directors are responsible for assessing the group and parent company’s ability to continue as a going concern, disclosing, as applicable, matters related to going concern and using the going concern basis of accounting unless the directors either intend to liquidate the group or the parent company or to cease operations, or have no realistic alternative but to do so. Auditor’s responsibilities for the audit of the financial statements Our objectives are to obtain reasonable assurance about whether the financial statements as a whole are free from material misstatement, whether due to fraud or error, and to issue an auditor’s report that includes our opinion. Reasonable assurance is a high level of assurance, but is not a guarantee that an audit conducted in accordance with ISAs (UK) will always detect a material misstatement when it exists. Misstatements can arise from fraud or error and are considered material if, individually or in the aggregate, they could reasonably be expected to influence the economic decisions of users taken on the basis of these financial statements. Explanation as to what extent the audit was considered capable of detecting irregularities, including fraud The objectives of our audit, in respect to fraud, are; to identify and assess the risks of material misstatement of the financial statements due to fraud; to obtain sufficient appropriate audit evidence regarding the assessed risks of material misstatement due to fraud, through designing and implementing appropriate responses; and to respond appropriately to fraud or suspected fraud identified during the audit. However, the primary responsibility for the prevention and detection of fraud rests with both those charged with governance of the entity and management. Our approach was as follows: ◾ We obtained an understanding of the legal and regulatory frameworks that are applicable to the group and determined that the most significant are those that relate to the reporting framework (IFRS, FRS 101, the Companies Act 2006 and UK Corporate Governance Code) and the relevant tax compliance regulations in the jurisdictions in which the group operates. ◾ We understood how RELX Group is complying with those frameworks making enquiries of management, internal audit, those responsible for legal and compliance procedures and the company secretary. We corroborated our enquiries through our review of board minutes and papers provided to the Audit Committee. | | | | The Directors are responsible for: ◾ the preparation and fair presentation of the Consolidated Financial Statements in accordance with IFRSs as adopted by the European Union and Part 9 of Book 2 of the Dutch Civil Code; ◾ the preparation and fair presentation of the NV Company Accounts in accordance with FRS 101 ‘Reduced Disclosure Framework’ as a result of applying Section 362 (1) of Book 2 of the Dutch Civil Code; ◾ the preparation of the other information, including the report of the Board in accordance with Part 9 of Book 2 of the Dutch Civil Code and other information pursuant to Part 9 of Book 2 of the Dutch Civil Code; ◾ such internal control as the directors determine is necessary to enable the preparation of the Financial Statements that are free from material misstatement, whether due to fraud or error. In preparing the Financial Statements, the Directors are responsible for assessing the Group’s and RELX NV’s ability to continue as a going concern. Based on the financial reporting frameworks mentioned, the Directors should prepare the Consolidated Financial Statements and NV Company Accounts using the going concern basis of accounting unless the Directors either intend to liquidate the Group and/or RELX NV or to cease operations, or have no realistic alternative but to do so. The Directors should disclose in the Financial Statements events and circumstances that may cast significant doubt on the Group’s and/or RELX NV’s ability to continue as a going concern. The Audit Committee is responsible for overseeing the Group’s financial reporting process. Auditor’s responsibilities Our objective is to plan and perform the audit assignment in a manner that allows us to obtain sufficient and appropriate audit evidence for our opinion. Our audit has been performed with a high, but not absolute, level of assurance, which means we may not have detected all errors and fraud. Misstatements can arise from fraud or error and are considered material if, individually or in the aggregate, they could reasonably be expected to influence the economic decisions of users taken on the basis of these financial statements. The materiality affects the nature, timing and extent of our audit procedures and the evaluation of the effect of identified misstatements on our opinion. For more information about an audit of financial statements, we refer to the NBA website: https://www.nba.nl/globalassets/tools-en-voorbeelden/standaardpassages/eng_ beursgenoteerd_01.pdf. |
| | |
| 116 | | RELX Group Annual reports and financial statements 2017 |
|
|
10. SCOPE AND RESPONSIBILITIES (CONTINUED)
| | | | |
◾ We assessed the susceptibility of the group’s financial statements to material misstatement, including how fraud might occur by meeting with management from various parts of the business to understand where it considered there was susceptibility to fraud. We also considered performance targets and their propensity to influence on efforts made by management to manage earnings. We considered the programmes and controls that the group has established to address risks identified, or that otherwise prevent, deter and detect fraud; and how senior management monitors those programmes and controls. Where the risk was considered to be higher, we performed audit procedures to address each identified fraud risk. These procedures included testing manual journals and were designed to provide reasonable assurance that the financial statements were free from fraud or error. ◾ Based on this understanding we designed our audit procedures to identifynon-compliance with such laws and regulations. Our procedures involved: journal entry testing, with a focus on manual consolidation journals and journals indicating large or unusual transactions based on our understanding of the business; enquiries of legal counsel, Group management, internal audit, country management at all full and specific scope management; and focused testing. In addition, we completed procedures to conclude on the compliance of the disclosures in the annual report and accounts with all applicable requirements. ◾ Any instances ofnon-compliance with laws and regulations were communicated by/to components and considered in our audit approach, if applicable. A further description of our responsibilities for the audit of the financial statements is located on the Financial Reporting Council’s website at https://www.frc.org.uk/auditorsresponsibilities. This description forms part of our auditor’s report. Other matters we are required to address ◾ We were appointed by the company on 21 April 2016 to audit the financial statements for the year ending 31 December 2016 and subsequent financial periods. ◾ The period of total uninterrupted engagement including previous renewals and reappointments is two years, covering the years ending 2016 and 2017. ◾ Thenon-audit services prohibited by the FRC’s Ethical Standard were not provided to the group or the parent company and we remain independent of the group and the parent company in conducting the audit. ◾ The audit opinion is consistent with the additional report to the audit committee. | | | | Report on other legal and regulatory requirements ◾ We have been engaged by the General Meeting at 13 January 2016 as auditor of RELX NV since the audit of the year 2016 and we are the statutory auditor since that date up until today. ◾ We have not provided prohibitednon-audit services as referred to in Article 5(1) of the EU Regulation on specific requirements regarding statutory audit of public-interest entities. ◾ We also submit an additional report to the audit committee in accordance with Article 11 of the EU Regulation on specific requirements regarding statutory audit of public-interest entities. The information included in this additional report is consistent with our audit opinion in this auditor’s report. |
11. SIGNING
| | | | |
| Nigel Jones | | | | Guus van Eimeren |
| (Senior Statutory Auditor) | | | | |
| | |
| For and on behalf of | | | | Ernst & Young Accountants LLP |
| Ernst & Young LLP | | | | Amsterdam |
| London | | | | |
| | | | 14 February 2018 |
| 14 February 2018 | | | | |
Notes:
| 1. | The maintenance and integrity of the RELX Group web site is the responsibility of the directors; the work carried out by the auditors does not involve consideration of these matters and, accordingly, the auditors accept no responsibility for any changes that may have occurred to the financial statements since they were initially presented on the web site. |
| 2. | Legislation in the United Kingdom governing the preparation and dissemination of financial statements may differ from legislation in other jurisdictions. |
| | |
| Financial statements and other information Consolidated financial statements | | 117 |
|
|
Consolidated income statement
| | | | | | | | | | | | | | | | |
| FOR THE YEAR ENDED 31 DECEMBER | | | | | 2017 | | | 2016 | | | 2015 | |
| | | Note | | | £m | | | £m | | | £m | |
Revenue | | | 2 | | | | 7,355 | | | | 6,895 | | | | 5,971 | |
Cost of sales | | | | | | | (2,631 | ) | | | (2,488 | ) | | | (2,129 | ) |
Gross profit | | | | | | | 4,724 | | | | 4,407 | | | | 3,842 | |
Selling and distribution costs | | | | | | | (1,163 | ) | | | (1,109 | ) | | | (965 | ) |
Administration and other expenses | | | | | | | (1,693 | ) | | | (1,627 | ) | | | (1,444 | ) |
Share of results of joint ventures | | | | | | | 37 | | | | 37 | | | | 64 | |
Operating profit | | | 3 | | | | 1,905 | | | | 1,708 | | | | 1,497 | |
Finance income | | | 8 | | | | 4 | | | | 8 | | | | 3 | |
Finance costs | | | 8 | | | | (186 | ) | | | (203 | ) | | | (177 | ) |
Net finance costs | | | | | | | (182 | ) | | | (195 | ) | | | (174 | ) |
Disposals and othernon-operating items | | | 9 | | | | 11 | | | | (40 | ) | | | (11 | ) |
Profit before tax | | | | | | | 1,734 | | | | 1,473 | | | | 1,312 | |
Current tax | | | | | | | (439 | ) | | | (374 | ) | | | (370 | ) |
Deferred tax | | | | | | | 372 | | | | 70 | | | | 72 | |
Tax expense | | | 10 | | | | (67 | ) | | | (304 | ) | | | (298 | ) |
Net profit for the year | | | | | | | 1,667 | | | | 1,169 | | | | 1,014 | |
| | | | |
Attributable to: | | | | | | | | | | | | | | | | |
RELX PLC and RELX NV shareholders | | | | | | | 1,659 | | | | 1,161 | | | | 1,008 | |
Non-controlling interests | | | | | | | 8 | | | | 8 | | | | 6 | |
Net profit for the year | | | | | | | 1,667 | | | | 1,169 | | | | 1,014 | |
| | | | |
Earnings per share | | | | | | | | | | | | | | | | |
FOR THE YEAR ENDED 31 DECEMBER | | | | | | | 2017 | | | | 2016 | | | | 2015 | |
Basic earnings per share | | | | | | | | | | | | | | | | |
RELX PLC | | | 11 | | | | 82.2p | | | | 56.3p | | | | 46.4p | |
RELX NV | | | 11 | | | | 82.2p | | | | 56.3p | | | | 49.4p | |
| | | | | | | | | | | | | | | | | |
Diluted earnings per share | | | | | | | | | | | | | | | | |
RELX PLC | | | 11 | | | | 81.5p | | | | 55.8p | | | | 46.0p | |
RELX NV | | | 11 | | | | 81.5p | | | | 55.8p | | | | 48.9p | |
| | |
| 118 | | RELX Group Annual reports and financial statements 2017 |
|
|
Consolidated statement of comprehensive income
| | | | | | | | | | | | | | | | |
| FOR THE YEAR ENDED 31 DECEMBER | | | | | 2017 | | | 2016 | | | 2015 | |
| | | Note | | | £m | | | £m | | | £m | |
Net profit for the year | | | | | | | 1,667 | | | | 1,169 | | | | 1,014 | |
| | | | |
Items that will not be reclassified to profit or loss: | | | | | | | | | | | | | | | | |
Actuarial gains/(losses) on defined benefit pension schemes | | | 6 | | | | 233 | | | | (262 | ) | | | 157 | |
Tax on items that will not be reclassified to profit or loss | | | 10 | | | | (59 | ) | | | 45 | | | | (34 | ) |
Total items that will not be reclassified to profit or loss | | | | | | | 174 | | | | (217 | ) | | | 123 | |
| | | | |
Items that may be reclassified subsequently to profit or loss: | | | | | | | | | | | | | | | | |
Exchange differences on translation of foreign operations | | | | | | | (507 | ) | | | 670 | | | | 99 | |
Fair value movements on cash flow hedges | | | 19 | | | | 137 | | | | (165 | ) | | | (104 | ) |
Transfer to net profit from cash flow hedge reserve | | | 19 | | | | 25 | | | | 46 | | | | 29 | |
Tax on items that may be reclassified to profit or loss | | | 10 | | | | (30 | ) | | | 19 | | | | 18 | |
Total items that may be reclassified to profit or loss | | | | | | | (375 | ) | | | 570 | | | | 42 | |
Other comprehensive (loss)/income for the year | | | | | | | (201 | ) | | | 353 | | | | 165 | |
Total comprehensive income for the year | | | | | | | 1,466 | | | | 1,522 | | | | 1,179 | |
| | | | |
Attributable to: | | | | | | | | | | | | | | | | |
RELX PLC and RELX NV shareholders | | | | | | | 1,458 | | | | 1,514 | | | | 1,173 | |
Non-controlling interests | | | | | | | 8 | | | | 8 | | | | 6 | |
Total comprehensive income for the year | | | | | | | 1,466 | | | | 1,522 | | | | 1,179 | |
| | |
| Financial statements and other information Consolidated financial statements | | 119 |
|
|
Consolidated statement of cash flows
| | | | | | | | | | | | | | | | |
| FOR THE YEAR ENDED 31 DECEMBER | | | | | 2017 | | | 2016 | | | 2015 | |
| | | Note | | | £m | | | £m | | | £m | |
Cash flows from operating activities | | | | | | | | | | | | | | | | |
Cash generated from operations | | | 12 | | | | 2,445 | | | | 2,236 | | | | 1,882 | |
Interest paid | | | | | | | (152 | ) | | | (160 | ) | | | (140 | ) |
Interest received | | | | | | | 4 | | | | 8 | | | | 8 | |
Tax paid (net) | | | | | | | (449 | ) | | | (402 | ) | | | (343 | ) |
Net cash from operating activities | | | | | | | 1,848 | | | | 1,682 | | | | 1,407 | |
| | | | |
Cash flows from investing activities | | | | | | | | | | | | | | | | |
Acquisitions | | | 12 | | | | (131 | ) | | | (361 | ) | | | (191 | ) |
Purchases of property, plant and equipment | | | | | | | (51 | ) | | | (51 | ) | | | (65 | ) |
Expenditure on internally developed intangible assets | | | | | | | (303 | ) | | | (282 | ) | | | (242 | ) |
Purchase of investments | | | | | | | (10 | ) | | | (6 | ) | | | (16 | ) |
Proceeds from disposals of property, plant and equipment | | | | | | | 1 | | | | 1 | | | | 1 | |
Gross proceeds from business disposals | | | | | | | 84 | | | | 18 | | | | 75 | |
Payments on business disposals | | | | | | | (50 | ) | | | (31 | ) | | | (41 | ) |
Dividends received from joint ventures | | | | | | | 38 | | | | 44 | | | | 57 | |
Net cash used in investing activities | | | | | | | (422 | ) | | | (668 | ) | | | (422 | ) |
| | | | |
Cash flows from financing activities | | | | | | | | | | | | | | | | |
Dividends paid to shareholders of RELX PLC and RELX NV | | | 14 | | | | (762 | ) | | | (683 | ) | | | (583 | ) |
Distributions tonon-controlling interests | | | | | | | (10 | ) | | | (9 | ) | | | (8 | ) |
(Decrease)/increase in short-term bank loans, overdrafts and commercial paper | | | 12 | | | | (148 | ) | | | 271 | | | | (339 | ) |
Issuance of term debt | | | 12 | | | | 873 | | | | 603 | | | | 500 | |
Repayment of term debt | | | 12 | | | | (712 | ) | | | (474 | ) | | | (186 | ) |
Repayment of finance leases | | | 12 | | | | (5 | ) | | | (7 | ) | | | (9 | ) |
Repurchase of ordinary shares | | | 26 | | | | (700 | ) | | | (700 | ) | | | (500 | ) |
Purchase of shares by Employee Benefit Trust | | | 26 | | | | (39 | ) | | | (29 | ) | | | (23 | ) |
Proceeds on issue of ordinary shares | | | | | | | 32 | | | | 23 | | | | 24 | |
Net cash used in financing activities | | | | | | | (1,471 | ) | | | (1,005 | ) | | | (1,124 | ) |
| | | | |
(Decrease)/increase in cash and cash equivalents | | | 12 | | | | (45 | ) | | | 9 | | | | (139 | ) |
| | | | |
Movement in cash and cash equivalents | | | | | | | | | | | | | | | | |
At start of year | | | | | | | 162 | | | | 122 | | | | 276 | |
(Decrease)/increase in cash and cash equivalents | | | | | | | (45 | ) | | | 9 | | | | (139 | ) |
Exchange translation differences | | | | | | | (6 | ) | | | 31 | | | | (15 | ) |
At end of year | | | | | | | 111 | | | | 162 | | | | 122 | |
| | |
| 120 | | RELX Group Annual reports and financial statements 2017 |
|
|
Consolidated statement of financial position
| | | | | | | | | | | | |
| AS AT 31 DECEMBER | | | | | 2017 | | | 2016 | |
| | | Note | | | £m | | | £m | |
Non-current assets | | | | | | | | | | | | |
Goodwill | | | 15 | | | | 5,965 | | | | 6,392 | |
Intangible assets | | | 16 | | | | 3,194 | | | | 3,604 | |
Investments in joint ventures | | | 17 | | | | 102 | | | | 102 | |
Other investments | | | 17 | | | | 141 | | | | 137 | |
Property, plant and equipment | | | 18 | | | | 209 | | | | 242 | |
Deferred tax assets | | | 10 | | | | 405 | | | | 444 | |
Net pension assets | | | 6 | | | | 22 | | | | - | |
Derivative financial instruments | | | 19 | | | | 86 | | | | 49 | |
| | | | | | | | 10,124 | | | | 10,970 | |
Current assets | | | | | | | | | | | | |
Inventories andpre-publication costs | | | 20 | | | | 197 | | | | 209 | |
Trade and other receivables | | | 21 | | | | 1,822 | | | | 1,956 | |
Derivative financial instruments | | | 19 | | | | 29 | | | | 20 | |
Cash and cash equivalents | | | 12 | | | | 111 | | | | 162 | |
| | | | | | | | 2,159 | | | | 2,347 | |
Assets held for sale | | | | | | | – | | | | 6 | |
Total assets | | | | | | | 12,283 | | | | 13,323 | |
| | | |
Current liabilities | | | | | | | | | | | | |
Trade and other payables | | | 22 | | | | 3,237 | | | | 3,425 | |
Derivative financial instruments | | | 19 | | | | 32 | | | | 85 | |
Borrowings | | | 23 | | | | 678 | | | | 1,159 | |
Taxation | | | | | | | 560 | | | | 612 | |
Provisions | | | 25 | | | | 19 | | | | 23 | |
| | | | | | | | 4,526 | | | | 5,304 | |
Non-current liabilities | | | | | | | | | | | | |
Derivative financial instruments | | | 19 | | | | 25 | | | | 110 | |
Borrowings | | | 23 | | | | 4,208 | | | | 3,684 | |
Deferred tax liabilities | | | 10 | | | | 738 | | | | 1,137 | |
Net pension obligations | | | 6 | | | | 350 | | | | 636 | |
Provisions | | | 25 | | | | 62 | | | | 89 | |
| | | | | | | | 5,383 | | | | 5,656 | |
Liabilities associated with assets held for sale | | | | | | | – | | | | 5 | |
Total liabilities | | | | | | | 9,909 | | | | 10,965 | |
Net assets | | | | | | | 2,374 | | | | 2,358 | |
| | | |
Capital and reserves | | | | | | | | | | | | |
Share capital | | | 26 | | | | 224 | | | | 226 | |
Share premium | | | 26 | | | | 3,104 | | | | 3,003 | |
Shares held in treasury | | | 26 | | | | (1,631 | ) | | | (1,471 | ) |
Translation reserve | | | | | | | 169 | | | | 727 | |
Other reserves | | | 27 | | | | 487 | | | | (165 | ) |
Shareholders’ equity | | | | | | | 2,353 | | | | 2,320 | |
Non-controlling interests | | | | | | | 21 | | | | 38 | |
Total equity | | | | | | | 2,374 | | | | 2,358 | |
The consolidated financial statements were approved by the Board of Directors and authorised for issue on 14 February 2018. They were signed on its behalf by:
| | |
| A J Habgood | | N L Luff |
| Chairman | | Chief Financial Officer |
| | |
| Financial statements and other information Consolidated financial statements | | 121 |
|
|
Consolidated statement of changes in equity
| | | | | | | | | | | | | | | | | | | | | | | | | | | | | | | | | | | | |
| | | | | | | | | | | | | | | | | | | | | | | | Non- | | | | |
| | | | | | Share | | | Share | | | Shares held | | | Translation | | | Other | | | Shareholders’ | | | controlling | | | Total | |
| | | | | | capital | | | premium | | | in treasury | | | reserve | | | reserves | | | equity | | | interests | | | equity | |
| | | Note | | | £m | | | £m | | | £m | | | £m | | | £m | | | £m | | | £m | | | £m | |
Balance at 1 January 2015 | | | | | | | 212 | | | | 2,820 | | | | (1,107 | ) | | | 74 | | | | 107 | | | | 2,106 | | | | 31 | | | | 2,137 | |
Total comprehensive income for the year | | | | | | | – | | | | – | | | | – | | | | 99 | | | | 1,074 | | | | 1,173 | | | | 6 | | | | 1,179 | |
Dividends paid | | | 14 | | | | – | | | | – | | | | – | | | | – | | | | (583 | ) | | | (583 | ) | | | (8 | ) | | | (591 | ) |
Issue of ordinary shares, net of expenses | | | | | | | – | | | | 24 | | | | – | | | | – | | | | – | | | | 24 | | | | – | | | | 24 | |
Repurchase of ordinary shares | | | | | | | – | | | | – | | | | (623 | ) | | | – | | | | – | | | | (623 | ) | | | – | | | | (623 | ) |
Cancellation of shares | | | | | | | (4 | ) | | | – | | | | 269 | | | | – | | | | (265 | ) | | | – | | | | – | | | | – | |
Bonus issue of ordinary shares | | | | | | | 18 | | | | (18 | ) | | | – | | | | – | | | | – | | | | – | | | | – | | | | – | |
Increase in share based remuneration reserve (net of tax) | | | | | | | – | | | | – | | | | – | | | | – | | | | 47 | | | | 47 | | | | – | | | | 47 | |
Settlement of share awards | | | | | | | – | | | | – | | | | 49 | | | | – | | | | (49 | ) | | | – | | | | – | | | | – | |
Acquisitions | | | | | | | – | | | | – | | | | – | | | | – | | | | – | | | | – | | | | 4 | | | | 4 | |
Exchange differences on translation of capital and reserves | | | | | | | (2 | ) | | | (78 | ) | | | 19 | | | | 51 | | | | 10 | | | | – | | | | 1 | | | | 1 | |
Balance at 1 January 2016 | | | | | | | 224 | | | | 2,748 | | | | (1,393 | ) | | | 224 | | | | 341 | | | | 2,144 | | | | 34 | | | | 2,178 | |
Total comprehensive income for the year | | | | | | | – | | | | – | | | | – | | | | 670 | | | | 844 | | | | 1,514 | | | | 8 | | | | 1,522 | |
Dividends paid | | | 14 | | | | – | | | | – | | | | – | | | | – | | | | (683 | ) | | | (683 | ) | | | (9 | ) | | | (692 | ) |
Issue of ordinary shares, net of expenses | | | | | | | – | | | | 23 | | | | – | | | | – | | | | – | | | | 23 | | | | – | | | | 23 | |
Repurchase of ordinary shares | | | | | | | – | | | | – | | | | (722 | ) | | | – | | | | – | | | | (722 | ) | | | – | | | | (722 | ) |
Cancellation of shares | | | 26 | | | | (6 | ) | | | – | | | | 713 | | | | – | | | | (707 | ) | | | – | | | | – | | | | – | |
Increase in share based remuneration reserve (net of tax) | | | | | | | – | | | | – | | | | – | | | | – | | | | 44 | | | | 44 | | | | – | | | | 44 | |
Settlement of share awards | | | | | | | – | | | | – | | | | 39 | | | | – | | | | (39 | ) | | | – | | | | – | | | | – | |
Exchange differences on translation of capital and reserves | | | | | | | 8 | | | | 232 | | | | (108 | ) | | | (167 | ) | | | 35 | | | | – | | | | 5 | | | | 5 | |
Balance at 1 January 2017 | | | | | | | 226 | | | | 3,003 | | | | (1,471 | ) | | | 727 | | | | (165 | ) | | | 2,320 | | | | 38 | | | | 2,358 | |
Total comprehensive income for the year | | | | | | | – | | | | – | | | | – | | | | (507 | ) | | | 1,965 | | | | 1,458 | | | | 8 | | | | 1,466 | |
Dividends paid | | | 14 | | | | – | | | | – | | | | – | | | | – | | | | (762 | ) | | | (762 | ) | | | (10 | ) | | | (772 | ) |
Issue of ordinary shares, net of expenses | | | | | | | – | | | | 32 | | | | – | | | | – | | | | – | | | | 32 | | | | – | | | | 32 | |
Repurchase of ordinary shares | | | | | | | – | | | | – | | | | (737 | ) | | | – | | | | – | | | | (737 | ) | | | – | | | | (737 | ) |
Cancellation of shares | | | 26 | | | | (4 | ) | | | – | | | | 570 | | | | – | | | | (566 | ) | | | – | | | | – | | | | – | |
Increase in share based remuneration reserve (net of tax) | | | | | | | – | | | | – | | | | – | | | | – | | | | 42 | | | | 42 | | | | – | | | | 42 | |
Settlement of share awards | | | | | | | – | | | | – | | | | 37 | | | | – | | | | (37 | ) | | | – | | | | – | | | | – | |
Acquisitions | | | | | | | – | | | | – | | | | – | | | | – | | | | – | | | | – | | | | 1 | | | | 1 | |
Disposal of business | | | | | | | – | | | | – | | | | – | | | | – | | | | – | | | | – | | | | (15 | ) | | | (15 | ) |
Exchange differences on translation of capital and reserves | | | | | | | 2 | | | | 69 | | | | (30 | ) | | | (51 | ) | | | 10 | | | | – | | | | (1 | ) | | | (1 | ) |
Balance at 31 December 2017 | | | | | | | 224 | | | | 3,104 | | | | (1,631 | ) | | | 169 | | | | 487 | | | | 2,353 | | | | 21 | | | | 2,374 | |
| | |
| 122 | | RELX Group Annual reports and financial statements 2017 |
|
|
Notes to the consolidated financial statements
for the year ended 31 December 2017
1 Basis of preparation and accounting policies
Basis of preparation
RELX PLC and RELX NV are separate, publicly-held entities. RELX PLC’s ordinary shares are listed in London and, through a depositary receipt, in New York, and RELX NV’s ordinary shares are listed in Amsterdam and, through a depositary receipt, in New York. RELX PLC and RELX NV jointly own RELX Group plc, which holds all the Group’s operating businesses and financing activities. RELX PLC, RELX NV, RELX Group plc and its subsidiaries, joint ventures and associates are together known as “the Group”.
The Governing Agreement determines the equalisation ratio between RELX PLC and RELX NV shares. One RELX PLC ordinary share confers an equivalent economic interest to one RELX NV ordinary share.
As a result of these arrangements, all shareholders can be regarded as having interests in a single economic entity. Consequently, the Directors have concluded that the Group forms a single reporting entity for the presentation of consolidated financial statements. Accordingly, the Group consolidated financial information represents the interests of both sets of shareholders and is presented by both RELX PLC and RELX NV as their respective consolidated financial statements.
The Directors of RELX PLC and RELX NV, having made appropriate enquiries, consider that adequate resources exist for the Group to continue in operational existence for the foreseeable future and that, therefore, it is appropriate to adopt the going concern basis in preparing the consolidated financial statements for the year ended 31 December 2017.
In preparing the consolidated financial statements, subsidiaries of the Group are accounted for under the acquisition method and investments in associates and joint ventures are accounted for under the equity method. All intra-group transactions and balances are eliminated.
On acquisition of a subsidiary, or interest in an associate or joint venture, fair values, reflecting conditions at the date of acquisition, are attributed to the net assets, including identifiable intangible assets acquired. Adjustments are made to bring accounting policies into line with those of the Group. The results of subsidiaries sold or acquired are included in the consolidated financial statements up to or from the date that control passes from or to the Group.
Non-controlling interests in the net assets of the Group are identified separately from shareholders’ equity.Non-controlling interests consist of the amount of those interests at the date of the original acquisition and thenon-controlling share of changes in equity since the date of acquisition.
Accounting policies
The Group’s consolidated financial statements are prepared in accordance with International Financial Reporting Standards (IFRS) as adopted by the European Union and as issued by the International Accounting Standards Board (IASB). The accounting policies under IFRS are included in the relevant notes to the consolidated financial statements. The accounting policies below are applied throughout the financial statements and are unchanged from those applied in preparing the consolidated financial statements for the year ended 31 December 2016 and 2015.
Foreign exchange translation
The consolidated financial statements are presented in sterling.
Transactions in foreign currencies are recorded at the rate of exchange prevailing on the date of the transaction.Non-monetary assets and liabilities that are measured at historical cost in foreign currencies are translated using the exchange rate at the date of the transaction. At each statement of financial position date, monetary assets and liabilities that are denominated in foreign currencies are retranslated at the rate prevailing on the statement of financial position date. Exchange differences arising are recorded in the income statement other than where hedge accounting applies, as set out on pages 147 to 152.
Assets and liabilities of foreign operations are translated at exchange rates prevailing on the statement of financial position date. Income and expense items and cash flows of foreign operations are translated at the average exchange rate for the period. Significant individual items of income and expense and cash flows in foreign operations are translated at the rate prevailing on the date of transaction. Exchange differences arising are classified as equity and transferred to the translation reserve. When foreign operations are disposed of, the related cumulative translation differences are recognised within the income statement in the period.
The Group uses derivative financial instruments, primarily forward contracts, to hedge its exposure to certain foreign exchange risks. Details of the Group’s accounting policies in respect of derivative financial instruments are set out on page 147.
| | |
| Financial statements and other information Notes to the consolidated financial statements | | 123 |
|
|
1 Basis of preparation and accounting policies (continued)
Critical judgements and key sources of estimation uncertainty
The most significant accounting policies in determining the financial condition and results of the Group, and those requiring the most subjective or complex judgement, relate to and are included in the following notes:
| ∎ | valuation of goodwill and intangible assets – notes 15 and 16; |
| ∎ | capitalisation of development spend – note 16; |
| ∎ | accounting for defined benefit pension schemes – note 6. |
Other significant accounting policies
The accounting policy in respect of revenue recognition is also significant in determining the financial condition and results of the Group, although the application of this policy is more straightforward. This policy is included in note 2.
Standards and amendments effective for the year
The interpretations and amendments to IFRS effective for 2017 have not had a significant impact on the Group’s accounting policies or reporting.
Standards, amendments and interpretations not yet effective
New accounting standards and amendments and their expected impact on the future accounting policies and reporting of the Group are set out below.
IFRS 9 – Financial Instruments (effective for the 2018 financial year). The standard replaces the existing classification and measurement requirements in IAS 39 – Financial Instruments: Recognition and Measurement. Adoption of the standard is not expected to have a significant impact on the measurement, presentation or disclosure of financial assets and liabilities in the consolidated financial statements. The most notable impact for the Group relates to cash flow hedge accounting, which will result in additional disclosure in respect of the costs of hedging reserve balance and movements from 2018 onwards.
IFRS 15 – Revenue from Contracts with Customers (effective for the 2018 financial year). The new standard provides a single point of reference for revenue recognition, including guidance in relation to identification of contracts and licensing arrangements. RELX Group will adopt IFRS 15 on a fully retrospective basis. Management have performed a full assessment of the impact of IFRS 15. The adoption of IFRS 15 will not result in a material change to the 2017 income statement reported numbers, and will not result in material differences to the 2018 income statement numbers.
IFRS 16 – Leases (early adoption so as to be effective for the 2018 financial year). The new standard eliminates the distinction between operating and finance leases and requires lessees to recognise all leases with a lease term of greater than 12 months in the statement of financial position. RELX Group will adopt this standard a year earlier than the mandatory effective date of 1 January 2019. IFRS 16 will be adopted on a fully retrospective basis. The majority of the RELX Group lease portfolio relates to property leases. Management have performed a full assessment of the impact of IFRS 16.
The table below sets out the expected impact on the income statement and the most significantly impacted statement of financial position accounts.
| | | | | | | | | | | | | | | | | | | | |
| | | 2017 as
reported
£m | | | IFRS 9
impact
£m | | | IFRS 15
impact
£m | | | IFRS 16
impact
£m | | | 2017 as
restated
£m | |
Income statement | | | | | | | | | | | | | | | | | | | | |
Revenue | | | 7,355 | | | | – | | | | (14 | ) | | | – | | | | 7,341 | |
Adjusted operating profit | | | 2,284 | | | | – | | | | (11 | ) | | | 11 | | | | 2,284 | |
Reported operating profit | | | 1,905 | | | | – | | | | (11 | ) | | | 11 | | | | 1,905 | |
Net finance costs | | | (182 | ) | | | (2 | ) | | | – | | | | (15 | ) | | | (199 | ) |
Adjusted net profit attributable to RELX PLC and RELX NV shareholders | | | 1,635 | | | | (2 | ) | | | (9 | ) | | | (4 | ) | | | 1,620 | |
Reported net profit attributable to RELX PLC and RELX NV shareholders | | | 1,659 | | | | (2 | ) | | | (9 | ) | | | – | | | | 1,648 | |
Adjusted EPS | | | 81.0p | | | | (0.1p | ) | | | (0.5p | ) | | | (0.2p | ) | | | 80.2p | |
Reported EPS | | | 82.2p | | | | (0.1p | ) | | | (0.5p | ) | | | – | | | | 81.6p | |
Statement of financial position | | | | | | | | | | | | | | | | | | | | |
Right of use asset | | | 16 | | | | – | | | | – | | | | 272 | | | | 288 | |
Borrowings (including lease liability) | | | (4,886 | ) | | | 14 | | | | – | | | | (381 | ) | | | (5,253 | ) |
Finance lease receivable | | | – | | | | – | | | | – | | | | 56 | | | | 56 | |
Deferred income | | | (1,834 | ) | | | – | | | | (76 | ) | | | – | | | | (1,910 | ) |
Additionally, a number of amendments and interpretations have been issued which are not expected to have any significant impact on the Group’s accounting policies and reporting.
| | |
| 124 | | RELX Group Annual reports and financial statements 2017 |
|
|
Notes to the consolidated financial statements
for the year ended 31 December 2017
2 Segment analysis
Accounting policy
The Group’s reported segments are based on the internal reporting structure and financial information provided to the Boards.
Adjusted operating profit is the key segmental profit measure used by the Group in assessing performance. Adjusted operating profit is reconciled to operating profit on page 125.
Revenue represents the value of sales less anticipated returns on transactions completed by performance, excluding customer sales taxes.
Revenues are recognised for the various categories as follows: subscriptions – on periodic dispatch of subscribed product or rateably over the period of the subscription where performance is not measurable by despatch; transactional – on despatch or occurrence of the transaction; and advertising – on publication or over the period of online display.
Revenue recognition policies, while an area of management focus, are generally straightforward in application as the timing of product or service delivery and customer acceptance for the various revenue types can be readily determined. Allowances for product returns are deducted from revenues based on historical return rates. Where sales consist of two or more components that operate independently, revenue is recognised as each component is completed by performance, based on attribution of relative value.
RELX Group is a global provider of information and analytics for professional and business customers across industries operating in four major market segments: Scientific, Technical & Medical is a global information and analytics business that helps institutions and professionals advance healthcare, open science, and improve performance for the benefit of humanity; Risk & Business Analytics provides customers with solutions and decision tools that combine public and industry specific content with advanced technology and analytics to assist them in evaluating and predicting risk and enhancing operational efficiency; Legal is a leading global provider of legal, regulatory and business information and analytics that helps customers increase productivity, improve decision-making and outcomes and advance the rule of law around the world; and Exhibitions is the world’s leading events business, enhancing the power offace-to-face through data and digital tools at over 500 events, in 30 countries, attracting more than 7m participants.
| | | | | | | | | | | | | | | | | | | | | | | | | | |
| ANALYSIS BY BUSINESS SEGMENT | | Revenue | | | | | Adjusted operating profit | |
| | | 2017 £m | | | 2016 £m | | | 2015 £m | | | | | 2017 £m | | | 2016 £m | | | 2015 £m | |
Scientific, Technical & Medical | | | 2,478 | | | | 2,320 | | | | 2,070 | | | | | | 913 | | | | 853 | | | | 760 | |
Risk & Business Analytics | | | 2,076 | | | | 1,906 | | | | 1,601 | | | | | | 759 | | | | 686 | | | | 575 | |
Legal | | | 1,692 | | | | 1,622 | | | | 1,443 | | | | | | 332 | | | | 311 | | | | 274 | |
Exhibitions | | | 1,109 | | | | 1,047 | | | | 857 | | | | | | 285 | | | | 269 | | | | 217 | |
Sub-total | | | 7,355 | | | | 6,895 | | | | 5,971 | | | | | | 2,289 | | | | 2,119 | | | | 1,826 | |
Unallocated items | | | – | | | | – | | | | – | | | | | | (5 | ) | | | (5 | ) | | | (4 | ) |
Total | | | 7,355 | | | | 6,895 | | | | 5,971 | | | | | | 2,284 | | | | 2,114 | | | | 1,822 | |
| | | | | | | | | | | | | | | | | | | | | | | | | | |
| ANALYSIS OF REVENUE BY GEOGRAPHICAL ORIGIN | | | | | | | | | | | | | 2017 £m | | | 2016 £m | | | 2015 £m | |
North America | | | | | | | | | | | | | | | | | 4,004 | | | | 3,693 | | | | 3,166 | |
United Kingdom | | | | | | | | | | | | | | | | | 1,083 | | | | 1,055 | | | | 996 | |
The Netherlands | | | | | | | | | | | | | | | | | 855 | | | | 813 | | | | 649 | |
Rest of Europe | | | | | | | | | | | | | | | | | 704 | | | | 707 | | | | 614 | |
Rest of world | | | | | | | | | | | | | | | | | 709 | | | | 627 | | | | 546 | |
Total | | | | | | | | | | | | | | | | | 7,355 | | | | 6,895 | | | | 5,971 | |
| | | | | | | | | | | | | | | | | | | | | | | | | | |
ANALYSIS OF REVENUE BY GEOGRAPHICAL
MARKET | | | | | | | | | | | | | 2017 £m | | | 2016 £m | | | 2015 £m | |
North America | | | | | | | | | | | | | | | | | 4,081 | | | | 3,778 | | | | 3,215 | |
United Kingdom | | | | | | | | | | | | | | | | | 522 | | | | 504 | | | | 461 | |
The Netherlands | | | | | | | | | | | | | | | | | 92 | | | | 118 | | | | 117 | |
Rest of Europe | | | | | | | | | | | | | | | | | 1,081 | | | | 1,091 | | | | 958 | |
Rest of world | | | | | | | | | | | | | | | | | 1,579 | | | | 1,404 | | | | 1,220 | |
Total | | | | | | | | | | | | | | | | | 7,355 | | | | 6,895 | | | | 5,971 | |
| | |
| Financial statements and other information Notes to the consolidated financial statements | | 125 |
|
|
2 Segment analysis (continued)
| | | | | | | | | | | | |
| ANALYSIS OF REVENUE BY FORMAT | | 2017
£m | | | 2016 £m | | | 2015 £m | |
Electronic | | | 5,399 | | | | 4,954 | | | | 4,179 | |
Print | | | 834 | | | | 875 | | | | 906 | |
Face-to-face | | | 1,122 | | | | 1,066 | | | | 886 | |
Total | | | 7,355 | | | | 6,895 | | | | 5,971 | |
| | | | | | | | | | | | |
| ANALYSIS OF REVENUE BY TYPE | | 2017
£m | | | 2016 £m | | | 2015 £m | |
Subscriptions | | | 3,808 | | | | 3,618 | | | | 3,123 | |
Transactional | | | 3,449 | | | | 3,163 | | | | 2,736 | |
Advertising | | | 98 | | | | 114 | | | | 112 | |
Total | | | 7,355 | | | | 6,895 | | | | 5,971 | |
| | | | | | | | | | | | | | | | | | | | | | | | | | | | | | | | | | | | | | | | | | | | | | | | | | | | | | | | | | | | |
| ANALYSIS BY BUSINESS SEGMENT | | Expenditure on | | | | | | | | | | | | | | | | | | | | | | | | | | | | | | | | | | | | | |
| | | acquired goodwill and | | | | | | Capital expenditure | | | | | | Amortisation of acquired | | | | | | Depreciation and other | |
| | | intangible assets | | | | | | additions | | | | | | intangible assets | | | | | | amortisation | |
| | | 2017 £m | | | 2016
£m | | | 2015
£m | | | | | | 2017
£m | | | 2016
£m | | | 2015
£m | | | | | | 2017
£m | | | 2016
£m | | | 2015
£m | | | | | | 2017
£m | | | 2016
£m | | | 2015
£m | |
Scientific, Technical & Medical | | | 94 | | | | 19 | | | | 7 | | | | | | | | 97 | | | | 86 | | | | 74 | | | | | | | | 77 | | | | 88 | | | | 77 | | | | | | | | 81 | | | | 82 | | | | 86 | |
Risk & Business Analytics | | | – | | | | 288 | | | | 41 | | | | | | | | 83 | | | | 67 | | | | 56 | | | | | | | | 141 | | | | 147 | | | | 131 | | | | | | | | 52 | | | | 45 | | | | 33 | |
Legal | | | 6 | | | | 83 | | | | 96 | | | | | | | | 154 | | | | 156 | | | | 161 | | | | | | | | 52 | | | | 73 | | | | 56 | | | | | | | | 121 | | | | 113 | | | | 95 | |
Exhibitions | | | 33 | | | | 21 | | | | 67 | | | | | | | | 23 | | | | 26 | | | | 27 | | | | | | | | 44 | | | | 38 | | | | 32 | | | | | | | | 18 | | | | 17 | | | | 14 | |
Total | | | 133 | | | | 411 | | | | 211 | | | | | | | | 357 | | | | 335 | | | | 318 | | | | | | | | 314 | | | | 346 | | | | 296 | | | | | | | | 272 | | | | 257 | | | | 228 | |
Capital expenditure comprises additions to property, plant and equipment and internally developed intangible assets. Amortisation of acquired intangible assets includes amounts in respect of joint ventures of nil (2016: £3m; 2015: £3m) in Legal and £1m (2016: £1m; 2015: £1m) in Exhibitions.
| | | | | | | | | | | | |
| ANALYSIS OFNON-CURRENT ASSETS BY GEOGRAPHICAL LOCATION | | 2017
£m | | | 2016 £m | | | 2015 £m | |
North America | | | 7,304 | | | | 8,174 | | | | 6,824 | |
United Kingdom | | | 978 | | | | 906 | | | | 787 | |
The Netherlands | | | 154 | | | | 135 | | | | 125 | |
Rest of Europe | | | 746 | | | | 801 | | | | 723 | |
Rest of world | | | 429 | | | | 461 | | | | 399 | |
Total | | | 9,611 | | | | 10,477 | | | | 8,858 | |
Non-current assets by geographical location exclude amounts relating to deferred tax, pension assets and derivative financial instruments.
Operating profit is reconciled to adjusted operating profit as follows:
| | | | | | | | | | | | |
| RECONCILIATION OF OPERATING PROFIT TO ADJUSTED OPERATING PROFIT | | 2017
£m | | | 2016 £m | | | 2015 £m | |
Operating profit | | | 1,905 | | | | 1,708 | | | | 1,497 | |
Adjustments: | | | | | | | | | | | | |
Amortisation of acquired intangible assets | | | 314 | | | | 346 | | | | 296 | |
Acquisition-related costs | | | 56 | | | | 51 | | | | 35 | |
Reclassification of tax in joint ventures | | | 10 | | | | 10 | | | | (6 | ) |
Reclassification of finance income in joint ventures | | | (1 | ) | | | (1 | ) | | | – | |
Adjusted operating profit | | | 2,284 | | | | 2,114 | | | | 1,822 | |
The share ofpost-tax results of joint ventures of £37m (2016: £37m; 2015: £64m) included in operating profit comprised £5m (2016: £10m; 2015: £37m) relating to Legal, £32m (2016: £27m; 2015: £28m) relating to Exhibitions and nil (2016: nil; 2015: £1m loss) relating to Risk & Business Analytics.
| | |
| 126 | | RELX Group Annual reports and financial statements 2017 |
|
|
��
Notes to the consolidated financial statements
for the year ended 31 December 2017
3 Operating profit
Operating profit is stated after charging/(crediting) the following:
| | | | | | | | | | | | | | | | |
| | | Note | | | 2017 £m | | | 2016 £m | | | 2015 £m | |
Staff costs | | | | | | | | | | | | | | | | |
Wages and salaries | | | | | | | 1,926 | | | | 1,767 | | | | 1,490 | |
Social security costs | | | | | | | 213 | | | | 198 | | | | 169 | |
Pensions | | | 6 | | | | 95 | | | | 111 | | | | 58 | |
Share based remuneration | | | | | | | 39 | | | | 38 | | | | 34 | |
Total staff costs | | | | | | | 2,273 | | | | 2,114 | | | | 1,751 | |
Depreciation and amortisation | | | | | | | | | | | | | | | | |
Amortisation of acquired intangible assets | | | 16 | | | | 313 | | | | 342 | | | | 292 | |
Share of joint ventures’ amortisation of acquired intangible assets | | | | | | | 1 | | | | 4 | | | | 4 | |
Amortisation of internally developed intangible assets | | | 16 | | | | 203 | | | | 189 | | | | 157 | |
Depreciation of property, plant and equipment | | | 18 | | | | 69 | | | | 68 | | | | 71 | |
Total depreciation and amortisation | | | | | | | 586 | | | | 603 | | | | 524 | |
Other expenses and income | | | | | | | | | | | | | | | | |
Cost of sales includingpre-publication costs and inventory expenses | | | | | | | 2,631 | | | | 2,488 | | | | 2,129 | |
Operating lease rentals expense | | | | | | | 104 | | | | 102 | | | | 90 | |
Operating lease rentals income | | | | | | | (3 | ) | | | (6 | ) | | | (5 | ) |
|
The amortisation of acquired intangible assets is included within administration and other expenses. 4 Auditors’ remuneration | |
| | | | | | 2017
£m | | | 2016
£m | | | 2015
£m | |
Auditors’ remuneration | | | | | | | | | | | | | | | | |
Payable to the auditors of RELX PLC and RELX NV | | | | | | | 0.9 | | | | 0.9 | | | | 0.8 | |
Payable to the auditors of the Group’s subsidiaries | | | | | | | 5.6 | | | | 5.3 | | | | 4.2 | |
Audit services | | | | | | | 6.5 | | | | 6.2 | | | | 5.0 | |
Audit-related assurance services | | | | | | | 0.8 | | | | 0.6 | | | | 0.8 | |
Total audit and audit related assurance services | | | | | | | 7.3 | | | | 6.8 | | | | 5.8 | |
Tax services | | | | | | | – | | | | 0.4 | | | | 0.9 | |
Other services: Consulting | | | | | | | – | | | | 0.1 | | | | 0.2 | |
Other services: Due diligence and other transaction-related services | | | | | | | 0.3 | | | | 0.4 | | | | 0.3 | |
Totalnon-audit related services | | | | | | | 0.3 | | | | 0.9 | | | | 1.4 | |
Total auditors’ remuneration | | | | | | | 7.6 | | | | 7.7 | | | | 7.2 | |
Amounts payable to the auditors of the Group’s subsidiaries include amounts for the audit of internal controls over financial reporting in accordance with the US Sarbanes-Oxley Act.Non-audit services performed in the Netherlands by Ernst & Young Accountants LLP in 2017 and 2016 (and Deloitte Accountants BV in 2015) are limited to audit-related assurance services. Included in audit related assurance services for 2017 are £0.1m in fees for services relating to RELX pension plans. The previously reported 2016 fees paid to EY for audit services have been revised to include additional amounts for expenses incurred and final fees for statutory audits which took place subsequent to the audit of the RELX Group consolidated accounts.
5 Personnel
| | | | | | | | | | | | | | | | | | | | | | | | | | | | |
| NUMBER OF PEOPLE EMPLOYED: FULL-TIME EQUIVALENTS | | At 31 December | | | | | | Average during the year | |
| | | 2017 | | | 2016 | | | 2015 | | | | | | 2017 | | | 2016 | | | 2015 | |
Business segment | | | | | | | | | | | | | | | | | | | | | | | | | | | | |
Scientific, Technical & Medical | | | 7,500 | | | | 7,500 | | | | 7,200 | | | | | | | | 7,500 | | | | 7,300 | | | | 7,200 | |
Risk & Business Analytics | | | 8,100 | | | | 8,200 | | | | 7,600 | | | | | | | | 8,200 | | | | 7,900 | | | | 7,500 | |
Legal | | | 10,600 | | | | 10,700 | | | | 10,500 | | | | | | | | 10,700 | | | | 10,600 | | | | 10,000 | |
Exhibitions | | | 4,000 | | | | 4,000 | | | | 3,800 | | | | | | | | 4,000 | | | | 3,900 | | | | 3,700 | |
Sub-total | | | 30,200 | | | | 30,400 | | | | 29,100 | | | | | | | | 30,400 | | | | 29,700 | | | | 28,400 | |
Corporate/shared functions | | | 800 | | | | 800 | | | | 900 | | | | | | | | 800 | | | | 900 | | | | 900 | |
Total | | | 31,000 | | | | 31,200 | | | | 30,000 | | | | | | | | 31,200 | | | | 30,600 | | | | 29,300 | |
Geographical location | | | | | | | | | | | | | | | | | | | | | | | | | | | | |
North America | | | 13,500 | | | | 13,700 | | | | 13,400 | | | | | | | | 13,600 | | | | 13,500 | | | | 13,400 | |
United Kingdom | | | 5,000 | | | | 4,900 | | | | 4,700 | | | | | | | | 5,000 | | | | 4,800 | | | | 4,500 | |
The Netherlands | | | 1,300 | | | | 1,400 | | | | 1,500 | | | | | | | | 1,400 | | | | 1,500 | | | | 1,500 | |
Rest of Europe | | | 2,800 | | | | 2,800 | | | | 2,800 | | | | | | | | 2,800 | | | | 2,800 | | | | 2,800 | |
Rest of world | | | 8,400 | | | | 8,400 | | | | 7,600 | | | | | | | | 8,400 | | | | 8,000 | | | | 7,100 | |
Total | | | 31,000 | | | | 31,200 | | | | 30,000 | | | | | | | | 31,200 | | | | 30,600 | | | | 29,300 | |
| | |
| Financial statements and other information Notes to the consolidated financial statements | | 127 |
|
|
6 Pension schemes
Accounting policy
The expense of defined benefit pension schemes and other post-retirement employee benefits is determined using the projected unit credit method and charged in the income statement as an operating expense, based on actuarial assumptions reflecting market conditions at the beginning of the financial year. Actuarial gains and losses are recognised in full in the statement of comprehensive income in the period in which they occur.
Past service costs and credits are recognised immediately at the earlier of when plan amendments or curtailments occur and when related restructuring costs or termination benefits are recognised. Settlements are recognised when they occur.
Net pension obligations in respect of defined benefit schemes are included in the statement of financial position at the present value of scheme liabilities, less the fair value of scheme assets. Where schemes are in surplus, i.e. assets exceed liabilities, the net pension assets are separately included in the statement of financial position. Any net pension asset is limited to the extent that the asset is recoverable.
The expense of defined contribution pension schemes and other employee benefits is charged in the income statement as incurred.
Critical judgement and key source of estimation uncertainty
At 31 December 2017, the Group operates defined benefit pension schemes in the UK and the US. These schemes require management to exercise judgement in estimating the ultimate cost of providing post-employment benefits, especially given the length of each scheme’s liabilities. Accounting for defined benefit pension schemes involves judgement about uncertain events, including the life expectancy of the members, salary and pension increases, inflation, the future operation of each scheme and the rate at which the future pension payments are discounted. Estimates for these factors are used in determining the pension cost and liabilities reported in the financial statements. The estimates made around future developments of each of the critical assumptions are made in conjunction with independent actuaries, and each scheme is subject to a periodic review by independent actuaries. Information regarding some of the assumptions used for valuation is provided below, together with a sensitivity analysis.
A number of pension schemes are operated around the world. The largest defined benefit schemes as at 31 December 2017 are in the UK and the US. In November 2015, the Netherlands defined benefit pension scheme, together with all associated assets and liabilities, was transferred into an industry-wide collective defined contribution scheme. This scheme is now accounted for as a defined contribution pension plan, with no deficit or surplus recognised on the balance sheet. Prior to this, the scheme was a career average salary scheme and was open to new hires.
Major defined benefit schemes in place at 31 December 2017
The UK scheme is a final salary scheme and is closed to new hires. Members accrue a portion of their final pensionable earnings based on the number of years of service. The US scheme is a cash balance scheme and is closed to new hires. Members earn pay credits dependent on age and years of service up to certain limits which are added to an account balance that accrues interest at specified minimum rates. In September 2017, it was announced the US scheme would be closed to future accruals effective 1 January 2019.
Each of the major defined benefit schemes is administered by a separate fund that is legally separated from the Group. The trustees of the pension funds in the UK and plan fiduciaries of the US scheme are required by law to act in the interest of the funds’ beneficiaries. In the UK, the trustees of the pension fund are responsible for the investment policy with regard to the assets of the fund. The board of trustees consists of an equal number of company-appointed and member nominated Directors. In the US, the fiduciary duties for the scheme are allocated between committees which are staffed by senior employees of the Group; the investment committee has the primary responsibility for the investment and management of plan assets.
The funding of the Group’s major schemes reflects the different rules within each jurisdiction.
In the UK, the level of funding is determined by statutory triennial actuarial valuations in accordance with pensions legislation. Where the scheme falls below 100% funded status, the Group and the scheme trustees must agree on how the deficit is to be remedied. The UK Pensions Regulator has significant powers and sets out in codes and guidance the parameters for scheme funding.
The US scheme has an annual statutory valuation which forms the basis for establishing the employer contribution each year (subject to ERISA and IRS minimums). Should the statutory funded status fall to below 100%, the US Pension Protection Act requires the deficit to be rectified with additional contributions over a seven-year period.
Employer cash contributions to defined benefit pension schemes, in respect of 2018, are expected to be approximately £37m including a pension deficit funding contribution of £20m relating to the UK scheme recovery plan.
In addition to the contributions set out above, the Group has committed to providing a further £110m of deficit funding contributions to the UK scheme over the period from 2019 to 2022. The triennial valuation will take place during 2018, as part of which funding requirements in future years will be reassessed.
| | |
| 128 | | RELX Group Annual reports and financial statements 2017 |
|
|
Notes to the consolidated financial statements
for the year ended 31 December 2017
6 Pension schemes (continued)
The pension expense, including amounts in relation to the UK, US (for all years) and NL (for 2015 only) defined benefit schemes, and defined contribution schemes in total, recognised within operating profit consists of:
| | | | | | | | | | | | |
| | | 2017
£m | | | 2016 £m | | | 2015 £m | |
Defined benefit pension expense (net of settlement and past service credits) | | | 4 | | | | 36 | | | | 6 | |
Defined contribution pension expense | | | 91 | | | | 75 | | | | 52 | |
Total | | | 95 | | | | 111 | | | | 58 | |
The amounts recognised in the income statement in respect of defined benefit pension schemes during the year are presented by major scheme as follows:
| | | | | | | | | | | | | | | | | | | | | | | | | | | | | | | | | | | | | | | | | | | | | | | | |
| | | 2017 | | | | | | 2016 | | | | | | 2015 | |
| | | UK
£m | | | US
£m | | | Total
£m | | | | | | UK
£m | | | US
£m | | | Total
£m | | | | | | UK
£m | | | US
£m | | | NL
£m | | | Total
£m | |
Service cost | | | 33 | | | | 14 | | | | 47 | | | | | | | | 27 | | | | 14 | | | | 41 | | | | | | | | 34 | | | | 18 | | | | 15 | | | | 67 | |
Settlement and past service credits | | | (42 | ) | | | (1 | ) | | | (43 | ) | | | | | | | – | | | | (5 | ) | | | (5 | ) | | | | | | | (1 | ) | | | – | | | | (60 | ) | | | (61 | ) |
Defined benefit pension expense | | | (9 | ) | | | 13 | | | | 4 | | | | | | | | 27 | | | | 9 | | | | 36 | | | | | | | | 33 | | | | 18 | | | | (45 | ) | | | 6 | |
Net interest on net defined benefit obligation | | | 10 | | | | 5 | | | | 15 | | | | | | | | 9 | | | | 5 | | | | 14 | | | | | | | | 14 | | | | 5 | | | | 2 | | | | 21 | |
Net defined benefit pension expense | | | 1 | | | | 18 | | | | 19 | | | | | | | | 36 | | �� | | 14 | | | | 50 | | | | | | | | 47 | | | | 23 | | | | (43 | ) | | | 27 | |
Net interest on net defined benefit pension scheme liabilities is presented within net finance costs in the income statement. Service cost, including settlements and past service credits, is presented within operating profit.
The 2017 settlement and past service cost credits primarily relate to changes to the UK scheme.
Settlements and past service credits in 2015 primarily relate to the transfer of the Netherlands scheme to a collective industry-wide scheme.
The significant valuation assumptions, determined for each major scheme in conjunction with the respective independent actuaries, are presented below. The net defined benefit pension expense for each year is based on the assumptions and scheme valuations set at 31 December of the prior year.
| | | | | | | | | | | | | | | | | | | | | | | | | | | | | | | | |
| AS AT 31 DECEMBER | | 2017 | | | | | | 2016 | | | | | | 2015 | |
| | | UK | | | US | | | | | | UK | | | US | | | | | | UK | | | US | |
Discount rate | | | 2.60% | | | | 3.55% | | | | | | | | 2.65% | | | | 4.00% | | | | | | | | 3.85% | | | | 4.45% | |
Inflation | | | 3.15% | | | | 2.50% | | | | | | | | 3.25% | | | | 2.50% | | | | | | | | 3.05% | | | | 2.50% | |
Discount rates are set by reference to high-quality corporate bond yields.
Mortality assumptions make allowance for future improvements in longevity and have been determined by reference to applicable mortality statistics. The average life expectancy assumptions are set out below:
| | | | | | | | | | | | | | | | | | | | |
| AS AT 31 DECEMBER 2017 | | Male average life
expectancy | | | | | | Female average
life expectancy | |
| | | UK | | | US | | | | | | UK | | | US | |
Member currently aged 60 years | | | 86 | | | | 86 | | | | | | | | 88 | | | | 89 | |
Member currently aged 45 years | | | 87 | | | | 87 | | | | | | | | 90 | | | | 89 | |
| | |
| Financial statements and other information Notes to the consolidated financial statements | | 129 |
|
|
6 Pension schemes (continued)
The amount recognised in the statement of financial position in respect of defined benefit pension schemes at the start and end of the year and the movements during the year were as follows:
| | | | | | | | | | | | | | | | | | | | | | | | | | | | |
| | | 2017 | | | | | | 2016 | |
| | | UK £m | | | US £m | | | Total
£m | | | | | | UK £m | | | US £m | | | Total
£m | |
Defined benefit obligation | | | | | | | | | | | | | | | | | | | | | | | | | | | | |
At start of year | | | (3,883 | ) | | | (1,120 | ) | | | (5,003 | ) | | | | | | | (3,089 | ) | | | (955 | ) | | | (4,044 | ) |
Service cost | | | (33 | ) | | | (14 | ) | | | (47 | ) | | | | | | | (27 | ) | | | (14 | ) | | | (41 | ) |
Past service credits | | | 42 | | | | 1 | | | | 43 | | | | | | | | – | | | | 5 | | | | 5 | |
Interest on pension scheme liabilities | | | (101 | ) | | | (42 | ) | | | (143 | ) | | | | | | | (117 | ) | | | (45 | ) | | | (162 | ) |
Actuarial gain/(loss) on financial assumptions | | | 45 | | | | (61 | ) | | | (16 | ) | | | | | | | (774 | ) | | | (61 | ) | | | (835 | ) |
Actuarial (loss)/gain arising from experience assumptions | | | (39 | ) | | | 1 | | | | (38 | ) | | | | | | | 22 | | | | 3 | | | | 25 | |
Contributions by employees | | | (8 | ) | | | – | | | | (8 | ) | | | | | | | (7 | ) | | | – | | | | (7 | ) |
Benefits paid | | | 123 | | | | 60 | | | | 183 | | | | | | | | 109 | | | | 95 | | | | 204 | |
Liabilities transferred on settlement* | | | – | | | | – | | | | – | | | | | | | | – | | | | 36 | | | | 36 | |
Exchange translation differences | | | – | | | | 100 | | | | 100 | | | | | | | | – | | | | (184 | ) | | | (184 | ) |
At end of year | | | (3,854 | ) | | | (1,075 | ) | | | (4,929 | ) | | | | | | | (3,883 | ) | | | (1,120 | ) | | | (5,003 | ) |
| | | | | | | |
Fair value of scheme assets | | | | | | | | | | | | | | | | | | | | | | | | | | | | |
At start of year | | | 3,390 | | | | 977 | | | | 4,367 | | | | | | | | 2,838 | | | | 822 | | | | 3,660 | |
Interest income on plan assets | | | 91 | | | | 37 | | | | 128 | | | | | | | | 108 | | | | 40 | | | | 148 | |
Return on assets excluding amounts included in interest income | | | 181 | | | | 106 | | | | 287 | | | | | | | | 502 | | | | 46 | | | | 548 | |
Contributions by employer | | | 42 | | | | 43 | | | | 85 | | | | | | | | 44 | | | | 41 | | | | 85 | |
Contributions by employees | | | 8 | | | | – | | | | 8 | | | | | | | | 7 | | | | – | | | | 7 | |
Benefits paid | | | (123 | ) | | | (60 | ) | | | (183 | ) | | | | | | | (109 | ) | | | (95 | ) | | | (204 | ) |
Assets transferred on settlement* | | | – | | | | – | | | | – | | | | | | | | – | | | | (36 | ) | | | (36 | ) |
Exchange translation differences | | | – | | | | (91 | ) | | | (91 | ) | | | | | | | – | | | | 159 | | | | 159 | |
At end of year | | | 3,589 | | | | 1,012 | | | | 4,601 | | | | | | | | 3,390 | | | | 977 | | | | 4,367 | |
| | | | | | | |
Opening net deficit | | | (493 | ) | | | (143 | ) | | | (636 | ) | | | | | | | (251 | ) | | | (133 | ) | | | (384 | ) |
Service cost | | | (33 | ) | | | (14 | ) | | | (47 | ) | | | | | | | (27 | ) | | | (14 | ) | | | (41 | ) |
Net interest on net defined benefit obligation | | | (10 | ) | | | (5 | ) | | | (15 | ) | | | | | | | (9 | ) | | | (5 | ) | | | (14 | ) |
Settlement and past service credits | | | 42 | | | | 1 | | | | 43 | | | | | | | | – | | | | 5 | | | | 5 | |
Contributions by employer | | | 42 | | | | 43 | | | | 85 | | | | | | | | 44 | | | | 41 | | | | 85 | |
Actuarial gains/(losses) | | | 187 | | | | 46 | | | | 233 | | | | | | | | (250 | ) | | | (12 | ) | | | (262 | ) |
Exchange translation differences | | | – | | | | 9 | | | | 9 | | | | | | | | – | | | | (25 | ) | | | (25 | ) |
Overall net pension obligation | | | (265 | ) | | | (63 | ) | | | (328 | ) | | | | | | | (493 | ) | | | (143 | ) | | | (636 | ) |
* In 2016, the settlement relates to an annuity purchase in the US.
As at 31 December 2017, the defined benefit obligations comprised £4,690m (2016: £4,760m) in relation to funded schemes and £239m (2016: £243m) in relation to unfunded schemes.
The weighted average duration of defined benefit scheme liabilities is 20 years in the UK (2016: 20 years) and 13 years in the US (2016: 13 years). Deferred tax assets of £66m (2016: £145m) are recognised in respect of the pension scheme deficits.
A net pension asset has been recognised in relation to the US funded scheme after considering the guidance in IAS 19 Employee Benefits and IFRIC 14. The split between net pension obligations and net pension assets is as follows:
| | | | | | | | | | | | |
| | | 2017
£m | | | | | | 2016
£m | |
Net pension asset | | | 22 | | | | | | | | – | |
Net pension obligation | | | (350 | ) | | | | | | | (636 | ) |
Overall net pension obligation | | | (328 | ) | | | | | | | (636 | ) |
| | |
| 130 | | RELX Group Annual reports and financial statements 2017 |
|
|
Notes to the consolidated financial statements
for the year ended 31 December 2017
6 Pension schemes (continued)
Amounts recognised in the statement of comprehensive income are set out below:
| | | | | | | | | | | | |
| | | 2017
£m | | | 2016
£m | | | 2015
£m | |
Gains and losses arising during the year: | | | | | | | | | | | | |
Experience (losses)/gains on scheme liabilities | | | (38 | ) | | | 25 | | | | 182 | |
Experience gains/(losses) on scheme assets | | | 287 | | | | 548 | | | | (134 | ) |
Actuarial (losses)/gains on the present value of scheme liabilities due to changes in: | | | | | | | | | | | | |
– discount rates | | | (102 | ) | | | (873 | ) | | | 96 | |
– inflation | | | 69 | | | | (96 | ) | | | (64 | ) |
– other actuarial assumptions | | | 17 | | | | 134 | | | | 77 | |
| | | 233 | | | | (262 | ) | | | 157 | |
Net cumulative losses at start of year | | | (846 | ) | | | (584 | ) | | | (741 | ) |
Net cumulative losses at end of year | | | (613 | ) | | | (846 | ) | | | (584 | ) |
The major categories and fair values of scheme assets at the end of the reporting period are as follows:
| | | | | | | | | | | | | | | | | | | | | | | | | | | | |
| FAIR VALUE OF SCHEME ASSETS | | 2017 | | | | | | 2016 | |
| | | UK £m | | | US £m | | | Total
£m | | | | | | UK £m | | | US
£m | | | Total
£m | |
Equities | | | 1,252 | | | | 143 | | | | 1,395 | | | | | | | | 1,261 | | | | 330 | | | | 1,591 | |
Government bonds | | | 1,395 | | | | 221 | | | | 1,616 | | | | | | | | 1,390 | | | | 104 | | | | 1,494 | |
Corporate bonds | | | – | | | | 622 | | | | 622 | | | | | | | | – | | | | 527 | | | | 527 | |
Property funds and ground leases | | | 620 | | | | – | | �� | | 620 | | | | | | | | 487 | | | | – | | | | 487 | |
Structured debt and direct lending | | | 253 | | | | – | | | | 253 | | | | | | | | 162 | | | | – | | | | 162 | |
Cash and cash equivalents | | | 46 | | | | 18 | | | | 64 | | | | | | | | 69 | | | | 15 | | | | 84 | |
Other | | | 23 | | | | 8 | | | | 31 | | | | | | | | 21 | | | | 1 | | | | 22 | |
Total | | | 3,589 | | | | 1,012 | | | | 4,601 | | | | | | | | 3,390 | | | | 977 | | | | 4,367 | |
Assets and obligations associated with the schemes are sensitive to changes in the market values of assets and the market-related assumptions used to value scheme liabilities. In particular, adverse changes to asset values, discount rates or inflation could increase future pension costs and funding requirements.
Typically, the Group’s schemes are exposed to: investment risks, whereby actual rates of return on plan assets may be below those rates used to determine the defined benefit obligations, and interest rate risks, whereby scheme deficits may increase if bond yields in the UK and the US decline and are not offset by returns in government and corporate bond portfolios. The schemes are also exposed to other risks, such as unanticipated future increases in member longevity patterns and inflation, all potentially leading to an increase in scheme liabilities.
Investment policies of each scheme are intended to ensure continuous payment of defined benefit pensions in the short-term and long-term. Efforts are made to limit risks on marketable securities by adopting investment policies that diversify assets across geographies and among equities, government and corporate bonds, property funds and cash. Asset allocations are dependent on a variety of factors including the duration of scheme liabilities and the funded position of the plan.
All equities, government and corporate bonds have quoted prices in active markets.
Sensitivity analysis
The valuation of the Group’s pension scheme liabilities involves significant actuarial assumptions, being the life expectancy of the members, inflation and the rate at which the future pension payments are discounted. Differences arising from actual experience or future changes in assumptions may materially affect future pension charges. In particular, changes in assumptions for discount rates, inflation and life expectancies that are reasonably possible would have the following approximate effects on the defined benefit pension obligations:
| | | | |
| | | £m | |
Increase/decrease of 0.25% in discount rate: | | | 222 | |
Increase/decrease of 0.25% in the expected inflation rate: | | | 134 | |
Increase/decrease of one year in assumed life expectancy: | | | 179 | |
The above analysis has been calculated on the same basis used to determine the defined benefit obligation recognised in the statement of financial position. There has been no change in the methods used to prepare the analysis compared with prior years. This sensitivity analysis may not be representative of the actual change in the defined benefit obligation as it is unlikely that changes in the above assumptions would occur in isolation of one another as some of the assumptions may be correlated.
| | |
| Financial statements and other information Notes to the consolidated financial statements | | 131 |
|
|
7 Share based remuneration
Accounting policy
The fair value of share based remuneration is determined at the date of grant and recognised as an expense in the income statement on a straight-line basis over the vesting period, taking account of the estimated number of shares that are expected to vest. Market based performance criteria are taken into account when determining the fair value at the date of grant.Non-market based performance criteria are taken into account when estimating the number of shares expected to vest. The fair value of share based remuneration is determined by use of a binomial or Monte Carlo simulation model as appropriate. All of the Group’s share based remuneration is equity settled.
The Group provides a number of share based remuneration schemes to Directors and employees. The principal share based remuneration schemes are the Executive Share Option Schemes (ESOS), the Long-Term Incentive Plan (LTIP), the Retention Share Plan (RSP) and the Bonus Investment Plan (BIP). Share options granted under ESOS are exercisable after three years and up to ten years from the date of grant at a price equivalent to the market value of the respective shares at the date of grant. Conditional shares granted under LTIP, RSP and BIP are exercisable after three years for nil consideration if conditions are met. Other awards principally relate to all employee share based saving schemes in the UK and the Netherlands.
Share based remuneration awards are, other than upon retirement or in exceptional circumstances, subject to the condition that the employee remains in employment at the time of exercise.
Conditional shares granted under LTIP, RSP and BIP between 2014 and 2017 are subject to the achievement of growth targets of adjusted earnings per share measured at constant exchange rates as well as the achievement of a targeted percentage return on invested capital of the Group. LTIP grants between 2014 and 2017 and RSP grants in 2014 and 2017 are also variable subject to the achievement of a total shareholder return performance target.
The weighted average fair value per award is based on full vesting on achievement ofnon-market-related performance conditions and stochastic models for market-related components. The conditional shares and option awards are recognised in the income statement over the vesting period, being between three and five years, on the basis of expected performance against thenon-market-related conditions, with the fair value related to market-related components unchanging.
| | | | | | | | | | | | | | | | | | | | |
| | | In respect of RELX PLC ordinary shares | | | | | | In respect of RELX NV ordinary shares | |
| | | Number of
shares
‘000 | | | Weighted
average fair
value per
award £ | | | | | | Number of
shares
‘000 | | | Weighted
average fair
value per
award £ | |
2017 GRANTS | | | | | | | | | | | | | | | | | | | | |
Share options | | | 1,688 | | | | 1.60 | | | | | | | | 1,647 | | | | 1.30 | |
Conditional shares | | | 1,637 | | | | 13.74 | | | | | | | | 1,631 | | | | 13.33 | |
2016 GRANTS | | | | | | | | | | | | | | | | | | | | |
Share options | | | 1,727 | | | | 1.49 | | | | | | | | 1,668 | | | | 1.12 | |
Conditional shares | | | 1,706 | | | | 11.51 | | | | | | | | 1,778 | | | | 11.41 | |
2015 GRANTS | | | | | | | | | | | | | | | | | | | | |
Share options | | | 1,911 | | | | 1.23 | | | | | | | | 1,827 | | | | 0.77 | |
Conditional shares | | | 1,841 | | | | 10.44 | | | | | | | | 1,874 | | | | 9.72 | |
| | |
| 132 | | RELX Group Annual reports and financial statements 2017 |
|
|
Notes to the consolidated financial statements
for the year ended 31 December 2017
7 Share based remuneration (continued)
The main assumptions used to determine the fair values, which have been established with advice from and data provided by independent actuaries, are set out below:
| | | | | | | | | | | | | | | | | | | | | | | | | | | | |
| ASSUMPTIONS FOR GRANTS MADE DURING THE YEAR | | In respect of RELX PLC | | | | | | In respect of RELX NV | |
| | | ordinary shares | | | | | | ordinary shares | |
| | | 2017 | | | 2016 | | | 2015 | | | | | | 2017 | | | 2016 | | | 2015 | |
Weighted average share price at date of grant | | | | | | | | | | | | | | | | | | | | | | | | | | | | |
– Share options* | | | £15.44 | | | | £12.52 | | | | £11.44 | | | | | | | | €17.04 | | | | €15.31 | | | | €14.80 | |
– Conditional shares | | | £15.07 | | | | £12.68 | | | | £11.55 | | | | | | | | €16.71 | | | | €15.28 | | | | €14.98 | |
Expected share price volatility | | | 16% | | | | 17% | | | | 19% | | | | | | | | 19% | | | | 19% | | | | 19% | |
Expected option life | | | 4 years | | | | 4 years | | | | 4 years | | | | | | | | 4 years | | | | 4 years | | | | 4 years | |
Expected dividend yield | | | 3.0% | | | | 3.0% | | | | 3.5% | | | | | | | | 3.0% | | | | 3.0% | | | | 4.2% | |
Risk-free interest rate | | | 0.3% | | | | 0.7% | | | | 0.8% | | | | | | | | 0.0% | | | | 0.0% | | | | 0.0% | |
Expected lapse rate | | | 2-5% | | | | 2-5% | | | | 2-5% | | | | | | | | 2-5% | | | | 2-4% | | | | 2-4% | |
* Weighted average exercise price is disclosed in the table below.
Expected share price volatility has been estimated based on relevant historical data in respect of the RELX PLC and RELX NV ordinary share prices. Expected share option life has been estimated based on historical exercise patterns in respect of RELX PLC and RELX NV share options.
The share based remuneration options outstanding as at 31 December 2017, in respect of both RELX PLC and RELX NV ordinary shares, are set out below:
| | | | | | | | | | | | | | | | | | | | |
| SHARE OPTIONS | | In respect of RELX PLC
ordinary shares | | | | | | In respect of RELX NV
ordinary shares | |
| | | Number of
shares
under option
‘000 | | | Weighted
average
exercise
price
(pence) | | | | | | Number of
shares
under option
‘000 | | | Weighted
average
exercise
price (€) | |
Outstanding at 1 January 2015 | | | 9,327 | | | | 629 | | | | | | | | 9,468 | | | | 7.58 | |
Granted | | | 1,911 | | | | 978 | | | | | | | | 1,827 | | | | 14.80 | |
Exercised | | | (2,053 | ) | | | 627 | | | | | | | | (1,716 | ) | | | 7.32 | |
Forfeited | | | (254 | ) | | | 694 | | | | | | | | (680 | ) | | | 7.51 | |
Expired | | | (191 | ) | | | 618 | | | | | | | | (438 | ) | | | 6.18 | |
Outstanding at 1 January 2016 | | | 8,740 | | | | 704 | | | | | | | | 8,461 | | | | 9.27 | |
Granted | | | 1,727 | | | | 1,164 | | | | | | | | 1,668 | | | | 15.31 | |
Exercised | | | (1,954 | ) | | | 519 | | | | | | | | (1,778 | ) | | | 8.05 | |
Forfeited | | | (424 | ) | | | 489 | | | | | | | | (310 | ) | | | 12.41 | |
Expired | | | (147 | ) | | | 470 | | | | | | | | (144 | ) | | | 8.56 | |
Outstanding at 1 January 2017 | | | 7,942 | | | | 865 | | | | | | | | 7,897 | | | | 10.71 | |
Granted | | | 1,688 | | | | 1,396 | | | | | | | | 1,647 | | | | 17.06 | |
Exercised | | | (2,130 | ) | | | 700 | | | | | | | | (2,170 | ) | | | 9.86 | |
Forfeited | | | (394 | ) | | | 1,135 | | | | | | | | (186 | ) | | | 15.54 | |
Expired | | | (140 | ) | | | 762 | | | | | | | | (140 | ) | | | 9.20 | |
Outstanding at 31 December 2017 | | | 6,966 | | | | 1,031 | | | | | | | | 7,048 | | | | 12.36 | |
| | | | | |
Exercisable at 31 December 2015 | | | 3,105 | | | | 551 | | | | | | | | 4,886 | | | | 8.02 | |
Exercisable at 31 December 2016 | | | 2,598 | | | | 598 | | | | | | | | 4,770 | | | | 8.91 | |
Exercisable at 31 December 2017 | | | 2,162 | | | | 696 | | | | | | | | 4,241 | | | | 10.14 | |
The weighted average share price at the date of exercise of share options and vesting of conditional shares during 2017 was 1,560p (2016: 1,278p; 2015: 1,118p) for RELX PLC ordinary shares and€17.23 (2016:€15.23; 2015:€14.50) for RELX NV ordinary shares.
| | |
| Financial statements and other information Notes to the consolidated financial statements | | 133 |
|
|
7 Share based remuneration (continued)
| | | | | | | | | | | | | | | | | | | | | | | | | | | | | | | | |
| RANGE OF EXERCISE PRICES FOR OUTSTANDING SHARE OPTIONS | | 2017 | | | | | | 2016 | | | | | | 2015 | |
| | | Number of
shares
under option
‘000 | | | Weighted
average
remaining
period until
expiry
(years) | | | | | | Number of
shares under option ‘000 | | | Weighted
average
remaining
period until
expiry
(years) | | | | | | Number of
shares under option ‘000 | | | Weighted
average
remaining
period until
expiry
(years) | |
RELX PLC ordinary shares (pence) | | | | | | | | | | | | | | | | | | | | | | | | | | | | | | | | |
401-600 | | | 1,043 | | | | 2.8 | | | | | | | | 1,672 | | | | 3.6 | | | | | | | | 2,950 | | | | 4.0 | |
601-800 | | | 733 | | | | 3.6 | | | | | | | | 1,922 | | | | 3.4 | | | | | | | | 2,856 | | | | 4.4 | |
801-1,000 | | | 1,272 | | | | 4.0 | | | | | | | | 1,732 | | | | 5.3 | | | | | | | | 1,903 | | | | 6.3 | |
1,001-1,200 | | | 1,465 | | | | 5.3 | | | | | | | | 1,657 | | | | 6.2 | | | | | | | | 1,031 | | | | 9.3 | |
1,201-1,400 | | | 1,530 | | | | 6.1 | | | | | | | | 949 | | | | 9.2 | | | | | | | | – | | | | – | |
1,401-1,600 | | | 896 | | | | 9.2 | | | | | | | | 10 | | | | 9.7 | | | | | | | | – | | | | – | |
1,601-1,800 | | | 27 | | | | 9.7 | | | | | | | | – | | | | – | | | | | | | | – | | | | – | |
Total | | | 6,966 | | | | 5.2 | | | | | | | | 7,942 | | | | 5.1 | | | | | | | | 8,740 | | | | 5.3 | |
RELX NV ordinary shares (€) | | | | | | | | | | | | | | | | | | | | | | | | | | | | | | | | |
4.01-6.00 | | | 1,032 | | | | 3.2 | | | | | | | | 1,380 | | | | 4.2 | | | | | | | | 1,924 | | | | 5.4 | |
6.01-8.00 | | | 506 | | | | 1.8 | | | | | | | | 965 | | | | 2.2 | | | | | | | | 1,446 | | | | 2.8 | |
8.01-10.00 | | | 617 | | | | 5.4 | | | | | | | | 1,181 | | | | 5.6 | | | | | | | | 1,971 | | | | 5.9 | |
10.01-12.00 | | | 865 | | | | 6.2 | | | | | | | | 1,239 | | | | 7.2 | | | | | | | | 1,333 | | | | 8.2 | |
12.01-14.00 | | | 69 | | | | 6.3 | | | | | | | | 114 | | | | 7.5 | | | | | | | | 143 | | | | 8.4 | |
14.01-16.00 | | | 2,600 | | | | 7.7 | | | | | | | | 3,002 | | | | 8.7 | | | | | | | | 1,625 | | | | 9.2 | |
16.01-18.00 | | | 1,154 | | | | 9.1 | | | | | | | | 16 | | | | 8.3 | | | | | | | | 19 | | | | 9.0 | |
18.01-20.00 | | | 205 | | | | 9.0 | | | | | | | | – | | | | – | | | | | | | | – | | | | – | |
Total | | | 7,048 | | | | 6.5 | | | | | | | | 7,897 | | | | 6.4 | | | | | | | | 8,461 | | | | 6.3 | |
Share options are expected, upon exercise, to be met by the issue of new ordinary shares.
8 Net finance costs
Accounting policy
Borrowing costs that are directly attributable to the acquisition, construction or production of an asset that takes a substantial period of time to bring to use are capitalised. All other interest on borrowings is expensed as incurred. The cost of issuing borrowings is generally expensed over the period of borrowing so as to produce a constant periodic rate of charge.
| | | | | | | | | | | | |
| | | 2017
£m | | | 2016
£m | | | 2015
£m | |
Interest on short-term bank loans, overdrafts and commercial paper | | | (10 | ) | | | (15 | ) | | | (11 | ) |
Interest on term debt | | | (152 | ) | | | (160 | ) | | | (141 | ) |
Total borrowing costs | | | (162 | ) | | | (175 | ) | | | (152 | ) |
Losses on loans and derivatives not designated as hedges | | | (9 | ) | | | (14 | ) | | | (3 | ) |
Fair value losses on designated fair value hedge relationships | | | – | | | | – | | | | (1 | ) |
Net financing charge on defined benefit pension schemes | | | (15 | ) | | | (14 | ) | | | (21 | ) |
Finance costs | | | (186 | ) | | | (203 | ) | | | (177 | ) |
Interest on bank deposits | | | 3 | | | | 6 | | | | 3 | |
Fair value gains on designated fair value hedge relationships | | | 1 | | | | – | | | | – | |
Gains on loans and derivatives not designated as hedges | | | – | | | | 2 | | | | – | |
Finance income | | | 4 | | | | 8 | | | | 3 | |
Net finance costs | | | (182 | ) | | | (195 | ) | | | (174 | ) |
A net gain of £63m (2016: loss of £26m; 2015: loss of £48m) on interest rate derivatives designated as cash flow hedges was recognised in other comprehensive income and accumulated in the hedge reserve. This included gains of £78m (2016: losses of £18m; 2015: losses of £42m) related to foreign exchange movements on debt hedges, which were reclassified immediately to the income statement and offset £78m (2016: £18m gains; 2015: £42m gains) of foreign exchange losses on the related debt. The remaining loss of £15m (2016: £8m; 2015: £6m) recognised in other comprehensive income may be reclassified to the income statement in future periods. Including the £78m (2016: losses of £18m; 2015: losses of £42m) of foreign exchange gains, net gains of £65m (2016: losses of £27m; 2015: losses of £48m) in total were transferred from the hedge reserve in the period.
| | |
| 134 | | RELX Group Annual reports and financial statements 2017 |
|
|
Notes to the consolidated financial statements
for the year ended 31 December 2017
9 Disposals and othernon-operating items
Accounting policy
Assets of businesses that are available for immediate sale in their current condition and for which a sales process is considered highly probable to complete are classified as assets held for sale and are carried at the lower of carrying value and fair value less costs to sell. Fair value is based on anticipated disposal proceeds, typically derived from firm or indicative offers from potential acquirers.Non-current assets are not amortised or depreciated following their classification as held for sale. Liabilities of businesses held for sale are also separately classified on the statement of financial position. Fair value movements in the venture capital portfolio, which are classified as held for trading, are reported within disposals and other items – see note 17.
| | | | | | | | | | | | |
| | | 2017
£m | | | 2016
£m | | | 2015
£m | |
Revaluation of held for trading investments | | | 5 | | | | (13 | ) | | | 8 | |
Gain/(loss) on disposal of businesses and assets held for sale | | | 6 | | | | (27 | ) | | | (19 | ) |
Net gain/(loss) on disposals and othernon-operating items | | | 11 | | | | (40 | ) | | | (11 | ) |
10 Taxation
Accounting policy
Tax expense comprises current and deferred tax. Current and deferred tax are charged or credited in the income statement except to the extent that the tax arises from a transaction or event which is recognised, in the same or a different period, outside the income statement (either in other comprehensive income, directly in equity, or through a business combination), in which case the tax appears in the same statement as the transaction that gave rise to it.
Current tax is the amount of corporate income taxes expected to be payable or recoverable based on the profit for the period as adjusted for items that are not taxable or not deductible, and is calculated using tax rates and laws that were enacted or substantively enacted at the date of the statement of financial position. Management periodically evaluates positions taken in tax returns with respect to situations in which applicable tax regulation is subject to interpretation. Provisions are established where appropriate on the basis of amounts expected to be paid to the tax authorities.
Current tax includes amounts provided in respect of uncertain tax positions when management expects that, upon examination of the uncertainty by a tax authority in possession of all relevant knowledge, it is more likely than not that an economic outflow will occur. Changes in facts and circumstances underlying these provisions are reassessed at the date of each statement of financial position, and the provisions are remeasured as required to reflect current information.
Deferred tax is recognised on temporary differences arising between the tax bases of assets and liabilities and their carrying amounts in the statement of financial position. Deferred tax is calculated using tax rates and laws that have been enacted or substantively enacted at the end of the reporting period, and which are expected to apply when the related deferred tax asset is realised or the deferred tax liability is settled.
Deferred tax liabilities are generally recognised for all taxable temporary differences but not recognised for taxable temporary differences arising on investments in subsidiaries, associates and joint ventures where the reversal of the temporary difference can be controlled and it is probable that the difference will not reverse in the foreseeable future. Deferred tax liabilities are not recognised on temporary differences that arise from goodwill which is not deductible for tax purposes.
Deferred tax assets are recognised to the extent it is probable that taxable profits will be available against which the deductible temporary differences can be utilised, and are reviewed at the end of each reporting period and reduced to the extent that it is no longer probable that sufficient taxable profits will be available to allow all or part of the asset to be recovered.
Deferred tax assets and liabilities are not recognised in respect of temporary differences that arise on initial recognition of assets and liabilities acquired other than in a business combination. Deferred tax is not discounted.
| | |
| Financial statements and other information Notes to the consolidated financial statements | | 135 |
|
|
10 Taxation (continued)
Accounting policy (continued)
Critical judgement and key source of estimation uncertainty
The Group is subject to tax in numerous jurisdictions, giving rise to complex tax issues that require management to exercise judgement in making tax determinations. As a multinational enterprise, our tax returns in the countries in which we operate are subject to tax authority audits as a matter of routine. While the Group is confident that tax returns are appropriately prepared and filed, amounts are provided in respect of uncertain tax positions that reflect the risk with respect to tax matters under active discussion with tax authorities, or which are otherwise considered to involve uncertainty.
Provisions against uncertain tax positions are measured using one of the following methods, depending on which of the methods management expects will better predict the amount it will pay over to the tax authority:
| | ◾ | | The Single Best Estimate – where there is a single outcome that is more likely than not to occur. This will happen, for example, where the tax outcome is binary (such as whether an entity can deduct an item of expenditure) or the range of possible outcomes is narrow or concentrated on a single value. The most likely outcome may be that no tax is expected to be payable, in which case the provision is nil; or |
| | ◾ | | A Probability-Weighted Expected Value – where, on the balance of probabilities, something will be paid to the tax authority but the possible outcomes are widely dispersed with low individual probabilities (i.e. there is no single outcome more likely than not to occur). In this case, the provision is the sum of the probability-weighted amounts in the range. |
In assessing provisions against uncertain tax positions, management usesin-house tax experts, professional firms and previous experience to inform the evaluation of risk. However, it remains possible that uncertainties will ultimately be resolved at amounts greater or smaller than the liabilities recorded.
In particular, although we report cross-border transactions undertaken between Group subsidiaries on anarm’s-length basis in tax returns in accordance with OECD guidelines, transfer pricing relies on the exercise of judgement and it is frequently possible for there to be a range of legitimate and reasonable views. This means that it is impossible to be certain that the returns basis will be sustained on examination. Discussions with tax authorities relating to cross-border transactions and other matters are ongoing in each of our major trading jurisdictions. Although the timing and amount of final resolution of these uncertain tax positions cannot be reliably predicted, no significant impact on the profitability of the Group is expected in the near term.
Estimation of income taxes also includes assessments of the recoverability of deferred tax assets. Deferred tax assets are only recognised to the extent that they are considered recoverable based on existing tax laws and forecasts of future taxable profits against which the underlying tax deductions can be utilised. The recoverability of these assets is reassessed at the end of each reporting period, and changes in recognition of deferred tax assets will affect the tax liability in the period of that reassessment.
| | | | | | | | | | | | |
| | | 2017
£m | | | 2016
£m | | | 2015
£m | |
Current tax | | | | | | | | | | | | |
United Kingdom | | | (104 | ) | | | (80 | ) | | | (65 | ) |
The Netherlands | | | (77 | ) | | | (51 | ) | | | (45 | ) |
Rest of world | | | (258 | ) | | | (243 | ) | | | (260 | ) |
Total current tax charge | | | (439 | ) | | | (374 | ) | | | (370 | ) |
Deferred tax | | | 372 | | | | 70 | | | | 72 | |
Tax expense | | | (67 | ) | | | (304 | ) | | | (298 | ) |
Cash tax paid in the year was £449m (2016: £402m; 2015: £343m), which is different to the tax expense for the year set out above.
There are a number of reasons why the cash tax payments in a particular year will be different from the tax expense in the accounts:
Deferred tax:
| ◾ | | Tax expense includes deferred tax, which is an accounting adjustment arising from temporary differences; |
| ◾ | | Temporary differences occur when an item has to be included in the income statement in one year but is taxed in another year; and |
| ◾ | | For the purposes of acquisition accounting only, the Group recognises deferred tax liabilities arising on intangible assets. Any unwind of these deferred tax liabilities from the amortisation of intangible assets does not result in cash tax payments. |
Timing differences:
| ◾ | | Tax payments relating to a particular year’s profits are typically due partly in the year and partly in the following year. |
Prior period adjustments:
| ◾ | | Current tax expense is the best estimate at the end of the period of cash tax expected to be paid; and |
| ◾ | | To the extent the final liability is higher or lower than that estimate, any cash tax impact will occur in a later period. |
| | |
| 136 | | RELX Group Annual reports and financial statements 2017 |
|
|
Notes to the consolidated financial statements
for the year ended 31 December 2017
10 Taxation (continued)
Items recorded in equity and other comprehensive income:
| ◾ | | Some of the benefits of tax deductions related to share based payments, pensions and hedging are credited to equity or other comprehensive income rather than to tax expense, and so the cash tax liability will be lower than the current tax expense in years when those deductions are available. |
Set out below is a reconciliation of the difference between tax expense for the period and the theoretical expense calculated by multiplying accounting profit by the applicable tax rate.
We believe the most meaningful applicable rate is that obtained by multiplying the accounting profits and losses of all consolidated entities by the applicable domestic rate in each of those entities’ jurisdictions.
The net tax expense charged on profit before tax differs from the theoretical amount that would arise using the weighted average of tax rates applicable to accounting profits and losses of the consolidated entities, as follows:
| | | | | | | | | | | | | | | | | | | | | | | | | | | | | | | | |
| | | 2017 | | | | | | 2016 | | | | | | 2015 | |
| | | £m | | | % | | | | | | £m | | | % | | | | | | £m | | | % | |
Profit before tax | | | 1,734 | | | | | | | | | | | | 1,473 | | | | | | | | | | | | 1,312 | | | | | |
Tax at average applicable rates | | | (392 | ) | | | 22.6% | | | | | | | | (330) | | | | 22.4% | | | | | | | | (299 | ) | | | 22.8% | |
Tax effect of share of results of joint ventures | | | 7 | | | | (0.4)% | | | | | | | | 7 | | | | (0.5)% | | | | | | | | 11 | | | | (0.8)% | |
Expenses not deductible for tax purposes | | | (14 | ) | | | 0.7% | | | | | | | | (18) | | | | 1.3% | | | | | | | | (16 | ) | | | 1.1% | |
US state taxes | | | (18 | ) | | | 1.0% | | | | | | | | (13) | | | | 0.9% | | | | | | | | (9 | ) | | | 0.7% | |
Non-deductible costs of share based remuneration | | | (1 | ) | | | 0.1% | | | | | | | | (1) | | | | 0.1% | | | | | | | | (3 | ) | | | 0.2% | |
Non-deductible disposal-related gains and losses | | | (36 | ) | | | 2.1% | | | | | | | | (8) | | | | 0.5% | | | | | | | | 4 | | | | (0.3)% | |
Tax losses of the period not recognised | | | (10 | ) | | | 0.6% | | | | | | | | (2) | | | | 0.1% | | | | | | | | (2 | ) | | | 0.2% | |
Recognition and utilisation of tax losses that arose in prior years | | | 16 | | | | (0.9)% | | | | | | | | 32 | | | | (2.1)% | | | | | | | | – | | | | 0.0% | |
Other adjustments in respect of prior periods | | | 35 | | | | (2.0)% | | | | | | | | 28 | | | | (1.9)% | | | | | | | | 16 | | | | (1.2)% | |
Deferred tax effect of changes in tax rates | | | 346 | | | | (19.9)% | | | | | | | | 1 | | | | (0.1)% | | | | | | | | – | | | | 0.0% | |
Tax expense | | | (67 | ) | | | 3.9% | | | | | | | | (304) | | | | 20.7% | | | | | | | | (298 | ) | | | 22.7% | |
The weighted average applicable tax rate for the year was 22.6% (2016: 22.4%, 2015: 22.8%), reflecting the applicable rates in the countries where the Group operates. The Group’s future tax charge will be sensitive to the geographic mix of profits and losses and the tax rates and laws in force in the jurisdictions in which we operate.
In the UK, a reduction in the corporate tax rate from 18% to 17% from April 2020 was enacted on 6 September 2016. In the US, the Tax Cuts and Jobs Act which includes a reduction in the federal corporate tax rate from 35% to 21% from January 2018 was enacted on 22 December 2017. Consequently, the Group has measured its US deferred tax assets and liabilities at the end of the reporting period at a combined (federal and state) tax rate of 26%. This has resulted in the recognition of an exceptional deferred tax credit of £346m in the income statement and a reduction in the reported tax rate to 3.9% (2016: 20.7%, 2015: 22.7%).
The following tax has been recognised in other comprehensive income or directly in equity during the year:
| | | | | | | | | | | | |
| | | 2017
£m | | | 2016
£m | | | 2015
£m | |
Tax on items that will not be reclassified to profit or loss | | | | | | | | | | | | |
Tax on actuarial movements on defined benefit pension schemes | | | (59 | ) | | | 45 | | | | (34 | ) |
| | | | | | | | | | | | | |
Tax on items that may be reclassified to profit or loss | | | | | | | | | | | | |
Tax on fair value movements on cash flow hedges | | | (30 | ) | | | 19 | | | | 18 | |
| | | | | | | | | | | | | |
Net tax (debit)/credit recognised in other comprehensive income | | | (89 | ) | | | 64 | | | | (16 | ) |
Tax credit on share based remuneration recognised directly in equity | | | 8 | | | | 10 | | | | 17 | |
The measurement of the US deferred tax assets and liabilities has also resulted in a charge of £10m in other comprehensive income and a charge of £5m directly in equity.
| | |
| Financial statements and other information Notes to the consolidated financial statements | | 137 |
|
|
10 Taxation (continued)
| | | | | | | | |
| | | 2017
£m | | | 2016
£m | |
Deferred tax assets | | | 405 | | | | 444 | |
Deferred tax liabilities | | | (738 | ) | | | (1,137 | ) |
Total | | | (333 | ) | | | (693 | ) |
Movements in deferred tax liabilities and assets (before taking into consideration the offsetting of balances within the same jurisdiction) are summarised as follows:
| | | | | | | | | | | | | | | | | | | | | | | | | | | | | | | | | | | | |
| | | Deferred tax liabilities | | | | | | Deferred tax assets | | | | |
| | | Excess of tax
allowances
over
amortisation
£m | | | Acquired
intangible
assets
£m | | | Other
temporary
differences
£m | | | | | | Excess of
amortisation
over tax
allowances
£m | | | Tax
losses
carried
forward
£m | | | Pensions
liabilities
£m | | | Other
temporary
differences
£m | | | Total
£m | |
Deferred tax (liability)/asset at 1 January 2016 | | | (339 | ) | | | (702 | ) | | | (291 | ) | | | | | | | 251 | | | | 32 | | | | 103 | | | | 295 | | | | (651 | ) |
Credit/(charge) to profit | | | 9 | | | | 91 | | | | 4 | | | | | | | | (28 | ) | | | 26 | | | | (1 | ) | | | (31 | ) | | | 70 | |
Credit to equity/other comprehensive income | | | – | | | | – | | | | 4 | | | | | | | | – | | | | – | | | | 33 | | | | 17 | | | | 54 | |
Acquisitions | | | – | | | | (38 | ) | | | – | | | | | | | | – | | | | 3 | | | | – | | | | – | | | | (35 | ) |
Exchange translation differences | | | (63 | ) | | | (118 | ) | | | (55 | ) | | | | | | | 40 | | | | 9 | | | | 10 | | | | 46 | | | | (131 | ) |
Deferred tax (liability)/asset at 1 January 2017 | | | (393 | ) | | | (767 | ) | | | (338 | ) | | | | | | | 263 | | | | 70 | | | | 145 | | | | 327 | | | | (693 | ) |
Credit/(charge) to profit | | | 97 | | | | 298 | | | | 2 | | | | | | | | (15 | ) | | | 22 | | | | – | | | | (32 | ) | | | 372 | |
(Charge)/credit to equity/other comprehensive income | | | – | | | | – | | | | 7 | | | | | | | | – | | | | – | | | | (76 | ) | | | (20 | ) | | | (89 | ) |
Acquisitions | | | – | | | | (2 | ) | | | – | | | | | | | | – | | | | – | | | | – | | | | – | | | | (2 | ) |
Exchange translation differences | | | 29 | | | | 45 | | | | 27 | | | | | | | | 9 | | | | (5 | ) | | | (3 | ) | | | (23 | ) | | | 79 | |
Deferred tax (liability)/asset at
31 December 2017 | | | (267 | ) | | | (426 | ) | | | (302 | ) | | | | | | | 257 | | | | 87 | | | | 66 | | | | 252 | | | | (333 | ) |
Other deferred tax liabilities include temporary differences in respect of property, plant and equipment, capitalised development spend and financial instruments. Other deferred tax assets include temporary differences in respect of share based remuneration provisions and financial instruments.
As a result of exemptions on dividends from subsidiaries and capital gains on disposal there are no significant taxable temporary differences associated with investments in subsidiaries, branches, associates and interests in joint arrangements.
Deferred tax assets in respect of tax losses and other deductible temporary differences have only been recognised to the extent that it is more likely than not that sufficient taxable profits will be available to allow the asset to be recovered. Accordingly, no deferred tax asset has been recognised in respect of unused trading losses of approximately £143m (2016: £111m) carried forward at year end. The deferred tax asset not recognised in respect of these losses is approximately £34m (2016: £30m). Of the unrecognised losses, £30m (2016: £31m) will expire if not utilised within ten years and £113m (2016: £80m) will expire after more than ten years.
Deferred tax assets of approximately £4m (2016: £7m) have not been recognised in respect of tax losses and other temporary differences carried forward of £23m (2016: £42m), which can only be used to offset future capital gains.
| | |
| 138 | | RELX Group Annual reports and financial statements 2017 |
|
|
Notes to the consolidated financial statements
for the year ended 31 December 2017
11 Earnings per share
Accounting policy
With effect from 6 April 2016, the UK government abolished tax credits on dividends paid after this date, including the 2015 final dividend, which was paid in May 2016. As a result of the abolition of this credit, dividends and therefore earnings per share are equal for both RELX PLC and RELX NV. Earnings per share is calculated by taking the reported net profit attributable to shareholders and dividing this by the total weighted average number of shares.
In calculating earnings per share of the Group up until the end of 2015 (prior to the abolition of the tax credit), the earnings for each class of share were calculated on the basis that earnings are fully distributed. The Group’s usual practice is for only a portion of earnings to be distributed by way of dividends. Until the end of 2015, dividends paid to RELX PLC and RELX NV shareholders were, other than in special circumstances, equalised at the gross level inclusive of the prevailing UK tax credit available to certain RELX PLC shareholders. The allocation of earnings between the RELX PLC shares and the RELX NV shares reflected the differential in dividend payments declared as a result of the tax credit, with the balance of earnings assumed to be distributed as a capital distribution, in equal amounts per share.
Adjusted earnings per share is calculated by dividing adjusted net profit attributable to shareholders by the total weighted average number of shares for the Group.
| | | | | | | | | | | | | | | | | | | | | | | | | | | | |
| EARNINGS PER SHARE – FOR THE YEAR ENDED 31 DECEMBER | | 2017 | | | | | | 2016 | |
| | | Net profit
attributable
to RELX PLC
and RELX NV
shareholders
£m | | | Weighted
average
number of
shares
(millions) | | | EPS (pence) | | | | | | Net profit
attributable
to RELX PLC
and RELX NV
shareholders
£m | | | Weighted
average
number of
shares
(millions) | | | EPS (pence) | |
Basic earnings per share for RELX PLC and RELX NV (pence) | | | 1,659 | | | | 2,019.4 | | | | 82.2p | | | | | | | | 1,161 | | | | 2,062.3 | | | | 56.3p | |
Diluted earnings per share for RELX PLC and RELX NV (pence) | | | 1,659 | | | | 2,035.2 | | | | 81.5p | | | | | | | | 1,161 | | | | 2,079.8 | | | | 55.8p | |
| | | | | | | | | | | | | | | | | | | | | | | | | | | | |
| ALLOCATION OF EARNINGS – 2015 | | | | | | | | | | | | | | | | | | | | | |
| FOR THE YEAR ENDED 31 DECEMBER | | | | | | | | | | | | | | | | | | | | 2015 £m | |
RELX PLC | | | | | | | | | | | | | | | | | | | | | | | | | | | | |
Allocation of distributed earnings | | | | | | | | | | | | | | | | | | | | | | | | | | | 294 | |
Allocation of undistributed earnings | | | | | | | | | | | | | | | | | | | | | | | | | | | 224 | |
Total net profit allocated to RELX PLC shares | | | | | | | | | | | | | | | | | | | | | | | | | | | 518 | |
| | | | | | | | | | | | | | | | | | | | | | | | | | | | | |
RELX NV | | | | | | | | | | | | | | | | | | | | | | | | | | | | |
Allocation of distributed earnings | | | | | | | | | | | | | | | | | | | | | | | | | | | 291 | |
Allocation of undistributed earnings | | | | | | | | | | | | | | | | | | | | | | | | | | | 199 | |
Total net profit allocated to RELX NV shares | | | | | | | | | | | | | | | | | | | | | | | | | | | 490 | |
| | | | | | | | | | | | | | | | | | | | | | | | | | | | | |
Total net profit attributable to RELX PLC and RELX NV shareholders | | | | | | | | | | | | | | | | | | | | | | | | | | | 1,008 | |
| | |
| Financial statements and other information Notes to the consolidated financial statements | | 139 |
|
|
11 Earnings per share (continued)
| | | | | | | | |
| EARNINGS PER SHARE – 2015 | | 2015 | |
| FOR THE YEAR ENDED 31 DECEMBER | | Weighted
average
number of
shares
(millions) | | | EPS
(pence) | |
Basic earnings per share | | | | | | | | |
RELX PLC | | | 1,116.2 | | | | 46.4p | |
RELX NV | | | 992.4 | | | | 49.4p | |
| | | | | | | | | |
Diluted earnings per share | | | | | | | | |
RELX PLC | | | 1,125.9 | | | | 46.0p | |
RELX NV | | | 1,001.6 | | | | 48.9p | |
The diluted figures are calculated after taking account of potential additional ordinary shares arising from share options and conditional shares.
| | | | | | | | | | | | | | | | | | | | | | | | | | | | | | | | | | | | | | | | | | | | |
| ADJUSTED EARNINGS PER SHARE | | 2017 | | | | | | 2016 | | | | | | 2015 | |
| | | Adjusted net | | | | | | | | | | | | Adjusted net | | | | | | | | | | | | Adjusted net | | | | | | | |
| | | profit | | | | | | | | | | | | profit | | | | | | | | | | | | profit | | | | | | | |
| | | attributable | | | Weighted | | | | | | | | | attributable to | | | Weighted | | | | | | | | | attributable to | | | Weighted | | | | |
| | | to RELX PLC | | | average | | | | | | | | | RELX PLC and | | | average | | | | | | | | | RELX PLC and | | | average | | | | |
| | | and RELX NV | | | number | | | Adjusted | | | | | | RELX NV | | | number of | | | Adjusted | | | | | | RELX NV | | | number of | | | Adjusted | |
| | | shareholders | | | of shares | | | EPS | | | | | | shareholders | | | shares | | | EPS | | | | | | shareholders | | | shares | | | EPS | |
| | | £m | | | (millions) | | | (pence) | | | | | | £m | | | (millions) | | | (pence) | | | | | | £m | | | (millions) | | | (pence) | |
Adjusted earnings per share for | | | | | | | | | | | | | | | | | | | | | | | | | | | | | | | | | | | | | | | | | | | | |
RELX PLC and RELX NV (pence) | | | 1,635 | | | | 2,019.4 | | | | 81.0p | | | | | | | | 1,488 | | | | 2,062.3 | | | | 72.2p | | | | | | | | 1,275 | | | | 2,108.6 | | | | 60.5p | |
| | | | | | | | | | | | |
| RECONCILIATION OF ADJUSTED NET PROFIT ATTRIBUTABLE TO RELX PLC AND RELX NV SHAREHOLDERS | | 2017
£m | | | 2016
£m | | | 2015
£m | |
Net profit attributable to RELX PLC and RELX NV shareholders | | | 1,659 | | | | 1,161 | | | | 1,008 | |
Adjustments(post-tax): | | | | | | | | | | | | |
Amortisation of acquired intangible assets | | | 356 | | | | 364 | | | | 311 | |
Acquisition-related costs | | | 43 | | | | 38 | | | | 27 | |
Net financing charge on defined benefit pension schemes | | | 11 | | | | 10 | | | | 16 | |
Disposals and othernon-operating items | | | 5 | | | | 6 | | | | (2 | ) |
Other deferred tax credits from intangible assets* | | | (93 | ) | | | (91 | ) | | | (85 | ) |
Exceptional tax credit | | | (346 | ) | | | – | | | | – | |
Adjusted net profit attributable to RELX PLC and RELX NV shareholders | | | 1,635 | | | | 1,488 | | | | 1,275 | |
* Movements on deferred tax liabilities arising on acquired intangible assets that do not qualify for tax amortisation.
| | |
| 140 | | RELX Group Annual reports and financial statements 2017 |
|
|
Notes to the consolidated financial statements
for the year ended 31 December 2017
12 Statement of cash flows
Accounting policy
Cash and cash equivalents comprise cash balances, call deposits and other short-term highly liquid investments and are held in the statement of financial position at fair value.
| | | | | | | | | | | | | | | | | | | | | | | | |
| RECONCILIATION OF PROFIT BEFORE TAX TO CASH GENERATED FROM OPERATIONS | | | 2017 £m | | | 2016 £m | | | 2015 £m | |
Profit before tax | | | | | | | | | | | | | | | 1,734 | | | | 1,473 | | | | 1,312 | |
Disposals and othernon-operating items | | | | | | | | | | | | | | | (11 | ) | | | 40 | | | | 11 | |
Net finance costs | | | | | | | | | | | | | | | 182 | | | | 195 | | | | 174 | |
Operating profit | | | | | | | | | | | | | | | 1,905 | | | | 1,708 | | | | 1,497 | |
Share of results of joint ventures | | | | | | | | | | | | | | | (37 | ) | | | (37 | ) | | | (64 | ) |
Amortisation of acquired intangible assets | | | | | | | | | | | | | | | 313 | | | | 342 | | | | 292 | |
Amortisation of internally developed intangible assets | | | | | | | | | | | | | | | 203 | | | | 189 | | | | 157 | |
Depreciation of property, plant and equipment | | | | | | | | | | | | | | | 69 | | | | 68 | | | | 71 | |
Share based remuneration | | | | | | | | | | | | | | | 39 | | | | 38 | | | | 34 | |
Totalnon-cash items | | | | | | | | | | | | | | | 624 | | | | 637 | | | | 554 | |
Decrease/(increase) in inventories andpre-publication costs | | | | | | | | | | | | | | | 2 | | | | (24 | ) | | | (17 | ) |
Decrease/(increase) in receivables | | | | | | | | | | | | | | | 35 | | | | (146 | ) | | | (150 | ) |
(Decrease)/increase in payables | | | | | | | | | | | | | | | (84 | ) | | | 98 | | | | 62 | |
Increase in working capital | | | | | | | | | | | | | | | (47 | ) | | | (72 | ) | | | (105 | ) |
Cash generated from operations | | | | | | | | | | | | | | | 2,445 | | | | 2,236 | | | | 1,882 | |
| | | | | | | | | | | | | | | | | | | | | | | | |
| CASH FLOW ON ACQUISITIONS | | | | | | | | Note | | | 2017
£m | | | 2016
£m | | | 2015
£m | |
Purchase of businesses | | | | | | | | | | | 13 | | | | (117 | ) | | | (336 | ) | | | (158 | ) |
Investment in joint ventures | | | | | | | | | | | | | | | (1 | ) | | | (1 | ) | | | (8 | ) |
Deferred payments relating to prior year acquisitions | | | | | | | | | | | | | | | (13 | ) | | | (24 | ) | | | (25 | ) |
Total | | | | | | | | | | | | | | | (131 | ) | | | (361 | ) | | | (191 | ) |
| | | | | | | | | | | | | | | | | | | | | | | | |
RECONCILIATION OF NET BORROWINGS | | Cash and
cash
equivalents
£m | | | Borrowings
£m | | | Related
derivative
financial
instruments
£m | | | 2017
£m | | | 2016
£m | | | 2015
£m | |
At start of year | | | 162 | | | | (4,843 | ) | | | (19 | ) | | | (4,700 | ) | | | (3,782 | ) | | | (3,550 | ) |
| | | | | | | | | | | | | | | | | | | | | | | | |
(Decrease)/increase in cash and cash equivalents | | | (45 | ) | | | – | | | | – | | | | (45 | ) | | | 9 | | | | (139 | ) |
Decrease/(increase) in short-term bank loans, overdrafts and commercial paper | | | – | | | | 152 | | | | (4 | ) | | | 148 | | | | (271 | ) | | | 339 | |
Issuance of term debt | | | – | | | | (873 | ) | | | – | | | | (873 | ) | | | (603 | ) | | | (500 | ) |
Repayment of term debt | | | – | | | | 712 | | | | – | | | | 712 | | | | 474 | | | | 186 | |
Repayment of finance leases | | | – | | | | 5 | | | | – | | | | 5 | | | | 7 | | | | 9 | |
Change in net borrowings resulting from cash flows | | | (45 | ) | | | (4 | ) | | | (4 | ) | | | (53 | ) | | | (384 | ) | | | (105 | ) |
Inception of finance leases | | | – | | | | (2 | ) | | | – | | | | (2 | ) | | | (3 | ) | | | (12 | ) |
Fair value and other adjustments to borrowings and related derivatives | | | – | | | | (73 | ) | | | 64 | | | | (9 | ) | | | (22 | ) | | | 4 | |
Exchange translation differences | | | (6 | ) | | | 36 | | | | 2 | | | | 32 | | | | (509 | ) | | | (119 | ) |
At end of year | | | 111 | | | | (4,886 | ) | | | 43 | | | | (4,732 | ) | | | (4,700 | ) | | | (3,782 | ) |
Net borrowings comprise cash and cash equivalents, loan capital, finance leases, promissory notes, bank and other loans, derivative financial instruments that are used to hedge certain borrowings and adjustments in respect of cash collateral received/paid. The Group monitors net borrowings as part of capital and liquidity management.
| | |
| Financial statements and other information Notes to the consolidated financial statements | | 141 |
|
|
13 Acquisitions
During the year, a number of acquisitions were made. The net assets of the businesses acquired are incorporated at their fair value to the Group. Provisional fair values of the consideration given and of the assets and liabilities acquired are summarised below:
| | | | | | | | | | | | |
| | | Fair value
2017 £m | | | Fair value
2016 £m | | | Fair value
2015 £m | |
Goodwill | | | 77 | | | | 222 | | | | 100 | |
Intangible assets | | | 56 | | | | 189 | | | | 111 | |
Property, plant and equipment | | | – | | | | 1 | | | | – | |
Current assets | | | 3 | | | | 12 | | | | 9 | |
Current liabilities | | | (16 | ) | | | (20 | ) | | | (23 | ) |
Deferred tax | | | (2 | ) | | | (35 | ) | | | (19 | ) |
Net assets acquired | | | 118 | | | | 369 | | | | 178 | |
Consideration (after taking account of £7m (2016: £10m; 2015: £3m) net cash acquired) | | | 118 | | | | 369 | | | | 178 | |
Less: consideration deferred to future years | | | (1 | ) | | | (15 | ) | | | (20 | ) |
Less: acquisition date fair value of equity interest | | | – | | | | (18 | ) | | | – | |
Net cash flow | | | 117 | | | | 336 | | | | 158 | |
Goodwill, being the excess of the consideration over the net tangible and intangible assets acquired, represents benefits which do not qualify for recognition as intangible assets, including: the ability of a business to generate higher returns than individual assets; skilled workforces; and acquisition synergies that are specific to the Group. In addition, goodwill arises on the recognition of deferred tax liabilities in respect of intangible assets for which amortisation does not qualify for tax deductions.
The fair values of the assets and liabilities acquired in the last 12 months are provisional pending the completion of the valuation exercises. Final fair values will be incorporated in the 2018 consolidated financial statements. There were no significant adjustments to the provisional fair values of prior year acquisitions established in 2016.
The businesses acquired in 2017 contributed £12m to revenue, increased adjusted operating profit by £2m, decreased net profit by £6m and contributed nil to net cash inflow from operating activities for the part year under the Group’s ownership and before taking account of acquisition financing costs. Had the businesses been acquired at the beginning of the year, on a pro forma basis the Group revenues, adjusted operating profit and net profit attributable to RELX PLC and RELX NV shareholders for the year would have been £7,368m, £2,288m and £1,662m respectively, before taking account of acquisition financing costs.
14 Equity dividends
| | | | | | | | | | | | |
| ORDINARY DIVIDENDS PAID IN THE YEAR | | 2017
£m | | | 2016
£m | | | 2015
£m | |
RELX PLC | | | 400 | | | | 356 | | | | 295 | |
RELX NV | | | 362 | | | | 327 | | | | 288 | |
Total | | | 762 | | | | 683 | | | | 583 | |
Ordinary dividends declared and paid in the year ended 31 December 2017, in amounts per ordinary share, comprise: a 2016 final dividend of 25.7p (2016: 22.3p; 2015: 19p) and a 2017 interim dividend of 11.7p (2016: 10.25p; 2015: 7.4p), giving a total of 37.4p (2016: 32.55p; 2015: 26.4p) for RELX PLC; and a 2016 final dividend of€0.301 (2016:€0.288; 2015:€0.285) and a 2017 interim dividend of€0.132 (2016:€0.122; 2015:€0.115), giving a total of€0.433 (2016:€0.410; 2015:€0.400) for RELX NV.
The Directors of RELX PLC have proposed a final dividend of 27.7p (2016: 25.7p; 2015: 22.3p), giving a total for the financial year of 39.4p (2016: 35.95p; 2015: 29.7p). The Directors of RELX NV have proposed a final dividend of€0.316 (2016:€0.301; 2015:€0.288), giving a total for the financial year of€0.448 (2016:€0.423; 2015:€0.403). The total cost of funding the proposed final dividends is expected to be £559m, for which no liability has been recognised at the statement of financial position date.
RELX NV dividends per share were adjusted retrospectively in 2015 to reflect the bonus issue declared on 30 June 2015.
Until the end of 2015, dividends paid to RELX PLC and RELX NV shareholders were, other than in special circumstances, equalised at the gross level inclusive of the prevailing UK tax credit received by certain RELX PLC shareholders. With effect from 6 April 2016 the UK government abolished the dividend tax credits previously available to certain RELX PLC shareholders, impacting dividends paid after this date.
The Employee Benefit Trust has currently waived the right to receive dividends on RELX PLC and RELX NV shares. This waiver has been applied to dividends paid in 2017, 2016 and 2015.
| | |
| 142 | | RELX Group Annual reports and financial statements 2017 |
|
|
Notes to the consolidated financial statements
for the year ended 31 December 2017
15 Goodwill
Accounting policy
On the acquisition of a subsidiary or business, the purchase consideration is allocated between the net tangible and intangible assets on a fair value basis, with any excess purchase consideration representing goodwill. Goodwill arising on acquisitions also includes amounts corresponding to deferred tax liabilities recognised in respect of acquired intangible assets.
Goodwill is recognised as an asset and reviewed for impairment when there is an indicator that the asset may be impaired and at least annually. Any impairment is recognised immediately in the income statement and not subsequently reversed.
On disposal of a subsidiary or business, the attributable amount of goodwill is included in the determination of the profit or loss on disposal.
At each statement of financial position date, the carrying amounts of tangible and intangible assets and goodwill are reviewed to determine whether there is any indication that those assets have suffered an impairment loss. If any such indication exists, the recoverable amount, which is the higher of value in use and fair value less costs to sell, of the asset is estimated in order to determine the extent, if any, of the impairment loss. Where the asset does not generate cash flows that are independent from other assets, value in use estimates are made based on the cash flows of the cash generating unit to which the asset belongs. Intangible assets with an indefinite useful life are tested for impairment at least annually and whenever there is any indication that the asset may be impaired.
If the recoverable amount of an asset or cash generating unit is estimated to be less than its net carrying amount, the net carrying amount of the asset or cash generating unit is reduced to its recoverable amount. Impairment losses are recognised immediately in the income statement in administration and other expenses.
Critical judgement and key source of estimation uncertainty
The carrying amounts of goodwill and indefinite lived intangible assets in each business are reviewed for impairment at least annually. The carrying amounts of all other intangible assets are reviewed where there are indications of possible impairment. An impairment review involves a comparison of the carrying value of the asset with estimated values in use based on the latest management cash flow projections, approved by the Boards. Key areas of judgement in estimating the values in use of businesses are the growth in cash flows over a forecast period of up to five years, the long-term growth rate assumed thereafter and the discount rate applied to the forecast cash flows. A description of the key assumptions and sensitivities is provided below.
| | | | | | | | |
| | | 2017
£m | | | 2016
£m | |
At start of year | | | 6,392 | | | | 5,231 | |
Acquisitions | | | 77 | | | | 222 | |
Disposals/reclassified as held for sale | | | (72 | ) | | | (19 | ) |
Transfers | | | 11 | | | | – | |
Exchange translation differences | | | (443 | ) | | | 958 | |
At end of year | | | 5,965 | | | | 6,392 | |
Transfers relate to movements in goodwill as a result of the finalisation of the accounting for prior year acquisitions.
The carrying amount of goodwill is after cumulative amortisation of £1,173m (2016: £1,284m), which was charged prior to the adoption of IFRS, and £9m (2016: £9m) of subsequent impairment charges recorded in prior years.
Impairment review
Impairment testing of goodwill and indefinite lived intangible assets is performed at least annually in accordance with the methodology described above. There were no charges for impairment of goodwill in 2017 (2016: nil; 2015: nil).
Goodwill is compiled and assessed among groups of cash generating units, which represent the lowest level at which goodwill is monitored by management. Typically, acquisitions are integrated into existing business units, and the goodwill arising is allocated to the groups of cash generating units (CGUs) that are expected to benefit from the synergies of the acquisition. As the business areas have become increasingly integrated and globalised, the current CGU allocation reflects the global leverage of assets, skills, knowledge and technology platforms, and the monitoring of goodwill by management.
| | | | | | | | |
| GOODWILL | | 2017
£m | | | 2016
£m | |
Scientific, Technical & Medical | | | 1,479 | | | | 1,549 | |
Risk & Business Analytics | | | 2,595 | | | | 2,829 | |
Legal | | | 1,390 | | | | 1,499 | |
Exhibitions | | | 501 | | | | 515 | |
Total | | | 5,965 | | | | 6,392 | |
| | |
| Financial statements and other information Notes to the consolidated financial statements | | 143 |
|
|
15 Goodwill (continued)
The key assumptions used for each group of cash generating units are disclosed below:
| | | | | | | | | | | | | | | | |
| KEY ASSUMPTIONS | | 2017 | | | 2016 | |
| | | Pre-tax
discount
rate | | | Nominal
long-term
market
growth rate | | | Pre-tax
discount rate | | | Nominal
long-term
market
growth rate | |
Scientific, Technical & Medical | | | 10.1% | | | | 3% | | | | 10.0% | | | | 3% | |
Risk & Business Analytics | | | 12.3% | | | | 3% | | | | 11.7% | | | | 3% | |
Legal | | | 12.7% | | | | 2% | | | | 12.4% | | | | 2% | |
Exhibitions | | | 12.6% | | | | 3% | | | | 12.6% | | | | 3% | |
Thepre-tax discount rates used are based on the Group’s weighted average cost of capital, adjusted to reflect a risk premium specific to each business. Nominal long-term market growth rates, which are applied after the forecast period of up to five years, do not exceed the long-term average growth prospects for the sectors and territories in which the businesses operate.
A sensitivity analysis has been performed based on changes in key assumptions considered to be reasonably possible by management: an increase in the discount rate of 0.5%, a decrease in the compound annual growth rate for cash flow in the five-year forecast period of 2.0%, and a decrease in the nominal long-term market growth rates of 0.5%. The sensitivity analysis shows that no impairment charges would result from these scenarios.
16 Intangible assets
Accounting policy
Intangible assets acquired as part of a business combination are stated in the statement of financial position at their fair value as at the date of acquisition, less accumulated amortisation. Internally generated intangible assets are stated in the statement of financial position at the directly attributable cost of creation of the asset, less accumulated amortisation.
Intangible assets acquired as part of business combinations comprise: market-related assets (e.g. trademarks, imprints, brands); customer-related assets (e.g. subscription bases, customer lists, customer relationships); editorial content; software and systems (e.g. application infrastructure, product delivery platforms,in-process research and development); contract-based assets (e.g. publishing rights, exhibition rights, supply contracts); and other intangible assets. Internally generated intangible assets typically comprise software and systems development where an identifiable asset is created that is probable to generate future economic benefits.
Intangible assets, other than journal titles determined to have indefinite lives, are amortised on a straight-line basis over their estimated useful lives. The estimated useful lives of intangible assets with finite lives are as follows: market and customer-related assets – 3 to 40 years; content, software and other acquired intangible assets – 3 to 20 years; and internally developed intangible assets – 3 to 10 years. Journal titles determined to have indefinite lives are not amortised and are subject to impairment review at least annually, including a review of events and circumstances to ensure that they continue to support an indefinite useful life.
Critical judgements and key sources of estimation uncertainty
On acquisition of a subsidiary or business, the purchase consideration is allocated between the net tangible and intangible assets other than goodwill on a fair value basis, with any excess purchase consideration representing goodwill. The valuation of acquired intangible assets represents the estimated economic value in use, using standard valuation methodologies, including as appropriate, discounted cash flow, relief from royalty and comparable market transactions. Acquired intangible assets are capitalised and amortised systematically over their estimated useful lives, subject to impairment review. The assumptions used are subject to management judgement.
Appropriate amortisation periods are selected based on assessments of the longevity of the brands and imprints, the strength and stability of customer relationships, the market positions of the acquired assets and the technological and competitive risks that they face. Certain intangible assets in relation to acquired science and medical publishing businesses have been determined to have indefinite lives. The longevity of these assets is evidenced by their long-established and well-regarded journal titles, and their characteristically stable market positions. The assumptions used are subject to management judgement.
Development spend embraces investment in new products and other initiatives, ranging from the building of online delivery platforms, to launch costs of new services, to building new infrastructure and applications. Launch costs and other ongoing operating expenses of new products and services are expensed as incurred. The costs of building product applications, platforms and infrastructure are capitalised as intangible assets, where the investment they represent has demonstrable value and the technical and commercial feasibility is assured. Costs eligible for capitalisation must be incremental, clearly identified and directly attributable to a particular project. The resulting assets are amortised over their estimated useful lives. Impairment reviews are carried out at least annually where indicators of impairment are identified. Judgement is required in the assessment of the potential value of a development project, the identification of costs eligible for capitalisation and the selection of appropriate asset lives.
| | |
| 144 | | RELX Group Annual reports and financial statements 2017 |
|
|
Notes to the consolidated financial statements
for the year ended 31 December 2017
16 Intangible assets (continued)
| | | | | | | | | | | | | | | | | | | | |
| | | Market and
customer-
related £m | | | Content,
software
and other
£m | | | Total
acquired
intangible
assets
£m | | | Internally
developed
intangible
assets £m | | | Total £m | |
Cost | | | | | | | | | | | | | | | | | | | | |
At 1 January 2016 | | | 3,158 | | | | 3,133 | | | | 6,291 | | | | 2,053 | | | | 8,344 | |
Acquisitions | | | 103 | | | | 86 | | | | 189 | | | | – | | | | 189 | |
Additions | | | – | | | | – | | | | – | | | | 280 | | | | 280 | |
Disposals/reclassified as held for sale | | | – | | | | – | | | | – | | | | (100 | ) | | | (100 | ) |
Exchange translation differences | | | 611 | | | | 460 | | | | 1,071 | | | | 317 | | | | 1,388 | |
At 1 January 2017 | | | 3,872 | | | | 3,679 | | | | 7,551 | | | | 2,550 | | | | 10,101 | |
Acquisitions | | | 32 | | | | 24 | | | | 56 | | | | – | | | | 56 | |
Additions | | | – | | | | – | | | | – | | | | 304 | | | | 304 | |
Disposals/reclassified as held for sale | | | (26 | ) | | | (76 | ) | | | (102 | ) | | | (42 | ) | | | (144 | ) |
Transfers | | | (50 | ) | | | 27 | | | | (23 | ) | | | – | | | | (23 | ) |
Exchange translation differences | | | (309 | ) | | | (162 | ) | | | (471 | ) | | | (121 | ) | | | (592 | ) |
At 31 December 2017 | | | 3,519 | | | | 3,492 | | | | 7,011 | | | | 2,691 | | | | 9,702 | |
| | | | | | | | | | | | | | | | | | | | |
Accumulated amortisation | | | | | | | | | | | | | | | | | | | | |
At 1 January 2016 | | | 1,402 | | | | 2,611 | | | | 4,013 | | | | 1,175 | | | | 5,188 | |
Charge for the year | | | 204 | | | | 138 | | | | 342 | | | | 189 | | | | 531 | |
Disposals/reclassified as held for sale | | | – | | | | – | | | | – | | | | (96 | ) | | | (96 | ) |
Exchange translation differences | | | 287 | | | | 390 | | | | 677 | | | | 197 | | | | 874 | |
At 1 January 2017 | | | 1,893 | | | | 3,139 | | | | 5,032 | | | | 1,465 | | | | 6,497 | |
Charge for the year | | | 188 | | | | 125 | | | | 313 | | | | 203 | | | | 516 | |
Disposals/reclassified as held for sale | | | (16 | ) | | | (72 | ) | | | (88 | ) | | | (43 | ) | | | (131 | ) |
Exchange translation differences | | | (158 | ) | | | (146 | ) | | | (304 | ) | | | (70 | ) | | | (374 | ) |
At 31 December 2017 | | | 1,907 | | | | 3,046 | | | | 4,953 | | | | 1,555 | | | | 6,508 | |
| | | | | | | | | | | | | | | | | | | | |
Net book amount | | | | | | | | | | | | | | | | | | | | |
At 31 December 2016 | | | 1,979 | | | | 540 | | | | 2,519 | | | | 1,085 | | | | 3,604 | |
At 31 December 2017 | | | 1,612 | | | | 446 | | | | 2,058 | | | | 1,136 | | | | 3,194 | |
Transfers relate to movements in intangible assets as a result of the finalisation of the accounting for prior year acquisitions.
Included in content, software and other acquired intangible assets are assets with a net book value of £120m (2016: £175m) that arose on acquisitions completed prior to the adoption of IFRS that have not been allocated to specific categories of intangible assets. Internally developed intangible assets typically comprise software and systems development where an identifiable asset is created that is expected to generate future economic benefits.
Included in market and customer-related intangible assets are £112m (2016: £123m) of journal titles relating to Scientific, Technical & Medical determined to have indefinite lives based on an assessment of their historical longevity and stable market positions. In 2015, following a review by management, £280m of brands and imprints relating to Scientific, Technical & Medical previously determined to have an indefinite useful life were assigned a useful life of 20 years. Indefinite lived intangibles are tested for impairment at least annually.
| | |
| Financial statements and other information Notes to the consolidated financial statements | | 145 |
|
|
17 Investments
Accounting policy
Investments, other than investments in joint arrangements and associates, are stated in the statement of financial position at fair value. Investments held as part of the venture capital portfolio are classified as held for trading, with changes in fair value reported in disposals and othernon-operating items in the income statement. All other investments are classified as available for sale with changes in fair value recognised directly in equity until the investment is disposed of or is determined to be impaired, at which time the cumulative gain or loss previously recognised in equity is brought into the net profit or loss for the period. All items recognised in the income statement relating to investments, other than investments in joint arrangements and associates, are reported as disposals and othernon-operating items.
Available for sale investments and venture capital investments held for trading represent investments in listed and unlisted securities. The fair value of listed securities is determined based on quoted market prices, and of unlisted securities on management’s estimate of fair value based on standard valuation techniques, including market comparisons and discounts of future cash flows, having regard to maximising the use of observable inputs and adjusting for risk. Advice from valuation experts is used as appropriate.
All joint arrangements are classified as joint ventures because the Group shares joint control and has rights to the net assets of the arrangements. Investments in joint ventures and associates are accounted for under the equity method and stated in the statement of financial position at cost as adjusted for post-acquisition changes in the Group’s share of net assets, less any impairment in value.
| | | | | | | | |
| | | 2017
£m | | | 2016 £m | |
Investments in joint ventures | | | 102 | | | | 102 | |
Available for sale investments | | | 2 | | | | 2 | |
Venture capital investments held for trading | | | 139 | | | | 135 | |
Total | | | 243 | | | | 239 | |
The value of venture capital investments and available for sale investments has been determined by reference to other observable market inputs or, when these are not available, by reference to inputs we believe would reflect the assumptions market participants would use. Gains and losses included in the consolidated income statement are provided in note 9.
An analysis of changes in the carrying value of investments in joint ventures is set out below:
| | | | | | | | |
| | | 2017
£m | | | 2016 £m | |
At start of year | | | 102 | | | | 101 | |
Share of results of joint ventures | | | 37 | | | | 37 | |
Dividends received from joint ventures | | | (38 | ) | | | (44 | ) |
Disposals and transfers | | | – | | | | (7 | ) |
Additions | | | 2 | | | | 1 | |
Exchange translation differences | | | (1 | ) | | | 14 | |
At end of year | | | 102 | | | | 102 | |
| | |
| 146 | | RELX Group Annual reports and financial statements 2017 |
|
|
Notes to the consolidated financial statements
for the year ended 31 December 2017
17 Investments (continued)
Summarised aggregate information in respect of the Group’s share of joint ventures is set out below:
| | | | | | | | |
| | | RELX Group’s share | |
| | | 2017
£m | | | 2016
£m | |
Revenue | | | 101 | | | | 131 | |
Net profit for the year | | | 37 | | | | 37 | |
| | | | | | | | |
Total assets | | | 85 | | | | 92 | |
Total liabilities | | | (42 | ) | | | (49 | ) |
Net assets | | | 43 | | | | 43 | |
Goodwill | | | 59 | | | | 59 | |
Total | | | 102 | | | | 102 | |
The Group’s consolidated other comprehensive income includes no income or losses relating to joint ventures in either period.
18 Property, plant and equipment
Accounting policy
Property, plant and equipment are stated in the statement of financial position at cost less accumulated depreciation. No depreciation is provided on freehold land. Freehold buildings and long leaseholds are depreciated over their estimated useful lives up to a maximum of 50 years. Short leases are written off over the duration of the lease. Depreciation is provided on other assets on a straight-line basis over their estimated useful lives as follows:
– land and buildings: land – not depreciated; leasehold improvements – shorter of life of lease and 10 years;
– fixtures and equipment: plant – 3 to 20 years; office furniture, fixtures and fittings – 5 to 10 years; computer systems, communication networks and equipment – 3 to 7 years.
| | | | | | | | | | | | | | | | | | | | | | | | | | | | |
| | | 2017 | | | | | | 2016 | |
| | | Land and
buildings
£m | | | Fixtures and
equipment
£m | | | Total
£m | | | | | | Land and
buildings
£m | | | Fixtures and
equipment
£m | | | Total
£m | |
Cost | | | | | | | | | | | | | | | | | | | | | | | | | | | | |
At start of year | | | 231 | | | | 687 | | | | 918 | | | | | | | | 205 | | | | 595 | | | | 800 | |
Acquisitions | | | – | | | | – | | | | – | | | | | | | | – | | | | 1 | | | | 1 | |
Capital expenditure | | | 5 | | | | 48 | | | | 53 | | | | | | | | 6 | | | | 48 | | | | 54 | |
Disposals/reclassified as held for sale | | | (3 | ) | | | (40 | ) | | | (43 | ) | | | | | | | (13 | ) | | | (52 | ) | | | (65 | ) |
Exchange translation differences | | | (17 | ) | | | (41 | ) | | | (58 | ) | | | | | | | 33 | | | | 95 | | | | 128 | |
At end of year | | | 216 | | | | 654 | | | | 870 | | | | | | | | 231 | | | | 687 | | | | 918 | |
| | | | | | | | | | | | | | | | | | | | | | | | | | | | |
Accumulated depreciation | | | | | | | | | | | | | | | | | | | | | | | | | | | | |
At start of year | | | 139 | | | | 537 | | | | 676 | | | | | | | | 117 | | | | 454 | | | | 571 | |
Charge for the year | | | 9 | | | | 60 | | | | 69 | | | | | | | | 9 | | | | 59 | | | | 68 | |
Disposals/reclassified as held for sale | | | (1 | ) | | | (39 | ) | | | (40 | ) | | | | | | | (7 | ) | | | (50 | ) | | | (57 | ) |
Exchange translation differences | | | (10 | ) | | | (34 | ) | | | (44 | ) | | | | | | | 20 | | | | 74 | | | | 94 | |
At end of year | | | 137 | | | | 524 | | | | 661 | | | | | | | | 139 | | | | 537 | | | | 676 | |
| | | | | | | | | | | | | | | | | | | | | | | | | | | | |
Net book amount | | | 79 | | | | 130 | | | | 209 | | | | | | | | 92 | | | | 150 | | | | 242 | |
No depreciation is provided on freehold land of £14m (2016: £16m). The net book amount of property, plant and equipment at 31 December 2017 includes £16m (2016: £20m) in respect of assets held under finance leases relating to fixtures and equipment.
| | |
| Financial statements and other information Notes to the consolidated financial statements | | 147 |
|
|
19 Financial instruments
|
Accounting policy Financial instruments comprise investments (other than investments in joint ventures or associates), trade receivables, cash and cash equivalents, payables and accruals, borrowings and derivative financial instruments. Investments (other than investments in joint ventures and associates) are classified as either held for trading or available for sale, as described in note 17. (These investments are typically classified as either Level 2 or 3 in the IFRS 13 fair value hierarchy.) The fair value of such investments is based on standard valuation techniques, including market comparisons and discounts of future cash flows, having regard to maximising the use of observable inputs and adjusting for risk. Trade receivables are carried in the statement of financial position at invoiced value less allowance for estimated irrecoverable amounts. Irrecoverable amounts are estimated based on the ageing of trade receivables, experience and circumstance. Borrowings and payables are recorded initially at fair value and subsequently carried at amortised cost (other than fixed rate borrowings in designated hedging relationships for which the carrying amount of the hedged portion of the borrowings is subsequently adjusted for the gain or loss attributable to the hedged risk). Derivative financial instruments are used to hedge interest rate and foreign exchange risks. Where an effective hedge is in place against changes in the fair value of fixed rate borrowings, the hedged borrowings are adjusted for changes in fair value attributable to the risk being hedged with a corresponding income or expense included in the income statement within finance costs. The offsetting gains or losses from remeasuring the fair value of the related derivatives are also recognised in the income statement within finance costs. When the related derivative expires, is sold or terminated, or no longer qualifies for hedge accounting, the cumulative change in fair value of the hedged borrowing is amortised in the income statement over the period to maturity of the borrowing using the effective interest method. Changes in the fair value of derivative financial instruments that are designated and effective as hedges of future cash flows are recognised (net of tax) in other comprehensive income and accumulated in the hedge reserve. If a hedged firm commitment or forecasted transaction results in the recognition of anon-financial asset or liability, then, at the time that the asset or liability is recognised, the associated gains or losses on the derivative that had previously been recognised in other comprehensive income are included in the initial measurement of the asset or liability. For hedges that do not result in the recognition of an asset or a liability, amounts deferred in the hedge reserve are recognised in the income statement in the same period in which the hedged item affects net profit or loss. Any ineffective portion of hedges is recognised immediately in the income statement. Cash flow hedge accounting is discontinued when a hedging instrument expires or is sold, terminated or exercised, or no longer qualifies for hedge accounting. At that time, any cumulative gain or loss on the hedging instrument recognised in other comprehensive income is either retained in the hedge reserve until the firm commitment or forecasted transaction occurs, or, where a hedged transaction is no longer expected to occur, is immediately credited or expensed in the income statement. Derivative financial instruments that are not designated as hedging instruments are classified as held for trading and recorded in the statement of financial position at fair value, with changes in fair value recognised in the income statement. The fair values of interest rate swaps, interest rate options, forward rate agreements and forward foreign exchange contracts represent the replacement costs calculated using observable market rates of interest and exchange. The fair value of long-term borrowings is calculated by discounting expected future cash flows at observable market rates. (These instruments are accordingly classified as Level 2 in the IFRS 13 fair value hierarchy). |
The main financial risks faced by the Group are liquidity risk, market risk – comprising interest rate risk and foreign exchange risk – and credit risk. Financial instruments are used to finance the Group’s businesses and to manage interest rate and foreign exchange risks. The Group’s businesses do not enter into speculative derivative transactions. Details of financial instruments subject to liquidity, market and credit risks are described below.
Liquidity risk
The Group maintains a range of borrowing facilities and debt programmes to fund its requirements at competitive rates.
The balance of long-term debt, short-term debt and committed bank facilities is managed to provide security of funding, taking into account the cash generation cycle of the business and the uncertain size and timing of acquisition spend. To accommodate the significant free cash flow generated by the Group and to capitalise on an inexpensive source of funding, a meaningful portion of the overall debt portfolio is typically kept short-term as long as there exists acceptable liquidity in the commercial paper markets and sufficient capacity under committed credit lines. The Group’s treasury policies ensure adequate liquidity by requiring that (a) no more than $1.5bn of term debt matures in any12-month period, (b) the sum of term debt maturing over the ensuing 12 months plus short-term borrowings is less than the sum of available cash plus committed facilities and (c) minimum levels of borrowing with maturities over three and five years are maintained.
The treasury policies ensure debt efficiency by (a) targeting certain levels of short-term borrowings across a given year, (b) maintaining a weighted average maturity of the gross debt portfolio of approximately five years and (c) minimising surplus cash balances. From time to time, based on cash flow and market conditions, the Group may redeem term debt early or repurchase outstanding debt in the open market.
| | |
| 148 | | RELX Group Annual reports and financial statements 2017 |
|
|
Notes to the consolidated financial statements
for the year ended 31 December 2017
19 Financial instruments (continued)
Debt is issued to meet the funding requirements of various jurisdictions and in the currencies that are needed. It is recognised that debt can act as a natural translation hedge of earnings, net assets and net cash flow in currencies other than the reporting currency. For this reason, the majority of the Group’s net debt is denominated in US dollars and euros, reflecting the Group’s largest geographical markets.
There were no changes to the Group’s long-term approach to capital and liquidity management during the year.
The remaining contractual maturities for borrowings and derivative financial instruments are shown in the table below. The table shows undiscounted principal and interest cash flows and includes contractual gross cash flows to be exchanged as part of cross-currency interest rate swaps and forward foreign exchange contracts where there is a legal right ofset-off.
| | | | | | | | | | | | | | | | | | | | | | | | | | | | | | | | |
| AT 31 DECEMBER 2017 | | | | | Contractual cash flow | |
| | | Carrying | | | Within | | | | | | | | | | | | | | | More than | | | | |
| | | amount | | | 1 year | | | 1-2 years | | | 2-3 years | | | 3-4 years | | | 4-5 years | | | 5 years | | | Total | |
| | | £m | | | £m | | | £m | | | £m | | | £m | | | £m | | | £m | | | £m | |
Borrowings | | | | | | | | | | | | | | | | | | | | | | | | | | | | | | | | |
Fixed rate borrowings | | | (4,417 | ) | | | (336 | ) | | | (706 | ) | | | (577 | ) | | | (518 | ) | | | (805 | ) | | | (2,198 | ) | | | (5,140 | ) |
Floating rate borrowings | | | (469 | ) | | | (464 | ) | | | – | | | | – | | | | – | | | | – | | | | (5 | ) | | | (469 | ) |
| | | | | | | | |
Derivative financial liabilities | | | | | | | | | | | | | | | | | | | | | | | | | | | | | | | | |
Interest rate derivatives | | | (13 | ) | | | (1 | ) | | | (1 | ) | | | (2 | ) | | | (2 | ) | | | (4 | ) | | | (8 | ) | | | (18 | ) |
Cross-currency interest rate swaps | | | (2 | ) | | | (258 | ) | | | (17 | ) | | | (18 | ) | | | (18 | ) | | | (18 | ) | | | (541 | ) | | | (870 | ) |
Forward foreign exchange contracts | | | (42 | ) | | | (2,148 | ) | | | (418 | ) | | | (188 | ) | | | (41 | ) | | | – | | | | – | | | | (2,795 | ) |
| | | | | | | | |
Derivative financial assets | | | | | | | | | | | | | | | | | | | | | | | | | | | | | | | | |
Interest rate derivatives | | | 20 | | | | 13 | | | | 11 | | | | 10 | | | | 1 | | | | – | | | | – | | | | 35 | |
Cross-currency interest rate swaps | | | 42 | | | | 246 | | | | 7 | | | | 7 | | | | 7 | | | | 7 | | | | 554 | | | | 828 | |
Forward foreign exchange contracts | | | 53 | | | | 2,139 | | | | 422 | | | | 193 | | | | 42 | | | | – | | | | – | | | | 2,796 | |
Total | | | (4,828 | ) | | | (809 | ) | | | (702 | ) | | | (575 | ) | | | (529 | ) | | | (820 | ) | | | (2,198 | ) | | | (5,633 | ) |
| | | | | | | | | | | | | | | | | | | | | | | | | | | | | | | | |
| AT 31 DECEMBER 2016 | | | | | Contractual cash flow | |
| | | Carrying | | | Within | | | | | | | | | | | | | | | More than | | | | |
| | | amount | | | 1 year | | | 1-2 years | | | 2-3 years | | | 3-4 years | | | 4-5 years | | | 5 years | | | Total | |
| | | £m | | | £m | | | £m | | | £m | | | £m | | | £m | | | £m | | | £m | |
Borrowings | | | | | | | | | | | | | | | | | | | | | | | | | | | | | | | | |
Fixed rate borrowings | | | (3,937 | ) | | | (479 | ) | | | (345 | ) | | | (733 | ) | | | (555 | ) | | | (72 | ) | | | (2,617 | ) | | | (4,801 | ) |
Floating rate borrowings | | | (906 | ) | | | (822 | ) | | | (2 | ) | | | (82 | ) | | | – | | | | – | | | | (4 | ) | | | (910 | ) |
| | | | | | | | |
Derivative financial liabilities | | | | | | | | | | | | | | | | | | | | | | | | | | | | | | | | |
Interest rate derivatives | | | (14 | ) | | | – | | | | – | | | | (1 | ) | | | (2 | ) | | | (2 | ) | | | (12 | ) | | | (17 | ) |
Cross-currency interest rate swaps | | | (37 | ) | | | (21 | ) | | | (252 | ) | | | (18 | ) | | | (20 | ) | | | (20 | ) | | | (618 | ) | | | (949 | ) |
Forward foreign exchange contracts | | | (144 | ) | | | (1,675 | ) | | | (512 | ) | | | (215 | ) | | | (51 | ) | | | – | | | | – | | | | (2,453 | ) |
| | | | | | | | |
Derivative financial assets | | | | | | | | | | | | | | | | | | | | | | | | | | | | | | | | |
Interest rate derivatives | | | 35 | | | | 17 | | | | 8 | | | | 8 | | | | 9 | | | | – | | | | – | | | | 42 | |
Cross-currency interest rate swaps | | | 13 | | | | 9 | | | | 234 | | | | 7 | | | | 7 | | | | 7 | | | | 539 | | | | 803 | |
Forward foreign exchange contracts | | | 21 | | | | 1,598 | | | | 467 | | | | 205 | | | | 51 | | | | – | | | | – | | | | 2,321 | |
Total | | | (4,969 | ) | | | (1,373 | ) | | | (402 | ) | | | (829 | ) | | | (561 | ) | | | (87 | ) | | | (2,712 | ) | | | (5,964 | ) |
The carrying amount of derivative financial liabilities comprises £15m (2016: £16m) in relation to fair value hedges, £30m (2016: £153m) in relation to cash flow hedges and £12m (2016: £30m) not designated as hedging instruments. The carrying amount of derivative financial assets comprises £20m (2016: £32m) in relation to fair value hedges, £81m (2016: £22m) in relation to cash flow hedges and £14m (2016: £15m) not designated as hedging instruments, less nil of cash collateral received from swap counterparties which has been offset against the related derivative financial assets (2016: £4m of cash collateral paid to swap counterparties which has been offset against the related derivative liabilities) (see ‘Credit risk’ below). The expected cash flows in respect of the cash collateral have been included in the tables above together with the cash flows for the related cross-currency interest rate swaps.
| | |
| Financial statements and other information Notes to the consolidated financial statements | | 149 |
|
|
19 Financial instruments (continued)
At 31 December 2017, the Group had access to a $2,000m committed bank facility maturing in July 2020, which was undrawn. This facility backs up short-term borrowings. All borrowings that mature within the next two years can be covered by the facility and by utilising available cash resources.
The committed bank facility is subject to financial covenants typical to the Group’s size and financial strength. The Group had significant headroom within these covenants for the year ended 31 December 2017. There are no financial covenants in any outstanding public bonds.
Market risk
The Group’s primary market risks are to interest rate fluctuations and exchange rate movements. Derivatives are used to manage the risks associated with interest rate and exchange rate movements and the Group does not enter into speculative derivatives. Derivatives used by the Group for hedging a particular risk are not specialised and are generally available from numerous sources. The impact of market risks on net post-employment benefit obligations and taxation is excluded from the following market risk sensitivity analysis.
Interest rate exposure management
The Group’s interest rate exposure management policy aims to minimise interest costs with an acceptable level of year on year volatility. To achieve this, the Group uses fixed rate term debt, interest rate swaps, forward rate agreements and interest rate options. Interest rate derivatives are used only to hedge an underlying risk and no net market positions are held.
At 31 December 2017, 44% of gross borrowings were either fixed rate or had been fixed through the use of interest rate swaps, forward rate agreements and options. A 100 basis point reduction in interest rates would result in an estimated decrease in net finance costs of £26m (2016: £25m), based on the composition of financial instruments including cash, cash equivalents, bank loans and commercial paper borrowings at 31 December 2017. A 100 basis point rise in interest rates would result in an estimated increase in net finance costs of £26m (2016: £25m).
The impact on net equity of a theoretical change in interest rates as at 31 December 2017 is restricted to the change in carrying value of floating rate to fixed rate interest rate derivatives in a designated cash flow hedge relationship and undesignated interest rate derivatives. A 100 basis point reduction in interest rates would result in an estimated increase in net equity of £2m (2016: £2m) and a 100 basis point increase in interest rates would reduce net equity by an estimated £2m (2016: £2m). The impact of a change in interest rates on the carrying value of fixed rate borrowings in a designated fair value hedge relationship would be offset by the change in carrying value of the related interest rate derivative. Fixed rate borrowings not in a designated hedging relationship are carried at amortised cost.
Foreign currency exposure management
Translation exposures arise on the earnings and net assets of individual businesses whose operational currencies are other than sterling. Some of these exposures are offset by denominating borrowings in US dollars, euros and other currencies. Currency exposures on transactions denominated in a foreign currency are generally hedged using forward contracts. In addition, recurring transactions and future investment exposures may be hedged, in advance of becoming contractual. The precise policy differs according to the specific circumstances of the individual businesses. Highly predictable future cash flows may be covered for transactions expected to occur during the next 24 months (50 months for the Scientific, Technical & Medical subscription businesses) within limits defined according to the period before the transaction is expected to become contractual. Cover takes the form of foreign exchange forward contracts.
As at 31 December 2017, the amount of outstanding foreign exchange cover against future transactions was £1.3bn (2016: £1.5bn).
A theoretical weakening of all currencies by 10% against sterling at 31 December 2017 would decrease the carrying value of net assets, excluding net borrowings, by £630m (2016: £658m). This would be offset to a degree by a decrease in net borrowings of £448m (2016: £389m). A strengthening of all currencies by 10% against sterling at 31 December 2017 would increase the carrying value of net assets, excluding net borrowings, by £630m (2016: £658m) and increase net borrowings by £448m (2016: £389m).
A retranslation of the Group’s net profit for the year, assuming a 10% weakening of all foreign currencies against sterling but excluding transactional exposures, would reduce net profit by £148m (2016: £105m). A 10% strengthening of all foreign currencies against sterling on this basis would increase net profit for the year by £148m (2016: £105m).
| | |
| 150 | | RELX Group Annual reports and financial statements 2017 |
|
|
Notes to the consolidated financial statements
for the year ended 31 December 2017
19 Financial instruments (continued)
Credit risk
The Group seeks to manage interest rate risk and limit foreign exchange risks described above by the use of financial instruments and as a result has a credit risk from the potentialnon-performance by the counterparties to these financial instruments, which are unsecured. The amount of this credit risk is normally restricted to the amounts of any hedge gain and not the principal amount being hedged. The Group also has a credit exposure to counterparties for the full principal amount of cash and cash equivalents. Credit risks are controlled by monitoring the credit quality of these counterparties, principally licensed commercial banks and investment banks with strong long-term credit ratings, and the amounts outstanding with each of them.
In certain situations, the Group enters into credit support arrangements with derivative counterparties to mitigate the credit exposures arising from hedge gains on the related financial instruments. Under these arrangements, the Group receives (or pays) cash collateral equal to the mark to market valuation of the related derivative asset (or liability) on monthly settlement dates. At 31 December 2017, nil cash collateral had been received, resulting in no payable balance to be offset against the related derivative assets of £2m in the statement of financial position (2016: £4m of cash collateral paid and the resulting receivable balance offset against the related derivative liabilities of £5m).
The Group has treasury policies in place which do not allow concentrations of risk with individual counterparties and do not allow significant treasury exposures with counterparties which are rated lower thanA-/A3 by Standard & Poor’s, Moody’s and Fitch. At 31 December 2017, cash and cash equivalents totalled £111m (2016: £162m), of which 90% (2016: 94%) was held with banks ratedA-/A3 or better.
The Group also has credit risk with respect to trade receivables due from its customers, which include national and state governments, academic institutions and large and small enterprises including law firms, book stores and wholesalers. The concentration of credit risk from trade receivables is limited due to the large and broad customer base. Trade receivable exposures are managed locally in the business units where they arise. Where appropriate, business units seek to minimise this exposure by taking payment in advance and through management of credit terms. Allowance is made for bad and doubtful debts based on management’s assessment of the risk taking into account the ageing profile, experience and circumstance. The maximum exposure to credit risk is represented by the carrying amount of each financial asset, including derivative financial instruments, recorded in the statement of financial position.
Included within trade receivables are the following amounts which are past due but for which no allowance has been made: past due up to one month £220m (2016: £187m); past due two to three months £97m (2016: £96m); past due four to six months £44m (2016: £45m); and past due greater than six months £40m (2016: £31m). Examples of trade receivables which are past due but for which no allowance has been made include those receivables where there is no concern over the creditworthiness of the customer and where the history of dealings with the customer indicate the amount will be settled.
Hedge accounting
The hedging relationships that are designated under IAS 39 – Financial Instruments are described below.
Fair value hedges
The Group has entered into interest rate swaps and cross-currency interest rate swaps to hedge the exposure to changes in the fair value of fixed rate borrowings due to interest rate and foreign currency movements which could affect the income statement. Interest rate derivatives (including cross-currency interest rate swaps) with a principal amount of £2,021m (2016: £1,403m) were in place at 31 December 2017 swapping fixed rate term debt issues denominated in US dollars (USD) and euros to floating rate USD and euro debt respectively for the whole or part of their term.
| | |
| Financial statements and other information Notes to the consolidated financial statements | | 151 |
|
|
19 Financial instruments (continued)
The gains and losses on the borrowings and related derivatives designated as fair value hedges, which are included in the income statement, for the three years ended 31 December 2017, 2016 and 2015 were as follows:
| | | | | | | | | | | | | | | | | | | | |
| GAINS/(LOSSES) ON BORROWINGS AND RELATED DERIVATIVES | | | | | Fair value | | | | | | | | | 31 | |
| | | 1 January | | | movement | | | De- | | | Exchange | | | December | |
| | | 2017 | | | gain/(loss) | | | designated | | | gain/(loss) | | | 2017 | |
| | | £m | | | £m | | | £m | | | £m | | | £m | |
USD debt | | | 16 | | | | (1 | ) | | | (2 | ) | | | (1 | ) | | | 12 | |
Related interest rate swaps | | | (16 | ) | | | 1 | | | | 2 | | | | 1 | | | | (12 | ) |
| | | | – | | | | – | | | | – | | | | – | | | | – | |
EUR debt | | | (33 | ) | | | 17 | | | | – | | | | (1 | ) | | | (17 | ) |
Related interest rate swaps | | | 32 | | | | (16 | ) | | | – | | | | 1 | | | | 17 | |
| | | | (1 | ) | | | 1 | | | | – | | | | – | | | | – | |
Total relating to USD and EUR debt | | | (17 | ) | | | 16 | | | | (2 | ) | | | (2 | ) | | | (5 | ) |
Total related interest rate swaps | | | 16 | | | | (15 | ) | | | 2 | | | | 2 | | | | 5 | |
Net (loss)/gain | | | (1 | ) | | | 1 | | | | – | | | | – | | | | – | |
| | | | | | | | | | | | | | | | | | | | |
| GAINS/(LOSSES) ON BORROWINGS AND RELATED DERIVATIVES | | | | | Fair value | | | | | | | | | 31 | |
| | | 1 January | | | movement | | | De- | | | Exchange | | | December | |
| | | 2016 | | | gain/(loss) | | | designated | | | gain/(loss) | | | 2016 | |
| | | £m | | | £m | | | £m | | | £m | | | £m | |
USD debt | | | 2 | | | | 13 | | | | – | | | | 1 | | | | 16 | |
Related interest rate swaps | | | (2 | ) | | | (13 | ) | | | – | | | | (1 | ) | | | (16 | ) |
| | | | – | | | | – | | | | – | | | | – | | | | – | |
GBP debt | | | (14 | ) | | | – | | | | 14 | | | | – | | | | – | |
Related interest rate swaps | | | 14 | | | | – | | | | (14 | ) | | | – | | | | – | |
| | | | – | | | | – | | | | – | | | | – | | | | – | |
EUR debt | | | (9 | ) | | | (21 | ) | | | – | | | | (3 | ) | | | (33 | ) |
Related interest rate swaps | | | 8 | | | | 21 | | | | – | | | | 3 | | | | 32 | |
| | | | (1 | ) | | | – | | | | – | | | | – | | | | (1 | ) |
Total relating to USD, GBP and EUR debt | | | (21 | ) | | | (8 | ) | | | 14 | | | | (2 | ) | | | (17 | ) |
Total related interest rate swaps | | | 20 | | | | 8 | | | | (14 | ) | | | 2 | | | | 16 | |
Net loss | | | (1 | ) | | | – | | | | – | | | | – | | | | (1 | ) |
| | | | | | | | | | | | | | | | | | | | |
| GAINS/(LOSSES) ON BORROWINGS AND RELATED DERIVATIVES | | | | | | | | Fair value | | | | | | 31 | |
| | | | | | 1 January | | | movement | | | Exchange | | | December | |
| | | | | | 2015 | | | gain/(loss) | | | gain/(loss) | | | 2015 | |
| | | | | | £m | | | £m | | | £m | | | £m | |
USD debt | | | | | | | 3 | | | | (2 | ) | | | 1 | | | | 2 | |
Related interest rate swaps | | | | | | | (3 | ) | | | 2 | | | | (1 | ) | | | (2 | ) |
| | | | | | | | – | | | | – | | | | – | | | | – | |
GBP debt | | | | | | | (20 | ) | | | 6 | | | | – | | | | (14 | ) |
Related interest rate swaps | | | | | | | 20 | | | | (6 | ) | | | – | | | | 14 | |
| | | | | | | | – | | | | – | | | | – | | | | – | |
EUR debt | | | | | | | (26 | ) | | | 15 | | | | 2 | | | | (9 | ) |
Related interest rate swaps | | | | | | | 26 | | | | (16 | ) | | | (2 | ) | | | 8 | |
| | | | | | | | – | | | | (1 | ) | | | – | | | | (1 | ) |
Total relating to USD, GBP and EUR debt | | | | | | | (43 | ) | | | 19 | | | | 3 | | | | (21 | ) |
Total related interest rate swaps | | | | | | | 43 | | | | (20 | ) | | | (3 | ) | | | 20 | |
Net loss | | | | | | | – | | | | (1 | ) | | | – | | | | (1 | ) |
All fair value hedges were highly effective throughout the three years ended 31 December 2017.
| | |
| 152 | | RELX Group Annual reports and financial statements 2017 |
|
|
Notes to the consolidated financial statements
for the year ended 31 December 2017
19 Financial instruments (continued)
Gross borrowings as at 31 December 2017 included £24m (2016: £30m) in relation to fair value adjustments to borrowings previously designated in a fair value hedge relationship which werede-designated in 2008. The related derivatives were closed out onde-designation with a cash inflow of £62m. £3m (2016: £3m) of these fair value adjustments were amortised in the year as a reduction to finance costs.
Gross borrowings were also reduced by £2m (2016: increased by £6m) in relation to fair value adjustments to borrowings previously designated in a fair value hedging relationship which werede-designated during the year or prior year. £6m (2016: £8m) of these fair value adjustments were amortised in the year as a reduction to finance costs. The related derivatives remained on the balance sheet at 31 December 2017 with a carrying value of £2m (2016: £8m).
Cash flow hedges
The Group enters into two types of cash flow hedge:
| 1 | Debt hedges comprising interest rate derivatives which fix the interest expense on a portion of forecast floating rate debt (including commercial paper, short-term bank loans and floating rate term debt), and cross-currency interest rate derivatives which hedge the cash flow exposure arising from foreign currency denominated debt. |
| 2 | Revenue hedges comprising forward foreign exchange contracts which fix the exchange rate on a portion of future foreign currency subscription revenues forecast by the businesses for up to 50 months. |
Movements in the hedge reserve in 2016 and 2017, including gains and losses on cash flow hedging instruments, were as follows:
| | | | | | | | | | | | |
| | | | | | | | | Total hedge | |
| | | Debt | | | Revenue | | | reserve | |
| | | hedges | | | hedges | | | pre-tax | |
| | | £m | | | £m | | | £m | |
Hedge reserve at 1 January 2016: gains/(losses) deferred | | | 6 | | | | (44 | ) | | | (38 | ) |
Losses arising in 2016 | | | (26 | ) | | | (139 | ) | | | (165 | ) |
Amounts recognised in income statement | | | 27 | | | | 19 | | | | 46 | |
Exchange translation differences | | | 1 | | | | (5 | ) | | | (4 | ) |
Hedge reserve at 1 January 2017: gains/(losses) deferred | | | 8 | | | | (169 | ) | | | (161 | ) |
Gains arising in 2017 | | | 63 | | | | 74 | | | | 137 | |
Amounts recognised in income statement | | | (65 | ) | | | 90 | | | | 25 | |
Exchange translation differences | | | (1 | ) | | | (2 | ) | | | (3 | ) |
Hedge reserve at 31 December 2017: gains/(losses) deferred | | | 5 | | | | (7 | ) | | | (2 | ) |
All cash flow hedges were highly effective throughout the two years ended 31 December 2017.
A deferred tax charge of £1m (2016: credit of £28m; 2015: credit of £8m) in respect of the above gains and losses at 31 December 2017 was also deferred in the hedge reserve.
Of the amounts recognised in the income statement in the year, losses of £90m (2016: losses of £19m; 2015: gains of £19m) were recognised in revenue, and gains of £65m (2016: losses of £27m; 2015: losses of £48m) were recognised in finance costs. A tax credit of
£1m (2016: £12m; 2015: £1m) was recognised in relation to these items.
The deferred gains and losses on cash flow hedges at 31 December 2017 are currently expected to be recognised in the income statement in future years as follows:
| | | | | | | | | | | | |
| | | | | | | | | Total hedge | |
| | | Debt | | | Revenue | | | reserve | |
| | | hedges | | | hedges | | | pre-tax | |
| | | £m | | | £m | | | £m | |
2018 | | | 3 | | | | (18 | ) | | | (15 | ) |
2019 | | | (1 | ) | | | – | | | | (1 | ) |
2020 | | | (2 | ) | | | 10 | | | | 8 | |
2021 | | | (2 | ) | | | 1 | | | | (1 | ) |
2022 and beyond | | | 7 | | | | – | | | | 7 | |
Gains/(losses) deferred in hedge reserve at end of year | | | 5 | | | | (7 | ) | | | (2 | ) |
The cash flows for these hedges are expected to occur in line with the recognition of the gains and losses in the income statement, other than in respect of certain forward foreign exchange hedges on subscriptions, where cash flows may be expected to occur in advance of the subscription year.
| | |
| Financial statements and other information Notes to the consolidated financial statements | | 153 |
|
|
20 Inventories andpre-publication costs
|
Accounting policy Inventories andpre-publication costs are stated at the lower of cost, including appropriate attributable overhead, and estimated net realisable value. Such costs typically comprise direct internal labour costs and externally commissioned editorial and other fees. Pre-publication costs, representing costs incurred in the origination of content prior to publication, are expensed systematically reflecting the expected sales profile over the estimated economic lives of the related products, generally up to five years. Annual reviews are carried out to assess the recoverability of carrying amounts. |
| | | | | | | | |
| | | 2017
£m | | | 2016 £m | |
Raw materials | | | 2 | | | | 2 | |
Pre-publication costs | | | 157 | | | | 152 | |
Finished goods | | | 38 | | | | 55 | |
Total | | | 197 | | | | 209 | |
21 Trade and other receivables
| | | | | | | | |
| | | 2017
£m | | | 2016
£m | |
Trade receivables | | | 1,682 | | | | 1,782 | |
Allowance for doubtful debts | | | (79 | ) | | | (56 | ) |
| | | | 1,603 | | | | 1,726 | |
Prepayments and accrued income | | | 219 | | | | 230 | |
Total | | | 1,822 | | | | 1,956 | |
Trade receivables are predominantlynon-interest bearing and their carrying amounts approximate to their fair value.
Trade receivables are stated net of a provision for allowances for doubtful debts. The movements in the provision during the year were as follows:
| | | | | | | | |
| | | 2017
£m | | | 2016
£m | |
At start of year | | | 56 | | | | 51 | |
Charge for the year | | | 39 | | | | 4 | |
Trade receivables written off | | | (15 | ) | | | (6 | ) |
Exchange translation differences | | | (1 | ) | | | 7 | |
At end of year | | | 79 | | | | 56 | |
22 Trade and other payables
| | | | | | | | |
| | | 2017
£m | | | 2016
£m | |
Trade payables | | | 240 | | | | 297 | |
Accruals | | | 670 | | | | 650 | |
Social security and other taxes | | | 114 | | | | 114 | |
Other payables | | | 379 | | | | 423 | |
Deferred income | | | 1,834 | | | | 1,941 | |
Total | | | 3,237 | | | | 3,425 | |
Trade and other payables are predominantlynon-interest bearing and their carrying amounts approximate to their fair value.
| | |
| 154 | | RELX Group Annual reports and financial statements 2017 |
|
|
Notes to the consolidated financial statements
for the year ended 31 December 2017
23 Borrowings
|
Accounting policy Borrowings are recorded initially at fair value and subsequently carried at amortised cost, other than fixed rate borrowings in designated hedging relationships for which the carrying amount of the hedged portion of the borrowings is subsequently adjusted for the gain or loss attributable to the hedged risk. When the related derivative in such a hedging relationship expires, is sold or terminated, or no longer qualifies for hedge accounting, the cumulative change in fair value of the hedged borrowing is amortised in the income statement over the period to maturity of the borrowing using the effective interest method. |
| | | | | | | | | | | | | | | | | | | | |
| | | 2017 | | | | 2016 | |
| | | Falling due
within 1 year £m | | Falling due
in more than
1 year £m | | Total £m | | | | Falling due
within
1 year £m | | | Falling due in
more than
1 year £m | | | Total
£m | |
Financial liabilities measured at amortised cost: | | | | | | | | | | | | | | | | | | | | |
Short-term bank loans, overdrafts and commercial paper | | 464 | | – | | 464 | | | | | 521 | | | | – | | | | 521 | |
Term debt | | 209 | | 1,696 | | 1,905 | | | | | 299 | | | | 2,021 | | | | 2,320 | |
Finance leases | | 5 | | 5 | | 10 | | | | | 5 | | | | 9 | | | | 14 | |
Term debt in fair value hedging relationships | | – | | 2,069 | | 2,069 | | | | | – | | | | 1,399 | | | | 1,399 | |
Term debt previously in fair value hedging relationships | | – | | 438 | | 438 | | | | | 334 | | | | 255 | | | | 589 | |
Total | | 678 | | 4,208 | | 4,886 | | | | | 1,159 | | | | 3,684 | | | | 4,843 | |
The total fair value of financial liabilities measured at amortised cost is £2,532m (2016: £3,071m). The total fair value of term debt in fair value hedging relationships is £2,148m (2016: £1,517m). The total fair value of term debt previously in fair value hedging relationships is £501m (2016: £660m).
RELX PLC and RELX NV have given joint and several guarantees of certain long-term and short-term borrowings issued by subsidiaries of RELX Group plc. Included within term debt above are debt securities issued by RELX Capital Inc., a 100% indirectly-owned finance subsidiary of RELX PLC and RELX NV, which have been registered with the US Securities and Exchange Commission. RELX PLC and RELX NV have fully and unconditionally guaranteed these securities, which are not guaranteed by any other subsidiary of RELX PLC and RELX NV.
Analysis by year of repayment
| | | | | | | | | | | | | | | | | | | | | | | | | | | | | | | | | | |
| | | 2017 | | | | | 2016 | |
| | | Short-term | | | | | | | | | | | | | | Short-term | | | | | | | | | | |
| | | bank loans, | | | | | | | | | | | | | | bank loans, | | | | | | | | | | |
| | | overdrafts | | | | | | | | | | | | | | overdrafts | | | | | | | | | | |
| | | and | | | | | | | | | | | | | | and | | | | | | | | | | |
| | | commercial | | | | | | Finance | | | | | | | | commercial | | | | | | Finance | | | | |
| | | paper | | | Term debt | | | leases | | | Total | | | | | paper | | | Term debt | | | leases | | | Total | |
| | | £m | | | £m | | | £m | | | £m | | | | | £m | | | £m | | | £m | | | £m | |
Within 1 year | | | 464 | | | | 209 | | | | 5 | | | | 678 | | | | | | 521 | | | | 633 | | | | 5 | | | | 1,159 | |
Within 1 to 2 years | | | – | | | | 593 | | | | 3 | | | | 596 | | | | | | – | | | | 219 | | | | 4 | | | | 223 | |
Within 2 to 3 years | | | – | | | | 508 | | | | 2 | | | | 510 | | | | | | – | | | | 700 | | | | 3 | | | | 703 | |
Within 3 to 4 years | | | – | | | | 444 | | | | – | | | | 444 | | | | | | – | | | | 496 | | | | 2 | | | | 498 | |
Within 4 to 5 years | | | – | | | | 644 | | | | – | | | | 644 | | | | | | – | | | | – | | | | – | | | | – | |
After 5 years | | | – | | | | 2,014 | | | | – | | | | 2,014 | | | | | | – | | | | 2,260 | | | | – | | | | 2,260 | |
After 1 year | | | – | | | | 4,203 | | | | 5 | | | | 4,208 | | | | | | – | | | | 3,675 | | | | 9 | | | | 3,684 | |
Total | | | 464 | | | | 4,412 | | | | 10 | | | | 4,886 | | | | | | 521 | | | | 4,308 | | | | 14 | | | | 4,843 | |
Short-term bank loans, overdrafts and commercial paper were backed up at 31 December 2017 by a $2,000m (£1,479m) committed bank facility maturing in July 2020, which was undrawn.
| | |
| Financial statements and other information Notes to the consolidated financial statements | | 155 |
|
|
23 Borrowings (continued)
Analysis by currency
| | | | | | | | | | | | | | | | | | | | | | | | | | | | | | | | | | |
| | | 2017 | | | | | 2016 | |
| | | Short-term | | | | | | | | | | | | | | Short-term | | | | | | | | | | |
| | | bank loans, | | | | | | | | | | | | | | bank loans, | | | | | | | | | | |
| | | overdrafts | | | | | | | | | | | | | | overdrafts | | | | | | | | | | |
| | | and | | | | | | | | | | | | | | and | | | | | | | | | | |
| | | commercial | | | | | | Finance | | | | | | | | commercial | | | | | | Finance | | | | |
| | | paper | | | Term debt | | | leases | | | Total | | | | | paper | | | Term debt | | | leases | | | Total | |
| | | £m | | | £m | | | £m | | | £m | | | | | £m | | | £m | | | £m | | | £m | |
US dollars | | | 103 | | | | 2,058 | | | | 10 | | | | 2,171 | | | | | | 13 | | | | 2,274 | | | | 14 | | | | 2,301 | |
£ sterling | | | 262 | | | | 299 | | | | – | | | | 561 | | | | | | 189 | | | | 604 | | | | – | | | | 793 | |
Euro | | | 76 | | | | 2,055 | | | | – | | | | 2,131 | | | | | | 240 | | | | 1,430 | | | | – | | | | 1,670 | |
Other currencies | | | 23 | | | | – | | | | – | | | | 23 | | | | | | 79 | | | | – | | | | – | | | | 79 | |
Total | | | 464 | | | | 4,412 | | | | 10 | | | | 4,886 | | | | | | 521 | | | | 4,308 | | | | 14 | | | | 4,843 | |
Included in the US dollar amounts for term debt above is £742m (2016: £732m) of debt denominated in euros (€600m; 2016:€600m) and Swiss francs (CHF 275m; 2016: CHF 275m) that was swapped into US dollars on issuance and against which there are related derivative financial instruments, which, as at 31 December 2017, had a fair value of £38m (2016: £39m).
24 Lease arrangements
|
Accounting policy Assets held under leases which confer rights and obligations similar to those attaching to owned assets are classified as assets held under finance leases and capitalised within property, plant and equipment or software and the corresponding liability to pay rentals is shown net of interest in the statement of financial position as obligations under finance leases. The capitalised value of the assets is depreciated on a straight-line basis over the shorter of the periods of the leases or the useful lives of the assets concerned. The interest element of the lease payments is allocated so as to produce a constant periodic rate of charge. Operating lease rentals are charged to the income statement on a straight-line basis over the period of the leases. Rental income from operating leases is recognised on a straight-line basis over the term of the relevant lease. The Group has exposures tosub-lease shortfalls in respect of certain property leases for periods up to 2024. Provisions are recognised for net liabilities expected to arise on these exposures. Estimation of the provisions requires judgement in respect of future head lease costs,sub-lease income and the length of vacancy periods. |
Finance leases
At 31 December 2017, future finance lease obligations fall due as follows:
| | | | | | | | |
| | | 2017
£m | | | 2016
£m | |
Within one year | | | 5 | | | | 5 | |
In the second to fifth years inclusive | | | 5 | | | | 9 | |
| | | 10 | | | | 14 | |
Less: future finance charges | | | – | | | | – | |
Total | | | 10 | | | | 14 | |
Present value of future finance lease obligations payable: | | | | | | | | |
Within one year | | | 5 | | | | 5 | |
In the second to fifth years inclusive | | | 5 | | | | 9 | |
Total | | | 10 | | | | 14 | |
The fair value of the lease obligations approximates to their carrying amount.
| | |
| 156 | | RELX Group Annual reports and financial statements 2017 |
|
|
Notes to the consolidated financial statements
for the year ended 31 December 2017
24 Lease arrangements (continued)
Operating leases
At 31 December 2017, outstanding commitments undernon-cancellable operating leases fall due as follows:
| | | | | | | | |
| | | 2017
£m | | | 2016
£m | |
Within one year | | | 109 | | | | 114 | |
In the second to fifth years inclusive | | | 287 | | | | 338 | |
After five years | | | 88 | | | | 115 | |
Total | | | 484 | | | | 567 | |
The Group leases various properties, principally offices, which have varying terms and renewal rights that are typical to the territory in which they are located. Of the above outstanding commitments, £478m (2016: £559m) relate to land and buildings.
The Group has a number of properties that aresub-leased. The future lease receivables contracted withsub-tenants fall due as follows:
| | | | | | | | |
| | | 2017
£m | | | 2016
£m | |
Within one year | | | 21 | | | | 17 | |
In the second to fifth years inclusive | | | 60 | | | | 68 | |
After five years | | | 1 | | | | – | |
Total | | | 82 | | | | 85 | |
25 Provisions
|
Accounting policy Provisions are recognised when a present obligation exists as a result of a past event, the obligation is reasonably estimable, and it is probable that settlement will be required. Provisions are measured at the best estimate of the expenditure required to settle the obligation at the statement of financial position date. |
| | | | | | | | |
| | | 2017
£m | | | 2016
£m | |
At start of year | | | 112 | | | | 121 | |
Utilised | | | (24 | ) | | | (24 | ) |
Exchange translation differences | | | (7 | ) | | | 15 | |
Total | | | 81 | | | | 112 | |
Provisions principally relate to leasehold properties, includingsub-lease shortfalls and guarantees given in respect of certain property leases for various periods up to 2024.
At 31 December 2017, provisions are included within current andnon-current liabilities as follows:
| | | | | | | | |
| | | 2017
£m | | | 2016
£m | |
Current liabilities | | | 19 | | | | 23 | |
Non-current liabilities | | | 62 | | | | 89 | |
Total | | | 81 | | | | 112 | |
| | |
| Financial statements and other information Notes to the consolidated financial statements | | 157 |
|
|
26 Share capital, share premium and shares held in treasury
|
Accounting policy Shares of RELX PLC and RELX NV that are repurchased by the respective company and not cancelled are classified as shares held in treasury. The consideration paid, including directly attributable costs, is recognised as a deduction from equity. Shares of RELX PLC and RELX NV that are purchased by the Employee Benefit Trust are also classified as shares held in treasury, with the cost recognised as a deduction from equity. The consolidated share capital of the Group is the aggregate of the RELX PLC and RELX NV individual share capitals. |
RELX PLC
| | | | | | | | | | | | | | | | |
| CALLED UP SHARE CAPITAL – ISSUED AND FULLY PAID | | No. of shares | | | 2017
£m | | | No. of shares | | | 2016
£m | |
At start of year | | | 1,144,122,623 | | | | 165 | | | | 1,175,914,837 | | | | 170 | |
Issue of ordinary shares | | | 2,019,483 | | | | – | | | | 1,907,786 | | | | – | |
Cancellation of shares | | | (22,460,000 | ) | | | (3 | ) | | | (33,700,000 | ) | | | (5 | ) |
At end of year | | | 1,123,682,106 | | | | 162 | | | | 1,144,122,623 | | | | 165 | |
| | | | | | | | | | | | | | | | |
| RELX NV | | | | | | | | | | | | | | | | |
| CALLED UP SHARE CAPITAL – ISSUED AND FULLY PAID | | No. of shares | | | 2017
€m | | | No. of shares | | | 2016
€m | |
At start of year | | | 1,019,893,404 | | | | 71 | | | | 1,048,162,690 | | | | 73 | |
Issue of ordinary shares | | | 2,067,694 | | | | – | | | | 1,730,714 | | | | – | |
Cancellation of shares | | | (22,000,000 | ) | | | (1 | ) | | | (30,000,000 | ) | | | (2 | ) |
At end of year | | | 999,961,098 | | | | 70 | | | | 1,019,893,404 | | | | 71 | |
| | | | | | | | | | | | | | | | |
| | | | | | £m | | | | | | £m | |
At end of year* | | | | | | | 62 | | | | | | | | 61 | |
* The RELX NV sterling information has been translated using the exchange rates as disclosed in note 29 to the consolidated financial statements.
| | | | | | | | | | | | | | | | |
| NUMBER OF ORDINARY SHARES | | Year ended 31 December | |
| | | Shares in
issue
(millions) | | | Treasury
shares
(millions) | | | 2017
Shares in
issue net of
treasury
shares
(millions) | | | 2016
Shares in
issue net of
treasury
shares
(millions) | |
RELX PLC | | | | | | | | | | | | | | | | |
At start of period | | | 1,144.1 | | | | (63.6 | ) | | | 1,080.5 | | | | 1,106.6 | |
Issue of ordinary shares | | | 2.0 | | | | – | | | | 2.0 | | | | 1.9 | |
Repurchase of ordinary shares | | | – | | | | (23.1 | ) | | | (23.1 | ) | | | (29.2 | ) |
Net release of shares by the Employee Benefit Trust | | | – | | | | 0.7 | | | | 0.7 | | | | 1.2 | |
Cancellation of shares | | | (22.5 | ) | | | 22.5 | | | | – | | | | – | |
At end of year | | | 1,123.6 | | | | (63.5 | ) | | | 1,060.1 | | | | 1,080.5 | |
RELX NV | | | | | | | | | | | | | | | | |
At start of period | | | 1,019.9 | | | | (57.7 | ) | | | 962.2 | | | | 985.3 | |
Issue of ordinary shares | | | 2.1 | | | | – | | | | 2.1 | | | | 1.7 | |
Repurchase of ordinary shares | | | – | | | | (21.4 | ) | | | (21.4 | ) | | | (26.1 | ) |
Net release of shares by the Employee Benefit Trust | | | – | | | | 0.7 | | | | 0.7 | | | | 1.3 | |
Cancellation of shares | | | (22.0 | ) | | | 22.0 | | | | – | | | | – | |
At end of year | | | 1,000.0 | | | | (56.4 | ) | | | 943.6 | | | | 962.2 | |
| | | | | | | | | | | | | | | | | |
At end of period - RELX PLC and RELX NV | | | 2,123.6 | | | | (119.9 | ) | | | 2,003.7 | | | | 2,042.7 | |
| | |
| 158 | | RELX Group Annual reports and financial statements 2017 |
|
|
Notes to the consolidated financial statements
for the year ended 31 December 2017
26 Share capital, share premium and shares held in treasury (continued)
During the year, RELX PLC repurchased 23.1m (2016: 29.2m; 2015: 25.7m) RELX PLC ordinary shares for an average price of 1,604p and RELX NV repurchased 21.4m (2016: 26.1m; 2015: 15.8m) RELX NV ordinary shares for an average price of€17.57. The total consideration for the repurchases was £700m (2016: £700m; 2015: £500m). These shares are held in treasury.
The Employee Benefit Trust purchases RELX PLC and RELX NV shares which, at the trustees’ discretion, can be used in respect of the exercise of share options and to meet commitments under conditional share awards. During the year, the Employee Benefit Trust purchased 1.2m RELX PLC shares and 1.3m RELX NV shares for a total cost of £39m (2016: £29m; 2015: £23m). At 31 December 2017, shares held by the Employee Benefit Trust were £82m (2016: £81m) at cost.
The issue of ordinary shares in the year relates to the exercise of share options. Details of share option and conditional share schemes are set out in note 7 on page 131.
All of the RELX PLC and RELX NV ordinary shares rank equally with respect to voting rights and rights to receive dividends, except for shares held in treasury by the respective parent company, which do not attract voting or dividend rights. There are no restrictions on the rights to transfer shares.
At 31 December 2017, RELX PLC shares held in treasury related to 3,493,817 (2016: 4,229,442) RELX PLC ordinary shares held by the Employee Benefit Trust; and 60,077,786 (2016: 59,415,287) RELX PLC ordinary shares held by the parent company. At 31 December 2017, RELX PLC shares held by the Employee Benefit Trust were £39m (2016: £38m) at cost. During December 2017, 22.5m (2016: 33.7m) RELX PLC ordinary shares held in treasury were cancelled.
At 31 December 2017, RELX NV shares held in treasury related to 3,775,905 (2016: 4,519,358) RELX NV ordinary shares held by the Employee Benefit Trust; and 52,563,100 (2016: 53,204,378) RELX NV ordinary shares held by the parent company. At 31 December 2017, RELX NV shares held by the Employee Benefit Trust were £43m (2016: £43m) at cost. During December 2017, 22.0m (2016: 30.0m) RELX NV ordinary shares held in treasury were cancelled.
On 7 December 2017, RELX PLC and RELX NV announced anon-discretionary programme to repurchase further ordinary shares up to the value of £100m. At 31 December 2017, an accrual of £100m was recognised in respect of thisnon-discretionary commitment. A further 3.3m RELX PLC ordinary shares and 2.9m RELX NV ordinary shares have been repurchased in January and February 2018 under this programme.
27 Other reserves
| | | | | | | | | | | | | | | | |
| | | Hedge
reserve
2017
£m | | | Other
reserves
2017 £m | | | Total
2017
£m | | | Total
2016
£m | |
| | | | |
At start of year | | | (133 | ) | | | (32 | ) | | | (165 | ) | | | 341 | |
Profit attributable to RELX PLC and RELX NV shareholders | | | – | | | | 1,659 | | | | 1,659 | | | | 1,161 | |
Dividends paid | | | – | | | | (762 | ) | | | (762 | ) | | | (683 | ) |
Actuarial gains /(losses) on defined benefit pension schemes | | | – | | | | 233 | | | | 233 | | | | (262 | ) |
Fair value movements on cash flow hedges | | | 137 | | | | – | | | | 137 | | | | (165 | ) |
Transfer to net profit from cash flow hedge reserve | | | 25 | | | | – | | | | 25 | | | | 46 | |
Tax recognised in other comprehensive income | | | (30 | ) | | | (59 | ) | | | (89 | ) | | | 64 | |
Increase in share based remuneration reserve (net of tax) | | | – | | | | 42 | | | | 42 | | | | 44 | |
Cancellation of shares | | | – | | | | (566 | ) | | | (566 | ) | | | (707 | ) |
Settlement of share awards | | | – | | | | (37 | ) | | | (37 | ) | | | (39 | ) |
Exchange translation differences | | | (2 | ) | | | 12 | | | | 10 | | | | 35 | |
At end of year | | | (3 | ) | | | 490 | | | | 487 | | | | (165 | ) |
Other reserves principally comprise retained earnings and the share based remuneration reserve.
28 Related party transactions
Transactions between the RELX PLC, RELX NV, RELX Group plc and subsidairies of the Group have been eliminated within the consolidated financial statements. Transactions with joint ventures were made on normal market terms of trading and comprise sales of goods and services of £16m (2016: £2m; 2015: nil) and the rendering and receiving of goods and services of £0.1m (2016: nil; 2015: £14.0m). As at 31 December 2017, amounts owed by joint ventures were £2m (2016: nil; 2015: £1m) and amounts due to joint ventures were £1m (2016: nil; 2015: £1m). See note 6 for details of the Group’s participation in defined benefit pension schemes.
Key management personnel are also related parties as defined by IAS 24 – Related Party Disclosures and comprise the Executiveand Non-Executive Directors of RELX PLC and RELX NV. Key management personnel remuneration is set out below. For reporting purposes, salary, benefits and annual incentive payments are considered short-term employee benefits.
| | |
| Financial statements and other information Notes to the consolidated financial statements | | 159 |
|
|
28 Related party transactions (continued)
| | | | | | | | | | | | |
| KEY MANAGEMENT PERSONNEL REMUNERATION | | 2017
£m | | | 2016
£m | | | 2015
£m | |
Salaries, other short-term employee benefits andnon-executive fees | | | 5 | | | | 5 | | | | 5 | |
Post-employment benefits | | | 1 | | | | 1 | | | | 1 | |
Share based remuneration* | | | 6 | | | | 5 | | | | 5 | |
Total | | | 12 | | | | 11 | | | | 11 | |
| | | | | | | | | | | | | | | | | | | | | | | | | | | | |
| EXECUTIVE DIRECTORS | | | | | |
| Salary
£’000 |
| |
| Benefits
£’000 |
| |
| Annual
incentive
£’000 |
| |
| Cost of share
based
remuneration£’000 |
* | |
| Cost of
pension
provision£’000 |
* | |
| Total
£’000 |
|
Total Executive Directors | | | 2017 | | | | 1,889 | | | | 101 | | | | 1,964 | | | | 5,549 | | | | 983 | | | | 10,486 | |
| | | 2016 | | | | 1,843 | | | | 88 | | | | 1,881 | | | | 5,409 | | | | 1,052 | | | | 10,273 | |
| | | | 2015 | | | | 1,797 | | | | 92 | | | | 1,889 | | | | 5,181 | | | | 966 | | | | 9,925 | |
* The share based remuneration charge comprises the multi-year incentive scheme charges in accordance with IFRS 2 – Share Based Payment. These IFRS 2 charges do not reflect the actual value received on vesting. The cost of pension provision is calculated in accordance with the methodology set out in the UK Regulations. The amount is reduced by the Directors’ contributions and participation fee for defined benefit schemes and reduced by the payments made to defined contribution schemes or in lieu of pension.
| | | | | | | | | | | | |
| NON-EXECUTIVE DIRECTORS | | 2017
£’000 | | | 2016
£’000 | | | 2015
£’000 | |
Fees and benefits | | | 1,396 | | | | 1,364 | | | | 1,145 | |
The remuneration ofnon-executive directors comprises fees for services, and benefits primarily relating to tax filing support in respect of filings resulting from their directorships. The value of deemed benefits provided during 2017 to two former Directors’ was £2,460 (2016: nil; 2015: nil). No loans, advances or guarantees have been provided on behalf of any Director. The aggregate gains made by Executive Directors on the exercise of options during 2017 were £2,804,358 (2016: £3,082,715; 2015: £1,474,715).
29 Exchange rates
The following exchange rates have been applied in preparing the consolidated financial statements:
| | | | | | | | | | | | | | | | | | | | | | | | |
| | | Income statement | | | | | | Statement of
financial position | |
| | | 2017 | | | 2016 | | | 2015 | | | | | | 2017 | | | 2016 | |
Euro to sterling | | | 1.14 | | | | 1.22 | | | | 1.38 | | | | | | | | 1.12 | | | | 1.17 | |
US dollars to sterling | | | 1.29 | | | | 1.36 | | | | 1.53 | | | | | | | | 1.35 | | | | 1.23 | |
30 Subsequent events
On 29 January 2018, RELX Group announced that it had entered into a definitive agreement to acquire 100% of the share capital of ThreatMetrix for £580m. The acquisition is subject to customary conditions and regulatory consents and is expected to close during the first half of 2018. This acquisition will be accounted for as a business combination in accordance with IFRS 3. The results and net assets of ThreatMetrix will be consolidated into the RELX Group results from the point of close. The assessment of the fair values of the assets and liabilities acquired will be completed during 2018.
31 Approval of financial statements
The consolidated financial statements were approved and authorised for issue by the Boards of Directors of RELX PLC and RELX NV on
14 February 2018.
| | |
| 160 | | RELX Group Annual reports and financial statements 2017 |
|
|
Notes to the consolidated financial statements
for the year ended 31 December 2017
32 Related undertakings
A full list of related undertakings (comprising subsidiaries, joint ventures, associates and other significant holdings) is set out below. All are 100% owned directly or indirectly by the Group except where percentage ownership denoted in (x%).
| | | | | | |
| Company Name | | Share Class | | Reg
Office | |
| Australia | | | | | | |
Adaptris Pty Ltd | | Ordinary | | | AUS1 | |
Elsevier (Australia) Pty Ltd | | Ordinary | | | AUS3 | |
Fair Events Pty Ltd (49%) | | Ordinary | | | AUS4 | |
First 4 Farming Australia Pty Ltd | | Ordinary | | | AUS1 | |
Fitness Show Pty Ltd (80%) | | Ordinary | | | AUS6 | |
LexisNexis Risk Solutions Assets Australia Pty Ltd | | Ordinary and | | | AUS3 | |
| | Redeemable | | | | |
| | Preference | | | | |
LexisNexis Risk Solutions Australia Pty Ltd | | Ordinary | | | AUS3 | |
LexisNexis Risk Solutions Unit Trust | | Units | | | AUS3 | |
Reed Exhibitions Australia Pty Ltd | | Ordinary | | | AUS2 | |
Reed International Books Australia Pty Ltd | | Ordinary | | | AUS3 | |
Reed OzComic-Con Pty Ltd (80%) | | Ordinary | | | AUS2 | |
RELX Australia Pty Ltd | | Ordinary | | | AUS2 | |
| | | | | | |
| Austria | | | | | | |
Expoxx Messebau GmbH | | Registered Capital | | | AUT1 | |
LexisNexis Verlag ARD ORAC GmbH & Co KG | | Registered Capital | | | AUT2 | |
ORAC Gesellschaft m.b.H. | | Registered Capital | | | AUT2 | |
Reed CEE GmbH | | Registered Capital | | | AUT1 | |
Reed Messe Salzburg GmbH | | Registered Capital | | | AUT3 | |
Reed Messe Wien GmbH | | Registered Capital | | | AUT1 | |
RELX Austria GmbH | | Registered Capital | | | AUT3 | |
System StandBau GmbH | | Registered Capital | | | AUT4 | |
| | | | | | |
| Belgium | | | | | | |
LexisNexis BVBA | | Ordinary | | | BEL1 | |
First 4 Farming Europe NV | | Ordinary-A, | | | BEL2 | |
| | Ordinary-B | | | | |
| | | | | | |
| Brazil | | | | | | |
Elsevier Editora Ltda | | Quotas | | | BRA1 | |
Elsevier Participacoes Ltda | | Quotas | | | BRA1 | |
| Fircosoft Brazil Consultoria e Servicos de Informatica Ltda | | Ordinary | | | BRA2 | |
LexisNexis Informações e Sistemas Empresariais Ltda | | Quotas shares | | | BRA3 | |
LexisNexis Serviços de Análise de Risco Ltda | | Quotas shares | | | BRA3 | |
MLex Brasil Midia Mercadologica Ltda | | Quotas | | | BRA4 | |
Reed Exhibitions Alcântara Machado Ltda | | Quotas shares | | | BRA3 | |
| | | | | | |
| Canada | | | | | | |
LexisNexis Canada Inc | | Class A(non-voting), | | | CAN1 | |
| | Class B (voting) | | | | |
Reed Exhibitions Inc | | Common | | | CAN2 | |
RELX Canada Ltd | | Unlimited Class A, | | | CAN3 | |
| | Unlimited Class B, | | | | |
| | Unlimited Class C, | | | | |
| | Unlimited Class D, | | | | |
| | Unlimited Class E, | | | | |
| | Unlimited Class F, | | | | |
| | Unlimited Class G, | | | | |
| | Unlimited Class H | | | | |
| | | | | | |
| Chile | | | | | | |
Encyclopédie Médico-Chirurgicale Chile Limitada | | Ordinary | | | CHL1 | |
| | | | | | |
| China | | | | | | |
Beijing Bakery China Exhibitions Co., Ltd (25%) | | Registered Capital | | | CHN1 | |
| Beijing Medtime Elsevier Education Technology Co., Ltd (49%) | | Registered Capital | | | CHN2 | |
Beijing Reed Elsevier Science and Technology Co., Ltd | | Registered Capital | | | CHN3 | |
Beijing Reed Guanghe Exhibition Co., Ltd (80%) | | Registered Capital | | | CHN4 | |
C-One Energy Co., Ltd | | Registered Capital | | | CHN6 | |
Genilex Information Technology Co., Ltd (40%) | | Registered Capital | | | CHN7 | |
ICIS Consulting (Beijing) Co., Ltd | | Registered Capital | | | CHN8 | |
KeAi Communications Co., Ltd (49%) | | Registered Capital | | | CHN9 | |
LexisNexis Risk Solutions (Shanghai) Information | | Registered Capital | | | CHN10 | |
Technologies Co., Ltd | | | | | | |
MLex Consulting (Beijing) Co., Ltd | | Registered Capital | | | CHN11 | |
Reed Elsevier Information Technology (Beijing) Co., Ltd | | Registered Capital | | | CHN3 | |
Reed Exhibitions (China) Co., Ltd | | Registered Capital | | | CHN4 | |
Reed Exhibitions (Shanghai) Co., Ltd | | Registered Capital | | | CHN12 | |
Reed Hongda Exhibitions (Henan) Co., Ltd (51%) | | Registered Capital | | | CHN13 | |
Reed Huabai Exhibitions (Beijing) Co., Ltd (51%) | | Registered Capital | | | CHN4 | |
Reed Huabo Exhibitions (Shenzhen) Co., Ltd (65%) | | Registered Capital | | | CHN14 | |
Reed Huaqun Exhibitions Co., Ltd (52%) | | Registered Capital | | | CHN4 | |
Reed Kuozhan Exhibitions (Shanghai) Co., Ltd (60%) | | Registered Capital | | | CHN12 | |
Reed Sinopharm Exhibitions Co., Ltd (50%) | | Registered Capital | | | CHN4 | |
RELX (China) Investment Co., Ltd | | Ordinary | | | CHN15 | |
Shanghai CBI Business Development Co., Ltd | | Registered Capital | | | CHN16 | |
| Shanghai Datong Medical Information Technology Co., Ltd | | Registered Capital | | | CHN17 | |
| Shanghai SinoReal Exhibitions Co., Ltd (27.5%) | | Registered Capital | | | CHN18 | |
| | | | | | |
| Company Name | | Share Class | | Reg
Office | |
| Colombia | | | | | | |
LexisNexis Risk Solutions S.A.S. | | Ordinary | | | COL1 | |
| | | | | | |
| Denmark | | | | | | |
Elsevier A/S | | Ordinary | | | DNK1 | |
Reed Elsevier Denmark ApS | | Ordinary | | | DNK1 | |
| | | | | | |
| Dubai, UAE | | | | | | |
Reed Exhibitions FreeZone-LLC | | Ordinary | | | UAE1 | |
RELX Middle EastFZ-LLC | | Ordinary | | | UAE2 | |
| | | | | | |
| Egypt | | | | | | |
Elsevier Egypt LLC | | Ordinary | | | EGY1 | |
| | | | | | |
| France | | | | | | |
Elsevier Holding France SAS | | Registered Capital | | | FRA1 | |
Elsevier Masson SAS | | Registered Capital | | | FRA1 | |
Evoluprint SAS | | Ordinary | | | FRA2 | |
Fircosoft SAS | | Ordinary | | | FRA3 | |
GieEdi-Data | | Ordinary | | | FRA4 | |
Gie Juris-Data | | Ordinary | | | FRA4 | |
GIE PRK - Publicite Robert Krier | | Registered capital | | | FRA5 | |
LexisNexis Business Information Solutions | | Ordinary | | | FRA4 | |
LexisNexis Business Information Solutions Holding | | Ordinary | | | FRA6 | |
LexisNexis International Development Services | | Ordinary | | | FRA4 | |
LexisNexis SA | | Ordinary | | | FRA4 | |
Reed Exhibitions ISG SARL | | Registered capital | | | FRA7 | |
Reed Expositions France SAS | | Ordinary | | | FRA5 | |
Reed Midem SAS | | Registered capital | | | FRA7 | |
Reed Organisation SAS | | Ordinary | | | FRA5 | |
RELX France S.A. | | Registered capital | | | FRA7 | |
SAFI SA | | Ordinary | | | FRA8 | |
| | | | | | |
| Germany | | | | | | |
Collexis GmbH | | Registered Capital | | | DEU3 | |
Elsevier GmbH | | Registered Capital | | | DEU3 | |
Elsevier Information Systems GmbH | | Registered Capital | | | DEU3 | |
LexisNexis GmbH | | Registered Capital | | | DEU5 | |
MedCongress GmbH | | Registered Capital | | | DEU1 | |
REC Publications GmbH | | Registered Capital | | | DEU1 | |
Reed Exhibitions (Germany) GmbH | | Registered Capital | | | DEU1 | |
Reed Exhibitions Deutschland GmbH | | Registered Capital | | | DEU1 | |
Reed Exhibitions Holdings GmbH | | Registered Capital | | | DEU1 | |
Reed Travel (Germany) GmbH | | Ordinary | | | DEU6 | |
RELX Deutschland GmbH | | Registered Capital | | | DEU1 | |
Tschach Solutions GmbH | | Ordinary | | | DEU7 | |
| | | | | | |
| Hong Kong | | | | | | |
Ascend China Holding Ltd | | Ordinary | | | HNK1 | |
Reed Business Information (China) Ltd | | Ordinary | | | HNK2 | |
CBI Group Co. Ltd (20%) | | Ordinary | | | HNK3 | |
JC Exhibition and Promotion Ltd (65%) | | Ordinary | | | HNK1 | |
JYLN Sager Ltd (40%) | | Ordinary | | | HNK5 | |
MLex Asia Ltd (91%) | | Ordinary | | | HNK6 | |
Reed Exhibitions Ltd | | Ordinary | | | HNK5 | |
RELX (Greater China) Ltd | | Ordinary | | | HNK7 | |
| | | | | | |
| India | | | | | | |
B I Churchill Living Stone Pvt Ltd | | Equity shares | | | IND1 | |
Comic Con India Private Ltd (36%) | | Ordinary | | | IND2 | |
FircoSoft India Private Ltd | | Ordinary | | | IND3 | |
Harcourt (India) Pvt Ltd | | Equity shares | | | IND1 | |
Reed Elsevier Publishing (India) Pvt Ltd | | Ordinary | | | IND4 | |
Reed Manch Exhibitions Private Ltd (70%) | | Ordinary | | | IND5 | |
Reed SI Exhibitions Private Ltd (51%) | | Ordinary | | | IND6 | |
Reed Triune Exhibitions Private Ltd (72%) | | Ordinary | | | IND7 | |
RELX India Private Ltd | | Ordinary | | | IND1 | |
| | | | | | |
| Indonesia | | | | | | |
PT Reed Panorama Exhibitions (50%) | | Ordinary | | | IDN1 | |
| | | | | | |
| Ireland | | | | | | |
Armanatta Holding Ltd | | Ordinary | | | IRE1 | |
Butterworth (Ireland) Ltd | | Ordinary, A Ordinary | | | IRE2 | |
Elsevier Services Ireland Ltd | | Ordinary | | | IRE4 | |
I.W.P.M. (Holdings) Ltd | | 6% Cumulative, | | | IRE2 | |
| | Deferred Ordinary, | | | | |
| | Ordinary | | | | |
LexisNexis Risk Solutions (Ireland) Ltd | | Ordinary | | | IRE1 | |
LexisNexis Risk Solutions (Europe) Ltd | | Ordinary | | | IRE1 | |
| | |
| Financial statements and other information Notes to the consolidated financial statements | | 161 |
|
|
32 Related undertakings (continued)
| | | | | | |
| Company Name | | Share Class | | Reg
Office | |
| Israel | | | | | | |
LexisNexis Israel Ltd | | Ordinary | | | ISR1 | |
| | | | | | |
| Italy | | | | | | |
Elsevier SRL | | Registered Capital | | | ITA1 | |
ICIS Italia SRL | | Ordinary | | | ITA2 | |
Reed Exhibitions ISG Italy SRL | | Ordinary | | | ITA1 | |
Reed Exhibitions Italia SRL | | Ordinary | | | ITA3 | |
| | | | | | |
| Japan | | | | | | |
Ascend Japan KK | | Ordinary | | | JPN1 | |
Elsevier Japan KK | | Ordinary | | | JPN2 | |
LexisNexis Japan KK | | Common Stock | | | JPN3 | |
Reed Exhibitions Japan KK | | Ordinary | | | JPN4 | |
Reed ISG Japan KK | | Ordinary | | | JPN5 | |
| | | | | | |
| Korea (South) | | | | | | |
Elsevier Korea LLC | | Ordinary | | | KOR1 | |
| LexisNexis Legal and Professional Service Korea Ltd | | Ordinary | | | KOR2 | |
Reed Exhibitions Korea Ltd | | Ordinary | | | KOR3 | |
Reed Exporum Ltd (60%) | | Ordinary | | | KOR4 | |
Reed K. Fairs Ltd (70%) | | Ordinary | | | KOR3 | |
| | | | | | |
| Luxembourg | | | | | | |
FIRCOSOFT Luxembourg Sàrl | | Ordinary | | | LUX1 | |
| | | | | | |
| Malaysia | | | | | | |
LexisNexis Malaysia Sdn Bhd | | Ordinary | | | MYS1 | |
Reed Exhibitions Sdn Bhd | | Ordinary | | | MYS1 | |
TJ Ventures Sdn Bhd | | Ordinary | | | MYS1 | |
| | | | | | |
| Mexico | | | | | | |
Masson-Doyma Mexico, S.A. | | Ordinary | | | MEX1 | |
Reed Exhibitions Mexico S.A. de C.V. | | Ordinary | | | MEX2 | |
| | | | | | |
| Morocco | | | | | | |
Reed Exhibitions Morocco SARL | | Ordinary | | | MAR1 | |
| | | | | | |
| New Zealand | | | | | | |
LexisNexis NZ Ltd | | Ordinary | | | NZL1 | |
| | | | | | |
| Philippines | | | | | | |
Reed Elsevier Shared Services (Philippines) Inc. | | Ordinary | | | PHL1 | |
| | | | | | |
| Poland | | | | | | |
Elsevier sp. z.o.o. | | Ordinary | | | POL1 | |
| | | | | | |
| Russia | | | | | | |
Ecwatech Company ZAO | | Ordinary | | | RUS1 | |
LexisNexis OOO | | Registered Capital | | | RUS2 | |
Real Estate Events Direct OOO (80%) | | Registered Capital | | | RUS3 | |
RELX OOO | | Registered Capital | | | RUS2 | |
| | | | | | |
| Saudi Arabia | | | | | | |
Reed Sunaidi Exhibitions (50%) | | Ordinary | | | SAU1 | |
| | | | | | |
| Singapore | | | | | | |
Elsevier (Singapore) Pte Ltd | | Ordinary | | | SGP1 | |
F4F Agriculture (Asia Pacific) Pte Ltd | | Ordinary | | | SGP2 | |
ICIS Investment Singapore Pte Ltd | | Ordinary | | | SGP3 | |
Lexis-Nexis Philippines Pte Ltd (75%) | | Preference shares | | | SGP3 | |
Reed Business Information Pte Ltd | | Ordinary | | | SGP4 | |
RE (HAPL) Pte Ltd | | Ordinary | | | SGP1 | |
RELX (Singapore) Pte. Ltd | | Ordinary | | | SGP3 | |
SAFI Asia Pte Ltd (50%) | | Ordinary | | | SGP4 | |
| | | | | | |
| South Africa | | | | | | |
| Fircosoft South Africa (Pty) Ltd | | Ordinary | | | ZAF1 | |
| Globalrange SA (Pty) Ltd | | Ordinary | | | ZAF2 | |
| Korbitec (Pty) Ltd (90%) | | Ordinary | | | ZAF3 | |
| LegalPerfect Software Solutions (Pty) Ltd (90%) | | Ordinary | | | ZAF3 | |
| LexisNexis Academic (Pty) Ltd (90%) | | Ordinary | | | ZAF3 | |
| LexisNexis (Pty) Ltd (90%) | | Ordinary | | | ZAF3 | |
| LexisNexis Risk Management (Pty) Ltd (90%) | | Ordinary | | | ZAF3 | |
| Property Payment Exchange (SA) (Pty) Ltd (“Pexsa”) (90%) | | Ordinary | | | ZAF3 | |
| RELX (Pty) Ltd | | Ordinary | | | ZAF3 | |
| Reed Exhibitions (Pty) Ltd (90%) | | A-shares | | | ZAF4 | |
| Reed Management (Pty) Ltd (90%) | | A-shares | | | ZAF4 | |
| Reed Exhibitions (Pty) Ltd (90%) | | Ordinary | | | ZAF4 | |
| Reed Venue Management (Pty) Ltd (90%) | | A-shares | | | ZAF4 | |
Winsearch Services (Pty) Ltd (90%) | | Ordinary | | | ZAF3 | |
| | | | | | |
| Company Name | | Share Class | | Reg
Office | |
| Spain | | | | | | |
Elsevier Espana, S.L. | | Participations | | | ESP1 | |
| | | | | | |
| Switzerland | | | | | | |
Elsevier Finance SA | | Ordinary | | | CHE1 | |
Fircosoft Schweiz GmbH | | Ordinary | | | CHE2 | |
RELX Intellectual Properties SA | | Ordinary | | | CHE1 | |
RELX Risks SA | | Ordinary | | | CHE1 | |
RELX Swiss Holdings SA | | Ordinary | | | CHE1 | |
| | | | | | |
| Taiwan | | | | | | |
Elsevier Taiwan LLC | | Registered Capital | | | TWN1 | |
| | | | | | |
| Thailand | | | | | | |
Reed Holding (Thailand) Co., Ltd | | Ordinary | | | THA2 | |
Reed Tradex Company Ltd (49%) | | Preference shares | | | THA1 | |
| | | | | | |
| The Netherlands | | | | | | |
AGRM Solutions C.V. | | Partnership Interest | | | NLD1 | |
Elsevier B.V. | | Ordinary | | | NLD1 | |
Elsevier Employment Services B.V. | | Ordinary | | | NLD1 | |
LexisNexis Business Information Solutions B.V. | | Ordinary | | | NLD1 | |
LexisNexis Univentio B.V. | | Ordinary | | | NLD2 | |
Reed Business B.V. | | Ordinary | | | NLD1 | |
RELX Finance B.V. | | Ordinary | | | NLD1 | |
RELX Holdings B.V. | | Ordinary | | | NLD1 | |
RELX Nederland B.V. | �� | E Shares / RE Shares | | | NLD1 | |
RELX Overseas B.V. | | E Shares / RE Shares | | | NLD1 | |
RELX US Holdings (Amsterdam) B.V. | | Ordinary | | | NLD1 | |
| | | | | | |
| Turkey | | | | | | |
Elsevier STM Bilgi Hizmetleri Limited Şirketi | | Ordinary | | | TUR1 | |
Reed Tüyap Fuarcilik A.Ş.(50%) | | A-shares /B-shares | | | TUR2 | |
| | | | | | |
| United Kingdom | | | | | | |
Accuity Solutions Ltd | | Ordinary | | | GBR2 | |
Accuity Solutions UK Ltd | | Ordinary | | | GBR2 | |
Adaptris Group Ltd | | Ordinary | | | GBR2 | |
Adaptris Ltd | | Ordinary | | | GBR2 | |
Ascend Holdings Ltd | | Ordinary | | | GBR2 | |
Ascend Worldwide Group Holdings Ltd | | Ordinary, | | | GBR2 | |
| | Ordinary C, | | | | |
| | Ordinary D, | | | | |
| | Ordinary-A | | | | |
Ascend Worldwide Ltd | | Ordinary | | | GBR2 | |
Avenue Exhibitions Ltd | | non-voting, Ordinary | | | GBR4 | |
Axxia Systems Ltd | | Ordinary, | | | GBR1 | |
| | Ordinary-A | | | | |
Berrows Pension Trustees Ltd | | Ordinary | | | GBR1 | |
Bluegrill Ltd | | Ordinary | | | GBR4 | |
Bradfield Brett Holdings Ltd | | 7 1/2% Preferred | | | GBR1 | |
| | Income, Ordinary | | | | |
Bradfield, Brett & Company Ltd | | Ordinary | | | GBR1 | |
Butterworth & Co. (Overseas) Ltd | | Ordinary | | | GBR1 | |
Butterworth & Co. (Publishers) Ltd | | 4.5% Cum. | | | GBR1 | |
| | Preference, | | | | |
| | ‘A’ Ordinary, | | | | |
| | ‘B’ Ordinary | | | | |
Butterworths Ltd | | Ordinary | | | GBR5 | |
Cordery Compliance Ltd (72%) | | Ordinary | | | GBR5 | |
Cordery Ltd (72%) | | Ordinary | | | GBR5 | |
Crediva Ltd | | Ordinary | | | GBR6 | |
DBT Ltd | | Ordinary | | | GBR2 | |
Dew Events Ltd | | Ordinary | | | GBR4 | |
Drayton Legal Recoveries Ltd | | Ordinary | | | GBR7 | |
E & P Events LLP (50%) | | No Shares | | | GBR4 | |
Elsevier Ltd | | Ordinary | | | GBR8 | |
Elsevier Life Sciences IP Ltd | | Ordinary | | | GBR8 | |
Everyform Ltd | | Ordinary A, | | | GBR9 | |
| | Ordinary B, | | | | |
| | Ordinary C, | | | | |
| | Ordinary D | | | | |
Fircosoft Ltd | | Ordinary | | | GBR2 | |
First 4 Farming Ltd | | Ordinary | | | GBR2 | |
Formpart (EPL) Ltd | | Ordinary | | | GBR1 | |
Formpart (EPS) Ltd | | Ordinary | | | GBR1 | |
Formpart (MDL) Ltd | | Ordinary | | | GBR1 | |
Formpart (PDL) Ltd | | Ordinary | | | GBR1 | |
Formpart (SFL) Ltd | | Ordinary | | | GBR1 | |
Gamermania Ltd | | Ordinary | | | GBR2 | |
George Philip Holdings Ltd | | Cumulative | | | GBR1 | |
| | Preference, | | | | |
| | Ordinary, | | | | |
| | Ordinary A, | | | | |
| | Redeemable | | | | |
| | Cumulative | | | | |
| | Preference | | | | |
| | |
| 162 | | RELX Group Annual reports and financial statements 2017 |
|
|
Notes to the consolidated financial statements
for the year ended 31 December 2017
32 Related undertakings (continued)
| | | | | | |
| Company Name | | Share Class | | Reg
Office | |
| United Kingdom cont. | | | | | | |
Hallplaza Ltd | | Ordinary | | | GBR4 | |
Imbibe Media Ltd | | Ordinary | | | GBR4 | |
Indicium Financial Ltd | | Ordinary | | | GBR10 | |
InferMed Ltd | | Ordinary | | | GBR8 | |
Information Handling Ltd (85%) | | Ordinary | | | GBR1 | |
Insurance Initiatives Ltd | | Ordinary | | | GBR10 | |
Legend Exhibitions Ltd | | Ordinary-A, | | | GBR4 | |
| | Ordinary-B | | | | |
LexisNexis Risk Solutions UK Ltd | | Ordinary | | | GBR11 | |
Marktile Ltd | | Ordinary | | | GBR1 | |
MCM Central Ltd | | Ordinary | | | GBR2 | |
MCM Expo Ltd | | Ordinary | | | GBR2 | |
MCM Stategy Ltd | | Ordinary | | | GBR2 | |
Mendeley Ltd | | Ordinary | | | GBR8 | |
MLex Ltd (91%) | | A Ordinary Shares, | | | GBR5 | |
| | Ordinary | | | | |
Moreover Technologies Ltd | | Ordinary | | | GBR1 | |
Mosby International Ltd | | Ordinary | | | GBR1 | |
Neptune Collections Ltd | | Deferred | | | GBR4 | |
Newsflo Ltd | | Ordinary | | | GBR1 | |
Offshore Europe (Management) Ltd | | Ordinary | | | GBR4 | |
Offshore Europe Partnership (50%) | | Partnership Interest | | | GBR4 | |
OPG 1 Ltd | | Ordinary | | | GBR1 | |
Oxford Spires Management Co; Ltd (55%) | | Ordinary | | | GBR12 | |
Peopletracer Ltd | | Ordinary | | | GBR6 | |
Prean Holdings Ltd | | Deferred, Ordinary | | | GBR1 | |
RE (IDM) Ltd | | Cumulative | | | GBR2 | |
| | Redeemable | | | | |
| | Preference, | | | | |
| | Ordinary, | | | | |
| | Ordinary-A | | | | |
RE (SEG) Ltd | | Ordinary-A, | | | GBR4 | |
| | Ordinary-B, | | | | |
| | Preferred Ordinary | | | | |
RE (SEL) Ltd | | Ordinary | | | GBR4 | |
RE (SOE) Ltd | | Ordinary | | | GBR4 | |
RE Directors (No.1) Ltd | | Ordinary | | | GBR1 | |
RE Directors (No.2) Ltd | | Ordinary | | | GBR1 | |
RE Secretaries Ltd | | Ordinary | | | GBR1 | |
ReedAll-Energy Ltd | | Ordinary | | | GBR4 | |
Reed Business Information (Holdings) Ltd | | Ordinary | | | GBR2 | |
Reed Business Information Ltd | | Ordinary | | | GBR2 | |
Reed Consumer Books Ltd | | Ordinary | | | GBR1 | |
Reed Elsevier (UIG) Ltd | | Ordinary | | | GBR1 | |
Reed Elsevier Pension Investment Management Ltd | | Ordinary | | | GBR1 | |
Reed Elsevier Pension Trustee Ltd | | Ordinary | | | GBR1 | |
Reed Events Ltd | | Ordinary | | | GBR4 | |
Reed Exhibitions Ltd | | Deferred, Ordinary | | | GBR4 | |
Reed Healthcare Communications Ltd | | Ordinary-A | | | GBR2 | |
Reed Midem Ltd | | Ordinary | | | GBR4 | |
Reed Nominees Ltd | | Ordinary | | | GBR1 | |
Reed Overseas Corporation Ltd | | Ordinary | | | GBR1 | |
Reed Publishing Corporation Ltd | | Ordinary | | | GBR1 | |
RELX (Holdings) Ltd | | Ordinary | | | GBR1 | |
RELX (Investments) plc | | Ordinary | | | GBR1 | |
RELX (UK) Holdings Ltd | | Ordinary | | | GBR1 | |
RELX (UK) Ltd | | Ordinary | | | GBR1 | |
RELX Finance Ltd | | Ordinary | | | GBR1 | |
RELX Group plc | | ‘E’ Ordinary, | | | GBR1 | |
| | Ordinary, | | | | |
| | ‘R’ Ordinary | | | | |
RELX Overseas Holdings Ltd | | Ordinary, | | | GBR1 | |
| | Preference | | | | |
REV Venture Partners Ltd | | Ordinary | | | GBR1 | |
Rowan Marketing Ltd (50%) | | Ordinary | | | GBR2 | |
Scripta Technica Ltd | | ‘A’ Ordinary, ‘B’ | | | GBR1 | |
| | Ordinary, | | | | |
| | Cumulative | | | | |
| | Preference | | | | |
Sharpwise Ltd | | Ordinary | | | GBR1 | |
The Lancet Ltd | | Ordinary | | | GBR1 | |
The Medicine Publishing Company Ltd | | Ordinary | | | GBR1 | |
The Medicine Publishing Group Ltd | | Ordinary | | | GBR1 | |
The Viscom Group Ltd | | Ordinary | | | GBR1 | |
Tolley Publishing Company Ltd | | Ordinary, A Equity | | | GBR1 | |
Tracesmart Group Ltd | | Ordinary | | | GBR6 | |
Tracesmart Ltd | | Ordinary | | | GBR6 | |
Wunelli Ltd | | Ordinary | | | GBR13 | |
| | | | | | |
| Company Name | | Share Class | | Reg
Office | |
| United States | | | | | | |
Accuity Asset Verification Services Inc | | Common Stock | | | USA1 | |
Accuity Europe Inc | | Common Stock | | | USA1 | |
Accuity Holdings Inc | | Common Stock and | | | USA1 | |
| | Preferred Stock | | | | |
Accuity Inc | | Common Stock | | | USA1 | |
C.L.U.E. Inc | | Common Stock | | | USA2 | |
Charles Jones LLC | | Membership Interest | | | USA2 | |
De Pluimen LLC | | Membership Interest | | | USA3 | |
Derman, Inc | | Common Stock | | | USA4 | |
Diio LLC | | Membership Interest | | | USA5 | |
Dunlap-Hanna Publishers (50%) | | Partnership Interest | | | USA8 | |
Elsevier Inc | | Common Stock | | | USA3 | |
Elsevier Holdings Inc | | Common Stock | | | USA3 | |
Elsevier Medical Information LLC | | Membership Interest | | | USA3 | |
Elsevier STM Inc | | Common Stock | | | USA3 | |
Enclarity, Inc | | Common Stock | | | USA2 | |
ExitCare LLC | | Membership Interest | | | USA3 | |
Fire Solutions Inc | | Common and | | | USA4 | |
| | Preferred Stock | | | | |
Flightstats, Inc | | Common Stock | | | USA5 | |
Gaming Business Asia LLC (50%) | | Membership Interest | | | USA3 | |
Globalrange Corporation | | Common Stock | | | USA5 | |
Gold Standard, Inc | | Ordinary shares | | | USA3 | |
Health Market Science, Inc | | Common Stock | | | USA2 | |
IDG-RBI China Publishers LLC (50%) | | Membership Interest | | | USA3 | |
Informed Decisions, LLC | | Membership Interest | | | USA3 | |
Innovata, LLC | | Membership Interest | | | USA5 | |
Intelligize, Inc | | Common Stock | | | USA3 | |
Internet-Journals LLC | | Membership Interest | | | USA3 | |
J.Allan Sheehan Scholarship Fund Inc | | No Shares | | | USA3 | |
Knovel Corporation | | Common Stock | | | USA3 | |
Lex Machina Inc | | Common Stock | | | USA3 | |
LexisNexis Claims Solutions Inc | | Common Stock | | | USA2 | |
LexisNexis Coplogic Solutions Inc | | Common Stock | | | USA2 | |
LexisNexis of Puerto Rico Inc | | Common Stock | | | USA6 | |
LexisNexis Risk Assets Inc | | Common Stock | | | USA2 | |
LexisNexis Risk Data Management Inc | | Common Stock | | | USA2 | |
LexisNexis Risk Holdings Inc | | Common Stock | | | USA2 | |
LexisNexis Risk Solutions Bureau LLC | | Membership Interest | | | USA2 | |
LexisNexis Risk Solutions FL Inc | | Common Stock | | | USA2 | |
LexisNexis Risk Solutions Inc | | Common Stock | | | USA2 | |
LexisNexis Special Services Inc | | Common Stock | | | USA6 | |
LexisNexis VitalChek Network Inc | | Common Stock | | | USA2 | |
Managed Technology Services LLC (51%) | | Membership | | | USA9 | |
| | Interest | | | | |
Matthew Bender & Company, Inc. | | Common Stock | | | USA3 | |
MLex US, Inc (91%) | | Common Stock | | | USA3 | |
MWW Clinical Sales Force, Inc. (50%) | | Common Stock | | | USA3 | |
Nexis, Inc | | Common Stock | | | USA4 | |
PoliceReports.US, LLC | | Membership Interest | | | USA2 | |
Portfolio Media, Inc | | Common Stock | | | USA3 | |
Ravel Law Inc | | Common Stock | | | USA3 | |
Re (CMDGC) Inc | | Common Stock | | | USA3 | |
Reed Business Information Inc | | Common Stock | | | USA5 | |
Reed Technology and Information Services Inc. | | Common Stock | | | USA3 | |
Reed Westminster Cares Inc | | No Stock | | | USA4 | |
RELX Capital Inc | | Common Stock | | | USA4 | |
RELX Inc | | Common Stock | | | USA3 | |
RELX US Holdings Inc | | Common Stock | | | USA3 | |
Reman, Inc | | Common Stock | | | USA3 | |
REV IV Partnership LP | | No shares | | | USA4 | |
Ronald G. Segel Memorial Scholarship Fund Inc. | | No shares | | | USA3 | |
SAFI Americas LLC (50%) | | Membership Interest | | | USA3 | |
tClara LLC (51%) | | Membership Interest | | | USA4 | |
The Elsevier Foundation | | No Shares | | | USA3 | |
The Michie Company | | Common Stock | | | USA4 | |
The Reed Elsevier Ventures 2005 Partnership LP | | Partnership Interest | | | USA4 | |
The Reed Elsevier Ventures 2006 Partnership LP | | Partnership Interest | | | USA4 | |
The Reed Elsevier Ventures 2008 Partnership LP | | Partnership Interest | | | USA4 | |
The Reed Elsevier Ventures 2009 Partnership LP | | Partnership Interest | | | USA4 | |
The Reed Elsevier Ventures 2010 Partnership LP | | Partnership Interest | | | USA4 | |
The Reed Elsevier Ventures 2011 Partnership LP | | Partnership Interest | | | USA4 | |
The Reed Elsevier Ventures 2012 Partnership LP | | Partnership Interest | | | USA4 | |
The Reed Elsevier Ventures 2013 Partnership LP | | Partnership Interest | | | USA4 | |
The Remick Publishers (50%) | | Partnership Interest | | | USA8 | |
World Compliance, Inc | | Common Stock | | | USA4 | |
| | | | | | |
| Venezuela | | | | | | |
Encyclopédie Médico-Chirurgicale Venezuela C.A. | | Ordinary | | | VEN1 | |
| | |
| Financial statements and other information Notes to the consolidated financial statements | | 163 |
|
|
32 Related undertakings (continued)
| | |
Registered offices |
| Australia |
AUS1: | | Building B, Level 2, Unit 11, 1 Maitland Place, Baulkham Hills NSW 2153,Australia |
AUS2: | | Level 10, 10 Help Street, Chatswood NSW 2067, Australia |
AUS3: | | ‘Tower 2’ Level 10, 475 Victoria Avenue, Chatswood NSW 2067 |
AUS4: | | Grant Thornton, Level 17, 393 Kent St, Sydney, NSW 2000, Australia |
AUS5: | | KPMG, 147 Collins Street, Melbourne, Vic, 3000 |
AUS6: | | Fordham Business Advisors Pty Ltd, Rialto South Tower Level 35, 525 Collins Street, Melbourne, Vic, 3000 |
| Austria |
AUT1: | | Messeplatz 1, 1020, Wien, Austria |
AUT2: | | Marxergasse 25, 1030, Wien, Austria |
AUT3: | | Am Messezentrum 6, 5020, Salzburg, Austria |
| Belgium |
BEL1: | | Grotesteenweg-Zuid 39, 9052 Gent, Belgium |
BEL2: | | Leernseteenweg 128 Box E, 9800 Deinze, Belgium |
BEL3: | | 67 rue de la Loi, 1040 Etterbeek, Belgium |
| Brazil |
BRA1: | | Rua Sete de Setembro, nº 111, salas 601,1501/1502, 1601/1602, 1701/1702 e 802 – 8º Andar, Centro, cidade do Rio de Janeiro, estado do Rio de Janeiro, CEP20.050-006 |
BRA2: | | São Paulo, State of São Paulo, at Rua Bela Cintra, nº 1.200, 8th floor, CEP01415-002 |
BRA3: | | Rua Bela Cintra no. 1200, 10th floor, Sâo Paulo,01415-001, Brazil |
BRA4: | | Avenida paulista, 2300-Piso Pilotis room 28, Sao Paulo, Sao Paulo01310-300 |
| Canada |
CAN1: | | 123 Commerce Valley Drive East, Suite 700, Markham, Ontario, L3T 7W8, Canada |
CAN2: | | 905 King Street West, 4TH Floor, Toronto, Ontario, Canada M6K 3G9 |
CAN3: | | 555 RIichmond Street West, Toronto, Ontario, Canada, M5V 3B1 |
| Chile |
CHL1: | | Serrano 172, Santiago, Chile |
| China |
CHN1: | | Zhongkun Building, Room 612, Gaoliangqiaoxie Street, No. 59, Haidan District, Beijing, 100044, China |
CHN2: | | West Building of Administration Building, Xueyuan Road No. 38 Peking University Health Science Center, Haidan District, Beijing, 100191, China |
CHN3: | | Oriental Plaza, No. 1 East Chang An Ave, Tower W1, 7th Floor, Unit1-7, Dong Cheng District, Beijing, 100738, China |
CHN4: | | Ping An International Finance Center, Room 1504, 15th Floor, TowerA-101,3-24 floor, Xinyuan South Road, Chaoyang District, Beijing, 100027, China |
CHN5: | | 4/F Block C, No 999 Jingzhong Road, Changning District, Shanghai, China |
CHN6: | | 9/F, No 3 Zhongshan Er Road, Guangzhou, China |
CHN7: | | Unit 2480, Building 2, No. 7, Chuangxin Road, Science Park of Changping District, Beijing, China |
CHN8: | | Room 12B, 7th Floor, Oriental Plaza, 1 East Chang An Avenue, Beijing, China |
CHN9: | | 16 Donghuangchenggen North Street, Beijing, 100717, China |
CHN10: | | Room 5106, Raffle City, 268 Middle Xizang Road, Huangpu District, Shanghai, 200001, China |
CHN11: | | Room A 100 of Room 0307, Floor 3, Building 3, 7 Middle Dongsanhuan road, Chaoyang District, Beijing |
CHN12: | | Intercontinental Center, 42F, 100 Yutong Road, Zhabei District, Shanghai, 200070, China |
CHN13: | | World Expo Mansion, 14F,No. 04-05, No. 8 Business Out Ring Road, Zhengzou New District, Zhengzou, 450000, China |
CHN14: | | Shenzhen International Chamber of Commerce Tower, Room 1801-1802, 1805, Fuhua 3rd Road, Futian District, Shenzhen, 518048, China |
CHN15: | | Room 319, 238 Jiangchangsan Road, Jing’an District, Shanghai, China |
CHN16: | | Room702-2, 200 Huiyuan Road, Jiading Industrial Area, Shanghai |
CHN17: | | No 498, GouShouJing Road, Building 6 Unit12502-505, Shanghai, Pudong New District, 201203, China |
CHN18: | | Building 2, Room No. 3895, Changjiang Avenue, No. 161, Changliang Farm, Chongming County, Shanghai Municipality |
| Colombia |
COL1: | | Philippe Prietocarrizosa & Uria Abogados, Carrera 9No. 74-08 Oficina 105, Bogotá, d.c., 76600, Colombia |
| Denmark |
DNK1: | | Niels Jernes Vej 10, 9220, Aalborg Øst, Denmark |
| | |
Registered offices |
| Dubai, UAE |
UAE1: | | Office No. 328, Building 02, third floor, P.O. Box 502425, Dubai, United Arab Emirates |
UAE2: | | Al Sufouh Complex, Floor 3, No. 304, Dubai, United Arab Emirates |
| Egypt |
EGY1: | | Land Mark Office Building, 2nd Floor, 90th Street, City Center, 5th Settlement, New Cairo, Cairo, Egypt |
| France |
FRA1: | | 65, rue Camille Desmoulins, 92130, Issy les Moulineaux, France |
FRA2: | | Parc Euronord – 10, rue du Parc – 31150 Bruguieres |
FRA3: | | 247 rue de Bercy 75012 Paris |
FRA4: | | 141 rue de Javel, 75015 Paris |
FRA5: | | 52 Quai de Dion Bouton 92800 Puteaux |
FRA6: | | Immeuble « Technopolis », 350 rue Georges Besse –Nîmes (30000) |
FRA7: | | 27 quai Alphonse Le Gallo, 92100, Boulogne-Billancourt, France |
FRA8: | | 6-8 Rue Chaptal, 75009 Paris |
| Germany |
DEU1: | | Völklinger Strasse 4, 40219, Düsseldorf, Germany |
DEU3: | | Theodor-Heuss-Allee 108,D-60488, Frankfurt am Main, Hesse, Germany |
DEU4: | | Hackerbrücke 6, 80335, Munich, Germany |
DEU5: | | Heerdter Sandberg 30, 40549, Düsseldorf, Germany |
DEU6: | | Schwannstr. 6, 40476 Düsseldorf |
DEU7: | | Steinhäuserstrasse 9, 76135, Karlsruhe, Germany |
| Hong Kong |
HNK1: | | 20/F Alexandra House, 18 Chater Road, Central, Hong Kong |
HNK2: | | Level 28, Building 8, 3 Pacific Place, 1 Queens Road East, HONG KONG, Hong Kong |
HNK3: | | Unit 204 2/F, Malaysia Bldg., 50 Gloucester Rd, Wanchai, Hong Kong |
HNK4: | | Level 54 Hopewell Center, 183 Queens Road East (Tricor Office), Hong Kong |
HNK5: | | Flat 2, 19/F Henan Building90-92, Jaffe Road Wanchai, Hong Kong, Hong Kong |
HNK6: | | 703 Silvercord, Tower 2, 30 Canton Road, Tsimshatsui, Kowloon, Hong Kong |
HNK7: | | 3901, 39th Floor Hopewell Center, 183 Queens Road East, Wanchai, Hong Kong, Hong Kong |
| India |
IND1: | | 818, 8th Floor, Indraprakash Builing, 21 Barakhamba Road, New Delhi, 110001, India |
IND2: | | B9/5 Vasant Vihar, New Delhi, 110057, India |
IND3: | | n°664 Level 6 – Chennai Regus – Citi Centre – 10/11 Dr Radhakrishnan Salai, Mylapore – Chennai 600004 |
IND4: | | 18, Kotla Lane, Rouse Avenue, New Delhi, 110002, India |
IND5: | | B-15/192, Pharma Apartments, Patparganj, I.P. Extension, New Delhi, 110092, India |
IND6: | | B-9, “A” Block, LSC, Naraina Vihar, Ring Road, New Delhi, 110028, India |
IND7: | | #25, 3rd floor, 8th Main Road, Vasanthnager, Bangalore, 560052, India |
| Indonesia |
IDN1: | | Panorama Building, 5th Floor, Jalan Tomang Raya No. 63, Jakarta, 11440, Indonesia |
| Ireland |
IRL1: | | 80 Harcourt Street, Dublin 2, Ireland |
IRL2: | | Arthur Cox Building, Earlsfort Terrace, Dublin 2, Ireland |
IRL3: | | (A&L Goodbody Secretarial Services), 25/28 North Wall Quay, Dublin 1, D01 H104, Ireland |
IRL4: | | Suite 4320, Atlantic Avenue, Westpark Business Campus, Shannon, Clare, Ireland |
| Israel |
ISR1: | | Meitar, attorneys at Law, 16 Abba Hillel Road, Ramat Gan, 5250608, Israel |
| Italy |
ITA1: | | Via Marostica 1, 20146, Milan, Italy |
ITA2: | | Studio Colombo e Associati, Via Cino del Duca 5, 20122, Milano, Italy |
ITA3: | | Milano (MI) Via Marostica 1 cap 20146 |
| Japan |
JPN1: | | Kyodo Tsushin Kaikam 2F,2-2-5 Toronomon, Minato-ku, Tokyo,105-0001 |
JPN2: | | Ark Mori Building,1-12-32 Akasaka, Minato-ku, Tokyo,107-6029, Japan |
JPN3: | | 1-9-15, Higashi Azabu, Minato-ku Tokyo Japan |
JPN4: | | Shinjuku-Nomura Bldg.,1-26-2 Nishi-shinjuku, Shinjuku-ku, Tokyo, Japan |
JPN5: | | 13-12 Rokubancho, Chiyoda-ku, Tokyo, Japan |
| | |
| 164 | | RELX Group Annual reports and financial statements 2017 |
|
|
Notes to the consolidated financial statements
for the year ended 31 December 2017
32 Related undertakings (continued)
| | |
Registered offices |
| Korea (South) |
KOR1: | | Chunwoo Building, 4th floor, 534 Itaewon-dong,Yongsan-gu, Seoel,140-861, Korea, Republic of |
KOR2: | | 206 Noksapyeong-daero,Yongsan-gu, Seoel, Korea, Republic of |
KOR3: | | “Room 4401, Trade Tower,159-1, Samseong-dong,Gangnam-gu Seoul,135-729, Republic of Korea” |
KOR4: | | 1324 Block A Tera Tower II, 201, Songpa-daero,Songpa-gu, Seoul, 05854 |
| Luxembourg |
LUX1: | | Bloc B19-21, Route d’Arlon,L-8009 Strassen, Luxembourg |
| Malaysia |
MYS1: | | 6th Floor, Akademi Etiqa, No. 23 Jalan Melaka, 50100 Kuala Lumpur, Malaysia |
| Mexico |
MEX1: | | Insurgentes Sur # 1388 Piso 8, Col. Actipan, Deleg. Benito Juarez, C.P. 03230 Ciudad de México, México |
MEX2: | | Av. Insurgentes No. 1388, Piso 8, Col. Actipan, 03230 Mexico, Mexico |
| Morocco |
MAR1: | | Forum Bab Abdelaziz au 62, Angle Blvd. d’Anfa, 6ème étage, Apt 61, Casablanca, Morocco |
| New Zealand |
NZL1: | | Level 1, 138 The Terrace, P.O. Box 472, Wellington 6011, New Zealand |
| Philippines |
PHL1: | | Building H, 2nd Floor, U.P. Ayalaland TechnoHub, Commonwealth Avenue, Quezon City, Metro Manila, 1101, Philippines |
| Poland |
POL1: | | Natpoll Building, ul. Migdalowa 4/59,02-796, Warsaw, Poland |
| Russia |
RUS1: | | Pokrovka Street 27, Building 1, Moscow, Russian Federation |
RUS2: | | 24 Bolshaya Nikitskaya Str., bldg. 5, Moscow 125009, Russian Federation |
RUS3: | | Petrozavodskaya street 28/4, Building VI, room 2, 125475, Moscow, Russian Federation |
| Saudi Arabia |
SAU1: | | Al Fadl Commercial Center, Jeddah, 21411, Saudi Arabia |
| Singapore |
SGP1: | | 3 Killiney Road,#08-01 Winsland House 1, Singapore, 239119, Singapore |
SGP2: | | 16 Raffles Quay,#33-03 Hong Leong Building, Singapore, 048581, Singapore |
SGP3: | | 80 Robinson Road,#02-00, Singapore, 068898, Singapore |
SGP4: | | 1 Changi Business Park Crescent,#06-01 Plaza 8 & CBP, Singapore, 48602551, Singapore |
| South Africa |
ZAF1: | | Regus Brooklyn Bridge, 3rd Floor Steven House, Brooklyn Bridge Office Park, Fehrsen Street, Brooklyn, Pretoria |
ZAF2: | | Fourways Gold Park, 1st Floor – Wentworth Building, 32 Roos Street, Fourways, 2191, South Africa |
ZAF3: | | 215 Peter Mokaba Road (North Ridge Road), Morningside, Durban, Kwa-Zulu Natal, 4001, South Africa |
ZAF4: | | Thebe House, 2nd Floor, 166 Jan Smuts Avenue, Rosebank, Johannesburg, 2196, South Africa |
| Spain |
ESP1: | | C/ Josep Tarradellas20-30, 1º / 20029, Barcelona, Spain |
ESP2: | | Calle Zancoeta 0009, 48013, Bilbao, Viscaya, Spain |
| Switzerland |
CHE1: | | Espace de L’Europe 3, 2002 Neuchatel, Switzerland |
CHE2: | | Bahnhofstrasse 100 – 8001 Zurich |
| Taiwan |
TWN1: | | SuiteN-818, 8/F, Chia Hsin Cement Building, 96 Zhong Shan North Road, Section 2, Taipei, 10449, Taiwan |
| | |
Registered offices |
| Thailand |
THA1: | | Sathorn Nakorn Building, Floor 32,No. 100/68-69 North Sathon Road, Silom, Bangrak, Bangkok, 10500, Thailand |
THA2: | | 540 Mercury Tower, 22nd Floor, Ploenchit Road, Lumpini, Pathumwan, Bangkok 10330 |
| The Netherlands |
NLD1: | | Radarweg 29, 1043 NX Amsterdam, Netherlands |
NLD2: | | Galileiweg 8, 2333 BD Leiden, Netherlands |
| Turkey |
TUR1: | | Maslak Mah. Bilim Sokak Sun Plaza Kat:13Şişli-Maslak, Istanbul, Turkey |
TUR2: | | Tüyap Fuar ve Kongre Merkezi, E – 5 Karayolu Üzeri, Gürpınar Kavşağı 34500, Büyükçekmece, Istanbul, 34500, Turkey |
| United Kingdom |
GBR1: | | 1-3 Strand, London, WC2N 5JR, United Kingdom |
GBR2: | | Quadrant House, The Quadrant, Sutton, Surrey, SM2 5AS, United Kingdom |
GBR3: | | AG Gateway Global Network, 85 Great Portland Street, First Floor, London, W1W 7LT, United Kingdom |
GBR4: | | Gateway House 28 The Quadrant, Richmond, Surrey, TW9 1DN, United Kingdom |
GBR5: | | Lexis House, 30 Farringdon Street, London, EC4A 4HH, United Kingdom |
GBR6: | | Global Reach, Dunleavy Drive, Cardiff, CF11 0SN, United Kingdom |
GBR7: | | The Eye, 1 Procter Street, London, WC1V 6EU, United Kingdom |
GBR8: | | The Boulevard, Langford Lane, Kidlington, Oxford, OX5 1GB, United Kingdom |
GBR9: | | c/o RELX (UK) Limited, Butterworths Limited, 4 Hill Street, Edinburgh, EH2 3JZ, Scotland |
GBR10: | | 35 – 37 St. Marys Gate, Nottingham, United Kingdom, NG1 1PU |
GBR11: | | 1st Floor 80 Moorbridge Road, Maidenhead, Berkshire, London, SL8 8BW, United Kingdom |
GBR12: | | 40 Kimbolton Road, Bedford, England, MK40 2NR |
GBR13: | | 1000 Lakeside, Western Road, Portsmouth, PO6 3EN, United Kingdom |
| US |
USA1: | | 1007 Church Street, Evanston IL 60201 |
USA2: | | 1000 Alderman Dr., Alpharetta, GA 30005 |
USA3: | | 230 Park Ave, New York, NY 10169 |
USA4: | | 1105 North Market St, Wilmington, DE 19801 |
USA5: | | 3355 West Alabama Street, Houston, TX 77098 |
USA6: | | Puerta Del Condado #1095, Wilson Ave, Local #3, San Juan, PR 00907 |
USA7: | | N909 N. Sepulveda Blvd., 11th Floor, El Segundo, CA 90245 |
USA8: | | 313 Washington Street, Suite 400, Newton, MA 02458 |
USA9: | | 1209 Orange Street, Wilmington, DE 19801 |
| Venezuela |
VEN1: | | Avenida Banca, Torre BOD, Piso 21, La Castellana, Estado Miranda, Caracas, Venezuela |
| | |
| Financial statements and other information Notes to the consolidated financial statements | | 165 |
|
|
5 year summary
| | | | | | | | | | | | | | | | | | | | | | | | |
| | | | | | | | | | | | | | | Restated(3) | |
| | | Note | | | 2017 £m | | | 2016 £m | | | 2015 £m | | | 2014 £m | | | 2013 £m | |
RELX Group consolidated financial information | | | | | | | | | | | | | | | | | | | | | | | | |
Revenue | | | | | | | 7,355 | | | | 6,895 | | | | 5,971 | | | | 5,773 | | | | 6,035 | |
Reported operating profit | | | | | | | 1,905 | | | | 1,708 | | | | 1,497 | | | | 1,402 | | | | 1,376 | |
Adjusted operating profit | | | 1 | | | | 2,284 | | | | 2,114 | | | | 1,822 | | | | 1,739 | | | | 1,749 | |
Reported net profit attributable to shareholders | | | | | | | 1,659 | | | | 1,161 | | | | 1,008 | | | | 955 | | | | 1,110 | |
Adjusted net profit attributable to shareholders | | | 1 | | | | 1,635 | | | | 1,488 | | | | 1,275 | | | | 1,213 | | | | 1,197 | |
RELX PLC financial information | | | | | | | | | | | | | | | | | | | | | | | | |
Reported earnings per ordinary share (pence) | | | | | | | 82.2p | | | | 56.3p | | | | 46.4p | | | | 43.0p | | | | 49.0p | |
Adjusted earnings per ordinary share (pence) | | | | | | | 81.0p | | | | 72.2p | | | | 60.5p | | | | 56.3p | | | | 54.1p | |
Dividend per ordinary share (pence) | | | 2 | | | | 39.4p | | | | 35.95p | | | | 29.7p | | | | 26.0p | | | | 24.6p | |
RELX NV financial information(3) | | | | | | | | | | | | | | | | | | | | | | | | |
Reported earnings per ordinary share (pence) | | | | | | | 82.2p | | | | 56.3p | | | | 49.4p | | | | 45.8p | | | | 51.6p | |
Reported earnings per ordinary share (euro) | | | | | | € | 0.936 | | | € | 0.687 | | | € | 0.682 | | | € | 0.568 | | | € | 0.609 | |
Adjusted earnings per ordinary share (euro) | | | | | | € | 0.923 | | | € | 0.880 | | | € | 0.835 | | | € | 0.698 | | | € | 0.638 | |
Dividend per ordinary share (euro) | | | 2 | | | € | 0.448 | | | € | 0.423 | | | € | 0.403 | | | € | 0.383 | | | € | 0.329 | |
| (1) | Adjusted figures are presented as additional performance measures used by management. A reconciliation of the adjusted measures to the comparable GAAP measures can be found on page 186. Adjusted measures are stated before amortisation and impairment of acquired intangible assets and goodwill, the net financing cost on defined benefit pension schemes and acquisition- related costs, exceptional tax credits (in 2017, resulting from the US Tax Cuts and Jobs Act), and in respect of attributable net profit, reflect a tax rate that excludes the effect of movements in deferred taxation assets and liabilities that are not expected to crystallise in the near term and includes the benefit of tax amortisation where available on acquired goodwill and intangible assets. Acquisition-related financing costs and profit and loss from disposal gains and losses and othernon-operating items are also excluded from the adjusted figures. |
| (2) | Dividend per ordinary share is based on the interim dividend and proposed final dividend for the relevant year. |
| (3) | RELX NV amounts and dividend per share reflect the bonus share issue declared on 30 June 2015. |
| | |
| 166 | | RELX Group Annual reports and financial statements 2017 |
|
|

| | |
| Financial statements and other financial information | | 167 |
|
|

| | | | |
RELX PLC Annual Report and Financial Statements | | |
In this section | |
| | |
| 168 | | RELX Group Annual reports and financial statements 2017 |
|
|
Directors’ Report
The Directors present their report, together with the financial statements of the Group and RELX PLC (the Company), for the year ended 31 December 2017.
RELX PLC is incorporated as a public limited company and is registered in England and Wales with registered number 77536. RELX PLC’s registered office is 1-3 Strand, London, WC2N 5JR.
Corporate structure
RELX PLC and RELX NV are separate, publicly-listed holding companies. RELX PLC’s ordinary shares are traded on the London and New York stock exchanges, and RELX NV’s ordinary shares are traded on the Amsterdam and New York stock exchanges. RELX PLC and RELX NV have equal voting rights in RELX Group plc, which holds all of RELX Group’s operating businesses, subsidiaries and financing activities. RELX PLC, RELX NV, RELX Group plc and its subsidiaries, joint ventures and associates are together known as ‘RELX Group’ or ‘the Group’.
Financial statement presentation
Under the Governing Agreement between RELX PLC and RELX NV, one RELX PLC ordinary share confers an equivalent economic interest to one RELX NV ordinary share. Therefore, all shareholders can be regarded as having interests in a single economic entity. Accordingly, the Group forms a single reporting entity for the presentation of consolidated financial statements. The Group consolidated financial statements represent the interests of both sets of shareholders and are presented by both RELX PLC and RELX NV as their respective consolidated financial statements. This Directors’ Report and the financial statements of the Group and Company should be read in conjunction with the other reports set out on pages 2 to 104. A review of the Group’s performance during the year is set out on pages 8 to 52, the principal risks facing the Group are set out on pages 60 to 63, and the Group statement on corporate responsibility is set out on pages 42 to 52.
The shares of RELX PLC and RELX NV are regarded as two separate classes of share which together form the consolidated issued share capital of the Group. In calculating the earnings per share of the Group, the earnings for each company are calculated on a fully distributed basis. The Group’s usual practice is for only a portion of earnings to be distributed by way of dividends. Dividends paid to RELX PLC and RELX NV shareholders are, other than in special circumstances, equalised at a gross level and reported earnings per share have the same value for each RELX PLC and RELX NV share.
In addition to the reported figures, adjusted figures are presented as additional performance measures used by management to assess the performance of the business. These exclude the Group’s share of amortisation of acquired intangible assets, acquisition-related costs, tax in joint ventures, disposal gains and losses and other non-operating items, related tax effects, and movements in deferred taxation assets and liabilities related to acquired intangible assets, and include the benefit of tax amortisation where available on acquired goodwill and intangible assets. In 2017, the exceptional tax credit arising as a result of the US Tax Cuts and Jobs Act has been excluded from our adjusted measures.
Company financial statements
The individual company financial statements of the Company are presented on page 172, and were prepared under Financial Reporting Standard 101 (FRS 101).
Distributable reserves as at 31 December 2017 were £1,518m (2016: £1,472m), comprising reserves less shares held in treasury.
Parent company shareholders’ funds as at 31 December 2017 were £3,174m (2016: £3,112m).
Strategic Report
The Companies Act 2006 requires the Company to present a fair review of the Group during the financial year. The Strategic Report, which includes a review of the Group’s business areas, a financial review, the principal risks facing the Group, any important events affecting the Group since 31 December 2017, and the likely future developments in the Group’s business, is set out on pages 2 to 63 which are incorporated into this Directors’ Report by reference. The Directors’ Report, inclusive of the Strategic Report incorporated therein, forms the management report for the purposes of the Financial Conduct Authority’s Disclosure and Transparency Rule 4.1.8R.
Dividends
The Board is recommending a final dividend of 27.7p (2016: 25.7p) per ordinary share to be paid on 22 May 2018 to shareholders appearing on the Register at the close of business on 27 April 2018. Payment of this final dividend remains subject to the approval of the Company’s shareholders at its 2018 Annual General Meeting (AGM). Together with the interim dividend of 11.7p (2016: 10.25p) per ordinary share, paid in August 2017, the total ordinary dividends for the year will be 39.4p (2016: 35.95p).
Details of dividend cover and dividend policy are set out on page 58.
Corporate Governance
The Company has complied throughout the year with the provisions of the UK Corporate Governance Code 2016 (the UK Code), which is publicly available on the Financial Reporting Council website (www.frc.org.uk). Details of how the main principles of the UK Code have been applied and the Directors’ statement on internal control are set out in the Corporate Governance report on pages 72 to 80, which are incorporated into this Directors’ Report by reference.
Greenhouse gas emissions
The Company is required to state the annual quantity of emissions in tonnes of carbon dioxide equivalent from Group operational activities. Details of our emissions during the year ended 31 December 2017 and the actions being taken to reduce them are set out in the Corporate Responsibility section of the Strategic Report on pages 51 and 52, which are incorporated into the Directors’ Report by reference. Further details can be found in our online Corporate Responsibility Report at www.relx.com/go/CRReport.
Directors
The names of the Directors who served on the Board during the year, and changes to the Board, are set out on pages 66, 67, 76 and 77, which are incorporated into this Directors’ Report by reference.
| | |
| Financial statements and other information Directors’ Report | | 169 |
|
|
Share capital
The Company’s issued share capital comprises a single class of ordinary shares, all of which are listed on the London and New York stock exchanges. All issued shares are fully paid up and carry no additional obligations or special rights. Each share carries the right to one vote at general meetings of the Company.
In a general meeting, subject to any rights and restrictions attached to any shares, on a show of hands every member who is present in person shall have one vote and every proxy present who has been duly appointed by one or more members entitled to vote on the resolution has one vote (although a proxy has one vote for and one vote against the resolution if: (i) the proxy has been duly appointed by more than one member entitled to vote on the resolution; and (ii) the proxy has been instructed by one or more of those members to vote for the resolution and by one or more other of those members to vote against it). Subject to any rights or restrictions attached to any shares, on a vote on a resolution on a poll every member present in person or by proxy shall have one vote for every share of which he/ she is the holder.
Proxy appointments and voting instructions must be received by the registrars not less than 48 hours before a general meeting. There are no specific restrictions on the size of a holding nor on the transfer of shares, which are both governed by the general provisions of the Articles and prevailing legislation. The Company is not aware of any agreements between shareholders that may result in restrictions on the transfer of shares or on voting rights attached to the shares.
At the 2017 AGM, shareholders passed a resolution authorising the Directors to issue shares for cash on anon-pre-emptive basis up to a nominal value of £8.2m, representing less than 5% of the Company’s issued share capital, and authorising the Directors to issue up to an additional 5% of the issued share capital for cash ona non-pre-emptive basis in connection with an acquisition or specified investment. Since the 2017 AGM, no shares have been issued under this authority. The shareholder authority also permitted the Directors to issue shares in order to satisfy entitlements under employee share plans, and details of such allotments are noted below. The authorities to issue shares will expire at the 2018 AGM. Two separate resolutions to extend the authorities will be proposed at the 2018 AGM: (i) to authorise the Directors to issue shares for cash on anon-pre-emptive basis up to 5% of the issued share capital and to satisfy entitlements under employee share plans; and (ii) to authorise the Directors to issue up to 5% of the issued share capital for cash on anon-pre-emptive basis in connection with an acquisition or specified investment subject to certain conditions in accordance with thePre-Emption Group’s Statement of Principles.
During the year, 2,019,483 ordinary shares in the Company were issued in order to satisfy entitlements under employee share plans as follows: 717,932 under a UK Sharesave option scheme at prices between 410.80p and 1251.20p per share; and 1,301,551 under executive share option schemes at prices between 466.50p and 1494.50p per share.
The issued share capital as at 31 December 2017 is shown in note 26 to the consolidated financial statements.
Authority to purchase shares
At the 2017 AGM, shareholders passed a resolution authorising the purchase of up to 114.4m ordinary shares in the Company (representing less than 10% of the issued ordinary shares) by market purchase. During the year, 23,122,499 ordinary shares with a nominal value of 1451/116p (representing 2.0% of the ordinary shares in issue on 31 December 2017) were purchased under this and the previous authority, for a total consideration of £371m, including expenses, and subsequently transferred to be held in treasury. The purpose of the share buyback is to reduce the capital of the Company.
On 27 December 2017, the Company cancelled 22.46m ordinary shares held in treasury. Therefore, as at 31 December 2017 there were 60,077,786 ordinary shares held in treasury, representing 5.3% of the issued ordinary shares. A further 3,304,631 ordinary shares were purchased between 2 January 2018 and the date of this report. The authority to make market purchases will expire at the 2018 AGM, at which a resolution to further extend the authority will be submitted to shareholders.
Substantial share interests
As at 31 December 2017, the Company had been notified by the following shareholders that they held an interest of 3% or more in voting rights of its issued share capital pursuant to Rule 5 of the Disclosure and Transparency Rules (DTR):
| | | | |
| Notifications received as at 31 December 2017 | | % of voting rights | |
| |
◾ BlackRock Inc | | | 9.62% | |
| |
◾ Invesco Limited | | | 5.03% | |
| |
◾ Legal & General Group plc | | | 3.40% | |
The percentage interests stated above are as disclosed at the date on which the interests were notified to the Company.
Between 31 December 2017 and 14 February 2018, the Company did not receive any notifications under DTR 5.
Employee Benefit Trust
The trustee of the Employee Benefit Trust held an interest in 3,493,817 ordinary shares in the Company (representing 0.3% of the issued ordinary shares) as at 31 December 2017. The trustee may vote or abstain from voting any shares it holds in any way it sees fit.
Significant agreements – change of control
The Governing Agreement between RELX PLC and RELX NV states that, upon a change of control of RELX PLC (for these purposes, the acquisition by a third party of 50% or more of the issued share capital having voting rights), should there not be a comparable offer from the offeror for RELX NV, RELX NV may serve notice upon the Company varying certain provisions of the Governing Agreement, including the governance and the standstill provisions.
There are a number of borrowing agreements including credit facilities that, in the event of a change of control of both the Company and RELX NV and, in some cases, a consequential credit rating downgrade tosub-investment grade may, at the option of the lenders, require repayment and/or cancellation as appropriate.
Articles
The Company’s Articles of Association, which were not amended during the year, may only be amended by a special resolution of shareholders passed at a general meeting of the Company.
| | |
| 170 | | RELX Group Annual reports and financial statements 2017 |
|
|
Appointment and replacement of Directors
The appointment,re-appointment and replacement of Directors is governed by the Company’s Articles, the Governing Agreement between RELX PLC and RELX NV, the Companies Act 2006 and related legislation. RELX PLC shareholders maintain their right to appoint andre-appoint Directors by way of an ordinary resolution in accordance with the Articles. However, no individual may be appointed to the Board unless recommended by the joint Nominations Committee of RELX PLC and RELX NV. Subject to this restriction, the Directors may appoint additional or replacement Directors, who may only serve until the following AGM of the Company, at which time they must retire and, if appropriate, seek election by the Company’s shareholders. A Director may be removed from office by the Company as provided for by applicable law, in certain circumstances set out in the Company’s Articles, and at a general meeting of the Company by the passing of an ordinary resolution.
The Articles provide for a Board of Directors consisting of not fewer than two, but not more than 20 Directors, who manage the business and affairs of the Company.
Powers of Directors
Subject to the provisions of the Companies Act 2006, the Company’s Articles and any directions given by special resolutions, the business of the Company shall be managed by the Board which may exercise all the powers of the Company.
Directors’ indemnity
In accordance with its Articles, the Company has granted Directors an indemnity, to the extent permitted by law, in respect of liabilities incurred as a result of their office. This indemnity was in place for Directors that served at any time during the 2017 financial year, and also for each serving Director as at the date of approval of this report. The Company also purchased and maintained throughout the year Directors’ and Officers’ liability insurance in respect of itself and its Directors.
Related party transactions
Internal controls are in place to ensure that any related party transactions involving Directors or their connected persons are carried out on anarm’s-length basis and are properly recorded and disclosed where appropriate.
Conflicts of interest
Under the Companies Act 2006, the Directors have a duty to avoid situations in which they have, or could have, a direct or indirect interest that conflicts with the interests of the Company. The Board has established formal procedures for identifying, assessing and reviewing any situations where a Director has an interest that conflicts, or may possibly conflict, with the interests of the Company.
The Nominations Committee considers any such conflict or potential conflict and makes a recommendation to the Board on whether to authorise it, as permitted under the Company’s Articles. In reaching its decision, the Board is required to act in a way it considers would be most likely to promote the success of the Company and may impose limits or conditions when giving its authorisation, if it thinks this is appropriate. Actual or potential conflicts of interest are reviewed annually by the Nominations Committee.
Financial Instruments
The Group’s financial risk management objectives and policies, including hedging activities and exposure to risks, are described in note 19 to the consolidated financial statements on pages 147 to 152.
Political donations
The Group does not make donations to European Union (EU) political organisations or incur EU political expenditure. In the US, Group companies donated £62,791 (2016: £74,264) to political organisations. In line with US law, these donations were not made at federal level, but only to candidates and political parties at the state and local levels.
Employee relations
The Group is committed to employee involvement and participation. Where appropriate, major announcements are communicated to employees through internal briefings. Information on performance, development, organisational changes and other matters of interest is communicated through briefings and electronic bulletins. The Company is an equal opportunity employer and does not discriminate on the grounds of race, gender or other characteristics in its recruitment or employment policies. The Group seeks opinions from employees through a triennial survey. The last employee survey was carried out in 2015. Certain employees throughout the Group are eligible to participate in the Group’s share incentive plans.
Disabled persons
RELX Group has a positive approach to diversity and inclusion. Details of the Group’s Diversity and Inclusion Statement are set out on page 46, which is incorporated into this Directors’ Report by reference. The Group is committed to the full and fair treatment of people with disabilities in relation to job applications, training, promotion and career development. Where existing employees become disabled, our policy is to provide continuing employment, support and training wherever practicable.
Disclosures required under UK Listing Rule 9.8.4
The information required by Listing Rule 9.8.4 is set out on the pages below:
| | |
| | |
| Information required | | Page |
| |
(1) Interest capitalised by the Group | | n/a |
| |
(2) Publication of unaudited financial information | | n/a |
| |
(4) Long-term incentive schemes | | n/a |
| |
(5) Waiver of emoluments by a director | | n/a |
| |
(6) Waiver of future emoluments by a director | | n/a |
| |
(7) Nonpro-rata allotments for cash (issuer) | | n/a |
| |
(8) Nonpro-rata allotments for cash (major subsidiaries) | | n/a |
| |
(9) Parent participation in a placing by a listed subsidiary | | n/a |
| |
(10) Contracts of significance | | n/a |
| |
(11) Provision of services by a controlling shareholder | | n/a |
| |
(12) Shareholder waiver of dividends | | 141 |
| |
(13) Shareholder waiver of future dividends | | 141 |
| |
(14) Agreements with controlling shareholders | | n/a |
| | |
| Financial statements and other information Directors’ Report | | 171 |
|
|
Financial statements and accounting records
The Directors are responsible for preparing the Directors’ Report and the financial statements in accordance with applicable law and regulations.
Company law requires the Directors to prepare financial statements for each financial year. Under that law the Directors are required to prepare the consolidated financial statements in accordance with International Financial Reporting Standards (IFRS) as adopted by the EU and Article 4 of the IAS Regulation. The Directors have elected to prepare the individual company financial statements in accordance with Financial Reporting Standard 101Reduced Disclosure Framework. Under company law the Directors must not approve the accounts unless they are satisfied that they give a true and fair view of the state of affairs of the Company and of the profit or loss of the Company for that period.
In preparing the individual company financial statements, the Directors are required to: select suitable accounting policies and then apply them consistently; make judgements and accounting estimates that are reasonable and prudent; state whether Financial Reporting Standard 101Reduced Disclosure Framework has been followed, subject to any material departures being disclosed and explained in the financial statements; and prepare the financial statements on a going concern basis unless it is inappropriate to presume that the Company will continue in business.
In preparing the Group financial statements, IAS1 requires that Directors: properly select and apply accounting policies; present information, including accounting policies, in a manner that provides relevant, reliable, comparable and understandable information; provide additional disclosures when compliance with the specific requirements of IFRS are insufficient to enable users to understand the impact of particular transactions, other events and conditions on the entity’s financial position and financial performance; and make an assessment of the company’s ability to continue as a going concern.
The Directors are responsible for keeping adequate accounting records that are sufficient to show and explain the Company’s transactions and disclose with reasonable accuracy at any time the financial position of the Company and enable them to ensure that the financial statements comply with the Companies Act 2006. They are also responsible for safeguarding the assets of the Company and hence for taking reasonable steps for the prevention and detection of fraud and other irregularities.
Directors’ responsibility statement
Each of the Directors, whose names and roles can be found on pages 66 to 67, confirms that, to the best of their knowledge:
| ◾ | | the consolidated financial statements, prepared in accordance with International Financial Reporting Standards as issued by the International Accounting Standards Board and as adopted by the European Union, give a true and fair view of the assets, liabilities, financial position and profit or loss of the Group; |
| ◾ | | the individual company financial statements, prepared in accordance with Financial Reporting Standard 101 ‘Reduced Disclosure Framework’ (FRS 101), give a true and fair view of the assets, liabilities, financial position and profit or loss of the Company; and |
| ◾ | | the Directors’ Report includes a fair review of the development and performance of the business and the position of the Group, together with a description of the principal risks and uncertainties that it faces. |
Having taken into account all the matters considered by the Board and brought to the attention of the Board during the year, the Directors are satisfied that the Annual Report and Accounts, taken as a whole, is fair, balanced and understandable and provides the information necessary for shareholders to assess the Company’s position and performance, business model and strategy.
Neither the Company nor the Directors accept any liability to any person in relation to the Annual Report except to the extent that such liability could arise under English law. Accordingly, any liability to a person who has demonstrated reliance on any untrue or misleading statement or omission shall be determined in accordance with Section 90A of the Financial Services and Markets Act 2000.
Disclosure of information to auditors
In accordance with Section 418 of the Companies Act 2006, each Director in office at the date the Directors’ Report is approved, confirms that:
| ◾ | | so far as the Director is aware, there is no relevant audit information of which the Company’s auditors are unaware; and |
| ◾ | | he/she has taken all the steps that he/she ought to have taken as a Director to make himself/herself aware of any relevant audit information and to establish that the Company’s auditors are aware of that information. |
Going concern
The Directors’ statement regarding the appropriateness of adopting the going concern basis of accounting is set out on page 79, which is incorporated into this Directors’ Report by reference.
Long-term viability statement
The Directors’ statement regarding the long-term viability of the Group is set out on page 80, which is incorporated into this Directors’ Report by reference.
Auditors
Resolutions for there-appointment of Ernst & Young LLP as auditors of the Company and to authorise the Audit Committee, on behalf of the Board, to determine their remuneration will be submitted to shareholders at the 2018 AGM.
By order of the Board
Henry Udow
Company Secretary
14 February 2018
Registered Office
1-3 Strand
London
WC2N 5JR
| | |
| 172 | | RELX Group Annual reports and financial statements 2017 |
|
|
RELX PLC statement of financial position
| | | | | | | | | | | | |
| AS AT 31 DECEMBER | | Note | | | 2017
£m | | | 2016
£m | |
Non-current assets | | | | | | | | | | | | |
Investments in subsidiary undertakings | | | 1 | | | | – | | | | 77 | |
Investments in joint ventures | | | 1 | | | | 3,027 | | | | 3,025 | |
| | | | | | | | 3,027 | | | | 3,102 | |
Current assets | | | | | | | | | | | | |
Receivables: amounts due from joint ventures | | | 2 | | | | 205 | | | | 68 | |
| | | | | | | | 205 | | | | 68 | |
Total assets | | | | | | | 3,232 | | | | 3,170 | |
| | | |
Current liabilities | | | | | | | | | | | | |
Taxation | | | | | | | 2 | | | | 3 | |
Other payables | | | | | | | 56 | | | | 55 | |
| | | | | | | | 58 | | | | 58 | |
Net assets | | | | | | | 3,174 | | | | 3,112 | |
| | | |
Capital and reserves | | | | | | | | | | | | |
Share capital | | | | | | | 162 | | | | 165 | |
Share premium | | | | | | | 1,309 | | | | 1,295 | |
Shares held in treasury | | | | | | | (753 | ) | | | (645 | ) |
Capital redemption reserve | | | | | | | 25 | | | | 22 | |
Other reserves | | | | | | | 160 | | | | 158 | |
Net profit | | | | | | | 817 | | | | 717 | |
Reserves | | | | | | | 1,454 | | | | 1,400 | |
Shareholders’ equity | | | | | | | 3,174 | | | | 3,112 | |
The RELX PLC company financial statements were approved by the Board of Directors and authorised for issue on 14 February 2018. They were signed on its behalf by:
| | |
| A J Habgood | | N L Luff |
| Chairman | | Chief Financial Officer |
| | |
| Financial statements and other information RELX PLC financial statements | | 173 |
|
|
RELX PLC statement of changes in equity
| | | | | | | | | | | | | | | | | | | | | | | | | | | | | | | | |
| | |
| Share
capital
£m |
| |
| Share
premium
£m |
| |
| Shares
held in
treasury
£m |
| |
| Capital
redemption
reserve£m |
(1) | |
| Other
reserves£m |
(2) | |
| Net
profit
£m |
| |
| Reserves
£m | (3)
| |
| Total
£m |
|
Balance at 1 January 2016 | | | 170 | | | | 1,284 | | | | (604 | ) | | | 17 | | | | 156 | | | | 665 | | | | 1,426 | | | | 3,114 | |
Total comprehensive income for the year | | | – | | | | – | | | | – | | | | – | | | | – | | | | 717 | | | | – | | | | 717 | |
Dividends paid(4) | | | – | | | | – | | | | – | | | | – | | | | – | | | | – | | | | (356 | ) | | | (356 | ) |
Repurchase of ordinary shares | | | – | | | | – | | | | (376 | ) | | | – | | | | – | | | | – | | | | – | | | | (376 | ) |
Cancellation of shares | | | (5 | ) | | | – | | | | 335 | | | | 5 | | | | – | | | | – | | | | (335 | ) | | | – | |
Issue of ordinary shares, net of expenses | | | – | | | | 11 | | | | – | | | | – | | | | – | | | | – | | | | – | | | | 11 | |
Equity instruments granted to employees of the Group | | | – | | | | – | | | | – | | | | – | | | | 2 | | | | – | | | | – | | | | 2 | |
Transfer of net profit to reserves | | | – | | | | – | | | | – | | | | – | | | | – | | | | (665 | ) | | | 665 | | | | – | |
Balance at 1 January 2017 | | | 165 | | | | 1,295 | | | | (645 | ) | | | 22 | | | | 158 | | | | 717 | | | | 1,400 | | | | 3,112 | |
Total comprehensive income for the year | | | – | | | | – | | | | – | | | | – | | | | – | | | | 817 | | | | – | | | | 817 | |
Dividends paid(4) | | | – | | | | – | | | | – | | | | – | | | | – | | | | – | | | | (400 | ) | | | (400 | ) |
Repurchase of ordinary shares | | | – | | | | – | | | | (371 | ) | | | – | | | | – | | | | – | | | | – | | | | (371 | ) |
Cancellation of shares | | | (3 | ) | | | – | | | | 263 | | | | 3 | | | | – | | | | – | | | | (263 | ) | | | – | |
Issue of ordinary shares, net of expenses | | | – | | | | 14 | | | | – | | | | – | | | | – | | | | – | | | | – | | | | 14 | |
Equity instruments granted to employees of the Group | | | – | | | | – | | | | – | | | | – | | | | 2 | | | | – | | | | – | | | | 2 | |
Transfer of net profit to reserves | | | – | | | | – | | | | – | | | | – | | | | – | | | | (717 | ) | | | 717 | | | | – | |
Balance at 31 December 2017 | | | 162 | | | | 1,309 | | | | (753 | ) | | | 25 | | | | 160 | | | | 817 | | | | 1,454 | | | | 3,174 | |
| (1) | The capital redemption reserve does not form part of the distributable reserves balance. |
| (2) | Other reserves relate to equity instruments granted to employees of the Group under share based remuneration arrangements, and do not form part of the distributable reserves balance. |
| (3) | Distributable reserves at 31 December 2017 were £1,518m (2016: £1,472m) comprising net profit and reserves, net of shares held in treasury. |
| (4) | Refer to note 14 of the RELX Group consolidated financial statements on page 141 for further dividend disclosure. |
RELX PLC accounting policies
Basis of preparation
RELX PLC meets the definition of a qualifying entity under FRS 100 (Financial Reporting Standard 100) issued by the Financial Reporting Council (FRC). Accordingly, the financial statements are prepared in accordance with FRS 101 (Financial Reporting Standard 101) ‘Reduced Disclosure Framework’ as issued by the Financial Reporting Council, incorporating the Amendments to FRS 101 issued by the FRC in July 2015 and the amendments to Company law made by The Companies, Partnerships and Groups (Accounts and Reports) Regulations 2015.
As permitted by FRS 101, RELX PLC has taken advantage of the disclosure exemptions available under that standard in relation to share based payments, financial instruments, capital management, presentation of comparative information in respect of certain assets, presentation of a cash flow statement, standards not yet effective, impairment of assets and related party transactions.
The RELX PLC financial statements have been prepared on the historical cost basis.
Unless otherwise indicated, all amounts in the financial statements are in millions of pounds.
The RELX PLC financial statements should be read in conjunction with the Group consolidated financial statements and notes presented on pages 117 to 164, which are also presented as the RELX PLC consolidated financial statements. See the Basis of preparation of the consolidated financial statements on page 122.
The RELX PLC financial statements are prepared on a going concern basis, as explained on page 171.
As permitted by section 408 of the Companies Act 2006, and in compliance with The Companies, Partnerships and Groups (Accounts and Reports) Regulations 2015, the company has not presented its own profit and loss account but has presented the net profit for the year on the statement of financial position.
The RELX PLC accounting policies under FRS 101 are set out below.
Investments
Fixed asset investments are stated at cost, less provision, if appropriate, for any impairment in value. The fair value of the award of share options and conditional shares over RELX PLC ordinary shares to employees of the Group are treated as a capital contribution.
Other assets and liabilities are stated at historical cost, less provision, if appropriate, for any impairment in value.
Shares held in treasury
The consideration paid, including directly attributable costs, for shares repurchased is recognised as shares held in treasury and presented as a deduction from total equity. Details of share capital and shares held in treasury are set out in note 26 of the Group consolidated financial statements.
Foreign exchange translation
Transactions entered into in foreign currencies are recorded at the exchange rates applicable at the time of the transaction.
Taxation
Refer to note 10 on pages134-135 of the consolidated financial statements for the taxation accounting policies.
| | |
| 174 | | RELX Group Annual reports and financial statements 2017 |
|
|
Notes to the RELX PLC financial statements
1 Investments
| | | | | | | | | | | | |
| | | Subsidiary
undertaking
£m | | | Joint
venture
£m | | | Total
£m | |
At 1 January 2016 | | | 77 | | | | 3,023 | | | | 3,100 | |
Equity instruments granted to employees of the Group | | | – | | | | 2 | | | | 2 | |
At 1 January 2017 | | | 77 | | | | 3,025 | | | | 3,102 | |
Impairment | | | (77 | ) | | | – | | | | (77 | ) |
Equity instruments granted to employees of the Group | | | – | | | | 2 | | | | 2 | |
At 31 December 2017 | | | – | | | | 3,027 | | | | 3,027 | |
The joint venture is set out in note 3.
2 Related party transactions
All transactions with joint ventures, subsidiaries and the Group’s employees, which are related parties of RELX PLC, are reflected in these financial statements. Transactions with key management personnel including share based remuneration costs are set out in note 28 of the Group consolidated financial statements and details of the Directors’ remuneration are included in the Directors’ Remuneration Report on pages 83 to 102.
3 Joint venture as at 31 December 2017
| | | | | | |
| | | | | % holding as at
31 December | |
RELX Group plc | | | | | | |
Incorporated and operating in Great Britain1-3 Strand | | 63,226 ordinary voting shares | | | 50% | |
London WC2N 5JR | | 15,487non-voting E shares | | | – | |
RELX Group plc is a holding company for group financing activities and | | 21,287non-voting R shares | | | 100% | |
operating businesses involved in scientific and medical, risk and business | | Equivalent to a 52.9% equity interest and a | | | | |
analytics, legal markets and organisation of trade exhibitions | | 50% interest in the voting shares | | | | |
4 Contingent liabilities
There are contingent liabilities in respect of borrowings of joint ventures guaranteed by RELX PLC as follows:
| | | | | | | | |
| | | 2017
£m | | | 2016
£m | |
Guaranteed jointly and severally with RELX NV | | | 4,644 | | | | 4,643 | |
Financial instruments disclosures in respect of the borrowings covered by the above guarantees are given in note 19 of the Group’s consolidated financial statements.
5 Subsequent events
As set out on page 3, a set of measures that will further simplify the RELX Group corporate structure into a single parent company have been proposed. The simplification is subject to the approval of both RELX NV and RELX PLC shareholders. We expect a circular to be sent to shareholders in the second quarter of 2018, with implementation in the third quarter of 2018, subject to various conditions including shareholder approval. An implementation of the proposal would result in the merger of RELX NV’s assets and liabilities into RELX PLC.
| | |
Financial statements and other information | | 175 |

| | |
| 176 | | RELX Group Annual reports and financial statements 2017 |
|
|
Report of the Board
TheNon-Executive and Executive Directors present their joint report, together with the financial statements of the Group and of RELX NV (the Company), for the year ended 31 December 2017.
RELX PLC and RELX NV are separate, publicly-listed holding companies. RELX PLC’s ordinary shares are traded on the London and New York stock exchanges, and RELX NV’s shares are traded on the Amsterdam and New York stock exchanges. RELX PLC and RELX NV have equal voting rights in RELX Group plc, which holds all of RELX Group’s operating businesses, subsidiaries and financing activities. RELX PLC, RELX NV, RELX Group plc and its subsidiaries, associates and joint ventures are together known as ‘RELX Group’ or ‘the Group’.
This Report of the Board and the company financial statements should be read in conjunction with the consolidated financial statements and other reports set out on pages 2 to 165, which are incorporated by reference herein. Summary consolidated financial information in euros is set out on page 184. The consolidated financial statements on pages 106 to 164 are to be considered as part of the notes to the statutory financial statements. The Annual Report of RELX NV within the meaning of article 2:391 of the Dutch Civil Code consists of pages 175 to 182 and, incorporated by reference, pages 2 to 165 and the Corporate Governance Statement of RELX NV dated 14 February 2018 which is published on the RELX Group website (www.relx.com) is incorporated by reference herein in accordance with the Besluit inhoud bestuursverslag .
Principal activities
RELX NV is a holding company. Its principal investment is its direct 47.1% shareholding in RELX Group plc. RELX Group plc is a global provider of information and analytics for professional and business customers across industries. The remaining shareholding in RELX Group plc is held by RELX PLC. A full description is set out on page 71.
Financial statement presentation
Under the Governing Agreement between RELX PLC and RELX NV, one RELX PLC ordinary share confers an equivalent economic interest to one RELX NV share. Therefore all shareholders can be regarded as having interests in a single economic entity.
Accordingly, the Group forms a single reporting entity for the presentation of consolidated financial statements. The Group consolidated financial statements represent the interests of both sets of shareholders and are presented by both RELX PLC and RELX NV as their respective consolidated financial statements. A review of the Group’s performance during the year is set out on pages 7 to 39, a summary of the principal risks facing the Group is set out on pages 60 to 63, and the Group statement on corporate responsibility is set out on pages 41 to 51.
The shares of RELX PLC and RELX NV are regarded as two separate classes of share which together form the consolidated issued share capital of the Group. In calculating earnings per share of the Group, the earnings for each company are calculated on a fully distributed basis. The Group’s usual practice is for only a portion of earnings to be distributed by way of dividends. Dividends paid to RELX PLC and RELX NV shareholders are, other than in special circumstances, equalised at the gross level and reported earnings per share have the same value for each RELX NV and RELX PLC share.
In addition to the reported figures, adjusted profit figures are presented as additional performance measures used by management. These exclude the Group’s share of amortisation of acquired intangible assets, acquisition-related costs, tax in joint ventures, disposal gains and losses and othernon-operating items, related tax effects, and movements in deferred taxation assets and liabilities related to acquired intangible assets and include the benefit of tax amortisation where available on acquired goodwill and intangible assets.
Parent company financial statements
In accordance with article 2:362(1) of the Dutch Civil Code, the individual company financial statements of RELX NV (presented on pages 179 to 182) were prepared under Financial Reporting Standard 101 (FRS 101).
The profit attributable to the shareholders of RELX NV was€819m (2016:€869m) and net assets as at 31 December 2017, principally representing the investment in RELX Group plc under the historical cost method and loans to their subsidiaries were€4,370m (2016:€4,318m). Free reserves as at 31 December 2017 were€4,095m (2016:€4,046m), comprising reserves andpaid-in surplus less shares held in treasury.
Dividends
The Board is recommending a final dividend of€0.316 per ordinary share. This gives total ordinary dividends for the year of€0.448 (2016:€0.423), (up 6%). The final dividend will be paid on
22 May 2018. Payment of this final dividend remains subject to approval of the Company’s shareholders at its 2018 Annual General Meeting.
Details of dividend cover and dividend policy are set out on page 58.
| | |
| Financial statements and other information Report of the Board | | 177 |
|
|
Share capital
All issued shares are fully paid up and carry no additional obligations or special rights.
During 2017, 2,067,694 ordinary shares in RELX NV were issued as follows:
| ◾ | under convertible debentures at prices between€5.099 and €18.470 |
| ◾ | under executive share option schemes at prices between€5.403 and€16.723 |
Information regarding shares outstanding at 31 December 2017 is shown in note 26 to the consolidated financial statements. At 31 December 2017, the total shares held in treasury were 52,563,100. Another 3,775,905 shares were held by the Employee Benefit Trust.
At the 2017 Annual General Meeting, the shareholders approved the reduction of the capital of RELX NV by the cancellation of up to 50 million of its shares held in treasury. On 27 December 2017, 22 million ordinary shares held in treasury were cancelled on the basis of this authorisation.
Substantial holdings
As at 14 February 2018, based on the public database of and on notification received from the Netherlands Authority for the Financial Markets, the Company is aware of interests in the capital and voting rights of the issued share capital of the Company of at least 3% by the following persons or organisations:
| ◾ | Janus Henderson Group Plc |
| ◾ | The Bank of New York Mellon Corporation |
| ◾ | Jupiter Asset Management Ltd. |
| ◾ | Massachusetts Financial Services Company |
Authority to purchase shares
At the 2017 Annual General Meeting, shareholders passed a resolution delegating authority to the Board to acquire shares in RELX NV for a period of 18 months from the date of the Annual General Meeting up to and including 18 October 2018, for the maximum amount of 10% of the issued capital. During the year, 21 million shares were purchased under this and the previous delegation of authority. As at 31 December 2017 there were 52,563,100 shares held in treasury, representing 5.26% of the issued shares. A further 2.9 million shares were purchased between 2 January 2018 and the date of this report.
A resolution to renew the delegation of the authority is to be put to the 2018 Annual General Meeting, together with a proposal for approval of the reduction of RELX NV’s capital by cancellation of accumulated shares held in treasury.
Corporate Governance
RELX NV is subject to the Dutch Corporate Governance Code issued in December 2016 (the Dutch Code). The Dutch Code replaces the former Code (issued in 2008) and is applicable to financial years starting on or after 1 January 2017. For further information on the application of the Dutch Code, see the Corporate Governance Statement of RELX NV published on the RELX Group website, www.relx.com, which is incorporated into this Report of the Board by reference.
Significant agreements – change of control
The Governing Agreement between RELX NV and RELX PLC states that upon a change of control of RELX NV (for these purposes, the acquisition by a third party of 50% or more of the issued share capital having voting rights), should there not be a comparable offer from the offeror for RELX PLC, RELX PLC may serve notice upon RELX NV varying certain provisions of the Governing Agreement, including the governance and the standstill provisions.
There are a number of borrowing agreements including credit facilities that in the event of a change of control of both RELX NV and RELX PLC and, in some cases, a consequential credit rating downgrade tosub-investment grade may, at the option of the lenders, require repayment and/or cancellation as appropriate.
Financial statements and accounting records
The financial statements provide a true and fair view of the state of affairs of the Company and the Group as of 31 December 2017 and of the profit or loss in 2017. In preparing the financial statements, the Board ensures that suitable accounting policies, consistently applied and supported by reasonable judgements and estimates, have been used and applicable accounting standards have been followed. The Board is responsible for keeping proper accounting records, which disclose with reasonable accuracy at any time the financial position of the company and enable them to ensure that the financial statements comply with the law. The Board has general responsibility for taking reasonable steps to safeguard the assets of the company and to prevent and detect fraud and other irregularities.
Internal control
As required under sections 1.4.2 and 1.4.3 of the Dutch Code, the Board has reviewed the effectiveness of the systems of internal control and risk management during the last financial year. The objective of these systems is to manage, rather than eliminate, the risk of failure to achieve business objectives. Accordingly, they can only provide reasonable, but not absolute, assurance against material misstatement or loss. The outcome of this review has been discussed with the external auditors.
The Board confirmed that this report provides sufficient insights into the functioning of the risk management and control systems as set out on pages78-79 and that with regards to financial reporting the risk management and control systems provide reasonable assurance against material inaccuracies or loss. They further confirmed that based on the current state of affairs, it is justified that the financial reporting is prepared on a going concern basis; and that the annual report describes those material risks and uncertainties that are relevant to the expectation of the Company’s continuity for the period of twelve months after the preparation of the report.
| | |
| 178 | | RELX Group Annual reports and financial statements 2017 |
|
|
Corporate Simplification
As set out on page 3, a set of measures that will further simplify the RELX Group corporate structure into a single parent company have been proposed. The simplification is subject to the approval of both RELX NV and RELX PLC shareholders. We expect a circular to be sent to shareholders in the second quarter of 2018, with implementation in the third quarter of 2018, subject to various conditions including shareholder approval. An implementation of the proposal would result in the merger of the Company’s assets and liabilities into RELX PLC.
Directors’ responsibility statement
Each of the Directors whose names and roles can be found on pages 66 to 67 confirms that to the best of their knowledge that
| ◾ | the consolidated financial statements, prepared in accordance with International Financial Reporting Standards as issued by the International Accounting Standards Board and as adopted by the European Union and Part 9 of Book 2 of the Dutch Civil Code, give a true and fair view of the financial position and profit or loss of the Group; |
| ◾ | the individual company financial statements prepared in accordance with Financial Reporting Standard 101 ‘Reduced Disclosure Framework’ (FRS 101) and Part 9 of Book 2 of the Dutch Civil Code, give a true and fair view of the assets, liabilities, financial position and profit or loss of the Company; and |
| ◾ | the Report of the Board includes a fair review of the development and performance of the business during the financial year and the position of the Group as at 31 December 2017 together with a description of the principal risks and uncertainties that it faces. |
Neither the Company nor the Directors accept any liability to any person in relation to the Annual Report except to the extent that such liability arises under Dutch law.
Disclosure of information to auditors
As part of the process of approving the RELX NV 2017 financial statements, the Board has taken steps to ensure that all relevant information was provided to the Company’s auditors and, so far as the Board is aware, there is no relevant audit information of which the Company’s auditors are unaware.
Going concern
The Directors’ statement on the appropriateness of adopting the going concern basis of accounting is set out on page 79, which is incorporated into this Report of the Board by reference.
Long-term viability statement
The Directors’ statement regarding the long-term viability of the Group as required by the UK Corporate Governance Code is set out on page 80, which is incorporated into this Report of the Board by reference.
Auditors
Resolutions for there-appointment of Ernst & Young Accountants LLP as the Company’s auditors and to authorise the Board to determine their remuneration will be submitted to the forthcoming Annual General Meeting on 18 April 2018.
| | |
Signed by: | | |
| Non-Executive Directors | | Executive Directors |
| A Habgood | | E Engstrom |
| (Chairman) | | (Chief Executive Officer) |
| W Hauser | | N Luff |
| (Senior Independent Director) | | (Chief Financial Officer) |
A Hennah
M van Lier Lels
R MacLeod
C Mills
L Sanford
B van der Veer
S Wood (appointed 26 September 2017)
Registered office
Radarweg 29
1043 NX Amsterdam
The Netherlands
Chamber of Commerce Amsterdam
Register file No: 33155037
14 February 2018
| | |
| Financial statements and other information RELX NV financial statements | | 179 |
|
|
RELX NV statement of comprehensive income
| | | | | | | | | | | | |
| FOR THE YEAR ENDED 31 DECEMBER | | Note | | | 2017 €m | | | 2016 €m | |
Administrative expenses | | | | | | | (2 | ) | | | (2 | ) |
Operating profit | | | | | | | (2 | ) | | | (2 | ) |
Dividends received from joint ventures | | | | | | | 800 | | | | 850 | |
Finance income from joint ventures | | | | | | | 27 | | | | 27 | |
Profit before tax | | | | | | | 825 | | | | 875 | |
Tax expense | | | | | | | (6 | ) | | | (6 | ) |
Net profit for the year | | | 2 | | | | 819 | | | | 869 | |
| | | | | | | | | | | | | |
Other comprehensive income | | | | | | | – | | | | – | |
Total comprehensive income for the year | | | | | | | 819 | | | | 869 | |
RELX NV statement of financial position
before appropriation of profit
| | | | | | | | | | | | |
| AS AT 31 DECEMBER | | Note | | | 2017 €m | | | 2016 €m | |
Non-current assets | | | | | | | | | | | | |
Investments in joint ventures | | | 4 | | | | 4,180 | | | | 4,178 | |
| | | |
Current assets | | | | | | | | | | | | |
Amounts due from joint ventures – funding | | | 4 | | | | 279 | | | | 230 | |
Amounts due from joint ventures – other | | | 4 | | | | 7 | | | | 5 | |
| | | | | | | | 286 | | | | 235 | |
Total assets | | | | | | | 4,466 | | | | 4,413 | |
| | | |
Current liabilities | | | | | | | | | | | | |
Taxation | | | | | | | 35 | | | | 36 | |
Other payables | | | 1 | | | | 58 | | | | 59 | |
| | | | | | | | 93 | | | | 95 | |
Net assets | | | 2 | | | | 4,373 | | | | 4,318 | |
| | | |
Capital and reserves | | | | | | | | | | | | |
Share capital | | | | | | | 70 | | | | 71 | |
Paid-in surplus | | | | | | | 2,339 | | | | 2,318 | |
Shares held in treasury | | | | | | | (894 | ) | | | (872 | ) |
Other reserves | | | | | | | 203 | | | | 201 | |
Reserves | | | | | | | 1,836 | | | | 1,731 | |
Net profit | | | | | | | 819 | | | | 869 | |
Shareholders’ equity | | | | | | | 4,373 | | | | 4,318 | |
| | |
| 180 | | RELX Group Annual reports and financial statements 2017 |
|
|
RELX NV statement of changes in equity
| | | | | | | | | | | | | | | | | | | | | | | | | | | | |
| | |
| Share
capital €m |
| |
| Paid-in
surplus €m |
(1) | |
| Shares
held in treasury €m |
| |
| Other
reserves €m |
(2) | |
| Net profit
€m | (3)
| |
| Reserves
€m | (3)
| |
| Total
€m |
|
Balance at 1 January 2016 | | | 73 | | | | 2,304 | | | | (948 | ) | | | 199 | | | | 787 | | | | 1,803 | | | | 4,218 | |
Total comprehensive income for the year | | | – | | | | – | | | | – | | | | – | | | | 869 | | | | – | | | | 869 | |
Dividends paid(4) | | | – | | | | – | | | | – | | | | – | | | | – | | | | (399 | ) | | | (399 | ) |
Repurchase of shares | | | – | | | | – | | | | (386 | ) | | | – | | | | – | | | | – | | | | (386 | ) |
Cancellation of shares | | | (2 | ) | | | – | | | | 462 | | | | – | | | | – | | | | (460 | ) | | | – | |
Issue of shares, net of expenses | | | – | | | | 14 | | | | – | | | | – | | | | – | | | | – | | | | 14 | |
Equity instruments granted to employees of the Group | | | – | | | | – | | | | – | | | | 2 | | | | – | | | | – | | | | 2 | |
Transfer of net profit to reserves | | | – | | | | – | | | | – | | | | – | | | | (787 | ) | | | 787 | | | | – | |
Balance at 1 January 2017 | | | 71 | | | | 2,318 | | | | (872 | ) | | | 201 | | | | 869 | | | | 1,731 | | | | 4,318 | |
Total comprehensive income for the year | | | – | | | | – | | | | – | | | | – | | | | 819 | | | | – | | | | 819 | |
Dividends paid(4) | | | – | | | | – | | | | – | | | | – | | | | – | | | | (412 | ) | | | (412 | ) |
Repurchase of shares | | | – | | | | – | | | | (375 | ) | | | – | | | | – | | | | – | | | | (375 | ) |
Cancellation of shares | | | (1 | ) | | | – | | | | 353 | | | | – | | | | – | | | | (352 | ) | | | – | |
Issue of shares, net of expenses | | | – | | | | 21 | | | | – | | | | – | | | | – | | | | – | | | | 21 | |
Equity instruments granted to employees of the Group | | | – | | | | – | | | | – | | | | 2 | | | | – | | | | – | | | | 2 | |
Transfer of net profit to reserves | | | – | | | | – | | | | – | | | | – | | | | (869 | ) | | | 869 | | | | – | |
Balance at 31 December 2017 | | | 70 | | | | 2,339 | | | | (894 | ) | | | 203 | | | | 819 | | | | 1,836 | | | | 4,373 | |
| (1) | Withinpaid-in surplus, an amount of€2,186m (2016:€2,165m) is free of tax. |
| (2) | Other reserves relate to equity instruments granted to employees of the Group under share based remuneration arrangements. Other reserves do not form part of free reserves. |
| (3) | Free reserves of the company at 31 December 2017 were€4,100m (2016:€4,046m), comprising net profit reserves andpaid-in surplus less shares held in treasury. |
| (4) | Refer to note 14 of the RELX Group consolidated financial statements on page 141 for further dividend disclosure. |
RELX NV accounting policies
Basis of preparation
The RELX NV financial statements have been prepared on the historical cost basis. As permitted by 2:362 subsection 1 of the Dutch Civil Code for companies with international operations, the RELX NV financial statements have been prepared in accordance with FRS 101 and in accordance with Part 9 of Book 2 of the Dutch Civil Code.
RELX NV meets the definition of a qualifying entity under FRS 100 (Financial Reporting Standard 100) issued by the Financial Reporting Council, the standard setting body in the UK. Accordingly, the financial statements are prepared in accordance with FRS 101 (Financial Reporting Standard 101) ‘Reduced Disclosure Framework’ as issued by the Financial Reporting Council, incorporating the Amendments to FRS 101 issued by the FRC in July 2015.
As permitted by FRS 101, the company has taken advantage of the disclosure exemptions available under that standard in relations to share based payments, financial instruments, capital management, presentation of comparative information in respect of certain assets, presentation of a cash flow statement, standards not yet effective, impairment of assets and related party transactions.
The RELX NV financial statements have been prepared on the historical cost basis.
Unless otherwise stated, the financial statements are in millions of euros.
The RELX NV financial statements and notes should be read in conjunction with the Group consolidated financial statements and notes presented on pages 117 to 164, which are also presented as the RELX NV consolidated financial statements. See the Basis of preparation of the RELX Group consolidated financial statements on page 122.
The RELX NV financial statements are prepared on a going concern basis, as explained on page 79.
The RELX NV accounting policies under FRS 101 are set out below.
Investments
Fixed asset investments are stated at cost, less provision, if appropriate, for any impairment in value. The fair value of the award of share options and conditional shares over RELX NV ordinary shares to employees of the Group are treated as a capital contribution.
Other assets and liabilities are stated at historical cost, less provision, if appropriate, for any impairment in value.
| | |
| Financial statements and other information RELX NV financial statements | | 181 |
|
|
Shares held in treasury
The amount of consideration paid, including directly attributable costs, for shares repurchased is recognised as shares held in treasury and presented as a deduction from total equity. Details of share capital and shares held in treasury are set out in note 26 of the Group consolidated financial statements.
Foreign exchange translation
Transactions entered into in foreign currencies are recorded at the exchange rates applicable at the time of the transaction.
Taxation
Refer to note 10 on pages 134 to 135 of the RELX Group consolidated financial statements for the taxation accounting policies.
Notes to the RELX NV financial statements
1 Other payables
Other payables include€6m (2016:€6m) of the Group’s employee convertible debenture loans with a weighted average interest rate of 0.5% (2016: 0.8%). Depending on the conversion terms, the surrender of€200 par value debenture loans qualifies for 50 RELX NV ordinary shares.
2 RELX NV and consolidated financial statements
| | | | | | | | |
| YEAR ENDED 31 DECEMBER | | 2017 €m | | | 2016 €m | |
RELX NV profit attributable to shareholders | | | 819 | | | | 869 | |
RELX PLC profit attributable to shareholders | | | 931 | | | | 875 | |
| | | | | | | | | |
Consolidated net profit attributable to RELX PLC and RELX NV shareholders | | | 1,891 | | | | 1,416 | |
The difference between the RELX NV and RELX Group consolidated net profit arises as the RELX NV profit and loss accounts include dividends from RELX Group plc and other intra-group transactions (which are eliminated on a consolidated basis) whereas the RELX Group consolidated net profit includes the consolidated net profit of the Group’s subsidiaries and the Group’s share of the results of its joint ventures and associates.
| | | | | | | | |
| AS AT 31 DECEMBER | | 2017 €m | | | 2016 €m | |
RELX NV shareholders’ funds | | | 4,373 | | | | 4,318 | |
RELX PLC shareholders’ funds | | | 3,555 | | | | 3,641 | |
| | | | | | | | | |
Consolidated shareholders’ equity | | | 2,635 | | | | 2,714 | |
The difference between the RELX NV and RELX Group consolidated shareholders’ funds arise as the RELX NV shareholders’ funds includes the investment in RELX Group plc held at cost less any provision for impairment, and other intra-group transactions, such as intra-group funding, which eliminate on consolidation, whereas the RELX Group consolidated equity includes the investment in subsidiaries and the assets and liabilities (including external borrowings) of the Group as a whole.
3 Related party transactions
All transactions with joint ventures and the Group’s employees, which are related parties of RELX NV, are reflected in these financial statements. Joint ventures are set out in note 4.
Transactions with key management personnel including share based remuneration costs are set out in note 28 to the Group consolidated financial statements and details of the Directors’ remuneration are included in the Directors’ Remuneration Report on pages 83 to 102.
| | |
| 182 | | RELX Group Annual reports and financial statements 2017 |
|
|
Notes to the RELX NV financial statements
4 Joint venture as at 31 December 2017
| | | | | | |
| | | | | % holding as at
31 December | |
RELX Group plc | | | | | | |
Incorporated and operating in Great Britain | | | | | | |
1-3 Strand | | 63,226 ordinary voting shares | | | 50% | |
London WC2N 5JR | | 15,487non-voting E shares | | | 100% | |
RELX Group plc is a holding company for group financing activities and | | 21,287non-voting R shares | | | – | |
operating businesses involved in scientific and medical, risk and business | | Equivalent to a 47.1% equity interest and a | | | | |
analytics, legal markets and organisation of trade exhibitions | | 50% interest in the voting shares | | | | |
Investments in joint ventures include equity instruments granted to the Group’s employees of€2m (2016:€2m)
5 Contingent liabilities
There are contingent liabilities in respect of borrowings of joint ventures guaranteed by RELX NV as follows:
| | | | | | | | |
| | | 2017 €m | | | 2016 €m | |
Guaranteed jointly and severally with RELX PLC | | | 5,202 | | | | 5,432 | |
Financial instruments disclosures in respect of the borrowings covered by the above guarantees are given in note 19 of the Group’s consolidated financial statements.
6 Auditors’ remuneration
Information on the audit andnon-audit fees paid by RELX Group to Ernst & Young Accountants LLP and its associates is set out in note 4 to the Group’s consolidated financial statements.
7 Subsequent events
As set out on page 3, a set of measures that will further simplify the RELX Group corporate structure into a single parent company have been proposed. The simplification is subject to the approval of both RELX NV and RELX PLC shareholders. We expect a circular to be sent to shareholders in the second quarter of 2018, with implementation in the third quarter of 2018, subject to various conditions including shareholder approval. An implementation of the proposal would result in the merger of the Company’s assets and liabilities into RELX PLC.
8 Approval of financial statements
The RELX NV financial statements were signed and authorised for issue by the Board of Directors on 14 February 2018.
| | |
| A J Habgood | | N L Luff |
| Chairman of the Board | | Chief Financial Officer |
Additional information (unaudited)
Profit allocation
The Articles of Association provide that distributions of dividend may only be made insofar as the company’s equity exceeds the amount of thepaid-in capital, increased by the reserves which must be kept by virtue of the law and may be made in cash or in shares, at the proposal of the Board. Distribution of dividends on ordinary shares shall be made in proportion to the nominal value of each share. The Board may resolve what amount of dividend shall be paid on each ordinary share. Distribution of dividends on ordinary shares are subject to approval at the General Meeting of Shareholders. Details of dividends proposed in relation to the financial year are in note 14 to the consolidated financial statements.
| | | | | | | | | | | | |
| OVERVIEW OF PROFIT FOR THE YEAR AND DIVIDENDS PAID | | 2017
€m | | | 2016 €m | | | 2015 €m | |
Final dividend on ordinary shares for prior financial year | | | 287 | | | | 281 | | | | 283 | |
Interim dividend on ordinary shares for financial year | | | 125 | | | | 118 | | | | 114 | |
Surplus for the year | | | 407 | | | | 470 | | | | 390 | |
Total | | | 819 | | | | 869 | | | | 787 | |
| | |
| Financial statements and other information | | 183 |
|
|

| | |
Other financial information |
| | |
| 184 | | RELX Group Annual reports and financial statements 2017 |
|
|
Summary financial information in euros
Basis of preparation
The Group’s consolidated financial information is presented in sterling. The summary financial information is a simple translation of the Group’s consolidated financial statements into euros at the stated rates of exchange.
| | | | | | | | | | | | | | | | | | | | | | | | |
| EXCHANGE RATES FOR TRANSLATION | | Income statement | | | | | | Statement of financial
position | |
| | | 2017 | | | 2016 | | | 2015 | | | | | | 2017 | | | 2016 | |
Euro to sterling | | | 1.14 | | | | 1.22 | | | | 1.38 | | | | | | | | 1.12 | | | | 1.17 | |
Consolidated income statement
| | | | | | | | | | | | |
| FOR THE YEAR ENDED 31 DECEMBER | | 2017 €m | | | 2016 €m | | | 2015 €m | |
Revenue | | | 8,385 | | | | 8,412 | | | | 8,240 | |
Operating profit | | | 2,172 | | | | 2,084 | | | | 2,066 | |
Profit before tax | | | 1,977 | | | | 1,797 | | | | 1,811 | |
Net profit attributable to RELX PLC and RELX NV shareholders | | | 1,891 | | | | 1,416 | | | | 1,391 | |
Adjusted operating profit | | | 2,604 | | | | 2,579 | | | | 2,514 | |
Adjusted profit before tax | | | 2,415 | | | | 2,359 | | | | 2,303 | |
Adjusted net profit attributable to RELX PLC and RELX NV shareholders | | | 1,864 | | | | 1,815 | | | | 1,760 | |
Adjusted earnings per ordinary share | | | €0.923 | | | | €0.880 | | | | €0.835 | |
Basic earnings per ordinary share | | | | | | | | | | | | |
RELX PLC | | | €0.936 | | | | €0.687 | | | | €0.640 | |
RELX NV | | | €0.936 | | | | €0.687 | | | | €0.682 | |
Net dividend per ordinary share paid in the year | | | | | | | | | | | | |
RELX PLC | | | €0.426 | | | | €0.397 | | | | €0.364 | |
RELX NV | | | €0.433 | | | | €0.410 | | | | €0.400 | |
Net dividend per ordinary share paid and proposed in relation to the financial year | | | | | | | | | | | | |
RELX PLC | | | €0.449 | | | | €0.439 | | | | €0.410 | |
RELX NV | | | €0.448 | | | | €0.423 | | | | €0.403 | |
Consolidated statement of cash flows | | | | | | | | | | | | |
| FOR THE YEAR ENDED 31 DECEMBER | | 2017 €m | | | 2016 €m | | | 2015 €m | |
Net cash from operating activities | | | 2,107 | | | | 2,052 | | | | 1,942 | |
Net cash used in investing activities | | | (481 | ) | | | (815 | ) | | | (582 | ) |
Net cash used in financing activities | | | (1,677 | ) | | | (1,226 | ) | | | (1,552 | ) |
(Decrease)/increase in cash and cash equivalents | | | (51 | ) | | | 11 | | | | (192 | ) |
| | | |
Movement in cash and cash equivalents | | | | | | | | | | | | |
At start of year | | | 190 | | | | 166 | | | | 356 | |
(Decrease)/increase in cash and cash equivalents | | | (51 | ) | | | 11 | | | | (192 | ) |
Exchange translation differences | | | (15 | ) | | | 13 | | | | 2 | |
At end of year | | | 124 | | | | 190 | | | | 166 | |
Adjusted cash flow | | | 2,499 | | | | 2,460 | | | | 2,363 | |
Consolidated statement of financial position | | | | | | | | | | | | |
| AS AT 31 DECEMBER | | | | | 2017 €m | | | 2016 €m | |
Non-current assets | | | | | | | 11,339 | | | | 12,835 | |
Current assets | | | | | | | 2,418 | | | | 2,746 | |
Assets held for sale | | | | | | | – | | | | 7 | |
Total assets | | | | | | | 13,757 | | | | 15,588 | |
Current liabilities | | | | | | | 5,069 | | | | 6,206 | |
Non-current liabilities | | | | | | | 6,029 | | | | 6,617 | |
Liabilities associated with assets held for sale | | | | | | | – | | | | 6 | |
Total liabilities | | | | | | | 11,098 | | | | 12,829 | |
Net assets | | | | | | | 2,659 | | | | 2,759 | |
| | |
| Financial statements and other information Other financial information | | 185 |
|
|
Summary financial information in US dollars
Basis of preparation
The Group’s consolidated financial information is presented in sterling. The summary financial information is a simple translation of the Group’s consolidated financial statements into US dollars at the stated rates of exchange. It does not represent a restatement under US GAAP which would be different in some significant respects.
| | | | | | | | | | | | | | | | | | | | | | | | |
| EXCHANGE RATES FOR TRANSLATION | | Income statement | | | | | | Statement of financial
position | |
| | | 2017 | | | 2016 | | | 2015 | | | | | | 2017 | | | 2016 | |
US dollars to sterling | | | 1.29 | | | | 1.36 | | | | 1.53 | | | | | | | | 1.35 | | | | 1.23 | |
Consolidated income statement
| | | | | | | | | | | | |
| FOR THE YEAR ENDED 31 DECEMBER | | 2017
US$m | | | 2016
US$m | | | 2015
US$m | |
Revenue | | | 9,488 | | | | 9,377 | | | | 9,136 | |
Operating profit | | | 2,457 | | | | 2,323 | | | | 2,290 | |
Profit before tax | | | 2,237 | | | | 2,003 | | | | 2,007 | |
Net profit attributable to RELX PLC and RELX NV shareholders | | | 2,140 | | | | 1,579 | | | | 1,542 | |
Adjusted operating profit | | | 2,946 | | | | 2,875 | | | | 2,788 | |
Adjusted profit before tax | | | 2,732 | | | | 2,630 | | | | 2,554 | |
Adjusted net profit attributable to RELX PLC and RELX NV shareholders | | | 2,109 | | | | 2,024 | | | | 1,951 | |
Adjusted earnings per American Depositary Share (ADS) | | | $1.044 | | | | $0.982 | | | | $0.926 | |
Basic earnings per ADS | | | | | | | | | | | | |
RELX PLC (Each ADS comprises one ordinary share) | | | $1.060 | | | | $0.766 | | | | $0.710 | |
RELX NV (Each ADS comprises one ordinary share) | | | $1.060 | | | | $0.766 | | | | $0.756 | |
Net dividend per ADS paid in the year | | | | | | | | | | | | |
RELX PLC | | | $0.482 | | | | $0.443 | | | | $0.404 | |
RELX NV | | | $0.490 | | | | $0.457 | | | | $0.444 | |
Net dividend per ADS paid and proposed in relation to the financial year | | | | | | | | | | | | |
RELX PLC | | | $0.508 | | | | $0.489 | | | | $0.437 | |
RELX NV | | | $0.507 | | | | $0.472 | | | | $0.439 | |
Consolidated statement of cash flows | | | | | | | | | | | | |
| FOR THE YEAR ENDED 31 DECEMBER | | 2017
US$m | | | 2016
US$m | | | 2015
US$m | |
Net cash from operating activities | | | 2,384 | | | | 2,287 | | | | 2,153 | |
Net cash used in investing activities | | | (544 | ) | | | (908 | ) | | | (646 | ) |
Net cash used in financing activities | | | (1,898 | ) | | | (1,367 | ) | | | (1,720 | ) |
(Decrease)/increase in cash and cash equivalents | | | (58 | ) | | | 12 | | | | (213 | ) |
| | | |
Movement in cash and cash equivalents | | | | | | | | | | | | |
At start of year | | | 199 | | | | 179 | | | | 431 | |
(Decrease)/increase in cash and cash equivalents | | | (58 | ) | | | 12 | | | | (213 | ) |
Exchange translation differences | | | 9 | | | | 8 | | | | (39 | ) |
At end of year | | | 150 | | | | 199 | | | | 179 | |
Adjusted cash flow | | | 2,828 | | | | 2,742 | | | | 2,619 | |
Consolidated statement of financial position | | | | | | | | | | | | |
| AS AT 31 DECEMBER | | | | | 2017
US$m | | | 2016
US$m | |
Non-current assets | | | | | | | 13,667 | | | | 13,493 | |
Current assets | | | | | | | 2,915 | | | | 2,887 | |
Assets held for sale | | | | | | | – | | | | 7 | |
Total assets | | | | | | | 16,582 | | | | 16,387 | |
Current liabilities | | | | | | | 6,110 | | | | 6,524 | |
Non-current liabilities | | | | | | | 7,267 | | | | 6,957 | |
Liabilities associated with assets held for sale | | | | | | | – | | | | 6 | |
Total liabilities | | | | | | | 13,377 | | | | 13,487 | |
Net assets | | | | | | | 3,205 | | | | 2,900 | |
| | |
| 186 | | RELX Group Annual reports and financial statements 2017 |
|
|
Reconciliation of adjusted to GAAP measures
The Group uses adjusted figures, which are not defined by generally accepted accounting principles (“GAAP”) such as IFRS, as additional performance measures. These measures are used by management, alongside the comparable GAAP measures, in evaluating the business performance. The measures may not be comparable to similarly reported measures by other companies.
A reconciliation ofnon-GAAP measures to relevant GAAP measures is as follows:
| | | | | | | | |
| YEAR ENDED 31 DECEMBER | | 2017
£m | | | 2016
£m | |
Operating profit | | | 1,905 | | | | 1,708 | |
Adjustments: | | | | | | | | |
Amortisation of acquired intangible assets | | | 314 | | | | 346 | |
Acquisition-related costs | | | 56 | | | | 51 | |
Reclassification of tax in joint ventures | | | 10 | | | | 10 | |
Reclassification of finance income in joint ventures | | | (1 | ) | | | (1 | ) |
Adjusted operating profit | | | 2,284 | | | | 2,114 | |
| | |
Profit before tax | | | 1,734 | | | | 1,473 | |
Adjustments: | | | | | | | | |
Amortisation of acquired intangible assets | | | 314 | | | | 346 | |
Acquisition-related costs | | | 56 | | | | 51 | |
Reclassification of tax in joint ventures | | | 10 | | | | 10 | |
Net interest on net defined benefit schemes | | | 15 | | | | 14 | |
Disposals and othernon-operating items | | | (11 | ) | | | 40 | |
Adjusted profit before tax | | | 2,118 | | | | 1,934 | |
| | |
Tax charge | | | (67 | ) | | | (304 | ) |
Adjustments: | | | | | | | | |
Deferred tax movements on goodwill and acquired intangible assets | | | 42 | | | | 18 | |
Tax on acquisition-related costs | | | (13 | ) | | | (13 | ) |
Reclassification of tax in joint ventures | | | (10 | ) | | | (10 | ) |
Tax on net interest on net defined benefit schemes | | | (4 | ) | | | (4 | ) |
Tax on disposals and othernon-operating items | | | 16 | | | | (34 | ) |
Other deferred tax credits from intangible assets* | | | (93 | ) | | | (91 | ) |
Exceptional tax credit** | | | (346 | ) | | | – | |
Adjusted tax charge | | | (475 | ) | | | (438 | ) |
| | |
Net profit attributable to RELX PLC and RELX NV shareholders | | | 1,659 | | | | 1,161 | |
Adjustments (post tax): | | | | | | | | |
Amortisation of acquired intangible assets | | | 356 | | | | 364 | |
Acquisition-related costs | | | 43 | | | | 38 | |
Net interest on net defined benefit obligation | | | 11 | | | | 10 | |
Disposals and othernon-operating items | | | 5 | | | | 6 | |
Other deferred tax credits from intangible assets* | | | (93 | ) | | | (91 | ) |
Exceptional tax credit** | | | (346 | ) | | | – | |
Adjusted net profit attributable to RELX PLC and RELX NV shareholders | | | 1,635 | | | | 1,488 | |
| | |
Cash generated from operations | | | 2,445 | | | | 2,236 | |
Adjustments: | | | | | | | | |
Dividends received from joint ventures and associates | | | 38 | | | | 44 | |
Purchases of property, plant and equipment | | | (51 | ) | | | (51 | ) |
Proceeds on disposals of property, plant, and equipment | | | 1 | | | | 1 | |
Expenditure on internally developed intangible assets | | | (303 | ) | | | (282 | ) |
Payments in relation to acquisition-related costs/other | | | 62 | | | | 68 | |
Adjusted cash flow | | | 2,192 | | | | 2,016 | |
| * | Movements on deferred tax liabilities arising on acquired intangible assets that do not qualify for tax amortisation. |
| ** | One-offnon-cash credit from a deferred tax adjustment arising from the US Tax Cuts and Jobs Act. |
| | |
| Financial statements and other information | | 187 |
|
|

| | |
| 188 | | RELX Group Annual reports and financial statements 2017 |
|
|
Shareholder information
Annual Reports and Financial Statements 2017
The RELX Group Annual Reports and consolidated Financial Statements for RELX PLC and RELX NV for the year ended
31 December 2017, and the Corporate Governance Statement of RELX NV are available on the Group’s website, and from the registered offices of the respective parent companies shown on page 190. Additional financial information, including the interim and full-year results announcements, trading updates and presentations, is also available on the Group’s website,
 www.relx.com
The consolidated financial statements set out in the Annual Reports and Financial Statements are expressed in sterling, with summary financial information expressed in euros and US dollars. The financial statements of RELX PLC and RELX NV are expressed in sterling and euros respectively.
Share price information
RELX PLC’s ordinary shares are traded on the London Stock Exchange.
| | | | |
| | |
| | | PLC | |
| Trading symbol | | | REL | |
| ISIN | | | GB00B2B0DG97 | |
RELX NV’s ordinary shares are traded on the Euronext Amsterdam Stock Exchange.
| | | | |
| | | NV | |
| Trading symbol | | | REN | |
| ISIN | | | NL000614495 | |
The RELX PLC and RELX NV ordinary shares are traded on the New York Stock Exchange in the form of American Depositary Shares (ADSs), evidenced by American Depositary Receipts (ADRs).
| | | | | | | | |
| | | PLC ADRs | | | NV ADRs | |
| Ratio to ordinary shares | | | 1:1 | | | | 1:1 | |
| Trading symbol | | | RELX | | | | RENX | |
| CUSIP code | | | 759530108 | | | | 75955B102 | |
The RELX PLC and RELX NV ordinary share prices and the ADR prices may be obtained from the Group’s website, other online sources and the financial pages of some newspapers.
| | |
| | For further information visit the ‘Investor Centre’ section of the Group’s websitewww.relx.com/investorcentre |
Information for RELX PLC ordinary shareholders
Shareholder services
The RELX PLC ordinary share register is administered by Equiniti Limited. Equiniti provides a free online portal for shareholders at www.shareview.co.uk. Shareview allows shareholders to monitor the value of their shareholdings, view their dividend payments and submit dividend mandate instructions. Shareholders can also submit their proxy voting instructions ahead of company meetings, as well as update their personal contact details. Shareview Dealing provides a share purchase and sale facility. Equiniti’s contact details are shown on page 190.
Electronic communications
While hard copy shareholder communications continue to be available to those shareholders requesting them, in accordance with the Companies Act 2006 and the Company’s articles of association, RELX PLC uses the Group’s website as the main method of communicating with shareholders. By registering their details online at Shareview, shareholders can be notified by email when shareholder communications are published on the Group’s website. Shareholders can also use the Shareview website to appoint a proxy to vote on their behalf at shareholder meetings.
Shareholders who hold their RELX PLC shares through CREST may appoint proxies for shareholder meetings through the CREST electronic proxy appointment service by using the procedures described in the CREST manual.
Dividend mandates
Shareholders are encouraged to have their dividends paid directly into a UK bank or building society account. This method of payment reduces the risk of delay or loss of dividend cheques in the post and ensures the account is credited on the dividend payment date. A dividend mandate form can be obtained online at www.shareview.co.uk, or by contacting Equiniti at the address shown on page 190.
Equiniti has established a service for overseas shareholders in over 90 countries, which enables shareholders to have their dividends automatically converted from sterling and paid directly into their nominated bank account. Further details of this service, and the fees applicable, are available at www.shareview.co.uk/ info/ops or by contacting Equiniti at the address shown on page 190.
Dividend Reinvestment Plan
Shareholders can choose to reinvest their RELX PLC dividends by purchasing further shares through the Dividend Reinvestment Plan (DRIP) provided by Equiniti. Further information concerning the DRIP facility, together with the terms and conditions and an application form can be obtained online at www.shareview.co.uk/ info/drip or by contacting Equiniti at the address shown on page 190.
| | |
| Financial statements and other information Shareholder information | | 189 |
|
|
Share dealing service
A telephone and internet dealing service is available through Equiniti, which provides a simple way for UK resident shareholders to buy or sell RELX PLC shares. For telephone dealing call 0345 603 7037 between 8.30am and 5.30pm (UK time), Monday to Friday (excluding public holidays in England and Wales), and for internet dealing log on to www.shareview.co.uk/dealing. You will need your shareholder reference number shown on your dividend confirmation.
ShareGift
The Orr Mackintosh Foundation operates a charity share donation scheme for shareholders with small parcels of shares whose value makes it uneconomic to sell them. Details of the scheme can be obtained from the ShareGift website at www.sharegift.org, or by telephoning ShareGift on 020 7930 3737.
Sub-division of ordinary shares and share consolidation
On 28 July 1986, each RELX PLC ordinary share of £1 nominal value wassub-divided into four ordinary shares of 25p each. On 2 May 1997, each 25p ordinary share wassub-divided into two ordinary shares of 12.5p each. On 7 January 2008, the ordinary shares of 12.5p each were consolidated on the basis of 58 new ordinary shares of 14 51⁄116p nominal value for every 67 ordinary shares of 12.5p each held.
Capital gains tax
Themid-market price of RELX PLC’s £1 ordinary shares on 31 March 1982 was 282p. Adjusting for thesub-divisions and share consolidation referred to above results in an equivalentmid-market price of 40.72p for each existing ordinary share of 14 51⁄116p nominal value.
Warning to shareholders – unsolicited investment advice
| ◾ | | From time to time shareholders may receive unsolicited calls from fraudsters |
| ◾ | | Fraudsters use persuasive and high-pressure tactics to lure investors into scams, sometimes known as boiler room scams |
| ◾ | | They may offer to sell shares that turn out to be worthless ornon-existent, or to buy shares at an inflated price in return for an upfront payment |
| ◾ | | While high profits are promised, if you buy or sell shares in this way you will probably lose your money |
| ◾ | | Thousands of people contact the Financial Conduct Authority about investment fraud each year, with victims losing an average of £32,000 |
How to avoid share fraud and boiler room scams
The Financial Conduct Authority (FCA) has issued some guidance on how to recognise and avoid investment fraud:
| ◾ | | Legitimate firms authorised by the FCA are unlikely to contact you unexpectedly with an offer to buy or sell shares |
| ◾ | | If you receive an unsolicited phone call, do not get into a conversation, note the name of the person and firm contacting you and then end the call |
| ◾ | | Check the Financial Services Register available at https://register.fca.org.uk/ to see if the person and firm contacting you is authorised by the FCA. If you wish to call the person or firm back, only use the contact details listed on the Register |
| ◾ | | Call the FCA on 0800 111 6768 if the firm does not have any contact details on the Register, or if you are told that they are out of date |
| ◾ | | Search the list of unauthorised firms to avoid at https://www.fca.org.uk/consumers/unauthorised-firms-individuals#list |
| ◾ | | If you do buy or sell shares through an unauthorised firm, you will not have access to the Financial Ombudsman Service or the Financial Services Compensation Scheme |
| ◾ | | Consider obtaining independent financial and professional advice before you hand over any money. If it sounds too good to be true it probably is. |
How to report a scam
If you are approached by fraudsters, please tell the FCA using the share fraud reporting form at www.fca.org.uk/consumers/ report-scam-unauthorised-firm, where you can find out more about investment scams. You can also call the FCA Consumer Helpline on 0800 111 6768.
If you have already paid money to share fraudsters, you should contact Action Fraud on 0300 123 2040 or use their online tool: http://www.actionfraud.police.uk/report_fraud
| | |
| 190 | | RELX Group Annual reports and financial statements 2017 |
|
|
Shareholder information and contacts
Information for RELX NV ordinary shareholders
Shareholder services
Enquiries from holders of RELX NV registered ordinary shares in relation to share transfers, dividends, change of address and bank accounts should be directed to the Company Secretary of RELX NV, at the registered office address shown below.
Dividends
Dividends on RELX NV ordinary shares are declared and paid in euros. Registered shareholders in RELX NV will receive dividends from the Company by transmission to the bank account which they have notified to the Company. Dividends on shares in bearer form are paid through the intermediary of a bank or broker.
Dividend Reinvestment Plan
By instructing their bank or intermediary, shareholders can choose to reinvest their RELX NV dividends by purchasing further shares through the Dividend Reinvestment Plan (DRIP) provided by ABN AMRO Bank NV. Further information concerning the DRIP facility can be obtained online at www.securitiesinfo.com.
Consolidation of ordinary shares
On 7 January 2008, the RELX NV ordinary shares of€0.06 each were consolidated on the basis of 58 new ordinary shares of€0.07 each for every 67 ordinary shares of€0.06 each held.
Information for RELX PLC and RELX NV ADR holders
ADR shareholder services
The RELX PLC and RELX NV ADR Depositary is Citibank NA.
Enquiries concerning RELX PLC and RELX NV ADRs should be addressed to the ADR Depositary at the address shown below.
Dividends
Dividend payments on RELX PLC and RELX NV ADRs are converted into US dollars by the ADR Depositary.
Annual Report on Form20-F
The RELX Group Annual Report on Form20-F is filed electronically with the United States Securities and Exchange Commission. A copy of the Form20-F is available on the Group’s website, or from the ADR Depositary at the address shown below.
Contacts
RELX PLC
Head Office and Registered Office
1-3 Strand
London WC2N 5JR
United Kingdom
Tel: +44 (0)20 7166 5500
Fax: +44 (0)20 7166 5799
Auditors
Ernst & Young LLP
1 More London Place
London SE1 2AF
United Kingdom
Registrar
Equiniti Limited
Aspect House
Spencer Road
Lancing BN99 6DA
West Sussex
United Kingdom
| | |
| | www.shareview.co.uk |
Tel: 0371 384 2960 (UK callers)
Tel: +44 121 415 7047 (callers outside the UK)
RELX NV
Head Office and Registered Office
Radarweg 29
1043 NX Amsterdam
The Netherlands
Tel: +31 (0)20 485 2222
Fax: +31 (0)20 485 2032
Auditors
Ernst & Young Accountants LLP
Antonio Vivaldistraat 150
1083 HP Amsterdam
The Netherlands
Listing/paying agent
ABN AMRO Bank NV
Gustav Mahlerlaan 10
1082 PP Amsterdam
The Netherlands
| | |
| | www.securitiesinfo.com |
RELX PLC and RELX NV ADR Depositary
Citibank Depositary Receipt Services
PO Box 43077
Providence, RI 02940-3077
USA
| | |
| | www.citi.com/dr |
Email: citibank@shareholders-online.com
Tel: +1 877 248 4327
+1 781 575 4555 (callers outside the US)
| | |
| Financial statements and other information Shareholder information | | 191 |
|
|
2018 financial calendar
| | |
| 15 February | | Results announcement for the year ended 31 December 2017 |
| 18 April | | Trading update issued in relation to the 2018 financial year |
| 18 April | | RELX NV Annual General Meeting – The Grand Hotel, Oudezijds Voorburgwal 197, 1012 EX Amsterdam, The Netherlands |
| 19 April | | RELX PLC Annual General Meeting – Millennium Hotel, Grosvenor Square, London W1K 2HP |
| 26 April | | Ex-dividend date – 2017 final dividend, RELX PLC and RELX NV ordinary shares and ADRs |
| 27 April | | Record date – 2017 final dividend, RELX PLC and RELX NV ordinary shares and ADRs |
| 22 May | | Payment date – 2017 final dividend, RELX PLC and RELX NV ordinary shares |
| 25 May | | Payment date – 2017 final dividend, RELX PLC and RELX NV ADRs |
| 26 July | | Interim results announcement for the six months to 30 June 2018 |
| 2 August* | | Ex-dividend date – 2018 interim dividend, RELX PLC and RELX NV ordinary shares and ADRs |
| 3 August* | | Record date – 2018 interim dividend, RELX PLC and RELX NV ordinary shares and ADRs |
| 24 August* | | Payment date – 2018 interim dividend, RELX PLC and RELX NV ordinary shares |
| 29 August* | | Payment date – 2018 interim dividend, RELX PLC and RELX NV ADRs |
* These dates remain provisional and subject to change.
Dividend history
The following tables set out dividends paid (or proposed) in relation to the three financial years 2015–2017.
| | | | | | | | | | | | |
| ORDINARY SHARES | | pence per PLC ordinary share | | | € per NV ordinary share | | | Payment date | |
Final dividend for 2017** | | | 27.70 | | | | 0.316 | | | | 22 May 2018 | |
Interim dividend for 2017 | | | 11.70 | | | | 0.132 | | | | 25 August 2017 | |
Final dividend for 2016 | | | 25.70 | | | | 0.301 | | | | 22 May 2017 | |
Interim dividend for 2016 | | | 10.25 | | | | 0.122 | | | | 26 August 2016 | |
Final dividend for 2015 | | | 22.30 | | | | 0.288 | | | | 20 May 2016 | |
Interim dividend for 2015 | | | 7.40 | | | | 0.115 | | | | 28 August 2015 | |
** Proposed dividend, to be submitted for approval at the respective Annual General Meetings of RELX PLC and RELX NV in April 2018. | |
ADRS | | $ per PLC ADR | | | $ per NV ADR | | | Payment date | |
Final dividend for 2017 | | | *** | | | | *** | | | | 25 May 2018 | |
Interim dividend for 2017 | | | 0.15085 | | | | 0.15659 | | | | 30 August 2017 | |
Final dividend for 2016 | | | 0.33387 | | | | 0.33817 | | | | 25 May 2017 | |
Interim dividend for 2016 | | | 0.13452 | | | | 0.13645 | | | | 31 August 2016 | |
Final dividend for 2015 | | | 0.32348 | | | | 0.32247 | | | | 25 May 2016 | |
Interim dividend for 2015 | | | 0.11356 | | | | 0.12836 | | | | 2 September 2015 | |
*** Payment will be determined using the appropriate £/US$ and€/US$ exchange rate on 22 May 2018.
Notes:
The dividend rates shown for RELX NV ordinary shares and ADRs are gross dividend rates before the deduction of Dutch withholding tax.
| | |
| 192 | | RELX Group Annual reports and financial statements 2017 |
|
|
Cautionary note
This Announcement does not constitute or form part of any offer to sell or subscribe for or any invitation to purchase or subscribe for any securities or the solicitation of any vote or approval in any jurisdiction pursuant to the simplification. It does not constitute a prospectus or prospectus equivalent document and investors should not make any investment decision in relation to any shares referred to in this Announcement. No offer of securities shall be made except by means of a prospectus meeting the requirements of the Securities Act of 1933, as amended, and applicable European rules and regulations. A prospectus is expected to be made available to shareholders on RELX Group’s website (www.relx.com) in due course.
Important additional information will be filed with the SEC
In addition to the prospectus to be made available to shareholders, RELX PLC will file with the U.S. Securities and Exchange Commission (the “SEC”) a registration statement on FormF-4 that will include the prospectus. RELX PLC plans to mail the prospectus to the holders of American Depositary Shares of RELX N.V. and U.S. holders of ordinary shares of RELX N.V. (collectively, “RELX NV U.S. Shareholders”) in connection with the Simplification. RELX N.V. U.S. SHAREHOLDERS ARE URGED TO READ THE PROSPECTUS AND OTHER RELEVANT DOCUMENTS FILED OR TO BE FILED WITH THE SEC CAREFULLY WHEN THEY BECOME AVAILABLE BECAUSE THEY WILL CONTAIN IMPORTANT INFORMATION ABOUT RELX PLC, RELX N.V., THE SIMPLIFICATION AND RELATED MATTERS. RELX N.V. U.S. Shareholders will be able to obtain free copies of the prospectus and other documents filed with the SEC by RELX PLC and RELX N.V. through the website maintained by the SEC at www.sec. gov. In addition, RELX N.V. U.S. Shareholders will be able to obtain free copies of the prospectus and other documents filed by RELX PLC with the SEC by contacting RELX Investor Relations at1-3 Strand, London WC2N 5JR or by calling +44 20 7166 5634.
Credits
| | |
Designed and produced by mslgroup.co.uk Board photography by Douglas Fry, Piranha Photography Printed by Pureprint Group, ISO14001, FSC® certified and CarbonNeutral® The 2017 Annual Reports and Financial Statements is printed using paper containing a minimum of 75% recycled content, of which 100% isde-inked post-consumer waste. All of the pulp is bleached using an elemental chlorine free process (ECF). Printed in the UK by Pureprint using their environmental printing technology; vegetable inks were used throughout. Pureprint is a CarbonNeutral® company. Both manufacturing mill and printer are ISO14001 registered and are Forest Stewardship Council® (FSC)chain-of-custody certified. 
| | |