Exhibit 99.2
|
|
| |
| T A B L E O F C O N T E N T S |
|
| |
| Introduction | |
| | |
| Shareholder Letter | |
| | |
| Quarterly Overview | |
| | |
Ñ Fourth Quarter Highlights | |
| | |
Ñ GAAP Net Income and Reconciliation to Non-GAAP Core Earnings | |
| | |
Ñ Analysis of Earnings | |
| | |
Ñ GAAP Book Value | |
| | |
Ñ Capital Allocations | |
| | |
Ñ 2018 Financial Outlook | |
| | |
| Financial Insights | |
| | |
Ñ Segment Results | |
| | |
Ñ Balance Sheet Analysis | |
| | |
| Financial Tables | |
| | |
| Appendix | |
| | |
Ñ Redwood’s Business Overview | |
| | |
Ñ Dividend Policy | |
| | |
Ñ Core Earnings Definition | |
| | |
Ñ Forward-Looking Statements | |
| | |
Ñ Glossary | |
|
|
| |
| THE REDWOOD REVIEW I 4TH QUARTER 2017 |
| 1 |
|
|
| |
| C A U T I O N A R Y S T A T E M E N T |
This Redwood Review contains forward-looking statements within the meaning of the safe harbor provisions of the Private Securities Litigation Reform Act of 1995. Forward-looking statements involve numerous risks and uncertainties. Our actual results may differ from our expectations, estimates, and projections and, consequently, you should not rely on these forward-looking statements as predictions of future events. Forward-looking statements are not historical in nature and can be identified by words such as “anticipate,” “estimate,” “will,” “should,” “expect,” “believe,” “intend,” “seek,” “plan,” and similar expressions or their negative forms, or by references to strategy, plans, goals, or intentions. These forward-looking statements are subject to risks and uncertainties, including, among other things, those described in our Annual Report on Form 10-K under the caption “Risk Factors.” Other risks, uncertainties, and factors that could cause actual results to differ materially from those projected are described below and may be described from time to time in reports we file with the Securities and Exchange Commission, including reports on Forms 10-K, 10-Q, and 8-K. We undertake no obligation to update or revise forward-looking statements, whether as a result of new information, future events, or otherwise.
Statements regarding the following subjects, among others, are forward-looking by their nature: statements we make regarding Redwood’s business strategy and strategic focus, statements related to our financial outlook and expectations for 2018, statements regarding our available capital and sourcing additional capital both internally and from the capital markets, and other statements regarding pending business activities and expectations and estimates relating to our business and financial results. Additional detail regarding the forward-looking statements in this Redwood Review and the important factors that may affect our actual results in 2018 are described in the Appendix of this Redwood Review under the heading “Forward-Looking Statements.”
|
|
| |
| THE REDWOOD REVIEW I 4TH QUARTER 2017 |
| 2 |
Note to Readers:
We file annual reports (on Form 10-K) and quarterly reports (on Form 10-Q) with the Securities and Exchange Commission. These filings and our earnings press releases provide information about Redwood and our financial results in accordance with generally accepted accounting principles (GAAP). We urge you to review these documents, which are available through our website, www.redwoodtrust.com.
This document, called The Redwood Review, is an additional format for providing information about Redwood through a discussion of our GAAP financial results, as well as other metrics, such as taxable income. Supplemental information is also provided in the Financial Tables in this Review to facilitate more detailed understanding and analysis of Redwood. We also provide non-GAAP financial measures in this Review. When we use non-GAAP financial measures it is because we believe that these figures provide additional insight into Redwood’s business. In each case in which we discuss a non-GAAP financial measure we provide an explanation of how it has been calculated, why we think the figure is important, and a reconciliation between the GAAP and non-GAAP figures.
References herein to “Redwood,” the “company,” “we,” “us,” and “our” include Redwood Trust, Inc. and its consolidated subsidiaries. Note that because we round numbers in the tables to millions, except per share amounts, some numbers may not foot due to rounding. References to the “fourth quarter” refer to the quarter ended December 31, 2017, and references to the “third quarter” refer to the quarter ended September 30, 2017, unless otherwise specified.
We hope you find this Review helpful to your understanding of our business. We thank you for your input and suggestions, which have resulted in our changing the form and content of The Redwood Review over time.
|
| | | | | | | | | | | |
| | Selected Financial Highlights |
| |
| | Quarter:Year | | GAAP Income per Share | | REIT Taxable Income per Share (1) | | Annualized GAAP Return on Equity | | GAAP Book Value per Share | | Dividends per Share |
| | Q417 | | $0.35 | | $0.42 | | 10% | | $15.83 | | $0.28 |
| | Q317 | | $0.41 | | $0.26 | | 12% | | $15.67 | | $0.28 |
| | Q217 | | $0.43 | | $0.25 | | 12% | | $15.29 | | $0.28 |
| | Q117 | | $0.43 | | $0.22 | | 13% | | $15.13 | | $0.28 |
| | Q416 | | $0.31 | | $0.34 | | 9% | | $14.96 | | $0.28 |
| | Q316 | | $0.58 | | $0.34 | | 19% | | $14.74 | | $0.28 |
| | Q216 | | $0.48 | | $0.36 | | 15% | | $14.20 | | $0.28 |
| | Q116 | | $0.15 | | $0.23 | | 4% | | $14.17 | | $0.28 |
| | Q415 | | $0.46 | | $0.37 | | 14% | | $14.67 | | $0.28 |
| | | | | | | | | | | | |
| |
| (1) | REIT taxable income per share for 2017 is an estimate until we file our tax return. |
|
|
| |
| THE REDWOOD REVIEW I 4TH QUARTER 2017 |
| 3 |
|
|
| |
| S H A R E H O L D E R L E T T E R |
Dear Fellow Shareholders:
During the past few years, the financial markets enjoyed a quiet, seemingly uninterrupted ascent forward: equities reached new all-time highs, volatility remained subdued, credit spreads ratcheted tighter, and long-term interest rates remained near historically low levels. All the while, politicians in Washington battled to a standstill in achieving any meaningful fiscal policy reforms.
Well, we all know a lot has changed recently. Equities have been under pressure, volatility has increased, long-term rates are trending higher, we have a new tax plan, the grip of regulation is easing, and GSE reform is back on the table. We will try to cover the macro impact of these changes in this letter, but we believe the short summary is that the net impact to Redwood is favorable.
It is against this backdrop that we move forward, mindful of market forces but confident in our operating plan. At our core, we remain patient, long-term credit investors who measure outcomes in years, not quarters. Our strengths continue to lie where they always have: in sourcing and analyzing housing credit risk, prudent management of our capital base, and our ability to execute in the marketplace. In an era where demand for residential mortgage credit risk continues to outstrip supply, our ability to organically create investments that we could not otherwise source remains a key competitive advantage.
In this letter, we provide a brief recap of our 2017 financial metrics, cover capital and investing activities, and provide an update on our residential mortgage banking activities. We also touch on tax reform and close with our company goals and outlook for 2018.
2017 Financial Results
We had a productive 2017 overall, generating good financial results while laying the groundwork to scale our business more profitably. We generated an 11.9% GAAP return on equity (ROE), and increased our GAAP book value per share by $0.87 to $15.83 at year-end 2017. This represented the largest annual increase in book value since 2013, and importantly was driven in part by the excess of earnings over our dividend. We generated GAAP earnings per share of $1.60, as compared with $1.54 in 2016, and consistent with 2016, we paid cumulative dividends of $1.12 per share in 2017. Details on our fourth quarter metrics can be found in the Quarterly Overview section of this Redwood Review.
Capital and Investing
We deployed $511 million of capital in 2017 (including $37 million of debt repurchases and $9 million of share repurchases). As spreads tightened, particularly in the second half of 2017, we were active in optimizing our portfolio, selling $281 million of mostly lower yielding securities and the remainder of our non-core conforming MSR portfolio, capturing gains and freeing up $167 million of capital for redeployment into higher-yielding investments.
|
|
| |
| THE REDWOOD REVIEW I 4TH QUARTER 2017 |
| 4 |
|
|
| |
| S H A R E H O L D E R L E T T E R |
At December 31, 2017, we estimate that our capital available for investments was approximately $280 million. Subsequent to year-end, we have continued to optimize our portfolio and have sufficient capital to repay our maturing convertible debt due in April.
Residential Mortgage Banking
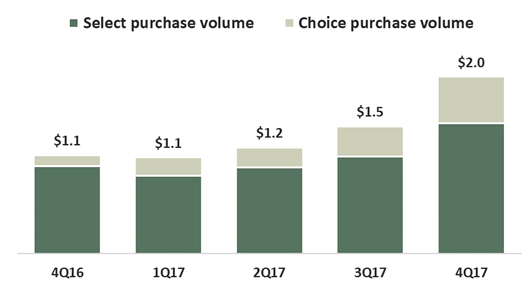
After three consecutive quarters of outsized returns, the mortgage banking team experienced more normalized earnings in the fourth quarter. Margins in the fourth quarter were below our long-term expectation of 75-100 basis points, as loan prices softened heading into year-end. However, market conditions rebounded in January, and we have taken full advantage. Thus far in 2018, we have priced and closed two Select securitizations, and priced three additional transactions (two Select, one Choice) that are scheduled to close in the coming weeks. These five transactions priced at significantly better executions relative to the fourth quarter and together included just over $2 billion of loans.
We completed two Sequoia transactions in the fourth quarter of 2017, one each from our Choice and Select programs, and sold $474 million of whole loans to portfolio buyers. The Choice securitization was received favorably by the market, attracting a diverse group of both new and existing investors. The issuance created $47 million of credit securities that we retained, utilizing approximately $15 million of capital, around three times that of a traditional Sequoia transaction. Given the current pace of Choice purchases, we expect to issue larger transactions going forward.
Total purchase volume was $2.0 billion in the fourth quarter of 2017, an increase of 33% over the third quarter. Our full-year total purchase volume was $5.7 billion - at the higher end of the $5 to $6 billion guidance we set out for investors in February 2017 and an increase of over 20% from our 2016 volume. Choice represented almost 30% of our full-year lock volume and was a key driver of our year-over-year growth.
As we look forward to 2018, our focus continues to be on growing our Choice volume while maintaining our competitive position in Select through speed, reliability and deepening relationships with our sellers. Our recent success in the securitization market has attracted competition from both new and existing conduit platforms - as we expected would happen. We continue to drive operational efficiencies and enhance our program offerings to maintain our competitive advantages.
Tax Reform
Overall, our view is that the tax reform bill is a net positive for Redwood. The most direct benefit to Redwood is the reduction in the corporate tax rate from 35% to 21%, which benefits our mortgage banking activities and non-REIT eligible investments, both of which are housed within our taxable REIT subsidiaries. This rate reduction also resulted in a $8 million benefit to our fourth quarter results from the reduction of our net federal deferred tax liabilities.
|
|
| |
| THE REDWOOD REVIEW I 4TH QUARTER 2017 |
| 5 |
|
|
| |
| S H A R E H O L D E R L E T T E R |
Additionally, beginning in 2018, individual taxpayers may deduct 20% of their ordinary REIT dividends from taxable income. This results in a maximum federal effective tax rate of 29.6% on an individual taxpayer’s ordinary REIT dividends, compared to the highest marginal rate of 37%.
The broader impact from tax reform on the housing market remains unclear. Although existing mortgages up to $1 million will be grandfathered in for the full mortgage interest deduction, the new limit decreases to $750,000 of unpaid principal balance, and will remain limited to two homes. Property tax and state/local income tax deductions will be limited to $10,000 and the standard deduction will roughly double. Although households with jumbo mortgages will likely not take the standard deduction, these changes could potentially have a marginally negative impact on home demand and jumbo origination volume. They may also impact the rent versus buy decision for newly-formed households, further broadening financing needs for housing investors.
2018 Outlook
We continue to operate in an environment that rewards creativity, crisp execution, and rigorous risk management - all of which are hallmarks of our company. To succeed, we will continue to leverage our core strengths to further enhance our strategic value to the housing finance market. We will expand on our core mortgage credit strategies, with an emphasis on our Redwood Choice loan program. Additionally, we will pursue initiatives that are responsive to secular trends in the housing market and consistent with our core competencies, including financing single-family housing investors and providing new types of capital solutions to our seller base.
While volatility is once again something to contend with, we are confident that our strategy is durable and built to succeed for the long-term. Our priorities for the remainder of 2018 are to generate GAAP earnings that exceed our recent historical annual dividends of $1.12 per share, grow our residential loan purchase volume, and maintain our strong capital deployment trends. We anticipate deploying capital towards new initiatives in a manner conducive to our long-term success. More detail on our 2018 outlook is included on page 13 of this Redwood Review.
We are excited to watch our business and industry evolve in 2018, and thank you for your continued support.
|
| | |
| | |
| Marty Hughes | | Christopher J. Abate |
| Chief Executive Officer | | President |
|
|
| |
| THE REDWOOD REVIEW I 4TH QUARTER 2017 |
| 6 |
|
|
| |
| Q U A R T E R L Y O V E R V I E W |
Fourth Quarter Highlights
| |
| Ñ | Our GAAP earnings were $0.35 per share for the fourth quarter of 2017, as compared with $0.41 per share for the third quarter of 2017, primarily driven by lower mortgage banking income relative to the third quarter. This decrease was partially offset by a tax benefit related to recent tax reform. |
| |
| Ñ | Our non-GAAP core earnings(1) were $0.35 per share for the fourth quarter of 2017, consistent with $0.35 per share for the third quarter of 2017. |
| |
| Ñ | Our GAAP book value was $15.83 per share at December 31, 2017, as compared with $15.67 per share at September 30, 2017. This increase was driven primarily by our quarterly earnings exceeding our dividend and higher fair values on our available-for-sale securities. |
| |
| Ñ | We deployed $109 million of capital in the fourth quarter of 2017 toward new investments, including $24 million in Agency residential CRT securities, $66 million in Sequoia and third-party RMBS, and $19 million in Agency multifamily securities. |
| |
| Ñ | We also deployed $9 million of capital to repurchase shares of Redwood stock at an average price of $15.05 per share during the fourth quarter and through February 22, 2018 had deployed an additional $16 million toward share repurchases. |
| |
| Ñ | We sold $80 million of securities during the fourth quarter of 2017, freeing up $37 million of capital for reinvestment after the repayment of associated debt. |
| |
| Ñ | We purchased $2.0 billion of residential jumbo loans during the fourth quarter of 2017. At December 31, 2017, our pipeline of jumbo residential loans identified for purchase was $1.2 billion. |
| |
| Ñ | Residential loan sales totaled $1.2 billion during the fourth quarter of 2017 and included $0.5 billion of whole loan sales to third parties and $0.7 billion of loans that were securitized. |
| |
| Ñ | Our recourse debt to equity leverage ratio was 3.7x at the end of the fourth quarter of 2017, as compared to 3.2x at the end of the third quarter. The increase was primarily related to the higher balance of loans held-for-sale and financed with warehouse debt at the end of the fourth quarter. |
_____________________
(1) For details on GAAP and core earnings, please see the GAAP Net Income and Reconciliation to Non-GAAP Core Earnings section that follows on page 8.
|
|
| |
| THE REDWOOD REVIEW I 4TH QUARTER 2017 |
| 7 |
|
|
| |
| Q U A R T E R L Y O V E R V I E W |
GAAP Net Income and Reconciliation to Non-GAAP Core Earnings
Below we present GAAP net income and a reconciliation to non-GAAP core earnings for the fourth and third quarters of 2017. Further information about Redwood's core earnings measure is included in the Core Earnings Definition section of the Appendix.
|
| | | | | | | | |
| |
| GAAP Net Income and Reconciliation to Non-GAAP Core Earnings |
| ($ in millions, except per share data) |
| | Three Months Ended | |
| | 12/31/2017 | | 9/30/2017 | |
| | | | | |
| Interest income | $ | 71 |
| | $ | 63 |
| |
| Interest expense | (36 | ) | | (27 | ) | |
| Net interest income | 35 |
| | 35 |
| |
| | | | | |
| Non-interest income | | | | |
| Mortgage banking activities, net | 3 |
| | 21 |
| |
| MSR income, net | 2 |
| | 2 |
| |
| Investment fair value changes, net | — |
| | — |
| |
| Other income | 1 |
| | 1 |
| |
| Realized gains, net | 5 |
| | 2 |
| |
| Total non-interest income, net | 11 |
| | 26 |
| |
| | | | | |
| Operating expenses | (20 | ) | | (20 | ) | |
| Benefit from (provision for) income taxes | 5 |
| | (5 | ) | |
| | | | | |
| GAAP net income | $ | 31 |
| | $ | 36 |
| |
| | | | | |
| Core earnings adjustments | | | | |
Eliminate mark-to-market changes on long-term investments and associated derivatives (1) | (7 | ) | | (6 | ) | |
Include cumulative gain (loss) on long-term investments sold, net (2) | 5 |
| | 1 |
| |
Income tax adjustments associated with core earnings adjustments (3) | 2 |
| | (1 | ) | |
| Non-GAAP core earnings | $ | 30 |
| | $ | 30 |
| |
| | | | | |
| GAAP net income per diluted common share | $ | 0.35 |
| | $ | 0.41 |
| |
Non-GAAP core earnings per diluted common share (4) | $ | 0.35 |
| | $ | 0.35 |
| |
| |
| (1) | Adjustments eliminate the mark-to-market changes on the fair value of loans held-for-investment, trading securities, other investments, and associated derivatives that are primarily related to changes in benchmark interest rates and credit spreads. Details on the components of investment fair value changes, net, are included in the Appendix of this Redwood Review. |
| |
| (2) | Adjustment includes the cumulative net gains or losses on long-term investments accounted for as trading securities under GAAP that were sold during the period presented, net of any realized gains or losses from derivatives associated with the investments sold. Cumulative gains and losses are calculated by multiplying the difference between the sales price and original purchase price by the face value of the securities sold. |
| |
| (3) | We apply estimated effective tax rates to core earnings adjustments occurring within Redwood's taxable REIT subsidiaries to estimate the hypothetical income tax expense or benefit associated with those adjustments. |
| |
| (4) | Consistent with the calculation of net income per diluted common share for GAAP purposes, non-GAAP core earnings per diluted common share is calculated following the "two-class" method. Additional information on the calculation of core earnings using the "two-class" method can be found in Table 2 in the Financial Tables section of this Redwood Review. |
|
|
| |
| THE REDWOOD REVIEW I 4TH QUARTER 2017 |
| 8 |
|
|
| |
| Q U A R T E R L Y O V E R V I E W |
Analysis of Earnings
| |
| Ñ | Net interest income of $35 million for the fourth quarter was consistent with the third quarter of 2017. Higher portfolio net interest income from capital deployment was offset by higher interest costs from a full quarter of interest expense on our convertible debt offering in August. |
| |
| Ñ | Mortgage banking activities, net, decreased to $3 million for the fourth quarter, from $21 million for the third quarter of 2017, reflecting the impact to margins from a temporary pull-back in loan pricing at year-end. |
| |
| Ñ | Investment fair value changes, net, on a GAAP basis were less than $1 million for the fourth quarter, consistent with the third quarter of 2017, as hedge costs and the effect of principal paydowns on our loans and securities held at a premium were more than offset by the net benefit from spread tightening on our securities portfolio. On a non-GAAP core earnings basis, after eliminating certain mark-to-market changes on long-term investments (and associated derivatives), investment fair value changes, net, were negative $7 million for the fourth quarter of 2017, as compared with negative $6 million for the third quarter of 2017. |
| |
| Ñ | On a GAAP basis, we realized gains of $5 million during the fourth quarter, which were primarily related to the sale of $29 million of available-for-sale securities, as compared with realized gains of $2 million during the third quarter of 2017. On a non-GAAP core earnings basis, realized gains also includes the cumulative net gains or losses on trading securities sold. This adjustment increased realized gains, net to $9 million for the fourth quarter from the sale of $51 million of trading securities, as compared with $3 million for the third quarter. |
| |
| Ñ | Operating expenses were $20 million for the fourth quarter, consistent with the third quarter of 2017. Fourth quarter operating expenses included variable compensation commensurate with our full-year financial results. |
| |
| Ñ | We recorded a tax benefit of $5 million during the fourth quarter, as compared with a tax provision of $5 million for the third quarter of 2017. The tax benefit in the fourth quarter includes an $8 million benefit associated with the reduction of our net federal deferred tax liabilities from recent tax reform. A reconciliation of GAAP and taxable income is set forth in Table 6 in the Financial Tables section of this Redwood Review. |
| |
| Ñ | Additional details on our earnings are included in the Segment Results portion of the Financial Insights section that follows. |
|
|
| |
| THE REDWOOD REVIEW I 4TH QUARTER 2017 |
| 9 |
|
|
| |
| Q U A R T E R L Y O V E R V I E W |
GAAP Book Value
The following table sets forth the changes in Redwood’s GAAP book value per share for the fourth and third quarters of 2017.
|
| | | | | | | | |
| |
| Changes in GAAP Book Value per Share |
| ($ in per share) |
| | Three Months Ended | |
| | 12/31/2017 | | 9/30/2017 | |
| | | | | |
| Beginning book value per share | $ | 15.67 |
| | $ | 15.29 |
| |
| Earnings | 0.35 |
| | 0.41 |
| |
| Changes in unrealized gains on securities, net from: | | | | |
| Realized gains recognized in earnings | (0.03 | ) | | (0.03 | ) | |
| Amortization income recognized in earnings | (0.04 | ) | | (0.05 | ) | |
| Mark-to-market adjustments, net | 0.12 |
| | 0.27 |
| |
| Total change in unrealized gains on securities, net | 0.05 |
| | 0.19 |
| |
| Dividends | (0.28 | ) | | (0.28 | ) | |
| Equity compensation, net | (0.02 | ) | | 0.02 |
| |
| Changes in unrealized losses on derivatives hedging long-term debt | 0.02 |
| | — |
| |
| Other, net | 0.04 |
| | 0.04 |
| |
| | | | | |
| Ending book value per share | $ | 15.83 |
| | $ | 15.67 |
| |
| |
Ñ | Our GAAP book value per share increased $0.16 per share to $15.83 per share during the fourth quarter of 2017. This increase was driven primarily by earnings exceeding the dividend, and positive mark-to-market adjustments on our available-for-sale securities. |
| |
Ñ | Unrealized gains on our available-for-sale securities increased $0.05 per share during the fourth quarter of 2017. This increase primarily resulted from a positive $0.12 per share mark-to-market adjustment on our available-for-sale securities due to spread tightening during the quarter, which was partially offset by $0.04 per share of discount accretion income recognized in earnings from the appreciation in the amortized cost basis of our available-for-sale securities, and $0.03 per share of previously unrealized net gains that were realized as income from the sale of securities. |
|
|
| |
| THE REDWOOD REVIEW I 4TH QUARTER 2017 |
| 10 |
|
|
| |
| Q U A R T E R L Y O V E R V I E W |
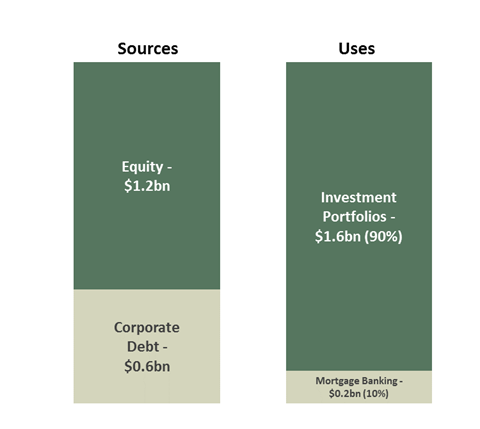
Capital Allocations
We use a combination of equity and corporate debt (which we collectively refer to as “capital”) to fund our business.
Capital Allocation: By Source and By Business Use
(as of December 31, 2017)
| |
| Ñ | Our total capital of $1.8 billion at December 31, 2017 included $1.2 billion of equity capital and $0.6 billion of the total $2.6 billion of long-term debt on our consolidated balance sheet. This portion of debt includes $201 million of exchangeable debt due in 2019, $245 million of convertible debt due in 2023, and $140 million of trust-preferred securities due in 2037. This portion of debt has a weighted average cost of approximately 6.0%. |
| |
| Ñ | We also utilize various forms of short-term and long-term collateralized debt to finance certain investments and to warehouse our inventory of certain residential loans held-for-sale. We do not consider this collateralized debt as "capital" and, therefore, exclude it from our capital allocation analysis. |
| |
| Ñ | The Balance Sheet Analysis portion of the Financial Insights section that follows describes our long-term and short-term borrowings in further detail. |
|
|
| |
| THE REDWOOD REVIEW I 4TH QUARTER 2017 |
| 11 |
|
|
| |
| Q U A R T E R L Y O V E R V I E W |
|
| | | | | | | | | | | | | | |
| |
| Capital Allocation Detail |
| By Investment Type |
| December 31, 2017 |
| ($ in millions) |
| | GAAP Fair Value | | Collateralized Debt | | Allocated Capital | | % of Total Capital | |
| | | | | | | | | |
Residential loans (1) | $ | 2,478 |
| | $ | (2,000 | ) | | $ | 478 |
| | 27% | |
| | | | | | | | | |
| Securities portfolio | | | | | | | | |
| Third party residential securities | 832 |
| | (235 | ) | | 596 |
| | 33% | |
Sequoia residential securities (2) | 399 |
| | (174 | ) | | 225 |
| | 13% | |
| Multifamily securities | 324 |
| | (240 | ) | | 84 |
| | 5% | |
| Total securities portfolio | 1,555 |
| | (649 | ) | | 906 |
| | 51% | |
| | | | | | | | | |
| Mortgage servicing rights | 64 |
| | — |
| | 64 |
| | 4% | |
| Other assets/(Liabilities) | 105 |
| | (40 | ) | | 65 |
| | 4% | |
| Cash and liquidity capital | | | | | 325 |
| | NA | |
| (Capital allocated to convert. repayment) | | | | | (250 | ) | | NA | |
| | | | | | | | | |
| Total Investments | $ | 4,201 |
| | $ | (2,689 | ) | | $ | 1,587 |
| | 89% | |
| | | | | | | | | |
| Residential mortgage banking | | | | | $ | 200 |
| | 11% | |
| | | | | | | | | |
| Total | | | | | $ | 1,787 |
| | 100% | |
| |
| (1) | Includes $43 million of FHLB stock. |
| |
| (2) | In addition to our $1.5 billion of securities on our GAAP balance sheet, securities presented above also include our $78 million economic investment in our Sequoia Choice securitizations, which represents the fair value of the securities we retained from these securitizations. For GAAP purposes, we consolidated these Sequoia Choice securitizations. |
| |
| Ñ | During the fourth quarter of 2017, we continued to optimize our portfolio by selling lower yielding CRT and mezzanine securities and redeploying the capital to higher-yielding alternatives. Additionally, during the fourth quarter, the FHLBC increased the collateral requirement on our borrowing facility, which increased the capital allocated to this portfolio. |
| |
| Ñ | At the end of the fourth quarter we increased the capital allocated to our residential mortgage banking operations to $200 million from $170 million to accommodate an anticipated increase in loan purchase volume in 2018. |
| |
| Ñ | As of December 31, 2017, our cash and liquidity capital included $280 million of capital available for investment or debt repayment. Subsequent to year-end, we have generated additional capital through portfolio optimization and we currently have sufficient capital to repay our maturing convertible debt in April. Going forward, as the initiatives we discussed above in the Shareholder Letter develop and require capital, we will consider the most efficient sources of capital both from continued optimization within our portfolio and from the capital markets. |
|
|
| |
| THE REDWOOD REVIEW I 4TH QUARTER 2017 |
| 12 |
|
|
| |
| Q U A R T E R L Y O V E R V I E W |
2018 Financial Outlook(1)
Consistent with prior years, we seek to generate earnings that exceed our expected annual dividend payment of $1.12 per share. Below we summarize key targeted 2018 operating metrics:
| |
| Ñ | Loan purchase volume of $7 to $8 billion is expected for 2018, versus $6 billion in 2017, and gross margins within our long-term expectations of 75 to 100 basis points. As part of our growth initiatives, we expect to double our Redwood Choice loan purchase volume in 2018. |
| |
| Ñ | Returns on our investment portfolio are expected to be between 9% and 11%. Investment returns include an estimate of net interest income, hedging costs, the effect of principal paydowns, realized gains, direct operating expenses, and taxes. |
| |
| Ñ | Beginning in the second quarter of 2018, we expect to deploy an increasing amount of capital towards new investment initiatives in the single-family and multifamily housing sectors. |
| |
| Ñ | Baseline corporate operating expenses are expected to be between $40 million to $45 million, with variable compensation commensurate with company performance. |
_____________________
| |
| (1) | As with all forward-looking statements, our forward-looking statements relating to our 2018 financial outlook are subject to risks and uncertainties, including, among other things, those described in our Annual Report on Form 10-K under the caption “Risk Factors” and other risks, uncertainties, and factors that could cause actual results to differ materially from those described above and under the heading "Forward-Looking Statements" in the Appendix to this Redwood Review, including those described in the “Cautionary Statement” at the beginning of this Redwood Review. Although we may update our 2018 financial outlook subsequently in 2018, as a general matter we undertake no obligation to update or revise forward-looking statements, whether as a result of new information, future events, or otherwise. |
|
|
| |
| THE REDWOOD REVIEW I 4TH QUARTER 2017 |
| 13 |
|
|
| |
| F I N A N C I A L I N S I G H T S |
Segment Results
We report on our business using two distinct segments: Investment Portfolio and Residential Mortgage Banking. The following table presents the results from each of these segments reconciled to our GAAP net income for the fourth and third quarters of 2017.
|
| | | | | | | | |
| |
Segment Results Summary (1) |
| ($ in millions) |
| | Three Months Ended | |
| | 12/31/2017 | | 9/30/2017 | |
| | | | | |
| Investment portfolio | | | | |
| Net interest income | $ | 39 |
| | $ | 38 |
| |
| Investment fair value changes, net | 5 |
| | 1 |
| |
| Other income | 3 |
| | 3 |
| |
| Realized gains | 5 |
| | 2 |
| |
| Operating expenses | (2 | ) | | (1 | ) | |
| Provision for income taxes | (1 | ) | | — |
| |
| Segment contribution | $ | 48 |
| | $ | 42 |
| |
| | | | | |
| Residential mortgage banking | | | | |
| Net interest income | $ | 7 |
| | $ | 6 |
| |
| Mortgage banking activities | 3 |
| | 21 |
| |
| Operating expenses | (7 | ) | | (6 | ) | |
| Provision for income taxes | 6 |
| | (5 | ) | |
| Segment contribution | $ | 9 |
| | $ | 17 |
| |
| |
|
| | | |
| Corporate/Other | (26 | ) | | (22 | ) | |
| | | | | |
| Net income | $ | 31 |
| | $ | 36 |
| |
| |
| (1) | Redwood's Business Overview section located in the Appendix of this Redwood Review includes full descriptions of these segments and how they fit into Redwood's business model. See Table 3 in the Financial Tables section of this Redwood Review for a more comprehensive presentation of our segment results. |
Investment Portfolio
| |
| Ñ | Segment contribution from our investment portfolio improved during the fourth quarter, primarily due to higher net interest income from increased capital deployment in our securities portfolio, an increase in the value of our securities from spread tightening during the fourth quarter, and increased gains on sales of securities from portfolio optimization activities. |
| |
| Ñ | Credit fundamentals in our investment portfolio remain strong, benefiting from continued housing price growth and improvements in the general economy. |
|
|
| |
| THE REDWOOD REVIEW I 4TH QUARTER 2017 |
| 14 |
|
|
| |
| F I N A N C I A L I N S I G H T S |
Residential Mortgage Banking
| |
| Ñ | Segment contribution from residential mortgage banking declined during the fourth quarter as a result of lower gross margins on increased loan purchase volume. The decline was partially offset by a tax benefit related to recent tax reform. |
| |
| Ñ | Loan purchase volume saw strong growth in the fourth quarter, with overall loan purchase volumes increasing 33% from the third quarter. Choice loan purchase volume increased over 50% from the third quarter. |
| |
| Ñ | During the fourth quarter of 2017, we completed our seventh traditional Select securitization and our second Choice securitization for the year. Loan sales in the fourth quarter of 2017 decreased to $1.2 billion from $1.4 billion (inclusive of securitized Choice loans). In addition, during the fourth quarter, we transferred loans of $274 million to our FHLB member-subsidiary. |
| |
| Ñ | High loan purchase volume in the fourth quarter, as well as seasonally lower loan distribution, resulted in a high relative balance of loans held-for-sale at the end of the fourth quarter. This, in combination with a softening in loan prices at the end of December, contributed to a decrease in mortgage banking income for the fourth quarter. |
| |
| Ñ | In early 2018, we completed two Select securitizations and priced three additional securitizations (two Select and one Choice), all of which are expected to close in the coming weeks. All of these transactions priced at meaningfully tighter spreads relative to year-end. |
| |
| Ñ | At December 31, 2017, we had 451 loan sellers, which included 185 jumbo sellers and 266 MPF Direct sellers from various FHLB districts. Currently, 82% of our sellers have rolled out the Choice program and 94% of these sellers have begun locking Choice loans. |
|
|
| |
| THE REDWOOD REVIEW I 4TH QUARTER 2017 |
| 15 |
|
|
| |
| F I N A N C I A L I N S I G H T S |
Balance Sheet Analysis
The following table presents our consolidated balance sheets at December 31, 2017 and September 30, 2017.
|
| | | | | | | | |
| |
Consolidated Balance Sheets (1) |
| ($ in millions) |
| | 12/31/2017 | | 9/30/2017 | |
| | | | | |
| Residential loans | $ | 5,115 |
| | $ | 4,185 |
| |
| Real estate securities | 1,477 |
| | 1,356 |
| |
| Mortgage servicing rights | 64 |
| | 63 |
| |
| Cash and cash equivalents | 145 |
| | 258 |
| |
| Total earning assets | 6,800 |
| | 5,862 |
| |
| | | | | |
| Other assets | 240 |
| | 269 |
| |
| Total assets | $ | 7,040 |
| | $ | 6,131 |
| |
| | | | | |
| Short-term debt | | | | |
| Mortgage loan warehouse debt | $ | 1,040 |
| | $ | 438 |
| |
| Security repurchase facilities | 649 |
| | 550 |
| |
Convertible notes, net (2) | 250 |
| | 250 |
| |
| Other liabilities | 149 |
| | 166 |
| |
| Asset-backed securities issued | 1,165 |
| | 944 |
| |
| Long-term debt, net | 2,575 |
| | 2,574 |
| |
| Total liabilities | 5,828 |
| | 4,922 |
| |
| | | | | |
| Stockholders’ equity | 1,212 |
| | 1,209 |
| |
| | | | | |
| Total liabilities and equity | $ | 7,040 |
| | $ | 6,131 |
| |
| |
| (1) | Our consolidated balance sheets include assets of consolidated variable interest entities (“VIEs”) that can only be used to settle obligations of these VIEs and liabilities of consolidated VIEs for which creditors do not have recourse to the primary beneficiary (Redwood Trust, Inc.). At December 31, 2017 and September 30, 2017, assets of consolidated VIEs totaled $1.3 billion and $1.0 billion, respectively, and liabilities of consolidated VIEs totaled $1.2 billion and $0.9 billion, respectively. See Table 9 in the Financial Tables section of the Appendix to this Redwood Review for additional detail on consolidated VIEs. |
| |
| (2) | Certain of our convertible notes are classified as Short-term debt as the maturity of the notes was less than one year as of the dates presented. |
|
|
| |
| THE REDWOOD REVIEW I 4TH QUARTER 2017 |
| 16 |
|
|
| |
| F I N A N C I A L I N S I G H T S |
Recourse Financing
We finance our business with a diversified mix of long-term and short-term recourse debt. The following charts present the composition of our recourse debt and its characteristics at the end of the fourth quarter:
|
| | | |
| |
| Borrowing Type | Average Cost of Funds | Average Remaining Term (yrs.) |
| | | |
| FHLBC Borrowings | 1.4% | 8 |
| Total Corporate Debt | 5.6% | 6 |
| Mortgage Warehouse | 3.2% | <1 |
| Securities Repurchase | 2.7% | <1 |
| | | |
| Weighted Average Cost of Funds | 2.6% | |
| | | |
| |
| Ñ | Our long-term corporate debt is comprised of our recently issued six-year 4.75% convertible notes due in 2023, our exchangeable notes due in 2019, and $140 million of trust-preferred securities due in 2037. In addition, total corporate debt includes $250 million of our convertible notes due in 2018. |
| |
| Ñ | Our FHLBC borrowings and securities repurchase debt are used to finance our whole loan and securities investments, respectively, and we utilize mortgage warehouse facilities to finance our mortgage banking activities. These are discussed in further detail in the following sections. |
| |
| Ñ | Our recourse debt to equity leverage ratio increased to 3.7x at the end of the fourth quarter of 2017 primarily as a result of the higher balance of loans held-for-sale and financed with warehouse debt at the end of the fourth quarter. |
| |
| Ñ | In addition to our recourse financing, we have ABS debt issued by securitization entities that we consolidate that is non-recourse to us. |
|
|
| |
| THE REDWOOD REVIEW I 4TH QUARTER 2017 |
| 17 |
|
|
| |
| F I N A N C I A L I N S I G H T S |
Residential Loan Investments
At December 31, 2017, we had $2.4 billion of jumbo residential loans held for investment. The following table presents the fair value of our residential loan investments at December 31, 2017.
|
| | | | | | | |
| |
| FHLB Portfolio By Loan and Coupon Type |
| December 31, 2017 |
| ($ in millions) |
| Loan Product Type | Total | | Weighted Average Coupon | |
| | | | | |
| Fixed rate | $ | 2,230 |
| | 4.08 | % | |
| Adjustable rate | 204 |
| | 4.07 | % | |
| | | | | |
| Total | $ | 2,434 |
| | 4.07 | % | |
| |
| Ñ | At December 31, 2017, none of these loans were more than 90 days delinquent. |
| |
| Ñ | We finance our residential loan investments with $2.0 billion of FHLB debt through our FHLB-member subsidiary. The interest cost for these borrowings resets every 13 weeks, and we seek to fix the interest cost of this debt over its weighted average maturity by using a combination of swaps, TBAs, and other derivative instruments. |
| |
| Ñ | Under a final rule published by the Federal Housing Finance Agency in January 2016, our FHLB-member subsidiary's existing $2.0 billion of FHLB debt is permitted to remain outstanding until the stated maturity. As residential loans pledged as collateral for this debt pay down, we are permitted to pledge additional loans or other eligible assets to collateralize this debt; however, we do not expect to be able to increase our subsidiary's FHLB debt above the existing $2.0 billion. |
| |
| Ñ | In connection with these borrowings, our FHLB-member subsidiary is required to hold $43 million of FHLB stock. |
|
|
| |
| THE REDWOOD REVIEW I 4TH QUARTER 2017 |
| 18 |
|
|
| |
| F I N A N C I A L I N S I G H T S |
Securities Portfolio
At December 31, 2017, we had $1.6 billion invested in real estate securities. We categorize these securities by (i) whether they were issued through our Sequoia platform, by an Agency in a CRT, or by third parties, and (ii) by priority of cash flow (senior, Re-REMIC, and subordinate). The following table presents the fair value of our residential real estate securities at December 31, 2017.
|
| | | | | | | | | | | | | | | | | | | | | | | |
| |
| Securities Portfolio - By Source and Security Type |
| December 31, 2017 |
| ($ in millions) |
| | Interest-Only Securities | | Senior & Re-REMIC | | Mezzanine | | Subordinate | | Total | | % of Total Securities | |
| | | | | | | | | | | | | |
Sequoia (1) | $ | 39 |
| | $ | 16 |
| | $ | 191 |
| | $ | 153 |
| | $ | 399 |
| | 26 | % | |
Third Party New Issue (2) | 46 |
| | — |
| | 184 |
| | 96 |
| | 326 |
| | 21 | % | |
Third Party Legacy (2) | 3 |
| | 180 |
| | — |
| | 23 |
| | 205 |
| | 13 | % | |
Agency CRT (3) | — |
| | — |
| | — |
| | 301 |
| | 301 |
| | 19 | % | |
| | | | | | | | | | | | | |
| Total residential securities | $ | 87 |
| | $ | 196 |
| | $ | 375 |
| | $ | 572 |
| | $ | 1,230 |
| | 79 | % | |
| | | | | | | | | | | | | |
Multifamily securities (3) | — |
| | — |
| | 324 |
| | — |
| | 324 |
| | 21 | % | |
| Total securities portfolio | $ | 87 |
| | $ | 196 |
| | $ | 699 |
| | $ | 572 |
| | $ | 1,554 |
| | 100 | % | |
| |
| (1) | Presents securities retained from our Sequoia securitizations that were issued from 2012 through 2017. These securities included $5 million of interest-only securities, $16 million of senior securities, $44 million of mezzanine securities, and $13 million of subordinate securities retained from our Sequoia Choice securitizations, which were consolidated for GAAP purposes. |
| |
| (2) | Presents RMBS issued by third-parties from 2013 through 2018 for New Issue and prior to 2008 for Legacy. |
| |
| (3) | Agency CRT and Multifamily securities were issued from 2013 through 2017. |
We finance our holdings of real estate securities with a combination of capital and collateralized debt in the form of repurchase (or “repo”) financing. At December 31, 2017, we had short-term debt incurred through repurchase facilities of $649 million, which was secured by $788 million of real estate securities. The remaining $766 million of securities were financed with capital.
|
|
| |
| THE REDWOOD REVIEW I 4TH QUARTER 2017 |
| 19 |
|
|
| |
| F I N A N C I A L I N S I G H T S |
The following table presents the fair value of our real estate securities that are financed with repurchase debt, at December 31, 2017.
|
| | | | | | | | | | | | | | | | | | | |
| |
| Real Estate Securities Financed with Repurchase Debt |
| December 31, 2017 |
| ($ in millions, except weighted average price) |
| | Real Estate Securities | | Repurchase Debt | | Allocated Capital | | Weighted Average Price (1) | | Financing Haircut (2) | |
| | | | | | | | | | | |
| Residential securities | | | | | | | | | | |
| Senior | $ | 110 |
| | $ | (97 | ) | | $ | 13 |
| | $ | 99 |
| | 12 | % | |
| Mezzanine | 374 |
| | (312 | ) | | 62 |
| | $ | 99 |
| | 17 | % | |
| Total residential securities | 484 |
| | (409 | ) | | 75 |
| | | | | |
| Multifamily securities | 304 |
| | (240 | ) | | 64 |
| | $ | 97 |
| | 21 | % | |
| | | | | | | | | | | |
| Total | $ | 788 |
| | $ | (649 | ) | | $ | 139 |
| | $ | 98 |
| | 18 | % | |
| |
| (1) | GAAP fair value per $100 of principal. |
| |
| (2) | Allocated capital divided by GAAP fair value. |
| |
| Ñ | In addition to the allocated capital listed in the table above that directly supports our repurchase facilities (i.e., “the haircut”), we continue to hold a designated amount of supplemental risk capital available for potential margin calls or future obligations relating to these facilities. |
| |
| Ñ | At December 31, 2017, we had securities repurchase facilities with nine different counterparties. |
| |
| Ñ | Additional information on the residential securities we own is set forth in Table 8 in the Financial Tables section of this Redwood Review. |
Mortgage Servicing Rights
| |
| Ñ | At December 31, 2017, we had $64 million of MSR investments, which are primarily comprised of jumbo MSRs retained from loans transferred to Sequoia securitizations we completed over the past several years. |
| |
| Ñ | We earn fees from these MSRs, but outsource the actual servicing of the associated loans to third-party servicers. |
|
|
| |
| THE REDWOOD REVIEW I 4TH QUARTER 2017 |
| 20 |
|
|
| |
| F I N A N C I A L I N S I G H T S |
Residential Loans Held-for-Sale
| |
| Ñ | At December 31, 2017, we had $1.4 billion of residential mortgages held-for-sale financed with $1.0 billion of warehouse debt. |
| |
| Ñ | We utilize a combination of capital and our residential loan warehouse facilities to manage our inventory of residential loans held-for-sale. |
| |
| Ñ | Our warehouse capacity at December 31, 2017 totaled $1.6 billion across four separate counterparties. |
| |
| Ñ | The $1.4 billion of residential loans held-for-sale at December 31, 2017 included $1.1 billion, or 77%, of Select loans, and $322 million, or 23%, of expanded-prime Choice loans. |
| |
| Ñ | At December 31, 2017, our pipeline of jumbo residential loans identified for purchase was $1.2 billion. |
|
|
| |
| THE REDWOOD REVIEW I 4TH QUARTER 2017 |
| 21 |
|
|
| |
| THE REDWOOD REVIEW I 4TH QUARTER 2017 |
| 22 |
|
| | | | | | | | | | | | | | | | | | | | | | | | | | | | | | | | | | | | | | | | | | |
| Table 1: GAAP Earnings (in thousands, except per share data) | |
| | | | | | | | | | | | | | | | | | | | | | | |
| | | 2017 Q4 | | 2017
Q3 | | 2017 Q2 | | 2017 Q1 | | 2016
Q4 | | 2016
Q3 | | 2016
Q2 | | 2016
Q1 | | | Twelve Months 2017 | | Twelve Months 2016 | |
| Interest income | $ | 67,370 |
| | $ | 58,106 |
|
| $ | 54,419 |
|
| $ | 49,367 |
| | $ | 50,612 |
| | $ | 54,781 |
|
| $ | 60,307 |
| | $ | 54,071 |
| | | $ | 229,262 |
| | $ | 219,771 |
| |
| Discount amortization on securities, net | 4,098 |
| | 4,631 |
| | 4,805 |
| | 5,261 |
| | 5,722 |
| | 6,125 |
| | 6,339 |
| | 8,068 |
| | | 18,795 |
| | 26,254 |
| |
| Discount (premium) amortization on loans, net | — |
| | — |
| | — |
| | — |
| | — |
| | — |
| | 141 |
| | 189 |
| | | — |
| | 330 |
| |
| Total interest income | 71,468 |
| | 62,737 |
| | 59,224 |
| | 54,628 |
| | 56,334 |
| | 60,906 |
| | 66,787 |
| | 62,328 |
| | | 248,057 |
| | 246,355 |
| |
| Interest expense on short-term debt | (9,841 | ) | | (7,158 | ) | | (6,563 | ) | | (4,453 | ) | | (4,848 | ) | | (5,405 | ) | | (5,337 | ) | | (6,697 | ) | | | (28,015 | ) | | (22,287 | ) | |
Interest expense on short-term convertible notes (1) | (3,025 | ) | | (3,024 | ) | | (2,787 | ) | | — |
| | — |
| | — |
| | — |
| | — |
| | | (8,836 | ) | | — |
| |
| Interest expense on ABS issued from consolidated trusts | (7,917 | ) | | (3,956 | ) | | (3,705 | ) | | (3,530 | ) | | (3,278 | ) | | (3,193 | ) | | (3,982 | ) | | (4,282 | ) | | | (19,108 | ) | | (14,735 | ) | |
| Interest expense on long-term debt | (15,325 | ) | | (13,305 | ) | | (11,179 | ) | | (13,048 | ) | | (12,411 | ) | | (12,999 | ) | | (13,125 | ) | | (12,971 | ) | | | (52,857 | ) | | (51,506 | ) | |
| Total interest expense | (36,108 | ) | | (27,443 | ) | | (24,234 | ) | | (21,031 | ) | | (20,537 | ) | | (21,597 | ) |
| (22,444 | ) | | (23,950 | ) | | | (108,816 | ) | | (88,528 | ) | |
| Net interest income | 35,360 |
| | 35,294 |
| | 34,990 |
| | 33,597 |
| | 35,797 |
| | 39,309 |
|
| 44,343 |
| | 38,378 |
| | | 139,241 |
|
| 157,827 |
| |
| (Provision for) reversal of provision for loan losses – Commercial | — |
| | — |
| | — |
| | — |
| | — |
| | 859 |
| | 6,532 |
| | (289 | ) | | | — |
| | 7,102 |
| |
| Net interest income after provision | 35,360 |
| | 35,294 |
| | 34,990 |
| | 33,597 |
| | 35,797 |
| | 40,168 |
|
| 50,875 |
| | 38,089 |
| | | 139,241 |
| | 164,929 |
| |
| Non-interest income | | | | | | | | | | | | | | | | | | | |
|
| |
| Mortgage banking activities, net | 3,058 |
| | 21,200 |
| | 12,046 |
| | 17,604 |
| | 13,979 |
| | 9,766 |
| | 7,728 |
| | 7,218 |
| | | 53,908 |
| | 38,691 |
| |
| Mortgage servicing rights income, net | 1,754 |
| | 1,615 |
| | 2,778 |
| | 1,713 |
| | 1,519 |
| | 3,770 |
| | 2,783 |
| | 6,281 |
| | | 7,860 |
| | 14,353 |
| |
| Investment fair value changes, net | 384 |
| | 324 |
| | 8,115 |
| | 1,551 |
| | (9,888 | ) | | 11,918 |
| | (11,066 | ) | | (19,538 | ) | | | 10,374 |
| | (28,574 | ) | |
| Realized gains, net | 4,546 |
| | 1,734 |
| | 1,372 |
| | 5,703 |
| | 1,972 |
| | 6,615 |
| | 9,884 |
| | 9,538 |
| | | 13,355 |
| | 28,009 |
| |
| Other income | 1,209 |
| | 1,197 |
| | 986 |
| | 1,184 |
| | 2,181 |
| | 1,643 |
| | 1,559 |
| | 955 |
| | | 4,576 |
| | 6,338 |
| |
| Total non-interest income (loss), net | 10,951 |
| | 26,070 |
|
| 25,297 |
| | 27,755 |
| | 9,763 |
| | 33,712 |
|
| 10,888 |
| | 4,454 |
| | | 90,073 |
| | 58,817 |
| |
| Fixed compensation expense | (5,555 | ) | | (5,233 | ) | | (5,321 | ) | | (6,002 | ) | | (5,310 | ) | | (5,253 | ) | | (5,875 | ) | | (7,894 | ) | | | (22,111 | ) | | (24,332 | ) | |
| Variable compensation expense | (5,861 | ) | | (6,467 | ) | | (4,313 | ) | | (3,933 | ) | | (4,757 | ) | | (5,802 | ) | | (4,262 | ) | | (1,760 | ) | | | (20,574 | ) | | (16,581 | ) | |
| Equity compensation expense | (2,507 | ) | | (2,337 | ) | | (3,121 | ) | | (2,176 | ) | | (1,976 | ) | | (2,031 | ) | | (2,754 | ) | | (2,332 | ) | | | (10,141 | ) | | (9,093 | ) | |
| Restructuring charges | — |
| | — |
| | — |
| | — |
| | 144 |
| | (4 | ) | | 118 |
| | (10,659 | ) | | | — |
| | (10,401 | ) | |
| Other operating expense | (6,444 | ) | | (5,885 | ) | | (5,886 | ) | | (6,115 | ) | | (5,925 | ) | | (7,265 | ) | | (7,382 | ) | | (7,807 | ) | | | (24,330 | ) | | (28,379 | ) | |
| Total operating expenses | (20,367 | ) | | (19,922 | ) |
| (18,641 | ) | | (18,226 | ) | | (17,824 | ) | | (20,355 | ) |
| (20,155 | ) | | (30,452 | ) | | | (77,156 | ) | | (88,786 | ) | |
| (Provision for) benefit from income taxes | 4,989 |
| | (5,262 | ) | | (5,322 | ) | | (6,157 | ) | | (2,381 | ) | | (972 | ) | | (327 | ) | | (28 | ) | | | (11,752 | ) | | (3,708 | ) | |
| Net income | $ | 30,933 |
| | $ | 36,180 |
|
| $ | 36,324 |
| | $ | 36,969 |
| | $ | 25,355 |
| | $ | 52,553 |
|
| $ | 41,281 |
| | $ | 12,063 |
| | | $ | 140,406 |
| | $ | 131,252 |
| |
Diluted average shares (2) | 109,621 |
| | 102,703 |
| | 97,494 |
| | 97,946 |
| | 85,838 |
| | 97,832 |
| | 97,762 |
| | 77,138 |
| | | 101,975 |
| | 97,909 | |
| Diluted earnings per common share | $ | 0.35 |
| | $ | 0.41 |
| | $ | 0.43 |
| | $ | 0.43 |
| | $ | 0.31 |
| | $ | 0.58 |
| | $ | 0.48 |
| | $ | 0.15 |
| | | $ | 1.60 |
| | $ | 1.54 |
| |
| |
| (1) | Represents interest expense on $250 million of convertible notes that were reclassified from Long-term debt to Short-term debt as the maturity of the notes was less than one year as of April 2017. |
| |
| (2) | Diluted average shares includes shares from the assumed conversion of our convertible and/or exchangeable debt in certain periods, in accordance with GAAP diluted EPS provisions. See Table 2 that follows for details of this calculation for the current and prior quarter and our respective Quarterly Reports on Form 10-Q and Annual Reports on Form 10-K for prior periods. |
|
| | |
| THE REDWOOD REVIEW I 4TH QUARTER 2017 | | Table 1: GAAP Earnings 23 |
|
| | | | | | | | | |
| Table 2: GAAP and Non-GAAP Core Diluted Earnings (1) per Common Share (in thousands, except per share data) | |
| | | | | | |
| | | 2017 Q4 | | 2017 Q3 | |
| GAAP Diluted Earnings per Common Share: | | | | |
| Net income attributable to Redwood | $ | 30,933 |
| | $ | 36,180 |
| |
| Less: Dividends and undistributed earnings allocated to participating securities | (916 | ) | | (986 | ) | |
Add back: Interest expense on convertible notes for the period, net of tax (2) | 8,259 |
| | 6,564 |
| |
| Net income allocated to common shareholders | $ | 38,276 |
| | $ | 41,758 |
| |
| | | | | |
| Basic weighted average common shares outstanding | 76,762 |
| | 76,851 |
| |
| Net effect of dilutive equity awards | 96 |
| | 299 |
| |
Net effect of assumed convertible notes conversion to common shares (2) | 32,763 |
| | 25,553 |
| |
| Diluted weighted average common shares outstanding | 109,621 |
| | 102,703 |
| |
| | | | | |
| GAAP Diluted Earnings per Common Share | $ | 0.35 |
| | $ | 0.41 |
| |
| | | | | |
| Non-GAAP Core Diluted Earnings per Common Share: | | | | |
| Non-GAAP core earnings | $ | 30,473 |
| | $ | 30,432 |
| |
| Less: Dividends and undistributed earnings allocated to participating securities | (908 | ) | | (873 | ) | |
Add back: Interest expense on convertible notes for the period, net of tax (2) | 8,259 |
| | 6,564 |
| |
| Non-GAAP core earnings allocated to common shareholders | $ | 37,824 |
| | $ | 36,123 |
| |
| | | | | |
| Basic weighted average common share outstanding | 76,762 |
| | 76,851 |
| |
| Net effect of dilutive equity awards | 96 |
| | 299 |
| |
Net effect of assumed convertible notes conversion to common shares (2) | 32,763 |
| | 25,553 |
| |
| Diluted weighted average common shares outstanding | 109,621 |
| | 102,703 |
| |
| | | | | |
| Non-GAAP Core Diluted Earnings per Common Share | $ | 0.35 |
| | $ | 0.35 |
| |
| | | | | |
| |
| (1) | A reconciliation of GAAP net income to non-GAAP core earnings is included in the GAAP Net Income and Reconciliation to Non-GAAP Core Earnings section that starts on page 8 and a definition of core earnings is included in the Core Earnings Definition section of the Appendix. |
| |
| (2) | Certain convertible notes were determined to be dilutive in the periods presented and were included in the calculations of diluted EPS under the "if-converted" method. Under this method, the periodic interest expense (net of applicable taxes) for dilutive notes is added back to the numerator and the number of shares that the notes are entitled to (if converted, regardless of whether they are in or out of the money) are included in the denominator. |
|
| | |
| THE REDWOOD REVIEW I 4TH QUARTER 2017 | | Table 2: GAAP and Core Earnings per Diluted Common Share 24 |
|
| | | | | | | | | | | | | | | | | | | | | | | | | | | | | | | | | | | | | | | | | |
| Table 3: Segment Results ($ in thousands) | |
| | | | | | | | | | | | | | | | | | | | | | |
| | | 2017
Q4 | | 2017
Q3 | | 2017
Q2 | | 2017
Q1 | | 2016
Q4 | | 2016
Q3 | | 2016
Q2 | | 2016
Q1 | | Twelve
Months 2017 | | Twelve
Months 2016 | |
| Investment Portfolio | | | | | | | | | | | | | | | | | | | | |
| Net interest income | | | | | | | | | | | | | | | | | | | | |
| Residential securities | $ | 21,123 |
| | $ | 19,364 |
| | $ | 18,163 |
| | $ | 17,081 |
| | $ | 16,368 |
| | $ | 16,441 |
| | $ | 16,707 |
| | $ | 18,454 |
| | $ | 75,731 |
| | $ | 67,970 |
| |
| Residential loans | 16,032 |
| | 16,916 |
| | 18,461 |
| | 18,448 |
| | 18,676 |
| | 19,069 |
| | 19,536 |
| | 16,529 |
| | 69,857 |
| | 73,810 |
| |
| Multifamily and commercial investments | 1,749 |
| | 1,298 |
| | 1,978 |
| | 1,457 |
| | 2,853 |
| | 6,653 |
| | 11,644 |
| | 6,273 |
| | 6,482 |
| | 27,423 |
| |
| Total net interest income | 38,904 |
| | 37,578 |
| | 38,602 |
| | 36,986 |
| | 37,897 |
| | 42,163 |
| | 47,887 |
| | 41,256 |
| | 152,070 |
| | 169,203 |
| |
| Reversal of (provision for) loan losses | — |
| | — |
| | — |
| | — |
| | — |
| | 859 |
| | 6,532 |
| | (289 | ) | | — |
|
| 7,102 |
| |
| | | | | | | | | | | | | | | | | | | | | |
| Non-interest income | | | | | | | | | | | | | | | | | | | | |
| MSR income, net | 1,754 |
| | 1,615 |
| | 2,778 |
| | 1,713 |
| | 1,519 |
| | 3,770 |
| | 2,783 |
| | 6,281 |
| | 7,860 |
|
| 14,353 |
| |
| Investment fair value changes, net | 4,568 |
| | 1,372 |
| | 9,115 |
| | 3,359 |
| | (7,862 | ) | | 12,176 |
| | (10,779 | ) | | (17,902 | ) | | 18,414 |
|
| (24,367 | ) | |
| Other income | 1,209 |
| | 1,197 |
| | 986 |
| | 1,184 |
| | 2,181 |
| | 1,643 |
| | 1,559 |
| | 955 |
| | 4,576 |
|
| 6,338 |
| |
| Realized gains | 4,546 |
| | 1,734 |
| | 2,124 |
| | 5,703 |
| | 1,972 |
| | 6,615 |
| | 9,884 |
| | 9,246 |
| | 14,107 |
|
| 27,717 |
| |
| Total non-interest income, net | 12,077 |
| | 5,918 |
| | 15,003 |
| | 11,959 |
| | (2,190 | ) | | 24,204 |
| | 3,447 |
| | (1,420 | ) | | $ | 44,957 |
|
| $ | 24,041 |
| |
| | | | | | | | | | | | | | | | | | | | | |
| Operating expenses | (1,657 | ) | | (1,324 | ) | | (1,454 | ) | | (1,593 | ) | | (2,732 | ) | | (2,751 | ) | | (2,827 | ) | | (2,111 | ) | | (6,028 | ) |
| (10,421 | ) | |
| Provision for income taxes | (838 | ) | | (433 | ) | | (2,320 | ) | | (1,737 | ) | | (761 | ) | | (732 | ) | | (327 | ) | | (28 | ) | | (5,328 | ) |
| (1,848 | ) | |
| Segment contribution | $ | 48,486 |
| | $ | 41,739 |
| | $ | 49,831 |
| | $ | 45,615 |
| | $ | 32,214 |
| | $ | 63,743 |
| | $ | 54,712 |
| | $ | 37,408 |
| | $ | 185,671 |
|
| $ | 188,077 |
| |
| | | | | | | | | | | | | | | | | | | | | |
| Residential Mortgage Banking | | | | | | | | | | | | | | | | | | | | |
| Net interest income | $ | 6,887 |
| | $ | 6,491 |
| | $ | 4,012 |
| | $ | 4,550 |
| | $ | 5,579 |
| | $ | 5,005 |
| | $ | 4,306 |
| | $ | 4,580 |
| | $ | 21,940 |
|
| $ | 19,470 |
| |
| Non-interest income | | | | | | | | | | | | | | | | | | | | |
| Mortgage banking activities | 3,058 |
| | 21,200 |
| | 12,046 |
| | 17,604 |
| | 13,979 |
| | 9,766 |
| | 7,728 |
| | 9,280 |
| | 53,908 |
| | 40,753 |
| |
| | | | | | | | | | | | | | | | | | | | | |
| Operating expenses | (7,104 | ) | | (6,107 | ) | | (6,021 | ) | | (5,881 | ) | | (6,077 | ) | | (5,807 | ) | | (6,047 | ) | | (5,321 | ) | | (25,113 | ) | | (23,252 | ) | |
| Benefit from (provision for) income taxes | 5,827 |
| | (4,829 | ) | | (3,002 | ) | | (4,420 | ) | | (1,620 | ) | | (240 | ) | | — |
| | — |
| | (6,424 | ) | | (1,860 | ) | |
| Segment contribution | $ | 8,668 |
| | $ | 16,755 |
| | $ | 7,035 |
| | $ | 11,853 |
| | $ | 11,861 |
| | $ | 8,724 |
| | $ | 5,987 |
| | $ | 8,539 |
| | $ | 44,311 |
| | $ | 35,111 |
| |
| | | | | | | | | | | | | | | | | | | | | |
| Corporate/other | (26,221 | ) | | (22,314 | ) | | (20,542 | ) | | (20,499 | ) | | (18,720 | ) | | (19,914 | ) | | (19,418 | ) | | (33,884 | ) | | (89,576 | ) | | (91,936 | ) | |
| GAAP net income | $ | 30,933 |
| | $ | 36,180 |
| | $ | 36,324 |
| | $ | 36,969 |
| | $ | 25,355 |
| | $ | 52,553 |
| | $ | 41,281 |
| | $ | 12,063 |
| | $ | 140,406 |
| | $ | 131,252 |
| |
| | | | | | | | | | | | | | | | | | | | | | |
|
| | |
| THE REDWOOD REVIEW I 4TH QUARTER 2017 | | Table 3: Segment Results 25 |
|
| | | | | | | | | | | | | | | | | | | | | | | | | | | | | | | | | | | |
| Table 4: Segment Assets and Liabilities ($ in thousands) |
| | | | | | | | | | | | | | | | | | | | |
| | | | December 31, 2017 | | | September 30, 2017 | |
| | | | Investment Portfolio | | Residential Mortgage Banking | | Corporate/ Other | | Total | | | Investment Portfolio | | Residential Mortgage Banking | | Corporate/ Other | | Total | |
| Residential loans | | | | | | | | | | | | | | | | | | |
| At Redwood | | $ | 2,434,386 |
| | $ | 1,427,945 |
| | $ | — |
| | $ | 3,862,331 |
| | | $ | 2,268,802 |
| | $ | 925,681 |
| | $ | — |
| | $ | 3,194,483 |
| |
| At consolidated Sequoia entities | | 620,062 |
| | — |
| | 632,817 |
| | 1,252,879 |
| | | 317,303 |
| | — |
| | 673,134 |
| | 990,437 |
| |
| Real estate securities | | 1,476,510 |
| | — |
| | — |
| | 1,476,510 |
| | | 1,356,272 |
| | — |
| | — |
| | 1,356,272 |
| |
| Mortgage servicing rights | | 63,598 |
| | — |
| | — |
| | 63,598 |
| | | 62,928 |
| | — |
| | — |
| | 62,928 |
| |
| Cash and cash equivalents | | 14,405 |
| | — |
| | 130,258 |
| | 144,663 |
| | | 72,949 |
| | — |
| | 184,662 |
| | 257,611 |
| |
| Other assets | | 134,912 |
| | 25,124 |
| | 79,805 |
| | 239,841 |
| | | 157,769 |
| | 21,822 |
| | 89,377 |
| | 268,968 |
| |
| Total assets | | $ | 4,743,873 |
| | $ | 1,453,069 |
|
| $ | 842,880 |
| | $ | 7,039,822 |
| | | $ | 4,236,023 |
| | $ | 947,503 |
|
| $ | 947,173 |
| | $ | 6,130,699 |
| |
| | | | | | | | | | | | | | | | | | | |
| Short-term debt | | | | | | | | | | | | | | | | | | |
| Mortgage loan warehouse debt | | $ | — |
| | $ | 1,039,666 |
| | $ | — |
| | $ | 1,039,666 |
| | | $ | — |
| | $ | 438,243 |
| | $ | — |
| | $ | 438,243 |
| |
| Security repurchase facilities | | 648,746 |
| | — |
| | — |
| | 648,746 |
| | | 549,811 |
| | — |
| | — |
| | 549,811 |
| |
| Convertible notes, net | | — |
| | — |
| | 250,270 |
| | 250,270 |
| | | — |
| | — |
| | 250,142 |
| | 250,142 |
| |
| Other liabilities | | 40,287 |
| | 14,087 |
| | 94,871 |
| | 149,245 |
| | | 53,551 |
| | 13,851 |
| | 97,734 |
| | 165,136 |
| |
| ABS issued | | 542,140 |
| | — |
| | 622,445 |
| | 1,164,585 |
| | | 286,328 |
| | — |
| | 657,960 |
| | 944,288 |
| |
| Long-term debt, net | | 1,999,999 |
| | — |
| | 575,024 |
| | 2,575,023 |
| | | 1,999,999 |
| | — |
| | 574,440 |
| | 2,574,439 |
| |
| Total liabilities | | $ | 3,231,172 |
|
| $ | 1,053,753 |
|
| $ | 1,542,610 |
|
| $ | 5,827,535 |
| | | $ | 2,889,689 |
| | $ | 452,094 |
| | $ | 1,580,276 |
| | $ | 4,922,059 |
| |
| | | | | | | | | | | | | | | | | | | |
|
| | |
| THE REDWOOD REVIEW I 4TH QUARTER 2017 | | Table 4: Segment Assets and Liabilities 26 |
|
| | | | | | | | | | | | | | | | | | | | | | | | | | | | | | | | | | | | | | | | | |
| Table 5: Components of Investment Portfolio Fair Value Changes, Net by Investment Type ($ in thousands) | |
| | | | | | | | | | | | | | | | | | | | | | |
| | | 2017
Q4 | | 2017
Q3 | | 2017
Q2 | | 2017
Q1 | | 2016
Q4 | | 2016
Q3 | | 2016
Q2 | | 2016
Q1 | | Twelve
Months 2017 | | Twelve
Months 2016 | |
| Investment Portfolio Fair Value Changes | | | | | | | | | | | | | | | | | | | | |
| Residential loans held-for-investment | | | | | | | | | | | | | | | | | | | | |
Change in fair value from the reduction of principal (1) | $ | (1,820 | ) | | $ | (1,274 | ) | | $ | (952 | ) | | $ | (1,528 | ) | | $ | (5,668 | ) | | $ | (4,724 | ) | | $ | (3,712 | ) | | $ | (1,419 | ) | | $ | (5,574 | ) | | $ | (15,523 | ) | |
Other fair value changes (2) | (12,848 | ) | | 4,156 |
| | 9,305 |
| | (805 | ) | | (39,595 | ) | | 4,069 |
| | 3,065 |
| | 24,882 |
| | (192 | ) | | (7,579 | ) | |
| Total change in fair value of residential loans held-for-investment | (14,668 | ) | | 2,882 |
| | 8,353 |
| | (2,333 | ) | | (45,263 | ) | | (655 | ) | | (647 | ) | | 23,463 |
| | (5,766 | ) | | (23,102 | ) | |
| | | | | | | | | | | | | | | | | | | | | |
| Real estate securities | | | | | | | | | | | | | | | | | | | | |
Change in fair value from the reduction of principal (1) | (2,277 | ) | | (1,784 | ) | | (947 | ) | | (1,789 | ) | | (1,578 | ) | | (1,383 | ) | | (1,130 | ) | | (1,123 | ) | | (6,797 | ) | | (5,214 | ) | |
Other fair value changes (2) | 9,799 |
| | 1,862 |
| | 19,534 |
| | 12,610 |
| | 6,990 |
| | 9,990 |
| | 562 |
| | (4,489 | ) | | 43,805 |
| | 13,053 |
| |
| Total change in fair value of real estate securities | 7,522 |
| | 78 |
| | 18,587 |
| | 10,821 |
| | 5,412 |
| | 8,607 |
| | (568 | ) | | (5,612 | ) | | 37,008 |
| | 7,839 |
| |
| | | | | | | | | | | | | | | | | | | | | |
| Risk management derivatives | | | | | | | | | | | | | | | | | | | | |
| Interest component of derivative expense | (2,927 | ) | | (2,909 | ) | | (3,768 | ) | | (3,693 | ) | | (2,253 | ) | | (1,956 | ) | | (2,310 | ) | | (2,598 | ) | | (13,297 | ) | | (9,117 | ) | |
Other fair value changes (3) | 14,641 |
| | 1,321 |
| | (14,057 | ) | | (1,436 | ) | | 34,242 |
| | 6,180 |
| | (7,254 | ) | | (33,155 | ) | | 469 |
| | 13 |
| |
| Total change in fair value of risk management derivatives | 11,714 |
| | (1,588 | ) | | (17,825 | ) | | (5,129 | ) | | 31,989 |
| | 4,224 |
| | (9,564 | ) | | (35,753 | ) | | (12,828 | ) | | (9,104 | ) | |
| | | | | | | | | | | | | | | | | | | | | |
| Total investment portfolio fair value changes, net | $ | 4,568 |
|
| $ | 1,372 |
|
| $ | 9,115 |
|
| $ | 3,359 |
|
| $ | (7,862 | ) |
| $ | 12,176 |
|
| $ | (10,779 | ) |
| $ | (17,902 | ) | | $ | 18,414 |
| | $ | (24,367 | ) | |
| | | | | | | | | | | | | | | | | | | | | | |
| |
| (1) | Reflects the change in fair value due to principal changes, which is calculated as the change in principal on a given investment during the period, multiplied by the prior quarter ending price or acquisition price for that investment in percentage terms. |
| |
| (2) | Reflects changes in prepayment assumptions and credit spreads on our residential loans, trading securities and conforming risk-sharing investments primarily due to changes in benchmark interest rates. This item is excluded from management's definition of core earnings. |
| |
| (3) | Reflects the change in fair value of our risk management derivatives that are associated with changes in benchmark interest rates during the period. This item is excluded from management's definition of core earnings. |
|
| | |
| THE REDWOOD REVIEW I 4TH QUARTER 2017 | | Table 5: Components of Investment Fair Value Changes, Net 27 |
|
| | | | | | | | | | | | | | | | | | | | | | | | | | | | | | | | | | | | | |
| Table 6: Taxable and GAAP Income (1) Differences and Dividends ($ in thousands, except for per share data) | |
| | | | | | | | | | | | | | | | | | | | |
| | | Estimated Twelve Months 2017 (2) | | Actual Twelve Months 2016 (2) | | Actual Twelve Months 2015 (2) | |
| | | Taxable Income | | GAAP Income | | Differences | | Taxable
Income | | GAAP
Income | | Differences | | Taxable Income | | GAAP Income | | Differences | |
| Taxable and GAAP Income Differences | | | | | | | | | | | | | | | | | | |
| Interest income | $ | 224,644 |
| | $ | 248,057 |
| | $ | (23,413 | ) | | $ | 233,258 |
| | $ | 246,355 |
| | $ | (13,097 | ) | | $ | 227,133 |
| | $ | 259,432 |
| | $ | (32,299 | ) | |
| Interest expense | (89,662 | ) | | (108,816 | ) | | 19,154 |
| | (76,396 | ) | | (88,528 | ) | | 12,132 |
| | (79,830 | ) | | (95,883 | ) | | 16,053 |
| |
| Net interest income | 134,982 |
| | 139,241 |
| | (4,259 | ) | | 156,862 |
| | 157,827 |
| | (965 | ) | | 147,303 |
| | 163,549 |
| | (16,246 | ) | |
| Reversal of provision for loan losses | — |
| | — |
| | — |
| | — |
| | 7,102 |
| | (7,102 | ) | | — |
| | 355 |
| | (355 | ) | |
| Realized credit losses | (3,442 | ) | | — |
| | (3,442 | ) | | (7,989 | ) | | — |
| | (7,989 | ) | | (8,645 | ) | | — |
| | (8,645 | ) | |
| Mortgage banking activities, net | 44,162 |
| | 53,908 |
| | (9,746 | ) | | 26,477 |
| | 38,691 |
| | (12,214 | ) | | (24,637 | ) | | 10,972 |
| | (35,609 | ) | |
| MSR income (loss), net | 3,930 |
| | 7,860 |
| | (3,930 | ) | | 86,955 |
| | 14,353 |
| | 72,602 |
| | 33,669 |
| | (3,922 | ) | | 37,591 |
| |
| Investment fair value changes, net | (11,191 | ) | | 10,374 |
| | (21,565 | ) | | (10,410 | ) | | (28,574 | ) | | 18,164 |
| | (2,827 | ) | | (21,357 | ) | | 18,530 |
| |
| Operating expenses | (74,932 | ) | | (77,156 | ) | | 2,224 |
| | (88,416 | ) | | (88,786 | ) | | 370 |
| | (103,236 | ) | | (97,416 | ) | | (5,820 | ) | |
| Other income (expense), net | 27,395 |
| | 4,576 |
| | 22,819 |
| | 2,760 |
| | 6,338 |
| | (3,578 | ) | | 2,174 |
| | 3,192 |
| | (1,018 | ) | |
| Realized gains, net | (735 | ) | | 13,355 |
| | (14,090 | ) | | 284 |
| | 28,009 |
| | (27,725 | ) | | — |
| | 36,369 |
| | (36,369 | ) | |
| (Provision for) benefit from income taxes | (515 | ) | | (11,752 | ) | | 11,237 |
| | (155 | ) | | (3,708 | ) | | 3,553 |
| | (150 | ) | | 10,346 |
| | (10,496 | ) | |
| Income | $ | 119,654 |
| | $ | 140,406 |
| | $ | (20,752 | ) | | $ | 166,368 |
| | $ | 131,252 |
| | $ | 35,116 |
| | $ | 43,651 |
| | $ | 102,088 |
| | $ | (58,437 | ) | |
| | | | | | | | | | | | | | | | | | | |
| REIT taxable income | $ | 87,994 |
| | | | | | $ | 97,576 |
| | | | | | $ | 85,685 |
| | | | | |
| Taxable income (loss) at taxable subsidiaries | 31,660 |
| | | | | | 68,792 |
| | | | | | (42,034 | ) | | | | | |
| Taxable income | $ | 119,654 |
| | | | | | $ | 166,368 |
| | | | | | $ | 43,651 |
| | | | | |
| | | | | | | | | | | | | | | | | | | |
| Shares used for taxable EPS calculation | 76,600 |
| | | | | | 76,835 |
| | | | | | 78,163 |
| | | | | |
REIT taxable income per share (3) | $ | 1.15 |
| | | | | | $ | 1.27 |
| | | | | | $ | 1.05 |
| | | | | |
| Taxable income (loss) per share at taxable subsidiaries | $ | 0.41 |
| | | | | | $ | 0.90 |
| | | | | | $ | (0.50 | ) | | | | | |
Taxable income per share (3) | $ | 1.56 |
| | | | | | $ | 2.17 |
| | | | | | $ | 0.55 |
| | | | | |
| | | | | | | | | | | | | | | | | | | |
| Dividends | | | | | | | | | | | | | | | | | | |
| Dividends declared | $ | 86,271 |
| | | | | | $ | 86,240 |
| | | | | | $ | 92,493 |
| | | | | |
Dividends per share (4) | $ | 1.12 |
| | | | | | $ | 1.12 |
| | | | | | $ | 1.12 |
| | | | | |
| |
| (1) | Taxable income for 2017 is an estimate until we file our tax returns for this year. To the extent we expect to pay tax at the corporate level (generally as a result of activity at our taxable REIT subsidiaries), we are required to record a tax provision for GAAP reporting purposes. Any tax provision (or benefit) is not necessarily the actual amount of tax currently due (or receivable as a refund) as a portion of our provision (or benefit) is deferred in nature. It is our intention to retain any excess inclusion income generated in 2017 at our TRS and not pass it through to our shareholders. |
| |
| (2) | Reconciliation of GAAP income to taxable income (loss) for prior quarters is provided in the respective Redwood Reviews for those quarters. |
| |
| (3) | REIT taxable income per share and taxable income (loss) per share are based on the number of shares outstanding at the end of each quarter. The annual REIT taxable income per share and taxable income (loss) per share are the sum of the quarterly per share estimates. |
| |
| (4) | Dividends in 2017 are expected to be characterized as 71% ordinary dividend income (or $61 million) and 29% qualified dividend income (or $25 million). Dividends in 2016 were characterized as 100% ordinary income (or $86 million). Dividends in 2015 were characterized as 100% ordinary income (or $92 million). |
|
| | |
| THE REDWOOD REVIEW I 4TH QUARTER 2017 | | Table 6: Taxable and GAAP Income Differences and Dividends 28 |
|
| | | | | | | | | | | | | | | | | | | | | | | | | | | | | | | | | | | | | | | | | |
| Table 7: Financial Ratios and Book Value ($ in thousands, except per share data) | |
| | | | | | | | | | | | | | | | | | | | | | |
| | | 2017
Q4 | | 2017
Q3 | | 2017 Q2 | | 2017 Q1 | | 2016
Q4 | | 2016
Q3 | | 2016
Q2 | | 2016
Q1 | | Twelve
Months 2017 | | Twelve
Months 2016 | |
| Financial performance ratios | | | | | | | | | | | | | | | | | | | | |
| Net interest income | $ | 35,360 |
| | $ | 35,294 |
| | $ | 34,990 |
| | $ | 33,597 |
| | $ | 35,797 |
| | $ | 39,309 |
| | $ | 44,343 |
| | $ | 38,378 |
| | $ | 139,241 |
| | $ | 157,827 |
| |
| Operating expenses | $ | (20,367 | ) | | $ | (19,922 | ) | | $ | (18,641 | ) | | $ | (18,226 | ) | | $ | (17,824 | ) | | $ | (20,355 | ) | | $ | (20,155 | ) | | $ | (30,452 | ) | | $ | (77,156 | ) | | $ | (88,786 | ) | |
| GAAP net income | $ | 30,933 |
| | $ | 36,180 |
| | $ | 36,324 |
| | $ | 36,969 |
| | $ | 25,355 |
| | $ | 52,553 |
| | $ | 41,281 |
| | $ | 12,063 |
| | $ | 140,406 |
| | $ | 131,252 |
| |
| | | | | | | | | | | | | | | | | | | | | |
| Average total assets | $ | 6,652,937 |
| | $ | 5,851,133 |
| | $ | 5,685,460 |
| | $ | 5,471,154 |
| | $ | 5,613,048 |
| | $ | 5,880,281 |
| | $ | 5,954,162 |
| | $ | 6,131,715 |
| | $ | 5,918,233 |
| | $ | 5,893,998 |
| |
| Average total equity | $ | 1,207,879 |
| | $ | 1,189,540 |
| | $ | 1,167,438 |
| | $ | 1,158,732 |
| | $ | 1,137,948 |
| | $ | 1,111,507 |
| | $ | 1,089,289 |
| | $ | 1,110,187 |
| | $ | 1,181,056 |
| | $ | 1,112,313 |
| |
| Less: average AOCI | | | | | | | | | | | | | | | | | (74,202 | ) | | (58,803 | ) | |
| Average total equity less average AOCI | | | | | | | | | | | | | | | | | $ | 1,106,854 |
| | $ | 1,053,510 |
| |
| | | | | | | | | | | | | | | | | | | | | |
| Operating expenses / average total assets | 1.22 | % |
| 1.36 | % | | 1.31 | % | | 1.33 | % | | 1.27 | % | | 1.38 | % |
| 1.35 | % | | 1.99 | % | | 1.30 | % | | 1.51 | % | |
| Operating expenses / average total equity | 6.74 | % |
| 6.70 | % | | 6.39 | % | | 6.29 | % | | 6.27 | % | | 7.33 | % |
| 7.40 | % | | 10.97 | % | | 6.53 | % | | 7.98 | % | |
| | | | | | | | | | | | | | | | | | | | | |
| GAAP net income / average total assets | 1.86 | % |
| 2.47 | % | | 2.56 | % | | 2.70 | % | | 1.81 | % | | 3.57 | % |
| 2.77 | % | | 0.79 | % | | 2.37 | % | | 2.23 | % | |
| GAAP net income / average equity (GAAP ROE) | 10.24 | % |
| 12.17 | % | | 12.45 | % | | 12.76 | % | | 8.91 | % | | 18.91 | % |
| 15.16 | % | | 4.35 | % | | 11.89 | % | | 11.80 | % | |
Adjusted ROE (non-GAAP) (1) | | | | | | | | | | | | | | | | | 12.69 | % | | 12.46 | % | |
| | | | | | | | | | | | | | | | | | | | | | |
| Leverage ratios and book value per share | | | | | | | | | | | | | | | | | | | | |
| Short-term debt | $ | 1,938,682 |
| | $ | 1,238,196 |
| | $ | 1,294,807 |
| | $ | 563,773 |
| | $ | 791,539 |
| | $ | 1,117,405 |
| | $ | 1,059,045 |
| | $ | 804,175 |
| | | | | |
| Long-term debt – Commercial secured borrowing | — |
| | — |
| | — |
| | — |
| | — |
| | — |
| | 65,240 |
| | 65,181 |
| | | | | |
Long-term debt – Other (2) | 2,585,264 |
| | 2,585,264 |
| | 2,340,264 |
| | 2,627,764 |
| | 2,627,764 |
| | 2,627,764 |
| | 2,627,764 |
| | 2,627,764 |
| | | | | |
| Total debt at Redwood | $ | 4,523,946 |
|
| $ | 3,823,460 |
| | $ | 3,635,071 |
| | $ | 3,191,537 |
| | $ | 3,419,303 |
| | $ | 3,745,169 |
|
| $ | 3,752,049 |
| | $ | 3,497,120 |
| | | | | |
| | | | | | | | | | | | | | | | | | | | | |
| ABS issued at consolidated entities | | | | | | | | | | | | | | | | | | | | |
| Legacy Sequoia entities ABS issued | $ | 622,445 |
| | $ | 657,960 |
| | $ | 692,606 |
| | $ | 728,391 |
| | $ | 773,462 |
| | $ | 819,868 |
| | $ | 859,628 |
| | $ | 907,023 |
| | | | | |
| Sequoia Choice entity ABS issued | 542,140 |
| | 286,328 |
| | — |
| | — |
| | — |
| | — |
| | — |
| | — |
| | | | | |
Total ABS issued (2) | $ | 1,164,585 |
|
| $ | 944,288 |
| | $ | 692,606 |
| | $ | 728,391 |
| | $ | 773,462 |
| | $ | 819,868 |
|
| $ | 859,628 |
| | $ | 958,703 |
| | | | | |
| Consolidated Debt | $ | 5,688,531 |
|
| $ | 4,767,748 |
| | $ | 4,327,677 |
| | $ | 3,919,928 |
| | $ | 4,192,765 |
|
| $ | 4,565,037 |
|
| $ | 4,611,677 |
| | $ | 4,455,823 |
| | | | | |
| Stockholders' equity | $ | 1,212,287 |
| | $ | 1,208,640 |
| | $ | 1,179,424 |
| | $ | 1,165,771 |
| | $ | 1,149,428 |
| | $ | 1,130,130 |
| | $ | 1,092,603 |
| | $ | 1,085,750 |
| | | | | |
Recourse debt at Redwood to stockholders' equity (3) | 3.7x |
| | 3.2x |
| | 3.1x |
| | 2.7x |
| | 3.0x |
| | 3.3x |
| | 3.4x |
| | 3.2x |
| | | | | |
| Consolidated debt to stockholders' equity | 4.7x |
| | 3.9x |
| | 3.7x |
| | 3.4x |
| | 3.6x |
| | 4.0x |
| | 4.2x |
| | 4.1x |
| | | | | |
| Shares outstanding at period end (in thousands) | 76,600 |
| | 77,123 |
| | 77,117 |
| | 77,039 |
| | 76,835 |
| | 76,682 |
| | 76,935 |
| | 76,627 |
| | | | | |
| Book value per share | $ | 15.83 |
| | $ | 16.05 |
| | $ | 15.29 |
| | $ | 15.13 |
| | $ | 14.96 |
| | $ | 14.74 |
| | $ | 14.20 |
| | $ | 14.17 |
| | | | | |
| | | | | | | | | | | | | | | | | | | | | | |
| |
| (1) | Adjusted ROE (non-GAAP) is calculated as GAAP net income divided by average total equity less average accumulated other comprehensive income ("AOCI") of $74 million and $59 million for the years ended December 31, 2017 and 2016, respectively. See "Adjusted ROE" in the Glossary section of the Appendix to this Redwood Review for additional information on this metric. |
| |
| (2) | Long-term debt - other and ABS issued presented above do not include deferred securities issuance costs. |
| |
| (3) | Excludes ABS issued at consolidated entities and commercial secured borrowings associated with commercial A-notes that were sold, but treated as secured borrowings under GAAP. |
|
| | |
| THE REDWOOD REVIEW I 4TH QUARTER 2017 | | Table 7: Financial Ratios and Book Value 29
|
|
| | | | | | | | | | | | | | | | | | | | | | | | | | | | | | | | | | | | | | | | | | | | |
| Table 8: Securities and Loan Activity ($ in thousands) |
| | | | | | | | | | | | | | | | | | | | | | | | |
| | 2017
Q4 | | 2017
Q3 | | 2017
Q2 | | 2017 Q1 | | 2016
Q4 | | | | | 2017
Q4 | | 2017
Q3 | | 2017
Q2 | | 2017 Q1 | | 2016
Q4 | |
| Securities – Senior | | | | | | | | | | | | Residential Loans, held-for-sale | | | | | | | | | | | |
| Beginning fair value | $ | 215,999 |
| | $ | 176,962 |
| | $ | 176,099 |
| | $ | 173,613 |
| | $ | 95,782 |
| | | Beginning carrying value | | $ | 925,681 |
| | $ | 837,371 |
| | $ | 376,607 |
| | $ | 835,399 |
| | $ | 1,188,514 |
| |
| Acquisitions | 14,749 |
| | 16,383 |
| | 12,842 |
| | 3,231 |
| | 4,943 |
| | | Acquisitions | | 1,950,180 |
| | 1,462,116 |
| | 1,221,051 |
| | 1,108,304 |
| | 1,132,561 |
| |
| Sales | (236 | ) | | (2,500 | ) | | (628 | ) | | (4,944 | ) | | (1,463 | ) | | | Sales | | (834,977 | ) | | (1,075,194 | ) | | (694,875 | ) | | (1,377,637 | ) | | (1,268,943 | ) | |
| Effect of principal payments | (11,997 | ) | | (7,324 | ) | | (7,828 | ) | | (6,247 | ) | | (5,364 | ) | | | Principal repayments | | (14,771 | ) | | (16,436 | ) | | (9,273 | ) | | (12,995 | ) | | (24,427 | ) | |
Transfers between portfolios (1) | — |
| | 34,375 |
| | — |
| | 12,229 |
| | 75,058 |
| | | Transfers between portfolios (2) | | (601,554 | ) | | (298,104 | ) | | (61,922 | ) | | (184,996 | ) | | (186,116 | ) | |
| Change in fair value, net | (7,552 | ) | | (1,897 | ) | | (3,523 | ) | | (1,783 | ) | | 4,657 |
| | | Changes in fair value, net | | 3,386 |
| | 15,928 |
| | 5,783 |
| | 8,532 |
| | (6,190 | ) | |
| Ending fair value | $ | 210,963 |
| | $ | 215,999 |
| | $ | 176,962 |
| | $ | 176,099 |
| | $ | 173,613 |
| | | Ending fair value | | $ | 1,427,945 |
| | $ | 925,681 |
| | $ | 837,371 |
| | $ | 376,607 |
| | $ | 835,399 |
| |
| | | | | | | | | | | | | | | | | | | | | | | | |
| Ending Balances for Senior Sub-Categories | | | | | | | | | | | Residential Loans, held-for-investment at Redwood | | | | | |
| Legacy RMBS Securities Senior | $ | 140,988 |
| | $ | 153,232 |
| | $ | 128,330 |
| | $ | 137,210 |
| | $ | 136,547 |
| | | Beginning carrying value | | $ | 2,268,802 |
| | $ | 2,360,234 |
| | $ | 2,350,013 |
| | $ | 2,261,016 |
| | $ | 2,282,674 |
| |
| RMBS 2.0 IO Securities Senior | 69,975 |
| | 62,767 |
| | 48,632 |
| | 38,889 |
| | 37,066 |
| | | Principal repayments | | (93,916 | ) | | (74,550 | ) | | (60,055 | ) | | (93,666 | ) | | (162,512 | ) | |
| Total senior securities | $ | 210,963 |
| | $ | 215,999 |
| | $ | 176,962 |
| | $ | 176,099 |
| | $ | 173,613 |
| | | Transfers between portfolios | | 273,994 |
| | (20,025 | ) | | 61,922 |
| | 184,996 |
| | 186,116 |
| |
| | | | | | | | | | | | | Changes in fair value, net | | (14,494 | ) | | 3,143 |
| | 8,354 |
| | (2,333 | ) | | (45,262 | ) | |
| Securities – Re-REMIC | | | | | | | | | | | | Ending fair value | | $ | 2,434,386 |
| | $ | 2,268,802 |
| | $ | 2,360,234 |
| | $ | 2,350,013 |
| | $ | 2,261,016 |
| |
| Beginning fair value | $ | 39,033 |
| | $ | 73,337 |
| | $ | 73,730 |
| | $ | 85,479 |
| | $ | 161,234 |
| | | | |
| |
| |
| |
| |
| |
| Effect of principal payments | (110 | ) | | (1,745 | ) | | (488 | ) | | (866 | ) | | (1,828 | ) | | | Ending Balances for Other Loan and MSR Investments | | | |
Transfers between portfolios (1) | — |
| | (34,375 | ) | | — |
| | (12,229 | ) | | (75,058 | ) | | | Residential Loans, HFI | | | | | | | | | | | |
| Change in fair value, net | (48 | ) | | 1,816 |
| | 95 |
| | 1,346 |
| | 1,131 |
| | | Legacy Sequoia entities | | $ | 632,817 |
| | $ | 673,134 |
| | $ | 707,686 |
| | $ | 745,621 |
| | $ | 791,636 |
| |
| Ending fair value | $ | 38,875 |
| | $ | 39,033 |
| | $ | 73,337 |
| | $ | 73,730 |
| | $ | 85,479 |
| | | Sequoia Choice entities | | $ | 620,062 |
| | $ | 317,303 |
| | $ | — |
| | $ | — |
| | $ | — |
| |
| | | | | | | | | | | | | Commercial Loans | | $ | — |
| | $ | — |
| | $ | — |
| | $ | 2,700 |
| | $ | 2,700 |
| |
| Securities – Subordinate | | | | | | | | | | | | Mortgage Servicing Rights | | $ | 63,598 |
| | $ | 62,928 |
| | $ | 63,770 |
| | $ | 111,013 |
| | $ | 118,526 |
| |
| Beginning fair value | $ | 1,101,240 |
| | $ | 968,204 |
| | $ | 916,111 |
| | $ | 759,347 |
| | $ | 679,894 |
| | | | |
| | | | | |
| |
| |
| Acquisitions | 189,984 |
| | 171,755 |
| | 104,018 |
| | 167,498 |
| | 106,415 |
| | | | | | | | | | | | | | |
| Sales | (75,651 | ) | | (44,576 | ) | | (69,048 | ) | | (16,816 | ) | | (11,809 | ) | | | | | | | | | | | | | | |
| Effect of principal payments | (9,396 | ) | | (10,428 | ) | | (7,538 | ) | | (7,798 | ) | | (8,182 | ) | | | | | | | | | | | | | | |
| Change in fair value, net | 20,495 |
| | 16,285 |
| | 24,661 |
| | 13,880 |
| | (6,971 | ) | | | | | | | | | | | | | | |
| Ending fair value | $ | 1,226,672 |
| | $ | 1,101,240 |
| | $ | 968,204 |
| | $ | 916,111 |
| | $ | 759,347 |
| | | | | | | | | | | | | | |
| | | | | | | | | | | | | | |
| | | | | |
| |
| |
| Ending Balances for Subordinate Sub-Categories | | | | | | | | | | | | | | | | | | | | | | |
| RMBS 2.0 Mezzanine | $ | 331,451 |
| | $ | 334,915 |
| | $ | 343,013 |
| | $ | 368,919 |
| | $ | 315,397 |
| | | | | | | | | | | | | | |
| RMBS 2.0 Subordinate | 247,897 |
| | 209,554 |
| | 195,039 |
| | 191,321 |
| | 177,760 |
| | | | |
| | | | | |
| |
| |
| Agency CRT | 300,713 |
| | 286,780 |
| | 229,510 |
| | 198,197 |
| | 152,126 |
| | | | | | | | | | | | | | |
| Legacy RMBS Subordinate | 22,586 |
| | 26,920 |
| | 30,333 |
| | 18,993 |
| | 22,294 |
| | | | | | | | | | | | | | |
| Total residential subordinates | 902,647 |
| | 858,169 |
| | 797,895 |
| | 777,430 |
| | 667,577 |
| | | | | | | | | | | | | | |
| Multifamily | 324,025 |
| | 243,071 |
| | 170,309 |
| | 138,681 |
| | 91,770 |
| | | | | | | | | | | | | | |
| Total subordinate securities | $ | 1,226,672 |
| | $ | 1,101,240 |
| | $ | 968,204 |
| | $ | 916,111 |
| | $ | 759,347 |
| | | | | | | | | | | | | | |
| | | | | | | | | | | | | | | | | | | | | | | | | |
| |
| (1) | In 2016 and 2017, certain Re-REMIC securities we held were exchanged for the underlying senior securities. |
| |
| (2) | Includes $328 million and $318 million of Choice loans securitized during the fourth and third quarters of 2017, respectively, which were not treated as sales for GAAP purposes and continue to be reported on our consolidated balance sheets as residential loans held-for-investment within our Investment Portfolio segment. |
|
| | |
| THE REDWOOD REVIEW I 4TH QUARTER 2017 | | Table 8: Securities and Loan Activity 30 |
|
| | | | | | | | | | | | | | | | | | | | | | | | | | | | | | | | | |
| Table 9: Consolidating Balance Sheet ($ in thousands) | |
| | | | | | | | | | | | | | | | | | |
| | December 31, 2017 | | September 30, 2017 | |
| | | | Consolidated VIEs (1) | | | | | | Consolidated VIEs (1) | | | |
| | At Redwood (1) | | Legacy Sequoia | | Sequoia Choice | | Redwood Consolidated | | At Redwood (1) | | Legacy Sequoia | | Sequoia Choice | | Redwood
Consolidated | |
| Residential loans | $ | 3,862,331 |
| | $ | 632,817 |
| | $ | 620,062 |
| | $ | 5,115,210 |
| | $ | 3,194,483 |
| | $ | 673,134 |
| | $ | 317,303 |
| | $ | 4,184,920 |
| |
| Real estate securities | 1,476,510 |
| | — |
| | — |
| | 1,476,510 |
| | 1,356,272 |
| | — |
| | — |
| | 1,356,272 |
| |
| Mortgage servicing rights | 63,598 |
| | — |
| | — |
| | 63,598 |
| | 62,928 |
| | — |
| | — |
| | 62,928 |
| |
| Cash and cash equivalents | 144,663 |
| | — |
| | — |
| | 144,663 |
| | 257,611 |
| | — |
| | — |
| | 257,611 |
| |
| Total earning assets | 5,547,102 |
| | 632,817 |
|
| 620,062 |
| | 6,799,981 |
| | 4,871,294 |
| | 673,134 |
| | 317,303 |
| | 5,861,731 |
| |
Other assets (2) | 232,946 |
| | 4,367 |
|
| 2,528 |
| | 239,841 |
| | 263,637 |
| | 4,065 |
| | 1,266 |
| | 268,968 |
| |
| Total assets | $ | 5,780,048 |
| | $ | 637,184 |
| | $ | 622,590 |
| | $ | 7,039,822 |
| | $ | 5,134,931 |
| | $ | 677,199 |
| | $ | 318,569 |
| | $ | 6,130,699 |
| |
| Short-term debt | $ | 1,938,682 |
| | $ | — |
| | $ | — |
| | $ | 1,938,682 |
| | $ | 1,238,196 |
| | $ | — |
| | $ | — |
| | $ | 1,238,196 |
| |
| Other liabilities | 146,673 |
| | 537 |
|
| 2,035 |
| | 149,245 |
| | 163,551 |
| | 540 |
| | 1,045 |
| | 165,136 |
| |
| ABS issued | — |
| | 622,445 |
| | 542,140 |
| | 1,164,585 |
| | — |
| | 657,960 |
| | 286,328 |
| | 944,288 |
| |
| Long-term debt, net | 2,575,023 |
| | — |
| | — |
| | 2,575,023 |
| | 2,574,439 |
| | — |
| | — |
| | 2,574,439 |
| |
| Total liabilities | 4,660,378 |
| | 622,982 |
| | 544,175 |
| | 5,827,535 |
| | 3,976,186 |
| | 658,500 |
| | 287,373 |
| | 4,922,059 |
| |
| | | | | | | | | | | | | | | | | |
| Equity | 1,119,670 |
| | 14,202 |
|
| 78,415 |
| | 1,212,287 |
| | 1,158,745 |
| | 18,699 |
| | 31,196 |
| | 1,208,640 |
| |
| Total liabilities and equity | $ | 5,780,048 |
| | $ | 637,184 |
|
| $ | 622,590 |
| | $ | 7,039,822 |
| | $ | 5,134,931 |
| | $ | 677,199 |
| | $ | 318,569 |
| | $ | 6,130,699 |
| |
| | | | | | | | | | | | | | | | | |
| |
| (1) | The format of this consolidating balance sheet is provided to more clearly delineate between the assets belonging to consolidated Sequoia securitization entities that we are required to consolidate on our balance sheet in accordance with GAAP, but which are not legally ours, and the liabilities of these consolidated entities, which are payable only from the cash flows generated by their assets and are, therefore, nonrecourse to us, and the assets that are legally ours and the liabilities of ours for which there is recourse to us. |
| |
| (2) | At both December 31, 2017 and September 30, 2017, other assets at Redwood included a total of $43 million of assets held by third-party custodians and pledged as collateral to the GSEs in connection with credit risk-sharing arrangements relating to conforming residential loans. These pledged assets can only be used to settle obligations to the GSEs under these risk-sharing arrangements. |
|
| | |
| THE REDWOOD REVIEW I 4TH QUARTER 2017 | | Table 9: Consolidating Balance Sheet 31 |
|
|
| |
| R E D W O O D' S B U S I N E S S O V E R V I E W |
Redwood’s Business
Redwood invests in residential mortgages and other real estate-related assets and engages in residential mortgage banking activities. We are structured as a REIT for federal tax purposes. Our REIT holds most of our mortgage-related investments, due to the tax advantages afforded to REITs. Our mortgage-banking activities are conducted through taxable REIT subsidiaries that pay corporate income taxes. We operate and report our businesses through two segments - Investment Portfolio and Residential Mortgage Banking.
Investment Portfolio: Our Investment Portfolio segment primarily consists of investments in residential jumbo loans and real estate securities. Our securities portfolio primarily includes investments in residential mortgage-backed securities ("RMBS") retained from our Sequoia securitizations and RMBS issued by third parties, Agency CRT securities, as well as investments in Agency multifamily securities. Our loan investments are primarily made through a subsidiary of Redwood Trust that is a member of the Federal Home Loan Bank of Chicago ("FHLBC"). This subsidiary utilizes attractive long-term financing from the FHLBC to make long-term investments directly in residential mortgage loans.
This segment’s main source of revenue is net interest income from these investments. Additionally, this segment may realize gains and losses upon the sale of investments. Funding, hedging, tax, and direct operating expenses associated with these activities are also included in this segment.
Residential Mortgage Banking: Our Residential Mortgage Banking segment primarily consists of operating a mortgage loan conduit that acquires prime jumbo residential loans on a flow basis from a network of third-party originators for subsequent sale, securitization, or transfer to our investment portfolio. We occasionally supplement our flow purchases with bulk loan acquisitions. We typically distribute the loans through either our Sequoia private-label securitization program or to institutions that acquire pools of whole loans.
This segment’s main source of revenue is income from mortgage banking activities, which includes valuation increases (or gains) on the sale or securitization of loans and valuation changes from hedges used to manage the risks associated with these activities. Additionally, this segment may generate interest income on loans held pending securitization or sale. Funding, tax, and direct operating expenses associated with these activities are also included in this segment.
|
|
| |
| THE REDWOOD REVIEW I 4TH QUARTER 2017 |
| 33 |
|
|
| |
| D I V I D E N D P O L I C Y |
Dividend Policy
Summary
As a REIT, Redwood is required to distribute to shareholders at least 90% of its REIT taxable income, excluding net capital gains. To the extent Redwood retains REIT taxable income, including net capital gains, it is taxed at corporate tax rates. Redwood also earns taxable income at its taxable REIT subsidiaries (TRS), which it is not required to distribute.
Dividend Policy Overview
In recent years, our Board of Directors has maintained a policy of paying regular quarterly dividends in excess of the amount required to comply with the provisions of the Internal Revenue Code applicable to REITs. In December 2017, the Board of Directors announced its intention to pay a regular dividend of $0.28 per share per quarter in 2018. In February 2018, the Board of Directors declared a regular dividend of $0.28 per share for the first quarter of 2018, which is payable on March 29, 2018 to shareholders of record on March 15, 2018.
Dividend Distribution Requirement
Our estimated REIT taxable income was $32 million, or $0.42 per share, for the fourth quarter of 2017 and $20 million, or $0.26 per share, for the third quarter of 2017. Under normal circumstances, our minimum REIT dividend requirement would be 90% of our annual REIT taxable income. However, we currently maintain a $58 million federal net operating loss carry forward (NOL) at the REIT that affords us the option of retaining REIT taxable income up to the NOL amount, tax free, rather than distributing it as dividends. Federal income tax rules require the dividends paid deduction to be applied to reduce REIT taxable income before the applicability of NOLs is considered. Our estimated REIT taxable income exceeded our dividend distributions in 2017; therefore, we expect to utilize $2 million of our NOL in 2017 and the remaining $57 million will carry forward into 2018.
|
|
| |
| THE REDWOOD REVIEW I 4TH QUARTER 2017 |
| 34 |
|
|
| |
| D I V I D E N D P O L I C Y |
Income Tax Characterization of Dividend for Shareholders
Our 2017 dividend distributions are expected to be characterized for federal income tax purposes as 71% ordinary dividend income and 29% qualified dividend income (generated from $25 million of qualified dividends from our TRS to our REIT). Thus, we expect all $86 million of our 2017 dividend distributions to be characterized as dividend income to shareholders, as the taxable income and net capital gains we generated in 2017 prior to the application of a dividends paid deduction, NOLs, and capital loss carryforwards in accordance with federal income tax rules, exceeded our 2017 distributions. While the REIT earned net capital gains in 2017, none of the 2017 dividend distributions are expected to be characterized as long-term capital gains. Under the federal income tax rules applicable to REITs, capital loss carryforwards offset the 2017 capital gains when determining the characterization of ordinary versus long-term capital gain dividend distributions.
Beginning in 2018, the Tax Cuts and Jobs Act provides that individual taxpayers may deduct 20% of their ordinary REIT dividends from taxable income. This results in a maximum federal effective tax rate of 29.6% on an individual taxpayer's ordinary REIT dividends, compared to the highest marginal rate of 37%. This deduction does not apply to REIT dividends classified as qualified dividends or long-term capital gains dividends, as those dividends are taxed at a maximum rate of 20% for individuals.
|
|
| |
| THE REDWOOD REVIEW I 4TH QUARTER 2017 |
| 35 |
|
|
| |
| C O R E E A R N I N G S D E F I N I T I O N |
Core Earnings
Core earnings is a non-GAAP measure of Redwood’s earnings and results of operations. Specifically, management has defined core earnings as: GAAP net income adjusted to (i) eliminate the impact of quarterly mark-to-market changes on the fair value of long-term investments (and associated derivatives) related to changes in benchmark interest rates and credit spreads, (ii) include the cumulative net gains or losses on long-term investments accounted for as trading securities under GAAP that were sold during the period presented, net of any gains or losses from derivatives associated with the investments sold, and (iii) include the hypothetical income taxes associated with core earnings adjustments.
Management utilizes this core earnings measure internally as one way of analyzing Redwood’s performance over multiple periods, as it believes it provides useful comparative results absent the impact of certain quarterly mark-to-market changes on investments held through the end of the period presented and inclusive of all realized gains and losses from securities sales.
Specifically, the quarterly mark-to-market changes in the value of our long-term investments in loans, trading securities, and other investments, as well as the associated derivatives, resulting from changes in benchmark interest rates and credit spreads may not be reflective of the total return management would expect to earn from them over the longer-term.
Additionally, the adjustment to include cumulative net gains or losses from the sale of trading securities is to ensure that core earnings presents consistently the impact of the sales of investments regardless of whether they are accounted for as (i) trading securities or (ii) available-for-sale securities, in each case under GAAP, as outlined below.
| |
| • | Under GAAP, available-for-sale securities are reported at their fair value with periodic changes in fair value recognized through the balance sheet in Shareholders’ equity. When an available-for-sale security is sold, the cumulative gain or loss since purchase is recognized through the income statement, in Realized gains, net, in the period the sale occurred. As a result, any such cumulative gains or losses are reflected in core earnings in the period the sale occurred. |
| |
| • | Under GAAP, trading securities are reported at their fair value with periodic changes in fair value recognized through the income statement in Investment fair value changes, net. Certain of these periodic changes in fair value (as described above) are excluded from core earnings. Core earnings includes an adjustment to include the cumulative net gains or losses (from purchase through the sale of the investment) for sold trading securities in the period they are sold. The result is to consistently present within core earnings the cumulative gains or losses from the sale of long-term investments, regardless of how they are accounted for under GAAP. |
|
|
| |
| THE REDWOOD REVIEW I 4TH QUARTER 2017 |
| 36 |
|
|
| |
| C O R E E A R N I N G S D E F I N I T I O N |
Core earnings also includes adjustments to show the hypothetical tax provision or benefit that would be associated with the core earnings adjustments made to net income. As a REIT, we are subject to income taxes on earnings generated at our taxable REIT subsidiaries (TRS) and generally not subject to income taxes on earnings generated at the REIT (to the extent we distribute our REIT taxable income as dividends). In order to present the hypothetical income taxes associated with core earnings adjustments made to net income, estimated effective tax rates are applied to the core earnings adjustments occurring within our TRS.
We caution that core earnings, core segment contribution, and core earnings per share should not be utilized in isolation, nor should they be considered as alternatives to GAAP net income, GAAP net income per share, or other measurements of results of operations computed in accordance with GAAP.
|
|
| |
| THE REDWOOD REVIEW I 4TH QUARTER 2017 |
| 37 |
|
|
| |
| F O R W A R D - L O O K I N G S T A T E M E N T S |
As noted above under the heading “Cautionary Statement,” this Redwood Review contains forward-looking statements within the meaning of the safe harbor provisions of the Private Securities Litigation Reform Act of 1995. Forward-looking statements involve numerous risks and uncertainties. Our actual results may differ from our expectations, estimates, and projections and, consequently, you should not rely on these forward-looking statements as predictions of future events. Forward-looking statements are not historical in nature and can be identified by words such as “anticipate,” “estimate,” “will,” “should,” “expect,” “believe,” “intend,” “seek,” “plan,” and similar expressions or their negative forms, or by references to strategy, plans, goals, or intentions. These forward-looking statements are subject to risks and uncertainties, including, among other things, those described in our Annual Report on Form 10-K under the caption “Risk Factors.” Other risks, uncertainties, and factors that could cause actual results to differ materially from those projected are described below and may be described from time to time in reports we file with the Securities and Exchange Commission, including reports on Forms 10-K, 10-Q, and 8-K. We undertake no obligation to update or revise forward-looking statements, whether as a result of new information, future events, or otherwise.
Statements regarding the following subjects, among others, are forward-looking by their nature: (i) statements we make regarding Redwood’s business strategy and strategic focus, including statements relating to our overall market position, strategy and long-term prospects; (ii) statements related to our financial outlook and expectations for 2018, including with respect to: 2018 GAAP earnings (including that we seek to generate earnings that exceed our recent historical annual dividend payouts), our investment portfolio (including that we expect returns on our investment portfolio to be between 9% and 11%), residential mortgage banking activities (including that we expect loan purchase volume to be between $7 billion and $8 billion for 2018, gross margins within our long-term expectations of 75 to 100 basis points, and that we expect to double Redwood Choice loan purchase volume in 2018), and operating expenses (including that we expect baseline corporate operating expenses to be between $40 million and $45 million); (iii) statements regarding the upcoming maturity of convertible notes in 2018, including that we have sufficient capital to repay our maturing convertible debt due in April 2018, and that, going forward, we will consider the most efficient sources of capital both from optimization within our portfolio and from the capital markets; (iv) statements regarding the impact of the 2017 tax reform legislation on our business and on the broader housing market; (v) statements regarding mortgage banking activities, including statements relating to pending securitization activity and the pricing and anticipated closing of certain Select and Choice securitization transactions, as well as the expansion of our core mortgage credit strategies through the growth of our expanded-prime Redwood Choice loan program and the pursuit of initiatives providing financing to single-family housing investors and providing new types of capital solutions to our existing loan sellers; (vi) statements relating to acquiring residential mortgage loans in the future that we have identified for purchase or plan to purchase, including the amount of such loans that we identified for purchase during the fourth quarter of 2017 and at December 31, 2017, and expected fallout and the corresponding volume of residential mortgage loans expected to be available for purchase; (vii) statements relating to our estimate of our available capital (including that we estimate our capital available for
|
|
| |
| THE REDWOOD REVIEW I 4TH QUARTER 2017 |
| 38 |
|
|
| |
| F O R W A R D - L O O K I N G S T A T E M E N T S |
investments at December 31, 2017 was approximately $280 million); (viii) statements we make regarding our dividend policy, including our intention to pay a regular dividend of $0.28 per share per quarter in 2018; and (ix) statements regarding our expectations and estimates relating to the characterization for income tax purposes of our dividend distributions, our expectations and estimates relating to tax accounting, tax liabilities and tax savings, and GAAP tax provisions, and our estimates of REIT taxable income and TRS taxable income.
Important factors, among others, that may affect our actual results include:
| |
| • | the pace at which we redeploy our available capital into new investments; |
| |
| • | interest rate volatility, changes in credit spreads, and changes in liquidity in the market for real estate securities and loans; |
| |
| • | changes in the demand from investors for residential mortgages and investments, and our ability to distribute residential mortgages through our whole-loan distribution channel; |
| |
| • | our ability to finance our investments in securities and our acquisition of residential mortgages with short-term debt; |
| |
| • | changes in the values of assets we own; |
| |
| • | general economic trends, the performance of the housing, real estate, mortgage, credit, and broader financial markets, and their effects on the prices of earning assets and the credit status of borrowers; |
| |
| • | federal and state legislative and regulatory developments, and the actions of governmental authorities, including the new U.S. presidential administration, and in particular those affecting the mortgage industry or our business (including, but not limited to, the Federal Housing Finance Agency’s rules relating to FHLB membership requirements and the implications for our captive insurance subsidiary’s membership in the FHLB); |
| |
| • | strategic business and capital deployment decisions we make; |
| |
| • | developments related to the fixed income and mortgage finance markets and the Federal Reserve’s statements regarding its future open market activity and monetary policy; |
| |
| • | our exposure to credit risk and the timing of credit losses within our portfolio; |
| |
| • | the concentration of the credit risks we are exposed to, including due to the structure of assets we hold and the geographical concentration of real estate underlying assets we own; |
| |
| • | our exposure to adjustable-rate mortgage loans; |
| |
| • | the efficacy and expense of our efforts to manage or hedge credit risk, interest rate risk, and other financial and operational risks; |
| |
| • | changes in credit ratings on assets we own and changes in the rating agencies’ credit rating methodologies; |
| |
| • | changes in interest rates; |
| |
| • | changes in mortgage prepayment rates; |
| |
| • | changes in liquidity in the market for real estate securities and loans; |
| |
| • | our ability to finance the acquisition of real estate-related assets with short-term debt; |
| |
| • | the ability of counterparties to satisfy their obligations to us; |
|
|
| |
| THE REDWOOD REVIEW I 4TH QUARTER 2017 |
| 39 |
|
|
| |
| F O R W A R D - L O O K I N G S T A T E M E N T S |
| |
| • | our involvement in securitization transactions, the profitability of those transactions, and the risks we are exposed to in engaging in securitization transactions; |
| |
| • | exposure to claims and litigation, including litigation arising from our involvement in securitization transactions; |
| |
| • | ongoing litigation against various trustees of RMBS transactions; |
| |
| • | whether we have sufficient liquid assets to meet short-term needs; |
| |
| • | our ability to successfully compete and retain or attract key personnel; |
| |
| • | our ability to adapt our business model and strategies to changing circumstances; |
| |
| • | changes in our investment, financing, and hedging strategies and new risks we may be exposed to if we expand our business activities; |
| |
| • | our exposure to a disruption or breach of the security of our technology infrastructure and systems; |
| |
| • | exposure to environmental liabilities; |
| |
| • | our failure to comply with applicable laws and regulations; |
| |
| • | our failure to maintain appropriate internal controls over financial reporting and disclosure controls and procedures; |
| |
| • | the impact on our reputation that could result from our actions or omissions or from those of others; changes in accounting principles and tax rules; |
| |
| • | our ability to maintain our status as a REIT for tax purposes; |
| |
| • | limitations imposed on our business due to our REIT status and our status as exempt from registration under the Investment Company Act of 1940; |
| |
| • | decisions about raising, managing, and distributing capital; and |
| |
| • | other factors not presently identified. |
|
|
| |
| THE REDWOOD REVIEW I 4TH QUARTER 2017 |
| 40 |
ADJUSTABLE-RATE MORTGAGES (ARMs) - Adjustable-rate mortgages are loans that have coupons that adjust at least once per year. We make a distinction between ARMs (loans with a rate adjustment at least annually) and hybrids (loans that have a fixed-rate period of 2-10 years and then become adjustable-rate).
ADJUSTED ROE - Adjusted ROE, or Adjusted Return on Equity, is a non-GAAP financial performance metric used in determining performance-based annual bonus compensation for executives. Non-GAAP Adjusted ROE is defined as GAAP earnings divided by average equity capital adjusted to exclude average accumulated other comprehensive income, as reported under GAAP. Average accumulated other comprehensive income generally represents certain unrealized mark-to-market gains and losses.
AGENCY - Agency refers to government-sponsored enterprises (“GSEs”), including Federal National Mortgage Association (“Fannie Mae”), Federal Home Loan Mortgage Corporation (“Freddie Mac”), and Government National Mortgage Association (“Ginnie Mae”).
ALT-A SECURITIES and ALT-A LOANS - As categories, Alt-A securities and Alt-A loans were commonly used prior to the financial crisis (i.e., prior to 2009), but are no longer typically used to describe securities or loans issued or originated since 2009. Alt-A securities was a term used to describe residential mortgage-backed securities backed by loans that had higher credit quality than subprime and lower credit quality than prime. Alt-A originally represented loans with alternative documentation, but the definition shifted over time to include loans with additional risk characteristics and in some cases investor loans. An Alt-A loan was a term used to describe a loan where the borrower’s income may not have been verified, and in some cases, may not have been disclosed on the loan application. Alt-A loans was also a term used to describe loans with expanded criteria that allowed for higher debt-to-income ratios with higher accompanying loan-to-value ratios than would otherwise have applied prime loans.
AMORTIZED COST - Amortized cost is the initial acquisition cost of an available-for-sale (“AFS”) security, minus principal repayments or principal reductions through credit losses, plus or minus premium or discount amortization. At the point in time an AFS security is deemed other-than-temporarily impaired, the amortized cost is adjusted (by changing the amount of unamortized premium or discount) by the amount of other-than temporary impairment taken through the income statement.
ASSET-BACKED SECURITIES (ABS) - Asset-backed securities are securities backed by financial assets that generate cash flows. Each ABS issued from a securitization entity has a unique priority with respect to receiving principal and interest cash flows and absorbing any credit losses from the assets owned by the entity.
AVAILABLE CAPITAL - Available Capital represents a combination of capital available for investment and risk capital we hold for liquidity management purposes.
|
|
| |
| THE REDWOOD REVIEW I 4TH QUARTER 2017 |
| 41 |
AVAILABLE-FOR-SALE (AFS) - An accounting method for debt and equity securities in which the securities are reported at their fair value. Positive changes in the fair value are accounted for as increases to stockholders’ equity and do not flow through the income statement. Negative changes in fair value may be recognized through the income statement or balance sheet.
BOOK VALUE (GAAP) - Book value is the value of our common equity in accordance with GAAP.
COMMERCIAL MORTGAGE-BACKED SECURITIES (CMBS) - A type of mortgage-backed security that is secured by one or more loans on commercial properties.
CONFORMING LOAN - A conforming loan is a mortgage loan that conforms to the underwriting standards of Fannie Mae and Freddie Mac, including the maximum loan limit, which is currently $424,100 except in defined high-cost areas of the country, where the limit is higher. Changes to this maximum loan limit are announced annually by the Federal Housing Finance Agency (“FHFA”), which is the regulator and conservator of both Fannie Mae and Freddie Mac.
CONSTANT (or CONDITIONAL) PREPAYMENT RATE (CPR) - Constant (or conditional) prepayment rate is an industry-standard measure of the speed at which mortgage loans prepay. It approximates the annual percentage rate at which a pool of loans is paying down due to unscheduled principal prepayments.
CORE EARNINGS - Core earnings is a non-GAAP measure of Redwood’s earnings and results of operations. See the preceding Core Earnings Definition section for additional information on this metric.
CREDIT RISK TRANSFER (CRT) INVESTMENTS - Credit risk transfer investments generally refer to transactions in which mortgage loan credit risk is shifted from one party to another, examples of which may include structured debt issuances, credit-linked notes, insurance/reinsurance transactions, front-end or back-end lender risk-sharing transactions, and senior subordinate securities. Among the CRT investments that Redwood holds are CRT transactions it entered into with the Agencies relating to conforming loans.
CREDIT SPREAD - Credit spread is a component of the security representing its credit quality. Credit spread reflects the market perception of changes in prepayment, delinquency and recovery rates, therefore capturing the impact of other variables on the fair value. Changes in credit spread affect the fair value of securities differently depending on the characteristics and maturity profile of the security. For example, credit spread is a more significant driver of the fair value measurement of a high yield bond as compared to an investment grade bond. Generally, the credit spread for an investment grade bond is also more observable and less volatile than its high yield counterpart.
|
|
| |
| THE REDWOOD REVIEW I 4TH QUARTER 2017 |
| 42 |
CREDIT SUPPORT - Credit support is the face amount of securities subordinate (or junior) to the applicable security that protects the security from credit losses and is generally expressed as a percentage of the securitization’s underlying pool balance.
DISREGARDED ENTITY - An entity wholly owned, directly or indirectly through other disregarded entities, by another entity (the “parent entity”), whose separate existence from the parent entity is disregarded for federal income tax purposes.
FALLOUT - The percentage of loans that an originator plans or commits to sell to a buyer that ultimately do not close and are not delivered to the buyer.
FASB - Financial Accounting Standards Board.
FHFA - The FHFA refers to the Federal Housing Finance Authority.
FHLB and FHLBC - The FHLB refers to the Federal Home Loan Bank system. The FHLBC refers to the Federal Home Loan Bank of Chicago.
GAAP - Generally Accepted Accounting Principles in the United States.
GOVERNMENT-SPONSORED ENTERPRISE (GSE) - A government-sponsored enterprise is a financial services corporation created by the United States Congress to enhance the flow of credit to targeted sectors of the economy. Among the GSEs chartered by Congress are Fannie Mae, Freddie Mac, Ginnie Mae, and the Federal Home Loan Banks. When we refer to GSEs, we are generally referring to Fannie Mae and Freddie Mac.
INTEREST-ONLY SECURITIES (IOs) - Interest-only securities are specialized securities created by securitization entities where the projected cash flows generated by the underlying assets exceed the cash flows projected to be paid to the securities that are issued with principal balances. Typically, IOs do not have a principal balance and they will not receive principal payments. Interest payments to IOs usually equal an interest rate formula multiplied by a “notional” principal balance. The notional principal balances for IOs are typically reduced over time as the actual principal balance of the underlying pool of assets pays down, thus reducing the cash flows to the IOs over time. Cash flows on IOs are typically reduced more quickly when asset prepayments increase.
JUMBO LOAN - A jumbo loan is a residential mortgage loan that generally conforms to the underwriting standards of Fannie Mae and Freddie Mac except that the dollar amount of the loan exceeds the conforming loan limit set annually by the FHFA. See Conforming Loan Definition.
LEGACY RMBS - Residential mortgage-backed securities issued prior to 2009.
|
|
| |
| THE REDWOOD REVIEW I 4TH QUARTER 2017 |
| 43 |
LEVERAGE RATIOS - Leverage ratios measure financial leverage and are used to assess a company’s ability to meet its financial obligations. Financial leverage ratios are often expressed as debt to equity and assets to equity. In the mortgage banking industry, financial leverage is most commonly calculated using debt to equity. At Redwood, the two financial leverage ratios used are consolidated GAAP debt to equity and recourse debt (or, debt at Redwood) to equity. The former calculation includes the consolidated ABS issued from certain Sequoia securitization entities even though those obligations are not financial obligations of Redwood but are obligations of each the consolidated securitization trusts and are payable only from the cash flow from the assets owned by each of those trusts. The latter calculation of recourse debt to equity excludes debt related to consolidated securitizations and only includes debt for which Redwood has an obligation to repay. Both ratios are calculated at the bottom of Table 7: Financial Ratios and Book Value in the Appendix section.
LOAN PURCHASE COMMITMENT (LPC) - A commitment to purchase a residential mortgage loan from a mortgage loan originator at a specified price and within a specified time period. A “best efforts” loan purchase commitment becomes effective once the originator has closed the loan with the borrower. A “mandatory” loan purchase commitment becomes effective once the commitment is entered into among the buyer and the originator, regardless if the originator has closed the loan. Mortgage buyers such as Redwood often issue 30 to 60 day loan purchase commitments to loan originators so they can in turn offer a similar commitments to their borrowers. To hedge interest rate risk during the commitment period, buyers will often enter in to a forward sale commitment or hedge the risk using derivatives. (See Forward Sale Commitment definition.) A loan purchase commitment for a conforming loan qualifies as a derivative in accordance with GAAP. Beginning January 1, 2015, our loan purchase commitment for a non-conforming loan qualifies as a derivative in accordance with GAAP. Any change in the value of a loan purchase commitment is recorded in mortgage banking activities.
LONG-TERM DEBT - Long-term debt is debt that is an obligation of Redwood that is not payable within a year and includes convertible debt, exchangeable debt, junior subordinated notes and trust preferred securities. We generally treat long-term debt as part of our capital base when it is not payable in the near future.
MARK-TO-MARKET (MTM) ACCOUNTING - Mark-to-market accounting uses estimated fair values of assets, liabilities, and hedges. Many assets on our consolidated balance sheet are carried at their fair value rather than amortized cost. Taxable income is generally not affected by mark-to-market fair value changes.
MEZZANINE SECURITIES - Mezzanine securities are a type of subordinate security and refer to the securities in a residential mortgage-backed securitization that are rated AA, A, and BBB. They rank junior to the AAA securities, and senior to the securities rated below BBB which typically include BB and B rated securities, and any non-rated securities.
|
|
| |
| THE REDWOOD REVIEW I 4TH QUARTER 2017 |
| 44 |
MORTGAGE SERVICING RIGHT (MSR) - A mortgage servicing right gives the holder the contractual right to service a mortgage loan. MSRs typically include the right to collect monthly mortgage principal and interest payments, as well as related tax and insurance payments, from borrowers, disburse funds to the mortgage debt holders and remit related insurance and tax payments, collect late payments, and process modifications and foreclosures. MSRs are created when mortgage loans are sold in a transaction in which the seller retains the right to service the loans. The holder of an MSR receives a monthly servicing fee (which generally ranges from 0.25% to 0.375% per annum of the outstanding principal balance of the related mortgage loan), which is deducted from the borrower’s monthly interest payments. For accounting purposes, MSRs are capitalized at the net present value of the servicing fee less the servicing cost. When Redwood holds an MSR relating to a residential mortgage loan, it retains a sub-servicer to carry out actual servicing functions, as Redwood does not directly service residential mortgage loans.
MPF DIRECT - MPF Direct is a mortgage loan product offered by the Federal Home Loan Bank of Chicago under the Mortgage Partnership Finance ("MPF") program. Members of the FHLB system that are eligible to participate in the MPF Direct product ("MPF Direct sellers") sell high-balance loans to the Federal Home Loan Bank of Chicago which in turn sells the loans to Redwood, which we also refer to as our MPF Direct channel.
MULTIFAMILY SECURITIES - A type of mortgage-backed security that is secured by one or more loans on multifamily properties. Our Investment Portfolio includes securities primarily issued through Freddie Mac’s conventional multifamily securitization platform.
NON-PRIME SECURITIES - Non-prime securities are Alt-A, option ARM, and subprime securities. See definitions of Alt-A, option ARM, and subprime securities.
NON-RECOURSE DEBT - Debt that is secured by collateral, but for which the borrower is not personally liable. If the borrower defaults, the lender may seize the collateral, but cannot seek repayment from the borrower for any unpaid principal or interest, even if the value of the collateral does not cover the unpaid amount due following default.
PRIME RESIDENTIAL REAL ESTATE LOANS - Prime loans are residential loans with higher quality credit characteristics, such as borrowers with relatively higher FICO credit scores, relatively lower loan-to-value ratios, relatively lower debt-to-income ratios, and/or relatively greater levels of other assets.
PRIME SECURITIES - Prime securities are residential mortgage-backed securities backed by prime loans. Prime securities are typically backed by loans that have relatively higher weighted average FICO scores, relatively lower weighted average LTVs, and relatively limited concentrations of investor properties.
|
|
| |
| THE REDWOOD REVIEW I 4TH QUARTER 2017 |
| 45 |
PRINCIPAL-ONLY SECURITIES (POs) - Principal-only securities are specialized securities created by securitization entities where the holder is only entitled to receive regular cash flows that are derived from incoming principal repayments on an underlying mortgage loan pool. This security is created by splitting a mortgage-backed security into its interest and principal payments. The principal payments create a stream of cash flows which are sold at a discount to investors. These investors will receive the principal portions of the monthly mortgage payments from the underlying pool of loans. The yield on a PO strip depends on the prepayment speed of the underlying loan. The faster the principal is repaid, the higher the yield an investor will receive.
PROFITABILITY RATIOS - Many financial institution analysts use asset-based profitability ratios such as interest rate spread and interest rate margin when analyzing financial institutions. These are asset-based measures. Since we consolidate the assets and liabilities of certain securitization entities for GAAP purposes, our total GAAP assets and liabilities may vary over time, and may not be comparable to assets typically used in profitability calculations for other financial institutions. As a result, we believe equity-based profitability ratios may be more appropriate than asset-based measures for analyzing Redwood’s operations and results. We provide various profitability ratios in Table 7 in the Financial Tables in this Review.
QUALIFIED REIT SUBSIDIARY - An entity treated as a corporation for federal income tax purposes, 100% of the outstanding equity interests of which is owned by a REIT directly or through one or more disregarded entities or qualified REIT subsidiaries, and with respect to which no election is made to treat such entity as a taxable REIT subsidiary. A qualified REIT subsidiary is treated as a disregarded entity with respect to its parent REIT for federal income tax purposes.
REAL ESTATE INVESTMENT TRUST (REIT) - A real estate investment trust is an entity that makes a tax election to be taxed as a REIT, invests in real estate and real estate-related assets, and meets other requirements for REIT qualification, including the distribution as dividends of at least 90% of its REIT taxable income, excluding net capital gains. A REIT’s REIT taxable income is not taxed at the corporate level to the extent that the REIT taxable income is distributed as dividends to stockholders, providing an operating cost savings. On the other hand, the requirement to pay out as dividends most of the REIT’s REIT taxable income means it can be harder for a REIT to grow using only internally-generated funds (as opposed to raising new capital).
REAL ESTATE OWNED (REO) - Real estate owned refers to real property owned by the lender or loan owner that has been acquired through foreclosure.
REDWOOD CHOICE and REDWOOD SELECT - Redwood Choice is an expanded credit loan acquisition program launched in April 2016. The Choice program is a prime program that is fully documented, but with credit parameters outside Redwood's traditional jumbo loan purchase guidelines. Redwood's traditional prime jumbo loan acquisition program is now referred to as Redwood Select.
|
|
| |
| THE REDWOOD REVIEW I 4TH QUARTER 2017 |
| 46 |
REIT TAXABLE INCOME - REIT taxable income is a non-GAAP measure calculated for tax purposes for a REIT. REIT taxable income is an important measure as it is the basis of a REIT’s dividend distribution requirements. A REIT must annually distribute at least 90% of its REIT taxable income, excluding net capital gains, as dividends to its shareholders. A REIT is subject to corporate income taxes to the extent it does not distribute 100% of its REIT taxable income, including net capital gains.
REMIC - A real estate mortgage investment conduit (“REMIC”) is a special purpose vehicle used to pool real estate mortgages and issue mortgage-backed securities. REMICs are typically exempt from tax at the entity level. REMICs may invest only in qualified mortgages and permitted investments, including single family or multifamily mortgages, commercial mortgages, second mortgages, mortgage participations, and Agency pass-through securities.
RE-REMIC SECURITY - A Re-REMIC is a re-securitization of asset-backed securities. The cash flows from and any credit losses absorbed by the underlying assets can be redirected to the resulting Re-REMIC securities in a variety of ways.
RESECURITIZATION - A resecuritization is a securitization of two or more mortgage-backed securities into a new mortgage-backed security.
RESIDENTIAL MORTGAGE-BACKED SECURITIES (RMBS) - A type of mortgage-backed security that is backed by a pool of mortgages on residential properties.
RETURN ON EQUITY (ROE) - ROE is a measure of the amount of profit we generate over a given period per dollar of equity capital; ROE equals GAAP income divided by average GAAP equity.
RMBS 2.0 - Residential mortgage-backed securities issued after 2008.
SENIOR SECURITIES - Generally, senior securities have the least credit risk in a securitization transaction because they are the last securities to absorb credit losses and have the highest claim on the principal and interest payments (after the fees to servicers and trustees are paid). To further reduce credit risk, most if not all, principal collected from the underlying asset pool is used to pay down the senior securities until certain performance tests are satisfied. If certain performance tests are satisfied, principal payments are shared between the senior securities and the subordinate securities, generally on a pro rata basis. At issuance, senior securities are generally triple A-rated.
SEQUOIA - Sequoia is the brand name for securitizations of residential real estate loans Redwood sponsors. Sequoia entities are independent securitization entities that acquire residential mortgage loans and create and issue asset-backed securities (“ABS”) backed by these loans. These ABS are also referred to as RMBS. Most of the loans that Sequoia entities acquire are prime-quality loans. Most of the senior ABS created by Sequoia are sold to third-party investors. Redwood usually acquires most of the subordinated ABS and may also acquire the IOs.
|
|
| |
| THE REDWOOD REVIEW I 4TH QUARTER 2017 |
| 47 |
SHORT-TERM DEBT - Short-term debt is a debt obligation of Redwood payable within a year. We may obtain this form of debt from a variety of Wall Street firms, banks, and other institutions. We may issue this or other forms of short term debt in the future, use it to finance the accumulation of assets prior to sale or securitization, or to finance investments in loans and securities.
SUBORDINATE SECURITIES (JUNIOR SECURITIES or NON-SENIOR SECURITIES) - Subordinate securities absorb the initial credit losses from a securitization, thus protecting the senior securities. Subordinate securities have a lower priority to receive principal and interest payments than the senior securities. Subordinate securities receive little, if any, principal payments until certain performance tests are satisfied. If certain performance tests are satisfied, principal payments are shared between the senior securities and the subordinate securities, generally on a pro rata basis. Subordinate securities generally receive interest payments even if they do not receive principal payments. At issuance, subordinate securities are generally rated double-A or below.
TAXABLE INCOME - Taxable income is a non-GAAP measure calculated for tax purposes for Redwood and all its subsidiaries. As taxable income calculations differ significantly from GAAP income calculations, a reconciliation is provided in Table 6 in the Financial Tables in this Review.
TAXABLE REIT SUBSIDIARY (TRS) - A corporation in which a REIT directly or indirectly owns stock, that jointly elects with such REIT to have such corporation treated as a taxable REIT subsidiary within the meaning of the Internal Revenue Code and that does not directly or indirectly engage in certain prohibited activities. A TRS is subject to corporate income tax on its taxable income. A TRS is not limited to investing in real estate and real estate-related assets and it can choose to retain all of its after-tax profits.
TO BE ANNOUNCED (TBA) - A term used to describe a forward Agency mortgage-backed securities trade. Pass-through securities issued by Freddie Mac, Fannie Mae and Ginnie Mae trade in the TBA market. The term TBA is derived from the fact that the actual mortgage-backed security that will be delivered to fulfill a TBA trade is not designated at the time the trade is made. The securities are “to be announced” 48 hours prior to the established trade settlement date.
TRADING SECURITIES - The trading designation for securities represents an accounting method under GAAP, whereby securities are reported at their fair value with periodic changes in fair value (both unrealized and realized) recognized through the income statement in Investment fair value changes, net.
|
|
| |
| THE REDWOOD REVIEW I 4TH QUARTER 2017 |
| 48 |