Exhibit 99.2
|
|
| |
| T A B L E O F C O N T E N T S |
|
| |
| Introduction | |
| | |
| Shareholder Letter | |
| | |
| Quarterly Overview | |
| | |
Ñ Second Quarter Highlights | |
| | |
Ñ GAAP Net Income and Reconciliation to Non-GAAP Core Earnings | |
| | |
Ñ Analysis of Earnings | |
| | |
Ñ Segment Results | |
| | |
Ñ GAAP Book Value | |
| | |
Ñ Capital Allocations | |
| | |
Ñ 2018 Financial Outlook | |
| | |
| Financial Insights | |
| | |
Ñ Balance Sheet Analysis | |
| | |
| Financial Tables | |
| | |
| Appendix | |
| | |
Ñ Dividend Policy | |
| | |
Ñ Core Earnings Definition | |
| | |
Ñ Forward-Looking Statements | |
|
|
| |
| THE REDWOOD REVIEW I 2ND QUARTER 2018 |
| 1 |
|
|
| |
| C A U T I O N A R Y S T A T E M E N T |
This Redwood Review contains forward-looking statements within the meaning of the safe harbor provisions of the Private Securities Litigation Reform Act of 1995. Forward-looking statements involve numerous risks and uncertainties. Our actual results may differ from our expectations, estimates, and projections and, consequently, you should not rely on these forward-looking statements as predictions of future events. Forward-looking statements are not historical in nature and can be identified by words such as “anticipate,” “estimate,” “will,” “should,” “expect,” “believe,” “intend,” “seek,” “plan,” and similar expressions or their negative forms, or by references to strategy, plans, goals, or intentions. These forward-looking statements are subject to risks and uncertainties, including, among other things, those described in our Annual Report on Form 10-K under the caption “Risk Factors.” Other risks, uncertainties, and factors that could cause actual results to differ materially from those projected are described below and may be described from time to time in reports we file with the Securities and Exchange Commission, including reports on Forms 10-K, 10-Q, and 8-K. We undertake no obligation to update or revise forward-looking statements, whether as a result of new information, future events, or otherwise.
Statements regarding the following subjects, among others, are forward-looking by their nature: statements we make regarding Redwood’s business strategy and strategic focus, statements related to our financial outlook and expectations for 2018, statements regarding our available capital and sourcing additional capital both internally and from the capital markets, and other statements regarding pending business activities and expectations and estimates relating to our business and financial results. Additional detail regarding the forward-looking statements in this Redwood Review and the important factors that may affect our actual results in 2018 are described in the Appendix of this Redwood Review under the heading “Forward-Looking Statements.”
|
|
| |
| THE REDWOOD REVIEW I 2ND QUARTER 2018 |
| 2 |
Note to Readers:
We file annual reports (on Form 10-K) and quarterly reports (on Form 10-Q) with the Securities and Exchange Commission. These filings and our earnings press releases provide information about Redwood and our financial results in accordance with generally accepted accounting principles (GAAP). These documents, as well as information about our business and a glossary of terms we use in this and other publications, are available through our website, www.redwoodtrust.com. We encourage you to review these documents.
References herein to “Redwood,” the “company,” “we,” “us,” and “our” include Redwood Trust, Inc. and its consolidated subsidiaries. Note that because we round numbers in the tables to millions, except per share amounts, some numbers may not foot due to rounding. References to the “second quarter” refer to the quarter ended June 30, 2018, and references to the “first quarter” refer to the quarter ended March 31, 2018, unless otherwise specified.
We hope you find this Review helpful to your understanding of our business. We thank you for your input and suggestions, which have resulted in our changing the form and content of The Redwood Review over time.
|
| | | | | | | | | | | | | |
| | Selected Financial Highlights |
| |
| | Quarter:Year | | GAAP Income per Share | | REIT Taxable Income per Share (1) | | Annualized GAAP Return on Equity | | GAAP Book Value per Share | | Dividends
per Share | | Economic Return on Book Value (2) |
| | Q218 | | $0.38 | | $0.35 | | 11% | | $16.23 | | $0.30 | | 2.5% |
| | Q118 | | $0.50 | | $0.44 | | 15% | | $16.12 | | $0.28 | | 3.6% |
| | Q417 | | $0.35 | | $0.42 | | 10% | | $15.83 | | $0.28 | | 2.8% |
| | Q317 | | $0.41 | | $0.26 | | 12% | | $15.67 | | $0.28 | | 4.3% |
| | Q217 | | $0.43 | | $0.25 | | 12% | | $15.29 | | $0.28 | | 2.9% |
| | Q117 | | $0.43 | | $0.22 | | 13% | | $15.13 | | $0.28 | | 3.0% |
| | Q416 | | $0.31 | | $0.34 | | 9% | | $14.96 | | $0.28 | | 3.4% |
| | Q316 | | $0.58 | | $0.34 | | 19% | | $14.74 | | $0.28 | | 5.8% |
| | Q216 | | $0.48 | | $0.36 | | 15% | | $14.20 | | $0.28 | | 2.2% |
| | | | | | | | | | | | | | |
| |
| (1) | REIT taxable income per share for 2017 and 2018 are estimates until we file our tax returns. |
| |
| (2) | Economic return on book value is based on the periodic change in GAAP book value per common share plus dividends declared per common share during the period. |
|
|
| |
| THE REDWOOD REVIEW I 2ND QUARTER 2018 |
| 3 |
|
|
| |
| S H A R E H O L D E R L E T T E R |
Dear Fellow Shareholders:
This year has marked the start of the next new era for Redwood Trust, an era we plan to signify through our commitment to profitable growth. As always, there will be plenty of ink dedicated to our metrics when we publish the second quarter Redwood Review. However, with our recent leadership transition now complete, we thought we would focus in this letter on our vision for the future, and offer insight into how we’ll lead Redwood during this next chapter.
To understand where we should be going, we first had to reassess who we are and where we have been. With 24 years of organizational history, we had much to consider. This assessment was a major aspect of our strategic planning sessions last December. Together with our Board, we reaffirmed our highest competencies and competitive strengths, and ultimately defined how we can maximize the value we deliver to our business partners while building shareholder wealth.
So, who are we? Above all else, we are a specialty finance company that plays a central role in the inner workings of housing finance. This is a rare combination at the heart of our franchise value and corporate vision. It gives us a unique strategic relevance to the market and it has the capacity to propel our growth initiatives and facilitate our continued role as a premier housing credit investor.
Through our mortgage loan acquisition and structuring platform, our business helps facilitate the ultimate financing of homeowners through the capital markets. We work as a direct partner to mortgage lenders throughout the country, rather than just as an end-investor. Through our conduit operations, our platform has both the ability to generate repeatable, fee-based revenues and create long-term, differentiated investments. Our brand value is heavily derived through the mortgage products and services we provide to the market, so we don’t skimp on infrastructure to compete on cost. Our platform does, however, have the capacity to create significant operating scale as we grow. The quality of our people and processes remain the most critical factor to our success. Our people drive the business partnerships and risk-minded approach that have made us one of the industry’s longest standing firms.
Although we are organized as a real estate investment trust (REIT) for federal income tax purposes and comply with the relevant rules, that structure does not define us. Redwood’s likeness to other mortgage REITs has decreased across a number of key areas such as our leverage profile, revenue mix, and risk metrics (including exposure to interest rates). Our formula for profitability is straightforward: sound credit decisions; crisp execution; and rational, risk-based pricing. Our earnings are not driven by the shape of the yield curve. How we further differentiate our operating platform and revenue streams is a topic we’ll continue to evaluate as our vision takes shape.
|
|
| |
| THE REDWOOD REVIEW I 2ND QUARTER 2018 |
| 4 |
|
|
| |
| S H A R E H O L D E R L E T T E R |
We have an exceptional track record in housing credit – both residential and multifamily. We are an expert at product structuring and customization. Our securitization franchise is one of the most well-established in the industry. We have a strong balance-sheet and access to various sources of capital (as evidenced by our recent convertible bond and common equity raises), often at a significantly lower cost than what’s available to originators who supply us with loans. We excel at speed and reliable execution, in marked contrast to less nimble and much larger banks and other providers who compete primarily on price.
Our business strategy going forward is squarely focused on areas in which these strengths are expected to lead to long-term, sustainable earnings growth for Redwood. Specifically, we plan to focus our operations on areas that achieve the following:
| |
| • | Our capital is value-added to the marketplace |
| |
| • | There is a long runway of durable revenues available to us |
| |
| • | Our core strengths are a competitive advantage |
| |
| • | We can scale profitably and realize significant operating efficiencies |
| |
| • | We feel the risks associated with investing can be prudently managed |
Our strategic plan is responsive to trends we view as secular rather than transitory. These trends reflect constraints on the supply of homes and attendant changes in demand in household formation (i.e., renting versus owning). Our future success will depend on our ability to accurately predict where capital will flow in response to these changes, along with the understanding that borrowers ultimately migrate to superior service. This all requires nimble and thorough risk oversight, a demonstrated competency of our firm.
Fortunately, our efforts toward building a differentiated and sustainable path for our business are well underway. Redwood Choice – our expanded-prime channel – now represents almost one-third of our mortgage banking volumes. Our total volumes, meanwhile, remain on track to increase meaningfully from last year amidst declining industry originations. Our investment portfolio continues to deepen its purchasing power by diversifying into other housing investments, such as Freddie Mac-sponsored multifamily bonds. Most recently, our new partnership with 5 Arches gives us access to an attractive pipeline of single-family rental and other “business-purpose” mortgage loans and a growing stream of asset management revenues.
|
|
| |
| THE REDWOOD REVIEW I 2ND QUARTER 2018 |
| 5 |
|
|
| |
| S H A R E H O L D E R L E T T E R |
Effective implementation of our vision requires quantitative benchmarks, and we have laid out several key targets. Our goal is for annual mortgage banking volumes and total shareholder capital deployed five years from now to be at least two to three times what they are today. We aim to diversify our sources of revenue to achieve a more balanced mix of fee-based activities and income from portfolio investing. A prudent growth trajectory to these benchmarks should drive our expense ratios meaningfully lower. As an internally-managed company, our investors benefit directly from these efficiencies. If we are successful, we believe our valuation will reflect the quality and repeatability of these earnings, not simply the latest move in our net worth. And our EPS, after the realization of significant untapped operating leverage, should grow significantly with the potential to command a multiple commensurate with the highest-quality firms in the financial services industry.
We have a long history of success at Redwood and, as we begin a new chapter, we are committed to achieving much more. We have a clear plan in place to expand our strategic footprint while staying true to our core principles. Through a well-reasoned commitment to profitable growth, we plan to continue optimizing our role in the housing finance market. We believe the fruits of our labor will be powerful and measurable: diversified and predictable earnings that, complemented by scale, will drive attractive shareholder returns.
We appreciate your support and confidence in us.
Sincerely,
|
| | |
| | |
| Christopher J. Abate | | Dashiell I. Robinson |
| Chief Executive Officer | | President |
|
|
| |
| THE REDWOOD REVIEW I 2ND QUARTER 2018 |
| 6 |
|
|
| |
| Q U A R T E R L Y O V E R V I E W |
Second Quarter Highlights
| |
| Ñ | Our GAAP earnings were $0.38 per share for the second quarter of 2018, as compared with $0.50 per share for the first quarter of 2018. This change was driven primarily by mortgage banking margins that were within our long-term expected range, but lower relative to the first quarter, as well as fewer realized gains on available-for-sale securities relative to the first quarter. |
| |
| Ñ | Our non-GAAP core earnings(1) were $0.41 per share for the second quarter of 2018, as compared with $0.60 per share for the first quarter of 2018. Core earnings exceeded GAAP earnings in the second quarter primarily due to gains realized from sales of trading securities during the quarter. |
| |
| Ñ | Our GAAP book value was $16.23 per share at June 30, 2018, an increase of $0.11 per share from the first quarter, and represented an economic return(2) of 2.5% for the quarter. This increase was driven primarily by our quarterly earnings exceeding our dividend and an increase in the value of our long-term debt hedge. |
| |
| Ñ | We deployed $186 million of capital in the second quarter of 2018 toward new investments, including $66 million in Sequoia and third-party RMBS, $65 million in Agency residential CRT securities, and $6 million in Agency multifamily securities. Additionally, we deployed $50 million into new initiatives, including $40 million in customized financing for our jumbo loan sellers and $10 million to acquire a minority interest in business-purpose mortgage lender 5 Arches, LLC. |
| |
| Ñ | We sold $108 million of securities during the second quarter of 2018, capturing $12 million of previously unrealized gains ($5 million of realized gains from AFS securities and $7 million of non-GAAP core fair value gains from trading securities) and generating $91 million of capital for reinvestment after the repayment of associated debt. |
| |
| Ñ | We purchased $2.0 billion of residential jumbo loans during the second quarter of 2018. At June 30, 2018, our pipeline of jumbo residential loans identified for purchase was $1.3 billion. |
| |
| Ñ | Residential loan sales totaled $1.9 billion during the second quarter of 2018 and included $1.7 billion of loans that were securitized and $0.3 billion of whole loan sales to third parties. |
| |
| Ñ | We issued $200 million of six-year, 5.625% convertible debt during the second quarter of 2018. |
| |
| Ñ | Our recourse debt to equity leverage ratio was 3.4x at the end of the second quarter of 2018. |
| |
| Ñ | In late July, we raised $117 million of equity capital in our first follow-on offering since 2009. |
_____________________
(1) For details on GAAP and non-GAAP core earnings, see the GAAP Net Income and Reconciliation to Non-GAAP Core Earnings section that follows on page 8.
(2) Economic return on book value is based on the periodic change in GAAP book value per common share plus dividends declared per common share during the period.
|
|
| |
| THE REDWOOD REVIEW I 2ND QUARTER 2018 |
| 7 |
|
|
| |
| Q U A R T E R L Y O V E R V I E W |
GAAP Net Income and Reconciliation to Non-GAAP Core Earnings
Below we present GAAP net income and a reconciliation to non-GAAP core earnings for the second and first quarters of 2018. Further information about Redwood's core earnings measure and core earnings adjustments are included in the Core Earnings Definition section of the Appendix.
|
| | | | | | | | |
| |
| GAAP Net Income and Reconciliation to Non-GAAP Core Earnings |
| ($ in millions, except per share data) |
| | Three Months Ended | |
| | 6/30/2018 | | 3/31/2018 | |
| | | | | |
| Interest income | $ | 83 |
| | $ | 77 |
| |
| Interest expense | (48 | ) | | (42 | ) | |
| Net interest income | 35 |
| | 35 |
| |
| | | | | |
| Non-interest income | | | | |
| Mortgage banking activities, net | 11 |
| | 27 |
| |
| Investment fair value changes, net | 1 |
| | 2 |
| |
| Other income, net | 3 |
| | 2 |
| |
| Realized gains, net | 5 |
| | 9 |
| |
| Total non-interest income, net | 20 |
| | 40 |
| |
| | | | | |
| Operating expenses | (19 | ) | | (23 | ) | |
| Provision for income taxes | (3 | ) | | (5 | ) | |
| | | | | |
| GAAP net income | $ | 33 |
| | $ | 47 |
| |
| | | | | |
| Core earnings adjustments | | | | |
| Eliminate mark-to-market changes on long-term investments and associated derivatives | (3 | ) | | (7 | ) | |
| Include cumulative gain (loss) on long-term investments sold, net | 7 |
| | 18 |
| |
| Income tax adjustments associated with core earnings adjustments | — |
| | — |
| |
| Non-GAAP core earnings | $ | 36 |
| | $ | 58 |
| |
| | | | | |
| GAAP net income per diluted common share | $ | 0.38 |
| | $ | 0.50 |
| |
Non-GAAP core earnings per diluted common share (1) | $ | 0.41 |
| | $ | 0.60 |
| |
| |
| (1) | Consistent with the calculation of net income per diluted common share for GAAP purposes, non-GAAP core earnings per diluted common share is calculated following the "two-class" method. Additional information on the calculation of core earnings using the "two-class" method can be found in Table 2 in the Financial Tables section of this Redwood Review. |
|
|
| |
| THE REDWOOD REVIEW I 2ND QUARTER 2018 |
| 8 |
|
|
| |
| Q U A R T E R L Y O V E R V I E W |
Analysis of Earnings
| |
| Ñ | Net interest income was $35 million for the second quarter of 2018, consistent with the first quarter of 2018. The benefit from higher average returns resulting from portfolio optimization was offset by higher interest expense on our floating rate debt during the second quarter. We note that the benefit from interest rate hedges associated with our portfolio investments is reported in our Investment fair value changes line item and is discussed further below and in the Segment Results section that follows. |
| |
| Ñ | Mortgage banking activities, net, decreased to $11 million for the second quarter of 2018, from $27 million for the first quarter of 2018, driven primarily by gross margins that were within our long-term expected range, but lower relative to the first quarter. |
| |
| Ñ | Investment fair value changes, net, on a GAAP basis were $1 million for the second quarter of 2018, as hedge costs and the effect of principal paydowns on our investments were more than offset by the net benefit from spread tightening on our securities portfolio. On a non-GAAP core earnings basis, after eliminating certain mark-to-market changes on long-term investments (and associated derivatives), investment fair value changes, net, were negative $2 million for the second quarter of 2018, as compared with negative $6 million for the first quarter of 2018. The decline in this value is a result of the benefit from lower hedge interest expense in the second quarter of 2018, which partially offsets the increase in interest expense included in net interest income above. |
| |
| Ñ | On a GAAP basis, we realized gains of $5 million during the second quarter of 2018, which were primarily related to the sale of $41 million of available-for-sale securities, as compared with realized gains of $9 million during the first quarter of 2018. On a non-GAAP core earnings basis, realized gains also include the cumulative net gains or losses on trading securities sold, and decreased to $12 million for the second quarter from the sale of $108 million of securities, as compared with $28 million for the first quarter. |
| |
| Ñ | Operating expenses were $19 million for the second quarter of 2018, as compared with $23 million for the first quarter of 2018. The decline in operating expenses was primarily the result of lower variable compensation expense in the second quarter commensurate with lower GAAP earnings during the quarter. |
| |
| Ñ | We recorded a tax provision of $3 million during the second quarter of 2018, as compared with a tax provision of $5 million for the first quarter of 2018. This decrease was primarily due to lower mortgage banking income relative to the first quarter. A reconciliation of GAAP and taxable income is set forth in Table 5 in the Financial Tables section of this Redwood Review. |
| |
| Ñ | Additional details on our earnings are included in the Segment Results section that follows. |
|
|
| |
| THE REDWOOD REVIEW I 2ND QUARTER 2018 |
| 9 |
|
|
| |
| Q U A R T E R L Y O V E R V I E W |
Segment Results
We report on our business using two distinct segments: Investment Portfolio and Residential Mortgage Banking. The following table presents the results from each of these segments reconciled to our GAAP net income for the second and first quarters of 2018.
|
| | | | | | | | |
| |
Segment Results Summary (1) |
| ($ in millions) |
| | Three Months Ended | |
| | 6/30/2018 | | 3/31/2018 | |
| | | | | |
| Investment portfolio | | | | |
| Net interest income | $ | 38 |
| | $ | 39 |
| |
| Investment fair value changes, net | 2 |
| | 2 |
| |
| Other income, net | 3 |
| | 2 |
| |
| Realized gains, net | 5 |
| | 9 |
| |
| Operating expenses | (2 | ) | | (2 | ) | |
| Provision for income taxes | (1 | ) | | (1 | ) | |
| Segment contribution | $ | 44 |
| | $ | 49 |
| |
| | | | | |
| Residential mortgage banking | | | | |
| Net interest income | $ | 5 |
| | $ | 7 |
| |
| Mortgage banking activities, net | 11 |
| | 27 |
| |
| Operating expenses | (6 | ) | | (9 | ) | |
| Provision for income taxes | (1 | ) | | (4 | ) | |
| Segment contribution | $ | 9 |
| | $ | 21 |
| |
| |
|
| | | |
| Corporate/Other | (21 | ) | | (23 | ) | |
| | | | | |
| Net income | $ | 33 |
| | $ | 47 |
| |
| |
| (1) | See Table 3 in the Financial Tables section of this Redwood Review for a more comprehensive presentation of our segment results. |
Investment Portfolio
| |
| Ñ | Both segment contribution and non-GAAP core segment contribution (presented in the following table) from our investment portfolio declined during the second quarter, as we realized fewer gains from the sale of AFS securities, which reduced segment contribution, and also realized fewer gains from the sale of trading securities, reducing non-GAAP core segment contribution. |
| |
| Ñ | Credit fundamentals in our investment portfolio remain strong, benefiting from continued housing price growth and improvements in the general economy. |
|
|
| |
| THE REDWOOD REVIEW I 2ND QUARTER 2018 |
| 10 |
|
|
| |
| Q U A R T E R L Y O V E R V I E W |
The following table presents segment contribution of our investment portfolio by asset type for the second and first quarters of 2018.
|
| | | | | | | | | | | | | | | | | | | | | | | | | |
| |
| Segment Contribution of Investment Portfolio by Type |
| ($ in millions) |
| | Three Months Ended | |
| | 6/30/2018 | | | 3/31/2018 | |
| | Loans | | Securities (2) | | Total | | | Loans | | Securities (2) | | Total | |
| | | | | | | | | | | | | | |
| Total net interest income | $ | 14 |
| | $ | 24 |
| | $ | 38 |
| | | $ | 16 |
| | $ | 23 |
| | $ | 39 |
| |
| | | | | | | | | | | | | | |
| Non-interest income | | | | | | | | | | | | | |
| Investment fair value changes, net | | | | | | | | | | | | | |
| Change in basis and hedge expense | 1 |
| | (3 | ) | | (2 | ) | | | (3 | ) | | (3 | ) | | (6 | ) | |
| Other valuation changes | (2 | ) | | 6 |
| | 4 |
| | | — |
| | 7 |
| | 7 |
| |
| Other income, net | — |
| | 3 |
| | 3 |
| | | — |
| | 2 |
| | 2 |
| |
| Realized gains, net | — |
| | 5 |
| | 5 |
| | | — |
| | 9 |
| | 9 |
| |
| Total non-interest income, net | (1 | ) | | 11 |
| | 10 |
| | | (2 | ) | | 15 |
| | 13 |
| |
| | | | | | | | | | | | | | |
| Direct operating expenses | (1 | ) | | (1 | ) | | (2 | ) | | | — |
| | (2 | ) | | (2 | ) | |
| Provision for income taxes | — |
| | (1 | ) | | (1 | ) | | | — |
| | (1 | ) | | (1 | ) | |
| | | | | | | | | | | | | | |
| Segment contribution | $ | 12 |
| | $ | 32 |
| | $ | 44 |
| | | $ | 13 |
| | $ | 36 |
| | $ | 49 |
| |
| | | | | | | | | | | | | | |
Core Earnings adjustments (1) | | | | | | | | | | | | | |
| Eliminate mark-to-market changes on long-term investments and associated derivatives | 2 |
| | (6 | ) | | (4 | ) | | | — |
| | (7 | ) | | (7 | ) | |
| Include cumulative gain (loss) on long-term investments sold, net | — |
| | 7 |
| | 7 |
| | | — |
| | 18 |
| | 18 |
| |
| Income taxes associated with core earnings adjustments | — |
| | — |
| | — |
| | | — |
| | — |
| | — |
| |
| Total core earnings adjustments | 2 |
| | 1 |
| | 3 |
| | | — |
| | 11 |
| | 11 |
| |
| | | | | | | | | | | | | | |
Non-GAAP core segment contribution (1) | $ | 14 |
| | $ | 33 |
| | $ | 47 |
| | | $ | 13 |
| | $ | 47 |
| | $ | 60 |
| |
| |
| (1) | Consistent with management's definition of core earnings set forth on page 34, non-GAAP core segment contribution reflects GAAP segment contribution adjusted to reflect the portion of core earnings adjustments allocable to this segment. |
| |
| (2) | Includes results from securities retained from our Sequoia Choice securitizations, which we consolidated for GAAP purposes, as well as other investments. |
| |
| Ñ | While net interest income from residential loans declined in the second quarter of 2018 due to rising benchmark interest rates, the net interest expense from the hedges associated with these loans also decreased, effectively offsetting this decline. |
|
|
| |
| THE REDWOOD REVIEW I 2ND QUARTER 2018 |
| 11 |
|
|
| |
| Q U A R T E R L Y O V E R V I E W |
Residential Mortgage Banking
| |
| Ñ | Segment contribution from residential mortgage banking declined during the second quarter of 2018 as a result of gross margins that were lower relative to the first quarter of 2018 but within our long-term expected range of 75 to 100 basis points. We define gross margins for this segment as net interest income plus mortgage banking activities, net, divided by loan purchase commitments (LPCs). |
| |
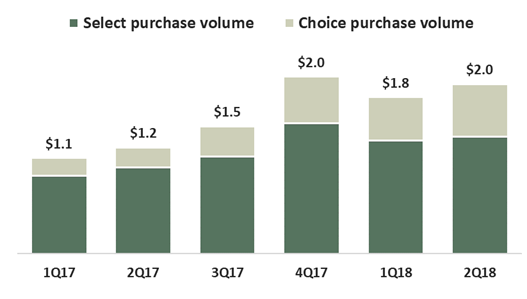
| Ñ | LPCs, adjusted for fallout expectations, were $2.0 billion for the second quarter of 2018, as compared with $1.7 billion for the first quarter of 2018. Choice loans comprised 33% of total LPCs in the second quarter, and increased 35% from the prior quarter and 119% from the same quarter last year. |
| |
| Ñ | Loan purchase volumes in the second quarter of 2018, as presented below, increased 8% from the prior quarter and 60% from the same quarter last year. |
| |
| Ñ | During the second quarter of 2018, we completed three traditional Select securitizations and one Choice securitization (our fourth since inception of our Choice program). Loan sales in the second quarter of 2018 decreased to $1.9 billion from $2.0 billion in the first quarter (inclusive of securitized loans). |
| |
| Ñ | At June 30, 2018, we had 470 loan sellers, which included 181 jumbo sellers and 289 MPF Direct sellers from various FHLB districts. Currently, 85% of our jumbo sellers have rolled out the Choice program and 95% of these sellers have begun locking Choice loans. |
|
|
| |
| THE REDWOOD REVIEW I 2ND QUARTER 2018 |
| 12 |
|
|
| |
| Q U A R T E R L Y O V E R V I E W |
GAAP Book Value
The following table sets forth the changes in Redwood’s GAAP book value per share for the second and first quarters of 2018.
|
| | | | | | | | |
| |
| Changes in GAAP Book Value per Share |
| ($ in per share) |
| | Three Months Ended | |
| | 6/30/2018 | | 3/31/2018 | |
| | | | | |
| Beginning book value per share | $ | 16.12 |
| | $ | 15.83 |
| |
| Earnings | 0.38 |
| | 0.50 |
| |
| Changes in unrealized gains on securities, net, from: | | | | |
| Realized gains recognized in earnings | (0.05 | ) | | (0.09 | ) | |
| Amortization income recognized in earnings | (0.04 | ) | | (0.04 | ) | |
| Mark-to-market adjustments, net | 0.01 |
| | — |
| |
| Total change in unrealized gains on securities, net | (0.08 | ) | | (0.13 | ) | |
| Dividends | (0.30 | ) | | (0.28 | ) | |
| Share repurchases | — |
| | 0.01 |
| |
| Equity compensation, net | 0.03 |
| | 0.03 |
| |
| Changes in unrealized losses on derivatives hedging long-term debt | 0.05 |
| | 0.11 |
| |
| Other, net | 0.03 |
| | 0.05 |
| |
| | | | | |
| Ending book value per share | $ | 16.23 |
| | $ | 16.12 |
| |
| |
Ñ | Our GAAP book value per share increased $0.11 per share to $16.23 per share during the second quarter of 2018. This increase was driven primarily by earnings exceeding the dividend and an increase in value of derivatives hedging our long-term debt. |
| |
Ñ | Unrealized gains on our available-for-sale securities decreased $0.08 per share during the second quarter of 2018. This decrease primarily resulted from $0.05 per share of previously unrealized net gains that were realized as income from the sale of securities, as well as $0.04 per share of discount accretion income recognized in earnings from the appreciation in the amortized cost basis of our available-for-sale securities. |
| |
| Ñ | Higher benchmark interest rates during the second quarter of 2018 resulted in a $0.05 per share increase to book value due to a decrease in unrealized losses on the derivatives hedging a portion of our long-term debt. At June 30, 2018, the cumulative unrealized loss on these derivatives, which is included in our GAAP book value per share, was $0.41 per share. |
|
|
| |
| THE REDWOOD REVIEW I 2ND QUARTER 2018 |
| 13 |
|
|
| |
| Q U A R T E R L Y O V E R V I E W |
Capital Allocations
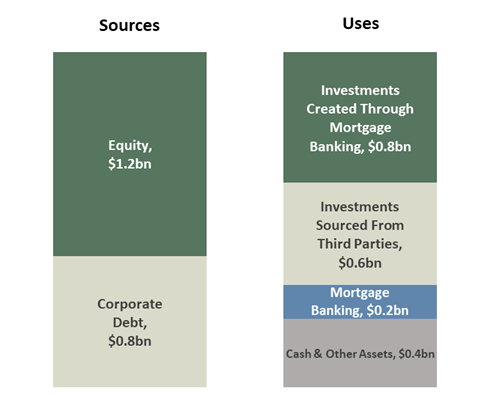
We use a combination of equity and corporate debt (which we collectively refer to as “capital”) to fund our business.
Capital Allocation: By Source and By Business Use
(as of June 30, 2018)
| |
| Ñ | Our total capital of $2.0 billion at June 30, 2018 included $1.2 billion of equity capital and $0.8 billion of the total $2.8 billion of long-term debt on our consolidated balance sheet. This portion of debt includes $201 million of exchangeable debt due in 2019, $245 million of convertible debt due in 2023, $200 million of convertible debt due in 2024, and $140 million of trust-preferred securities due in 2037. This portion of debt has a weighted average cost of approximately 6.1%. |
| |
| Ñ | We also utilize various forms of short-term and long-term collateralized debt to finance certain investments and to warehouse our inventory of certain residential loans held-for-sale. We do not consider this collateralized debt as "capital" and, therefore, exclude it from our capital allocation analysis. |
| |
| Ñ | The Balance Sheet Analysis portion of the Financial Insights section that follows describes our long-term and short-term borrowings in further detail. |
|
|
| |
| THE REDWOOD REVIEW I 2ND QUARTER 2018 |
| 14 |
|
|
| |
| Q U A R T E R L Y O V E R V I E W |
|
| | | | | | | | | | | | | | |
| |
| Capital Allocation Detail |
| By Investment Type |
| June 30, 2018 |
| ($ in millions) |
| | GAAP Fair Value | | Collateralized Debt | | Allocated Capital | | % of Total Capital | |
| | | | | | | | | |
Residential loans (1) | $ | 2,356 |
| | $ | (2,000 | ) | | $ | 356 |
| | 18% | |
| | | | | | | | | |
| Securities portfolio | | | | | | | | |
| Third party residential securities | 763 |
| | (242 | ) | | 521 |
| | 26% | |
Sequoia residential securities (2) | 426 |
| | (153 | ) | | 274 |
| | 14% | |
| Multifamily securities | 399 |
| | (313 | ) | | 86 |
| | 4% | |
| Total securities portfolio | 1,588 |
| | (707 | ) | | 881 |
| | 44% | |
| | | | | | | | | |
| Other investments | 146 |
| | — |
| | 146 |
| | 7% | |
| Other assets/(liabilities) | 154 |
| | (56 | ) | | 98 |
| | 5% | |
| Cash and liquidity capital | | | | | 308 |
| | N/A | |
| | | | | | | | | |
| Total Investments | $ | 4,244 |
| | $ | (2,763 | ) | | $ | 1,789 |
| | 90% | |
| | | | | | | | | |
| Residential mortgage banking | | | | | $ | 210 |
| | 10% | |
| | | | | | | | | |
| Total | | | | | $ | 1,999 |
| | 100% | |
| |
| (1) | Includes $43 million of FHLB stock. |
| |
| (2) | In addition to our $1.5 billion of securities on our GAAP balance sheet, securities presented above also include $134 million of securities retained from our Sequoia Choice securitizations. For GAAP purposes, we consolidate these Sequoia Choice securitizations. |
| |
| Ñ | During the second quarter of 2018, we continued to optimize our portfolio by selling lower-yielding securities and redeploying proceeds into higher-yielding alternatives, including into new initiatives. (See Table 7 in the Financial Tables section for additional detail on asset activity and balances.) |
| |
| Ñ | As of June 30, 2018, our cash and liquidity capital included $200 million of available capital. |
| |
| Ñ | Additionally, in July of 2018, we issued $117 million of common equity, which will provide additional available capital for us going forward. |
|
|
| |
| THE REDWOOD REVIEW I 2ND QUARTER 2018 |
| 15 |
|
|
| |
| Q U A R T E R L Y O V E R V I E W |
2018 Financial Outlook(1)
Our 2018 results are on track to exceed our expected dividend payments of $1.18 per share. Below we provide an update on the key targeted 2018 operating metrics we provided in our fourth quarter 2017 Redwood Review:
Mortgage Banking
Our mortgage banking business had solid performance in the first half of 2018. Gross margins were above our long-term expected range of 75 to 100 basis points and annualized returns on allocated capital(2) were also above our target range of 10 to 20%. For the full year of 2018 we continue to expect margins and returns on allocated capital to be within our expected ranges. Our year-to-date purchase volume of $3.75 billion (including $1.2 billion of Redwood Choice loans) puts us on track to meet our full-year expectations of purchasing $7 to $8 billion of jumbo loans and doubling our Choice purchase volume from 2017.
Investment Portfolio
Our investment portfolio performed well in the first half of 2018, generating annualized returns on allocated capital(3) in line with our expectations of 9% to 11%. For the full year of 2018, we continue to expect portfolio returns to be in line with our 2018 return expectations. This assumes additional realized gains from portfolio optimization and a benefit from higher yields as we redeploy capital into new opportunities.
Corporate
Total operating expenses were $42 million in the first half of 2018, and included $14 million of mortgage banking expenses and $4 million of portfolio expenses (each of which are included in the segment returns provided above), as well as $24 million of corporate expenses. We currently expect full-year corporate operating expenses of between $40 and $45 million, with variable compensation commensurate with company performance. We issued $200 million of convertible debt in June 2018 and $117 million of common equity in July 2018. Depending on the rate of deployment into new initiatives and other long-term investments, this capital may be modestly dilutive to our earnings in the second half of 2018.
_____________________
| |
| (1) | As with all forward-looking statements, our forward-looking statements relating to our 2018 financial outlook are subject to risks and uncertainties, including, among other things, those described in our Annual Report on Form 10-K under the caption “Risk Factors” and other risks, uncertainties, and factors that could cause actual results to differ materially from those described above and under the heading "Forward-Looking Statements" in the Appendix to this Redwood Review, including those described in the “Cautionary Statement” at the beginning of this Redwood Review. Although we may update our 2018 financial outlook subsequently in 2018, as a general matter we undertake no obligation to update or revise forward-looking statements, whether as a result of new information, future events, or otherwise. |
| |
| (2) | Includes net interest income, mortgage banking activities, direct operating expenses, and taxes. Excludes corporate operating expenses. Returns are calculated based on average capital allocated during the period. |
| |
| (3) | Includes net interest income, changes in fair value of the investments and their associated hedges that flow through GAAP earnings, realized gains, direct operating expenses, taxes, and other income. Excludes unrealized gains and losses on our AFS securities portfolio, and corporate operating expenses. Returns are calculated based on average capital allocated during the period. |
|
|
| |
| THE REDWOOD REVIEW I 2ND QUARTER 2018 |
| 16 |
|
|
| |
| F I N A N C I A L I N S I G H T S |
Balance Sheet Analysis
The following table presents our consolidated balance sheets at June 30, 2018 and March 31, 2018.
|
| | | | | | | | |
| |
Consolidated Balance Sheets (1) |
| ($ in millions) |
| | 6/30/2018 | | 3/31/2018 | |
| | | | | |
| Residential loans | $ | 5,491 |
| | $ | 5,146 |
| |
| Real estate securities | 1,454 |
| | 1,358 |
| |
| Cash and cash equivalents | 185 |
| | 179 |
| |
| Other assets | 383 |
| | 318 |
| |
| | | | | |
| Total assets | $ | 7,513 |
| | $ | 7,000 |
| |
| | | | | |
| Short-term debt | | | | |
| Mortgage loan warehouse debt | $ | 719 |
| | $ | 662 |
| |
| Security repurchase facilities | 707 |
| | 592 |
| |
Convertible notes, net (2) | — |
| | 250 |
| |
| Other liabilities | 157 |
| | 158 |
| |
| Asset-backed securities issued | 1,930 |
| | 1,542 |
| |
| Long-term debt, net | 2,770 |
| | 2,576 |
| |
| Total liabilities | 6,284 |
| | 5,780 |
| |
| | | | | |
| Stockholders’ equity | 1,229 |
| | 1,220 |
| |
| | | | | |
| Total liabilities and equity | $ | 7,513 |
| | $ | 7,000 |
| |
| |
| (1) | Our consolidated balance sheets include assets of consolidated variable interest entities (“VIEs”) that can only be used to settle obligations of these VIEs and liabilities of consolidated VIEs for which creditors do not have recourse to the primary beneficiary (Redwood Trust, Inc.). At June 30, 2018 and March 31, 2018, assets of consolidated VIEs totaled $2.1 billion and $1.6 billion, respectively, and liabilities of consolidated VIEs totaled $1.9 billion and $1.5 billion, respectively. See Table 8 in the Financial Tables section of this Redwood Review for additional detail on consolidated VIEs. |
| |
| (2) | Certain of our convertible notes were classified as Short-term debt as the maturity of the notes was less than one year as of March 31, 2018. |
|
|
| |
| THE REDWOOD REVIEW I 2ND QUARTER 2018 |
| 17 |
|
|
| |
| F I N A N C I A L I N S I G H T S |
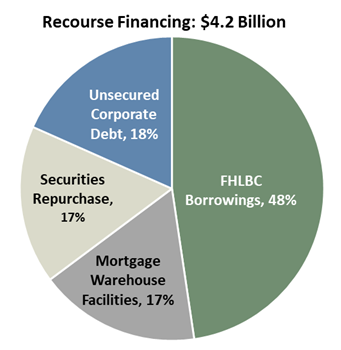
Recourse Financing
We finance our business with a diversified mix of long-term and short-term recourse debt. The following charts present the composition of our recourse debt and its characteristics at the end of the second quarter:
|
| | | |
| |
| Borrowing Type | Average Cost of Funds | Average Remaining Term (yrs.) |
| | | |
| FHLBC Borrowings | 2.0% | 7 |
| Unsecured Corporate Debt | 6.1% | 7 |
| Mortgage Warehouse | 3.6% | <1 |
| Securities Repurchase | 3.2% | <1 |
| | | |
| Weighted Average Cost of Funds | 3.2% | |
| | | |
| |
| Ñ | Our long-term unsecured corporate debt is comprised of $200 million of 5.625% convertible notes due in 2024, $245 million of 4.75% convertible notes due in 2023, $201 million of 5.625% exchangeable notes due in 2019, and $140 million of trust-preferred securities due in 2037 (that we hedge to yield approximately 6.8%). |
| |
| Ñ | Our FHLBC borrowings and securities repurchase debt are used to finance our whole loan and securities investments, respectively, and we utilize mortgage warehouse facilities to finance our mortgage banking activities. These are discussed in further detail in the following sections. |
| |
| Ñ | Our recourse debt to equity leverage ratio was 3.4x at the end of the second quarter of 2018. |
| |
| Ñ | In addition to our recourse financing, we have ABS debt issued by securitization entities that we consolidate that is non-recourse to us. |
|
|
| |
| THE REDWOOD REVIEW I 2ND QUARTER 2018 |
| 18 |
|
|
| |
| F I N A N C I A L I N S I G H T S |
Residential Loan Investments
At June 30, 2018, we had $2.3 billion of jumbo residential loans held for investment. The following table presents the fair value of our residential loan investments at June 30, 2018.
|
| | | | | | | |
| |
| Residential Loans by Product Type |
| June 30, 2018 |
| ($ in millions) |
| Product Type | Total | | Weighted Average Coupon | |
| | | | | |
| Fixed rate | $ | 2,081 |
| | 4.08 | % | |
| Hybrid | 232 |
| | 4.09 | % | |
| | | | | |
| Total | $ | 2,313 |
| | 4.08 | % | |
| |
| Ñ | Our held-for-investment loans are prime-quality, first lien jumbo loans, most of which were originated between 2013 and 2018. At June 30, 2018, the weighted average FICO score of borrowers backing these loans was 770 (at origination) and the weighted average loan-to-value ("LTV") ratio of these loans was 66% (at origination). At June 30, 2018, 0.04% of these loans (by unpaid principal balance) were more than 90 days delinquent. |
| |
| Ñ | We finance our residential loan investments with $2.0 billion of FHLB debt through our FHLB-member subsidiary. The interest cost for these borrowings resets every 13 weeks, and we seek to effectively fix the interest cost of this debt over its weighted average maturity by using a combination of swaps, TBAs, and other derivative instruments. |
| |
| Ñ | In connection with these borrowings, our FHLB-member subsidiary is required to hold $43 million of FHLB stock. |
|
|
| |
| THE REDWOOD REVIEW I 2ND QUARTER 2018 |
| 19 |
|
|
| |
| F I N A N C I A L I N S I G H T S |
Securities Portfolio
At June 30, 2018, we had $1.6 billion invested in real estate securities. We categorize these securities by (i) whether they were issued through our Sequoia platform, by an Agency in a CRT, or by third parties, and (ii) by priority of cash flow (senior, mezzanine, and subordinate). The following table presents the fair value of our real estate securities at June 30, 2018.
|
| | | | | | | | | | | | | | | | | | | | | | | |
| |
| Securities Portfolio - By Source and Security Type |
| June 30, 2018 |
| ($ in millions) |
| | Interest-Only Securities | | Senior (1) | | Mezzanine | | Subordinate | | Total | | % of Total Securities | |
| | | | | | | | | | | | | |
Sequoia (2) | $ | 73 |
| | $ | — |
| | $ | 189 |
| | $ | 163 |
| | $ | 426 |
| | 27 | % | |
Third Party New Issue (3) | 40 |
| | 49 |
| | 138 |
| | 129 |
| | 356 |
| | 22 | % | |
Third Party Legacy (3) | 2 |
| | 147 |
| | — |
| | 18 |
| | 167 |
| | 11 | % | |
Agency CRT (4) | — |
| | — |
| | — |
| | 240 |
| | 240 |
| | 15 | % | |
| | | | | | | | | | | | | |
| Total residential securities | $ | 115 |
| | $ | 196 |
| | $ | 327 |
| | $ | 550 |
| | $ | 1,189 |
| | 75 | % | |
| | | | | | | | | | | | | |
Multifamily securities (4) | — |
| | — |
| | 399 |
| | — |
| | 399 |
| | 25 | % | |
| Total securities portfolio | $ | 115 |
| | $ | 196 |
| | $ | 726 |
| | $ | 550 |
| | $ | 1,588 |
| | 100 | % | |
| |
| (1) | Includes $34 million of re-REMIC securities at June 30, 2018. |
| |
| (2) | Presents securities retained from our Sequoia securitizations that were issued from 2012 through 2018. These securities included $14 million of interest-only securities, $88 million of mezzanine securities, and $32 million of subordinate securities retained from our Sequoia Choice securitizations, which were consolidated for GAAP purposes. |
| |
| (3) | Presents RMBS issued by third parties after 2012 as New Issue and prior to 2008 as Legacy. |
| |
| (4) | Agency CRT and Multifamily securities were issued after 2012. |
At June 30, 2018, our securities consisted of fixed-rate assets (65%), adjustable-rate assets (28%), hybrid assets that reset within the next year (6%), and hybrid assets that reset between 12 and 36 months (1%). For the portions of our securities portfolio that are sensitive to changes in interest rates, we seek to minimize this interest rate risk by using various derivative instruments.
We finance our holdings of real estate securities with a combination of capital and collateralized debt in the form of repurchase (or “repo”) financing. At June 30, 2018, we had short-term debt incurred through repurchase facilities of $707 million, which was secured by $846 million of real estate securities. The remaining $742 million of securities were financed with capital.
|
|
| |
| THE REDWOOD REVIEW I 2ND QUARTER 2018 |
| 20 |
|
|
| |
| F I N A N C I A L I N S I G H T S |
The following table presents the fair value of our real estate securities that are financed with repurchase debt, at June 30, 2018.
|
| | | | | | | | | | | | | | | | | | | |
| |
| Real Estate Securities Financed with Repurchase Debt |
| June 30, 2018 |
| ($ in millions, except weighted average price) |
| | Real Estate Securities | | Repurchase Debt | | Allocated Capital | | Weighted Average Price (1) | | Financing Haircut (2) | |
| | | | | | | | | | | |
| Residential securities | | | | | | | | | | |
| Senior | $ | 161 |
| | $ | (142 | ) | | $ | 19 |
| | $ | 98 |
| | 12 | % | |
| Mezzanine | 293 |
| | (252 | ) | | 41 |
| | $ | 96 |
| | 14 | % | |
| Total residential securities | 454 |
| | (395 | ) | | 59 |
| | | | | |
| Multifamily securities | 392 |
| | (313 | ) | | 79 |
| | $ | 95 |
| | 20 | % | |
| | | | | | | | | | | |
| Total | $ | 846 |
| | $ | (707 | ) | | $ | 138 |
| | $ | 96 |
| | 16 | % | |
| |
| (1) | GAAP fair value per $100 of principal. |
| |
| (2) | Allocated capital divided by GAAP fair value. |
| |
| Ñ | In addition to the allocated capital listed in the table above that directly supports our repurchase facilities (i.e., “the haircut”), we continue to hold a designated amount of supplemental risk capital available for potential margin calls or future obligations relating to these facilities. |
| |
| Ñ | At June 30, 2018, we had securities repurchase facilities with seven different counterparties. |
| |
| Ñ | Additional information on the residential securities we own is set forth in Table 7 in the Financial Tables section of this Redwood Review. |
|
|
| |
| THE REDWOOD REVIEW I 2ND QUARTER 2018 |
| 21 |
|
|
| |
| F I N A N C I A L I N S I G H T S |
Residential Loans Held-for-Sale
| |
| Ñ | At June 30, 2018, we had $1.1 billion of residential mortgages held-for-sale financed with $719 million of warehouse debt. |
| |
| Ñ | Our warehouse capacity at June 30, 2018 totaled $1.8 billion across six separate counterparties. |
| |
| Ñ | The $1.1 billion of residential loans held-for-sale at June 30, 2018 included $681 million, or 62%, of Select loans, and $424 million, or 38%, of expanded-prime Choice loans. |
| |
| Ñ | At June 30, 2018, our pipeline of jumbo residential loans identified for purchase was $1.3 billion. |
| |
| Ñ | We seek to minimize the exposure we have to interest rates on our loan pipeline (for loans both on balance sheet and identified for purchase) by using a combination of TBAs, interest rate swaps, and other derivative instruments. |
|
|
| |
| THE REDWOOD REVIEW I 2ND QUARTER 2018 |
| 22 |
|
|
| |
| THE REDWOOD REVIEW I 2ND QUARTER 2018 |
| 23 |
|
| | | | | | | | | | | | | | | | | | | | | | | | | | | | | | | | | | | | | | | | | | | | | | |
| Table 1: GAAP Earnings (in thousands, except per share data) | |
| | | | | | | | | | | | | | | | | | | | | | | | | |
| | | 2018 Q2 | | 2018 Q1 | | 2017
Q4 | | 2017
Q3 | | 2017 Q2 | | 2017 Q1 | | 2016
Q4 | | 2016
Q3 | | 2016
Q2 | | | Six Months 2018 | | Six Months 2017 | |
| Interest income | $ | 79,128 |
| | $ | 72,559 |
| | $ | 67,370 |
| | $ | 58,106 |
|
| $ | 54,419 |
|
| $ | 49,367 |
| | $ | 50,612 |
| | $ | 54,781 |
|
| $ | 60,307 |
| | | $ | 151,687 |
| | $ | 103,786 |
| |
| Discount amortization on securities, net | 3,848 |
| | 4,060 |
| | 4,098 |
| | 4,631 |
| | 4,805 |
| | 5,261 |
| | 5,722 |
| | 6,125 |
| | 6,339 |
| | | 7,908 |
| | 10,066 |
| |
| Discount (premium) amortization on loans, net | — |
| | — |
| | — |
| | — |
| | — |
| | — |
| | — |
| | — |
| | 141 |
| | | — |
| | — |
| |
| Total interest income | 82,976 |
| | 76,619 |
| | 71,468 |
| | 62,737 |
| | 59,224 |
| | 54,628 |
| | 56,334 |
| | 60,906 |
| | 66,787 |
| | | 159,595 |
| | 113,852 |
| |
| Interest expense on short-term debt | (12,666 | ) | | (10,424 | ) | | (9,841 | ) | | (7,158 | ) | | (6,563 | ) | | (4,453 | ) | | (4,848 | ) | | (5,405 | ) | | (5,337 | ) | | | (23,090 | ) | | (11,016 | ) | |
Interest expense on short-term convertible notes (1) | (509 | ) | | (3,011 | ) | | (3,025 | ) | | (3,024 | ) | | (2,787 | ) | | — |
| | — |
| | — |
| | — |
| | | (3,520 | ) | | (2,787 | ) | |
| Interest expense on ABS issued from consolidated trusts | (16,349 | ) | | (11,401 | ) | | (7,917 | ) | | (3,956 | ) | | (3,705 | ) | | (3,530 | ) | | (3,278 | ) | | (3,193 | ) | | (3,982 | ) | | | (27,750 | ) | | (7,235 | ) | |
| Interest expense on long-term debt | (18,689 | ) | | (16,678 | ) | | (15,325 | ) | | (13,305 | ) | | (11,179 | ) | | (13,048 | ) | | (12,411 | ) | | (12,999 | ) | | (13,125 | ) | | | (35,367 | ) | | (24,227 | ) | |
| Total interest expense | (48,213 | ) | | (41,514 | ) | | (36,108 | ) | | (27,443 | ) | | (24,234 | ) | | (21,031 | ) | | (20,537 | ) | | (21,597 | ) |
| (22,444 | ) | | | (89,727 | ) | | (45,265 | ) | |
| Net interest income | 34,763 |
| | 35,105 |
| | 35,360 |
| | 35,294 |
| | 34,990 |
| | 33,597 |
| | 35,797 |
| | 39,309 |
|
| 44,343 |
| | | 69,868 |
|
| 68,587 |
| |
| Reversal of provision for loan losses – Commercial | — |
| | — |
| | — |
| | — |
| | — |
| | — |
| | — |
| | 859 |
| | 6,532 |
| | | — |
| | — |
| |
| Net interest income after provision | 34,763 |
| | 35,105 |
| | 35,360 |
| | 35,294 |
| | 34,990 |
| | 33,597 |
| | 35,797 |
| | 40,168 |
|
| 50,875 |
| | | 69,868 |
| | 68,587 |
| |
| Non-interest income | | | | | | | | | | | | | | | | | | | | | |
|
| |
| Mortgage banking activities, net | 10,596 |
| | 26,576 |
| | 3,058 |
| | 21,200 |
| | 12,046 |
| | 17,604 |
| | 13,979 |
| | 9,766 |
| | 7,728 |
| | | 37,172 |
| | 29,650 |
| |
| Investment fair value changes, net | 889 |
| | 1,609 |
| | 384 |
| | 324 |
| | 8,115 |
| | 1,551 |
| | (9,888 | ) | | 11,918 |
| | (11,066 | ) | | | 2,498 |
| | 9,666 |
| |
| Realized gains, net | 4,714 |
| | 9,363 |
| | 4,546 |
| | 1,734 |
| | 1,372 |
| | 5,703 |
| | 1,972 |
| | 6,615 |
| | 9,884 |
| | | 14,077 |
| | 7,075 |
| |
| Other income | 3,322 |
| | 2,118 |
| | 2,963 |
| | 2,812 |
| | 3,764 |
| | 2,897 |
| | 3,700 |
| | 5,413 |
| | 4,342 |
| | | 5,440 |
| | 6,661 |
| |
| Total non-interest income (loss), net | 19,521 |
| | 39,666 |
| | 10,951 |
| | 26,070 |
|
| 25,297 |
| | 27,755 |
| | 9,763 |
| | 33,712 |
|
| 10,888 |
| | | 59,187 |
| | 53,052 |
| |
| Fixed compensation expense | (5,775 | ) | | (6,439 | ) | | (5,555 | ) | | (5,233 | ) | | (5,321 | ) | | (6,002 | ) | | (5,310 | ) | | (5,253 | ) | | (5,875 | ) | | | (12,214 | ) | | (11,323 | ) | |
| Variable compensation expense | (1,825 | ) | | (6,907 | ) | | (5,861 | ) | | (6,467 | ) | | (4,313 | ) | | (3,933 | ) | | (4,757 | ) | | (5,802 | ) | | (4,262 | ) | | | (8,732 | ) | | (8,246 | ) | |
| Equity compensation expense | (3,835 | ) | | (2,697 | ) | | (2,507 | ) | | (2,337 | ) | | (3,121 | ) | | (2,176 | ) | | (1,976 | ) | | (2,031 | ) | | (2,754 | ) | | | (6,532 | ) | | (5,297 | ) | |
| Loan acquisition costs | (2,155 | ) | | (1,818 | ) | | (1,625 | ) | | (1,187 | ) | | (1,005 | ) | | (1,205 | ) | | (1,064 | ) | | (1,393 | ) | | (1,686 | ) | | | (3,973 | ) | | (2,210 | ) | |
| Restructuring charges | — |
| | — |
| | — |
| | — |
| | — |
| | — |
| | 144 |
| | (4 | ) | | 118 |
| | | — |
| | — |
| |
| Other operating expense | (5,419 | ) | | (5,169 | ) | | (4,819 | ) | | (4,698 | ) | | (4,881 | ) | | (4,910 | ) | | (4,861 | ) | | (5,872 | ) | | (5,696 | ) | | | (10,588 | ) | | (9,791 | ) | |
| Total operating expenses | (19,009 | ) | | (23,030 | ) | | (20,367 | ) | | (19,922 | ) |
| (18,641 | ) | | (18,226 | ) | | (17,824 | ) | | (20,355 | ) |
| (20,155 | ) | | | (42,039 | ) | | (36,867 | ) | |
| (Provision for) benefit from income taxes | (2,528 | ) | | (4,896 | ) | | 4,989 |
| | (5,262 | ) | | (5,322 | ) | | (6,157 | ) | | (2,381 | ) | | (972 | ) | | (327 | ) | | | (7,424 | ) | | (11,479 | ) | |
| Net income | $ | 32,747 |
| | $ | 46,845 |
| | $ | 30,933 |
| | $ | 36,180 |
|
| $ | 36,324 |
| | $ | 36,969 |
| | $ | 25,355 |
| | $ | 52,553 |
|
| $ | 41,281 |
| | | $ | 79,592 |
| | $ | 73,293 |
| |
Diluted average shares (2) | 100,432 |
| | 108,195 |
| | 109,621 |
| | 102,703 |
| | 97,494 |
| | 97,946 |
| | 85,838 |
| | 97,832 |
| | 97,762 |
| | | 104,291 |
| | 97,719 | |
| Diluted earnings per common share | $ | 0.38 |
| | $ | 0.50 |
| | $ | 0.35 |
| | $ | 0.41 |
| | $ | 0.43 |
| | $ | 0.43 |
| | $ | 0.31 |
| | $ | 0.58 |
| | $ | 0.48 |
| | | $ | 0.88 |
| | $ | 0.85 |
| |
| |
| (1) | Represents interest expense on $250 million of convertible notes that were reclassified from Long-term debt to Short-term debt as the maturity of the notes was less than one year as of April 2017. These convertible notes were repaid in April 2018. |
| |
| (2) | Diluted average shares includes shares from the assumed conversion of our convertible and/or exchangeable debt in certain periods, in accordance with GAAP diluted EPS provisions. See Table 2 that follows for details of this calculation for the current and prior quarter and our respective Quarterly Reports on Form 10-Q and Annual Reports on Form 10-K for prior periods. |
|
| | |
| THE REDWOOD REVIEW I 2ND QUARTER 2018 | | Table 1: GAAP Earnings 24 |
|
| | | | | | | | | |
| Table 2: GAAP and Non-GAAP Core Basic and Diluted Earnings (1) per Common Share (in thousands, except per share data) | |
| | | | | | |
| | | 2018 Q2 | | 2018 Q1 | |
| GAAP Earnings per Common Share ("EPS"): | | | | |
| Net income attributable to Redwood | $ | 32,747 |
| | $ | 46,845 |
| |
| Less: Dividends and undistributed earnings allocated to participating securities | (1,074 | ) | | (1,433 | ) | |
| Net income allocated to common shareholders for GAAP basic EPS | 31,673 |
| | 45,412 |
| |
| Incremental adjustment to dividends and undistributed earnings allocated to participating securities | (82 | ) | | 39 |
| |
Add back: Interest expense on convertible notes for the period, net of tax (2) | 6,335 |
| | 8,641 |
| |
| Net income allocated to common shareholders for GAAP diluted EPS | $ | 37,926 |
| | $ | 54,092 |
| |
| | | | | |
| Basic weighted average common shares outstanding | 75,381 |
| | 75,397 |
| |
| Net effect of dilutive equity awards | 278 |
| | 35 |
| |
Net effect of assumed convertible notes conversion to common shares (2) | 24,773 |
| | 32,763 |
| |
| Diluted weighted average common shares outstanding | 100,432 |
| | 108,195 |
| |
| | | | | |
| GAAP Basic Earnings per Common Share | $ | 0.42 |
| | $ | 0.60 |
| |
| GAAP Diluted Earnings per Common Share | $ | 0.38 |
| | $ | 0.50 |
| |
| | | | | |
| Non-GAAP Core Earnings per Common Share: | | | | |
| Non-GAAP core earnings | $ | 36,330 |
| | $ | 57,674 |
| |
| Less: Dividends and undistributed earnings allocated to participating securities | (1,191 | ) | | (1,749 | ) | |
| Non-GAAP core earnings allocated to common shareholders for core basic EPS | 35,139 |
| | 55,925 |
| |
| Incremental adjustment to dividends and undistributed earnings allocated to participating securities | (53 | ) | | 133 |
| |
Add back: Interest expense on convertible notes for the period, net of tax (2) | 6,335 |
| | 8,641 |
| |
| Non-GAAP core earnings allocated to common shareholders for core diluted EPS | $ | 41,421 |
| | $ | 64,699 |
| |
| | | | | |
| Basic weighted average common share outstanding | 75,381 |
| | 75,397 |
| |
| Net effect of dilutive equity awards | 278 |
| | 35 |
| |
Net effect of assumed convertible notes conversion to common shares (2) | 24,773 |
| | 32,763 |
| |
| Diluted weighted average common shares outstanding | 100,432 |
| | 108,195 |
| |
| | | | | |
| Non-GAAP Core Basic Earnings per Common Share | $ | 0.47 |
| | $ | 0.74 |
| |
| Non-GAAP Core Diluted Earnings per Common Share | $ | 0.41 |
| | $ | 0.60 |
| |
| | | | | |
| |
| (1) | A reconciliation of GAAP net income to non-GAAP core earnings is included in the GAAP Net Income and Reconciliation to Non-GAAP Core Earnings section that starts on page 8 and a definition of core earnings is included in the Core Earnings Definition section of the Appendix. |
| |
| (2) | Certain convertible notes were determined to be dilutive in the periods presented and were included in the calculations of diluted EPS under the "if-converted" method. Under this method, the periodic interest expense (net of applicable taxes) for dilutive notes is added back to the numerator and the number of shares that the notes are entitled to (if converted, regardless of whether they are in or out of the money) are included in the denominator. |
|
| | |
| THE REDWOOD REVIEW I 2ND QUARTER 2018 | | Table 2: GAAP and Non-GAAP Core Earnings per Basic and Diluted Common Share 25 |
|
| | | | | | | | | | | | | | | | | | | | | | | | | | | | | | | | | | | | | | | | | | | | | |
| Table 3: Segment Results ($ in thousands) | |
| | | | | | | | | | | | | | | | | | | | | | | | |
| | | 2018
Q2 | | 2018
Q1 | | 2017
Q4 | | 2017
Q3 | | 2017
Q2 | | 2017
Q1 | | 2016
Q4 | | 2016
Q3 | | 2016
Q2 | | Six
Months 2018 | | Six
Months 2017 | |
| Investment Portfolio | | | | | | | | | | | | | | | | | | | | | | |
| Net interest income | | | | | | | | | | | | | | | | | | | | | | |
| Residential loans | | | | | | | | | | | | | | | | | | | | | | |
| At Redwood | $ | 13,842 |
| | $ | 15,842 |
| | $ | 16,032 |
| | $ | 16,916 |
| | $ | 18,461 |
| | $ | 18,448 |
| | $ | 18,676 |
| | $ | 19,069 |
| | $ | 19,536 |
| | $ | 29,684 |
| | $ | 36,909 |
| |
| At consolidated Sequoia Choice entities | 2,163 |
| | 1,386 |
| | 836 |
| | 22 |
| | — |
| | — |
| | — |
| | — |
| | — |
| | 3,549 |
| | — |
| |
| Residential securities | 19,700 |
| | 19,778 |
| | 20,287 |
| | 19,342 |
| | 18,163 |
| | 17,081 |
| | 16,368 |
| | 16,441 |
| | 16,707 |
| | 39,478 |
| | 35,244 |
| |
| Multifamily and commercial investments | 1,860 |
| | 1,888 |
| | 1,749 |
| | 1,298 |
| | 1,978 |
| | 1,457 |
| | 2,853 |
| | 6,653 |
| | 11,644 |
| | 3,748 |
| | 3,435 |
| |
| Total net interest income | 37,565 |
| | 38,894 |
| | 38,904 |
| | 37,578 |
| | 38,602 |
| | 36,986 |
| | 37,897 |
| | 42,163 |
| | 47,887 |
| | 76,459 |
| | 75,588 |
| |
| Reversal of provision for loan losses | — |
| | — |
| | — |
| | — |
| | — |
| | — |
| | — |
| | 859 |
| | 6,532 |
| | — |
|
| — |
| |
| | | | | | | | | | | | | | | | | | | | | | | |
| Non-interest income | | | | | | | | | | | | | | | | | | | | | | |
| Investment fair value changes, net | 1,600 |
| | 1,590 |
| | 4,568 |
| | 1,372 |
| | 9,115 |
| | 3,359 |
| | (7,862 | ) | | 12,176 |
| | (10,779 | ) | | 3,190 |
|
| 12,474 |
| |
| Other income | 3,322 |
| | 2,118 |
| | 2,963 |
| | 2,812 |
| | 3,764 |
| | 2,897 |
| | 3,700 |
| | 5,413 |
| | 4,342 |
| | 5,440 |
|
| 6,661 |
| |
| Realized gains | 4,714 |
| | 9,363 |
| | 4,546 |
| | 1,734 |
| | 2,124 |
| | 5,703 |
| | 1,972 |
| | 6,615 |
| | 9,884 |
| | 14,077 |
|
| 7,827 |
| |
| Total non-interest income, net | 9,636 |
| | 13,071 |
| | 12,077 |
| | 5,918 |
| | 15,003 |
| | 11,959 |
| | (2,190 | ) | | 24,204 |
| | 3,447 |
| | 22,707 |
|
| 26,962 |
| |
| | | | | | | | | | | | | | | | | | | | | | | |
| Operating expenses | (1,858 | ) | | (2,007 | ) | | (1,657 | ) | | (1,324 | ) | | (1,454 | ) | | (1,593 | ) | | (2,732 | ) | | (2,751 | ) | | (2,827 | ) | | (3,865 | ) |
| (3,047 | ) | |
| Provision for income taxes | (1,130 | ) | | (888 | ) | | (838 | ) | | (433 | ) | | (2,320 | ) | | (1,737 | ) | | (761 | ) | | (732 | ) | | (327 | ) | | (2,018 | ) |
| (4,057 | ) | |
| Segment contribution | $ | 44,213 |
| | $ | 49,070 |
| | $ | 48,486 |
| | $ | 41,739 |
| | $ | 49,831 |
| | $ | 45,615 |
| | $ | 32,214 |
| | $ | 63,743 |
| | $ | 54,712 |
| | $ | 93,283 |
|
| $ | 95,446 |
| |
| | | | | | | | | | | | | | | | | | | | | | | |
| Residential Mortgage Banking | | | | | | | | | | | | | | | | | | | | | | |
| Net interest income | $ | 5,455 |
| | $ | 6,760 |
| | $ | 6,887 |
| | $ | 6,491 |
| | $ | 4,012 |
| | $ | 4,550 |
| | $ | 5,579 |
| | $ | 5,005 |
| | $ | 4,306 |
| | $ | 12,215 |
|
| $ | 8,562 |
| |
| Non-interest income | | | | | | | | | | | | | | | | | | | | | | |
| Mortgage banking activities | 10,596 |
| | 26,576 |
| | 3,058 |
| | 21,200 |
| | 12,046 |
| | 17,604 |
| | 13,979 |
| | 9,766 |
| | 7,728 |
| | 37,172 |
| | 29,650 |
| |
| | | | | | | | | | | | | | | | | | | | | | | |
| Operating expenses | (5,611 | ) | | (8,632 | ) | | (7,104 | ) | | (6,107 | ) | | (6,021 | ) | | (5,881 | ) | | (6,077 | ) | | (5,807 | ) | | (6,047 | ) | | (14,243 | ) | | (11,902 | ) | |
| (Provision for) benefit from income taxes | (1,398 | ) | | (4,008 | ) | | 5,827 |
| | (4,829 | ) | | (3,002 | ) | | (4,420 | ) | | (1,620 | ) | | (240 | ) | | — |
| | (5,406 | ) | | (7,422 | ) | |
| Segment contribution | $ | 9,042 |
| | $ | 20,696 |
| | $ | 8,668 |
| | $ | 16,755 |
| | $ | 7,035 |
| | $ | 11,853 |
| | $ | 11,861 |
| | $ | 8,724 |
| | $ | 5,987 |
| | $ | 29,738 |
| | $ | 18,888 |
| |
| | | | | | | | | | | | | | | | | | | | | | | |
| Corporate/other | (20,508 | ) | | (22,921 | ) | | (26,221 | ) | | (22,314 | ) | | (20,542 | ) | | (20,499 | ) | | (18,720 | ) | | (19,914 | ) | | (19,418 | ) | | (43,429 | ) | | (41,041 | ) | |
| GAAP net income | $ | 32,747 |
| | $ | 46,845 |
| | $ | 30,933 |
| | $ | 36,180 |
| | $ | 36,324 |
| | $ | 36,969 |
| | $ | 25,355 |
| | $ | 52,553 |
| | $ | 41,281 |
| | $ | 79,592 |
| | $ | 73,293 |
| |
| | | | | | | | | | | | | | | | | | | | | | | | |
|
| | |
| THE REDWOOD REVIEW I 2ND QUARTER 2018 | | Table 3: Segment Results 26 |
|
| | | | | | | | | | | | | | | | | | | | | | | | | | | | | | | | | | | |
| Table 4: Segment Assets and Liabilities ($ in thousands) |
| | | | | | | | | | | | | | | | | | | | |
| | | | June 30, 2018 | | | March 31, 2018 | |
| | | | Investment Portfolio | | Residential Mortgage Banking | | Corporate/ Other | | Total | | | Investment Portfolio | | Residential Mortgage Banking | | Corporate/ Other | | Total | |
| Residential loans | | | | | | | | | | | | | | | | | | |
| At Redwood | | $ | 2,313,336 |
| | $ | 1,104,660 |
| | $ | — |
| | $ | 3,417,996 |
| | | $ | 2,375,785 |
| | $ | 1,130,185 |
| | $ | — |
| | $ | 3,505,970 |
| |
| At consolidated Sequoia entities | | 1,481,145 |
| | — |
| | 592,029 |
| | 2,073,174 |
| | | 1,013,619 |
| | — |
| | 626,151 |
| | 1,639,770 |
| |
| Real estate securities | | 1,453,936 |
| | — |
| | — |
| | 1,453,936 |
| | | 1,357,720 |
| | — |
| | — |
| | 1,357,720 |
| |
| Cash and cash equivalents | | 40,654 |
| | — |
| | 144,125 |
| | 184,779 |
| | | 19,854 |
| | — |
| | 158,708 |
| | 178,562 |
| |
| Other assets | | 302,707 |
| | 19,640 |
| | 60,319 |
| | 382,666 |
| | | 245,257 |
| | 24,228 |
| | 48,066 |
| | 317,551 |
| |
| Total assets | | $ | 5,591,778 |
| | $ | 1,124,300 |
|
| $ | 796,473 |
| | $ | 7,512,551 |
| | | $ | 5,012,235 |
| | $ | 1,154,413 |
|
| $ | 832,925 |
| | $ | 6,999,573 |
| |
| | | | | | | | | | | | | | | | | | | |
| Short-term debt | | | | | | | | | | | | | | | | | | |
| Mortgage loan warehouse debt | | $ | — |
| | $ | 719,394 |
| | $ | — |
| | $ | 719,394 |
| | | $ | — |
| | $ | 661,782 |
| | $ | — |
| | $ | 661,782 |
| |
| Security repurchase facilities | | 706,894 |
| | — |
| | — |
| | 706,894 |
| | | 592,294 |
| | — |
| | — |
| | 592,294 |
| |
| Convertible notes, net | | — |
| | — |
| | — |
| | — |
| | | — |
| | — |
| | 250,384 |
| | 250,384 |
| |
| Other liabilities | | 56,450 |
| | 18,414 |
| | 82,561 |
| | 157,425 |
| | | 43,451 |
| | 19,034 |
| | 94,970 |
| | 157,455 |
| |
| ABS issued | | 1,347,427 |
| | — |
| | 582,235 |
| | 1,929,662 |
| | | 926,238 |
| | — |
| | 615,849 |
| | 1,542,087 |
| |
| Long-term debt, net | | 1,999,999 |
| | — |
| | 770,222 |
| | 2,770,221 |
| | | 1,999,999 |
| | — |
| | 575,589 |
| | 2,575,588 |
| |
| Total liabilities | | $ | 4,110,770 |
|
| $ | 737,808 |
|
| $ | 1,435,018 |
|
| $ | 6,283,596 |
| | | $ | 3,561,982 |
| | $ | 680,816 |
| | $ | 1,536,792 |
| | $ | 5,779,590 |
| |
| | | | | | | | | | | | | | | | | | | |
|
| | |
| THE REDWOOD REVIEW I 2ND QUARTER 2018 | | Table 4: Segment Assets and Liabilities 27 |
|
| | | | | | | | | | | | | | | | | | | | | | | | | | | | | | | | | | | | | |
| Table 5: Taxable and GAAP Income (1) Differences and Dividends (In thousands, except for per share data) | |
| | | | | | | | | | | | | | | | | | | | |
| | | Estimated Six Months 2018 (2) | | Estimated Twelve Months 2017 (2) | | Actual Twelve Months 2016 (2) | |
| | | Taxable Income | | GAAP Income | | Differences | | Taxable
Income | | GAAP
Income | | Differences | | Taxable Income | | GAAP Income | | Differences | |
| Taxable and GAAP Income Differences | | | | | | | | | | | | | | | | | | |
| Interest income | $ | 124,885 |
| | $ | 159,595 |
| | $ | (34,710 | ) | | $ | 224,644 |
| | $ | 248,057 |
| | $ | (23,413 | ) | | $ | 233,258 |
| | $ | 246,355 |
| | $ | (13,097 | ) | |
| Interest expense | (62,256 | ) | | (89,727 | ) | | 27,471 |
| | (89,662 | ) | | (108,816 | ) | | 19,154 |
| | (76,396 | ) | | (88,528 | ) | | 12,132 |
| |
| Net interest income | 62,629 |
| | 69,868 |
| | (7,239 | ) | | 134,982 |
| | 139,241 |
| | (4,259 | ) | | 156,862 |
| | 157,827 |
| | (965 | ) | |
| Reversal of provision for loan losses | — |
| | — |
| | — |
| | — |
| | — |
| | — |
| | — |
| | 7,102 |
| | (7,102 | ) | |
| Realized credit losses | (966 | ) | | — |
| | (966 | ) | | (3,442 | ) | | — |
| | (3,442 | ) | | (7,989 | ) | | — |
| | (7,989 | ) | |
| Mortgage banking activities, net | 36,097 |
| | 37,172 |
| | (1,075 | ) | | 44,162 |
| | 53,908 |
| | (9,746 | ) | | 26,477 |
| | 38,691 |
| | (12,214 | ) | |
| Investment fair value changes, net | (41 | ) | | 2,498 |
| | (2,539 | ) | | (11,191 | ) | | 10,374 |
| | (21,565 | ) | | (10,410 | ) | | (28,574 | ) | | 18,164 |
| |
| Operating expenses | (38,374 | ) | | (42,039 | ) | | 3,665 |
| | (74,932 | ) | | (77,156 | ) | | 2,224 |
| | (88,416 | ) | | (88,786 | ) | | 370 |
| |
| Other income (expense), net | 8,537 |
| | 5,440 |
| | 3,097 |
| | 31,325 |
| | 12,436 |
| | 18,889 |
| | 89,715 |
| | 20,691 |
| | 69,024 |
| |
| Realized gains, net | 28,607 |
| | 14,077 |
| | 14,530 |
| | (735 | ) | | 13,355 |
| | (14,090 | ) | | 284 |
| | 28,009 |
| | (27,725 | ) | |
| (Provision for) benefit from income taxes | (257 | ) | | (7,424 | ) | | 7,167 |
| | (515 | ) | | (11,752 | ) | | 11,237 |
| | (155 | ) | | (3,708 | ) | | 3,553 |
| |
| Income | $ | 96,232 |
| | $ | 79,592 |
| | $ | 16,640 |
| | $ | 119,654 |
| | $ | 140,406 |
| | $ | (20,752 | ) | | $ | 166,368 |
| | $ | 131,252 |
| | $ | 35,116 |
| |
| | | | | | | | | | | | | | | | | | | |
| REIT taxable income | $ | 60,268 |
| | | | | | $ | 87,994 |
| | | | | | $ | 97,576 |
| | | | | |
| Taxable income at taxable subsidiaries | 35,964 |
| | | | | | 31,660 |
| | | | | | 68,792 |
| | | | | |
| Taxable income | $ | 96,232 |
| | | | | | $ | 119,654 |
| | | | | | $ | 166,368 |
| | | | | |
| | | | | | | | | | | | | | | | | | | |
| Shares used for taxable EPS calculation | 75,743 |
| | | | | | 76,600 |
| | | | | | 76,835 |
| | | | | |
| REIT taxable income per share | $ | 0.79 |
| | | | | | $ | 1.15 |
| | | | | | $ | 1.27 |
| | | | | |
| Taxable income (loss) per share at taxable subsidiaries | $ | 0.48 |
| | | | | | $ | 0.41 |
| | | | | | $ | 0.90 |
| | | | | |
Taxable income per share (3) | $ | 1.27 |
| | | | | | $ | 1.56 |
| | | | | | $ | 2.17 |
| | | | | |
| | | | | | | | | | | | | | | | | | | |
| Dividends | | | | | | | | | | | | | | | | | | |
| Dividends declared | $ | 43,916 |
| | | | | | $ | 86,271 |
| | | | | | $ | 86,240 |
| | | | | |
Dividends per share (4) | $ | 0.58 |
| | | | | | $ | 1.12 |
| | | | | | $ | 1.12 |
| | | | | |
| |
| (1) | Taxable income for 2017 and 2018 are estimates until we file our tax returns for these years. To the extent we expect to pay tax at the corporate level (generally as a result of activity at our taxable REIT subsidiaries), we are required to record a tax provision for GAAP reporting purposes. Any tax provision (or benefit) is not necessarily the actual amount of tax currently due (or receivable as a refund) as a portion of our provision (or benefit) is deferred in nature. It is our intention to retain any excess inclusion income generated in 2018 at our TRS and not pass it through to our shareholders. |
| |
| (2) | Reconciliation of GAAP income to taxable income (loss) for prior quarters is provided in the respective Redwood Reviews for those quarters. |
| |
| (3) | Taxable income (loss) per share is based on the number of shares outstanding at the end of each quarter. The annual and year-to-date taxable income (loss) per share is the sum of the quarterly per share estimates. |
| |
| (4) | Dividends in 2017 are expected to be characterized as 71% ordinary dividend income (or $61 million) and 29% qualified dividend income (or $25 million). Dividends in 2016 were characterized as 100% ordinary income (or $86 million). |
|
| | |
| THE REDWOOD REVIEW I 2ND QUARTER 2018 | | Table 5: Taxable and GAAP Income Differences and Dividends 28 |
|
| | | | | | | | | | | | | | | | | | | | | | | | | | | | | | | | | | | | | | | | | | | | | |
| Table 6: Financial Ratios and Book Value ($ in thousands, except per share data) | |
| | | | | | | | | | | | | | | | | | | | | | | | |
| | | 2018
Q2 | | 2018
Q1 | | 2017
Q4 | | 2017
Q3 | | 2017 Q2 | | 2017 Q1 | | 2016
Q4 | | 2016
Q3 | | 2016
Q2 | | Six
Months 2018 | | Six
Months 2017 | |
| Financial performance ratios | | | | | | | | | | | | | | | | | | | | | | |
| Net interest income | $ | 34,763 |
| | $ | 35,105 |
| | $ | 35,360 |
| | $ | 35,294 |
| | $ | 34,990 |
| | $ | 33,597 |
| | $ | 35,797 |
| | $ | 39,309 |
| | $ | 44,343 |
| | $ | 69,868 |
| | $ | 68,587 |
| |
| Operating expenses | $ | (19,009 | ) | | $ | (23,030 | ) | | $ | (20,367 | ) | | $ | (19,922 | ) | | $ | (18,641 | ) | | $ | (18,226 | ) | | $ | (17,824 | ) | | $ | (20,355 | ) | | $ | (20,155 | ) | | $ | (42,039 | ) | | $ | (36,867 | ) | |
| GAAP net income | $ | 32,747 |
| | $ | 46,845 |
| | $ | 30,933 |
| | $ | 36,180 |
| | $ | 36,324 |
| | $ | 36,969 |
| | $ | 25,355 |
| | $ | 52,553 |
| | $ | 41,281 |
| | $ | 79,592 |
| | $ | 73,293 |
| |
| | | | | | | | | | | | | | | | | | | | | | | |
| Average total assets | $ | 7,134,026 |
| | $ | 6,922,611 |
| | $ | 6,652,937 |
| | $ | 5,851,133 |
| | $ | 5,685,460 |
| | $ | 5,471,154 |
| | $ | 5,613,048 |
| | $ | 5,880,281 |
| | $ | 5,954,162 |
| | $ | 7,028,903 |
| | $ | 5,578,899 |
| |
| Average total equity | $ | 1,226,735 |
| | $ | 1,218,015 |
| | $ | 1,207,879 |
| | $ | 1,189,540 |
| | $ | 1,167,438 |
| | $ | 1,158,732 |
| | $ | 1,137,948 |
| | $ | 1,111,507 |
| | $ | 1,089,289 |
| | $ | 1,222,399 |
| | $ | 1,163,109 |
| |
| | | | | | | | | | | | | | | | | | | | | | | |
| Operating expenses / average total assets | 1.07 | % | | 1.33 | % |
| 1.22 | % | | 1.36 | % | | 1.31 | % | | 1.33 | % | | 1.27 | % | | 1.38 | % |
| 1.35 | % | | 1.20 | % | | 1.32 | % | |
| Operating expenses / total capital | 3.80 | % | | 5.13 | % | | 4.56 | % | | 4.47 | % | | 4.22 | % | | 4.08 | % | | 4.03 | % | | 4.65 | % | | 4.71 | % | | 4.21 | % | | 4.18 | % | |
| Operating expenses / average total equity | 6.20 | % | | 7.56 | % |
| 6.74 | % | | 6.70 | % | | 6.39 | % | | 6.29 | % | | 6.27 | % | | 7.33 | % |
| 7.40 | % | | 6.88 | % | | 6.34 | % | |
| | | | | | | | | | | | | | | | | | | | | | | |
| GAAP net income / average total assets | 1.84 | % | | 2.71 | % |
| 1.86 | % | | 2.47 | % | | 2.56 | % | | 2.70 | % | | 1.81 | % | | 3.57 | % |
| 2.77 | % | | 2.26 | % | | 2.63 | % | |
| GAAP net income / average equity (GAAP ROE) | 10.68 | % | | 15.38 | % |
| 10.24 | % | | 12.17 | % | | 12.45 | % | | 12.76 | % | | 8.91 | % | | 18.91 | % |
| 15.16 | % | | 13.02 | % | | 12.60 | % | |
| | | | | | | | | | | | | | | | | | | | | | | | |
| Leverage ratios and book value per share | | | | | | | | | | | | | | | | | | | | | | |
| Short-term debt | $ | 1,426,288 |
| | $ | 1,504,460 |
| | $ | 1,938,682 |
| | $ | 1,238,196 |
| | $ | 1,294,807 |
| | $ | 563,773 |
| | $ | 791,539 |
| | $ | 1,117,405 |
| | $ | 1,059,045 |
| | | | | |
| Long-term debt – Commercial secured borrowing | — |
| | — |
| | — |
| | — |
| | — |
| | — |
| | — |
| | — |
| | 65,240 |
| | | | | |
Long-term debt – Other (1) | 2,785,264 |
| | 2,585,264 |
| | 2,585,264 |
| | 2,585,264 |
| | 2,340,264 |
| | 2,627,764 |
| | 2,627,764 |
| | 2,627,764 |
| | 2,627,764 |
| | | | | |
| Total debt at Redwood | $ | 4,211,552 |
| | $ | 4,089,724 |
|
| $ | 4,523,946 |
| | $ | 3,823,460 |
| | $ | 3,635,071 |
| | $ | 3,191,537 |
| | $ | 3,419,303 |
| | $ | 3,745,169 |
|
| $ | 3,752,049 |
| | | | | |
| | | | | | | | | | | | | | | | | | | | | | | |
| ABS issued at consolidated entities | | | | | | | | | | | | | | | | | | | | | | |
| Legacy Sequoia entities ABS issued | $ | 582,235 |
| | $ | 615,849 |
| | $ | 622,445 |
| | $ | 657,960 |
| | $ | 692,606 |
| | $ | 728,391 |
| | $ | 773,462 |
| | $ | 819,868 |
| | $ | 859,628 |
| | | | | |
| Sequoia Choice entities ABS issued | 1,347,427 |
| | 926,238 |
| | 542,140 |
| | 286,328 |
| | — |
| | — |
| | — |
| | — |
| | — |
| | | | | |
Total ABS issued (1) | $ | 1,929,662 |
| | $ | 1,542,087 |
|
| $ | 1,164,585 |
| | $ | 944,288 |
| | $ | 692,606 |
| | $ | 728,391 |
| | $ | 773,462 |
| | $ | 819,868 |
|
| $ | 859,628 |
| | | | | |
| Consolidated debt | $ | 6,141,214 |
| | $ | 5,631,811 |
|
| $ | 5,688,531 |
| | $ | 4,767,748 |
| | $ | 4,327,677 |
| | $ | 3,919,928 |
| | $ | 4,192,765 |
|
| $ | 4,565,037 |
|
| $ | 4,611,677 |
| | | | | |
| Stockholders' equity | $ | 1,228,955 |
| | $ | 1,219,983 |
| | $ | 1,212,287 |
| | $ | 1,208,640 |
| | $ | 1,179,424 |
| | $ | 1,165,771 |
| | $ | 1,149,428 |
| | $ | 1,130,130 |
| | $ | 1,092,603 |
| | | | | |
Total capital (2) | $ | 1,999,177 |
| | $ | 1,795,572 |
| | $ | 1,787,701 |
| | $ | 1,783,301 |
| | $ | 1,765,784 |
| | $ | 1,787,266 |
| | $ | 1,770,074 |
| | $ | 1,750,000 |
| | $ | 1,711,802 |
| | | | | |
Recourse debt at Redwood to stockholders' equity (3) | 3.4x |
| | 3.4x |
| | 3.7x |
| | 3.2x |
| | 3.1x |
| | 2.7x |
| | 3.0x |
| | 3.3x |
| | 3.4x |
| | | | | |
| Consolidated debt to stockholders' equity | 5.0x |
| | 4.6x |
| | 4.7x |
| | 3.9x |
| | 3.7x |
| | 3.4x |
| | 3.6x |
| | 4.0x |
| | 4.2x |
| | | | | |
| Shares outstanding at period end (in thousands) | 75,743 |
| | 75,703 |
| | 76,600 |
| | 77,123 |
| | 77,117 |
| | 77,039 |
| | 76,835 |
| | 76,682 |
| | 76,935 |
| | | | | |
| Book value per share | $ | 16.23 |
| | $ | 16.12 |
| | $ | 15.83 |
| | $ | 15.67 |
| | $ | 15.29 |
| | $ | 15.13 |
| | $ | 14.96 |
| | $ | 14.74 |
| | $ | 14.20 |
| | | | | |
| | | | | | | | | | | | | | | | | | | | | | | | |
| |
| (1) | Long-term debt - other and ABS issued presented above do not include deferred securities issuance costs. |
| |
| (2) | Our total capital of $2.0 billion at June 30, 2018 included $1.2 billion of equity capital and $0.8 billion of the total $2.8 billion of long-term debt on our consolidated balance sheet. |
| |
| (3) | Excludes ABS issued at consolidated entities and commercial secured borrowings associated with commercial A-notes that were sold, but treated as secured borrowings under GAAP. |
|
| | |
| THE REDWOOD REVIEW I 2ND QUARTER 2018 | | Table 6: Financial Ratios and Book Value 29
|
|
| | | | | | | | | | | | | | | | | | | | | | | | | | | | | | | | | | | | | |
| Table 7: Loans and Securities Activity and Balances ($ in thousands) |
| | | | | | | | | | | | | | | | | | | |
| | 2018 Q2 | | 2018 Q1 | | 2017
Q4 | | 2017
Q3 | | 2017
Q2 | | 2017 Q1 | | 2016
Q4 | | 2016
Q3 | | 2016
Q2 | |
| Residential Loans, Held-for-Sale - Activity | | | | | | | | | | | | | | | | | | |
| Beginning carrying value | $ | 1,130,185 |
| | $ | 1,427,945 |
| | $ | 925,681 |
| | $ | 837,371 |
| | $ | 376,607 |
| | $ | 835,399 |
| | $ | 1,188,514 |
| | $ | 882,380 |
| | $ | 441,076 |
| |
| Acquisitions | 1,951,566 |
| | 1,815,294 |
| | 1,950,180 |
| | 1,462,116 |
| | 1,221,051 |
| | 1,108,304 |
| | 1,132,561 |
| | 1,252,135 |
| | 1,342,079 |
| |
| Sales | (1,408,358 | ) | | (1,594,531 | ) | | (834,977 | ) | | (1,393,323 | ) | | (694,875 | ) | | (1,377,637 | ) | | (1,268,943 | ) | | (774,106 | ) | | (830,974 | ) | |
| Principal repayments | (14,612 | ) | | (17,017 | ) | | (14,771 | ) | | (16,436 | ) | | (9,273 | ) | | (12,995 | ) | | (24,427 | ) | | (20,574 | ) | | (12,332 | ) | |
| Transfers between portfolios | (561,710 | ) | | (507,616 | ) | | (601,554 | ) | | 20,025 |
| | (61,922 | ) | | (184,996 | ) | | (186,116 | ) | | (151,919 | ) | | (63,328 | ) | |
| Changes in fair value, net | 7,589 |
| | 6,110 |
| | 3,386 |
| | 15,928 |
| | 5,783 |
| | 8,532 |
| | (6,190 | ) | | 598 |
| | 5,859 |
| |
| Ending fair value | $ | 1,104,660 |
| | $ | 1,130,185 |
| | $ | 1,427,945 |
| | $ | 925,681 |
| | $ | 837,371 |
| | $ | 376,607 |
| | $ | 835,399 |
| | $ | 1,188,514 |
| | $ | 882,380 |
| |
| | | | | | | | | | | | | | | | | | | |
| Residential Loans, Held-for-Investment at Redwood - Activity | | | | | | | | | | | | | | | | | | |
| Beginning carrying value | $ | 2,375,785 |
| | $ | 2,434,386 |
| | $ | 2,268,802 |
| | $ | 2,360,234 |
| | $ | 2,350,013 |
| | $ | 2,261,016 |
| | $ | 2,282,674 |
| | $ | 2,277,561 |
| | $ | 2,343,953 |
| |
| Principal repayments | (79,375 | ) | | (74,954 | ) | | (93,916 | ) | | (74,530 | ) | | (60,055 | ) | | (93,666 | ) | | (162,512 | ) | | (146,151 | ) | | (129,073 | ) | |
| Transfers between portfolios | 31,936 |
| | 55,775 |
| | 273,994 |
| | (20,045 | ) | | 61,922 |
| | 184,996 |
| | 186,116 |
| | 151,919 |
| | 63,328 |
| |
| Changes in fair value, net | (15,010 | ) | | (39,422 | ) | | (14,494 | ) | | 3,143 |
| | 8,354 |
| | (2,333 | ) | | (45,262 | ) | | (655 | ) | | (647 | ) | |
| Ending fair value | $ | 2,313,336 |
| | $ | 2,375,785 |
| | $ | 2,434,386 |
| | $ | 2,268,802 |
| | $ | 2,360,234 |
| | $ | 2,350,013 |
| | $ | 2,261,016 |
| | $ | 2,282,674 |
| | $ | 2,277,561 |
| |
| | | | | | | | | | | | | | | | | | | |
| Ending Balances for Other Loan and MSR Investments | | | | | | | | | | | | |
| |
| |
| |
| Residential Loans, HFI |
| | | |
| |
| |
| |
| |
| |
| |
| |
| Consolidated Legacy Sequoia entities | $ | 592,029 |
| | $ | 626,151 |
| | $ | 632,817 |
| | $ | 673,134 |
| | $ | 707,686 |
| | $ | 745,621 |
| | $ | 791,636 |
| | $ | 839,976 |
| | $ | 880,197 |
| |
| Consolidated Sequoia Choice entities | $ | 1,481,145 |
| | $ | 1,013,619 |
| | $ | 620,062 |
| | $ | 317,303 |
| | $ | — |
| | $ | — |
| | $ | — |
| | $ | — |
| | $ | — |
| |
| Commercial Loans | $ | — |
| | $ | — |
| | $ | — |
| | $ | — |
| | $ | — |
| | $ | 2,700 |
| | $ | 2,700 |
| | $ | 30,400 |
| | $ | 259,823 |
| |
| Mortgage Servicing Rights | $ | 64,674 |
| | $ | 66,496 |
| | $ | 63,598 |
| | $ | 62,928 |
| | $ | 63,770 |
| | $ | 111,013 |
| | $ | 118,526 |
| | $ | 106,009 |
| | $ | 110,046 |
| |
| | | | | | | | | | | | | | | | | | | |
| Securities - Activity | | | | | | | | | | | | | | | | | | |
| Beginning fair value | $ | 1,357,720 |
| | $ | 1,476,510 |
| | $ | 1,356,272 |
| | $ | 1,218,503 |
| | $ | 1,165,940 |
| | $ | 1,018,439 |
| | $ | 936,910 |
| | $ | 883,801 |
| | $ | 919,927 |
| |
| Acquisitions | 223,022 |
| | 144,465 |
| | 204,733 |
| | 188,138 |
| | 116,860 |
| | 170,729 |
| | 111,358 |
| | 75,676 |
| | 77,016 |
| |
| Sales | (103,685 | ) | | (234,509 | ) | | (75,887 | ) | | (47,076 | ) | | (69,676 | ) | | (21,760 | ) | | (13,272 | ) | | (25,610 | ) | | (99,940 | ) | |
| Effect of principal payments | (17,022 | ) | | (15,707 | ) | | (21,503 | ) | | (19,497 | ) | | (15,854 | ) | | (14,911 | ) | | (15,374 | ) | | (17,454 | ) | | (17,012 | ) | |
| Change in fair value, net | (6,099 | ) | | (13,039 | ) | | 12,895 |
| | 16,204 |
| | 21,233 |
| | 13,443 |
| | (1,183 | ) | | 20,497 |
| | 3,810 |
| |
| Ending fair value | $ | 1,453,936 |
| | $ | 1,357,720 |
| | $ | 1,476,510 |
| | $ | 1,356,272 |
| | $ | 1,218,503 |
| | $ | 1,165,940 |
| | $ | 1,018,439 |
| | $ | 936,910 |
| | $ | 883,801 |
| |
| | | | | | | | | | | | | |
| | | | | |
| Ending Balances for Securities Sub-Categories | | | | | | | | | | | | | | | | | | |
| Residential | | | | | | | | | | | | | | | | | | |
| Senior - New Issue | $ | 49,099 |
| | $ | — |
| | $ | — |
| | $ | — |
| | $ | — |
| | $ | — |
| | $ | — |
| | $ | — |
| | $ | — |
| |
| Senior - Legacy | 113,799 |
| | 127,240 |
| | 140,988 |
| | 153,232 |
| | 128,330 |
| | 137,210 |
| | 136,547 |
| | 71,290 |
| | 73,324 |
| |
| Senior - IO | 89,230 |
| | 82,062 |
| | 69,975 |
| | 62,767 |
| | 48,632 |
| | 38,889 |
| | 37,066 |
| | 24,492 |
| | 23,132 |
| |
| Senior - Re-REMIC | 33,691 |
| | 38,370 |
| | 38,875 |
| | 39,033 |
| | 73,337 |
| | 73,730 |
| | 85,479 |
| | 161,234 |
| | 165,707 |
| |
| Mezzanine - New issue | 239,107 |
| | 228,114 |
| | 331,451 |
| | 334,915 |
| | 343,013 |
| | 368,919 |
| | 315,397 |
| | 283,561 |
| | 308,243 |
| |
| Subordinate - New issue | 272,508 |
| | 239,565 |
| | 247,897 |
| | 209,554 |
| | 195,039 |
| | 191,321 |
| | 177,760 |
| | 165,721 |
| | 144,072 |
| |
| Subordinate - Agency CRT | 239,767 |
| | 245,654 |
| | 300,713 |
| | 286,780 |
| | 229,510 |
| | 198,197 |
| | 152,126 |
| | 134,460 |
| | 96,008 |
| |
| Subordinate - Legacy | 17,950 |
| | 19,707 |
| | 22,586 |
| | 26,920 |
| | 30,333 |
| | 18,993 |
| | 22,294 |
| | 23,542 |
| | 25,195 |
| |
| Multifamily (mezzanine) | 398,785 |
| | 377,008 |
| | 324,025 |
| | 243,071 |
| | 170,309 |
| | 138,681 |
| | 91,770 |
| | 72,610 |
| | 48,120 |
| |
| Total securities | $ | 1,453,936 |
| | $ | 1,357,720 |
| | $ | 1,476,510 |
| | $ | 1,356,272 |
| | $ | 1,218,503 |
| | $ | 1,165,940 |
| | $ | 1,018,439 |
| | $ | 936,910 |
| | $ | 883,801 |
| |
| | | | | | | | | | | | | | | | | | | |
Sequoia Choice Securities (1) | $ | 133,718 |
| | $ | 87,381 |
| | $ | 77,922 |
| | $ | 30,975 |
| | $ | — |
| | $ | — |
| | $ | — |
| | $ | — |
| | $ | — |
| |
| | | | | | | | | | | | | | | | | | | | |
| |
| (1) | Represents securities retained from our Sequoia Choice securitizations. We consolidate the loans associated with these retained securities in accordance with GAAP. |
|
| | |
| THE REDWOOD REVIEW I 2ND QUARTER 2018 | | Table 7: Loans and Securities Activity and Balances 30 |
|
| | | | | | | | | | | | | | | | | | | | | | | | | | | | | | | | | |
| Table 8: Consolidating Balance Sheet ($ in thousands) | |
| | | | | | | | | | | | | | | | | | |
| | June 30, 2018 | | March 31, 2018 | |
| | | | Consolidated VIEs (1) | | | | | | Consolidated VIEs (1) | | | |
| | At Redwood (1) | | Legacy Sequoia | | Sequoia Choice | | Redwood Consolidated | | At Redwood (1) | | Legacy Sequoia | | Sequoia Choice | | Redwood
Consolidated | |
| Residential loans | $ | 3,417,996 |
| | $ | 592,029 |
| | $ | 1,481,145 |
| | $ | 5,491,170 |
| | $ | 3,505,970 |
| | $ | 626,151 |
| | $ | 1,013,619 |
| | $ | 5,145,740 |
| |
| Real estate securities | 1,453,936 |
| | — |
| | — |
| | 1,453,936 |
| | 1,357,720 |
| | — |
| | — |
| | 1,357,720 |
| |
| Cash and cash equivalents | 184,779 |
| | — |
| | — |
| | 184,779 |
| | 245,058 |
| | — |
| | — |
| | 245,058 |
| |
Other assets (2) | 373,069 |
| | 3,631 |
|
| 5,966 |
| | 382,666 |
| | 242,975 |
| | 4,016 |
| | 4,064 |
| | 251,055 |
| |
| Total assets | $ | 5,429,780 |
| | $ | 595,660 |
| | $ | 1,487,111 |
| | $ | 7,512,551 |
| | $ | 5,351,723 |
| | $ | 630,167 |
| | $ | 1,017,683 |
| | $ | 6,999,573 |
| |
| Short-term debt | $ | 1,426,288 |
| | $ | — |
| | $ | — |
| | $ | 1,426,288 |
| | $ | 1,504,460 |
| | $ | — |
| | $ | — |
| | $ | 1,504,460 |
| |
| Other liabilities | 151,788 |
| | 589 |
|
| 5,048 |
| | 157,425 |
| | 153,476 |
| | 534 |
| | 3,445 |
| | 157,455 |
| |
| ABS issued | — |
| | 582,235 |
| | 1,347,427 |
| | 1,929,662 |
| | — |
| | 615,849 |
| | 926,238 |
| | 1,542,087 |
| |
| Long-term debt, net | 2,770,221 |
| | — |
| | — |
| | 2,770,221 |
| | 2,575,588 |
| | — |
| | — |
| | 2,575,588 |
| |
| Total liabilities | 4,348,297 |
| | 582,824 |
| | 1,352,475 |
| | 6,283,596 |
| | 4,233,524 |
| | 616,383 |
| | 929,683 |
| | 5,779,590 |
| |
| | | | | | | | | | | | | | | | | |
| Equity | 1,081,483 |
| | 12,836 |
|
| 134,636 |
| | 1,228,955 |
| | 1,118,199 |
| | 13,784 |
| | 88,000 |
| | 1,219,983 |
| |
| Total liabilities and equity | $ | 5,429,780 |
| | $ | 595,660 |
|
| $ | 1,487,111 |
| | $ | 7,512,551 |
| | $ | 5,351,723 |
| | $ | 630,167 |
| | $ | 1,017,683 |
| | $ | 6,999,573 |
| |
| | | | | | | | | | | | | | | | | |
| |
| (1) | The format of this consolidating balance sheet is provided to more clearly delineate between the assets belonging to consolidated Sequoia securitization entities that we are required to consolidate on our balance sheet in accordance with GAAP, but which are not legally ours, and the liabilities of these consolidated entities, which are payable only from the cash flows generated by their assets and are, therefore, nonrecourse to us, and the assets that are legally ours and the liabilities of ours for which there is recourse to us. |
| |
| (2) | At both June 30, 2018 and March 31, 2018, other assets at Redwood included a total of $42 million of assets held by third-party custodians and pledged as collateral to the GSEs in connection with credit risk-sharing arrangements relating to conforming residential loans. These pledged assets can only be used to settle obligations to the GSEs under these risk-sharing arrangements. |
|
| | |
| THE REDWOOD REVIEW I 2ND QUARTER 2018 | | Table 8: Consolidating Balance Sheet 31 |
|
|
| |
| D I V I D E N D P O L I C Y |
Dividend Policy
Summary
As a REIT, Redwood is required to distribute to shareholders at least 90% of its REIT taxable income, excluding net capital gains. To the extent Redwood retains REIT taxable income, including net capital gains, it is taxed at corporate tax rates. Redwood also earns taxable income at its taxable REIT subsidiaries (TRS), which it is not required to distribute.
Dividend Policy Overview
In recent years, our Board of Directors has maintained a policy of paying regular quarterly dividends in excess of the amount required to comply with the provisions of the Internal Revenue Code applicable to REITs. In December 2017, the Board of Directors announced its intention to pay a regular dividend of $0.28 per share per quarter in 2018. During the first quarter of 2018, the Board of Directors declared and paid a regular quarterly dividend of $0.28 per share. In May 2018, the Board of Directors declared an increase in the regular dividend to $0.30 per share for the second quarter of 2018. In August 2018, the Board of Directors declared a regular dividend of $0.30 per share for the third quarter of 2018, which is payable on September 28, 2018 to shareholders of record on September 14, 2018.
Dividend Distribution Requirement
Our estimated REIT taxable income was $27 million, or $0.35 per share, for the second quarter of 2018 and $33 million, or $0.44 per share, for the first quarter of 2018. Under normal circumstances, our minimum REIT dividend requirement would be 90% of our annual REIT taxable income. However, we currently maintain a $57 million federal net operating loss carry forward (NOL) at the REIT that affords us the option of retaining REIT taxable income up to the NOL amount, tax free, rather than distributing it as dividends. Federal income tax rules require the dividends paid deduction to be applied to reduce REIT taxable income before the applicability of NOLs is considered. It is possible that our estimated REIT taxable income will exceed our dividend distributions in 2018; therefore, we may utilize a portion of our NOL in 2018 and any remaining amount will carry forward into 2019.
Income Tax Characterization of Dividend for Shareholders
We currently expect all or nearly all of the distributions to shareholders in 2018 will be taxable as dividend income and a smaller portion, if any, will be a return of capital, which is generally non-taxable. Additionally, a portion of our 2018 dividend distributions are expected to be characterized as long-term capital gains for federal income tax purposes.
Beginning in 2018, the Tax Cuts and Jobs Act provides that individual taxpayers may deduct 20% of their ordinary REIT dividends from taxable income. This results in a maximum federal effective tax rate of 29.6% on an individual taxpayer's ordinary REIT dividends, compared to the highest marginal rate of 37%. This deduction does not apply to REIT dividends classified as qualified dividends or long-term capital gains dividends, as those dividends are taxed at a maximum rate of 20% for individuals.
|
|
| |
| THE REDWOOD REVIEW I 2ND QUARTER 2018 |
| 33 |
|
|
| |
| C O R E E A R N I N G S D E F I N I T I O N |
Core Earnings
Core earnings is a non-GAAP measure of Redwood’s earnings and results of operations. Specifically, management has defined core earnings as: GAAP net income adjusted to (i) eliminate the impact of quarterly mark-to-market changes on the fair value of long-term investments (and associated derivatives) related to changes in benchmark interest rates and credit spreads, (ii) include the cumulative net gains or losses on long-term investments accounted for as trading securities under GAAP that were sold during the period presented, net of any gains or losses from derivatives associated with the investments sold, and (iii) include the hypothetical income taxes associated with core earnings adjustments.
Management utilizes this core earnings measure internally as one way of analyzing Redwood’s performance over multiple periods, as it believes it provides useful comparative results absent the impact of certain quarterly mark-to-market changes on investments held through the end of the period presented and inclusive of all realized gains and losses from securities sales.
Specifically, the quarterly mark-to-market changes in the value of our long-term investments in loans, trading securities, and other investments, as well as the associated derivatives, resulting from changes in benchmark interest rates and credit spreads may not be reflective of the total return management would expect to earn from them over the longer-term.
Additionally, the adjustment to include cumulative net gains or losses from the sale of trading securities is to ensure that core earnings presents consistently the impact of the sales of investments regardless of whether they are accounted for as (i) trading securities or (ii) available-for-sale securities, in each case under GAAP, as outlined below.
| |
| • | Under GAAP, available-for-sale securities are reported at their fair value with periodic changes in fair value recognized through the balance sheet in Shareholders’ equity. When an available-for-sale security is sold, the cumulative gain or loss since purchase is recognized through the income statement, in Realized gains, net, in the period the sale occurred. As a result, any such cumulative gains or losses are reflected in core earnings in the period the sale occurred. |
| |
| • | Under GAAP, trading securities are reported at their fair value with periodic changes in fair value recognized through the income statement in Investment fair value changes, net. Certain of these periodic changes in fair value (as described above) are excluded from core earnings. Core earnings includes an adjustment to include the cumulative net gains or losses (from purchase through the sale of the investment) for sold trading securities in the period they are sold. The result is to consistently present within core earnings the cumulative gains or losses from the sale of long-term investments, regardless of how they are accounted for under GAAP. |
|
|
| |
| THE REDWOOD REVIEW I 2ND QUARTER 2018 |
| 34 |
|
|
| |
| C O R E E A R N I N G S D E F I N I T I O N |
Core earnings also includes adjustments to show the hypothetical tax provision or benefit that would be associated with the core earnings adjustments made to net income. As a REIT, we are subject to income taxes on earnings generated at our taxable REIT subsidiaries (TRS) and generally not subject to income taxes on earnings generated at the REIT (to the extent we distribute our REIT taxable income as dividends). In order to present the hypothetical income taxes associated with core earnings adjustments made to net income, estimated effective tax rates are applied to the core earnings adjustments occurring within our TRS.
Additionally, we use core earnings as described above to calculate basic and diluted core earnings per share. To calculate these measures, we follow the same methodology for calculating basic and diluted earnings per share for GAAP, but substitute core earnings for GAAP earnings in the calculation. A detailed presentation of these calculations is presented in Table 2 of the Financial Tables section of this document.
|
|
| |
| THE REDWOOD REVIEW I 2ND QUARTER 2018 |
| 35 |
|
|
| |
| C O R E E A R N I N G S D E F I N I T I O N |
The following table presents the components of investment fair value changes, net, of our Investment Portfolio segment that are included and excluded from core earnings, by investment type, for the second and first quarters of 2018.
|
| | | | | | | | |
| |
Components of Investment Portfolio Fair Value Changes, Net by Investment Type |
| ($ in millions) |
| | Three Months Ended | |
| | 6/30/2018 | | 3/31/2018 | |
| | | | | |
| Market valuation changes on: | | | | |
| Residential loans held-for-investment | | | | |
Change in fair value from the reduction of principal (1) | $ | — |
| | $ | (1 | ) | |
Other fair value changes (2) | (15 | ) | | (38 | ) | |
| Total change in fair value of residential loans held-for-investment | (15 | ) | | (39 | ) | |
| | | | | |
| Real estate securities | | | | |
Change in fair value from the reduction of principal (1) | (3 | ) | | (2 | ) | |
Other fair value changes (2) | 3 |
| | (1 | ) | |
| Total change in fair value of real estate securities | — |
| | (3 | ) | |
| | | | | |
| Risk management derivatives | | | | |
| Interest component of derivative expense | — |
| | (3 | ) | |
Other fair value changes (3) | 17 |
| | 47 |
| |
| Total change in fair value of risk management derivatives | 17 |
| | 44 |
| |
| | | | | |
| Total investment portfolio fair value changes, net | $ | 2 |
| | $ | 2 |
| |
| |
| (1) | Reflects the change in fair value due to principal changes, which is calculated as the change in principal on a given investment during the period, multiplied by the prior quarter ending price or acquisition price for that investment in percentage terms. |
| |
| (2) | Reflects changes in prepayment assumptions and credit spreads on our residential loans, trading securities and conforming risk-sharing investments primarily due to changes in benchmark interest rates. This item is excluded from management's definition of core earnings. |
| |
| (3) | Reflects the change in fair value of our risk management derivatives that are associated with changes in benchmark interest rates during the period. This item is excluded from management's definition of core earnings. |
We caution that core earnings, core segment contribution, and core earnings per share should not be utilized in isolation, nor should they be considered as alternatives to GAAP net income, GAAP net income per share, or other measurements of results of operations computed in accordance with GAAP.
|
|
| |
| THE REDWOOD REVIEW I 2ND QUARTER 2018 |
| 36 |
|
|
| |
| F O R W A R D - L O O K I N G S T A T E M E N T S |
As noted above under the heading “Cautionary Statement,” this Redwood Review contains forward-looking statements within the meaning of the safe harbor provisions of the Private Securities Litigation Reform Act of 1995. Forward-looking statements involve numerous risks and uncertainties. Our actual results may differ from our expectations, estimates, and projections and, consequently, you should not rely on these forward-looking statements as predictions of future events. Forward-looking statements are not historical in nature and can be identified by words such as “anticipate,” “estimate,” “will,” “should,” “expect,” “believe,” “intend,” “seek,” “plan,” and similar expressions or their negative forms, or by references to strategy, plans, goals, or intentions. These forward-looking statements are subject to risks and uncertainties, including, among other things, those described in our Annual Report on Form 10-K under the caption “Risk Factors.” Other risks, uncertainties, and factors that could cause actual results to differ materially from those projected are described below and may be described from time to time in reports we file with the Securities and Exchange Commission, including reports on Forms 10-K, 10-Q, and 8-K. We undertake no obligation to update or revise forward-looking statements, whether as a result of new information, future events, or otherwise.
Statements regarding the following subjects, among others, are forward-looking by their nature: (i) statements we make regarding Redwood’s business strategy and strategic focus, including statements relating to our overall market position, strategy and long-term prospects (including our strategic focus on areas in which our core business strengths are expected to lead to long-term, sustainable earnings growth, our goal for annual mortgage banking volumes and total shareholder capital deployed five years from now to be at least two to three times what they are today, that a prudent growth trajectory to these benchmarks should drive our expense ratios meaningfully lower, and that our earnings per share, after the realization of significant untapped operating leverage, should grow significantly); (ii) statements related to our financial outlook and expectations for 2018, including with respect to: 2018 GAAP earnings, mortgage banking activities (including target returns on allocated capital, loan acquisition volume, and gross margins), our investment portfolio (including target returns on allocated capital), and corporate operating expenses (including that equity and convertible debt capital raised in June and July 2018 may be modestly dilutive to our earnings in the second half of 2018, depending on the rate of capital deployment into new initiatives and other long-term investments); (iii) statements related to expanding our mortgage banking activities and investment portfolio to include mortgage loans secured by single-family rental properties; (iv) statements regarding our mortgage banking activities, including expectations relating to residential mortgage banking margins, loan purchase volume, and our expanded-prime Redwood Choice loan program; (vi) statements relating to acquiring residential mortgage loans in the future that we have identified for purchase or plan to purchase, including the amount of such loans that we identified for purchase during the second quarter of 2018 and at June 30, 2018, and expected fallout and the corresponding volume of residential mortgage loans expected to be available for purchase; (vii) statements relating to our estimate of our available capital (including that we estimate our available capital at June 30, 2018 was approximately $200 million), and expectations relating to sourcing additional capital from continued optimization of our investment portfolio and from capital markets; (viii) statements we
|
|
| |
| THE REDWOOD REVIEW I 2ND QUARTER 2018 |
| 37 |
|
|
| |
| F O R W A R D - L O O K I N G S T A T E M E N T S |
make regarding our dividend policy, including with respect to our regular quarterly dividends in 2018; and (ix) statements regarding our expectations and estimates relating to the characterization for income tax purposes of our dividend distributions, our expectations and estimates relating to tax accounting, tax liabilities and tax savings, and GAAP tax provisions, and our estimates of REIT taxable income and TRS taxable income.
Important factors, among others, that may affect our actual results include:
| |
| • | the pace at which we redeploy our available capital into new investments and initiatives; |
| |
| • | our ability to scale our platform and systems, particularly with respect to our new initiatives; |
| |
| • | interest rate volatility, changes in credit spreads, and changes in liquidity in the market for real estate securities and loans; |
| |
| • | changes in the demand from investors for residential mortgages and investments, and our ability to distribute residential mortgages through our whole-loan distribution channel; |
| |
| • | our ability to finance our investments in securities and our acquisition of residential mortgages with short-term debt; |
| |
| • | changes in the values of assets we own; |
| |
| • | general economic trends, the performance of the housing, real estate, mortgage, credit, and broader financial markets, and their effects on the prices of earning assets and the credit status of borrowers; |
| |
| • | federal and state legislative and regulatory developments, and the actions of governmental authorities, including the new U.S. presidential administration, and in particular those affecting the mortgage industry or our business (including, but not limited to, the Federal Housing Finance Agency’s rules relating to FHLB membership requirements and the implications for our captive insurance subsidiary’s membership in the FHLB); |
| |
| • | strategic business and capital deployment decisions we make; |
| |
| • | developments related to the fixed income and mortgage finance markets and the Federal Reserve’s statements regarding its future open market activity and monetary policy; |
| |
| • | our exposure to credit risk and the timing of credit losses within our portfolio; |
| |
| • | the concentration of the credit risks we are exposed to, including due to the structure of assets we hold and the geographical concentration of real estate underlying assets we own; |
| |
| • | our exposure to adjustable-rate mortgage loans; |
| |
| • | the efficacy and expense of our efforts to manage or hedge credit risk, interest rate risk, and other financial and operational risks; |
| |
| • | changes in credit ratings on assets we own and changes in the rating agencies’ credit rating methodologies; |
| |
| • | changes in interest rates; |
| |
| • | changes in mortgage prepayment rates; |
| |
| • | changes in liquidity in the market for real estate securities and loans; |
| |
| • | our ability to finance the acquisition of real estate-related assets with short-term debt; |
| |
| • | the ability of counterparties to satisfy their obligations to us; |
|
|
| |
| THE REDWOOD REVIEW I 2ND QUARTER 2018 |
| 38 |
|
|
| |
| F O R W A R D - L O O K I N G S T A T E M E N T S |
| |
| • | our involvement in securitization transactions, the profitability of those transactions, and the risks we are exposed to in engaging in securitization transactions; |
| |
| • | exposure to claims and litigation, including litigation arising from our involvement in securitization transactions; |
| |
| • | ongoing litigation against various trustees of RMBS transactions; |
| |
| • | whether we have sufficient liquid assets to meet short-term needs; |
| |
| • | our ability to successfully compete and retain or attract key personnel; |
| |
| • | our ability to adapt our business model and strategies to changing circumstances; |
| |
| • | changes in our investment, financing, and hedging strategies and new risks we may be exposed to if we expand our business activities; |
| |
| • | our exposure to a disruption or breach of the security of our technology infrastructure and systems; |
| |
| • | exposure to environmental liabilities; |
| |
| • | our failure to comply with applicable laws and regulations; |
| |
| • | our failure to maintain appropriate internal controls over financial reporting and disclosure controls and procedures; |
| |
| • | the impact on our reputation that could result from our actions or omissions or from those of others; changes in accounting principles and tax rules; |
| |
| • | our ability to maintain our status as a REIT for tax purposes; |
| |
| • | limitations imposed on our business due to our REIT status and our status as exempt from registration under the Investment Company Act of 1940; |
| |
| • | decisions about raising, managing, and distributing capital; and |
| |
| • | other factors not presently identified. |
|
|
| |
| THE REDWOOD REVIEW I 2ND QUARTER 2018 |
| 39 |