Exhibit 99.2
|
|
| |
| T A B L E O F C O N T E N T S |
|
| |
| Introduction | |
| | |
| Shareholder Letter | |
| | |
| Quarterly Overview | |
| | |
Ñ Third Quarter Highlights | |
| | |
Ñ Quarterly Earnings and Analysis | |
| | |
Ñ Book Value | |
| | |
Ñ Capital Allocations | |
| | |
Ñ 2019 Updated Financial Outlook | |
| | |
Ñ Segment Results | |
| | |
Ñ Balance Sheet Analysis | |
| | |
| Financial Tables | |
| | |
| Appendix | |
| | |
Ñ Dividends | |
| | |
Ñ Non-GAAP Measurements | |
| | |
Ñ Forward-Looking Statements | |
|
|
| |
| THE REDWOOD REVIEW I 3RD QUARTER 2019 |
| 1 |
|
|
| |
| F O R W A R D - L O O K I N G S T A T E M E N T S |
This Redwood Review contains forward-looking statements within the meaning of the safe harbor provisions of the Private Securities Litigation Reform Act of 1995. Forward-looking statements involve numerous risks and uncertainties. Our actual results may differ from our expectations, estimates, and projections and, consequently, you should not rely on these forward-looking statements as predictions of future events. Forward-looking statements are not historical in nature and can be identified by words such as “anticipate,” “estimate,” “will,” “should,” “expect,” “believe,” “intend,” “seek,” “plan,” and similar expressions or their negative forms, or by references to strategy, plans, goals, or intentions. These forward-looking statements are subject to risks and uncertainties, including, among other things, those described in our Annual Report on Form 10-K under the caption “Risk Factors.” Other risks, uncertainties, and factors that could cause actual results to differ materially from those projected are described below and may be described from time to time in reports we file with the Securities and Exchange Commission, including reports on Forms 10-K, 10-Q, and 8-K. We undertake no obligation to update or revise forward-looking statements, whether as a result of new information, future events, or otherwise.
Statements regarding the following subjects, among others, are forward-looking by their nature: statements we make regarding Redwood’s business strategy and strategic focus, statements related to our financial outlook and expectations for 2019, statements regarding our available capital and sourcing additional capital both internally and from the capital markets, and other statements regarding pending business activities and expectations and estimates relating to our business and financial results. Additional detail regarding the forward-looking statements in this Redwood Review and the important factors that may affect our actual results in 2019 are described in the Appendix of this Redwood Review under the heading “Forward-Looking Statements.”
|
|
| |
| THE REDWOOD REVIEW I 3RD QUARTER 2019 |
| 2 |
Note to Readers:
We file annual reports (on Form 10-K) and quarterly reports (on Form 10-Q) with the Securities and Exchange Commission. These filings and our earnings press releases provide information about Redwood and our financial results in accordance with generally accepted accounting principles (GAAP). These documents, as well as information about our business and a glossary of terms we use in this and other publications, are available through our website, www.redwoodtrust.com. We encourage you to review these documents.
References herein to “Redwood,” the “company,” “we,” “us,” and “our” include Redwood Trust, Inc. and its consolidated subsidiaries. Note that because we round numbers in the tables to millions, except per share amounts, some numbers may not foot due to rounding. References to the “third quarter” refer to the quarter ended September 30, 2019, and references to the “second quarter” refer to the quarter ended June 30, 2019, unless otherwise specified.
We hope you find this Review helpful to your understanding of our business. We thank you for your input and suggestions, which have resulted in our changing the form and content of The Redwood Review over time.
|
| | | | | | | | | | | | | | | |
| | Selected Financial Highlights |
| |
| | Quarter:
Year | | GAAP Income
(Loss) per Share | | REIT Taxable
Income per
Share (1) | | Annualized
GAAP Return
on Equity | | GAAP Book
Value per
Share | | Dividends
per Share | | Economic Return on Book Value (2) | | Recourse Leverage (3) |
| | Q319 | | $0.31 | | $0.34 | | 9% | | $15.92 | | $0.30 | | 1.3% | | 2.7x |
| | Q219 | | $0.30 | | $0.25 | | 8% | | $16.01 | | $0.30 | | 1.9% | | 3.1x |
| | Q119 | | $0.49 | | $0.30 | | 15% | | $16.00 | | $0.30 | | 2.6% | | 2.9x |
| | Q418 | | $(0.02) | | $0.32 | | —% | | $15.89 | | $0.30 | | (1.4)% | | 3.5x |
| | Q318 | | $0.42 | | $0.27 | | 12% | | $16.42 | | $0.30 | | 3.0% | | 3.1x |
| | | | | | | | | | | | | | | | |
| |
| (1) | REIT taxable income per share for 2019 is an estimate until we file our tax return. |
| |
| (2) | Economic return on book value is based on the periodic change in GAAP book value per common share plus dividends declared per common share during the period. |
| |
| (3) | See Table 7 in the Financial Tables section of this Redwood Review for details of how our recourse debt to equity leverage ratio is calculated. |
|
|
| |
| THE REDWOOD REVIEW I 3RD QUARTER 2019 |
| 3 |
|
|
| |
| S H A R E H O L D E R L E T T E R |
Dear Fellow Shareholders:
Two years ago, we announced a comprehensive new business strategy to leverage our housing credit competencies across a broader residential landscape. This entailed not only the expansion of our consumer mortgage business, but also a commitment to offering similar solutions for housing investors who purchase residential real estate for business income (i.e., rent or refurbishment). Over the course of the past 18 months, we've developed the skills and operations necessary to grow in this market, and have taken tangible steps towards building a best-in-class specialty finance platform that serves the liquidity needs of all homebuyers - homeowners and investors alike.
Our expansion into the business-purpose lending ("BPL") space began organically, but quickly evolved into a partnership with our 5 Arches team in Irvine. We were extremely fortunate to bring 5 Arches fully into the fold this year, and their business has fit squarely within Redwood's DNA. The investment opportunities we have seen through 5 Arches have validated the thesis underpinning our new strategy; that is, a significant imbalance exists between the rate of new household formation in the United States and the rate of new homebuilding. Earlier this month, we had the opportunity to further solidify business-purpose lending as a core strategy at Redwood, and we announced a second new partner - CoreVest.
CoreVest is an industry leading BPL originator with over $900 million of total assets, and brings an extremely talented team to Redwood that shares our values of working with integrity and fostering deep relationships with our customers and business partners. Since their inception in 2014, CoreVest has funded over $4 billion of loans while developing industry-leading technology that offers a seamless borrower experience. The platform has generated attractive returns to date, with its highly scalable mortgage banking business significantly contributing to the company's profitability. The firm also recently completed its ninth securitization of single-family rental loans since it began issuing in 2015, more such transactions than any other issuer. Pairing this channel with our own market-leading Sequoia program further expands our lead in the private-label securitization market. This transaction strengthens our position as a leading lender in a market whose size we estimate to be in excess of $100 billion.
While our BPL expansion has been a key area of focus, we continue to expand our core consumer residential business. We are committed to growing expanded credit and non-qualified residential mortgage (non-QM) loans by leveraging our approach to credit, speed to close, and reliable execution we deliver to our loan sellers. We see a tremendous opportunity for this business thanks to announcements made regarding impending changes to housing finance rules made by regulators over the course of this year. Most recently, the CFPB announced in late July that they intend to let the so called "QM Patch" expire. As we laid out in a presentation we published in May, the QM Patch is a regulatory-driven competitive advantage afforded to the public mortgage sector that resulted in an unlevel playing field for non-QM mortgage lending. We estimate the patch expiration will open the private sector to a market in upwards of $185 billion of non-QM loans produced annually by Fannie Mae and Freddie Mac. To contextualize this opportunity, we
|
|
| |
| THE REDWOOD REVIEW I 3RD QUARTER 2019 |
| 4 |
|
|
| |
| S H A R E H O L D E R L E T T E R |
purchased about $7 billion of loans in 2018, a successful and profitable year for our consumer mortgage banking business.
The CFPB's announcement in July included a notice of proposed rulemaking seeking information relating to the expiration of the QM Patch. In late August, we published a presentation on our perspective for potential changes focused on redefining Qualified Mortgages; improving pricing transparency at the GSEs; and refining certain rules that in our view, unnecessarily inhibit access to the public securitization markets. Our presentations can be viewed on the Newsroom section of our website at: http://www.redwoodtrust.com/Presentations.
The success of our operating businesses has been directly complimented by the great work done within our investment portfolio. The portfolio team continues to deploy capital at a record pace, leveraging unique and durable relationships forged over several years. A key differentiator for Redwood has always been our ability to source and structure investments our competitors cannot easily replicate. Our collective suite of businesses makes that truer than ever before, with over $670 million of capital deployed year-to-date, through October 29th, including our acquisition of the CoreVest investment portfolio. As we grow our mortgage banking platforms, our portfolio activities and efficiency of our corporate functions will be key to profitably scaling our consolidated platform and maximizing the growth of earnings per share.
As we reflect on the current state of our industry, the present marks an exciting time for Redwood. After years of fundraising, markets are awash in capital and credit-oriented strategies are in demand as the yield curve flattens and investors seek alternative means to source real estate-related assets. The product sourcing capabilities and operating know-how required to succeed, however, remain in scarce supply. At Redwood, we have built a solutions-based platform that possesses a unique ability to bridge the gap between the customized needs of non-agency borrowers - whether BPL, non-QM, or traditional jumbo and the liquidity options available to them in the marketplace. We are already making necessary investments in technology and infrastructure to further automate our loan purchase process in anticipation of these opportunities. Our 25-year track record speaks to our ability to operate efficiently, while developing nascent, emerging products into scalable funding solutions that are transformative in nature. With an eye towards integrating our consumer mortgage and BPL businesses over time across our national correspondent network, our vision of becoming the preeminent, and most profitable, specialty finance operator in the mortgage industry can be realized.
We are grateful to have your continued support.
|
| | |
| | |
| Christopher J. Abate | | Dashiell I. Robinson |
| Chief Executive Officer | | President |
|
|
| |
| THE REDWOOD REVIEW I 3RD QUARTER 2019 |
| 5 |
|
|
| |
| Q U A R T E R L Y O V E R V I E W |
Third Quarter Highlights
| |
| Ñ | During the third quarter, we issued $228 million of common stock and generated $248 million of capital through portfolio optimization, ending the quarter with approximately $590 million of available capital and reducing our recourse leverage ratio to 2.7x, below our historical target range of 3.0x - 4.0x. |
| |
| Ñ | Our portfolio optimization activities during the quarter included the sale of $262 million of lower yielding securities, which freed-up $118 million of capital, and the completion of a new $185 million, non-mark-to-market, 3-year term facility, collateralized by a portion of our retained Sequoia securities, which generated $130 million of capital, after repayment of existing financing. |
| |
| Ñ | We deployed $152 million of capital toward new investments in the third quarter of 2019, including $55 million into proprietary investments and $98 million into third-party investments (which included $73 million into subordinate re-performing loan (RPL) securities issued by Freddie Mac). On page 12, we provide a supplemental overview of our RPL investment strategy. |
| |
| Ñ | We purchased $1.5 billion of residential jumbo loans during the third quarter of 2019, including a record $0.7 billion of Choice loans, and sold $1.6 billion of loans, through a combination of whole loan sales and three Sequoia securitizations, including our 100th overall. At September 30, 2019, our pipeline of jumbo residential loans identified for purchase was $1.3 billion. |
| |
| Ñ | We originated $162 million of business purpose residential loans (BPLs) during the third quarter and at September 30, 2019, our total portfolio of BPLs was $336 million, including both single-family rental and residential bridge loans. On page 21, we provide additional detail on BPL activity at our 5 Arches subsidiary. |
| |
| Ñ | In September, we issued $201 million of 5.75% 6-year exchangeable debt, which is excluded from our available capital, and will replace our $201 million of exchangeable debt maturing in November 2019. |
| |
| Ñ | Following the end of the third quarter, we completed our acquisition of CoreVest, a leading nationwide originator and portfolio manager of business purpose residential loans. The acquisition included CoreVest's operating platform and $900 million of related financial assets. Total transaction consideration was $492 million, net of in-place financing on certain of the financial assets. |
|
|
| |
| THE REDWOOD REVIEW I 3RD QUARTER 2019 |
| 6 |
|
|
| |
| Q U A R T E R L Y O V E R V I E W |
Quarterly Earnings and Analysis
Below we present GAAP net income and non-GAAP core earnings for the third and second quarters of 2019.
|
| | | | | | | | |
| |
| GAAP Net Income |
| ($ in millions, except per share data) |
| | Three Months Ended | |
| | 9/30/2019 | | 6/30/2019 | |
| | | | | |
| Net interest income | $ | 34 |
| | $ | 32 |
| |
| | | | | |
| Non-interest income | | | | |
| Mortgage banking activities, net | 10 |
| | 19 |
| |
| Investment fair value changes, net | 11 |
| | 3 |
| |
| Other income, net | 2 |
| | 2 |
| |
| Realized gains, net | 5 |
| | 3 |
| |
| Total non-interest income, net | 27 |
| | 28 |
| |
| Operating expenses | (27 | ) | | (26 | ) | |
| Provision for income taxes | — |
| | (2 | ) | |
| | | | | |
| GAAP net income | $ | 34 |
| | $ | 31 |
| |
| | | | | |
| GAAP diluted earnings per common share | $ | 0.31 |
| | $ | 0.30 |
| |
| | | | | |
| |
Non-GAAP Core Earnings (1) |
| ($ in millions, except per share data) |
| | Three Months Ended | |
| | 9/30/2019 | | 6/30/2019 | |
| | | | | |
| GAAP net interest income | $ | 34 |
| | $ | 32 |
| |
| Change in basis and hedge interest | (3 | ) | | 1 |
| |
Non-GAAP economic net interest income (1) | 31 |
| | 34 |
| |
| | | | | |
| Non-interest income | | | | |
| Mortgage banking activities, net | 10 |
| | 19 |
| |
Core investment fair value changes, net (1) | — |
| | — |
| |
Core other income, net (1) | 4 |
| | 4 |
| |
Core realized gains, net (1) | 25 |
| | 16 |
| |
| Total non-interest income, net | 38 |
| | 40 |
| |
| Core operating expenses | (25 | ) | | (26 | ) | |
Core provision for income taxes (1) | — |
| | (4 | ) | |
| | | | | |
Core earnings (1) | $ | 43 |
| | $ | 43 |
| |
| | | | | |
Core diluted earnings per common share (2) | $ | 0.37 |
| | $ | 0.39 |
| |
| |
| (1) | During the third quarter of 2019, we updated our definition of core earnings and economic net interest income. Prior period amounts presented above have been conformed. Additional information on Redwood's non-GAAP measures, including: economic net interest income; core investment fair value changes, net; core other income, net; core realized gains, net; core provision for income taxes; and core earnings as well as reconciliations to associated GAAP measures, is included in the Non-GAAP Measurements section of the Appendix. |
| |
| (2) | Additional information on the calculation of non-GAAP core diluted EPS can be found in Table 2 in the Financial Tables section of this Redwood Review. |
|
|
| |
| THE REDWOOD REVIEW I 3RD QUARTER 2019 |
| 7 |
|
|
| |
| Q U A R T E R L Y O V E R V I E W |
Overview
During the third quarter of 2019, we accelerated our pace of portfolio optimization and raised equity capital in early September, which together generated $476 million of available capital. These activities resulted in increased levels of core realized gains, but dampened economic net interest income, as our average undeployed capital increased. While lower rates generally persisted throughout the quarter, helping maintain residential loan purchase volume levels in our mortgage banking business, we experienced higher prepayments in our investment portfolio, which further impacted economic net interest income. Additionally, mortgage banking margins were negatively impacted by the rally in rates, which impacted execution on securitizations we completed during the quarter. Execution improved for our most recent securitization, completed in October. Despite the rate volatility, overall we continued to see strong demand for yield, resulting in positive investment fair value changes for the quarter.
Line Item Review
| |
| Ñ | Net interest income increased from the second quarter of 2019, as the benefit from continued capital deployment during the third quarter was partially offset by capital inflows that resulted from increased portfolio optimization activities, including an increase in opportunistic asset sales and the addition of incremental term financing within our investment portfolio. |
| |
| Ñ | Non-GAAP economic net interest income declined from the second quarter of 2019, due to lower mortgage rates and strong prepayment activity. Faster prepayments helped to improve the fair value of our subordinate investments, but negatively impacted our portfolio investments held at a premium. |
| |
| Ñ | Mortgage banking activities decreased primarily due to lower gross margins in our residential mortgage banking business, on similar loan purchase volume as the second quarter. Gross margins were driven lower primarily due to the impact of rate volatility on securitizations we executed during the third quarter. |
| |
| Ñ | Investment fair value changes was positively impacted by tightening credit spreads in our securities portfolio during the third quarter, benefiting fair values to a greater extent than in the second quarter. Our non-GAAP core earnings excludes these market valuation adjustments. |
| |
| Ñ | Realized gains in the third quarter resulted from the sale of $262 million of securities. After the repayment of associated debt, the security sales freed up $118 million of capital for reinvestment. |
| |
| Ñ | GAAP operating expenses increased primarily due to $2 million of transaction costs incurred in relation to the acquisition of CoreVest. We exclude these expenses from our non-GAAP core operating expenses. |
| |
| Ñ | The provision for income tax declined during the third quarter due to lower residential mortgage banking income at our taxable subsidiary during the third quarter, as compared with the second quarter. A reconciliation of GAAP and taxable income is set forth in Table 6 in the Financial Tables section of this Redwood Review. |
| |
| Ñ | Additional details on our earnings are included in the Segment Results section. |
|
|
| |
| THE REDWOOD REVIEW I 3RD QUARTER 2019 |
| 8 |
|
|
| |
| Q U A R T E R L Y O V E R V I E W |
Book Value
|
| | | | | | | | |
| |
| Changes in GAAP Book Value per Share |
| ($ in per share) |
| | Three Months Ended | |
| | 9/30/2019 | | 6/30/2019 | |
| | | | | |
| Beginning book value per share | $ | 16.01 |
| | $ | 16.00 |
| |
| Earnings | 0.31 |
| | 0.30 |
| |
| Changes in unrealized gains on securities, net, from: | | | | |
| Realized gains recognized in earnings | (0.03 | ) | | (0.02 | ) | |
| Amortization income recognized in earnings | (0.01 | ) | | (0.02 | ) | |
| Mark-to-market adjustments, net | 0.06 |
| | 0.11 |
| |
| Total change in unrealized gains on securities, net | 0.02 |
| | 0.07 |
| |
| Dividends | (0.30 | ) | | (0.30 | ) | |
| Equity compensation, net | 0.02 |
| | 0.02 |
| |
| Changes in unrealized losses on derivatives hedging long-term debt | (0.11 | ) | | (0.10 | ) | |
| Other, net | (0.03 | ) | | 0.02 |
| |
| | | | | |
| Ending book value per share | $ | 15.92 |
| | $ | 16.01 |
| |
| |
Ñ | Our GAAP book value declined $0.09 per share to $15.92 per share during the third quarter of 2019. While GAAP earnings exceeded our third quarter dividend, book value decreased primarily due to an $0.11 per share decline in the value of derivatives hedging our long-term debt, which were impacted by the decline in benchmark interest rates during the third quarter. |
| |
| Ñ | Combining our third quarter dividend with our change in book value during the third quarter contributed to a positive economic return on book value(1) of 1.3% for the quarter. |
_____________________
| |
| (1) | Economic return on book value is based on the periodic change in GAAP book value per common share plus dividends declared per common share during the period. |
|
|
| |
| THE REDWOOD REVIEW I 3RD QUARTER 2019 |
| 9 |
|
|
| |
| Q U A R T E R L Y O V E R V I E W |
Capital Allocations
| |
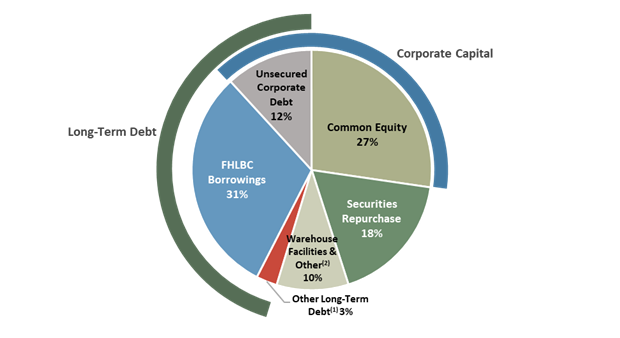
| Ñ | We capitalize our business with a combination of equity and long-term unsecured corporate debt (which we collectively refer to as corporate “capital”). Our total capital of $2.6 billion at September 30, 2019 was comprised of $1.8 billion of equity capital and $0.8 billion of convertible notes and other long-term unsecured debt. |
| |
| Ñ | We also utilize various forms of collateralized debt to finance certain investments and to warehouse our inventory of certain loans held-for-sale. We do not consider this collateralized debt as "capital" and, therefore, exclude it from our capital allocation analysis. |
| |
| Ñ | Collectively, over 73% of our total funding sources are corporate capital and other long-term secured debt. |
Funding Sources
(as of September 30, 2019)
| |
| Ñ | During the third quarter, capital raising combined with the completion of a new secured financing facility and portfolio optimization raised over $476 million of capital. This combined activity included $228 million of common equity raised in early September, a $185 million long-term, non-mark-to-market, 3-year-term secured debt facility collateralized by retained Sequoia residential securities (that generated $130 million of capital, after repayment of existing financing), and $118 million from security sales. |
| |
| Ñ | In late September, we issued $201 million of 5.75% 6-year exchangeable debt. This issuance will replace our exchangeable notes maturing in November of this year, and we therefore do not consider it incremental capital. |
_____________________
(1) Other long-term debt represents a non-mark-to-market secured-term facility.
(2) Other includes our exchangeable notes due in November 2019, which are classified as short-term.
|
|
| |
| THE REDWOOD REVIEW I 3RD QUARTER 2019 |
| 10 |
|
|
| |
| Q U A R T E R L Y O V E R V I E W |
|
| | | | | | | | | | | | | | | | | | |
| |
| Capital Allocation Detail |
| By Investment Type |
| September 30, 2019 |
| ($ in millions) |
| | GAAP Fair Value | | Collateralized Short-Term Debt | | Collateralized Long-Term Debt | | Allocated Capital | | % of Total Capital | |
| | | | | | | | | | | |
Residential loans (1) | $ | 2,420 |
| | $ | — |
| | $ | (1,945 | ) | | $ | 475 |
| | 19% | |
| Business purpose residential loans | 226 |
| | (139 | ) | | (14 | ) | | 72 |
| | 3% | |
| | | | | | | | | | | |
| Securities portfolio | | | | | | | | | | |
| Sequoia residential securities | 505 |
| | (155 | ) | | (185 | ) | | 166 |
| | 6% | |
| Agency CRT securities | 141 |
| | (8 | ) | | — |
| | 133 |
| | 5% | |
| Multifamily securities | 683 |
| | (517 | ) | | — |
| | 167 |
| | 7% | |
Re-performing residential loan securities (2) | 627 |
| | (315 | ) | | (41 | ) | | 270 |
| | 11% | |
| Other third-party residential securities | 254 |
| | (163 | ) | | — |
| | 91 |
| | 4% | |
Total securities portfolio (3) | 2,211 |
| | (1,158 | ) | | (226 | ) | | 827 |
| | 32% | |
| | | | | | | | | | | |
| Other investments | 201 |
| | — |
| | — |
| | 201 |
| | 8% | |
| Other assets/(liabilities) | | | | | | | (74 | ) | | (3)% | |
| Cash and liquidity capital | | | | | | | 868 |
| | N/A | |
| | | | | | | | | | | |
| Total Investments | $ | 5,057 |
| | $ | (1,297 | ) | | $ | (2,185 | ) | | $ | 2,370 |
| | 93% | |
| | | | | | | | | | | |
| Residential mortgage banking | | | | | | | 130 |
| | 5% | |
| Business purpose mortgage banking | | | | | | | 55 |
| | 2% | |
| | | | | | | | | | | |
| Total Mortgage banking | | | | | | | $ | 185 |
| | 7% | |
| | | | | | | | | | | |
| Total | | | | | | | $ | 2,554 |
| | 100% | |
| |
| (1) | Includes $43 million of FHLB stock, $34 million of cash and cash equivalents, and $77 million of restricted cash. |
| |
| (2) | Re-performing residential loan securities represent third-party securities collateralized by seasoned re-performing residential loans. |
| |
| (3) | In addition to our $1.3 billion of securities on our GAAP balance sheet, securities presented above also include $257 million, $454 million, and $214 million of securities retained from Sequoia Choice, Freddie Mac SLST, and Freddie Mac K-Series securitizations, respectively. For GAAP purposes, we consolidate these securitizations. |
| |
| Ñ | During the third quarter, we deployed capital into re-performing residential loan securities and business purpose residential loans, and reduced our capital allocations to Agency CRT securities, other third-party residential securities, and multifamily mezzanine securities. |
| |
| Ñ | Over the last several quarters, we have increased our allocation of capital to re-performing residential loan securities. The following section provides a summary of this investment opportunity. |
| |
| Ñ | At September 30, 2019, our cash and liquidity capital included $590 million of available capital. |
| |
| Ñ | In October 2019, we completed the acquisition of CoreVest for $492 million, net of in-place financing on financial assets acquired, with a mix of cash on hand and shares of Redwood stock. |
|
|
| |
| THE REDWOOD REVIEW I 3RD QUARTER 2019 |
| 11 |
|
|
| |
| Q U A R T E R L Y O V E R V I E W |
Overview of Re-Performing Loan Securities Investments
Since late 2016, we have deployed $270 million of capital into primarily Freddie Mac-issued securitizations backed by seasoned, re-performing and, to a lesser extent, non-performing single-family mortgage loans (RPLs). In most cases, these loans have experienced a credit event leading up to the securitization and have been modified in order to keep the borrower in their home and current in their payments under recast loan terms. Freddie Mac transfers credit risk by selling the subordinate securities and keeping or guaranteeing the senior tranches.
The majority of our deployed capital in this asset class is invested in a securitization structure in which we own 100% of the subordinate securities and that is consolidated on our balance sheet. The senior securities in the structure represent term financing for our investment in the underlying loans and carry a low interest rate for up to 10 years. Our estimated base case returns on our securities - which represent more than 20% of the transaction capital structure - range between 10-13% on a loss-adjusted basis, inclusive of the effects of leverage applied to the mezzanine tranches.
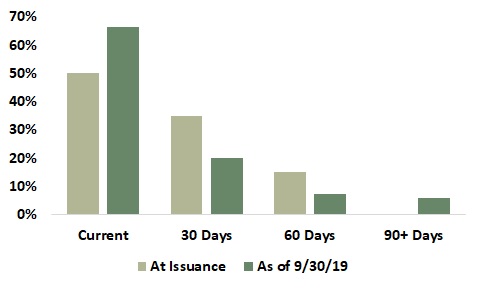
Central to the investment thesis in these securities is the view that a significant percentage of the underlying borrowers will improve upon their delinquency history and continue paying steadily under the modified or recast terms of the loan. This improvement in performance can sometimes be linked to the assumption of servicing duties by a more “high-touch” servicer that specializes in working with borrowers to keep them current in their payments. The performance of the first consolidated RPL transaction we invested in continues to trend favorably as delinquencies have declined from 50% to 33% in less than one year. The chart below details the trends in payment status for this transaction, which we invested in during December 2018. To date, the transaction has had 0.01% in realized losses, and 5% of the original principal balance has prepaid in full.
2018 Consolidated RPL Transaction
|
|
| |
| THE REDWOOD REVIEW I 3RD QUARTER 2019 |
| 12 |
|
|
| |
| Q U A R T E R L Y O V E R V I E W |
The following table details our RPL securities by asset type as of September 30, 2019.
|
| | | | | | | | | | | | | | | | |
| |
| Re-Performing Residential Loan Securities by Type |
| September 30, 2019 |
| ($ in millions) |
| | GAAP Fair Value | | Collateralized Short-Term Debt | | Collateralized Long-Term Debt | | Allocated Capital | |
| | | | | | | | | |
| Consolidated RPL securities | | | | | | | | |
| Subordinate | $ | 454 |
| | $ | (289 | ) | | $ | — |
| | $ | 165 |
| |
| | | | | | | | | |
| Other RPL securities | | | | | | | | |
| Senior / IO | 70 |
| | — |
| | (41 | ) | | 29 |
| |
| Subordinate | 103 |
| | (26 | ) | | — |
| | 76 |
| |
| Total other RPL securities | 173 |
| | (26 | ) | | (41 | ) | | 105 |
| |
| | | | | | | | | |
| Total Re-Performing Residential Loan Securities | $ | 627 |
| | $ | (315 | ) | | $ | (41 | ) | | $ | 270 |
| |
|
|
| |
| THE REDWOOD REVIEW I 3RD QUARTER 2019 |
| 13 |
|
|
| |
| Q U A R T E R L Y O V E R V I E W |
2019 Updated Financial Outlook(1)
We currently anticipate our full year results will be towards the higher end, overall, of the original range we provided in our fourth quarter 2018 Redwood Review.
For the remainder of 2019, we will continue to focus on key strategic initiatives to increase sustainable earnings - namely integrating the CoreVest operating platform, improving investment returns through portfolio optimization, implementing operational efficiencies to maintain strong returns on equity for our residential mortgage banking platform, and disciplined cost management to unlock operating leverage as we scale our business.
While we do not anticipate the CoreVest acquisition to meaningfully impact our 2019 expected range of returns on equity, we do expect a slight impact to the capital allocation expectations we set at the beginning of the year. Additionally, as a result of the acquisition, we expect our leverage ratio to increase toward the higher end of our historical 3.0x - 4.0x target range.
The following are additional details on our expected activity in 2019:
For our investment portfolio
| |
| Ñ | Our investment portfolio returns through the first nine months of 2019, were near the high end of the 11-13% return on equity range previously provided, benefiting from higher gains associated with increased portfolio optimization activity. For the remainder of 2019, we expect economic net interest income to increase and core realized gains to moderate, keeping expected returns for this portfolio for the full year towards the higher end of our original range of 11-13%. With the acquisition of CoreVest, we expect to allocate approximately 85% of our capital to our investment portfolio for the remainder of 2019. |
| |
| Ñ | Investment returns include an estimate of portfolio economic net interest income, interest expense on corporate debt capital, core realized gains, direct operating expenses, and taxes. |
____________________
| |
| (1) | As with all forward-looking statements, our forward-looking statements relating to our 2019 financial outlook are subject to risks and uncertainties, including, among other things, those described in our Annual Report on Form 10-K under the caption “Risk Factors” and other risks, uncertainties, and factors that could cause actual results to differ materially from those described above and under the heading "Forward-Looking Statements" in the Appendix to this Redwood Review, including those described in the “Forward-Looking Statements” at the beginning of this Redwood Review. Although we may update our 2019 financial outlook subsequently in 2019, as a general matter we undertake no obligation to update or revise forward-looking statements, whether as a result of new information, future events, or otherwise. |
|
|
| |
| THE REDWOOD REVIEW I 3RD QUARTER 2019 |
| 14 |
|
|
| |
| Q U A R T E R L Y O V E R V I E W |
For our residential mortgage banking platform
| |
| Ñ | Our residential mortgage banking platform had strong performance through the first nine months of 2019, generating a return on equity in excess of our originally projected range of mid to high teens. The outperformance was driven by gross margins above our long-term expectations of 75-100 basis points and strong volume growth. For the remainder of 2019, we expect gross margins to be within our long-term expected range and volume to remain stable, supporting full year results that we expect to be above our previously disclosed return range. We expect to maintain our current 5% allocation of capital to this platform for the remainder of 2019. |
| |
| Ñ | Mortgage banking returns include an estimate of loan purchase volume, gross margins, direct operating expenses, and taxes. |
For our business purpose mortgage banking platform
| |
| Ñ | In May, subsequent to the acquisition of 5 Arches, we estimated we would allocate 3-4% of our capital to our business purpose mortgage banking platform for the remainder of 2019 and generate a return on equity in the low double digits. |
| |
| Ñ | Inclusive of both CoreVest's origination platform and 5 Arches, we expect to allocate approximately 10% of our capital to our business purpose mortgage banking platform for the remainder of 2019. This includes the platform premiums for both businesses and the working capital required to fund single-family rental loans in inventory. For the remainder of 2019, we expect to generate an overall return on equity from the platforms of 12-14%, bringing full-year results slightly below our previously disclosed return range. |
| |
| Ñ | Additionally, we expect both of these businesses to provide new accretive business purpose loans and securities for our investment portfolio, the anticipated returns on which are included in our investment portfolio outlook. |
| |
| Ñ | Expected returns include an estimate of mortgage banking income (including origination points and fees), other income, direct operating expenses, and taxes. Return expectations exclude the amortization of purchase-related intangibles and other items, consistent with what we exclude for core earnings. |
For our corporate overhead
| |
| Ñ | We continue to expect our baseline corporate operating expenses to be between $48 million and $50 million, exclusive of any CoreVest acquisition-related expenses, with variable compensation commensurate with company performance. |
|
|
| |
| THE REDWOOD REVIEW I 3RD QUARTER 2019 |
| 15 |
|
|
| |
| Q U A R T E R L Y O V E R V I E W |
Analysis and Outlook for Economic Net Interest Income
| |
| Ñ | Over the past several quarters, as demand for residential mortgage credit has continued to strengthen and drive prices higher, we have taken advantage of the opportunity to rotate out of portfolio investments whose forward return profile fell below our long-term targets. Year-to-date through the third quarter of 2019, we have sold over $500 million of securities and freed-up approximately $230 million of capital through portfolio optimization, locking in $53 million in core realized gains. These activities have benefited our GAAP and core results, but have impacted economic net interest income (ENII) as we have been selective in redeploying capital due to the overall credit spread environment. ENII is also impacted by hedging costs and premium amortization, and as such has been affected by the sharp rally in rates and overall heightened interest rate volatility we have observed since early in the second quarter of 2019. |
| |
| Ñ | With substantial portfolio optimization and the CoreVest acquisition complete, our investment portfolio has meaningfully increased sustainable earnings potential and we expect ENII to begin growing in the fourth quarter of 2019 and into 2020. We anticipate the key drivers towards this increase will be: |
| |
| Ñ | the investments acquired as part of the CoreVest acquisition; |
| |
| Ñ | a full quarter of income from our most recent investment in RPL securities issued by Freddie Mac; |
| |
| Ñ | improved returns on SFR loans originated by 5 Arches that we expect to be financed with long-term FHLB debt; and |
| |
| Ñ | incremental interest income from higher-returning BPL investments created by our newly expanded BPL origination platform |
|
|
| |
| THE REDWOOD REVIEW I 3RD QUARTER 2019 |
| 16 |
|
|
| |
| Q U A R T E R L Y O V E R V I E W |
Segment Results
Investment Portfolio
The following table presents segment contribution from our investment portfolio for the third and second quarters of 2019.
|
| | | | | | | | |
| |
| Investment Portfolio Segment Contribution |
| ($ in millions) |
| | Three Months Ended | |
| | 9/30/2019 | | 6/30/2019 | |
| | | | | |
| GAAP net interest income | $ | 38 |
| | $ | 38 |
| |
| Change in basis and hedge interest | (3 | ) | | 1 |
| |
Non-GAAP economic net interest income (1) | 36 |
| | 39 |
| |
| | | | | |
Non-GAAP other fair value changes, net (2) | 15 |
| | 2 |
| |
| Other income, net | 2 |
| | 3 |
| |
| Realized gains, net | 5 |
| | 3 |
| |
| Operating expenses | (2 | ) | | (2 | ) | |
| Provision for income taxes | — |
| | (1 | ) | |
Segment contribution (3) | $ | 55 |
| | $ | 44 |
| |
Core earnings adjustments (4) | | | | |
Eliminate non-GAAP other fair value changes, net (2) | (15 | ) | | (2 | ) | |
| Include cumulative gain on long-term investments sold, net | 20 |
| | 13 |
| |
| Income taxes associated with core earnings adjustments | — |
| | (1 | ) | |
| Non-GAAP core segment contribution | $ | 60 |
| | $ | 54 |
| |
| |
| (1) | During the third quarter of 2019, we updated our definition of non-GAAP economic net interest income. Consistent with management's definition of non-GAAP economic net interest income set forth in the Non-GAAP Measurements section of the Appendix, this measure, as presented above, is calculated in the same manner, inclusive only of amounts allocable to this segment. |
| |
| (2) | Non-GAAP other fair value changes, net, represents GAAP investment fair value changes adjusted to exclude the change in basis and hedge interest that is presented in the table above and included in non-GAAP economic net interest income. |
| |
| (3) | Segment contribution totals above are presented in accordance with GAAP. Within the table, "Change in basis and hedge interest" has been reallocated between investment fair value changes and net interest income as described above. |
| |
| (4) | During the third quarter of 2019, we updated our definition of core earnings. Consistent with management's definition of core earnings set forth on page 41, non-GAAP core segment contribution reflects GAAP segment contribution adjusted to reflect the portion of core earnings adjustments allocable to this segment. |
| |
| Ñ | Segment contribution from our investment portfolio improved during the third quarter, as we experienced a benefit to investment fair value changes from spread tightening and higher realized gains from sales of available-for-sale securities, offset by increased hedging costs from interest rate volatility and higher levels of prepayments on loans and securities held at premiums. |
|
|
| |
| THE REDWOOD REVIEW I 3RD QUARTER 2019 |
| 17 |
|
|
| |
| Q U A R T E R L Y O V E R V I E W |
| |
| Ñ | Core segment contribution improved during the third quarter, driven by an increase in gain on sale of long-term investments from portfolio optimization activities. |
| |
| Ñ | We deployed $152 million of capital in the third quarter, including $55 million into proprietary investments and $98 million into third-party investments. Proprietary investments included $21 million of business purpose loans originated by 5 Arches, $21 million into Sequoia RMBS, and $12 million into a home equity shared appreciation investment. Third-party investments included $73 million of Freddie Mac subordinate re-performing loan securities, $16 million of Agency CRT securities, a $5 million multifamily mezzanine loan, $3 million of Agency multifamily securities, and $1 million of third-party securities. |
| |
| Ñ | During the third quarter, we sold $262 million of lower yielding securities, which freed up approximately $118 million of capital for redeployment. Additionally, we completed a 3-year secured, non-mark-to-market term securities repurchase facility that generated approximately $130 million of capital for redeployment (after repayment of existing financing), while effectively enhancing the yield on the portfolio. |
| |
| Ñ | Credit fundamentals in our investment portfolio remain strong, benefiting from continued stability in the general economy and in housing. |
|
|
| |
| THE REDWOOD REVIEW I 3RD QUARTER 2019 |
| 18 |
|
|
| |
| Q U A R T E R L Y O V E R V I E W |
Mortgage Banking
|
| | | | | | | | |
| |
| Mortgage Banking Segment Contribution |
| ($ in millions) |
| | Three Months Ended | |
| | 9/30/2019 | | 6/30/2019 | |
| | | | | |
| Residential Mortgage Banking | | | | |
| Net interest income | $ | 5 |
| | $ | 4 |
| |
| Mortgage banking activities, net | 5 |
| | 15 |
| |
| Mortgage banking income | 10 |
| | 20 |
| �� |
| | | | | |
| Other income, net | — |
| | — |
| |
| Operating expenses | (6 | ) | | (6 | ) | |
| Provision for income taxes | — |
| | (1 | ) | |
| Residential mortgage banking segment contribution | $ | 5 |
| | $ | 13 |
| |
| | | | | |
| Business Purpose Mortgage Banking | | | | |
| Net interest income | $ | 1 |
| | $ | — |
| |
| Mortgage banking activities, net | 4 |
| | 4 |
| |
| Mortgage banking income | 5 |
| | 4 |
| |
| | | | | |
| Other income, net | | | | |
| Loan administration fees and other | 2 |
| | 2 |
| |
| Amortization of intangible asset expense | (2 | ) | | (2 | ) | |
| Operating expenses | (6 | ) | | (6 | ) | |
| Provision for income taxes | — |
| | — |
| |
| Business purpose mortgage banking segment contribution | $ | (1 | ) | | $ | (2 | ) | |
| | | | | |
| Mortgage banking segment contribution | $ | 3 |
| | $ | 11 |
| |
| | | | | |
Core earnings adjustments (1) | 2 |
| | 2 |
| |
Non-GAAP core segment contribution (2) | $ | 5 |
| | $ | 12 |
| |
| Jumbo loan purchase commitments | $ | 1,700 |
| | $ | 1,695 |
| |
| |
| (1) | Includes amounts to eliminate purchase accounting adjustments and income tax adjustments of $0.4 million for both the third and second quarters of 2019, related to our business purpose mortgage banking operations. |
| |
| (2) | Consistent with management's definition of core earnings set forth on page 41, non-GAAP core segment contribution reflects GAAP segment contribution adjusted to reflect the portion of core earnings adjustments allocable to this segment. |
|
|
| |
| THE REDWOOD REVIEW I 3RD QUARTER 2019 |
| 19 |
|
|
| |
| Q U A R T E R L Y O V E R V I E W |
Residential Mortgage Banking
| |
| Ñ | Segment contribution from our residential mortgage banking operations decreased to $5 million in the third quarter from $13 million in the second quarter, due to lower gross margins on stable volume of purchase commitments. We define gross margins for this segment as mortgage banking income divided by loan purchase commitments. |
| |
| Ñ | Rate volatility during the quarter negatively impacted margins as the sharp decline in rates impacted execution on our mortgage loan pipeline. Toward the end of the quarter, volatility decreased and we saw pricing and margins improve. |
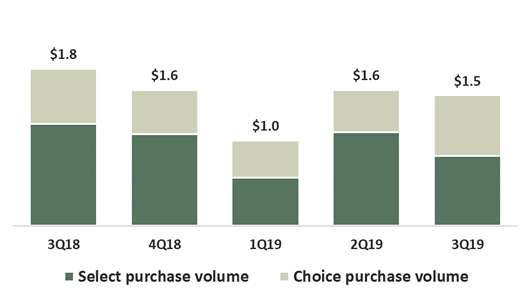
Quarterly Jumbo Loan Purchase Volume
($ in billions)
| |
| Ñ | The continued lower interest rate environment helped keep mortgage purchase volumes elevated, and we saw a 37% increase in Choice purchase volume, representing record quarterly volume for this loan type. At September 30, 2019, our pipeline of jumbo residential loans identified for purchase was $1.3 billion. |
| |
| Ñ | During the third quarter, we completed one Select securitization of $376 million and two Choice securitizations totaling $727 million. Additionally, we sold $470 million of whole loans to third parties. |
Business Purpose Mortgage Banking
| |
| Ñ | Non-GAAP core segment contribution from our business purpose mortgage banking operations was $0.2 million for the third quarter. |
| |
| Ñ | During the third quarter of 2019, we originated $162 million of loans and associated funding commitments, including $126 million of residential bridge loans and $36 million of single-family rental loans. Loan fundings during this period totaled $127 million, including $91 million of residential bridge loans and $36 million of single-family rental loans. |
|
|
| |
| THE REDWOOD REVIEW I 3RD QUARTER 2019 |
| 20 |
|
|
| |
| Q U A R T E R L Y O V E R V I E W |
Update on Contribution from 5 Arches
| |
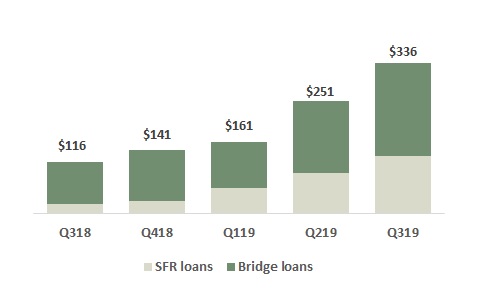
| Ñ | The third quarter of 2019 represented our second full quarter of ownership of the 5 Arches platform, following our initial 20% investment in the platform in May 2018 and our full acquisition of the company in March 2019. We currently retain the majority of the single-family rental and bridge loans originated by 5 Arches, and at September 30, 2019, our portfolio of these assets totaled $336 million. Since the end of the third quarter, 5 Arches has originated an additional $140 million of business purpose loans (through October 28th), all of which we have retained on our balance-sheet. |
Cumulative Business Purpose Loans on Balance Sheet
($ in millions)
| |
| Ñ | Since our initial minority investment in 5 Arches and through September 30, 2019, we have deployed $68 million of capital into $207 million of bridge loans created by 5 Arches, which have generated core returns on capital of approximately 11% for our investment portfolio. Optimizing this capital for our currently available financing terms, we estimate levered returns to increase to 12-15%. |
| |
| Ñ | Additionally, during the third quarter we began financing 5 Arches originated SFR loans using our FHLB financing facility and as of September 30, 2019, we had $17 million of these loans financed with FHLB borrowings. Going forward, we anticipate transferring the majority of our remaining 5 Arches-originated SFR loans to our investment portfolio and financing them at the FHLB with an estimated core return on capital of 11-12%. |
| |
| Ñ | Total operating revenue in the third quarter of 2019 from 5 Arches origination and asset management activities rose 16% from the prior quarter, versus a 6% increase in operating expenses. |
|
|
| |
| THE REDWOOD REVIEW I 3RD QUARTER 2019 |
| 21 |
|
|
| |
| Q U A R T E R L Y O V E R V I E W |
Balance Sheet Analysis
The following table presents our consolidated balance sheets at September 30, 2019 and June 30, 2019.
|
| | | | | | | | |
| |
Consolidated Balance Sheets (1) |
| ($ in millions) |
| | 9/30/2019 | | 6/30/2019 | |
| | | | | |
| Residential loans | $ | 8,682 |
| | $ | 7,283 |
| |
| Business purpose residential loans | 336 |
| | 251 |
| |
| Multifamily loans | 3,792 |
| | 3,750 |
| |
| Real estate securities | 1,285 |
| | 1,477 |
| |
| Other investments | 348 |
| | 372 |
| |
| Cash and cash equivalents | 395 |
| | 218 |
| |
| Other assets | 639 |
| | 500 |
| |
| | | | | |
| Total assets | $ | 15,476 |
| | $ | 13,852 |
| |
| | | | | |
| Short-term debt | | | | |
| Mortgage loan warehouse facilities | $ | 233 |
| | $ | 638 |
| |
| Business purpose mortgage loan warehouse facilities | 198 |
| | 174 |
| |
| Security repurchase facilities | 1,158 |
| | 1,214 |
| |
| Servicer advance financing | 191 |
| | 236 |
| |
| Convertible notes, net | 201 |
| | 200 |
| |
| Other liabilities | 410 |
| | 340 |
| |
| Asset-backed securities issued | | | | |
| Residential | 4,768 |
| | 3,370 |
| |
| Multifamily | 3,578 |
| | 3,543 |
| |
| Long-term debt, net | 2,954 |
| | 2,573 |
| |
| Total liabilities | 13,691 |
| | 12,288 |
| |
| | | | | |
| Stockholders’ equity | 1,785 |
| | 1,564 |
| |
| | | | | |
| Total liabilities and equity | $ | 15,476 |
| | $ | 13,852 |
| |
| |
| (1) | Our consolidated balance sheets include assets of consolidated variable interest entities (“VIEs”) that can only be used to settle obligations of these VIEs and liabilities of consolidated VIEs for which creditors do not have recourse to the primary beneficiary (Redwood Trust, Inc.). At September 30, 2019 and June 30, 2019, assets of consolidated VIEs totaled $9.6 billion and $7.9 billion, respectively, and liabilities of consolidated VIEs totaled $8.6 billion and $7.2 billion, respectively. See Table 10 in the Financial Tables section of this Redwood Review for additional detail on consolidated VIEs. |
| |
| Ñ | We have invested in several securitizations that we were required to consolidate under GAAP. See Table 9 in the Financial Tables section of this Redwood Review for additional information on these securitizations and other entities that we consolidate. |
|
|
| |
| THE REDWOOD REVIEW I 3RD QUARTER 2019 |
| 22 |
|
|
| |
| Q U A R T E R L Y O V E R V I E W |
Residential Loan Investments
| |
| Ñ | At September 30, 2019, we had $2.3 billion of residential loans held-for-investment. These loans are prime-quality, first lien jumbo loans, most of which were originated between 2013 and 2019. At September 30, 2019, 88% of these loans were fixed rate and the remainder were hybrid, and in aggregate, had a weighted average coupon of 4.16%. |
| |
| Ñ | At September 30, 2019, the weighted average FICO score of borrowers backing these loans was 768 (at origination) and the weighted average loan-to-value ("LTV") ratio of these loans was 66% (at origination). At September 30, 2019, 0.03% of these loans (by unpaid principal balance) were more than 90 days delinquent. |
| |
| Ñ | We finance our residential loan investments with $1.9 billion of variable-rate FHLB debt through our FHLB-member subsidiary. In connection with these borrowings, our FHLB-member subsidiary is required to hold $43 million of FHLB stock. |
| |
| Ñ | We seek to minimize the interest rate risk in this portfolio by using a combination of swaps, TBAs, and other derivative instruments. |
Business Purpose Residential Loan Investments
| |
| Ñ | At September 30, 2019, our $226 million of business purpose residential loans held-for-investment were comprised of $207 million of short-term, residential bridge loans, which were originated in 2018 and 2019, and $19 million of single-family rental loans, which were financed with variable-rate FHLB debt through our FHLB-member subsidiary. |
| |
| Ñ | At September 30, 2019, the residential bridge portfolio contained 392 loans with a weighted average coupon of 8.90% and a weighted average LTV ratio of 70% (at origination). At September 30, 2019, nine of these loans with a cumulative unpaid principal balance and fair value of $6 million were more than 90 days delinquent or in foreclosure. These delinquent loans had a weighted average LTV ratio of 79% (at origination), and we currently expect to recover the full carrying amount of these loans. Since September 30, 2019, two of these loans with a cumulative unpaid principal balance and fair value of $1 million were resolved with full repayment of principal, regular interest and expenses. |
| |
| Ñ | We finance our residential bridge loan investments with warehouse debt that had a balance of $139 million at September 30, 2019. |
| |
| Ñ | At September 30, 2019, our business purpose residential warehouse capacity for financing residential bridge loans totaled $330 million across four separate counterparties. |
|
|
| |
| THE REDWOOD REVIEW I 3RD QUARTER 2019 |
| 23 |
|
|
| |
| Q U A R T E R L Y O V E R V I E W |
Securities Portfolio
The following table presents the fair value of our real estate securities at September 30, 2019.
|
| | | | | | | | | | | | | | | | | | | | | | | |
| |
| Securities Portfolio - By Source and Security Type |
| September 30, 2019 |
| ($ in millions) |
| | Interest-Only Securities | | Senior | | Mezzanine | | Subordinate | | Total | | % of Total Securities | |
| | | | | | | | | | | | | |
Sequoia (1) | $ | 55 |
| | $ | — |
| | $ | 251 |
| | $ | 200 |
| | $ | 505 |
| | 23 | % | |
Re-performing (2) | 29 |
| | 41 |
| | 416 |
| | 140 |
| | 627 |
| | 28 | % | |
| Agency CRT | — |
| | — |
| | — |
| | 141 |
| | 141 |
| | 6 | % | |
| Other third-party | — |
| | 84 |
| | 89 |
| | 81 |
| | 254 |
| | 12 | % | |
| | | | | | | | | | | | | |
| Total residential securities | $ | 84 |
| | $ | 125 |
| | $ | 756 |
| | $ | 562 |
| | $ | 1,527 |
| | 69 | % | |
| | | | | | | | | | | | | |
Multifamily securities (3) | — |
| | — |
| | 494 |
| | 190 |
| | 683 |
| | 31 | % | |
| Total securities portfolio | $ | 84 |
| | $ | 125 |
| | $ | 1,249 |
| | $ | 752 |
| | $ | 2,211 |
| | 100 | % | |
| |
| (1) | Presents securities retained from our Sequoia securitizations that were issued from 2012 through 2019. These securities included $13 million of interest-only securities, $181 million of mezzanine securities, and $63 million of subordinate securities retained from our Sequoia Choice securitizations, which were consolidated for GAAP purposes. |
| |
| (2) | Re-performing securities included $454 million of mezzanine and subordinate securities issued from Agency residential securitizations that are consolidated for GAAP purposes. |
| |
| (3) | Multifamily securities included $24 million of mezzanine securities and $190 million of subordinate securities issued from Agency multifamily securitizations that are consolidated for GAAP purposes. |
At September 30, 2019, our securities consisted of fixed-rate assets (90%), adjustable-rate assets (7%), hybrid assets that reset within the next year (2%), and hybrid assets that reset between 12 and 36 months (1%). For the portions of our securities portfolio that are sensitive to changes in interest rates, we seek to minimize this interest rate risk by using various derivative instruments.
We finance our holdings of real estate securities with a combination of capital and collateralized debt in the form of repurchase (or “repo”) financing and long-term debt. At September 30, 2019, we had short-term debt incurred through repurchase facilities totaling $1.2 billion with nine separate counterparties, which was secured by $1.4 billion of real estate securities. Additionally, we had long-term debt incurred through FHLB borrowings and secured term facilities totaling $226 million which was secured by $294 million of securities. The remaining $474 million of securities were financed with capital.
|
|
| |
| THE REDWOOD REVIEW I 3RD QUARTER 2019 |
| 24 |
|
|
| |
| Q U A R T E R L Y O V E R V I E W |
The following table presents the fair value of our real estate securities that are financed with repurchase debt, at September 30, 2019.
|
| | | | | | | | | | | | | | | | | | | |
| |
| Real Estate Securities Financed with Repurchase Debt |
| September 30, 2019 |
| ($ in millions, except weighted average price) |
| | Real Estate Securities (3) | | Repurchase Debt | | Allocated Capital | | Weighted Average Price (1) | | Financing Haircut (2) | |
| | | | | | | | | | | |
| Residential securities | | | | | | | | | | |
| Senior | $ | 84 |
| | $ | (77 | ) | | $ | 7 |
| | $ | 101 |
| | 8 | % | |
| Mezzanine | 289 |
| | (249 | ) | | 40 |
| | 104 |
| | 14 | % | |
| Re-performing | 416 |
| | (315 | ) | | 101 |
| | 91 |
| | 24 | % | |
| Total residential securities | 789 |
| | (641 | ) | | 148 |
| | | | | |
| Multifamily securities | 653 |
| | (517 | ) | | 137 |
| | 88 |
| | 21 | % | |
| | | | | | | | | | | |
| Total | $ | 1,443 |
| | $ | (1,158 | ) | | $ | 285 |
| | $ | 93 |
| | 20 | % | |
| |
| (1) | GAAP fair value per $100 of principal. |
| |
| (2) | Allocated capital divided by GAAP fair value. |
| |
| (3) | Includes $113 million, $385 million, and $209 million of securities we owned that were issued by consolidated Sequoia Choice, Freddie Mac SLST, and Freddie Mac K-Series securitizations, respectively. |
| |
| Ñ | In addition to the allocated capital listed in the table above that directly supports our repurchase facilities (i.e., “the haircut”), we continue to hold a designated amount of supplemental risk capital available for potential margin calls or future obligations relating to these facilities. |
| |
| Ñ | Additional information on the residential securities we own is set forth in Table 9 in the Financial Tables section of this Redwood Review. |
Other Investments
| |
| Ñ | At September 30, 2019, our other investments were primarily comprised of $238 million of servicer advance investments and associated excess servicing ($75 million of capital invested, net of non-recourse securitization debt collateralized by servicing-related assets), $40 million of MSRs retained from our Sequoia securitizations, $17 million of other excess servicing investments, and a $32 million investment in a light-renovation multifamily loan fund. |
|
|
| |
| THE REDWOOD REVIEW I 3RD QUARTER 2019 |
| 25 |
|
|
| |
| F I N A N C I A L I N S I G H T S |
Residential Loans Held-for-Sale
| |
| Ñ | At September 30, 2019, we had $926 million of residential mortgages held-for-sale financed with $233 million of warehouse debt. These loans included $647 million of Select loans and $279 million of expanded-prime Choice loans. |
| |
| Ñ | Our residential warehouse capacity at September 30, 2019 totaled $1.4 billion across four separate counterparties. |
| |
| Ñ | At September 30, 2019, our pipeline of jumbo residential loans identified for purchase was $1.3 billion. |
| |
| Ñ | We seek to minimize the exposure we have to interest rates on our loan pipeline (for loans both on balance sheet and identified for purchase) by using a combination of TBAs, interest rate swaps, and other derivative instruments. |
| |
| Ñ | At September 30, 2019, we had 482 loan sellers, which included 184 jumbo sellers and 298 MPF Direct sellers from various FHLB districts. |
Business Purpose Residential Loans Held-for-Sale
| |
| Ñ | At September 30, 2019, we had $110 million of single-family rental loans held-for-sale that were financed with $59 million of short-term warehouse debt. Going forward, we anticipate transferring the majority of our 5 Arches originated SFR loans to our investment portfolio and financing them at the FHLB. |
| |
| Ñ | At September 30, 2019, the weighted average coupon on these loans was 5.35% and the LTV ratio was 68% (at origination). |
| |
| Ñ | At September 30, 2019, our business purpose residential warehouse capacity for financing single-family rental loans totaled $400 million across two separate counterparties. |
| |
| Ñ | We seek to minimize the exposure we have to interest rates on our business purpose loan pipeline by using interest rate swaps and other derivative instruments. |
|
|
| |
| THE REDWOOD REVIEW I 3RD QUARTER 2019 |
| 26 |
|
|
| |
| Q U A R T E R L Y O V E R V I E W |
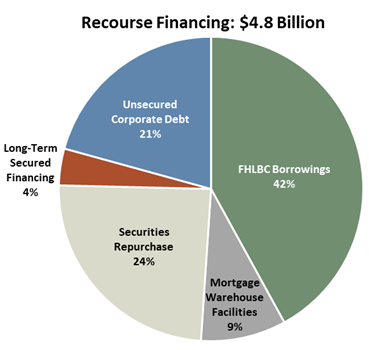
Recourse Financing
We finance our business with a diversified mix of long-term and short-term recourse debt. The following charts present the composition of our recourse debt and its characteristics at the end of the third quarter of 2019:
|
| | | |
| |
| Borrowing Type | Average Cost of Funds | Average Remaining Term (yrs.) |
| | | |
| FHLBC Borrowings | 2.5% | 6 |
| Unsecured Corporate Debt | 6.1% | 6 |
| Long-Term Secured Financing | 4.3% | 3 |
| Mortgage Warehouse | 4.2% | <1 |
| Securities Repurchase | 3.4% | <1 |
| | | |
| Weighted Average Cost of Funds | 3.7% | |
| | | |
| |
| Ñ | Our unsecured corporate debt is comprised of $201 million of 5.75% exchangeable notes due in 2025, $200 million of 5.625% convertible notes due in 2024, $245 million of 4.75% convertible notes due in 2023, $201 million of 5.625% exchangeable notes due in 2019, and $140 million of trust-preferred securities due in 2037 (that we hedge to yield approximately 6.9%). |
| |
| Ñ | Proceeds from the issuance of our new exchangeable notes in September were used to pay down mortgage warehouse debt and we expect the balance of these borrowings to increase when we repay our exchangeable notes maturing in November 2019. |
| |
| Ñ | Our recourse debt to equity leverage ratio(1) decreased to 2.7x at the end of the third quarter from 3.1x at the end of the second quarter, primarily resulting from the issuance of $228 million of equity capital during the third quarter. As a result of the CoreVest acquisition, we expect our leverage ratio to increase toward the higher-end of our historical 3.0x - 4.0x target range. |
| |
| Ñ | In addition to our recourse financing, we have non-recourse ABS debt issued by securitization entities and other non-recourse short-term securitization debt that we consolidate. |
_____________________
| |
| (1) | See Table 7 in the Financial Tables section of this Redwood Review for details of how our recourse debt to equity leverage ratio is calculated. |
|
|
| |
| THE REDWOOD REVIEW I 3RD QUARTER 2019 |
| 27 |
|
|
| |
| THE REDWOOD REVIEW I 3RD QUARTER 2019 |
| 28 |
|
| | | | | | | | | | | | | | | | | | | | | | | | | | | | | | | | | | | | | | | | | | | | | | |
| Table 1: GAAP Earnings (in thousands, except per share data) | |
| | | | | | | | | | | | | | | | | | | | | | | | | |
| | | 2019 Q3 | | 2019
Q2 | | 2019
Q1 | | 2018
Q4 | | 2018
Q3 | | 2018
Q2 | | 2018 Q1 | | 2017
Q4 | | 2017
Q3 | | | Nine Months 2019 | | Nine Months 2018 | |
| Interest income | $ | 148,283 |
| | $ | 146,483 |
| | $ | 129,111 |
| | $ | 116,858 |
| | $ | 96,074 |
| | $ | 79,128 |
| | $ | 72,559 |
| | $ | 67,370 |
| | $ | 58,106 |
| | | $ | 423,877 |
| | $ | 247,761 |
| |
| Discount amortization on securities, net | 1,834 |
| | 2,059 |
| | 1,930 |
| | 2,867 |
| | 3,323 |
| | 3,848 |
| | 4,060 |
| | 4,098 |
| | 4,631 |
| | | 5,823 |
| | 11,231 |
| |
| Total interest income | 150,117 |
| | 148,542 |
| | 131,041 |
| | 119,725 |
| | 99,397 |
| | 82,976 |
| | 76,619 |
| | 71,468 |
| | 62,737 |
| | | 429,700 |
| | 258,992 |
| |
| Interest expense on short-term debt | (21,100 | ) | | (21,141 | ) | | (19,090 | ) | | (16,567 | ) | | (14,146 | ) | | (12,666 | ) | | (10,424 | ) | | (9,841 | ) | | (7,158 | ) | | | (61,331 | ) | | (37,236 | ) | |
Interest expense on short-term convertible notes (1) | (3,139 | ) | | (3,134 | ) | | (3,128 | ) | | (1,594 | ) | | — |
| | (509 | ) | | (3,011 | ) | | (3,025 | ) | | (3,024 | ) | | | (9,401 | ) | | (3,520 | ) | |
| Interest expense on ABS issued from consolidated trusts | (71,065 | ) | | (70,113 | ) | | (55,295 | ) | | (44,258 | ) | | (27,421 | ) | | (16,349 | ) | | (11,401 | ) | | (7,917 | ) | | (3,956 | ) | | | (196,473 | ) | | (55,171 | ) | |
| Interest expense on long-term debt | (21,300 | ) | | (21,832 | ) | | (21,763 | ) | | (22,542 | ) | | (22,784 | ) | | (18,689 | ) | | (16,678 | ) | | (15,325 | ) | | (13,305 | ) | | | (64,895 | ) | | (58,151 | ) | |
| Total interest expense | (116,604 | ) | | (116,220 | ) | | (99,276 | ) | | (84,961 | ) | | (64,351 | ) | | (48,213 | ) | | (41,514 | ) | | (36,108 | ) | | (27,443 | ) | | | (332,100 | ) | | (154,078 | ) | |
| Net interest income | 33,513 |
| | 32,322 |
| | 31,765 |
| | 34,764 |
| | 35,046 |
| | 34,763 |
| | 35,105 |
| | 35,360 |
| | 35,294 |
| | | 97,600 |
|
| 104,914 |
| |
| Non-interest income | | | | | | | | | | | | | | | | | | | | | |
|
| |
| Mortgage banking activities, net | 9,515 |
| | 19,160 |
| | 12,309 |
| | 11,170 |
| | 11,224 |
| | 10,596 |
| | 26,576 |
| | 3,058 |
| | 21,200 |
| | | 40,984 |
| | 48,396 |
| |
| Investment fair value changes, net | 11,444 |
| | 3,138 |
| | 20,159 |
| | (38,519 | ) | | 10,332 |
| | 889 |
| | 1,609 |
| | 384 |
| | 324 |
| | | 34,741 |
| | 12,830 |
| |
| Realized gains, net | 4,714 |
| | 2,827 |
| | 10,686 |
| | 5,689 |
| | 7,275 |
| | 4,714 |
| | 9,363 |
| | 4,546 |
| | 1,734 |
| | | 18,227 |
| | 21,352 |
| |
| Other income, net | 1,825 |
| | 2,407 |
| | 3,587 |
| | 3,981 |
| | 3,453 |
| | 3,322 |
| | 2,118 |
| | 2,963 |
| | 2,812 |
| | | 7,819 |
| | 8,893 |
| |
| Total non-interest income (loss), net | 27,498 |
| | 27,532 |
| | 46,741 |
| | (17,679 | ) | | 32,284 |
| | 19,521 |
| | 39,666 |
| | 10,951 |
| | 26,070 |
| | | 101,771 |
| | 91,471 |
| |
| Fixed compensation expense | (9,391 | ) | | (9,252 | ) | | (8,205 | ) | | (6,309 | ) | | (5,922 | ) | | (5,775 | ) | | (6,439 | ) | | (5,555 | ) | | (5,233 | ) | | | (26,848 | ) | | (18,136 | ) | |
| Variable compensation expense | (4,090 | ) | | (4,021 | ) | | (4,402 | ) | | (934 | ) | | (4,923 | ) | | (1,825 | ) | | (6,907 | ) | | (5,861 | ) | | (6,467 | ) | | | (12,513 | ) | | (13,655 | ) | |
| Equity compensation expense | (3,155 | ) | | (4,024 | ) | | (2,953 | ) | | (2,823 | ) | | (3,033 | ) | | (3,835 | ) | | (2,697 | ) | | (2,507 | ) | | (2,337 | ) | | | (10,132 | ) | | (9,565 | ) | |
| Loan acquisition costs | (1,392 | ) | | (1,516 | ) | | (1,477 | ) | | (1,837 | ) | | (1,887 | ) | | (2,155 | ) | | (1,818 | ) | | (1,625 | ) | | (1,187 | ) | | | (4,385 | ) | | (5,860 | ) | |
| Other operating expense | (8,787 | ) | | (7,442 | ) | | (6,122 | ) | | (7,350 | ) | | (5,725 | ) | | (5,419 | ) | | (5,169 | ) | | (4,819 | ) | | (4,698 | ) | | | (22,351 | ) | | (16,313 | ) | |
| Total operating expenses | (26,815 | ) | | (26,255 | ) | | (23,159 | ) | | (19,253 | ) | | (21,490 | ) | | (19,009 | ) | | (23,030 | ) | | (20,367 | ) | | (19,922 | ) | | | (76,229 | ) | | (63,529 | ) | |
| (Provision for) benefit from income taxes | 114 |
| | (2,333 | ) | | (883 | ) | | 1,255 |
| | (4,919 | ) | | (2,528 | ) | | (4,896 | ) | | 4,989 |
| | (5,262 | ) | | | (3,102 | ) | | (12,343 | ) | |
| Net income (loss) | $ | 34,310 |
| | $ | 31,266 |
| | $ | 54,464 |
| | $ | (913 | ) | | $ | 40,921 |
| | $ | 32,747 |
| | $ | 46,845 |
| | $ | 30,933 |
| | $ | 36,180 |
| | | $ | 120,040 |
| | $ | 120,513 |
| |
Diluted average shares (2) | 136,523 |
| | 130,697 |
| | 126,278 |
| | 83,217 |
| | 114,683 |
| | 100,432 |
| | 108,195 |
| | 109,621 |
| | 102,703 |
| | | 131,203 | | 107,792 | |
| Diluted earnings (loss) per common share | $ | 0.31 |
| | $ | 0.30 |
| | $ | 0.49 |
| | $ | (0.02 | ) | | $ | 0.42 |
| | $ | 0.38 |
| | $ | 0.50 |
| | $ | 0.35 |
| | $ | 0.41 |
| | | $ | 1.09 |
| | $ | 1.30 |
| |
| |
| (1) | Represents interest expense on $201 million of exchangeable notes and $250 million of convertible notes, respectively, that were reclassified from Long-term debt to Short-term debt as the maturity of the notes was less than one year as of the dates presented. Convertible notes of $250 million were repaid in April 2018 and exchangeable notes of $201 million are due in November 2019. |
| |
| (2) | Diluted average shares includes shares from the assumed conversion of our convertible and/or exchangeable debt in certain periods, in accordance with GAAP diluted EPS provisions. See Table 2 that follows for details of this calculation for the current and prior quarter and our respective Quarterly Reports on Form 10-Q and Annual Reports on Form 10-K for prior periods. |
|
| | |
| THE REDWOOD REVIEW I 3RD QUARTER 2019 | | Table 1: GAAP Earnings 29 |
|
| | | | | | | | | |
| Table 2: GAAP and Non-GAAP Core Basic and Diluted Earnings (1) per Common Share (in thousands, except per share data) | |
| | | | | | |
| | | 2019 Q3 | | 2019
Q2 | |
| GAAP Earnings per Common Share ("EPS"): | | | | |
| Net income attributable to Redwood | $ | 34,310 |
| | $ | 31,266 |
| |
| Less: Dividends and undistributed earnings allocated to participating securities | (856 | ) | | (877 | ) | |
| Net income allocated to common shareholders for GAAP basic EPS | 33,454 |
| | 30,389 |
| |
| Incremental adjustment to dividends and undistributed earnings allocated to participating securities | (180 | ) | | (176 | ) | |
Add back: Interest expense on convertible notes for the period, net of tax (2) | 8,887 |
| | 8,698 |
| |
| Net income allocated to common shareholders for GAAP diluted EPS | $ | 42,161 |
| | $ | 38,911 |
| |
| | | | | |
| Basic weighted average common shares outstanding | 101,872 |
| | 96,984 |
| |
| Net effect of dilutive equity awards | 363 |
| | 271 |
| |
Net effect of assumed convertible notes conversion to common shares (2) | 34,288 |
| | 33,443 |
| |
| Diluted weighted average common shares outstanding | 136,523 |
| | 130,697 |
| |
| | | | | |
| GAAP Basic Earnings per Common Share | $ | 0.33 |
| | $ | 0.31 |
| |
| GAAP Diluted Earnings per Common Share | $ | 0.31 |
| | $ | 0.30 |
| |
| | | | | |
| Non-GAAP Core Earnings per Common Share: | | | | |
| Non-GAAP core earnings | $ | 43,326 |
| | $ | 43,286 |
| |
| Less: Dividends and undistributed earnings allocated to participating securities | (1,099 | ) | | (1,219 | ) | |
| Non-GAAP core earnings allocated to common shareholders for core basic EPS | 42,227 |
| | 42,067 |
| |
| Incremental adjustment to dividends and undistributed earnings allocated to participating securities | (121 | ) | | (89 | ) | |
Add back: Interest expense on convertible notes for the period, net of tax (2) | 8,887 |
| | 8,698 |
| |
| Non-GAAP core earnings allocated to common shareholders for core diluted EPS | $ | 50,993 |
| | $ | 50,676 |
| |
| | | | | |
| Basic weighted average common shares outstanding | 101,872 |
| | 96,984 |
| |
| Net effect of dilutive equity awards | 363 |
| | 271 |
| |
Net effect of assumed convertible notes conversion to common shares (2) | 34,288 |
| | 33,443 |
| |
| Diluted weighted average common shares outstanding | 136,523 |
| | 130,697 |
| |
| | | | | |
| Non-GAAP Core Basic Earnings per Common Share | $ | 0.41 |
| | $ | 0.43 |
| |
| Non-GAAP Core Diluted Earnings per Common Share | $ | 0.37 |
| | $ | 0.39 |
| |
| | | | | |
| |
| (1) | A reconciliation of GAAP net income to non-GAAP core earnings and a definition of core earnings (which we updated during the third quarter of 2019) is included in the Non-GAAP Measurements section of the Appendix. |
| |
| (2) | Certain convertible notes were determined to be dilutive in the periods presented and were included in the calculations of diluted EPS under the "if-converted" method. Under this method, the periodic interest expense (net of applicable taxes) for dilutive notes is added back to the numerator and the number of shares that the notes are entitled to (if converted, regardless of whether they are in or out of the money) are included in the denominator. |
|
| | |
| THE REDWOOD REVIEW I 3RD QUARTER 2019 | | Table 2: GAAP and Non-GAAP Core Earnings per Basic and Diluted Common Share 30 |
|
| | | | | | | | | | | | | | | | | | | | | | | | | | | | | | | | | | | | | | | | | | | | | |
| Table 3: Segment Results ($ in thousands) | |
| | | | | | | | | | | | | | | | | | | | | | | | |
| | | 2019
Q3 | | 2019
Q2 | | 2019
Q1 | | 2018
Q4 | | 2018
Q3 | | 2018
Q2 | | 2018
Q1 | | 2017
Q4 | | 2017
Q3 | | Nine
Months 2019 | | Nine
Months 2018 | |
| Investment Portfolio | | | | | | | | | | | | | | | | | | | | | | |
| Net interest income | | | | | | | | | | | | | | | | | | | | | | |
| Residential loans | | | | | | | | | | | | | | | | | | | | | | |
| At Redwood | $ | 10,934 |
| | $ | 11,115 |
| | $ | 11,022 |
| | $ | 11,659 |
| | $ | 12,478 |
| | $ | 13,842 |
| | $ | 15,842 |
| | $ | 16,032 |
| | $ | 16,916 |
| | $ | 33,071 |
| | $ | 42,162 |
| |
| At consolidated Sequoia Choice entities | 3,979 |
| | 3,694 |
| | 3,549 |
| | 3,608 |
| | 2,880 |
| | 2,002 |
| | 1,386 |
| | 836 |
| | 22 |
| | 11,222 |
| | 6,268 |
| |
| At consolidated Freddie Mac SLST entities | 3,121 |
| | 3,038 |
| | 3,047 |
| | 1,297 |
| | — |
| | — |
| | — |
| | — |
| | — |
| | 9,206 |
| | — |
| |
| Business purpose residential loans | 2,454 |
| | 1,740 |
| | 1,521 |
| | 1,861 |
| | 974 |
| | — |
| | — |
| | — |
| | — |
| | 5,715 |
| | 974 |
| |
| Residential securities | 13,096 |
| | 14,304 |
| | 14,291 |
| | 17,700 |
| | 19,412 |
| | 19,700 |
| | 19,778 |
| | 20,287 |
| | 19,342 |
| | 41,691 |
| | 58,890 |
| |
| Multifamily and commercial investments | 3,760 |
| | 4,063 |
| | 3,964 |
| | 3,296 |
| | 2,209 |
| | 1,860 |
| | 1,888 |
| | 1,749 |
| | 1,298 |
| | 11,787 |
| | 5,957 |
| |
| Other investments | 1,031 |
| | 182 |
| | 171 |
| | 913 |
| | 751 |
| | 161 |
| | — |
| | — |
| | — |
| | 1,384 |
| | 912 |
| |
| Total net interest income | 38,375 |
| | 38,136 |
| | 37,565 |
| | 40,334 |
| | 38,704 |
| | 37,565 |
| | 38,894 |
| | 38,904 |
| | 37,578 |
| | 114,076 |
| | 115,163 |
| |
| | | | | | | | | | | | | | | | | | | | | | | |
| Non-interest income | | | | | | | | | | | | | | | | | | | | | | |
| Investment fair value changes, net | 11,896 |
| | 3,297 |
| | 20,556 |
| | (38,449 | ) | | 10,566 |
| | 1,600 |
| | 1,590 |
| | 4,568 |
| | 1,372 |
| | 35,749 |
| | 13,756 |
| |
| Other income, net | 2,313 |
| | 2,874 |
| | 1,221 |
| | 3,659 |
| | 3,334 |
| | 3,322 |
| | 2,118 |
| | 2,963 |
| | 2,812 |
| | 6,408 |
| | 8,774 |
| |
| Realized gains | 4,714 |
| | 2,827 |
| | 10,686 |
| | 5,689 |
| | 7,275 |
| | 4,714 |
| | 9,363 |
| | 4,546 |
| | 1,734 |
| | 18,227 |
| | 21,352 |
| |
| Total non-interest income, net | 18,923 |
| | 8,998 |
| | 32,463 |
| | (29,101 | ) | | 21,175 |
| | 9,636 |
| | 13,071 |
| | 12,077 |
| | 5,918 |
| | 60,384 |
|
| 43,882 |
| |
| | | | | | | | | | | | | | | | | | | | | | | |
| Operating expenses | (2,191 | ) | | (2,258 | ) | | (2,661 | ) | | (3,833 | ) | | (2,659 | ) | | (1,858 | ) | | (2,007 | ) | | (1,657 | ) | | (1,324 | ) | | (7,110 | ) |
| (6,524 | ) | |
| (Provision for) benefit from income taxes | (89 | ) | | (896 | ) | | (342 | ) | | 1,117 |
| | (2,840 | ) | | (1,130 | ) | | (888 | ) | | (838 | ) | | (433 | ) | | (1,327 | ) |
| (4,858 | ) | |
| Segment contribution | $ | 55,018 |
| | $ | 43,980 |
| | $ | 67,025 |
| | $ | 8,517 |
| | $ | 54,380 |
| | $ | 44,213 |
| | $ | 49,070 |
| | $ | 48,486 |
| | $ | 41,739 |
| | $ | 166,023 |
|
| $ | 147,663 |
| |
| | | | | | | | | | | | | | | | | | | | | | | |
| Mortgage Banking | | | | | | | | | | | | | | | | | | | | | | |
| Net interest income | $ | 5,834 |
| | $ | 4,757 |
| | $ | 4,813 |
| | $ | 5,015 |
| | $ | 6,890 |
| | $ | 5,455 |
| | $ | 6,760 |
| | $ | 6,887 |
| | $ | 6,491 |
| | $ | 15,404 |
|
| $ | 19,105 |
| |
| Non-interest income | | | | | | | | | | | | | | | | | | | | | | |
| Mortgage banking activities | 9,515 |
| | 19,160 |
| | 12,309 |
| | 11,170 |
| | 11,224 |
| | 10,596 |
| | 26,576 |
| | 3,058 |
| | 21,200 |
| | 40,984 |
| | 48,396 |
| |
| Other income (expense), net | (252 | ) | | (156 | ) | | (167 | ) | | — |
| | — |
| | — |
| | — |
| | — |
| | — |
| | (575 | ) | | — |
| |
| Total non-interest income, net | 9,263 |
| | 19,004 |
| | 12,142 |
| | 11,170 |
| | 11,224 |
| | 10,596 |
| | 26,576 |
| | 3,058 |
| | 21,200 |
| | 40,409 |
| | 48,396 |
| |
| | | | | | | | | | | | | | | | | | | | | | | |
| Operating expenses | (11,907 | ) | | (11,571 | ) | | (8,104 | ) | | (7,231 | ) | | (6,570 | ) | | (5,739 | ) | | (8,632 | ) | | (7,104 | ) | | (6,107 | ) | | (31,582 | ) | | (20,941 | ) | |
| Benefit from (provision for) income taxes | 203 |
| | (1,437 | ) | | (541 | ) | | 138 |
| | (2,079 | ) | | (1,398 | ) | | (4,008 | ) | | 5,827 |
| | (4,829 | ) | | (1,775 | ) | | (7,485 | ) | |
| Segment contribution | $ | 3,393 |
| | $ | 10,753 |
| | $ | 8,310 |
| | $ | 9,092 |
| | $ | 9,465 |
| | $ | 8,914 |
| | $ | 20,696 |
| | $ | 8,668 |
| | $ | 16,755 |
| | $ | 22,456 |
| | $ | 39,075 |
| |
| | | | | | | | | | | | | | | | | | | | | | | |
| Corporate/other | (24,101 | ) | | (23,467 | ) | | (20,871 | ) | | (18,522 | ) | | (22,924 | ) | | (20,380 | ) | | (22,921 | ) | | (26,221 | ) | | (22,314 | ) | | (68,439 | ) | | (66,225 | ) | |
| GAAP net income (loss) | $ | 34,310 |
| | $ | 31,266 |
| | $ | 54,464 |
| | $ | (913 | ) | | $ | 40,921 |
| | $ | 32,747 |
| | $ | 46,845 |
| | $ | 30,933 |
| | $ | 36,180 |
| | $ | 120,040 |
| | $ | 120,513 |
| |
| | | | | | | | | | | | | | | | | | | | | | | | |
|
| | |
| THE REDWOOD REVIEW I 3RD QUARTER 2019 | | Table 3: Segment Results 31 |
|
| | | | | | | | | | | | | | | | | | | | | | | | | | | | | | | | | | | |
| Table 4: Segment Assets and Liabilities ($ in thousands) |
| | | | | | | | | | | | | | | | | | | | |
| | | | September 30, 2019 | | | June 30, 2019 | |
| | | | Investment Portfolio | | Mortgage Banking | | Corporate/ Other | | Total | | | Investment Portfolio | | Mortgage Banking | | Corporate/ Other | | Total | |
| Residential loans | | | | | | | | | | | | | | | | | | |
| At Redwood | | $ | 2,267,218 |
| | $ | 925,887 |
| | $ | — |
| | $ | 3,193,105 |
| | | $ | 2,395,314 |
| | $ | 1,047,856 |
| | $ | — |
| | $ | 3,443,170 |
| |
| At consolidated Sequoia entities | | 2,618,316 |
| | — |
| | 429,159 |
| | 3,047,475 |
| | | 2,147,356 |
| | — |
| | 457,750 |
| | 2,605,106 |
| |
| At consolidated Freddie Mac SLST entities | | 2,441,223 |
| | — |
| | — |
| | 2,441,223 |
| | | 1,235,089 |
| | — |
| | — |
| | 1,235,089 |
| |
| Business purpose residential loans | | 225,601 |
| | 110,434 |
| | — |
| | 336,035 |
| | | 159,353 |
| | 91,501 |
| | — |
| | 250,854 |
| |
| Multifamily loans at consolidated entities | | 3,791,622 |
| | — |
| | — |
| | 3,791,622 |
| | | 3,749,657 |
| | — |
| | — |
| | 3,749,657 |
| |
| Real estate securities | | 1,285,426 |
| | — |
| | — |
| | 1,285,426 |
| | | 1,477,486 |
| | — |
| | — |
| | 1,477,486 |
| |
| Other investments | | 346,136 |
| | 1,571 |
| | — |
| | 347,707 |
| | | 369,900 |
| | 2,230 |
| | — |
| | 372,130 |
| |
| Cash and cash equivalents | | 68,966 |
| | 58,431 |
| | 267,231 |
| | 394,628 |
| | | 66,263 |
| | 8,444 |
| | 143,438 |
| | 218,145 |
| |
| Other assets | | 302,952 |
| | 70,316 |
| | 265,794 |
| | 639,062 |
| | | 190,001 |
| | 75,086 |
| | 234,862 |
| | 499,949 |
| |
| Total assets | | $ | 13,347,460 |
| | $ | 1,166,639 |
|
| $ | 962,184 |
| | $ | 15,476,283 |
| | | $ | 11,790,419 |
| | $ | 1,225,117 |
|
| $ | 836,050 |
| | $ | 13,851,586 |
| |
| | | | | | | | | | | | | | | | | | | |
| Short-term debt | | | | | | | | | | | | | | | | | | |
| Mortgage loan warehouse debt | | $ | — |
| | $ | 233,224 |
| | $ | — |
| | $ | 233,224 |
| | | $ | — |
| | $ | 638,055 |
| | $ | — |
| | $ | 638,055 |
| |
| Security repurchase facilities | | 1,157,646 |
| | — |
| | — |
| | 1,157,646 |
| | | 1,213,920 |
| | — |
| | — |
| | 1,213,920 |
| |
| Business purpose residential loan warehouse facilities | | 138,988 |
| | 59,204 |
| | — |
| | 198,192 |
| | | 120,445 |
| | 53,998 |
| | — |
| | 174,443 |
| |
| Servicer advance financing | | 191,203 |
| | — |
| | — |
| | 191,203 |
| | | 236,231 |
| | — |
| | — |
| | 236,231 |
| |
| Convertible notes, net | | — |
| | — |
| | 200,552 |
| | 200,552 |
| | | — |
| | — |
| | 200,236 |
| | 200,236 |
| |
| Other liabilities | | 232,945 |
| | 35,012 |
| | 142,677 |
| | 410,634 |
| | | 182,390 |
| | 29,897 |
| | 126,080 |
| | 338,367 |
| |
| ABS issued | | 7,926,161 |
| | — |
| | 419,890 |
| | 8,346,051 |
| | | 6,464,267 |
| | — |
| | 448,862 |
| | 6,913,129 |
| |
| Long-term debt, net | | 2,184,663 |
| | — |
| | 769,059 |
| | 2,953,722 |
| | | 1,999,999 |
| | — |
| | 573,174 |
| | 2,573,173 |
| |
| Total liabilities | | $ | 11,831,606 |
|
| $ | 327,440 |
|
| $ | 1,532,178 |
|
| $ | 13,691,224 |
| | | $ | 10,217,252 |
| | $ | 721,950 |
| | $ | 1,348,352 |
| | $ | 12,287,554 |
| |
| | | | | | | | | | | | | | | | | | | |
|
| | |
| THE REDWOOD REVIEW I 3RD QUARTER 2019 | | Table 4: Segment Assets and Liabilities 32 |
|
| | | | | | | | | | | | | | | | | | | | | | | | | | | | | | | | | | | | | | | | | | | | | |
| Table 5: Changes in Book Value per Share ($ in per share) | |
| | | | | | | | | | | | | | | | | | | | | | | | |
| | | 2019
Q3 | | 2019
Q2 | | 2019
Q1 | | 2018
Q4 | | 2018
Q3 | | 2018
Q2 | | 2018
Q1 | | 2017
Q4 | | 2017
Q3 | | Nine Months 2019 | | Nine
Months 2018 | |
| | | | | | | | | | | | | | | | | | | | | | | |
| Beginning book value per share | $ | 16.01 |
| | $ | 16.00 |
| | $ | 15.89 |
| | $ | 16.42 |
| | $ | 16.23 |
| | $ | 16.12 |
| | $ | 15.83 |
| | $ | 15.67 |
| | $ | 15.29 |
| | $ | 15.89 |
| | $ | 15.83 |
| |
| Earnings | 0.31 |
| | 0.30 |
| | 0.49 |
| | (0.02 | ) | | 0.42 |
| | 0.38 |
| | 0.50 |
| | 0.35 |
| | 0.41 |
| | 1.09 |
| | 1.30 |
| |
| Changes in unrealized gains on securities, net, from: | | | | | | | | | | | | | | | | | | |
| |
| |
| Realized gains recognized in earnings | (0.03 | ) | | (0.02 | ) | | (0.08 | ) | | (0.07 | ) | | (0.05 | ) | | (0.05 | ) | | (0.09 | ) | | (0.03 | ) | | (0.03 | ) | | (0.12 | ) | | (0.18 | ) | |
| Amortization income recognized in earnings | (0.01 | ) | | (0.02 | ) | | (0.02 | ) | | (0.03 | ) | | (0.03 | ) | | (0.04 | ) | | (0.04 | ) | | (0.04 | ) | | (0.05 | ) | | (0.04 | ) | | (0.10 | ) | |
| Mark-to-market adjustments, net | 0.06 |
| | 0.11 |
| | 0.10 |
| | 0.06 |
| | 0.01 |
| | 0.01 |
| | — |
| | 0.12 |
| | 0.27 |
| | 0.26 |
| | 0.02 |
| |
| Total change in unrealized gains on securities, net | 0.02 |
| | 0.07 |
| | — |
| | (0.04 | ) | | (0.07 | ) | | (0.08 | ) | | (0.13 | ) | | 0.05 |
| | 0.19 |
| | 0.10 |
| | (0.26 | ) | |
| Dividends | (0.30 | ) | | (0.30 | ) | | (0.30 | ) | | (0.30 | ) | | (0.30 | ) | | (0.30 | ) | | (0.28 | ) | | (0.28 | ) | | (0.28 | ) | | (0.90 | ) |
| (0.88 | ) | |
| Equity compensation, net | 0.02 |
| | 0.02 |
| | (0.02 | ) | | (0.07 | ) | | 0.03 |
| | 0.03 |
| | 0.03 |
| | (0.02 | ) | | 0.02 |
| | 0.03 |
| | 0.09 |
| |
| Changes in unrealized losses on derivatives hedging long-term debt | (0.11 | ) | | (0.10 | ) | | (0.06 | ) | | (0.09 | ) | | 0.06 |
| | 0.05 |
| | 0.11 |
| | 0.02 |
| | — |
| | (0.28 | ) | | 0.21 |
| |
| Other, net | (0.03 | ) | | 0.02 |
| | — |
| | (0.01 | ) | | 0.05 |
| | 0.03 |
| | 0.06 |
| | 0.04 |
| | 0.04 |
| | (0.01 | ) | | 0.13 |
| |
| | | | | | | | | | | | | | | | | | | |
| |
| |
| Ending book value per share | $ | 15.92 |
| | $ | 16.01 |
| | $ | 16.00 |
| | $ | 15.89 |
| | $ | 16.42 |
| | $ | 16.23 |
| | $ | 16.12 |
| | $ | 15.83 |
| | $ | 15.67 |
| | $ | 15.92 |
| | $ | 16.42 |
| |
| | | | | | | | | | | | | | | | | | | | | | | |
Economic return on book value (1) | 1.3 | % | | 1.9 | % | | 2.6 | % | | (1.4 | )% | | 3.0 | % | | 2.5 | % | | 3.6 | % | | 2.8 | % | | 4.3 | % | | 5.9 | % | | 9.3 | % | |
| | | | | | | | | | | | | | | | | | | | | | | | |
| |
| (1) | Economic return on book value is based on the periodic change in GAAP book value per common share plus dividends declared per common share during the period. |
|
| | |
| THE REDWOOD REVIEW I 3RD QUARTER 2019 | | Table 5: Changes in Book Value per Share 33 |
|
| | | | | | | | | | | | | | | | | | | | | | | | | | | | | | | | | | | | | |
| Table 6: Taxable and GAAP Income (1) Differences and Dividends (In thousands, except for per share data) | |
| | | | | | | | | | | | | | | | | | | | |
| | | Estimated Nine Months 2019 (2) | | Actual Twelve Months 2018 (2) | | Actual Twelve Months 2017 (2) | |
| | | Taxable Income | | GAAP Income | | Differences | | Taxable
Income | | GAAP
Income | | Differences | | Taxable Income | | GAAP Income | | Differences | |
| Taxable and GAAP Income Differences | | | | | | | | | | | | | | | | | | |
| Interest income | $ | 226,174 |
| | $ | 429,700 |
| | $ | (203,526 | ) | | $ | 265,400 |
| | $ | 378,717 |
| | $ | (113,317 | ) | | $ | 225,079 |
| | $ | 248,057 |
| | $ | (22,978 | ) | |
| Interest expense | (135,733 | ) | | (332,100 | ) | | 196,367 |
| | (139,147 | ) | | (239,039 | ) | | 99,892 |
| | (89,662 | ) | | (108,816 | ) | | 19,154 |
| |
| Net interest income | 90,441 |
| | 97,600 |
| | (7,159 | ) | | 126,253 |
| | 139,678 |
| | (13,425 | ) | | 135,417 |
| | 139,241 |
| | (3,824 | ) | |
| Realized credit losses | 197 |
| | — |
| | 197 |
| | (1,738 | ) | | — |
| | (1,738 | ) | | (3,442 | ) | | — |
| | (3,442 | ) | |
| Mortgage banking activities, net | 39,670 |
| | 40,984 |
| | (1,314 | ) | | 57,212 |
| | 59,566 |
| | (2,354 | ) | | 44,143 |
| | 53,908 |
| | (9,765 | ) | |
| Investment fair value changes, net | 803 |
| | 34,741 |
| | (33,938 | ) | | 4,927 |
| | (25,689 | ) | | 30,616 |
| | (11,191 | ) | | 10,374 |
| | (21,565 | ) | |
| Operating expenses | (71,097 | ) | | (76,229 | ) | | 5,132 |
| | (78,097 | ) | | (82,782 | ) | | 4,685 |
| | (73,203 | ) | | (77,156 | ) | | 3,953 |
| |
| Other income (expense), net | 15,634 |
| | 7,819 |
| | 7,815 |
| | 17,519 |
| | 12,874 |
| | 4,645 |
| | 31,325 |
| | 12,436 |
| | 18,889 |
| |
| Realized gains, net | 42,566 |
| | 18,227 |
| | 24,339 |
| | 43,099 |
| | 27,041 |
| | 16,058 |
| | (736 | ) | | 13,355 |
| | (14,091 | ) | |
| (Provision for) benefit from income taxes | (401 | ) | | (3,102 | ) | | 2,701 |
| | (538 | ) | | (11,088 | ) | | 10,550 |
| | (516 | ) | | (11,752 | ) | | 11,236 |
| |
| Income | $ | 117,813 |
| | $ | 120,040 |
| | $ | (2,227 | ) | | $ | 168,637 |
| | $ | 119,600 |
| | $ | 49,037 |
| | $ | 121,797 |
| | $ | 140,406 |
| | $ | (18,609 | ) | |
| | | | | | | | | | | | | | | | | | | |
| REIT taxable income | $ | 91,948 |
| | | | | | $ | 110,161 |
| | | | | | $ | 90,122 |
| | | | | |
| Taxable income at taxable subsidiaries | 25,865 |
| | | | | | 58,476 |
| | | | | | 31,675 |
| | | | | |
| Taxable income | $ | 117,813 |
| | | | | | $ | 168,637 |
| | | | | | $ | 121,797 |
| | | | | |
| | | | | | | | | | | | | | | | | | | |
| Shares used for taxable EPS calculation | 112,102 |
| | | | | | 84,884 |
| | | | | | 76,600 |
| | | | | |
| REIT taxable income per share | $ | 0.89 |
| | | | | | $ | 1.38 |
| | | | | | $ | 1.17 |
| | | | | |
| Taxable income (loss) per share at taxable subsidiaries | $ | 0.27 |
| | | | | | $ | 0.75 |
| | | | | | $ | 0.42 |
| | | | | |
Taxable income per share (3) | $ | 1.16 |
| | | | | | $ | 2.13 |
| | | | | | $ | 1.59 |
| | | | | |
| | | | | | | | | | | | | | | | | | | |
| Dividends | | | | | | | | | | | | | | | | | | |
| Dividends declared | $ | 91,931 |
| | | | | | $ | 94,134 |
| | | | | | $ | 86,271 |
| | | | | |
Dividends per share (4) | $ | 0.90 |
| | | | | | $ | 1.18 |
| | | | | | $ | 1.12 |
| | | | | |
| |
| (1) | Taxable income for 2019 is an estimate until we file our tax returns for 2019. To the extent we expect to pay tax at the corporate level (generally as a result of activity at our taxable REIT subsidiaries), we are required to record a tax provision for GAAP reporting purposes. Any tax provision (or benefit) is not necessarily the actual amount of tax currently due (or receivable as a refund) as a portion of our provision (or benefit) is deferred in nature. It is our intention to retain any excess inclusion income generated in 2019 at our TRS and not pass it through to our shareholders. |
| |
| (2) | Reconciliation of GAAP income to taxable income (loss) for prior quarters is provided in the respective Redwood Reviews for those quarters. |
| |
| (3) | Taxable income (loss) per share is based on the number of shares outstanding at the end of each quarter. The annual taxable income (loss) per share is the sum of the quarterly per share estimates. |
| |
| (4) | Dividends in 2018 were characterized as 69% ordinary dividend income (or $65 million) and 31% long-term capital gain dividend income (or $29 million). Dividends in 2017 were characterized as 71% ordinary dividend income (or $61 million) and 29% qualified dividend income (or $25 million). |
|
| | |
| THE REDWOOD REVIEW I 3RD QUARTER 2019 | | Table 6: Taxable and GAAP Income Differences and Dividends 34 |
|
| | | | | | | | | | | | | | | | | | | | | | | | | | | | | | | | | | | | | | | | | | | | | |
| Table 7: Financial Ratios and Book Value ($ in thousands, except per share data) | |
| | | | | | | | | | | | | | | | | | | | | | | | |
| | | 2019
Q3 | | 2019
Q2 | | 2019
Q1 | | 2018
Q4 | | 2018
Q3 | | 2018
Q2 | | 2018
Q1 | | 2017
Q4 | | 2017
Q3 | | Nine
Months 2019 | | Nine
Months 2018 | |
| Financial performance ratios | | | | | | | | | | | | | | | | | | | | | | |
| Net interest income | $ | 33,513 |
| | $ | 32,322 |
| | $ | 31,765 |
| | $ | 34,764 |
| | $ | 35,046 |
| | $ | 34,763 |
| | $ | 35,105 |
| | $ | 35,360 |
| | $ | 35,294 |
| | $ | 97,600 |
| | $ | 104,914 |
| |
| Operating expenses | $ | (26,815 | ) | | $ | (26,255 | ) | | $ | (23,159 | ) | | $ | (19,253 | ) | | $ | (21,490 | ) | | $ | (19,009 | ) | | $ | (23,030 | ) | | $ | (20,367 | ) | | $ | (19,922 | ) | | $ | (76,229 | ) | | $ | (63,529 | ) | |
| GAAP net income | $ | 34,310 |
| | $ | 31,266 |
| | $ | 54,464 |
| | $ | (913 | ) | | $ | 40,921 |
| | $ | 32,747 |
| | $ | 46,845 |
| | $ | 30,933 |
| | $ | 36,180 |
| | $ | 120,040 |
| | $ | 120,513 |
| |
| Average total assets | $ | 14,017,627 |
| | $ | 13,596,337 |
| | $ | 11,795,343 |
| | $ | 10,163,283 |
| | $ | 8,503,749 |
| | $ | 7,134,026 |
| | $ | 6,922,611 |
| | $ | 6,652,937 |
| | $ | 5,851,133 |
| | $ | 13,144,576 |
| | $ | 7,519,264 |
| |
| Average total equity | $ | 1,591,792 |
| | $ | 1,556,850 |
| | $ | 1,452,282 |
| | $ | 1,342,967 |
| | $ | 1,331,497 |
| | $ | 1,226,735 |
| | $ | 1,218,015 |
| | $ | 1,207,879 |
| | $ | 1,189,540 |
| | $ | 1,534,152 |
| | $ | 1,259,165 |
| |
| Operating expenses / average total equity | 6.74 | % | | 6.75 | % | | 6.38 | % | | 5.73 | % | | 6.46 | % | | 6.20 | % | | 7.56 | % |
| 6.74 | % | | 6.70 | % | | 6.63 | % | | 6.73 | % | |
| GAAP net income / average equity (GAAP ROE) | 8.62 | % | | 8.03 | % | | 15.00 | % | | (0.27 | )% | | 12.29 | % | | 10.68 | % | | 15.38 | % |
| 10.24 | % | | 12.17 | % | | 10.43 | % | | 12.76 | % | |
| | | | | | | | | | | | | | | | | | | | | | | | |
| Leverage ratios and book value per share | | | | | | | | | | | | | | | | | | | | | | |
| Short-term debt | $ | 1,789,827 |
| | $ | 2,227,183 |
| | $ | 1,914,514 |
| | $ | 2,138,686 |
| | $ | 1,424,275 |
| | $ | 1,426,288 |
| | $ | 1,504,460 |
| | $ | 1,938,682 |
| | $ | 1,238,196 |
| | | | | |
| Long-term debt – Other | 2,971,552 |
| | 2,584,499 |
| | 2,584,499 |
| | 2,584,499 |
| | 2,785,264 |
| | 2,785,264 |
| | 2,585,264 |
| | 2,585,264 |
| | 2,585,264 |
| | | | | |
Total debt at Redwood | $ | 4,761,379 |
| | $ | 4,811,682 |
| | $ | 4,499,013 |
| | $ | 4,723,185 |
| | $ | 4,209,539 |
| | $ | 4,211,552 |
| | $ | 4,089,724 |
|
| $ | 4,523,946 |
| | $ | 3,823,460 |
| | | | | |
| At consolidated securitization entities | | | | | | | | | | | | | | | | | | | | | | |
| ABS issued | 8,346,051 |
| | 6,913,129 |
| | 5,637,644 |
| | 5,410,073 |
| | 3,406,985 |
| | 1,929,662 |
| | 1,542,087 |
| | 1,164,585 |
| | 944,288 |
| | | | | |
| Non-recourse short-term debt | 191,556 |
| | 237,363 |
| | 251,875 |
| | 265,637 |
| | — |
| | — |
| | — |
| | — |
| | — |
| | | | | |
| Total ABS and non-recourse short-term debt | $ | 8,537,607 |
| | $ | 7,150,492 |
| | $ | 5,889,519 |
| | $ | 5,675,710 |
| | $ | 3,406,985 |
| | $ | 1,929,662 |
| | $ | 1,542,087 |
|
| $ | 1,164,585 |
| | $ | 944,288 |
| | | | | |
Consolidated debt (1) | $ | 13,298,986 |
| | $ | 11,962,174 |
| | $ | 10,388,532 |
| | $ | 10,398,895 |
| | $ | 7,616,524 |
| | $ | 6,141,214 |
| | $ | 5,631,811 |
|
| $ | 5,688,531 |
| | $ | 4,767,748 |
| | | | | |
| Stockholders' equity | $ | 1,785,059 |
| | $ | 1,564,032 |
| | $ | 1,549,927 |
| | $ | 1,348,794 |
| | $ | 1,361,327 |
| | $ | 1,228,955 |
| | $ | 1,219,983 |
| | $ | 1,212,287 |
| | $ | 1,208,640 |
| | | | | |
Total capital (2) | $ | 2,554,118 |
| | $ | 2,337,442 |
| | $ | 2,322,515 |
| | $ | 2,120,572 |
| | $ | 2,132,298 |
| | $ | 1,999,177 |
| | $ | 1,795,572 |
| | $ | 1,787,701 |
| | $ | 1,783,301 |
| | | | | |
Recourse debt at Redwood to stockholders' equity (3) | 2.7x |
| | 3.1x |
| | 2.9x |
| | 3.5x |
| | 3.1x |
| | 3.4x |
| | 3.4x |
| | 3.7x |
| | 3.2x |
| | | | | |
| Consolidated debt to stockholders' equity | 7.5x |
| | 7.6x |
| | 6.7x |
| | 7.7x |
| | 5.6x |
| | 5.0x |
| | 4.6x |
| | 4.7x |
| | 3.9x |
| | | | | |
| Shares outstanding at period end (in thousands) | 112,102 |
| | 97,715 |
| | 96,866 |
| | 84,884 |
| | 82,930 |
| | 75,743 |
| | 75,703 |
| | 76,600 |
| | 77,123 |
| | | | | |
| Book value per share | $ | 15.92 |
| | $ | 16.01 |
| | $ | 16.00 |
| | $ | 15.89 |
| | $ | 16.42 |
| | $ | 16.23 |
| | $ | 16.12 |
| | $ | 15.83 |
| | $ | 15.67 |
| | | | | |
| | | | | | | | | | | | | | | | | | | | | | | | |
| |
| (1) | Amounts presented in Consolidated debt above do not include deferred issuance costs or debt discounts. |
| |
| (2) | Our total capital of $2.6 billion at September 30, 2019 included $1.8 billion of equity capital and $0.8 billion of unsecured corporate debt. |
| |
| (3) | Excludes ABS issued and non-recourse debt at consolidated entities. See Table 10 for additional detail on our ABS issued and short-term debt at consolidated entities. |
|
| | |
| THE REDWOOD REVIEW I 3RD QUARTER 2019 | | Table 7: Financial Ratios and Book Value 35
|
|
| | | | | | | | | | | | | | | | | | | | | | | | | | | | | | | | | | | | | | | | | | | | | |
| Table 8: Loans and Securities Activity ($ in thousands) |
| | | | | | | | | | | | | | | | | | | | | | | |
| | 2019 Q3 | | 2019
Q2 | | 2019
Q1 | | 2018
Q4 | | 2018
Q3 | | 2018
Q2 | | 2018 Q1 | | 2017
Q4 | | 2017
Q3 | | Nine Months 2019 | | Nine Months 2018 | |
| Residential Loans, Held-for-Sale | | | | | | | | | | | | | | | | | | | | | | |
| Beginning carrying value | $ | 1,056,287 |
| | $ | 819,221 |
| | $ | 1,048,801 |
| | $ | 866,444 |
| | $ | 1,104,660 |
| | $ | 1,130,185 |
| | $ | 1,427,945 |
| | $ | 925,681 |
| | $ | 837,371 |
| | $ | 1,048,801 |
| | $ | 1,427,945 |
| |
| Acquisitions | 1,482,786 |
| | 1,561,752 |
| | 982,929 |
| | 1,562,573 |
| | 1,804,125 |
| | 1,951,566 |
| | 1,815,294 |
| | 1,950,180 |
| | 1,462,116 |
| | 4,027,467 |
| | 5,570,985 |
| |
| Sales | (846,677 | ) | | (1,252,416 | ) | | (833,078 | ) | | (1,290,337 | ) | | (1,133,078 | ) | | (1,408,358 | ) | | (1,594,531 | ) | | (834,977 | ) | | (1,393,323 | ) | | (2,932,171 | ) | | (4,135,967 | ) | |
| Principal repayments | (26,737 | ) | | (32,401 | ) | | (17,425 | ) | | (14,862 | ) | | (21,198 | ) | | (14,612 | ) | | (17,017 | ) | | (14,771 | ) | | (16,436 | ) | | (76,563 | ) | | (52,827 | ) | |
| Transfers between portfolios | (735,449 | ) | | (43,250 | ) | | (366,672 | ) | | (81,639 | ) | | (896,129 | ) | | (561,710 | ) | | (507,616 | ) | | (601,554 | ) | | 20,025 |
| | (1,145,371 | ) | | (1,965,455 | ) | |
| Changes in fair value, net | (4,323 | ) | | 3,381 |
| | 4,666 |
| | 6,622 |
| | 8,064 |
| | 7,589 |
| | 6,110 |
| | 3,386 |
| | 15,928 |
| | 3,724 |
| | 21,763 |
| |
| Ending fair value | $ | 925,887 |
| | $ | 1,056,287 |
| | $ | 819,221 |
| | $ | 1,048,801 |
| | $ | 866,444 |
| | $ | 1,104,660 |
| | $ | 1,130,185 |
| | $ | 1,427,945 |
| | $ | 925,681 |
| | $ | 925,887 |
| | $ | 866,444 |
| |
| | | | | | | | | | | | | | | | | | | | | | | |
Residential Loans, Held-for-Investment at Redwood (1) | | | | | | | | | | | | | | | | | | | | | |
| Beginning carrying value | $ | 2,386,883 |
| | $ | 2,404,870 |
| | $ | 2,383,932 |
| | $ | 2,320,662 |
| | $ | 2,313,336 |
| | $ | 2,375,785 |
| | $ | 2,434,386 |
| | $ | 2,268,802 |
| | $ | 2,360,234 |
| | $ | 2,383,932 |
| | $ | 2,434,386 |
| |
| Acquisitions | — |
| | — |
| | 39,269 |
| | — |
| | — |
| | — |
| | — |
| | — |
| | — |
| | 39,269 |
| | — |
| |
| Sales | (6,641 | ) | | (2,780 | ) | | — |
| | — |
| | — |
| | — |
| | — |
| | — |
| | — |
| | (9,421 | ) | | — |
| |
| Principal repayments | (129,122 | ) | | (94,005 | ) | | (63,583 | ) | | (59,854 | ) | | (76,144 | ) | | (79,375 | ) | | (74,954 | ) | | (93,916 | ) | | (74,530 | ) | | (286,710 | ) | | (230,473 | ) | |
| Transfers between portfolios | 8,431 |
| | 43,250 |
| | 17,144 |
| | 81,639 |
| | 100,533 |
| | 31,936 |
| | 55,775 |
| | 273,994 |
| | (20,045 | ) | | 68,825 |
| | 188,244 |
| |
| Changes in fair value, net | 7,667 |
| | 35,548 |
| | 28,108 |
| | 41,485 |
| | (17,063 | ) | | (15,010 | ) | | (39,422 | ) | | (14,494 | ) | | 3,143 |
| | 71,323 |
| | (71,495 | ) | |
| Ending fair value | $ | 2,267,218 |
| | $ | 2,386,883 |
| | $ | 2,404,870 |
| | $ | 2,383,932 |
| | $ | 2,320,662 |
| | $ | 2,313,336 |
| | $ | 2,375,785 |
| | $ | 2,434,386 |
| | $ | 2,268,802 |
| | $ | 2,267,218 |
| | $ | 2,320,662 |
| |
| | | | | | | | | | | | | | | | | | | | | | | |
| Business Purpose Residential Loans | | | | | | | | | | | | | | | | | | | | | | |
| Beginning carrying value | $ | 250,854 |
| | $ | 160,612 |
| | $ | 141,258 |
| | $ | 115,620 |
| | $ | — |
| | $ | — |
| | $ | — |
| | $ | — |
| | $ | — |
| | $ | 141,258 |
| | $ | — |
| |
| Originations | 126,742 |
| | 134,133 |
| | 35,968 |
| | — |
| | — |
| | — |
| | — |
| | — |
| | — |
| | 296,843 |
| | — |
| |
| Acquisitions | — |
| | — |
| | 29,093 |
| | 41,563 |
| | 126,214 |
| | — |
| | — |
| | — |
| | — |
| | 29,093 |
| | 126,214 |
| |
| Sales | (3,306 | ) | | (22,811 | ) | | (20,590 | ) | | — |
| | — |
| | — |
| | — |
| | — |
| | — |
| | (46,707 | ) | | — |
| |
| Principal repayments | (40,479 | ) | | (22,939 | ) | | (20,992 | ) | | (16,469 | ) | | (10,912 | ) | | — |
| | — |
| | — |
| | — |
| | (84,410 | ) | | (10,912 | ) | |
| Transfers between portfolios | — |
| | — |
| | (4,996 | ) | | — |
| | — |
| | — |
| | — |
| | — |
| | — |
| | (4,996 | ) | | — |
| |
| Changes in fair value, net | 2,224 |
| | 1,859 |
| | 871 |
| | 544 |
| | 318 |
| | — |
| | — |
| | — |
| | — |
| | 4,954 |
| | 318 |
| |
| Ending fair value | $ | 336,035 |
| | $ | 250,854 |
| | $ | 160,612 |
| | $ | 141,258 |
| | $ | 115,620 |
| | $ | — |
| | $ | — |
| | $ | — |
| | $ | — |
| | $ | 336,035 |
| | $ | 115,620 |
| |
| | | | | | | | | | | | | | | | | | | | | | | |
| Securities | | | | | | | | | | | | | | | | | | | | | | |
| Beginning fair value | $ | 1,477,486 |
| | $ | 1,543,152 |
| | $ | 1,452,494 |
| | $ | 1,470,084 |
| | $ | 1,453,936 |
| | $ | 1,357,720 |
| | $ | 1,476,510 |
| | $ | 1,356,272 |
| | $ | 1,218,503 |
| | $ | 1,452,494 |
| | $ | 1,476,510 |
| |
| Acquisitions | 68,167 |
| | 91,960 |
| | 157,472 |
| | 132,457 |
| | 161,534 |
| | 223,022 |
| | 144,465 |
| | 204,733 |
| | 188,138 |
| | 317,599 |
| | 529,021 |
| |
| Sales | (255,679 | ) | | (164,372 | ) | | (67,358 | ) | | (109,782 | ) | | (106,972 | ) | | (103,685 | ) | | (234,509 | ) | | (75,887 | ) | | (47,076 | ) | | (487,409 | ) | | (445,166 | ) | |
| Effect of principal repayments | (22,286 | ) | | (13,953 | ) | | (19,356 | ) | | (22,562 | ) | | (26,571 | ) | | (17,022 | ) | | (15,707 | ) | | (21,503 | ) | | (19,497 | ) | | (55,595 | ) | | (59,300 | ) | |
| Transfers between portfolios | — |
| | (4,951 | ) | | — |
| | (6,090 | ) | | (11,091 | ) | | — |
| | — |
| | — |
| | — |
| | (4,951 | ) | | (11,091 | ) | |
| Change in fair value, net | 17,738 |
| | 25,650 |
| | 19,900 |
| | (11,613 | ) | | (752 | ) | | (6,099 | ) | | (13,039 | ) | | 12,895 |
| | 16,204 |
| | 63,288 |
| | (19,890 | ) | |
| Ending fair value | $ | 1,285,426 |
| | $ | 1,477,486 |
| | $ | 1,543,152 |
| | $ | 1,452,494 |
| | $ | 1,470,084 |
| | $ | 1,453,936 |
| | $ | 1,357,720 |
| | $ | 1,476,510 |
| | $ | 1,356,272 |
| | $ | 1,285,426 |
| | $ | 1,470,084 |
| |
| | | | | | | | | | | | | | | | | | | | | | | | |
| |
| (1) | Amounts presented include loans held-for-investment at Redwood that are financed at FHLB and exclude loans from consolidated securitization entities. |
|
| | |
| THE REDWOOD REVIEW I 3RD QUARTER 2019 | | Table 8: Loans and Securities Activity 36 |
|
| | | | | | | | | | | | | | | | | | | | | | | | | | | | | | | | | | | | | |
| Table 9: Investment Portfolio Detailed Balances ($ in thousands) |
| | | | | | | | | | | | | | | | | | | |
| | 2019 Q3 | | 2019 Q2 | | 2019
Q1 | | 2018
Q4 | | 2018
Q3 | | 2018
Q2 | | 2018 Q1 | | 2017
Q4 | | 2017
Q3 | |
| Residential Loans Held-for-Investment at Redwood | $ | 2,267,218 |
| | $ | 2,386,883 |
| | $ | 2,404,870 |
| | $ | 2,383,932 |
| | $ | 2,320,662 |
| | $ | 2,313,336 |
| | $ | 2,375,785 |
| | $ | 2,434,386 |
| | $ | 2,268,802 |
| |
| Business Purpose (Residential Bridge) Loans Held-for-Investment | 225,601 |
| | 159,353 |
| | 103,916 |
| | 112,798 |
| | 95,515 |
| | — |
| | — |
| | — |
| | — |
| |
| | | | | | | | | | | | | | | | | | | |
| Securities with Sub-Categories | | | | | | | | | | | | | | | | | | |
| Residential | | | | | | | | | | | | | | | | | | |
| Senior - New Issue | 50,497 |
| | 76,923 |
| | 79,389 |
| | 48,553 |
| | 48,076 |
| | 49,099 |
| | — |
| | — |
| | — |
| |
| Senior - Legacy | 33,457 |
| | 44,467 |
| | 47,755 |
| | 87,615 |
| | 114,628 |
| | 147,490 |
| | 165,610 |
| | 179,863 |
| | 192,265 |
| |
| Senior - IO | 41,831 |
| | 49,019 |
| | 57,542 |
| | 62,601 |
| | 64,673 |
| | 64,018 |
| | 53,957 |
| | 38,990 |
| | 40,671 |
| |
| Mezzanine - New issue | 158,080 |
| | 187,947 |
| | 238,685 |
| | 207,124 |
| | 210,110 |
| | 221,586 |
| | 210,567 |
| | 325,162 |
| | 328,659 |
| |
| Subordinate - New issue | 206,064 |
| | 205,074 |
| | 197,845 |
| | 202,646 |
| | 251,655 |
| | 232,047 |
| | 208,417 |
| | 224,581 |
| | 209,554 |
| |
| Subordinate - Agency CRT | 140,881 |
| | 208,603 |
| | 274,112 |
| | 276,894 |
| | 235,720 |
| | 239,767 |
| | 245,654 |
| | 300,713 |
| | 286,780 |
| |
| Subordinate - Legacy | 12,488 |
| | 13,986 |
| | 15,163 |
| | 15,993 |
| | 16,255 |
| | 17,950 |
| | 19,707 |
| | 22,586 |
| | 26,920 |
| |
| Re-performing | 172,759 |
| | 163,545 |
| | 120,415 |
| | 121,989 |
| | 111,713 |
| | 83,194 |
| | 76,800 |
| | 60,590 |
| | 28,352 |
| |
| Multifamily (mezzanine) | 469,369 |
| | 527,922 |
| | 512,246 |
| | 429,079 |
| | 417,254 |
| | 398,785 |
| | 377,008 |
| | 324,025 |
| | 243,071 |
| |
| Total Securities on Balance Sheet | 1,285,426 |
| | 1,477,486 |
| | 1,543,152 |
| | 1,452,494 |
| | 1,470,084 |
| | 1,453,936 |
| | 1,357,720 |
| | 1,476,510 |
| | 1,356,272 |
| |
| | | | | | | | | | | | | | | | | | | |
Sequoia Choice Securities (1) | 257,205 |
| | 217,912 |
| | 215,892 |
| | 194,372 |
| | 194,739 |
| | 133,718 |
| | 87,381 |
| | 77,922 |
| | 30,975 |
| |
Freddie Mac SLST Securities (1) | 453,750 |
| | 243,323 |
| | 235,285 |
| | 228,921 |
| | — |
| | — |
| | — |
| | — |
| | — |
| |
Freddie Mac K-Series Securities (1) | 214,045 |
| | 206,600 |
| | 128,642 |
| | 125,523 |
| | 66,559 |
| | — |
| | — |
| | — |
| | — |
| |
| Adjusted Total Securities | 2,210,426 |
| | 2,145,321 |
| | 2,122,971 |
| | 2,001,310 |
| | 1,731,382 |
| | 1,587,654 |
| | 1,445,101 |
| | 1,554,432 |
| | 1,387,247 |
| |
| | | | | | | | | | | | | | | | | | | |
| Other Investments | | | | | | | | | | | | | | | | | | |
Servicer Advance Investments (2) | 31,388 |
| | 22,992 |
| | 54,363 |
| | 37,728 |
| | — |
| | — |
| | — |
| | — |
| | — |
| |
| Mortgage Servicing Rights | 39,837 |
| | 47,396 |
| | 55,284 |
| | 60,281 |
| | 63,785 |
| | 64,674 |
| | 66,496 |
| | 63,598 |
| | 62,928 |
| |
| Excess MSRs | 32,937 |
| | 33,620 |
| | 28,992 |
| | 27,312 |
| | — |
| | — |
| | — |
| | — |
| | — |
| |
| Investment in Multifamily Loan Fund | 32,158 |
| | 28,678 |
| | 22,416 |
| | — |
| | — |
| | — |
| | — |
| | — |
| | — |
| |
| Other | 20,184 |
| | 3,214 |
| | 3,586 |
| | 50,457 |
| | 49,991 |
| | 52,631 |
| | — |
| | — |
| | — |
| |
| Total earning assets | $ | 4,859,749 |
| | $ | 4,827,457 |
| | $ | 4,796,398 |
| | $ | 4,673,818 |
| | $ | 4,261,335 |
| | $ | 4,018,295 |
| | $ | 3,887,382 |
| | $ | 4,052,416 |
| | $ | 3,718,977 |
| |
| | | | | | | | | | | | | | | | | | | | |
| |
| (1) | Represents securities retained from our consolidated Sequoia Choice securitizations and securities owned in consolidated Freddie Mac SLST and Freddie Mac K-Series securitizations. |
| |
| (2) | Represents our servicer advance investments net of associated non-recourse, short-term securitization debt. |
|
| | |
| THE REDWOOD REVIEW I 3RD QUARTER 2019 | | Table 9: Investment Portfolio Detailed Balances 37 |
|
| | | | | | | | | | | | | | | | | | | | | | | | | | | | | | | | | | | | | | | | | | | | | | | | | | | | | | | | | |
| Table 10: Consolidating Balance Sheet ($ in thousands) | |
| | | | | | | | | | | | | | | | | | | | | | | | | | | | | | |
| | September 30, 2019 | | June 30, 2019 | |
| | | | Consolidated VIEs (1) | | | | | | Consolidated VIEs (1) | | | |
| | At Redwood (1) | | Legacy Sequoia | | Sequoia Choice | | Freddie Mac SLST | | Freddie Mac K-Series | | Servicing Investment | | Redwood Consolidated | | At Redwood (1) | | Legacy Sequoia | | Sequoia Choice | | Freddie Mac SLST | | Freddie Mac K-Series | | Servicing Investment | | Redwood
Consolidated | |
| Residential loans | $ | 3,193,105 |
| | $ | 429,159 |
| | $ | 2,618,316 |
| | $ | 2,441,223 |
| | $ | — |
| | $ | — |
| | $ | 8,681,803 |
| | $ | 3,443,170 |
| | $ | 457,750 |
| | $ | 2,147,356 |
| | $ | 1,235,089 |
| | $ | — |
| | $ | — |
| | $ | 7,283,365 |
| |
| Business purpose residential loans | 336,035 |
| | — |
| | — |
| | — |
| | — |
| | — |
| | 336,035 |
| | 250,854 |
| | — |
| | — |
| | — |
| | — |
| | — |
| | 250,854 |
| |
| Multifamily loans | — |
| | — |
| | — |
| | — |
| | 3,791,622 |
| | — |
| | 3,791,622 |
| | — |
| | — |
| | — |
| | — |
| | 3,749,657 |
| | — |
| | 3,749,657 |
| |
| Real estate securities | 1,285,426 |
| | — |
| | — |
| | — |
| | — |
| | — |
| | 1,285,426 |
| | 1,477,486 |
| | — |
| | — |
| | — |
| | — |
| | — |
| | 1,477,486 |
| |
| Other investments | 109,391 |
| | — |
| | — |
| | — |
| | | | 238,316 |
| | 347,707 |
| | 97,513 |
| | — |
| | — |
| | — |
| | | | 274,617 |
| | 372,130 |
| |
| Cash and cash equivalents | 373,388 |
| | — |
| | — |
| | — |
| | — |
| | 21,240 |
| | 394,628 |
| | 198,752 |
| | — |
| | — |
| | — |
| | — |
| | 19,393 |
| | 218,145 |
| |
Other assets (2) | 582,401 |
| | 1,319 |
|
| 10,821 |
| | 7,299 |
| | 11,300 |
| | 25,922 |
| | 639,062 |
| | 446,126 |
| | 2,363 |
| | 8,960 |
| | 3,786 |
| | 11,317 |
| | 27,397 |
| | 499,949 |
| |
| Total assets | $ | 5,879,746 |
| | $ | 430,478 |
| | $ | 2,629,137 |
| | $ | 2,448,522 |
| | $ | 3,802,922 |
| | $ | 285,478 |
| | $ | 15,476,283 |
| | $ | 5,913,901 |
| | $ | 460,113 |
| | $ | 2,156,316 |
| | $ | 1,238,875 |
| | $ | 3,760,974 |
| | $ | 321,407 |
| | $ | 13,851,586 |
| |
| Short-term debt | $ | 1,789,614 |
| | $ | — |
| | $ | — |
| | $ | — |
| | $ | — |
| | $ | 191,203 |
| | $ | 1,980,817 |
| | $ | 2,226,654 |
| | $ | — |
| | $ | — |
| | $ | — |
| | $ | — |
| | $ | 236,231 |
| | $ | 2,462,885 |
| |
| Other liabilities | 365,293 |
| | 456 |
|
| 8,964 |
| | 5,498 |
| | 10,805 |
| | 19,618 |
| | 410,634 |
| | 298,641 |
| | 519 |
| | 7,336 |
| | 2,774 |
| | 10,822 |
| | 18,275 |
| | 338,367 |
| |
| ABS issued | — |
| | 419,890 |
| | 2,361,111 |
| | 1,987,473 |
| | 3,577,577 |
| | — |
| | 8,346,051 |
| | — |
| | 448,862 |
| | 1,929,444 |
| | 991,766 |
| | 3,543,057 |
| | — |
| | 6,913,129 |
| |
| Long-term debt, net | 2,953,722 |
| | — |
| | — |
| | — |
| | — |
| | — |
| | 2,953,722 |
| | 2,573,173 |
| | — |
| | — |
| | — |
| | — |
| | — |
| | 2,573,173 |
| |
| Total liabilities | 5,108,629 |
| | 420,346 |
| | 2,370,075 |
| | 1,992,971 |
| | 3,588,382 |
| | 210,821 |
| | 13,691,224 |
| | 5,098,468 |
| | 449,381 |
| | 1,936,780 |
| | 994,540 |
| | 3,553,879 |
| | 254,506 |
| | 12,287,554 |
| |
| | | | | | | | | | | | | | | | | | | | | | | | | | | | | |
| Equity | 771,117 |
| | 10,132 |
|
| 259,062 |
| | 455,551 |
| | 214,540 |
| | 74,657 |
| | 1,785,059 |
| | 815,433 |
| | 10,732 |
| | 219,536 |
| | 244,335 |
| | 207,095 |
| | 66,901 |
| | 1,564,032 |
| |
| Total liabilities and equity | $ | 5,879,746 |
| | $ | 430,478 |
|
| $ | 2,629,137 |
| | $ | 2,448,522 |
| | $ | 3,802,922 |
| | $ | 285,478 |
| | $ | 15,476,283 |
| | $ | 5,913,901 |
| | $ | 460,113 |
| | $ | 2,156,316 |
| | $ | 1,238,875 |
| | $ | 3,760,974 |
| | $ | 321,407 |
| | $ | 13,851,586 |
| |
| | | | | | | | | | | | | | | | | | | | | | | | | | | | | |
| |
| (1) | The format of this consolidating balance sheet is provided to more clearly delineate between the assets belonging to consolidated securitization entities that we are required to consolidate on our balance sheet in accordance with GAAP, but which are not legally ours, and the liabilities of these consolidated entities, which are payable only from the cash flows generated by their assets and are, therefore, non-recourse to us, and the assets that are legally ours and the liabilities of ours for which there is recourse to us. |
| |
| (2) | At September 30, 2019 and June 30, 2019, other assets at Redwood included a total of $33 million and $43 million of assets, respectively, held by third-party custodians and pledged as collateral to the GSEs in connection with credit risk-sharing arrangements relating to conforming residential loans. These pledged assets can only be used to settle obligations to the GSEs under these risk-sharing arrangements. |
|
| | |
| THE REDWOOD REVIEW I 3RD QUARTER 2019 | | Table 10: Consolidating Balance Sheet 38 |
Dividends
Summary
As a REIT, Redwood is required to distribute to shareholders at least 90% of its annual REIT taxable income, excluding net capital gains. To the extent Redwood retains REIT taxable income, including net capital gains, it is taxed at corporate tax rates. Redwood also earns taxable income at its taxable REIT subsidiaries (TRS), which it is not required to distribute.
Dividends Overview
In recent years, our Board of Directors has maintained a practice of paying regular quarterly dividends, including when in excess of the amount required to comply with the provisions of the Internal Revenue Code applicable to REITs. In August 2019, the Board of Directors declared a regular dividend of $0.30 per share for the third quarter of 2019, which was paid on September 30, 2019 to shareholders of record on September 16, 2019.
Dividend Distribution Requirement
Our estimated REIT taxable income was $39 million, or $0.34 per share, for the third quarter of 2019 and $25 million, or $0.25 per share, for the second quarter of 2019. Under normal circumstances, our minimum REIT dividend requirement would be 90% of our annual REIT taxable income. However, we currently maintain a $39 million federal net operating loss carry forward (NOL) at the REIT that affords us the option of retaining REIT taxable income up to the NOL amount, tax free, rather than distributing it as dividends. Federal income tax rules require the dividends paid deduction to be applied to reduce REIT taxable income before the applicability of NOLs is considered. It is possible our estimated REIT taxable income will exceed our dividend distributions in 2019; therefore, we may utilize a portion of our NOL in 2019 and any remaining amount will carry forward into 2020.
Income Tax Characterization of Dividend for Shareholders
We currently expect all or nearly all of the distributions to shareholders in 2019 will be taxable as dividend income and a smaller portion, if any, will be a return of capital, which is generally non-taxable. Additionally, a portion of our 2019 dividend distributions are expected to be characterized as long-term capital gains for federal income tax purposes.
Beginning in 2018, the Tax Cuts and Jobs Act provides that individual taxpayers may generally deduct 20% of their ordinary REIT dividends from taxable income. This results in a maximum federal effective tax rate of 29.6% on an individual taxpayer's ordinary REIT dividends, compared to the highest marginal rate of 37%. This deduction does not apply to REIT dividends classified as qualified dividend income or long-term capital gain dividends, as those dividends are taxed at a maximum rate of 20% for individuals.
|
|
| |
| THE REDWOOD REVIEW I 3RD QUARTER 2019 |
| 40 |
|
|
| |
| N O N - G A A P M E A S U R E M E N T S |
Information about our non-GAAP financial measures is provided in this Appendix, which supplements the descriptions and information about these non-GAAP financial measures that is set forth in previous sections of this Redwood Review. In addition, this Appendix provides reconciliations of non-GAAP financial measures to the most directly comparable GAAP financial measures to the extent those reconciliations are not otherwise set forth in the previous sections of this Redwood Review or in the Financial Tables in the Appendix to this Redwood Review.
What is Core Earnings?
Core earnings is a non-GAAP measure of Redwood’s earnings and results of operations. Specifically, management has defined core earnings as: GAAP net income adjusted to (i) eliminate the impact of quarterly mark-to-market changes on the fair value of long-term investments (and associated derivatives) related to changes in benchmark interest rates and credit spreads, (ii) include the cumulative net gains or losses on long-term investments accounted for as trading securities under GAAP that were sold during the period presented, net of any gains or losses from derivatives associated with the investments sold, and (iii) include the hypothetical income taxes associated with core earnings adjustments.
In addition, beginning with the first quarter of 2019, management has also excluded from core earnings several items related to our acquisitions of 5 Arches and CoreVest. These items include: the exclusion of a one-time gain in the first quarter of 2019 associated with the re-measurement of our initial minority investment and purchase option in 5 Arches; ongoing adjustments to exclude amortization of intangible assets acquired in the 5 Arches transaction; beginning in the second quarter of 2019, changes in fair value of the contingent consideration liability related to the remaining purchase consideration for the 5 Arches platform; and for the third quarter of 2019, exclusion of certain transaction expenses associated with our acquisition of CoreVest.
What are the Core Earnings adjustments that relate to “eliminating the impact of quarterly mark-to-market changes on the fair value of long-term investments (and associated derivatives) related to changes in benchmark interest rates and credit spreads”?
Under GAAP there are quarterly mark-to-market changes in the value of our long-term investments in loans, trading securities, and other investments accounted for under the fair value option, as well as the associated derivatives, that result from changes in benchmark interest rates and credit spreads and which may not be reflective of the total return management would expect to earn from them over the longer-term. These mark-to-market changes, to the extent they do not reflect a change in basis or net interest paid or received on hedges, are eliminated from GAAP net income when management calculates core earnings.
Beginning with the first quarter of 2019, management updated its calculation of this adjustment for certain investments accounted for under the fair value option that have significant differences between expected cash interest and expected yield-to-maturity. For these assets management does not eliminate mark-to-market changes in value that are attributable to a change in basis from the expected receipt of future cash flows.
|
|
| |
| THE REDWOOD REVIEW I 3RD QUARTER 2019 |
| 41 |
|
|
| |
| N O N - G A A P M E A S U R E M E N T S |
| |
| • | Investments impacted by this change include certain multifamily mezzanine securities and B-pieces, residential securities relating to re-performing residential loans, our servicer advance investment and related excess spread investment, and beginning in the second quarter of 2019, we also included certain subordinate securities. |
| |
| • | This change was introduced because there is an increasing amount of these types of investments in Redwood’s portfolio and management believes this change represents a more precise method of eliminating mark-to-market changes in the value of these assets which may not be reflective of the total return management would expect to earn from them over the longer-term. |
During the third quarter of 2019, management updated its calculation of the quarterly change in basis for certain investments accounted for under the fair value option. This update results in presenting this aspect of core earnings more consistently with core earnings adjustments related to cumulative net gains and losses on long-term investments accounted for as trading securities – i.e., as measured against original basis consistently across these different types of investments.
What are the Core Earnings adjustments that relate to “including the cumulative net gains or losses on long-term investments accounted for as trading securities under GAAP that were sold during the period presented, net of any gains or losses from derivatives associated with the investments sold”?
The core earnings adjustments to include cumulative net gains or losses from the sale of trading securities is to ensure that core earnings presents consistently the impact of the sales of investments regardless of whether they are accounted for under GAAP as (i) trading securities or (ii) available-for-sale securities, as outlined below.
| |
| • | Under GAAP, available-for-sale securities are reported at their fair value with periodic changes in fair value recognized through the balance sheet in Shareholders’ equity. When an available-for-sale security is sold, the cumulative gain or loss since purchase is recognized through the income statement, in Realized gains, net, in the period the sale occurred. As a result, any such cumulative gains or losses are reflected in core earnings in the period the sale occurred. |
| |
| • | Under GAAP, trading securities are reported at their fair value with periodic changes in fair value recognized through the income statement in Investment fair value changes, net. Certain of these periodic changes in fair value (as described above) are excluded from core earnings. Core earnings includes an adjustment to include the cumulative net gains or losses (from purchase through the sale of the investment) for sold trading securities in the period they are sold. The result is to consistently present within core earnings the cumulative gains or losses from the sale of long-term investments, regardless of how they are accounted for under GAAP. |
|
|
| |
| THE REDWOOD REVIEW I 3RD QUARTER 2019 |
| 42 |
|
|
| |
| N O N - G A A P M E A S U R E M E N T S |
What are the Core Earnings adjustments that relate to Redwood’s acquisitions of 5 Arches and CoreVest?
The adjustments related to our acquisition of 5 Arches, which was completed during the first quarter 2019, include the elimination of the one-time gain associated with the re-measurement of our initial minority investment and purchase option in 5 Arches and an ongoing adjustment to exclude amortization of intangible assets. Additionally, beginning in the second quarter of 2019, we exclude from our calculation of core earnings changes in the fair value of the contingent consideration liability related to the remaining purchase consideration for the 5 Arches platform.
In addition, for the third quarter of 2019, we have excluded from core earnings certain transaction expenses associated with Redwood's acquisition of CoreVest, which was completed during the fourth quarter of 2019.
What are the Core Earnings adjustments that relate to “including the hypothetical income taxes associated with core earnings adjustments”?
Core earnings also includes adjustments to show the hypothetical tax provision or benefit that would be associated with the core earnings adjustments made to net income. As a REIT, we are subject to income taxes on earnings generated at our taxable REIT subsidiaries (TRS) and generally not subject to income taxes on earnings generated at the REIT (to the extent we distribute our REIT taxable income as dividends). In order to present the hypothetical income taxes associated with core earnings adjustments made to net income, estimated effective tax rates are applied to the core earnings adjustments occurring within our TRS.
Why does management believe that Core Earnings provides useful information to investors in Redwood? How does management use Core Earnings to analyze Redwood’s performance?
Management utilizes this core earnings measure internally as one way of analyzing Redwood’s performance over multiple periods, as management believes it provides useful comparative results absent the impact of certain quarterly mark-to-market changes on investments held through the end of the period presented that may not be reflective of the total return management would expect to earn from them over the longer term, and inclusive of all realized gains and losses from securities sales, regardless of accounting designations.
In addition, management believes that it is useful for core earnings to be a measure of Redwood‘s performance that eliminates the impact of several items related to our acquisitions of 5 Arches and CoreVest that management believes may not be reflective of the underlying performance of Redwood’s ongoing operations (and which, therefore, may not be reflective of their impact over the longer-term).
|
|
| |
| THE REDWOOD REVIEW I 3RD QUARTER 2019 |
| 43 |
|
|
| |
| N O N - G A A P M E A S U R E M E N T S |
Has the definition of Core Earnings changed since Redwood previously published its Core Earnings? If so, has Redwood adjusted its presentation of past period Core Earnings to reflect the updated definition?
As noted above, beginning with the first quarter of 2019, management changed its definition of core earnings to exclude from core earnings several items related to our acquisition of 5 Arches. In addition, and as also noted above, beginning with the first quarter of 2019 management updated its calculation for eliminating the impact of quarterly mark-to-market changes on the fair value of long-term investments (and associated derivatives) related to changes in benchmark interest rates and credit spreads for certain types of investments, including certain investments accounted for under the fair value option that have significant differences between expected cash interest and expected yield-to-maturity.
Beginning with the third quarter of 2019, as noted above, management has excluded from core earnings certain transaction expenses associated with our acquisition of CoreVest. In addition, during the third quarter of 2019, management updated its calculation of the quarterly change in basis for certain investments accounted for under the fair value option.
For consistency of presentation, to the extent core earnings for any period prior to the third quarter of 2019 is republished or represented, management will adjust the prior presentation of core earnings for that prior period to reflect the updated calculation methodology.
|
|
| |
| THE REDWOOD REVIEW I 3RD QUARTER 2019 |
| 44 |
|
|
| |
| N O N - G A A P M E A S U R E M E N T S |
The following table presents a reconciliation of GAAP net income to non-GAAP core earnings for the third and second quarters of 2019.
|
| | | | | | | | | | | | |
| |
| Reconciliation of Non-GAAP Core Earnings |
| ($ in millions) |
| | Three Months Ended September 30, 2019 | |
| | GAAP | | Adjustments | | Non-GAAP | |
| | | | | | | |
| Net interest income | $ | 34 |
| | $ | (3 | ) | | $ | 31 |
| |
| | | | | | | |
| Non-interest income | | | | | | |
| Mortgage banking activities, net | 10 |
| | — |
| | 10 |
| |
Investment fair value changes, net (1) | 11 |
| | (11 | ) | | — |
| |
Other income, net (2) | 2 |
| | 2 |
| | 4 |
| |
Realized gains, net (3) | 5 |
| | 20 |
| | 25 |
| |
| Total non-interest income, net | 27 |
| | 11 |
| | 38 |
| |
| | | | | | | |
Operating expenses (4) | (27 | ) | | 2 |
| | (25 | ) | |
Provision for income taxes (5) | — |
| | (1 | ) | | — |
| |
| | | | | | | |
| GAAP Net Income/Non-GAAP Core Earnings | $ | 34 |
| | $ | 9 |
| | $ | 43 |
| |
| | | | | | | |
| | Three Months Ended June 30, 2019 | |
| | GAAP | | Adjustments | | Non-GAAP | |
| | | | | | | |
| Net interest income | $ | 32 |
| | $ | 1 |
| | $ | 34 |
| |
| | | | | | | |
| Non-interest income | | | | | | |
| Mortgage banking activities, net | 19 |
| | — |
| | 19 |
| |
Investment fair value changes, net (1) | 3 |
| | (3 | ) | | — |
| |
Other income, net (2) | 2 |
| | 2 |
| | 4 |
| |
Realized gains, net (3) | 3 |
| | 13 |
| | 16 |
| |
| Total non-interest income, net | 27 |
| | 12 |
| | 40 |
| |
| | | | | | | |
Operating expenses (4) | (26 | ) | | — |
| | (26 | ) | |
Provision for income taxes (5) | (2 | ) | | (2 | ) | | (4 | ) | |
| | | | | | | |
| GAAP Net Income/Non-GAAP Core Earnings | $ | 31 |
| | $ | 12 |
| | $ | 43 |
| |
| |
| (1) | References in this Redwood Review to core investment fair value changes, net refer to GAAP investment fair value changes, net as adjusted by the amount described in the "Adjustments" column, as further described above under the heading "What is Core Earnings?" |
| |
| (2) | References in this Redwood Review to core other income net, refer to GAAP other income, net as adjusted by the amount described in the "Adjustments" column, as further described above under the heading "What is Core Earnings?" |
| |
| (3) | References in this Redwood Review to core realized gains, net refer to GAAP realized gains, net as adjusted by the amount described in the "Adjustments" column, as further described above under the heading "What is Core Earnings?" |
| |
| (4) | References in this Redwood Review to core operating expenses refer to GAAP operating expenses as adjusted by the amount described in the "Adjustments" column, as further described above under the heading "What is Core Earnings?" |
| |
| (5) | References in this Redwood Review to core provision for income taxes refer to GAAP provision for income taxes as adjusted by the amount described in the "Adjustments" column, as further described above under the heading "What is Core Earnings?" |
|
|
| |
| THE REDWOOD REVIEW I 3RD QUARTER 2019 |
| 45 |
|
|
| |
| N O N - G A A P M E A S U R E M E N T S |
What are the following non-GAAP measures and where can I find more information about them?
| |
| • | Core realized gains, net |
| |
| • | Core provision for income taxes |
All four of these non-GAAP measures correspond with line items in our income statement that are adjusted in connection with calculating core earnings as described above. Each of these four non-GAAP measures is included in the “Reconciliation of Non-GAAP Core Earnings” table above, along with a reconciliation to the most directly comparable GAAP financial measures.
What is Core Segment Contribution?
For our Investment Portfolio segment, we calculate non-GAAP core segment contribution in a manner consistent with management's definition of core earnings, as described above. Core segment contribution for our Investment Portfolio segment reflects GAAP segment contribution for our Investment Portfolio segment adjusted to reflect the portion of core earnings adjustments allocable to this segment and is shown and reconciled to GAAP segment contribution for our Investment Portfolio segment on page 17.
How are basic and diluted Core Earnings per share calculated? Where is a reconciliation of basic and diluted Core Earnings per share to basic and diluted earnings per share calculated in accordance with GAAP?
We use core earnings as described above to calculate basic and diluted core earnings per share. To calculate these measures, we follow the same methodology for calculating basic and diluted earnings per share for GAAP, but substitute core earnings for GAAP earnings in the calculation. A detailed presentation of these calculations is presented in Table 2 of the Financial Tables section of the Appendix to this Redwood Review.
What factors should be considered when comparing non-GAAP Core Earnings (and related non-GAAP measures) to GAAP financial measures?
We caution that core earnings, core other income, core realized gains, core operating expenses, core provision for income taxes, core segment contribution, and core earnings per share should not be utilized in isolation, nor should they be considered as alternatives to GAAP net income, GAAP other income, GAAP realized gains, GAAP operating expenses, GAAP provision for income taxes, GAAP segment contribution, GAAP net income per share, or other measurements of results of operations computed in accordance with GAAP.
|
|
| |
| THE REDWOOD REVIEW I 3RD QUARTER 2019 |
| 46 |
|
|
| |
| N O N - G A A P M E A S U R E M E N T S |
What supplemental information about Core Earnings is helpful to understand?
The following table presents the components of investment fair value changes, net, of our Investment Portfolio segment that are included and excluded from core earnings, by investment type, for the third and second quarters of 2019.
|
| | | | | | | | |
| |
Components of Investment Portfolio Fair Value Changes, Net by Investment Type |
| ($ in millions) |
| | Three Months Ended | |
| | 9/30/2019 | | 6/30/2019 | |
| | | | | |
| Market valuation changes on: | | | | |
| Residential loans held-for-investment at fair value | | | | |
Change in fair value from the reduction in basis (1) | $ | (2 | ) | | $ | (1 | ) | |
Other fair value changes (2) | 10 |
| | 37 |
| |
| Total change in fair value of residential loans held-for-investment | 8 |
| | 36 |
| |
| | | | | |
| Real estate securities classified as trading | | | | |
Change in fair value from the reduction in basis (1) | — |
| | 1 |
| |
Other fair value changes (2) | 42 |
| | 31 |
| |
| Total change in fair value of real estate securities | 42 |
| | 32 |
| |
| | | | | |
| Risk management derivatives | | | | |
Interest component of hedges (3) | — |
| | 1 |
| |
Other fair value changes (4) | (37 | ) | | (66 | ) | |
| Total change in fair value of risk management derivatives | (37 | ) | | (65 | ) | |
| | | | | |
| Total investment portfolio fair value changes, net | $ | 12 |
| | $ | 3 |
| |
| |
| (1) | Reflects the change in fair value due to principal changes, which is calculated as the change in principal on a given investment during the period, multiplied by the amount that the acquisition price for that investment is above or below par in percentage terms or for certain securities, the change in fair value reflecting the expected receipt of cash flows. During the third quarter of 2019, we updated our calculation of the quarterly change in basis for certain investments accounted for under the fair value option. Prior period amounts presented above have been conformed. |
| |
| (2) | Reflects changes in prepayment assumptions and credit spreads on our residential loans, trading securities and conforming risk-sharing investments primarily due to changes in benchmark interest rates. This item is excluded from management's definition of core earnings. |
| |
| (3) | Reflects the net interest paid or received on hedges associated with fair value investments. |
| |
| (4) | Reflects the change in fair value of our risk management derivatives that are associated with changes in benchmark interest rates during the period. This item is excluded from management's definition of core earnings. |
What is Economic Net Interest Income?
Economic net interest income is a non-GAAP measure of Redwood’s net interest income. Management has defined economic net interest income as GAAP net interest income adjusted to (i) include the change in basis for fair value investments (including loans held-for-investment at fair value and real estate securities classified as trading, among others) and (ii) include net interest received or paid on hedges associated with fair value investments.
|
|
| |
| THE REDWOOD REVIEW I 3RD QUARTER 2019 |
| 47 |
|
|
| |
| N O N - G A A P M E A S U R E M E N T S |
What are the Economic Net Interest Income adjustments that relate to “including the change in basis for fair value investments (including loans held-for-investment at fair value and real estate securities classified as trading, among others)”?
For loans or securities that are carried at a fair value above or below their par value, any receipt of principal (or associated change in underlying notional principal) during the period results in a realization of the premium or discount to par (the “change in basis”) that affects yield. We also treat as a “change in basis” the periodic changes in net present value reflecting the expected receipt of cash flows on certain types of investments, including principal-only securities and investments that do not generally receive cash flows until maturity. We include these “change in basis” amounts in economic net interest income as we view them similarly to discount accretion or premium amortization on an available-for-sale security, which is incorporated into interest income when calculating an effective yield.
What are the Economic Net Interest Income adjustments that relate to “including net interest received or paid on hedges associated with fair value investments”?
Many of our investments pay a fixed rate of interest and are financed with floating rate debt. As interest rates rise, net interest income for these investments decreases. However, if these investments are hedged with swaps or other derivative instruments, there is an offsetting change in the net interest received or paid on the associated hedge. By including the net interest of associated hedges in economic net interest income, it allows us to better assess our hedge-adjusted returns for investments we hedge.
Why does management believe that Economic Net Interest Income provides useful information to investors in Redwood? How does management use Economic Net Interest Income to analyze Redwood’s performance?
Management utilizes economic net interest income internally as an additional metric to analyze the performance of its investments, as it believes it presents a more comprehensive view of an investment’s current return, by including the impact of hedges it uses to manage interest rate risk on an investment and also including the change in basis of an investment that factors into its economic yield.
Has the definition of Economic Net Interest Income changed since Redwood previously published its Economic Net Interest Income? If so, has Redwood adjusted it presentation of past period Economic Net Interest Income to reflect the updated definition?
Beginning with the first quarter of 2019, management updated its calculation of the change in basis to include the periodic changes in net present value reflecting the expected receipt of cash flows on certain types of investments, including investments accounted for under the fair value option that have significant differences between expected cash interest and expected yield-to-maturity. (This change is consistent with the updated calculation, described above, of our core earnings adjustment for mark-to-market changes on these types of investments.)
|
|
| |
| THE REDWOOD REVIEW I 3RD QUARTER 2019 |
| 48 |
|
|
| |
| N O N - G A A P M E A S U R E M E N T S |
| |
| • | Investments impacted by this change include certain multifamily mezzanine securities and B-pieces, residential securities relating to re-performing residential loans, our servicer advance investment and related excess spread investment, and beginning in the second quarter of 2019, we also included certain subordinate securities accounted for under the fair value option. As noted above, these investments are principal-only securities and investments that do not generally receive cash flows until maturity. |
| |
| • | This change has been introduced because there is an increasing amount of these types of investments in Redwood’s portfolio and management believes this change represents a more precise method of determining the impact that this aspect of the change in basis for these fair value investments should have on economic net interest income. |
During the third quarter of 2019, management updated its calculation of the quarterly change in basis for certain investments accounted for under the fair value option. This update results in presenting this aspect of core earnings more consistently with core earnings adjustments related to cumulative net gains and losses on long-term investments accounted for as trading securities – i.e., as measured against original basis consistently across these different types of investments.
As noted above with respect to core earnings, for consistency of presentation, to the extent economic net interest income for any period prior to the third quarter of 2019 is republished or represented, management will adjust the prior presentation of economic net interest income for that prior period to reflect the updated calculation methodology.
The following table presents a reconciliation of GAAP net interest income to non-GAAP economic net interest income for the third and second quarters of 2019.
|
| | | | | | | | |
| |
| Reconciliation to Non-GAAP Economic Net Interest Income |
| ($ in millions) |
| | Three Months Ended | |
| | 9/30/2019 | | 6/30/2019 | |
| | | | | |
| Net interest income | $ | 34 |
| | $ | 32 |
| |
| | | | | |
| Adjustments | | | | |
| Change in basis of fair value investments | (2 | ) | | (1 | ) | |
| Interest component of hedges | — |
| | 2 |
| |
| | | | | |
| Non-GAAP economic net interest income | $ | 31 |
| | $ | 34 |
| |
Consistent with the methodology described above, we also calculate economic net interest income for our Investment Portfolio segment, which is shown and reconciled to GAAP net interest income for our Investment Portfolio segment on page 17.
|
|
| |
| THE REDWOOD REVIEW I 3RD QUARTER 2019 |
| 49 |
|
|
| |
| N O N - G A A P M E A S U R E M E N T S |
What factors should be considered when comparing non-GAAP Economic Net Interest Income to GAAP net interest income?
We caution that economic net interest income should not be utilized in isolation, nor should it be considered as an alternative to GAAP net interest income.
What are non-GAAP Other Fair Value Changes, Net and Core Investment Fair Value Changes, Net? What are the adjustments made to GAAP Investment Fair Value Changes, Net to calculate these non-GAAP measures?
Other fair value changes, net and core investment fair value changes, net are non-GAAP measures of Redwood’s investment fair value changes, net.
| |
| • | Non-GAAP other fair value changes, net represents GAAP investment fair value changes, net, adjusted to exclude the amount of fair value changes that are included in non-GAAP economic net interest income, as described above. Effectively, this amount of fair value changes is excluded from investment fair value changes, net and included with net interest income to calculate economic net interest income. |
| |
| • | Core investment fair value changes, net represents non-GAAP other fair value changes, net, adjusted to exclude the component of mark-to-market changes on long-term investments and associated derivatives that were not otherwise included in the adjustment to arrive at non-GAAP other fair value changes, net. |
Why does management calculate non-GAAP Other Fair Value Changes, Net and Core Investment Fair Value Changes, Net? How are these two non-GAAP measures used by management?
Both of these measures are used in, and result from, the calculation of economic net interest income and our Investment Portfolio segment’s economic net interest income. As a result, they are calculated and used for the same reasons, as described above, that management calculates and uses economic net interest income.
|
|
| |
| THE REDWOOD REVIEW I 3RD QUARTER 2019 |
| 50 |
|
|
| |
| N O N - G A A P M E A S U R E M E N T S |
The following table presents a reconciliation of GAAP investment fair value changes, net to non-GAAP other fair value changes, net and non-GAAP core investment fair value changes, net, in each case for the third and second quarters of 2019.
|
| | | | | | | | |
| |
Reconciliation to Non-GAAP Other Fair Value Changes, Net and Non-GAAP Core Investment Fair Value Changes, Net |
| ($ in millions) |
| | Three Months Ended | |
| | 9/30/2019 | | 6/30/2019 | |
| | | | | |
| Investment fair value changes, net | $ | 11 |
| | $ | 3 |
| |
| | | | | |
| Adjustments | | | | |
| Change in basis of fair value investments | 2 |
| | 1 |
| |
| Interest component of hedges | — |
| | (2 | ) | |
| | | | | |
| Non-GAAP Other Fair Value Changes, Net | $ | 14 |
| | $ | 2 |
| |
| Core adjustments | | | | |
| Eliminate mark-to-market changes on long-term investments and associated derivatives | (14 | ) | | (2 | ) | |
| Non-GAAP Core Investment Fair Value Changes, Net | $ | — |
| | $ | — |
| |
What factors should be considered when comparing Non-GAAP Other Fair Value Changes, Net and Core Investment Fair Value Changes, Net to GAAP investment fair value changes, net?
We caution that neither non-GAAP other fair value changes, net nor core investment fair value changes, net should be utilized in isolation, nor should either of them be considered as an alternative to GAAP investment fair value changes, net.
|
|
| |
| THE REDWOOD REVIEW I 3RD QUARTER 2019 |
| 51 |
|
|
| |
| F O R W A R D - L O O K I N G S T A T E M E N T S |
As noted above under the heading “Forward-Looking Statements,” this Redwood Review contains forward-looking statements within the meaning of the safe harbor provisions of the Private Securities Litigation Reform Act of 1995. Forward-looking statements involve numerous risks and uncertainties. Our actual results may differ from our expectations, estimates, and projections and, consequently, you should not rely on these forward-looking statements as predictions of future events. Forward-looking statements are not historical in nature and can be identified by words such as “anticipate,” “estimate,” “will,” “should,” “expect,” “believe,” “intend,” “seek,” “plan,” and similar expressions or their negative forms, or by references to strategy, plans, goals, or intentions. These forward-looking statements are subject to risks and uncertainties, including, among other things, those described in our Annual Report on Form 10-K under the caption “Risk Factors.” Other risks, uncertainties, and factors that could cause actual results to differ materially from those projected are described below and may be described from time to time in reports we file with the Securities and Exchange Commission, including reports on Forms 10-K, 10-Q, and 8-K. We undertake no obligation to update or revise forward-looking statements, whether as a result of new information, future events, or otherwise.
Statements regarding the following subjects, among others, are forward-looking by their nature: (i) statements we make regarding Redwood's business strategy and strategic focus, including statements relating to our overall market position, strategy and long-term prospects (including trends driving the flow of capital in the housing finance market, our strategic initiatives designed to capitalize on those trends, our ability to attract capital to finance those initiatives, our approach to raising capital, our ability to pay higher sustainable dividends in the future, and the prospects for federal housing finance reform); (ii) statements related to our financial outlook and expectations for 2019, including with respect to: 2019 GAAP earnings (including our recourse debt to equity leverage ratio), our investment portfolio (including target return on equity, expectations regarding portfolio economic net interest income and realized gains associated with portfolio optimization, and target capital allocation), residential mortgage banking activities (including target return on equity, expectations regarding gross margins and volume growth, and target capital allocation), business purpose mortgage banking activities (including target return on equity, target capital allocation, and expectations regarding the creation of new accretive investments for our investment portfolio), corporate operating expenses, and economic net interest income (including anticipated key drivers towards increased economic net interest income); (iii) statements related to our investment portfolio, including target returns on our RPL securities, our RPL investment strategy, and the view that a significant percentage of the underlying borrowers will cure their persistent delinquency history and continue paying steadily under the modified or recast terms of the loan, (iv) statements related to our residential and business purpose mortgage banking platforms, including our positioning in the market, the estimated size of the BPL market opportunity, and our commitment to growing our acquisition volume of expanded credit and non-QM loans; (v) statements relating to the potential for regulatory reform, including the expiration of the "QM Patch," shifting upwards of $185 million of non-QM loans from the GSEs to the private sector, and positioning Redwood to capitalize on resulting opportunities; (vi) statements relating to acquiring residential mortgage loans in the future that we have identified for purchase or plan
|
|
| |
| THE REDWOOD REVIEW I 3RD QUARTER 2019 |
| 52 |
|
|
| |
| F O R W A R D - L O O K I N G S T A T E M E N T S |
to purchase, including the amount of such loans that we identified for purchase during the third quarter of 2019 and at September 30, 2019, and expected fallout and the corresponding volume of residential mortgage loans expected to be available for purchase; (vii) statements regarding business purpose loan originations, loans funded, and associated funding commitments, (viii) statements relating to our estimate of our available capital (including that we estimate our available capital at September 30, 2019 was approximately $590 million, and that we believe this capital, along with additional capital from continued portfolio optimization, should be sufficient to meet our near-term capital needs); (ix) statements we make regarding future dividends, including with respect to our regular quarterly dividends in 2019; and (x) statements regarding our expectations and estimates relating to the characterization for income tax purposes of our dividend distributions, our expectations and estimates relating to tax accounting, tax liabilities and tax savings, and GAAP tax provisions, and our estimates of REIT taxable income and TRS taxable income.
Important factors, among others, that may affect our actual results include:
| |
| • | the pace at which we redeploy our available capital into new investments and initiatives; |
| |
| • | our ability to scale our platform and systems, particularly with respect to our new initiatives; |
| |
| • | interest rate volatility, changes in credit spreads, and changes in liquidity in the market for real estate securities and loans; |
| |
| • | changes in the demand from investors for residential mortgages and investments, and our ability to distribute residential mortgages through our whole-loan distribution channel; |
| |
| • | our ability to finance our investments in securities and our acquisition of residential mortgages with short-term debt; |
| |
| • | changes in the values of assets we own; |
| |
| • | general economic trends, the performance of the housing, real estate, mortgage, credit, and broader financial markets, and their effects on the prices of earning assets and the credit status of borrowers; |
| |
| • | federal and state legislative and regulatory developments, and the actions of governmental authorities, including the new U.S. presidential administration, and in particular those affecting the mortgage industry or our business (including, but not limited to, the Federal Housing Finance Agency’s rules relating to FHLB membership requirements and the implications for our captive insurance subsidiary’s membership in the FHLB); |
| |
| • | strategic business and capital deployment decisions we make; |
| |
| • | developments related to the fixed income and mortgage finance markets and the Federal Reserve’s statements regarding its future open market activity and monetary policy; |
| |
| • | our exposure to credit risk and the timing of credit losses within our portfolio; |
| |
| • | the concentration of the credit risks we are exposed to, including due to the structure of assets we hold and the geographical concentration of real estate underlying assets we own; |
| |
| • | our exposure to adjustable-rate mortgage loans; |
| |
| • | the efficacy and expense of our efforts to manage or hedge credit risk, interest rate risk, and other financial and operational risks; |
|
|
| |
| THE REDWOOD REVIEW I 3RD QUARTER 2019 |
| 53 |
|
|
| |
| F O R W A R D - L O O K I N G S T A T E M E N T S |
| |
| • | changes in credit ratings on assets we own and changes in the rating agencies’ credit rating methodologies; |
| |
| • | changes in interest rates; |
| |
| • | changes in mortgage prepayment rates; |
| |
| • | changes in liquidity in the market for real estate securities and loans; |
| |
| • | our ability to finance the acquisition of real estate-related assets with short-term debt; |
| |
| • | the ability of counterparties to satisfy their obligations to us; |
| |
| • | our involvement in securitization transactions, the profitability of those transactions, and the risks we are exposed to in engaging in securitization transactions; |
| |
| • | exposure to claims and litigation, including litigation arising from our involvement in securitization transactions; |
| |
| • | ongoing litigation against various trustees of RMBS transactions; |
| |
| • | whether we have sufficient liquid assets to meet short-term needs; |
| |
| • | our ability to successfully compete and retain or attract key personnel; |
| |
| • | our ability to adapt our business model and strategies to changing circumstances; |
| |
| • | changes in our investment, financing, and hedging strategies and new risks we may be exposed to if we expand our business activities; |
| |
| • | our exposure to a disruption or breach of the security of our technology infrastructure and systems; |
| |
| • | exposure to environmental liabilities; |
| |
| • | our failure to comply with applicable laws and regulations; |
| |
| • | our failure to maintain appropriate internal controls over financial reporting and disclosure controls and procedures; |
| |
| • | the impact on our reputation that could result from our actions or omissions or from those of others; changes in accounting principles and tax rules; |
| |
| • | our ability to maintain our status as a REIT for tax purposes; |
| |
| • | limitations imposed on our business due to our REIT status and our status as exempt from registration under the Investment Company Act of 1940; |
| |
| • | decisions about raising, managing, and distributing capital; and |
| |
| • | other factors not presently identified. |
|
|
| |
| THE REDWOOD REVIEW I 3RD QUARTER 2019 |
| 54 |