Exhibit 99.2
|
|
| |
| T A B L E O F C O N T E N T S |
|
| |
| Introduction | |
| | |
| Shareholder Letter | |
| | |
| Current Company Update | |
| | |
| Quarterly Results | |
| | |
Ñ First Quarter Overview | |
| | |
Ñ Quarterly Earnings and Analysis | |
| | |
Ñ Book Value | |
| | |
Ñ Segment Results | |
| | |
| Pro Forma Financial Information | |
| | |
Ñ Capital Allocations | |
| | |
Ñ Recourse Debt Analysis | |
| | |
| Quarterly Positions | |
| | |
Ñ Credit Overview | |
| | |
Ñ Mortgage Servicing Advance Obligations | |
| | |
| Financial Tables | |
| | |
| Appendix | |
| | |
Ñ Segment Overview | |
| | |
Ñ Dividends and Taxable Income | |
| | |
Ñ Forward-Looking Statements | |
| | |
| Endnotes | |
|
|
| |
| |
| THE REDWOOD REVIEW I 1ST QUARTER 2020 |
| 1 |
Note to Readers:
We file annual reports (on Form 10-K) and quarterly reports (on Form 10-Q) with the Securities and Exchange Commission. These filings and our earnings press releases provide information about Redwood and our financial results in accordance with generally accepted accounting principles (GAAP). These documents, as well as information about our business and a glossary of terms we use in this and other publications, are available through our website, www.redwoodtrust.com. We encourage you to review these documents.
Within this document, in addition to our GAAP results, we also present certain non-GAAP measures. When we present a non-GAAP measure, we accompany it with a description of that measure and a reconciliation to the comparable GAAP measure.
References herein to “Redwood,” the “company,” “we,” “us,” and “our” include Redwood Trust, Inc. and its consolidated subsidiaries. Note that because we generally round numbers in the tables to millions, except per share amounts, some numbers may not foot due to rounding. References to the “first quarter” refer to the quarter ended March 31, 2020, and references to the “fourth quarter” refer to the quarter ended December 31, 2019, unless otherwise specified.
Forward-looking statements:
This Redwood Review contains forward-looking statements within the meaning of the safe harbor provisions of the Private Securities Litigation Reform Act of 1995. Forward-looking statements involve numerous risks and uncertainties. Our actual results may differ from our expectations, estimates, and projections and, consequently, you should not rely on these forward-looking statements as predictions of future events. Forward-looking statements are not historical in nature and can be identified by words such as “anticipate,” “estimate,” “will,” “should,” “expect,” “believe,” “intend,” “seek,” “plan,” and similar expressions or their negative forms, or by references to strategy, plans, goals, or intentions. These forward-looking statements are subject to risks and uncertainties, including, among other things, those described in our Annual Report on Form 10-K under the caption “Risk Factors” and in our Current Report on Form 8-K filed on April 2, 2020. Many of these risks and uncertainties have been, and will be, exacerbated by the COVID-19 pandemic and any worsening of the global business and economic environment as a result. Other risks, uncertainties, and factors that could cause actual results to differ materially from those projected are described below and may be described from time to time in reports we file with the Securities and Exchange Commission, including reports on Forms 10-K, 10-Q, and 8-K. We undertake no obligation to update or revise forward-looking statements, whether as a result of new information, future events, or otherwise.
|
|
| Detailed endnotes are included at the end of this Redwood Review. |
| |
| THE REDWOOD REVIEW I 1ST QUARTER 2020 |
| 2 |
Statements regarding the following subjects, among others, are forward-looking by their nature: statements we make regarding Redwood’s business strategy and strategic focus, statements related to our financial outlook and expectations for 2020 and future years, statements regarding our available capital and sourcing additional capital both internally and from the capital markets, and other statements regarding pending business activities and expectations and estimates relating to our business and financial results. Additional detail regarding the forward-looking statements in this Redwood Review and the important factors that may affect our actual results in 2020 are described in the Appendix of this Redwood Review under the heading “Forward-Looking Statements.”
Pro forma financial information:
This Redwood Review also contains selected pro forma financial information, giving effect to pending asset sale transactions and certain other activity that occurred on or prior to May 6, 2020, as if the transactions and activity had occurred on March 31, 2020. The pro forma financial data as of March 31, 2020 reflect our estimates with respect to such information, based on information currently available to management and a number of assumptions, and may vary from our actual results. We make no assurance that we will be able to complete these asset sale transactions during the expected time period on attractive terms or at all, including asset sales we have entered into that have not yet settled. The pro forma financial information is not necessarily indicative of the expected financial position or results of Redwood’s operations for the first quarter of 2020, the second quarter of 2020, or any future period. Differences could result from numerous factors, including exposure to new or increased risks as a result of the impact of the COVID-19 pandemic, changes in market conditions or benchmark interest rates, changes in Redwood’s capital structure, changes in Redwood’s portfolio of investments, changes in Redwood’s operating expenses, and for other reasons, including those discussed in our Annual Report on Form 10-K for the year ended December 31, 2019, the Current Report on Form 8-K filed on April 2, 2020, and any subsequent Quarterly Reports on Form 10-Q under the caption “Risk Factors.”
|
|
| Detailed endnotes are included at the end of this Redwood Review. |
| |
| THE REDWOOD REVIEW I 1ST QUARTER 2020 |
| 3 |
|
|
| |
| S H A R E H O L D E R L E T T E R |
Dear Fellow Shareholders:
Redwood entered the first quarter of 2020 building on the strong momentum gained over the past year. While January and February were filled with optimism and opportunities for growth, including record monthly loan volumes, dynamics quickly shifted as the spread of the novel coronavirus (COVID-19) accelerated into a global pandemic in mid-March. Significant dislocation in the financial markets quickly ensued, resulting in one of the fastest market declines in history. In the span of six weeks, the U.S. economy shed over 30 million jobs - more than we experienced during the entire Great Financial Crisis of 2007-2008. More important than the economic impact, we’ve lost more Americans to COVID-19 than we did during the entire Vietnam War. We extend our sincerest gratitude to the nurses, doctors, first responders and others who are protecting people’s lives and carrying out essential functions at substantial risk to themselves.
In the Great Financial Crisis, it was a bubble in residential housing and mortgage credit, rather than a public health pandemic, that led the way. Yet we’ve been impacted just as severely in the current crisis and in a small fraction of the time. Despite the overall strong credit quality and underlying performance of our residential and business-purpose loan assets, uncertainty related to the pandemic and its impact on the economy triggered a collapse in liquidity for any sector not explicitly supported by the federal government. And as we disclosed on April 2, 2020, our balance sheet sustained heavy losses as a result.
In our early April disclosure, we estimated that book value per share at March 31, 2020 would be between $7.03 and $7.67, which excluded any potential decline in the value of our intangible assets. Actual book value results at March 31, 2020 were consistent with this prior estimate (i.e., GAAP book value at March 31, 2020 was $6.32 per share after giving effect to a $(0.78) per share impact from the impairment of goodwill). These declines were driven by widespread panic among market participants and the systematic repricing of mortgage-related assets financed by large financial institutions. Importantly, however, nearly two-thirds of the declines in our investments, or $(5.36) per share, were negative mark-to-market adjustments on assets that remained on our balance sheet at quarter end that we generally expect to hold for the longer term. While we can’t be sure exactly where the economy goes from here, we believe our portfolio is well-positioned to recover meaningful value from quarter-end levels in the event market technicals subside and our nation gets back to work.
While no playbook existed to manage the sheer speed at which this economic downturn occurred, we took necessary and timely actions to preserve our franchise. With our employees working remotely, and with the help of our strongest counterparties, we managed to significantly reposition our balance sheet and boost our liquidity. As a result, at May 6, 2020, our unrestricted cash balance was $552 million. Additionally, our outstanding secured debt that remains subject to margin calls - primarily loan warehouse facilities used to aggregate residential and business purpose loans through our origination and acquisition activities - had declined from $4.2 billion at December 31, 2019 to approximately $1.1 billion at March 31, 2020 on a pro forma basis,(1) with several initiatives well underway that we expect will reduce it even further.
|
|
| Detailed endnotes are included at the end of this Redwood Review. |
| |
| THE REDWOOD REVIEW I 1ST QUARTER 2020 |
| 4 |
|
|
| |
| S H A R E H O L D E R L E T T E R |
One of the actions we took to preserve liquidity was to delay the payment of our $0.32 per share first quarter dividend, which was originally scheduled to be paid on March 30, 2020. While this was a difficult decision to make, we believe it was in Redwood’s best interest while we navigated through the onset of this crisis. We are pleased to have recently announced that the first quarter dividend is now scheduled to be paid fully in cash on May 8, 2020. We’ve taken, and continue to take, myriad additional steps to address the various impacts of the pandemic, many of which we explain in this Redwood Review or will further detail during our first quarter earnings call. The pain this crisis has bestowed upon our workforce, our shareholders, our business partners, and our friends and families has been acute and severe. While it will take time for our industry to recover from the economic fallout caused by this health crisis, we are cautiously optimistic that both Redwood, and the broader economy, can begin to turn the corner and resume more normalized business activities in the coming weeks and months.
What do we expect the post-crisis world to look like for Redwood? We can start with what we know. We know that the Fed took lessons learned from the last crisis and quickly moved to support the federally guaranteed mortgage market, and through its Agency mortgage-backed securities (MBS) purchase program, has driven Agency-conforming mortgage rates back to record lows. This should become a medium-term positive for the residential mortgage market, as it will allow many Agency-eligible borrowers to refinance their home loans, reduce their monthly payments, and free up cash to spend on other pressing household and family needs. And while the private residential lending markets did not receive this type of governmental support, we expect mortgage rates for these products to re-correlate with traditional benchmark rates over time. These benchmarks are significantly lower than before this crisis began and are expected to continue converging toward zero until the economy begins to grow again.
We also know that traditional sources of funding for mortgage aggregators - namely loan warehouse facilities - will need to be reimagined with the potential for another health crisis in mind. The business of aggregating, structuring, and distributing exposure to mortgage loans has always required financing to accommodate the scale, diversification needs, and return thresholds of whole loan and securities investors. In the past, the quality of the assets financed drove the structure and pricing of these facilities. Going forward, we’ll need to assume the prospect of another wave of COVID-19 impacts (or another health pandemic), a resulting shutdown of many or most of the significant components of the U.S. economy, and the associated market effects. Working with our lending counterparties to recast our borrowing facilities with these factors in mind is a necessary step to re-growing our loan origination and acquisition volumes. To that end, since April 30, 2020, we have closed two new non-marginable loan warehouse facilities to provide financing on business purpose and residential whole loans previously financed under marginable facilities.
|
|
| Detailed endnotes are included at the end of this Redwood Review. |
| |
| THE REDWOOD REVIEW I 1ST QUARTER 2020 |
| 5 |
|
|
| |
| S H A R E H O L D E R L E T T E R |
From a product perspective, we continue to believe in housing credit. The reforms undertaken since the Great Financial Crisis, coupled with discipline among both originators and investors, have created a cohort of high-quality residential and business purpose loan products that should continue to perform well through this crisis. The substantial improvements exhibited by the private mortgage sector in recent years should accelerate our market’s recovery relative to the last crisis. We also believe that the strength of our underwriting and knowledge of the loans we’ve originated or flowed through our conduits has the potential to differentiate our platform going forward.
But there remain significant challenges we must manage before turning the page on this crisis. We continue to monitor trends in borrower-requested loan forbearance closely, as well as the financial health of loan servicers. Unhelpful and loose rhetoric stemming from housing officials in Washington has perpetuated market panic and diluted otherwise unified efforts from the Federal Reserve, Congress, Treasury, and other stakeholders to support consumers through this health pandemic. One area that has already been impacted is the home purchase market, where borrowers are experiencing significantly tighter credit terms due to uncertainty amongst lenders on whether there will be reliable liquidity for newly originated loans.
But as is often said, the biggest challenges often present the greatest opportunities. Our franchise remains intact and our focus will be emerging from this crisis with an enhanced business model that is capable of delivering meaningful value to our shareholders while taking into account the likelihood of a prolonged recession and possible resurgence of COVID-19 in the coming months. Our posture will remain defensive in how we structure and manage around these significant risks, but we believe we will find the best path forward. With competition across our business lines expected to be significantly reduced, the need for our sourcing and structuring capabilities - especially with tighter underwriting criteria at banks - will remain strong.
Thank you for your continued support.
|
| | |
| | |
| Christopher J. Abate | | Dashiell I. Robinson |
| Chief Executive Officer | | President |
|
|
| Detailed endnotes are included at the end of this Redwood Review. |
| |
| THE REDWOOD REVIEW I 1ST QUARTER 2020 |
| 6 |
|
|
| |
| C U R R E N T C O M P A N Y U P D A T E |
Current Company Update
On April 2, 2020, we published a company update that detailed key actions we had taken through March 27, 2020 as a result of the COVID-19 pandemic and the associated prospects of a potentially prolonged economic downturn. That update can be found as a Current Report on Form 8-K within the “Investor Information-SEC Filings” section of our website at www.redwoodtrust.com.
In this Redwood Review, we provide further updates on the actions we continue to take in preparation for further economic impacts that may be caused by the ongoing pandemic. Where practicable, we've included select pro forma information and quarter-to-date information for the second quarter of 2020. This information, combined with our first quarter results, is intended to provide more recent insight into these actions and their expected impact to our business, as well as how we are seeking to position Redwood as we navigate this complex and volatile environment.
Liquidity
As of May 6, 2020, we had unrestricted cash of $552 million and had met all margin calls due.
Updated Estimate of Book Value (1)
On a preliminary basis, we estimate that our GAAP book value per common share as of April 30, 2020 was approximately 5% higher than GAAP book value per common share at March 31, 2020. This increase was primarily driven by observed spread tightening in many areas of our investment portfolio, recovering some of the mark-to-market losses we recorded in the first quarter.
Recent Asset Sales
Between April 1, 2020 and April 30, 2020, we settled sales of residential mortgage loans for aggregate proceeds of $1.5 billion and repaid $1.3 billion of associated borrowings. Additionally, as of April 30, 2020, we had entered into agreements to sell residential mortgage loans with a principal balance of $0.5 billion, which transactions are expected to settle on or before June 4, 2020, subject to customary closing conditions. Also, between April 1, 2020 and April 30, 2020, we completed the sale of $51 million of securities and repaid associated borrowings. Further detail on these transactions, including pro forma information and the expected impact to our balance sheet are presented in the Pro Forma Financial Information section that follows in this Redwood Review.
Changes to our Funding Structure
During the last several weeks, we have made significant progress de-levering our balance sheet through asset sales and debt repayments. In preparation for the potential of a prolonged recession, we have generated a substantial amount of cash and reduced our exposure to further volatility in asset prices by reducing both our marginable and absolute debt balances.
We have also made meaningful progress on plans to replace a significant amount of our remaining marginable warehouse facilities currently financing our whole-loan portfolios with new non-marginable facilities and other term facilities.
|
|
| Detailed endnotes are included at the end of this Redwood Review. |
| |
| THE REDWOOD REVIEW I 1ST QUARTER 2020 |
| 7 |
|
|
| |
| C U R R E N T C O M P A N Y U P D A T E |
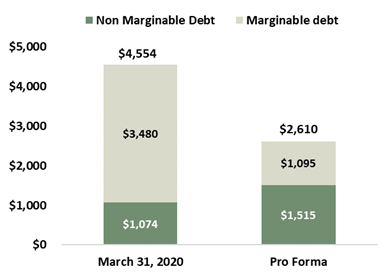
Inclusive of our asset sales and associated debt repayments through April 30, 2020, and taking into account two new non-marginable loan warehouse facilities we closed since April 30th, on a pro forma basis(1) we had reduced our total recourse debt to approximately $2.6 billion and our total marginable debt to approximately $1.1 billion, compared to $5.1 billion of total recourse debt and $4.2 billion of marginable debt at December 31, 2019. A substantial amount of these reductions were associated with our FHLBC borrowing facility, which, as previously disclosed, we decided to begin to repay in March 2020.
Using our March 31, 2020 pro forma total recourse debt of $2.6 billion and our tangible book value at March 31, 2020, we estimate our March 31, 2020 recourse leverage ratio would be 4.0x on a pro forma basis.(2)
Operations Update
We have undertaken a series of actions to help ensure the safety and productivity of our employees and help prevent the spread of COVID-19 among our workforce. Substantially all of our employees have been working remotely since March 16, 2020. We are maintaining our remote working policies to be consistent with actions taken and statements made by state and local government officials. In addition, we have implemented and tested our business continuity protocols to ensure the ongoing functional operation of our business as we work remotely. When applicable state and local guidelines allow our offices to fully reopen, we will do so only when we are confident that we have the processes and practices in place to safeguard the health and well-being of our employees.
|
|
| Detailed endnotes are included at the end of this Redwood Review. |
| |
| THE REDWOOD REVIEW I 1ST QUARTER 2020 |
| 8 |
|
|
| |
| Q U A R T E R L Y R E S U L T S |
First Quarter Overview
|
| | | | | | | | |
| |
| Key Financial Results and Metrics |
| | |
| | Three Months Ended | |
| | 3/31/2020 | | 12/31/2019 | |
| | | | | |
| Earnings (Loss) per Share | $ | (8.28 | ) | | $ | 0.38 |
| |
| Book Value per Share | $ | 6.32 |
| | $ | 15.98 |
| |
| Dividend per Share | $ | 0.32 |
| | $ | 0.30 |
| |
| Unrestricted Cash (in millions) | $ | 375 |
| | $ | 188 |
| |
| | | | | |
| |
| Ñ | Our first quarter 2020 results were significantly impacted by the COVID-19 pandemic, which ultimately led to substantial losses on our investments and an overall loss for the quarter. Nearly two-thirds of our investment losses, or $(5.36) per share, were on assets we continued to hold at March 31, 2020 that we generally have the intention to hold for longer-term investment. The remainder of our investment losses, or $(3.08) per share, were on assets we sold and hedges we settled during the first quarter of 2020, and assets that we had either entered into agreements to sell or that we have the intent to sell in the near-term. While our operating businesses saw increased volumes early in the first quarter, as markets became dislocated in March, profitability was negatively impacted due to less favorable execution on securitizations we completed in March, and lower marks on the remaining loan inventories we held at quarter-end. Additionally, as a result of the recent market dislocation, we determined all of the goodwill on our balance sheet was impaired, resulting in an expense of $(0.78) per share. |
| |
| Ñ | We are not disclosing non-GAAP core earnings for the first quarter of 2020, as we determined that this measure, as we have historically calculated it, does not appropriately reflect the economic impact of the COVID-19 pandemic on our results. As financial markets stabilize, we will evaluate whether core earnings or other non-GAAP measures would help both management and investors evaluate our operating performance for future periods. |
| |
| Ñ | On March 27, 2020, we announced the deferral of the payment of our previously declared first quarter dividend of $0.32 per share, which was originally scheduled to be paid on March 30, 2020. On May 6, 2020, we announced the first quarter dividend will now be paid fully in cash on May 8, 2020. |
| |
| Ñ | Our unrestricted cash position increased meaningfully at March 31, 2020, as we repositioned our balance sheet to generate additional liquidity. |
|
|
| Detailed endnotes are included at the end of this Redwood Review. |
| |
| THE REDWOOD REVIEW I 1ST QUARTER 2020 |
| 9 |
|
|
| |
| Q U A R T E R L Y R E S U L T S |
Quarterly Earnings and Analysis
Below we present GAAP net (loss) income for the first quarter of 2020 and fourth quarter of 2019.
|
| | | | | | | | |
| | |
| GAAP Net (Loss) Income |
| ($ in millions, except per share data) |
| | Three Months Ended | |
| | 3/31/2020 | | 12/31/2019 | |
| | | | | |
| Net interest income | | | | |
| From investments | $ | 43 |
| | $ | 38 |
| |
| From mortgage banking activities | 8 |
| | 7 |
| |
| Total net interest income | 51 |
| | 45 |
| |
| | | | | |
| Non-interest (loss) income | | | | |
| Residential mortgage banking, net | (23 | ) | | 17 |
| |
| Business purpose mortgage banking, net | (5 | ) | | 30 |
| |
| Investment fair value changes, net | (871 | ) | | 1 |
| |
| Other income, net | 2 |
| | 5 |
| |
| Realized gains, net | 4 |
| | 6 |
| |
| Total non-interest (loss) income, net | (893 | ) | | 58 |
| |
| | | | | |
| General and administrative expenses | (33 | ) | | (42 | ) | |
| Other expenses | (91 | ) | | (7 | ) | |
| Benefit from (provision for) income taxes | 22 |
| | (4 | ) | |
| | | | | |
| Net (loss) income | $ | (943 | ) | | $ | 49 |
| |
| | | | | |
| (Loss) earnings per diluted common share | $ | (8.28 | ) | | $ | 0.38 |
| |
| | | | | |
| | |
| GAAP Net (Loss) Income by Segment |
| ($ in millions) |
| | Three Months Ended |
| | 3/31/2020 | | 12/31/2019 | |
| | | | | |
| Residential Lending | $ | (199 | ) | | $ | 16 |
| |
| Business Purpose Lending | (228 | ) | | 19 |
| |
| Multifamily Investments | (225 | ) | | 11 |
| |
| Third-Party Residential Investments | (280 | ) | | 21 |
| |
| Corporate | (11 | ) | | (18 | ) | |
| Net (loss) income | $ | (943 | ) | | $ | 49 |
| |
|
|
| Detailed endnotes are included at the end of this Redwood Review. |
| |
| THE REDWOOD REVIEW I 1ST QUARTER 2020 |
| 10 |
|
|
| |
| Q U A R T E R L Y R E S U L T S |
Analysis of Earnings and Losses
| |
| Ñ | Net interest income increased in the first quarter, compared to the fourth quarter of 2019, resulting from a higher average balance of invested capital during the first quarter, prior to the asset sales that occurred in late March. |
| |
| Ñ | Mortgage banking activities at both our residential and business purpose lending segments were negatively impacted by lower profitability on securitizations that settled late in the first quarter and from lower marks on loan inventories held at quarter-end, resulting from the recent market dislocation. |
| |
| Ñ | Negative investment fair value changes reflected significant declines in the value of our investments resulting from the market dislocation caused by the COVID-19 pandemic. Additionally, this line item includes losses associated with our decision to close-out substantially all of our outstanding interest rate hedges, as we determined that due to the recent market dislocations, the correlations between asset market values and interest rates had deteriorated and the hedges were no longer effective. Approximately $(510) million of investment losses were associated with assets we continued to hold at March 31, 2020 and that we generally have the intention to hold for longer-term investment. The remainder of our investment losses (approximately $(361) million) were on assets we sold and hedges we settled during the first quarter of 2020, and assets that we had either entered into agreements to sell or that we have the intent to sell in the near-term. See the "Q1 2020 Fair Value Changes on Assets Held at March 31, 2020" table below, which includes additional detail on the assets we held at March 31, 2020 and their associated losses recognized during the first quarter of 2020. |
| |
| Ñ | The realized gains, net line item on our income statement presents net gains and losses on securities classified as available-for-sale. While we realized a significant amount of losses on the sale of securities during the first quarter of 2020, those losses were on securities classified under fair value accounting, for which losses are recorded in the Investment fair value changes line item. |
| |
| Ñ | General and administrative expenses decreased in the first quarter, primarily due to a significant reduction in our variable compensation expense accrual, aligned with the quarter's financial results. |
| |
| Ñ | Other expenses increased during the quarter, primarily due to the impairment of $89 million of goodwill at our Business Purpose Lending segment. |
| |
| Ñ | Income tax provision changed to a benefit in the first quarter as a result of losses incurred at our taxable REIT subsidiaries (TRS), driven by mortgage banking losses as well as losses on investments held at our TRS. |
|
|
| Detailed endnotes are included at the end of this Redwood Review. |
| |
| THE REDWOOD REVIEW I 1ST QUARTER 2020 |
| 11 |
|
|
| |
| Q U A R T E R L Y R E S U L T S |
The following table presents the investments we held at March 31, 2020 and their associated losses recognized in both our earnings and comprehensive income during the first quarter of 2020.
|
| | | | | | | | | | | | | | | | | | | |
| |
| Q1 2020 Fair Value Changes on Assets Held at March 31, 2020 |
| By Investment Type |
| ($ in millions) |
| | | | | Q1 2020 Fair Value Changes (1) | |
| | | | | Held-for-sale (2) | | Held -for-investment | |
| | | Fair Value of Assets at March 31, 2020 | | Income Statement (3) | | Income Statement (3) | Balance Sheet (4) | Total | |
| | | | | | | | | | |
| Residential Lending | | | | | | | | | |
Residential loans (5) | | $ | 1,437 |
| | $ | (73 | ) | | $ | — |
| $ | — |
| $ | — |
| |
| Sequoia securities | | 275 |
| | | | (103 | ) | (59 | ) | (162 | ) | |
| MSRs/Other | | 44 |
| | | | (19 | ) | — |
| (19 | ) | |
Residential mortgage banking (5) | | 894 |
| | (30 | ) | | — |
| — |
| — |
| |
| Total Residential Lending | | 2,650 |
| | (103 | ) | | (122 | ) | (59 | ) | (181 | ) | |
| | | | | | | | | | |
| Business Purpose Lending | | | | | | | | | |
| SFR securities | | 167 |
| | | | (68 | ) | — |
| (68 | ) | |
| Bridge investments | | 817 |
| | | | (40 | ) | — |
| (40 | ) | |
SFR loans (5) | | 414 |
| | (10 | ) | | (23 | ) | — |
| (23 | ) | |
| Total Business Purpose Lending | | 1,398 |
| | (10 | ) | | (131 | ) | — |
| (131 | ) | |
| | | | | | | | | | |
| Multifamily Investments | | | | | | | | | |
| Multifamily B-pieces | | 49 |
| | | | (16 | ) | (2 | ) | (18 | ) | |
| Other investments | | 37 |
| | | | (4 | ) | — |
| (4 | ) | |
| Total Multifamily Investments | | 86 |
| | — |
| | (20 | ) | (2 | ) | (22 | ) | |
| | | | | | | | | | |
| Third-Party Residential Investments | | | | | | | | | |
| RPL investments | | 369 |
| | | | (175 | ) | — |
| (175 | ) | |
| CRT & third-party securities | | 73 |
| | | | (61 | ) | (26 | ) | (87 | ) | |
| Other investments | | 104 |
| | | | (19 | ) | | (19 | ) | |
| Total Third-Party Residential Investments | | 546 |
| | — |
| | (255 | ) | (26 | ) | (281 | ) | |
| | | | | | | | | | |
| Total | | $ | 4,680 |
| | $ | (113 | ) | | $ | (528 | ) | $ | (87 | ) | $ | (615 | ) | |
|
|
| Detailed endnotes are included at the end of this Redwood Review. |
| |
| THE REDWOOD REVIEW I 1ST QUARTER 2020 |
| 12 |
|
|
| |
| Q U A R T E R L Y R E S U L T S |
Book Value
|
| | | | | | | | |
| |
| Changes in Book Value per Share |
| ($ in per share) |
| | Three Months Ended | |
| | 3/31/2020 | | 12/31/2019 | |
| | | | | |
| Beginning GAAP book value per share | $ | 15.98 |
| | $ | 15.92 |
| |
| Comprehensive (Loss) Income | | | | |
Q1 2020 fair value changes on investments held at March 31, 2020 (1) | (5.36 | ) | | — |
| |
Other Q1 2020 fair value changes on investments (2) | (3.08 | ) | | — |
| |
| Impairment of goodwill | (0.78 | ) | | — |
| |
| Change in value of long-term debt hedge | (0.29 | ) | | 0.09 |
| |
| Other comprehensive income, net | 0.16 |
| | 0.37 |
| |
| Total comprehensive (loss) income per share | (9.35 | ) | | 0.46 |
| |
| Dividends | (0.32 | ) | | (0.30 | ) | |
| Other, net | 0.01 |
| | (0.10 | ) | |
| | | | | |
| Ending GAAP book value per share | $ | 6.32 |
| | $ | 15.98 |
| |
| |
| Ñ | Our GAAP book value decreased $(9.66) per share during the first quarter of 2020, resulting primarily from negative investment fair value changes that were recorded both through our income statement and through accumulated comprehensive income on our balance sheet. |
| |
| Ñ | During the first quarter, we recognized losses of $(5.36) per share on assets we continued to hold at March 31, 2020 that we generally have the intention to hold for longer-term investment. These losses represent the decline in price of the related assets from December 31, 2019 (or their purchase date, if purchased after December 31, 2019) to March 31, 2020. |
| |
| Ñ | Other investment fair value changes of $(3.08) per share were associated with assets we sold and hedges we settled during the first quarter of 2020, and assets that we had either entered into agreements to sell or that we have the intent to sell in the near-term. For securities, these losses represent their decline in price from December 31, 2019 (or their purchase date, if purchased after December 31, 2019) to the price the assets were sold at during the first quarter. For loans, these losses represent the decline in price from December 31, 2019 (or their purchase date, if purchased after December 31, 2019) to the earlier of the date they were sold or March 31, 2020 (which in many cases represents agreed-upon sales prices for transactions entered into as of March 31, 2020 and that have since settled or are expected to settle after March 31, 2020). |
| |
| Ñ | During the first quarter of 2020, we recorded a goodwill impairment of $0.78 per share, associated with the BPL operating platforms we acquired in 2019. At March 31, 2020, after excluding $0.60 per share of our remaining intangible assets, our non-GAAP tangible book value per share was $5.72.(3) |
|
|
| Detailed endnotes are included at the end of this Redwood Review. |
| |
| THE REDWOOD REVIEW I 1ST QUARTER 2020 |
| 13 |
|
|
| |
| Q U A R T E R L Y R E S U L T S |
Segment Results
This section provides additional information on quarterly results and activity for each of our business segments. A detailed segment income statement is presented in Table 2 within the Financial Tables section of this Redwood Review.
Residential Lending
| |
| Ñ | Our Residential Lending segment incurred a $(199) million net loss during the first quarter of 2020, driven primarily by $(197) million of negative investment fair value changes and a $(19) million net loss from mortgage banking operations. |
| |
| Ñ | As a result of the economic and financial market impacts of COVID-19, the terms of our borrowing facility with the Federal Home Loan Bank of Chicago (our "FHLBC Facility") evolved and we decided to reduce the financing we obtain from the FHLBC. Accordingly, in March we began entering into transactions to sell several pools of residential whole loans financed through this facility and in the coming weeks we expect to sell or refinance substantially all of the remaining assets financed through this facility and repay substantially all of our borrowings from the FHLBC. (See the Pro Forma Financial Information section that follows for additional details.) |
| |
| Ñ | During the first quarter, we sold $83 million of securities from our residential lending investment portfolio. |
| |
| Ñ | During the first quarter, our residential mortgage banking business purchased $2.7 billion of jumbo residential loans (the majority during the first two months of the quarter). In March 2020, in response to market conditions, we became more selective in making loan purchases. |
| |
Ñ | During the first quarter, we sold $2.7 billion of loans held in inventory for our mortgage banking business, including through three Select securitizations totaling $1.6 billion and through Select and Choice whole loan sales to third parties totaling $1.1 billion. At March 31, 2020, we held loans in inventory of $898 million. Subsequent to March 31, 2020, we sold a substantial portion of these loans. (See the Pro Forma Financial Information section that follows for additional details.) |
Business Purpose Lending
| |
| Ñ | Our Business Purpose Lending segment incurred a $(228) million net loss during the first quarter of 2020, driven primarily by $(142) million of negative investment fair value changes and a $(12) million net loss from mortgage banking operations, exclusive of an $(89) million charge related to the full impairment of this segment's goodwill. |
|
|
| Detailed endnotes are included at the end of this Redwood Review. |
| |
| THE REDWOOD REVIEW I 1ST QUARTER 2020 |
| 14 |
|
|
| |
| Q U A R T E R L Y R E S U L T S |
| |
| Ñ | During the first quarter of 2020, we funded $206 million of business purpose bridge loans and received repayments of $123 million of such loans. In addition, we retained $42 million of securities from a single-family rental loan securitization we completed during the first quarter. |
| |
| Ñ | As of March 31, 2020, we reclassified our single-family rental loans financed at the FHLBC to held-for-sale and currently plan to securitize a portion of these loans. |
| |
| Ñ | BPL originations in the first quarter included $259 million of single-family rental loans and $227 million of bridge loans, largely during the first two months of the quarter. While we were able to price and complete a $374 million single-family rental loan securitization in early March with a modest impact to pricing, our remaining loan inventory experienced meaningful price declines through the end of March. |
Multifamily Investments
| |
| Ñ | Our Multifamily Investments segment incurred a net loss of $(225) million during the first quarter of 2020, driven primarily by $(227) million of negative investment fair value changes. |
| |
| Ñ | During the first quarter, we sold $430 million of multifamily securities, representing nearly all of our multifamily mezzanine securities, and all but two of our multifamily b-piece securities. |
Third-Party Residential Investments
| |
| Ñ | Our Third-Party Residential Investments segment incurred a net loss of $(280) million during the first quarter of 2020, driven primarily by $(304) million of negative investment fair value changes. |
| |
| Ñ | During the first quarter, we sold $210 million of third-party residential investments, including $95 million of recently issued subordinate securities, $74 million of RPL securities, $23 million of CRT securities, and $18 million of legacy securities. The proceeds from these sales were used to pay down associated repurchase debt. |
|
|
| Detailed endnotes are included at the end of this Redwood Review. |
| |
| THE REDWOOD REVIEW I 1ST QUARTER 2020 |
| 15 |
|
|
| |
| P R O F O R M A F I N A N C I A L I N F O R M A T I O N |
Capital Allocations
The following table presents our allocations of capital by segment as of December 31, 2019, March 31, 2020, and as of March 31, 2020 on a pro forma basis to give effect to pending asset sale transactions and certain other activity that occurred on or prior to May 6, 2020.(1)
|
| | | | | | | | | | | | | | | | | | | | | | | | |
| |
| Capital Allocation Detail |
| By Investment Type |
| ($ in millions) |
| | December 31, 2019 | | March 31, 2020 | | March 31, 2020 Pro Forma(1) | |
| | Fair Value of Assets (2) | | Total Recourse Debt | | Fair Value of Assets (2) | | Total Recourse Debt | | Fair Value of Assets (2) | | Total Recourse Debt | |
| | | | | | | | | | | | | |
| Residential Lending | | | | | | | | | | | | |
| Residential loans | $ | 2,105 |
| | $ | (1,776 | ) | | $ | 1,437 |
| | $ | (1,190 | ) | | $ | — |
| | $ | — |
| |
| Sequoia securities | 483 |
| | (320 | ) | | 275 |
| | (259 | ) | | 254 |
| | (230 | ) | |
| MSRs/Other | 63 |
| | — |
| | 44 |
| | (30 | ) | | 44 |
| | (20 | ) | |
| Residential mortgage banking | 544 |
| | (186 | ) | | 894 |
| | (841 | ) | | 226 |
| | (212 | ) | |
| Total Residential Lending | 3,195 |
| | (2,282 | ) | | 2,650 |
| | (2,321 | ) | | 524 |
| | (463 | ) | |
| | | | | | | | | | | | | |
| Business Purpose Lending | | | | | | | | | | | | |
| SFR securities | 191 |
| | (80 | ) | | 167 |
| | (103 | ) | | 167 |
| | (103 | ) | |
| Bridge investments | 764 |
| | (567 | ) | | 817 |
| | (626 | ) | | 817 |
| | (626 | ) | |
| SFR loans | 570 |
| | (432 | ) | | 415 |
| | (308 | ) | | 415 |
| | (308 | ) | |
| Platform premium | 161 |
| | — |
| | 69 |
| | — |
| | 69 |
| | — |
| |
| Total Business Purpose Lending | 1,686 |
| | (1,079 | ) | | 1,468 |
| | (1,037 | ) | | 1,468 |
| | (1,037 | ) | |
| | | | | | | | | | | | | |
| Multifamily Investments | | | | | | | | | | | | |
| Multifamily mezzanine | 423 |
| | (334 | ) | | — |
| | (26 | ) | | — |
| | — |
| |
| Multifamily B-pieces | 234 |
| | (171 | ) | | 49 |
| | (50 | ) | | 49 |
| | (42 | ) | |
| Other investments | 61 |
| | — |
| | 37 |
| | — |
| | 37 |
| | — |
| |
| Total Multifamily Investments | 718 |
| | (505 | ) | | 86 |
| | (76 | ) | | 86 |
| | (42 | ) | |
| | | | | | | | | | | | | |
| Third-Party Residential Investments | | | | | | | | | | | | |
| RPL investments | 611 |
| | (354 | ) | | 369 |
| | (300 | ) | | 364 |
| | (282 | ) | |
| CRT & third-party securities | 306 |
| | (142 | ) | | 73 |
| | (32 | ) | | 50 |
| | (1 | ) | |
| Other investments | 102 |
| | — |
| | 104 |
| | — |
| | 104 |
| | — |
| |
| Total Third-Party Residential Investments | 1,019 |
| | (496 | ) | | 546 |
| | (332 | ) | | 518 |
| | (283 | ) | |
| | | | | | | | | | | | | |
Cash and cash equivalents (3) | 188 |
| | — |
| | 378 |
| | — |
| | 596 |
| | — |
| |
| Other Assets and liabilities, net | 169 |
| | — |
| | 151 |
| | — |
| | 143 |
| | — |
| |
| Corporate debt | — |
| | (786 | ) | | — |
| | (786 | ) | | — |
| | (786 | ) | |
| Total Corporate / Other | 357 |
| | (786 | ) | | 529 |
| | (786 | ) | | 739 |
| | (786 | ) | |
| | | | | | | | | | | | | |
| Totals | $ | 6,975 |
| | $ | (5,148 | ) | | $ | 5,279 |
| | $ | (4,554 | ) | | $ | 3,335 |
| | $ | (2,610 | ) | |
| | | | | | | | | | | | | |
| | | | | | | | | | | | | |
| GAAP Equity |
|
| | $ | 1,827 |
| |
|
| | $ | 725 |
| |
|
| | $ | 725 |
| |
|
|
| Detailed endnotes are included at the end of this Redwood Review. |
| |
| THE REDWOOD REVIEW I 1ST QUARTER 2020 |
| 16 |
|
|
| |
| P R O F O R M A F I N A N C I A L I N F O R M A T I O N |
Residential Lending
| |
| Ñ | Between April 1, 2020 and April 30, 2020, we sold $1.5 billion of residential loans to third parties, including $1.0 billion of loans previously financed under our FHLBC facility and $0.5 billion of loans previously funded with warehouse debt. In addition, as of April 30, 2020, we had entered into agreements to sell residential mortgage loans with a fair value of $0.5 billion. Additionally, we expect to transfer all of our remaining residential loans under our FHLBC facility, to our new non-marginable loan warehouse facility, which we closed subsequent to April 30, 2020. Upon completion of these sales and financing arrangements, we expect to reduce our residential warehouse debt to $145 million, and borrowings under our FHLBC facility that fund residential loans to zero. |
| |
| Ñ | Between April 1, 2020 and April 30, 2020, we sold $22 million of Sequoia securities and repaid associated repurchase debt. |
| |
| Ñ | During April 2020, we paid down our secured revolving debt financing our MSR investments by $10 million. |
Business Purpose Lending
| |
| Ñ | Since April 30, 2020, we established a new non-marginable warehouse facility and are exploring additional financing transactions to further reduce the remaining marginable financing for our business purpose loans. |
Multifamily Investments
| |
| Ñ | Between April 1, 2020 and April 30, 2020, we repaid $26 million of securities repurchase debt that financed multifamily securities associated with sales that were executed as of March 31, 2020 and settled in April 2020. The settlement amount for these security sales is included in other assets as a trade receivable as of March 31, 2020, and the associated debt was repaid upon settlement of the receivable in April 2020. |
Third-Party Residential Investments
| |
| Ñ | Between April 1, 2020 and April 30, 2020, we sold $29 million of securities in our third-party residential investments segment and repaid associated repurchase debt. We also paid down certain repurchase debt during April 2020 in accordance with new terms when the debt was refinanced. |
|
|
| Detailed endnotes are included at the end of this Redwood Review. |
| |
| THE REDWOOD REVIEW I 1ST QUARTER 2020 |
| 17 |
|
|
| |
| P R O F O R M A F I N A N C I A L I N F O R M A T I O N |
Recourse Debt Analysis
The following summaries present the composition of our recourse debt and its characteristics as of March 31, 2020, on a pro forma basis(1), to give effect to debt paydowns associated with settled and pending asset sale transactions and certain other activity that occurred from April 1, 2020 to May 6, 2020.
|
| | | | | | | | | | | | | | | | | | | | |
| |
Debt Balances at March 31, 2020 Pro Forma (1) |
| ($ in millions) | |
| | | | | | | | | | | |
| | Scheduled Maturity | | |
| | Q2 2020 | | Q3 2020 | | Q4 2020 | | Beyond 2020 | | Total | |
| | | | | | | | | | | |
| Securities repurchase debt | $ | 373 |
| | $ | — |
| | $ | — |
| | $ | — |
| | $ | 373 |
| |
| Warehouse/secured revolving debt | — |
| | — |
| | 298 |
| | 405 |
| | 704 |
| |
| Non-marginable warehouse debt | — |
| | — |
| | — |
| | 444 |
| | 444 |
| |
| Non-marginable secured term debt | — |
| | — |
| | — |
| | 286 |
| | 286 |
| |
| Non-marginable corporate unsecured debt | — |
| | — |
| | — |
| | 786 |
| | 786 |
| |
| FHLB debt | — |
| | — |
| | — |
| | 18 |
| | 18 |
| |
| | | | | | | | | | | |
| Total debt | $ | 373 |
| | $ | — |
| | $ | 298 |
| | $ | 1,939 |
| | $ | 2,610 |
| |
| |
| Ñ | We expect to reduce our recourse debt from $4.6 billion at March 31, 2020 to $2.6 billion, on a pro forma basis.(1) |
|
|
| Detailed endnotes are included at the end of this Redwood Review. |
| |
| THE REDWOOD REVIEW I 1ST QUARTER 2020 |
| 18 |
|
|
| |
| P R O F O R M A F I N A N C I A L I N F O R M A T I O N |
After giving effect to debt paydowns associated with settled and pending asset sale transactions and certain other activity that occurred from April 1, 2020 to May 6, 2020, our pro forma(1) debt and associated asset balances would consist of the following:
| |
| Ñ | Securities repurchase debt of $373 million, financing $308 million of third-party securities, $56 million of Sequoia securities, and $47 million of multifamily b-pieces. On a pro forma basis, we expect to have $19 million of remaining cash margin posted against our pro forma securities repurchase debt, which is held by our counterparties, and $191 million of unencumbered securities. |
| |
| Ñ | Warehouse debt of $704 million, financing $514 million of bridge loans, $154 million of SFR loans, and $140 million of residential loans, and secured revolving debt of $20 million, financing $49 million of MSRs and certificated servicing assets. |
| |
| Ñ | New non-marginable warehouse facilities we entered into since April 30, 2020 of $444 million, financing $273 million of bridge loans, $222 million of SFR loans, and $39 million of residential loans. |
| |
| Ñ | Non-marginable secured term debt of $286 million, financing $155 million of Sequoia securities and $103 million of SFR securities, with final maturity dates in 2024 and 2025. |
| |
| Ñ | Unsecured corporate debt comprised of $245 million of 4.75% convertible notes due in 2023, $200 million of 5.625% convertible notes due in 2024, $201 million of 5.75% exchangeable notes due in 2025, and $140 million of trust-preferred securities due in 2037. |
| |
| Ñ | FHLB debt of $18 million, financing $25 million of SFR loans. |
Our recourse leverage ratio was 6.9x at March 31, 2020. Using our March 31, 2020 pro forma total recourse debt of $2.6 billion and our tangible book value at March 31, 2020, we estimate our March 31, 2020 recourse leverage ratio would be 4.0x on a pro forma basis.(2)
Our ratio of cash to marginable recourse debt increased to 54% at March 31, 2020 on a pro forma basis(1), after giving effect to these pending and recently completed transactions.
|
|
| Detailed endnotes are included at the end of this Redwood Review. |
| |
| THE REDWOOD REVIEW I 1ST QUARTER 2020 |
| 19 |
|
|
| |
| Q U A R T E R L Y P O S I T I O N S |
Credit Overview
This section presents select credit characteristics for our major investment types, with current information as of March 31, 2020.
|
| | | | | | | | | | | | |
| |
| Residential Investments Credit Characteristics |
| March 31, 2020 | |
| ($ in millions, except where noted) | |
| | Sequoia Select Securities | | Sequoia Choice Securities | | Re-Performing Loan Securities | |
| | | | | | | |
| Market value | $ | 105 |
| | $ | 136 |
| | $ | 369 |
| |
| Average FICO (at origination) | 771 |
| | 744 |
| | 613 |
| |
HPI updated LTV (1) | 47 | % | | 66 | % | | 69 | % | |
| Average loan size (in thousands) | $ | 690 |
| | $ | 704 |
| | $ | 187 |
| |
| Gross weighted average coupon | 4.0 | % | | 5.0 | % | | 4.5 | % | |
| Current 3-month prepayment rate | 19 | % | | 36 | % | | 6 | % | |
| 90+ days delinquency (as a % of UPB) | 0.1 | % | | 0.4 | % | | 5.8 | % | |
| Investment thickness | 4 | % | | 11 | % | | 21 | % | |
| | | | | | | |
Sequoia Select Securities — As of March 31, 2020, we had securitized $21.4 billion of Sequoia Select loans since 2010. Our securitized Select portfolio includes fully documented loans to prime borrowers with an average FICO score (at loan origination) of 771, maximum loan-to-value (at origination) of 80%, and a maximum debt-to-income ratio (at origination) of 43%. We retain all first-loss securities from our Sequoia Select securitizations, and on average we have exposure up to 4% of credit losses resulting from loans underlying the securities (represented by the thickness of the securities we currently own as investments).
Sequoia Choice Securities — As of March 31, 2020, we had securitized $3.4 billion of Sequoia Choice loans, since 2017. Our securitized Choice portfolio includes fully documented loans to prime borrowers with an average FICO score (at loan origination) of 744, maximum loan-to-value (at origination) of 90%, and a maximum debt-to-income ratio (at origination) of 49.9%. We retain all of the first-loss securities issued as part of our Sequoia Choice program, and on average we have exposure up to the first 11% of credit losses resulting from loans underlying the securities, (represented by the thickness of the securities we currently own as investments).
Re-performing Loan Securities — As of March 31, 2020, we held $369 million of securities collateralized by re-performing loans, and on average we have exposure to up to 21% of the credit losses resulting from loans underlying the securities (represented by the thickness of the securities we currently own as investments). The collateral underlying these securities are seasoned re-performing, and to a lesser extent non-performing, loans. In most cases, these loans experienced a credit event leading up to the securitization and were modified in order to keep the borrower in their home and current in their payments under recast loan terms. Central to the investment
|
|
| Detailed endnotes are included at the end of this Redwood Review. |
| |
| THE REDWOOD REVIEW I 1ST QUARTER 2020 |
| 20 |
|
|
| |
| Q U A R T E R L Y P O S I T I O N S |
thesis in these securities is the view that a significant percentage of the underlying borrowers will improve upon their delinquency history and continue paying steadily under the modified or recast terms of the loan.
|
| | | | | | | | | | | | |
| |
| Business Purpose and Multifamily Investments Credit Characteristics |
| March 31, 2020 | |
| ($ in millions, except where noted) | |
| | Multifamily B-Pieces | | SFR Securities | | BPL Bridge Loans | |
| | | | | | | |
| Market value | $ | 49 |
| | $ | 167 |
| | $ | 817 |
| |
Average current DSCR (1) | 1.5x |
| | 1.36x |
| | N/A |
| |
LTV (at origination) (2) | 72 | % | | 68 | % | | 68 | % | |
| Average loan size (in thousands) | $ | 20,116 |
| | $ | 2,650 |
| | $ | 399 |
| |
| Gross weighted average coupon | 4.2 | % | | 5.6 | % | | 7.9 | % | |
| 90+ days delinquency (as a % of UPB) | 0.0 | % | | 1.5 | % | | 4.3 | % | |
| Investment thickness | 10 | % | | 11 | % | | N/A |
| |
| | | | | | | |
Multifamily B-Pieces — As of March 31, 2020, we had $49 million of multifamily b-pieces, which represent first-loss risk on $1.0 billion of underlying multifamily loan collateral across two separate Freddie Mac sponsored securitizations. On average, we have exposure to the first 10% of credit losses resulting from loans underlying the securities (represented by the thickness of the securities we currently own as investments).
SFR Securities — As of March 31, 2020, we had $167 million of SFR securities, comprised of subordinate and interest-only securities retained from the eleven CAFL securitizations completed by CoreVest through March 31, 2020. We own and retain the first-loss securities from the CAFL securitizations, and on average have exposure to the first 11% of credit losses (represented by the current thickness of the securities we currently own as investments).
BPL Bridge Loans — As of March 31, 2020, we had $817 million of bridge loans held for investment. These loans are collateralized by residential and multifamily properties, many of which are being rehabilitated for either re-sale or rental purposes. The average loan term at origination is approximately 12 months.
|
|
| Detailed endnotes are included at the end of this Redwood Review. |
| |
| THE REDWOOD REVIEW I 1ST QUARTER 2020 |
| 21 |
|
|
| |
| Q U A R T E R L Y P O S I T I O N S |
Current Update on Forbearances
COVID-19 Related Forbearances
In response to the personal financial impacts of the COVID-19 pandemic, many residential mortgage borrowers are seeking forbearance with respect to monthly mortgage payment obligations. Across the mortgage industry, mortgage loan investors and servicers are seeking to provide such forbearances to impacted individuals as a loss mitigation response to the pandemic. At the same time, federal and state governmental authorities have sought to encourage a constructive and voluntary industry response to these forbearance requests, as well as mandate, in certain cases, responses to these forbearance requests by enacting statutes and promulgating various orders, regulations, and guidance.
Generally speaking, COVID-19 related payment forbearances granted to borrowers whose loans are securitized in Sequoia transactions, and borrowers whose loans are held for investment or sale by Redwood, initially enable the borrowers to reschedule one to three months of mortgage payments. While forbearance terms differ across the industry and may differ based on various factors, including state-specific requirements or guidance, payments subject to these forbearances are in many cases required to be paid in full at the end of the forbearance period. Borrowers who have been granted COVID-19 related forbearances may request, and may receive or be entitled to, an additional forbearance period in the future and/or may request or be entitled to additional modifications to payment and loan terms, including when rescheduled payments become due, under applicable law, regulation, regulatory guidance and/or commonly accepted servicing practices.
Our financial exposure to COVID-19 related forbearances is not limited to residential loans within Sequoia securitizations and residential whole loans held for investment or sale on our balance sheet. We are also exposed to the negative financial impact of COVID-19 related payment forbearances with respect a variety of other investments, including third-party issued mortgage-backed securities, mortgage servicing rights and related cash flows, re-performing residential mortgage loans, and business purpose loans. In addition, transactions we have entered into, including to finance loans with warehouse financing providers and to sell whole loans to third parties, may be negatively impacted by COVID-19 related payment forbearances, including by reducing our proceeds from these transactions.
|
|
| Detailed endnotes are included at the end of this Redwood Review. |
| |
| THE REDWOOD REVIEW I 1ST QUARTER 2020 |
| 22 |
|
|
| |
| Q U A R T E R L Y P O S I T I O N S |
Mortgage Servicing Advance Obligations
Redwood's liquidity exposure to advancing obligations associated with residential mortgage servicing rights (MSRs) is primarily related to our Sequoia private-label residential mortgage backed securities (RMBS). The collateral backing our Sequoia securities were generally originated as prime quality residential mortgage loans with strong credit characteristics. These loans were sourced from our residential mortgage platform through our network of loan sellers, including banks and independent mortgage companies, and were acquired after undergoing our review and underwriting process.
We outsource our residential mortgage servicing activity to third-party sub-servicers and do not directly service residential mortgage loans. We carry out a servicing oversight function and, in some cases, are obligated to reimburse our sub-servicers when they fund advances of principal and interest (P&I), taxes and insurance (T&I), and certain other amounts related to securitized mortgage loans.
Transactions With P&I Stop-Advance Features
Approximately 77% of our funding obligations related to P&I servicing advances are associated with Sequoia securitization transactions that include a stop-advance feature after 120 days of delinquency or forbearance and are structured with a “scheduled / scheduled” remittance type.(1) These obligations to fund advances of P&I payments for loans that are delinquent or subject to forbearance is, therefore, generally limited to four months of scheduled P&I payments. For certain Sequoia securitization transactions, the cash flows related to our associated MSRs are certificated as "AIOS" securities, which we also refer to as "Certificated MSRs." Other advancing obligations, including T&I servicing advances, are not subject to the stop-advance feature.
Transactions Without P&I Stop-Advance Features
While our funding obligations related to P&I servicing advances associated with Sequoia securitization transactions without stop-advance features do not have a specified maximum advance period or amount, for borrowers that experience long-term financing distress and are delinquent or subject to forbearance for longer periods, loss mitigation actions, including loan modifications, may allow us to recoup outstanding P&I advances earlier than ultimate loan resolution or liquidation.
|
|
| Detailed endnotes are included at the end of this Redwood Review. |
| |
| THE REDWOOD REVIEW I 1ST QUARTER 2020 |
| 23 |
|
|
| |
| Q U A R T E R L Y P O S I T I O N S |
Mortgage Servicing P&I Advance Obligations
At April 30, 2020, mortgage loans in a delinquent status (whether or not subject to forbearance) accounted for approximately 3.2% of the aggregate principal (or notional) balance of Sequoia securitized loans for which we had servicing advance funding obligations (an increase from approximately 0.9% of principal balance that were in a delinquent status (whether or not subject to forbearance) with respect to the monthly mortgage payment due in March 2020). For every 10 percentage point increase in the principal balance of Sequoia securitized mortgage loans in a delinquent status (whether or not subject to forbearance)(collectively "DQ"), Redwood estimates that its average monthly P&I servicing advance funding obligation would increase by $6 million.
|
| | | | | | | | | | | | | | |
| |
| Mortgage Servicing P&I Advance Obligations |
| March 31, 2020 | |
| ($ in millions) | |
| | Fair Value | | Notional Principal Balance | | Estimated Average Monthly P&I Advance Requirement (per 10 percentage points of DQ) | | Maximum Period of P&I Advance Obligation | |
| | | | | | | | | |
| MSRs - Non-Stop Advance | $ | 15 |
| | $ | 2,496 |
| | $ | 1 |
| | N/A | |
| MSRs - Stop Advance | 8 |
| | 1,355 |
| | 1 |
| | 120 days | |
| Certificated MSRs - Stop Advance | 26 |
| | 7,190 |
| | 4 |
| | 120 days | |
| | | | | | | | | |
| | $ | 49 |
| | $ | 11,041 |
| | $ | 6 |
| | | |
| | | | | | | | | |
The table above does not include funding obligations related to non-P&I servicing advances - e.g., T&I servicing advances - which can vary based on seasonality and other factors.
|
|
| Detailed endnotes are included at the end of this Redwood Review. |
| |
| THE REDWOOD REVIEW I 1ST QUARTER 2020 |
| 24 |
|
|
| Detailed endnotes are included at the end of this Redwood Review. |
| |
| THE REDWOOD REVIEW I 1ST QUARTER 2020 |
| 25 |
|
| | | | | | | | | | | | | | | | | | | | | | | | | | |
| Table 1: GAAP Earnings (in thousands, except per share data) | |
| | | | | | | | | | | | | | | |
| | | 2020 Q1 | | 2019
Q4 | | 2019
Q3 | | 2019
Q2 | | 2019
Q1 | | | Twelve Months 2019 | |
| Net interest income | | | | | | | | | | | | | |
| From investments | $ | 43,115 |
| | $ | 37,639 |
| | $ | 27,679 |
| | $ | 27,565 |
| | $ | 26,952 |
| | | $ | 119,835 |
| |
| From mortgage banking activities | 8,295 |
| | 7,234 |
| | 5,834 |
| | 4,757 |
| | 4,813 |
| | | 22,638 |
| |
| Net interest income | 51,410 |
| | 44,873 |
| | 33,513 |
| | 32,322 |
| | 31,765 |
| | | 142,473 |
| |
| Non-interest (loss) income | | | | | | | | | | | | | |
| Residential mortgage banking activities, net | (23,081 | ) | | 16,540 |
| | 5,016 |
| | 15,361 |
| | 10,826 |
| | | 47,743 |
| |
| Business purpose mortgage banking activities, net | (5,330 | ) | | 29,742 |
| | 4,499 |
| | 3,799 |
| | 1,483 |
| | | 39,523 |
| |
| Investment fair value changes, net | (870,832 | ) | | 759 |
| | 11,444 |
| | 3,138 |
| | 20,159 |
| | | 35,500 |
| |
| Realized gains, net | 3,852 |
| | 5,594 |
| | 4,714 |
| | 2,827 |
| | 10,686 |
| | | 23,821 |
| |
| Other income | 2,437 |
| | 5,417 |
| | 4,356 |
| | 4,859 |
| | 4,625 |
| | | 19,257 |
| |
| Total non-interest (loss) income, net | (892,954 | ) | | 58,052 |
| | 30,029 |
| | 29,984 |
| | 47,779 |
| | | 165,844 |
| |
| Fixed compensation expense | (14,684 | ) | | (12,899 | ) | | (9,391 | ) | | (9,252 | ) | | (8,205 | ) | | | (39,747 | ) | |
| Variable compensation expense (excluding commissions) | (11 | ) | | (10,372 | ) | | (3,489 | ) | | (3,573 | ) | | (4,402 | ) | | | (21,836 | ) | |
| Equity compensation expense | (1,995 | ) | | (3,270 | ) | | (3,155 | ) | | (4,024 | ) | | (2,953 | ) | | | (13,402 | ) | |
Acquisition-related equity compensation expense (1) | (1,212 | ) | | (1,010 | ) | | — |
| | — |
| | — |
| | | (1,010 | ) | |
| Loan acquisition costs (including commissions) | (4,726 | ) | | (4,830 | ) | | (1,993 | ) | | (1,964 | ) | | (1,477 | ) | | | (10,264 | ) | |
| Other general and administrative expense | (10,040 | ) | | (10,062 | ) | | (8,787 | ) | | (7,442 | ) | | (6,122 | ) | | | (32,413 | ) | |
| Total general and administrative expenses | (32,668 | ) | | (42,443 | ) | | (26,815 | ) | | (26,255 | ) | | (23,159 | ) | | | (118,672 | ) | |
| Other expenses | (91,415 | ) | | (7,001 | ) | | (2,531 | ) | | (2,452 | ) | | (1,038 | ) | | | (13,022 | ) | |
| Benefit from (provision for) income taxes | 22,229 |
| | (4,338 | ) | | 114 |
| | (2,333 | ) | | (883 | ) | | | (7,440 | ) | |
| Net (loss) income | $ | (943,398 | ) | | $ | 49,143 |
| | $ | 34,310 |
| | $ | 31,266 |
| | $ | 54,464 |
| | | $ | 169,183 |
| |
Diluted average shares (2) | 114,077 |
| | 152,983 |
| | 136,523 |
| | 130,697 |
| | 126,278 |
| | | 136,781 | |
| Diluted (loss) earnings per common share | $ | (8.28 | ) | | $ | 0.38 |
| | $ | 0.31 |
| | $ | 0.30 |
| | $ | 0.49 |
| | | $ | 1.46 |
| |
| |
| (1) | Acquisition-related equity compensation expense relates to shares of restricted stock that were issued to members of CoreVest management as a component of the consideration paid to them for our purchase of their interests in CoreVest. |
| |
| (2) | Diluted average shares includes shares from the assumed conversion of our convertible and/or exchangeable debt in certain periods, in accordance with GAAP diluted EPS provisions. See Table 3 that follows for details of this calculation for the current and prior quarter and our respective Quarterly Reports on Form 10-Q and Annual Report on Form 10-K. |
|
| | |
| THE REDWOOD REVIEW I 1ST QUARTER 2020 | | Table 1: GAAP Earnings 26 |
|
| | | | | | | | | | | | | | | | | | | | | | | | | | | | | | | | | | | | | | | | | | | | | | | | | |
| Table 2: Segment Results ($ in thousands) | |
| | | | | | | | | | | | | | | | | | | | | | | | | | |
| | Three Months Ended March 31, 2020 | | Three Months Ended December 31, 2019 | |
| | Residential Lending | | Business Purpose Lending | | Multifamily Investments | | Third-Party Residential Investments | | Corporate / Other | | Total | | Residential Lending | | Business Purpose Lending | | Multifamily Investments | | Third-Party Residential Investments | | Corporate / Other | | Total | |
| | | | | | | | | | | | | | | | | | | | | | | | | |
| Net interest income | $ | 19,229 |
| | $ | 18,070 |
| | $ | 3,597 |
| | $ | 9,842 |
| | $ | 672 |
| | $ | 51,410 |
| | $ | 19,647 |
| | $ | 12,838 |
| | $ | 2,392 |
| | $ | 9,142 |
| | $ | 855 |
| | $ | 44,874 |
| |
| | | | | | | | | | | | | | | | | | | | | | | | | |
| Non-interest (loss) income | | | | | | | | | | | | | | | | | | | | | | | | |
| Mortgage banking activities, net | (23,081 | ) | | (5,330 | ) | | — |
| | — |
| | — |
| | (28,411 | ) | | 16,539 |
| | 29,742 |
| | — |
| | — |
| | — |
| | 46,281 |
| |
| Investment fair value changes, net | (196,635 | ) | | (142,130 | ) | | (227,122 | ) | | (304,436 | ) | | (509 | ) | | (870,832 | ) | | (11,182 | ) | | (4,910 | ) | | 8,149 |
| | 9,311 |
| | (609 | ) | | 759 |
| |
| Other income, net | (497 | ) | | 1,693 |
| | 1,240 |
| | 1 |
| | — |
| | 2,437 |
| | 2,896 |
| | 1,502 |
| | 1,020 |
| | — |
| | — |
| | 5,418 |
| |
| Realized gains, net | 1,796 |
| | — |
| | (1,604 | ) | | 3,660 |
| | — |
| | 3,852 |
| | 563 |
| | — |
| | 134 |
| | 4,897 |
| | — |
| | 5,594 |
| |
| Total non-interest (loss) income, net | (218,417 | ) | | (145,767 | ) | | (227,486 | ) | | (300,775 | ) | | (509 | ) | | (892,954 | ) | | 8,816 |
| | 26,334 |
| | 9,303 |
| | 14,208 |
| | (609 | ) | | 58,052 |
| |
| | | | | | | | | | | | | | | | | | | | | | | | | |
| General and administrative expenses | (5,632 | ) | | (14,333 | ) | | (610 | ) | | (1,178 | ) | | (10,915 | ) | | (32,668 | ) | | (10,221 | ) | | (15,187 | ) | | (569 | ) | | (1,031 | ) | | (15,436 | ) | | (42,444 | ) | |
| Other expenses | — |
| | (92,985 | ) | | — |
| | 1,882 |
| | (312 | ) | | (91,415 | ) | | — |
| | (4,088 | ) | | — |
| | (242 | ) | | (2,671 | ) | | (7,001 | ) | |
| | | | | | | | | | | | | | | | | | | | | | | | | |
| Benefit from (provision for) income taxes | 5,330 |
| | 6,582 |
| | (106 | ) | | 10,423 |
| | — |
| | 22,229 |
| | (2,318 | ) | | (971 | ) | | (11 | ) | | (1,038 | ) | | — |
| | (4,338 | ) | |
| | | | | | | | | | | | | | | | | | | | | | | | | |
| Net (loss) income | $ | (199,490 | ) | | $ | (228,433 | ) | | $ | (224,605 | ) | | $ | (279,806 | ) | | $ | (11,064 | ) | | $ | (943,398 | ) | | $ | 15,924 |
| | $ | 18,926 |
| | $ | 11,115 |
| | $ | 21,039 |
| | $ | (17,861 | ) | | $ | 49,143 |
| |
| | | | | | | | | | | | | | | | | | | | | | | | | |
| Residential and business purpose lending subcategories: | | | | | | | | | | | | | | | | | | | | | | | | |
| Mortgage Banking | $ | (19,372 | ) | | $ | (102,175 | ) | | | | | | | | | | $ | 10,811 |
| | $ | 13,278 |
| | | | | | | | | |
| Investments | (180,118 | ) | | (126,258 | ) | | | | | | | | | | 5,113 |
| | 5,648 |
| | | | | | | | | |
| | | | | | | | | | | | | | | | | | | | | | | | | |
| Net (loss) income | $ | (199,490 | ) | | $ | (228,433 | ) | |
|
| |
|
| | | | | | $ | 15,924 |
| | $ | 18,926 |
| | | | | | | | | |
| | | | | | | | | | | | | | | | | | | | | | | | | |
|
| | |
| THE REDWOOD REVIEW I 1ST QUARTER 2020 | | Table 2: Segment Results 27 |
|
| | | | | | | | | |
| Table 3: GAAP Basic and Diluted Earnings per Common Share (in thousands, except per share data) | |
| | | | | | |
| | | 2020 Q1 | | 2019
Q4 | |
| GAAP Earnings per Common Share ("EPS"): | | | | |
| Net (loss) income attributable to Redwood | $ | (943,397 | ) | | $ | 49,143 |
| |
| Less: Dividends and undistributed earnings allocated to participating securities | (1,209 | ) | | (1,546 | ) | |
| Net (loss) income allocated to common shareholders for GAAP basic EPS | (944,606 | ) | | 47,597 |
| |
| Incremental adjustment to dividends and undistributed earnings allocated to participating securities | — |
| | (113 | ) | |
Add back: Interest expense on convertible notes for the period, net of tax (1) | — |
| | 9,941 |
| |
| Net (loss) income allocated to common shareholders for GAAP diluted EPS | $ | (944,606 | ) | | $ | 57,425 |
| |
| | | | | |
| Basic weighted average common shares outstanding | 114,077 |
| | 112,818 |
| |
| Net effect of dilutive equity awards | — |
| | 221 |
| |
Net effect of assumed convertible notes conversion to common shares (1) | — |
| | 39,943 |
| |
| Diluted weighted average common shares outstanding | 114,077 |
| | 152,982 |
| |
| | | | | |
| GAAP Basic (Loss) Earnings per Common Share | $ | (8.28 | ) | | $ | 0.42 |
| |
| GAAP Diluted (Loss) Earnings per Common Share | $ | (8.28 | ) | | $ | 0.38 |
| |
| | | | | |
| | | | | |
| |
| (1) | Certain convertible notes were determined to be dilutive in the periods presented and were included in the calculations of diluted EPS under the "if-converted" method. Under this method, the periodic interest expense (net of applicable taxes) for dilutive notes is added back to the numerator and the number of shares that the notes are entitled to (if converted, regardless of whether they are in or out of the money) are included in the denominator. |
|
| | |
| THE REDWOOD REVIEW I 1ST QUARTER 2020 | | Table 3: GAAP Earnings per Basic and Diluted Common Share 28 |
|
| | | | | | | | | | | | | | | | | | | | | | | | | |
| Table 4: Taxable and GAAP Income (1) Differences and Dividends (In thousands, except for per share data) | |
| | | | | | | | | | | | | | |
| | | Estimated Three Months 2020 (2) | | Estimated Twelve Months 2019 (2) | |
| | | Taxable Income | | GAAP Income | | Differences | | Taxable
Income | | GAAP
Income | | Differences | |
| Taxable and GAAP Income Differences | | | | | | | | | | | | |
| Interest income | $ | 94,011 |
| | $ | 198,081 |
| | $ | (104,070 | ) | | $ | 320,480 |
| | $ | 622,281 |
| | $ | (301,801 | ) | |
| Interest expense | (45,219 | ) | | (146,671 | ) | | 101,452 |
| | (183,550 | ) | | (479,808 | ) | | 296,258 |
| |
| Net interest income | 48,792 |
| | 51,410 |
| | (2,618 | ) | | 136,930 |
| | 142,473 |
| | (5,543 | ) | |
| Realized credit losses | (643 | ) | | — |
| | (643 | ) | | (534 | ) | | — |
| | (534 | ) | |
| Mortgage banking activities, net | (28,181 | ) | | (28,411 | ) | | 230 |
| | 80,146 |
| | 87,266 |
| | (7,120 | ) | |
| Investment fair value changes, net | (4,537 | ) | | (870,832 | ) | | 866,295 |
| | 4,307 |
| | 35,500 |
| | (31,193 | ) | |
| General and administrative expenses | (31,220 | ) | | (32,668 | ) | | 1,448 |
| | (109,737 | ) | | (118,672 | ) | | 8,935 |
| |
| Other income | 7,407 |
| | 2,437 |
| | 4,970 |
| | 23,397 |
| | 19,257 |
| | 4,140 |
| |
| Realized gains, net | — |
| | 3,852 |
| | (3,852 | ) | | 62,613 |
| | 23,821 |
| | 38,792 |
| |
| Other expenses | (1,364 | ) | | (91,415 | ) | | 90,051 |
| | (3,351 | ) | | (13,022 | ) | | 9,671 |
| |
| (Provision for) benefit from income taxes | (216 | ) | | 22,229 |
| | (22,445 | ) | | (866 | ) | | (7,440 | ) | | 6,574 |
| |
| (Loss) income | $ | (9,962 | ) | | $ | (943,398 | ) | | $ | 933,436 |
| | $ | 192,905 |
| | $ | 169,183 |
| | $ | 23,722 |
| |
| | | | | | | | | | | | | |
| REIT taxable income | $ | 37,527 |
| | | | | | $ | 136,255 |
| | | | | |
| Taxable (loss) income at taxable subsidiaries | (47,489 | ) | | | | | | 56,650 |
| | | | | |
| Taxable (loss) income | $ | (9,962 | ) | | | | | | $ | 192,905 |
| | | | | |
| | | | | | | | | | | | | |
| Shares used for taxable EPS calculation | 114,838 |
| | | | | | 114,353 |
| | | | | |
| REIT taxable income per share | $ | 0.33 |
| | | | | | $ | 1.28 |
| | | | | |
| Taxable (loss) income per share at taxable subsidiaries | $ | (0.41 | ) | | | | | | $ | 0.54 |
| | | | | |
Taxable (loss) income per share (3) | $ | (0.08 | ) | | | | | | $ | 1.82 |
| | | | | |
| | | | | | | | | | | | | |
| Dividends | | | | | | | | | | | | |
| Dividends declared | $ | 36,741 |
| | | | | | $ | 126,139 |
| | | | | |
Dividends per share (4) | $ | 0.32 |
| | | | | | $ | 1.20 |
| | | | | |
| |
| (1) | Taxable income for 2020 and 2019 are estimates until we file our tax returns for these years. To the extent we expect to pay tax at the corporate level (generally as a result of activity at our TRS), we are required to record a tax provision for GAAP reporting purposes. Any tax provision (or benefit) is not necessarily the actual amount of tax currently due (or receivable as a refund) as a portion of our provision (or benefit) is deferred in nature. It is our intention to retain any excess inclusion income generated in 2020 at our TRS and not pass it through to our shareholders. |
| |
| (2) | Reconciliation of GAAP income to taxable income (loss) for prior quarters is provided in the respective Redwood Reviews for those quarters. |
| |
| (3) | Taxable income (loss) per share is based on the number of shares outstanding at the end of each quarter. The annual taxable income (loss) per share is the sum of the quarterly per share estimates. |
| |
| (4) | Dividends in 2019 are expected to be characterized as 73% ordinary dividend income (or $92 million) and 27% long-term capital gain dividend income (or $34 million). |
|
| | |
| THE REDWOOD REVIEW I 1ST QUARTER 2020 | | Table 4: Taxable and GAAP Income Differences and Dividends 29 |
|
| | | | | | | | | | | | | | | | | | | | | | | | | |
| Table 5: Financial Ratios and Book Value ($ in thousands, except per share data) | |
| | | | | | | | | | | | | | |
| | | 2020
Q1 | | 2019
Q4 | | 2019
Q3 | | 2019
Q2 | | 2019
Q1 | | Twelve
Months 2019 | |
| Financial performance ratios | | | | | | | | | | | | |
| Net interest income | $ | 51,410 |
| | $ | 44,873 |
| | $ | 33,513 |
| | $ | 32,322 |
| | $ | 31,765 |
| | $ | 142,473 |
| |
| Corporate general and administrative expenses | $ | (10,915 | ) | | $ | (15,436 | ) | | $ | (12,727 | ) | | $ | (12,448 | ) | | $ | (12,394 | ) | | $ | (53,005 | ) | |
| Total general and administrative expenses | $ | (32,668 | ) | | $ | (42,443 | ) | | $ | (26,815 | ) | | $ | (26,255 | ) | | $ | (23,159 | ) | | $ | (118,672 | ) | |
| GAAP net income (loss) | $ | (943,398 | ) | | $ | 49,143 |
| | $ | 34,310 |
| | $ | 31,266 |
| | $ | 54,464 |
| | $ | 169,183 |
| |
| Average total assets | $ | 17,838,481 |
| | $ | 17,551,586 |
| | $ | 14,017,627 |
| | $ | 13,596,337 |
| | $ | 11,795,343 |
| | $ | 14,255,384 |
| |
| Average total equity | $ | 1,613,920 |
| | $ | 1,800,390 |
| | $ | 1,591,792 |
| | $ | 1,556,850 |
| | $ | 1,452,282 |
| | $ | 1,601,259 |
| |
| Corporate general and administrative expenses / average total equity | 2.71 | % | | 3.43 | % | | 3.20 | % | | 3.20 | % | | 3.41 | % | | 3.31 | % | |
| Total general and administrative expenses / average total equity | 8.10 | % | | 9.43 | % | | 6.74 | % | | 6.75 | % | | 6.38 | % | | 7.41 | % | |
| GAAP net income / average equity (GAAP ROE) | N/A |
| | 10.92 | % | | 8.62 | % | | 8.03 | % | | 15.00 | % | | 10.57 | % | |
| | | | | | | | | | | | | | |
| Leverage ratios and book value per share | | | | | | | | | | | | |
| Short-term debt | $ | 2,082,717 |
| | $ | 2,176,591 |
| | $ | 1,789,827 |
| | $ | 2,227,183 |
| | $ | 1,914,514 |
| | | |
| Long-term debt | 2,470,928 |
| | 2,970,415 |
| | 2,971,552 |
| | 2,584,499 |
| | 2,584,499 |
| | | |
Total debt at Redwood | $ | 4,553,645 |
| | $ | 5,147,006 |
| | $ | 4,761,379 |
| | $ | 4,811,682 |
| | $ | 4,499,013 |
| | | |
| At consolidated securitization entities | | | | | | | | | | | | |
| ABS issued | 6,461,864 |
| | 10,515,475 |
| | 8,346,051 |
| | 6,913,129 |
| | 5,637,644 |
| | | |
| Non-recourse short-term debt | 259,876 |
| | 153,696 |
| | 191,556 |
| | 237,363 |
| | 251,875 |
| | | |
| Total ABS issued and non-recourse short-term debt | $ | 6,721,740 |
| | $ | 10,669,171 |
| | $ | 8,537,607 |
| | $ | 7,150,492 |
| | $ | 5,889,519 |
| | | |
Consolidated debt (1) | $ | 11,275,385 |
| | $ | 15,816,177 |
| | $ | 13,298,986 |
| | $ | 11,962,174 |
| | $ | 10,388,532 |
| | | |
Tangible stockholders' equity - non-GAAP (2) | $ | 656,719 |
| | $ | 1,665,767 |
| | $ | 1,735,938 |
| | $ | 1,513,033 |
| | $ | 1,497,032 |
| | | |
| Total stockholders' equity | $ | 725,202 |
| | $ | 1,827,231 |
| | $ | 1,785,059 |
| | $ | 1,564,032 |
| | $ | 1,549,927 |
| | | |
Total capital (3) | $ | 1,495,700 |
| | $ | 2,596,984 |
| | $ | 2,554,118 |
| | $ | 2,337,442 |
| | $ | 2,322,515 |
| | | |
Recourse leverage ratio (recourse debt at Redwood to tangible stockholders' equity)(4) | 6.9x |
| | 3.1x |
| | 2.7x |
| | 3.2x |
| | 3.0x |
| | | |
| Consolidated debt to tangible stockholders' equity | 17.2x |
| | 9.5x |
| | 7.7x |
| | 7.9x |
| | 6.9x |
| | | |
| Shares outstanding at period end (in thousands) | 114,838 |
| | 114,353 |
| | 112,102 |
| | 97,715 |
| | 96,866 |
| | | |
| Book value per share | $ | 6.32 |
| | $ | 15.98 |
| | $ | 15.92 |
| | $ | 16.01 |
| | $ | 16.00 |
| | | |
| | | | | | | | | | | | | | |
| |
| (1) | Amounts presented in Consolidated debt above do not include deferred issuance costs or debt discounts. |
| |
| (2) | At March 31, 2020, December 31, 2019, September 30, 2019, June 30, 2019, and March 31, 2019, tangible stockholders' equity excluded $68 million, $161 million, $49 million, $51 million, and $53 million, respectively, of goodwill and intangible assets. |
| |
| (3) | Our total capital of $1.5 billion at March 31, 2020 included $0.7 billion of equity capital and $0.8 billion of unsecured corporate debt. |
| |
| (4) | Excludes ABS issued and non-recourse debt at consolidated entities. See Table 6 for additional detail on our ABS issued and short-term debt at consolidated entities. |
|
| | |
| THE REDWOOD REVIEW I 1ST QUARTER 2020 | | Table 5: Financial Ratios and Book Value 30
|
|
| | | | | | | | | | | | | | | | | | | | | | | | | | | | | | | | | | | | | | | | | | | | | | | | | | | | | | | | | |
| Table 6: Consolidating Balance Sheet ($ in thousands) | |
| | | | | | | | | | | | | | | | | | | | | | | | | | | | | | |
| | March 31, 2020 | | December 31, 2019 | |
| | | Consolidated VIEs (1) | | | | | Consolidated VIEs (1) | | | |
| | At Redwood (1) | | Sequoia Choice | | Freddie Mac SLST | | Freddie Mac K-Series | | CAFL | | Other (2) | | Redwood Consolidated | | At Redwood (1) | | Sequoia Choice | | Freddie Mac SLST | | Freddie Mac K-Series | | CAFL | | Other (2) | | Redwood
Consolidated | |
| Residential loans | $ | 2,330,669 |
| | $ | 1,932,658 |
| | $ | 2,131,125 |
| | $ | — |
| | $ | — |
| | $ | 316,677 |
| | $ | 6,711,129 |
| | $ | 2,648,282 |
| | $ | 2,291,463 |
| | $ | 2,367,215 |
| | $ | — |
| | $ | — |
| | $ | 407,890 |
| | $ | 7,714,850 |
| |
| Business purpose residential loans | 1,215,077 |
| | — |
| | — |
| | — |
| | 2,248,665 |
| | — |
| | 3,463,742 |
| | 1,314,191 |
| | — |
| | — |
| | — |
| | 2,192,552 |
| | — |
| | 3,506,743 |
| |
| Multifamily loans | — |
| | — |
| | — |
| | 470,484 |
| | — |
| | — |
| | 470,484 |
| | — |
| | — |
| | — |
| | 4,408,524 |
| | — |
| | — |
| | 4,408,524 |
| |
| Real estate securities | 293,462 |
| | — |
| | — |
| | — |
| | — |
| | — |
| | 293,462 |
| | 1,099,874 |
| | — |
| | — |
| | — |
| | — |
| | — |
| | 1,099,874 |
| |
| Other investments | 131,826 |
| | — |
| | — |
| | | | — |
| | 314,394 |
| | 446,220 |
| | 173,328 |
| | — |
| | — |
| | | | — |
| | 184,802 |
| | 358,130 |
| |
| Cash and cash equivalents | 375,347 |
| | — |
| | — |
| | — |
| | — |
| | 2,886 |
| | 378,233 |
| | 187,951 |
| | — |
| | — |
| | — |
| | — |
| | 9,015 |
| | 196,966 |
| |
Other assets (3) | 483,703 |
|
| 8,589 |
| | 8,234 |
| | 1,390 |
| | 16,552 |
| | 19,052 |
| | 537,520 |
| | 639,945 |
| | 9,851 |
| | 7,758 |
| | 13,539 |
| | 11,367 |
| | 27,893 |
| | 710,353 |
| |
| Total assets | $ | 4,830,084 |
| | $ | 1,941,247 |
| | $ | 2,139,359 |
| | $ | 471,874 |
| | $ | 2,265,217 |
| | $ | 653,009 |
| | $ | 12,300,790 |
| | $ | 6,063,571 |
| | $ | 2,301,314 |
| | $ | 2,374,973 |
| | $ | 4,422,063 |
| | $ | 2,203,919 |
| | $ | 629,600 |
| | $ | 17,995,440 |
| |
| Short-term debt | $ | 2,082,717 |
| | $ | — |
| | $ | — |
| | $ | — |
| | $ | — |
| | $ | 258,931 |
| | $ | 2,341,648 |
| | $ | 2,176,591 |
| | $ | — |
| | $ | — |
| | $ | — |
| | $ | — |
| | $ | 152,554 |
| | $ | 2,329,145 |
| |
| Other liabilities | 279,850 |
|
| 6,935 |
| | 5,251 |
| | 1,230 |
| | 8,188 |
| | 16,861 |
| | 318,315 |
| | 321,274 |
| | 7,759 |
| | 5,374 |
| | 12,887 |
| | 7,485 |
| | 15,538 |
| | 370,317 |
| |
| ABS issued | — |
| | 1,790,094 |
| | 1,825,000 |
| | 447,699 |
| | 2,086,870 |
| | 312,201 |
| | 6,461,864 |
| | — |
| | 2,037,198 |
| | 1,918,322 |
| | 4,156,239 |
| | 2,001,251 |
| | 402,465 |
| | 10,515,475 |
| |
| Long-term debt, net | 2,453,761 |
| | — |
| | — |
| | — |
| | — |
| | — |
| | 2,453,761 |
| | 2,953,272 |
| | — |
| | — |
| | — |
| | — |
| | — |
| | 2,953,272 |
| |
| Total liabilities | 4,816,328 |
| | 1,797,029 |
| | 1,830,251 |
| | 448,929 |
| | 2,095,058 |
| | 587,993 |
| | 11,575,588 |
| | 5,451,137 |
| | 2,044,957 |
| | 1,923,696 |
| | 4,169,126 |
| | 2,008,736 |
| | 570,557 |
| | 16,168,209 |
| |
| | | | | | | | | | | | | | | | | | | | | | | | | | | | | |
| Equity | 13,756 |
|
| 144,218 |
| | 309,108 |
| | 22,945 |
| | 170,159 |
| | 65,016 |
| | 725,202 |
| | 612,434 |
|
| 256,357 |
| | 451,277 |
| | 252,937 |
| | 195,183 |
| | 59,043 |
| | 1,827,231 |
| |
| Total liabilities and equity | $ | 4,830,084 |
|
| $ | 1,941,247 |
| | $ | 2,139,359 |
| | $ | 471,874 |
| | $ | 2,265,217 |
| | $ | 653,009 |
| | $ | 12,300,790 |
| | $ | 6,063,571 |
| | $ | 2,301,314 |
| | $ | 2,374,973 |
| | $ | 4,422,063 |
| | $ | 2,203,919 |
| | $ | 629,600 |
| | $ | 17,995,440 |
| |
| | | | | | | | | | | | | | | | | | | | | | | | | | | | | |
| |
| (1) | The format of this consolidating balance sheet is provided to more clearly delineate between the assets and liabilities belonging to securitization entities (Consolidated VIEs) that we are required to consolidate on our balance sheet in accordance with GAAP, and the assets that are legally ours and the liabilities of ours for which there is recourse to us. Each of these entities is independent of Redwood and of each other and the assets and liabilities of these entities are not owned by and are not legal obligations of ours. Our exposure to these entities is primarily through the financial interests we have retained or acquired in these entities (generally subordinate securities), the fair value of which is represented by our equity in each entity, as presented in this table. |
| |
| (2) | Includes our consolidated Legacy Sequoia and Servicing Investment entities. At March 31, 2020, our equity in the Legacy Sequoia and Servicing Investment entities was $6 million and $59 million, respectively. At December 31, 2019, our equity in the Legacy Sequoia and Servicing Investment entities was $6 million and $53 million, respectively. |
| |
| (3) | At both March 31, 2020 and December 31, 2019, other assets at Redwood included a total of $33 million of assets held by third-party custodians and pledged as collateral to the GSEs in connection with credit risk-sharing arrangements. These pledged assets can only be used to settle obligations to the GSEs under these risk-sharing arrangements. |
|
| | |
| THE REDWOOD REVIEW I 1ST QUARTER 2020 | | Table 6: Consolidating Balance Sheet 31 |
|
|
| |
| S E G M E N T O V E R V I E W |
Segment Overview
In the fourth quarter of 2019, we reorganized our operations into four business segments. These segments represent areas of the housing market we operate in through vertically integrated platforms.
Each segment includes all revenue and direct expense associated with the origination, acquisition and management of its associated financial assets. Additionally, we allocate corporate long-term debt (previously included in our corporate segment) to each segment, allowing us to evaluate each segment's contribution to our overall return on equity. Our four business segments currently include:
Residential Lending – Comprised of our residential mortgage banking operations and investments created from these activities, including: residential loans financed with secured debt, including through our FHLBC facility, and investments retained from our residential loan securitization activities.
Business Purpose Lending – Comprised of our business purpose mortgage banking operations (both 5 Arches and CoreVest), and investments created from these activities, including: SFR securities retained from CoreVest-sponsored securitizations, SFR loans financed with secured debt, including through our FHLBC facility, and investments in residential and small-balance multifamily bridge loans.
Multifamily Investments – Comprised of multifamily securities and loans we have acquired, as well as other multifamily investments.
Third-Party Residential Investments – Comprised of other residential investments not sourced through our residential mortgage banking activities, including: re-performing loan securities, third-party RMBS (including CRT securities and legacy securities), and other investments.
As a result of the significant asset dispositions we made in response to the COVID-19 pandemic, we are currently re-evaluating our business segments and may make changes to our segments in the future, including possibly incorporating our multifamily assets into one of our other three segments.
|
|
| Detailed endnotes are included at the end of this Redwood Review. |
| |
| THE REDWOOD REVIEW I 1ST QUARTER 2020 |
| 33 |
|
|
| |
| D I V I D E N D S A N D T A X A B L E I N C O M E |
Dividends and Taxable Income
Summary
As a REIT, Redwood is required to distribute to shareholders at least 90% of its annual REIT taxable income, excluding net capital gains. To the extent Redwood retains REIT taxable income, including net capital gains, it is taxed at corporate tax rates. Redwood also earns taxable income at its taxable REIT subsidiaries (TRS), which it is not required to distribute.
Dividends Overview
In recent years, our Board of Directors has maintained a practice of paying regular quarterly dividends, including when in excess of the amount required to comply with the provisions of the Internal Revenue Code applicable to REITs. In February 2020, the Board of Directors declared a regular dividend of $0.32 per share for the first quarter of 2020. This first quarter dividend is payable on May 8, 2020 to shareholders of record on March 16, 2020.
REIT Taxable Income and Dividend Distribution Requirement
Our estimated REIT taxable income was $38 million, or $0.33 per share, for the first quarter of 2020 and $44 million, or $0.39 per share, for the fourth quarter of 2019. Under normal circumstances, our minimum REIT dividend requirement would be 90% of our annual REIT taxable income. However, we currently maintain a $28 million federal net operating loss carry forward (NOL) at the REIT that affords us the option of retaining REIT taxable income up to the NOL amount, tax free, rather than distributing it as dividends. Federal income tax rules require the dividends paid deduction to be applied to reduce REIT taxable income before the applicability of NOLs is considered; therefore, REIT taxable income must exceed our dividend distribution for us to utilize a portion of our NOL and any remaining amount will carry forward into future years. See Table 4 in the Financial Tables section of this Redwood Review for additional detail on our REIT and total taxable income.
Income Tax Characterization of Dividend for Shareholders
Our dividend characterization for 2020 will be determined based on our full-year taxable income and dividend distributions, both of which are uncertain at this time. As the year progresses, we plan to provide an update on the expected characterization of 2020 dividends. Under the federal income tax rules applicable to REITs, none of our 2020 dividend distributions are currently expected to be characterized as long-term capital gains.
Beginning in 2018, the Tax Cuts and Jobs Act provides that individual taxpayers may generally deduct 20% of their ordinary REIT dividends from taxable income. This results in a maximum federal effective tax rate of 29.6% on an individual taxpayer's ordinary REIT dividends, compared to the highest marginal rate of 37%. This deduction does not apply to REIT dividends classified as qualified dividend income or long-term capital gain dividends, as those dividends are taxed at a maximum rate of 20% for individuals.
|
|
| Detailed endnotes are included at the end of this Redwood Review. |
| |
| THE REDWOOD REVIEW I 1ST QUARTER 2020 |
| 34 |
|
|
| |
| F O R W A R D - L O O K I N G S T A T E M E N T S |
Forward-Looking Statements
As noted above under the heading “Forward-Looking Statements,” this Redwood Review contains forward-looking statements within the meaning of the safe harbor provisions of the Private Securities Litigation Reform Act of 1995. Forward-looking statements involve numerous risks and uncertainties. Our actual results may differ from our expectations, estimates, and projections and, consequently, you should not rely on these forward-looking statements as predictions of future events. Forward-looking statements are not historical in nature and can be identified by words such as “anticipate,” “estimate,” “will,” “should,” “expect,” “believe,” “intend,” “seek,” “plan,” and similar expressions or their negative forms, or by references to strategy, plans, goals, or intentions. These forward-looking statements are subject to risks and uncertainties, including, among other things, those described in our Annual Report on Form 10-K under the caption “Risk Factors” and in our Current Report on Form 8-K filed on April 2, 2020. Other risks, uncertainties, and factors that could cause actual results to differ materially from those projected are described below and may be described from time to time in reports we file with the Securities and Exchange Commission, including reports on Forms 10-K, 10-Q, and 8-K. We undertake no obligation to update or revise forward-looking statements, whether as a result of new information, future events, or otherwise.
Statements regarding the following subjects, among others, are forward-looking by their nature: (i) statements we make regarding Redwood's business strategy and strategic focus, including statements relating to our overall market position, strategy and long-term prospects (including trends driving the flow of capital in the housing finance market, our strategic initiatives designed to capitalize on those trends, our ability to attract capital to finance those initiatives, our approach to raising capital, our ability to pay dividends in the future, and the prospects for federal housing finance reform); (ii) statements related to our financial outlook and expectations for 2020 and future years, including our belief that our investment portfolio is well-positioned to recover meaningful value from March 31, 2020 levels, our expectations that mortgage rates for non-Agency-eligible borrowers will re-correlate with traditional benchmark rates over time, and that benchmark rates continue converging towards zero until the economy begins growing again; our expectation that we will further reduce our outstanding secured debt that remains subject to margin calls; our belief that the substantial improvements exhibited by the private mortgage sector in recent years have created a cohort of high-quality residential and business purpose loan products that should continue to perform well through this crisis, that such improvements should accelerate our market's recovery relative to the last financial crisis, that the strength of our underwriting and knowledge of the loans we've originated or purchased through our conduits has the potential to differentiate our platform going forward, and our focus on emerging from this crisis with an enhanced business model that is capable of delivering meaning value to counterparties while taking into account the likelihood of a prolonged recession and possible resurgence of COVID-19; (iii) statements regarding estimated and pro forma financial information, including our estimate of GAAP book value as of April 30, 2020, and information related to mortgage loan sales transactions entered into and expected to settle during the second quarter
|
|
| Detailed endnotes are included at the end of this Redwood Review. |
| |
| THE REDWOOD REVIEW I 1ST QUARTER 2020 |
| 35 |
|
|
| |
| F O R W A R D - L O O K I N G S T A T E M E N T S |
of 2020, repayment of associated debt balances, and replacement of certain marginable debt with new non-marginable debt, our presentation of outstanding recourse debt, marginable debt, recourse leverage ratio, and remaining margin posted against securities repurchase debt, each on a pro forma basis; (iv) statements related to our residential and business purpose lending platforms, including our expectation that we will sell or refinance substantially all of the remaining assets financed through our FHLBC facility and repay substantially all of our borrowings from the FHLBC, our plan to securitize a portion of the single-family rental loans financed at the FHLBC; (v) statements we make regarding future dividends, including with respect to our regular quarterly dividends in 2020; and (vi) statements regarding our expectations and estimates relating to the characterization for income tax purposes of our dividend distributions, our expectations and estimates relating to tax accounting, tax liabilities and tax savings, and GAAP tax provisions, and our estimates of REIT taxable income and TRS taxable income.
Important factors, among others, that may affect our actual results include:
| |
| • | the pace at which we redeploy our available capital into new investments and initiatives; |
| |
| • | our ability to scale our platform and systems, particularly with respect to our new initiatives; |
| |
| • | interest rate volatility, changes in credit spreads, and changes in liquidity in the market for real estate securities and loans; |
| |
| • | changes in the demand from investors for residential mortgages and investments, and our ability to distribute residential mortgages through our whole-loan distribution channel; |
| |
| • | our ability to finance our investments in securities and our acquisition of residential mortgages with short-term debt; |
| |
| • | changes in the values of assets we own; |
| |
| • | general economic trends, the performance of the housing, real estate, mortgage, credit, and broader financial markets, and their effects on the prices of earning assets and the credit status of borrowers; |
| |
| • | federal and state legislative and regulatory developments, and the actions of governmental authorities, including the new U.S. presidential administration, and in particular those affecting the mortgage industry or our business (including, but not limited to, the Federal Housing Finance Agency’s rules relating to FHLB membership requirements and the implications for our captive insurance subsidiary’s membership in the FHLB); |
| |
| • | strategic business and capital deployment decisions we make; |
| |
| • | developments related to the fixed income and mortgage finance markets and the Federal Reserve’s statements regarding its future open market activity and monetary policy; |
| |
| • | our exposure to credit risk and the timing of credit losses within our portfolio; |
| |
| • | the concentration of the credit risks we are exposed to, including due to the structure of assets we hold and the geographical concentration of real estate underlying assets we own; |
| |
| • | our exposure to adjustable-rate mortgage loans; |
| |
| • | the efficacy and expense of our efforts to manage or hedge credit risk, interest rate risk, and other financial and operational risks; |
|
|
| Detailed endnotes are included at the end of this Redwood Review. |
| |
| THE REDWOOD REVIEW I 1ST QUARTER 2020 |
| 36 |
|
|
| |
| F O R W A R D - L O O K I N G S T A T E M E N T S |
| |
| • | changes in credit ratings on assets we own and changes in the rating agencies’ credit rating methodologies; |
| |
| • | changes in interest rates; |
| |
| • | changes in mortgage prepayment rates; |
| |
| • | changes in liquidity in the market for real estate securities and loans; |
| |
| • | our ability to finance the acquisition of real estate-related assets with short-term debt; |
| |
| • | the ability of counterparties to satisfy their obligations to us; |
| |
| • | our involvement in securitization transactions, the profitability of those transactions, and the risks we are exposed to in engaging in securitization transactions; |
| |
| • | exposure to claims and litigation, including litigation arising from our involvement in securitization transactions; |
| |
| • | ongoing litigation against various trustees of RMBS transactions; |
| |
| • | whether we have sufficient liquid assets to meet short-term needs; |
| |
| • | our ability to successfully compete and retain or attract key personnel; |
| |
| • | our ability to adapt our business model and strategies to changing circumstances; |
| |
| • | changes in our investment, financing, and hedging strategies and new risks we may be exposed to if we expand our business activities; |
| |
| • | our exposure to a disruption or breach of the security of our technology infrastructure and systems; |
| |
| • | exposure to environmental liabilities; |
| |
| • | our failure to comply with applicable laws and regulations; |
| |
| • | our failure to maintain appropriate internal controls over financial reporting and disclosure controls and procedures; |
| |
| • | the impact on our reputation that could result from our actions or omissions or from those of others; changes in accounting principles and tax rules; |
| |
| • | our ability to maintain our status as a REIT for tax purposes; |
| |
| • | limitations imposed on our business due to our REIT status and our status as exempt from registration under the Investment Company Act of 1940; |
| |
| • | decisions about raising, managing, and distributing capital; and |
| |
| • | other factors not presently identified. |
|
|
| Detailed endnotes are included at the end of this Redwood Review. |
| |
| THE REDWOOD REVIEW I 1ST QUARTER 2020 |
| 37 |
Pro Forma Note
This Redwood Review contains selected pro forma financial information, giving effect to pending asset sale transactions and certain other activity that occurred on or prior to May 6, 2020, as if the transactions and activity had occurred on March 31, 2020. In general, these adjustments reflect asset sales that occurred from April 1, 2020 through April 30, 2020, and associated debt repayments, as well as new non-marginable warehouse facilities that were entered into since April 30, 2020. An additional description of this pro forma activity is provided in Pro Forma Financial Information section of this Redwood Review. Additionally, refer to the Introduction section of this Redwood Review for further information regarding our pro forma financial information.
Non-GAAP Tangible Book Value Note
Non-GAAP tangible shareholders' equity (or book value) is a measurement of stockholders’ equity excluding the value of acquisition-related intangible assets recorded on our consolidated balance sheet in connection with the acquisitions in 2019 of 5 Arches, LLC and CoreVest American Finance Lender LLC. Management believes tangible shareholders’ equity provides useful information to investors and management because it eliminates the impact of these acquisition-related items that may not be reflective of the underlying performance of Redwood’s ongoing operations, and which may not be reflective of their impact over the longer term. At March 31, 2020, tangible stockholders' equity excluded $68 million of intangible assets.
Page 5
| |
| (1) | Refer to Pro Forma Note above. |
Page 7
| |
| (1) | Our preliminary estimate of GAAP book value per common share as of April 30, 2020 reflects management’s preliminary estimate with respect to such information, based on information currently available to management, and may vary from the Company’s actual GAAP book value per common share as of such date. Further, this preliminary estimate is not a comprehensive statement or estimate of Redwood’s financial results or financial condition as of April 30, 2020. This preliminary estimate should not be viewed as a substitute for full interim financial statements prepared in accordance with GAAP and is not necessarily indicative of the results to be achieved in any future period. Accordingly, you should not place undue reliance on this preliminary estimate. |
Page 8
| |
| (1) | Refer to Pro Forma Note above. |
| |
| (2) | Refer to Pro Forma Note and Non-GAAP Tangible Book Value Note above. Our recourse leverage ratio represents the ratio of our non-GAAP tangible book value divided by our total recourse debt. |
Page 12
| |
| (1) | "Q1 2020 Fair Value Changes" presented within this table represent fair value changes recorded in the first quarter of 2020 for assets we held at March 31, 2020. These changes in fair value were recorded both through our "Investment fair value changes" line item on our income statement and our "Accumulated other comprehensive income" line item on our balance sheet. These losses represent the decline in price of the related assets from December 31, 2019 (or their purchase date, if purchased after December 31, 2019) to March 31, 2020. |
| |
| (2) | "Held-for-sale" amounts presented in this column are associated with assets we held at March 31, 2020 and as of April 30, 2020, had either sold, entered into agreements to sell or that we have the intent to sell in the near-term. |
| |
| (3) | "Income Statement" amounts presented in these columns represent net losses recorded within the "Investment fair value changes" line item of our income statement, except for MSRs, for which their changes in fair value were recorded through the "Other Income" line item of our income statement. |
| |
| (4) | "Balance Sheet" amounts presented in this column represent net losses recorded within the "Accumulated other comprehensive income" line item of our balance sheet. |
| |
| (5) | Q1 2020 fair value changes for our Residential loans, Residential mortgage banking (loans), and SFR loans held in inventory at our Business Purpose Lending segment are presented in the "Held-for-sale" column as we have either sold, entered into agreements to sell, or had the intent to sell in the near-term, as of April 30, 2020. |
Page 13
| |
| (1) | "Q1 2020 fair value changes on assets held at March 31, 2020", represents investment fair value changes associated with assets we continued to hold at March 31, 2020 and that we generally have the intention to hold for longer-term investment. |
| |
| (2) | "Other Q1 2020 investment fair value changes" represents investment fair value changes on assets we sold and hedges we settled during the first quarter of 2020, and assets that we had either entered into agreements to sell or that we have the intent to sell in the near-term. |
| |
| (3) | Refer to Non-GAAP Tangible Book Value note above. |
|
|
| |
| |
| THE REDWOOD REVIEW I 1ST QUARTER 2020 |
| 38 |
Page 16
| |
| (1) | Refer to Pro Forma Note above. |
| |
| (2) | Other assets and liabilities are presented on a net basis within this column. |
| |
| (3) | In addition to the impact from the Pro Forma asset sales and debt repayments, cash at March 31, 2020 on a pro forma basis has been adjusted for the Dividend we expect to pay on May 8, 2020. |
Page 18
| |
| (1) | Debt balances presented in this table are adjusted on a pro forma basis for certain items as described in the Pro Forma Note above. Adjusted amounts assume proceeds from sales transactions are used to fully repay debt balances outstanding at March 31, 2020 associated with such items. |
Page 19
| |
| (1) | Pro forma financial data reflect our estimates with respect to such information, based on information currently available to management and a number of assumptions, and may vary from our actual results. The pro forma financial information is not necessarily indicative of the expected financial position or results of Redwood's operations for the first quarter of 2020, the second quarter of 2020, or any future period. |
| |
| (2) | Refer to Pro Forma Note and Non-GAAP Tangible Book Value Note above. Our recourse leverage ratio represents the ratio of our non-GAAP tangible book value divided by our total recourse debt. |
Page 20
| |
| (1) | HPI updated LTV is calculated based on the current loan balance and an updated property value amount that is formulaically adjusted from value at origination based on the FHFA home price index (HPI). |
Page 21
| |
| (1) | Average current debt service coverage ratio (or DSCR) is the ratio by which net operating income of a property exceeds it fixed debt costs. |
| |
| (2) | Average loan to value (or LTV) (at origination) is calculated based on the original loan amount and the property value at the time the loan was originated. |
Page 23
| |
| (1) | “Scheduled/scheduled” remittance type refers to a requirement for the servicer to remit to a securitization entity scheduled interest, whether collected or not, and scheduled principal, whether collected or not, for mortgages serviced, in addition to any prepayments of principal. |
Page 24
| |
| (1) | Excludes MSRs owned by Redwood associated with unsecuritized loans, where there is no advancing obligation. |
|
|
| |
| |
| THE REDWOOD REVIEW I 1ST QUARTER 2020 |
| 39 |