| |
The Redwood Review 3rd Quarter 2006 |
| |
 | CONTENTS |
INTRODUCTION | 2 |
SHAREHOLDER LETTER | 3 |
ABOUT REDWOOD TRUST | 7 |
BUSINESS GROUP DISCUSSION | |
| ► | Residential Group | 12 |
| ► | Commercial Group | 17 |
| ► | CDO Group | 21 |
FINANCIAL REVIEW | |
| ► | Finance Group Overview | 24 |
| ► | GAAP Earnings | 28 |
| ► | Core Earnings | 29 |
| ► | Taxable Income | 30 |
| ► | Book Value per Share | 34 |
| ► | Return on Equity | 36 |
| ► | Residential Credit Results | 38 |
| ► | Credit Reserves | 42 |
| ► | Dividends | 44 |
APPENDIX | |
| ► | Glossary | 46 |
| ► | Financial Tables | 53 |
| INTRODUCTION |
The Redwood Review
We file quarterly reports on Form 10-Q and annual reports on Form 10-K with the Securities and Exchange Commission. Those filings and our quarterly earnings press releases provide information about our financial results from the perspective of Generally Accepted Accounting Principles (GAAP). These documents are available on our web site, www.redwoodtrust.com. We urge you to study them, as there is much to learn about Redwood Trust there.
In the Redwood Review, you have the opportunity to learn more about Redwood Trust through a discussion of GAAP results and also a discussion of tax results and other non-GAAP measures. You will first find a quarterly letter to our shareholders, and then a background section on Redwood Trust that highlights the key aspects of our business. Following that is a discussion of current trends within each of the business groups that comprise Redwood Trust, a review of various financial indicators for our business, a glossary explaining some of the specialized terms we use, and then tables that provide supplementary financial data.
On a basic level, our primary business - assuming the credit risk of securitized residential and commercial real estate loans - is not that difficult to understand. The details and business metrics, however, can get complicated. We hope that the Redwood Review provides some insight and serves as a useful tool for better understanding your investment in Redwood Trust.
We expect that the form and content of the Redwood Review will evolve over time. We welcome your input during this process.
CAUTIONARY STATEMENT: This Redwood Review contains forward-looking statements within the safe harbor provisions of the Private Securities Litigation Reform Act of 1995. Statements that are not historical in nature, including the words “anticipated,” “estimated,” “should,” “expect,” “believe,” ”intend,” and similar expressions, are intended to identify forward-looking statements. These forward-looking statements are subject to risks and uncertainties, including, among other things, those described in our 2005 Annual Report on Form 10-K under Item 1A “Risk Factors.” Other risks, uncertainties, and factors that could cause actual results to differ materially from those projected are detailed from time to time in reports filed by us with the Securities and Exchange Commission, including Forms 10-K, 10-Q, and 8-K. Important factors that may impact our actual results include changes in interest rates and market values; changes in prepayment rates; general economic conditions, particularly as they affect the price of earning assets and the credit status of borrowers; the level of liquidity in the capital markets as it affects our ability to finance our real estate asset portfolio; and other factors not presently identified. In light of these risks, uncertainties, and assumptions, the forward-looking events mentioned in, discussed in, or incorporated by reference into this Review might not occur. Accordingly, our actual results may differ from our current expectations, estimates, and projections. We undertake no obligation to publicly update or revise any forward-looking statements, whether as a result of new information, future events, or otherwise.
| SHAREHOLDER LETTER |
Third Quarter 2006
Dear Shareholders:
At Redwood, we are actively managing our business for growth. We focus on growth through the development of strong market positions, economies of scale, and the diversification of risk and opportunity. In practical terms, this means that we have been building and developing our capabilities to capitalize on changing market conditions and to invest in a broader array of real estate assets. Our long-term mission is to become a much larger company, and we believe we can do that in a responsible manner that benefits our shareholders.
As has been well documented, this is a period of rapid change in the real estate and capital markets. To capitalize on those changes, Redwood has been evolving. We are working to diversify our opportunities and risks on both the asset and liability side of our balance sheet. In addition, in the short-term, we are putting less emphasis on accumulating assets that have highly concentrated real estate credit risks. This letter highlights some of these developments. You can read more about the evolution of Redwood Trust in the business group discussions that follow.
Over the past year, capital market pricing for prime-quality residential credit-enhancement securities (CES) has remained at record levels despite clear signs of weakness in the housing market. These assets have highly concentrated credit risks with respect to large balances of underlying loans, and healthy investment returns require that almost all of the underlying loans perform. For the last year, we have continued to acquire prime CES at a reduced pace while also actively selling certain types of these assets. We have reduced our exposure to first- and second-loss residential real estate credit risk from the 2005 and 2006 vintages to less than 10% of our equity base. We will continue to acquire selected second- and third-loss CES for re-securitization via Acacia CDOs. However, we do not expect to make significant new net investments in prime residential first-loss or similar assets in the next few quarters unless asset prices correct. We do anticipate resuming across-the-board investment growth in residential CES in late 2007 or early 2008, by which time we expect that underwriting quality will have improved and the risk of further home price decreases will have diminished.
For some time, we have been developing our capabilities to invest in Alt-A and sub-prime residential credit-enhancement securities, including residuals and net interest margin securities (NIMs). We have made small initial investments in these assets and we expect to make additional investments as the housing cycle progresses. While we do not expect that first-loss exposure to Alt-A or sub-prime loans will become a large part of Redwood’s business, we do expect to find some very interesting investment opportunities in these sectors in the next few years.
We have expanded our commercial real estate CES activities, acting as the lead investor providing credit-enhancement for what we expect to be an increasing number of commercial real estate securitizations. While commercial property fundamentals are strong, loan-underwriting criteria are becoming more speculative. We are proceeding, but with caution.
| SHAREHOLDER LETTER |
Third Quarter 2006
We see some tentative initial signs of softness in pricing for residential and commercial CES and related assets that have concentrated credit risks. It is not yet clear how attractive asset acquisition prices will become, or whether this price softness is a seasonal fourth quarter phenomenon or a secular trend.
We expect that investing in CES backed by residential and commercial real estate loans will remain our primary business in terms of total equity capital employed. If credit results are good, Redwood shareholders stand to benefit from the potential upside inherent in the assets we own that have concentrated credit risks. Investing in CES is a fundamental focus of our company, and we will continue to develop and build CES upside potential for shareholders.
We believe that our capabilities can also be used to create attractive investment opportunities in higher-rated securities, whole loans, and other assets that are not directly exposed to concentrated credit risks. We expect to expand our focus on investing in these lower risk assets going forward. Doing so not only compliments but also strengthens our credit-enhancement business. In addition, doing so also utilizes our excess capital in an attractive but flexible manner, and diversifies some of our capital away from first-loss credit risks, which may be appropriate at this point in the real estate and capital markets cycles.
To produce an attractive rate of return on equity capital employed while investing in lower-risk assets, we must use leverage. Our returns on these lower-risk assets are generated through spread lending - earning the spread between the yield on the asset and the cost of borrowed funds. In contrast, most of our earnings over the last few years have come from investing in CES assets held with equity (without leverage). Spread lending was a large business for Redwood in its early years. We have continued to engage in spread lending in the last few years primarily through funding loans via securitization in Sequoia and funding securities through re-securitization in Acacia CDOs. In this manner, we have used structural leverage (our equity invested is exposed to the risks of a large volume of underlying assets) but not financial leverage (the ABS issued by these consolidated securitization entities are not obligations of, and do not pose liquidity risks for, Redwood Trust). We have used financial leverage, but only to a small degree to fund the aggregation of loans and securities prior to securitization.
Going forward, we intend to increase our acquisitions of residential and commercial whole loans and of investment-grade real estate securities backed by these loans. We will use Sequoia securitizations, Acacia CDO securitizations, and Redwood debt to fund these assets on an on-going basis to earn net interest income.
Since we have not used Redwood debt extensively in the last few years, we expect our financial leverage will increase from near zero to levels more common for financial institutions. We are not changing our risk-adjusted capital standards - we will still use equity funding for higher risk, less liquid assets. Our liability structure will shift in a manner we believe appropriate for our anticipated shift in asset mix.
| SHAREHOLDER LETTER |
Third Quarter 2006
We intend to take on only modest prepayment and interest rate risks with respect to assets funded with Redwood debt. To the extent we do take on these risks, we believe they will largely serve to offset risks we currently have within our existing asset portfolios. Using increased levels of Redwood debt (primarily debt secured through the pledging of assets) does involve assuming liquidity risk. We have experience successfully managing this risk at Redwood through several liquidity cycles in the past. In addition, new forms of secured debt that involve fewer liquidity risks (such as collateralized commercial paper, market value CDOs, and the like) have become available. We anticipate using diverse sources and types of debt, with the primary goal being prudent management of liquidity risks.
Let us look at a specific example that illustrates one of the ways we anticipate diversifying our liabilities. The Sequoia securitization entities currently own $9 billion seasoned high-quality residential loans funded by issuance of Sequoia ABS securities. We own the Sequoia call rights, giving us the right (if we so choose) to pay off Sequoia liabilities and acquire the underlying Sequoia loans at Redwood. At current prepayment rates, most of the existing Sequoias will become callable in the next two years and, in general, we intend to call these transactions when they become callable. For instance, we called Sequoia 7 and 8 in October and acquired $235 million one- and six-month LIBOR adjustable-rate Sequoia loans. We expect to have the opportunity to acquire approximately $2 billion Sequoia loans in 2007. In the past, we would have sold these loans for a gain or funded them by re-securitizing them in a new Sequoia transaction. Going forward, we intend to use Redwood debt to fund an ongoing investment in some of the loans we will be acquiring from Sequoia. Assuming an 8% equity-to-assets ratio, we could employ a significant amount of capital in this manner, generating equity returns we estimate at 10% to 15% before overhead. This is only one example of how we may employ capital in debt-funded asset strategies. Equity employed in this manner is a flexible commitment, because, if in the future we choose to redeploy this capital to acquire credit-enhancement securities, then we probably will be able to sell or re-securitize the debt-funded assets.
Moving on from spread lending - let us look at the big picture. For Redwood, the near-term outlook for earnings, dividends, and growth depends, in part, on the how fast we employ our $219 million of excess capital. The outlook for utilizing this capital is good, although the exact timing is uncertain and depends on a number of factors, including our pace of asset acquisitions, our funding strategies, capital recycling, and capital raising. Our general outlook is clear - the amount of excess capital we have is small relative to our current residential and commercial credit-enhancement opportunities, our developing opportunities in acquiring more high-grade securities and high-quality whole loans to be funded via securitization and with Redwood debt, and our potential future opportunities to acquire a variety of types of distressed assets. Since we could utilize our excess capital over the next several quarters, we are beginning to explore options for raising additional equity and long-term debt capital during 2007.
Moving to the intermediate term, residential credit performance is the most important factor driving investment results from our current book of business. It is still early in the down cycle for residential real estate. So far, there are few signs of increased stress among the residential loans we credit-enhance. Losses have been negligible. Residential delinquencies are up only slightly, in a manner generally consistent with the seasoning of the loans we credit-enhance. If the housing recession continues, however, we expect to realize increased residential credit losses in 2007 and 2008. The immediate effect of an increase in losses, should it occur, would be to reduce our taxable income and special (or perhaps, regular quarterly) dividends. The silver lining to such a scenario, if there is one, is that we would likely see ample opportunities to acquire newly originated and seasoned distressed assets at attractive risk/reward levels.
| SHAREHOLDER LETTER |
Third Quarter 2006
In the longer term, Redwood’s success depends on the competitive advantages we can develop and, most of all, on our culture of disciplined investing, teamwork, and innovation. In these respects, we believe we are in good shape.
On a personal note, we want to alert you that we (George and Doug) each own over 100,000 options that will be expiring in the next few months. We have held these options for almost ten years. As a result of this looming expiration, we will be exercising these options before year-end. Our plan is to exercise these options and sell a portion of the optioned shares (both back to Redwood and also in the open market) to cover option exercise costs, taxes, and to capture a portion of the option profits earned over the last 10 years. We also intend to keep a portion of the option-exercise shares, thus increasing the amount of Redwood stock we own. We have been continuously building our personal holdings of Redwood stock since we founded the company in 1994. Additional options will be expiring in the next few years and exercising these options will help us accumulate more stock. (Please note that it will not be our normal practice to discuss option exercises and stock sales in advance of when they occur.)
Continuing on a personal note, we are excited by the diverse opportunities in the real estate asset markets developed by Redwood’s staff. We are wary of the trends in residential real estate because they will likely bring us challenges and headaches, but at the same time, we are prepared to capitalize on new opportunities should they arise. For now, we have reduced some of our risks in the residential sector and we are watching it carefully, with interest. We expect to keep having fun, and to keep enjoying our work with the good people of Redwood Trust. In addition, we are looking forward to earning more quarterly and special dividends.
Yours truly,
| | |
| | |
 |  |
| | |
| George E. Bull, III | Douglas B. Hansen |
Chairman and CEO | President |
| ABOUT REDWOOD TRUST |
An Introductory Overview of Redwood Trust
| 1. | We are an entrepreneurial specialty finance company. |
Our vision when we started Redwood Trust in 1994 was to create a company that is more efficient than banks, thrifts, and other financial institutions at investing in and managing real estate loans and securities.
We are building a variety of related and integrated specialty finance businesses in areas where we believe we can develop a competitive advantage.
For tax purposes, we are structured as a real estate investment trust (REIT). We also conduct business in taxable subsidiaries.
2. | Our primary business is credit-enhancing securitized residential and commercial real estate loans. |
Historically, money lent to homeowners and property owners came from bank deposits. Today, a growing percentage of money sourced to fund real estate loans comes from capital markets investors who buy mortgage-asset-backed securities (MBS), which are fixed income securities backed by pools of residential real estate loans (RMBS) or commercial real estate loans (CMBS).
Most of these investors want to buy AAA-rated or other investment-grade MBS that do not carry a significant risk of credit loss if an underlying real estate loan defaults. In order for these securities to be marketed, someone else has to assume this risk of credit losses. Redwood Trust is a specialist in evaluating and managing real estate loan credit and our core business is assuming the risk of credit losses for securitized loans. Because Redwood Trust credit-enhances (or “guarantees”) these securitized loans, the risk of credit loss is reduced for other MBS investors. As a credit-enhancer, we are exposed to real estate credit risk on many loans, but we also have the ability to produce strong financial results if the real estate loans we credit-enhance perform well.
3. | We credit-enhance loans by acquiring and owning credit-enhancement securities. |
In most securitizations of real estate loans, a variety of types of MBS are created, each with different characteristics with respect to average life, credit risk, prepayment risk, interest rate risk, and other variables.
One security serves as the “first-loss” bond. If there are credit losses within the pool of securitized real estate loans, the principal value of the first-loss bond is reduced. If the entire principal value of the first-loss bond is eliminated due to credit losses within the securitized loan pool, then further credit losses reduce the principal value of the “second-loss” bond. Only when the entire principal value of the second-loss bond is eliminated does the third-loss and other bonds issued from that securitization risk incurring credit losses. The bonds that are the most exposed to credit risks carry below-investment-grade bond ratings from the credit rating agencies. These are credit-enhancement securities - they improve the creditworthiness of the more senior bonds by protecting them from initial credit losses.
We typically acquire first-loss bonds at 25% to 35% of their principal value and other credit-enhancement securities at 50% to 100% of their principal value. Many of these bonds are priced at a substantial discount to their principal value as future credit losses could reduce or eliminate the principal value of these bonds. Our returns on these investments are based on how much principal and interest we eventually receive and how quickly we receive those payments.
| ABOUT REDWOOD TRUST |
An Introductory Overview of Redwood Trust
We receive interest on the full principal value of the bonds, even though we buy them at a discount. For instance, on a bond with a principal value of $1 million - for which we may have paid only $300,000 - we receive interest based on the full principal value, thus providing a strong cash-on-cash return.
We typically do not receive principal payments until a few years following loan securitization since the principal payments and prepayments from the underlying loans are first used to pay down the most senior bonds. The amount of principal we ultimately receive depends on the cumulative amount of credit losses incurred within the loan pool before the securitization is called or the loans mature.
The faster we collect principal and the longer it takes to realize credit losses, the better it is for our investment returns. In an ideal environment, we would experience fast prepayments and low credit losses. We encountered this environment in 2003, 2004, and 2005. Conversely, our least favorable environment would be slow prepayments and high credit losses. If losses are high, we might never receive a principal payment. In this case, our investment return could still be positive if losses are delayed long enough for us to receive sufficient interest payments.
| 4. | Our primary focus is on credit-enhancing high-quality real estate assets. |
Most of the real estate loans we credit-enhance or own are of above-average quality compared to other securitized real estate loans. As a result, our delinquency and loss rates have been significantly lower than the national average. On the residential side, we plan to continue to expand our credit-enhancement activities to include more loans that have average or below-average quality characteristics (Alt-A and sub-prime). Nevertheless, it is likely that the bulk of the real estate loans we credit-enhance will continue to be of above-average quality. The majority of the loans we credit-enhance are “jumbo loans” that have balances in excess of the lending limits (currently $417,000) set for Fannie Mae (FNMA) and Freddie Mac (FHLMC).
Currently, 40% to 50% of the residential loans we credit-enhance or own are on homes located in California. This roughly equals the percentage of all jumbo loans that are located in California. We consider California to be one of the more attractive states for the residential credit-enhancement business. Of the commercial real estate loans we credit-enhance, 16% of the underlying properties are located in California.
| 5. | We use securitization to finance most of our assets. |
We securitize most of the residential real estate whole loans we acquire from originators. We accumulate loans over a period of weeks or months, and then sell the loans to a newly created securitization entity typically called “Sequoia”. These entities then create securities backed by these loans. Sequoia sells the created investment-grade securities to investors. Redwood generally assumes the credit risk of the loans and earns the spread between the yield on the loans and the cost of funds of the securities issued (we do this by acquiring the credit-enhancement securities and interest-only securities from the Sequoia entities). Although the loans are owned by Sequoia and the asset-backed securities (ABS) issued are obligations of Sequoia (not of Redwood), we show the assets and liabilities of Sequoia on our consolidated GAAP balance sheet. We retain the Sequoia call rights that permit us (if we so choose) to call the transaction and re-acquire the underlying Sequoia loans for Redwood by paying off the holders of Sequoia ABS securities at par value. Sequoias usually become callable after prepayments have reduced the underlying loan pool to 10% to 20% of its original size.
| ABOUT REDWOOD TRUST |
An Introductory Overview of Redwood Trust
We use collateralized debt obligation (CDO) securitizations to fund a variety of our assets, including credit-enhancement securities, investment-grade securities, and commercial whole loans. Over a period of several months, we acquire and aggregate a diverse pool of these assets. We then sell this pool of assets to a newly formed securitization entity (under the brand name “Acacia”) that creates and sells CDO asset-backed securities to the capital markets. We generally assume a portion of the credit risks of these assets and earn the spread between the yield on the asset and the cost of funds of the CDO securities issued (we do this by acquiring a portion of the CDO equity securities from Acacia). To the extent that we sell CDO equity securities to third-party investors other than Redwood, we also earn asset management fees for managing the Acacia assets and liabilities on an on-going basis. Although the asset pool is owned by the Acacia entity and the asset-backed securities issued are obligations of Acacia (not of Redwood), we show the assets and liabilities of Acacia on our consolidated balance sheet. We retain the Acacia call rights that permit us (if we so choose) to call the transaction and re-acquire the underlying Acacia assets for Redwood by paying off the holders of Acacia ABS securities at par value. Acacia CDOs generally become callable three years after they were originally issued.
| 6. | We maintain a strong balance sheet. |
Most of our assets that have concentrated credit risks (such as first-loss credit-enhancement securities) are financed with equity. Most of our other assets are financed via securitization. As a result, Redwood’s debt obligations are low compared to most financial institutions. On September 30, 2006, we had $1.0 billion of equity capital and $0.5 billion of Redwood debt.
We expect to utilize more Redwood debt in the future, as we are increasing our acquisitions of investment-grade securities and high-quality whole loans for which the use of debt is appropriate, we believe. Nevertheless, we expect to maintain a strong balance sheet given the risks we carry.
| 7. | We are leaders in our market segments. |
The securitized residential real estate loan market can be divided into three segments. The first segment consists of “conforming” lower-balance loans, usually of average or better quality. Many of these loans are credit-enhanced by FNMA or FHLMC. The second segment consists of lower-quality loans that are credit-enhanced primarily by sub-prime mortgage origination companies. The third segment consists of private-label securitizations containing primarily jumbo loans of above-average or average quality (prime and Alt-A loans). Redwood is one of the largest credit-enhancers in this third segment. Redwood credit-enhances $235 billion of loans that have been securitized in private-label securitizations, representing approximately 13% of the outstanding securitized loans in this segment.
Additionally, since 1998 we have been developing a credit-enhancement business for commercial real estate loans. We currently credit-enhance $36 billion of commercial loans, representing approximately 7% of the outstanding commercial real estate loan balances that have been securitized.
| ABOUT REDWOOD TRUST |
An Introductory Overview of Redwood Trust
| 8. | We have some interesting competitive advantages. |
As a non-regulated specialty finance company, we have greater freedom to operate in the capital markets and securitization markets than do financial institutions such as banks and insurance companies. We also enjoy lower operating costs.
As a public company with permanent capital, we have an advantage in investing in illiquid assets compared to investment companies, partnerships, and hedge funds. In an environment of declining liquidity, some of our competitors may suffer investor withdrawals, forcing them to sell assets at a time when prices are low and asset acquisition opportunities are attractive.
As a REIT, we have tax advantages relative to corporations that have to pay corporate income taxes, typically one of the largest costs of doing business.
With $1 billion of equity capital focused on one integrated business, we have size advantages that bring economies of scale as well as marketing and operating advantages.
As a company with a small number of employees (89 as of September 30, 2006), we have a strong culture that is entrepreneurial, innovative, focused, and disciplined.
| 9. | We pay a regular dividend and we may pay a special dividend. |
As a REIT, we are required to distribute to shareholders as dividends at least 90% of our REIT taxable income, which is our income as calculated for tax purposes (exclusive of income earned in taxable subsidiaries). In order to meet our dividend distribution requirements, we have been paying both a regular quarterly dividend and a year-end special dividend.
We set our regular quarterly dividend at a rate that we believe is reasonably likely to be sustainable over time under most market conditions. If we earn more REIT taxable income than is required to fund the regular dividend, we typically pay a special dividend. We expect our special dividend amount will be highly variable, and we may not pay a special dividend every year. Our dividend policies, distribution practices, and outlook may change over time.
| 10. | We are a growth company. |
The amount of real estate loans and securities outstanding has grown rapidly over the past several years, and we expect 8% to 12% long-term growth going forward. With our competitive advantages in a very large and growing market, we expect to be able to develop growth opportunities for many years. We believe growth, if pursued in a responsible manner, help us improve book value per share, produce an attractive return on equity, and increase dividends per share.
| ABOUT REDWOOD TRUST |
[This Page Intentionally Left Blank]
| BUSINESS GROUP DISCUSSION |
Residential Group Overview
Description
Redwood’s residential group invests in and manages residential real estate loans and securities backed by these loans.
Redwood credit-enhances residential loans by investing in the credit-enhancement securities that bear the bulk of the credit risk of a pool of securitized loans. These below-investment grade credit rated securities include highly credit-sensitive first-loss credit-enhancement securities that we acquire and hold using our equity funds. We also invest in second- and third-loss credit-enhancement securities that carry significant, but lesser, degrees of credit risk. We fund the acquisition of these assets either with our equity or via a re-securitization in our Acacia CDO program.
Redwood also invests in investment-grade credit rated residential securities and residential whole loans. Loans are acquired from originators on a flow and bulk basis through our residential conduit operations. Currently, most of our investments in these loans and investment-grade securities are funded via securitization. When we use securitization as a source of funding, residential whole loans are securitized via our Sequoia securitization program and residential securities are re-securitized via our Acacia CDO program. Increasingly, we also expect to fund ongoing investments in whole loans and investment-grade securities with Redwood debt.
Discussion
We continue to acquire residential real estate assets at a measured pace. During the third quarter, we acquired $967 million residential loans, $91 million investment-grade securities, and $22 million credit-enhancement securities.
We used a variety of methods to finance these new assets. During the third quarter, we completed a Sequoia securitization of whole loans and an Acacia CDO re-securitization of our securities purchases. We also used Redwood debt to finance assets, primarily assets we have purchased on a temporary basis prior to sale to a securitization entity.
At quarter-end, we owned $520 million of unsecuritized whole loans and we had commitments to acquire an additional $93 million newly originated loans. We expect to continue to acquire newly originated loans on an ongoing basis. Additionally, in the fourth quarter of 2006 (and continuing for the next few years), we expect to acquire seasoned high-quality adjustable-rate whole loans from the Sequoia securitization entities we have sponsored, as many of these transactions are becoming callable and we own the call rights.
In recent years, we have used securitization to fund all our ongoing investments in residential whole loans. Going forward, we intend to use a combination of securitization and Redwood debt to fund these assets. To secure Redwood debt, we can pledge either whole loans or securitize the whole loans and pledge the created securities.
Asset prices for many segments of the residential asset marketplace remain high. In our opinion, these high prices are, in many cases, not consistent with underlying fundamental weaknesses in the residential housing markets. During the third quarter, we took advantage of strong asset prices and sold $47 million residential first- and second-loss credit-enhancement securities backed primarily by prime and Alt-A loans originated in 2005 and 2006. The continued reduction of our investments in the 2005 and 2006 vintages reflects our concerns about weaker underwriting standards, deteriorating housing markets, and current risk-adjusted valuations for these assets. As a result of these sales, our total investment in first-loss CES backed by 2005 and 2006 vintage residential loans has been reduced to $67 million.
| BUSINESS GROUP DISCUSSION |
Residential Group Overview
In the business of investing in first-loss and other credit-enhancement securities, the prime-quality loan segment is very small relative to Alt-A and sub-prime. We estimate that the total market value of Alt-A first-loss credit-enhancement securities outstanding is more than four times larger than prime CES, and that the total of sub-prime first-loss CES outstanding is more than 10 times larger than the prime CES outstanding. In addition, the markets for these lower-quality loan investments are less efficient. To address this market opportunity, we are continuing to develop our credit expertise, asset evaluation, and surveillance capabilities with respect to Alt-A and sub-prime loans. We will continue to invest primarily in the prime markets, but we believe there are also opportunities for growth in the Alt-A and sub-prime markets.
Despite our increased interest in the Alt-A and sub-prime markets, we are not committing much capital to investments in Alt-A and sub-prime credit-enhancement securities at this time. This is not the right point in the credit cycle. At September 30, 2006, our first-loss Alt-A credit-enhancement securities totaled $33 million. As the cycle progresses, we may see improved loan quality, improved pricing, and attractive niche investment opportunities in these market segments.
A market segment that is of potential concern during a period of housing weakness is negative-amortization (neg-am) loans. Our quarter-end portfolio of first-loss securities credit-enhancing neg-am loans was $61 million market value. Depending on the quality of the borrower and various loan factors, we characterize the pools of neg-am loans we credit-enhance as generally prime or generally Alt-A. Our first-loss market value exposure to prime neg-am was $37 million and to Alt-A neg-am was $24 million.
We invest in and manage neg-am assets with great care. Neg-am loans allow borrowers to make a minimum monthly payment that is less than the interest due on the loan, deferring part of the interest payment by adding it to the loan balance. Borrowers who consistently make minimum payments face rising loan balances and a potential erosion of their equity in their home. For some neg-am loan pools, a reasonable percentage of the borrowers are likely to come under some financial stress as monthly payments rise over time. The overall credit quality of neg-am loans, even if made to prime borrowers, is significantly inferior to prime quality fully amortizing loans. Recognizing these risks, we are highly selective in making investments backed by neg-am loans. We would not credit-enhance many of these loans, even if they are “prime” neg-am product. It is also important to note that securitizations of these loans are structured, and assets are priced, so that we can still earn decent investment returns even if cumulative loss levels are five to ten times higher than fully amortized loans made to the same quality of borrowers.
We have invested in and credit-enhanced neg-am loans for many years. Credit losses and delinquency results for our neg-am loans have been and continue to be excellent. We also benefit from rapid prepayment rates on these loans. Therefore, while risks are elevated, the upside potential from these assets is substantial even if the credit performance of the loans turns out to be much worse than one would reasonably expect from these borrowers. We are currently generating attractive yields from our neg-am assets.
| BUSINESS GROUP DISCUSSION |
Residential Group Overview
The housing market is coming under some stress, especially in new home, condominium, and sub-prime markets in some locations. We do not know how much stress our borrowers will come under. So far, there are few if any visible signs of an increase in delinquencies in the loan portfolios we credit-enhance, and our credit losses remain negligible (see “Residential Credit Results” in the finance section of this Review for additional details). We expect to incur increased delinquencies and credit losses, but also to have improved investment opportunities.
Although, in the long term we expect to increase our residential assets and the amount of capital utilized in the residential business, in the near term our primary focus is on investing in investment-grade securities and high-quality whole loans that do not have the kind of concentrated credit risks found in credit-enhancement securities.
In the intermediate and longer term, we have a positive outlook for our invested and managed residential assets. Overall, the residential real estate markets should continue to grow. We have a highly efficient balance sheet, leadership positions in some segments of the residential credit-enhancement business, complimentary Redwood businesses that benefit our residential investment business, and a great team.
| BUSINESS GROUP DISCUSSION |
Residential Group Metrics
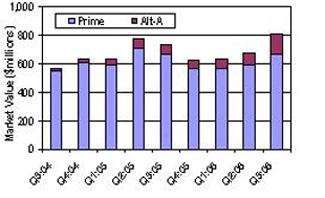
Chart 1: Total Residential CES | | Chart 2: Residential 1st Loss CES Portfolio by Vintage |
 | |  |
| Source: Redwood Trust | | | Source: Redwood Trust |
| | | | | |
| | | | | |
| Ø | Our residential CES assets are growing at a measured | | Ø | Our residential first-loss portfolio remains very |
| | pace. | | | seasoned,with 62% of assets originated prior |
| | | | | to 2005. |
| | | | Ø | Measured by market value. |
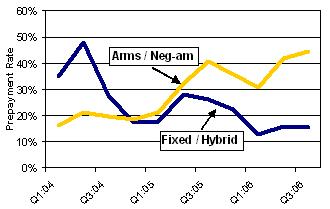
| Chart 3: Seriously Delinquent Trends for Neg-Am Residential CES | | Chart 4: Prepayments Trends for Residential CES |
 | |  |
| Source: Redwood Trust | | Source: Redwood Trust |
| | | |
| | | |
| Ø | Neg-am and non neg-am CES delinquencies remain low | | Ø | We continue to benefit from higher than expected |
| | on an absolute basis. | | | prepayment rates on our ARM and neg-am CES. |
| Ø | Neg-am CES delinquencies are performing well relative to | | | |
| | our higher expected loss assumptions. | | | |
| Ø | Delinquencies are measured as a percentage of current | | | |
| | pool balances. | | | |
| BUSINESS GROUP DISCUSSION |
[This Page Intentionally Left Blank]
| BUSINESS GROUP DISCUSSION |
Commercial Group Overview
Description
Redwood’s commercial group invests in and manages commercial real estate loans and securities backed by commercial loans.
An important part of our commercial real estate business is credit-enhancing securitized commercial real estate loans. We do this by investing in credit-enhancement securities issued from commercial loan securitizations. These securities bear the bulk of the credit risk of the underlying loans, and thus credit-enhance the other securities issued from the same entity. Due to the large amount of underlying loans, these credit-enhancement securities have concentrated credit risks and carry below-investment-grade credit ratings, bringing both the potential upside and downside that comes with assuming concentrated risks.
We also invest in commercial real estate whole loans that we acquire from originators, in investment-grade commercial real estate securities, and in special-situation commercial real estate assets.
Discussion
In the third quarter of 2006, we acquired $99 million below-investment-grade commercial credit-enhancement securities. We did not acquire any investment-grade commercial securities or commercial whole loans during the third quarter.
Redwood’s commercial group is now established in the marketplace as an investor and manager of first-loss and other commercial credit-enhancement securities. Credit-enhancement of commercial real estate loans is a specialized business requiring a commitment to providing a high level of service and reliability to loan originators and securities issuers.
Our commercial real estate business has been growing at a good pace. Over the last several years, we worked in partnership with another firm to invest in and manage credit-enhancement securities from 14 commercial loan securitizations. In the second quarter of 2006, for the first time we credit-enhanced a commercial securitization without a partner. We completed our second sole-managed deal in the third quarter, and we expect to continue to close an additional sole-managed deal in the fourth quarter. Our portfolio of below-investment-grade commercial credit-enhancement securities grew from $218 million to $383 million in the first nine months of this year. Of this, first-loss credit enhancement securities that we are funding with equity were $117 million at September 30, 2006. We have been funding first-loss securities primarily with equity and funding other credit-enhancement securities primarily through re-securitization in Acacia CDOs.
We have been working to enhance our due diligence, surveillance, and credit-risk management capabilities in an integrated fashion. We have been further developing our information systems so our staff can effectively monitor and manage our commercial real estate exposure at the individual property level. Our goal in developing these systems and capabilities is to not only make superior investment decisions based on underwriting and due diligence, but also to press forward asset workout and disposition decisions in a timely and cost-effective manner. Our focus on this aspect of the credit-enhancement business has already produced good results for us, as we have moved swiftly to either resolve the few loan issues that have surfaced or, alternatively, to sell assets that may have developing credit issues. We expect that our enhanced capabilities in this area will differentiate us from some of our competitors.
| BUSINESS GROUP DISCUSSION |
Commercial Group Overview
We have not been actively buying investment-grade commercial securities due to their tight spreads (high asset prices). We fund these securities through re-securitization in our Acacia CDO program. Our investment-grade commercial securities have declined from $162 million to $130 million during the first nine months of 2006 primarily due to asset sales following the call of Acacia 2.
Our commercial real estate whole loan portfolio was $32 million at September 30, 2006. Of this, $30 million was financed via securitization in Acacia CDOs. We intend to increase our purchases of commercial real estate whole loans in the future.
Although we have had to deal with issues on a few individual loans underlying our credit-enhancement securities, the overall credit performance for our commercial real estate assets continues to be good, with delinquencies and losses below industry-standard levels. At September 30, 2006, serious delinquencies were 0.15% of the current balance of the $36 billion loans underlying our commercial credit-enhancement securities. Realized principal value losses in the third quarter of 2006 were $1.0 million, of which our share was $0.5 million, reducing taxable income by $0.1 million.
Overall, the commercial real estate sector continues to perform quite well, with fundamentals of property performance balanced nicely against new construction and absorption. There are minor pockets of concern, such as a pending residential condominium bust in isolated markets. This could put upward pressure on vacancies in the multifamily sector as condo units (and also single-family residential investor properties) come onto the market as competitive rental properties. We also continue to be concerned about the retail property sector, which is driven by consumer spending, employment, and wage growth.
Space absorption across all property types continues to keep pace with the expanding economy, though with GDP growth forecasted to trend downward over the next year or two, absorption could slow. While each major property segment (office, retail, multifamily, and warehouse/industrial) is driven by its own set of specific dynamics, in the end, all commercial real estate is driven by macro trends of the economy. Given that there are currently few external challenges in the form of tax policy changes or systemic speculative construction (build first, find the tenant later), we feel our commercial real estate credit results will mirror the performance of the overall economy in the long run.
For the financing of commercial real estate, we are concerned that strong investor demand is leading to aggressive underwriting and over-leveraged properties. This, in turn, could lead to underperforming bond investments. Our approach continues to be that of investing only in assets that meet our investment criteria, rather than simply buying market share.
| BUSINESS GROUP DISCUSSION |
Commercial Group Metrics
| Chart 5: Redwood’s First-Loss Commercial CES and CRE CDO Equity | | Chart 6: Commercial Property Type Distribution |
 | |  |
| Source: Redwood Trust | | | Source: September 2006 Remittance Reports |
| | | | | |
| Ø | Our first-loss CES portfolio continues to grow at a steady | | Ø | Given the potential outlook for slower GDP growth and the |
| | pace. | | | slowdown in the residential housing market, we are paying |
| Ø | In 2007, we expect to match our current pace. | | | particular attention to the retail exposure we are taking on. |
| | | | | |
| Chart 7: Domestic CMBS Historical Issuance | | Chart 8: CRE CDO Historical Issuance |
 | |  |
Source: Commercial Mortgage Alert 10/6/05* Redwood Trust estimate | | Source: CRE CDO 201 CMSA Investor Conference 9/28/06. * Redwood Trust estimate |
| | | | | |
| Ø | The last few years have seen tremendous growth in CMBS | | Ø | CRE CDO issuance is growing rapidly and we expect this |
| | issuance. | | | trend to continue through 2007. |
| Ø | Though issuance may slow down in coming years, we | | Ø | We expect to issue more CRE CDOs to |
| | expect it to stay above the $150 billion level. | | | fund our growing commercial assets. |
| BUSINESS GROUP DISCUSSION |
[This Page Intentionally Left Blank]
| BUSINESS GROUP DISCUSSION |
CDO Group Overview
Description
The Redwood CDO group, working together with our residential and commercial groups, structures and manages collateralized debt obligation (CDO) transactions. In a CDO, diverse residential and commercial real estate securities and loans are acquired and pooled by a securitization entity, which then creates and sells collateralized debt securities. The CDO entities we sponsor issue CDO bond obligations under the Acacia brand name.
Most of the asset-backed debt securities created and sold by Acacia carry investment-grade credit ratings. The Acacia entities also create non-investment grade CDO equity securities that bear most of the credit risk of the underlying assets and that also earn the spread between the yield on Acacia assets and the cost of funds of the CDO bond obligations issued by Acacia. The primary determinant of the returns generated by Acacia CDO equity securities is the credit performance of the real estate securities and loans Acacia has purchased, though there is a small amount of interest rate and prepayment risk.
Redwood has an ongoing economic interest in the Acacia entities in three ways: we acquire and retain as an investment all or a portion of the Acacia CDO equity securities; we earn asset management fees for managing the assets and liabilities of the Acacia entities; and we retain the call rights for the Acacia transactions, giving us the opportunity (usually after three years) to generate a gain on sale.
Discussion
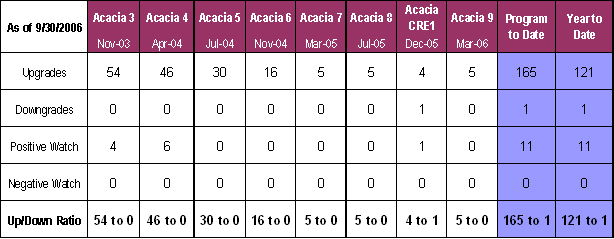
At the end of the third quarter of 2006, Acacia CDOs owned $2.5 billion assets, primarily residential and commercial real estate securities. Since the beginning of 2006, Acacia assets have increased by 25%. Many of Acacia’s assets were upgraded by the credit rating agencies in the last quarter. The overall performance of Acacia assets has been excellent.
Total investment-grade CDO bond obligations issued by Acacia were $2.5 billion at quarter-end. Several Acacia-issued securities have been upgraded in the last year, and Moody’s recently placed Acacia 3’s obligations on credit-watch positive.
Acacia 10 completed its $500 million issuance of ABS CDO bond obligations in the third quarter, selling all of the investment-grade ABS CDO bond obligations and a third of the equity to investors other than Redwood. The sale of CDO equity improves Redwood’s economics. It also helps us establish liquidity for Redwood’s Acacia CDO program in the CDO equity market, which may be of great value to us in the long run. We expect Acacia 10 to provide Redwood with attractive returns from our investment in the equity as well as from the asset management fees we will receive from non-Redwood equity investors. Going forward, our general intention for future Acacia transactions is to sell a portion of the CDO equity created by new Acacia securitizations to outside investors.
Of the outstanding Acacia CDO equity securities, Redwood owns $154 million and other investors own $14 million. All of these equity securities are generating attractive investment returns.
| BUSINESS GROUP DISCUSSION |
CDO Group Overview
The market for new CDOs similar to those that Acacia issues (“mezzanine ABS CDO”) has been extremely active in the past quarter, with dramatic increases in new issuance volume. The new issuance volume of mezzanine ABS CDOs has increased to $22 billion in the third quarter versus $13 billion in the prior quarter. The main reason for this increase is the large influx of capital from aggressive investors buying CDO equity. The demand for collateral from new CDOs has served to keep asset and credit derivative spreads at historically tight levels.
The unprecedented volume driven by these aggressive investors could ultimately cause high volatility in the markets for assets and CDO bond obligations. Investors in AAA-rated CDO bond obligations may also become more selective in the future. Absent the willingness of AAA buyers to support all of the new CDO issuance activity, the market for CDOs could change abruptly. For the time being, spreads on CDO bond obligations have remained stable.
Redwood’s CDO issuance activity has not increased in conjunction with the increased CDO market issuance activity, as lately we have not been large buyers of sub-prime assets, the predominant asset type for new mezzanine CDOs. The Acacia entities own $417 million investment-grade sub-prime securities (mostly from the 2003 and 2004 vintages), and those assets have performed very well for us, having suffered no downgrades to date. Earlier this year, the rating agencies increased the amount of credit support they require for new issue sub-prime and neg-am securities. This reduces risk to the owners of these securities. Consequently, we have increased our focus on securities backed by those loan types and we plan to purchase significantly more investment grade sub-prime and neg-am securities for Acacia in 2007.
We have completed two CDO transactions during 2006 for a Redwood equity investment of $37 million. We do not expect to complete any deals in the fourth quarter of 2006. Net of calls, and with market value appreciation, Redwood’s CDO equity investments have increased from $128 million to $159 million this year.
We anticipate that our CDO issuance activities will increase in 2007, and that our issuing activities will incorporate the best of what we have done in the past with some new concepts going forward. Depending on market developments, it is likely that the CDOs we issue will have a higher volume and concentration of securities backed by non-prime residential loans. In addition, the commercial group’s increased activity in commercial credit-enhancement securities will result in an increase in purchases of BB- and B-rated commercial securities for Acacia.
| BUSINESS GROUP DISCUSSION |
CDO Group Metrics
| Chart 9: Acacia’s Non-Investment Grade Assets by Vintage | | Chart 10: Acacia Equity Invested |
| | | |
 | |  |
| Source: Redwood Trust | | | |
| | | | | |
| Ø | Commercial assets are 1/3 and Prime residential assets | | Ø | Acacia equity is a significant part of Redwood’s |
| | are 2/3 of the total non-investment grade portfolio. | | | investments. |
| | | | Ø | Returns to date have exceeded our hurdle rate. |
| | | | Ø | Returns are expected to remain above our hurdle rate. |
| | | | Ø | The market value of Acacia equity has grown since we |
| | | | | initially invested. |
| | | | | |
| Chart 11: Acacia Collateral Rating History |
| |
 |
| Source: Redwood Trust |
| | |
| Ø Upgrades of securities owned by Acacia are a sign that Acacia CDO equity may continue to perform well. |
| FINANCIAL REVIEW |
Finance Group Overview
Description
Redwood’s finance group is responsible for financial reporting, tax, treasury, balance sheet management, and information technology.
Discussion
For the third quarter of 2006, GAAP earnings were $1.22 per share, core earnings were $1.20 per share, and total taxable income was $1.95 per share.
For the third quarter of 2006, compared to the third quarter of 2005, GAAP earnings per share were down 45% due to strong asset sale gains in 2005, core earnings per share were down 2%, and total taxable income per share was down 13%.
For the first nine months of 2006, GAAP earnings were $3.51 per share, core earnings were $3.34 per share, and total taxable income was $5.29 per share.
For the nine months of 2006, compared to the first nine months of 2005, GAAP earnings per share were down 44%, core earnings per share were down 26%, and total taxable income was down 8% per share.
Adjusted return on equity was 14% for the third quarter. During the quarter, GAAP book value per share increased from $39.13 to $40.02.
Please see the following pages for definitions of taxable income, core earnings, adjusted return on equity, and other non-GAAP measures, and for reconciliations of these measures to the most comparable GAAP measures.
Overall, this was a good quarter. We believe our earnings are generally stabilizing after declining from the extraordinary levels of profit we earned over the last few years.
We remain reasonably optimistic about earnings over the intermediate and long term. However, we continue to expect that GAAP earnings and taxable income could be volatile from quarter to quarter, due largely to some technical accounting and tax issues (which are fully described in our third quarter 10-Q). Furthermore, credit losses may become an issue as the housing recession progresses. We have established loss reserves for GAAP accounting purposes, so initial increases in losses may not affect our earnings per share. However, each realized credit loss will result in a reduction of our taxable income and will reduce our dividend distribution requirements.
These issues aside, there are a number of positive elements to our earnings outlook that could lead to a rising earnings trend over the next few years. Fast prepayments and continued excellent credit results are having a positive impact on our residential credit-enhancement business. We have begun to recognize increasing yields from these assets. Over the next few years, the upside income potential from these assets is considerable if credit losses remain low. In addition, our earnings should benefit as we invest excess capital.
| FINANCIAL REVIEW |
Finance Group Overview
Redwood Trust Permanent Assets

We generally have been measuring business growth with reference to the total market value of our permanent assets - those assets that we are holding for the long term and are funding with equity. Using this measure, our business grew at an annual rate of 8% in the first nine months. This is below our stated goal of 10% to 15% growth. While our commercial and CDO business groups grew at substantially higher rates during this period, our overall rate of growth was held back by a net reduction in capital invested in residential CES during the third quarter. Our residential group cut back on acquisitions and sold $47 million of 2005 and 2006 vintage residential CES to third parties as part of ongoing portfolio management. Additionally, we recycled $32 million of capital used in funding second-loss CES securities by securitizing these assets in Acacia 10.
As a result of these actions, total permanent assets remained essentially flat quarter to quarter. In the first nine months of 2006, permanent assets increased from $568 million to $603 million as a result of $179 million of acquisitions, $135 million of sales and calls, $48 million of pay downs, and $39 million of positive market value appreciation.
| FINANCIAL REVIEW |
Finance Group Overview
Redwood Trust Excess Capital

Due to asset sales, capital recycling, and retained earnings, we ended the quarter with $219 million of excess capital, an increase from $191 million at the beginning of the quarter. We do not hold most of this excess capital in cash or short-term securities. We use it to reduce debt. We derive our excess capital figures by calculating the amount of capital we would have available for investment if we conservatively leveraged our unsecuritized assets fully consistent with our risk-adjusted capital policies.
We see a number of possible investment opportunities that, combined with a special dividend, could utilize a meaningful portion of this excess capital during the fourth quarter of 2006. We currently expect to fully utilize all of this excess capital at some point during 2007.
Our plans include continuing to employ increasing amounts of capital in our CDO and commercial businesses. We will also be acquiring loans and securities that we will retain as an investment and fund with Redwood debt in order to earn a spread. We have initially allocated $100 million of excess capital to support new spread-lending assets, including high-quality seasoned residential loans that we expect to acquire when we exercise Sequoia calls starting in the fourth quarter of 2006.
Additionally, although the exact timing is unclear, we expect to resume asset growth in residential credit investments. As discussed in the Residential Group section, we expect the risk/reward relationship will improve over the next two years in the market for prime residential credit investments, even if asset prices do not fall. In addition, we expect to acquire some additional credit-sensitive assets backed by Alt-A and sub-prime loans.
Given the size and diversity of these various opportunities, we currently anticipate that we will seek to raise additional capital during 2007.
| FINANCIAL REVIEW |
Finance Group Overview
Currently, there is a lot of debate over contemplated changes to the accounting standards that could eventually require mark-to-market accounting for income statement purposes for some or all assets, liabilities, and hedges. While the outcome of the debates is still unclear, we believe there is merit to the concept. Mark-to-market income statement accounting offers more transparency and would likely lead to better economic decision making and lower hedging costs. It would also lead to higher quarter-to-quarter earnings volatility. As a step in this direction, we intend to classify securities (and related hedges) that we acquire as an on-going investment that we intend to fund with Redwood debt as “trading” for accounting purposes. Changes in the market values of securities and hedges classified as trading flow through the income statement.
We declared regular quarterly dividends of $0.70 per share in each of the first three quarters of 2006. Total regular dividends in 2006 to date totaled $54 million, of which $52 million represented the distribution of the remainder of our 2005 REIT taxable income. Consistent with our practice in previous years, we expect to permanently retain approximately 10% of the ordinary real estate investment trust (REIT) taxable income we earn during 2006, to retain the after-tax profits earned in our taxable subsidiaries, and to defer the distribution of a portion of our 2006 taxable income to distribute by September 2007 as regular dividends.
We also expect to declare a special dividend in the fourth quarter of 2006. Taxable income generation at the REIT level has been strong this year, but so far has been 8% below last year’s levels on a per share basis. Our special dividend declaration will depend on our evolving projection of fourth quarter REIT taxable income performance. Although subject to change, it currently appears that the special dividend this year will likely exceed $2.50 per share and could be close to the $3.00 per share special dividend we paid in December 2005.
| FINANCIAL REVIEW |
GAAP Earnings
What Is This?
Income calculated under Generally Accepted Accounting Principles in the United States.
| | Ø | Our GAAP earnings were $32 million, or $1.22 per share, for the third quarter of 2006. This was a slight increase over the previous quarter. In the third quarter of 2005, GAAP earnings were $56 million, or $2.21 per share. |
| | Ø | The reduction in net income of $24 million from the third quarter of 2005 resulted substantially from a reduced amount of gains generated from selling assets and asset calls. |
| | Ø | Net interest income was $49 million in the current quarter, an increase of $4 million from the previous quarter and an increase of $1 million from the third quarter of last year. This reflects rising yields from our residential credit-enhancement portfolio resulting from strong credit performance and rapid prepayments. |
| | Ø | The yield on our residential credit-enhancement securities improved from 17% in the third quarter of 2005 to 19% in the second quarter of 2006, to 22% in the third quarter of 2006. The performance of yields generated by our credit-enhancement investments in neg-am loans have been particularly favorable. |
| FINANCIAL REVIEW |
Core Earnings
What Is This?
Core earnings is a profitability measure that highlights earnings that are more likely to be ongoing in nature. In calculating core earnings, we start with GAAP earnings and then exclude gains and losses on calls and sales, mark-to-market adjustments, and one-time items that are unlikely to be repeated. Table 2 in the Appendix shows a reconciliation of core to GAAP earnings.
Core Earnings per Share

| | Ø | Core earnings were $32 million, or $1.20 per share, for the third quarter of 2006. This is the highest level of core earnings since the third quarter of 2005. |
| | Ø | An additional boost in core earnings could come as we invest our excess capital. Other factors, of course, could cause volatility. |
| FINANCIAL REVIEW |
Taxable Income
What Is This?
Total taxable income is a measure of our profitability. It is our pre-tax income as calculated for tax purposes. It includes pre-tax income earned at our parent company and qualified subsidiaries (REIT taxable income) as well as pre-tax income earned in our taxable qualified subsidiaries. Total taxable income can differ materially from GAAP earnings. Table 3 in the Appendix reconciles these two profitability measures.
Core taxable income is a profitability measure that highlights that portion of taxable income that is more likely to be ongoing in nature. In calculating core taxable income, we start with total taxable income and then exclude gains on sale, tax deductions created by the exercise of stock options, and one-time items that are unlikely to be repeated. Table 4 in the Appendix reconciles core taxable income and total taxable income to GAAP income.
REIT taxable income is the primary determinant of the minimum amount of dividends we need to distribute in order to maintain our tax status as a real estate investment trust (REIT). REIT taxable income is pre-tax profit, as calculated for tax purposes, at Redwood Trust. It does not include taxable income earned at our non-REIT taxable subsidiaries. Over time, we must distribute at least 90% of our REIT taxable income as dividends. A reconciliation of GAAP income to REIT taxable income appears in Table 3 of the Appendix.
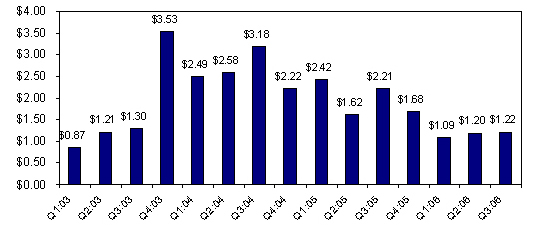
Total Taxable Income per Share
| FINANCIAL REVIEW |
Taxable Income
Core Taxable Income per Share
REIT Taxable Income per Share
| FINANCIAL REVIEW |
Taxable Income
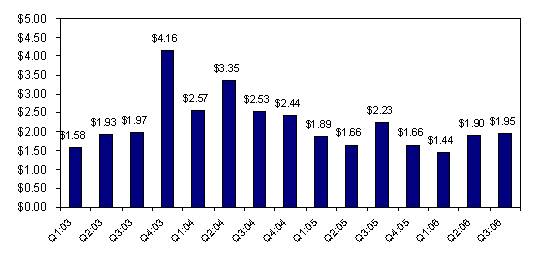
| | Ø | Taxable income results continue to be favorable. Total taxable income was $51 million, or $1.95 per share, in the third quarter of 2006. |
| | Ø | Our REIT taxable income per share continues to exceed our regular quarterly dividend rate of $0.70 per share by quarter by a comfortable margin. |
| | Ø | Taxable income exceeds GAAP for a variety of reasons, the largest of which is that we are not able to establish credit reserves for tax. Currently, our actual credit losses are minimal. Taxable income was reduced by $1.1 million ($0.04 per share) in the third quarter as a result of deductions for actual credit losses. This deduction is less than the losses incurred on the underlying loans, as we own most of our credit-sensitive assets at a tax basis that is substantially less than par (principal) value. Increased credit losses would reduce taxable income and our dividend distributions. |
| | Ø | For a variety of reasons, including but not limited to stock option exercises and distributions from deferred compensation plans, our taxable income results can be volatile on a quarter-to-quarter basis. |
| FINANCIAL REVIEW |
[This Page Intentionally Left Blank]
| FINANCIAL REVIEW |
Book Value per Share
What Is This?
Book value per share is the amount of equity capital we have per share of common stock outstanding. There are many different ways to measure equity. We usually focus on three measures, each of which we believe is useful for a different purpose.
GAAP book value is our common equity as calculated for GAAP purposes. It includes a mark-to-market valuation adjustment of some of our assets (i.e., those assets for which changes in market valuations are reported on our balance sheet and not our income statement.)
Core book value is GAAP book value excluding those mark-to-market valuation adjustments of our assets reflected on our balance sheets. Core book value more closely reflects historical amortized costs rather than current market values.
Adjusted core book value is core book value less REIT taxable income that we have earned but not yet distributed as dividends to our stockholders. Adjusted core book value is a measure that provides one estimate of the amount of equity capital we have available to reinvest in new long-term assets and to generate future earnings.
A reconciliation of GAAP book value to core book value and adjusted core book value appears in Table 8 of the Appendix.
GAAP Book Value per Share

| FINANCIAL REVIEW |
Book Value per Share
Quarterly Update
| | Ø | For the third quarter of 2006, after including the effect of declaring $0.70 per share of regular dividends, GAAP book value per share increased by 2% from $39.13 per share to $40.02 per share. |
| | Ø | Over time, our GAAP book value per share has been increasing because of retention of a portion of our income, increases in the market value of our assets, and issuance of stock at prices in excess of book value. |
| | Ø | At September 30, 2006, core book value was $36.38 per share and adjusted core book value was $32.11 per share. |
| | Ø | At the end of our first quarter of operations in September 1994, GAAP book value was $11.67 per share. Since that time, we have paid $36.73 per share of dividends while also increasing GAAP book value by $28.35 per share. |
| | Ø | Book value per share growth is not a direct indicator of our market value or an indicator of the returns available to our shareholders. If you had acquired Redwood stock at our initial public offering in August 1995, and had reinvested all dividends back into Redwood stock, your annualized compounded return as a shareholder through the third quarter of 2006 would have been 21% through October 31, 2006. Future results may vary. |
| FINANCIAL REVIEW |
Return on Equity
What Is This?
We believe return on equity (ROE) is one of the more useful measures of the profitability of our business. ROE is the amount of profit we generate each year per dollar of equity capital. There are numerous ways we calculate returns on equity for Redwood since we monitor a number of different profit measures as well as a number of different measures of equity capital.
GAAP ROE is GAAP earnings divided by GAAP equity.
One interesting aspect to consider about GAAP ROE is that it will decline (all other things being equal) if our assets increase in market value. Many of our assets are marked-to-market through our balance sheet but not our income statement. An increase in asset market value will therefore increase GAAP equity but not our GAAP earnings, thus lowering GAAP ROE. Similarly, a decrease in asset market values will increase our GAAP ROE.
An alternative measure of ROE that may also be useful is Adjusted ROE, by which we mean GAAP income divided by core equity. Core equity excludes those balance sheet mark-to-market adjustments that are not included in our income statement. Only those asset market value changes that are included in our income statement will affect Adjusted ROE.
A reconciliation of GAAP ROE to Adjusted ROE, and of GAAP equity to core equity, appears in Table 8 of the Appendix.
Adjusted ROE (Annualized)

| FINANCIAL REVIEW |
Return on Equity
Quarterly Update
| | Ø | GAAP ROE was 13% for the third quarter of 2006 as compared to 22% in the third quarter of 2005. |
| | Ø | Adjusted ROE was 14% for the third quarter of 2006 and 25% for the third quarter of 2005. Adjusted ROE is greater than GAAP ROE due to the appreciation of the market values of assets that are marked-to-market through our GAAP balance sheet. This increases our GAAP equity and thus lowers GAAP ROE. |
| | Ø | Over the very long term, we expect to generate an average adjusted annual return on equity between 11% and 18%. |
| FINANCIAL REVIEW |
Residential Credit Results
What Is This?
We invest in credit-enhancement securities that bear the credit risk of billions of underlying residential loans. We also invest in whole loans financed via securitization or with Redwood debt. If the credit performance of the loans we credit-enhance or own is strong, our earnings and dividends will benefit in a material way. If credit performance is weak, our earnings results will be reduced if losses exceed our reserves or cause market value write-downs.
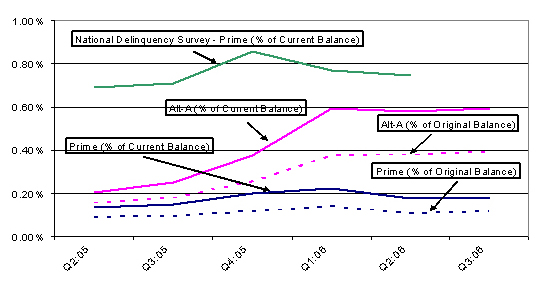
Serious delinquencies are defined as all loans that are 90 days or more overdue, or are in foreclosure, bankruptcy, or REO (REO means “real estate owned” and is industry jargon for property that has been foreclosed and is now owned by the lender pending sale). We report serious delinquencies as a percentage of both the current balance remaining in a pool of loans and the original balance of all loans originally within that pool of loans. We find the later measure more useful, as prepayment rates can alter the current balance measure and thus obscure underlying credit trends.
Seriously Delinquent Trends in RWT’s Prime and Alt-A Residential
Credit-Enhancement Portfolios
| FINANCIAL REVIEW |
Residential Credit Results
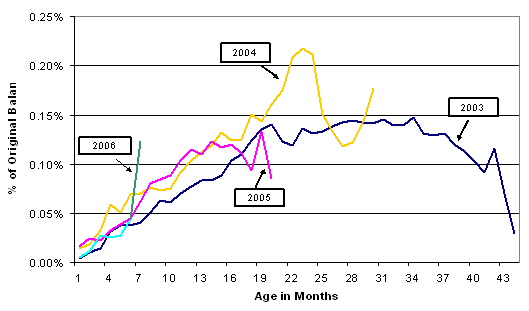
Seriously Delinquent Trends in RWT’s Prime Residential CES, by Vintage
September 2006
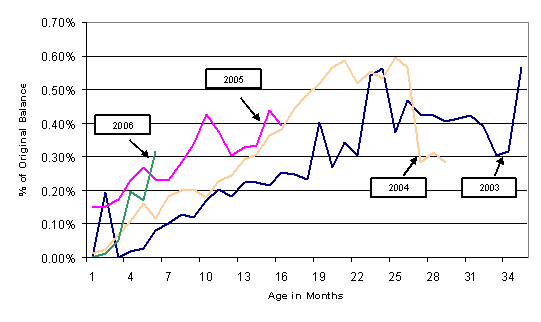
Seriously Delinquent Trends in RWT’s Alt-A Residential Portfolio, by Vintage
September 2006
| FINANCIAL REVIEW |
Residential Credit Results
Seriously Delinquent Trends for Residential CES in
RWT’s Top Five States

Principal Value of RWT’s Residential Credit Losses

| FINANCIAL REVIEW |
Residential Credit Results
b) Quarterly Update
| Ø | At September 30, 2006, through ownership of credit-enhancement securities and whole loans, we were exposed to credit risk on $235 billion in residential real estate loans (excluding loans underlying investment-grade rated securities). Of this total, prime-quality loans were $210 billion. |
| Ø | For the third quarter of 2006, realized credit losses within these loan pools were $2.6 million of principal value, a rate that is less than one basis point (0.01%) on an annualized basis of the current balance of loans. Principal value losses were $2.4 million for loans in prime pools and $0.2 million for Alt-A. There were no sub-prime losses, as these loans are new. |
| Ø | Realized credit losses for residential assets for tax purposes were $1.1 million for the third quarter. This deduction is less than the principal value losses incurred on the underlying loans, as we own most of our credit-sensitive assets at a tax basis that is substantially less than par (principal) value. |
| Ø | Serious delinquencies at September 30, 2006 were 0.23% of current balances and 0.14% of original balances. For loans in prime pools, delinquencies were 0.19% of current balance and 0.12% of original balance. Alt-A pools had delinquencies of 0.60% of current balance and 0.40% of original balance. Although delinquency ratios were generally stable for the quarter, total serious residential delinquencies increased from $467 million to $528 million. |
| Ø | For prime loans, the delinquency performance as a percentage of original balance of the 2005 and 2006 vintages has been generally similar (as measured at similar months since origination) to earlier vintages. The latest month jumped up slightly, but the last several months of data on vintage charts needs to be interpreted with caution—this portion of vintage data is volatile as it is based on a very small sample set. It is too early to conclude that the increase in the delinquency ratio for 6-month-old loans originated in 2006 is indicative of a real trend. |
| Ø | For Alt-A loans, delinquency results appear to be deteriorating slightly with each subsequent vintage, although it is too early to draw definitive conclusions. |
| Ø | We closely monitor early payment defaults, defined as loans that become seriously delinquent within three months of loan origination, for the 673,000 residential loans we credit-enhance or own. Early payment defaults remain very low. We have averaged 14 new early payment defaults per month in 2006, compared to 10 per month in 2005. |
| FINANCIAL REVIEW |
Credit Reserves
What Is This?
One of our goals is to provide substantial earnings upside for shareholders if real estate credit losses in the loans we credit-enhance or own are low.
Our potential GAAP earnings upside from good credit performance can be estimated by referencing the size of our credit reserves. In the event we experience no future credit losses, as these loans pay off our GAAP earnings would benefit by the amount of these credit reserves. Our current earnings incorporate these loss estimates, so income from the reversal of credit reserves would add to our current GAAP earnings run rate (all other factors being equal).
Our investments incorporate a high degree of credit risk, so high credit loss rates would reduce GAAP earnings, taxable income, and dividends.
| FINANCIAL REVIEW |
Credit Reserves
GAAP Credit Reserve per Share
| | Ø | Our GAAP credit reserves at September 30, 2006 were $635 million, or $24.36 per share. |
| | Ø | At September 30, 2006, our residential real estate credit reserves were $384 million ($14.76 per share) for CES and $19 million ($0.74 per share) for residential whole loans. The principal value of actual credit losses underlying our residential loans and securities were $3 million for the third quarter of 2006 and $8 million for the last 12 months. Third quarter residential credit losses reduced taxable income by $1 million. |
| | Ø | At September 30, 2006, our commercial real estate credit reserves were $223 million ($8.55 per share) for CES and $8 million ($0.31 per share) for commercial whole loans. We incurred principal value commercial credit losses of $0.5 million ($0.1 million tax losses) in the third quarter of 2006 and for the last 12 months. |
| FINANCIAL REVIEW |
Dividends
What Is This?
As a REIT, we are required to distribute at least 90% of our REIT taxable income each year as dividends. We have established a regular dividend rate level that we believe is reasonably likely to be sustainable. To the extent the REIT taxable income we are required or choose to distribute is greater than our regular dividend distributions, we typically make a special dividend distribution towards year-end.
Redwood Trust - Annual Regular Dividends
Redwood Trust - Annual Special Dividends

| FINANCIAL REVIEW |
Dividends
| | Ø | We declared a regular quarterly dividend of $0.70 per share in the third quarter of 2006. |
| | Ø | Based on the Redwood stock price of $54.97 on October 31, 2006, the dividend yield on Redwood stock based regular dividends distributed over the last 12 months of $2.80 per share was 5%. The dividend yield based on the $5.80 per share of total dividends (including the special dividend) distributed over the last 12 months was 11%. |
| | Ø | We plan to permanently retain approximately 10% of the ordinary REIT taxable income we earn during 2006, and to retain 100% of the after-tax taxable income we earn at our taxable subsidiaries. By retaining a portion of our income, we seek to build book value per share, and thus potential earnings and dividends per share, over time. |
| | Ø | We also plan to defer distribution of a portion of this year’s taxable income into the following year. |
| | Ø | Based on our estimates of REIT taxable income during 2005 and the first three quarters of 2006, we entered the fourth quarter of 2006 with $111 million ($4.28 per share) of undistributed REIT taxable income. |
| | Ø | We expect to distribute a special dividend in the fourth quarter of 2006. Our special dividend declaration will depend on our evolving projection of fourth quarter REIT taxable income performance. Although subject to change, it currently appears that the special dividend this year will exceed $2.50 per share and could be close to the $3.00 per share special dividend we paid in December 2005. |
| APPENDIX |
Glossary
All companies and analysts do not calculate non-GAAP measures in the same fashion. As a result, certain measures as calculated by Redwood Trust may not be comparable to similarly titled measures reported by other companies.
ASSET-BACKED SECURITIES (ABS)
Securities backed by financial assets that generate cash flows. Each security issued from an asset-backed securitization entity has a unique priority with respect to receiving principal and interest cash flows from the assets owned by the entity.
ACACIA
Acacia is the brand name for the collateralized debt obligation (CDO) securitizations Redwood sponsors. The underlying pool of assets for these CDO securitizations consists primarily of investment-grade and non-investment-grade rated securities backed by residential prime, residential sub-prime, and commercial real estate loans. Acacia also owns related assets such as CDO securities issued by other real estate oriented CDOs, corporate debt issued by equity REITs, commercial real estate loans, and synthetic assets derived from commercial real estate assets. Redwood typically acquires a portion of the CDO equity securities issued by Acacia; these are the securities that are in the first-loss (highest risk) position with respect to absorbing any credit losses that may occur within the assets owned by the Acacia entities.
ADJUSTED CORE EQUITY (ADJUSTED BOOK VALUE)
Adjusted core equity (adjusted book value) is not a measure calculated in accordance with GAAP. Adjusted core equity is core equity less undistributed REIT taxable income that is still undeclared but that will need to be paid out. We have minimum dividend distribution requirements as a REIT. As we earn income (as calculated for tax and minimum distribution requirements) we are creating future dividend payment obligations. These obligations are not recognized for GAAP accounting, however, until dividends are declared. Cash that we have earned but that we must pay out as dividends in the near future is not cash that will be available to us to acquire long-term assets and build our business. So when we try to answer questions such as “how much equity per share do we have available to build our business and to generate dividends in the long-term?” we use adjusted core equity per share. A reconciliation of adjusted core equity to GAAP equity appears in the Appendix in Table 8.
ADJUSTABLE RATE MORTGAGES (ARMs)
Adjustable rate mortgages are loans that have coupons that adjust at least once per year. We make a distinction between ARMs (loans with a rate adjustment at least annually) and hybrids (loans that have a fixed rate period of 2 to 10 years and then become adjustable rate).
ALT-A SECURITIES
Alt-A securities are residential mortgage-backed securities that have higher credit quality than sub-prime and lower credit quality than prime. Alt-A originally represented loans with alternative documentation, but has shifted over time to include additional characteristics. Alt-A loans typically originate from a lender’s expanded criteria underwriting guidelines. For example, borrowers’ income may not be verified, and in some cases, may not be disclosed on the loan application. Expanded criteria also allows for higher debt-to-income ratios with higher accompanying loan-to-value ratio (LTV) than otherwise permissible for Prime loans. Other distinguishing characteristics of Alt-A securities may be lower weighted average FICO, higher weighted average LTV, as well as greater percentages of loans on investor properties or with low FICO or high LTV.
BOOK VALUE
Book value is our common equity amount. It can be calculated in a number of ways, one of which is appropriate for GAAP.
| APPENDIX |
Glossary
COLLATERALIZED DEBT OBLIGATIONS (CDO)
Re-securitization of a diverse pool of assets. See “Acacia”.
CDO EQUITY SECURITIES
CDO equity securities are securities that bear the initial credit losses of the assets owned by re-securitization entities. Their function is similar to that of credit-enhancement securities issued by residential and commercial real estate loan securitizations.
CONDUIT
An entity that acquires closed loans from originators, accumulates loans over a period of time, and sells these loans, seeking to generate a gain on sale. Sales are usually made via securitization, but also can be made through bulk whole loan sales.
CORE EARNINGS
Core earnings are not a measure of earnings in accordance with GAAP. We attempt to strip some of the elements out of GAAP earnings that are temporary, one-time, or non-economic in nature, or that relate to the past rather than the future. We are trying to show the trend of underlying ongoing earnings. We exclude realized gains (and losses) resulting from asset sales and calls from GAAP income. We sell assets from time to time as part of our ongoing portfolio management activities. These sales can produce material gains and losses that could obscure the underlying trend of our long-term portfolio earnings, so we exclude them from core earnings. Similarly, we exclude gains from calls of residential credit-enhancement securities, as these are essentially sales of assets that produce a highly variable stream of income that may obscure some underlying income generation trends. GAAP earnings also include mark-to-market income and expenses for certain of our assets and interest rate agreements. These are unrealized market value fluctuations, and we exclude them from core earnings.
Management believes that core earnings provide relevant and useful information regarding results from operations. This information can be used in conjunction with and in addition to GAAP measures of performance. Core earnings can be useful, in part, because market valuation adjustments on only a portion of our assets and none of our liabilities are recognized through the income statement under GAAP. Thus, GAAP valuation adjustments may not be fully indicative of changes in market values on the balance sheet as a whole and may not be a reliable guide to current operating performance. Furthermore, gains or losses realized upon sales of assets vary based on portfolio management decisions; a sale of an asset for a gain or a loss may or may not affect ongoing earnings from operations. A reconciliation of core earnings to GAAP income appears in Table 2 of the Appendix.
CORE EQUITY (CORE BOOK VALUE)
Core equity is not a measure calculated in accordance with GAAP. Core equity is GAAP equity with mark-to-market gains and losses (“accumulated other comprehensive income”) excluded. GAAP equity includes mark-to-market adjustments for certain of our assets and interest rate agreements. Core equity approximates what our equity value would be if we used historical amortized cost accounting exclusively. A reconciliation of core equity to GAAP equity appears in Table 8 of the Appendix.
CORE REIT TAXABLE INCOME
Core REIT taxable income is REIT taxable income before gains and losses on asset sales and calls and before certain other expenses such as tax deductions for stock option exercises. It represents that portion of our REIT taxable income that may be more ongoing in nature. A reconciliation of core REIT taxable income to GAAP income appears in Tables 3 and 4 of the Appendix.
| APPENDIX |
Glossary
CORE TAXABLE INCOME
Core taxable income is total taxable income before gains and losses on asset sales and calls and before certain other expenses such as tax deductions for stock option exercises. It represents that portion of our total taxable income that may be more ongoing in nature. A reconciliation of core taxable income to GAAP income is covered in Tables 3 and 4 of the Appendix.
CPR
Constant (or Conditional) Prepayment Rate (CPR) is an industry-standard measure of the speed at which mortgage loans prepay. It approximates the annual percentage rate at which a pool of loans is paying down due to prepayments.
CREDIT-ENHANCEMENT SECURITIES (CES)
Credit-enhancement securities (CES) absorb the initial credit losses generated by a pool of securitized assets. As a result, the more senior securities issued from that securitization are credit-enhanced (have less credit risk). Our definition of CES includes all the below investment-grade rated bonds issued from a securitization. These securities are also referred to as subordinated securities and B-pieces. For a typical securitization of prime residential loans, there are three CES - the first-loss, second-loss, and third-loss bonds. The first-loss security takes the initial risk. If credit losses within the securitized asset pool exceed the principal value of the first-loss security, the second-loss security is at risk. If cumulative losses exceed the principal value of the first- and second-loss securities, then the third-loss security is at risk. Generally, for these securitizations, the third-loss security has a credit rating of BB, the second-loss has a credit rating of B, and the first-loss is not rated. Other types of securitizations, such as commercial, CDO, sub-prime residential, and some Alt-A residential transactions, are structured differently. Nevertheless, the below-investment-grade securities issued from these securitizations function as credit-enhancement securities for these transactions.
GAAP
Generally Accepted Accounting Principles in the United States.
INTEREST-ONLY SECURITIES (IOs)
Interest-only securities (IOs) are specialized securities that are backed by real estate loans. They receive interest payments calculated by a formula that typically varies as a function of interest payments generated by the underlying loans within a securitization or as a function of the spread between the yield on the loans owned by a securitization entity and the cost of funds of the securities (ABS) issued by that entity. Typically, IO securities do not have a principal balance and they will not receive principal payments. Interest payments to IO securities usually equal the IO interest rate formula multiplied by a “notional” principal balance. The notional principal balance for an IO is typically reduced over time as the actual principal balance of the underlying pool of real estate loans pays down, thus reducing IO cash flows over time. IO cash flows are typically reduced more quickly if loan prepayments accelerate. The IO securities that Redwood has acquired in the past from some Sequoia residential securitizations typically earn an interest amount that varies as a function of the remaining principal balance of Sequoia loans and the spread between the yield on the residential loans owned by Sequoia and the cost of the asset-backed securities issued by Sequoia.
INVENTORY ASSETS
Inventory assets are assets that we acquire to hold for several weeks or months that we then sell to a securitization entity or as part of a whole-loan sale. We use a combination of debt and equity to fund inventory assets.
| APPENDIX |
Glossary
LEVERAGE RATIOS
We currently use debt to primarily to finance on a temporary basis the accumulation of inventory assets prior to sale to a securitization entity. Thus, we do not typically have a significant amount of financial leverage. However, because of the consolidation of independent securitization entities, it appears on our GAAP consolidated financial statements that Redwood is highly leveraged, with total liabilities significantly greater than equity. These securitization structures are non-recourse to Redwood. Therefore, although included in our consolidated balance sheets, they do not represent financial leverage for Redwood. Our investment returns from the assets we own are highly dependent on the credit performance (and, to a lesser degree, interest rate and prepayment performance) of much larger balances of loans within the associated securitizations. We do take “structural leverage” in this sense, but that does not necessarily mean we are taking financial leverage. In the future, we intend to use more Redwood debt and therefore financial leverage will increase.
MARK-TO-MARKET ACCOUNTING
Mark-to-market accounting uses estimated current market values of assets, liabilities, and hedges to determine balance sheet values and/or income statement revenue recognition. For instance, many of our assets currently are carried on our balance sheet at their market value rather than historical amortized cost. For our income statement, mark-to-market accounting is used for some assets and hedges, and will also be used for assets if they become impaired under various accounting definitions of that term. Increasingly in the future, we expect to use mark-to-market accounting for income statement purposes for a wider variety of assets and liabilities. This will likely make quarter-to-quarter GAAP earnings trends more volatile, although core earning and taxable income will not be affected to the same degree.
NEGATIVE AMORTIZATION ADJUSTABLE-RATE MORTGAGES (NEG-AM ARMS, OPTION ARMS, OR MTA ARMS)
Negative amortization ARMs (Neg-am ARMs, option ARMs, pay option ARMs, or MTA ARMs) are monthly adjustable rate mortgages that allow the borrower to choose between different payment options. One of these options allows the borrower to make a minimum payment. This minimum payment is less than the interest accrued on the mortgage during that period and, in this instance, the borrower’s loan balance will increase (causing negative amortization of the loan balance).
PERMANENT ASSETS
We seek to invest in assets that have the potential to provide high cash flow returns over a long period of time to help support our goal of maintaining steady dividends. We have typically funded long-term investment assets entirely with equity capital and not debt. We refer to the assets that meet these criteria as permanent assets. Our permanent asset portfolio primarily includes residential and commercial credit-enhancement securities. Increasingly in the future, we will use Redwood debt to fund assets -- these assets are not "permanent assets."
PRIME RESIDENTIAL REAL ESTATE LOANS
Prime loans are higher-quality residential loans issued to borrowers with high FICO credit scores, lower loan-to-value ratios, lower debt-to-income ratios, greater reserves, more full documentation, and other characteristics of higher quality loans.
PRIME SECURITIES
Prime securities are residential mortgage-backed securities backed by high credit, quality loans, generally with balances greater than conforming loan limits. Prime securities typically have relatively high weighted average FICO scores (700 or higher), low weighted averages LTVs (75% or less), limited concentrations of investor properties, and low percentages of loans with low FICO or high LTV.
| APPENDIX |
Glossary
PROFITABILITY RATIOS
Many financial institution analysts use asset-based profitability ratios such as interest rate spread and interest rate margin in their work analyzing financial institutions. These are asset-based measures. Because we consolidate the assets and liabilities of securitization entities for GAAP purposes, our total GAAP assets and liabilities may vary strongly over time, and may not be comparable in economic reality to assets typically used in these calculations for other financial institutions. As a result, we believe equity-based profitability ratios may be more appropriate than asset-based measures for some analyses of Redwood’s operations. We believe, for example, that net interest income as a percentage of equity is a useful measure of profitability. For operating expenses, we believe useful measures are operating efficiency ratio (operating expenses as a percentage of net interest income) and operating expenses as a percentage of equity.
REIT SUBSIDIARY
A REIT subsidiary is a subsidiary of a REIT that is taxed as a REIT.
REDWOOD DEBT
Redwood debt is debt that is an obligation of Redwood. We have been using debt to fund the acquisition of our inventory assets. We obtain this debt from a variety of Wall Street firms, banks, and other institutions. In addition, we have a commercial paper facility that will allow us to issue short-term debt to finance the acquisition of residential loans as inventory prior to securitization. In the future, we expect to fund ongoing investments in assets using Redwood debt.
REAL ESTATE INVESTMENT TRUST (REIT)
An entity that makes a tax election to be taxed as a REIT, invests in real estate assets, and that meets certain qualifications. By meeting certain tests, including the distribution as dividends of at least 90% of REIT taxable income, profits are not taxed at the corporate level for a REIT to the extent that these profits are distributed as dividends to stockholders. This provides an operating cost savings, as most profits are not taxed at the entity level. On the other hand, the requirement to pay out as dividends most of the REIT profits means it can be harder for a REIT to grow if using only internally-generated funds (as opposed to issuing new stock).
REIT RETAINED TAXABLE INCOME
REIT retained taxable income is not a measure calculated in accordance with GAAP. REIT retained taxable income is the taxable income earned at the REIT after dividend distributions to our shareholders, less corporate income taxes and excise taxes paid at the REIT level. A reconciliation of REIT retained taxable income to GAAP income appears in Tables 3 and 4 of the Appendix.
REIT TAXABLE INCOME
REIT taxable income is not a measure calculated in accordance with GAAP. REIT taxable income is pre-tax income calculated for tax purposes at Redwood including only its qualified REIT subsidiaries (excluding its taxable subsidiaries). REIT taxable income is an important measure as it is the basis of our dividend distributions to shareholders. We must distribute at least 90% of REIT taxable income as dividends to shareholders over time. As a REIT, we are not subject to corporate income taxes on the REIT taxable income we distribute. We pay income tax on the REIT taxable income we retain (we can retain up to 10% of the total). A reconciliation of REIT taxable income to GAAP income appears in Table 3 of the Appendix.
| APPENDIX |
Glossary
RETURN ON EQUITY (ROE) AND ADJUSTED RETURN ON EQUITY
ROE is the amount of profit we generate each year per dollar of equity capital. Adjusted ROE is GAAP income divided by core equity. Core equity excludes those balance sheet mark-to-market adjustments that are not included in our income statement. Thus, only those asset market value changes that are included in our income statement will affect adjusted ROE. A reconciliation of GAAP ROE to adjusted ROE appears in Table 8 of the Appendix.
SUB-PRIME SECURITIES
Sub-prime securities are residential mortgage-backed securities backed by loans to borrowers who have impaired credit histories, but who exhibit the ability to repay the current loan. Typically, these borrowers have lower credit scores and/or other credit deficiencies that prevent them from qualifying for prime or Alt-A mortgages. To compensate for the greater risks and higher costs to service the loans, sub-prime borrowers pay higher interest rates, points, and origination fees.
Sub-prime borrowers typically have experienced credit problems in the past, such as late payments or bankruptcies.
Typical characteristics of sub-prime loan pools are:
| · | More than 60% of loans with FICO < 680 |
| · | Weighted average LTV over 85% |
| · | More than 70% of loans with LTV over 75% |
| · | Loans with LTV over 80% with no mortgage insurance |
SEQUOIA
Sequoia is the brand name for most of the securitizations of residential real estate loans we have sponsored.
TAXABLE SUBSIDIARY
A taxable subsidiary is a subsidiary of a REIT that is not taxed as a REIT and thus pays taxes on its income. A taxable subsidiary is not limited to investing in real estate and it can choose to retain all of its after-tax profits.
TOTAL RETAINED TAXABLE INCOME
Total retained taxable income is not a measure calculated in accordance with GAAP. Total retained taxable income is the taxable income earned at the REIT after dividend distributions to our shareholders, plus all of the taxable income earned at our taxable subsidiaries, less corporate income taxes and excise taxes paid. A reconciliation of total retained taxable income to GAAP income appears in Tables 3 and 4 of the Appendix.
TOTAL TAXABLE INCOME
Total taxable income is not a measure calculated in accordance with GAAP. Total taxable income is pre-tax income for Redwood and all its subsidiaries as calculated for tax purposes. Taxable income calculations differ significantly from GAAP income calculations. The remainder of our total taxable income is income we earn in taxable subsidiaries. We pay income tax on this income and we generally retain the after-tax income at the subsidiary level. A reconciliation of total taxable income to GAAP income appears in Table 3 of the Appendix.
| APPENDIX |
[This Page Intentionally Left Blank]
| APPENDIX |
FINANCIAL TABLES
| APPENDIX |
[This Page Intentionally Left Blank]
Table 1: GAAP Earnings (in thousands, except per share data) | |
| | | | | | | | | | | | | | | | | | | | | Nine Months | | Nine Months | |
| | | Q3:2006 | | Q2:2006 | | Q1:2006 | | Q4:2005 | | Q3:2005 | | Q2:2005 | | Q1:2005 | | Q4:2004 | | Q3:2004 | | Q3:2006 | | Q3:2005 | |
| | | | | | | | | | | | | | | | | | | | | | | | |
| Interest income | | $ | 217,504 | | $ | 214,544 | | $ | 224,795 | | $ | 234,531 | | $ | 246,810 | | $ | 248,786 | | $ | 237,714 | | $ | 205,125 | | $ | 174,072 | | $ | 656,843 | | $ | 733,309 | |
| Discount amortization income | | | 19,530 | | | 14,381 | | | 14,661 | | | 11,936 | | | 12,714 | | | 8,395 | | | 9,316 | | | 9,146 | | | 9,012 | | | 48,572 | | | 30,425 | |
| Premium amortization expense | | | (12,920 | ) | | (13,193 | ) | | (13,398 | ) | | (14,451 | ) | | (15,698 | ) | | (10,203 | ) | | (8,082 | ) | | (7,105 | ) | | 802 | | | (39,511 | ) | | (33,983 | ) |
| Provision for (reversal of) credit reserve | | | (465 | ) | | 2,506 | | | (176 | ) | | (877 | ) | | 805 | | | 1,527 | | | (1,025 | ) | | (1,697 | ) | | (1,528 | ) | | 1,865 | | | 1,307 | |
| Total GAAP interest income | | | 223,649 | | | 218,238 | | | 225,882 | | | 231,139 | | | 244,631 | | | 248,505 | | | 237,923 | | | 205,469 | | | 182,358 | | | 667,769 | | | 731,058 | |
| | | | | | | | | | | | | | | | | | | | | | | | | | | | | | | | | | | |
| Interest expense on Redwood debt | | | (9,422 | ) | | (1,822 | ) | | (2,072 | ) | | (3,520 | ) | | (3,789 | ) | | (1,789 | ) | | (2,694 | ) | | (2,527 | ) | | (2,299 | ) | | (13,316 | ) | | (8,272 | ) |
| | | | | | | | | | | | | | | | | | | | | | | | | | | | | | | | | | | |
| ABS expenses consolidated from trusts | | | (165,177 | ) | | (171,659 | ) | | (178,182 | ) | | (186,433 | ) | | (190,996 | ) | | (191,966 | ) | | (173,146 | ) | | (143,024 | ) | | (108,249 | ) | | (515,018 | ) | | (556,108 | ) |
| ABS issuance expense amortization | | | (5,786 | ) | | (6,079 | ) | | (5,907 | ) | | (6,069 | ) | | (5,162 | ) | | (5,386 | ) | | (5,273 | ) | | (4,783 | ) | | (4,197 | ) | | (17,772 | ) | | (15,821 | ) |
| ABS interest agreement expense | | | 3,317 | | | 3,678 | | | 2,980 | | | 3,573 | | | 623 | | | 876 | | | 1,469 | | | 606 | | | (2,888 | ) | | 9,975 | | | 2,968 | |
| ABS issuance premium amortization income | | | 2,395 | | | 2,363 | | | 2,526 | | | 2,793 | | | 2,733 | | | 3,140 | | | 3,747 | | | 2,644 | | | 2,823 | | | 7,284 | | | 9,620 | |
| Total consolidated ABS expense | | | (165,251 | ) | | (171,697 | ) | | (178,583 | ) | | (186,136 | ) | | (192,802 | ) | | (193,336 | ) | | (173,203 | ) | | (144,557 | ) | | (112,511 | ) | | (515,531 | ) | | (559,341 | ) |
| | | | | | | | | | | | | | | | | | | | | | | | | | | | | | | | | | | |
| GAAP net interest income | | | 48,976 | | | 44,719 | | | 45,227 | | | 41,483 | | | 48,040 | | | 53,380 | | | 62,026 | | | 58,385 | | | 67,547 | | | 138,922 | | | 163,445 | |
| | | | | | | | | | | | | | | | | | | | | | | | | | | | | | | | | | | |
| Fixed compensation expense | | | (3,437 | ) | | (3,309 | ) | | (3,437 | ) | | (2,879 | ) | | (2,802 | ) | | (2,623 | ) | | (2,778 | ) | | (2,009 | ) | | (1,959 | ) | | (10,183 | ) | | (8,203 | ) |
| Variable compensation expense | | | (5,209 | ) | | (4,891 | ) | | (4,208 | ) | | (5,005 | ) | | (4,241 | ) | | (5,174 | ) | | (4,565 | ) | | (3,204 | ) | | (3,789 | ) | | (14,308 | ) | | (13,980 | ) |
| Other operating expense | | | (4,425 | ) | | (5,150 | ) | | (4,505 | ) | | (4,583 | ) | | (4,246 | ) | | (3,542 | ) | | (3,698 | ) | | (2,487 | ) | | (2,813 | ) | | (14,080 | ) | | (11,486 | ) |
| Due diligence expenses | | | (384 | ) | | (2,687 | ) | | (432 | ) | | (298 | ) | | (1,075 | ) | | (117 | ) | | (757 | ) | | (291 | ) | | (2,268 | ) | | (3,503 | ) | | (1,949 | ) |
| Total GAAP operating expenses | | | (13,455 | ) | | (16,037 | ) | | (12,582 | ) | | (12,765 | ) | | (12,364 | ) | | (11,456 | ) | | (11,798 | ) | | (7,991 | ) | | (10,829 | ) | | (42,074 | ) | | (35,618 | ) |
| | | | | | | | | | | | | | | | | | | | | | | | | | | | | | | | | | | |
| Realized gains on calls | | | 723 | | | 747 | | | - | | | 4,266 | | | 2,914 | | | 4,421 | | | 7,548 | | | 11,205 | | | 20,472 | | | 1,470 | | | 14,883 | |
| Realized gains on sales | | | 4,967 | | | 2,027 | | | 1,059 | | | 11,654 | | | 23,053 | | | 516 | | | 8,347 | | | - | | | 488 | | | 8,053 | | | 31,916 | |
| Securities and loans valuation adjustments | | | (484 | ) | | (2,305 | ) | | (3,226 | ) | | (1,111 | ) | | (1,158 | ) | | (1,710 | ) | | (391 | ) | | (1,948 | ) | | (421 | ) | | (6,015 | ) | | (3,259 | ) |
| Derivatives valuation adjustments | | | (4,773 | ) | | 5,524 | | | 297 | | | 3,066 | | | 107 | | | (182 | ) | | (492 | ) | | (411 | ) | | 47 | | | 1,048 | | | (567 | ) |
| Net gains and valuation adjustments | | | 433 | | | 5,993 | | | (1,870 | ) | | 17,875 | | | 24,916 | | | 3,045 | | | 15,012 | | | 8,846 | | | 20,586 | | | 4,556 | | | 42,973 | |
| | | | | | | | | | | | | | | | | | | | | | | | | | | | | | | | | | | |
| Deferred tax benefit | | | - | | | - | | | - | | | - | | | - | | | - | | | - | | | - | | | - | | | - | | | - | |
| Provision for income taxes | | | (3,538 | ) | | (3,265 | ) | | (2,760 | ) | | (4,097 | ) | | (4,693 | ) | | (4,054 | ) | | (4,677 | ) | | (4,826 | ) | | (4,962 | ) | | (9,563 | ) | | (13,424 | ) |
| GAAP net income | | $ | 32,416 | | $ | 31,410 | | $ | 28,015 | | $ | 42,496 | | $ | 55,899 | | $ | 40,915 | | $ | 60,563 | | $ | 54,414 | | $ | 72,342 | | $ | 91,841 | | $ | 157,376 | |
| | | | | | | | | | | | | | | | | | | | | | | | | | | | | | | | | | | |
| Diluted average shares | | | 26,625 | | | 26,109 | | | 25,703 | | | 25,311 | | | 25,314 | | | 25,196 | | | 25,021 | | | 24,491 | | | 22,728 | | | 26,132 | | | 25,160 | |
| GAAP earnings per share | | $ | 1.22 | | $ | 1.20 | | $ | 1.09 | | $ | 1.68 | | $ | 2.21 | | $ | 1.62 | | $ | 2.42 | | $ | 2.22 | | $ | 3.18 | | $ | 3.51 | | $ | 6.26 | |
Table 2: Core Earnings (in thousands, except per share data) |
| | | | | | | | | | | | | | | | | | | | | Nine Months | | Nine Months | |
| | | Q3:2006 | | Q2:2006 | | Q1:2006 | | Q4:2005 | | Q3:2005 | | Q2:2005 | | Q1:2005 | | Q4:2004 | | Q3:2004 | | Q3:2006 | | Q3:2005 | |
| | | | | | | | | | | | | | | | | | | | | | | | |
| GAAP net income | | $ | 32,416 | | $ | 31,410 | | $ | 28,015 | | $ | 42,496 | | $ | 55,899 | | $ | 40,915 | | $ | 60,563 | | $ | 54,414 | | $ | 72,342 | | $ | 91,841 | | $ | 157,377 | |
| | | | | | | | | | | | | | | | | | | | | | | | | | | | | | | | | | | |
GAAP income items not included in core earnings | | | | | | | | | | | | | | | | | | | | | | | | | | | | | | | | | | |
| Realized gains on calls | | $ | 723 | | $ | 747 | | $ | - | | $ | 4,266 | | $ | 2,914 | | $ | 4,421 | | $ | 7,548 | | $ | 11,205 | | $ | 20,472 | | $ | 1,470 | | $ | 14,883 | |
| Realized gains on sales | | | 4,967 | | | 2,027 | | | 1,059 | | | 11,654 | | | 23,053 | | | 516 | | | 8,347 | | | - | | | 488 | | | 8,053 | | | 31,916 | |
| Securities and loans valuation adjustments | | | (484 | ) | | (2,305 | ) | | (3,226 | ) | | (1,111 | ) | | (1,158 | ) | | (1,710 | ) | | (391 | ) | | (1,948 | ) | | (421 | ) | | (6,015 | ) | | (3,259 | ) |
| Derivatives valuation adjustments | | | (4,773 | ) | | 5,524 | | | 297 | | | 3,066 | | | 107 | | | (182 | ) | | (492 | ) | | (411 | ) | | 47 | | | 1,048 | | | (567 | ) |
| Variable stock option market value change | | | - | | | - | | | - | | | 25 | | | 16 | | | (2 | ) | | 84 | | | 3 | | | (213 | ) | | - | | | 98 | |
| Total GAAP / Core earnings differences | | | 433 | | | 5,993 | | | (1,870 | ) | | 17,900 | | | 24,932 | | | 3,043 | | | 15,096 | | | 8,849 | | | 20,373 | | | 4,556 | | | 43,071 | |
| | | | | | | | | | | | | | | | | | | | | | | | | | | | | | | | | | | |
| Core earnings | | $ | 31,983 | | $ | 25,417 | | $ | 29,885 | | $ | 24,596 | | $ | 30,967 | | $ | 37,872 | | $ | 45,467 | | $ | 45,565 | | $ | 51,969 | | $ | 87,285 | | $ | 114,306 | |
| | | | | | | | | | | | | | | | | | | | | | | | | | | | | | | | | | | |
| Per share analysis | | | | | | | | | | | | | | | | | | | | | | | | | | | | | | | | | | |
| GAAP earnings per share | | $ | 1.22 | | $ | 1.20 | | $ | 1.09 | | $ | 1.68 | | $ | 2.21 | | $ | 1.62 | | $ | 2.42 | | $ | 2.22 | | $ | 3.18 | | $ | 3.51 | | $ | 6.26 | |
| | | | | | | | | | | | | | | | | | | | | | | | | | | | | | | | | | | |
GAAP income items not included in core earnings | | | | | | | | | | | | | | | | | | | | | | | | | | | | | | | | | | |
| Realized gains on calls | | $ | 0.03 | | $ | 0.03 | | $ | 0.00 | | $ | 0.17 | | $ | 0.12 | | $ | 0.18 | | $ | 0.30 | | $ | 0.46 | | $ | 0.90 | | $ | 0.06 | | $ | 0.60 | |
| Realized gains on sales | | | 0.19 | | | 0.08 | | | 0.04 | | | 0.46 | | | 0.92 | | | 0.02 | | | 0.34 | | | - | | | 0.02 | | | 0.30 | | | 1.27 | |
| Securities and loans valuation adjustments | | | (0.02 | ) | | (0.09 | ) | | (0.12 | ) | | (0.04 | ) | | (0.05 | ) | | (0.07 | ) | | (0.02 | ) | | (0.08 | ) | | (0.02 | ) | | (0.23 | ) | | (0.13 | ) |
| Derivatives valuation adjustments | | | (0.18 | ) | | 0.21 | | | 0.01 | | | 0.12 | | | - | | | (0.01 | ) | | (0.02 | ) | | (0.02 | ) | | - | | | 0.04 | | | (0.02 | ) |
| Variable stock option market value change | | | - | | | - | | | - | | | 0.00 | | | - | | | - | | | - | | | - | | | (0.01 | ) | | - | | | 0.00 | |
| GAAP / Core earnings differences per share | | | 0.02 | | | 0.23 | | | (0.07 | ) | | 0.71 | | | 0.99 | | | 0.12 | | | 0.60 | | | 0.36 | | | 0.89 | | | 0.17 | | | 1.72 | |
| Core earnings per share | | $ | 1.20 | | $ | 0.97 | | $ | 1.16 | | $ | 0.97 | | $ | 1.22 | | $ | 1.50 | | $ | 1.82 | | $ | 1.86 | | $ | 2.29 | | $ | 3.34 | | $ | 4.53 | |
Table 3: GAAP / TAX Differences (in thousands, except per share data) |
| | | | | | | | | | | | | | | | | | | | | Estimated | | Actual | |
| | | Estimated | | Actual | | Actual | | Nine Months | | Nine Months | |
| | | Q3:2006 | | Q2:2006 | | Q1:2006 | | Q4:2005 | | Q3:2005 | | Q2:2005 | | Q1:2005 | | Q4:2004 | | Q3:2004 | | Q3:2006 | | Q3:2005 | |
| | | | | | | | | | | | | | | | | | | | | | | | |
| GAAP net income | | $ | 32,416 | | $ | 31,410 | | $ | 28,015 | | $ | 42,496 | | $ | 55,899 | | $ | 40,915 | | $ | 60,563 | | $ | 54,414 | | $ | 72,342 | | $ | 91,841 | | $ | 157,377 | |
| GAAP/Tax differences: | | | | | | | | | | | | | | | | | | | | | | | | | | | | | | | | | | |
| Interest income and expense | | | 11,062 | | | 15,048 | | | 6,216 | | | (1,590 | ) | | 1,353 | | | (4,868 | ) | | (20,091 | ) | | (7,519 | ) | | (23,527 | ) | | 32,326 | | | (23,606 | ) |
| Provision for credit losses | | | 465 | | | (2,506 | ) | | 176 | | | 876 | | | (805 | ) | | (1,527 | ) | | 1,025 | | | 1,697 | | | 1,528 | | | (1,865 | ) | | (1,307 | ) |
| Deductions for realized credit losses | | | (1,100 | ) | | (686 | ) | | (1,002 | ) | | 34 | | | (562 | ) | | (737 | ) | | (438 | ) | | (247 | ) | | (127 | ) | | (2,788 | ) | | (1,737 | ) |
| Long-term compensation | | | 2,137 | | | (165 | ) | | 2,520 | | | 944 | | | 2,892 | | | 2,138 | | | 1,969 | | | (1,775 | ) | | 402 | | | 4,492 | | | 6,999 | |
| Stock option exercise deduction | | | (92 | ) | | (7 | ) | | (1,126 | ) | | (202 | ) | | (2,944 | ) | | (143 | ) | | (477 | ) | | (3,094 | ) | | (745 | ) | | (1,225 | ) | | (3,564 | ) |
| Depreciation of fixed assets | | | 98 | | | 14 | | | 176 | | | 154 | | | 60 | | | 166 | | | 151 | | | (176 | ) | | (589 | ) | | 288 | | | 377 | |
| Other operating expenses | | | 75 | | | (425 | ) | | (261 | ) | | (780 | ) | | 283 | | | (31 | ) | | 69 | | | (2,495 | ) | | (34 | ) | | (611 | ) | | 321 | |
| Sale of assets to third parties | | | (5,362 | ) | | (1,189 | ) | | (798 | ) | | (4,615 | ) | | (8,041 | ) | | (2,476 | ) | | (967 | ) | | 1,428 | | | (576 | ) | | (7,349 | ) | | (11,484 | ) |
| Call income of residential CES | | | - | | | - | | | 204 | | | (1,505 | ) | | (319 | ) | | 120 | | | (2,324 | ) | | (2,872 | ) | | (3,961 | ) | | 204 | | | (2,523 | ) |
| (Loss)/gain on securitizations | | | 2,266 | | | - | | | - | | | - | | | (392 | ) | | 808 | | | 2,558 | | | 10,749 | | | 11,153 | | | 2,266 | | | 2,974 | |
| (Loss)/gain on intercompany sales and transfers | | | 1,955 | | | 490 | | | (19 | ) | | (446 | ) | | 170 | | | 2,371 | | | 3,260 | | | 3,256 | | | 28 | | | 2,426 | | | 5,801 | |
| Market valuation write downs | | | 484 | | | 2,305 | | | 3,226 | | | 1,110 | | | 2,048 | | | 820 | | | 391 | | | 1,572 | | | 422 | | | 6,015 | | | 3,259 | |
| Interest rate agreements | | | 2,131 | | | 923 | | | (451 | ) | | 799 | | | 216 | | | 53 | | | 202 | | | (688 | ) | | (278 | ) | | 2,603 | | | 471 | |
| Provision for excise tax | | | 327 | | | 295 | | | 295 | | | 280 | | | 285 | | | 308 | | | 307 | | | (165 | ) | | 301 | | | 917 | | | 900 | |
| Provision for income tax | | | 4,123 | | | 3,265 | | | (703 | ) | | 4,096 | | | 5,013 | | | 3,035 | | | 134 | | | 4,827 | | | 2,834 | | | 6,685 | | | 8,182 | |
| Total differences | | | 18,569 | | | 17,362 | | | 8,453 | | | (845 | ) | | (743 | ) | | 37 | | | (14,231 | ) | | 4,498 | | | (13,169 | ) | | 44,384 | | | (14,937 | ) |
| Total taxable income (pre-tax) | | $ | 50,985 | | $ | 48,772 | | $ | 36,468 | | $ | 41,651 | | $ | 55,156 | | $ | 40,952 | | $ | 46,332 | | $ | 58,912 | | $ | 59,173 | | $ | 136,225 | | $ | 142,440 | |
| | | | | | | | | | | | | | | | | | | | | | | | | | | | | | | | | | | |
| Shares outstanding at period end | | | 26,053 | | | 25,668 | | | 25,382 | | | 25,133 | | | 24,764 | | | 24,647 | | | 24,514 | | | 24,154 | | | 23,346 | | | 26,053 | | | 24,764 | |
| | | | | | | | | | | | | | | | | | | | | | | | | | | | | | | | | | | |
| Total taxable income per share | | $ | 1.95 | | $ | 1.90 | | $ | 1.44 | | $ | 1.66 | | $ | 2.23 | | $ | 1.66 | | $ | 1.89 | | $ | 2.44 | | $ | 2.53 | | $ | 5.29 | | $ | 5.78 | |
Table 4: Taxable Income (in thousands, except per share data) |
| | | | | | | | | | | | | | | | | | | | | Estimated | | Actual | |
| | | Estimated | | Actual | | Actual | | Nine Months | | Nine Months | |
| | | Q3:2006 | | Q2:2006 | | Q1:2006 | | Q4:2005 | | Q3:2005 | | Q2:2005 | | Q1:2005 | | Q4:2004 | | Q3:2004 | | Q3:2006 | | Q3:2005 | |
| | | | | | | | | | | | | | | | | | | | | | | | |
| Total taxable income (pre-tax) | | $ | 50,985 | | $ | 48,772 | | $ | 36,468 | | $ | 41,651 | | $ | 55,156 | | $ | 40,952 | | $ | 46,331 | | $ | 58,912 | | $ | 59,173 | | $ | 136,225 | | $ | 142,439 | |
| Less: net gains (losses) from calls, sales and stock option exercises | | | 1,659 | | | 4,826 | | | (630 | ) | | 6,863 | | | 14,160 | | | 5,365 | | | 17,586 | | | 18,553 | | | 26,176 | | | 5,855 | | | 37,111 | |
| Total core taxable income | | $ | 49,326 | | $ | 43,946 | | $ | 37,098 | | $ | 34,788 | | $ | 40,996 | | $ | 35,587 | | $ | 28,745 | | $ | 40,359 | | $ | 32,997 | | $ | 130,370 | | $ | 179,550 | |
| | | | | | | | | | | | | | | | | | | | | | | | | | | | | | | | | | | |
| Total taxable income (pre-tax) | | $ | 50,985 | | $ | 48,772 | | $ | 36,468 | | $ | 41,651 | | $ | 55,156 | | $ | 40,952 | | $ | 46,331 | | $ | 58,912 | | $ | 59,173 | | $ | 136,225 | | $ | 142,439 | |
| Less: REIT taxable income (pre-tax) | | | 45,751 | | | 45,040 | | | 35,382 | | | 39,957 | | | 47,118 | | | 39,237 | | | 45,161 | | | 50,009 | | | 49,030 | | | 126,173 | | | 131,516 | |
| Taxable income in taxable subs (pre-tax) | | $ | 5,234 | | $ | 3,732 | | $ | 1,086 | | $ | 1,694 | | $ | 8,038 | | $ | 1,715 | | $ | 1,170 | | $ | 8,903 | | $ | 10,143 | | $ | 10,052 | | $ | 10,923 | |
| | | | | | | | | | | | | | | | | | | | | | | | | | | | | | | | | | | |
| Core REIT taxable income | | $ | 44,795 | | $ | 40,504 | | $ | 36,011 | | $ | 35,234 | | $ | 33,065 | | $ | 36,198 | | $ | 30,741 | | $ | 42,544 | | $ | 34,272 | | $ | 121,310 | | $ | 100,004 | |
| Other ordinary REIT taxable income (expense) | | | 1,054 | | | 4,370 | | | (1,068 | ) | | 2,232 | | | (2,160 | ) | | 3,166 | | | (565 | ) | | (3,094 | ) | | (745 | ) | | 4,356 | | | 441 | |
| Ordinary REIT taxable income | | | 45,849 | | | 44,874 | | | 34,943 | | | 37,466 | | | 30,905 | | | 39,364 | | | 30,176 | | | 39,450 | | | 33,527 | | | 125,666 | | | 100,445 | |
| Net long-term capital gains | | | (98 | ) | | 166 | | | 439 | | | 2,491 | | | 16,213 | | | (127 | ) | | 14,985 | | | 10,559 | | | 15,503 | | | 507 | | | 31,071 | |
| REIT taxable income (pre-tax) | | $ | 45,751 | | $ | 45,040 | | $ | 35,382 | | $ | 39,957 | | $ | 47,118 | | $ | 39,237 | | $ | 45,161 | | $ | 50,009 | | $ | 49,030 | | $ | 126,173 | | $ | 131,516 | |
| | | | | | | | | | | | | | | | | | | | | | | | | | | | | | | | | | | |
| REIT taxable income (pre-tax) | | $ | 45,751 | | $ | 45,040 | | $ | 35,382 | | $ | 39,957 | | $ | 47,118 | | $ | 39,237 | | $ | 45,161 | | $ | 50,009 | | $ | 49,030 | | $ | 126,173 | | $ | 131,516 | |
| Excise taxes | | | (327 | ) | | (295 | ) | | (295 | ) | | (280 | ) | | (285 | ) | | (308 | ) | | (307 | ) | | 293 | | | (301 | ) | | (917 | ) | | (900 | ) |
| Income taxes | | | (1,529 | ) | | (1,802 | ) | | (1,712 | ) | | (867 | ) | | (1,641 | ) | | (1,830 | ) | | (1,450 | ) | | 14 | | | (1,537 | ) | | (5,043 | ) | | (4,921 | ) |
| REIT taxable income available for distribution | | $ | 43,895 | | $ | 42,943 | | $ | 33,375 | | $ | 38,810 | | $ | 45,192 | | $ | 37,099 | | $ | 43,404 | | $ | 50,316 | | $ | 47,192 | | $ | 120,213 | | $ | 125,695 | |
| | | | | | | | | | | | | | | | | | | | | | | | | | | | | | | | | | | |
| Core income (loss) in taxable subs (pre-tax) | | $ | 4,531 | | $ | 3,442 | | $ | 1,086 | | | ($445 | ) | $ | 7,931 | | | ($611 | ) | | ($1,996 | ) | | ($2,185 | ) | | ($1,275 | ) | $ | 9,059 | | $ | 5,324 | |
| Income from calls and sales in taxable subs (pre-tax) | | | 703 | | | 290 | | | - | | | 2,139 | | | 107 | | | 2,326 | | | 3,166 | | | 11,088 | | | 11,418 | | | 993 | | | 5,599 | |
| Taxable income in taxable subs (pre-tax) | | | 5,234 | | | 3,732 | | | 1,086 | | | 1,694 | | | 8,038 | | | 1,715 | | | 1,170 | | | 8,903 | | | 10,143 | | | 10,052 | | $ | 10,923 | |
| Income tax for taxable subs (actual tax due) | | | (2,078 | ) | | (1,700 | ) | | (530 | ) | | (456 | ) | | (3,652 | ) | | (870 | ) | | (830 | ) | | (5,773 | ) | | (4,574 | ) | | (4,308 | ) | | (5,352 | ) |
| After-tax income in taxable subs | | $ | 3,156 | | $ | 2,032 | | $ | 556 | | $ | 1,238 | | $ | 4,386 | | $ | 845 | | $ | 340 | | $ | 3,130 | | $ | 5,569 | | $ | 5,744 | | $ | 5,571 | |
| | | | | | | | | | | | | | | | | | | | | | | | | | | | | | | | | | | |
| REIT taxable income available for distribution | | $ | 43,895 | | $ | 42,943 | | $ | 33,375 | | $ | 38,810 | | $ | 45,192 | | $ | 37,099 | | $ | 43,404 | | $ | 50,316 | | $ | 47,192 | | $ | 120,213 | | $ | 125,695 | |
| After-tax income in taxable subs | | | 3,156 | | | 2,032 | | | 556 | | | 1,238 | | | 4,386 | | | 845 | | | 340 | | | 3,130 | | | 5,569 | | | 5,744 | | | 5,571 | |
| Total taxable income (after-tax) | | $ | 47,051 | | $ | 44,975 | | $ | 33,931 | | $ | 40,048 | | $ | 49,578 | | $ | 37,944 | | $ | 43,744 | | $ | 53,446 | | $ | 52,761 | | $ | 125,957 | | $ | 131,266 | |
| | | | | | | | | | | | | | | | | | | | | | | | | | | | | | | | | | | |
| Taxable income (after-tax) retained in tax subs | | $ | 3,156 | | $ | 2,032 | | $ | 556 | | $ | 1,238 | | $ | 4,386 | | $ | 845 | | $ | 340 | | $ | 3,130 | | $ | 5,569 | | $ | 5,744 | | $ | 5,571 | |
| REIT retained taxable income (after-tax) (1) | | | 2,500 | | | 2,166 | | | 1,313 | | | 1,910 | | | 1,164 | | | 1,798 | | | 1,261 | | | 4,252 | | | 1,515 | | | 5,978 | | | 4,223 | |
| Total retained taxable earnings (after-tax) | | $ | 5,656 | | $ | 4,198 | | $ | 1,869 | | $ | 3,148 | | $ | 5,551 | | $ | 2,643 | | $ | 1,601 | | $ | 7,382 | | $ | 7,084 | | $ | 11,722 | | $ | 9,794 | |
| | | | | | | | | | | | | | | | | | | | | | | | | | | | | | | | | | | |
| Shares outstanding at period end (000) | | | 26,053 | | | 25,668 | | | 25,382 | | | 25,133 | | | 24,764 | | | 24,647 | | | 24,514 | | | 24,154 | | | 23,346 | | | 26,053 | | | 24,764 | |
| | | | | | | | | | | | | | | | | | | | | | | | | | | | | | | | | | | |
Per share outstanding at quarter end | | | | | | | | | | | | | | | | | | | | | | | | | | | | | | | | | | |
| Total taxable income (pre-tax) | | $ | 1.95 | | $ | 1.90 | | $ | 1.44 | | $ | 1.66 | | $ | 2.23 | | $ | 1.66 | | $ | 1.89 | | $ | 2.44 | | $ | 2.53 | | $ | 5.29 | | $ | 5.78 | |
| Core taxable income (pre-tax) | | $ | 1.89 | | $ | 1.71 | | $ | 1.46 | | $ | 1.38 | | $ | 1.66 | | $ | 1.44 | | $ | 1.17 | | $ | 1.67 | | $ | 1.41 | | $ | 5.06 | | $ | 4.27 | |
| REIT taxable income (pre-tax) | | $ | 1.76 | | $ | 1.75 | | $ | 1.39 | | $ | 1.60 | | $ | 1.90 | | $ | 1.59 | | $ | 1.84 | | $ | 2.07 | | $ | 2.10 | | $ | 4.90 | | $ | 5.33 | |
| Taxable income at taxable subsidiaries | | $ | 0.20 | | $ | 0.16 | | $ | 0.04 | | $ | 0.07 | | $ | 0.32 | | $ | 0.07 | | $ | 0.05 | | $ | 0.37 | | $ | 0.43 | | $ | 0.40 | | $ | 0.44 | |
| Total retained taxable earnings (after-tax) | | $ | 0.22 | | $ | 0.16 | | $ | 0.07 | | $ | 0.13 | | $ | 0.22 | | $ | 0.11 | | $ | 0.07 | | $ | 0.31 | | $ | 0.30 | | $ | 0.45 | | $ | 0.40 | |
(1) REIT retained taxable income equals 10% of ordinary REIT taxable income less income taxes and excise taxes.
Table 5: Retention and Distribution of Taxable Income (in thousands, except per share data) | |
| | | | | | | | | | | | | | | | | | | | | Estimated | | Actual | |
| | | Estimated | | Actual | | Actual | | Nine Months | | Nine Months | |
| | | Q3:2006 | | Q2:2006 | | Q1:2006 | | Q4:2005 | | Q3:2005 | | Q2:2005 | | Q1:2005 | | Q4:2004 | | Q3:2004 | | Q3:2006 | | Q3:2005 | |
| Dividends declared | | $ | 18,237 | | $ | 17,967 | | $ | 17,767 | | $ | 92,150 | | $ | 17,335 | | $ | 17,253 | | $ | 17,160 | | $ | 146,707 | | $ | 15,642 | | $ | 53,971 | | $ | 51,748 | |
| Dividend deduction on stock issued through DRIP | | | 177 | | | 239 | | | 176 | | | 263 | | | 128 | | | 112 | | | 56 | | | 1,048 | | | 844 | | | 592 | | | 296 | |
| Total dividend deductions | | $ | 18,414 | | $ | 18,206 | | $ | 17,943 | | $ | 92,413 | | $ | 17,463 | | $ | 17,365 | | $ | 17,216 | | $ | 147,755 | | $ | 16,486 | | $ | 54,563 | | $ | 52,044 | |
| | | | | | | | | | | | | | | | | | | | | | | | | | | | | | | | | | | |
| Regular dividend per share | | $ | 0.70 | | $ | 0.70 | | $ | 0.70 | | $ | 0.70 | | $ | 0.70 | | $ | 0.70 | | $ | 0.70 | | $ | 0.67 | | $ | 0.67 | | $ | 2.10 | | $ | 2.10 | |
| Special dividend per share | | | | | | - | | | - | | | 3.00 | | | - | | | - | | | - | | | 5.50 | | | - | | | - | | | - | |
| Total dividends per share | | $ | 0.70 | | $ | 0.70 | | $ | 0.70 | | $ | 3.70 | | $ | 0.70 | | $ | 0.70 | | $ | 0.70 | | $ | 6.17 | | $ | 0.67 | | $ | 2.10 | | $ | 2.10 | |
| | | | | | | | | | | | | | | | | | | | | | | | | | | | | | | | | | | |
| Undistributed REIT taxable income at beginning of period (pre-tax): | | $ | 88,422 | | $ | 65,851 | | $ | 51,732 | | $ | 106,719 | | $ | 80,166 | | $ | 62,218 | | $ | 37,291 | | $ | 138,981 | | $ | 109,790 | | $ | 51,732 | | $ | 37,291 | |
| REIT taxable income (pre-tax) | | | 45,751 | | | 45,040 | | | 35,382 | | | 39,957 | | | 47,118 | | | 39,237 | | | 45,161 | | | 50,009 | | | 49,030 | | | 126,173 | | | 131,516 | |
| Permanently retained (pre-tax) | | | (4,356 | ) | | (4,263 | ) | | (3,320 | ) | | (2,531 | ) | | (3,102 | ) | | (3,924 | ) | | (3,018 | ) | | (3,944 | ) | | (3,353 | ) | | (11,939 | ) | | (10,044 | ) |
| Dividend of 2003 income | | | - | | | - | | | - | | | - | | | - | | | - | | | - | | | - | | | (14,413 | ) | | - | | | - | |
| Dividend of 2004 income | | | - | | | - | | | - | | | - | | | (2,710 | ) | | (17,365 | ) | | (17,216 | ) | | (147,755 | ) | | (2,073 | ) | | - | | | (37,291 | ) |
| Dividend of 2005 income | | | (15,582 | ) | | (18,206 | ) | | (17,943 | ) | | (92,413 | ) | | (14,753 | ) | | - | | | - | | | - | | | - | | | (51,731 | ) | | (14,753 | ) |
| Dividend of 2006 income | | | (2,832 | ) | | - | | | - | | | - | | | - | | | - | | | - | | | - | | | - | | | (2,832 | ) | | - | |
Undistributed REIT taxable income at end of period (pre-tax): | | $ | 111,403 | | $ | 88,422 | | $ | 65,851 | | $ | 51,732 | | $ | 106,719 | | $ | 80,166 | | $ | 62,218 | | $ | 37,291 | | $ | 138,981 | | $ | 111,403 | | $ | 106,719 | |
| | | | | | | | | | | | | | | | | | | | | | | | | | | | | | | | | | | |
| Undistributed REIT taxable income (pre-tax) | | | | | | | | | | | | | | | | | | | | | | | | | | | | | | | | | | |
| From 2003's income | | $ | - | | $ | - | | $ | - | | $ | - | | $ | - | | $ | - | | $ | - | | $ | - | | $ | - | | $ | - | | $ | - | |
| From 2004's income | | | - | | | - | | | - | | | - | | | - | | | 2,710 | | | 20,075 | | | 37,291 | | | 138,981 | | | - | | | - | |
| From 2005's income | | | - | | | 15,583 | | | 33,789 | | | 51,732 | | | 106,719 | | | 77,456 | | | 42,143 | | | - | | | - | | | - | | | 106,719 | |
| From 2006's income | | | 111,403 | | | 72,839 | | | 32,062 | | | - | | | - | | | - | | | - | | | - | | | - | | | 111,403 | | | - | |
Total | | $ | 111,403 | | $ | 88,422 | | $ | 65,851 | | $ | 51,732 | | $ | 106,719 | | $ | 80,166 | | $ | 62,218 | | $ | 37,291 | | $ | 138,981 | | $ | 111,403 | | $ | 106,719 | |
Table 6: Assets (in millions) | |
| | | | | | | | | | | | | | | | | | | | |
| | | Q3:2006 | | Q2:2006 | | Q1:2006 | | Q4:2005 | | Q3:2005 | | Q2:2005 | | Q1:2005 | | Q4:2004 | | Q3:2004 | |
| | | | | | | | | | | | | | | | | | | | |
| Residential loans owned by Redwood | | $ | 520 | | $ | 351 | | $ | 87 | | $ | 45 | | $ | 17 | | $ | 300 | | $ | 256 | | $ | 193 | | $ | 259 | |
| Residential loans consolidated from entities | | | 9,205 | | | 9,962 | | | 11,741 | | | 13,649 | | | 16,324 | | | 19,083 | | | 21,237 | | | 22,015 | | | 21,299 | |
| Total GAAP residential loans | | | 9,725 | | | 10,313 | | | 11,828 | | | 13,694 | | | 16,341 | | | 19,383 | | | 21,493 | | | 22,208 | | | 21,558 | |
| | | | | | | | | | | | | | | | | | | | | | | | | | | | | |
| HELOC loans owned by Redwood | | | - | | | - | | | - | | | - | | | - | | | - | | | - | | | - | | | - | |
| HELOC loans consolidated from entities | | | 118 | | | 140 | | | 162 | | | 181 | | | 215 | | | 247 | | | 279 | | | 296 | | | 317 | |
| Total GAAP HELOC loans | | | 118 | | | 140 | | | 162 | | | 181 | | | 215 | | | 247 | | | 279 | | | 296 | | | 317 | |
| | | | | | | | | | | | | | | | | | | | | | | | | | | | | |
| Commercial loans owned by Redwood | | | 2 | | | 2 | | | 2 | | | 7 | | | 21 | | | 16 | | | 22 | | | 32 | | | 21 | |
| Commercial loans consolidated from entities | | | 30 | | | 36 | | | 53 | | | 53 | | | 35 | | | 26 | | | 35 | | | 22 | | | 12 | |
| Total GAAP commercial loans | | | 32 | | | 38 | | | 55 | | | 60 | | | 56 | | | 42 | | | 57 | | | 54 | | | 33 | |
| | | | | | | | | | | | | | | | | | | | | | | | | | | | | |
| Residential CES owned by Redwood | | | 291 | | | 409 | | | 305 | | | 311 | | | 338 | | | 469 | | | 373 | | | 351 | | | 327 | |
| Residential CES consolidated from entities | | | 451 | | | 306 | | | 339 | | | 302 | | | 326 | | | 237 | | | 238 | | | 211 | | | 170 | |
| Total GAAP residential CES | | | 742 | | | 715 | | | 644 | | | 613 | | | 664 | | | 706 | | | 611 | | | 562 | | | 497 | |
| | | | | | | | | | | | | | | | | | | | | | | | | | | | | |
| Commercial first-loss CES owned by Redwood | | | 117 | | | 76 | | | 67 | | | 58 | | | 44 | | | 29 | | | 29 | | | 14 | | | 9 | |
| Commercial first-loss CES consolidated from entities | | | - | | | - | | | - | | | - | | | - | | | - | | | - | | | - | | | - | |
| Total GAAP Commercial First Loss CES | | | 117 | | | 76 | | | 67 | | | 58 | | | 44 | | | 29 | | | 29 | | | 14 | | | 9 | |
| | | | | | | | | | | | | | | | | | | | | | | | | | | | | |
| Other securities owned by Redwood | | | 156 | | | 240 | | | 53 | | | 167 | | | 234 | | | 208 | | | 70 | | | 115 | | | 161 | |
| Other securities consolidated from entities | | | 1,897 | | | 1,630 | | | 1,765 | | | 1,582 | | | 1,549 | | | 1,441 | | | 1,435 | | | 1,266 | | | 1,069 | |
| Total GAAP other securities | | | 2,053 | | | 1,870 | | | 1,818 | | | 1,749 | | | 1,783 | | | 1,649 | | | 1,505 | | | 1,381 | | | 1,230 | |
| | | | | | | | | | | | | | | | | | | | | | | | | | | | | |
| Cash owned by Redwood | | | 113 | | | 106 | | | 85 | | | 176 | | | 163 | | | 72 | | | 65 | | | 57 | | | 76 | |
| Restricted cash consolidated from entities | | | 139 | | | 86 | | | 131 | | | 72 | | | 59 | | | 48 | | | 58 | | | 36 | | | 45 | |
| Accrued interest receivable | | | 67 | | | 67 | | | 73 | | | 76 | | | 80 | | | 85 | | | 82 | | | 72 | | | 62 | |
| Principal receivable | | | 1 | | | 1 | | | 2 | | | - | | | 2 | | | - | | | - | | | 3 | | | 1 | |
| Interest rate agreements | | | 30 | | | 54 | | | 48 | | | 31 | | | 25 | | | 13 | | | 29 | | | 16 | | | 10 | |
| Deferred tax asset | | | 3 | | | 5 | | | 5 | | | 5 | | | 8 | | | 7 | | | 8 | | | 11 | | | 9 | |
| Deferred asset-backed security issuance costs | | | 47 | | | 46 | | | 52 | | | 54 | | | 56 | | | 59 | | | 63 | | | 61 | | | 58 | |
| Other assets | | | 13 | | | 13 | | | 10 | | | 8 | | | 9 | | | 6 | | | 6 | | | 7 | | | 7 | |
| Total GAAP assets | | $ | 13,200 | | $ | 13,530 | | $ | 14,979 | | $ | 16,777 | | $ | 19,505 | | $ | 22,346 | | $ | 24,285 | | $ | 24,778 | | $ | 23,912 | |
| | | | | | | | | | | | | | | | | | | | | | | | | | | | | |
| Residential loans owned by Redwood | | $ | 520 | | $ | 351 | | $ | 87 | | $ | 45 | | $ | 17 | | $ | 300 | | $ | 256 | | $ | 193 | | $ | 259 | |
| HELOC loans owned by Redwood | | | - | | | - | | | - | | | - | | | - | | | - | | | - | | | - | | | - | |
| Commercial loans owned by Redwood | | | 2 | | | 2 | | | 2 | | | 7 | | | 21 | | | 16 | | | 22 | | | 32 | | | 21 | |
| Residential CES owned by Redwood | | | 291 | | | 409 | | | 305 | | | 311 | | | 338 | | | 469 | | | 373 | | | 351 | | | 327 | |
| Commercial CES owned by Redwood | | | 117 | | | 76 | | | 67 | | | 58 | | | 44 | | | 29 | | | 29 | | | 14 | | | 9 | |
| Other securities owned by Redwood | | | 156 | | | 240 | | | 53 | | | 167 | | | 234 | | | 208 | | | 70 | | | 129 | | | 170 | |
| Cash owned by Redwood | | | 113 | | | 106 | | | 85 | | | 176 | | | 163 | | | 72 | | | 65 | | | 57 | | | 76 | |
| Assets of securitizations for GAAP | | | 11,701 | | | 12,074 | | | 14,060 | | | 15,767 | | | 18,449 | | | 21,034 | | | 23,224 | | | 23,810 | | | 22,867 | |
| ABS liabilities of entities for GAAP | | | (11,554 | ) | | (11,898 | ) | | (13,930 | ) | | (15,585 | ) | | (18,238 | ) | | (20,815 | ) | | (23,057 | ) | | (23,630 | ) | | (22,680 | ) |
| Redwood earning assets - GAAP basis | | $ | 1,346 | | $ | 1,360 | | $ | 729 | | $ | 946 | | $ | 1,028 | | $ | 1,313 | | $ | 982 | | $ | 956 | | $ | 1,049 | |
Table 7: Liabilities and Equity (all $ in millions) | | | |
| | | | | | | | | | | | | | | | | | | | |
| | | Q3:2006 | | Q2:2006 | | Q1:2006 | | Q4:2005 | | Q3:2005 | | Q2:2005 | | Q1:2005 | | Q4:2004 | | Q3:2004 | |
| | | | | | | | | | | | | | | | | | | | |
| Redwood debt: short-term | | $ | 510 | | $ | 529 | | $ | - | | $ | 170 | | $ | 162 | | $ | 453 | | $ | 199 | | $ | 203 | | $ | 246 | |
| Redwood debt: long-term | | | - | | | - | | | - | | | - | | | - | | | - | | | - | | | - | | | - | |
| Redwood debt | | | 510 | | | 529 | | | - | | | 170 | | | 162 | | | 453 | | | 199 | | | 203 | | | 246 | |
| | | | | | | | | | | | | | | | | | | | | | | | | | | | | |
| ABS issued, consolidated from entities | | | 11,466 | | | 11,775 | | | 13,788 | | | 15,422 | | | 18,049 | | | 20,598 | | | 22,821 | | | 23,383 | | | 22,449 | |
| Unamortized IO issuance premium | | | 90 | | | 106 | | | 124 | | | 143 | | | 163 | | | 186 | | | 202 | | | 210 | | | 185 | |
| Unamortized ABS issuance premium | | | (2 | ) | | 17 | | | 18 | | | 20 | | | 25 | | | 31 | | | 34 | | | 37 | | | 46 | |
| ABS obligations of entities | | | 11,554 | | | 11,898 | | | 13,930 | | | 15,585 | | | 18,237 | | | 20,815 | | | 23,057 | | | 23,630 | | | 22,680 | |
| | | | | | | | | | | | | | | | | | | | | | | | | | | | | |
| Accrued interest payable | | | 51 | | | 47 | | | 43 | | | 41 | | | 42 | | | 43 | | | 38 | | | 35 | | | 29 | |
| Interest rate agreements | | | 6 | | | 4 | | | - | | | 1 | | | 1 | | | 3 | | | - | | | 1 | | | 7 | |
| Accrued expenses and other liabilities | | | 18 | | | 29 | | | 21 | | | 28 | | | 30 | | | 23 | | | 26 | | | 29 | | | 32 | |
| Dividends payable | | | 18 | | | 18 | | | 18 | | | 17 | | | 17 | | | 17 | | | 17 | | | 16 | | | 16 | |
| Total GAAP liabilities | | | 12,157 | | | 12,525 | | | 14,012 | | | 15,842 | | | 18,489 | | | 21,354 | | | 23,337 | | | 23,914 | | | 23,010 | |
| | | | | | | | | | | | | | | | | | | | | | | | | | | | | |
| | | | | | | | | | | | | | | | | | | | | | | | | | | | | |
| Common stock and paid-in capital | | | 875 | | | 854 | | | 839 | | | 825 | | | 808 | | | 803 | | | 795 | | | 773 | | | 727 | |
| Accumulated other comprehensive income | | | 95 | | | 91 | | | 82 | | | 74 | | | 117 | | | 137 | | | 125 | | | 105 | | | 97 | |
| Cumulative GAAP earnings | | | 773 | | | 740 | | | 709 | | | 681 | | | 639 | | | 583 | | | 542 | | | 482 | | | 427 | |
| Cumulative distributions to shareholders | | | (700 | ) | | (681 | ) | | (663 | ) | | (645 | ) | | (548 | ) | | (531 | ) | | (514 | ) | | (496 | ) | | (349 | ) |
| GAAP stockholders' equity | | | 1,043 | | | 1,004 | | | 967 | | | 935 | | | 1,016 | | | 992 | | | 948 | | | 864 | | | 902 | |
| | | | | | | | | | | | | | | | | | | | | | | | | | | | | |
| Total GAAP liabilities and equity | | $ | 13,200 | | $ | 13,530 | | $ | 14,979 | | $ | 16,777 | | $ | 19,505 | | $ | 22,346 | | $ | 24,285 | | $ | 24,778 | | $ | 23,912 | |
| | | | | | | | | | | | | | | | | | | | | | | | | | | | | |
| | | | | | | | | | | | | | | | | | | | | | | | | | | | | |
| Redwood debt | | $ | 510 | | $ | 529 | | $ | - | | $ | 170 | | $ | 162 | | $ | 453 | | $ | 199 | | $ | 203 | | $ | 246 | |
| GAAP stockholders' equity | | | 1,043 | | | 1,004 | | | 967 | | | 935 | | | 1016 | | | 992 | | | 948 | | | 864 | | | 902 | |
| Redwood total capital | | $ | 1,553 | | $ | 1,533 | | $ | 967 | | $ | 1,105 | | $ | 1,178 | | $ | 1,445 | | $ | 1,147 | | $ | 1,067 | | $ | 1,148 | |
| | | | | | | | | | | | | | | | | | | | | | | | | | | | | |
| Redwood debt to stockholders' equity | | | 49 | % | | 53 | % | | 0 | % | | 18 | % | | 16 | % | | 46 | % | | 21 | % | | 23 | % | | 27 | % |
| Redwood debt to capital | | | 33 | % | | 35 | % | | 0 | % | | 15 | % | | 14 | % | | 31 | % | | 17 | % | | 19 | % | | 21 | % |
| | | | | | | | | | | | | | | | | | | | | | | | | | | | | |
| Redwood earning assets | | $ | 1,346 | | $ | 1,360 | | $ | 729 | | $ | 946 | | $ | 1,028 | | $ | 1,313 | | $ | 982 | | $ | 956 | | $ | 1,049 | |
| Redwood debt | | | 510 | | | 529 | | | - | | | 170 | | | 162 | | | 453 | | | 199 | | | 203 | | | 246 | |
| Redwood net earning assets (GAAP basis) | | | 836 | | | 831 | | | 729 | | | 776 | | | 866 | | | 860 | | | 783 | | | 739 | | | 794 | |
| Working capital and other | | | 207 | | | 173 | | | 238 | | | 159 | | | 150 | | | 132 | | | 165 | | | 125 | | | 108 | |
| GAAP stockholders' equity | | $ | 1,043 | | $ | 1,004 | | $ | 967 | | $ | 935 | | $ | 1,016 | | $ | 992 | | $ | 948 | | $ | 864 | | $ | 902 | |
| | | | | | | | | | | | | | | | | | | | | | | | | | | | | |
| Equity to earning assets | | | 77 | % | | 74 | % | | 133 | % | | 99 | % | | 99 | % | | 76 | % | | 97 | % | | 92 | % | | 87 | % |
Table 8: Book Value and Profitability Ratios (all $ in thousands, except per share data) | |
| | | | | | | | | | | | | | | | | | | | | Nine Months | | Nine Months | |
| | | Q3:2006 | | Q2:2006 | | Q1:2006 | | Q4:2005 | | Q3:2005 | | Q2:2005 | | Q1:2005 | | Q4:2004 | | Q3:2004 | | Q3:2006 | | Q3:2005 | |
| | | | | | | | | | | | | | | | | | | | | | | | |
| GAAP stockholders' equity | | $ | 1,042,661 | | $ | 1,004,265 | | $ | 967,333 | | $ | 934,960 | | $ | 1,016,065 | | $ | 991,757 | | $ | 948,001 | | $ | 864,156 | | $ | 901,841 | | $ | 1,042,661 | | $ | 1,016,065 | |
| Balance sheet mark-to-market adjustments | | | 94,780 | | | 90,937 | | | 81,591 | | | 73,731 | | | 117,043 | | | 137,380 | | | 124,784 | | | 105,357 | | | 96,452 | | | 94,780 | | | 117,043 | |
| Core equity | | $ | 947,881 | | $ | 913,328 | | $ | 885,742 | | $ | 861,229 | | $ | 899,022 | | $ | 854,377 | | $ | 823,217 | | $ | 758,799 | | $ | 805,389 | | $ | 947,881 | | $ | 899,022 | |
| | | | | | | | | | | | | | | | | | | | | | | | | | | | | | | | | | | |
| Core equity | | $ | 947,881 | | $ | 913,328 | | $ | 885,742 | | $ | 861,229 | | $ | 899,022 | | $ | 854,377 | | $ | 823,217 | | $ | 758,799 | | $ | 805,389 | | $ | 947,881 | | $ | 899,022 | |
| REIT taxable income yet to be distributed as dividends | | | 111,403 | | | 88,421 | | | 65,851 | | | 51,732 | | | 106,719 | | | 80,166 | | | 62,218 | | | 37,291 | | | 138,982 | | | 111,403 | | | 106,719 | |
| Adjusted core equity | | $ | 836,478 | | $ | 824,907 | | $ | 819,891 | | $ | 809,497 | | $ | 792,303 | | $ | 774,211 | | $ | 760,999 | | $ | 721,508 | | $ | 666,407 | | $ | 836,478 | | $ | 792,303 | |
| | | | | | | | | | | | | | | | | | | | | | | | | | | | | | | | | | | |
| Shares outstanding at quarter end | | | 26,053 | | | 25,668 | | | 25,382 | | | 25,133 | | | 24,764 | | | 24,647 | | | 24,514 | | | 24,154 | | | 23,346 | | | 26,053 | | | 24,764 | |
| | | | | | | | | | | | | | | | | | | | | | | | | | | | | | | | | | | |
| GAAP equity per share | | $ | 40.02 | | $ | 39.13 | | $ | 38.11 | | $ | 37.20 | | $ | 41.03 | | $ | 40.24 | | $ | 38.67 | | $ | 35.78 | | $ | 38.63 | | $ | 40.02 | | $ | 41.03 | |
| Core equity per share | | $ | 36.38 | | $ | 35.58 | | $ | 34.90 | | $ | 34.27 | | $ | 36.30 | | $ | 34.66 | | $ | 33.58 | | $ | 31.42 | | $ | 34.50 | | $ | 36.38 | | $ | 36.30 | |
| Adjusted core equity per share | | $ | 32.11 | | $ | 32.14 | | $ | 32.30 | | $ | 32.21 | | $ | 31.99 | | $ | 31.41 | | $ | 31.04 | | $ | 29.87 | | $ | 28.55 | | $ | 32.11 | | $ | 31.99 | |
| | | | | | | | | | | | | | | | | | | | | | | | | | | | | | | | | | | |
| | | | | | | | | | | | | | | | | | | | | | | | | | | | | | | | | | | |
| | | | | | | | | | | | | | | | | | | | | | | | | | | | | | | | | | | |
| Net interest income (NII) | | $ | 48,976 | | $ | 44,719 | | $ | 45,227 | | $ | 41,483 | | $ | 48,040 | | $ | 53,380 | | $ | 62,026 | | $ | 58,385 | | $ | 67,547 | | $ | 138,922 | | $ | 163,445 | |
| Net interest income / average core equity | | | 21 | % | | 20 | % | | 21 | % | | 19 | % | | 22 | % | | 25 | % | | 31 | % | | 30 | % | | 39 | % | | 22 | % | | 28 | % |
| | | | | | | | | | | | | | | | | | | | | | | | | | | | | | | | | | | |
| Operating expenses | | $ | 13,455 | | $ | 16,037 | | $ | 12,582 | | $ | 12,765 | | $ | 12,364 | | $ | 11,456 | | $ | 11,798 | | $ | 7,991 | | $ | 10,829 | | $ | 42,074 | | $ | 35,618 | |
| Operating expenses / Net interest income (NII) | | | 27 | % | | 36 | % | | 28 | % | | 31 | % | | 26 | % | | 21 | % | | 19 | % | | 14 | % | | 16 | % | | 30 | % | | 22 | % |
| | | | | | | | | | | | | | | | | | | | | | | | | | | | | | | | | | | |
| GAAP net income | | $ | 32,416 | | $ | 31,410 | | $ | 28,015 | | $ | 42,496 | | $ | 55,899 | | $ | 40,915 | | $ | 60,563 | | $ | 54,414 | | $ | 72,342 | | $ | 91,841 | | $ | 157,376 | |
| GAAP net income/average core equity (adjusted ROE) | | | 14 | % | | 14 | % | | 13 | % | | 19 | % | | 25 | % | | 19 | % | | 30 | % | | 28 | % | | 42 | % | | 14 | % | | 25 | % |
| | | | | | | | | | | | | | | | | | | | | | | | | | | | | | | | | | | |
| Core earnings | | $ | 31,983 | | $ | 25,417 | | $ | 29,885 | | $ | 24,596 | | $ | 30,967 | | $ | 37,872 | | $ | 45,467 | | $ | 45,565 | | $ | 51,969 | | $ | 87,285 | | $ | 114,306 | |
| Core earnings/average core equity | | | 14 | % | | 11 | % | | 14 | % | | 11 | % | | 14 | % | | 18 | % | | 23 | % | | 23 | % | | 30 | % | | 13 | % | | 18 | % |
Table 9: Average Balance Sheet (in thousands) | |
| | | | | | | | | | | | | | | | | | | | | Nine Months | | Nine Months | |
| | | Q3:2006 | | Q2:2006 | | Q1:2006 | | Q4:2005 | | Q3:2005 | | Q2:2005 | | Q1:2005 | | Q4:2004 | | Q3:2004 | | Q3:2006 | | Q3:2005 | |
| | | | | | | | | | | | | | | | | | | | | | | | |
| Average real estate loans | | $ | 9,979,261 | | $ | 10,832,187 | | $ | 12,599,296 | | $ | 14,880,636 | | $ | 17,645,610 | | $ | 20,357,699 | | $ | 21,981,723 | | $ | 22,059,853 | | $ | 20,840,848 | | $ | 11,127,318 | | $ | 19,979,127 | |
| Average real estate securities | | | 2,697,903 | | | 2,502,926 | | | 2,386,493 | | | 2,322,337 | | | 2,305,361 | | | 2,123,630 | | | 1,936,154 | | | 1,703,407 | | | 1,517,715 | | | 2,530,248 | | | 2,123,067 | |
| Average cash and cash equivalents | | | 183,323 | | | 246,597 | | | 244,002 | | | 339,379 | | | 134,422 | | | 124,707 | | | 124,685 | | | 126,556 | | | 101,937 | | | 224,418 | | | 127,974 | |
| Average earning assets | | | 12,860,487 | | | 13,581,710 | | | 15,229,791 | | | 17,542,352 | | | 20,085,393 | | | 22,606,036 | | | 24,042,562 | | | 23,889,816 | | | 22,460,500 | | | 13,881,984 | | | 22,230,168 | |
| Average other assets | | | 619,874 | | | 587,045 | | | 609,692 | | | 806,329 | | | 905,906 | | | 759,517 | | | 520,622 | | | 430,219 | | | 416,736 | | | 605,574 | | | 730,136 | |
| Average total assets | | $ | 13,480,361 | | $ | 14,168,755 | | $ | 15,839,483 | | $ | 18,348,681 | | $ | 20,991,299 | | $ | 23,365,553 | | $ | 24,563,184 | | $ | 24,320,035 | | $ | 22,877,236 | | $ | 14,487,558 | | $ | 22,960,304 | |
| | | | | | | | | | | | | | | | | | | | | | | | | | | | | | | | | | | |
| | | | | | | | | | | | | | | | | | | | | | | | | | | | | | | | | | | |
| Average Redwood debt | | $ | 647,978 | | $ | 85,616 | | $ | 137,181 | | $ | 253,302 | | $ | 297,788 | | $ | 216,639 | | $ | 277,423 | | $ | 348,177 | | $ | 404,589 | | $ | 292,129 | | $ | 264,024 | |
| Average asset-backed securities issued | | | 11,684,412 | | | 12,969,801 | | | 14,663,134 | | | 16,941,243 | | | 19,542,413 | | | 22,067,276 | | | 23,324,111 | | | 22,956,247 | | | 21,606,164 | | | 13,094,871 | | | 21,630,747 | |
| Average total obligations | | | 12,332,390 | | | 13,055,417 | | | 14,800,315 | | | 17,194,545 | | | 19,840,201 | | | 22,283,915 | | | 23,601,534 | | | 23,304,424 | | | 22,010,753 | | | 13,387,000 | | | 21,894,771 | |
| Average other liabilities | | | 136,362 | | | 132,936 | | | 86,938 | | | 154,823 | | | 136,769 | | | 111,294 | | | 66,188 | | | 145,752 | | | 64,916 | | | 118,926 | | | 105,053 | |
| Average total liabilities | | | 12,468,752 | | | 13,188,353 | | | 14,887,253 | | | 17,349,368 | | | 19,976,970 | | | 22,395,209 | | | 23,667,722 | | | 23,450,176 | | | 22,075,669 | | | 13,505,926 | | | 21,999,824 | |
| | | | | | | | | | | | | | | | | | | | | | | | | | | | | | | | | | | |
| Average core equity | | | 932,030 | | | 898,409 | | | 877,212 | | | 880,329 | | | 880,482 | | | 840,098 | | | 794,866 | | | 776,833 | | | 695,488 | | | 902,752 | | | 838,824 | |
| Average balance sheet mark-to-market adjustments | | | 79,579 | | | 81,993 | | | 75,018 | | | 118,984 | | | 133,847 | | | 130,246 | | | 100,596 | | | 93,026 | | | 106,079 | | | 78,880 | | | 121,656 | |
| Average total equity | | | 1,011,609 | | | 980,402 | | | 952,230 | | | 999,313 | | | 1,014,329 | | | 970,344 | | | 895,462 | | | 869,859 | | | 801,567 | | | 981,632 | | | 960,480 | |
| Average total liabilities and equity | | $ | 13,480,361 | | $ | 14,168,755 | | $ | 15,839,483 | | $ | 18,348,681 | | $ | 20,991,299 | | $ | 23,365,553 | | $ | 24,563,184 | | $ | 24,320,035 | | $ | 22,877,236 | | $ | 14,487,558 | | $ | 22,960,304 | |
Table 10: Balances & Yields (all $ in thousands) | |
| | | | | | | | | | | | | | | | | | | | |
| | | | | At period end | | For period ended | |
| | | | | | | | | | | | | | | | | | | | |
| | | | | Current Face | | Unamortized Premium/ (Discount) | | Credit Protection | | UnrealizedGain / (Loss) | | Net Book Value | | Average Balance | | Interest Income | | Yield | |
| | | | | | | | | | | | | | | | | | | | |
Total Earning Assets (GAAP) | | | Q3: 2004 | | $ | 23,883,198 | | $ | 102,744 | | | ($356,371 | ) | $ | 90,818 | | $ | 23,720,389 | | $ | 22,460,501 | | $ | 182,358 | | | 3.25 | % |
| | | | Q4: 2004 | | | 24,794,021 | | | 104,063 | | | (420,757 | ) | | 95,396 | | | 24,572,723 | | | 23,889,816 | | | 205,469 | | | 3.44 | % |
| | | | 2004 | | | 24,794,021 | | | 101,480 | | | (418,174 | ) | | 95,396 | | | 24,572,723 | | | 21,208,757 | | | 651,618 | | | 3.07 | % |
| | | | Q1: 2005 | | | 24,301,644 | | | 122,952 | | | (487,952 | ) | | 102,711 | | | 24,039,355 | | | 24,042,562 | | | 237,922 | | | 3.96 | % |
| | | | Q2: 2005 | | | 22,414,482 | | | 103,779 | | | (522,490 | ) | | 133,210 | | | 22,128,981 | | | 22,606,036 | | | 248,505 | | | 4.40 | % |
| | | | Q3: 2005 | | | 19,625,979 | | | 94,058 | | | (551,562 | ) | | 98,874 | | | 19,267,349 | | | 20,085,393 | | | 244,631 | | | 4.87 | % |
| | | | Q4: 2005 | | | 16,986,581 | | | 13,376 | | | (527,213 | ) | | 56,542 | | | 16,529,286 | | | 17,542,352 | | | 231,082 | | | 5.27 | % |
| | | | 2005 | | | 16,986,581 | | | 13,376 | | | (527,213 | ) | | 56,542 | | | 16,529,286 | | | 21,048,582 | | | 962,140 | | | 4.57 | % |
| | | | Q1: 2006 | | | 15,168,319 | | | 12,215 | | | (572,066 | ) | | 50,480 | | | 14,658,948 | | | 15,229,791 | | | 225,882 | | | 5.93 | % |
| | | | Q2: 2006 | | | 13,865,565 | | | (18,160 | ) | | (645,303 | ) | | 56,652 | | | 13,258,755 | | | 13,581,710 | | | 218,238 | | | 6.43 | % |
| | | | Q3: 2006 | | | 13,553,988 | | | (72,430 | ) | | (670,246 | ) | | 88,943 | | | 12,900,255 | | | 12,860,487 | | | 223,649 | | | 6.96 | % |
| | | | | | | | | | | | | | | | | | | | | | | | | | | | | |
Residential Real Estate Loans | | | Q3: 2004 | | | 21,690,481 | | | 206,501 | | | (21,875 | ) | | - | | | 21,875,107 | | | 20,807,387 | | | 151,860 | | | 2.92 | % |
| | | | Q4: 2004 | | | 22,312,842 | | | 215,694 | | | (23,771 | ) | | - | | | 22,504,765 | | | 22,020,017 | | | 171,299 | | | 3.11 | % |
| | | | 2004 | | | 22,312,842 | | | 215,694 | | | (23,771 | ) | | - | | | 22,504,765 | | | 19,665,096 | | | 533,376 | | | 2.71 | % |
| | | | Q1: 2005 | | | 21,579,671 | | | 217,852 | | | (24,827 | ) | | - | | | 21,772,696 | | | 21,925,643 | | | 197,701 | | | 3.61 | % |
| | | | Q2: 2005 | | | 19,443,387 | | | 210,137 | | | (22,959 | ) | | - | | | 19,630,565 | | | 20,312,485 | | | 206,263 | | | 4.06 | % |
| | | | Q3: 2005 | | | 16,386,833 | | | 191,513 | | | (22,029 | ) | | - | | | 16,556,317 | | | 17,597,907 | | | 193,621 | | | 4.40 | % |
| | | | Q4: 2005 | | | 13,719,242 | | | 178,206 | | | (22,656 | ) | | - | | | 13,874,792 | | | 14,821,587 | | | 176,599 | | | 4.77 | % |
| | | | 2005 | | | 13,719,242 | | | 178,206 | | | (22,656 | ) | | - | | | 13,874,792 | | | 18,642,020 | | | 774,184 | | | 4.15 | % |
| | | | Q1: 2006 | | | 11,846,454 | | | 166,134 | | | (22,372 | ) | | - | | | 11,990,216 | | | 12,542,519 | | | 165,665 | | | 5.28 | % |
| | | | Q2: 2006 | | | 10,318,641 | | | 155,101 | | | (19,450 | ) | | - | | | 10,454,292 | | | 10,789,275 | | | 154,160 | | | 5.72 | % |
| | | | Q3: 2006 | | | 9,718,985 | | | 143,135 | | | (19,326 | ) | | - | | | 9,842,794 | | | 9,947,068 | | | 148,494 | | | 5.97 | % |
| | | | | | | | | | | | | | | | | | | | | | | | | | | | | |
Commercial Real Estate Loans | | | Q3: 2004 | | | 43,410 | | | (1,380 | ) | | (8,641 | ) | | - | | | 33,389 | | | 33,461 | | | 1,038 | | | 12.41 | % |
| | | | Q4: 2004 | | | 65,598 | | | (2,478 | ) | | (8,641 | ) | | - | | | 54,479 | | | 39,836 | | | 1,162 | | | 11.67 | % |
| | | | 2004 | | | 65,598 | | | (2,478 | ) | | (8,641 | ) | | - | | | 54,479 | | | 30,469 | | | 3,769 | | | 12.37 | % |
| | | | Q1: 2005 | | | 67,365 | | | (2,305 | ) | | (8,456 | ) | | - | | | 56,604 | | | 56,080 | | | 1,587 | | | 11.32 | % |
| | | | Q2: 2005 | | | 51,778 | | | (1,843 | ) | | (8,141 | ) | | - | | | 41,794 | | | 45,214 | | | 1,208 | | | 10.69 | % |
| | | | Q3: 2005 | | | 66,348 | | | (2,105 | ) | | (8,141 | ) | | - | | | 56,102 | | | 47,703 | | | 1,209 | | | 10.14 | % |
| | | | Q4: 2005 | | | 70,091 | | | (2,258 | ) | | (8,141 | ) | | - | | | 59,692 | | | 59,049 | | | 1,281 | | | 8.68 | % |
| | | | 2005 | | | 70,091 | | | (2,258 | ) | | (8,141 | ) | | - | | | 59,692 | | | 52,008 | | | 5,285 | | | 10.16 | % |
| | | | Q1: 2006 | | | 65,508 | | | (2,200 | ) | | (8,141 | ) | | - | | | 55,167 | | | 56,777 | | | 1,238 | | | 8.72 | % |
| | | | Q2: 2006 | | | 46,959 | | | (2,096 | ) | | (8,141 | ) | | - | | | 36,722 | | | 42,912 | | | 812 | | | 7.57 | % |
| | | | Q3: 2006 | | | 42,384 | | | (2,073 | ) | | (8,141 | ) | | - | | | 32,170 | | | 32,194 | | | 524 | | | 6.51 | % |
| | | | | | | | | | | | | | | | | | | | | | | | | | | | | |
Residential Credit Enhancement Securities | | | Q3: 2004 | | | 830,524 | | | (109,367 | ) | | (298,925 | ) | | 74,577 | | | 496,809 | | | 368,887 | | | 16,007 | | | 17.36 | % |
| | | | Q4: 2004 | | | 933,772 | | | (108,141 | ) | | (342,706 | ) | | 78,733 | | | 561,658 | | | 424,879 | | | 16,985 | | | 15.99 | % |
| | | | 2004 | | | 933,772 | | | (110,724 | ) | | (340,123 | ) | | 78,733 | | | 561,658 | | | 349,779 | | | 64,602 | | | 18.47 | % |
| | | | Q1: 2005 | | | 978,878 | | | (89,405 | ) | | (365,998 | ) | | 87,919 | | | 611,394 | | | 493,412 | | | 19,624 | | | 15.91 | % |
| | | | Q2: 2005 | | | 1,103,737 | | | (96,488 | ) | | (404,180 | ) | | 103,126 | | | 706,195 | | | 550,460 | | | 19,439 | | | 14.13 | % |
| | | | Q3: 2005 | | | 1,052,813 | | | (89,429 | ) | | (382,862 | ) | | 84,279 | | | 664,801 | | | 585,663 | | | 24,368 | | | 16.64 | % |
| | | | Q4: 2005 | | | 1,035,874 | | | (126,811 | ) | | (354,610 | ) | | 58,196 | | | 612,649 | | | 534,420 | | | 23,133 | | | 17.31 | % |
| | | | 2005 | | | 1,035,874 | | | (126,811 | ) | | (354,610 | ) | | 58,196 | | | 612,649 | | | 541,224 | | | 86,564 | | | 15.99 | % |
| | | | Q1: 2006 | | | 1,087,135 | | | (118,990 | ) | | (373,781 | ) | | 49,459 | | | 643,823 | | | 560,191 | | | 27,748 | | | 19.81 | % |
| | | | Q2: 2006 | | | 1,210,437 | | | (125,274 | ) | | (425,578 | ) | | 55,775 | | | 715,360 | | | 610,046 | | | 29,449 | | | 19.31 | % |
| | | | Q3: 2006 | | | 1,211,636 | | | (147,037 | ) | | (384,397 | ) | | 62,179 | | | 742,381 | | | 669,181 | | | 35,875 | | | 21.45 | % |
Table 10: Balances & Yields (all $ in thousands) | |
| | | | | | | | | | | | | | | | | | | | |
| | | | | At period end | | For period ended | |
| | | | | | | | | | | | | | | | | | | | |
| | | | | Current Face | | Unamortized Premium/ (Discount) | | Credit Protection | | UnrealizedGain / (Loss) | | Net Book Value | | Average Balance | | Interest Income | | Yield | |
| | | | | | | | | | | | | | | | | | | | |
Securities Portfolio | | | Q3: 2004 | | $ | 1,215,847 | | | ($1,466 | ) | $ | - | | $ | 15,555 | | $ | 1,229,936 | | $ | 1,141,456 | | $ | 12,932 | | | 4.53 | % |
| | | | Q4: 2004 | | | 1,378,924 | | | (13,895 | ) | | - | | | 15,048 | | | 1,380,077 | | | 1,267,692 | | | 15,282 | | | 4.82 | % |
| | | | 2004 | | | 1,378,924 | | | (13,895 | ) | | - | | | 15,048 | | | 1,380,077 | | | 1,062,901 | | | 48,274 | | | 4.54 | % |
| | | | Q1: 2005 | | | 1,522,345 | | | (28,534 | ) | | - | | | 11,566 | | | 1,505,377 | | | 1,423,487 | | | 18,074 | | | 5.08 | % |
| | | | Q2: 2005 | | | 1,656,177 | | | (32,874 | ) | | - | | | 25,535 | | | 1,648,838 | | | 1,548,085 | | | 19,910 | | | 5.14 | % |
| | | | Q3: 2005 | | | 1,818,295 | | | (47,048 | ) | | - | | | 12,182 | | | 1,783,429 | | | 1,687,506 | | | 23,990 | | | 5.69 | % |
| | | | Q4: 2005 | | | 1,810,146 | | | (55,235 | ) | | - | | | (6,330 | ) | | 1,748,581 | | | 1,743,808 | | | 26,316 | | | 6.04 | % |
| | | | 2005 | | | 1,810,146 | | | (55,235 | ) | | - | | | (6,330 | ) | | 1,748,581 | | | 1,601,837 | | | 88,290 | | | 5.51 | % |
| | | | Q1: 2006 | | | 1,885,075 | | | (60,429 | ) | | - | | | (7,018 | ) | | 1,817,628 | | | 1,769,502 | | | 27,765 | | | 6.28 | % |
| | | | Q2: 2006 | | | 1,960,878 | | | (80,256 | ) | | - | | | (10,621 | ) | | 1,870,001 | | | 1,827,690 | | | 29,298 | | | 6.41 | % |
| | | | Q3: 2006 | | | 2,145,996 | | | (102,080 | ) | | - | | | 9,327 | | | 2,053,243 | | | 1,940,042 | | | 34,747 | | | 7.16 | % |
| | | | | | | | | | | | | | | | | | | | | | | | | | | | | |
Commercial First-Loss Credit Enhancement Securities | | | Q3: 2004 | | | 26,930 | | | 8,456 | | | (26,930 | ) | | 686 | | | 9,142 | | | 7,372 | | | 346 | | | 18.77 | % |
| | | | Q4: 2004 | | | 45,639 | | | 12,883 | | | (45,639 | ) | | 1,615 | | | 14,498 | | | 10,836 | | | 233 | | | 8.60 | % |
| | | | 2004 | | | 45,639 | | | 12,883 | | | (45,639 | ) | | 1,615 | | | 14,498 | | | 5,261 | | | 675 | | | 12.83 | % |
| | | | Q1: 2005 | | | 88,671 | | | 25,344 | | | (88,671 | ) | | 3,226 | | | 28,570 | | | 19,255 | | | 356 | | | 7.40 | % |
| | | | Q2: 2005 | | | 87,210 | | | 24,847 | | | (87,210 | ) | | 4,549 | | | 29,396 | | | 25,085 | | | 881 | | | 14.05 | % |
| | | | Q3: 2005 | | | 138,530 | | | 41,127 | | | (138,530 | ) | | 2,413 | | | 43,540 | | | 32,192 | | | 453 | | | 5.63 | % |
| | | | Q4: 2005 | | | 175,343 | | | 19,474 | | | (141,806 | ) | | 4,676 | | | 57,687 | | | 44,109 | | | 923 | | | 8.37 | % |
| | | | 2005 | | | 175,343 | | | 19,474 | | | (141,806 | ) | | 4,676 | | | 57,687 | | | 30,234 | | | 2,613 | | | 8.64 | % |
| | | | Q1: 2006 | | | 198,681 | | | 27,700 | | | (167,772 | ) | | 8,039 | | | 66,648 | | | 56,800 | | | 989 | | | 5.34 | % |
| | | | Q2: 2006 | | | 222,160 | | | 34,365 | | | (192,134 | ) | | 11,498 | | | 75,889 | | | 65,190 | | | 1,648 | | | 10.11 | % |
| | | | Q3: 2006 | | | 322,061 | | | 35,625 | | | (258,382 | ) | | 17,437 | | | 116,741 | | | 88,681 | | | 2,137 | | | 9.64 | % |
| | | | | | | | | | | | | | | | | | | | | | | | | | | | | |
Cash & Equivalents | | | Q3: 2004 | | | 76,006 | | | - | | | - | | | - | | | 76,006 | | | 101,938 | | | 175 | | | | |
| | | | Q4: 2004 | | | 57,246 | | | - | | | - | | | - | | | 57,246 | | | 126,556 | | | 508 | | | | |
| | | | 2004 | | | 57,246 | | | - | | | - | | | - | | | 57,246 | | | 95,251 | | | 922 | | | | |
| | | | Q1: 2005 | | | 64,714 | | | - | | | - | | | - | | | 64,714 | | | 124,685 | | | 580 | | | | |
| | | | Q2: 2005 | | | 72,193 | | | - | | | - | | | - | | | 72,193 | | | 124,707 | | | 804 | | | | |
| | | | Q3: 2005 | | | 163,160 | | | - | | | - | | | - | | | 163,160 | | | 134,422 | | | 990 | | | | |
| | | | Q4: 2005 | | | 175,885 | | | - | | | - | | | - | | | 175,885 | | | 339,379 | | | 2,830 | | | | |
| | | | 2005 | | | 175,885 | | | - | | | - | | | - | | | 175,885 | | | 181,259 | | | 5,204 | | | | |
| | | | Q1: 2006 | | | 85,466 | | | - | | | - | | | - | | | 85,466 | | | 244,002 | | | 2,477 | | | | |
| | | | Q2: 2006 | | | 106,491 | | | - | | | - | | | - | | | 106,491 | | | 246,597 | | | 2,871 | | | | |
| | | | Q3: 2006 | | | 112,926 | | | | | | | | | | | | 112,926 | | | 183,323 | | | 1,872 | | | | |
Table 11: Portfolio Activity (in thousands) |
| | | | | Acquisitions | | Sales to Third Parties | | Principal Payments | | Discount / (Premium) Amortization | | Credit Provision | | Net Charge-offs / (Recoveries) | | Net Mark-to-Market Adjustment | | Net Increase / (Decrease) | |
| | | | | | | | | | | | | | | | | | | | |
Residential Real Estate Loans | | | Q3: 2004 | | $ | 2,898,165 | | | ($112,811 | ) | | ($1,152,610 | ) | $ | 1,006 | | | ($1,528 | ) | $ | - | | $ | 489 | | $ | 1,632,711 | |
| | | | Q4: 2004 | | | 1,791,951 | | | (865 | ) | | (1,152,597 | ) | | (6,935 | ) | | (1,697 | ) | | 176 | | | (375 | ) | | 629,658 | |
| | | | 2004 | | | 10,050,309 | | | (113,676 | ) | | (3,632,395 | ) | | (31,687 | ) | | (7,236 | ) | | 176 | | | 114 | | | 6,265,605 | |
| | | | Q1: 2005 | | | 832,383 | | | - | | | (1,555,752 | ) | | (7,644 | ) | | (1,210 | ) | | 154 | | | - | | | (732,069 | ) |
| | | | Q2: 2005 | | | 426,933 | | | (3,378 | ) | | (2,557,675 | ) | | (9,758 | ) | | 1,527 | | | (34 | ) | | 254 | | | (2,142,131 | ) |
| | | | Q3: 2005 | | | 332,049 | | | (263,079 | ) | | (3,129,492 | ) | | (14,438 | ) | | 805 | | | 125 | | | (218 | ) | | (3,074,248 | ) |
| | | | Q4: 2005 | | | 271,875 | | | (240,987 | ) | | (2,698,500 | ) | | (13,334 | ) | | (877 | ) | | 250 | | | 48 | | | (2,681,525 | ) |
| | | | 2005 | | | 1,863,240 | | | (507,444 | ) | | (9,941,419 | ) | | (45,174 | ) | | 245 | | | 495 | | | 84 | | | (8,629,973 | ) |
| | | | Q1: 2006 | | | 52,691 | | | - | | | (1,925,475 | ) | | (12,075 | ) | | (141 | ) | | 425 | | | - | | | (1,884,575 | ) |
| | | | Q2: 2006 | | | 272,627 | | | - | | | (1,799,401 | ) | | (12,073 | ) | | 2,507 | | | 415 | | | - | | | (1,535,925 | ) |
| | | | Q3: 2006 | | | 966,673 | | | - | | | (1,567,041 | ) | | (11,254 | ) | | (465 | ) | | 589 | | | - | | | (611,498 | ) |
| | | | | | | | | | | | | | | | | | | | | | | | | | | | | |
Commercial Real Estate Loans | | | Q3: 2004 | | | - | | | - | | | (29 | ) | | (128 | ) | | - | | | - | | | - | | | (157 | ) |
| | | | Q4: 2004 | | | 21,305 | | | - | | | (83 | ) | | (132 | ) | | - | | | - | | | - | | | 21,090 | |
| | | | 2004 | | | 38,371 | | | (2,339 | ) | | (3,390 | ) | | (484 | ) | | - | | | - | | | (98 | ) | | 32,060 | |
| | | | Q1: 2005 | | | 6,732 | | | - | | | (5,267 | ) | | (30 | ) | | 185 | | | - | | | 505 | | | 2,125 | |
| | | | Q2: 2005 | | | - | | | (11,192 | ) | | (3,769 | ) | | (99 | ) | | - | | | - | | | 250 | | | (14,810 | ) |
| | | | Q3: 2005 | | | 14,219 | | | (17 | ) | | 158 | | | (69 | ) | | - | | | - | | | 17 | | | 14,308 | |
| | | | Q4: 2005 | | | 4,248 | | | - | | | (506 | ) | | (152 | ) | | - | | | - | | | - | | | 3,590 | |
| | | | 2005 | | | 25,199 | | | (11,209 | ) | | (9,384 | ) | | (350 | ) | | 185 | | | - | | | 772 | | | 5,213 | |
| | | | Q1: 2006 | | | - | | | - | | | (4,583 | ) | | 93 | | | (35 | ) | | - | | | - | | | (4,525 | ) |
| | | | Q2: 2006 | | | - | | | (8,408 | ) | | (10,049 | ) | | 27 | | | - | | | - | | | (14 | ) | | (18,445 | ) |
| | | | Q3: 2006 | | | - | | | - | | | (4,574 | ) | | 22 | | | - | | | - | | | - | | | (4,552 | ) |
| | | | | | | | | | | | | | | | | | | | | | | | | | | | | |
Residential Credit Enhancement Securities | | | Q3: 2004 | | | 82,918 | | | - | | | (44,822 | ) | | 8,181 | | | - | | | - | | | 8,293 | | | 54,570 | |
| | | | Q4: 2004 | | | 72,976 | | | - | | | (30,900 | ) | | 8,443 | | | - | | | - | | | 14,330 | | | 64,849 | |
| | | | 2004 | | | 268,529 | | | (22,416 | ) | | (157,359 | ) | | 34,108 | | | - | | | - | | | 60,069 | | | 182,931 | |
| | | | Q1: 2005 | | | 67,809 | | | (27,293 | ) | | (23,932 | ) | | 8,727 | | | - | | | - | | | 24,425 | | | 49,736 | |
| | | | Q2: 2005 | | | 87,849 | | | - | | | (20,400 | ) | | 7,775 | | | - | | | - | | | 19,577 | | | 94,801 | |
| | | | Q3: 2005 | | | 57,481 | | | (98,775 | ) | | (18,403 | ) | | 11,193 | | | - | | | - | | | 7,110 | | | (41,394 | ) |
| | | | Q4: 2005 | | | 54,664 | | | (81,292 | ) | | (22,468 | ) | | 10,456 | | | - | | | - | | | (13,512 | ) | | (52,152 | ) |
| | | | 2005 | | | 267,803 | | | (207,360 | ) | | (85,203 | ) | | 38,151 | | | - | | | - | | | 37,600 | | | 50,991 | |
| | | | Q1: 2006 | | | 52,822 | | | (9,650 | ) | | (17,469 | ) | | 13,155 | | | - | | | - | | | (7,684 | ) | | 31,174 | |
| | | | Q2: 2006 | | | 89,217 | | | (10,317 | ) | | (28,102 | ) | | 12,410 | | | - | | | - | | | 8,329 | | | 71,537 | |
| | | | Q3: 2006 | | | 78,887 | | | (47,585 | ) | | (32,338 | ) | | 16,616 | | | - | | | - | | | 11,441 | | | 27,021 | |
Table 11: Portfolio Activity (in thousands) |
| | | | | Acquisitions | | Sales to Third Parties | | Principal Payments | | Discount / (Premium) Amortization | | Credit Provision | | Net Charge-offs / (Recoveries) | | Net Mark-to-Market Adjustment | | Net Increase / (Decrease) | |
| | | | | | | | | | | | | | | | | | | | |
Securities Portfolio | | | Q3: 2004 | | $ | 144,753 | | $ | - | | | ($18,489 | ) | | ($146 | ) | $ | - | | $ | - | | $ | 10,444 | | $ | 136,562 | |
| | | | Q4: 2004 | | | 176,341 | | | - | | | (25,189 | ) | | 39 | | | - | | | - | | | (1,050 | ) | | 150,141 | |
| | | | 2004 | | | 597,945 | | | (8,475 | ) | | (63,554 | ) | | (1,254 | ) | | - | | | - | | | 10,701 | | | 535,363 | |
| | | | Q1: 2005 | | | 168,337 | | | (12,362 | ) | | (27,070 | ) | | 115 | | | - | | | - | | | (3,720 | ) | | 125,300 | |
| | | | Q2: 2005 | | | 156,182 | | | (3,012 | ) | | (22,333 | ) | | 151 | | | - | | | - | | | 12,472 | | | 143,460 | |
| | | | Q3: 2005 | | | 190,160 | | | - | | | (41,833 | ) | | 566 | | | - | | | - | | | (14,302 | ) | | 134,591 | |
| | | | Q4: 2005 | | | 169,736 | | | (151,620 | ) | | (38,006 | ) | | 907 | | | - | | | - | | | (15,865 | ) | | (34,848 | ) |
| | | | 2005 | | | 684,415 | | | (166,994 | ) | | (129,242 | ) | | 1,739 | | | - | | | - | | | (21,415 | ) | | 368,503 | |
| | | | Q1: 2006 | | | 103,866 | | | (3,984 | ) | | (27,614 | ) | | 650 | | | - | | | - | | | (3,871 | ) | | 69,047 | |
| | | | Q2: 2006 | | | 235,881 | | | (152,481 | ) | | (28,618 | ) | | 1,471 | | | - | | | - | | | (3,880 | ) | | 52,373 | |
| | | | Q3: 2006 | | | 205,652 | | | (17,607 | ) | | (27,649 | ) | | 2,454 | | | - | | | - | | | 20,392 | | | 183,242 | |
| | | | | | | | | | | | | | | | | | | | | | | | | | | | | |
Commercial First Loss Credit-Enhancement Securities | | | Q3: 2004 | | | 6,311 | | | - | | | - | | | 60 | | | - | | | - | | | 677 | | | 7,048 | |
| | | | Q4: 2004 | | | 4,770 | | | - | | | - | | | (343 | ) | | - | | | - | | | 929 | | | 5,356 | |
| | | | 2004 | | | 11,081 | | | - | | | - | | | (283 | ) | | - | | | - | | | 1,606 | | | 12,404 | |
| | | | Q1: 2005 | | | 12,870 | | | - | | | - | | | (409 | ) | | - | | | - | | | 1,611 | | | 14,072 | |
| | | | Q2: 2005 | | | 0 | | | - | | | - | | | (346 | ) | | - | | | - | | | 1,173 | | | 827 | |
| | | | Q3: 2005 | | | 17,182 | | | - | | | - | | | (902 | ) | | - | | | - | | | (2,137 | ) | | 14,143 | |
| | | | Q4: 2005 | | | 13,028 | | | - | | | - | | | (904 | ) | | - | | | - | | | 2,023 | | | 14,147 | |
| | | | 2005 | | | 43,080 | | | - | | | - | | | (2,561 | ) | | - | | | - | | | 2,670 | | | 43,189 | |
| | | | Q1: 2006 | | | 6,911 | | | - | | | - | | | (1,276 | ) | | - | | | - | | | 3,326 | | | 8,961 | |
| | | | Q2: 2006 | | | 8,125 | | | - | | | - | | | (1,091 | ) | | - | | | - | | | 2,207 | | | 9,241 | |
| | | | Q3: 2006 | | | 36,858 | | | - | | | - | | | (1,670 | ) | | - | | | - | | | 5,664 | | | 40,852 | |
Table 12: Residential Loans Credit Performance (in thousands) |
| | | | | | | | | | | | | | | | | | | | | | | | | | |
| | | | | Underlying Loans | | Internally-Designated Credit Reserve | | External Credit Enhancement | | Total Credit Protection (1) | | Total Credit Protection as % of Loans | | Seriously Delinquent Loans | | Seriously Delinquent Loan % | | Total Credit Losses | | Losses To Securities Junior to Redwood's Interest | | Redwood's Share of Net Charge-offs/(Recoveries) | | Total Credit Losses As % of Loans (Annualized) | |
| | | | | | | | | | | | | | | | | | | | | | | | | | |
Total Managed | | | Q3: 2004 | | $ | 143,275,834 | | $ | 320,800 | | $ | 69,244 | | $ | 389,513 | | | 0.27 | % | $ | 185,023 | | | 0.13 | % | $ | 730 | | $ | 196 | | $ | 534 | | | <0.01 | % |
Residential | | | Q4: 2004 | | | 148,799,639 | | | 366,477 | | | 67,650 | | | 433,434 | | | 0.29 | % | | 163,554 | | | 0.11 | % | | 689 | | | - | | | 689 | | | <0.01 | % |
Portfolio | | | 2004 | | | 148,799,639 | | | 366,477 | | | 67,650 | | | 433,434 | | | 0.29 | % | | 163,554 | | | 0.11 | % | | 3,303 | | | 271 | | | 3,032 | | | <0.01 | % |
| | | | Q1: 2005 | | | 151,706,780 | | | 390,825 | | | 92,467 | | | 482,696 | | | 0.32 | % | | 217,159 | | | 0.14 | % | | 1,377 | | | - | | | 1,377 | | | <0.01 | % |
| | | | Q2: 2005 | | | 183,489,517 | | | 427,139 | | | 141,970 | | | 568,546 | | | 0.31 | % | | 245,399 | | | 0.13 | % | | 740 | | | 196 | | | 544 | | | <0.01 | % |
| | | | Q3: 2005 | | | 195,454,022 | | | 404,891 | | | 134,967 | | | 539,858 | | | 0.28 | % | | 282,850 | | | 0.14 | % | | 1,812 | | | 220 | | | 1,592 | | | <0.01 | % |
| | | Q4: 2005 | | | 183,904,883 | | | 377,266 | | | 140,907 | | | 518,173 | | | 0.28 | % | | 368,521 | | | 0.20 | % | | 1,175 | | | - | | | 1,175 | | | <0.01 | % |
| | | | 2005 | | | 183,904,883 | | | 377,266 | | | 140,907 | | | 518,173 | | | 0.28 | % | | 368,521 | | | 0.20 | % | | 5,104 | | | 416 | | | 4,688 | | | <0.01 | % |
| | | | Q1: 2006 | | | 192,545,691 | | | 396,153 | | | 128,015 | | | 524,168 | | | 0.27 | % | | 474,871 | | | 0.25 | % | | 3,002 | | | - | | | 3,002 | | | <0.01 | % |
| | | | Q2: 2006 | | | 223,006,911 | | | 445,028 | | | 127,372 | | | 572,399 | | | 0.26 | % | | 466,898 | | | 0.21 | % | | 1,464 | | | - | | | 1,464 | | | <0.01 | % |
| | | | Q3: 2006 | | | 234,492,256 | | | 403,723 | | | 216,076 | | | 619,799 | | | 0.26 | % | | 527,704 | | | 0.23 | % | | 2,748 | | | 155 | | | 2,593 | | | <0.01 | % |
| | | | | | | | | | | | | | | | | | | | | | | | | | | | | | | | | | | | | | |
Residential Real | | | Q3: 2004 | | | 21,690,481 | | | 21,875 | | | - | | | 21,344 | | | 0.10 | % | | 10,785 | | | 0.05 | % | | - | | | - | | | - | | | 0.00 | % |
Estate Loans | | | Q4: 2004 | | | 22,312,842 | | | 23,771 | | | - | | | 23,078 | | | 0.10 | % | | 13,338 | | | 0.06 | % | | 176 | | | - | | | 176 | | | <0.01 | % |
| | | | 2004 | | | 22,312,842 | | | 23,771 | | | - | | | 23,078 | | | 0.10 | % | | 13,338 | | | 0.06 | % | | 176 | | | - | | | 176 | | | <0.01 | % |
| | | | Q1: 2005 | | | 21,579,671 | | | 24,827 | | | - | | | 24,231 | | | 0.11 | % | | 16,066 | | | 0.07 | % | | 154 | | | - | | | 154 | | | <0.01 | % |
| | | Q2: 2005 | | | 19,443,387 | | | 22,959 | | | - | | | 22,396 | | | 0.12 | % | | 16,514 | | | 0.08 | % | | (34 | ) | | - | | | (34 | ) | | 0.00 | % |
| | | | Q3: 2005 | | | 16,386,833 | | | 22,029 | | | - | | | 22,029 | | | 0.13 | % | | 22,956 | | | 0.14 | % | | 90 | | | - | | | 90 | | | <0.01 | % |
| | | Q4: 2005 | | | 13,719,242 | | | 22,656 | | | - | | | 22,656 | | | 0.17 | % | | 37,335 | | | 0.27 | % | | 251 | | | - | | | 251 | | | <0.01 | % |
| | | 2005 | | | 13,719,242 | | | 22,656 | | | - | | | 22,656 | | | 0.17 | % | | 37,335 | | | 0.27 | % | | 461 | | | - | | | 461 | | | <0.01 | % |
| | | | Q1: 2006 | | | 11,846,454 | | | 22,372 | | | - | | | 22,372 | | | 0.19 | % | | 48,677 | | | 0.41 | % | | 425 | | | - | | | 425 | | | <0.01 | % |
| | | | Q2: 2006 | | | 10,318,641 | | | 19,450 | | | - | | | 19,450 | | | 0.19 | % | | 47,162 | | | 0.46 | % | | 423 | | | - | | | 423 | | | <0.01 | % |
| | | | Q3: 2006 | | | 9,718,985 | | | 19,326 | | | - | | | 19,326 | | | 0.20 | % | | 61,447 | | | 0.63 | % | | 589 | | | - | | | 589 | | | <0.01 | % |
| | | | | | | | | | | | | | | | | | | | | | | | | | | | | | | | | | | | | | |
Residential Credit Enhancement Securities | | | Q3: 2004 | | | 121,585,353 | | | 298,925 | | | 69,244 | | | 368,169 | | | 0.30 | % | | 174,238 | | | 0.14 | % | | 730 | | | 196 | | | 534 | | | <0.01 | % |
| | | Q4: 2004 | | | 126,486,797 | | | 342,706 | | | 67,650 | | | 410,356 | | | 0.32 | % | | 150,216 | | | 0.12 | % | | 513 | | | - | | | 513 | | | <0.01 | % |
| | | | 2004 | | | 126,486,797 | | | 342,706 | | | 67,650 | | | 410,356 | | | 0.32 | % | | 150,216 | | | 0.12 | % | | 3,127 | | | 271 | | | 2,856 | | | <0.01 | % |
| | | | Q1: 2005 | | | 130,127,109 | | | 365,998 | | | 92,467 | | | 458,465 | | | 0.35 | % | | 201,093 | | | 0.15 | % | | 1,223 | | | - | | | 1,223 | | | <0.01 | % |
| | | | Q2: 2005 | | | 164,046,130 | | | 404,180 | | | 141,970 | | | 546,150 | | | 0.33 | % | | 228,885 | | | 0.14 | % | | 774 | | | 196 | | | 578 | | | <0.01 | % |
| | | | Q3: 2005 | | | 179,067,189 | | | 382,862 | | | 134,967 | | | 517,829 | | | 0.29 | % | | 259,894 | | | 0.15 | % | | 1,722 | | | 220 | | | 1,502 | | | <0.01 | % |
| | | Q4: 2005 | | | 170,185,641 | | | 354,610 | | | 140,907 | | | 495,517 | | | 0.29 | % | | 331,186 | | | 0.19 | % | | 924 | | | - | | | 924 | | | <0.01 | % |
| | | | 2005 | | | 170,185,641 | | | 354,610 | | | 140,907 | | | 495,517 | | | 0.29 | % | | 331,186 | | | 0.19 | % | | 4,643 | | | 416 | | | 4,227 | | | <0.01 | % |
| | | | Q1: 2006 | | | 180,699,237 | | | 373,781 | | | 128,015 | | | 501,796 | | | 0.28 | % | | 426,194 | | | 0.24 | % | | 2,577 | | | - | | | 2,577 | | | <0.01 | % |
| | | | Q2: 2006 | | | 212,688,271 | | | 425,578 | | | 127,372 | | | 552,949 | | | 0.26 | % | | 419,736 | | | 0.20 | % | | 1,041 | | | - | | | 1,041 | | | <0.01 | % |
| | | | Q3: 2006 | | | 224,773,271 | | | 384,397 | | | 216,076 | | | 600,473 | | | 0.27 | % | | 466,257 | | | 0.21 | % | | 2,159 | | | 155 | | | 2,004 | | | <0.01 | % |
| | | | (1) The credit reserve on residential real estate loans owned is only available to absorb losses on the residential real estate loan portfolio. The internally-designated credit reserves on loans credit enhanced and the external credit enhancement on loans credit enhanced are only available to absorb losses on the residential credit-enhancement portfolio. | | |
Table 13: Residential Real Estate Loans & Credit Enhancement Securities Characteristics (all $ in thousands) |
| | | | | | | | | | | | | | | | | | | | |
| | Sep. 2006 | | Jun. 2006 | | Mar. 2006 | | Dec. 2005 | | Sept. 2005 | | Jun. 2005 | | Mar. 2005 | | Dec. 2004 | | Sep. 2004 | |
| Residential Loans Managed | | $ | 234,492,256 | | $ | 223,006,911 | | $ | 192,545,691 | | $ | 183,904,883 | | $ | 195,454,022 | | $ | 183,489,517 | | $ | 151,706,780 | | $ | 148,799,639 | | $ | 142,275,834 | |
| Number of loans | | | 673,062 | | | 629,963 | | | 552,368 | | | 542,858 | | | 576,246 | | | 549,889 | | | 406,718 | | | 396,136 | | | 340,747 | |
| Average loan size | | $ | 348 | | $ | 354 | | $ | 349 | | $ | 339 | | $ | 339 | | $ | 334 | | $ | 373 | | $ | 376 | | $ | 418 | |
| | | | | | | | | | | | | | | | | | | | | | | | | | | | | |
| Adjustable % | | | 6 | % | | 8 | % | | 11 | % | | 13 | % | | 15 | % | | 17 | % | | 22 | % | | 22 | % | | 22 | % |
| Negatively Amortizing % | | | 23 | % | | 23 | % | | 22 | % | | 22 | % | | 17 | % | | 16 | % | | 15 | % | | 14 | % | | 12 | % |
| Hybrid % | | | 39 | % | | 36 | % | | 33 | % | | 30 | % | | 29 | % | | 26 | % | | 24 | % | | 24 | % | | 25 | % |
| Fixed % | | | 32 | % | | 33 | % | | 34 | % | | 36 | % | | 39 | % | | 40 | % | | 39 | % | | 39 | % | | 42 | % |
| | | | | | | | | | | | | | | | | | | | | | | | | | | | | |
| Interest Only % | | | 29 | % | | 28 | % | | 26 | % | | 30 | % | | 30 | % | | 31 | % | | 35 | % | | 35 | % | | 35 | % |
| | | | | | | | | | | | | | | | | | | | | | | | | | | | | |
| Southern California | | | 25 | % | | 25 | % | | 24 | % | | 24 | % | | 23 | % | | 23 | % | | 21 | % | | 21 | % | | 22 | % |
| Northern California | | | 22 | % | | 22 | % | | 22 | % | | 20 | % | | 19 | % | | 19 | % | | 19 | % | | 18 | % | | 20 | % |
| Florida | | | 6 | % | | 6 | % | | 6 | % | | 6 | % | | 6 | % | | 6 | % | | 6 | % | | 7 | % | | 6 | % |
| New York | | | 5 | % | | 5 | % | | 5 | % | | 5 | % | | 5 | % | | 5 | % | | 5 | % | | 5 | % | | 5 | % |
| Virginia | | | 4 | % | | 4 | % | | 4 | % | | 4 | % | | 4 | % | | 4 | % | | 4 | % | | 4 | % | | 4 | % |
| New Jersey | | | 3 | % | | 3 | % | | 3 | % | | 3 | % | | 4 | % | | 4 | % | | 4 | % | | 4 | % | | 4 | % |
| Texas | | | 3 | % | | 3 | % | | 3 | % | | 3 | % | | 3 | % | | 3 | % | | 3 | % | | 3 | % | | 3 | % |
| Illinois | | | 3 | % | | 3 | % | | 3 | % | | 3 | % | | 3 | % | | 3 | % | | 3 | % | | 3 | % | | 3 | % |
| Other states (none greater than 3%) | | | 30 | % | | 30 | % | | 29 | % | | 31 | % | | 33 | % | | 34 | % | | 35 | % | | 36 | % | | 34 | % |
| | | | | | | | | | | | | | | | | | | | | | | | | | | | | |
| Year 2006 origination | | | 15 | % | | 9 | % | | 1 | % | | 0 | % | | 0 | % | | 0 | % | | 0 | % | | 0 | % | | 0 | % |
| Year 2005 origination | | | 28 | % | | 27 | % | | 27 | % | | 23 | % | | 14 | % | | 13 | % | | 6 | % | | 0 | % | | 0 | % |
| Year 2004 origination | | | 23 | % | | 26 | % | | 29 | % | | 35 | % | | 41 | % | | 49 | % | | 52 | % | | 52 | % | | 48 | % |
| Year 2003 origination | | | 24 | % | | 27 | % | | 31 | % | | 33 | % | | 35 | % | | 28 | % | | 31 | % | | 33 | % | | 37 | % |
| Year 2002 origination | | | 5 | % | | 6 | % | | 7 | % | | 7 | % | | 7 | % | | 6 | % | | 7 | % | | 8 | % | | 9 | % |
| Year 2001 origination or earlier | | | 5 | % | | 5 | % | | 5 | % | | 3 | % | | 3 | % | | 4 | % | | 5 | % | | 6 | % | | 6 | % |
Table 13: Residential Real Estate Loans & Credit Enhancement Securities Characteristics (all $ in thousands) |
| | | | | | | | | | | | | | | | | | | | |
| | Sep. 2006 | | Jun. 2006 | | Mar. 2006 | | Dec. 2005 | | Sept. 2005 | | Jun. 2005 | | Mar. 2005 | | Dec. 2004 | | Sep. 2004 | |
| Wtg Avg Original LTV | | | 69 | % | | 68 | % | | 68 | % | | 68 | % | | 68 | % | | 68 | % | | 68 | % | | 68 | % | | 68 | % |
| Original LTV: 0% - 20% | | | 1 | % | | 1 | % | | 1 | % | | 1 | % | | 1 | % | | 0 | % | | 0 | % | | 0 | % | | 0 | % |
| Original LTV: 20% - 30% | | | 2 | % | | 2 | % | | 2 | % | | 2 | % | | 2 | % | | 2 | % | | 2 | % | | 2 | % | | 2 | % |
| Original LTV: 30% - 40% | | | 3 | % | | 3 | % | | 3 | % | | 3 | % | | 3 | % | | 3 | % | | 3 | % | | 3 | % | | 3 | % |
| Original LTV: 40% - 50% | | | 7 | % | | 7 | % | | 7 | % | | 8 | % | | 8 | % | | 8 | % | | 8 | % | | 8 | % | | 8 | % |
| Original LTV: 50% - 60% | | | 11 | % | | 12 | % | | 12 | % | | 12 | % | | 12 | % | | 12 | % | | 12 | % | | 12 | % | | 13 | % |
| Original LTV: 60% - 70% | | | 21 | % | | 22 | % | | 22 | % | | 22 | % | | 22 | % | | 23 | % | | 23 | % | | 23 | % | | 23 | % |
| Original LTV: 70% - 75% | | | 15 | % | | 15 | % | | 15 | % | | 15 | % | | 15 | % | | 15 | % | | 15 | % | | 15 | % | | 15 | % |
| Original LTV: 75% - 80% | | | 36 | % | | 34 | % | | 33 | % | | 34 | % | | 34 | % | | 33 | % | | 33 | % | | 33 | % | | 33 | % |
| Original LTV: 80% - 90% | | | 3 | % | | 3 | % | | 3 | % | | 2 | % | | 2 | % | | 3 | % | | 3 | % | | 3 | % | | 2 | % |
| Original LTV: 90% - 100% | | | 2 | % | | 1 | % | | 2 | % | | 1 | % | | 1 | % | | 2 | % | | 2 | % | | 2 | % | | 2 | % |
| | | | | | | | | | | | | | | | | | | | | | | | | | | | | |
| Wtg Avg FICO | | | 731 | | | 730 | | | 730 | | | 731 | | | 731 | | | 731 | | | 731 | | | 731 | | | 730 | |
| FICO: <= 600 | | | 1 | % | | 1 | % | | 1 | % | | 0 | % | | 0 | % | | 0 | % | | 0 | % | | 0 | % | | 0 | % |
| FICO: 601 -620 | | | 1 | % | | 1 | % | | 1 | % | | 1 | % | | 0 | % | | 0 | % | | 0 | % | | 0 | % | | 0 | % |
| FICO: 621 - 640 | | | 2 | % | | 2 | % | | 2 | % | | 2 | % | | 2 | % | | 2 | % | | 2 | % | | 2 | % | | 2 | % |
| FICO: 641 -660 | | | 4 | % | | 4 | % | | 4 | % | | 4 | % | | 4 | % | | 4 | % | | 4 | % | | 4 | % | | 4 | % |
| FICO: 661 - 680 | | | 7 | % | | 7 | % | | 7 | % | | 7 | % | | 7 | % | | 7 | % | | 7 | % | | 7 | % | | 7 | % |
| FICO: 681 - 700 | | | 11 | % | | 11 | % | | 11 | % | | 11 | % | | 11 | % | | 11 | % | | 11 | % | | 11 | % | | 11 | % |
| FICO: 701 - 720 | | | 13 | % | | 13 | % | | 13 | % | | 13 | % | | 13 | % | | 13 | % | | 13 | % | | 13 | % | | 13 | % |
| FICO: 721 - 740 | | | 13 | % | | 13 | % | | 14 | % | | 13 | % | | 14 | % | | 14 | % | | 14 | % | | 14 | % | | 14 | % |
| FICO: 741 - 760 | | | 14 | % | | 15 | % | | 15 | % | | 15 | % | | 15 | % | | 15 | % | | 16 | % | | 16 | % | | 16 | % |
| FICO: 761 - 780 | | | 16 | % | | 16 | % | | 16 | % | | 17 | % | | 17 | % | | 17 | % | | 17 | % | | 17 | % | | 18 | % |
| FICO: 781 - 800 | | | 12 | % | | 12 | % | | 12 | % | | 12 | % | | 12 | % | | 12 | % | | 11 | % | | 11 | % | | 11 | % |
| FICO: >= 801 | | | 4 | % | | 3 | % | | 3 | % | | 3 | % | | 3 | % | | 3 | % | | 2 | % | | 2 | % | | 2 | % |
| Unknown | | | 2 | % | | 3 | % | | 3 | % | | 2 | % | | 2 | % | | 1 | % | | 2 | % | | 2 | % | | 2 | % |
| | | | | | | | | | | | | | | | | | | | | | | | | | | | | |
| Conforming at Origination % | | | 37 | % | | 35 | % | | 26 | % | | 26 | % | | 24 | % | | 24 | % | | 22 | % | | 20 | % | | 18 | % |
| % balance in loans > $1mm per loan | | | 9 | % | | 9 | % | | 8 | % | | 8 | % | | 7 | % | | 7 | % | | 7 | % | | 6 | % | | 7 | % |
| | | | | | | | | | | | | | | | | | | | | | | | | | | | | |
| 2nd Home % | | | 6 | % | | 6 | % | | 6 | % | | 6 | % | | 6 | % | | 6 | % | | 6 | % | | 6 | % | | 6 | % |
| Investment Home % | | | 3 | % | | 3 | % | | 3 | % | | 3 | % | | 2 | % | | 3 | % | | 2 | % | | 2 | % | | 2 | % |
| | | | | | | | | | | | | | | | | | | | | | | | | | | | | |
| Purchase | | | 40 | % | | 39 | % | | 36 | % | | 36 | % | | 36 | % | | 35 | % | | 35 | % | | 34 | % | | 33 | % |
| Cash Out Refi | | | 30 | % | | 30 | % | | 29 | % | | 30 | % | | 28 | % | | 27 | % | | 27 | % | | 27 | % | | 25 | % |
| Rate-Term Refi | | | 30 | % | | 31 | % | | 34 | % | | 34 | % | | 36 | % | | 37 | % | | 37 | % | | 38 | % | | 42 | % |
| Construction | | | 0 | % | | 0 | % | | 0 | % | | 0 | % | | 0 | % | | 0 | % | | 0 | % | | 0 | % | | 0 | % |
| Other | | | 0 | % | | 0 | % | | 0 | % | | 0 | % | | 0 | % | | 1 | % | | 0 | % | | 0 | % | | 0 | % |
| | | | | | | | | | | | | | | | | | | | | | | | | | | | | |
| This table includes residential real estate loans and these are primarily the loans securitized by Sequoia securitization entities sponsored by Redwood as well as loans underlying residential credit-enhancement securities by Redwood. |
Table 14: Commercial Real Estate Loans - Characteristics (all $ in thousands) |
| | | | | | | | | | | | | | | | | | | | |
| | Q3:2006 | | Q2:2006 | | Q1:2006 | | Q4:2005 | | Q3:2005 | | Q2:2005 | | Q1:2005 | | Q4:2004 | | Q3:2004 | |
| Commercial mortgage loans | | $ | 32,170 | | $ | 36,722 | | $ | 55,167 | | $ | 59,692 | | $ | 56,102 | | $ | 41,794 | | $ | 56,604 | | $ | 54,479 | | $ | 33,389 | |
| Number of loans | | | 8 | | | 9 | | | 12 | | | 13 | | | 12 | | | 9 | | | 12 | | | 9 | | | 7 | |
| Average loan size | | $ | 4,021 | | $ | 4,080 | | $ | 4,597 | | $ | 4,592 | | $ | 4,675 | | $ | 4,644 | | $ | 4,717 | | $ | 6,053 | | $ | 4,770 | |
| Seriously delinquent loans | | | - | | | - | | | - | | | - | | | - | | | - | | | - | | | - | | | - | |
| Realized credit losses | | | - | | | - | | | - | | | - | | | - | | | - | | | - | | | - | | | - | |
| California % | | | 7 | % | | 6 | % | | 19 | % | | 25 | % | | 28 | % | | 37 | % | | 42 | % | | 44 | % | | 72 | % |
Table 15: Commercial Real Estate Loans Credit Performance (all $ in thousands) |
| | | | | | | | | | | | | | | | | | | | | | | | | | |
| | | | | Underlying Loans | | Internally-Designated Credit Reserve | | External Credit Enhancement | | Total Credit Protection (1) | | Total Credit Protection as % of Loans | | Seriously Delinquent Loans | | Seriously Delinquent Loan % | | Total Credit Losses | | Third Parties' Share of Net Charge-offs/ (Recoveries) | | Redwood's Share of Net Charge-offs/ (Recoveries) | | Total Credit Losses As % of Loans (Annualized) | |
| | | | | | | | | | | | | | | | | | | | | | | | | | |
Total Managed Commercial Portfolio | | | Q3: 2004 | | $ | 1,363,341 | | $ | 16,816 | | $ | - | | $ | 16,816 | | | 1.23 | % | $ | - | | | 0.00 | % | $ | - | | $ | - | | $ | - | | | 0.00 | % |
| | | | Q4: 2004 | | | 5,925,183 | | | 35,525 | | | - | | | 35,525 | | | 0.60 | % | | - | | | 0.00 | % | | 176 | | | - | | | 176 | | | 0.01 | % |
| | | | 2004 | | | 5,925,183 | | | 35,525 | | | - | | | 35,525 | | | 0.60 | % | | - | | | 1.39 | % | | 176 | | | - | | | 176 | | | 0.00 | % |
| | | Q1: 2005 | | | 11,565,506 | | | 78,372 | | | - | | | 78,372 | | | 0.68 | % | | 4,937 | | | 0.04 | % | | 315 | | | - | | | 315 | | | 0.01 | % |
| | | | Q2: 2005 | | | 12,544,115 | | | 78,057 | | | - | | | 78,057 | | | 0.62 | % | | - | | | 0.00 | % | | - | | | - | | | - | | | 0.00 | % |
| | | | Q3: 2005 | | | 20,973,246 | | | 129,381 | | | - | | | 129,381 | | | 0.62 | % | | 13,109 | | | 0.06 | % | | - | | | - | | | - | | | 0.00 | % |
| | | | Q4: 2005 | | | 25,951,655 | | | 136,407 | | | - | | | 136,407 | | | 0.53 | % | | 17,342 | | | 0.07 | % | | - | | | - | | | - | | | 0.00 | % |
| | | 2005 | | | 25,951,655 | | | 136,407 | | | - | | | 136,407 | | | 0.53 | % | | 17,342 | | | 0.07 | % | | 315 | | | - | | | 315 | | | 0.00 | % |
| | | Q1: 2006 | | | 28,065,048 | | | 162,373 | | | - | | | 162,373 | | | 0.58 | % | | 22,606 | | | 0.08 | % | | 35 | | | - | | | 35 | | | 0.00 | % |
| | | Q2: 2006 | | | 28,923,299 | | | 186,735 | | | - | | | 186,735 | | | 0.65 | % | | 23,521 | | | 0.08 | % | | - | | | - | | | - | | | 0.00 | % |
| | | Q3: 2006 | | | 35,993,610 | | | 266,523 | | | - | | | 266,523 | | | 0.74 | % | | 54,972 | | | 0.15 | % | | 1,044 | | | 582 | | | 462 | | | 0.01 | % |
| | | | | | | | | | | | | | | | | | | | | | | | | | | | | | | | | | | | | | |
Commercial Real Estate Loans | | | Q3: 2004 | | | 43,410 | | | 8,641 | | | - | | | 8,641 | | | 19.91 | % | | - | | | 0.00 | % | | - | | | - | | | - | | | 0.00 | % |
| | | | Q4: 2004 | | | 65,598 | | | 8,641 | | | - | | | 8,641 | | | 13.17 | % | | - | | | 0.00 | % | | 176 | | | - | | | 176 | | | 1.07 | % |
| | | 2004 | | | 65,598 | | | 8,641 | | | - | | | 8,641 | | | 13.17 | % | | - | | | 0.00 | % | | 176 | | | - | | | 176 | | | 0.27 | % |
| | | Q1: 2005 | | | 67,365 | | | 8,456 | | | - | | | 8,456 | | | 12.55 | % | | - | | | 0.00 | % | | 315 | | | - | | | 315 | | | 1.87 | % |
| | | | Q2: 2005 | | | 51,778 | | | 8,141 | | | - | | | 8,141 | | | 15.72 | % | | - | | | 0.00 | % | | - | | | - | | | - | | | 0.00 | % |
| | | Q3: 2005 | | | 66,348 | | | 8,141 | | | - | | | 8,141 | | | 12.27 | % | | - | | | 0.00 | % | | - | | | - | | | - | | | 0.00 | % |
| | | Q4: 2005 | | | 70,091 | | | 8,141 | | | - | | | 8,141 | | | 11.61 | % | | - | | | 0.00 | % | | - | | | - | | | - | | | 0.00 | % |
| | | 2005 | | | 70,091 | | | 8,141 | | | - | | | 8,141 | | | 11.61 | % | | - | | | 0.00 | % | | 315 | | | - | | | 315 | | | 0.45 | % |
| | | Q1: 2006 | | | 65,508 | | | 8,141 | | | - | | | 8,141 | | | 12.43 | % | | - | | | 0.00 | % | | 35 | | | - | | | 35 | | | 0.21 | % |
| | | Q2: 2006 | | | 46,959 | | | 8,141 | | | - | | | 8,141 | | | 17.34 | % | | - | | | 0.00 | % | | - | | | - | | | - | | | 0.00 | % |
| | | Q3: 2006 | | | 42,384 | | | 8,141 | | | - | | | 8,141 | | | 19.21 | % | | - | | | 0.00 | % | | - | | | - | | | - | | | 0.00 | % |
| | | | | | | | | | | | | | | | | | | | | | | | | | | | | | | | | | | | | | |
Commercial First-Loss Credit Enhancement Securities | | | Q3: 2004 | | | 1,319,931 | | | 8,175 | | | - | | | 8,175 | | | 0.62 | % | | - | | | 0.00 | % | | - | | | - | | | - | | | 0.00 | % |
| | | Q4: 2004 | | | 5,859,585 | | | 26,884 | | | - | | | 26,884 | | | 0.46 | % | | - | | | 0.00 | % | | - | | | - | | | - | | | 0.00 | % |
| | | 2004 | | | 5,859,585 | | | 26,884 | | | - | | | 26,884 | | | 0.46 | % | | - | | | 0.00 | % | | - | | | - | | | - | | | 0.00 | % |
| | | Q1: 2005 | | | 11,498,141 | | | 69,916 | | | - | | | 69,916 | | | 0.61 | % | | 4,937 | | | 0.04 | % | | - | | | - | | | - | | | 0.00 | % |
| | | Q2: 2005 | | | 12,492,337 | | | 69,916 | | | - | | | 69,916 | | | 0.56 | % | | - | | | 0.00 | % | | - | | | - | | | - | | | 0.00 | % |
| | | | Q3: 2005 | | | 20,906,898 | | | 121,240 | | | - | | | 121,240 | | | 0.58 | % | | 13,109 | | | 0.06 | % | | - | | | - | | | - | | | 0.00 | % |
| | | Q4: 2005 | | | 25,881,564 | | | 128,266 | | | - | | | 128,266 | | | 0.50 | % | | 17,342 | | | 0.07 | % | | - | | | - | | | - | | | 0.00 | % |
| | | 2005 | | | 25,881,564 | | | 128,266 | | | - | | | 128,266 | | | 0.50 | % | | 17,342 | | | 0.07 | % | | - | | | - | | | - | | | 0.00 | % |
| | | Q1: 2006 | | | 27,999,540 | | | 154,232 | | | - | | | 154,232 | | | 0.55 | % | | 22,606 | | | 0.08 | % | | - | | | - | | | - | | | 0.00 | % |
| | | Q2: 2006 | | | 28,876,341 | | | 178,594 | | | - | | | 178,594 | | | 0.62 | % | | 23,521 | | | 0.08 | % | | - | | | - | | | - | | | 0.00 | % |
| | | Q3: 2006 | | | 35,951,226 | | | 258,382 | | | - | | | 258,382 | | | 0.72 | % | | 54,972 | | | 0.15 | % | | 1,044 | | | 582 | | | 462 | | | 0.01 | % |
(1) The credit reserve on commercial real estate loans owned is only available to absorb losses on the commercial real estate loan portfolio. The internally-designated credit reserves on commercial first-loss credit enhancement securities is only available to absorb losses on the commercial first-loss credit enhancement portfolio. |
| |
Table 16: Commercial Loans and First-Loss Credit Enhancement Securities - Characteristics (all $ in thousands) |
| | | | | | | | | | | | | | | | | | | | |
| | | Sep. 2006 | | Jun. 2006 | | Mar. 2006 | | Dec. 2005 | | Sep. 2005 | | Jun. 2005 | | Mar. 2005 | | Dec. 2004 | | Sep. 2004 | |
Underlying Commercial Real Estate Loans | | $ | 35,993,610 | | $ | 28,923,299 | | $ | 28,065,048 | | $ | 25,951,655 | | $ | 20,973,246 | | $ | 12,544,115 | | $ | 11,565,506 | | $ | 5,925,183 | | $ | 1,363,341 | |
| Number of credit-enhanced loans | | | 2,329 | | | 2,097 | | | 1,977 | | | 1,857 | | | 1,428 | | | 801 | | | 717 | | | 392 | | | 93 | |
| Average loan size | | $ | 15,455 | | $ | 13,793 | | $ | 14,196 | | $ | 13,975 | | $ | 14,687 | | $ | 15,661 | | $ | 16,130 | | $ | 15,115 | | $ | 14,660 | |
| | | | | | | | | | | | | | | | | | | | | | | | | | | | | |
| | | | | | | | | | | | | | | | | | | | | | | | | | | | | |
State Distribution | | | | | | | | | | | | | | | | | | | | | | | | | | | | |
| CA | | | 16 | % | | 16 | % | | 17 | % | | 16 | % | | 17 | % | | 17 | % | | 17 | % | | 18 | % | | 18 | % |
| NY | | | 14 | % | | 14 | % | | 14 | % | | 14 | % | | 14 | % | | 15 | % | | 14 | % | | 10 | % | | 0 | % |
| TX | | | 9 | % | | 8 | % | | 8 | % | | 8 | % | | 8 | % | | 10 | % | | 9 | % | | 8 | % | | 6 | % |
| FL | | | 7 | % | | 7 | % | | 7 | % | | 7 | % | | 3 | % | | 2 | % | | 2 | % | | 2 | % | | 5 | % |
| VA | | | 5 | % | | 4 | % | | 5 | % | | 5 | % | | 4 | % | | 1 | % | | 1 | % | | 2 | % | | 6 | % |
| Other | | | 49 | % | | 51 | % | | 49 | % | | 50 | % | | 54 | % | | 55 | % | | 57 | % | | 60 | % | | 65 | % |
| | | | | | | | | | | | | | | | | | | | | | | | | | | | | |
Property Type Distribution | | | | | | | | | | | | | | | | | | | | | | | | | | | | |
| Office | | | 40 | % | | 37 | % | | 37 | % | | 37 | % | | 40 | % | | 45 | % | | 44 | % | | 42 | % | | 28 | % |
| Retail | | | 31 | % | | 30 | % | | 30 | % | | 31 | % | | 32 | % | | 34 | % | | 33 | % | | 31 | % | | 41 | % |
| Multi-Family | | | 9 | % | | 13 | % | | 15 | % | | 13 | % | | 11 | % | | 9 | % | | 10 | % | | 12 | % | | 11 | % |
| Hospitality | | | 8 | % | | 7 | % | | 7 | % | | 7 | % | | 6 | % | | 6 | % | | 8 | % | | 6 | % | | 4 | % |
| Self-Storage | | | 3 | % | | 4 | % | | 4 | % | | 4 | % | | 3 | % | | 2 | % | | 2 | % | | 2 | % | | 3 | % |
| Industrial | | | 3 | % | | 2 | % | | 3 | % | | 2 | % | | 3 | % | | 2 | % | | 1 | % | | 2 | % | | 4 | % |
| Other | | | 6 | % | | 6 | % | | 4 | % | | 6 | % | | 5 | % | | 2 | % | | 3 | % | | 4 | % | | 10 | % |
| | | | | | | | | | | | | | | | | | | | | | | | | | | | | |
Weighted Average Current LTV | | | 69 | % | | 69 | % | | 69 | % | | 68 | % | | 69 | % | | 67 | % | | 68 | % | | 67 | % | | 68 | % |
| | | | | | | | | | | | | | | | | | | | | | | | | | | | | |
Weighted Average Debt Service Coverage Ratio | | | 1.69 | | | 1.63 | | | 1.63 | | | 1.66 | | | 1.67 | | | 1.73 | | | 1.71 | | | 1.79 | | | 1.89 | |
| | | | | | | | | | | | | | | | | | | | | | | | | | | | | |
| |
Table 17: Securities Portfolio - Characteristics (in millions) |
| | | RATING | |
At September 30, 2006: | | | | | | | | | | | | | | | | | |
| | | Total | | AAA | | AA | | A | | BBB | | BB | | B | | Unrated | |
| Commercial real estate | | $ | 513 | | $ | 5 | | $ | 2 | | $ | 18 | | $ | 105 | | $ | 195 | | $ | 71 | | $ | 117 | |
| Residential prime real estate | | | 1,378 | | | 20 | | | 201 | | | 265 | | | 294 | | | 339 | | | 131 | | | 128 | |
| Residential Alt-A real estate | | | 283 | | | 81 | | | 39 | | | 8 | | | 16 | | | 86 | | | 20 | | | 33 | |
| Residential sub-prime real estate | | | 428 | | | 5 | | | 90 | | | 227 | | | 102 | | | 2 | | | - | | | 3 | |
| Residential HELOCs | | | 101 | | | 3 | | | 50 | | | 37 | | | 7 | | | 4 | | | - | | | - | |
| REIT corporate debt | | | 9 | | | - | | | - | | | - | | | 1 | | | 8 | | | - | | | - | |
| Real estate CDOs | | | 200 | | | 44 | | | 28 | | | 37 | | | 72 | | | 14 | | | - | | | 4 | |
Total securities portfolio | | $ | 2,912 | | $ | 158 | | $ | 410 | | $ | 592 | | $ | 597 | | $ | 648 | | $ | 222 | | $ | 285 | |
| | | | | | | | | | | | | | | | | | | | | | | | | | |
| | | | RATING | |
At December 31, 2006: | | | | | | | | | | | | | | | | | | | | | | | | | |
| | | | Total | | | AAA | | | AA | | | A | | | BBB | | | BB | | | B | | | Unrated | |
| Commercial real estate | | $ | 380 | | $ | 11 | | $ | 2 | | $ | 20 | | $ | 129 | | $ | 130 | | $ | 30 | | $ | 58 | |
| Residential prime real estate | | | 1,185 | | | 29 | | | 197 | | | 195 | | | 232 | | | 281 | | | 113 | | | 138 | |
| Residential Alt-A real estate | | | 117 | | | - | | | 46 | | | 1 | | | - | | | 50 | | | 3 | | | 17 | |
| Residential sub-prime real estate | | | 442 | | | 5 | | | 86 | | | 292 | | | 59 | | | - | | | - | | | - | |
| Residential HELOCs | | | 108 | | | - | | | 49 | | | 54 | | | 5 | | | - | | | - | | | - | |
| REIT corporate debt | | | 32 | | | - | | | - | | | - | | | 24 | | | 8 | | | - | | | - | |
| Real estate CDOs | | | 155 | | | 37 | | | 25 | | | 37 | | | 44 | | | 11 | | | - | | | 1 | |
Total securities portfolio | | $ | 2,419 | | $ | 82 | | $ | 405 | | $ | 599 | | $ | 493 | | $ | 480 | | $ | 146 | | $ | 214 | |
| | | | | | | | | | | | | | | | | | | | | | | | | | |
Includes a portion of Redwood's permanent investment portfolio, plus securities consolidated from Acacia CDO securitization entities sponsored by Redwood, plus securities held by Redwood temporarily prior to sale to Acacia. Does not include Redwood's permanent investments acquired from securitization entities sponsored by Redwood, as those securities are eliminated in the GAAP consolidation of the underlying entities. | |
| |
Table 18: Sequoia ABS Issued - Characteristics (all $ in thousands) |
| | | | | | | | | | | | |
| | | | | | | | | | | Principal | |
| | | | | Original | | | | Estimated | | Outstanding At | |
Sequoia | | Issue | | Issue | | Stated | | Callable | | September 30, | |
ABS Issued (1) | | Date | | Amount | | Maturity | | Date | | 2006 | |
| Sequoia 1 | | | 07/29/97 | | $ | 534,347 | | | 2028 | | | Called | | $ | - | |
| Sequoia 2 | | | 11/06/97 | | | 749,160 | | | 2029 | | | Called | | | - | |
| Sequoia 3 | | | 06/26/98 | | | 635,288 | | | 2028 | | | Called | | | - | |
| Sequoia 1A | | | 05/04/99 | | | 157,266 | | | 2028 | | | Called | | | - | |
| Sequoia 4 | | | 03/21/00 | | | 377,119 | | | 2024 | | | 2006 | | | 79,728 | |
| Sequoia 5 | | | 10/29/01 | | | 510,047 | | | 2026 | | | 2007 | | | 117,528 | |
| Sequoia 6 | | | 04/26/02 | | | 506,142 | | | 2027 | | | 2007 | | | 135,908 | |
| Sequoia 7 | | | 05/29/02 | | | 572,000 | | | 2032 | | | 2006 | | | 107,473 | |
| Sequoia 8 | | | 07/30/02 | | | 642,998 | | | 2032 | | | 2006 | | | 122,255 | |
| Sequoia 9 | | | 08/28/02 | | | 558,266 | | | 2032 | | | 2007 | | | 118,399 | |
| Sequoia 10 | | | 09/26/02 | | | 1,041,600 | | | 2027 | | | 2008 | | | 298,546 | |
| Sequoia 11 | | | 10/30/02 | | | 704,936 | | | 2032 | | | 2007 | | | 160,251 | |
| Sequoia 12 | | | 12/19/02 | | | 1,096,891 | | | 2033 | | | 2006 | | | 249,800 | |
| Sequoia 2003-1 | | | 02/27/03 | | | 1,012,321 | | | 2033 | | | 2007 | | | 248,204 | |
| Sequoia 2003-2 | | | 04/29/03 | | | 815,080 | | | 2022 | | | 2007 | | | 207,986 | |
| Sequoia 2003-3 | | | 06/26/03 | | | 538,452 | | | 2023 | | | 2007 | | | 128,722 | |
| MLCC 2003-C | | | 06/26/03 | | | 984,349 | | | 2023 | | | 2008 | | | 262,209 | |
| MLCC 2003-D | | | 07/29/03 | | | 1,003,591 | | | 2028 | | | 2008 | | | 280,970 | |
| Sequoia 2003-4 | | | 07/29/03 | | | 504,273 | | | 2033 | | | 2007 | | | 196,450 | |
| Sequoia 2003-5 | | | 08/27/03 | | | 840,248 | | | 2033 | | | 2007 | | | 186,426 | |
| Sequoia 2003-6 | | | 10/29/03 | | | 649,999 | | | 2033 | | | 2007 | | | 151,703 | |
| Sequoia 2003-7 | | | 11/25/03 | | | 811,707 | | | 2034 | | | 2007 | | | 204,482 | |
| Sequoia 2003-8 | | | 12/23/03 | | | 964,238 | | | 2034 | | | 2007 | | | 282,143 | |
| MLCC 2003-E | | | 08/28/03 | | | 983,852 | | | 2028 | | | 2008 | | | 288,289 | |
| MLCC 2003-F | | | 09/25/03 | | | 1,297,913 | | | 2028 | | | 2007 | | | 389,286 | |
| MLCC 2003-H | | | 12/22/03 | | | 739,196 | | | 2029 | | | 2008 | | | 215,020 | |
| |
Table 18: Sequoia ABS Issued - Characteristics (all $ in thousands) |
| | | | | | | | | | | | | | | | | |
| | | | | | | | | | | | | | | | Principal | |
| | | | | | | Original | | | | | | Estimated | | | Outstanding At | |
| Sequoia | | | Issue | | | Issue | | | Stated | | | Callable | | | September 30, | |
| ABS Issued (1) | | | Date | | | Amount | | | Maturity | | | Date | | | 2006 | |
| Sequoia 2004-1 | | | 01/28/04 | | $ | 616,562 | | | 2034 | | | 2007 | | $ | 163,212 | |
| Sequoia 2004-2 | | | 02/25/04 | | | 690,548 | | | 2034 | | | 2007 | | | 196,458 | |
| Sequoia 2004-3 | | | 03/30/04 | | | 917,673 | | | 2034 | | | 2006 | | | 241,272 | |
| Sequoia 2004-4 | | | 04/29/04 | | | 808,933 | | | 2010 | | | 2007 | | | 218,661 | |
| Sequoia 2004-5 | | | 05/27/04 | | | 831,540 | | | 2012 | | | 2008 | | | 235,576 | |
| Sequoia 2004-6 | | | 06/29/04 | | | 910,662 | | | 2012 | | | 2008 | | | 261,098 | |
| SEMHT 2004-01 | | | 06/29/04 | | | 317,044 | | | 2014 | | | 2008 | | | 111,125 | |
| Sequoia 2004-7 | | | 07/29/04 | | | 1,032,685 | | | 2034 | | | 2008 | | | 256,634 | |
| Sequoia 2004-8 | | | 08/27/04 | | | 807,699 | | | 2034 | | | 2008 | | | 261,883 | |
| Sequoia 2004-9 | | | 09/29/04 | | | 772,831 | | | 2034 | | | 2008 | | | 278,815 | |
| Sequoia 2004-10 | | | 10/28/04 | | | 673,356 | | | 2034 | | | 2008 | | | 235,181 | |
| Sequoia 2004-11 | | | 11/23/04 | | | 705,746 | | | 2034 | | | 2008 | | | 303,900 | |
| Sequoia 2004-12 | | | 12/22/04 | | | 821,955 | | | 2035 | | | 2008 | | | 283,738 | |
| Sequoia 2005-1 | | | 01/27/05 | | | 409,071 | | | 2035 | | | 2008 | | | 162,844 | |
| Sequoia 2005-2 | | | 02/24/05 | | | 338,481 | | | 2035 | | | 2008 | | | 123,099 | |
| Sequoia 2005-3 | | | 04/28/05 | | | 359,182 | | | 2035 | | | 2008 | | | 156,099 | |
| Madrona 2005-A | | | 08/25/05 | | | 5,400 | | | 2008 | | | 2008 | | | 5,400 | |
| Sequoia 2005-4 | | | 09/29/05 | | | 324,576 | | | 2035 | | | 2009 | | | 235,913 | |
| Sequoia 2006-1 | | | 08/30/06 | | | 742,507 | | | 2046 | | | 2011 | | | 727,440 | |
Total Sequoia ABS Issuance | | | | | $ | 31,317,730 | | | | | | | | $ | 8,890,126 | |
| | | | | | | | | | | | | | | | | |
ABS Resecuritizations | | | | | | | | | | | | | | | | |
| SMFC 2002A | | | 04/30/02 | | $ | 80,622 | | | 2029 | | | Called | | $ | - | |
| SMFC 2002B | | | 12/19/02 | | | 161,605 | | | 2039 | | | Called | | | - | |
Total ABS Resecuritizations | | | | | $ | 242,227 | | | | | | | | $ | - | |
| | | | | | | | | | | | | | | | | |
(1) Does not include ABS acquired by Redwood or Acacia | | | | | | | | | | |
| | | | | | | | | | | | | | | | | |
| |
Table 19: Sequoia IO ABS Issued - Characteristics (all $ in thousands) |
| | | | | | | | | | | | |
| | | | | | | | | | | Adjusted Issue | |
| | | | | Original | | | | Estimated | | Amount At | |
Sequoia ABS | | Issue | | Issue | | Stated | | Callable | | September 30, | |
IO's Issued(1) | | Date | | Amount | | Maturity | | Date | | 2006 | |
| MLCC 2003-C X-A-2 | | | 06/26/03 | | $ | 12,662 | | | 2007 | | | 2007 | | $ | 635 | |
| MLCC 2003-D X-A-1 | | | 07/29/03 | | | 22,371 | | | 2007 | | | 2007 | | | 1,482 | |
| MLCC 2003-E X-A-1 | | | 08/28/03 | | | 16,550 | | | 2007 | | | 2007 | | | 1,644 | |
| MLCC 2003-F X-A-1 | | | 09/25/03 | | | 18,666 | | | 2007 | | | 2007 | | | 1,778 | |
| Sequoia 2003-6 X-1 | | | 10/29/03 | | | 8,220 | | | 2007 | | | 2007 | | | 591 | |
| SMFC 2003A AX1 | | | 10/31/03 | | | 70,568 | | | 2007 | | | 2007 | | | 3,255 | |
| Sequoia 2003-7 X-1 | | | 11/25/03 | | | 10,345 | | | 2007 | | | 2007 | | | 871 | |
| Sequoia 2003-8 X-1 | | | 12/23/03 | | | 12,256 | | | 2007 | | | 2007 | | | 1,208 | |
| Sequoia 2004-1 X-1 | | | 01/28/04 | | | 7,801 | | | 2007 | | | 2007 | | | 883 | |
| Sequoia 2004-2 X-1 | | | 02/25/04 | | | 8,776 | | | 2007 | | | 2007 | | | 1,112 | |
| SMFC 2004A AX1 | | | 02/26/04 | | | 10,626 | | | 2007 | | | 2007 | | | 1,096 | |
| MLCC 2003-H X-A-1 | | | 12/22/03 | | | 10,430 | | | 2007 | | | 2007 | | | 1,538 | |
| Sequoia 2004-4 X-1 | | | 05/28/04 | | | 9,789 | | | 2010 | | | 2007 | | | 1,656 | |
| Sequoia 2004-5 X-1 | | | 05/27/04 | | | 3,371 | | | 2012 | | | 2008 | | | 590 | |
| Sequoia 2004-6 X-A | | | 06/29/04 | | | 10,884 | | | 2012 | | | 2008 | | | 4,811 | |
| Sequoia 2004-7 X-A | | | 07/29/04 | | | 12,145 | | | 2034 | | | 2008 | | | 5,577 | |
| Sequoia 2004-8 X-A | | | 08/27/04 | | | 18,270 | | | 2034 | | | 2008 | | | 8,669 | |
| Sequoia 2004-9 X-A | | | 09/29/04 | | | 16,951 | | | 2034 | | | 2008 | | | 8,385 | |
| Sequoia 2004-10 X-A | | | 10/28/04 | | | 14,735 | | | 2034 | | | 2008 | | | 7,424 | |
| Sequoia 2004-11 X-A-1 | | | 11/23/04 | | | 12,603 | | | 2034 | | | 2008 | | | 6,828 | |
| Sequoia 2004-11 X-A-2 | | | 11/23/04 | | | 4,697 | | | 2034 | | | 2008 | | | 2,637 | |
| Sequoia 2004-12 X-A-1 | | | 12/22/04 | | | 14,453 | | | 2035 | | | 2008 | | | 7,738 | |
| Sequoia 2004-12 X-A-2 | | | 12/22/04 | | | 4,619 | | | 2035 | | | 2008 | | | 5,078 | |
| Sequoia 2005-1 X-A | | | 01/27/05 | | | 9,669 | | | 2035 | | | 2008 | | | 5,406 | |
| Sequoia 2005-2 X-A | | | 02/24/05 | | | 7,484 | | | 2035 | | | 2008 | | | 4,177 | |
| Sequoia 2005-3 X-A | | | 04/28/05 | | | 8,183 | | | 2035 | | | 2008 | | | 5,045 | |
Total Sequoia Issuance | | | | | $ | 357,124 | | | | | | | | $ | 90,114 | |
| | | | | | | | | | | | | | | | | |
(1) Does not include Sequoia IO's acquired by Redwood or Acacia | | | | | | | | | | |
| | | | | | | | | | | | | | | | | |
| |
Table 20: Acacia CDO - ABS Issued - Characteristics (all $ in thousands) |
| | | | | | | | | | | | |
| | | | | | | | | | | Principal | |
| | | | | Original | | | | Estimated | | Outstanding At | |
| | | Issue | | Issue | | Stated | | Callable | | September 30, | |
CDO Issuance (1) | | Date | | Amount | | Maturity | | Date | | 2006 | |
| Acacia CDO 1 | | | 12/10/02 | | $ | 285,000 | | | 2023 | | | Called | | $ | - | |
| Acacia CDO 2 | | | 05/13/03 | | | 283,875 | | | 2023 | | | Called | | | - | |
| Acacia CDO 3 | | | 11/04/03 | | | 284,250 | | | 2038 | | | 2006 | | | 221,830 | |
| Acacia CDO 4 | | | 04/08/04 | | | 293,400 | | | 2039 | | | 2007 | | | 282,333 | |
| Acacia CDO 5 | | | 07/14/04 | | | 282,125 | | | 2039 | | | 2007 | | | 281,808 | |
| Acacia CDO 6 | | | 11/09/04 | | | 282,000 | | | 2040 | | | 2007 | | | 281,187 | |
| Acacia CDO 7 | | | 03/10/05 | | | 282,000 | | | 2045 | | | 2008 | | | 281,128 | |
| Acacia CDO 8 | | | 07/14/05 | | | 252,000 | | | 2045 | | | 2008 | | | 251,704 | |
| Acacia CRE1 | | | 12/14/05 | | | 261,750 | | | 2045 | | | 2010 | | | 261,543 | |
| Acacia CDO 9 | | | 03/09/06 | | | 277,800 | | | 2046 | | | 2009 | | | 277,800 | |
| Acacia CDO 10 | | | 08/02/06 | | | 436,500 | | | 2046 | | | 2009 | | | 436,500 | |
Total CDO Issuance | | | | | $ | 3,220,700 | | | | | | | | $ | 2,575,833 | |
| | | | | | | | | | | | | | | | | |
(1) Does not include ABS acquired by Redwood | | | | | | | | | | | | | |
| | | | | | | | | | | | | | | | | |
Redwood Trust Corporate Information
Executive Officers: | Directors: |
| | |
George E. Bull, III | George E. Bull, III |
| Chairman of the Board and | Chairman of the Board and |
| Chief Executive Officer | Chief Executive Officer |
| | |
Douglas B. Hansen | Douglas B. Hansen |
| President | President |
| | |
Martin S. Hughes | Richard D. Baum |
| Chief Financial Officer | Chief Deputy Insurance |
| | Commissioner for the |
Harold F. Zagunis | State of California |
| Vice President | |
| | Thomas C. Brown |
Brett D. Nicholas | CEO, Urban Bay Properties, Inc. |
| Vice President | |
| | Mariann Byerwalter |
Loren R. Picard | Chairman, JDN Corporate |
| Vice President | Advisory, LLC |
| | |
Andrew I. Sirkis | Greg H. Kubicek |
| Vice President | President, The Holt Group, Inc. |
| | |
| | Georganne C. Proctor |
| | Executive Vice President and |
| | Chief Financial Officer, TIAA-CREF |
| | |
| | Charles J. Toeniskoetter |
| | Chairman, Toeniskoetter & Breeding, Inc. |
| | |
| | David L. Tyler |
| | Private Investor |
Stock Listing:
The Company’s common stock is traded on the
New York Stock Exchange under the symbol RWT.
Corporate Office:
One Belvedere Place, Suite 300
Mill Valley, California 94941
Telephone: 415-389-7373
Investor Relations:
Nicole Klock
IR Hotline: 866-269-4976
Telephone: 415-380-2321
Email: nicole.klock@redwoodtrust.com
Transfer Agent:
Computershare
2 North LaSalle Street
Chicago, IL 60602
Telephone: 888-472-1955
For more information about our company, please visit our website at: www.redwoodtrust.com