CONTENTS
INTRODUCTION | 2 |
| | |
SHAREHOLDER LETTER | 3 |
| | |
REDWOOD BUSINESS AND STRATEGY | 7 |
| | |
FINANCIAL MODULES | |
| | |
| ► | GAAP Earnings and Core Earnings | 14 |
| | | |
| ► | Taxable Income | 16 |
| | | |
| ► | Book Value Per Share | 18 |
| | | |
| ► | Return on Equity | 20 |
| | | |
| ► | Dividends | 22 |
| | | |
| ► | Residential CES | 24 |
| | | |
| ► | Residential Loans | 28 |
| | | |
| ► | Residential IGS | 32 |
| | | |
| ► | Commercial CES | 34 |
| | | |
| ► | Commercial Loans | 38 |
| | | |
| ► | Commercial IGS | 40 |
| | | |
| ► | CDO CES | 42 |
| | | |
| ► | CDO IGS | 44 |
| | | |
| ► | Capital | 46 |
| | | |
| ► | Redwood Debt | 48 |
| | | |
| ► | Acacia CDO ABS Issued | 50 |
| | | |
| ► | Sequoia ABS Issued | 52 |
| | | |
APPENDIX | |
| | |
| ► | Glossary | 54 |
| | | |
| ► | Financial Tables | 61 |
INTRODUCTION
The Redwood Review
We file quarterly reports on Form 10-Q and annual reports on Form 10-K with the Securities and Exchange Commission. Those filings and our earnings press releases provide information about our financial results from the perspective of Generally Accepted Accounting Principles (GAAP). These documents are available on our web site, www.redwoodtrust.com. We urge you to study them, as there is much to learn about Redwood Trust there.
In the Redwood Review, you have the opportunity to learn more about Redwood Trust through a discussion of GAAP results and also a discussion of tax results and other non-GAAP measures. You will first find a letter to our shareholders, and then a background section on Redwood Trust that highlights the key aspects of our business. Following that is a review of various financial indicators for our business, each of the asset classes and types of liabilities that are included in our GAAP balance sheets, a glossary explaining some of the specialized terms we use, and then tables that provide supplementary financial data.
We hope that the Redwood Review provides some insight and serves as a useful tool for better understanding your investment in Redwood Trust.
We expect that the form and content of the Redwood Review will evolve over time. We welcome your input during this process.
CAUTIONARY STATEMENT: This Redwood Review contains forward-looking statements within the safe harbor provisions of the Private Securities Litigation Reform Act of 1995. Statements that are not historical in nature, including the words “anticipated,” “estimated,” “should,” “expect,” “believe,” ”intend,” and similar expressions, are intended to identify forward-looking statements. These forward-looking statements are subject to risks and uncertainties, including, among other things, those described in our 2006 Annual Report on Form 10-K under Item 1A “Risk Factors.” Other risks, uncertainties, and factors that could cause actual results to differ materially from those projected are detailed from time to time in reports filed by us with the Securities and Exchange Commission, including Forms 10-K, 10-Q, and 8-K. Important factors that may impact our actual results include changes in interest rates and market values; changes in prepayment rates; general economic conditions, particularly as they affect the price of earning assets and the credit status of borrowers; the level of liquidity in the capital markets as it affects our ability to finance our real estate asset portfolio; and other factors not presently identified. In light of these risks, uncertainties, and assumptions, the forward-looking events mentioned in, discussed in, or incorporated by reference into this Review might not occur. Accordingly, our actual results may differ from our current expectations, estimates, and projections. We undertake no obligation to publicly update or revise any forward-looking statements, whether as a result of new information, future events, or otherwise.
SHAREHOLDER LETTER
4th Quarter 2006
Dear Fellow Shareholders:
We are pleased to present to you the Redwood Review covering the fourth quarter of 2006. We appreciate the feedback you have given us about the Review. We have made some changes designed to make it more useful to you. In particular, we have eliminated the individual business unit write-ups, limiting the narrative portion of the Review to this letter. We also rewrote the “Introduction to Redwood Trust” to focus more on strategy and expanded the number of modules that explain the various metrics about our business.
There is another reason we eliminated the individual business group write-ups. As our business has developed over the past several years, the operational and capital markets aspects of our three business groups - residential, commercial, and CDO − have become more integrated and interdependent. In the first quarter of 2007, we took this evolution one step further by eliminating many of the lines and operating distinctions between these business groups. Even more than in the past, we are all one team now.
As part of this realignment, we merged the leadership for acquiring and managing residential and commercial real estate assets under Vice President Brett Nicholas. He is responsible for developing an integrated asset investment and operations strategy and for continuing to train and recruit strong leaders to help us build and manage diverse asset portfolios.
The integration of our individual business groups will help the Redwood team operate even more effectively than it has in the past. Our experts at investing in and issuing CDOs, our team that buys, finances, and securitizes loans, our finance and accounting organizations (including our new Treasurer, Tim Stare), our human resources personnel, our folks in securities and loan investment, management, surveillance, and loss mitigation − they are all on the same page, working together, with a healthy culture and a long-term outlook. It is our job as senior managers to make sure it stays that way.
Turning to the fourth quarter, we feel that we had a pretty good quarter, and that we ended the year on solid footing. During the quarter, we paid a special dividend of $3.00 per share in addition to our regular quarterly dividend of $0.70 per share. Our fourth-quarter adjusted return on equity (ROE) was 15%, in the middle of the 11%-18% range we have established as our long-term ROE target.
As we move forward in 2007, we have a good deal of momentum towards putting capital to work in a diversified manner that we believe will likely produce attractive yields without undue risk.
Over the past two years, our strategy was to lay the foundation for future growth by diversifying our investment and financing capabilities, strengthening the Redwood team, and bolstering our systems and infrastructure. At the same time, we have been steering our way through the disruption in the housing and loan markets by selling some of our riskiest credit assets, sticking to our investment discipline, and preserving capital.
SHAREHOLDER LETTER
4th Quarter 2006
In 2006, we raised $66 million of capital through the sale of common stock via our direct stock purchase plan and $100 million of capital through the sale of junior subordinated notes. Additionally, we freed up $97 million of capital by selling and re-securitizing a portion of our credit-enhancement (CES) portfolio. We absorbed all of this capital in 2006, primarily through new investments in commercial and residential credit-enhancement securities (CES) and investment-grade securities (IGS). At year-end 2006, we had $182 million of excess capital, $7 million less than at the beginning of the year.
We plan to increase our residential and commercial real estate investment activity in 2007 as compared to 2006. We expect that capital absorption will be evenly split between investments in assets with less credit sensitivity and investments in cautiously selected credit-enhancement securities. We currently expect capital employed to grow between $200 million and $400 million in 2007.
To finance planned investments, we expect to use a combination of Redwood debt, proceeds from securitization financings, excess capital, and newly raised capital. Although the precise amount and sources of the capital we expect to raise during 2007 are uncertain at this time, potential sources include the sale of common stock though our direct stock purchase plan, public or private sales of equity, and the issuance of junior subordinated notes or other long-term debt.
At year-end, we had over $2 billion of residential and commercial securities funded through our Acacia CDO program. The growth within this program over the past four years has been a significant achievement, as Acacia has allowed us to finance our securities efficiently and to diversify and expand our investment capabilities and product lines. We achieved this growth in CDO financing by combining the acquisition skills of our residential and commercial portfolio managers with the well-respected debt-structuring skills of our CDO finance team.
During 2007, we expect Acacia’s assets to continue to grow through the addition of less credit-sensitive commercial and residential securities. Some of these assets may also be synthetic or derivative assets. We believe that derivative assets can be an attractive investment alternative at a time of declining availability of new loans and securities.
Over the next several years, we expect to continue diversifying the type of assets we finance through Acacia. For instance, commercial whole loans are one of the asset types we are studying. Overall, we feel strongly that real estate assets funded through Acacia will continue to be a significant growth area for us.
Residential whole loans present another opportunity to invest in less credit-sensitive assets. Our residential conduit is an active buyer of prime-quality hybrid and adjustable-rate loans from major originators throughout the country. We expect to increase our investment in residential loans in 2007.
Expanding into less credit sensitive assets is clearly an attractive opportunity at the present time, but it is not intended to dilute the essential nature of our business. Over the long term, we expect that credit enhancing high quality residential and commercial real estate loans will remain our core activity.
SHAREHOLDER LETTER
4th Quarter 2006
Our residential CES investments have largely focused on securities backed by prime quality loans. The overall credit performance of the loans backing our existing portfolio of prime CES remains strong, and is significantly better than our initial loss estimates at the time of acquisition.
Most of the current problems in the residential loan market involve subprime loans originated in late 2005 and 2006. Mortgage originators are now being inundated by loan purchase requests from investors due to underwriting violations and the poor credit performance of subprime borrowers. We are not a mortgage originator, and our investment in residential CES backed by subprime loans totaled only $10 million at year-end 2006. These assets are performing within our expectations at purchase.
We owned $518 million investment-grade securities backed by subprime loans at year-end 2006, of which $471 million were securities rated BBB+ or higher. These securities are generally performing within our expectations credit-wise, and most of them are financed via Acacia CDO securitization, so changes in their market value in the absence of actual credit losses are generally of little concern to us.
Currently, the area of greatest concern in the subprime investment-grade market is securities issued in 2006 that were rated BBB- and BBB. We owned $44 million of these securities at year-end 2006. In January 2007, we identified and sold $10 million of the securities within this group that we believed were most at risk of being downgraded in the future. These sales were accomplished at a small loss relative to our purchase price.
In the current housing climate, we continue to take a cautious approach to credit enhancing new residential loans of any type. But we do see opportunities to make attractive investments.
Residential prime CES pricing continues to remain high due to high liquidity levels, strong demand, and a declining supply of new issuance. We believe this condition will likely persist. We believe we can still make attractive returns even at these price levels, as long as the underlying credit quality is high and we do not encounter a serious economic recession in the future. We expect the quality of underwriting to improve in 2007, and we expect to become a more active buyer of prime residential CES in the second half of 2007.
We expect our primary target areas will be residential CES backed by prime and near-prime alt-a loans. We will also be actively looking at subprime CES, but many unanswered credit questions still exist. Unless we see opportunities to buy subprime at lower or distressed prices, we expect our 2007 subprime CES investments to remain relatively small.
Our commercial group is now established in the marketplace as an investor and manager of first-loss and other commercial credit-enhancement securities. We were an active investor in commercial CES in 2006. This will continue to be our primary commercial focus in 2007.
SHAREHOLDER LETTER
4th Quarter 2006
The performance of our portfolios of commercial securities and loans continues to reflect current strong commercial market fundamentals. Even though commercial properties are largely healthy, we believe the risks of credit-enhancing commercial loans are increasing. The tremendous amount of capital flowing into securitized commercial real estate loans has encouraged more aggressive underwriting and has kept asset prices high. The volume of our commercial CES investments in 2007 will largely depend on our ability to find assets that meet our relatively conservative investment and pricing criteria.
Looking forward into 2007, our biggest concern is the depth and duration of the housing market correction, and its ultimate impact on residential real estate credit. To date, our assets have held up well. Our delinquencies and losses have increased somewhat, but are still at very low levels. If the housing market takes a more severe downward turn, however, our credit results (and earnings and dividends) will likely be more seriously impacted. Additionally, further stress in the housing and credit markets might also cause pricing dislocations for housing-related securities. While this would create buying opportunities for us, it would also likely result in a decline in the fair market value of our current residential CES portfolio.
We believe we are well positioned as we move forward in 2007. At the same time, we may see quarter-to-quarter volatility in our GAAP and taxable earnings.
In summary, we believe that our core strategy - to build a highly efficient and entrepreneurial financial institution focused on real estate investment - has us in a good position to capitalize on a wide range of investment opportunities in 2007 and beyond.
We greatly appreciate your continued support and look forward to reporting to you on our further progress.
Yours truly,
| | | | |
| | | | |
| | George E. Bull, III | | Douglas B. Hansen |
| | Chairman and CEO | | President |
ABOUT REDWOOD TRUST
Redwood Business and Strategy
1. Redwood Trust is a financial institution with competitive advantages in the business of investing in real estate loans and securities.
Since Redwood was founded in 1994, our goal has been to create a company that is more efficient than banks, thrifts, insurance companies, and other financial institutions at investing in, financing, and managing residential and commercial real estate loans and securities.
Like many financial institutions, our primary source of income is net interest income, which equals the interest income we earn from our investments in loans and securities less the interest expenses we incur from our borrowed funds and other liabilities.
Most financial institutions fund their asset investments with borrowed money sourced by taking bank deposits, writing insurance policies, or issuing corporate debt. By contrast, securitization is the primary source of funding for our investments.
We also borrow money on a collateralized and uncollateralized basis, typically at very competitive rates. We do not, however, take deposits or raise money in any other way that would subject us to consumer lending or banking regulations. Since we are not regulated as a financial institution and do not deal directly with consumers, our operating costs are far lower than other financial institutions, and we have far greater freedom to use securitization as a source of funding.
In a securitization, we sell our assets to an independent securitization entity that creates securities backed by those assets (asset-backed securities, or ABS) and sells these newly-created securities to both domestic and international investors. Most of the securities created and sold earn the highest credit rating of AAA, so the interest paid out is relatively low. We typically generate a profit from these securitization entities, consisting of the yield on the securitized assets less the interest payments made to the holders of the ABS securities sold.
Advances in securitization technology have enabled securitization to become increasingly competitive as a funding source relative to corporate debt, deposits, insurance contracts, and other borrowings. The cost of funds for ABS issued continues to improve relative to the cost of other borrowings. More importantly, the range of assets that can be efficiently securitized continues to broaden and the capital efficiency of securitization as a source of funding continues to improve.
As global capital markets continue to develop and evolve, we expect securitization to become an even more efficient as a source of funding. There are trillions of dollars of real estate loans and securities in the U.S. and the world, and the amount outstanding has been and is expected to continue to grow every year. We believe many of these assets would be better funded through securitization than by other means. Since we are highly efficient at using securitization as a source of funding, we believe we will continue to grow and diversify our business over time.
Our tax structure gives us an additional competitive advantage that cannot be easily replicated by most other financial institutions. We have structured our company for tax purposes as a real estate investment trust (REIT) because our primary business is investing in real estate assets. As a REIT, we are required to distribute the bulk of our profits as dividends. By doing so, we avoid paying corporate taxes on most of the income we generate. This lowers our costs, as taxes are one of the largest costs of doing business for most financial institutions.
ABOUT REDWOOD TRUST
Redwood Business and Strategy
2. In terms of capital employed, our largest area of investment is real estate credit-enhancement securities.
Typically, 1% to 15% of the principal value of the securities created in a securitization of real estate assets are credit-enhancement securities (CES). These securities bear most of the credit risk with respect to the underlying assets that were securitized. If the underlying loans or securities suffer a loss of principal due to default, that loss is passed on by reducing the principal value of the CES. As a result of the high level of assumed credit risks, CES carry credit ratings that are below investment-grade. Because the CES absorb most or all of the credit risk that would normally be expected to occur, they reduce the credit risk of the more senior securities, allowing them to earn investment-grade ratings and to be sold at higher prices.
We are a leading investor in CES issued from securitizations of prime-quality residential real estate loans and we are an increasingly important investor in CES issued from securitizations of commercial real estate loans made on income-producing properties. In the last year, we have also made small investments in CES issued from securitizations of alt-a and subprime quality residential loans. In total, at December 31, 2006, we owned residential, commercial, and CDO CES with a principal value of $2.0 billion and a market value of $1.2 billion. Many of these securities are deep discount securities where our cost is far less than the principal value. Since we receive interest payments based on the principal value of a CES security, our interest income cash flow returns are strong. In addition, if credit losses are low, we will receive principal payments in excess of our cost basis, thus generating additional investment returns. Conversely, larger than expected credit losses could rapidly reduce the principal value of our CES, causing our investment returns from CES to suffer.
At December 31, 2006, our CES were first in line to absorb credit losses from the $268 billion of real estate loans and securities that underlie the securitizations from which our CES investments were issued. However, our potential credit losses are far smaller than $268 billion and are limited to the value of the securities in which we invested.
With respect to these CES investments, we have a high degree of structural leverage since the principal value of our CES equals only a small percentage of the underlying asset pools. We do not, however, use a high degree of financial leverage with respect to our CES assets. We use capital rather than debt to finance most of our investments in the more junior subordinated CES (the first-loss and second-loss securities, or equivalent) and we use capital plus a modest amount of securitization financing through our Acacia CDO issuance program to finance the more senior CES that are closer to investment-grade quality.
In the near term, we anticipate that our net growth in CES assets will continue to be more focused on commercial real estate CES, since for many types of residential CES we believe the underwriting quality remains questionable and there is an elevated risk of loss. Later in 2007, we believe acquisition opportunities in residential CES may improve because we expect underwriting quality to improve.
ABOUT REDWOOD TRUST
Redwood Business and Strategy
3. We are increasing our investment in investment-grade rated real estate securities.
We are increasing our investments in residential and commercial real estate investment-grade securities (IGS) rated AAA, AA, A, and BBB for three reasons. First, advances in securitization technology (such as CDOs) allow us to re-securitize portfolios of certain types of residential and commercial investment-grade securities and earn attractive returns on invested capital, as well as asset management fees. Secondly, in an environment of flat or falling housing prices and increased residential loan delinquencies and credit losses, we have for some time been tilting our investment focus towards assets that are credit-enhanced by others (investment-grade securities) rather than towards assets that cause us to carry concentrated credit risk (credit-enhancement securities). Finally, we intend to acquire some AAA- and AA-rated residential real estate securities, fund them with short-term Redwood debt, and reduce any resulting interest rate mismatches between these assets and liabilities using interest rate agreements. We pursued this investment strategy on a large scale from 1994 to 2000, after which we focused our investment strategy almost exclusively on assets with highly concentrated credit risks such as CES. Debt-funding AAA and AA real estate securities can be a good investment strategy in most economic environments. In addition, it fits our current balance sheet needs well, as we believe it will help us increase our capital utilization rate in a flexible manner and also will offset some of the risks we have in our balance sheet. Currently, our balance sheet is set up to benefit somewhat more from rising short-term interest rates and faster prepayment speeds whereas debt-funded AAA and AA asset strategies typically benefit from falling short-term interest rates and slower prepayment speeds.
4. We are increasing our investment in residential real estate loans.
We have been increasing our acquisitions of high-quality residential loans, and we are using both securitization proceeds and Redwood debt to fund these assets. Our residential loan portfolio declined in size over the last few years as we purchased fewer loans and the adjustable-rate residential loans in our portfolio prepaid at rapid rates. Because we have been increasing our loan purchases and our loan prepayment rate has slowed, we expect our loan portfolio size to start to stabilize. We are buying hybrid loans (fixed rate for 3-10 years, converting to adjustable rate thereafter) as well as adjustable-rate loans. Our interest in acquiring loans has increased because we have greater control over the underwriting quality of acquired loans than we do with respect to the loans underlying the residential CES we acquire. Quality control has become more important as residential underwriting standards have deteriorated. In addition, we are buying more loans because we want to hold a portion of our loan portfolio in whole loan form (unsecuritized) and use Redwood debt (including collateralized commercial paper) to fund the whole loans. Compared to the alternative of using securitization proceeds to fund these loans, using debt funding will increase our flexibility in utilizing more of our capital. Debt-funding loans requires a much larger capital commitment (8% of loan value versus 3%), and it generates a somewhat lower expected return on that capital than would a securitization. This is a flexible capital commitment, however, as we can easily recycle the capital utilized in this debt-funded strategy into other investments by either securitizing or selling the loans. Employing capital in this manner is useful at a time when we want to build our capital base to take advantage of future growth opportunities but we also want to improve profits by increasing our capital utilization rate which has been lower than optimal in the last few years as we have cut back our acquisition rate of CES.
ABOUT REDWOOD TRUST
Redwood Business and Strategy
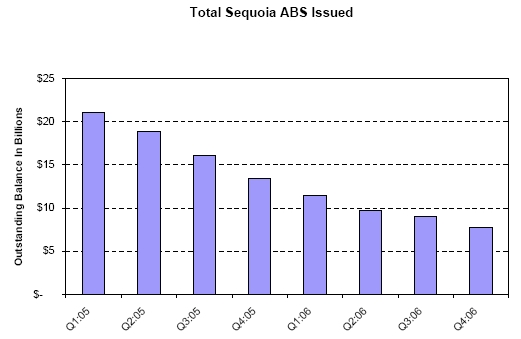
We also intend to replace some of our existing securitization funding with debt funding. In 2007 and 2008, we expect to exercise our rights to call many of our older “Sequoia” securitizations of residential loans. The terms of these securitizations generally allow us to call the deals when the current loan balance of the underlying loan pool pays down to 10% or 20% of its original balance. When calling a securitization, we pay off all the security holders at 100% of principal value and repurchase the underlying loans. We typically call our securitizations when we have the right to do so because the capital structure of a securitization becomes less efficient when the remaining balance of loans is small. It is better to call the deal so we can refinance the underlying loans more efficiently. We intend to finance a portion of the loans we acquire from called deals with Redwood debt and hold them as an ongoing investment. The remainder we will either re-securitize or sell.
5. We buy most of our assets rather than originate them.
Our primary strategy for sourcing assets is to acquire closed loans and securities directly from other financial institutions or from the capital markets. We do not originate or service loans. Others create most of the real estate securities we invest in, some are created by us, but in both cases, others have originated the underlying loans. This role allows us to have an independent point of view on asset quality and attractiveness, as well as the flexibility to change investment strategies as markets evolve. In our experience over the years, many financial institutions that have origination operations have produced sub-optimal asset investment results. We believe this is because, in some cases, there may have been incentives to retain loans that might not be the best investment (in terms of price and/or quality) in order to maintain or boost origination volumes and fees. In addition, origination (especially residential loan origination) is a business that is highly cyclical, operations intensive, and increasingly fraught with lender liability. Residential origination is becoming concentrated in the hands of a few large companies that have either banking or brokerage operations as well. Rather than competing with these companies, we develop close relationships with them and help them build their businesses. They need companies like Redwood to buy their loans and credit-enhance their securitizations.
We previously built a successful commercial real estate loan origination operation at Redwood, and we may do so again in the future now that CDO securitization technology has improved the efficiency and ease of securitizing commercial real estate loans. We may also build a commercial real estate loan special servicing operation. However, we expect to continue to source most of our residential and commercial assets through acquisition rather than origination.
6. Competition for assets is strong, but we believe our operating efficiencies will allow us to remain competitive.
Our competitors are banks, thrifts, insurance companies, Fannie Mae, Freddie Mac, Wall Street brokerage firms, hedge funds, specialty finance companies, mortgage REITs, mortgage insurance companies, CDO securitization managers, asset management companies, foreign investors, and other financial institutions.
ABOUT REDWOOD TRUST
Redwood Business and Strategy
Our corporate structure and competitive strengths differ from most other financial institutions. With our differentiated capabilities, we interact as competitors, but also as customers and suppliers, with most of the institutions active in the vast and interconnected real estate capital markets.
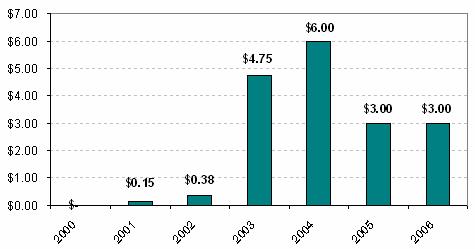
We commenced operations in 1994, a period of turmoil in financial markets. This turmoil allowed us to acquire assets that produced very high returns in subsequent years. The level of competition increased dramatically through the end of 1997, at which time we generally sold assets as the prospective risk/reward relationships for assets did not seem that attractive. There were several financial dislocations in 1998, including a prepayment acceleration crisis and a liquidity crisis. This allowed us to use our excess capital to acquire assets, including our own stock, at attractive prices. The CES we acquired in 1999 - 2002 performed very well, allowing us to report high return on equity results and to pay special dividends of $4.75 and $6.00 per share in 2003 and 2004.
The current competitive environment is much like 1997 - new entrants and other investors are willing to buy assets at high prices (low yields) despite increased potential risks. We have responded to this current lower return/higher risk environment by selling CES assets and slowing our acquisitions. In 2007, we are increasing our acquisitions of assets (such as investment-grade securities and loans) that carry less concentrated credit risks than CES. We are also focusing on acquiring assets that are funded through securitization. For these assets, high prices are less of a concern because these high prices (and the resulting narrow spreads) are offset by the high prices at which we can sell the securities we create using these assets as collateral.
If the financial markets experience turmoil due to falling housing prices and rising residential loan defaults, we will incur increased losses but we will also be in a position to take advantage of the lower asset prices that may result. We believe competition will remain strong, however, and that any extraordinary asset acquisition opportunities will be short-lived. With our operating efficiencies, funding strategy, corporate structure, permanent capital base, and investment discipline, we believe we are prepared to continue to compete effectively in the highly competitive market that we expect will be the norm going forward.
7. We maintain a strong balance sheet with risks that are largely segregated and limited.
Through our internal risk-adjusted capital policies, we seek to maintain a strong balance sheet with a large capital base, risks that are limited and segregated, and ample liquidity. Our $1.1 billion long-term capital base is primarily common equity but also includes $0.1 billion of unsecured junior subordinated notes (trust-preferred securities) that have a 30-year maturity.
We use capital, not debt, to fund assets such as first-loss credit-enhancement securities that carry concentrated credit risks. These assets have a high degree of structural credit risk, so we do not feel it would be prudent to employ financial leverage to acquire these assets. Our risk is limited to our investment in these securities. Since we fund these assets with capital rather than debt, high credit losses should not cause liquidity concerns. Similarly, our economic risk is limited and our liquid reserves are secure with respect to securitized assets, since the assets are sold to and the securities are issued by independent securitization entities, whose liabilities are not Redwood’s obligations. Our economic risk is limited to the value of any securities we may acquire as an investment from these entities. Typically, either we fund securities acquired from securitizations we sponsor with capital or we sell these securities to another securitization entity for re-securitization. In either case, the risk is segregated and limited.
ABOUT REDWOOD TRUST
Redwood Business and Strategy
We are increasingly using Redwood debt to fund assets. Expanding our funding strategy is bringing us a number of benefits, including allowing us to employ our excess capital in a flexible manner. It does, however, introduce potential liquidity risks as well as potential credit risks that are not as limited as with other parts of our balance sheet. Accordingly, we are using Redwood debt primarily to fund assets (such as investment-grade rated securities and prime-quality residential whole loans) that do not have concentrated credit risks and that typically can be sold in a reasonably liquid manner. Increasingly, we expect to use extendable collateralized commercial paper as a source of short-term Redwood debt for debt-funded asset strategies. We believe the potential liquidity risks of commercial paper are less than those of our debt facilities in the form of repurchase agreements. Finally, we allocate capital equal to 8% of assets to support our debt-funded asset strategies, an amount that is well in excess of the amount required by our lenders. We believe this gives us a margin for safety should liquidity, market value, or credit concerns arise.
With respect to interest rate and prepayment rate risks, we seek to maintain a balance sheet that is well balanced and that can generate cash flows to fund our regular dividend in a wide variety of scenarios. We believe we have achieved this - the net present value of our projected cash flows does not vary materially with respect to scenarios incorporating changes in interest rates or prepayment rates. Scenarios incorporating different degrees of potential credit losses, however, show a wide variation in the long-term net present value of our cash flows. In the near-term (one to three years), our results may vary as a function of changes in interest rates, prepayments, credit results, mark-to-market asset values, and other factors.
8. Our primary financial goal is to deliver an attractive sum of dividends per share over time.
Our financial goal is to distribute the highest levels of dividends per share over the next few decades as we can. We seek to do that while also remaining within our risk tolerance levels and while increasing the inherent value of the company by building competitive advantages, diversifying risks and opportunities, developing internal capabilities, maintaining our culture, keeping operations highly efficient, and increasing book value per share.
As a REIT, we are required to distribute to our shareholders as dividends at least 90% of our REIT profits as calculated for tax purposes. We distribute our profits as a regular quarterly dividend and also, in some years, in a year-end special dividend. The regular dividend rate for 2006 was $0.70 per share per quarter and the special dividend was $3.00 per share. Total dividends for 2006 were $5.80 per share.
We expect the regular quarterly dividend to be $0.75 per share for 2007, an increase from 2006’s rate of $0.70 per share per quarter. We set the regular dividend at a level we believe is likely to be sustained over the next few years. Whether we pay a special dividend or not in 2007 will depend primarily on how much REIT taxable income we generate during the year. We expect that our total annual dividend payout amounts (regular plus special) will vary from year to year.
ABOUT REDWOOD TRUST
Redwood Business and Strategy
9. Growth is our mission.
In a manner consistent with our goal of distributing dividends per share in attractive amounts over time, our mission is to grow to become a larger company in terms of capital employed and market capitalization. We are targeting growth by building real estate investment, financing, and management operations with competitive advantages. Over the long term, growth should bring several advantages, including book value accretion and a diversified income stream.
We plan to grow organically as markets grow and as we gain long-term market share, rather than simply growing for growth’s sake or through short-term acquisition of market share, which would be irresponsible and inconsistent with our long-term goal of distributing attractive dividends per share. In addition, we do not expect growth to be linear, because in cyclical markets growth is not always the appropriate short-term strategy.
FINANCIAL REVIEW
GAAP Earnings and Core Earnings
What Is This?
GAAP income is income calculated under Generally Accepted Accounting Principles (GAAP) in the United States.
Core earnings is a profitability measure that highlights earnings that are more likely to be ongoing in nature. In calculating core earnings, we start with GAAP earnings and then exclude gains and losses on calls and sales, unrealized market value adjustments, and one-time items that are unlikely to be repeated. Table 2 in the Appendix shows a reconciliation of core earnings to GAAP earnings.
a) Graphs
GAAP Earnings per Share
FINANCIAL REVIEW
GAAP Earnings and Core Earnings
b) Quarterly Update
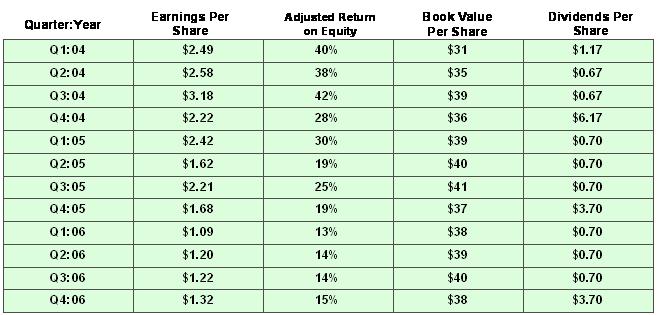
| Ø | Our GAAP earnings were $36 million, or $1.32 per share, for the fourth quarter of 2006. In the fourth quarter of 2005, GAAP earnings were $42 million, or $1.68 per share. |
| Ø | Core earnings were $30 million, or $1.12 per share, for the fourth quarter of 2006. This is an increase from $25 million, or $0.97 per share core earnings in the fourth quarter of 2005. |
| Ø | Our GAAP earnings in the fourth quarter were $6 million lower than fourth quarter 2005. The largest factor was a $12 million decline from gains generated from sales and calls of assets. Gains were $7 million in the fourth quarter of 2006 compared to $19 million in the fourth quarter of 2005. This decline was partially offset by a $4 million increase in net interest income, which was $45 million in the fourth quarter of 2006 compared to $41 million in the fourth quarter of 2005. This increase reflects rising yields from our credit-enhancement portfolio being driven by strong credit performance and rapid prepayments. |
| Ø | Operating expenses were $13 million in the fourth quarter of 2006, the same as the fourth quarter a year ago. |
| Ø | Income taxes were negligible in the fourth quarter of this year, compared to a $4 million expense in the fourth quarter of last year. This decreased expense reflects the reduction in our loan securitization activities over the past few years. |
FINANCIAL REVIEW
Taxable Income
What Is This?
Total taxable income is a measure of our profitability. It is our pre-tax income as calculated for tax purposes. It includes pre-tax income earned at our parent company and qualified subsidiaries (REIT taxable income) as well as pre-tax income earned in our taxable qualified subsidiaries. Total taxable income can differ materially from GAAP earnings. Table 3 in the Appendix reconciles these two profitability measures.
REIT taxable income is the primary determinant of the minimum amount of dividends we need to distribute in order to maintain our tax status as a real estate investment trust (REIT). REIT taxable income is pre-tax profit, as calculated for tax purposes, at Redwood. It does not include taxable income earned at our non-REIT taxable subsidiaries. Over time, we must distribute at least 90% of our REIT taxable income as dividends. A reconciliation of GAAP income to REIT taxable income appears in Table 3 of the Appendix.
a) Graphs
FINANCIAL REVIEW
Taxable Income
b) Quarterly Update
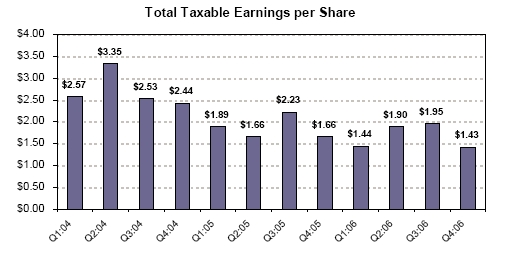
| Ø | Total taxable income was $38 million, or $1.43 per share, in the fourth quarter of 2006. This was a decrease from the total taxable income per share we generated in recent quarters. This decrease was primarily due to stock option exercises, a non-cash expense that is deductible for tax. |
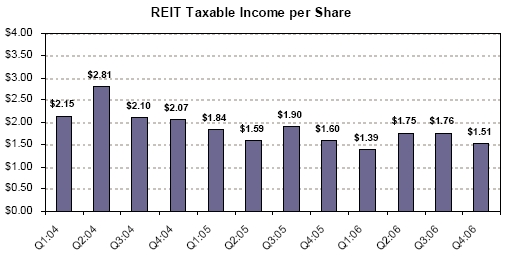
| Ø | For the same reason, our REIT taxable income decreased to $1.51 per share in the fourth quarter of 2006 from $1.60 per share in the fourth quarter of 2005. |
| Ø | Our taxable income was higher than our GAAP income in the fourth quarter of 2006, and for the full year. The primary reason is that we are not allowed to establish a credit reserve for our CES for tax accounting purposes. Thus, we amortize more discount into income and recognize a higher yield for tax purposes until credit losses occur. The cumulative difference in the discount amortization between tax and GAAP for residential, commercial, and CDO CES was $95 million at year end. |
| Ø | Total taxable income and REIT taxable income were reduced by $1.9 million ($0.07 per share) in the fourth quarter as a result of deductions for actual credit losses. This deduction is less than the losses incurred on the underlying loans, as we own most of our credit-sensitive assets at a tax basis that is substantially less than par (principal) value. Increased credit losses would reduce taxable income and our dividend distribution requirements. |
| Ø | We currently expect our REIT taxable income per share to continue to exceed our regular quarterly dividend rate by a comfortable margin. |
| Ø | For a variety of reasons, our total taxable income and REIT taxable income will continue to be volatile on a quarter-to-quarter basis. |
FINANCIAL REVIEW
Book Value per Share
What Is This?
Book value per share is the amount of equity capital we have per share of common stock outstanding.
GAAP book value is our common equity as calculated for GAAP purposes. It includes a mark-to-market valuation adjustment of some of our assets (i.e., those assets for which changes in market valuations are reported on our balance sheet and not our income statement.)
Core book value is GAAP book value excluding those mark-to-market valuation adjustments of our assets reflected on our balance sheets. Core book value more closely reflects historical amortized costs rather than current market values.
A reconciliation of GAAP book value to core book value appears in Table 7 of the Appendix.
a) Graph
FINANCIAL REVIEW
Book Value per Share
b) Quarterly Update
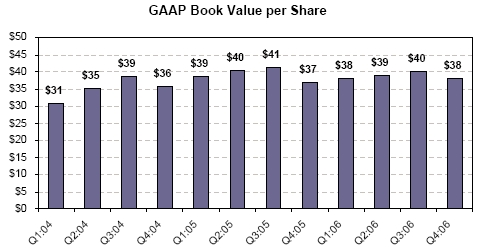
| Ø | In the fourth quarter of 2006, after including the effect of declaring $0.70 per share of regular dividends and $3.00 per share of special dividends, GAAP book value per share decreased by 6% from $40.02 per share to $37.51 per share. For 2006, GAAP book value increased by 1% from $37.20 per share. |
| Ø | At December 31, 2006, core book value was $34.02 per share. Core book value decreased by 1% during 2006, from $34.27 per share at the beginning of the year. |
| Ø | At the end of our first quarter of operations in September 1994, GAAP book value was $11.67 per share. Since that time, we have paid $40.43 per share of dividends while also increasing GAAP book value by $25.84 per share. |
| Ø | Book value per share growth is generally not a direct indicator of our market value or an indicator of the returns available to our shareholders. If you had acquired Redwood stock at our initial public offering in August 1995, and had reinvested all dividends back into Redwood stock, your compounded return as a shareholder would have been 23% per year through December 31, 2006. Future results may vary. |
FINANCIAL REVIEW
Return on Equity
What Is This?
Return on equity (ROE) is the amount of profit we generate each year per dollar of equity capital.
GAAP ROE is GAAP earnings divided by GAAP equity.
Adjusted ROE is GAAP earnings divided by core equity. Core equity excludes balance sheet mark-to-market adjustments that are not included in earnings.
A reconciliation of GAAP ROE to Adjusted ROE, and of GAAP equity to core equity, appears in Table 7 of the Appendix.
a) Graph
FINANCIAL REVIEW
Return on Equity
b) Quarterly Update
| Ø | GAAP ROE was 14% for the fourth quarter of 2006 as compared to 12% for the previous quarter and 18% in the fourth quarter of 2005. |
| Ø | Adjusted ROE was 15% for the fourth quarter of 2006 as compared to 14% for the previous quarter and 19% for the fourth quarter of 2005. |
| Ø | Adjusted ROE is higher than GAAP ROE for these periods as we have unrealized market value gains on our assets. This has the effect of increasing our GAAP equity and thus reducing our GAAP ROE relative to our adjusted ROE. |
| Ø | Over the last four years, our adjusted return on equity has ranged from 14% to 36%. Over the long term, we expect to be able to generate annual adjusted returns on equity between 11% and 18%. |
| Ø | Return on equity exceeded our target range in 2003, 2004, and 2005. We were able to acquire CES assets at attractive prices following the 1998 capital markets/liquidity crisis. In the following years, excellent credit results, combined with rapid prepayments, produced extraordinary profits. |
FINANCIAL REVIEW
Dividends
What Is This?
As a real estate investment trust (REIT), we are required to distribute at least 90% of our REIT taxable income as dividends. We have established a regular quarterly dividend rate at a level low enough so that we believe it is likely to be sustainable for the next few years. Distributions in excess of the regular dividend rate, if any, are paid in a fourth quarter special dividend.
a) Graphs
FINANCIAL REVIEW
Dividends
RWT Special Dividends
Per Share
b) Quarterly Update
| Ø | We declared a regular quarterly dividend of $0.70 per share in the fourth quarter of 2006. |
| Ø | The Board of Directors has declared its intent to raise the quarterly dividend rate to $0.75 per share in 2007. |
| Ø | We paid a special dividend of $3.00 per share in the fourth quarter of 2006. The annual special dividend, if any, is likely to vary from year to year. |
| Ø | Total 2006 dividend distributions were $5.80 per share. Assuming a Redwood stock price of $62, the indicated dividend yield would be 9.4% based on the last twelve months of dividends and 4.8% based on expected regular dividends of $3.00 per share for 2007. |
| Ø | Based on our estimates of REIT taxable income during 2006, we entered 2007 with $50 million ($1.85 per share) of undistributed REIT taxable income that we will distribute in 2007. This should be sufficient to fund at least the first two regular quarterly dividends in 2007. |
FINANCIAL REVIEW
Residential Credit-Enhancement Securities
What Is This?
Residential CES are subordinated securities issued from securitizations of residential real estate loans. Residential CES absorb the initial credit losses generated by the underlying mortgage pool and thus credit-enhance the more senior securities issued from the same securitization. CES assume a high level of risk of principal loss and thus have below investment-grade (BB, B, and NR) credit ratings.
FINANCIAL REVIEW
Residential Credit-Enhancement Securities
FINANCIAL REVIEW
Residential Credit-Enhancement Securities
b) Quarterly Update
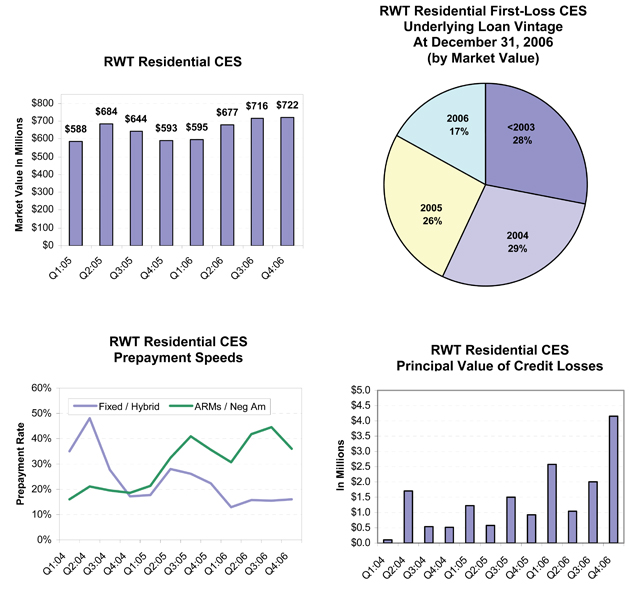
| Ø | Our residential CES portfolio grew in the fourth quarter of 2006 by $6 million (or 1%) to $722 million as a result of acquisitions of $21 million, market value adjustment increases of $1 million, sales of $1 million, calls of $1 million, discount amortization of $18 million, and principal pay downs of $32 million. |
| Ø | For 2006, our residential CES portfolio increased 22% from $593 million to $722 million. |
| Ø | Interest income generated by residential CES was $36 million for the fourth quarter. The yield for the fourth quarter was 22%, the same as the previous quarter. Yields are high due to fast prepayment speeds and continued good credit performance for underlying loans. The residential CES yield for 2006 was 21%. |
| Ø | At December 31, 2006, $716 million of our residential CES were structured to benefit from faster mortgage prepayment rates, as they are discount bonds purchased from senior/subordinated securitizations, and $6 million were structured in the form of residuals where slower prepayment rates are generally beneficial. |
| Ø | Prepayments on loans underlying CES averaged 27% CPR for the quarter and 24% CPR for 2006. Many of these CES will become callable by the issuer when the loan balance pays down to 10% of the original balance. If credit results remain strong, we may realize income gains if these CES are called. At current prepayment rates, we expect few calls in 2007 or 2008. Approximately 25% of these CES will become callable by 2009 and an additional 50% by 2014. On average in the past, CES have been called within 6 months following the month in which they first become callable. |
| Ø | The balance of residential loans underlying these CES decreased from $225 billion to $210 billion during the fourth quarter as a result of relatively rapid mortgage prepayment rates as well as a slower rate of net acquisitions. |
| Ø | By market value, 77% of our CES were backed by pools of primarily prime quality loans, 22% of our CES were backed by pools of primarily alt-a quality loans, and 1% of our CES were backed by pools of primarily subprime quality loans. The manner in which alt-a and subprime CES are structured and priced allows for the potential for attractive economic returns even if losses and delinquencies in the underlying loans are many times those of prime CES. For the market as a whole, subprime loans originated in 2006 are demonstrating very poor initial credit performance. Within our CES portfolio, our exposure to 2006 vintage subprime is $10 million market value of CES. |
| Ø | Statistics for loans underlying CES by dollar balance at December 31, 2006: $331,181 average loan size; 63% jumbo, 37% conforming balance at origination; 47% located in California, 6% Florida, 5% New York, 4% Virginia; 59% originated in 2004 or earlier, 28% originated in 2005, 13% originated in 2006; 69% average loan-to-property-value at origination, 5% loans with loan-to-value over 80% (many of which have mortgage insurance or additional pledged assets); 730 average FICO credit score, 15% FICO under 680; 91% owner-occupied, 6% second home, 3% investor properties; 38% fixed rate, 39% hybrid rate, 23% adjustable-rate; 57% fully-amortizing principal, 24% interest-only, 19% negative amortization option. |
FINANCIAL REVIEW
Residential Credit-Enhancement Securities
| Ø | Principal value credit losses for the loans underlying residential CES were $4.2 million for the fourth quarter, a loss rate of less than one basis point (0.01%) per year. As assets season, we expect losses to increase. Losses remain lower than our original expectations. |
| Ø | Our GAAP credit reserves for residential CES were $372 million ($13.92 per share) at December 31, 2006, a decrease of $18 million for the quarter. At year-end, credit reserves for CES (plus external credit enhancement we benefit from) were 0.32% of underlying loan balances. As a result of strong credit performance during the year, we transferred $73 million residential CES credit reserves to unamortized discount that will be amortized into income over time. Unamortized discount balances for residential CES were $145 million at year-end. |
| Ø | For tax purposes, realized credit losses were $1.6 million for the fourth quarter. This deduction is less than the principal value losses incurred on the underlying loans, as we own most of our credit-sensitive assets at a tax basis that is substantially less than par (principal) value. |
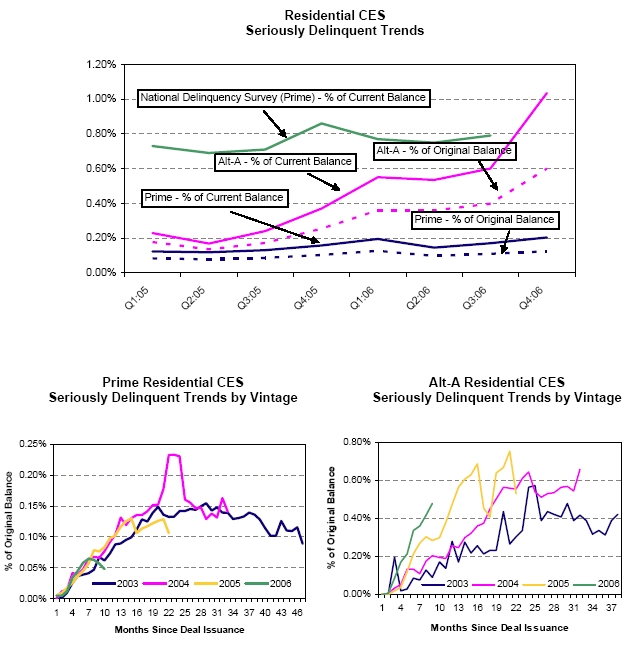
| Ø | For the $187 billion of our CES loans in pools consisting primarily of prime quality loans, at December 31, 2006 serious delinquencies were $381 million, a 13% increase from the third quarter balance of $337 million and a 50% increase from the beginning 2006 balance of $254 million. At December 31, 2006, serious delinquencies for prime CES pools were 0.12% of original balances and 0.20% of current balances. Principal value credit losses for the fourth quarter were $2.8 million. |
| Ø | For the $18 billion of our CES loans in pools consisting primarily of alt-a quality loans, at December 31, 2006 serious delinquencies were $187 million, a 41% increase from the third quarter balance of $133 million and a 224% increase from the beginning of 2006 balance of $58 million. At December 31, 2006, serious delinquencies for alt-a CES pools were 0.60% of original balances and 1.03% of current balances. Principal value credit losses for the fourth quarter were $1.3 million. |
| Ø | For the $5 billion of our CES loans in pools consisting primarily of subprime quality loans, at December 31, 2006 serious delinquencies were $210 million, a 65% increase from the third quarter balance of $127 million. Prior to the third quarter of 2006, the residential CES portfolio did not contain any subprime assets. At December 31, 2006, serious delinquencies for subprime CES pools were 2.78% of original balances and 3.87% of current balances. There were no credit losses for the fourth quarter. |
| Ø | At December 31, 2006, $230 million of residential CES was financed with equity and $492 million was financed through our Acacia CDO securitization program. |
| Ø | Additional information on our residential CES can be found in Tables 9, 10, 11, and 12 of the Appendix. |
FINANCIAL REVIEW
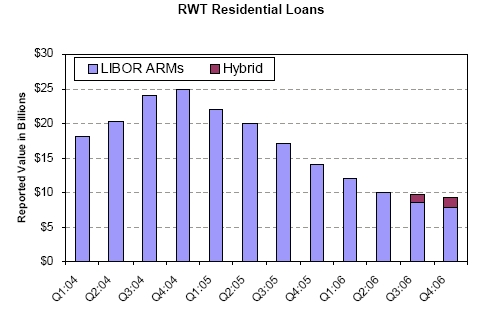
Residential Loans
What Is This?
We invest in residential real estate loans that we acquire from mortgage origination companies. Most of the loans we acquire are prime-quality loans. We do not originate or service residential real estate loans. We fund our loan investments via securitization and with Redwood debt and capital.
FINANCIAL REVIEW
Residential Loans
FINANCIAL REVIEW
Residential Loans
b) Quarterly Update
| Ø | In the fourth quarter, our residential loan portfolio declined from $9.8 billion to $9.3 billion. We acquired $0.7 billion loans and had no sales. Principal pay downs were $1.2 billion. |
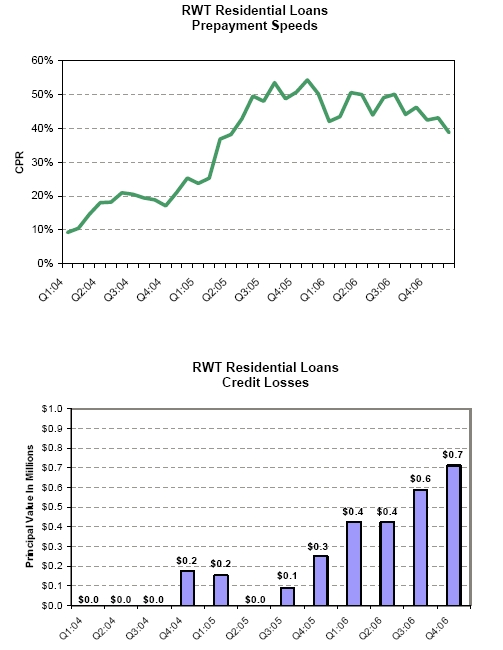
| Ø | For 2006, our residential loan portfolio decreased by $4.6 billion, or 33%, as prepayments exceeded acquisitions. The average annual prepayment rate (CPR) was 41% for the fourth quarter and 43% for 2006. Most of these loans are adjustable-rate loans that tend to prepay rapidly when the yield curve is flat or inverted. Acquisitions for 2006 were $2.0 billion. |
| Ø | Interest income was $138 million in the fourth quarter, a decrease from $149 million in the previous quarter. This portfolio yielded 5.97%, similar to the yield of 5.97% in the previous quarter. The yield for 2006 for residential loans was 5.71%. |
| Ø | Premium amortization expenses, a component of interest income, were $15 million for the fourth quarter and $48 million for 2006. We started 2006 with $13.9 billion principal value of loans and a loan premium balance of $178 million for an average basis of 101.30% of principal value. We finished 2006 with $9 billion principal value of loans and a premium balance of $132 million for an average basis of 101.43% of principal value. For various technical accounting reasons, for several years we have not been able to amortize premium expense balances as quickly as the loans prepaid. If short-term interest rates decline, under these accounting rules we would expect premium amortization expenses to increase significantly. Largely because premium amortization expenses have not kept pace with prepayments in the past, we estimate the book value of residential loans exceeded their market value by $83 million at year-end. |
| Ø | Statistics for residential loans by dollar balance at December 31, 2006: 100% prime quality loans; $332,624 average loan size; 62% jumbo, 38% conforming balance at origination; 23% located in California, 12% Florida, 6% New York, 3% Virginia; 78% originated in 2004 or earlier, 17% originated in 2006; 68% average loan-to-property-value at origination, 8% loans with loan-to-value over 80% (many of which have other pledged assets); 733 average FICO credit score, 14% FICO under 680; 86% owner-occupied, 11% second home, 3% investor properties; 15% hybrid rate, 85% adjustable-rate; 3% fully-amortizing, 97% interest-only. |
| Ø | Realized credit losses were $0.7 million for the fourth quarter, an annual loss rate of three basis points (0.03%) for the quarter. Losses for 2006 were $2.1 million, an annual loss rate of 0.02%. The loss for tax purposes was $0.2 million for the fourth quarter and $0.5 million for the year. Cumulative losses have been far lower than our original expectations. We expect losses to continue to increase as these loans season. Credit reserves for this portfolio were $20 million at year-end. |
FINANCIAL REVIEW
Residential Loans
| Ø | The balance of seriously delinquent loans increased from $61 million to $73 million during the quarter, an increase from 0.21% to 0.24% of original balances and from 0.63% to 0.79% of current balances. During 2006, serious residential loan delinquencies increased from $37 million to $73 million and REO (a component of serious delinquencies) increased from $3 million to $9 million. We believe delinquencies are increasing both as a result of a weaker housing market and the seasoning of the portfolio. Loans originated in 2004 or earlier were 78% of the portfolio at December 31, 2006, and seasoned loans generally have higher delinquency rates. |
| Ø | At year-end, $8 billion residential loans were financed via securitization (“Sequoia”) and $1.3 billion were financed with Redwood debt. The remainder were funded with capital. |
| Ø | Additional information on our residential loans can be found in Tables 9, 10, 11, and 13 of the Appendix. |
FINANCIAL REVIEW
Residential Investment-Grade Securities
What Is This?
Residential investment-grade securities (IGS) are asset-backed securities that are the more senior securities issued from a securitization of a pool of residential real estate loans. IGS are senior to the credit-enhancement securities issued from the same securitization transaction, and thus IGS are protected from initial credit losses that may stem from the underlying loan pool. Residential IGS have investment-grade credit ratings (AAA, AA, A, or BBB) from the credit rating agencies. The loans in the underlying collateral pool would have to experience a higher than expected degree of credit loss before residential IGS would experience a principal loss.
a) Graphs
FINANCIAL REVIEW
Residential Investment-Grade Securities
b) Quarterly Update
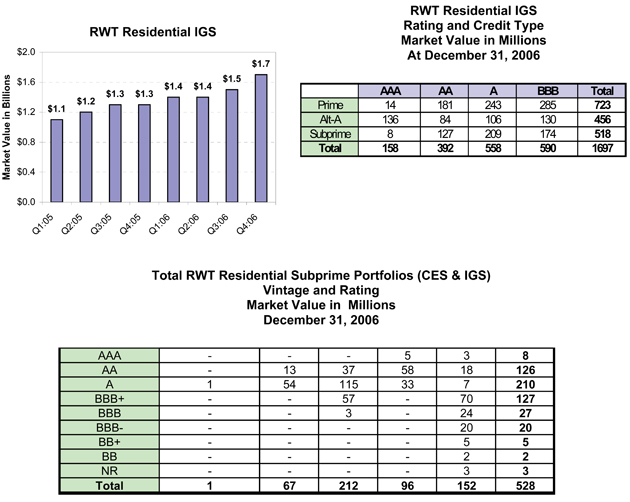
| Ø | Our residential IGS portfolio increased by 15% in the fourth quarter from $1.5 billion to $1.7 billion. Acquisitions were $352 million, market value declined $2 million, EITF 99-20 market value write-downs were $1 million, sales were $97 million, calls were $6 million, and principal pay downs were $25 million. |
| Ø | For 2006, growth of our residential IGS portfolio was 35%, from $1.3 billion to $1.7 billion. |
| Ø | Interest income generated by residential IGS was $26 million for the fourth quarter. The yield for the fourth quarter was 6.77%, a decline from 7.11% the previous quarter as we purchased higher rated securities with lower yields. The residential IGS yield for 2006 was 6.67%. |
| Ø | Net discount amortization income (which is included in interest income) for the fourth quarter was $1 million. At year-end, our net discount balance for these assets was $16 million giving us an average income statement basis of 99.04% of principal value. |
| Ø | We have never incurred a principal loss on a residential IGS security. We do not have credit reserves for these assets. There were no credit rating upgrades or downgrades of IGS for the fourth quarter of 2006. |
| Ø | At year-end, residential IGS backed by subprime loans totaled $518 million, or 31% of the residential IGS portfolio. IGS backed by subprime loans that were originated in 2006 and that had BBB credit ratings totaled $114 million at year-end. We sold $24 million of these in January 2007 at a slight loss. After these sales, we owned $90 million 2006 vintage subprime BBBs, including $15 million bonds rated BBB-, $19 million bonds rated BBB, and $56 million bonds rated BBB+. The performance of the loans underlying these bonds has been satisfactory to date, but we are monitoring them closely as the industry-wide performance of subprime loans originated in 2006 has generally been poor so far. |
| Ø | At December 31, 2006, $1.4 billion of residential IGS were financed via securitization in our Acacia CDO program and $0.3 billion were financed with Redwood debt and capital. At December 31, 2006, the interest rate characteristics of residential IGS were 60% adjustable-rate, 23% hybrid, and 17% fixed rate. We use interest rate agreements to generally match the interest rate characteristics of these assets to their corresponding funding sources. |
| Ø | Additional information on our residential IGS can be found in Tables 9 and 10 of the Appendix. |
FINANCIAL REVIEW
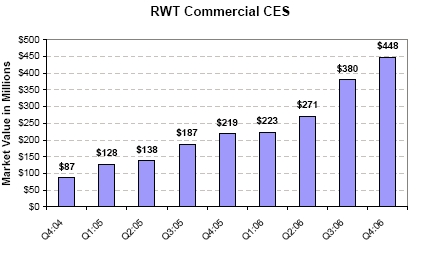
Commercial Credit-Enhancement Securities
What Is This?
Commercial CES are subordinated securities issued from a securitization of commercial real estate loans. Commercial CES absorb the initial credit losses generated by the underlying loan pool, and thus credit-enhance the more senior securities issued from the same securitization. CES assume a high level of potential risk of principal loss and thus have below investment-grade (BB, B, and NR) credit ratings.
a) Graphs
FINANCIAL REVIEW
Commercial Credit-Enhancement Securities
FINANCIAL REVIEW
Commercial Credit-Enhancement Securities
| Ø | Our commercial CES portfolio increased by $68 million (or 18%) in the fourth quarter as a result of $76 million acquisitions, $2 million market value appreciation, and sales of $10 million. |
| Ø | Our commercial CES portfolio grew by 105% during 2006, from $219 million to $448 million. |
| Ø | Interest income generated by commercial CES was $8 million for the fourth quarter. The yield for the quarter was 8.97%, a small decrease from 9.00% in the previous quarter. The yield for 2006 was 8.73%. The level of current yield we recognize on these assets is largely a function of our future credit loss assumptions. |
| Ø | For the fourth quarter of 2006, we generated $0.4 million income from sales and calls of commercial CES. Market value appreciation on our commercial CES portfolio was $2 million; all of this unrealized appreciation was recognized on our balance sheet but none through our income statement. |
| Ø | The balance of commercial real estate loans underlying these CES remained at $58 billion during the fourth quarter. We acquired $76 million CES from two CMBS transactions with underlying loans of $5 billion and sold $10 million CES from two CMBS transactions with underlying loans of $5.2 billion. |
| Ø | We do not own all the first-loss CES issued from the securitizations in which we are currently in a first-loss position. We own 40-49% of the first-loss CES issued from transactions completed prior to the first quarter of 2006. For transactions completed after that date, we own 50-100% of the issued first-loss CES. |
| Ø | On a principal value basis, for all the transactions in which we have invested, commercial first-loss CES have averaged 1.35% of the underlying loan balances at origination. |
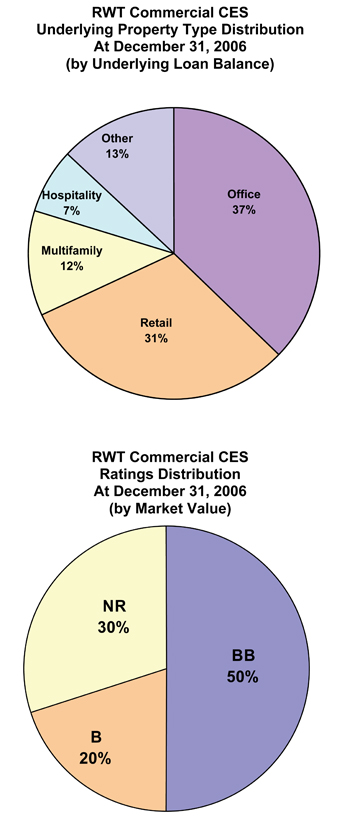
| Ø | Statistics for the loans underlying commercial CES by dollar balance at December 31, 2006: 37% office, 31% retail, 12% multifamily, 7% hospitality, 13% other; 17% located in California, 13% in New York, 8% in Texas, 4% in Virginia; 33% originated in 2006, 36% originated in 2005, 31% originated in 2004 or earlier. |
| Ø | There were $0.5 million principal value of credit losses for loans underlying our commercial CES in the fourth quarter, the first such credit losses during 2006. The 2006 annual credit loss rate was less than one basis point (0.01%). |
| Ø | Our GAAP credit reserves for commercial CES were $295 million ($11.05 per share) at December 31, 2006, an increase of $66 million for the quarter. At year-end, GAAP credit reserves were 0.51% of underlying loan balances. |
| Ø | For tax purposes, realized credit losses were $0.14 million for 2006. This deduction is less than the principal value losses incurred on the underlying loans, as we own most of our commercial CES at a tax basis that is substantially less than par (principal) value. In addition, we shared these loan losses with other CES investors. |
FINANCIAL REVIEW
Commercial Credit-Enhancement Securities
| Ø | For loans underlying CES, serious delinquencies at December 31, 2006 were $64 million, remaining flat for the quarter. These delinquencies were 0.11% of current balances at year-end. |
| Ø | At December 31, 2006, $224 million commercial CES were funded with capital and $224 million were financed through our Acacia CDO securitization program. |
| Ø | Additional information on our commercial CES can be found in Tables 9, 10, 14, and 15 of the Appendix. |
FINANCIAL REVIEW
Commercial Loans
What Is This?
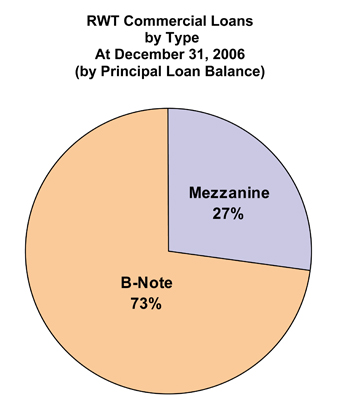
We invest in commercial real estate loans. These include whole loans and structured subordinated loans such as b-notes and mezzanine loans. Investing in commercial loans gives us exposures to income-producing real estate with specific property and geographic distributions.
a) Graphs
FINANCIAL REVIEW
Commercial Loans
b) Quarterly Update
| Ø | Our commercial loan portfolio at December 31, 2006 was $28 million. To date, these loans are performing well. |
| Ø | We successfully originated commercial whole loans from 1998 to 2003. We shut down this production largely because we were not able to develop a secure source of financing for these assets. |
| Ø | Since then, CDO securitization technology has evolved so that some types of commercial real estate whole loans can be securitized and funded via CDOs. |
| Ø | Although our immediate focus is on further developing our commercial CES business, in the longer-run we will be evaluating the possibility of rebuilding our commercial whole loan business using CDO securitization for funding. We could buy loans, originate them, or both. |
| Ø | Additional information on our commercial loans can be found in Tables 9, 10, 14, and 16 of the Appendix. |
FINANCIAL REVIEW
Commercial Investment-Grade Securities
What Is This?
Commercial investment-grade securities (IGS) are senior in the capital structure to the credit-enhancement securities issued from the same securitization transaction, and thus are protected from initial credit losses that may stem from the underlying loan pool. Commercial IGS have investment-grade credit ratings (AAA, AA, A, or BBB) from credit rating agencies. The loans in the underlying pool would have to experience higher than expected credit losses before commercial IGS would experience a principal loss.
FINANCIAL REVIEW
Commercial Investment-Grade Securities
b) Quarterly Update
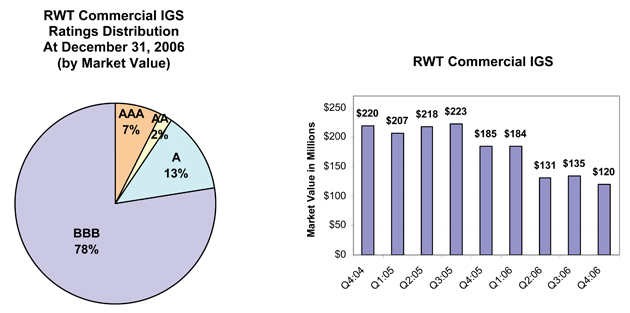
| Ø | Our commercial IGS portfolio decreased by 11% in the fourth quarter, from $135 million to $120 million. Acquisitions were $9 million, sales were $24 million, principal pay downs were $0.7 million, and market value appreciation was $0.7 million. Sales were the result of our call of Acacia 3 and subsequent sale of most of Acacia 3’s assets. |
| Ø | For 2006, our commercial IGS portfolio declined by 35% from $185 million to $120 million, largely as a result of sales subsequent to CDO calls. We intend to acquire additional commercial IGS in 2007. |
| Ø | Interest income generated by commercial IGS was $2 million for the fourth quarter. The yield on the fourth quarter was 8.77%, an increase from 7.30% in the previous quarter. Yields increased as a result of rising interest rates. The commercial IGS yield for 2006 was 7.01%. |
| Ø | At year-end, our income statement basis for commercial IGS assets was 97.35% of principal value, with a total unamortized discount of $3 million. Net discount amortization income (which is included in interest income) was $0.1 million for the fourth quarter. |
| Ø | Market value gains recognized in the income statement during the fourth quarter were $1 million on sales of $24 million. |
| Ø | We have never incurred a principal loss on a commercial IGS security and we do not have credit reserves for these assets. Credit rating upgrades for the quarter were $4 million and there were no downgrades. |
| Ø | At December 31, 2006, all of our commercial IGS were financed via Acacia CDO securitization. The interest rate characteristics of commercial CDO IGS were 78% fixed rate and 22% floating rate. We use interest rate agreements to reduce any interest rate mismatches that may occur between assets and their associated liabilities. |
| Ø | Additional information on our commercial IGS can be found in Tables 9 and 10 of the Appendix. |
FINANCIAL REVIEW
CDO Credit-Enhancement Securities
What Is This?
We invest in collateralized debt obligation credit-enhancement securities (CDO CES). These are the below investment-grade subordinated ABS issued from CDO securitizations. Many of these securities are also referred to as “CDO equity”. CDO CES securities absorb the initial credit losses that may occur within the underlying pool of collateral assets, and thus they serve to credit-enhance the more senior securities issued from the same securitization. Even though typically most of the underlying collateral assets are investment-grade securities and near investment-grade securities, there is still risk of credit loss. Since the CDO CES absorb these losses, they have below investment-grade (BB, B, and NR) ratings.
a) Graphs
FINANCIAL REVIEW
CDO Credit-Enhancement Securities
b) Quarterly Update
| Ø | Our CDO CES portfolio remained constant in size in the fourth quarter at $22 million. |
| Ø | For 2006, growth of our CDO CES portfolio was 97%, an increase from $11 million to $22 million. |
| Ø | Interest income generated by CDO CES was $0.6 million for the fourth quarter. The yield for the fourth quarter was 11.67%. The CDO CES yield for 2006 was 10.75%. The increase in yield during the fourth quarter was the result of rising LIBOR rates and continued good performance of the underlying securities. |
| Ø | We did not incur credit losses on CDO CES in 2006, and we have no credit reserves for these assets. |
| Ø | At December 31, 2006, $13 million of CDO CES was financed via securitization in our Acacia CDO program and $9 million was financed with capital. |
FINANCIAL REVIEW
CDO Investment-Grade Securities
What Is This?
We invest in investment-grade rated collateralized debt obligation securities (CDO IGS). These are ABS securities that are structured to be the more senior ownership interests issued from CDO securitizations. CDO IGS have been rated investment-grade (AAA, AA, A, or BBB) by the credit rating agencies because they are protected from initial credit losses by the CDO CES that are issued from the same transaction. The underlying collateral pool typically consists of residential and commercial real estate securities rated investment-grade or near investment-grade. The securities in the underlying collateral pool would have to experience a higher than expected degree of credit losses before CDO IGS would experience a principal loss.
a) Graphs
FINANCIAL REVIEW
CDO Investment-Grade Securities
b) Quarterly Update
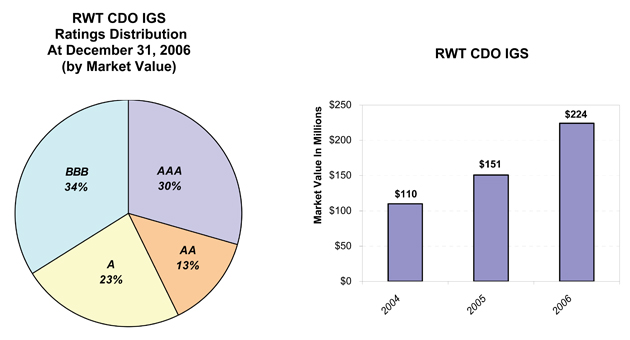
| Ø | Our CDO IGS portfolio increased by 21%, from $185 million to $224 million, in the fourth quarter of 2006. This increase was the result of acquisitions of $45 million which were offset by principal paydowns, mark-to-market adjustments, and sales of assets to third parties of $5.3 million. |
| Ø | For 2006, growth of our CDO IGS portfolio was 48%, from $151 million to $224 million. |
| Ø | Interest income generated by the CDO IGS portfolio during the fourth quarter was $3.3 million, an increase of 14% over the $2.9 million generated in the third quarter. The yield for the fourth quarter was 7.20%. The CDO IGS yield for 2006 was 6.16%. The yield has been increasing as a result of rising LIBOR rates. Substantially all of these assets earn a floating rate of interest based on the LIBOR interest rate. |
| Ø | We own these assets at a cost basis near par value. |
| Ø | At December 31, 2006, CDO IGS assets backed primarily by residential real estate collateral were $152 million and those backed primarily by commercial real estate collateral were $72 million. Most of the underlying collateral securities have investment-grade credit ratings. |
| Ø | We have never incurred a principal loss on a CDO IGS security and we do not currently have credit reserves for these assets. |
| Ø | At December 31, 2006, $210 million of CDO IGS were financed via securitization in our Acacia CDO securitization program. We funded $14 million of CDO IGS assets with capital. We use interest rate agreements to reduce any mismatch of interest rate characteristics between the fixed-rate CDO IGS we own and the floating-rate CDO securities issued by Acacia to finance these assets. |
FINANCIAL REVIEW
Capital
What Is This?
Our capital base includes equity plus junior subordinated notes.
We use capital to fund operations and working capital, to fund investments in illiquid or more credit-sensitive assets, and to meet lender capital requirements with respect to the collateralized borrowings we undertake. We also hold capital as a reserve to meet liquidity needs that may arise.
Through our internal risk-adjusted capital policies, we estimate the amount of capital we need to manage our current book of business and to set aside a prudent level of reserve capital. Any capital that exceeds our risk-adjusted capital guideline amount is excess capital that can be used to support business growth.
a) Graphs
FINANCIAL REVIEW
Capital
b) Quarterly Update
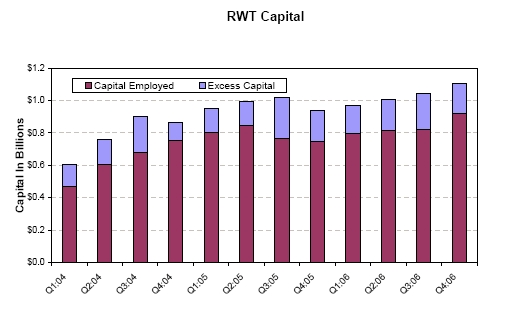
| Ø | Our capital base increased by $60 million during the fourth quarter to $1.1 billion. We issued $100 million junior subordinated notes (in the form of trust preferred certificates), issued 680,444 shares of common stock raising $29 million, and earned $36 million profits. Market values for assets marked-to-market through the balance sheet declined by $2 million. Our capital base was reduced by the declaration of $103 million regular and special dividends. |
| Ø | Capital employed at year-end was $914 million, a net increase of 11% ($90 million) for the fourth quarter. We closed on a large commercial CES transaction in the fourth quarter and acquired new assets in most of our other portfolios. In addition, by calling two Sequoia securitizations, we replaced ABS issued with Redwood debt, thus using more capital. |
| Ø | For 2006, capital employed increased by 23% from $746 million to $914 million. |
| Ø | We ended the year with $182 million of excess capital, a decrease of $37 million from the beginning of the quarter and $7 million from the beginning of the year. |
| Ø | We issued $100 million unsecured junior subordinated notes in December 2006. These notes had minimal covenants and carried an interest expense of 2.25% over three month LIBOR. At year-end, three month LIBOR was 5.36%. Maturity is in 30 years (January 2037). We have the right to call these notes without any prepayment penalty beginning in five years (January 2012). |
| Ø | We currently anticipate that growth of our business will absorb $200 million to $400 million net capital in 2007. Since this exceeds our year-end excess capital of $182 million, we anticipate seeking to raise additional capital in 2007. We will issue new common shares through our direct stock purchase plan which allows new or existing shareholders to acquire shares from us (as a new investment or to reinvest their dividends). We may also do a public or private offering of shares or issue long-term junior debt that we would consider capital. |
FINANCIAL REVIEW
Redwood Debt
What Is This?
Redwood debt is all the debt incurred by Redwood Trust, with the exception of junior subordinated notes that we count as part of our capital base.
a) Graphs
FINANCIAL REVIEW
Redwood Debt
b) Quarterly Update
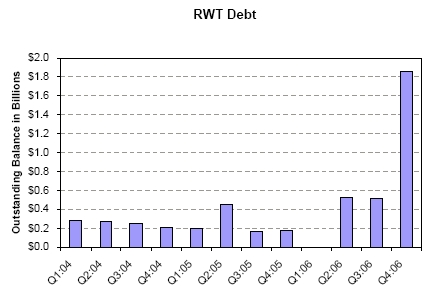
| Ø | Redwood debt balances increased in the fourth quarter from $0.5 billion to $1.9 billion as we increasingly used debt to fund residential whole loans that we intend to own on an ongoing basis. |
| Ø | The cost of funds for Redwood’s debt has been rising with short-term interest rates - it was 6.06% for the fourth quarter and 5.82% in the third quarter. Interest expense for Redwood debt was $17 million for the fourth quarter and $30 million for 2006. |
| Ø | At December 31, 2006, all Redwood debt was short-term debt collateralized by the pledge of assets. Maturities are generally one year or less, and the interest rate usually adjusts to market levels each month. |
| Ø | In the fourth quarter, we started using a new form of Redwood debt - collateralized commercial paper (CP) issued from our Madrona CP facility. Madrona CP outstanding at year-end was $300 million. Borrowings under our Madrona program are rated the highest CP rating of A1+/P1 and represent our lowest cost borrowings. At year-end, CP collateral was limited to whole loans. In 2007, we expect to expand our Madrona program to allow for funding of securities. |
| Ø | At December 31, 2006, Redwood debt funded $1.3 billion residential whole loans and $0.6 billion securities. |
| Ø | When we fund fixed-rate or hybrid-rate assets with Redwood debt, we generally use interest rate agreements to reduce the interest rate mismatch between the asset and the liability. |
FINANCIAL REVIEW
Acacia CDO ABS Issued
What Is This?
We finance a portion of our assets using proceeds from collateralized debt obligation (CDO) securitizations. We sell a diverse pool of our residential, commercial, and CDO real estate securities (primarily rated investment-grade or BB) to an independent securitization entity (typically called Acacia) that creates and issues collateralized debt obligation (CDO) securities, a type of ABS. The newly created CDO ABS securities that are rated investment-grade are sold to third-party investors. Redwood acquires most of the CDO CES that Acacia creates. By acquiring Acacia CDO CES, Redwood earns the net interest income created when the yield on the assets in the collateral pool Acacia exceeds the interest payments required to be made to the buyers of the CDO ABS securities Acacia has sold. Acacia CDO ABS are not obligations of Redwood Trust, although they are shown on our consolidated balance sheet as part of ABS issued liabilities.
a) Graphs
FINANCIAL REVIEW
Acacia CDO ABS Issued
b) Quarterly Update
| Ø | Acacia CDO ABS outstanding decreased from $2.6 billion to $2.3 billion during the fourth quarter, a decrease of 12%. Acacia did not issue new CDO ABS during the quarter. We exercised our call rights with respect to Acacia 3, purchasing and retiring $0.3 billion CDO ABS and regaining control of the underlying collateral assets. Pay downs of Acacia CDO securities were negligible for the quarter. |
| Ø | In 2006, Acacia issued $700 million CDO ABS securities in two transactions. Net of calls, Acacia CDO bonds outstanding grew by 5% in 2006, from $2.2 billion to $2.3 billion. Acacia issued $450 million additional CDO ABS in February 2007 (via Acacia 11), most of which were rated AAA. The Acacia 11 AAA-rated CDO ABS were issued with a coupon of three-month LIBOR plus 0.30%. |
| Ø | At December 31, 2006, 99% of Acacia bonds outstanding were floating rate bonds with coupons adjusting as a function of the LIBOR interest rate. |
| Ø | The cost of funds of issued Acacia CDO ABS was 6.08% in the fourth quarter of 2006 and 5.85% for the full year 2006. The cost of funds has been rising in conjunction with short-term interest rates. Interest expense, net of interest rate agreements, for Acacia ABS issued was $39 million for the fourth quarter and $139 million for 2006. |
| Ø | At December 31, 2006, the credit ratings for Acacia bonds outstanding were $1.9 billion AAA, $303 million AA, $156 million A, and $135 million BBB. In addition, Acacia has sold a portion of its unrated CDO CES to third parties, of which $15 million was outstanding at December 31, 2006. |
| Ø | The collateral underlying each Acacia transaction is typically rated BBB on average, with 7-15% of assets rated below investment-grade. |
| Ø | The Acacia CDO CES Redwood has acquired from Acacia had a market value of $127 million at December 31, 2006. Redwood’s economic risk with respect to Acacia’s assets and liabilities is generally limited to this amount. For accounting purposes, we account for Acacia transactions as financings, so the assets owned by Acacia are consolidated with our assets and the CDO bonds issued by Acacia are consolidated with our liabilities. As a result, the Acacia CDO CES assets we acquire do not appear on our GAAP balance sheet, but rather are implicitly represented as the excess of consolidated Acacia assets over consolidated Acacia liabilities. |
| Ø | For managing the outstanding Acacia transactions, Redwood’s asset management (taxable) subsidiaries earned $1.0 million asset management fees in the fourth quarter of 2006 and $3.2 million asset management fees in 2006. This income was sourced from the assets owned by Acacia for GAAP, and these assets are consolidated on our GAAP balance sheet, so we include this asset management income as part of the interest income generated by those assets. |
| Ø | Additional information about Acacia CDO ABS issued can be found in Table 20 of the Appendix. |
FINANCIAL REVIEW
Sequoia ABS Issued
What Is This?
We finance a portion of our residential whole loans by securitizing them. We sell loans to an independent securitization entity (typically called Sequoia) that creates and issues asset-backed securities (ABS) backed by these loans. Most of the investment-grade rated Sequoia ABS are sold to third party investors. Redwood usually acquires most of the credit-enhancement securities (CES) and the interest-only securities (IO) that Sequoia creates, as well as a portion of Sequoia’s investment-grade securities. When Redwood acquires Sequoia IO, we earn the net interest income created when the yield on Sequoia’s loans exceeds cost of funds of Sequoia ABS issued. Sequoia ABS are not obligations of Redwood Trust, although they are shown on our consolidated balance sheet as part of ABS issued liabilities.
a) Graphs
FINANCIAL REVIEW
Sequoia ABS Issued
Quarterly Update
| Ø | Sequoia ABS outstanding decreased from $9.0 billion to $7.5 billion in the fourth quarter, a decline of 17%. There was no new issuance for the quarter. For 2006, total issuance was $0.7 billion. During 2006, Sequoia ABS outstanding decreased by 44%, from $13.4 billion to $7.5 billion. Outstanding amounts are reduced as the underlying loans pay down and also as a result of calls. We called $0.2 billion Sequoia ABS in 2006. |
| Ø | Most of Sequoia’s ABS outstanding are rated AAA. For Sequoia’s last issuance in August, the AAA-rated ABS issued were 96% of the total issued. These AAA-rated ABS carry a coupon of 5.98%. |
| Ø | The cost of funds of issued Sequoia ABS was 5.72% in the fourth quarter of 2006 and 5.26% for the full year 2006. The cost has been rising in conjunction with short-term interest rates. Interest expense for Sequoia ABS issued was $118 million for the fourth quarter and $533 million for 2006. |
| Ø | Redwood’s economic risk with respect to Sequoia’s assets and liabilities is generally limited to the value of Sequoia ABS we have acquired, which included $26 million market value IO securities rated AAA, $108 million CES, and $154 million investment-grade securities at December 31, 2006. For GAAP accounting purposes, we account for Sequoia transactions as financings, so the assets owned by Sequoia are consolidated with our assets and the ABS bonds issued by Sequoia are consolidated with our liabilities. As a result, the Sequoia ABS we acquire do not appear on our GAAP balance sheet, but rather are implicitly represented as the excess of consolidated Sequoia assets over consolidated Sequoia liabilities. |
| Ø | Total ABS Issued on our December 31, 2006 balance sheet included $7.5 billion Sequoia ABS, $2.3 billion Acacia CDO ABS, and $5 million ABS issued by our Madrona CP issuance facility. |
| Ø | Additional information about Sequoia ABS issued can be found in Tables 18 and 19 of the Appendix. |
APPENDIX
Glossary
All companies and analysts do not calculate non-GAAP measures in the same fashion. As a result, certain measures as calculated by Redwood may not be comparable to similarly titled measures reported by other companies.
ACACIA
Acacia is the brand name for the collateralized debt obligation (CDO) securitizations Redwood sponsors. The underlying pool of assets for these CDO securitizations consists primarily of investment-grade and the more senior of the below investment-grade rated securities backed by residential prime, residential subprime, and commercial real estate loans. Acacia also owns related assets such as CDO securities issued by other real estate oriented CDOs, corporate debt issued by equity REITs, commercial real estate loans, and synthetic assets derived from commercial real estate assets. Redwood typically acquires a portion of the CDO credit-enhancement (or “equity”) securities issued by Acacia; these are the securities that are in the first-loss (highest risk) position with respect to absorbing any credit losses that may occur within the assets owned by the Acacia entities.
ADJUSTABLE RATE MORTGAGES (ARMs)
Adjustable rate mortgages are loans that have coupons that adjust at least once per year. We make a distinction between ARMs (loans with a rate adjustment at least annually) and hybrids (loans that have a fixed-rate period of 3 to 10 years and then become adjustable rate).
ALT-A SECURITIES
Alt-a securities are residential mortgage-backed securities that have higher credit quality than subprime and lower credit quality than prime. Alt-a originally represented loans with alternative documentation, but the definition has shifted over time to include loans with additional risk characteristics and a higher percentage of investor loans. For example, borrower’ income may not be verified, and in some case, may not be disclosed on the loan application. Expanded criteria also allows for higher debt-to-income ratios with higher accompanying LTV than otherwise would be permissible for prime loans.
ASSET-BACKED SECURITIES (ABS)
Securities backed by financial assets that generate cash flows. Each ABS security issued from an asset-backed securitization entity has a unique priority with respect to receiving principal and interest cash flows from the assets owned by the entity.
BOOK VALUE
Book value is the value of our common equity. As measured for GAAP, reported book value generally incorporates mark-to-market adjustments for securities and interest rate agreements, but not for loans or liabilities.
COLLATERALIZED DEBT OBLIGATIONS (CDO)
ABS securities issued from the securitization of a diverse pool of assets. See “Acacia”.
CDO EQUITY SECURITIES
CDO equity securities (or CDO CES) are credit-enhancement securities that bear the initial credit losses of the assets owned by CDO securitization entities.
COMMERCIAL B-NOTE LOANS
Commercial b-note loans are structured loans that are subordinated to the more senior portions of loans secured by the same income-producing commercial real estate.
APPENDIX
Glossary
COMMERCIAL MEZZANINE LOANS
Commercial mezzanine loans are junior subordinated loans that are not secured by a lien on income-producing commercial real estate; rather, they are secured by a pledge from an equity entity of its equity interests in the property.
COMMERCIAL WHOLE LOANS
Commercial whole loans are unsecuritized first-lien loans that are secured by income-producing commercial real estate.
CONDUIT
An entity that acquires closed loans from originators, accumulates loans over a period of time, and sells these loans, seeking to generate a gain on sale. Sales are usually made via securitization, but also can be made through bulk whole loan sales.
CORE EARNINGS
Core earnings are not a measure of earnings in accordance with GAAP. We attempt to strip some of the elements out of GAAP earnings that are temporary, one-time, or non-economic in nature, or that primarily relate to the past with little relevance to the future. In calculating core earnings, we are trying to show the trend of underlying ongoing earnings. We exclude realized gains (and losses) resulting from asset sales and calls that are included in income. We sell assets from time to time as part of our ongoing portfolio management activities. These sales can produce material gains and losses that could obscure the underlying trend of our long-term portfolio earnings. Similarly, we exclude gains from calls of residential credit-enhancement securities, as these are essentially sales of assets that produce a highly variable stream of income that may obscure some underlying income generation trends. GAAP earnings also include mark-to-market income and expenses for certain of our assets and interest rate agreements. These are unrealized market value fluctuations, and we exclude them from core earnings.
Management believes that core earnings provide relevant and useful information regarding results from operations. This information can be used in conjunction with and in addition to GAAP measures of performance. Core earnings can be useful, in part, because market valuation adjustments on only a portion of our assets and none of our liabilities are recognized through the income statement under GAAP. Thus, GAAP valuation adjustments may not be fully indicative of changes in market values on the balance sheet as a whole and may not be a reliable guide to current operating performance. Furthermore, gains or losses realized upon sales of assets vary based on portfolio management decisions; a sale of an asset for a gain or a loss may or may not affect ongoing earnings from operations. A reconciliation of core earnings to GAAP income appears in Table 2 of the Appendix.
CORE EQUITY (CORE BOOK VALUE)
Core equity is not a measure calculated in accordance with GAAP. Core equity is GAAP equity with mark-to-market gains and losses (“accumulated other comprehensive income”) excluded. GAAP equity includes mark-to-market adjustments for certain of our assets and interest rate agreements. Core equity in some ways approximates what our equity value would be if we used historical amortized cost accounting exclusively. A reconciliation of core equity to GAAP equity appears in Table 7 of the Appendix.
CORE REIT TAXABLE INCOME
Core REIT taxable income is REIT taxable income before gains and losses on asset sales and calls and before certain other expenses such as tax deductions for stock option exercises. It represents that portion of our REIT taxable income that may be more ongoing in nature.
APPENDIX
Glossary
CORE TAXABLE INCOME
Core taxable income is total taxable income before gains and losses on asset sales and calls and before certain other expenses such as tax deductions for stock option exercises. It represents that portion of our total taxable income that may be more ongoing in nature.
CPR
Constant (or conditional) prepayment rate (CPR) is an industry-standard measure of the speed at which mortgage loans prepay. It approximates the annual percentage rate at which a pool of loans is paying down due to prepayments.
CREDIT-ENHANCEMENT SECURITIES (CES)
Credit-enhancement securities (CES) absorb the initial credit losses generated by a pool of securitized assets. As a result, the more senior securities issued from that securitization are credit-enhanced (have less credit risk). Our definition of CES includes all the below investment-grade rated bonds issued from a securitization. These securities are also referred to as subordinated securities and B-pieces. For a typical securitization of prime residential loans, there are three CES - the first-loss, second-loss, and third-loss bonds. The first-loss security takes the initial risk. If credit losses within the securitized asset pool exceed the principal value of the first-loss security, the second-loss security is at risk. If cumulative losses exceed the principal value of the first- and second-loss securities, then the third-loss security is at risk. Generally, for these securitizations, the third-loss security has a credit rating of BB, the second-loss has a credit rating of B, and the first-loss is not rated. Other types of securitizations, such as commercial, CDO, subprime residential, and some alt-a residential transactions, are structured differently. Nevertheless, the below-IGS issued from these securitizations function as credit-enhancement securities for these transactions.
GAAP
Generally Accepted Accounting Principles in the United States.
INTEREST-ONLY SECURITIES (IOs)
Interest-only securities (IOs) are specialized securities that are backed by real estate loans. They receive interest payments calculated by a formula wherein IO cash flows vary as a function of interest payments generated by the underlying loans within a securitization or as a function of the spread between the yield on the loans owned by a securitization entity and the cost of funds of the securities (ABS) issued by that entity. Typically, IO securities do not have a principal balance and they will not receive principal payments. Interest payments to IO securities usually equal the IO interest rate formula multiplied by a “notional” principal balance. The notional principal balance for an IO is typically reduced over time as the actual principal balance of the underlying pool of real estate loans pays down, thus reducing IO cash flows over time. IO cash flows are typically reduced more quickly if loan prepayments accelerate. The IO securities that Redwood has acquired from some Sequoia residential securitizations typically earn an interest amount that varies as a function of the remaining principal balance of Sequoia loans and the spread between the yield on the residential loans owned by Sequoia and the cost of the asset-backed securities issued by Sequoia.
LEVERAGE RATIOS
We use collateralized debt to finance on a temporary basis the accumulation of inventory assets prior to sale to a securitization entity and also to finance ongoing investments in high-quality loans and investment-grade securities. As we increase these investments, Redwood debt is growing, although balances are still at what would be considered by many analysts to be low levels for financial institutions. However, because of the consolidation of independent securitization entities, it appears on our GAAP consolidated financial statements that Redwood is highly leveraged, with total liabilities significantly greater than equity. The obligations of these securitization entities are not obligations of Redwood. When determining the degree of financial leverage Redwood has, traditional leverage ratios may be misleading in some respects if consolidated ABS issued from securitization entities are included as part of Redwood’s obligations when calculating the ratio.
APPENDIX
Glossary
MARK-TO-MARKET ACCOUNTING
Mark-to-market accounting uses estimated current market values of assets, liabilities, and hedges to determine balance sheet values and/or income statement revenue recognition. For instance, many of our assets currently are carried on our balance sheet at their market value rather than historical amortized cost. For our income statement, mark-to-market accounting is used for some assets and hedges, and will also be used for assets if they become impaired under various accounting definitions of that term. Increasingly in the future, we expect to use mark-to-market accounting for income statement purposes for a wider variety of assets and liabilities. This will likely make quarter-to-quarter GAAP earnings trends more volatile, although core earning and taxable income will not be affected to the same degree.
NEGATIVE AMORTIZATION ADJUSTABLE-RATE MORTGAGES (NEG-AM ARMS, OPTION ARMS, OR MTA ARMS)
Negative amortization ARMs (neg-am ARMs, option ARMs, pay option ARMs, or monthly treasury average (MTA) ARMs) are adjustable-rate mortgages that allow the borrower to choose between different payment options. One of these options allows the borrower to make a minimum payment. This minimum payment is less than the interest accrued on the mortgage during that period and, in this instance, the borrower’s loan balance will increase (causing negative amortization of the loan balance).
PRIME RESIDENTIAL REAL ESTATE LOANS
Prime loans are residential loans with high-quality characteristics such as borrowers with high FICO credit scores, lower loan-to-value ratios, lower debt-to-income ratios, greater reserves, and more documentation.
PRIME SECURITIES
Prime securities are residential mortgage-backed securities backed by high credit, quality loans, generally with balances greater than conforming loan limits. Prime securities are typically backed by loans that have relatively high weighted average FICO scores (700 or higher), low weighted averages LTVs (75% or less), limited concentrations of investor properties, and low percentages of loans with low FICO or high LTV.
PROFITABILITY RATIOS
Many financial institution analysts use asset-based profitability ratios such as interest rate spread and interest rate margin in their work analyzing financial institutions. These are asset-based measures. Because we consolidate the assets and liabilities of securitization entities for GAAP purposes, our total GAAP assets and liabilities may vary strongly over time, and may not be comparable in economic reality to assets typically used in these calculations for other financial institutions. As a result, we believe equity-based profitability ratios may be more appropriate than asset-based measures for some analyses of Redwood’s operations. We believe, for example, that net interest income as a percentage of equity is a useful measure of profitability. For operating expenses, we believe useful measures are operating efficiency ratio (operating expenses as a percentage of net interest income) and operating expenses as a percentage of equity.
REAL ESTATE INVESTMENT TRUST (REIT)
An entity that makes a tax election to be taxed as a REIT, invests in real estate assets, and meets other REIT qualifications. By meeting certain tests, including the distribution as dividends of at least 90% of REIT taxable income, profits are not taxed at the corporate level for a REIT to the extent that these profits are distributed as dividends to stockholders. This provides an operating cost savings, as most profits are not taxed at the entity level. On the other hand, the requirement to pay out as dividends most of the REIT profits means it can be harder for a REIT to grow if using only internally-generated funds (as opposed to issuing new stock).
APPENDIX
Glossary
REDWOOD DEBT
Redwood debt is all debt that is an obligation of Redwood, with the exception of junior subordinated notes that we treat as part of our capital base. We obtain this debt from a variety of Wall Street firms, banks, and other institutions. In addition, we issue collateralized commercial paper.
REIT RETAINED TAXABLE INCOME
REIT retained taxable income is not a measure calculated in accordance with GAAP. REIT retained taxable income is the taxable income earned at the REIT after dividend distributions to our shareholders, less corporate income taxes and excise taxes paid at the REIT level. A reconciliation of REIT retained taxable income to GAAP income appears in Table 3 of the Appendix.
REIT SUBSIDIARY
A REIT subsidiary is a subsidiary of a REIT that is taxed as a REIT.
REIT TAXABLE INCOME
REIT taxable income is not a measure calculated in accordance with GAAP. REIT taxable income is pre-tax income calculated for tax purposes at Redwood including only its qualified REIT subsidiaries (excluding its taxable subsidiaries). REIT taxable income is an important measure as it is the basis of our dividend distributions to shareholders. We must distribute at least 90% of REIT taxable income as dividends to shareholders over time. As a REIT, we are not subject to corporate income taxes on the REIT taxable income we distribute. We pay income tax on the REIT taxable income we retain (we can retain up to 10% of the total). A reconciliation of REIT taxable income to GAAP income appears in Table 3 of the Appendix.
RETURN ON EQUITY (ROE) AND ADJUSTED RETURN ON EQUITY
ROE is the amount of profit we generate each year per dollar of equity capital. Adjusted ROE is GAAP income divided by core equity. Core equity excludes those balance sheet mark-to-market adjustments that are not included in our income statement. Thus, only those asset market value changes that are included in our income statement will affect adjusted ROE. A reconciliation of GAAP ROE to adjusted ROE appears in Table 8 of the Appendix.
SEQUOIA
Sequoia is the brand name for most of the securitizations of residential real estate loans we have sponsored.
SUBPRIME SECURITIES
Subprime securities are residential mortgage-backed securities backed by loans to borrowers who have impaired credit histories, but who exhibit the ability to repay the current loan. Typically, these borrowers have lower credit scores and/or other credit deficiencies that prevent them from qualifying for prime or alt-a mortgages. To compensate for the greater risks and higher costs to service the loans, subprime borrowers pay higher interest rates, points, and origination fees.
Subprime borrowers typically have experienced credit problems in the past, such as late payments or bankruptcies.
Typical characteristics of subprime loan pools are:
· More than 60% of loans with FICO < 680
· Weighted average LTV over 85%
· More than 70% of loans with LTV over 75%
· Loans with LTV over 80% with no mortgage insurance
APPENDIX
Glossary
TAXABLE SUBSIDIARY
A taxable subsidiary is a subsidiary of a REIT that is not taxed as a REIT and thus pays taxes on its income. A taxable subsidiary is not limited to investing in real estate and it can choose to retain all of its after-tax profits.
TOTAL RETAINED TAXABLE INCOME
Total retained taxable income is not a measure calculated in accordance with GAAP. Total retained taxable income is the taxable income earned at the REIT after dividend distributions to our shareholders, plus all of the taxable income earned at our taxable subsidiaries, less corporate income taxes and excise taxes paid. A reconciliation of total retained taxable income to GAAP income appears in Table 3 of the Appendix.
TOTAL TAXABLE INCOME
Total taxable income is not a measure calculated in accordance with GAAP. Total taxable income is pre-tax income for Redwood and all its subsidiaries as calculated for tax purposes. Taxable income calculations differ significantly from GAAP income calculations. The remainder of our total taxable income is income we earn in taxable subsidiaries. We pay income tax on this income and we generally retain the after-tax income at the subsidiary level. A reconciliation of total taxable income to GAAP income appears in Table 3 of the Appendix.
APPENDIX
[This Page Intentionally Left Blank]
APPENDIX
FINANCIAL TABLES
APPENDIX
[This Page Intentionally Left Blank]
Table 1: GAAP Earnings (in thousands, except per share data) |
| | | Q4:2006 | | Q3:2006 | | Q2:2006 | | Q1:2006 | | Q4:2005 | | Q3:2005 | | Q2:2005 | | Q1:2005 | | | | | | | |
| | | | | | | | | | | | | | | | | | | | | | | | |
| Interest income | | $ | 213,504 | | $ | 217,504 | | $ | 214,544 | | $ | 224,795 | | $ | 234,531 | | $ | 246,810 | | $ | 248,786 | | $ | 237,714 | | $ | 870,347 | | $ | 967,840 | | $ | 655,195 | |
| Discount amortization income | | | 20,323 | | | 19,530 | | | 14,381 | | | 14,661 | | | 11,936 | | | 12,714 | | | 8,395 | | | 9,316 | | | 68,895 | | | 42,361 | | | 36,071 | |
| Premium amortization expense | | | (14,930 | ) | | (12,920 | ) | | (13,193 | ) | | (13,398 | ) | | (14,451 | ) | | (15,698 | ) | | (10,203 | ) | | (8,082 | ) | | (54,441 | ) | | (48,434 | ) | | (32,412 | ) |
| Provision for (reversal of) credit reserve | | | (1,506 | ) | | (465 | ) | | 2,506 | | | (176 | ) | | (877 | ) | | 805 | | | 1,527 | | | (1,025 | ) | | 359 | | | 430 | | | (7,236 | ) |
| Total GAAP interest income | | | 217,391 | | | 223,649 | | | 218,238 | | | 225,882 | | | 231,139 | | | 244,631 | | | 248,505 | | | 237,923 | | | 885,160 | | | 962,197 | | | 651,618 | |
| | | | | | | | | | | | | | | | | | | | | | | | | | | | | | | | | | | |
| Interest expense on Redwood debt | | | (16,520 | ) | | (9,422 | ) | | (1,822 | ) | | (2,072 | ) | | (3,521 | ) | | (3,789 | ) | | (1,789 | ) | | (2,694 | ) | | (29,836 | ) | | (11,793 | ) | | (9,764 | ) |
| | | | | | | | | | | | | | | | | | | | | | | | | | | | | | | | | | | |
| ABS interest expense consolidated from trusts | | | (152,043 | ) | | (165,177 | ) | | (171,659 | ) | | (178,182 | ) | | (186,433 | ) | | (190,996 | ) | | (191,966 | ) | | (173,146 | ) | | (667,061 | ) | | (742,541 | ) | | (398,865 | ) |
| ABS issuance expense amortization | | | (7,898 | ) | | (5,786 | ) | | (6,079 | ) | | (5,907 | ) | | (6,069 | ) | | (5,162 | ) | | (5,386 | ) | | (5,273 | ) | | (25,670 | ) | | (21,890 | ) | | (16,829 | ) |
| ABS interest agreement expense | | | 2,497 | | | 3,317 | | | 3,678 | | | 2,980 | | | 3,573 | | | 623 | | | 876 | | | 1,469 | | | 12,472 | | | 6,541 | | | (13,235 | ) |
| ABS issuance premium amortization income | | | 1,530 | | | 2,395 | | | 2,363 | | | 2,526 | | | 2,793 | | | 2,733 | | | 3,140 | | | 3,747 | | | 8,814 | | | 12,413 | | | 7,272 | |
| Total consolidated ABS expense | | | (155,914 | ) | | (165,251 | ) | | (171,697 | ) | | (178,583 | ) | | (186,136 | ) | | (192,802 | ) | | (193,336 | ) | | (173,203 | ) | | (671,445 | ) | | (745,477 | ) | | (421,657 | ) |
| | | | | | | | | | | | | | | | | | | | | | | | | | | | | | | | | | | |
| Junior subordinated notes | | | (423 | ) | | - | | | - | | | - | | | - | | | - | | | - | | | - | | | (423 | ) | | - | | | - | |
| | | | | | | | | | | | | | | | | | | | | | | | | | | | | | | | | | | |
| GAAP net interest income | | | 44,534 | | | 48,976 | | | 44,719 | | | 45,227 | | | 41,481 | | | 48,040 | | | 53,380 | | | 62,026 | | | 183,456 | | | 204,927 | | | 220,197 | |
| | | | | | | | | | | | | | | | | | | | | | | | | | | | | | | | | | | |
| Fixed compensation expense | | | (3,688 | ) | | (3,437 | ) | | (3,309 | ) | | (3,437 | ) | | (2,879 | ) | | (2,802 | ) | | (2,623 | ) | | (2,778 | ) | | (13,871 | ) | | (11,082 | ) | | (8,040 | ) |
| Variable compensation expense | | | (4,899 | ) | | (5,209 | ) | | (4,891 | ) | | (4,208 | ) | | (5,005 | ) | | (4,241 | ) | | (5,174 | ) | | (4,565 | ) | | (19,207 | ) | | (18,985 | ) | | (16,794 | ) |
| Other operating expense | | | (4,732 | ) | | (4,425 | ) | | (5,150 | ) | | (4,505 | ) | | (4,583 | ) | | (4,246 | ) | | (3,542 | ) | | (3,698 | ) | | (18,812 | ) | | (16,069 | ) | | (10,324 | ) |
| Due diligence expenses | | | (532 | ) | | (384 | ) | | (2,687 | ) | | (432 | ) | | (298 | ) | | (1,075 | ) | | (117 | ) | | (757 | ) | | (4,035 | ) | | (2,246 | ) | | (3,534 | ) |
| Total GAAP operating expenses | | | (13,851 | ) | | (13,455 | ) | | (16,037 | ) | | (12,582 | ) | | (12,765 | ) | | (12,364 | ) | | (11,456 | ) | | (11,798 | ) | | (55,925 | ) | | (48,382 | ) | | (38,692 | ) |
| | | | | | | | | | | | | | | | | | | | | | | | | | | | | | | | | | | |
| Realized gains on sales | | | 5,308 | | | 4,968 | | | 8,239 | | | 1,062 | | | 14,815 | | | 23,053 | | | 516 | | | 8,346 | | | 19,577 | | | 46,730 | | | 7,639 | |
| Realized gains on calls | | | 1,511 | | | 722 | | | 747 | | | - | | | 4,265 | | | 2,914 | | | 4,421 | | | 7,548 | | | 2,980 | | | 19,149 | | | 58,739 | |
| Valuation adjustments | | | (1,404 | ) | | (5,257 | ) | | (2,993 | ) | | (2,932 | ) | | (1,205 | ) | | (1,051 | ) | | (1,892 | ) | | (883 | ) | | (12,586 | ) | | (5,031 | ) | | (7,251 | ) |
| Net gains and valuation adjustments | | | 5,415 | | | 433 | | | 5,993 | | | (1,870 | ) | | 17,875 | | | 24,916 | | | 3,045 | | | 15,011 | | | 9,971 | | | 60,848 | | | 59,127 | |
| | | | | | | | | | | | | | | | | | | | | | | | | | | | | | | | | | | |
| Provision for income taxes | | | (407 | ) | | (3,538 | ) | | (3,265 | ) | | (2,760 | ) | | (4,097 | ) | | (4,693 | ) | | (4,054 | ) | | (4,677 | ) | | (9,970 | ) | | (17,521 | ) | | (7,997 | ) |
| GAAP net income | | $ | 35,691 | | $ | 32,416 | | $ | 31,410 | | $ | 28,015 | | $ | 42,495 | | $ | 55,899 | | $ | 40,915 | | $ | 60,563 | | $ | 127,532 | | $ | 199,872 | | $ | 232,635 | |
| | | | | | | | | | | | | | | | | | | | | | | | | | | | | | | | | | | |
| Diluted average shares | | | 27,122 | | | 26,625 | | | 26,109 | | | 25,703 | | | 25,311 | | | 25,314 | | | 25,196 | | | 25,021 | | | 26,314 | | | 25,121 | | | 22,229 | |
| GAAP earnings per share | | $ | 1.32 | | $ | 1.22 | | $ | 1.20 | | $ | 1.09 | | $ | 1.68 | | $ | 2.21 | | $ | 1.62 | | $ | 2.42 | | $ | 4.85 | | $ | 7.96 | | $ | 10.47 | |
Table 2: Core Earnings (in thousands, except per share data) |
| | | Q4:2006 | | Q3:2006 | | Q2:2006 | | Q1:2006 | | Q4:2005 | | Q3:2005 | | Q2:2005 | | Q1:2005 | | | | | | | |
| | | | | | | | | | | | | | | | | | | | | | | | |
| GAAP net income | | $ | 35,691 | | $ | 32,416 | | $ | 31,410 | | $ | 28,015 | | $ | 42,495 | | $ | 55,899 | | $ | 40,915 | | $ | 60,563 | | $ | 127,532 | | $ | 199,872 | | $ | 232,635 | |
GAAP income items not included in core earnings | | | | | | | | | | | | | | | | | | | | | | | | | | | | | | | | | | |
| Realized gains on sales | | | 5,308 | | | 4,968 | | | 8,239 | | | 1,062 | | | 14,815 | | | 23,053 | | | 516 | | | 8,346 | | | 19,577 | | | 46,730 | | | 7,639 | |
| Realized gains on calls | | | 1,511 | | | 722 | | | 747 | | | - | | | 4,265 | | | 2,914 | | | 4,421 | | | 7,548 | | | 2,980 | | | 19,149 | | | 58,739 | |
| Valuation adjustments | | | (1,404 | ) | | (5,257 | ) | | (2,993 | ) | | (2,932 | ) | | (1,205 | ) | | (1,051 | ) | | (1,892 | ) | | (883 | ) | | (12,586 | ) | | (5,031 | ) | | (7,251 | ) |
| Variable stock option market value change | | | - | | | - | | | - | | | - | | | 25 | | | 16 | �� | | (2 | ) | | 84 | | | - | | | 123 | | | 98 | |
| Total GAAP / core earnings differences | | | 5,415 | | | 433 | | | 5,993 | | | (1,870 | ) | | 17,900 | | | 24,932 | | | 3,043 | | | 15,095 | | | 9,971 | | | 60,971 | | | 59,225 | |
| | | | | | | | | | | | | | | | | | | | | | | | | | | | | | | | | | | |
| Core earnings | | $ | 30,276 | | $ | 31,983 | | $ | 25,417 | | $ | 29,885 | | $ | 24,594 | | $ | 30,967 | | $ | 37,872 | | $ | 45,468 | | $ | 117,561 | | $ | 138,901 | | $ | 173,410 | |
Per share analysis | | | | | | | | | | | | | | | | | | | | | | | | | | | | | | | | | | |
| GAAP earnings per share | | $ | 1.32 | | $ | 1.22 | | $ | 1.20 | | $ | 1.09 | | $ | 1.68 | | $ | 2.21 | | $ | 1.62 | | $ | 2.42 | | $ | 4.85 | | $ | 7.96 | | $ | 10.47 | |
GAAP income items not included in core earnings | | | | | | | | | | | | | | | | | | | | | | | | | | | | | | | | | | |
| Realized gains on sales | | $ | 0.20 | | $ | 0.19 | | $ | 0.32 | | $ | 0.04 | | $ | 0.59 | | $ | 0.91 | | $ | 0.02 | | $ | 0.33 | | $ | 0.74 | | $ | 1.86 | | $ | 0.34 | |
| Realized gains on calls | | | 0.06 | | | 0.03 | | | 0.03 | | | - | | | 0.17 | | | 0.12 | | | 0.18 | | | 0.30 | | | 0.11 | | | 0.76 | | | 2.64 | |
| Valuation adjustments | | | (0.05 | ) | | (0.20 | ) | | (0.11 | ) | | (0.11 | ) | | (0.05 | ) | | (0.04 | ) | | (0.08 | ) | | (0.04 | ) | | (0.48 | ) | | (0.20 | ) | | (0.33 | ) |
| Variable stock option market value change | | | - | | | - | | | - | | | - | | | 0.00 | | | 0.00 | | | (0.00 | ) | | 0.00 | | | - | | | 0.00 | | | 0.00 | |
| GAAP / Core earnings differences per share | | $ | 0.20 | | $ | 0.02 | | $ | 0.23 | | | ($0.07 | ) | $ | 0.71 | | $ | 0.98 | | $ | 0.12 | | $ | 0.60 | | $ | 0.38 | | $ | 2.43 | | $ | 2.66 | |
| | | | | | | | | | | | | | | | | | | | | | | | | | | | | | | | | | | |
| Core earnings per share | | $ | 1.12 | | $ | 1.20 | | $ | 0.97 | | $ | 1.16 | | $ | 0.97 | | $ | 1.22 | | $ | 1.50 | | $ | 1.82 | | $ | 4.47 | | $ | 5.53 | | $ | 7.80 | |
Table 3: GAAP / TAX Differences (in thousands, except per share data) | |
| | | | | | | | | | | | | | | | | | | | |
| | | 2006 | | 2005 | | 2004 | |
| | | GAAP | | Difference | | Estimate Tax | | GAAP | | Difference | | | | GAAP | | Difference | | | |
| | | | | | | | | | | | | | | | | | | | |
| Interest income | | $ | 885,160 | | | ($516,673 | ) | $ | 368,487 | | $ | 962,197 | | | ($749,388 | ) | $ | 212,809 | | $ | 651,618 | | | ($394,571 | ) | $ | 257,047 | |
| Interest expense | | | (701,281 | ) | | 573,331 | | | (127,950 | ) | | (757,270 | ) | | 721,895 | | | (35,375 | ) | | (431,421 | ) | | 373,935 | | | (57,486 | ) |
| Junior subordinated notes | | | (423 | ) | | - | | | (423 | ) | | - | | | - | | | - | | | - | | | - | | | - | |
| Net interest income | | | 183,456 | | | 56,658 | | | 240,114 | | | 204,927 | | | (27,493 | ) | | 177,434 | | | 220,197 | | | (20,636 | ) | | 199,561 | |
| | | | | | | | | | | | | | | | | | | | | | | | | | | | | |
| Total operating expenses | | | (55,925 | ) | | (8,734 | ) | | (64,659 | ) | | (48,382 | ) | | 5,429 | | | (42,953 | ) | | (38,692 | ) | | (14,701 | ) | | (53,393 | ) |
| Realized gains on sales and calls | | | 22,557 | | | (20,609 | ) | | 1,948 | | | 65,879 | | | (11,191 | ) | | 54,688 | | | 66,378 | | | 30,558 | | | 96,936 | |
| Valuation adjustments | | | (12,586 | ) | | 12,586 | | | 0 | | | (5,031 | ) | | 5,031 | | | 0 | | | (7,251 | ) | | 7,251 | | | 0 | |
| Provision for income taxes | | | (9,970 | ) | | 7,090 | | | (2,880 | ) | | (17,521 | ) | | 12,278 | | | (5,243 | ) | | (7,997 | ) | | 5,870 | | | (2,127 | ) |
| Net income | | $ | 127,532 | | $ | 46,991 | | $ | 174,523 | | $ | 199,872 | | | ($15,946 | ) | $ | 183,926 | | $ | 232,635 | | $ | 8,342 | | $ | 240,977 | |
| | | | | | | | | | | | | | | | | | | | | | | | | | | | | |
| Shares used for EPS calculation | | | 26,314 | | | | | | 25,971 | | | 25,121 | | | | | | 24,754 | | | 22,229 | | | | | | 22,135 | |
| Earnings per share | | $ | 4.85 | | | | | $ | 6.72 | | $ | 7.96 | | | | | $ | 7.43 | | $ | 10.47 | | | | | $ | 10.89 | |
| | | | | | | | | | | | | | | | | | | | | | | | | | | | | |
Taxable Income (in thousands, except per share data) |
| | | | | | | | | | | | | | | | | | | | | | | | | | | | | |
| REIT taxable income | | | | | | | | $ | 167,002 | | | | | | | | $ | 171,309 | | | | | | | | $ | 201,873 | |
| Taxable income in taxable subsidiaries | | | | | | | | | 7,521 | | | | | | | | | 12,617 | | | | | | | | | 39,104 | |
| Total taxable income | | | | | | | | | 174,523 | | | | | | | | | 183,926 | | | | | | | | | 240,977 | |
| | | | | | | | | | | | | | | | | | | | | | | | | | | | | |
| Retained REIT taxable income (after-tax) | | | | | | | | | 6,652 | | | | | | | | | 6,118 | | | | | | | | | 9,315 | |
| Retained taxable income in taxable subsidaries (after-tax) | | | | | | | | | 4,791 | | | | | | | | | 6,809 | | | | | | | | | 26,007 | |
| Total retained taxable income (after-tax) | | | | | | | | $ | 11,443 | | | | | | | | $ | 12,927 | | | | | | | | $ | 35,322 | |
| | | | | | | | | | | | | | | | | | | | | | | | | | | | | |
| Shares used for taxable EPS calculation | | | | | | | | | 25,971 | | | | | | | | | 24,754 | | | | | | | | | 22,135 | |
| | | | | | | | | | | | | | | | | | | | | | | | | | | | | |
| REIT taxable income per share | | | | | | | | $ | 6.43 | | | | | | | | $ | 6.92 | | | | | | | | $ | 9.12 | |
| Taxable income in taxable subsidiaries per share | | | | | | | | $ | 0.29 | | | | | | | | $ | 0.51 | | | | | | | | $ | 1.77 | |
| Total taxable income per share | | | | | | | | $ | 6.72 | | | | | | | | $ | 7.43 | | | | | | | | $ | 10.89 | |
| | | | | | | | | | | | | | | | | | | | | | | | | | | | | |
| Total retained taxable income (after-tax) | | | | | | | | $ | 0.44 | | | | | | | | $ | 0.52 | | | | | | | | $ | 1.60 | |
Table 4: Retention and Distribution of Taxable Income (in thousands, except per share data) | |
| | | | | | | | | | | | | | | | | | | Estimated | | Actual | | Actual | |
| | | Estimated | | Actual | | Full Year | | Full Year | | Full Year | |
| | | Q4:2006 | | Q3:2006 | | Q2:2006 | | Q1:2006 | | Q4:2005 | | Q3:2005 | | Q2:2005 | | Q1:2005 | | 2006 | | 2005 | | 2004 | |
| Dividends declared | | $ | 98,476 | | $ | 18,237 | | $ | 17,967 | | $ | 17,767 | | $ | 92,150 | | $ | 17,335 | | $ | 17,253 | | $ | 17,160 | | $ | 152,447 | | $ | 143,898 | | $ | 199,923 | |
| Dividend deduction on stock issued through DRIP | | | - | | | 177 | | | 239 | | | 176 | | | 263 | | | 128 | | | 112 | | | 56 | | | 592 | | | 559 | | | 3,259 | |
| Total dividend deductions | | $ | 98,476 | | $ | 18,414 | | $ | 18,206 | | $ | 17,943 | | $ | 92,413 | | $ | 17,463 | | $ | 17,365 | | $ | 17,216 | | $ | 153,039 | | $ | 144,457 | | $ | 203,182 | |
| | | | | | | | | | | | | | | | | | | | | | | | | | | | | | | | | | | |
| Regular dividend per share | | $ | 0.70 | | $ | 0.70 | | $ | 0.70 | | $ | 0.70 | | $ | 0.70 | | $ | 0.70 | | $ | 0.70 | | $ | 0.70 | | $ | 2.80 | | $ | 2.80 | | $ | 2.68 | |
| Special dividend per share | | | 3.00 | | | - | | | - | | | - | | | 3.00 | | | - | | | - | | | - | | | 3.00 | | | 3.00 | | | 6.00 | |
| Total dividends per share | | $ | 3.70 | | $ | 0.70 | | $ | 0.70 | | $ | 0.70 | | $ | 3.70 | | $ | 0.70 | | $ | 0.70 | | $ | 0.70 | | $ | 5.80 | | $ | 5.80 | | $ | 8.68 | |
| | | | | | | | | | | | | | | | | | | | | | | | | | | | | | | | | | | |
| Undistributed REIT taxable income at beginning of period (pre-tax): | | $ | 111,421 | | $ | 88,257 | | $ | 65,687 | | $ | 51,568 | | $ | 106,719 | | $ | 80,166 | | $ | 62,218 | | $ | 37,291 | | $ | 51,568 | | $ | 37,291 | | $ | 53,354 | |
| REIT taxable income (pre-tax) | | | 40,408 | | | 45,934 | | | 45,040 | | | 35,382 | | | 39,793 | | | 47,118 | | | 39,237 | | | 45,161 | | | 166,764 | | | 171,309 | | | 201,873 | |
| Permanently retained (pre-tax) | | | (3,839 | ) | | (4,356 | ) | | (4,263 | ) | | (3,320 | ) | | (2,531 | ) | | (3,102 | ) | | (3,924 | ) | | (3,018 | ) | | (15,778 | ) | | (12,575 | ) | | (14,754 | ) |
| Dividend of 2004 income | | | - | | | - | | | - | | | - | | | - | | | (2,710 | ) | | (17,365 | ) | | (17,216 | ) | | - | | | (37,291 | ) | | (53,354 | ) |
| Dividend of 2005 income | | | - | | | (15,418 | ) | | (18,207 | ) | | (17,943 | ) | | (92,413 | ) | | (14,753 | ) | | - | | | - | | | (51,568 | ) | | (107,166 | ) | | (149,828 | ) |
| Dividend of 2006 income | | | (98,476 | ) | | (2,996 | ) | | - | | | - | | | - | | | - | | | - | | | - | | | (101,472 | ) | | - | | | - | |
Undistributed REIT taxable income at end of period (pre-tax): | | $ | 49,514 | | $ | 111,421 | | $ | 88,257 | | $ | 65,687 | | $ | 51,568 | | $ | 106,719 | | $ | 80,166 | | $ | 62,218 | | $ | 49,514 | | $ | 51,568 | | $ | 37,291 | |
| | | | | | | | | | | | | | | | | | | | | | | | | | | | | | | | | | | |
| Undistributed REIT taxable income (pre-tax) | | | | | | | | | | | | | | | | | | | | | | | | | | | | | | | | | | |
| From 2004's income | | $ | - | | $ | - | | $ | - | | $ | - | | $ | - | | $ | - | | $ | 2,710 | | $ | 20,075 | | $ | - | | $ | - | | $ | 37,291 | |
| From 2005's income | | | - | | | - | | | 15,418 | | | 33,625 | | | 51,568 | | | 106,719 | | | 77,456 | | | 42,143 | | | - | | | 51,568 | | | - | |
| From 2006's income | | | 49,514 | | | 111,421 | | | 72,839 | | | 32,062 | | | - | | | - | | | - | | | - | | | 49,514 | | | - | | | - | |
Total | | $ | 49,514 | | $ | 111,421 | | $ | 88,257 | | $ | 65,687 | | $ | 51,568 | | $ | 106,719 | | $ | 80,166 | | $ | 62,218 | | $ | 49,514 | | $ | 51,568 | | $ | 37,291 | |
| | | | | | | | | | | | | | | | | | | | | | | | | | | | | | | | | | | |
| Shares outstanding at period end | | | 26,733 | | | 26,053 | | | 25,668 | | | 25,382 | | | 25,133 | | | 24,764 | | | 24,647 | | | 24,514 | | | 26,733 | | | 25,133 | | | 24,154 | |
Undistributed REIT taxable income (pre-tax) per share outstanding | | $ | 1.85 | | $ | 4.28 | | $ | 3.44 | | $ | 2.59 | | $ | 2.04 | | $ | 4.31 | | $ | 3.25 | | $ | 2.54 | | $ | 1.85 | | $ | 2.05 | | $ | 1.54 | |
Table 5: Assets (in millions) |
| | | | | | | | | | | | | | | | | | | | |
| | | Q4:2006 | | Q3:2006 | | Q2:2006 | | Q1:2006 | | Q4:2005 | | Q3:2005 | | Q2:2005 | | Q1:2005 | | Q4:2004 | |
| Residential CES owned by Redwood | | $ | 230 | | $ | 291 | | $ | 403 | | $ | 303 | | $ | 309 | | $ | 338 | | $ | 469 | | $ | 374 | | $ | 351 | |
| Residential CES consolidated from Acacia | | | 492 | | | 424 | | | 274 | | | 292 | | | 284 | | | 305 | | | 215 | | | 214 | | | 211 | |
| Total GAAP residential CES | | $ | 722 | | $ | 715 | | $ | 677 | | $ | 595 | | $ | 593 | | $ | 643 | | $ | 684 | | $ | 588 | | $ | 562 | |
| | | | | | | | | | | | | | | | | | | | | | | | | | | | | |
| Residential loans owned by Redwood | | $ | 1,339 | | $ | 520 | | $ | 351 | | $ | 87 | | $ | 45 | | $ | 17 | | $ | 300 | | $ | 256 | | $ | 193 | |
| Residential loans consolidated from Sequoia | | | 7,985 | | | 9,323 | | | 10,102 | | | 11,903 | | | 13,830 | | | 16,539 | | | 19,330 | | | 21,516 | | | 22,311 | |
| Total GAAP residential loans | | $ | 9,324 | | $ | 9,843 | | $ | 10,453 | | $ | 11,990 | | $ | 13,875 | | $ | 16,556 | | $ | 19,630 | | $ | 21,772 | | $ | 22,504 | |
| | | | | | | | | | | | | | | | | | | | | | | | | | | | | |
| Residential IGS owned by Redwood | | $ | 318 | | $ | 105 | | $ | 206 | | $ | 42 | | $ | 151 | | $ | 139 | | $ | 140 | | $ | 22 | | $ | 59 | |
| Residential IGS consolidated from Acacia | | | 1,379 | | | 1,369 | | | 1,184 | | | 1,305 | | | 1,109 | | | 1,140 | | | 1,053 | | | 1,066 | | | 915 | |
| Total GAAP residential IGS | | $ | 1,697 | | $ | 1,474 | | $ | 1,390 | | $ | 1,347 | | $ | 1,260 | | $ | 1,279 | | $ | 1,193 | | $ | 1,088 | | $ | 974 | |
| | | | | | | | | | | | | | | | | | | | | | | | | | | | | |
| Commercial CES owned by Redwood | | $ | 224 | | $ | 156 | | $ | 93 | | $ | 68 | | $ | 59 | | $ | 98 | | $ | 79 | | $ | 73 | | $ | 39 | |
| Commercial CES consolidated from Acacia | | | 224 | | | 224 | | | 178 | | | 156 | | | 160 | | | 89 | | | 59 | | | 55 | | | 48 | |
| Total GAAP commercial CES | | $ | 448 | | $ | 380 | | $ | 271 | | $ | 224 | | $ | 219 | | $ | 187 | | $ | 138 | | $ | 128 | | $ | 87 | |
| | | | | | | | | | | | | | | | | | | | | | | | | | | | | |
| Commercial loans owned by Redwood | | $ | 2 | | $ | 2 | | $ | 2 | | $ | 2 | | $ | 7 | | $ | 21 | | $ | 16 | | $ | 22 | | $ | 32 | |
| Commercial loans consolidated from securitization | | | 26 | | | 30 | | | 36 | | | 53 | | | 53 | | | 35 | | | 26 | | | 35 | | | 22 | |
| Total GAAP commercial loans | | $ | 28 | | $ | 32 | | $ | 38 | | $ | 55 | | $ | 60 | | $ | 56 | | $ | 42 | | $ | 57 | | $ | 54 | |
| | | | | | | | | | | | | | | | | | | | | | | | | | | | | |
| Commercial IGS owned by Redwood | | $ | 0 | | $ | 0 | | $ | 1 | | $ | 3 | | $ | 6 | | $ | 23 | | $ | 10 | | $ | 1 | | $ | 7 | |
| Commercial IGS consolidated from Acacia | | | 120 | | | 135 | | | 130 | | | 182 | | | 179 | | | 200 | | | 208 | | | 205 | | | 214 | |
| Total GAAP commercial IGS | | $ | 120 | | $ | 135 | | $ | 131 | | $ | 185 | | $ | 185 | | $ | 223 | | $ | 218 | | $ | 206 | | $ | 221 | |
| | | | | | | | | | | | | | | | | | | | | | | | | | | | | |
| CDO CES owned by Redwood | | $ | 9 | | $ | 10 | | $ | 5 | | $ | 5 | | $ | 5 | | $ | 12 | | $ | 2 | | $ | 2 | | $ | 3 | |
| CDO CES consolidated from Acacia | | | 13 | | | 13 | | | 10 | | | 9 | | | 7 | | | - | | | - | | | - | | | - | |
| Total GAAP CDO CES | | $ | 22 | | $ | 23 | | $ | 15 | | $ | 14 | | $ | 12 | | $ | 12 | | $ | 2 | | $ | 2 | | $ | 3 | |
| | | | | | | | | | | | | | | | | | | | | | | | | | | | | |
| CDO IGS owned by Redwood | | $ | 14 | | $ | 2 | | $ | 17 | | $ | 4 | | $ | 6 | | $ | 5 | | $ | 6 | | $ | 0 | | $ | 0 | |
| CDO IGS consolidated from Acacia | | | 210 | | | 183 | | | 160 | | | 160 | | | 145 | | | 141 | | | 143 | | | 133 | | | 110 | |
| Total GAAP CDO IGS | | $ | 224 | | $ | 185 | | $ | 177 | | $ | 164 | | $ | 151 | | $ | 146 | | $ | 149 | | $ | 133 | | $ | 110 | |
| | | | | | | | | | | | | | | | | | | | | | | | | | | | | |
| Cash owned by Redwood | | $ | 168 | | $ | 113 | | $ | 106 | | $ | 85 | | $ | 176 | | $ | 163 | | $ | 72 | | $ | 65 | | $ | 57 | |
| Restricted cash consolidated from entities | | | 112 | | | 139 | | | 86 | | | 131 | | | 72 | | | 59 | | | 48 | | | 58 | | | 36 | |
| Accrued interest receivable | | | 71 | | | 67 | | | 67 | | | 73 | | | 76 | | | 80 | | | 85 | | | 82 | | | 72 | |
| Principal receivable | | | 4 | | | 1 | | | 1 | | | 2 | | | - | | | 2 | | | - | | | - | | | 3 | |
| Interest rate agreements | | | 27 | | | 30 | | | 54 | | | 48 | | | 31 | | | 25 | | | 13 | | | 29 | | | 16 | |
| Deferred tax asset | | | 5 | | | 3 | | | 5 | | | 5 | | | 5 | | | 8 | | | 7 | | | 8 | | | 11 | |
| Deferred asset-backed security issuance costs | | | 42 | | | 47 | | | 46 | | | 52 | | | 54 | | | 56 | | | 59 | | | 63 | | | 61 | |
| Other assets | | | 16 | | | 13 | | | 13 | | | 10 | | | 8 | | | 10 | | | 6 | | | 6 | | | 7 | |
| Total GAAP assets | | $ | 13,030 | | $ | 13,200 | | $ | 13,530 | | $ | 14,979 | | $ | 16,777 | | $ | 19,505 | | $ | 22,346 | | $ | 24,285 | | $ | 24,778 | |
| | | | | | | | | | | | | | | | | | | | | | | | | | | | | |
| Residential CES owned by Redwood | | $ | 230 | | $ | 291 | | $ | 403 | | $ | 303 | | $ | 309 | | $ | 338 | | $ | 469 | | $ | 374 | | $ | 351 | |
| Residential loans owned by Redwood | | | 1,339 | | | 520 | | | 351 | | | 87 | | | 45 | | | 17 | | | 300 | | | 256 | | | 193 | |
| Residential IGS owned by Redwood | | | 318 | | | 105 | | | 206 | | | 42 | | | 151 | | | 139 | | | 140 | | | 22 | | | 59 | |
| Commercial CES owned by Redwood | | | 224 | | | 156 | | | 93 | | | 68 | | | 59 | | | 98 | | | 79 | | | 73 | | | 39 | |
| Commercial loans owned by Redwood | | | 2 | | | 2 | | | 2 | | | 2 | | | 7 | | | 21 | | | 16 | | | 22 | | | 32 | |
| Commercial IGS owned by Redwood | | | - | | | - | | | 1 | | | 3 | | | 6 | | | 23 | | | 10 | | | 1 | | | 7 | |
| CDO CES owned by Redwood | | | 9 | | | 10 | | | 5 | | | 5 | | | 5 | | | 12 | | | 2 | | | 2 | | | 3 | |
| CDO IGS owned by Redwood | | | 14 | | | 2 | | | 17 | | | 4 | | | 6 | | | 5 | | | 6 | | | - | | | - | |
| Cash owned by Redwood | | | 168 | | | 113 | | | 106 | | | 85 | | | 176 | | | 163 | | | 72 | | | 65 | | | 57 | |
| Assets net of securitizations | | | 2,304 | | | 1,199 | | | 1,184 | | | 599 | | | 764 | | | 816 | | | 1,094 | | | 815 | | | 741 | |
| Assets of securitizations for GAAP | | | 10,449 | | | 11,701 | | | 12,074 | | | 14,060 | | | 15,767 | | | 18,449 | | | 21,034 | | | 23,224 | | | 23,831 | |
| ABS liabilities of entities for GAAP | | | (9,979 | ) | | (11,554 | ) | | (11,898 | ) | | (13,930 | ) | | (15,585 | ) | | (18,237 | ) | | (20,815 | ) | | (23,057 | ) | | (23,630 | ) |
| Redwood earning assets - GAAP basis | | $ | 2,774 | | $ | 1,346 | | $ | 1,360 | | $ | 729 | | $ | 946 | | $ | 1,028 | | $ | 1,313 | | $ | 982 | | $ | 942 | |
Table 6: Liabilities and Equity (all $ in millions) |
| | | | | | | | | | | | | | | | | | | | |
| | | Q4:2006 | | Q3:2006 | | Q2:2006 | | Q1:2006 | | Q4:2005 | | Q3:2005 | | Q2:2005 | | Q1:2005 | | Q4:2004 | |
| | | | | | | | | | | | | | | | | | | | |
| Redwood debt | | $ | 1,556 | | $ | 510 | | $ | 529 | | $ | - | | $ | 170 | | $ | 162 | | $ | 453 | | $ | 199 | | $ | 203 | |
| Madrona commercial paper | | | 300 | | | - | | | - | | | - | | | - | | | - | | | - | | | - | | | - | |
| Total Redwood debt | | | 1,856 | | | 510 | | | 529 | | | - | | | 170 | | | 162 | | | 453 | | | 199 | | | 203 | |
| | | | | | | | | | | | | | | | | | | | | | | | | | | | | |
| ABS issued, consolidated from entities | | | 9,907 | | | 11,466 | | | 11,775 | | | 13,788 | | | 15,422 | | | 18,049 | | | 20,598 | | �� | 22,821 | | | 23,383 | |
| Unamortized IO issuance premium | | | 75 | | | 90 | | | 106 | | | 124 | | | 143 | | | 163 | | | 186 | | | 202 | | | 210 | |
| Unamortized ABS issuance premium | | | (3 | ) | | (2 | ) | | 17 | | | 18 | | | 20 | | | 25 | | | 31 | | | 34 | | | 37 | |
| ABS obligations of entities | | | 9,979 | | | 11,554 | | | 11,898 | | | 13,930 | | | 15,585 | | | 18,237 | | | 20,815 | | | 23,057 | | | 23,630 | |
| | | | | | | | | | | | | | | | | | | | | | | | | | | | | |
| Junior subordinated notes | | | 100 | | | - | | | - | | | - | | | - | | | - | | | - | | | - | | | - | |
| | | | | | | | | | | | | | | | | | | | | | | | | | | | | |
| Accrued interest payable | | | 50 | | | 51 | | | 47 | | | 43 | | | 41 | | | 42 | | | 43 | | | 38 | | | 35 | |
| Interest rate agreements | | | 6 | | | 6 | | | 4 | | | - | | | 1 | | | 1 | | | 3 | | | - | | | 1 | |
| Accrued expenses and other liabilities | | | 17 | | | 18 | | | 29 | | | 21 | | | 28 | | | 30 | | | 23 | | | 26 | | | 29 | |
| Dividends payable | | | 19 | | | 18 | | | 18 | | | 18 | | | 17 | | | 17 | | | 17 | | | 17 | | | 16 | |
| Total GAAP liabilities | | | 12,027 | | | 12,157 | | | 12,525 | | | 14,012 | | | 15,842 | | | 18,489 | | | 21,354 | | | 23,337 | | | 23,914 | |
| | | | | | | | | | | | | | | | | | | | | | | | | | | | | |
| | | | | | | | | | | | | | | | | | | | | | | | | | | | | |
| Common stock and paid-in capital | | | 904 | | | 875 | | | 854 | | | 839 | | | 825 | | | 808 | | | 803 | | | 795 | | | 773 | |
| Accumulated other comprehensive income | | | 93 | | | 95 | | | 91 | | | 82 | | | 74 | | | 117 | | | 137 | | | 125 | | | 105 | |
| Cumulative GAAP earnings | | | 809 | | | 773 | | | 740 | | | 709 | | | 681 | | | 639 | | | 583 | | | 542 | | | 482 | |
| Cumulative distributions to shareholders | | | (803 | ) | | (700 | ) | | (681 | ) | | (663 | ) | | (645 | ) | | (548 | ) | | (531 | ) | | (514 | ) | | (496 | ) |
| GAAP stockholders' equity | | | 1,003 | | | 1,043 | | | 1,004 | | | 967 | | | 935 | | | 1,016 | | | 992 | | | 948 | | | 864 | |
| | | | | | | | | | | | | | | | | | | | | | | | | | | | | |
| Total GAAP liabilities and equity | | $ | 13,030 | | $ | 13,200 | | $ | 13,530 | | $ | 14,979 | | $ | 16,777 | | $ | 19,505 | | $ | 22,346 | | $ | 24,285 | | $ | 24,778 | |
| | | | | | | | | | | | | | | | | | | | | | | | | | | | | |
| Total Redwood debt | | $ | 1,856 | | $ | 510 | | $ | 529 | | $ | 0 | | $ | 170 | | $ | 162 | | $ | 453 | | $ | 199 | | $ | 203 | |
| Junior subordinated notes | | | 100 | | | - | | | - | | | - | | | - | | | - | | | - | | | - | | | - | |
| Redwood obligations | | $ | 1,956 | | $ | 510 | | $ | 529 | | $ | - | | $ | 170 | | $ | 162 | | $ | 453 | | $ | 199 | | $ | 203 | |
| | | | | | | | | | | | | | | | | | | | | | | | | | | | | |
| GAAP stockholders' equity | | $ | 1,003 | | $ | 1,043 | | $ | 1,004 | | $ | 967 | | $ | 935 | | $ | 1016 | | $ | 992 | | $ | 948 | | $ | 864 | |
| | | | | | | | | | | | | | | | | | | | | | | | | | | | | |
| Redwood obligations to equity | | | 2.0 | | | 0.5 | | | 0.5 | | | - | | | 0.2 | | | 0.2 | | | 0.5 | | | 0.2 | | | 0.2 | |
| Redwood obligations to (equity + Redwood obligations) | | | 66 | % | | 33 | % | | 35 | % | | 0 | % | | 15 | % | | 14 | % | | 31 | % | | 17 | % | | 19 | % |
| | | | | | | | | | | | | | | | | | | | | | | | | | | | | |
| Redwood obligations | | $ | 1,956 | | $ | 510 | | $ | 529 | | $ | 0 | | $ | 170 | | $ | 162 | | $ | 453 | | $ | 199 | | $ | 203 | |
| ABS obligations of entities | | | 9,979 | | | 11,554 | | | 11,898 | | | 13,930 | | | 15,585 | | | 18,237 | | | 20,815 | | | 23,057 | | | 23,630 | |
| GAAP debt | | $ | 11,935 | | $ | 12,064 | | $ | 12,427 | | $ | 13,930 | | $ | 15,755 | | $ | 18,399 | | $ | 21,268 | | $ | 23,256 | | $ | 23,833 | |
| | | | | | | | | | | | | | | | | | | | | | | | | | | | | |
| GAAP debt to equity | | | 11.9 | | | 11.6 | | | 12.4 | | | 14.4 | | | 16.9 | | | 18.1 | | | 21.4 | | | 24.5 | | | 27.6 | |
| GAAP debt to (equity + GAAP debt) | | | 92 | % | | 92 | % | | 93 | % | | 94 | % | | 94 | % | | 95 | % | | 96 | % | | 96 | % | | 97 | % |
|
| | | Q4:2006 | | Q3:2006 | | Q2:2006 | | Q1:2006 | | Q4:2005 | | Q3:2005 | | Q2:2005 | | Q1:2005 | | Full Year 2006 | | Full year 2005 | | Full year 2004 | |
| | | | | | | | | | | | | | | | | | | | | | | | |
| GAAP stockholders' equity | | $ | 1,002,690 | | $ | 1,042,661 | | $ | 1,004,265 | | $ | 967,333 | | $ | 934,960 | | $ | 1,016,065 | | $ | 991,757 | | $ | 948,001 | | $ | 1,002,690 | | $ | 934,960 | | $ | 864,156 | |
| Balance sheet mark-to-market adjustments | | | 93,158 | | | 94,780 | | | 90,937 | | | 81,591 | | | 73,731 | | | 117,043 | | | 137,380 | | | 124,784 | | | 93,158 | | | 73,731 | | | 105,357 | |
| Core equity | | $ | 909,532 | | $ | 947,881 | | $ | 913,328 | | $ | 885,742 | | $ | 861,229 | | $ | 899,022 | | $ | 854,377 | | $ | 823,217 | | $ | 909,532 | | $ | 861,229 | | $ | 758,799 | |
| | | | | | | | | | | | | | | | | | | | | | | | | | | | | | | | | | | |
| Shares outstanding at quarter end | | | 26,733 | | | 26,053 | | | 25,668 | | | 25,382 | | | 25,133 | | | 24,764 | | | 24,647 | | | 24,514 | | | 26,733 | | | 25,133 | | | 24,154 | |
| | | | | | | | | | | | | | | | | | | | | | | | | | | | | | | | | | | |
| GAAP equity per share | | $ | 37.51 | | $ | 40.02 | | $ | 39.13 | | $ | 38.11 | | $ | 37.20 | | $ | 41.03 | | $ | 40.24 | | $ | 38.67 | | $ | 37.51 | | $ | 37.20 | | $ | 35.78 | |
| Core equity per share | | $ | 34.02 | | $ | 36.38 | | $ | 35.58 | | $ | 34.90 | | $ | 34.27 | | $ | 36.30 | | $ | 34.66 | | $ | 33.58 | | $ | 34.02 | | $ | 34.27 | | $ | 31.42 | |
| | | | | | | | | | | | | | | | | | | | | | | | | | | | | | | | | | | |
| Net interest income (NII) | | $ | 44,534 | | $ | 48,976 | | $ | 44,719 | | $ | 45,227 | | $ | 41,481 | | $ | 48,040 | | $ | 53,380 | | $ | 62,026 | | $ | 183,456 | | $ | 204,927 | | $ | 220,197 | |
| Net interest income / average core equity | | | 19 | % | | 21 | % | | 20 | % | | 21 | % | | 19 | % | | 22 | % | | 25 | % | | 31 | % | | 20 | % | | 24 | % | | 34 | % |
| | | | | | | | | | | | | | | | | | | | | | | | | | | | | | | | | | | |
| Operating expenses | | $ | 13,851 | | $ | 13,455 | | $ | 16,037 | | $ | 12,582 | | $ | 12,765 | | $ | 12,364 | | $ | 11,456 | | $ | 11,798 | | $ | 55,925 | | $ | 48,382 | | $ | 38,692 | |
| | | | | | | | | | | | | | | | | | | | | | | | | | | | | | | | | | | |
| Average total assets | | $ | 13,041,794 | | $ | 13,480,361 | | $ | 14,168,755 | | $ | 15,839,483 | | $ | 18,348,681 | | $ | 20,991,299 | | $ | 23,365,553 | | $ | 24,563,184 | | $ | 14,123,149 | | $ | 21,797,922 | | $ | 21,559,604 | |
| Average total equity | | $ | 1,008,863 | | $ | 1,011,609 | | $ | 980,402 | | $ | 952,230 | | $ | 999,313 | | $ | 1,014,329 | | $ | 970,344 | | $ | 895,462 | | $ | 988,495 | | $ | 970,268 | | $ | 730,499 | |
| | | | | | | | | | | | | | | | | | | | | | | | | | | | | | | | | | | |
| Operating expenses / net interest income (NII) | | | 31 | % | | 27 | % | | 36 | % | | 28 | % | | 31 | % | | 26 | % | | 21 | % | | 19 | % | | 30 | % | | 24 | % | | 18 | % |
| Operating expenses / average total assets | | | 0.42 | % | | 0.40 | % | | 0.45 | % | | 0.32 | % | | 0.28 | % | | 0.24 | % | | 0.20 | % | | 0.19 | % | | 0.40 | % | | 0.22 | % | | 0.18 | % |
| Operating expenses / average total equity | | | 5 | % | | 5 | % | | 7 | % | | 5 | % | | 5 | % | | 5 | % | | 5 | % | | 5 | % | | 6 | % | | 5 | % | | 5 | % |
| | | | | | | | | | | | | | | | | | | | | | | | | | | | | | | | | | | |
| GAAP net income | | $ | 35,691 | | $ | 32,416 | | $ | 31,410 | | $ | 28,015 | | $ | 42,495 | | $ | 55,899 | | $ | 40,915 | | $ | 60,563 | | $ | 127,532 | | $ | 199,872 | | $ | 232,635 | |
| GAAP net income / average equity (GAAP ROE) | | | 14 | % | | 12 | % | | 13 | % | | 12 | % | | 18 | % | | 22 | % | | 17 | % | | 26 | % | | 13 | % | | 21 | % | | 27 | % |
| GAAP net income / average core equity (adjusted ROE) | | | 15 | % | | 14 | % | | 14 | % | | 13 | % | | 19 | % | | 25 | % | | 19 | % | | 30 | % | | 14 | % | | 24 | % | | 36 | % |
| | | | | | | | | | | | | | | | | | | | | | | | | | | | | | | | | | | |
| | | | | | | | | | | | | | | | | | | | | | | | | | | | | | | | | | | |
| Interest income | | $ | 217,391 | | $ | 223,649 | | $ | 218,238 | | $ | 225,882 | | $ | 231,139 | | $ | 244,631 | | $ | 248,505 | | $ | 237,923 | | $ | 885,160 | | $ | 962,197 | | $ | 651,618 | |
| Average consolidated earning assets | | $ | 12,498,889 | | $ | 12,860,488 | | $ | 13,581,710 | | $ | 15,229,790 | | $ | 17,542,352 | | $ | 20,085,392 | | $ | 22,606,037 | | $ | 24,042,561 | | $ | 13,533,367 | | $ | 21,048,582 | | $ | 21,208,757 | |
| Asset yield | | | 6.96 | % | | 6.96 | % | | 6.43 | % | | 5.93 | % | | 5.27 | % | | 4.87 | % | | 4.40 | % | | 3.96 | % | | 6.54 | % | | 4.57 | % | | 3.07 | % |
| | | | | | | | | | | | | | | | | | | | | | | | | | | | | | | | | | | |
| Interest expense | | | ($172,434 | ) | | ($174,673 | ) | | ($173,519 | ) | | ($180,655 | ) | | ($189,657 | ) | | ($196,591 | ) | | ($195,125 | ) | | ($175,897 | ) | | ($701,281 | ) | | ($757,270 | ) | | ($431,421 | ) |
| Average consolidated interest-bearing liablities | | $ | 11,815,316 | | $ | 12,332,390 | | $ | 13,055,417 | | $ | 14,800,315 | | $ | 17,194,545 | | $ | 19,840,201 | | $ | 22,283,915 | | $ | 23,601,534 | | $ | 12,990,908 | | $ | 20,710,057 | | $ | 20,748,657 | |
| Cost of funds | | | 5.84 | % | | 5.67 | % | | 5.32 | % | | 4.88 | % | | 4.41 | % | | 3.96 | % | | 3.50 | % | | 2.98 | % | | 5.40 | % | | 3.66 | % | | 2.08 | % |
| | | | | | | | | | | | | | | | | | | | | | | | | | | | | | | | | | | |
| Asset yield | | | 6.96 | % | | 6.96 | % | | 6.43 | % | | 5.93 | % | | 5.27 | % | | 4.87 | % | | 4.40 | % | | 3.96 | % | | 6.54 | % | | 4.57 | % | | 3.07 | % |
| Cost of funds | | | -5.84 | % | | -5.67 | % | | -5.32 | % | | -4.88 | % | | -4.41 | % | | -3.96 | % | | -3.50 | % | | -2.98 | % | | -5.40 | % | | -3.66 | % | | -2.08 | % |
| Interest rate spread | | | 1.12 | % | | 1.29 | % | | 1.11 | % | | 1.05 | % | | 0.86 | % | | 0.91 | % | | 0.89 | % | | 0.98 | % | | 1.14 | % | | 0.91 | % | | 0.99 | % |
| | | | | | | | | | | | | | | | | | | | | | | | | | | | | | | | | | | |
| Net interest income | | $ | 44,534 | | $ | 48,976 | | $ | 44,719 | | $ | 45,227 | | $ | 41,481 | | $ | 48,040 | | $ | 53,380 | | $ | 62,026 | | $ | 183,456 | | $ | 204,927 | | $ | 220,197 | |
| Average consolidated earning assets | | $ | 12,498,889 | | $ | 12,860,488 | | $ | 13,581,710 | | $ | 15,229,790 | | $ | 17,542,352 | | $ | 20,085,392 | | $ | 22,606,037 | | $ | 24,042,561 | | $ | 13,533,367 | | $ | 21,048,582 | | $ | 21,208,757 | |
| Net interest margin | | | 1.43 | % | | 1.52 | % | | 1.32 | % | | 1.19 | % | | 0.95 | % | | 0.96 | % | | 0.94 | % | | 1.03 | % | | 1.36 | % | | 0.97 | % | | 1.04 | % |
Table 8: Average Balance Sheet (in thousands) |
| | | | | | | | | | | | | | | | | | | | | | | | | | | | | | | | | | | |
| | | | Q4:2006 | | | Q3:2006 | | | Q2:2006 | | | Q1:2006 | | | Q4:2005 | | | Q3:2005 | | | Q2:2005 | | | Q1:2005 | | | Full Year 2006 | | | Full year 2005 | | | Full year 2004 | |
Average GAAP balances | | | | | | | | | | | | | | | | | | | | | | | | | | | | | | | | | | |
| Residential CES | | $ | 654,909 | | $ | 641,694 | | $ | 573,253 | | $ | 516,962 | | $ | 517,138 | | $ | 567,689 | | $ | 531,456 | | $ | 473,562 | | $ | 597,206 | | $ | 522,704 | | $ | 349,779 | |
| Residential loans | | | 9,212,346 | | | 9,947,068 | | | 10,789,275 | | | 12,542,519 | | | 14,821,587 | | | 17,597,906 | | | 20,312,485 | | | 21,925,643 | | | 10,611,827 | | | 18,642,020 | | | 19,665,096 | |
| Residential IGS | | | 1,513,794 | | | 1,404,281 | | | 1,358,453 | | | 1,299,933 | | | 1,263,277 | | | 1,219,034 | | | 1,122,945 | | | 1,030,406 | | | 1,393,736 | | | 1,158,785 | | | 771,543 | |
| Commercial CES | | | 364,405 | | | 328,211 | | | 253,429 | | | 215,769 | | | 191,586 | | | 152,641 | | | 123,390 | | | 102,699 | | | 290,964 | | | 142,850 | | | 40,622 | |
| Commercial loans | | | 29,571 | | | 32,194 | | | 42,912 | | | 56,777 | | | 59,049 | | | 47,703 | | | 45,214 | | | 56,080 | | | 40,267 | | | 52,008 | | | 30,469 | |
| Commercial IGS | | | 106,902 | | | 128,355 | | | 132,154 | | | 181,549 | | | 188,445 | | | 215,109 | | | 204,247 | | | 198,437 | | | 138,425 | | | 202,594 | | | 168,137 | |
| CDO CES | | | 19,539 | | | 20,999 | | | 13,950 | | | 14,709 | | | 12,231 | | | 11,892 | | | 2,816 | | | 6,302 | | | 17,245 | | | 8,155 | | | 4,668 | |
| CDO IGS | | | 198,749 | | | 174,363 | | | 171,687 | | | 157,570 | | | 149,660 | | | 138,996 | | | 138,777 | | | 124,747 | | | 175,358 | | | 138,207 | | | 83,193 | |
| Cash and cash equivalents | | | 398,674 | | | 183,323 | | | 246,597 | | | 244,002 | | | 339,379 | | | 134,422 | | | 124,707 | | | 124,685 | | | 268,340 | | | 181,259 | | | 95,251 | |
| Earning assets | | | 12,498,889 | | | 12,860,488 | | | 13,581,710 | | | 15,229,790 | | | 17,542,352 | | | 20,085,392 | | | 22,606,037 | | | 24,042,561 | | | 13,533,367 | | | 21,048,582 | | | 21,208,757 | |
| Other assets | | | 542,905 | | | 619,873 | | | 587,045 | | | 609,693 | | | 806,329 | | | 905,907 | | | 759,516 | | | 520,623 | | | 589,784 | | | 749,342 | | | 350,847 | |
| Total assets | | $ | 13,041,794 | | $ | 13,480,361 | | $ | 14,168,755 | | $ | 15,839,483 | | $ | 18,348,681 | | $ | 20,991,299 | | $ | 23,365,553 | | $ | 24,563,184 | | $ | 14,123,151 | | $ | 21,797,922 | | $ | 21,559,604 | |
| | | | | | | | | | | | | | | | | | | | | | | | | | | | | | | | | | | |
| | | | | | | | | | | | | | | | | | | | | | | | | | | | | | | | | | | |
| Redwood debt | | $ | 1,090,480 | | $ | 647,978 | | $ | 85,616 | | $ | 137,181 | | $ | 253,302 | | $ | 297,788 | | $ | 216,639 | | $ | 277,423 | | $ | 493,357 | | $ | 261,322 | | $ | 434,662 | |
| Junior subordinated notes | | | 21,401 | | | - | | | - | | | - | | | - | | | - | | | - | | | - | | | 5,336 | | | - | | | - | |
| ABS obligations of entities | | | 10,724,851 | | | 11,684,412 | | | 12,969,801 | | | 14,663,134 | | | 16,941,243 | | | 19,542,413 | | | 22,067,276 | | | 23,324,111 | | | 12,497,551 | | | 20,448,735 | | | 20,313,995 | |
| Other liabilities | | | 196,214 | | | 136,362 | | | 132,936 | | | 86,938 | | | 154,823 | | | 136,769 | | | 111,294 | | | 66,188 | | | 138,409 | | | 117,597 | | | 80,448 | |
| Total liabilities | | | 12,032,931 | | | 12,468,752 | | | 13,188,353 | | | 14,887,253 | | | 17,349,368 | | | 19,976,970 | | | 22,395,209 | | | 23,667,722 | | | 13,134,653 | | | 20,827,654 | | | 20,829,105 | |
| | | | | | | | | | | | | | | | | | | | | | | | | | | | | | | | | | | |
| Core equity | | | 923,856 | | | 932,030 | | | 898,409 | | | 877,212 | | | 880,329 | | | 880,482 | | | 840,098 | | | 794,866 | | | 908,071 | | | 849,257 | | | 641,182 | |
| Balance sheet mark-to-market adjustments | | | 85,007 | | | 79,579 | | | 81,993 | | | 75,018 | | | 118,984 | | | 133,847 | | | 130,246 | | | 100,596 | | | 80,424 | | | 121,011 | | | 89,317 | |
| Total equity | | | 1,008,863 | | | 1,011,609 | | | 980,402 | | | 952,230 | | | 999,313 | | | 1,014,329 | | | 970,344 | | | 895,462 | | | 988,495 | | | 970,268 | | | 730,499 | |
| Total liabilities and equity | | $ | 13,041,794 | | $ | 13,480,361 | | $ | 14,168,755 | | $ | 15,839,483 | | $ | 18,348,681 | | $ | 20,991,299 | | $ | 23,365,553 | | $ | 24,563,184 | | $ | 14,123,149 | | $ | 21,797,922 | | $ | 21,559,604 | |
Table 9: Balances & Yields (all $ in thousands) |
| | | | | | | | | | | | | | | | | | | | |
| | | | | At period end | | For period ended | |
| | | | | | | | | | | | | | | | | | | | |
| | | | | Current Face | | Unamortized Premium/ (Discount) | | Credit Protection | | Unrealized Market Value Gains | | Net Book Value | | Average Balance | | Interest Income | | Yield | |
| | | | | | | | | | | | | | | | | | | | |
Total Earning Assets (GAAP) | | | 2004 | | $ | 24,794,021 | | $ | 101,481 | | | ($418,174 | ) | $ | 95,396 | | $ | 24,572,724 | | $ | 21,208,757 | | $ | 651,618 | | | 3.07 | % |
| | | | Q1: 2005 | | | 24,301,643 | | | 122,952 | | | (487,952 | ) | | 102,712 | | | 24,039,355 | | | 24,042,561 | | | 237,922 | | | 3.96 | % |
| | | | Q2: 2005 | | | 22,414,484 | | | 103,778 | | | (522,490 | ) | | 133,207 | | | 22,128,979 | | | 22,606,037 | | | 248,505 | | | 4.40 | % |
| | | | Q3: 2005 | | | 19,625,979 | | | 94,058 | | | (551,562 | ) | | 98,873 | | | 19,267,348 | | | 20,085,392 | | | 244,631 | | | 4.87 | % |
| | | | Q4: 2005 | | | 16,986,581 | | | 13,375 | | | (527,213 | ) | | 56,541 | | | 16,529,284 | | | 17,542,352 | | | 231,139 | | | 5.27 | % |
| | | | 2005 | | | 16,986,581 | | | 13,375 | | | (527,213 | ) | | 56,541 | | | 16,529,284 | | | 21,048,582 | | | 962,197 | | | 4.57 | % |
| | | | Q1: 2006 | | | 15,168,319 | | | 12,214 | | | (572,066 | ) | | 50,479 | | | 14,658,946 | | | 15,229,790 | | | 225,882 | | | 5.93 | % |
| | | | Q2: 2006 | | | 13,865,566 | | | (18,161 | ) | | (645,303 | ) | | 56,653 | | | 13,258,755 | | | 13,581,710 | | | 218,238 | | | 6.43 | % |
| | | | Q3: 2006 | | | 13,553,988 | | | (72,430 | ) | | (670,246 | ) | | 88,943 | | | 12,900,255 | | | 12,860,488 | | | 223,649 | | | 6.96 | % |
| | | | Q4: 2006 | | | 13,475,346 | | | (113,138 | ) | | (695,846 | ) | | 86,527 | | | 12,752,890 | | | 12,498,889 | | | 217,391 | | | 6.96 | % |
| | | | 2006 | | $ | 13,475,346 | | | ($113,138 | ) | | ($695,846 | ) | $ | 86,527 | | $ | 12,752,890 | | $ | 13,533,367 | | $ | 885,160 | | | 6.54 | % |
| | | | | | | | | | | | | | | | | | | | | | | | | | | | | |
Residential CES | | | 2004 | | $ | 933,772 | | | ($110,724 | ) | | ($340,123 | ) | $ | 78,733 | | $ | 561,658 | | $ | 349,779 | | $ | 64,602 | | | 18.47 | % |
| | | | Q1: 2005 | | | 952,925 | | | (83,263 | ) | | (365,998 | ) | | 84,096 | | | 587,760 | | | 473,562 | | | 18,850 | | | 15.92 | % |
| | | | Q2: 2005 | | | 1,079,323 | | | (90,716 | ) | | (404,180 | ) | | 99,380 | | | 683,807 | | | 531,456 | | | 18,778 | | | 14.13 | % |
| | | | Q3: 2005 | | | 1,029,786 | | | (84,084 | ) | | (382,862 | ) | | 80,867 | | | 643,707 | | | 567,689 | | | 23,640 | | | 16.66 | % |
| | | | Q4: 2005 | | | 1,013,793 | | | (121,824 | ) | | (354,610 | ) | | 55,193 | | | 592,552 | | | 517,138 | | | 22,556 | | | 17.45 | % |
| | | | 2005 | | | 1,013,793 | | | (121,824 | ) | | (354,610 | ) | | 55,193 | | | 592,552 | | | 522,704 | | | 83,824 | | | 16.04 | % |
| | | | Q1: 2006 | | | 1,034,069 | | | (108,371 | ) | | (373,781 | ) | | 43,522 | | | 595,439 | | | 516,962 | | | 26,245 | | | 20.31 | % |
| | | | Q2: 2006 | | | 1,168,602 | | | (116,702 | ) | | (425,578 | ) | | 50,854 | | | 677,176 | | | 573,253 | | | 28,059 | | | 19.58 | % |
| | | | Q3: 2006 | | | 1,183,142 | | | (140,585 | ) | | (384,397 | ) | | 57,495 | | | 715,655 | | | 641,694 | | | 34,585 | | | 21.56 | % |
| | | | Q4: 2006 | | | 1,180,605 | | | (144,843 | ) | | (372,246 | ) | | 58,015 | | | 721,531 | | | 654,909 | | | 35,650 | | | 21.77 | % |
| | | | 2006 | | $ | 1,180,605 | | | ($144,843 | ) | | ($372,246 | ) | $ | 58,015 | | $ | 721,531 | | $ | 597,206 | | $ | 124,539 | | | 20.85 | % |
| | | | | | | | | | | | | | | | | | | | | | | | | | | | | |
Residential Real Estate Loans | | | 2004 | | $ | 22,312,842 | | $ | 215,694 | | | ($23,771 | ) | $ | 0 | | $ | 22,504,765 | | $ | 19,665,096 | | $ | 533,376 | | | 2.71 | % |
| | | | Q1: 2005 | | | 21,579,671 | | | 217,852 | | | (24,827 | ) | | 0 | | | 21,772,696 | | | 21,925,643 | | | 197,701 | | | 3.61 | % |
| | | | Q2: 2005 | | | 19,443,387 | | | 210,137 | | | (22,959 | ) | | 0 | | | 19,630,565 | | | 20,312,485 | | | 206,263 | | | 4.06 | % |
| | | | Q3: 2005 | | | 16,386,833 | | | 191,513 | | | (22,029 | ) | | 0 | | | 16,556,317 | | | 17,597,906 | | | 193,621 | | | 4.40 | % |
| | | | Q4: 2005 | | | 13,719,242 | | | 178,206 | | | (22,656 | ) | | 0 | | | 13,874,792 | | | 14,821,587 | | | 176,599 | | | 4.77 | % |
| | | | 2005 | | | 13,719,242 | | | 178,206 | | | (22,656 | ) | | 0 | | | 13,874,792 | | | 18,642,020 | | | 774,184 | | | 4.15 | % |
| | | | Q1: 2006 | | | 11,846,454 | | | 166,134 | | | (22,372 | ) | | 0 | | | 11,990,216 | | | 12,542,519 | | | 165,665 | | | 5.28 | % |
| | | | Q2: 2006 | | | 10,318,641 | | | 155,101 | | | (19,450 | ) | | 0 | | | 10,454,292 | | | 10,789,275 | | | 154,160 | | | 5.72 | % |
| | | | Q3: 2006 | | | 9,718,985 | | | 143,135 | | | (19,326 | ) | | 0 | | | 9,842,794 | | | 9,947,068 | | | 148,494 | | | 5.97 | % |
| | | | Q4: 2006 | | | 9,212,002 | | | 132,052 | | | (20,119 | ) | | 0 | | | 9,323,935 | | | 9,212,346 | | | 137,568 | | | 5.97 | % |
| | | | 2006 | | $ | 9,212,002 | | $ | 132,052 | | | ($20,119 | ) | $ | 0 | | $ | 9,323,935 | | $ | 10,611,827 | | | 605,886 | | | 5.71 | % |
Table 9: Balances & Yields (all $ in thousands) |
| | | | | | | | | | | | | | | | | | | | |
| | | | | At period end | | For period ended | |
| | | | | | | | | | | | | | | | | | | | |
| | | | | Current Face | | Unamortized Premium/ (Discount) | | Credit Protection | | Unrealized Market Value Gains | | Net Book Value | | Average Balance | | Interest Income | | Yield | |
| | | | | | | | | | | | | | | | | | | | |
| | | | | | | | | | | | | | | | | | | | |
Residential IGS | | | 2004 | | $ | 970,852 | | | ($2,922 | ) | $ | 0 | | $ | 5,955 | | $ | 973,885 | | $ | 771,543 | | $ | 30,842 | | | 4.00 | % |
| | | | Q1: 2005 | | | 1,084,556 | | | (9,054 | ) | | 0 | | | 11,895 | | | 1,087,397 | | | 1,030,406 | | | 12,865 | | | 4.99 | % |
| | | | Q2: 2005 | | | 1,189,207 | | | (12,165 | ) | | 0 | | | 16,252 | | | 1,193,294 | | | 1,122,945 | | | 13,909 | | | 4.95 | % |
| | | | Q3: 2005 | | | 1,282,132 | | | (13,970 | ) | | 0 | | | 11,082 | | | 1,279,244 | | | 1,219,034 | | | 16,942 | | | 5.56 | % |
| | | | Q4: 2005 | | | 1,273,985 | | | (11,595 | ) | | 0 | | | (2,300 | ) | | 1,260,090 | | | 1,263,277 | | | 18,148 | | | 5.75 | % |
| | | | 2005 | | | 1,273,985 | | | (11,595 | ) | | 0 | | | (2,300 | ) | | 1,260,090 | | | 1,158,785 | | | 61,864 | | | 5.34 | % |
| | | | Q1: 2006 | | | 1,361,245 | | | (19,874 | ) | | 0 | | | 5,304 | | | 1,346,675 | | | 1,299,933 | | | 20,179 | | | 6.21 | % |
| | | | Q2: 2006 | | | 1,406,195 | | | (18,788 | ) | | 0 | | | 2,609 | | | 1,390,016 | | | 1,358,453 | | | 22,287 | | | 6.56 | % |
| | | | Q3: 2006 | | | 1,484,095 | | | (17,362 | ) | | 0 | | | 8,270 | | | 1,475,003 | | | 1,404,281 | | | 24,961 | | | 7.11 | % |
| | | | Q4: 2006 | | | 1,708,607 | | | (16,382 | ) | | 0 | | | 5,025 | | | 1,697,250 | | | 1,513,794 | | | 25,626 | | | 6.77 | % |
| | | | 2006 | | $ | 1,708,607 | | | ($16,382 | ) | $ | 0 | | $ | 5,025 | | $ | 1,697,250 | | $ | 1,393,736 | | $ | 93,053 | | | 6.68 | % |
| | | | | | | | | | | | | | | | | | | | | | | | | | | | | |
Commercial CES | | | 2004 | | $ | 136,550 | | | ($6,563 | ) | | ($45,639 | ) | $ | 2,902 | | $ | 87,250 | | $ | 40,622 | | $ | 3,071 | | | 7.56 | % |
| | | | Q1: 2005 | | | 218,991 | | | (7,241 | ) | | (88,671 | ) | | 4,608 | | | 127,687 | | | 102,699 | | | 1,987 | | | 7.74 | % |
| | | | Q2: 2005 | | | 222,522 | | | (8,062 | ) | | (87,210 | ) | | 10,779 | | | 138,029 | | | 123,390 | | | 2,811 | | | 9.11 | % |
| | | | Q3: 2005 | | | 323,724 | | | (2,428 | ) | | (138,530 | ) | | 4,462 | | | 187,228 | | | 152,641 | | | 2,747 | | | 7.20 | % |
| | | | Q4: 2005 | | | 383,334 | | | (28,993 | ) | | (141,806 | ) | | 6,321 | | | 218,856 | | | 191,586 | | | 3,927 | | | 8.20 | % |
| | | | 2005 | | | 383,334 | | | (28,993 | ) | | (141,806 | ) | | 6,321 | | | 218,856 | | | 142,850 | | | 11,472 | | | 8.03 | % |
| | | | Q1: 2006 | | | 407,466 | | | (20,473 | ) | | (167,772 | ) | | 4,081 | | | 223,302 | | | 215,769 | | | 4,268 | | | 7.91 | % |
| | | | Q2: 2006 | | | 486,622 | | | (28,184 | ) | | (192,134 | ) | | 4,939 | | | 271,243 | | | 253,429 | | | 5,581 | | | 8.81 | % |
| | | | Q3: 2006 | | | 667,512 | | | (48,712 | ) | | (258,382 | ) | | 19,449 | | | 379,867 | | | 328,211 | | | 7,381 | | | 9.00 | % |
| | | | Q4: 2006 | | | 793,743 | | | (71,424 | ) | | (295,340 | ) | | 21,081 | | | 448,060 | | | 364,405 | | | 8,170 | | | 8.97 | % |
| | | | 2006 | | $ | 793,743 | | | ($71,424 | ) | | ($295,340 | ) | $ | 21,081 | | $ | 448,060 | | $ | 290,964 | | $ | 25,400 | | | 8.73 | % |
| | | | | | | | | | | | | | | | | | | | | | | | | | | | | |
Commercial Real Estate Loans | | | 2004 | | $ | 65,598 | | | ($2,478 | ) | | ($8,641 | ) | $ | 0 | | $ | 54,479 | | $ | 30,469 | | $ | 3,769 | | | 12.37 | % |
| | | | Q1: 2005 | | | 67,365 | | | (2,305 | ) | | (8,456 | ) | | 0 | | | 56,604 | | | 56,080 | | | 1,587 | | | 11.32 | % |
| | | | Q2: 2005 | | | 51,778 | | | (1,843 | ) | | (8,141 | ) | | 0 | | | 41,794 | | | 45,214 | | | 1,208 | | | 10.69 | % |
| | | | Q3: 2005 | | | 66,348 | | | (2,105 | ) | | (8,141 | ) | | 0 | | | 56,102 | | | 47,703 | | | 1,209 | | | 10.14 | % |
| | | | Q4: 2005 | | | 70,091 | | | (2,258 | ) | | (8,141 | ) | | 0 | | | 59,692 | | | 59,049 | | | 1,281 | | | 8.68 | % |
| | | | 2005 | | | 70,091 | | | (2,258 | ) | | (8,141 | ) | | 0 | | | 59,692 | | | 52,008 | | | 5,285 | | | 10.16 | % |
| | | | Q1: 2006 | | | 65,508 | | | (2,200 | ) | | (8,141 | ) | | 0 | | | 55,167 | | | 56,777 | | | 1,238 | | | 8.72 | % |
| | | | Q2: 2006 | | | 46,959 | | | (2,096 | ) | | (8,141 | ) | | 0 | | | 36,722 | | | 42,912 | | | 812 | | | 7.57 | % |
| | | | Q3: 2006 | | | 42,384 | | | (2,073 | ) | | (8,141 | ) | | 0 | | | 32,170 | | | 32,194 | | | 524 | | | 6.51 | % |
| | | | Q4: 2006 | | | 38,360 | | | (2,047 | ) | | (8,141 | ) | | 0 | | | 28,172 | | | 29,571 | | | 409 | | | 5.53 | % |
| | | | 2006 | | $ | 38,360 | | | ($2,047 | ) | | ($8,141 | ) | $ | 0 | | $ | 28,172 | | $ | 40,267 | | $ | 2,982 | | | 7.41 | % |
Table 9: Balances & Yields (all $ in thousands) |
| | | | | | | | | | | | | | | | | | | | |
| | | | | At period end | | For period ended | |
| | | | | | | | | | | | | | | | | | | | |
| | | | | Current Face | | Unamortized Premium/ (Discount) | | Credit Protection | | Unrealized Market Value Gains | | Net Book Value | | Average Balance | | Interest Income | | Yield | |
| | | | | | | | | | | | | | | | | | | | |
Commercial IGS | | | 2004 | | $ | 199,700 | | $ | 15,705 | | $ | 0 | | $ | 4,952 | | $ | 220,357 | | $ | 168,137 | | $ | 11,280 | | | 6.71 | % |
| | | | Q1: 2005 | | | 192,551 | | | 14,561 | | | 0 | | | (522 | ) | | 206,590 | | | 198,437 | | | 2,922 | | | 5.89 | % |
| | | | Q2: 2005 | | | 199,957 | | | 14,129 | | | 0 | | | 3,762 | | | 217,848 | | | 204,247 | | | 3,036 | | | 5.95 | % |
| | | | Q3: 2005 | | | 209,524 | | | 13,303 | | | 0 | | | (44 | ) | | 222,783 | | | 215,109 | | | 3,398 | | | 6.32 | % |
| | | | Q4: 2005 | | | 180,213 | | | 8,100 | | | 0 | | | (3,281 | ) | | 185,032 | | | 188,445 | | | 3,102 | | | 6.58 | % |
| | | | 2005 | | | 180,213 | | | 8,100 | | | 0 | | | (3,281 | ) | | 185,032 | | | 202,594 | | | 12,458 | | | 6.15 | % |
| | | | Q1: 2006 | | | 182,041 | | | 5,295 | | | 0 | | | (2,936 | ) | | 184,400 | | | 181,549 | | | 2,880 | | | 6.35 | % |
| | | | Q2: 2006 | | | 134,244 | | | 727 | | | 0 | | | (3,937 | ) | | 131,034 | | | 132,154 | | | 2,133 | | | 6.46 | % |
| | | | Q3: 2006 | | | 133,361 | | | 701 | | | 0 | | | 577 | | | 134,639 | | | 128,355 | | | 2,342 | | | 7.30 | % |
| | | | Q4: 2006 | | | 122,869 | | | (3,367 | ) | | 0 | | | 111 | | | 119,613 | | | 106,902 | | | 2,344 | | | 8.77 | % |
| | | | 2006 | | $ | 122,869 | | | ($3,367 | ) | $ | 0 | | $ | 111 | | $ | 119,613 | | $ | 138,425 | | $ | 9,699 | | | 7.01 | % |
| | | | | | | | | | | | | | | | | | | | | | | | | | | | | |
CDO CES | | | 2004 | | $ | 7,282 | | | ($4,426 | ) | $ | 0 | | $ | 196 | | $ | 3,052 | | $ | 4,668 | | $ | 723 | | | 15.49 | % |
| | | | Q1: 2005 | | | 10,184 | | | (7,113 | ) | | 0 | | | (287 | ) | | 2,784 | | | 6,302 | | | 246 | | | 15.61 | % |
| | | | Q2: 2005 | | | 10,184 | | | (7,232 | ) | | 0 | | | (187 | ) | | 2,765 | | | 2,816 | | | 127 | | | 18.04 | % |
| | | | Q3: 2005 | | | 20,226 | | | (7,907 | ) | | 0 | | | 144 | | | 12,463 | | | 11,892 | | | 131 | | | 4.41 | % |
| | | | Q4: 2005 | | | 20,226 | | | (8,004 | ) | | 0 | | | (484 | ) | | 11,738 | | | 12,231 | | | 125 | | | 4.09 | % |
| | | | 2005 | | | 20,226 | | | (8,004 | ) | | 0 | | | (484 | ) | | 11,738 | | | 8,155 | | | 629 | | | 7.71 | % |
| | | | Q1: 2006 | | | 23,226 | | | (8,048 | ) | | 0 | | | (436 | ) | | 14,742 | | | 14,709 | | | 439 | | | 11.94 | % |
| | | | Q2: 2006 | | | 22,226 | | | (7,978 | ) | | 0 | | | 470 | | | 14,718 | | | 13,950 | | | 236 | | | 6.77 | % |
| | | | Q3: 2006 | | | 29,231 | | | (7,298 | ) | | 0 | | | 326 | | | 22,259 | | | 20,999 | | | 609 | | | 11.60 | % |
| | | | Q4: 2006 | | | 28,731 | | | (6,889 | ) | | 0 | | | 122 | | | 21,964 | | | 19,539 | | | 570 | | | 11.67 | % |
| | | | 2006 | | $ | 28,731 | | | ($6,889 | ) | $ | 0 | | $ | 122 | | $ | 21,964 | | $ | 17,245 | | $ | 1,854 | | | 10.75 | % |
| | | | | | | | | | | | | | | | | | | | | | | | | | | | | |
CDO IGS | | | 2004 | | $ | 110,179 | | | ($2,805 | ) | $ | 0 | | $ | 2,658 | | $ | 110,032 | | $ | 83,193 | | $ | 3,033 | | | 3.65 | % |
| | | | Q1: 2005 | | | 130,686 | | | (485 | ) | | 0 | | | 2,922 | | | 133,123 | | | 124,747 | | | 1,184 | | | 3.80 | % |
| | | | Q2: 2005 | | | 145,933 | | | (470 | ) | | 0 | | | 3,221 | | | 148,684 | | | 138,777 | | | 1,569 | | | 4.52 | % |
| | | | Q3: 2005 | | | 144,246 | | | (264 | ) | | 0 | | | 2,362 | | | 146,344 | | | 138,996 | | | 1,953 | | | 5.62 | % |
| | | | Q4: 2005 | | | 149,812 | | | (257 | ) | | 0 | | | 1,092 | | | 150,647 | | | 149,660 | | | 2,571 | | | 6.87 | % |
| | | | 2005 | | | 149,812 | | | (257 | ) | | 0 | | | 1,092 | | | 150,647 | | | 138,207 | | | 7,277 | | | 5.26 | % |
| | | | Q1: 2006 | | | 162,844 | | | (249 | ) | | 0 | | | 944 | | | 163,539 | | | 157,570 | | | 2,491 | | | 6.32 | % |
| | | | Q2: 2006 | | | 175,586 | | | (241 | ) | | 0 | | | 1,718 | | | 177,063 | | | 171,687 | | | 2,099 | | | 4.89 | % |
| | | | Q3: 2006 | | | 182,352 | | | (236 | ) | | 0 | | | 2,826 | | | 184,942 | | | 174,363 | | | 2,881 | | | 6.61 | % |
| | | | Q4: 2006 | | | 222,413 | | | (238 | ) | | 0 | | | 2,174 | | | 224,349 | | | 198,749 | | | 3,335 | | | 6.71 | % |
| | | | 2006 | | $ | 222,413 | | | ($238 | ) | $ | 0 | | $ | 2,174 | | $ | 224,349 | | $ | 175,358 | | $ | 10,806 | | | 6.16 | % |
| | | | | | | | | | | | | | | | | | | | | | | | | | | | | |
Cash & Equivalents | | | 2004 | | $ | 57,246 | | $ | 0 | | $ | 0 | | $ | 0 | | $ | 57,246 | | $ | 95,251 | | $ | 922 | | | 0.97 | % |
| | | | Q1: 2005 | | | 64,714 | | | 0 | | | 0 | | | 0 | | | 64,714 | | | 124,685 | | | 580 | | | 1.86 | % |
| | | | Q2: 2005 | | | 72,193 | | | 0 | | | 0 | | | 0 | | | 72,193 | | | 124,707 | | | 804 | | | 2.58 | % |
| | | | Q3: 2005 | | | 163,160 | | | 0 | | | 0 | | | 0 | | | 163,160 | | | 134,422 | | | 990 | | | 2.95 | % |
| | | | Q4: 2005 | | | 175,885 | | | 0 | | | 0 | | | 0 | | | 175,885 | | | 339,379 | | | 2,830 | | | 3.34 | % |
| | | | 2005 | | | 175,885 | | | 0 | | | 0 | | | 0 | | | 175,885 | | | 181,259 | | | 5,204 | | | 2.87 | % |
| | | | Q1: 2006 | | | 85,466 | | | 0 | | | 0 | | | 0 | | | 85,466 | | | 244,002 | | | 2,477 | | | 4.06 | % |
| | | | Q2: 2006 | | | 106,491 | | | 0 | | | 0 | | | 0 | | | 106,491 | | | 246,597 | | | 2,871 | | | 4.66 | % |
| | | | Q3: 2006 | | | 112,926 | | | 0 | | | 0 | | | 0 | | | 112,926 | | | 183,323 | | | 1,872 | | | 4.08 | % |
| | | | Q4: 2006 | | | 168,016 | | | 0 | | | 0 | | | 0 | | | 168,016 | | | 398,674 | | | 3,719 | | | 3.73 | % |
| | | | 2006 | | $ | 168,016 | | $ | 0 | | $ | 0 | | $ | 0 | | $ | 168,016 | | $ | 268,340 | | $ | 10,939 | | | 4.08 | % |
Table 10: Portfolio Activity (in thousands) |
| | | | | | | | | | | | | | | | | | | | | | |
| | | | | Acquisitions | | Upgrades / Downgrades | | Sales to Third Parties | | Principal Payments | | Discount / (Premium) Amortization | | Credit Provision | | Net Charge-offs / (Recoveries) | | Net Mark-to-Market Adjustment | | Net Increase / (Decrease) | |
| | | | | | | | | | | | | | | | | | | | | | |
Total Earning | | | Q1: 2005 | | $ | 1,096,034 | | $ | 0 | | | ($47,571 | ) | | ($1,612,020 | ) | $ | 714 | | | ($1,025 | ) | $ | 154 | | $ | 22,877 | | | ($540,837 | ) |
| | | | Q2: 2005 | | | 670,979 | | | 0 | | | (17,582 | ) | | (2,604,175 | ) | | (2,281 | ) | | 1,527 | | | (34 | ) | | 33,711 | | | (1,917,855 | ) |
| | | | Q3: 2005 | | | 611,089 | | | 0 | | | (361,871 | ) | | (3,189,354 | ) | | (3,619 | ) | | 805 | | | 125 | | | (9,773 | ) | | (2,952,598 | ) |
| | | | Q4: 2005 | | | 513,554 | | | 0 | | | (473,899 | ) | | (2,759,267 | ) | | (3,012 | ) | | (877 | ) | | 250 | | | (27,538 | ) | | (2,750,789 | ) |
| | | | 2005 | | | 2,891,656 | | | 0 | | | (900,923 | ) | | (10,164,816 | ) | | (8,198 | ) | | 430 | | | 495 | | | 19,227 | | | (8,162,079 | ) |
| | | | Q1: 2006 | | | 216,290 | | | 0 | | | (13,634 | ) | | (1,975,141 | ) | | 547 | | | (176 | ) | | 425 | | | (8,229 | ) | | (1,779,919 | ) |
| | | | Q2: 2006 | | | 605,850 | | | 0 | | | (171,206 | ) | | (1,866,169 | ) | | 744 | | | 2,507 | | | 415 | | | 6,643 | | | (1,421,216 | ) |
| | | | Q3: 2006 | | | 1,288,070 | | | 0 | | | (65,192 | ) | | (1,631,603 | ) | | 6,168 | | | (465 | ) | | 589 | | | 37,498 | | | (364,935 | ) |
| | | | Q4: 2006 | | | 1,229,739 | | | 0 | | | (137,357 | ) | | (1,300,463 | ) | | 4,934 | | | (1,505 | ) | | 794 | | | 1,403 | | | (202,455 | ) |
| | | | 2006 | | $ | 3,340,949 | | $ | 0 | | | ($387,389 | ) | | ($6,773,376 | ) | $ | 12,392 | | $ | 361 | | $ | 2,223 | | $ | 37,315 | | | ($3,768,525 | ) |
| | | | | | | | | | | | | | | | | | | | | | | | | | | | | | | | |
Residential CES | | | Q1: 2005 | | $ | 67,796 | | | ($23,701 | ) | | ($27,293 | ) | | ($23,156 | ) | $ | 8,252 | | $ | 0 | | $ | 0 | | $ | 24,204 | | $ | 26,102 | |
| | | | Q2: 2005 | | | 87,864 | | | 0 | | | 0 | | | (18,931 | ) | | 7,424 | | | 0 | | | 0 | | | 19,690 | | | 96,047 | |
| | | | Q3: 2005 | | | 57,479 | | | 0 | | | (98,775 | ) | | (17,013 | ) | | 10,766 | | | 0 | | | 0 | | | 7,443 | | | (40,100 | ) |
| | | | Q4: 2005 | | | 54,664 | | | 0 | | | (81,292 | ) | | (21,523 | ) | | 10,098 | | | 0 | | | 0 | | | (13,102 | ) | | (51,155 | ) |
| | | | 2005 | | | 267,803 | | | (23,701 | ) | | (207,360 | ) | | (80,623 | ) | | 36,540 | | | 0 | | | 0 | | | 38,235 | | | 30,894 | |
| | | | Q1: 2006 | | | 52,822 | | | (30,667 | ) | | (9,650 | ) | | (14,110 | ) | | 12,391 | | | 0 | | | 0 | | | (7,899 | ) | | 2,887 | |
| | | | Q2: 2006 | | | 89,217 | | | 0 | | | (4,035 | ) | | (23,302 | ) | | 11,684 | | | 0 | | | 0 | | | 8,173 | | | 81,737 | |
| | | | Q3: 2006 | | | 87,305 | | | 0 | | | (47,585 | ) | | (28,835 | ) | | 15,917 | | | 0 | | | 0 | | | 11,677 | | | 38,479 | |
| | | | Q4: 2006 | | | 20,870 | | | 0 | | | (962 | ) | | (32,639 | ) | | 17,412 | | | 0 | | | 0 | | | 1,195 | | | 5,876 | |
| | | | 2006 | | $ | 250,210 | | | ($30,667 | ) | | ($62,232 | ) | | ($98,886 | ) | $ | 57,404 | | $ | 0 | | $ | 0 | | $ | 13,146 | | $ | 128,979 | |
| | | | | | | | | | | | | | | | | | | | | | | | | | | | | | | | |
| | | Q1: 2005 | | $ | 832,383 | | $ | 0 | | $ | 0 | | | ($1,555,752 | ) | | ($7,644 | ) | | ($1,210 | ) | $ | 154 | | $ | 0 | | | ($732,069 | ) |
| | | | Q2: 2005 | | | 426,933 | | | 0 | | | (3,378 | ) | | (2,557,675 | ) | | (9,758 | ) | | 1,527 | | | (34 | ) | | 254 | | | (2,142,131 | ) |
| | | | Q3: 2005 | | | 332,049 | | | 0 | | | (263,079 | ) | | (3,129,492 | ) | | (14,438 | ) | | 805 | | | 125 | | | (218 | ) | | (3,074,248 | ) |
| | | | Q4: 2005 | | | 271,875 | | | 0 | | | (240,987 | ) | | (2,698,500 | ) | | (13,334 | ) | | (877 | ) | | 250 | | | 48 | | | (2,681,525 | ) |
| | | | 2005 | | | 1,863,240 | | | 0 | | | (507,444 | ) | | (9,941,419 | ) | | (45,174 | ) | | 245 | | | 495 | | | 84 | | | (8,629,973 | ) |
| | | | Q1: 2006 | | | 52,691 | | | 0 | | | 0 | | | (1,925,475 | ) | | (12,075 | ) | | (141 | ) | | 425 | | | 0 | | | (1,884,575 | ) |
| | | | Q2: 2006 | | | 272,627 | | | 0 | | | 0 | | | (1,799,401 | ) | | (12,073 | ) | | 2,507 | | | 416 | | | 0 | | | (1,535,924 | ) |
| | | | Q3: 2006 | | | 966,673 | | | 0 | | | 0 | | | (1,567,041 | ) | | (11,254 | ) | | (465 | ) | | 589 | | | 0 | | | (611,498 | ) |
| | | | Q4: 2006 | | | 725,695 | | | 0 | | | 0 | | | (1,230,545 | ) | | (13,298 | ) | | (1,505 | ) | | 794 | | | 0 | | | (518,859 | ) |
| | | | 2006 | | $ | 2,017,775 | | $ | 0 | | $ | 0 | | | ($6,522,462 | ) | | ($48,709 | ) | $ | 396 | | $ | 2,141 | | $ | 0 | | | ($4,550,857 | ) |
| | | | | | | | | | | | | | | | | | | | | | | | | | | | | | | | |
Residential IGS | | | Q1: 2005 | | $ | 120,709 | | $ | 23,701 | | | ($11,488 | ) | | ($22,345 | ) | $ | 547 | | $ | 0 | | $ | 0 | | $ | 2,388 | | $ | 113,512 | |
| | | | Q2: 2005 | | | 128,708 | | | 0 | | | (3,012 | ) | | (22,961 | ) | | 347 | | | 0 | | | 0 | | | 2,818 | | | 105,900 | |
| | | | Q3: 2005 | | | 114,699 | | | 0 | | | 4,000 | | | (27,627 | ) | | 761 | | | 0 | | | 0 | | | (5,883 | ) | | 85,950 | |
| | | | Q4: 2005 | | | 116,987 | | | 0 | | | (95,328 | ) | | (29,834 | ) | | 790 | | | 0 | | | 0 | | | (11,769 | ) | | (19,154 | ) |
| | | | 2005 | | | 481,103 | | | 23,701 | | | (105,828 | ) | | (102,767 | ) | | 2,445 | | | 0 | | | 0 | | | (12,449 | ) | | 286,205 | |
| | | | Q1: 2006 | | | 80,970 | | | 30,667 | | | (3,984 | ) | | (25,445 | ) | | 853 | | | 0 | | | 0 | | | 3,524 | | | 86,585 | |
| | | | Q2: 2006 | | | 179,115 | | | 0 | | | (104,442 | ) | | (31,136 | ) | | 1,446 | | | 0 | | | 0 | | | (1,642 | ) | | 43,341 | |
| | | | Q3: 2006 | | | 120,316 | | | 0 | | | (12,669 | ) | | (29,997 | ) | | 1,943 | | | 0 | | | 0 | | | 5,394 | | | 84,987 | |
| | | | Q4: 2006 | | | 352,291 | | | 0 | | | (97,124 | ) | | (31,398 | ) | | 1,023 | | | 0 | | | 0 | | | (2,545 | ) | | 222,247 | |
| | | | 2006 | | $ | 732,692 | | $ | 30,667 | | | ($218,219 | ) | | ($117,976 | ) | $ | 5,265 | | $ | 0 | | $ | 0 | | $ | 4,731 | | $ | 437,160 | |
Table 10: Portfolio Activity (in thousands) |
| | | | | | | | | | | | | | | | | | | | | | | | | | | | | | | |
| | | | | | | | | | Upgrades / Downgrades | | | | | | | | | Discount / (Premium) Amortization | | | Credit Provision | | | Net Charge-offs / (Recoveries) | | | Net Mark-to-Market Adjustment | | | Net Increase / (Decrease) | |
| | | | | | | | | | | | | | | | | | | | | | | | | | | | | | | | |
Commercial CES | | | Q1: 2005 | | $ | 41,072 | | | ($2,192 | ) | $ | 0 | | | ($10 | ) | | ($174 | ) | $ | 0 | | $ | 0 | | $ | 1,741 | | $ | 40,437 | |
| | | | Q2: 2005 | | | 4,263 | | | 0 | | | 0 | | | (8 | ) | | 68 | | | 0 | | | 0 | | | 6,019 | | | 10,342 | |
| | | | Q3: 2005 | | | 55,941 | | | 0 | | | 0 | | | (8 | ) | | (416 | ) | | 0 | | | 0 | | | (6,318 | ) | | 49,199 | |
| | | | Q4: 2005 | | | 30,293 | | | 0 | | | 0 | | | (9 | ) | | (276 | ) | | 0 | | | 0 | | | 1,620 | | | 31,628 | |
| | | | 2005 | | | 131,569 | | | (2,192 | ) | | 0 | | | (35 | ) | | (798 | ) | | 0 | | | 0 | | | 3,062 | | | 131,606 | |
| | | | Q1: 2006 | | | 11,130 | | | (3,966 | ) | | 0 | | | (10 | ) | | (564 | ) | | 0 | | | 0 | | | (2,144 | ) | | 4,446 | |
| | | | Q2: 2006 | | | 51,978 | | | 0 | | | (2,820 | ) | | (9 | ) | | (257 | ) | | 0 | | | 0 | | | (951 | ) | | 47,941 | |
| | | | Q3: 2006 | | | 99,065 | | | 0 | | | (4,216 | ) | | (9 | ) | | (451 | ) | | 0 | | | 0 | | | 14,235 | | | 108,624 | |
| | | | Q4: 2006 | | | 76,498 | | | 0 | | | (9,914 | ) | | (13 | ) | | (289 | ) | | 0 | | | 0 | | | 1,913 | | | 68,193 | |
| | | | 2006 | | $ | 238,671 | | | ($3,966 | ) | | ($16,950 | ) | | ($41 | ) | | ($1,561 | ) | $ | 0 | | $ | 0 | | $ | 13,053 | | $ | 229,204 | |
| | | | | | | | | | | | | | | | | | | | | | | | | | | | | | | | |
Commercial Real Estate Loans | | | Q1: 2005 | | $ | 6,732 | | $ | 0 | | $ | 0 | | | ($5,267 | ) | | ($30 | ) | $ | 185 | | $ | 0 | | $ | 505 | | $ | 2,125 | |
| | | | Q2: 2005 | | | 0 | | | 0 | | | (11,192 | ) | | (3,769 | ) | | (99 | ) | | 0 | | | 0 | | | 250 | | | (14,810 | ) |
| | | | Q3: 2005 | | | 14,219 | | | 0 | | | (17 | ) | | 158 | | | (69 | ) | | 0 | | | 0 | | | 17 | | | 14,308 | |
| | | | Q4: 2005 | | | 4,248 | | | 0 | | | 0 | | | (506 | ) | | (152 | ) | | 0 | | | 0 | | | 0 | | | 3,590 | |
| | | | 2005 | | | 25,199 | | | 0 | | | (11,209 | ) | | (9,384 | ) | | (350 | ) | | 185 | | | 0 | | | 772 | | | 5,213 | |
| | | | Q1: 2006 | | | 0 | | | 0 | | | 0 | | | (4,583 | ) | | 93 | | | (35 | ) | | 0 | | | 0 | | | (4,525 | ) |
| | | | Q2: 2006 | | | 0 | | | 0 | | | (8,408 | ) | | (10,049 | ) | | 27 | | | 0 | | | 0 | | | (14 | ) | | (18,445 | ) |
| | | | Q3: 2006 | | | 0 | | | 0 | | | 0 | | | (4,574 | ) | | 22 | | | 0 | | | 0 | | | 0 | | | (4,552 | ) |
| | | | Q4: 2006 | | | 0 | | | 0 | | | 0 | | | (4,024 | ) | | 26 | | | 0 | | | 0 | | | 0 | | | (3,998 | ) |
| | | | 2006 | | $ | 0 | | $ | 0 | | | ($8,408 | ) | | ($23,230 | ) | $ | 168 | | | ($35 | ) | $ | 0 | | | ($14 | ) | | ($31,520 | ) |
| | | | | | | | | | | | | | | | | | | | | | | | | | | | | | | | |
Commercial IGS | | | Q1: 2005 | | $ | 3,500 | | $ | 2,192 | | | ($8,790 | ) | | ($5,298 | ) | | ($244 | ) | $ | 0 | | $ | 0 | | | ($5,127 | ) | | ($13,767 | ) |
| | | | Q2: 2005 | | | 7,845 | | | 0 | | | 0 | | | (594 | ) | | (281 | ) | | 0 | | | 0 | | | 4,288 | | | 11,258 | |
| | | | Q3: 2005 | | | 17,179 | | | 0 | | | (4,000 | ) | | (4,174 | ) | | (269 | ) | | 0 | | | 0 | | | (3,801 | ) | | 4,935 | |
| | | | Q4: 2005 | | | 29,684 | | | 0 | | | (56,292 | ) | | (8,560 | ) | | (145 | ) | | 0 | | | 0 | | | (2,438 | ) | | (37,751 | ) |
| | | | 2005 | | | 58,208 | | | 2,192 | | | (69,082 | ) | | (18,626 | ) | | (939 | ) | | 0 | | | 0 | | | (7,078 | ) | | (35,325 | ) |
| | | | Q1: 2006 | | | 2,177 | | | 3,966 | | | 0 | | | (5,006 | ) | | (159 | ) | | 0 | | | 0 | | | (1,610 | ) | | (632 | ) |
| | | | Q2: 2006 | | | 0 | | | 0 | | | (51,501 | ) | | (998 | ) | | (90 | ) | | 0 | | | 0 | | | (777 | ) | | (53,366 | ) |
| | | | Q3: 2006 | | | (3 | ) | | 0 | | | 0 | | | (883 | ) | | (14 | ) | | 0 | | | 0 | | | 4,505 | | | 3,605 | |
| | | | Q4: 2006 | | | 8,999 | | | 0 | | | (24,007 | ) | | (737 | ) | | 51 | | | 0 | | | 0 | | | 668 | | | (15,026 | ) |
| | | | 2006 | | $ | 11,173 | | $ | 3,966 | | | ($75,508 | ) | | ($7,624 | ) | | ($212 | ) | $ | 0 | | $ | 0 | | $ | 2,786 | | | ($65,419 | ) |
Table 10: Portfolio Activity (in thousands) |
| | | | | | | | | | | | | | | | | | | | | | | | | | | | | | | | |
| | | | | | | Acquisitions | | | Upgrades / Downgrades | | | Sales to Third Parties | | | Principal Payments | | | Discount / (Premium) Amortization | | | Credit Provision | | | Net Charge-offs / (Recoveries) | | | Net Mark-to-Market Adjustment | | | Net Increase / (Decrease) | |
CDO CES | | | Q1: 2005 | | | ($71 | ) | $ | 430 | | $ | 0 | | $ | 35 | | $ | 48 | | $ | 0 | | $ | 0 | | | ($710 | ) | | ($268 | ) |
| | | | Q2: 2005 | | | (119 | ) | | 0 | | | 0 | | | 0 | | | 0 | | | 0 | | | 0 | | | 100 | | | (19 | ) |
| | | | Q3: 2005 | | | 9,970 | | | 0 | | | 0 | | | 42 | | | 36 | | | 0 | | | 0 | | | (350 | ) | | 9,698 | |
| | | | Q4: 2005 | | | (97 | ) | | 0 | | | 0 | | | 0 | | | 0 | | | 0 | | | 0 | | | (628 | ) | | (725 | ) |
| | | | 2005 | | | 9,683 | | | 430 | | | 0 | | | 77 | | | 84 | | | 0 | | | 0 | | | (1,588 | ) | | 8,686 | |
| | | | Q1: 2006 | | | 3,000 | | | 0 | | | 0 | | | (44 | ) | | 0 | | | 0 | | | 0 | | | 48 | | | 3,004 | |
| | | | Q2: 2006 | | | (87 | ) | | 0 | | | 0 | | | (1,017 | ) | | 0 | | | 0 | | | 0 | | | 1,080 | | | (24 | ) |
| | | | Q3: 2006 | | | 7,714 | | | 0 | | | (722 | ) | | (29 | ) | | 0 | | | 0 | | | 0 | | | 578 | | | 7,541 | |
| | | | Q4: 2006 | | | 0 | | | 0 | | | 0 | | | (769 | ) | | 0 | | | 0 | | | 0 | | | 474 | | | (295 | ) |
| | | | 2006 | | $ | 10,627 | | $ | 0 | | | ($722 | ) | | ($1,859 | ) | $ | 0 | | $ | 0 | | $ | 0 | | $ | 2,180 | | $ | 10,226 | |
| | | | | | | | | | | | | | | | | | | | | | | | | | | | | | | | |
CDO IGS | | | Q1: 2005 | | $ | 23,913 | | | ($430 | ) | $ | 0 | | | ($227 | ) | | ($41 | ) | $ | 0 | | $ | 0 | | | ($124 | ) | $ | 23,091 | |
| | | | Q2: 2005 | | | 15,485 | | | 0 | | | 0 | | | (237 | ) | | 18 | | | 0 | | | 0 | | | 295 | | | 15,561 | |
| | | | Q3: 2005 | | | 9,553 | | | 0 | | | 0 | | | (11,240 | ) | | 10 | | | 0 | | | 0 | | | (663 | ) | | (2,340 | ) |
| | | | Q4: 2005 | | | 5,900 | | | 0 | | | 0 | | | (335 | ) | | 7 | | | 0 | | | 0 | | | (1,269 | ) | | 4,303 | |
| | | | 2005 | | | 54,851 | | | (430 | ) | | 0 | | | (12,039 | ) | | (6 | ) | | 0 | | | 0 | | | (1,761 | ) | | 40,615 | |
| | | | Q1: 2006 | | | 13,500 | | | 0 | | | 0 | | | (468 | ) | | 8 | | | 0 | | | 0 | | | (148 | ) | | 12,892 | |
| | | | Q2: 2006 | | | 13,000 | | | 0 | | | 0 | | | (257 | ) | | 7 | | | 0 | | | 0 | | | 774 | | | 13,524 | |
| | | | Q3: 2006 | | | 7,000 | | | 0 | | | 0 | | | (235 | ) | | 5 | | | 0 | | | 0 | | | 1,109 | | | 7,879 | |
| | | | Q4: 2006 | | | 45,388 | | | 0 | | | (5,350 | ) | | (338 | ) | | 9 | | | 0 | | | 0 | | | (302 | ) | | 39,407 | |
| | | | 2006 | | $ | 78,888 | | $ | 0 | | | ($5,350 | ) | | ($1,298 | ) | $ | 29 | | $ | 0 | | $ | 0 | | $ | 1,433 | | $ | 73,702 | |
Table 11: Managed Residential Loans Credit Performance (in thousands) |
| | | | | | | | | | | | | | | | | | | | | | | | | | |
| | | | | Managed Loans | | Internally-Designated Credit Reserve | | External Credit Enhancement | | Total Credit Protection (1) | | Total Credit Protection as % of Loans | | Seriously Delinquent Loans | | Seriously Delinquent Loan % of Current Balance | | Total Credit Losses | | Losses To Securities Junior to Redwood's Interest | | Redwood's Share of Net Charge-offs/(Recoveries) | | Total Credit Losses As % of Loans (Annualized) | |
| | | | | | | | | | | | | | | | | | | | | | | | | | |
Total Managed | | | 2004 | | $ | 166,658,801 | | $ | 363,894 | | | 67,650 | | $ | 431,544 | | | 0.26 | % | $ | 166,073 | | | 0.11 | % | $ | 3,303 | | $ | 271 | | $ | 3,032 | | | <0.01 | % |
Resi Portfolio | | | Q1: 2005 | | | 175,450,637 | | | 390,825 | | | 65,116 | | | 455,941 | | | 0.26 | % | | 217,894 | | | 0.12 | % | | 1,377 | | | 0 | | | 1,377 | | | <0.01 | % |
| | | | Q2: 2005 | | | 192,291,401 | | | 427,139 | | | 139,847 | | | 566,986 | | | 0.29 | % | | 230,538 | | | 0.12 | % | | 740 | | | 196 | | | 544 | | | <0.01 | % |
| | | | Q3: 2005 | | | 192,368,457 | | | 404,891 | | | 133,080 | | | 537,971 | | | 0.28 | % | | 268,341 | | | 0.14 | % | | 1,812 | | | 220 | | | 1,592 | | | <0.01 | % |
| | | | Q4: 2005 | | | 190,570,193 | | | 377,266 | | | 139,129 | | | 516,395 | | | 0.27 | % | | 349,068 | | | 0.18 | % | | 1,175 | | | 0 | | | 1,175 | | | <0.01 | % |
| | | | 2005 | | | 190,570,193 | | | 377,266 | | | 139,129 | | | 516,395 | | | 0.27 | % | | 349,068 | | | 0.18 | % | | 5,104 | | | 416 | | | 4,688 | | | <0.01 | % |
| | | | Q1: 2006 | | | 198,252,684 | | | 396,153 | | | 126,376 | | | 522,529 | | | 0.26 | % | | 467,352 | | | 0.24 | % | | 3,002 | | | 0 | | | 3,002 | | | <0.01 | % |
| | | | Q2: 2006 | | | 227,928,505 | | | 445,028 | | | 126,264 | | | 571,292 | | | 0.25 | % | | 441,430 | | | 0.19 | % | | 1,464 | | | 0 | | | 1,464 | | | <0.01 | % |
| | | | Q3: 2006 | | | 235,127,925 | | | 403,723 | | | 215,285 | | | 619,008 | | | 0.26 | % | | 658,262 | | | 0.28 | % | | 2,748 | | | 155 | | | 2,593 | | | <0.01 | % |
| | | | Q4: 2006 | | | 219,178,838 | | | 392,365 | | | 302,072 | | | 694,437 | | | 0.32 | % | | 850,761 | | | 0.39 | % | | 5,058 | | | 196 | | | 4,862 | | | <0.01 | % |
| | | | 2006 | | $ | 219,178,838 | | $ | 392,365 | | $ | 302,072 | | $ | 694,437 | | | 0.32 | % | $ | 850,761 | | | 0.39 | % | $ | 12,272 | | $ | 351 | | $ | 11,921 | | | <0.01 | % |
| | | | | | | | | | | | | | | | | | | | | | | | | | | | | | | | | | | | | | |
Residential Real | | | 2004 | | $ | 22,312,842 | | $ | 23,771 | | $ | 0 | | $ | 23,771 | | | 0.11 | % | $ | 13,338 | | | 0.06 | % | $ | 176 | | $ | 0 | | $ | 176 | | | <0.01 | % |
Estate Loans | | | Q1: 2005 | | | 21,579,671 | | | 24,827 | | | 0 | | | 24,827 | | | 0.12 | % | | 16,066 | | | 0.07 | % | | 154 | | | 0 | | | 154 | | | <0.01 | % |
| | | | Q2: 2005 | | | 19,443,387 | | | 22,959 | | | 0 | | | 22,959 | | | 0.12 | % | | 16,514 | | | 0.08 | % | | (34 | ) | | 0 | | | (34 | ) | | 0.00 | % |
| | | | Q3: 2005 | | | 16,386,833 | | | 22,029 | | | 0 | | | 22,029 | | | 0.13 | % | | 22,956 | | | 0.14 | % | | 90 | | | 0 | | | 90 | | | <0.01 | % |
| | | | Q4: 2005 | | | 13,719,242 | | | 22,656 | | | 0 | | | 22,656 | | | 0.17 | % | | 37,335 | | | 0.27 | % | | 251 | | | 0 | | | 251 | | | <0.01 | % |
| | | | 2005 | | | 13,719,242 | | | 22,656 | | | 0 | | | 22,656 | | | 0.17 | % | | 37,335 | | | 0.27 | % | | 461 | | | 0 | | | 461 | | | <0.01 | % |
| | | | Q1: 2006 | | | 11,846,454 | | | 22,372 | | | 0 | | | 22,372 | | | 0.19 | % | | 48,677 | | | 0.41 | % | | 425 | | | 0 | | | 425 | | | <0.01 | % |
| | | | Q2: 2006 | | | 10,318,641 | | | 19,450 | | | 0 | | | 19,450 | | | 0.19 | % | | 47,162 | | | 0.46 | % | | 423 | | | 0 | | | 423 | | | 0.02 | % |
| | | | Q3: 2006 | | | 9,718,985 | | | 19,326 | | | 0 | | | 19,326 | | | 0.20 | % | | 61,447 | | | 0.63 | % | | 589 | | | 0 | | | 589 | | | 0.02 | % |
| | | | Q4: 2006 | | | 9,212,002 | | | 20,119 | | | 0 | | | 20,119 | | | 0.22 | % | | 73,087 | | | 0.79 | % | | 711 | | | 0 | | | 711 | | | 0.03 | % |
| | | | 2006 | | $ | 9,212,002 | | $ | 20,119 | | $ | 0 | | $ | 20,119 | | | 0.22 | % | $ | 73,087 | | | 0.79 | % | $ | 2,148 | | $ | 0 | | $ | 2,148 | | | 0.02 | % |
| | | | | | | | | | | | | | | | | | | | | | | | | | | | | | | | | | | | | | |
Residential CES | | | 2004 | | $ | 144,345,959 | | $ | 340,123 | | $ | 67,650 | | $ | 407,773 | | | 0.28 | % | $ | 152,735 | | | 0.12 | % | $ | 3,127 | | $ | 271 | | $ | 2,856 | | | <0.01 | % |
| | | | Q1: 2005 | | | 153,870,966 | | | 365,998 | | | 65,116 | | | 431,114 | | | 0.28 | % | | 201,828 | | | 0.13 | % | | 1,223 | | | 0 | | | 1,223 | | | <0.01 | % |
| | | | Q2: 2005 | | | 172,848,014 | | | 404,180 | | | 139,847 | | | 544,027 | | | 0.31 | % | | 214,024 | | | 0.12 | % | | 774 | | | 196 | | | 578 | | | <0.01 | % |
| | | | Q3: 2005 | | | 175,981,624 | | | 382,862 | | | 133,080 | | | 515,942 | | | 0.29 | % | | 245,385 | | | 0.14 | % | | 1,722 | | | 220 | | | 1,502 | | | <0.01 | % |
| | | | Q4: 2005 | | | 176,850,951 | | | 354,610 | | | 139,129 | | | 493,739 | | | 0.28 | % | | 311,733 | | | 0.18 | % | | 924 | | | 0 | | | 924 | | | <0.01 | % |
| | | | 2005 | | | 176,850,951 | | | 354,610 | | | 139,129 | | | 493,739 | | | 0.28 | % | | 311,733 | | | 0.18 | % | | 4,643 | | | 416 | | | 4,227 | | | <0.01 | % |
| | | | Q1: 2006 | | | 186,406,230 | | | 373,781 | | | 126,376 | | | 500,157 | | | 0.27 | % | | 418,675 | | | 0.22 | % | | 2,577 | | | 0 | | | 2,577 | | | <0.01 | % |
| | | | Q2: 2006 | | | 217,609,864 | | | 425,578 | | | 126,264 | | | 551,842 | | | 0.25 | % | | 394,268 | | | 0.18 | % | | 1,041 | | | 0 | | | 1,041 | | | <0.01 | % |
| | | | Q3: 2006 | | | 225,408,940 | | | 384,397 | | | 215,285 | | | 599,682 | | | 0.27 | % | | 596,815 | | | 0.26 | % | | 2,159 | | | 155 | | | 2,004 | | | <0.01 | % |
| | | | Q4: 2006 | | | 209,966,836 | | | 372,246 | | | 302,072 | | | 674,318 | | | 0.32 | % | | 777,675 | | | 0.37 | % | | 4,347 | | | 196 | | | 4,151 | | | <0.01 | % |
| | | | 2006 | | $ | 209,966,836 | | $ | 372,246 | | $ | 302,072 | | $ | 674,318 | | | 0.32 | % | $ | 777,675 | | | 0.37 | % | $ | 10,124 | | $ | 351 | | $ | 9,773 | | | <0.01 | % |
(1) The credit reserve on residential real estate loans is only available to absorb losses on our residential real estate loans. Internally-designated credit reserves and external credit enhancement are only available to absorb losses on our residential CES.
Table 12: Residential CES and Underlying Loan Characteristics (all $ in thousands) | |
| | | Q4:2006 | | Q3:2006 | | Q2:2006 | | Q1:2006 | | Q4:2005 | | Q3:2005 | | Q2:2005 | | Q1:2005 | | Q4:2004 | |
| First loss position, principal value | | $ | 519,423 | | $ | 521,955 | | $ | 543,789 | | $ | 487,935 | | $ | 471,079 | | $ | 433,557 | | $ | 425,081 | | $ | 379,145 | | $ | 352,752 | |
| Second loss position, principal value | | | 190,802 | | | 189,978 | | | 216,806 | | | 172,345 | | | 164,426 | | | 224,987 | | | 298,821 | | | 260,855 | | | 276,720 | |
| Third loss position, principal value | | | 470,380 | | | 471,223 | | | 408,007 | | | 373,789 | | | 378,288 | | | 371,242 | | | 355,420 | | | 312,925 | | | 304,300 | |
| Total principal value | | $ | 1,180,605 | | $ | 1,183,156 | | $ | 1,168,602 | | $ | 1,034,069 | | $ | 1,013,793 | | $ | 1,029,786 | | $ | 1,079,322 | | $ | 952,925 | | $ | 933,772 | |
| | | | | | | | | | | | | | | | | | | | | | | | | | | | | |
| First loss position, reported value | | $ | 171,204 | | $ | 170,417 | | $ | 173,261 | | $ | 154,756 | | $ | 154,930 | | $ | 152,470 | | $ | 150,622 | | $ | 130,194 | | $ | 110,933 | |
| Second loss position, reported value | | | 141,697 | | | 139,180 | | | 155,531 | | | 121,951 | | | 115,060 | | | 165,402 | | | 222,282 | | | 188,310 | | | 195,536 | |
| Third loss position, reported value | | | 408,630 | | | 406,071 | | | 348,384 | | | 318,732 | | | 322,562 | | | 325,835 | | | 310,905 | | | 269,257 | | | 255,189 | |
| Total reported value | | $ | 721,531 | | $ | 715,668 | | $ | 677,176 | | $ | 595,439 | | $ | 592,552 | | $ | 643,707 | | $ | 683,809 | | $ | 587,761 | | $ | 561,658 | |
| | | | | | | | | | | | | | | | | | | | | | | | | | | | | |
| Internal designated credit reserves | | $ | 372,246 | | $ | 384,397 | | $ | 425,578 | | $ | 373,781 | | $ | 354,610 | | $ | 382,862 | | $ | 404,180 | | $ | 365,998 | | $ | 340,123 | |
| External credit enhancement | | | 302,072 | | | 215,285 | | | 126,264 | | | 126,376 | | | 139,129 | | | 133,080 | | | 139,847 | | | 65,116 | | | 67,650 | |
| Total credit protection | | $ | 674,318 | | $ | 599,682 | | $ | 551,842 | | $ | 500,157 | | $ | 493,739 | | $ | 515,942 | | $ | 544,027 | | $ | 431,114 | | $ | 407,773 | |
| As % of total portfolio | | | 0.32 | % | | 0.27 | % | | 0.25 | % | | 0.27 | % | | 0.28 | % | | 0.29 | % | | 0.31 | % | | 0.28 | % | | 0.32 | % |
| | | | | | | | | | | | | | | | | | | | | | | | | | | | | |
| Underlying residential real estate loans | | $ | 209,966,836 | | $ | 225,408,940 | | $ | 217,609,864 | | $ | 186,406,230 | | $ | 176,850,951 | | $ | 175,981,624 | | $ | 172,848,014 | | $ | 153,870,966 | | $ | 144,345,959 | |
| Number of credit-enhanced loans | | | 633,993 | | | 665,412 | | | 620,257 | | | 558,254 | | | 519,720 | | | 507,621 | | | 549,733 | | | 406,547 | | | 378,861 | |
| | | | | | | | | | | | | | | | | | | | | | | | | | | | | |
| Average loan size | | $ | 331 | | $ | 339 | | $ | 351 | | $ | 334 | | $ | 340 | | $ | 347 | | $ | 314 | | $ | 378 | | $ | 381 | |
| | | | | | | | | | | | | | | | | | | | | | | | | | | | | |
| Adjustable % | | | 23 | % | | 29 | % | | 31 | % | | 25 | % | | 29 | % | | 25 | % | | 26 | % | | 26 | % | | 26 | % |
| Hybrid % | | | 39 | % | | 36 | % | | 35 | % | | 36 | % | | 32 | % | | 32 | % | | 29 | % | | 28 | % | | 28 | % |
| Fixed % | | | 38 | % | | 35 | % | | 34 | % | | 39 | % | | 39 | % | | 43 | % | | 45 | % | | 46 | % | | 46 | % |
| | | | | | | | | | | | | | | | | | | | | | | | | | | | | |
| Amortizing % | | | 57 | % | | 51 | % | | 49 | % | | 57 | % | | 52 | % | | 57 | % | | 58 | % | | 59 | % | | 59 | % |
| Interest-only % | | | 24 | % | | 23 | % | | 23 | % | | 23 | % | | 24 | % | | 24 | % | | 23 | % | | 24 | % | | 24 | % |
| Negatively amortizing % | | | 19 | % | | 26 | % | | 28 | % | | 20 | % | | 24 | % | | 18 | % | | 18 | % | | 18 | % | | 17 | % |
| | | | | | | | | | | | | | | | | | | | | | | | | | | | | |
| Southern California | | | 25 | % | | 25 | % | | 26 | % | | 27 | % | | 25 | % | | 24 | % | | 24 | % | | 23 | % | | 22 | % |
| Northern California | | | 22 | % | | 22 | % | | 22 | % | | 24 | % | | 21 | % | | 20 | % | | 20 | % | | 20 | % | | 19 | % |
| Florida | | | 6 | % | | 6 | % | | 6 | % | | 5 | % | | 6 | % | | 5 | % | | 5 | % | | 5 | % | | 6 | % |
| New York | | | 5 | % | | 5 | % | | 5 | % | | 5 | % | | 5 | % | | 5 | % | | 5 | % | | 5 | % | | 5 | % |
| Virginia | | | 4 | % | | 4 | % | | 4 | % | | 4 | % | | 4 | % | | 4 | % | | 4 | % | | 4 | % | | 4 | % |
| New Jersey | | | 3 | % | | 3 | % | | 3 | % | | 3 | % | | 3 | % | | 4 | % | | 4 | % | | 4 | % | | 4 | % |
| Texas | | | 3 | % | | 3 | % | | 2 | % | | 3 | % | | 3 | % | | 3 | % | | 3 | % | | 3 | % | | 3 | % |
| Illinois | | | 3 | % | | 3 | % | | 3 | % | | 3 | % | | 3 | % | | 3 | % | | 3 | % | | 3 | % | | 3 | % |
| Other states (none greater than 3%) | | | 29 | % | | 29 | % | | 29 | % | | 28 | % | | 31 | % | | 32 | % | | 32 | % | | 32 | % | | 34 | % |
| | |
Table 12: Residential CES and Underlying Loan Characteristics (all $ in thousands) | |
| | | Q4:2006 | | Q3:2006 | | Q2:2006 | | Q1:2006 | | Q4:2005 | | Q3:2005 | | Q2:2005 | | Q1:2005 | | Q4:2004 | |
| Year 2006 origination | | | 13 | % | | 15 | % | | 10 | % | | 1 | % | | 0 | % | | 0 | % | | 0 | % | | 0 | % | | 0 | % |
| Year 2005 origination | | | 28 | % | | 28 | % | | 31 | % | | 32 | % | | 24 | % | | 15 | % | | 14 | % | | 6 | % | | 0 | % |
| Year 2004 origination | | | 23 | % | | 23 | % | | 26 | % | | 29 | % | | 34 | % | | 41 | % | | 50 | % | | 54 | % | | 55 | % |
| Year 2003 origination | | | 26 | % | | 24 | % | | 25 | % | | 30 | % | | 33 | % | | 35 | % | | 26 | % | | 29 | % | | 32 | % |
| Year 2002 origination | | | 5 | % | | 5 | % | | 5 | % | | 4 | % | | 6 | % | | 6 | % | | 5 | % | | 6 | % | | 7 | % |
| Year 2001 origination or earlier | | | 5 | % | | 5 | % | | 3 | % | | 4 | % | | 3 | % | | 3 | % | | 5 | % | | 5 | % | | 6 | % |
| | | | | | | | | | | | | | | | | | | | | | | | | | | | | |
| Wtg Avg Original LTV | | | 69 | % | | 69 | % | | 69 | % | | 68 | % | | 68 | % | | 68 | % | | 68 | % | | 68 | % | | 67 | % |
| Original LTV: 0% - 20% | | | 1 | % | | 1 | % | | 1 | % | | 1 | % | | 1 | % | | 1 | % | | 0 | % | | 0 | % | | 0 | % |
| Original LTV: 20% - 30% | | | 2 | % | | 1 | % | | 1 | % | | 2 | % | | 2 | % | | 2 | % | | 2 | % | | 1 | % | | 2 | % |
| Original LTV: 30% - 40% | | | 3 | % | | 3 | % | | 3 | % | | 4 | % | | 4 | % | | 4 | % | | 4 | % | | 3 | % | | 4 | % |
| Original LTV: 40% - 50% | | | 7 | % | | 7 | % | | 7 | % | | 7 | % | | 7 | % | | 8 | % | | 8 | % | | 7 | % | | 8 | % |
| Original LTV: 50% - 60% | | | 11 | % | | 11 | % | | 11 | % | | 11 | % | | 12 | % | | 12 | % | | 12 | % | | 12 | % | | 12 | % |
| Original LTV: 60% - 70% | | | 21 | % | | 21 | % | | 22 | % | | 21 | % | | 22 | % | | 22 | % | | 22 | % | | 23 | % | | 23 | % |
| Original LTV: 70% - 75% | | | 14 | % | | 15 | % | | 15 | % | | 15 | % | | 15 | % | | 15 | % | | 15 | % | | 15 | % | | 15 | % |
| Original LTV: 75% - 80% | | | 36 | % | | 36 | % | | 35 | % | | 35 | % | | 34 | % | | 34 | % | | 33 | % | | 34 | % | | 33 | % |
| Original LTV: 80% - 90% | | | 3 | % | | 3 | % | | 3 | % | | 3 | % | | 2 | % | | 2 | % | | 3 | % | | 2 | % | | 2 | % |
| Original LTV: 90% - 100% | | | 2 | % | | 2 | % | | 2 | % | | 1 | % | | 1 | % | | 1 | % | | 1 | % | | 1 | % | | 1 | % |
| | | | | | | | | | | | | | | | | | | | | | | | | | | | | |
| Wtg Avg FICO | | | 730 | | | 729 | | | 731 | | | 732 | | | 732 | | | 732 | | | 731 | | | 731 | | | 730 | |
| FICO: <= 600 | | | 1 | % | | 1 | % | | 1 | % | | 1 | % | | 0 | % | | 0 | % | | 0 | % | | 0 | % | | 0 | % |
| FICO: 601 -620 | | | 1 | % | | 1 | % | | 1 | % | | 1 | % | | 1 | % | | 0 | % | | 0 | % | | 0 | % | | 0 | % |
| FICO: 621 - 640 | | | 2 | % | | 2 | % | | 2 | % | | 2 | % | | 2 | % | | 2 | % | | 2 | % | | 2 | % | | 2 | % |
| FICO: 641 -660 | | | 4 | % | | 4 | % | | 4 | % | | 4 | % | | 4 | % | | 4 | % | | 4 | % | | 4 | % | | 4 | % |
| FICO: 661 - 680 | | | 7 | % | | 7 | % | | 7 | % | | 7 | % | | 7 | % | | 7 | % | | 7 | % | | 7 | % | | 7 | % |
| FICO: 681 - 700 | | | 10 | % | | 11 | % | | 11 | % | | 10 | % | | 11 | % | | 11 | % | | 11 | % | | 11 | % | | 11 | % |
| FICO: 701 - 720 | | | 12 | % | | 13 | % | | 13 | % | | 12 | % | | 13 | % | | 13 | % | | 13 | % | | 13 | % | | 13 | % |
| FICO: 721 - 740 | | | 13 | % | | 13 | % | | 13 | % | | 13 | % | | 13 | % | | 14 | % | | 14 | % | | 14 | % | | 14 | % |
| FICO: 741 - 760 | | | 14 | % | | 14 | % | | 14 | % | | 15 | % | | 15 | % | | 15 | % | | 15 | % | | 16 | % | | 16 | % |
| FICO: 761 - 780 | | | 16 | % | | 16 | % | | 16 | % | | 17 | % | | 17 | % | | 17 | % | | 17 | % | | 17 | % | | 17 | % |
| FICO: 781 - 800 | | | 12 | % | | 12 | % | | 12 | % | | 12 | % | | 12 | % | | 12 | % | | 12 | % | | 11 | % | | 11 | % |
| FICO: >= 801 | | | 4 | % | | 4 | % | | 4 | % | | 4 | % | | 3 | % | | 3 | % | | 3 | % | | 2 | % | | 2 | % |
| Unknown | | | 4 | % | | 2 | % | | 3 | % | | 3 | % | | 1 | % | | 2 | % | | 2 | % | | 2 | % | | 2 | % |
| | | | | | | | | | | | | | | | | | | | | | | | | | | | | |
| Conforming balance at origination % | | | 37 | % | | 37 | % | | 35 | % | | 37 | % | | 25 | % | | 23 | % | | 22 | % | | 20 | % | | 17 | % |
| % balance in loans > $1mm per loan | | | 8 | % | | 9 | % | | 9 | % | | 7 | % | | 8 | % | | 6 | % | | 6 | % | | 6 | % | | 5 | % |
| | | | | | | | | | | | | | | | | | | | | | | | | | | | | |
| 2nd home % | | | 6 | % | | 6 | % | | 6 | % | | 6 | % | | 6 | % | | 6 | % | | 5 | % | | 5 | % | | 5 | % |
| Investment home % | | | 3 | % | | 3 | % | | 3 | % | | 2 | % | | 3 | % | | 2 | % | | 3 | % | | 2 | % | | 2 | % |
| | | | | | | | | | | | | | | | | | | | | | | | | | | | | |
| Purchase | | | 40 | % | | 39 | % | | 38 | % | | 38 | % | | 36 | % | | 36 | % | | 35 | % | | 36 | % | | 34 | % |
| Cash out refinance | | | 29 | % | | 30 | % | | 31 | % | | 29 | % | | 29 | % | | 27 | % | | 26 | % | | 26 | % | | 26 | % |
| Rate-term refinance | | | 30 | % | | 30 | % | | 30 | % | | 32 | % | | 34 | % | | 36 | % | | 38 | % | | 38 | % | | 40 | % |
| Construction | | | 0 | % | | 0 | % | | 0 | % | | 0 | % | | 0 | % | | 0 | % | | 0 | % | | 0 | % | | 0 | % |
| Other | | | 1 | % | | 1 | % | | 1 | % | | 1 | % | | 1 | % | | 1 | % | | 1 | % | | 0 | % | | 0 | % |
Table 13: Residential Real Estate Loan Characteristics (all $ in thousands) | |
| | | | | | | | | | | | | | | | | | | | |
| | | Q4:2006 | | Q3:2006 | | Q2:2006 | | Q1:2006 | | Q4:2005 | | Q3:2005 | | Q2:2005 | | Q1:2005 | | Q4:2004 | |
| Residential Loans | | $ | 9,212,002 | | $ | 9,718,985 | | $ | 10,318,641 | | $ | 11,846,454 | | $ | 13,719,242 | | $ | 16,386,833 | | $ | 19,443,387 | | $ | 21,579,671 | | $ | 22,312,842 | |
| Number of loans | | | 27,695 | | | 31,744 | | | 34,013 | | | 37,458 | | | 33,863 | | | 51,593 | | | 58,941 | | | 62,060 | | | 64,066 | |
| Average loan size | | $ | 333 | | $ | 306 | | $ | 303 | | $ | 316 | | $ | 405 | | $ | 318 | | $ | 330 | | $ | 348 | | $ | 348 | |
| | | | | | | | | | | | | | | | | | | | | | | | | | | | | |
| Adjustable % | | | 85 | % | | 89 | % | | 99 | % | | 99 | % | | 98 | % | | 100 | % | | 100 | % | | 100 | % | | 100 | % |
| Hybrid % | | | 15 | % | | 11 | % | | 1 | % | | 1 | % | | 2 | % | | 0 | % | | 0 | % | | 0 | % | | 0 | % |
| Fixed % | | | 0 | % | | 0 | % | | 0 | % | | 0 | % | | 0 | % | | 0 | % | | 0 | % | | 0 | % | | 0 | % |
| | | | | | | | | | | | | | | | | | | | | | | | | | | | | |
| Amortizing % | | | 3 | % | | 3 | % | | 1 | % | | 1 | % | | 1 | % | | 0 | % | | 0 | % | | 0 | % | | 0 | % |
| Interest-only % | | | 97 | % | | 97 | % | | 99 | % | | 99 | % | | 99 | % | | 100 | % | | 100 | % | | 100 | % | | 100 | % |
| Negatively amortizing % | | | 0 | % | | 0 | % | | 0 | % | | 0 | % | | 0 | % | | 0 | % | | 0 | % | | 0 | % | | 0 | % |
| | | | | | | | | | | | | | | | | | | | | | | | | | | | | |
| Southern California | | | 13 | % | | 12 | % | | 11 | % | | 11 | % | | 11 | % | | 11 | % | | 12 | % | | 12 | % | | 13 | % |
| Northern California | | | 10 | % | | 10 | % | | 10 | % | | 10 | % | | 12 | % | | 11 | % | | 12 | % | | 12 | % | | 13 | % |
| Florida | | | 12 | % | | 12 | % | | 13 | % | | 12 | % | | 13 | % | | 12 | % | | 11 | % | | 11 | % | | 11 | % |
| New York | | | 6 | % | | 6 | % | | 6 | % | | 6 | % | | 5 | % | | 5 | % | | 5 | % | | 5 | % | | 5 | % |
| Georgia | | | 5 | % | | 5 | % | | 5 | % | | 5 | % | | 5 | % | | 5 | % | | 5 | % | | 5 | % | | 5 | % |
| New Jersey | | | 4 | % | | 4 | % | | 4 | % | | 4 | % | | 4 | % | | 4 | % | | 4 | % | | 4 | % | | 4 | % |
| Texas | | | 5 | % | | 5 | % | | 5 | % | | 5 | % | | 4 | % | | 4 | % | | 4 | % | | 4 | % | | 4 | % |
| Arizona | | | 4 | % | | 4 | % | | 4 | % | | 4 | % | | 4 | % | | 4 | % | | 4 | % | | 4 | % | | 4 | % |
| Illinois | | | 3 | % | | 3 | % | | 2 | % | | 2 | % | | 2 | % | | 3 | % | | 3 | % | | 3 | % | | 3 | % |
| Colorado | | | 4 | % | | 4 | % | | 4 | % | | 4 | % | | 4 | % | | 4 | % | | 4 | % | | 4 | % | | 4 | % |
| Virginia | | | 3 | % | | 3 | % | | 3 | % | | 3 | % | | 3 | % | | 3 | % | | 3 | % | | 3 | % | | 3 | % |
| Other states (none greater than 3%) | | | 31 | % | | 32 | % | | 33 | % | | 34 | % | | 33 | % | | 34 | % | | 33 | % | | 33 | % | | 31 | % |
| | | | | | | | | | | | | | | | | | | | | | | | | | | | | |
| Year 2006 origination | | | 17 | % | | 10 | % | | 0 | % | | 0 | % | | 0 | % | | 0 | % | | 0 | % | | 0 | % | | 0 | % |
| Year 2005 origination | | | 5 | % | | 5 | % | | 5 | % | | 5 | % | | 6 | % | | 5 | % | | 4 | % | | 3 | % | | 0 | % |
| Year 2004 origination | | | 30 | % | | 32 | % | | 36 | % | | 36 | % | | 45 | % | | 37 | % | | 37 | % | | 38 | % | | 38 | % |
| Year 2003 origination | | | 32 | % | | 35 | % | | 40 | % | | 40 | % | | 27 | % | | 39 | % | | 40 | % | | 40 | % | | 42 | % |
| Year 2002 origination | | | 12 | % | | 13 | % | | 15 | % | | 15 | % | | 18 | % | | 15 | % | | 15 | % | | 16 | % | | 16 | % |
| Year 2001 origination or earlier | | | 4 | % | | 5 | % | | 4 | % | | 4 | % | | 4 | % | | 4 | % | | 4 | % | | 3 | % | | 4 | % |
| | | | | | | | | | | | | | | | | | | | | | | | | | | | | |
| Wtg Avg Original LTV | | | 68 | % | | 68 | % | | 68 | % | | 68 | % | | 69 | % | | 68 | % | | 69 | % | | 68 | % | | 68 | % |
| Original LTV: 0% - 20% | | | 1 | % | | 1 | % | | 1 | % | | 1 | % | | 1 | % | | 1 | % | | 1 | % | | 1 | % | | 1 | % |
| Original LTV: 20% - 30% | | | 2 | % | | 2 | % | | 2 | % | | 2 | % | | 2 | % | | 2 | % | | 2 | % | | 2 | % | | 2 | % |
| Original LTV: 30% - 40% | | | 4 | % | | 4 | % | | 4 | % | | 4 | % | | 4 | % | | 4 | % | | 4 | % | | 4 | % | | 4 | % |
| Original LTV: 40% - 50% | | | 8 | % | | 8 | % | | 8 | % | | 8 | % | | 7 | % | | 7 | % | | 7 | % | | 7 | % | | 7 | % |
| Original LTV: 50% - 60% | | | 12 | % | | 12 | % | | 12 | % | | 12 | % | | 11 | % | | 11 | % | | 11 | % | | 11 | % | | 12 | % |
| Original LTV: 60% - 70% | | | 20 | % | | 20 | % | | 21 | % | | 21 | % | | 21 | % | | 20 | % | | 20 | % | | 20 | % | | 21 | % |
| Original LTV: 70% - 75% | | | 13 | % | | 14 | % | | 14 | % | | 14 | % | | 14 | % | | 14 | % | | 14 | % | | 15 | % | | 15 | % |
| Original LTV: 75% - 80% | | | 32 | % | | 32 | % | | 31 | % | | 31 | % | | 34 | % | | 32 | % | | 32 | % | | 32 | % | | 31 | % |
| Original LTV: 80% - 90% | | | 2 | % | | 2 | % | | 2 | % | | 2 | % | | 2 | % | | 2 | % | | 2 | % | | 2 | % | | 2 | % |
| Original LTV: 90% - 100% | | | 6 | % | | 5 | % | | 5 | % | | 5 | % | | 4 | % | | 7 | % | | 7 | % | | 6 | % | | 5 | % |
| | | | | | | | | | | | | | | | | | | | | | | | | | | | | |
| Wtg Avg FICO | | | 733 | | | 730 | | | 730 | | | 730 | | | 731 | | | 731 | | | 731 | | | 731 | | | 731 | |
| FICO: <= 600 | | | 1 | % | | 1 | % | | 1 | % | | 1 | % | | 1 | % | | 1 | % | | 1 | % | | 1 | % | | 1 | % |
| FICO: 601 -620 | | | 1 | % | | 1 | % | | 1 | % | | 1 | % | | 1 | % | | 1 | % | | 1 | % | | 1 | % | | 1 | % |
| FICO: 621 - 640 | | | 1 | % | | 1 | % | | 1 | % | | 2 | % | | 1 | % | | 1 | % | | 1 | % | | 1 | % | | 1 | % |
| FICO: 641 -660 | | | 3 | % | | 3 | % | | 3 | % | | 3 | % | | 3 | % | | 3 | % | | 3 | % | | 3 | % | | 3 | % |
| FICO: 661 - 680 | | | 8 | % | | 8 | % | | 8 | % | | 8 | % | | 8 | % | | 8 | % | | 8 | % | | 8 | % | | 8 | % |
| FICO: 681 - 700 | | | 12 | % | | 12 | % | | 12 | % | | 12 | % | | 12 | % | | 12 | % | | 12 | % | | 12 | % | | 12 | % |
| FICO: 701 - 720 | | | 14 | % | | 14 | % | | 14 | % | | 14 | % | | 15 | % | | 14 | % | | 14 | % | | 14 | % | | 14 | % |
| FICO: 721 - 740 | | | 13 | % | | 14 | % | | 13 | % | | 13 | % | | 13 | % | | 14 | % | | 14 | % | | 14 | % | | 14 | % |
| FICO: 741 - 760 | | | 15 | % | | 15 | % | | 15 | % | | 15 | % | | 15 | % | | 15 | % | | 15 | % | | 16 | % | | 16 | % |
| FICO: 761 - 780 | | | 17 | % | | 17 | % | | 17 | % | | 17 | % | | 17 | % | | 17 | % | | 17 | % | | 17 | % | | 17 | % |
| FICO: 781 - 800 | | | 12 | % | | 12 | % | | 12 | % | | 11 | % | | 11 | % | | 11 | % | | 11 | % | | 11 | % | | 11 | % |
| FICO: >= 801 | | | 3 | % | | 2 | % | | 3 | % | | 3 | % | | 3 | % | | 3 | % | | 3 | % | | 2 | % | | 2 | % |
| | | | | | | | | | | | | | | | | | | | | | | | | | | | | |
| Conforming balance at origination % | | | 38 | % | | 41 | % | | 45 | % | | 37 | % | | 38 | % | | 37 | % | | 37 | % | | 36 | % | | 36 | % |
| % balance in loans > $1mm per loan | | | 18 | % | | 14 | % | | 14 | % | | 14 | % | | 13 | % | | 14 | % | | 13 | % | | 13 | % | | 14 | % |
| | | | | | | | | | | | | | | | | | | | | | | | | | | | | |
| 2nd home % | | | 11 | % | | 11 | % | | 11 | % | | 11 | % | | 10 | % | | 10 | % | | 10 | % | | 10 | % | | 10 | % |
| Investment home % | | | 3 | % | | 3 | % | | 3 | % | | 3 | % | | 2 | % | | 2 | % | | 2 | % | | 2 | % | | 2 | % |
| | | | | | | | | | | | | | | | | | | | | | | | | | | | | |
| Purchase | | | 34 | % | | 34 | % | | 33 | % | | 33 | % | | 33 | % | | 33 | % | | 33 | % | | 34 | % | | 34 | % |
| Cash out refinance | | | 32 | % | | 32 | % | | 32 | % | | 34 | % | | 34 | % | | 34 | % | | 34 | % | | 34 | % | | 34 | % |
| Rate-term refinance | | | 32 | % | | 32 | % | | 34 | % | | 32 | % | | 32 | % | | 32 | % | | 32 | % | | 31 | % | | 31 | % |
| Construction | | | 0 | % | | 0 | % | | 0 | % | | 0 | % | | 0 | % | | 0 | % | | 0 | % | | 0 | % | | 0 | % |
| Other | | | 2 | % | | 2 | % | | 1 | % | | 1 | % | | 1 | % | | 1 | % | | 1 | % | | 1 | % | | 1 | % |
Table 14: Commercial Real Estate Loans Credit Performance (al6l $ in thousands) | |
| | | | | | | | | | | | | | | | | | | | | | | | | | |
| | | | | Managed Loans | | Internally-Designated Credit Reserve | | External Credit Enhancement | | Total Credit Protection (1) | | Total Credit Protection as % of Loans | | Seriously Delinquent Loans | | Seriously Delinquent Loan % of Current Balance | | Total Credit Losses | | Third Parties' Share of Net Charge-offs/ (Recoveries) | | Redwood's Share of Net Charge-offs/ (Recoveries) | | Total Credit Losses As % of Loans (Annualized) | |
| | | | | | | | | | | | | | | | | | | | | | | | | | |
| | | | | | | | | | | | | | | | | | | | | | | | | | |
Total Managed Commercial Portfolio | | | 2004 | | $ | 20,952,491 | | $ | 54,280 | | $ | 557,842 | | $ | 612,122 | | | 2.92 | % | $ | 0 | | | 1.39 | % | $ | 176 | | $ | 0 | | $ | 176 | | | 0.00 | % |
| | | Q1: 2005 | | | 27,830,707 | | | 97,127 | | | 557,480 | | | 654,607 | | | 2.35 | % | | 15,305 | | | 0.05 | % | | 315 | | | - | | | 315 | | | 0.00 | % |
| | | | Q2: 2005 | | | 31,324,563 | | | 95,351 | | | 681,133 | | | 776,484 | | | 2.48 | % | | 35,971 | | | 0.11 | % | | 1,213 | | | 1,213 | | | - | | | 0.02 | % |
| | | | Q3: 2005 | | | 40,081,879 | | | 146,671 | | | 706,532 | | | 853,203 | | | 2.13 | % | | 20,690 | | | 0.05 | % | | 59 | | | 59 | | | - | | | 0.00 | % |
| | | | Q4: 2005 | | | 46,825,453 | | | 149,947 | | | 714,168 | | | 864,115 | | | 1.85 | % | | 40,916 | | | 0.09 | % | | - | | | - | | | - | | | 0.00 | % |
| | | 2005 | | | 46,825,453 | | | 149,947 | | | 714,168 | | | 864,115 | | | 1.85 | % | | 40,916 | | | 0.09 | % | | 1,587 | | | 1,272 | | | 315 | | | 0.00 | % |
| | | Q1: 2006 | | | 48,366,213 | | | 175,913 | | | 645,675 | | | 821,588 | | | 1.70 | % | | 38,124 | | | 0.08 | % | | 90 | | | 55 | | | 35 | | | 0.00 | % |
| | | Q2: 2006 | | | 51,635,796 | | | 200,275 | | | 653,476 | | | 853,751 | | | 1.65 | % | | 44,632 | | | 0.09 | % | | 1,463 | | | 1,463 | | | - | | | 0.01 | % |
| | | | Q3: 2006 | | | 58,106,355 | | | 266,523 | | | 678,489 | | | 945,012 | | | 1.63 | % | | 70,586 | | | 0.12 | % | | 2,167 | | | 1,705 | | | 462 | | | 0.01 | % |
| | | Q4: 2006 | | | 57,789,159 | | | 303,481 | | | 472,669 | | | 776,150 | | | 1.34 | % | | 64,367 | | | 0.11 | % | | 1,156 | | | 1,132 | | | 24 | | | 0.01 | % |
| | | | 2006 | | $ | 57,789,159 | | $ | 303,481 | | $ | 472,669 | | $ | 776,150 | | | 1.34 | % | $ | 64,367 | | | 0.11 | % | $ | 4,876 | | $ | 4,355 | | $ | 521 | | | 0.03 | % |
| | | | | | | | | | | | | | | | | | | | | | | | | | | | | | | | | | | | | |
Commercial Real Estate Loans | | | 2004 | | $ | 65,598 | | $ | 8,641 | | $ | 0 | | $ | 8,641 | | | 13.17 | % | $ | 0 | | | 0.00 | % | $ | 176 | | $ | 0 | | $ | 176 | | | 0.27 | % |
| | | Q1: 2005 | | | 67,365 | | | 8,456 | | | - | | | 8,456 | | | 12.55 | % | | - | | | 0.00 | % | | 315 | | | - | | | 315 | | | 1.87 | % |
| | | | Q2: 2005 | | | 51,778 | | | 8,141 | | | - | | | 8,141 | | | 15.72 | % | | - | | | 0.00 | % | | - | | | - | | | - | | | 0.00 | % |
| | | | Q3: 2005 | | | 66,348 | | | 8,141 | | | - | | | 8,141 | | | 12.27 | % | | - | | | 0.00 | % | | - | | | - | | | - | | | 0.00 | % |
| | | Q4: 2005 | | | 70,091 | | | 8,141 | | | - | | | 8,141 | | | 11.61 | % | | - | | | 0.00 | % | | - | | | - | | | - | | | 0.00 | % |
| | | 2005 | | | 70,091 | | | 8,141 | | | - | | | 8,141 | | | 11.61 | % | | - | | | 0.00 | % | | 315 | | | - | | | 315 | | | 0.45 | % |
| | | | Q1: 2006 | | | 65,508 | | | 8,141 | | | - | | | 8,141 | | | 12.43 | % | | - | | | 0.00 | % | | 35 | | | - | | | 35 | | | 0.21 | % |
| | | Q2: 2006 | | | 46,959 | | | 8,141 | | | - | | | 8,141 | | | 17.34 | % | | - | | | 0.00 | % | | - | | | - | | | - | | | 0.00 | % |
| | | Q3: 2006 | | | 42,384 | | | 8,141 | | | - | | | 8,141 | | | 19.21 | % | | - | | | 0.00 | % | | - | | | - | | | - | | | 0.00 | % |
| | | | Q4: 2006 | | | 38,360 | | | 8,141 | | | - | | | 8,141 | | | 21.22 | % | | - | | | 0.00 | % | | - | | | - | | | - | | | 0.00 | % |
| | | 2006 | | $ | 38,360 | | $ | 8,141 | | $ | 0 | | $ | 8,141 | | | 21.22 | % | $ | 0 | | | 0.00 | % | $ | 35 | | $ | 0 | | $ | 35 | | | 0.36 | % |
| | | | | | | | | | | | | | | | | | | | | | | | | | | | | | | | | | | | | |
Commercial CES | | | 2004 | | $ | 20,886,893 | | $ | 45,639 | | $ | 557,842 | | $ | 603,481 | | | 2.89 | % | $ | 0 | | | 0.00 | % | $ | 0 | | $ | 0 | | $ | 0 | | | 0.00 | % |
| | | | Q1: 2005 | | | 27,763,342 | | | 88,671 | | | 557,480 | | | 646,151 | | | 2.33 | % | | 15,305 | | | 0.06 | % | | - | | | - | | | - | | | 0.00 | % |
| | | | Q2: 2005 | | | 31,272,785 | | | 87,210 | | | 681,133 | | | 768,343 | | | 2.46 | % | | 35,971 | | | 0.12 | % | | 1,213 | | | 1,213 | | | - | | | 0.02 | % |
| | | | Q3: 2005 | | | 40,015,531 | | | 138,530 | | | 706,532 | | | 845,062 | | | 2.11 | % | | 20,690 | | | 0.05 | % | | 59 | | | 59 | | | - | | | 0.00 | % |
| | | | Q4: 2005 | | | 46,755,362 | | | 141,806 | | | 714,168 | | | 855,974 | | | 1.83 | % | | 40,916 | | | 0.09 | % | | - | | | - | | | - | | | 0.00 | % |
| | | 2005 | | | 46,755,362 | | | 141,806 | | | 714,168 | | | 855,974 | | | 1.83 | % | | 40,916 | | | 0.09 | % | | 1,272 | | | 1,272 | | | - | | | 0.00 | % |
| | | | Q1: 2006 | | | 48,300,705 | | | 167,772 | | | 645,675 | | | 813,447 | | | 1.68 | % | | 38,124 | | | 0.08 | % | | 55 | | | 55 | | | - | | | 0.00 | % |
| | | Q2: 2006 | | | 51,588,837 | | | 192,134 | | | 653,476 | | | 845,610 | | | 1.64 | % | | 44,632 | | | 0.09 | % | | 1,463 | | | 1,463 | | | - | | | 0.01 | % |
| | | Q3: 2006 | | | 58,063,971 | | | 258,382 | | | 678,489 | | | 936,871 | | | 1.61 | % | | 70,586 | | | 0.12 | % | | 2,167 | | | 1,705 | | | 462 | | | 0.01 | % |
| | | | Q4: 2006 | | | 57,750,799 | | | 295,340 | | | 472,669 | | | 768,009 | | | 1.33 | % | | 64,367 | | | 0.11 | % | | 1,156 | | | 1,132 | | | 24 | | | 0.01 | % |
| | | 2006 | | $ | 57,750,799 | | $ | 295,340 | | $ | 472,669 | | $ | 768,009 | | | 1.33 | % | $ | 64,367 | | | 0.11 | % | $ | 4,841 | | $ | 4,355 | | $ | 486 | | | 0.01 | % |
(1) The credit reserve on commercial real estate loans is only available to absorb losses on our commercial real estate loan portfolio. Internally-designated credit reserves and external credit enhancement are only available to absorb losses on the commercial CES. Much of the external credit enhancement will share loan losses with Redwood rather than protect Redwood from losses.
Table 15: Commercial CES Underlying Loan Characteristics (all $ in thousands) |
| | | | | | | | | | | | | | | | | | | | |
| | | Q4:2006 | | Q3:2006 | | Q2:2006 | | Q1:2006 | | Q4:2005 | | Q3:2005 | | Q2:2005 | | Q1:2005 | | Q4:2004 | |
| Managed Commercial Loans | | $ | 57,750,799 | | $ | 58,063,971 | | $ | 51,588,837 | | $ | 48,300,705 | | $ | 46,755,362 | | $ | 40,015,531 | | $ | 31,272,785 | | $ | 27,763,342 | | $ | 20,886,893 | |
| Number of loans | | | 3,889 | | | 4,032 | | | 3,456 | | | 3,737 | | | 3,618 | | | 2,866 | | | 2,248 | | | 2,059 | | | 1,591 | |
| Average face value | | $ | 14,850 | | $ | 14,401 | | $ | 14,927 | | $ | 12,925 | | $ | 12,923 | | $ | 13,962 | | $ | 13,911 | | $ | 13,484 | | $ | 13,128 | |
| | | | | | | | | | | | | | | | | | | | | | | | | | | | | |
| | | | | | | | | | | | | | | | | | | | | | | | | | | | | |
State Distribution | | | | | | | | | | | | | | | | | | | | | | | | | | | | |
| CA | | | 17 | % | | 18 | % | | 18 | % | | 17 | % | | 17 | % | | 16 | % | | 18 | % | | 17 | % | | 18 | % |
| NY | | | 13 | % | | 11 | % | | 12 | % | | 12 | % | | 13 | % | | 13 | % | | 14 | % | | 16 | % | | 15 | % |
| TX | | | 8 | % | | 5 | % | | 6 | % | | 6 | % | | 6 | % | | 7 | % | | 7 | % | | 7 | % | | 5 | % |
| VA | | | 4 | % | | 2 | % | | 2 | % | | 2 | % | | 2 | % | | 3 | % | | 1 | % | | 1 | % | | 1 | % |
| FL | | | 6 | % | | 5 | % | | 5 | % | | 5 | % | | 5 | % | | 5 | % | | 4 | % | | 4 | % | | 4 | % |
| Other | | | 52 | % | | 60 | % | | 57 | % | | 57 | % | | 56 | % | | 57 | % | | 56 | % | | 56 | % | | 56 | % |
| | | | | | | | | | | | | | | | | | | | | | | | | | | | | |
Property Type Distribution | | | | | | | | | | | | | | | | | | | | | | | | | | | | |
| Office | | | 37 | % | | 30 | % | | 36 | % | | 32 | % | | 37 | % | | 39 | % | | 40 | % | | 40 | % | | 38 | % |
| Retail | | | 31 | % | | 32 | % | | 32 | % | | 33 | % | | 33 | % | | 34 | % | | 34 | % | | 34 | % | | 34 | % |
| Multi-family | | | 12 | % | | 11 | % | | 11 | % | | 16 | % | | 12 | % | | 10 | % | | 10 | % | | 12 | % | | 14 | % |
| Hospitality | | | 7 | % | | 6 | % | | 5 | % | | 7 | % | | 3 | % | | 5 | % | | 4 | % | | 3 | % | | 2 | % |
| Self-storage | | | 3 | % | | 0 | % | | 0 | % | | 0 | % | | 0 | % | | 0 | % | | 0 | % | | 0 | % | | 0 | % |
| Industrial | | | 3 | % | | 1 | % | | 1 | % | | 2 | % | | 2 | % | | 1 | % | | 2 | % | | 2 | % | | 3 | % |
| Other | | | 7 | % | | 20 | % | | 14 | % | | 11 | % | | 14 | % | | 11 | % | | 9 | % | | 9 | % | | 10 | % |
| | | | | | | | | | | | | | | | | | | | | | | | | | | | | |
| Weighted average LTV | | | 69 | % | | 69 | % | | 69 | % | | 68 | % | | 68 | % | | 68 | % | | 67 | % | | 68 | % | | 68 | % |
| | | | | | | | | | | | | | | | | | | | | | | | | | | | | |
| Weighted average debt service coverage ratio | | | 1.60 | | | 1.72 | | | 1.75 | | | 1.99 | | | 2.05 | | | 1.88 | | | 1.79 | | | 1.86 | | | 1.88 | |
Table 16: Commercial Real Estate Loan Characteristics (all $ in thousands) |
| | | | | | | | | | | | | | | | | | | | |
| | | Q4:2006 | | Q3:2006 | | Q2:2006 | | Q1:2006 | | Q4:2005 | | Q3:2005 | | Q2:2005 | | Q1:2005 | | Q4:2004 | |
| Commercial mortgage loans, reported value | | $ | 28,172 | | $ | 32,170 | | $ | 36,722 | | $ | 55,167 | | $ | 59,692 | | $ | 56,102 | | $ | 41,794 | | $ | 56,604 | | $ | 54,479 | |
| Number of loans | | | 7 | | | 8 | | | 9 | | | 12 | | | 13 | | | 12 | | | 9 | | | 12 | | | 9 | |
| Average loan size | | $ | 4,025 | | $ | 4,021 | | $ | 4,080 | | $ | 4,597 | | $ | 4,592 | | $ | 4,675 | | $ | 4,644 | | $ | 4,717 | | $ | 6,053 | |
| Seriously delinquent loans | | | - | | | - | | | - | | | - | | | - | | | - | | | - | | | - | | | - | |
| Realized credit losses | | | - | | | - | | | - | | | - | | | - | | | - | | | - | | | - | | | - | |
| California % | | | 7 | % | | 7 | % | | 6 | % | | 19 | % | | 25 | % | | 28 | % | | 37 | % | | 42 | % | | 44 | % |
Table 17: Securities Portfolios Credit Rating and Collateral Type (in millions) |
| | | RATING | |
At December 31, 2006: | | | | | | | | | | | | | | | | | |
| | | Total | | AAA | | AA | | A | | BBB | | BB | | B | | Unrated | |
| Residential prime | | $ | 1,279 | | $ | 14 | | $ | 181 | | $ | 243 | | $ | 285 | | $ | 308 | | $ | 119 | | $ | 129 | |
| Residential alt-a | | | 613 | | | 136 | | | 84 | | | 106 | | | 130 | | | 94 | | | 23 | | | 40 | |
| Residential sub-prime | | | 528 | | | 8 | | | 127 | | | 209 | | | 174 | | | 7 | | | - | | | 3 | |
| Commercial | | | 567 | | | 9 | | | 2 | | | 16 | | | 92 | | | 225 | | | 90 | | | 133 | |
| CDO | | | 246 | | | 66 | | | 30 | | | 52 | | | 76 | | | 14 | | | - | | | 8 | |
Total securities portfolio market value | | $ | 3,233 | | $ | 233 | | $ | 424 | | $ | 626 | | $ | 757 | | $ | 648 | | $ | 232 | | $ | 313 | |
| | | | | | | | | | | | | | | | | | | | | | | | | | |
| | | | RATING | | | | | | | | | | | | | | | | | | | | |
At December 31, 2005: | | | | | | | | | | | | | | | | | | | | | | | | | |
| | | | | | | AAA | | | AA | | | A | | | BBB | | | BB | | | B | | | Unrated | |
| Residential prime | | $ | 1,149 | | $ | 24 | | $ | 193 | | $ | 203 | | $ | 217 | | $ | 271 | | $ | 107 | | $ | 134 | |
| Residential alt-a | | | 197 | | | 6 | | | 70 | | | 11 | | | 30 | | | 51 | | | 8 | | | 21 | |
| Residential sub-prime | | | 507 | | | 5 | | | 114 | | | 324 | | | 64 | | | - | | | - | | | - | |
| Commercial | | | 404 | | | 11 | | | 2 | | | 20 | | | 152 | | | 131 | | | 30 | | | 58 | |
| CDO | | | 162 | | | 39 | | | 23 | | | 37 | | | 52 | | | 11 | | | - | | | - | |
Total securities portfolio market value | | $ | 2,419 | | $ | 85 | | $ | 402 | | $ | 595 | | $ | 515 | | $ | 464 | | $ | 145 | | $ | 213 | |
| | | | | | | | | | | | | | | | | | | | | | | | | | |
| | | | | | | | | | | | | | | | | | | | | | | | | | |
| Note: This table combines both CES and IGS securities in our residential, commercial, and CDO portfolios. |
Table 18: Sequoia ABS Issued |
(all $ in thousands) |
| | | | | | | | | | | | |
| | | | | | | | | | | Principal | |
| | | | | Original | | | | Estimated | | Outstanding At | |
Sequoia | | Issue | | Issue | | Stated | | Callable | | December 31, | |
ABS Issued | | Date | | Amount | | Maturity | | Date | | 2006 | |
| Sequoia 1 | | | 07/29/97 | | $ | 534,347 | | | 2028 | | | Called | | $ | - | |
| Sequoia 2 | | | 11/06/97 | | | 749,160 | | | 2029 | | | Called | | | - | |
| Sequoia 3 | | | 06/26/98 | | | 635,288 | | | 2028 | | | Called | | | - | |
| Sequoia 1A | | | 05/04/99 | | | 157,266 | | | 2028 | | | Called | | | - | |
| Sequoia 4 | | | 03/21/00 | | | 377,119 | | | 2024 | | | 2006 | | | 71,967 | |
| Sequoia 5 | | | 10/29/01 | | | 510,047 | | | 2026 | | | 2007 | | | 105,939 | |
| Sequoia 6 | | | 04/26/02 | | | 506,142 | | | 2027 | | | 2007 | | | 119,772 | |
| Sequoia 7 | | | 05/29/02 | | | 572,000 | | | 2032 | | | Called | | | - | |
| Sequoia 8 | | | 07/30/02 | | | 642,998 | | | 2032 | | | Called | | | - | |
| Sequoia 9 | | | 08/28/02 | | | 558,266 | | | 2032 | | | 2007 | | | 104,452 | |
| Sequoia 10 | | | 09/26/02 | | | 1,041,600 | | | 2027 | | | 2008 | | | 257,079 | |
| Sequoia 11 | | | 10/30/02 | | | 704,936 | | | 2032 | | | 2007 | | | 136,797 | |
| Sequoia 12 | | | 12/19/02 | | | 1,096,891 | | | 2033 | | | 2006 | | | 215,504 | |
| Sequoia 2003-1 | | | 02/27/03 | | | 1,012,321 | | | 2033 | | | 2007 | | | 219,452 | |
| Sequoia 2003-2 | | | 04/29/03 | | | 815,080 | | | 2022 | | | 2007 | | | 176,740 | |
| Sequoia 2003-3 | | | 06/26/03 | | | 538,452 | | | 2023 | | | 2007 | | | 115,704 | |
| MLCC 2003-C | | | 06/26/03 | | | 984,349 | | | 2023 | | | 2008 | | | 233,177 | |
| MLCC 2003-D | | | 07/29/03 | | | 1,003,591 | | | 2028 | | | 2008 | | | 256,257 | |
| Sequoia 2003-4 | | | 07/29/03 | | | 504,273 | | | 2033 | | | 2007 | | | 187,427 | |
| Sequoia 2003-5 | | | 08/27/03 | | | 840,248 | | | 2033 | | | 2007 | | | 157,622 | |
| Sequoia 2003-6 | | | 10/29/03 | | | 649,999 | | | 2033 | | | 2007 | | | 121,572 | |
| Sequoia 2003-7 | | | 11/25/03 | | | 811,707 | | | 2034 | | | 2007 | | | 148,853 | |
| Sequoia 2003-8 | | | 12/23/03 | | | 964,238 | | | 2034 | | | 2007 | | | 241,139 | |
| MLCC 2003-E | | | 08/28/03 | | | 983,852 | | | 2028 | | | 2008 | | | 255,413 | |
| MLCC 2003-F | | | 09/25/03 | | | 1,297,913 | | | 2028 | | | 2007 | | | 337,018 | |
| MLCC 2003-H | | | 12/22/03 | | | 739,196 | | | 2029 | | | 2008 | | | 181,909 | |
Table 18: Sequoia ABS Issued |
(all $ in thousands) |
| | | | | | | | | | | | |
| | | | | | | | | | | Principal | |
| | | | Original | | | | Estimated | | Outstanding At | |
Sequoia | | Issue | | Issue | | Stated | | Callable | | December 31, | |
ABS Issued | | Date | | Amount | | Maturity | | Date | | 2006 | |
| Sequoia 1 | | 07/29/97 | | $534,347 | | 2028 | | Called | | $- | |
| Sequoia 2004-1 | | | 01/28/04 | | $ | 616,562 | | | 2034 | | | 2007 | | $ | 147,563 | |
| Sequoia 2004-2 | | | 02/25/04 | | | 690,548 | | | 2034 | | | 2007 | | | 172,283 | |
| Sequoia 2004-3 | | | 03/30/04 | | | 917,673 | | | 2034 | | | 2006 | | | 200,716 | |
| Sequoia 2004-4 | | | 04/29/04 | | | 808,933 | | | 2010 | | | 2007 | | | 191,748 | |
| Sequoia 2004-5 | | | 05/27/04 | | | 831,540 | | | 2012 | | | 2008 | | | 200,806 | |
| Sequoia 2004-6 | | | 06/29/04 | | | 910,662 | | | 2012 | | | 2008 | | | 228,521 | |
| SEMHT 2004-01 | | | 06/29/04 | | | 317,044 | | | 2014 | | | 2008 | | | 94,067 | |
| Sequoia 2004-7 | | | 07/29/04 | | | 1,032,685 | | | 2034 | | | 2008 | | | 226,567 | |
| Sequoia 2004-8 | | | 08/27/04 | | | 807,699 | | | 2034 | | | 2008 | | | 219,923 | |
| Sequoia 2004-9 | | | 09/29/04 | | | 772,831 | | | 2034 | | | 2008 | | | 240,533 | |
| Sequoia 2004-10 | | | 10/28/04 | | | 673,356 | | | 2034 | | | 2008 | | | 204,770 | |
| Sequoia 2004-11 | | | 11/23/04 | | | 705,746 | | | 2034 | | | 2008 | | | 273,684 | |
| Sequoia 2004-12 | | | 12/22/04 | | | 821,955 | | | 2035 | | | 2008 | | | 241,415 | |
| Sequoia 2005-1 | | | 01/27/05 | | | 409,071 | | | 2035 | | | 2008 | | | 145,578 | |
| Sequoia 2005-2 | | | 02/24/05 | | | 338,481 | | | 2035 | | | 2008 | | | 105,689 | |
| Sequoia 2005-3 | | | 04/28/05 | | | 359,182 | | | 2035 | | | 2008 | | | 130,013 | |
| Madrona 2005-A | | | 08/25/05 | | | 5,400 | | | 2008 | | | 2008 | | | 5,400 | |
| Sequoia 2005-4 | | | 09/29/05 | | | 324,576 | | | 2035 | | | 2009 | | | 218,544 | |
| Sequoia 2006-1 | | | 08/30/06 | | | 742,507 | | | 2046 | | | 2011 | | | 688,854 | |
Total Sequoia ABS Issuance | | | | | $ | 31,317,730 | | | | | | | | $ | 7,580,467 | |
Table 19: Sequoia IO ABS Issued |
(all $ in thousands) |
| | | | | | | | | | | | |
| | | | | | | | | | Adjusted Issue | |
| | | | Original | | | | Estimated | | Amount At | |
Sequoia ABS | | Issue | | Issue | | Stated | | Callable | | December 31, | |
IO's Issued | | Date | | Amount | | Maturity | | Date | | 2006 | |
| MLCC 2003-C X-A-2 | | | 06/26/03 | | $ | 12,662 | | | 2007 | | | 2007 | | $ | 377 | |
| MLCC 2003-D X-A-1 | | | 07/29/03 | | | 22,371 | | | 2007 | | | 2007 | | | 939 | |
| MLCC 2003-E X-A-1 | | | 08/28/03 | | | 16,550 | | | 2007 | | | 2007 | | | 1,092 | |
| MLCC 2003-F X-A-1 | | | 09/25/03 | | | 18,666 | | | 2007 | | | 2007 | | | 1,126 | |
| Sequoia 2003-6 X-1 | | | 10/29/03 | | | 8,220 | | | 2007 | | | 2007 | | | - | |
| SMFC 2003A AX1 | | | 10/31/03 | | | 70,568 | | | 2007 | | | 2007 | | | 1,680 | |
| Sequoia 2003-7 X-1 | | | 11/25/03 | | | 10,345 | | | 2007 | | | 2007 | | | - | |
| Sequoia 2003-8 X-1 | | | 12/23/03 | | | 12,256 | | | 2007 | | | 2007 | | | 717 | |
| Sequoia 2004-1 X-1 | | | 01/28/04 | | | 7,801 | | | 2007 | | | 2007 | | | 563 | |
| Sequoia 2004-2 X-1 | | | 02/25/04 | | | 8,776 | | | 2007 | | | 2007 | | | 740 | |
| SMFC 2004A AX1 | | | 02/26/04 | | | 10,626 | | | 2007 | | | 2007 | | | 692 | |
| MLCC 2003-H X-A-1 | | | 12/22/03 | | | 10,430 | | | 2007 | | | 2007 | | | 1,145 | |
| Sequoia 2004-4 X-1 | | | 05/28/04 | | | 9,789 | | | 2010 | | | 2007 | | | 1,179 | |
| Sequoia 2004-5 X-1 | | | 05/27/04 | | | 3,371 | | | 2012 | | | 2008 | | | 428 | |
| Sequoia 2004-6 X-A | | | 06/29/04 | | | 10,884 | | | 2012 | | | 2008 | | | 4,136 | |
| Sequoia 2004-7 X-A | | | 07/29/04 | | | 12,145 | | | 2034 | | | 2008 | | | 4,887 | |
| Sequoia 2004-8 X-A | | | 08/27/04 | | | 18,270 | | | 2034 | | | 2008 | | | 7,490 | |
| Sequoia 2004-9 X-A | | | 09/29/04 | | | 16,951 | | | 2034 | | | 2008 | | | 7,401 | |
| Sequoia 2004-10 X-A | | | 10/28/04 | | | 14,735 | | | 2034 | | | 2008 | | | 6,526 | |
| Sequoia 2004-11 X-A-1 | | | 11/23/04 | | | 12,603 | | | 2034 | | | 2008 | | | 6,111 | |
| Sequoia 2004-11 X-A-2 | | | 11/23/04 | | | 4,697 | | | 2034 | | | 2008 | | | 2,415 | |
| Sequoia 2004-12 X-A-1 | | | 12/22/04 | | | 14,453 | | | 2035 | | | 2008 | | | 6,798 | |
| Sequoia 2004-12 X-A-2 | | | 12/22/04 | | | 4,619 | | | 2035 | | | 2008 | | | 5,081 | |
| Sequoia 2005-1 X-A | | | 01/27/05 | | | 9,669 | | | 2035 | | | 2008 | | | 4,827 | |
| Sequoia 2005-2 X-A | | | 02/24/05 | | | 7,484 | | | 2035 | | | 2008 | | | 3,690 | |
| Sequoia 2005-3 X-A | | | 04/28/05 | | | 8,183 | | | 2035 | | | 2008 | | | 4,509 | |
Total Sequoia Issuance | | | | | $ | 357,124 | | | | | | | | $ | 74,549 | |
Table 20: Acacia CDO ABS Issued |
(all $ in thousands) |
| | | | | | | | | | | | |
| | | | | | | | | | | Principal | |
| | | | | Original | | | | Estimated | | Outstanding At | |
| | Issue | | Issue | | Stated | | Callable | | December 31, | |
CDO Issuance | | Date | | Amount | | Maturity | | Date | | 2006 | |
| Acacia CDO 1 | | | 12/10/02 | | $ | 285,000 | | | 2023 | | | Called | | $ | - | |
| Acacia CDO 2 | | | 05/13/03 | | | 283,875 | | | 2023 | | | Called | | | - | |
| Acacia CDO 3 | | | 11/04/03 | | | 284,250 | | | 2038 | | | Called | | | - | |
| Acacia CDO 4 | | | 04/08/04 | | | 293,400 | | | 2039 | | | 2007 | | | 264,348 | |
| Acacia CDO 5 | | | 07/14/04 | | | 282,125 | | | 2039 | | | 2007 | | | 273,533 | |
| Acacia CDO 6 | | | 11/09/04 | | | 282,000 | | | 2040 | | | 2007 | | | 281,061 | |
| Acacia CDO 7 | | | 03/10/05 | | | 282,000 | | | 2045 | | | 2008 | | | 281,128 | |
| Acacia CDO 8 | | | 07/14/05 | | | 252,000 | | | 2045 | | | 2008 | | | 251,605 | |
| Acacia CRE 1 | | | 12/14/05 | | | 261,750 | | | 2045 | | | 2010 | | | 261,543 | |
| Acacia CDO 9 | | | 03/09/06 | | | 277,800 | | | 2046 | | | 2009 | | | 277,788 | |
| Acacia CDO 10 | | | 08/02/06 | | | 436,500 | | | 2046 | | | 2009 | | | 436,500 | |
Total CDO Issuance | | | | | $ | 3,220,700 | | | | | | | | $ | 2,327,506 | |
Redwood Trust Corporate Information
Executive Officers: | | Directors: |
| | | |
George E. Bull, III | | George E. Bull, III |
| Chairman of the Board and | | Chairman of the Board and |
| Chief Executive Officer | | Chief Executive Officer |
| | | |
Douglas B. Hansen | | Douglas B. Hansen |
| President | | President |
| | | |
Martin S. Hughes | | Richard D. Baum |
| Chief Financial Officer | | Chief Deputy Insurance |
| | | Commissioner for the |
| | State of California |
| Vice President | | |
| | | Thomas C. Brown |
Andrew I. Sirkis | | CEO, Urban Bay Properties, Inc. |
| Vice President | | |
| | | Mariann Byerwalter |
| | Chairman, JDN Corporate |
| Vice President | | Advisory, LLC |
| | | |
| | | Greg H. Kubicek |
| | | President, The Holt Group, Inc. |
| | | |
| | | Georganne C. Proctor |
| | | Executive Vice President and |
| | | Chief Financial Officer, TIAA-CREF |
| | | |
| | | Charles J. Toeniskoetter |
| | | Chairman, Toeniskoetter & Breeding, Inc. |
| | | |
| | | David L. Tyler |
| | | Private Investor |
Stock Listing:
The Company’s common stock is traded on the
New York Stock Exchange under the symbol RWT.
Corporate Office:
One Belvedere Place, Suite 300
Mill Valley, California 94941
Telephone: 415-389-7373
Investor Relations: | | |
| Nicole Klock | | |
| IR Hotline: | 866-269-4976 | |
| Telephone: | 415-380-2321 | |
| Email: | nicole.klock@redwoodtrust.com | |
Transfer Agent:
Computershare
2 North LaSalle Street
Chicago, IL 60602
Telephone: 888-472-1955
For more information about Redwood Trust, please visit our website at:
www.redwoodtrust.com