We file quarterly reports on Form 10-Q and annual reports on Form 10-K with the Securities and Exchange Commission. Those filings and our earnings press releases provide information about our financial results from the perspective of Generally Accepted Accounting Principles (GAAP). These documents are available on our website, www.redwoodtrust.com. We urge you to study them, as there is much to learn about Redwood Trust there.
In the Redwood Review, you have the opportunity to learn more about Redwood Trust through a discussion of GAAP results and also a discussion of core earnings, tax results, and other non-GAAP measures. You will first find a letter to our shareholders, and then a strategy section on Redwood Trust that highlights the key aspects of our business. Following that is a review of various financial indicators for our business, each of the asset classes and types of liabilities that are included in our GAAP balance sheets, a glossary explaining some of the specialized terms we use, and then tables that provide supplementary financial data.
We hope that the Redwood Review provides some insight and serves as a useful tool for better understanding your investment in Redwood Trust.
We expect that the form and content of the Redwood Review will evolve over time. We welcome your input during this process.
CAUTIONARY STATEMENT: This Redwood Review contains forward-looking statements within the safe harbor provisions of the Private Securities Litigation Reform Act of 1995. Statements that are not historical in nature, including the words “anticipated,” “estimated,” “should,” “expect,” “believe,” ”intend,” and similar expressions, are intended to identify forward-looking statements. These forward-looking statements are subject to risks and uncertainties, including, among other things, those described in our 2006 Annual Report on Form 10-K under Item 1A “Risk Factors.” Other risks, uncertainties, and factors that could cause actual results to differ materially from those projected are detailed from time to time in reports filed by us with the Securities and Exchange Commission, including Forms 10-K, 10-Q, and 8-K. Important factors that may impact our actual results include changes in interest rates and market values; changes in prepayment rates; general economic conditions, particularly as they affect the price of earning assets and the credit status of borrowers; the level of liquidity in the capital markets as it affects our ability to finance our real estate asset portfolio; and other factors not presently identified. In light of these risks, uncertainties, and assumptions, the forward-looking events mentioned in, discussed in, or incorporated by reference into this Review might not occur. Accordingly, our actual results may differ from our current expectations, estimates, and projections. We undertake no obligation to publicly update or revise any forward-looking statements, whether as a result of new information, future events, or otherwise.
Dear Fellow Shareholders:
We believe real estate to be a cyclical business. We have been warning about and expecting a correction in residential real estate, and now, the recessionary part of the cycle is here. We expect it to go on for a while, without a quick recovery. We have been preparing for this downturn for almost two years, and as a result, we believe we are in good shape to profit from these cyclical developments.
If growing this company were like flying a plane, we might describe the situation this way: we have for some time been flying into a headwind that has been slowing us down. The weather is now changing, and we are experiencing some turbulence. On the other side of this turbulent short-term weather pattern, however, we foresee smooth flying, and we may benefit from a tailwind to help our progress.
The headwind was a deterioration of residential real estate underwriting standards that reduced overall asset quality, combined with an increase in global liquidity that led to an investment environment where it was difficult to get paid to take risk.
The current turbulent situation in residential real estate has resulted in reduced prices for residential real estate assets. While we've had to take mark-to-market charges on some of our assets and reduced our GAAP earnings and reported book value, the turbulence has had little effect on our core earnings, cash flows, or net interest income. Over the next year or two, the realization of actual credit losses, and the resulting effects on markets and liquidity, may create additional challenges.
After this turbulent period, we expect underwriting standards and asset quality to be substantially improved. With a new respect for risk among market participants, we expect asset pricing to be more favorable. This is the tailwind that should create new opportunities, helping us to further expand and develop our U.S. residential real estate business and grow our company.
Results for the current quarter were not bad, although the headline GAAP earnings number of $0.66 per share was lower than expected, as a result of asset mark-to-market charges of $10 million as well as increased operating expenses of $5 million. The mark-to-market charges reflect the overall market decline in prices during the quarter for real estate securities. The increase in operating expenses included $2 million in severance charges, and $3 million in personnel and systems costs associated with the diversification and growth of our business.
At $1.08 per share, core income, which excludes mark-to-market charges and some extraordinary severance costs, was in line with the previous eight quarters. Taxable income, at $1.48 per share, remained strong.
Net interest income of $47 million was $2 million more than net interest income in the first quarter of 2006 and exceeded most other recent quarters. Adjusted ROE based on our GAAP results was 8%. On a core basis (core earnings divided by core equity), ROE was 13%. During the quarter, we also declared an increase in our quarterly dividend to $0.75 per share.
 SHAREHOLDER LETTER
1st Quarter 2007
Accounting standards are moving in the direction of increased use of mark-to-market accounting. As we have mentioned in the past, on balance we think this is a good thing. It does require investors to sort out how they want to think about the mark-to-market adjustments that will increasingly create substantial volatility in headline GAAP results and book value.
In general, we believe that analysis of market value changes can provide some valuable insights. It is important to remember, however, that market value changes for our existing assets may have very little impact on the real economics of our business. By contrast, changes in cash flow are of vital importance to our business. Therefore, if market values go up or down but actual credit losses don’t change, not much has really happened, in our view.
We believe the current state of affairs with respect to mark-to-market accounting is unsatisfactory. None of our liabilities are marked-to-market. Only some of our assets and derivatives are marked-to-market. Some of these marks go though the income statement, others through the balance sheet. In many cases, an asset and a derivative are marked-to-market whereas the paired liability is not. For instance, this quarter our assets declined in value while our liabilities increased in value, but we were only allowed to write down the assets. Some new accounting standards are coming in 2008 that will improve the situation, however, the volatility of GAAP earnings will continue to increase.
For us, there is one very real economic effect related to changes in asset prices, and it is a good thing. When asset prices go down, as they have recently, we can buy new assets more cheaply. Although we remain cautious, we are finding some occasional extraordinary investment opportunities in this difficult environment of falling prices. On average, however, we expect we will benefit far more from slightly better pricing and much better asset quality in our ongoing core business than we will from buying distressed assets at cents on the dollar.
Last quarter, we gave you some insight into our asset acquisition plans, and we wanted to provide you with an update. We ended the quarter with $114 million excess capital. Our plans for raising additional capital this year are uncertain and will largely depend on the level of our investment opportunities. In the near-term, we expect to continue to raise equity capital through our direct stock purchase plan (or, potentially through an equity offering) and we may issue additional trust preferred securities, junior subordinated notes, or other long-term debt. We previously stated that we expected to deploy between $200 million and $400 million of net new capital to acquire permanent assets during 2007. Given the turbulence in the market, it is even harder now than it was earlier in the year to predict how much we will buy. Given our current acquisition plans, it is possible that we will wind up the year on the low end of that range.
We are happy to report that so far our actual credit results remain excellent. Nearly all of the serious credit problems in the market to-date have been in the subprime sector, where Redwood has minimal exposure. To reiterate Redwood’s long-term strategy, the vast majority of our residential assets are backed by loans made to higher-quality prime and alt-a borrowers. Actual principal value credit losses in the $237 billion loans underlying the residential credit-enhancement securities (CES) we own were $4 million for the quarter, which is far lower than our forecast and below the level of reserves we have set aside to deal with anticipated losses. As the recessionary cycle plays itself out, we anticipate an increase in real credit losses, but so far, that is still somewhat over the horizon. Prepayments have continued to perform as expected, or better, as well.
SHAREHOLDER LETTER
1st Quarter 2007
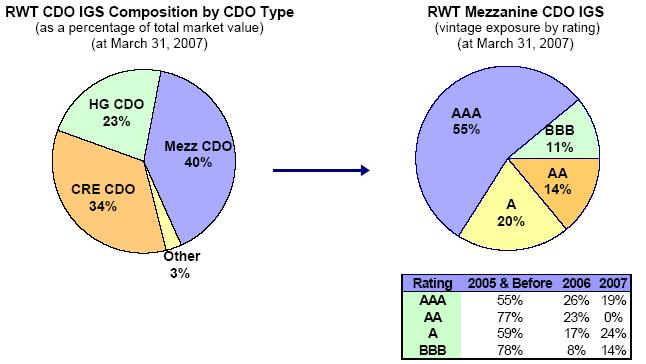
At the beginning of the second quarter, the turbulence in the residential mortgage markets spread to the CDO market. Many CDOs completed beginning in 2006 and those marketed in the first quarter of 2007 had a high concentration of securities backed by BBB and BBB- rated subprime securities from the 2006 vintage. The volume of CDO activity has now slowed and CDO debt spreads, especially for securities rated below AAA, have widened significantly.
Consequently, the level of our CDO activity in the second half of the year will largely depend on market conditions and debt spreads. Although we believe the likelihood is low, there may be a period of time where the CDO market temporarily shuts down as a financing option or debt spreads make financing through a CDO structure unattractive. If the CDO market becomes unavailable or unattractive, we will look to other sources of financing, such as Redwood debt, to fund acquisitions of investment-grade securities, or else we may slow our pace of acquisitions.
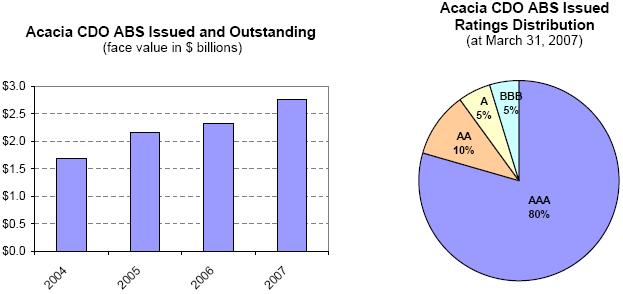
In April, we priced on a profitable basis a $500 million Acacia CDO backed by investment-grade option ARM residential securities. The transaction is scheduled to close in May. We have an additional $500 million Acacia CDO planned for the second quarter. We believe we will complete this transaction profitably, although it is possible that the transaction could be delayed or even cancelled due to unfavorable market conditions.
We believe that over the long term, our CDO business will likely benefit from recent market developments. We believe that our successful track record as a CDO manager and our willingness to invest in the equity of our CDO transactions will give us a competitive advantage. Additionally, we believe that lenders will change the terms of the non-recourse warehouse facilities used during the two-to-six month ramp-up phase of a CDO issuance, requiring issuers such as Redwood to assume more risk during the aggregation period. Consequently, the competitive advantage will go to CDO managers, like Redwood, with strong balance sheets and the hedging expertise necessary to bear this risk. Over the long term, we believe the likely result will be decreased competition and increased margins in our CDO business.
Commercial real estate in the U.S. is healthy, as is our commercial business. In a manner similar to residential real estate, however, both underwriting standards and respect for risk have been deteriorating in recent years. We thought that the downturn in residential, when it hit, might slow or halt aggressiveness in the financing markets for commercial real estate. At least in some respects, this seems to be happening. For instance, the rating agencies are increasing capital requirements for commercial securitizations, spreads have widened, and some B-piece buyers have been unwilling to meet their purchase commitments. We believe these are good signs for our commercial business for the future. In the meantime, we are moving ahead slowly and cautiously.
SHAREHOLDER LETTER
1st Quarter 2007
In summary, we continue to feel positive about our prospects for 2007 and beyond. We structured Redwood Trust to serve as an attractive long-term generator of earnings and dividends under a variety of market conditions, and we feel that both the company and our strategy are holding up well given the volatility in the marketplace. While our actual investment decisions will depend largely on market conditions and opportunities, we have no plans to change our approach to acquiring high quality real estate assets and creating high quality securitization products.
We thank you for your continued support of Redwood Trust, especially in these uncertain times. We are working hard everyday to continue to earn your trust, and we look forward to reporting to you on our progress in future editions of the Redwood Review.
ABOUT REDWOOD TRUST
Redwood Business and Strategy
This section of the Review is a broad introduction to Redwood Trust and provides a long-term overview of Redwood’s business and strategy. We review and edit it every quarter and as a result, the content may change over time as the company and market conditions evolve. We recommend that you review it periodically.
1. Redwood Trust is a financial institution with competitive advantages in the business of investing in real estate loans and securities.
Since Redwood was founded in 1994, our goal has been to create a company that is more efficient than banks, thrifts, insurance companies, and other financial institutions at investing in, financing, and managing residential and commercial real estate loans and securities.
Like many financial institutions, our primary source of income is net interest income, which equals the interest income we earn from our investments in loans and securities less the interest expenses we incur from our borrowed funds and other liabilities.
Most financial institutions fund their asset investments with borrowed money sourced by taking bank deposits, writing insurance policies, or issuing corporate debt. By contrast, securitization is the primary source of funding for our investments.
We also borrow money on a collateralized and uncollateralized basis, typically at very competitive rates. We do not, however, take deposits or raise money in any other way that would subject us to consumer lending or banking regulations. Since we are not regulated as a financial institution and do not deal directly with consumers, our operating costs are far lower than other financial institutions, and we have far greater freedom to use securitization as a source of funding.
In a securitization, we sell our assets to an independent securitization entity that creates securities backed by those assets (asset-backed securities, or ABS) and sells these newly created securities to both domestic and international investors. Most of the securities created and sold earn the highest credit rating of AAA, so the interest expense paid out is relatively low. We typically generate a profit from these securitization entities, consisting of the yield on the securitized assets less the interest expense payments made to the holders of the ABS securities sold.
Advances in securitization technology have enabled securitization to become increasingly competitive as a funding source relative to corporate debt, deposits, insurance contracts, and other borrowings. The cost of funds for ABS issued continues to improve relative to the cost of other borrowings. More importantly, the range of assets that can be efficiently securitized continues to broaden and the capital efficiency of securitization as a source of funding continues to improve.
As global capital markets continue to develop and evolve, we expect securitization to become an even more efficient source of funding. There are trillions of dollars of real estate loans and securities in the U.S. and the world, and the amount outstanding has been and is expected to continue to grow every year. We believe many of these assets would be better funded through securitization than by other means. Since we are highly efficient at using securitization as a source of funding, we believe we will continue to grow and diversify our business over time.
Our tax structure gives us an additional competitive advantage that cannot be easily replicated by most other financial institutions. We have structured our company for tax purposes as a real estate investment trust (REIT) because our primary business is investing in real estate assets. As a REIT, we are required to distribute the bulk of our profits as dividends. By doing so, we avoid paying corporate taxes on most of the income we generate. This lowers our costs, as taxes are one of the largest costs of doing business for most financial institutions.
ABOUT REDWOOD TRUST
Redwood Business and Strategy
2. In terms of capital employed, our largest area of investment is real estate credit-enhancement securities.
Typically, 1% to 15% of the principal value of the securities created in a securitization of real estate assets are credit-enhancement securities (CES). These securities bear most of the credit risk with respect to the underlying assets that were securitized. If the underlying loans or securities suffer a loss of principal due to default, that loss is passed on by reducing the principal value of the CES. As a result of the high level of assumed credit risks, CES carry credit ratings that are below investment-grade. Because the CES absorb most or all of the credit risk that would normally be expected to occur, they reduce the credit risk of the more senior securities, allowing them to earn investment-grade ratings and to be sold at higher prices.
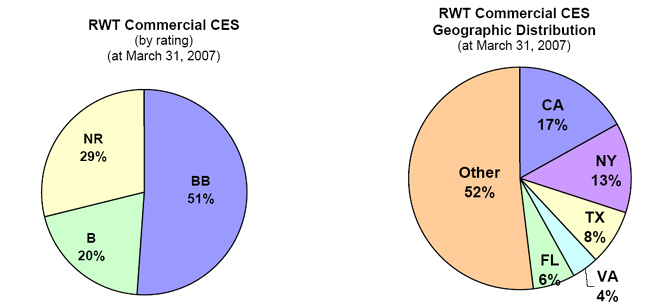
We are a leading investor in CES issued from securitizations of prime-quality residential real estate loans and we are an increasingly important investor in CES issued from securitizations of commercial real estate loans made on income-producing properties. In the last year, we have also made small investments in CES issued from securitizations of alt-a and subprime quality residential loans (some of these assets are also referred to as residuals and are listed on our balance sheet under ‘other real estate investments’). In total, at March 31, 2007, we owned residential, commercial, and CDO CES and similar other real estate investments with a principal value of $2 billion and a market value of $1 billion. Many of these securities are deep discount securities where our cost is far less than the principal value. Since we receive interest payments based on the principal value of a CES security, our interest income cash flow returns are strong. In addition, if credit losses are low, we will receive principal payments in excess of our cost basis, thus generating additional investment returns. Conversely, larger than expected credit losses could rapidly reduce the principal value of our CES, causing our investment returns from CES to suffer.
At March 31, 2007, our CES were first in line to absorb credit losses from the $294 billion of real estate loans and securities that underlie the securitizations from which our CES investments were issued. However, our potential credit losses are limited to the capital we have invested in CES.
With respect to these CES investments, we have a high degree of structural leverage since the principal value of our CES equals only a small percentage of the underlying asset pools. We do not, however, use a high degree of financial leverage with respect to our CES assets. We use capital rather than debt to finance most of our investments in the more junior subordinated CES (the first-loss and second-loss securities, or equivalent) and we use capital plus a modest amount of securitization financing through our Acacia CDO issuance program to finance the more senior CES that are closer to investment-grade quality.
Recently we have been acquiring more investment-grade securities than CES. We are highly focused on finding good opportunities to acquire residential, commercial, and CDO CES, as well as residuals, but in the current environment, we remain cautious. Later in 2007, and especially in 2008, we believe acquisition opportunities in CES may improve because we expect residential and commercial underwriting quality to improve.
ABOUT REDWOOD TRUST
Redwood Business and Strategy
3. We are increasing our investment in investment-grade rated real estate securities.
We are increasing our investments in residential and commercial real estate investment-grade securities (IGS) rated AAA, AA, A, and BBB for three reasons. First, advances in securitization technology (such as CDOs) allow us to re-securitize portfolios of certain types of residential and commercial investment-grade securities and earn attractive returns on invested capital, as well as asset management fees. Secondly, in an environment of flat or falling housing prices and increased residential loan delinquencies and credit losses, we have for some time been tilting our investment focus towards assets that are credit-enhanced by others (investment-grade securities) rather than towards assets that cause us to carry concentrated credit risk (credit-enhancement securities). Finally, we are increasing our investment in AAA- and AA-rated residential real estate securities funded with short-term Redwood debt. We pursued this investment strategy on a large scale from 1994 to 2000, after which we focused our investment strategy almost exclusively on assets with highly concentrated credit risks such as CES. Debt-funding AAA and AA real estate securities can be a good investment strategy in most economic environments. In addition, it fits our current balance sheet needs well, as we believe it will help us increase our capital utilization rate in a flexible manner and also will offset some of the risks we have in our balance sheet. Currently, our balance sheet is set up to benefit somewhat more from rising short-term interest rates and faster prepayment speeds, whereas debt-funded AAA and AA asset strategies typically benefit from falling short-term interest rates and slower prepayment speeds.
4. We are increasing our investment in residential real estate loans.
We have been increasing our acquisitions of high-quality residential loans, and we are using both securitization proceeds and Redwood debt to fund these assets. Our residential loan portfolio declined in size over the last few years as we purchased fewer loans and the adjustable-rate residential loans in our portfolio prepaid at rapid rates. Because we have been increasing our loan purchases and our loan prepayment rate has slowed, we expect our loan portfolio size to start to stabilize. We are buying hybrid loans (fixed rate for 3-10 years, converting to adjustable rate thereafter) as well as adjustable-rate loans. Our interest in acquiring loans has increased because we have greater control over the underwriting quality of acquired loans than we do with respect to the loans underlying the residential CES we acquire. Quality control has become more important as residential underwriting standards have deteriorated. In addition, we are buying more loans because we want to hold a portion of our loan portfolio in whole loan form (unsecuritized) and use Redwood debt (including collateralized commercial paper) to fund the whole loans. Compared to the alternative of using securitization proceeds to fund these loans, using debt funding increases our flexibility in utilizing more of our capital. Debt-funding loans requires a much larger capital commitment (8% of loan value versus 3%), and it generates a somewhat lower expected return on that capital than would a securitization. This is a flexible capital commitment, however, as we can easily recycle the capital utilized in this debt-funded strategy into other investments by either securitizing or selling the loans. Employing capital in this manner is useful at a time when we want to build our capital base to take advantage of future growth opportunities but we also want to improve profits by increasing our capital utilization rate, which has been lower than optimal in the last few years as we cut back our acquisition of CES.
ABOUT REDWOOD TRUST
Redwood Business and Strategy
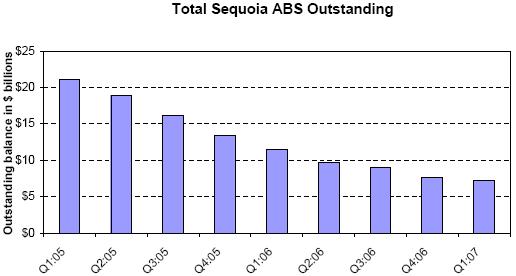
We are replacing some of our existing securitization funding with debt funding. In 2007 and 2008, we will exercise our rights to call many of our older “Sequoia” securitizations of residential loans. The terms of these securitizations generally allow us to call the deals when the current loan balance of the underlying loan pool pays down to 10% or 20% of its original balance. When calling a securitization, we pay off all the security holders at 100% of principal value and repurchase the underlying loans. We typically call our securitizations when we have the right to do so because the capital structure of a securitization becomes less efficient when the remaining balance of loans is small. It is better to call the deal so we can refinance the underlying loans more efficiently. We are financing a portion of the loans we acquire from called deals with Redwood debt and holding them as an ongoing investment. The remainder we either re-securitize or sell.
5. We buy most of our assets rather than originate them.
Our primary strategy for sourcing assets is to acquire closed loans and securities directly from other financial institutions or from the capital markets. We do not originate or service loans. Others create most of the real estate securities we invest in, some are created by us, but in both cases, others have originated the underlying loans. This role allows us to have an independent point of view on asset quality and attractiveness, as well as the flexibility to change investment strategies as markets evolve. In our experience over the years, many financial institutions that have origination operations have produced sub-optimal asset investment results. We believe this is because, in some cases, there may have been incentives to retain loans that might not be the best investment (in terms of price and/or quality) in order to maintain or boost origination volumes and fees. In addition, origination (especially residential loan origination) is a business that is highly cyclical, operations intensive, and increasingly fraught with lender liability. Residential origination is becoming concentrated in the hands of a few large companies that have either banking or brokerage operations as well. Rather than competing with these companies, we develop close relationships with them and help them build their businesses. They need companies like Redwood to buy their loans and credit-enhance their securitizations.
We previously built a successful commercial real estate loan origination operation at Redwood, and we may do so again in the future now that CDO securitization technology has improved the efficiency and ease of securitizing commercial real estate loans. We may also build a commercial real estate loan special servicing operation. However, we expect to continue to source most of our residential and commercial assets through acquisition rather than origination.
6. Competition for assets is strong, but we believe our operating efficiencies will allow us to remain competitive.
Our competitors are banks, thrifts, insurance companies, Fannie Mae, Freddie Mac, Wall Street brokerage firms, hedge funds, private equity firms, specialty finance companies, mortgage REITs, mortgage insurance companies, CDO securitization managers, asset management companies, foreign investors, and other financial institutions.
ABOUT REDWOOD TRUST
Redwood Business and Strategy
Our corporate structure and competitive strengths differ from most other financial institutions. With our differentiated capabilities, we interact not only as competitors, but also as customers and suppliers, with most of the institutions active in the vast and interconnected real estate capital markets.
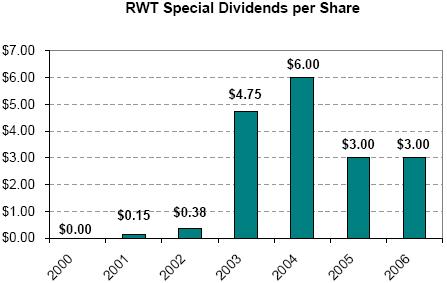
We commenced operations in 1994, a period of turmoil in financial markets. This turmoil allowed us to acquire assets that produced very high returns in subsequent years. The level of competition increased dramatically through the end of 1997, at which time we generally sold assets as the prospective risk/reward relationships for assets did not seem that attractive. There were several financial dislocations in 1998, including a prepayment acceleration crisis and a liquidity crisis. This allowed us to use our excess capital to acquire assets, including our own stock, at attractive prices. The CES we acquired in 1999 - 2002 performed very well, allowing us to report high return on equity results and to pay special dividends of $4.75 and $6.00 per share in 2003 and 2004, as well as $3.00 per share in each of the last two years.
The competitive environment over the last year has been much like 1997 - new entrants and other investors were willing to buy assets at high prices (low yields) despite increased potential risks. We responded to this lower return/higher risk environment by selling CES assets and slowing our acquisitions. We increased our acquisitions of assets (such as investment-grade securities and loans) that carry less concentrated credit risks than CES. We fund most of these assets via securitization, a form of financing that does not expose us to liquidity risks once a securitization is completed. For these assets, high prices were less of a concern because these high prices (and the resulting narrow spreads) were offset by the high prices at which we sell the securities we create using these assets as collateral.
Now the financial markets are experiencing turmoil due to falling housing prices and rising residential loan defaults. In all likelihood, we will incur increased credit losses, but we are also in a position to acquire lower priced assets with higher return potential. We believe competition will remain strong, however, and that any extraordinary asset acquisition opportunities will be short-lived. With our operating efficiencies, funding strategy, corporate structure, permanent capital base, and investment discipline, we believe we are prepared to continue to compete effectively in the highly competitive market that we expect will be the norm going forward.
7. We maintain a strong balance sheet with risks that are largely segregated and limited.
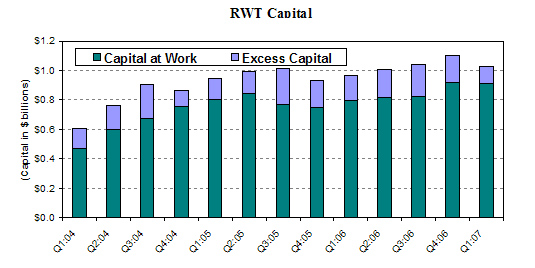
Through our internal risk-adjusted capital policies, we seek to maintain a strong balance sheet with a large capital base, risks that are limited and segregated, and ample liquidity. Our $1.0 billion long-term capital base is primarily common equity but also includes $0.1 billion of unsecured junior subordinated notes (trust-preferred securities) that have a 30-year maturity.
We use capital, not debt, to fund assets such as first-loss credit-enhancement securities and residuals that carry concentrated credit risks. These assets have a high degree of structural credit risk, so we do not feel it would be prudent to employ financial leverage to acquire these assets. Our risk is limited to our investment in these securities. Since we fund these assets with capital rather than debt, high credit losses should not cause liquidity concerns. Similarly, our economic risk is limited and our liquid reserves are secure with respect to securitized assets, since the assets are sold to and the securities are issued by independent securitization entities, whose liabilities are not Redwood’s obligations. Our economic risk is limited to the value of any securities we may acquire as an investment from these entities. Typically, either we fund securities acquired from securitizations we sponsor with capital or we sell these securities to another securitization entity for re-securitization. In either case, the risk is segregated and limited.
ABOUT REDWOOD TRUST
Redwood Business and Strategy
We also use Redwood debt to fund assets. This funding strategy brings us a number of benefits, including allowing us to employ our excess capital in a flexible manner. It does, however, expose us to potential liquidity risks as well as potential credit risks that are not as limited as with other parts of our balance sheet. Accordingly, we use Redwood debt primarily to fund assets (such as investment-grade rated securities and prime-quality residential whole loans) that do not have concentrated credit risks and that typically can be liquidated quickly. Increasingly, we expect to use extendable collateralized commercial paper as a source of short-term Redwood debt for debt-funded asset strategies. We believe the potential liquidity risks of commercial paper are less than those of our debt facilities in the form of repurchase agreements. Finally, we allocate capital equal to 8% of assets to support our debt-funded asset strategies, an amount that is well in excess of the amount required by our lenders. We believe this gives us a margin for safety should liquidity, market value, or credit concerns arise.
With respect to interest rate and prepayment rate risks, we seek to maintain a balance sheet that is well balanced and that can generate cash flows to fund our regular dividend in a wide variety of scenarios. We believe we have achieved this - the net present value of our projected cash flows does not vary materially with respect to scenarios incorporating changes in interest rates or prepayment rates. Scenarios incorporating different degrees of potential credit losses, however, show a wide variation in the long-term net present value of our cash flows. In the near-term (one to three years), our results may vary as a function of changes in interest rates, prepayments, credit results, mark-to-market asset values, and other factors.
8. Our primary financial goal is to deliver an attractive sum of dividends per share over time.
Our financial goal is to distribute the highest sum of dividends per share over the next few decades as we can. We seek to do that while also remaining within our risk tolerance levels and while increasing the inherent value of the company by building competitive advantages, diversifying risks and opportunities, developing internal capabilities, maintaining our culture, keeping operations highly efficient, and increasing book value per share.
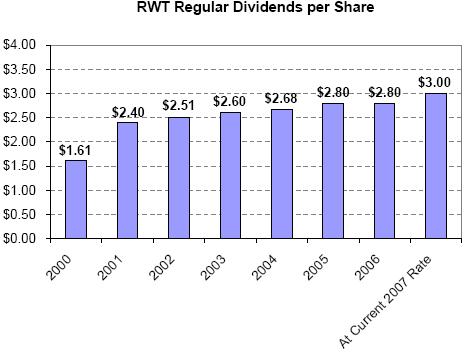
As a REIT, we are required to distribute to our shareholders as dividends at least 90% of our REIT profits as calculated for tax purposes. We distribute our profits as a regular quarterly dividend and also, in some years, in a year-end special dividend. The regular dividend rate for 2006 was $0.70 per share per quarter and the special dividend was $3.00 per share. Total dividends for 2006 were $5.80 per share.
We increased the regular dividend rate to $0.75 per share per quarter for the first quarter of 2007. We set the regular dividend rate at a level we believe is likely to be sustained over the next few years. Whether we pay a special dividend or not in 2007 will depend primarily on how much REIT taxable income we generate during the year. We expect that our total annual dividend payout amounts (regular plus special) will vary from year to year.
ABOUT REDWOOD TRUST
Redwood Business and Strategy
9. Growth is our mission.
In a manner consistent with our goal of distributing an attractive sum of dividends per share over time, our mission is to grow to become a larger company in terms of capital employed and market capitalization. We are targeting growth by building real estate investment, financing, and management operations with competitive advantages. Over the long term, growth should bring several advantages, including book value accretion and a diversified income stream.
We plan to grow organically as markets grow and as we gain long-term market share, rather than simply growing for growth’s sake or through short-term acquisition of market share, which would be irresponsible and inconsistent with our long-term goal of distributing attractive dividends per share. In addition, we do not expect growth to be linear, because, in cyclical markets, growth is not always the appropriate short-term strategy.
FINANCIAL REVIEW
GAAP Earnings and Core Earnings
What is this?
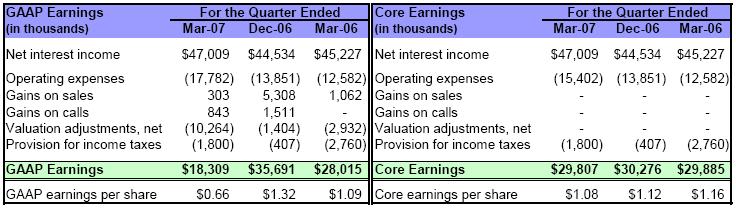
GAAP income is income calculated under Generally Accepted Accounting Principles (GAAP) in the United States.
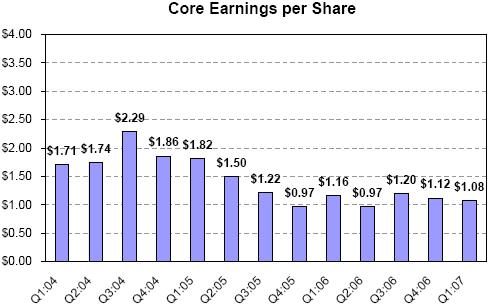
Core earnings is a profitability measure that highlights earnings that are more likely to be ongoing in nature. In calculating core earnings, we start with GAAP earnings and then exclude realized gains and losses on calls and sales, unrealized market value adjustments, and one-time items that are unlikely to be repeated. Table 2 in the Appendix shows a reconciliation of core earnings to GAAP earnings.
Highlights
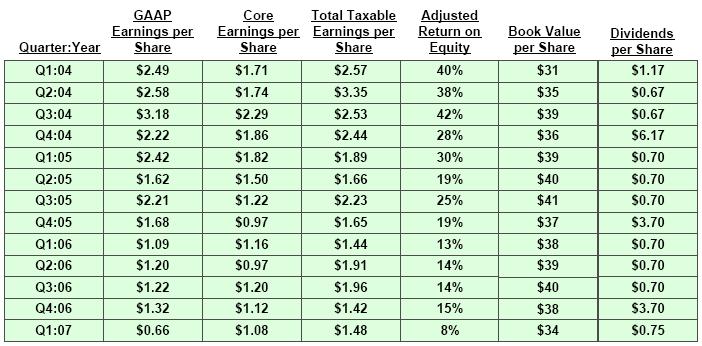
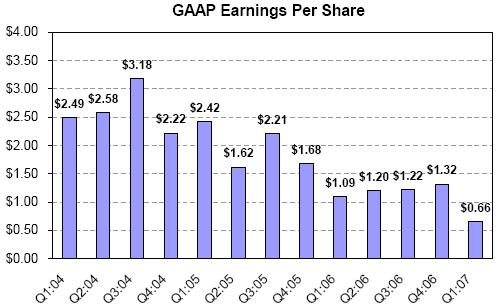
| · | GAAP earnings per share for the first quarter of $0.66 per share were lower than recent quarters primarily due to $10 million negative unrealized mark-to-market valuation adjustments, a $3 million charge against a commercial real estate loan, and $2 million severance costs. Net interest income for the first quarter was strong. |
| · | For the past year and a half, quarterly core earnings have ranged from $0.97 to $1.20 per share. Our first quarter core earnings of $1.08 per share were near the middle of this range. |
FINANCIAL REVIEW
GAAP Earnings and Core Earnings
FINANCIAL REVIEW
GAAP Earnings and Core Earnings
Quarterly Update:
| Ø | Net interest income for the first quarter of 2007 increased by $2 million over the fourth quarter of 2006 and $2 million over the first quarter of 2006. Higher net interest income earnings from our CES and IGS portfolios more than offset a decrease in net interest income from our residential loan portfolio and a $3 million charge related to a commercial real estate loan. The average balance of our residential loan portfolio continued to decline due to high prepayments on adjustable-rate residential loans acquired and securitized under our Sequoia program. |
| Ø | Our residential CES portfolio continues to benefit from strong credit performance and rapid prepayments on those securities backed by ARM loans. The yield for this portfolio was 22% in the first quarter of 2007, 22% in the fourth quarter of 2006, and 20% in the first quarter of 2006. |
| Ø | Operating expenses for the first quarter include $2 million of severance charges. Excluding this item, operating expenses increased by $2 million (or 11%) over the fourth quarter of 2006 as we have increased the number of our employees and increased pay levels at year-end. |
| Ø | The largest factor causing a decline in our GAAP earnings was $10 million of negative unrealized mark-to-market valuation adjustments. These adjustments were $9 million or $0.32 per share higher than the fourth quarter of 2006 and $7 million or $0.26 per share higher than the first quarter of 2006. The decrease in fair value reflects the overall market decline in prices for real estate securities (particularly, securities backed by subprime and alt-a loans) that occurred during the first quarter. Of the $10 million, $9 million related to securities accounted for as trading securities, for which quarterly mark-to-markets are a factor in GAAP net income. We had no securities classified as trading in the first quarter or fourth quarter of 2006. |
| Ø | As we expect to increase the amount of securities we classify as trading for accounting purposes, our quarterly GAAP earnings going forward will become increasingly volatile. Only certain types of market value changes are reported in our net income, so earnings changes will not reflect the net overall market value changes of our assets and liabilities. |
FINANCIAL REVIEW
Taxable Income
What is this?
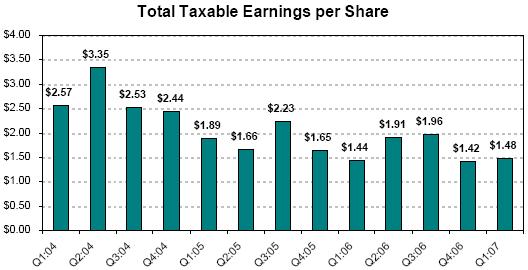
Total taxable income is our pre-tax income as calculated for tax purposes. Total taxable income differs materially from GAAP earnings. Table 3 in the Appendix reconciles these two profitability measures.
REIT taxable income is the primary determinant of the minimum amount of dividends we must distribute in order to maintain our tax status as a real estate investment trust (REIT). REIT taxable income is pre-tax profit, as calculated for tax purposes, excluding taxable income earned at our non-REIT taxable subsidiaries. Over time, we must distribute at least 90% of our REIT taxable income as dividends. A reconciliation of GAAP income to REIT taxable income appears in Table 3 of the Appendix.
Highlights
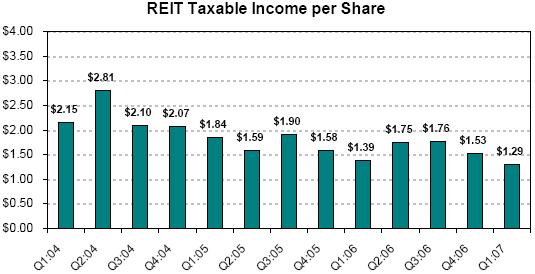
| · | Total taxable income for the first quarter of 2007 was strong at $1.48 per share, an increase from the prior quarter due to reduced tax deductions from stock option exercises. |
| · | REIT taxable income remained strong at $1.29 per share and continues to exceed our regular quarterly dividend by a comfortable margin. |
Tables & Graphs
FINANCIAL REVIEW
Taxable Income
Quarterly Update:
| Ø | Total taxable income was $40 million, or $1.48 per share, in the first quarter of 2007. This was an increase from the total taxable income we generated in the prior quarter of $38 million or $1.42 per share. In the prior quarter, we had more tax deductions relating to stock option exercises. |
| Ø | Our REIT taxable income was $1.29 per share in the first quarter of 2007. This was lower than the fourth quarter of 2006 of $1.53 due primarily to the timing of the reallocation of expenses between REIT and taxable subsidiaries. We are working to further develop this process so it does not cause large quarter-to-quarter variations. |
| Ø | Our taxable income continues to be higher than our GAAP income as we are not permitted to establish credit reserves for tax. As a result, we amortize more of our CES discount into income for tax and recognize a higher yield until credit losses occur. The cumulative difference at March 31, 2007 in the discount amortization between tax and GAAP for residential, commercial, and CDO CES was $99 million. |
| Ø | Another reason for the difference between tax and GAAP income is that we do not recognize changes in market values of assets for tax until the asset is sold. Consequently, the negative $10 million of unrealized market valuation adjustments included in our GAAP earnings this quarter were not included in our tax earnings. |
FINANCIAL REVIEW
Taxable Income
| Ø | Total taxable income and REIT taxable income were reduced by $2.2 million ($0.08 per share) in the first quarter of 2007 as a result of deductions for actual credit losses. The components of the $2.2 million in losses were $1.8 million on residential assets and $0.4 million on commercial assets. These deductions were less than the actual principal losses incurred on the underlying loans of $5.9 million ($4.6 million residential and $1.3 million commercial), as we own most of our credit-sensitive assets at a tax basis that is substantially less than par (principal) value. We currently expect that realized credit losses will increase substantially relative to our recent experience. We believe there is a reasonable chance that cumulative losses could remain less than the assumptions we have used for our pricing, GAAP reserve, and effective yield calculations. All realized credit losses, after adjusting for our tax basis in the assets we own, will reduce our dividend distribution requirements |
FINANCIAL REVIEW
Book Value per Share
What is this?
Book value per share is the amount of equity capital we have per share of common stock outstanding.
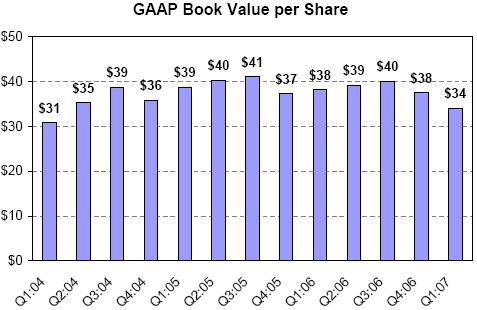
GAAP book value is our common equity as calculated for GAAP purposes. It includes mark-to-market valuation adjustments of some of our assets (principally the securities portfolio), but for none of our liabilities.
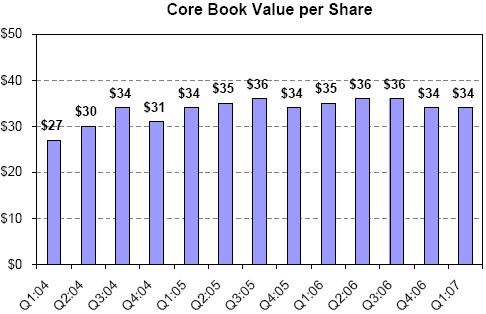
Core book value is GAAP book value excluding those mark-to-market valuation adjustments reflected on our GAAP balance sheets. Core book value more closely reflects historical amortized costs rather than current market values.
A reconciliation of GAAP book value to core book value appears in Table 7 of the Appendix.
Highlights
| · | GAAP book value declined by 9%, or $3.45 per share, during the first quarter from $37.51 per share to $34.06 per share as a result of declining asset values for those particular assets we own that are marked-to-market for balance sheet purposes. |
| · | Core book value rose by 1% during the first quarter of 2007 from $34.02 per share to $34.29 per share. |
| · | The disruption in the capital markets also impacted liability spreads. Under GAAP, we are required to carry our real estate securities on our balance sheet at their current market value, but we are not permitted to adjust paired Acacia ABS issued liabilities or other liabilities to market value. We estimate that if we had reported our Acacia ABS issued at fair value, our book value at March 31, 2007 would have been higher than reported by $41 million (or $1.51 per share). |
FINANCIAL REVIEW
Book Value per Share
Charts & Graphs
FINANCIAL REVIEW
Book Value per Share
Quarterly Update:
| Ø | The difference between core book value of $34.29 per share and GAAP book value of $34.06 per share at March 31, 2007 was cumulative mark-to-market balance sheet adjustments for GAAP of negative $6 million at quarter-end. |
| Ø | For the $3.6 billion of assets that were marked-to-market for balance sheet purposes at March 31, 2007, market values declined by $93 million in the first quarter of 2007. This represents an average decline in value during the quarter of 2% of principal value. |
| Ø | Market spreads widened in March—the yields the market requires increased, so asset values dropped. For some assets, value declines reflect a decline in economic value due to an increase in credit loss expectations. For other assets (including most of our assets), value declines reflect an increase in potential risks rather than a change in expected cash flows. The table below summarizes the change in unrealized mark-to-market (MTM) adjustments during the first quarter. |
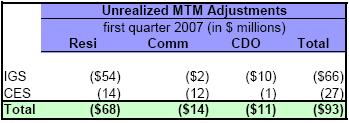
| Ø | On the positive side, our consolidated liabilities increased in value during the quarter, meaning we could buy back the securities we issued at a lower price than their issuance price. The interest expense we are incurring on the securities we issued is less than the interest expense we would have to pay if we had issued these liabilities in the first quarter of 2007. |
| Ø | Relative to the last few years, because asset prices are down, we earn more income on assets we buy today, but we also pay a higher interest expense on the securities we create and issue to finance our acquisitions. Overall, as of this writing, the resulting spread earning potential still appears attractive. The markets are volatile, however, and the cost to finance future asset acquisitions through securitization cannot be known until each transaction is completed. The overall situation is characterized by uncertainty, which, on average, we believe should benefit us relative to our competitors. |
| Ø | Changes in market values for our existing assets and liabilities have had little effect on our operations or actual and expected cash flows. On average, we see the increase in spreads (lower asset prices, more expensive liabilities) as a positive trend. Part of our business is being paid to assume credit risk, and it appears we are likely to be paid more in the future to take this risk than we have been in the recent past. |
FINANCIAL REVIEW
Book Value per Share
| Ø | At the end of our first quarter of operations in September 1994, GAAP book value was $11.67 per share. Since that time, we have paid $41.18 per share of dividends while also increasing GAAP book value by $22.39 per share. |
| Ø | Book value per share growth generally is not a direct indicator of our market value or an indicator of the returns available to our shareholders. If you had acquired Redwood stock at our initial public offering in August 1995 and had reinvested all dividends back into Redwood stock, your compounded return as a shareholder would have been 21% per year through March 31, 2007. Future results will vary. |
FINANCIAL REVIEW
Return on Equity
What is this?
Return on equity (ROE) is the amount of profit we generate each year per dollar of equity capital.
GAAP ROE is GAAP earnings divided by GAAP equity.
Adjusted ROE is GAAP earnings divided by core equity. Core equity excludes balance sheet mark-to-market adjustments that are not included in earnings.
Core ROE is core earnings divided by core equity.
A reconciliation of GAAP ROE to Adjusted ROE and core ROE, and of GAAP equity to core equity, appears in Table 7 of the Appendix.
Highlights
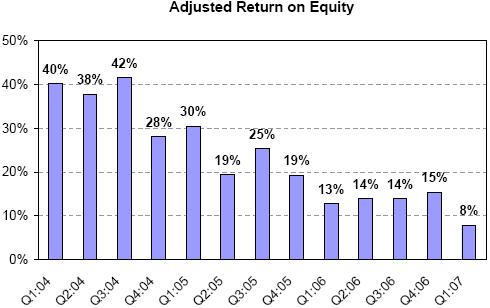
| · | During the first quarter of 2007, our adjusted return on equity dropped to 8% primarily due to the negative impact of unrealized market valuation adjustments on our GAAP earnings. |
| · | Over the long term, we expect to be able to generate annual adjusted returns on equity between 11% and 18%. |
| · | Core return on equity (core earnings divided by core equity) was 13% for the quarter. |
FINANCIAL REVIEW
Return on Equity
FINANCIAL REVIEW
Dividends
What is this?
We have established a regular quarterly dividend rate at a level we believe it is likely to be sustainable for the next few years. Distributions in excess of the regular dividend rate, if any, are typically paid in a fourth quarter special dividend.
Highlights
| · | We increased our regular quarterly dividend rate to $0.75 per share in 2007. |
Graphs
FINANCIAL REVIEW
Dividends
Quarterly Update:
| Ø | Total dividend distributions over the last four quarters were $5.85 per share. Assuming the recent Redwood stock price of $51, the indicated dividend yield would be 11.5% based on the last twelve months of dividends and 5.9% based on the current regular dividend rate of $3.00 per share for 2007. |
| Ø | Based on our estimates of REIT taxable income through the first quarter of 2007, at quarter end, we had $60 million ($2.20 per share) undistributed REIT taxable income that we anticipate distributing in 2007 through our regularly quarterly dividend and a special dividend. |
| Ø | We generally distribute 100% of REIT capital gains income and 90% of REIT ordinary income, retaining 10% of the ordinary REIT income. We generally retain 100% of the after-tax income we generate in taxable subsidiaries. |
RESIDENTIAL REVIEW
Residential Real Estate Securities
What is this?
We invest in securities that are backed by pools of residential real estate loans. These are shown on our balance sheet in real estate securities and in other real estate investments.
Highlights
| · | Total residential securities increased by 15% in the first quarter, from $2.4 billion to $2.8 billion, as a result of $609 million acquisitions, $20 million discount amortization, $114 million sales, $4 million calls, $63 million principal pay downs, and $70 million market value declines. Our primary emphasis during the first quarter was acquiring investment-grade rated securities. |
| · | For the most part, we believe the trend towards lower market values is good for us - it allows us to buy new assets more cheaply while not affecting our business in a material way. We are much more concerned about the cash flows our assets will generate than we are about market value fluctuations. |
| · | We have had increasing concerns about the credit performance of the loan pools underlying a small number of our residential securities. We have sold most of these securities. In the second quarter through May 4, we sold $6 million residential securities generating a de minimis GAAP loss in the second quarter. |
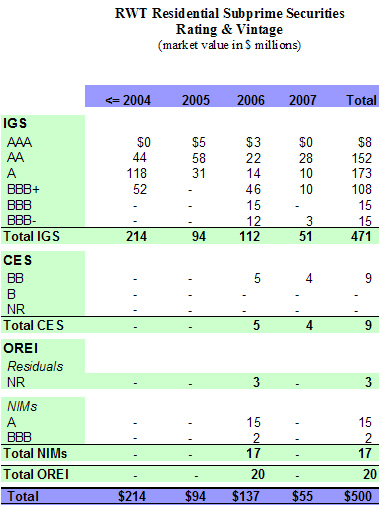
| · | We own some assets that would appear to be higher risk assets in the current environment. Using March 31, 2007 values and adjusting for subsequent second quarter sales, we currently own $17 million subprime securities of the 2006 vintage rated BBB- or lower and $78 million alt-a securities of the 2006 vintage rated BB+ or lower. We bought some of these assets at very low prices, some have higher-than-average loan quality for their type, some have very short average lives, and others generate returns driven primarily by prepayment rates rather than credit losses. Most of these remaining higher-risk assets are currently performing better than or equal to our expectations. We expect that cash flow returns from many of these assets will be attractive relative to similar assets of the same vintage and rating. Although certainly not free from risk, for the most part they have the potential to generate reasonable investment returns in a housing environment even more difficult than currently appears to be indicated. The upside potential from some of these assets is quite large if the environment does not worsen. Market values will fluctuate. |
| · | Our credit reserves for residential securities were $393 million, or $14.48 per share, at March 31, 2007. Reserves associated with prime assets were $264 million; reserves associated with alt-a assets were $129 million; no reserves were associated with our $9 million investment in subprime BB-rated securities. |
| · | Of the $2.8 billion residential securities we owned at March 31, 2007, $1.8 billion were financed through re-securitization via Acacia CDO transactions and $1.0 billion were financed with Redwood debt and capital. |
RESIDENTIAL REVIEW
Residential Real Estate Securities
| · | We plan to continue to acquire new residential securities of all types. Although we expect to incur some credit losses, overall we believe the longer-term outlook for investing in residential securities is increasingly positive. We expect underwriting quality to improve and we expect pricing and spreads between assets and liabilities to become somewhat more attractive than they have been in the recent past. |
| · | In the short-term, our biggest issue with respect to investing in additional residential IGS securities is that our CDO financing costs are unknown because the CDO issuance market is experiencing substantial disruption. Nevertheless, we priced an option ARM CDO transaction in April at attractive economic levels. We expect to price another CDO transaction in the second quarter; if we can achieve currently indicated CDO pricing levels, this will also be a profitable transaction. |
| · | We have established and initiated the funding of a wholly-owned qualified REIT subsidiary - Cypress Trust, Inc. - to hold some of our investments in high-quality investment-grade residential securities and high-quality prime residential loans. These assets will be funded initially with debt, although Cypress will likely also utilize securitization as a form of financing in the future. We believe spread lending opportunities with high credit quality securities and loans are becoming increasingly attractive. In order to raise capital to accommodate growth in this low credit risk strategy, we may sell new shares in Cypress at some point. Our asset management subsidiary, Redwood Asset Management, Inc., would manage Cypress as an external REIT. |
RESIDENTIAL REVIEW
Residential Real Estate Securities
Quarterly Update:
| a) | Residential Investment-Grade Securities |

| Ø | Our residential IGS portfolio increased by 19% in the first quarter from $1.7 billion to $2.0 billion as a result of acquisitions of $535 million, market value declines of $54 million, sales of $108 million, calls of $2 million, transfers to other portfolios of $14 million, and principal pay downs of $30 million. |
| Ø | The majority of our residential IGS acquisitions for the quarter were designated investments for two upcoming Acacia securitizations. One of these securitizations is predominately focused on option ARMs; the other is our more typical mezzanine CDO with a broader range of underlying mortgage collateral types. |
| Ø | During the first quarter, our residential IGS acquisitions were 25% prime, 63% alt-a, and 12% subprime. By interest rate type, these acquisitions were 60% option ARMs, 20% hybrids, and 20% fixed. |
| Ø | At March 31, 2007, $1.3 billion residential IGS were financed via securitization in our Acacia CDO program and $0.7 billion were financed with Redwood debt and capital. We are holding most of these $0.7 billion of securities in anticipation of selling them to future Acacia securitizations. |
| Ø | At March 31, 2007, the interest rate characteristics of residential IGS were 46% adjustable-rate, 35% hybrid, and 19% fixed rate. We use interest rate agreements to generally match the interest rate characteristics of these assets to their corresponding funding sources. |
| Ø | We have never incurred a principal loss on residential IGS. We do not have credit reserves for these assets. |
RESIDENTIAL REVIEW
Residential Real Estate Securities
Quarterly Update (Continued):
| Ø | Interest income generated by residential IGS was $29 million for the first quarter. The yield for the first quarter was 6.56%, a decline from 6.77% the previous quarter as we purchased higher-rated securities with lower yields. |
| Ø | Net discount amortization income (which is included in interest income) for the first quarter was $1 million. At quarter-end, our net discount balance for these assets was $20 million, giving us an average amortized balance sheet cost basis for residential IGS of 99.06% of principal value. |
| Ø | We purchased $33 million residential IGS in April at significantly higher expected yields. |
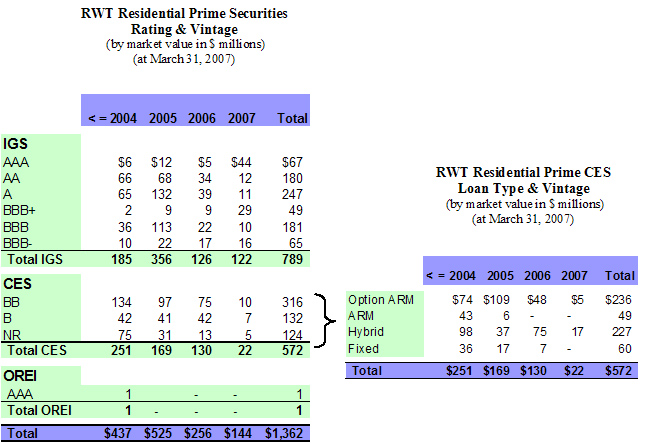
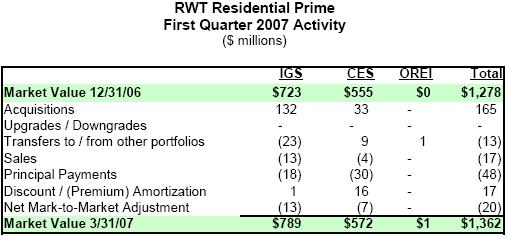
| Ø | In the first quarter, our residential prime IGS portfolio grew by $66 million (or 9%) to $789 million. Our residential alt-a IGS portfolio grew by $311 million (or 68%) to $766 million as we acquired collateral for an option ARM CDO. |
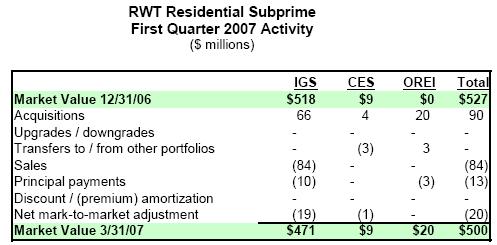
| Ø | Our subprime IGS portfolio declined by $48 million (or 9%) to $471 million as sales exceeded new acquisitions of $66 million. We sold $84 million subprime IGS in the first quarter - $53 million of which was older subprime IGS that we reacquired through the call of Acacia 4. The remaining $31 million were credit risk sales of underperforming 2006 securities; sales of these securities generated a GAAP income statement loss of $1 million in the first quarter. |
| Ø | Additional information on our residential IGS can be found in Tables 9, 10, and 18 of the Appendix. |
RESIDENTIAL REVIEW
Residential Real Estate Securities
Quarterly Update (Continued):
| b) | Residential Credit-Enhancement Securities |
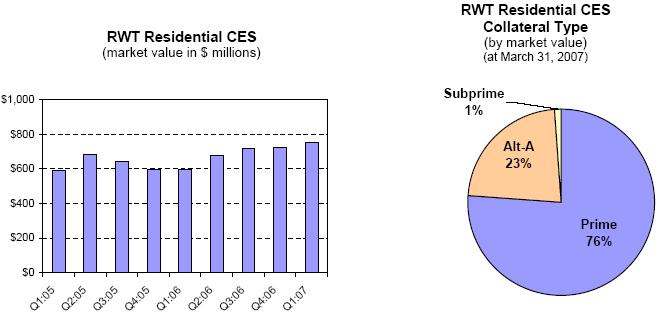
| Ø | The total value of our residential CES portfolio increased by 4% from $722 million to $752 million in the first quarter as a result of $74 million acquisitions, $15 million market value declines, $2 million EITF 99-20 impairment write-downs, $5 million sales, $1 million calls, $19 million discount amortization, $5 million transfers out to other portfolios, and $35 million principal pay downs. |
| Ø | The balance of residential loans underlying our residential CES increased by 13% from $210 billion to $237 billion during the first quarter. |
| Ø | During the quarter, the loans underlying our residential CES acquisitions were 45% prime, 49% alt-a, and 6% subprime. By interest rate type, the loans underlying these acquisitions were 58% option ARMs, 33% hybrids, and 9% fixed. |
| Ø | Interest income generated by residential CES was $38 million for the first quarter. The yield for the first quarter was 22%, the same as the previous quarter. Yields for the first quarter were 24% for prime CES, 19% for alt-a CES, and 10% for subprime CES. Interest income was $30 million, $7 million, and $1 million for these sub-portfolios, respectively. CES yields remain high due to fast prepayment speeds and continued good credit performance for underlying loans. |
RESIDENTIAL REVIEW
Residential Real Estate Securities
Quarterly Update (Continued):
| Ø | Overall, our alt-a and prime CES portfolios are performing well from a credit perspective. Our subprime CES portfolio has limited seasoning; early credit performance results are within our expectations. |
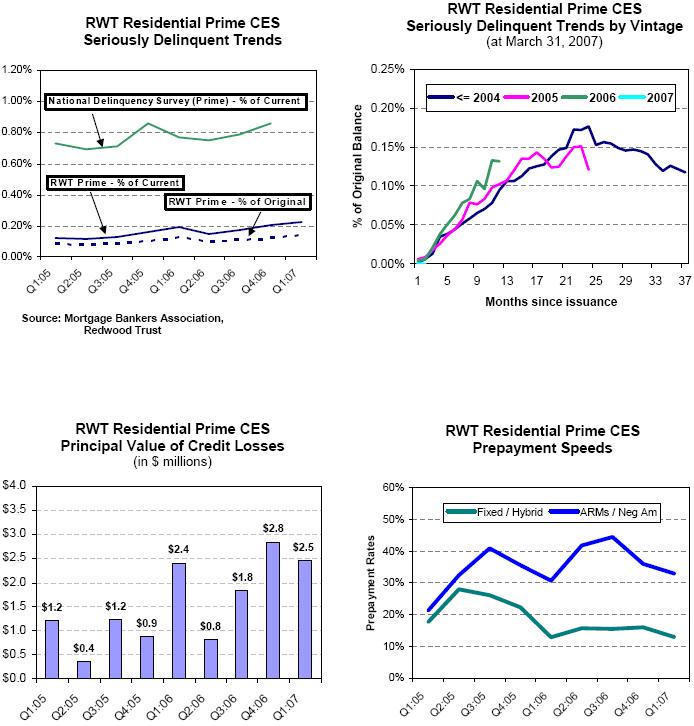
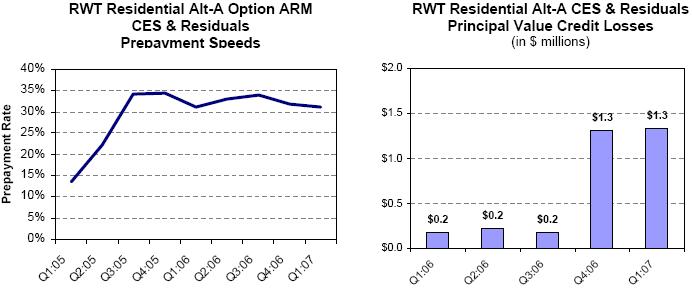
| Ø | Principal value credit losses for loans underlying CES were $3.8 million for the quarter, a decrease from $4.2 million in the previous quarter. As assets season, we expect losses to increase substantially in percentage terms, while perhaps remaining relatively low in absolute numbers. Cumulative losses and the current loss rate remain lower than our original pricing expectations. |
| Ø | For tax purposes, realized credit losses were $1.5 million ($0.06 per share) for residential CES for the first quarter. This deduction is less than the principal value losses incurred on the underlying loans of $3.8 million, as we own most of our credit-sensitive assets at a tax basis that is substantially less than par (principal) value. |
| Ø | Our GAAP credit reserves for residential CES were $393 million ($14.48 per share) at March 31, 2007, an increase of $21 million for the quarter. New acquisitions increased this reserve by $48 million. As a result of the strong credit performance of underlying loans, we transferred $22 million residential CES credit reserves to unamortized discount that will be amortized into income over time. Unamortized discount balances for residential CES were $159 million at quarter-end. |
| Ø | At March 31, 2007, $286 million residential CES were financed with equity and Redwood debt, and $466 million were financed through our Acacia CDO program. |
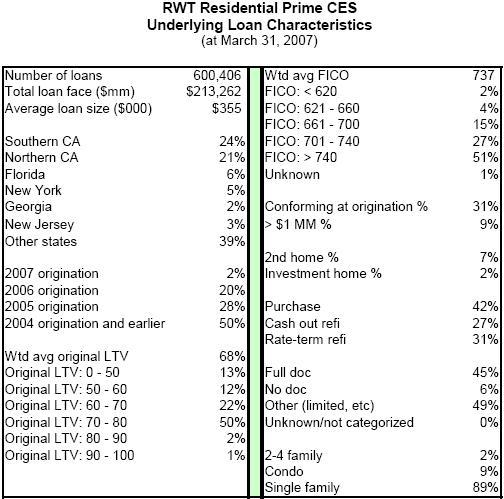
| Ø | Our total residential prime CES portfolio increased by $16 million (3%) to $571 million during the first quarter. Overall, our prime CES portfolio is performing well from a credit perspective and continues to benefit from fast prepayments. |
| Ø | The balance of seriously delinquent loans underlying prime residential CES increased from $381 million to $485 million during the quarter, an increase from 0.12% to 0.14% of original balances and 0.20% to 0.23% of current balances. These increases remain in line with normal seasoning and remain well below our initial modeling expectations. |
| Ø | Securities backed by option ARM and traditional ARM loans continued to prepay significantly faster than our original expectations at a weighted average CPR of 40%. These securities represent 50% of our prime CES, and they are priced and structured to benefit from fast prepayment speeds in addition to low losses. |
| Ø | The principal value of credit losses for loans underlying our prime CES was $2.5 million, which is less than one basis point (0.01%) per year. |
RESIDENTIAL REVIEW
Residential Real Estate Securities
Quarterly Update (Continued):
| Ø | Fifty percent of our prime portfolio is composed of securities backed by hybrid and fixed-rate mortgages. The loans underlying these securities prepaid at a weighted average CPR of 13% in the first quarter. This is slower than our original expectations. Cumulatively over time, however, prepayment rates for these assets have been more rapid than we originally assumed. |
| Ø | Our residential alt-a CES portfolio increased by $15 million (10%) to $172 million during the first quarter. Option ARM collateral makes up 92% of this portfolio. We sold $5 million underperforming alt-a CES in April for a minimal loss. |
| Ø | We generally acquire these alt-a securities backed by option ARMs with loss expectations that are six times greater than we expect for our prime hybrid CES. To date, the performance of our CES backed by option ARMs continues to exceed our expectations. |
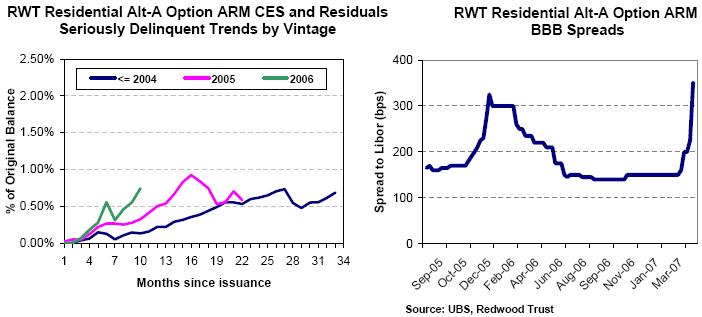
| Ø | The balance of seriously delinquent loans underlying alt-a residential CES increased from $187 million to $296 million during the quarter, an increase from 0.60% to 0.82% of original balances and 1.03% to 1.51% of current balances. These increases remain below our initial modeling expectations. |
| Ø | Our subprime CES portfolio remained nearly flat for the quarter at $9 million, with $4 million acquisitions and $3 million of transfers from other portfolios. Our subprime CES portfolio has limited seasoning; however, the early credit performance continues to be within our expectations. |
| Ø | In April 2007, we purchased $21 million deep-discounted subprime BBB and BBB- securities. |
| Ø | We continue to search for subprime credit investment opportunities, and we expect to make additional investments in distressed assets as well as in assets backed by new loans as quality improves. In addition, we expect to create new assets by buying and securitizing loans. At this point, we believe the subprime sector is still far from recovery, so we currently expect the volume of our subprime CES and residual investments will remain limited for some time. We do not originate or service subprime loans, nor at this point, do we intend to. |
| Ø | The subprime markets are very large in terms of potential capital employed and we believe they offer ongoing opportunities for Redwood, potentially on a large scale. So as to not change the essential nature of Redwood as an investor in higher quality loans, we are considering raising capital though a separately managed vehicle in order to fund our future growth in the subprime markets. |
| Ø | Additional information on our residential CES can be found in Tables 9, 10, 11, and 12 of the Appendix. |
RESIDENTIAL REVIEW
Residential Real Estate Securities
Quarterly Update (Continued):
| c) | Other Residential Real Estate Investments |
| Ø | Other real estate investments (OREI) are assets that we mark-to-market for income statement purposes, in many cases because they may otherwise be deemed to contain embedded derivatives for accounting purposes under FAS 155. We expect to acquire additional OREI assets. Unrealized mark-to-market fluctuations will affect GAAP income but will not directly affect core or taxable income. |
| Ø | OREI are a new reporting category we established in the first quarter of 2007. We transferred $18 million of assets that were held in other portfolios at December 31, 2006 into this category. Total OREI at March 31, 2007 was $50 million. This included $19 million residuals, $29 million net interest margin securities (NIMs), and $2 million IOs. |
| Ø | The collateral type underlying our OREI was $2 million prime, $28 million alt-a, and $20 million subprime at March 31, 2007. |
| Ø | Our OREI portfolio generated a 26 % yield for the first quarter, producing $2 million interest income. Mark-to-market charges to income were negative $5 million for the quarter, as a result of the substantial bid-ask spread on these new purchases plus the general decline in market values towards quarter-end. |
| Ø | Residuals are first-loss securities that are not rated by a rating agency. The value of residual securities can vary widely and is highly dependent on prepayment speeds. The value is also dependent on the level and timing of credit losses, but often is not as sensitive to losses as it is to prepayment speeds. These securities perform poorly when prepayments are fast and losses are higher than expected. |
| Ø | Due to early, poor credit performance, we sold one residual security in April. We sold the security at the market value reflected in our first quarter financial statements. |
| Ø | Our NIMs are structured in such a way that they mature quickly (typically less than two years). The majority of the NIMs we have acquired have an investment-grade rating. |
| Ø | OREI at March 31, 2007 consisted of $8 million of investment-grade alt-a NIMs with an average life of 2.5 years. |
RESIDENTIAL REVIEW
Additional Information - Residential Prime
Prime securities are mortgage-backed securities backed by high credit quality residential loans. The borrowers typically have high FICO credit scores. The loans have relatively low loan-to-value (LTV) ratios.
RESIDENTIAL REVIEW
Additional Information - Residential Prime
RESIDENTIAL REVIEW
Additional Information - Residential Prime
RESIDENTIAL REVIEW
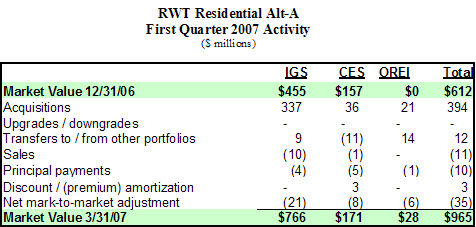
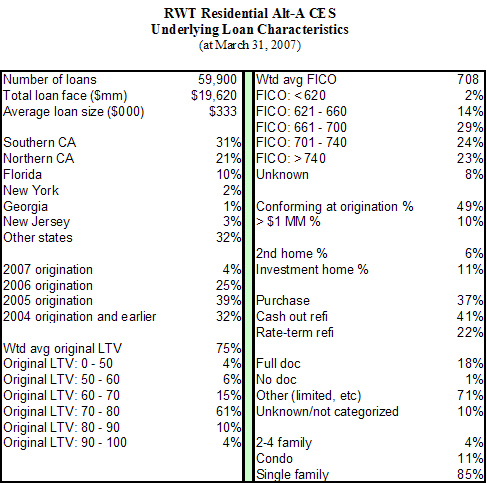
Additional Information - Residential Alt-A
Alt-A securities are residential mortgage-backed securities backed by loans that generally have higher credit quality characteristics than subprime, but lower credit quality characteristics than prime.
RESIDENTIAL REVIEW
Additional Information - Residential Alt-A
RESIDENTIAL REVIEW
Additional Information - Residential Alt-A
RESIDENTIAL REVIEW
Additional Information - Residential Subprime
Subprime securities are residential mortgage-backed securities backed by lower-quality loans. Many subprime borrowers have impaired credit histories
RESIDENTIAL REVIEW
Additional Information - Residential Subprime
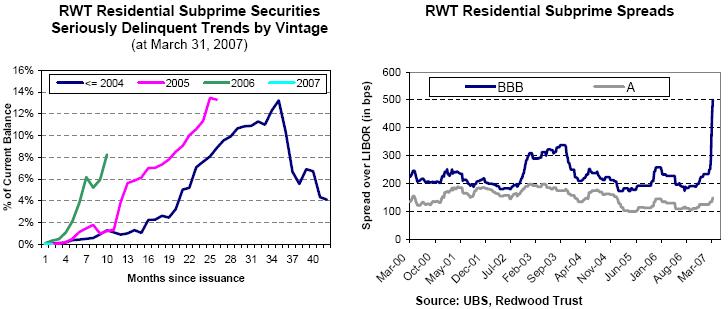
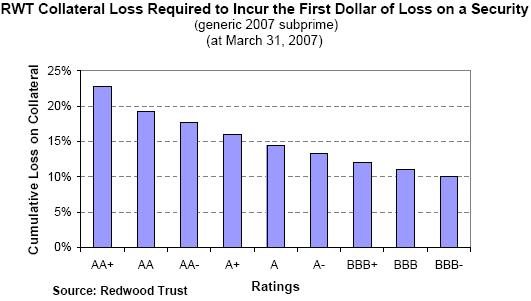
Explanation of Graph:
The graph above uses a base case prepayment and loss curve on generic 2007 subprime IGS to generate a cumulative deal loss where the selected IGS will suffer its first dollar of principal loss. For example, a generic 2007 subprime IGS with a rating of AA will take a principal loss when underlying cumulative credit losses approximate 19% of the original loan balance or higher using a base case prepayment and loss curve. Actual risk characteristics for individual subprime securitizations differ.
RESIDENTIAL REVIEW
Additional Information - Residential Subprime
RESIDENTIAL REVIEW
What is this?
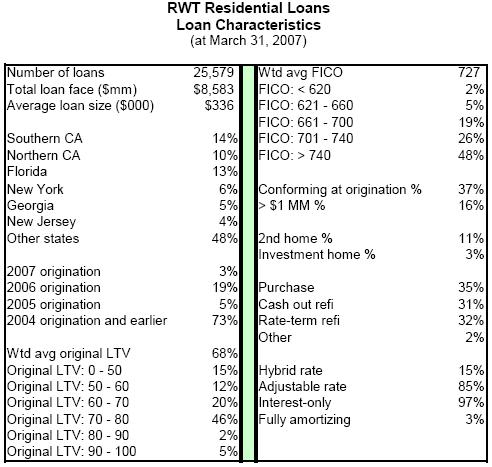
We invest in residential real estate loans that we acquire from mortgage origination companies. Most of the loans we acquire are prime-quality loans. We do not originate or service residential real estate loans. We fund our loan investments via securitization and with Redwood debt and capital.
Highlights
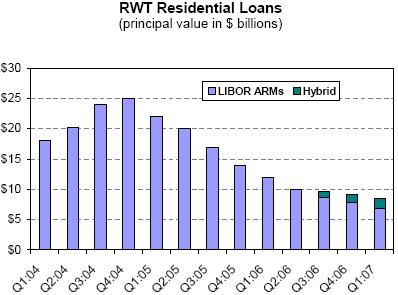
| · | Our loan acquisition activity through our conduit is increasing. Our primary focus has been hybrids, as ARMs are out of favor in the current yield curve environment. We purchased $415 million residential hybrid loans this quarter. All our loans were prime-quality loans at origination. |
| · | Seriously delinquent loans and credit losses on residential loans are increasing due to normal seasoning, but remain well below our initial expectations. |
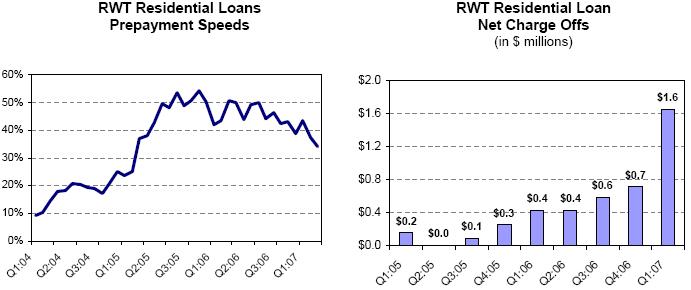
| · | Prepayment speeds on our loan portfolio, consisting mostly of ARM loans, continued to be fast, prepaying at a CPR of nearly 37% for the first quarter. |
| · | We completed one securitization in the first quarter, financing $885 million hybrid loans. In April, we priced another Sequoia securitization that will close in May. We called one older Sequoia securitization during the first quarter. The cost of financing loans has risen as market spreads for ABS have widened. Nevertheless, the two Sequoia transactions we have priced in 2007 have been profitable. |
RESIDENTIAL REVIEW
RESIDENTIAL REVIEW
Residential Loans
Quarterly Update:
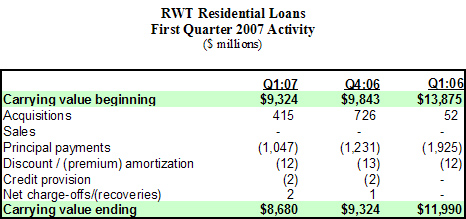
| Ø | In the first quarter, our residential loan portfolio declined from $9.3 billion to $8.7 billion. We acquired $415 million loans and had no sales. Principal pay downs were $1.0 billion. The average annual prepayment rate (CPR) was 37% for the first quarter versus 34% for all of 2006. Most of these loans are adjustable-rate loans that tend to prepay rapidly when the yield curve is flat or inverted. |
| Ø | Interest income was $129 million in the first quarter, a decrease from $138 million in the previous quarter. This portfolio yielded 5.93%. The yield in the previous two quarters was 5.97%. |
| Ø | Premium amortization expenses, a component of interest income, were $12 million for the first quarter. We ended the first quarter with $8.6 billion principal value of loans and a loan premium balance of $117 million for an average basis of 101.37% of principal value. For various technical accounting reasons, for several years we have not been able to amortize premium expense balances as quickly as the loans prepaid. If short-term interest rates decline, under these accounting rules we would expect premium amortization expenses to increase significantly. Largely because premium amortization expenses have not kept pace with prepayments in the past, we estimate the book value of residential loans exceeded their market value by $65 million at quarter-end. |
| Ø | Realized credit losses were $1.6 million for the first quarter, an annual loss rate of eight basis points (0.08%) of the reduced loan balances. The loss for tax purposes was $0.3 million. Cumulative losses have been far lower than our original expectations. We expect losses to continue to increase as these loans season. Credit reserves for this portfolio were $20 million (or 0.23%) at quarter-end. |
| Ø | The balance of seriously delinquent loans increased from $74 million to $79 million during the quarter, an increase from 0.24% to 0.26% of original balances and an increase from 0.81% to 0.92% of current balances. |
| Ø | At the end of the first quarter, $7.4 billion residential loans were financed via securitization (“Sequoia”) and $1.3 billion were financed with Redwood debt and equity. |
| Ø | We are planning to acquire and securitize alt-a and subprime loans in the future in addition to our current business of acquiring and securitizing prime-quality loans. |
| Ø | Additional information on our residential loans can be found in Tables 9, 10, 11, and 14 of the Appendix. |
RESIDENTIAL REVIEW
COMMERCIAL REVIEW
Commercial Real Estate Securities and Loans
What is this?
We invest in securities that are backed by pools of commercial real estate loans. These are represented on our balance sheet as part of real estate securities. We also invest in commercial real estate loans. These are represented on our balance sheet as part of real estate loans.
Highlights
| · | Total commercial securities declined by 3% in the first quarter, from $568 million to $551 million, as a result of $6 million acquisitions, $6 million sales, $1 million principal pay downs, and $14 million negative market value changes. We did not acquire or sell any commercial loans. |
| · | Spreads for commercial securities widened (asset prices declined) somewhat in the first quarter as market participants became more risk-averse and markets became less liquid. Problems in subprime residential lending, developing problems in CDO markets, and record volumes of new CMBS issuance were part of the cause. |
| · | In the first quarter, we did not invest in any CMBS transactions as the first-loss buyer. We invested in a new transaction in the second quarter, making a new investment of $42 million in these commercial CES. |
| · | For 2007, we now expect to slow our pace of commercial CES acquisitions relative to last year. Although the commercial property market is healthy, our concerns for the longer-term are growing, given elevated property prices and increasingly aggressive underwriting. We are satisfied with our current assets, but we are not currently looking to add substantial new assets. Our current focus is primarily on building our surveillance and special servicing capabilities. Over time, we also expect to expand our capacity to acquire, originate, and finance commercial real estate loans. |
| · | We are committed to building a complete commercial real estate finance business with more fully developed capabilities and a broader product line. We are not in any hurry to do so, however. Given current market dynamics, building slowly seems the prudent course of action. |
COMMERCIAL REVIEW
Commercial Real Estate Securities and Loans
Quarterly Update:
| a) | Commercial Investment-Grade Securities |
| Ø | Our commercial IGS declined by $4 million (or 3%) in the first quarter. Acquisitions were $3 million, sales were $6 million, principal pay downs were $1 million, upgrades of commercial CES securities to IGS were $4 million, and market value declines were $2 million. Sales were the result of our call of Acacia 4 and the subsequent sale of some of Acacia 4’s assets. We recognized $0.1 million of gains from these sales of commercial IGS. |
| Ø | Anticipating spread widening, we have not been acquiring significant volumes of investment-grade CMBS for some time. We may seek to complete our second commercial real estate CDO (CRE CDO) in 2008, in which case we may acquire additional commercial IGS. |
| Ø | Interest income generated by commercial IGS was $2 million for the first quarter. The yield for the quarter was 6.14%, a decrease from 8.77% in the previous quarter. The decrease in yield was primarily the result of our sale of higher-yielding commercial interest-only securities during the fourth quarter of 2006. |
| Ø | The market value decline of $2 million in commercial IGS was largely the result of credit spread widening in BBB-rated securities, reflecting increased supply of CMBS amidst credit concerns across all mortgage ABS sectors. |
| Ø | The credit performance of our commercial IGS portfolio remains strong. |
| Ø | We have never incurred a principal loss on a commercial IGS security and we do not currently maintain GAAP credit reserves against our commercial IGS securities, as we expect external credit enhancement (primarily structural credit subordination) will sufficiently protect our investments from principal losses. |
| Ø | The interest rate characteristics of commercial IGS were 80% fixed rate and 20% floating rate. We use interest rate agreements to reduce interest rate mismatches that may occur between assets and their associated liabilities. |
| Ø | At March 31, 2007, 92% of our commercial IGS were financed via our Acacia CDO program. |
| Ø | Additional information on this portfolio can be found in Tables 9, 10, and 18 of the Appendix. |
COMMERCIAL REVIEW
Commercial Real Estate Securities and Loans
| b) | Commercial IGS Tables & Graphs |
SEQUOIA
Sequoia is the brand name for most of the securitizations of residential real estate loans we have sponsored.
SUBPRIME SECURITIES
Subprime securities are residential mortgage-backed securities backed by loans to borrowers who have impaired credit histories, but who appear to exhibit the ability to repay the current loan. Typically, these borrowers have lower credit scores and/or other credit deficiencies that prevent them from qualifying for prime or alt-a mortgages. To compensate for the greater risks and higher costs to service the loans, subprime borrowers pay higher interest rates, points, and origination fees.
Subprime borrowers typically have experienced credit problems in the past, such as late payments or bankruptcies.
Typical characteristics of subprime loan pools are:
· More than 60% of loans with FICO < 680
· Weighted average LTV over 85%
· More than 70% of loans with LTV over 75%
· Loans with LTV over 80% with no mortgage insurance
TAXABLE SUBSIDIARY
A taxable subsidiary is a subsidiary of a REIT that is not taxed as a REIT and thus pays taxes on its income. A taxable subsidiary is not limited to investing in real estate and it can choose to retain all of its after-tax profits.
TOTAL RETAINED TAXABLE INCOME
Total retained taxable income is not a measure calculated in accordance with GAAP. Total retained taxable income is the taxable income earned at the REIT after dividend distributions to our shareholders, plus all of the taxable income earned at our taxable subsidiaries, less corporate income taxes and excise taxes paid. A reconciliation of total retained taxable income to GAAP income appears in Table 3 of the Appendix.
TOTAL TAXABLE INCOME
Total taxable income is not a measure calculated in accordance with GAAP. Total taxable income is pre-tax income for Redwood and all its subsidiaries as calculated for tax purposes. Taxable income calculations differ significantly from GAAP income calculations. The remainder of our total taxable income is income we earn in taxable subsidiaries. We pay income tax on this income and we generally retain the after-tax income at the subsidiary level. A reconciliation of total taxable income to GAAP income appears in Table 3 of the Appendix.
APPENDIX