|
| | |
The Redwood Review 2nd Quarter 2007 |
|
Introduction | | | 2 | |
Shareholder Letter | | | 3 | |
Quarterly Overview | | | 4 | |
| | | | | |
Financial and Business Modules | | | | |
| | | | | |
| • Financial | | | 6 | |
| • Residential | | | 16 | |
| • Commercial | | | 41 | |
| • CDO | | | 47 | |
| • Capital | | | 52 | |
| • Debt | | | 54 | |
| • ABS Issued | | | 56 | |
| | | | | |
Redwood Business and Strategy | | | 64 | |
| | | | | |
Appendix | | | | |
| • Glossary | | | 70 | |
| • Financial Tables | | | 77 | |
The Redwood Review 2nd Quarter 2007 | | 1 |
Note to Readers:
We file quarterly reports (on Form 10-Q) and annual reports (on Form 10-K) with the Securities and Exchange Commission. These filings and our earnings press releases provide information about our financial results in accordance with Generally Accepted Accounting Principles (GAAP). We urge you to review these documents, which are available through our web site, www.redwoodtrust.com.
This document, called Redwood Review, provides supplemental information about Redwood through a discussion of many GAAP as well as non-GAAP metrics, such as core earnings and taxable income. We believe that these figures provide additional insight into Redwood’s business and future prospects. In each case in which we discuss a non-GAAP metric, you will find an explanation of how it has been calculated and why we think the figure is important. In the Appendix, you will find reconciliations between GAAP and non-GAAP figures. We hope you find the Redwood Review to be helpful to your understanding of our business.
The form and content of the Redwood Review will likely change over time. We welcome your input and suggestions.
Selected Financial Highlights
Quarter:Year | GAAP
Earnings
per Share | Core
Earnings
per Share | Total Taxable
Earnings
per Share | Adjusted
Return on
Equity | GAAP Book
Value
per Share | Total
Dividends
per Share |
Q2:05 | $1.62 | $1.50 | $1.66 | 19% | $40.24 | $0.70 |
Q3:05 | $2.21 | $1.22 | $2.23 | 25% | $41.03 | $0.70 |
Q4:05 | $1.68 | $0.97 | $1.65 | 19% | $37.20 | $3.70 |
Q1:06 | $1.09 | $1.16 | $1.44 | 13% | $38.11 | $0.70 |
Q2:06 | $1.20 | $0.97 | $1.91 | 14% | $39.13 | $0.70 |
Q3:06 | $1.22 | $1.20 | $1.96 | 14% | $40.02 | $0.70 |
Q4:06 | $1.32 | $1.12 | $1.42 | 15% | $37.51 | $3.70 |
Q1:07 | $0.66 | $1.08 | $1.48 | 8% | $34.06 | $0.75 |
Q2:07 | $0.41 | $1.35 | $1.66 | 5% | $31.50 | $0.75 |
CAUTIONARY STATEMENT: This Redwood Review contains forward-looking statements within the safe harbor provisions of the Private Securities Litigation Reform Act of 1995. Statements that are not historical in nature, including the words “anticipated,” “estimated,” “should,” “expect,” “believe,” ”intend,” and similar expressions, are intended to identify forward-looking statements. These forward-looking statements are subject to risks and uncertainties, including, among other things, those described in our 2006 Annual Report on Form 10-K under Item 1A “Risk Factors.” Other risks, uncertainties and factors that could cause actual results to differ materially from those projected are detailed from time to time in reports filed by us with the Securities and Exchange Commission, including Forms 10-K, 10-Q, and 8-K. Important factors that may impact our actual results include changes in interest rates and fair market values; changes in prepayment rates; general economic conditions, particularly as they affect the price of earning assets and the credit status of borrowers; the level of liquidity in the capital markets as it affects our ability to finance our real estate asset portfolio; and other factors not presently identified. In light of these risks, uncertainties, and assumptions, the forward-looking events mentioned in, discussed in, or incorporated by reference into this Review might not occur. Accordingly, our actual results may differ from our current expectations, estimates and projections. We undertake no obligation to publicly update or revise any forward-looking statements, whether as a result of new information, future events, or otherwise.
| 2 | | The Redwood Review 2nd Quarter 2007 |
Dear Fellow Shareholders:
The aim of this quarter’s Redwood Review is to put your mind at ease, amid the uncertainty and volatility in the broader residential real estate sector.
In the pages that follow, you’ll find a great deal of data detailing our current financial position. But there is only one over-arching message that we want you to remember: Redwood Trust is okay.
Our vitals are strong. The vast majority of our credit-sensitive assets are performing well. They are high quality, seasoned, and have good upside potential. Our balance sheet is strong with a relatively low amount of recourse debt. We have based our business on permanent capital, which, unlike hedge funds, is not subject to redemption. We have had no liquidity issues and currently have $200 million of excess capital.
The residential real estate market, where we are a large, active, and long-term player, is inherently cyclical. Redwood benefited from some extraordinary times at the upper end of the cycle in 2003 through 2005. We are now going through the downside of the cycle. As we said last quarter, we have been expecting this, and preparing for it, for more than two years. For that reason, we believe we are in a good position to both weather the storm and profit from these cyclical developments.
Going forward, we are optimistic about potential investment opportunities in our core business, as loan quality continues to improve and investors once again demonstrate an appreciation for credit risk. Since our inception in 1994, we have been through several periods of market turbulence and have used those times to take advantage of favorable investment opportunities, helping to grow Redwood into the company it is today.
In closing, we want to reiterate that we remain committed to building a company that distributes the highest sum of dividends per share for years to come. That commitment requires us to continue to focus on successfully steering through today’s turbulence.
Your Redwood team is calm, disciplined, focused, and well prepared. We thank you for your continued support.
Sincerely,
| | |
| George E. Bull, III | | Douglas B. Hansen |
Chairman and CEO | | President |
The Redwood Review 2nd Quarter 2007 | | 3 |
Second Quarter 2007
We believe the current market turmoil will benefit our business in the long-run as competition will be less intense and assets will be less expensive to acquire. To benefit in the long-term, however, we need to get through the short-term. Let’s focus on how we intend to do that.
We gave a liquidity update in a press release dated August 1, 2007. Our liquidity position continues to be strong. As of August 7, 2007, we had $231 million of unrestricted cash. In addition, we had $189 million principal value of unsecuritized prime residential whole loans and $330 million principal value of AAA-rated prime residential securities. We believe the current fair market values for these portfolios equal 95% to 100% of their principal value. We also own other securities that are rated below AAA that are currently funded with equity and are unencumbered. These include a portion of our residential and commercial credit-enhancement securities portfolios and retained assets from our Sequoia and Acacia securitizations. Total short-term borrowings as of August 7, 2007 were $472 million. On August 3, 2007, we sold for future settlement $39.5 million of the $330 million principal value of AAA-rated securities for a price of 99.43% of principal value for proceeds of $39.3 million. This transaction will settle on August 30, 2007. We will likely use the cash from this transaction to further reduce debt and increase our ability to buy high-yield assets in the future.
We believe we have the cash resources and collateral availability to sustain us through the current market liquidity crisis. Although we believe it is unlikely, if short-term borrowings were to become completely unavailable, we may need to sell additional assets at a time when prices are low.
We expect opportunities to acquire credit-enhancement securities at attractive levels will materialize over the next year. We currently believe that acquiring these assets will be the best use for our excess capital and cash. In order to free up even more cash for this purpose, we may continue to sell additional AAA-rated securities and residential loans on a measured basis as the year progresses.
We would consider repurchasing Redwood shares if they trade at attractive levels relative to our other uses for excess capital. In general, however, we would rather use our capital to acquire new assets that have the potential to create significant upside gains for Redwood shareholders.
The credit cycle is the next issue we face. So far, our securities and loans continue to perform as well as or better than expected, with only a few exceptions (most of which we have either sold or written down). Realized losses remain low relative to our reserves and our expectations. The credit-sensitive assets we own that are seasoned are producing high yields, and we expect to continue to realize good earnings and cash flows from these assets as the risk of credit loss has been mitigated due to housing price increases over the last few years. We own a relatively large amount of alt-a securities backed by option ARM loans made to generally credit-worthy borrowers. These assets continue to perform better than our expectations. We own a relatively small amount of lower-rated subprime securities, CDO securities backed by subprime securities, and alt-a securities backed by hybrid loans. Delinquencies on these assets are rising to levels exceeding our initial expectations; the jury is still out on whether these will ultimately prove to be good investments. Our commercial real estate assets continue to perform well.
| 4 | | The Redwood Review 2nd Quarter 2007 |
Going forward, we will have to wait to see how bad this credit cycle gets. We have been more pessimistic than others on this topic, and we remain so, believing that the cycle will be more severe and will last longer than most others expect. We believe there are more “shoes to drop” and that problems in real estate markets (as well as the unwinding of other credit bubbles) are likely to spill over into the general economy. These thoughts make us both wary and hopeful, in equal parts. Wary because, although we like our assets and we expect to benefit in the end from this credit cycle, the cycle could carry on further and deeper than we expect. We are also hopeful, because the corrections resulting from this credit cycle are necessary developments to create a healthy real estate market, one that we can thrive in.
We continue to work on plans for developing our businesses, with plans for expanding asset management subsidiaries (such as Juniper), expanding our conduit activities (when appropriate) into subprime and alt-a securitizations, further developing our commercial real estate business, and expanding our use of credit derivatives. Some of these developments may be delayed by the current turmoil, but we remain committed to their long-term success. We are encouraged because the long-term prospects for these businesses seem to have improved as a result of the turbulence of the last few months due to reduced competition and increased awareness of risk.
In prior Reviews we have discussed some of the current issues surrounding the use of mark-to-market values in accounting. One issue we discussed arose again this quarter ─ we are required to mark down the value of our securities but are not allowed to mark up the value of paired liabilities. We expect continued mark-to-market earnings and book value volatility going forward, only some of which may be reflective of prospective changes in our real cash flows.
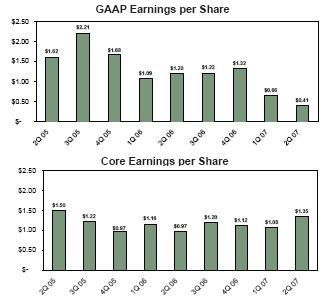
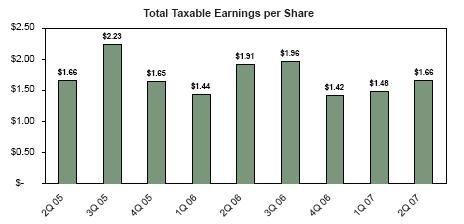
In the meantime, during the second quarter, net interest income was up and operating expenses down. GAAP earnings were $0.41 per share, reflecting asset market value declines (some of which were realized through our income statement accounts). Core earnings, as described later in this Review and which exclude market value adjustments, were $1.35 per share, our best quarter of core earnings in over two years. In addition, estimated total taxable earnings were $1.66 per share. None of these are a perfect measure of our results, and you can read in this Review about the details and caveats that go with these calculations. Putting it all together, however, the overall picture for the second quarter was a good one.
The Redwood Review 2nd Quarter 2007 | | 5 |
| GAAP Earnings and Core Earnings |
Summary
What is this?
GAAP income is income calculated under Generally Accepted Accounting Principles (GAAP) in the United States.
Core earnings is a profitability measure that highlights earnings that are more likely to be ongoing in nature. In calculating core earnings, we start with GAAP earnings and then exclude realized gains and losses on calls and sales, unrealized market value adjustments, and one-time items that are unlikely to be repeated. Table 2 in the Appendix shows a reconciliation of core earnings to GAAP earnings.
Insights
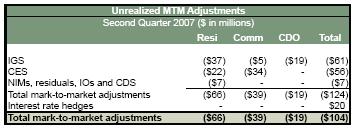
| · | GAAP earnings per share for the second quarter of $0.41 per share were lower than recent quarters primarily due to $29 million negative unrealized mark-to-market valuation adjustments. Net interest income for the second quarter was strong. |
| · | For the past year and a half, quarterly core earnings have ranged from $0.97 to $1.35 per share. Our second quarter core earnings of $1.35 per share were at the top of this range. |
| | | For the Quarter Ended | |
GAAP Earnings | | Jun-07 | | Mar-07 | | Jun-06 | |
| | | | | | | | |
| Net interest income | | $ | 53,901 | | $ | 47,009 | | $ | 44,719 | |
| | | | | | | | | | | |
| Operating expenses | | | (12,772 | ) | | (17,782 | ) | | (16,037 | ) |
| Gains on sales | | | 1,428 | | | 303 | | | 8,241 | |
| Gains on calls | | | 1,310 | | | 843 | | | 747 | |
| Valuation adjustments, net | | | (29,430 | ) | | (10,264 | ) | | (2,995 | ) |
| Provision for income taxes | | | (3,021 | ) | | (1,800 | ) | | (3,265 | ) |
| | | | | | | | | | | |
GAAP earnings | | $ | 11,416 | | $ | 18,309 | | $ | 31,410 | |
| | | | | | | | | | | |
| GAAP earnings per share | | $ | 0.41 | | $ | 0.66 | | $ | 1.20 | |
| | | For the Quarter Ended | |
Core Earnings | | Jun-07 | | Mar-07 | | Jun-06 | |
| | | | | | | | |
| Net interest income | | $ | 53,901 | | $ | 47,009 | | $ | 44,719 | |
| | | | | | | | | | | |
| Operating expenses | | | (12,772 | ) | | (15,402 | ) | | (16,037 | ) |
| Gains on sales | | | - | | | - | | | - | |
| Gains on calls | | | - | | | - | | | - | |
| Valuation adjustments, net | | | - | | | - | | | - | |
| Provision for income taxes | | | (3,021 | ) | | (1,800 | ) | | (3,265 | ) |
| | | | | | | | | | | |
Core earnings | | $ | 38,108 | | $ | 29,807 | | $ | 25,417 | |
| | | | | | | | | | | |
| Core earnings per share | | $ | 1.35 | | $ | 1.08 | | $ | 0.97 | |
| 6 | | The Redwood Review 2nd Quarter 2007 |
| GAAP Earnings and Core Earnings |
Quarterly Update
| Ø | Net interest income for the second quarter of 2007 increased by $7 million over the first quarter of 2007 and $9 million over the second quarter of 2006. Higher net interest income earnings from our CES and IGS portfolios more than offset a decrease in net interest income from a decline in balance in our residential loan portfolio. The average balance of our residential loan portfolio continued to decline due to high prepayments on adjustable-rate residential loans acquired and securitized under our Sequoia program. |
| Ø | Our residential CES portfolio continues to benefit from strong credit performance, and from rapid prepayments on those securities backed by ARM loans. The yield for the total CES portfolio was 24% in the second quarter of 2007, 22% in the first quarter of 2007, and 20% in the second quarter of 2006. |
| Ø | Operating expenses in the second quarter of 2007 were $5 million lower than the first quarter of 2007. The primary reason for this decline was lower severance charges and lower bonus accruals. In comparison to the second quarter of last year, operating expenses declined by $3 million primarily due to lower due diligence expenses as a result of lower commercial CES acquisitions activity. |
| Ø | The largest factor causing a decline in our GAAP earnings was $29 million of negative unrealized mark-to-market (MTM) valuation adjustments. These adjustments were $19 million higher than the first quarter of 2007 and $26 million higher than the second quarter of 2006. The decrease in fair value reflects the overall market decline in prices for real estate securities (particularly, securities backed by subprime and low quality alt-a loans) that occurred during the second quarter. Of the $29 million income statement MTM write-downs taken during the second quarter, $19 million were impairments as defined by GAAP. |
The Redwood Review 2nd Quarter 2007 | | 7 |
Summary
What is this?
Total taxable income is our pre-tax income as calculated for tax purposes. Total taxable income differs materially from GAAP earnings. Table 3 in the Appendix reconciles these two profitability measures.
REIT taxable income is the primary determinant of the minimum amount of dividends we must distribute in order to maintain our tax status as a real estate investment trust (REIT). REIT taxable income is pre-tax profit, as calculated for tax purposes, excluding taxable income earned at our non-REIT taxable subsidiaries. Over time, we must distribute at least 90% of our REIT taxable income as dividends. A reconciliation of GAAP income to REIT taxable income appears in Table 3 of the Appendix.
Insights
| · | Total taxable income for the second quarter of 2007 was strong at $1.66 per share, an increase from the prior quarter due to reduced tax deductions from stock option exercises and lower overall operating expenses. |
| · | REIT taxable income remained strong at $1.63 per share and continues to exceed our regular quarterly dividend by a comfortable margin. |
| 8 | | The Redwood Review 2nd Quarter 2007 |
Quarterly Update
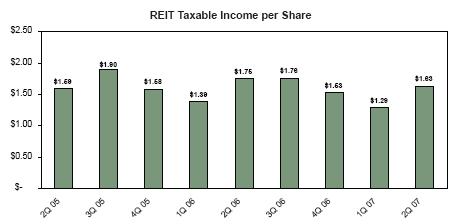
| Ø | Total taxable income was $46 million, or $1.66 per share, in the second quarter of 2007. This was an increase from the total taxable income we generated in the prior quarter of $40 million, or $1.48 per share. In the prior quarter, we had more tax deductions relating to stock option exercises and higher overall operating expenses. |
| Ø | Our REIT taxable income was $1.63 per share in the second quarter of 2007. This was higher than first quarter taxable income of $1.29 for the same reasons total taxable income was higher. |
| Ø | Our taxable income continues to be higher than our GAAP income as we are not permitted to establish credit reserves for tax. As a result, we amortize more of our CES discount into income for tax and recognize a higher yield until credit losses occur. The cumulative difference at June 30, 2007 in the discount amortization between tax and GAAP for residential, commercial, and CDO CES was $115 million. |
| Ø | Another reason for the difference between tax and GAAP income is that we do not recognize changes in market values of assets for tax until the asset is sold. Consequently, the negative $29 million of unrealized market valuation adjustments included in our GAAP earnings this quarter were not included in our tax earnings. |
| Ø | Total taxable income and REIT taxable income were reduced by $2 million ($0.08 per share) in the second quarter of 2007 as a result of deductions for actual credit losses. These deductions were less than the actual principal losses incurred on the underlying loans of $6 million, as we own most of our credit-sensitive assets at a tax basis that is substantially less than par (principal) value. We currently expect that realized credit losses will increase substantially relative to our recent experience. All realized credit losses, after adjusting for our tax basis in the assets we own, will reduce our dividend distribution requirements. |
The Redwood Review 2nd Quarter 2007 | | 9 |
Summary
What is this?
Book value per share is the amount of equity capital we have per share of common stock outstanding.
GAAP book value is our common equity as calculated for GAAP purposes. It includes mark-to-market valuation adjustments of some of our assets (principally the securities portfolio), but for none of our liabilities.
Core book value is GAAP book value excluding those mark-to-market valuation adjustments reflected on our GAAP balance sheets. Core book value more closely reflects historical amortized costs rather than current market values.
A reconciliation of GAAP book value to core book value appears in Table 7 of the Appendix.
Insights
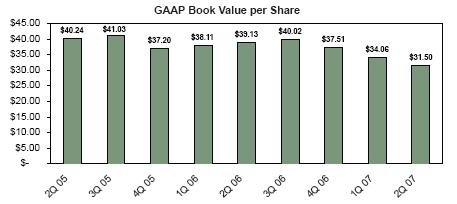
| · | GAAP book value declined by 8%, or $2.56 per share, during the second quarter of 2007 from $34.06 per share to $31.50 per share primarily as a result of declining values for assets we own that are marked-to-market for balance sheet purposes. |
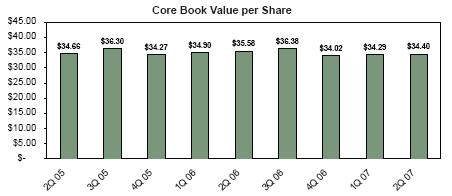
| · | Core book value rose by 0.3% during the second quarter of 2007 from $34.29 per share to $34.40 per share as a result of accretive stock issuance through our direct stock purchase and dividend reinvestment plan. |
| · | Under GAAP, we are required to carry our real estate securities on our balance sheet at their fair market value, but we are not permitted to adjust paired ABS issued liabilities to fair market value. Using the assumption described in footnote 14 of our June 30, 2007 quarterly financial statements, we estimate that if we had recorded our Acacia ABS issued at fair market value and adjusted for Acacia unamortized deferred bond issuance costs of $26 million, our book value as of June 30, 2007 would have been higher than reported by $75 million. |
| 10 | | The Redwood Review 2nd Quarter 2007 |
| Ø | The difference between core book value of $34.40 per share and GAAP book value of $31.50 per share at June 30, 2007 was cumulative mark-to-market balance sheet adjustments for GAAP of negative $81 million at quarter-end. |
| Ø | For the $3.7 billion of assets that were marked-to-market at June 30, 2007, market values declined by $124 million in the second quarter of 2007. This represents an average decline in value during the quarter of 3% of principal value. |
| Ø | Market spreads widened in the second quarter; that is, the yields the market required increased, so asset values dropped. For some assets, value declines reflected a decline in economic value due to an increase in credit loss expectations. For other assets (including most of our assets), value declines reflect an increase in potential risks rather than a change in expected cash flows. The table below summarizes the change in unrealized mark-to-market (MTM) adjustments during the second quarter. |
| Ø | At the end of our first quarter of operations in September 1994, GAAP book value was $11.67 per share. Since that time, we have paid $41.93 per share of dividends while also increasing GAAP book value by $19.83 per share. |
| Ø | Book value per share growth generally is not a direct indicator of our market value or an indicator of the returns available to our shareholders. If you had acquired Redwood stock at our initial public offering in August 1995 and had reinvested all dividends back into Redwood stock, your compounded return as a shareholder would have been 20% per year through June 30, 2007. Future results will vary. |
The Redwood Review 2nd Quarter 2007 | | 11 |
Summary
What is this?
Return on equity (ROE) is the amount of profit we generate each year per dollar of equity capital.
GAAP ROE is GAAP earnings divided by GAAP equity.
Adjusted ROE is GAAP earnings divided by core equity. Core equity excludes balance sheet mark-to-market adjustments that are not included in earnings.
Core ROE is core earnings divided by core equity.
A reconciliation of GAAP ROE to adjusted ROE and core ROE, and of GAAP equity to core equity, appears in Table 7 of the Appendix.
Insights
| · | During the second quarter of 2007, our adjusted return on equity was 5%. The return was lower in the past two quarters primarily due to the amount of unrealized market valuation adjustments included our GAAP earnings. |
| · | Core return on equity (core earnings divided by core equity) was 16% for the second quarter. |
| · | Over the long term, we expect to be able to generate annual adjusted returns on equity between 11% and 18%. |
| 12 | | The Redwood Review 2nd Quarter 2007 |
Quarterly Update
The Redwood Review 2nd Quarter 2007 | | 13 |
Summary
What is this?
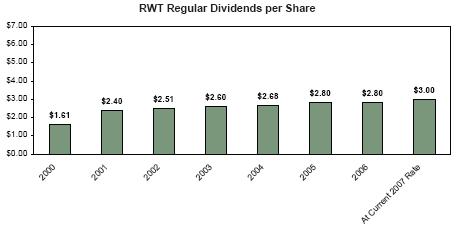
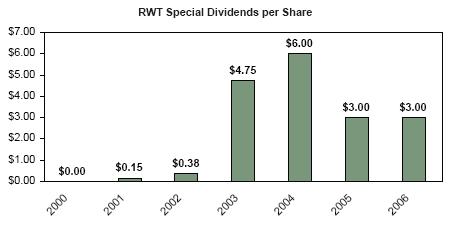
We have established a regular quarterly dividend rate at a level we believe it is likely to be sustainable unless realized credit losses rise dramatically or our business economics decline materially for some other reason. Distributions in excess of the regular dividend rate, if any, are typically paid in a fourth quarter special dividend.
Insights
| · | Our current regular dividend rate is $0.75 per share per quarter. |
| 14 | | The Redwood Review 2nd Quarter 2007 |
| Ø | Total dividend distributions over the last four quarters were $5.90 per share. Assuming the August 6, 2007 Redwood stock price of $36.04, the indicated dividend yield would be 16.4% based on the last twelve months of dividends and would be 8.3% based on the current regular dividend rate of $3.00 per share. |
| Ø | Based on our estimates of REIT taxable income through the second quarter of 2007, at quarter end, we had $80 million ($2.86 per share) undistributed REIT taxable income that we anticipate distributing in 2007 and 2008 through our regular quarterly dividend and a 2007 special dividend. |
| Ø | We generally distribute 100% of REIT capital gains income and 90% of REIT ordinary income, retaining 10% of the ordinary REIT income. We generally retain 100% of the after-tax income we generate in taxable subsidiaries. |
| Ø | As has been our recent policy, we currently intend to carry over two to three quarters worth of regular dividends into 2008. |
15 | | The Redwood Review 2nd Quarter 2007 |
| Residential Real Estate Securities |
Summary
What is this?
We invest in securities that are backed by pools of residential real estate loans. These are shown on our balance sheet in real estate securities and in other real estate investments (OREI).
Insights
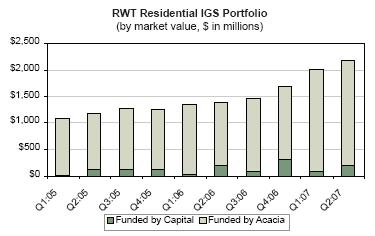
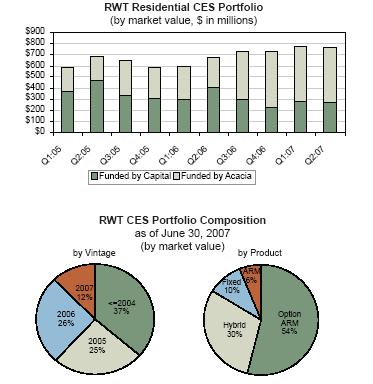
| · | Total residential securities increased by 4% in the second quarter from $2.8 billion to $2.9 billion as a result of $307 million of acquisitions, $23 million of discount amortization, $56 million of sales, $89 million of calls and principal pay downs, and $59 million of market value declines. Our primary focus during the quarter was buying IGS for our two Acacia CDO securitizations that closed in May and June. |
| · | Of the $2.9 billion residential securities we owned at June 30, 2007, $2.4 billion were financed through re-securitization via Acacia CDO transactions and $0.5 billion were financed with Redwood debt and capital. |
| · | Future residential IGS investment will largely depend on the availability and pricing of future Acacia CDO financing. If today’s turbulent environment persists, it is unlikely that we would complete another CDO transaction this year. This will require us to look to other potential sources of financing, such as Redwood debt or capital, to fund acquisitions, or else slow the pace of our IGS acquisitions. |
16 | | The Redwood Review 2nd Quarter 2007 |
| Residential Real Estate Securities |
Insights (cont.)
| · | In light of generally rising residential mortgage delinquencies and the continued slide in home prices, we are closely monitoring the collateral performance underlying our CES and IGS portfolios. During the quarter we sold $49 million of subprime collateral. We may make additional targeted sales in the third quarter. |
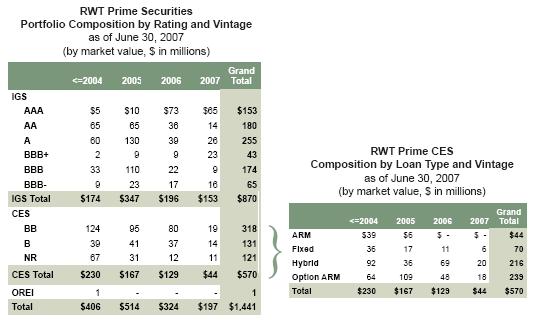
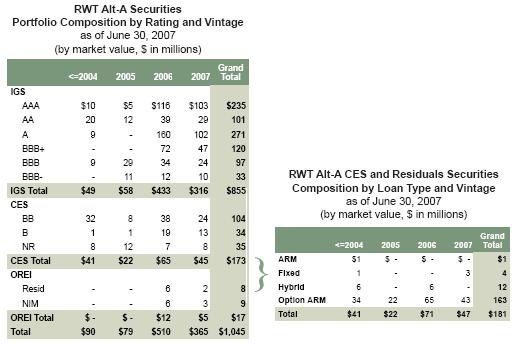
| · | Our CES portfolio backed by prime assets as well as our alt-a option ARM loans continue to perform better than, or within, our range of expectations. Prime represents 74% and alt-a option ARMS represent 22% of our residential CES portfolio by market value. At June 30, our credit reserves associated with these securities were $293 million for prime and $151 million for alt-a. |
| · | Credit performance on alt-a securities backed by hybrids is now worse than we had projected. These securities represent 1% of our total residential portfolio. During the quarter we took a mark-to-market valuation charge against these assets of $7 million. |
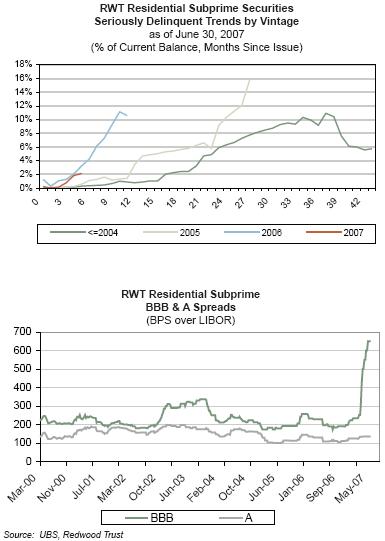
| · | Prices for residential mortgage-backed securities (RMBS) declined across the credit spectrum with the most severe drops impacting 2006 and early 2007 vintage subprime and alt-a securities. Prices continued to fall further in July and August as the market continued to weaken amid increased supply and reduced demand for RMBS. |
| · | In the RMBS market, trading volume is light since willing buyers and sellers cannot agree on price. Until a market clearing level develops, it is difficult to accurately know true RMBS market values. |
| · | Overall we believe this disruption will be good for Redwood since the likely result will be an improvement in loan credit quality and heightened appreciation for credit risk. This would create more opportunities to invest capital in our core residential credit business over the next year and the disruption may also lead to exceptional distressed buying opportunities. |
| · | We are particularly pleased that Andy Sirkis, who has successfully led our CDO group for the past 5 years, will take on the added responsibility of leading our expanding high-grade investment efforts. Recently, we changed the name of our wholly-owned qualified REIT subsidiary to Juniper Trust due to potential identity confusion with another financial company using the prior name, Cypress. Juniper currently intends to expand in high-grade spread lending product lines such as high-quality residential whole loans funded through securitization, high-grade CDOs backed by AAA and AA rated collateral, and AAA securities funded with repo borrowings. We are pleased with our team’s progress in the development of business strategies and the establishment of supporting systems for Juniper. Initially, Juniper will be funded by Redwood. In the future, we may raise additional capital to accommodate growth for this strategy by selling new shares in Juniper. Our asset management subsidiary, Redwood Asset Management, Inc., would manage Juniper as an external REIT. |
The Redwood Review 2nd Quarter 2007 | | 17 |
| Residential Real Estate Securities |
Residential Investment-Grade Securities
Quarterly Update
RWT Residential IGS Portfolio |
Activity |
| as of 06/30/07 |
| (by market value, $ in millions) |
| | Prime | Alt-A | Subprime | Total |
Market Value 3/31/07 | $789 | $766 | $471 | $2,026 |
| Acquisitions | 114 | 106 | 47 | 267 |
| Upgrades / Downgrades | 2 | - | - | 2 |
| Sales | (3) | - | (49) | (52) |
| Principal Payments | (29) | (1) | (16) | (46) |
| Discount / (Premium) Amortization | 1 | - | 1 | 2 |
| Gains on Sales/Calls | - | - | 1 | 1 |
| Net Mark-to-Market Adjustment | (4) | (16) | (17) | (37) |
Market Value 6/30/07 | $870 | $855 | $438 | $2,163 |
18 | | The Redwood Review 2nd Quarter 2007 |
| Residential Real Estate Securities |
Residential Investment-Grade Securities
Quarterly Update
| Ø | Our residential IGS portfolio increased by 7% in the second quarter from $2.0 billion to $2.2 billion. |
| Ø | Of the $37 million in market value declines, $13 million were related to interest rate increases that were largely offset by hedge gains. |
| Ø | The majority of our residential IGS acquisitions for the quarter were designated investments for two Acacia securitizations that closed in May and June. |
| Ø | During the second quarter, our residential IGS acquisitions were 43% prime, 40% alt-a, and 17% subprime. By interest rate type, these acquisitions were 33% option ARMs, 47% hybrids, and 20% fixed-rate. |
| Ø | At June 30, 2007, $2.0 billion residential IGS were financed via securitization in our Acacia CDO program and $0.2 billion were financed with Redwood debt and capital. |
| Ø | At June 30, 2007, the interest rate characteristics of our residential IGS portfolio were 46% adjustable-rate, 35% hybrid, and 19% fixed-rate. We use interest rate agreements to generally match the interest rate characteristics of these assets to their corresponding funding sources. |
| Ø | Interest income generated by residential IGS was $36 million for the second quarter. The yield for the second quarter was 6.80%, an increase from 6.56% the previous quarter. |
| Ø | Net discount amortization income (which is included in interest income) for the second quarter was $2 million. At quarter-end, our net discount balance for these assets was $32 million, giving us an average amortized balance sheet cost basis for residential IGS of 98.59% of principal value. |
| Ø | In the second quarter, our residential prime IGS portfolio grew by $81 million (or 10%) to $870 million. Our residential alt-a IGS portfolio grew by $90 million (or 12%) to $856 million. |
| Ø | Our subprime IGS portfolio declined by $33 million (or 7%) to $438 million. Sales of $49 million subprime IGS in the second quarter exceeded new acquisitions of $47 million. Although $36 million of these sales were due to increased credit risk of underperforming securities, $13 million were not credit related. The sales of these securities generated a GAAP income statement net gain of $2 million in the second quarter. |
| Ø | Additional information on our residential IGS can be found in Tables 9, 10, and 18 of the Appendix. |
The Redwood Review 2nd Quarter 2007 | | 19 |
| Residential Real Estate Securities |
Residential Credit-Enhancement Securities
Quarterly Update
RWT Residential CES Portfolio |
Activity |
| as of 06/30/07 |
| (by market value, $ in millions) |
| | Prime | Alt-A | Subprime | Total |
Market Value 3/31/07 | $571 | $172 | $9 | $752 |
| Acquisitions | 25 | 15 | - | 40 |
| Upgrades / Downgrades | - | - | - | - |
| Sales | (1) | (2) | - | (3) |
| Principal Payments | (35) | (7) | (1) | (43) |
| Discount / (Premium) Amortization | 17 | 4 | - | 21 |
| Net Mark-to-Market Adjustment | (8) | (10) | (5) | (23) |
Market Value 6/30/07 | $570 | $173 | $3 | $745 |
20 | | The Redwood Review 2nd Quarter 2007 |
| Residential Real Estate Securities |
Residential Credit-Enhancement Securities
Quarterly Update
| Ø | Our residential CES portfolio decreased by 1% from $752 million to $745 million during the quarter. |
| Ø | At June 30, 2007, $259 million residential CES were financed with equity and $486 million were financed through our Acacia CDO program. |
| Ø | The balance of residential loans underlying our residential CES decreased by 7% from $237 billion to $220 billion during the second quarter. |
| Ø | The loans underlying our residential CES acquisitions made during the quarter were 62% prime and 38% alt-a by market value. Option ARM CES represented 72% of our second quarter acquisitions while hybrids and fixed represented 13% and 15%, respectively, by market value. |
| Ø | Interest income generated by residential CES was $41 million for the second quarter. The yield for the second quarter was 24%. Yields for the second quarter were 24% for prime CES, 22% for alt-a CES, and 16% for subprime CES. Interest income was $31 million, $10 million, and $0.3 million for these sub-portfolios, respectively. CES yields remain high due to fast prepayment speeds and continued good credit performance for underlying loans. |
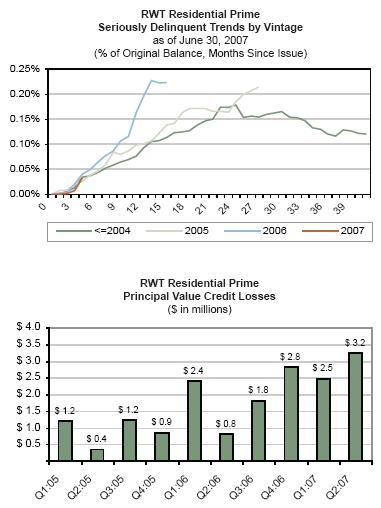
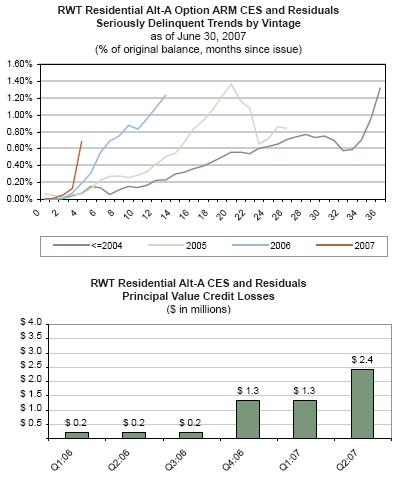
| Ø | Principal value credit losses for loans underlying CES were $6 million for the quarter, an increase from $4 million in the previous quarter. As assets season, we expect losses to increase substantially in percentage terms. Cumulative losses and the current loss rate remain lower than our original pricing expectations. |
| Ø | For tax purposes, realized credit losses were $2 million ($0.08 per share) for residential CES for the second quarter. This deduction is less than the principal value losses incurred on the underlying loans of $6 million, as we own most of our credit-sensitive assets at a tax basis that is substantially less than par (principal) value. |
| Ø | Our GAAP credit reserves for residential CES were $453 million ($16.29 per share) at June 30, 2007, an increase of $60 million for the quarter. New acquisitions increased this reserve by $46 million while the reallocation of $22 million of unamortized purchase discount to reserve as some loss expectations increased for some assets less $6 million of actual losses accounted for the remaining change. |
| Ø | Our total residential prime CES portfolio decreased by $1 million (0.2%) to $570 million during the second quarter. Overall, our prime CES portfolio is performing well from a credit perspective and continues to benefit from fast prepayments. |
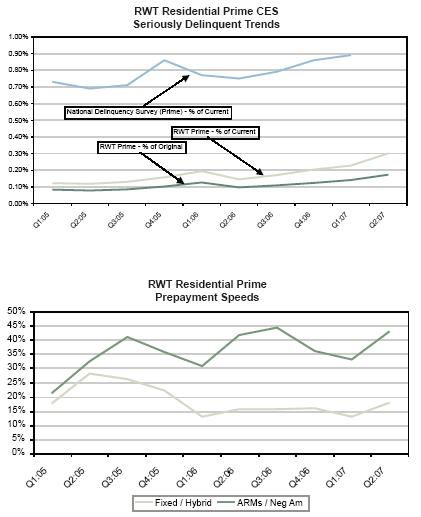
| Ø | The balance of seriously delinquent loans underlying prime residential CES increased from $485 million to $589 million during the quarter, an increase from 0.14% to 0.17%, respectively, of original balances and 0.23% to 0.30% of current balances, respectively. These increases remain in line with normal seasoning and remain below our initial modeling expectations. |
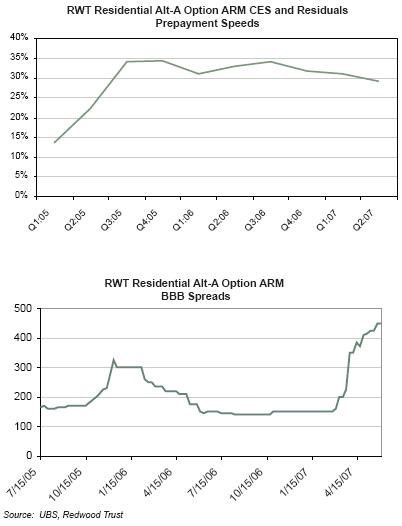
| Ø | Securities backed by option ARM and traditional ARM loans continued to prepay significantly faster than our original expectations at a weighted average CPR of 43%. These securities represent 50% of our prime CES and they are priced and structured to benefit from fast prepayment speeds in addition to low losses. |
| Ø | The principal value of credit losses for loans underlying our prime CES was $3 million, which is an annualized rate of loss of less than one basis point per year. |
The Redwood Review 2nd Quarter 2007 | | 21 |
| Residential Real Estate Securities |
Residential Credit-Enhancement Securities
Quarterly Update (cont.)
| Ø | Fifty percent of our prime portfolio is composed of securities backed by hybrid and fixed-rate mortgages by market value. The loans underlying these securities prepaid at a weighted average CPR of 18% in the second quarter. |
| Ø | Our residential alt-a CES portfolio held flat at $172 million during the second quarter. Option ARM collateral makes up 95% of this portfolio by market value. |
| Ø | We acquire alt-a securities backed by option ARMs with loss expectations that are significantly greater than we expect for our prime hybrid CES. To date, the performance of our CES backed by option ARMs continues to exceed our expectations. |
| Ø | The balance of seriously delinquent loans underlying alt-a residential CES increased from $296 million to $399 million during the quarter, an increase from 0.82% to 1.04% of original balances, respectively, and 1.51% to 1.95% of current balances, respectively. |
| Ø | Our subprime CES portfolio decreased 69% from $9 million to $3 million for the quarter as a result of $5 million in market value declines and $1 million in principal repayments. Our subprime CES portfolio has limited seasoning; however, the early credit performance is disappointing. |
| Ø | We continue to explore opportunities to invest in subprime residuals through joint venture partnerships or whole loan securitizations. We believe that once the market rationalization is complete the subprime business will be viable for the long term and presents an excellent opportunity to expand the Redwood franchise. |
| Ø | For the foreseeable future we expect subprime originations to continue to decline in volume, however the nature of subprime residuals will provide sufficient opportunities for investment given the required size of CES created in each deal. |
| Ø | Additional information on our residential CES can be found in Tables 9, 10, 11, and 12 of the Appendix. |
22 | | The Redwood Review 2nd Quarter 2007 |
| Residential Real Estate Securities |
Other Real Estate Investments
Quarterly Update
| Ø | Other real estate investments (OREI) are assets that we mark-to-market for income statement purposes, because they may otherwise be deemed to contain embedded derivatives for accounting purposes under FAS 155. We expect to acquire additional OREI assets. Mark-to-market fluctuations affect GAAP income. |
| Ø | OREI is a new reporting category we established in the first quarter of 2007. Total OREI at June 30, 2007 was $34 million. This included $22 million net interest margin securities (NIMs), $10 million residuals, and $2 million IOs. |
| Ø | Residuals are first-loss securities that are not rated by a rating agency. The value of residual securities can vary widely and is highly dependent on prepayment speeds. The value is also dependent on the level and timing of credit losses, and often is not as sensitive to losses as it is to prepayment speeds. These securities perform poorly when prepayments are fast and losses are higher than expected. |
| Ø | By market value, our OREI was 4% prime, 50% alt-a, and 46% subprime at June 30, 2007. |
| Ø | Mark-to-market charges in our OREI portfolio were negative $6 million for the quarter and were included in our income statement. Valuations decline were a result of credit performance below our expectations, and a general spread widening in the mortgage market. Although the reported yield has averaged 15% after the first two quarters, our total reported return equals the cash income and any change in market value, and will continue to be volatile. |
| Ø | Our NIMs are structured in such a way that they mature quickly (typically less than two years). The majority of the NIMs we have acquired have an investment-grade rating. |
| Ø | OREI at June 30, 2007 consisted of $9 million of investment-grade NIMs with an average life of 0.6 years. |
The Redwood Review 2nd Quarter 2007 | | 23 |
| Residential Real Estate Securities |
Prime Securities Portfolio
What is this?
Prime securities are mortgage-backed securities backed by high-credit quality residential loans. The borrowers typically have high FICO credit scores. The loans have relatively low loan-to-value (LTV) ratios.
24 | | The Redwood Review 2nd Quarter 2007 |
| Residential Real Estate Securities |
Prime Securities Portfolio
The Redwood Review 2nd Quarter 2007 | | 25 |
| Residential Real Estate Securities |
Prime Securities Portfolio
26 | | The Redwood Review 2nd Quarter 2007 |
| Residential Real Estate Securities |
Prime Securities Portfolio RWT Residential Prime Securities |
Activity |
| as of June 30, 2007 |
| (by market value, $ in millions) |
| | IGS | CES | OREI | Total |
Market Value 3/31/07 | $789 | $571 | $2 | $1,362 |
| Acquisitions | 114 | 25 | - | 139 |
| Upgrades / Downgrades | 2 | (2) | - | - |
| Sales | (3) | (1) | - | (4) |
| Principal Payments | (29) | (35) | - | (63) |
| Discount / (Premium) Amortization | 1 | 17 | - | 18 |
| Net Mark-to-Market Adjustment | (4) | (7) | - | (11) |
Market Value 6/30/07 | $870 | $570 | $2 | $1,442 |
RWT Residential Prime Securities |
Underlying Loan Characteristics |
| as of June 30, 2007 |
| | | | | |
| Number of loans | 554,494 | | Wtd Avg FICO | 737 |
| Total loan face ($ in millions) | 195,757 | | FICO: <= 620 | 2% |
| Average loan size ($ in 1000's) | 353 | | FICO: 621 - 660 | 4% |
| | | | FICO: 661 - 700 | 16% |
| Southern CA | 24% | | FICO: 701 - 740 | 26% |
| Northern CA | 21% | | FICO: > 740 | 51% |
| Florida | 6% | | Unknown | 1% |
| New York | 5% | | | |
| Georgia | 2% | | Conforming at origination % | 31% |
| New Jersey | 3% | | > $1 MM % | 9% |
| Other states | 39% | | | |
| | | | 2nd home % | 7% |
| 2007 origination | 4% | | Investment home % | 3% |
| 2006 origination | 20% | | | |
| 2005 origination | 27% | | Purchase | 41% |
| 2004 origination and earlier | 49% | | Cash out refi | 27% |
| | | | Rate-term refi | 30% |
| Wtd Avg Original LTV | 68% | | | |
| Original LTV: 0 - 50 | 13% | | Full doc | 45% |
| Original LTV: 50 - 60 | 12% | | No doc | 6% |
| Original LTV: 60. - 70 | 22% | | Other (limited, etc) | 49% |
| Original LTV: 70 - 80 | 51% | | | |
| Original LTV: 80 - 90 | 2% | | | |
| Original LTV: 90 - 100 | 1% | | 2-4 family | 2% |
| | | | Condo | 9% |
| | | | Single family | 89% |
The Redwood Review 2nd Quarter 2007 | | 27 |
| Residential Real Estate Securities |
Alt-A Securities Portfolio
What is this?
Alt-A securities are residential mortgage-backed securities backed by loans that generally have higher credit quality characteristics than subprime, but lower credit quality characteristics than prime.
28 | | The Redwood Review 2nd Quarter 2007 |
| Residential Real Estate Securities |
Alt-A Securities Portfolio
The Redwood Review 2nd Quarter 2007 | | 29 |
| Residential Real Estate Securities |
Alt-A Securities Portfolio
| 30 | | The Redwood Review 2nd Quarter 2007 |
| Residential Real Estate Securities |
Alt-A Securities Portfolio
RWT Residential Alt-A Securities |
Activity |
| as of June 30, 2007 |
| (by market value, $ in millions) |
| | IGS | CES | OREI | Total |
Market Value 3/31/07 | $766 | $172 | $28 | $966 |
| Acquisitions | 106 | 15 | - | 121 |
| Sales | - | (2) | (2) | (4) |
| Principal payments | (1) | (7) | (1) | (9) |
| Discount / (premium) amortization | - | 4 | (3) | 1 |
| Net mark-to-market adjustment | (16) | (10) | (6) | (32) |
Market Value 6/30/07 | $856 | $173 | $16 | $1,045 |
RWT Residential Alt-A Securities |
Underlying Loan Characteristics |
|
| | | | | |
| Number of loans | 59,767 | | Wtd avg FICO | 707 |
| Total loan face ($ in millions) | 20,523 | | FICO: <= 620 | 2% |
| Average loan size ($ in 1000's) | $343 | | FICO: 621 - 660 | 14% |
| | | | FICO: 661 - 700 | 29% |
| Southern CA | 31% | | FICO: 701 - 740 | 24% |
| Northern CA | 21% | | FICO: > 740 | 23% |
| Florida | 10% | | Unknown | 8% |
| New York | 2% | | | |
| Georgia | 1% | | Conforming at origination % | 47% |
| New Jersey | 3% | | > $1 MM % | 12% |
| Other states | 32% | | | |
| | | | 2nd home % | 6% |
| 2007 origination | 14% | | Investment home % | 11% |
| 2006 origination | 23% | | | |
| 2005 origination | 33% | | Purchase | 34% |
| 2004 origination and earlier | 30% | | Cash out refi | 43% |
| | | | Rate-term refi | 22% |
| Wtd avg original LTV | 75% | | | |
| Original LTV: 0 - 50 | 4% | | Full doc | 17% |
| Original LTV: 50 - 60 | 6% | | No doc | 1% |
| Original LTV: 60 - 70 | 16% | | Other (limited, etc) | 74% |
| Original LTV: 70 - 80 | 61% | | Unknown/not categorized | 8% |
| Original LTV: 80 - 90 | 9% | | | |
| Original LTV: 90 - 100 | 3% | | 2-4 family | 4% |
| | | | Condo | 11% |
| | | | Single family | 85% |
The Redwood Review 2nd Quarter 2007 | | 31 |
| Residential Real Estate Securities |
Subprime Securities Portfolio
What is this?
Subprime securities are residential mortgage-backed securities backed by lower-quality loans. Many subprime borrowers have impaired credit histories.
RWT Subprime Securities |
Portfolio Composition by Rating and Vintage |
| as of June 30, 2007 |
| (by market value, $ in millions) |
| | <=2004 | 2005 | 2006 | 2007 | Grand Total |
IGS | | | | | |
AAA | $ - | $5 | $9 | $ - | $14 |
AA | 43 | 57 | 25 | 29 | 154 |
A | 95 | 27 | 13 | 15 | 149 |
BBB+ | 36 | - | 39 | 9 | 85 |
BBB | - | - | 8 | 6 | 15 |
BBB- | - | - | 10 | 10 | 20 |
IGS Total | $174 | $88 | $106 | $70 | $438 |
CES | | | | | |
BB | - | - | 1 | 2 | 3 |
CES Total | $ - | $ - | $1 | $2 | $3 |
OREI | | | | | |
Resid | - | - | 2 | - | 2 |
NIM | - | - | - | 13 | 13 |
OREI Total | $ - | $ - | $2 | $13 | $15 |
Total | $174 | $88 | $109 | $85 | $456 |
32 | | The Redwood Review 2nd Quarter 2007 |
| Residential Real Estate Securities |
Subprime Securities Portfolio
The Redwood Review 2nd Quarter 2007 | | 33 |
| Residential Real Estate Securities |
Subprime Securities Portfolio
RWT Residential Subprime Securities
July 2007 Rating Agency Activity
| 7/10 | 7/13 | 7/19 | |
| | 1st Lien | 1st Lien | 2nd Lien | |
| | Moodys | S&P | S&P | Total |
Total Activity | | | | |
Negative Watch | 32 | 26 | 0 | 58 |
Downgraded | 399 | 498 | 418 | 1315 |
Redwood Exposure | | | | |
Negative Watch | 1 | 0 | 0 | 1 |
Downgrade | 2 | 2 | 2 | 6* |
| |
* The same two bonds were downgraded by Moodys and by S&P (7/13). Redwood had a total of four bonds downgraded and one placed on negative watch |
34 | | The Redwood Review 2nd Quarter 2007 |
| Residential Real Estate Securities |
Subprime Securities Portfolio
RWT Residential Subprime Securities |
Activity |
| as of June 30, 2007 |
| (by market value, $ in millions) |
| | IGS | CES | OREI | Total |
Market Value 3/31/07 | $471 | $9 | $20 | $500 |
| Acquisitions | 47 | - | - | 47 |
| Sales | (49) | - | - | (49) |
| Principal payments | (16) | (1) | (4) | (21) |
| Discount / (premium) amortization | 1 | - | 1 | 2 |
| Net mark-to-market adjustment | (17) | (5) | - | (22) |
Market Value 6/30/07 | $438 | $3 | $17 | $457 |
RWT Residential CES Subprime Securities |
Underlying Loan Characteristics |
|
| | | | | |
| Number of loans | 23,662 | | Wtd avg FICO | 640 |
| Total loan face ($ in millions) | 3,436 | | FICO: <= 620 | 36% |
| Average loan size ($ in 1000's) | 145 | | FICO: 621 - 660 | 29% |
| | | | FICO: 661 - 700 | 19% |
| Southern CA | 19% | | FICO: 701 - 740 | 10% |
| Northern CA | 14% | | FICO: > 740 | 6% |
| Florida | 12% | | Unknown | 0% |
| New York | 4% | | | |
| Georgia | 1% | | Conforming at origination % | 77% |
| New Jersey | 3% | | > $1 MM % | 0% |
| Other states | 47% | | | |
| | | | 2nd Home % | 2% |
| 2007 origination | 1% | | Investment Home % | 9% |
| 2006 origination | 98% | | | |
| 2005 origination | 0% | | Purchase | 52% |
| 2004 origination and earlier | 0% | | Cash out refi | 44% |
| | | | Rate-term refi | 4% |
| Wtd avg original LTV | 69% | | | |
| Original LTV: 0 - 50 | 20% | | Full doc | 50% |
| Original LTV: 50 - 60 | 3% | | No doc | 1% |
| Original LTV: 60 - 70 | 6% | | Other (limited, etc) | 49% |
| Original LTV: 70 - 80 | 44% | | Unknown/not categorized | 0% |
| Original LTV: 80 - 90 | 22% | | | |
| Original LTV: 90 - 100 | 6% | | 2-4 family | 8% |
| | | | Condo | 7% |
| | | | Single family | 85% |
The Redwood Review 2nd Quarter 2007 | | 35 |
| Residential Real Estate Loans |
Summary
What is this?
We invest in residential real estate loans that we acquire from mortgage origination companies. Most of the loans we acquire are prime-quality loans. We do not originate or service residential real estate loans. We fund our loan investments via securitization and with Redwood debt and capital.
Insights
| · | Recently, our primary focus has been prime hybrids, as prime ARMs are out of favor among borrowers in the current yield environment. We purchased $675 million residential loans this quarter. All our loans were prime-quality loans at origination. |
| · | Seriously delinquent loans and credit losses on residential loans are increasing due to normal seasoning, but remain well below our initial expectations. |
| · | Prepayment speeds on our loan portfolio, consisting mostly of ARM loans, continued to be fast, prepaying at a CPR of nearly 37% for the second quarter. |
| · | We completed one securitization during the second quarter, financing $407 million prime hybrid mortgages and $654 million prime ARM mortgages and priced another Sequoia securitization that closed in July. We called one older Sequoia securitization during the second quarter. Although we completed this latest Sequoia transaction on overall favorable economic terms, in general the cost of financing loans through securitization has risen as market spreads for ABS have widened. |
| 36 | | The Redwood Review 2nd Quarter 2007 |
| Residential Real Estate Loans |
Quarterly Update
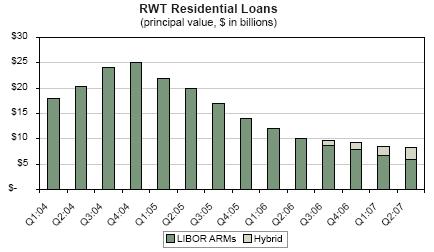
| Ø | In the second quarter, our residential loan portfolio declined from $8.7 billion to $8.4 billion. We acquired $675 million loans and sold $2 million seriously delinquent loans. Principal pay downs were $1.0 billion. The average CPR was 37% for the second quarter versus 44% for all of 2006. Most of these loans are ARM loans that tend to prepay rapidly when the yield curve is flat or inverted. |
| Ø | Interest income on our residential loans was $119 million in the second quarter, a decrease from $129 million in the previous quarter. This portfolio yielded 5.79%. The yield in the previous quarter was 5.93%. The primary reason for the decrease in yields was an increase in the provision for credit losses. |
| Ø | Premium amortization expenses, a component of interest income, were $11 million for the second quarter. We ended the second quarter with $8.3 billion principal value of loans and a loan premium balance of $99 million for an average basis of 101.19% of principal value. For accounting reasons, for several years we have not been able to amortize premium expense balances as quickly as the loans prepaid. If short-term interest rates decline, under these accounting rules we would expect premium amortization expenses to increase significantly. Largely because premium amortization expenses have not kept pace with prepayments in the past, we estimate the book value of residential loans exceeded their market value by $82 million at quarter-end. |
| Ø | Net charge-offs were $6 million for the second quarter. We reclassified $13 million of seriously delinquent loans from held-for-investment to held-for-sale. This increased our net charge-offs by $4 million and reduced our credit reserve by $4 million. Adjusting for this reclassification, net charge-offs would have otherwise been $2 million, an annual loss rate of ten basis points (0.10%) of the current loan balances. |
| Ø | Cumulative losses have been far lower than our original expectations. We expect losses to continue to increase as loans season. Credit reserves for this portfolio were $16.4 million (or 0.20%) of current loan balances at quarter-end. In July, we had a recovery of $0.6 million of a previously realized loss on a loan we were able to put back to the originator. This event will be reflected in our Q3 financial statements. |
| Ø | The balance of seriously delinquent loans decreased from $69 million to $56 million during the quarter, a decrease from 0.22% to 0.20% of original balances, and a decrease from 0.80% to 0.67% of current balances. |
| Ø | At the end of the second quarter, $7.5 billion of residential loans were financed via Sequoia securitizations and $878 million were financed with Redwood debt and equity. As a result of the July Sequoia transaction, unsecuritized whole loans at the end of July were $195 million. |
| Ø | Additional information on our residential loans can be found in Tables 9, 10, 11, and 14 of the Appendix. |
The Redwood Review 2nd Quarter 2007 | | 37 |
| Residential Real Estate Loans |
Residential Loans
Quarterly Update
| 38 | | The Redwood Review 2nd Quarter 2007 |
| Residential Real Estate Loans |
RWT Residential Loan Portfolio |
Activity |
| as of June 30, 2007 |
| (by market value, $ in millions) |
| | | Q207 | Q107 | Q206 |
Carrying Value Beginning | | $8,680 | $9,324 | $11,990 |
| Acquisitions | | 675 | 415 | 273 |
| Sales | | (2) | - | - |
| Principal Payments | | (989) | (1,047) | (1,800) |
| Discount / (Premium) Amortization | | (11) | (12) | (12) |
| Credit provision | | (3) | (2) | 3 |
| Net charge-offs/(recoveries) | | 2 | 2 | - |
Carrying Value Ending | | $8,352 | $8,680 | $10,454 |
RWT Residential Portfolio |
Loan Characteristics |
|
| | | | | |
| Number of loans | 24,452 | | Wtd Avg FICO | 732 |
| Total loan face ($ in millions) | 8,256 | | FICO: <= 620 | 2% |
| Average loan size ($ in 1000's) | 338 | | FICO: 621 - 660 | 5% |
| | | | FICO: 661 - 700 | 19% |
| Southern CA | 14% | | FICO: 701 - 740 | 27% |
| Northern CA | 11% | | FICO: > 740 | 47% |
| Florida | 12% | | | |
| New York | 6% | | Conforming at origination % | 35% |
| Georgia | 4% | | > $1 MM % | 15% |
| New Jersey | 4% | | | |
| Other states | 48% | | 2nd home % | 11% |
| | | | Investment home % | 3% |
| 2007 origination | 11% | | | |
| 2006 origination | 18% | | Purchase | 35% |
| 2005 origination | 5% | | Cash out refi | 31% |
| 2004 origination and earlier | 66% | | Rate-term refi | 32% |
| | | | Other | 2% |
| Wtd avg original LTV | 68% | | | |
| Original LTV: 0 - 50 | 15% | | Hybrid | 28% |
| Original LTV: 50 - 60 | 11% | | Adjustable | 71% |
| Original LTV: 60 - 70 | 19% | | Interest Only | 95% |
| Original LTV: 70 - 80 | 47% | | Fully-Amortizing | 5% |
| Original LTV: 80 - 90 | 2% | | | |
| Original LTV: 90 - 100 | 5% | | | |
The Redwood Review 2nd Quarter 2007 | | 39 |
Page Intentionally Left Blank
| 40 | | The Redwood Review 2nd Quarter 2007 |
| Commercial Real Estate Securities |
Summary
What is this?
We invest in securities that are backed by pools of commercial real estate loans. These are represented on our balance sheet as part of real estate securities.
Insights
| · | Total commercial securities increased by 2% in the second quarter, from $552 million to $562 million, as a result of $49 million acquisitions and $39 million negative market value changes. Increases in interest rates accounted for $12 million of these negative adjustments, which were largely offset by our use of interest rate derivatives. Less than $1 million of the total market value decline was due to credit deterioration on CES, which we expensed as impairments through our GAAP income statement. |
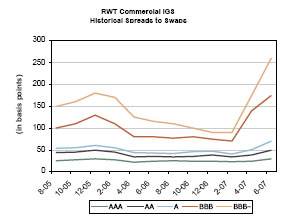
| · | Turmoil in the CDO markets, as well as uncertainty surrounding credit rating agency methodology changes, has caused spreads for commercial securities to widen and asset prices to decline. Investor sentiment in the commercial capital markets has been clearly affected by defaults and credit rating downgrades in the residential subprime mortgage sector. |
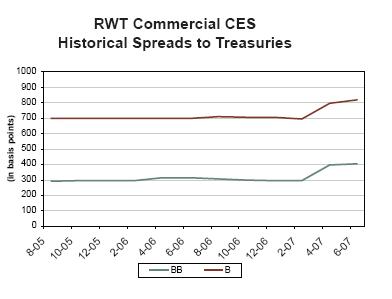
| · | Commercial real estate fundamentals remain strong, with historically low delinquencies across all major property types. Total serious delinquencies in our commercial CES portfolio were $73 million, or 0.10% of the $70 billion in loans that we credit-enhance. |
| · | We have slowed the pace of our commercial CES acquisitions. We feel that underwriting standards for late 2006 and 2007 vintage commercial loans became overly aggressive, and that yields on recent issue CES are not commensurate with this risk. Though spread widening and forthcoming increases in subordination levels may make future commercial CES attractive, we do not anticipate deploying capital in this sector for the remainder of the year. |
| · | We continue to analyze new investments, especially commercial IGS and seasoned CES. Our focus will remain on underwriting quality and attractive pricing levels. We anticipate using CRE CDO financing to efficiently match-fund our investments once the CDO market stabilizes. |
| · | Our near-term objectives are to enhance our surveillance capabilities and to build an asset management business. Our long-term strategy is to establish a vertically integrated commercial real estate platform, enabling us to invest across a broader range of commercial product types. Though this will take time, we believe it will establish Redwood’s position as a strong long-term competitor in the commercial real estate markets. |
The Redwood Review 2nd Quarter 2007 | | 41 |
| Commercial Real Estate Securities |
Commercial Investment-Grade Securities
Quarterly Update
| 42 | | The Redwood Review 2nd Quarter 2007 |
| Commercial Real Estate Securities |
Commercial Investment-Grade Securities
Quarterly Update
| Ø | Our commercial IGS declined by $5 million (or 4%) to $111 million in the second quarter. This decrease was due to negative market value changes. There were no purchases or sales during the quarter. |
| Ø | Interest income generated by commercial IGS was $2 million for the second quarter. The yield for the quarter was 6.18%, an increase from 6.14% in the previous quarter. |
| Ø | The market value decline of $5 million in commercial IGS was largely the result of credit spread widening in BBB-rated securities, reflecting increased supply of CMBS amidst credit concerns across all mortgage ABS sectors. |
| Ø | We are exploring opportunities to take on synthetic exposure with derivatives that reference commercial IGS collateral. Through synthetic technology, we can seek out exposure to seasoned vintages that are not otherwise available. |
| Ø | We have never incurred a principal loss on any commercial IGS. We do not maintain GAAP credit reserves against our commercial IGS, since we expect external credit-enhancement (primarily structural credit subordination) to protect our investments from principal losses. |
| Ø | The interest rate characteristics of commercial IGS were 80% fixed-rate and 20% adjustable-rate. We use interest rate agreements to reduce interest rate mismatches that may occur between assets and their associated liabilities. Interest rate agreements offset $1 million, or 25%, of the market value declines on commercial IGS during the quarter. |
| Ø | At June 30, 2007, 95% of our commercial IGS were financed via our Acacia CDO program. |
| Ø | Additional information on this portfolio can be found in Tables 9, 10, and 18 of the Appendix. |
The Redwood Review 2nd Quarter 2007 | | 43 |
| Commercial Real Estate Securities |
Commercial Credit-Enhancement Securities
Quarterly Update
| 44 | | The Redwood Review 2nd Quarter 2007 |
| Commercial Real Estate Securities |
Commercial Credit-Enhancement Securities
Quarterly Update
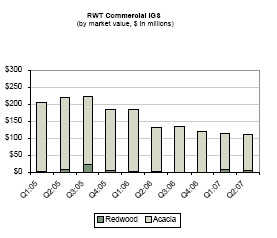
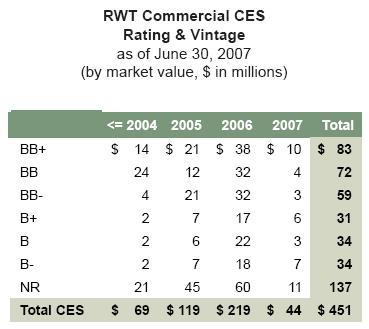
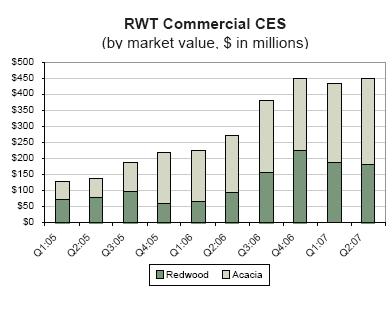
| Ø | Our commercial CES increased by $15 million (or 4%) in the second quarter to $451 million. Acquisitions were $49 million and market value declines were $34 million. There were no sales during the quarter. |
| Ø | The market value of our commercial CES declined by $34 million during the second quarter. Approximately $12 million of this decline was due to increases in interest rates, which was largely offset through our use of interest rate swaps. The remaining $22 million decline was due to widening credit spreads amidst declining market liquidity. |
| Ø | Of the $34 million in total market value decline, $33 million was unrealized and recorded on our balance sheet, as the underlying credit performance of these securities remains strong. The remaining $1 million was recorded as an impairment to our income statement during the second quarter. |
| Ø | Interest income generated by commercial CES was $11 million for the second quarter. The yield for the quarter was 9.75%, an increase from 9.52% in the previous quarter. The level of current yield we recognize on these assets is largely a function of the amount and timing of our future credit loss assumptions. All of our commercial CES pay fixed rate of interest. |
| Ø | Seriously delinquent loans underlying commercial CES were $73 million, a decrease of $5 million from the previous quarter. Of the $73 million in serious delinquencies, $57 million are contained within one security that we deemed impaired during a prior period. We currently have a zero cost basis in this security, with no risk of future write-downs affecting our GAAP income statement. |
| Ø | There were $0.1 million in realized credit losses during the quarter. Credit losses on this portfolio to date total less than one basis point (0.01%). |
| Ø | Our GAAP credit reserves for commercial CES were $311 million ($11.17 per share) at June 30, 2007, or 0.44% of underlying loan balances. Total credit reserves increased by $26 million upon acquisition of new commercial CES during the second quarter, offset by reserve releases on seasoned CES totaling $10 million. |
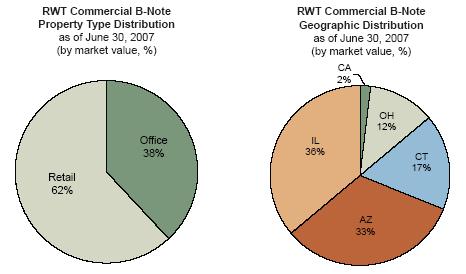
| Ø | Most of our commercial CES ($314 million or 70%) are in a second-loss or more senior position, and thus are protected from initial credit losses within the underlying loan pool. For the remaining $137 million of securities that are in a direct first-loss position, 42% share losses with other CES investors. |
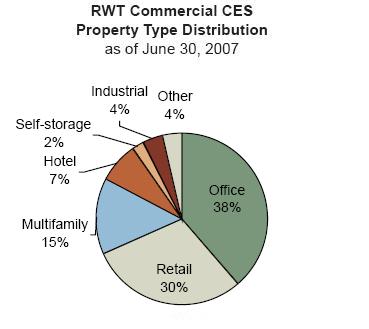
| Ø | The geographical distribution of our underlying loans is very diverse. The top five concentrations are in California (16%), New York (13%), Texas (8%), Florida (6%), and Virginia (4%). |
| Ø | At June 30, 2007, $180 million (or 40%) commercial CES were funded with Redwood capital and $271 million (or 60%) were financed through our Acacia CDO program. We continue to seek financing facilities for our unsecuritized commercial CES that would allow us to recycle some of the Redwood capital currently employed by these assets. |
| Ø | Additional information on commercial CES can be found in Tables 9, 10, 15, 16, and 18 of the Appendix. |
The Redwood Review 2nd Quarter 2007 | | 45 |
| Commercial Real Estate Loans |
Summary
What is this?
We invest in commercial real estate loans. These are represented on our balance sheet as part of real estate loans.
Insights
| · | Our commercial loan portfolio was unchanged during the second quarter, at $26 million. No new delinquencies occurred during the quarter. All of the $26 million of loans are structured as b-note loans. |
| · | Of our $26 million b-note investments, 99% are financed through Acacia CDO securitizations. |
| · | Additional information on our commercial loans can be found in Tables 9, 10, 15, and 17 of the Appendix. |
| 46 | | The Redwood Review 2nd Quarter 2007 |
What is this?
We invest in securities issued from collateralized debt obligation (CDO) securities sponsored by third parties. Typically, the collateral pool underlying these securities consists of a mixture of residential and commercial investment-grade and near IGS.
Insights
| · | The CDO markets experienced dramatic volatility by the end of the second quarter and into the third quarter. This volatility was driven by severe problems with portfolio liquidations by over-leveraged CDO investors, further erosion in the subprime market, and unprecedented rating downgrades by the rating agencies. |
| · | Liquidity is extremely poor, actual trading activity is minimal, and prices for CDO securities have plummeted. |
| · | New issuance activity is minimal with few new CDOs coming to market. New CDOs backed by commercial assets are seeing better demand and better execution than residential backed CDOs. |
| · | The CDO securities experiencing the most dramatic price declines and related rating downgrades are those backed by collateral pools containing high concentrations of 2006 and 2007 vintage subprime securities rated BBB and BBB-. CDO securities backed by CMBS and earlier vintage (2005 and prior) RMBS do not, at this time, appear to have significant performance issues. |
| · | Our exposure to CDO transactions backed by 2006 and 2007 vintage BBB and BBB- subprime assets is limited. Approximately 75% of our CDO portfolio is comprised of securities backed by commercial real estate or residential real estate from vintages pre-dating 2006. |
| · | As of June 30, 2007, none of the CDO securities owned by Redwood were downgraded or placed on credit watch by the credit rating agencies. In July 2007, one CDO security owned by Redwood was placed on credit watch negative. We recorded impairments on three 2006 vintage CDO assets this quarter, resulting in a $6 million charge against income. |
| · | Should there be additional and severe downgrades of subprime collateral over the coming months and years, these CDO securities themselves may experience downgrades and potentially losses. Should this occur, we expect lower rated securities to be the most heavily impacted. However, rating downgrades and potential losses may extend up the capital structure and even impact AAA and AA rated securities. |
| · | We have no immediate plans to sell any CDO securities. However, we will continue to monitor our portfolio and take action to sell underperforming assets where appropriate. |
| · | We still believe that once the turmoil in the CDO and mortgage markets subsides there will be some very attractive buying opportunities. We have directed resources towards evaluating acquisition of CDO securities but until there is more certainty around the actual performance of residential assets backing CDOs, any new purchases will likely be minimal. |
The Redwood Review 2nd Quarter 2007 | | 47 |
CDO Investment-Grade Securities
Quarterly Update
| 48 | | The Redwood Review 2nd Quarter 2007 |
CDO Investment-Grade Securities
Quarterly Update
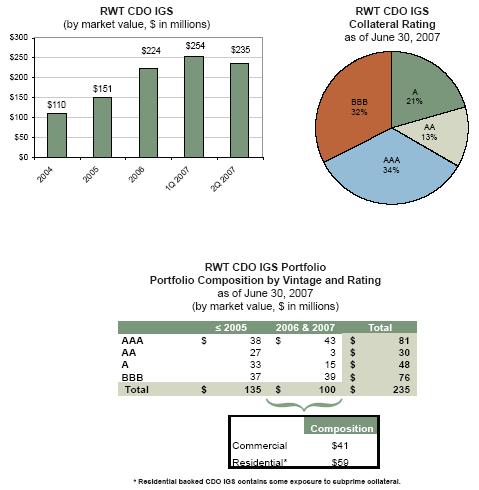
| Ø | Our total investment in CDO IGS decreased 7% during the second quarter, to $235 million from $254 million as a result of market value decreases totaling $19 million. There were no sales or acquisitions during the quarter. |
| Ø | At June 30, 2007, $219 million of our CDO IGS portfolio was financed via securitization in our Acacia CDO program and the remaining $16 million was funded with capital. |
| Ø | Interest income generated by the CDO IGS portfolio during the second quarter was $4.6 million, an increase of 20% over the $3.9 million generated in the first quarter of 2007. The yield for the second quarter was 7.08%, consistent with the previous quarter, as LIBOR interest rates have remained relatively stable. Substantially all of these assets earn a floating rate of interest based on the LIBOR interest rate. |
| Ø | We have never incurred a principal loss on a CDO IGS security and we do not currently have credit reserves for these assets. However, we did record impairment charges totaling $6 million related to three CDO IGS assets during the second quarter. |
| Ø | We use interest rate agreements to reduce mismatches of interest rate characteristics between the fixed-rate CDO IGS we own and the floating-rate CDO securities issued by Acacia to finance these assets. |
The Redwood Review 2nd Quarter 2007 | | 49 |
CDO Credit-Enhancement Securities
Quarterly Update
| 50 | | The Redwood Review 2nd Quarter 2007 |
CDO Credit-Enhancement Securities
Quarterly Update
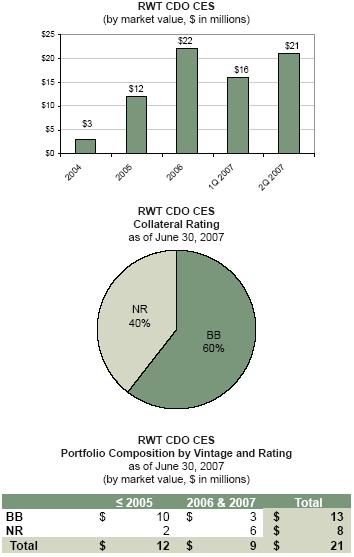
| Ø | Our CDO CES portfolio increased by $5 million due to acquisitions during the second quarter to $21 million, or 31% over the first quarter of 2007. |
| Ø | At June 30, 2007, $13 million of CDO CES was financed via our Acacia CDO program and $8 million was financed with capital. |
| Ø | Approximately 69% of the $21 million of CDO CES was backed by commercial real estate collateral. |
| Ø | Interest income generated by CDO CES was $0.7 million for the second quarter. The yield for the quarter was 14.38%, an increase over the previous quarter’s yield of 10.84%. The underlying securities supporting our CES CDO investments continue to perform well. |
The Redwood Review 2nd Quarter 2007 | | 51 |
Summary
What is this?
Our capital base includes equity plus $150 million subordinated notes (trust preferreds).
We use capital to fund operations and working capital, investments in illiquid or credit-sensitive assets, and to meet lender capital requirements with respect to the collateralized borrowings we undertake. We also hold capital as a reserve to meet liquidity needs that may arise.
Through our internal risk-adjusted capital policies, we estimate the amount of capital we need to manage our current book of business, and to set aside a prudent level of reserve capital. Any capital that exceeds our risk-adjusted capital guideline amount is excess capital that can be used to support business growth.
Insights
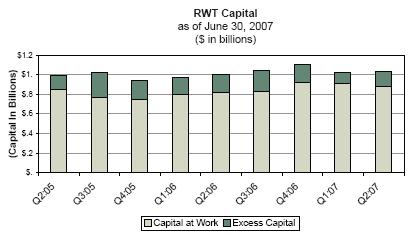
| · | We had $158 million excess capital at June 30, 2007, an increase from $114 million at the beginning of the quarter. In part as a result of a successful Sequoia securitization of prime residential whole loans, our excess capital at the end of July increased to $200 million. |
| · | At the beginning of 2007, we anticipated net capital absorption of $200 million to $400 million for 2007. At this point, the outlook for capital absorption is uncertain due to market turmoil. The amount of capital we deploy will depend on the level of expected returns from possible acquisitions. Given our current acquisition plans, it is possible that we will finish the year at, or below, the lower end of that range. |
| · | It is also possible that large and exceptional opportunities may develop during the remainder of the year. If that occurs, we may utilize our current excess capital and also elect to raise additional capital, through the issuance of long-term debt or equity. Alternatively, if our stock price were to decline to a level that we deemed attractive relative to our opportunities to acquire new real estate assets, we would consider using some of our excess capital to repurchase shares. |
| 52 | | The Redwood Review 2nd Quarter 2007 |
Quarterly Update
| Ø | Excess capital increased by $44 million to $158 million during the quarter. In the second quarter of 2007, uses of capital included asset acquisitions ($143 million) and dividends ($21 million). Sources of capital included asset sales ($22 million), principal payments ($45 million), debt issuance ($50 million), equity issuance ($37 million), earnings ($11 million), and other factors including recycling of capital ($43 million). |
| Ø | Capital employed decreased in the first quarter from $910 million to $877 million as a result of market value changes that were recognized for GAAP. |
| Ø | Market declines did not have a large effect on excess capital, since, for the most part, asset value declines result in an equal reduction of both total capital and also of capital required under our internal risk-adjusted capital guidelines. |
| Ø | Some of the capital utilized during the quarter is currently used on a temporary basis in an inefficient manner to fund assets that would be more efficiently financed with debt or via securitization or to fund delinquent loans from called Sequoia securitizations. Over time, we hope to employ this capital more efficiently, freeing capital to support future growth. |
| Ø | Our total capital base remained flat at $1.0 billion between March 31 and June 30. Issuance of new equity ($37 million) and subordinated debt ($50 million) offset market valuation adjustments ($75 million) and dividends ($21 million) and earnings ($11 million) for assets and derivatives that were recorded for GAAP. |
The Redwood Review 2nd Quarter 2007 | | 53 |
Summary
What is this?
Redwood debt is all the debt incurred by Redwood Trust, with the exception of subordinated notes that we count as part of our capital base.
| 54 | | The Redwood Review 2nd Quarter 2007 |
| Ø | Redwood debt balances finished the second quarter of 2007 at $0.8 billion. |
| Ø | At June 30, 2007, Redwood debt funded $0.7 billion residential whole loans and $0.1 billion securities. |
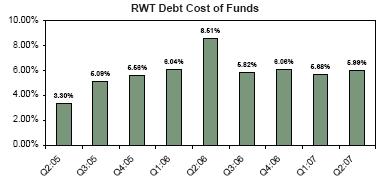
| Ø | Interest expense for Redwood debt was $23 million for the second quarter. The cost of funds for Redwood’s debt was 5.99% for the second quarter and 5.68% for the first quarter. Our debt expense varies, due to short-term interest rates, the type of facility used, and the type of collateral financed. |
| Ø | At June 30, 2007, all Redwood debt was short-term debt collateralized by the pledge of assets. Maturities are generally one year or less, and the interest rate usually adjusts to market levels each month. |
| Ø | When we fund fixed-rate or hybrid-rate assets with Redwood debt, we may use interest rate agreements to reduce the interest rate mismatch between the asset and the liability. |
| Ø | Commercial paper (CP) borrowings under our Madrona program are rated the highest CP rating of A1+/P1 and represent our lowest cost borrowings. At June 30, 2007, CP outstanding was $191 million. We had no CP outstanding at the end of July. |
| Ø | Redwood’s debt obligations of $1.0 billion (including $150 million of subordinated notes) were 1.1 times Redwood’s equity of $876 million at June 30, 2007. |
| Ø | At June 30, 2007, we had $83 million of unrestricted cash. We also had $878 million unsecuritized prime residential loans and $168 million of AAA-rated prime residential securities. Total short-term borrowings against these assets were $849 million. Since the end of the second quarter, we completed a securitization of residential loans through our Sequoia program. As a result of this and other activity, as of August 7, 2007, we had $231 million of unrestricted cash, $189 million unsecuritized residential loans, $330 million AAA-rated securities, and short-term borrowings of $472 million. We also owned other assets on an unencumbered basis, including CES, OREI, and retained assets from our Sequoia and Acacia securitizations. |
The Redwood Review 2nd Quarter 2007 | | 55 |
Summary
What is this?
We finance a majority of our investments in securities using proceeds from collateralized debt obligation (CDO) securitizations. We sell a diverse pool of our residential, commercial, and CDO real estate securities (primarily rated investment-grade or BB) to an independent securitization entity (typically called Acacia) that creates CDO securities. The newly created CDO ABS securities that are rated investment-grade are sold to third-party investors. Redwood earns ongoing asset management fees for managing the Acacia entities. In addition, Redwood acquires most of the CDO CES that Acacia creates. By acquiring Acacia CDO CES, Redwood earns the net interest income created when the yield on the assets in the Acacia collateral pool exceeds the interest payments required and made to the buyers of the CDO ABS securities Acacia has sold. Acacia CDO ABS are not obligations of Redwood Trust. However, they are shown on our consolidated balance sheet as part of ABS issued liabilities.
Insights
| · | The market for new issuance CDO ABS securities is currently distressed. Dealer inventory has swelled and pricing on new securities has weakened in order to accommodate the lack of demand and increased risk associated with new deals backed by 2006 and 2007 vintage assets. |
| · | During the very difficult market conditions of the second quarter we successfully priced and issued two CDO ABS deals, Acacia Option ARM 1 and Acacia 12, with equity returns that are expected to meet or exceed our internal hurdle rates. Relative to other real estate CDO issuance in the second quarter, our Acacia CDO ABS securities were priced at lower, more attractive yields than other comparable CDO securities that priced during the quarter. |
| · | CDO ABS issuance comprised of commercial, mezzanine, and high grade backed collateral slowed dramatically during the second quarter. Total issuance decreased by 50% with issuance in the mezzanine sector being impacted most dramatically and posting a 75% decrease over the previous quarter. |
| · | Subsequent to the end of the second quarter, the credit rating agencies have been issuing credit watch and downgrade actions to reflect the recent deterioration in the mortgage markets. Additionally, the credit rating agencies have revised their rating criteria, which will put additional pressure on the new issuance markets. |
| · | In the short term, the continued dislocation within the mortgage sector, poor performance of 2006 vintage subprime collateral and related CDOs, credit rating agency actions, and lack of liquidity for CDO ABS could hinder our ability to issue new Acacia CDO ABS deals. However, we believe we should be able to continue to leverage our competitive advantages in the CDO business. These include the ability to acquire and hold CDO CES, a well-developed real estate investment and credit management infrastructure, access to collateral, access to warehouse and other inventory financings, a strong track record, and an excellent reputation. These competitive advantages should enable us to maintain our status as a market participant and quality issuer in the CDO ABS markets. |
| 56 | | The Redwood Review 2nd Quarter 2007 |
Insights (cont.)
| · | Within our Acacia CDOs, we limited our exposure to the riskier 2006 and 2007 vintage subprime collateral. In the limited incidents where we did acquire subprime securities issued in 2006 and 2007, we focused our purchases in AA and A rated securities, with small exposure to BBB and BBB- rated securities. |
| · | Going forward, we believe Acacia’s issued CDO bonds are likely to perform well on an absolute basis and also relative to other CDO bonds. |
The Redwood Review 2nd Quarter 2007 | | 57 |
Quarterly Update
| 58 | | The Redwood Review 2nd Quarter 2007 |
Quarterly Update
| Ø | Acacia CDO ABS outstanding increased from $2.8 billion to $3.5 billion during the second quarter of 2007, an increase of 25%. Acacia issued two new CDO ABS during the quarter, Acacia Option ARM 1 and Acacia 12, which experienced good investor participation and provided attractive funding costs for Redwood. Paydowns of Acacia CDO ABS issued were $259 million for the second quarter; of this amount, $242 million was attributable to the retirement of debt related to the Acacia 4 call. |
| Ø | Spreads have continued to widen (yields increased) for both collateral assets and CDO liabilities beyond levels seen at the end of the first quarter of 2007. Uncertainty remains regarding the ultimate cost of new ABS CDO liabilities we might issue in the future. |
| Ø | The cost of funds of issued Acacia CDO ABS was 6.00% in the second quarter of 2007 as compared to 6.20% for the first quarter of 2007. Interest expense, net of interest rate agreements, for Acacia ABS issued was $43 million for the second quarter of 2007. |
| Ø | At June 30, 2007, the credit ratings for Acacia bonds outstanding were $2.7 billion AAA, $320 million AA, $201 million A, and $145 million BBB. In addition, Acacia has sold a portion of its unrated CDO CES (CDO equity) to third parties, of which $20 million was outstanding at June 30, 2007. |
| Ø | During the quarter, two Acacia CDO 5 ABS were placed on credit watch positive, giving further credence to our reputation as a quality issuer in the CDO ABS market. |
| Ø | Our collateral rating history continues to be strong. As of June 30, 2007, we have had 117 rating upgrades and three rating downgrades on all collateral within the existing Acacia program. In July 2007, there were 50 additional rating upgrades, two rating downgrades, and one credit watch negative. |
| Ø | The Acacia CDO CES Redwood has acquired from Acacia had a market value of $117 million at June 30, 2007. For accounting purposes, we account for Acacia transactions as financings, so the assets owned by Acacia are consolidated with our assets and the CDO bonds issued by Acacia are consolidated with our liabilities. As a result, the Acacia CDO CES we issue and then acquire do not appear on our GAAP balance sheet, but rather are implicitly represented as the excess of consolidated Acacia assets over consolidated Acacia liabilities. |
| Ø | For GAAP financial reporting purposes, we mark-to-market most of the assets and derivatives owned by the Acacia entities, but none of Acacia’s liabilities. For GAAP purposes, if market values for Acacia’s $3.5 billion assets declined sufficiently, we could be required to record balance sheet charges in excess of the total amount that Redwood actually has invested. Conversely, we are not permitted to reflect an offsetting mark-to-market improvement in Acacia liability results in our GAAP financials. None of these market value changes would affect the cash flows we expect to earn from our Acacia investments, however. The net balance sheet market valuation adjustment for assets and derivatives in closed Acacia transactions was $57 million for the second quarter. |
| Ø | For managing the outstanding Acacia transactions, Redwood’s taxable asset management subsidiaries earned $1.5 million of asset management fees during the second quarter of 2007. This income was sourced from the assets owned by Acacia, and these assets are consolidated on our GAAP balance sheet. Thus, for GAAP purposes we currently include this asset management income as part of interest income. |
| Ø | Additional information about Acacia CDO ABS issued can be found in Table 21 of the Appendix. |
The Redwood Review 2nd Quarter 2007 | | 59 |
Quarterly Update
| 60 | | The Redwood Review 2nd Quarter 2007 |
Quarterly Update
The Redwood Review 2nd Quarter 2007 | | 61 |
Summary
What is this?
We finance a portion of our residential whole loans by securitizing them. We sell loans to an independent securitization entity (typically called Sequoia) that creates and issues asset-backed securities (ABS) backed by these loans. Most of the investment-grade rated Sequoia ABS are sold to third party investors. Redwood usually acquires most of the credit-enhancement securities (CES) and the interest-only securities (IO) that Sequoia creates, as well as a portion of Sequoia’s IGS. When Redwood acquires Sequoia IO, we earn the net interest income created when the yield on Sequoia’s loans exceeds the cost of funds of Sequoia ABS issued. Sequoia ABS are not obligations of Redwood Trust, although they are shown on our consolidated balance sheet as part of ABS issued liabilities.
Insights
| · | We completed one Sequoia securitization in the second quarter and completed another Sequoia securitization that closed in July 2007. |
| · | Recent Sequoia ABS issued has been backed by prime hybrid and ARM mortgages. |
| · | In the second quarter, we called an older Sequoia transaction that was issued in 2004 and we may call more transactions in 2007 and 2008. |
| · | We expect to expand our residential conduit’s activities and to acquire alt-a and subprime loans, when appropriate, to be funded primarily through securitization. |
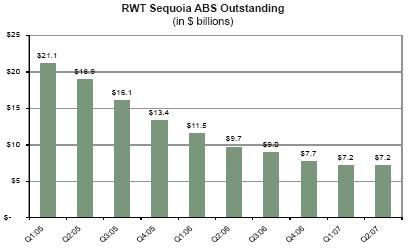
| 62 | | The Redwood Review 2nd Quarter 2007 |
Quarterly Update
| Ø | Sequoia ABS issued and outstanding remained flat at $7.2 billion in the second quarter. In the second quarter, the CPR for the loans owned by Sequoia entities was 37%. |
| Ø | We completed one securitization during the second quarter, financing $407 million prime hybrid mortgages and $654 million prime ARM mortgages. In conjunction with the securitization, Sequoia issued $1 billion AAA-rated ABS and another $15 million of investment-grade ABS. The ABS had similar interest rate characteristics to the underlying loans, thus minimizing our interest rate risk. The current cost of funds on the newly issued ABS was 5.68%. |
| Ø | In the second quarter, we called and retired $133 million ABS associated with a Sequoia securitization issued in early 2004. When we exercise the call option, Redwood acquires all the ABS that remains outstanding at par value. This securitization was canceled, the Sequoia entity was collapsed, and Redwood reacquired the underlying loans. Some of these loans were included in the 2007 Sequoia securitizations. |
| Ø | Interest expense for Sequoia ABS issued was $98 million for the second quarter for a cost of funds of 5.42%. |
| Ø | Redwood’s economic risk with respect to Sequoia’s assets and liabilities is generally limited to the value of Sequoia ABS we have acquired, which at June 30, included $54 million market value IO securities rated AAA, $52 million CES, and $12 million IGS. For GAAP accounting purposes, we account for Sequoia transactions as financings, so the assets owned by Sequoia are consolidated with our assets and the ABS bonds issued by Sequoia are consolidated with our liabilities. As a result, the Sequoia ABS we acquire do not appear on our GAAP balance sheet, but rather are implicitly represented as the excess of consolidated Sequoia assets over consolidated Sequoia liabilities. |
| Ø | Additional information about Sequoia ABS issued can be found in Tables 19 and 20 of the Appendix. |
The Redwood Review 2nd Quarter 2007 | | 63 |
| Redwood Business and Strategy |
This section of the Review is a broad introduction to Redwood Trust and provides a long-term overview of Redwood’s business and strategy. We review and edit it every quarter and as a result, the content may change over time as the company and market conditions evolve. We recommend that you review it periodically.
| 1. | Redwood Trust is a financial institution with competitive advantages in the business of investing in real estate loans and securities. |
Since Redwood was founded in 1994, our goal has been to create a company that is more efficient than banks, thrifts, insurance companies, and other financial institutions at investing in, financing, and managing residential and commercial real estate loans and securities.
Like many financial institutions, our primary source of income is net interest income, which equals the interest income we earn from our investments in loans and securities less the interest expenses we incur from our borrowed funds and other liabilities.
Most financial institutions fund their asset investments with borrowed money sourced by taking bank deposits, writing insurance policies, or issuing corporate debt. By contrast, securitization is the primary source of funding for our investments.
We also borrow money on a collateralized and uncollateralized basis, typically at very competitive rates. We do not, however, take deposits or raise money in any other way that would subject us to consumer lending or banking regulations. Since we are not regulated as a financial institution and do not deal directly with consumers, our operating costs are far lower than other financial institutions, and we have far greater freedom to use securitization as a source of funding.
In a securitization, we sell our assets to an independent securitization entity that creates securities backed by those assets (asset-backed securities, or ABS) and sells these newly created securities to both domestic and international investors. Most of the securities created and sold earn the highest credit rating of AAA, so the interest expense paid out is relatively low. We typically generate a profit from these securitization entities, consisting of the yield on the securitized assets less the interest expense payments made to the holders of the ABS securities sold.
Advances in securitization technology have enabled securitization to become increasingly competitive as a funding source relative to corporate debt, deposits, insurance contracts, and other borrowings. The cost of funds for ABS issued continues to improve relative to the cost of other borrowings. More importantly, the range of assets that can be efficiently securitized continues to broaden and the capital efficiency of securitization as a source of funding continues to improve.
As global capital markets continue to develop and evolve, we expect securitization to become an even more efficient source of funding. There are trillions of dollars of real estate loans and securities in the U.S. and the world, and the amount outstanding has been and is expected to continue to grow every year. We believe many of these assets would be better funded through securitization than by other means. Since we are highly efficient at using securitization as a source of funding, we believe we will continue to grow and diversify our business over time.
Our tax structure gives us an additional competitive advantage that cannot be easily replicated by most other financial institutions. We have structured our company for tax purposes as a real estate investment trust (REIT) because our primary business is investing in real estate assets. As a REIT, we are required to distribute the bulk of our profits as dividends. By doing so, we avoid paying corporate taxes on most of the income we generate. This lowers our costs, as taxes are one of the largest costs of doing business for most financial institutions.
| 64 | | The Redwood Review 2nd Quarter 2007 |
| Redwood Business and Strategy |
| 2. | In terms of capital employed, our largest area of investment is real estate credit-enhancement securities. |
Typically, 1% to 15% of the principal value of the securities created in a securitization of real estate assets are credit-enhancement securities (CES). These securities bear most of the credit risk with respect to the underlying assets that were securitized. If the underlying loans or securities suffer a loss of principal due to default, that loss is passed on by reducing the principal value of the CES. As a result of the high level of assumed credit risks, CES carry credit ratings that are below investment-grade. Because the CES absorb most or all of the credit risk that would normally be expected to occur, they reduce the credit risk of the more senior securities, allowing them to earn investment-grade ratings and to be sold at higher prices.
We are a leading investor in CES issued from securitizations of prime-quality residential real estate loans and we are an increasingly important investor in CES issued from securitizations of commercial real estate loans made on income-producing properties. In the last year, we have also made small investments in CES issued from securitizations of alt-a and subprime quality residential loans (some of these assets are also referred to as residuals and are listed on our balance sheet under ‘other real estate investments’). In total, at June 30, 2007, we owned residential, commercial, and CDO CES and similar other real estate investments with a principal value of $2 billion and a market value of $1 billion. Many of these securities are deep discount securities where our cost is far less than the principal value. Since we receive interest payments based on the principal value of a CES security, our interest income cash flow returns are strong. In addition, if credit losses are low, we will receive principal payments in excess of our cost basis, thus generating additional investment returns. Conversely, larger than expected credit losses could rapidly reduce the principal value of our CES, causing our investment returns from CES to suffer.
At June 30, 2007, our CES were first in line to absorb credit losses from the $290 billion of real estate loans and securities that underlie the securitizations from which our CES investments were issued. However, our potential credit losses are limited to the capital we have invested in CES.
With respect to these CES investments, we have a high degree of structural leverage since the principal value of our CES equals only a small percentage of the underlying asset pools. We do not, however, use a high degree of financial leverage with respect to our CES assets. We use capital rather than debt to finance most of our investments in the more subordinated CES (the first-loss and second-loss securities, or equivalent) and we use capital plus a modest amount of securitization financing through our Acacia CDO issuance program to finance the more senior CES that are closer to investment-grade quality.
Recently we have been acquiring more IGS than CES. We are highly focused on finding good opportunities to acquire residential, commercial, and CDO CES, as well as residuals, but in the current environment, we remain cautious. Later in 2007, and especially in 2008, we believe acquisition opportunities in CES may improve because we expect residential and commercial underwriting quality to improve.
| 3. | We are increasing our investment in investment-grade rated real estate securities. |
We have been increasing our investments in residential and commercial real estate investment-grade securities (IGS) rated AAA, AA, A, and BBB for three reasons.
First, advances in securitization technology (such as CDOs) allow us to re-securitize portfolios of certain types of residential and commercial IGS and earn attractive returns on invested capital, as well as asset management fees.
Secondly, in an environment of flat or falling housing prices and increased residential loan delinquencies and credit losses, we have for some time been tilting our investment focus towards assets that are credit-enhanced by others (IGS) rather than towards assets that cause us to carry concentrated credit risk (credit-enhancement securities).
The Redwood Review 2nd Quarter 2007 | | 65 |
| Redwood Business and Strategy |
Finally, we are increasing our investment in AAA- and AA-rated residential real estate securities funded with short-term Redwood debt. We pursued this investment strategy on a large scale from 1994 to 2000, after which we focused our investment strategy almost exclusively on assets with highly concentrated credit risks such as CES. Debt-funding AAA and AA real estate securities can be a good investment strategy in most economic environments. In addition, it fits our current balance sheet needs well, as we believe it will help us increase our capital utilization rate in a flexible manner and also will offset some of the risks we have in our balance sheet.
Currently, our balance sheet is set up to benefit somewhat more from rising short-term interest rates and faster prepayment speeds, whereas debt-funded AAA and AA asset strategies typically benefit from falling short-term interest rates and slower prepayment speeds.
Give recent market turmoil we may shift strategies over the next year to acquire more CES and credit-sensitive assets, especially if we can acquire assets at distressed pricing levels.
| 4. | We are increasing our investment in residential real estate loans. |
We have been increasing our acquisitions of high-quality residential loans, and we are using both securitization proceeds and Redwood debt to fund these assets.
Our residential loan portfolio declined in size over the last few years as we purchased fewer loans and the adjustable-rate residential loans in our portfolio prepaid at rapid rates. Because we have been increasing our loan purchases and our loan prepayment rate has slowed, we expect our loan portfolio size to start to stabilize. We are buying hybrid loans (fixed-rate for 3-10 years, converting to adjustable-rate thereafter) as well as adjustable-rate loans.
Our interest in acquiring loans has increased because we have greater control over the underwriting quality of acquired loans than we do with respect to the loans underlying the residential CES we acquire. Quality control has become more important as residential underwriting standards have deteriorated. In addition, we are buying more loans because we want to hold a portion of our loan portfolio in whole loan form (unsecuritized) and use Redwood debt (including collateralized commercial paper) to fund the whole loans. Compared to the alternative of using securitization proceeds to fund these loans, using debt funding increases our flexibility in utilizing more of our capital. Debt-funding loans requires a much larger capital commitment (8% to 10% of loan value versus 3%), and it generates a somewhat lower expected return on that capital than would a securitization. This is a flexible capital commitment, however, as we can easily recycle the capital utilized in this debt-funded strategy into other investments by either securitizing or selling the loans. Employing capital in this manner is useful at a time when we want to build our capital base to take advantage of future growth opportunities but we also want to improve profits by increasing our capital utilization rate, which has been lower than optimal in the last few years as we cut back our acquisition of CES.
We are replacing some of our existing securitization funding with debt funding. In 2007 and 2008, we may exercise our rights to call many of our older “Sequoia” securitizations of residential loans. The terms of these securitizations generally allow us to call the deals when the current loan balance of the underlying loan pool pays down to 10% or 20% of its original balance. When calling a securitization, we pay off all the security holders at 100% of principal value and repurchase the underlying loans. We typically call our securitizations when we have the right to do so because the capital structure of a securitization becomes less efficient when the remaining balance of loans is small. It is better to call the deal so we can refinance the underlying loans more efficiently. We sometimes finance a portion of the loans we acquire from called deals with Redwood debt and hold them as an ongoing investment. The remainder we either re-securitize or sell.
| 66 | | The Redwood Review 2nd Quarter 2007 |
| Redwood Business and Strategy |
| 5. | We buy most of our assets rather than originate them. |
Our primary strategy for sourcing assets is to acquire closed loans and securities directly from other financial institutions or from the capital markets. We do not originate or service loans. Others create most of the real estate securities we invest in, some are created by us, but in both cases, others have originated the underlying loans. This role allows us to have an independent point of view on asset quality and attractiveness, as well as the flexibility to change investment strategies as markets evolve. In our experience over the years, many financial institutions that have origination operations have produced sub-optimal asset investment results. We believe this is because, in some cases, there may have been incentives to retain loans that might not be the best investment (in terms of price and/or quality) in order to maintain or boost origination volumes and fees. In addition, origination (especially residential loan origination) is a business that is highly cyclical, operations intensive, and increasingly fraught with lender liability. Residential origination is becoming concentrated in the hands of a few large companies that have either banking or brokerage operations as well. Rather than competing with these companies, we develop close relationships with them and help them build their businesses. They need companies like Redwood to buy their loans and credit-enhance their securitizations.
We previously built a successful commercial real estate loan origination operation at Redwood, and we may do so again in the future now that CDO securitization technology has improved the efficiency and ease of securitizing commercial real estate loans. We may also build a commercial real estate loan special servicing operation. However, we expect to continue to source most of our residential and commercial assets through acquisition rather than origination.
| 6. | Competition for assets is strong, but we believe our operating efficiencies will allow us to remain competitive. |
Our competitors are banks, thrifts, insurance companies, Fannie Mae, Freddie Mac, Wall Street brokerage firms, hedge funds, private equity firms, specialty finance companies, mortgage REITs, mortgage insurance companies, CDO securitization managers, asset management companies, foreign investors, and other financial institutions.
Our corporate structure and competitive strengths differ from most other financial institutions. With our differentiated capabilities, we interact not only as competitors, but also as customers and suppliers, with most of the institutions active in the vast and interconnected real estate capital markets.
We commenced operations in 1994, a period of turmoil in financial markets. This turmoil allowed us to acquire assets that produced very high returns in subsequent years. The level of competition increased dramatically through the end of 1997, at which time we generally sold assets as the prospective risk/reward relationships for assets did not seem that attractive. There were several financial dislocations in 1998, including a prepayment acceleration crisis and a liquidity crisis. This allowed us to use our excess capital to acquire assets, including our own stock, at attractive prices. The CES we acquired in 1999 - 2002 performed very well, allowing us to report high return on equity results and to pay special dividends of $4.75 and $6.00 per share in 2003 and 2004, as well as $3.00 per share in each of the last two years.
The competitive environment over the last year has been much like 1997 - new entrants and other investors were willing to buy assets at high prices (low yields) despite increased potential risks. We responded to this lower return/higher risk environment by selling CES assets and slowing our acquisitions. We increased our acquisitions of assets (such as IGS and loans) that carry less concentrated credit risks than CES. We fund most of these assets via securitization, a form of financing that does not expose us to liquidity risks once a securitization is completed. For these assets, high prices were less of a concern because these high prices (and the resulting narrow spreads) were offset by the high prices at which we sell the securities we create using these assets as collateral.
The Redwood Review 2nd Quarter 2007 | | 67 |
| Redwood Business and Strategy |
Now the financial markets are experiencing turmoil due to falling housing prices and rising residential loan defaults. We will incur increased credit losses, but we are also in a position to acquire lower priced assets with higher return potential. We believe some competitors will remain strong, however, and that any extraordinary asset acquisition opportunities will be short-lived. With our operating efficiencies, funding strategy, corporate structure, permanent capital base, and investment discipline, we believe we are prepared to continue to compete effectively in the competitive market that we expect will be the norm going forward.
| 7. | We maintain a strong balance sheet with risks that are largely segregated and limited. |
Through our internal risk-adjusted capital policies, we seek to maintain a strong balance sheet with a large capital base, risks that are limited and segregated, and ample liquidity. Our $1.0 billion long-term capital base is primarily common equity but also includes $150 million of unsecured subordinated notes that have a 30-year maturity.
We use capital, not debt, to fund assets such as first-loss credit-enhancement securities and residuals that carry concentrated credit risks. These assets have a high degree of structural credit risk, so we do not feel it would be prudent to employ financial leverage to acquire these assets. Our risk is limited to our investment in these securities. Since we fund these assets with capital rather than debt, high credit losses should not cause liquidity concerns. Similarly, our economic risk is limited and our liquid reserves are secure with respect to securitized assets, since the assets are sold to and the securities are issued by independent securitization entities, whose liabilities are not Redwood’s obligations. Our economic risk is limited to the value of any securities we may acquire as an investment from these entities. Typically, either we fund securities acquired from securitizations we sponsor with capital or we sell these securities to another securitization entity for re-securitization. In either case, the risk is segregated and limited.
We also use Redwood debt to fund assets. This funding strategy brings us a number of benefits, including allowing us to employ our excess capital in a flexible manner. It does, however, expose us to potential liquidity risks as well as potential credit risks that are not as limited as with other parts of our balance sheet. Accordingly, we use Redwood debt primarily to fund assets (such as investment-grade rated securities and prime-quality residential whole loans) that do not have concentrated credit risks and that typically can be liquidated quickly. Increasingly, we expect to use extendable collateralized commercial paper as a source of short-term Redwood debt for debt-funded asset strategies. We believe the potential liquidity risks of commercial paper are less than those of our debt facilities in the form of repurchase agreements. Finally, we allocate capital equal to 8% to 10% of assets to support our debt-funded asset strategies, an amount that is well in excess of the amount required by our lenders. We believe this gives us a margin for safety should liquidity, market value, or credit concerns arise.
With respect to interest rate and prepayment rate risks, we seek to maintain a balance sheet that is well balanced and that can generate cash flows to fund our regular dividend in a wide variety of scenarios. We believe we have achieved this - the net present value of our projected cash flows does not vary materially with respect to scenarios incorporating changes in interest rates or prepayment rates. Scenarios incorporating different degrees of potential credit losses, however, show a wide variation in the long-term net present value of our cash flows. In the near-term (one to three years), our results may vary as a function of changes in interest rates, prepayments, credit results, mark-to-market asset values, and other factors.
| 68 | | The Redwood Review 2nd Quarter 2007 |
| Redwood Business and Strategy |
| 8. | Our primary financial goal is to deliver an attractive sum of dividends per share over time. |
Our financial goal is to distribute the highest sum of dividends per share over the next few decades as we can. We seek to do that while also remaining within our risk tolerance levels and while increasing the inherent value of the company by building competitive advantages, diversifying risks and opportunities, developing internal capabilities, maintaining our culture, keeping operations highly efficient, and increasing book value per share.
As a REIT, we are required to distribute to our shareholders as dividends at least 90% of our REIT profits as calculated for tax purposes. We distribute our profits as a regular quarterly dividend and also, in some years, in a year-end special dividend. The regular dividend rate for 2006 was $0.70 per share per quarter and the special dividend was $3.00 per share. Total dividends for 2006 were $5.80 per share.
We increased the regular dividend rate to $0.75 per share per quarter for the first quarter of 2007. We set the regular dividend rate at a level we believe is likely to be sustained barring significantly increased credit losses or material degradation of our business economics for another reason. Whether we pay a special dividend or not in 2007 will depend primarily on how much REIT taxable income we generate during the year. We expect that our total annual dividend payout amounts (regular plus special) will vary from year to year.
In a manner consistent with our goal of distributing an attractive sum of dividends per share over time, our mission is to grow to become a larger company in terms of capital employed and market capitalization. We are targeting growth by building real estate investment, financing, and management operations with competitive advantages. Over the long term, growth should bring several advantages, including book value accretion and a diversified income stream.
We plan to grow organically as markets grow and as we gain long-term market share, rather than simply growing for growth’s sake or through short-term acquisition of market share, which would be irresponsible and inconsistent with our long-term goal of distributing attractive dividends per share. In addition, we do not expect growth to be linear, because, in cyclical markets, growth is not always the appropriate short-term strategy.
The Redwood Review 2nd Quarter 2007 | | 69 |
NOTE: Not all companies and analysts calculate non-GAAP measures in the same fashion. As a result, certain measures as calculated by Redwood may not be comparable to similarly titled measures reported by other companies.
ACACIA
Acacia is the brand name for the collateralized debt obligation (CDO) securitizations Redwood sponsors. The underlying pool of assets for these CDO securitizations generally consists of IGS and, in some pools, some below-investment-grade rated securities backed by residential prime, residential subprime, and commercial real estate loans. Acacia also owns related assets such as CDO securities issued by other real estate oriented CDOs, corporate debt issued by equity REITs, commercial real estate loans, and synthetic assets derived from real estate assets. Redwood typically acquires a portion of the CDO credit-enhancement (or “equity”) securities issued by Acacia; these are the securities that are in the first-loss (highest risk) position with respect to absorbing any credit losses that may occur within the assets owned by the Acacia entities. Redwood also earns asset management fees for ongoing management of the Acacia entities.
ADJUSTABLE-RATE MORTGAGES (ARMs)
Adjustable-rate mortgages are loans that have coupons that adjust at least once per year. We make a distinction between ARMs (loans with a rate adjustment at least annually) and hybrids (loans that have a fixed-rate period of two to 10 years and then become adjustable-rate).
ALT-A SECURITIES
Alt-a securities are residential mortgage-backed securities backed by loans that have higher credit quality than subprime and lower credit quality than prime. Alt-a originally represented loans with alternative documentation, but the definition has shifted over time to include loans with additional risk characteristics and a higher percentage of investor loans. For example, in an alt-a loan the borrower’s income may not be verified, and in some cases, may not be disclosed on the loan application. Alt-a loans may also have expanded criteria that allow for higher debt-to-income ratios with higher accompanying LTV than would otherwise be permissible for prime loans.
ASSET-BACKED SECURITIES (ABS)
ABS are securities backed by financial assets that generate cash flows. Each ABS issued from a securitization entity has a unique priority with respect to receiving principal and interest cash flows from the assets, and absorbing any credit losses, owned by the entity.
BOOK VALUE
Book value is the value of our common equity. As measured for GAAP, reported book value generally incorporates mark-to-market adjustments for securities and interest rate agreements, but not for loans or liabilities.
| 70 | | The Redwood Review 2nd Quarter 2007 |
COLLATERALIZED DEBT OBLIGATION (CDO) SECURITIZATIONS
The securitization of a diverse pool of assets. See “Acacia”.
CDO EQUITY SECURITIES
CDO equity securities (or CDO CES) are credit-enhancement securities that bear the initial credit losses of the assets owned by CDO securitization entities.
COMMERCIAL B-NOTE LOANS
Commercial b-note loans are structured loans that are subordinated to the more senior portions of loans secured by the same commercial real estate.
COMMERCIAL MEZZANINE LOANS
Commercial mezzanine loans are junior subordinated loans that are not secured by a lien on commercial real estate; rather, they are secured by a pledge from an equity entity of its equity interests in commercial real estate.
COMMERCIAL WHOLE LOANS
Commercial whole loans are unsecuritized first-lien loans that are secured by commercial real estate.
CONDUIT
An entity that acquires closed loans from originators, accumulates loans over a period, and sells these loans, seeking to generate a gain on sale. Sales are usually made via securitization, but also can be made through bulk whole loan sales.
CORE EARNINGS
Core earnings is not a measure of earnings in accordance with GAAP. In calculating core earnings, we attempt to strip some of the elements out of GAAP earnings that are temporary, one-time, or non-economic in nature, or that primarily relate to the past with little relevance to the future. In calculating core earnings, we are trying to show the trend of underlying ongoing earnings. For example, we sell assets from time to time as part of our ongoing portfolio management activities. These sales can produce material gains and losses that can obscure the underlying trend of our long-term portfolio earnings. Thus, we exclude realized gains (and losses) resulting from asset sales and calls that are included in GAAP income. Similarly, we exclude gains from calls of residential credit-enhancement securities, as these are essentially sales of assets. GAAP earnings also include mark-to-market income and expenses for certain of our assets and interest rate agreements. These are unrealized market value fluctuations, and we exclude them from core earnings. Core earnings also exclude other, one-time expenses such as severance.
Management believes that core earnings provide relevant and useful information regarding results from operations. This information can be used in conjunction with and in addition to GAAP measures of performance. Core earnings can be useful, in part, because market valuation adjustments on only a portion of our assets and none of our liabilities are recognized through the income statement under GAAP. Thus, GAAP valuation adjustments may not be fully indicative of changes in market values on the balance sheet as a whole and may not be a reliable guide to current operating performance. Furthermore, gains or losses realized upon sales of assets vary based on portfolio management decisions; a sale of an asset for a gain or a loss may or may not affect ongoing earnings from operations. A reconciliation of core earnings to GAAP income appears in Table 2 in the Appendix.
The Redwood Review 2nd Quarter 2007 | | 71 |
CORE EQUITY (CORE BOOK VALUE)
Core equity is not a measure calculated in accordance with GAAP. GAAP equity includes mark-to-market adjustments for certain of our assets and interest rate agreements (“accumulated other comprehensive income”). Core equity excludes these mark-to-market adjustments. Core equity in some ways approximates what our equity value would be if we used historical amortized cost accounting exclusively. A reconciliation of core equity to GAAP equity appears in Table 7 of the Appendix.
CONSTANT (OR CONDITIONAL) PREPAYMENT RATE (CPR)
Constant (or conditional) prepayment rate (CPR) is an industry-standard measure of the speed at which mortgage loans prepay. It approximates the annual percentage rate at which a pool of loans is paying down due to prepayments.
CREDIT-ENHANCEMENT SECURITIES (CES)
Credit-enhancement securities (CES) absorb the initial credit losses generated by a pool of securitized assets. As a result, the more senior securities issued from that securitization are credit-enhanced because they carry less credit risk. Our definition of CES includes all the below investment-grade rated bonds issued from a securitization. These securities are also referred to as subordinated securities and B-pieces. For a typical securitization of prime residential loans, there are three CES: the first-loss, second-loss, and third-loss bonds. The first-loss security takes the initial risk. If credit losses within the securitized asset pool exceed the principal value of the first-loss security, the second-loss security is at risk. If cumulative losses exceed the principal value of the first- and second-loss securities, then the third-loss security is at risk. Generally, for these securitizations, the third-loss security has a credit rating of BB, the second-loss has a credit rating of B, and the first-loss is unrated. Other types of securitizations, such as commercial, CDO, subprime residential, and some alt-a residential transactions, are structured differently. Nevertheless, the non-investment rated securities issued from these securitizations function as credit-enhancement securities for these transactions.
GAAP
Generally Accepted Accounting Principles in the United States.
INTEREST-ONLY SECURITIES (IOs)
Interest-only securities (IOs) are specialized securities that are backed by income-producing assets. They receive interest payments calculated by a formula wherein IO cash flows vary as a function of interest payments generated by the underlying assets within a securitization or as a function of the spread between the yield on the loans owned by a securitization entity and the cost of funds of the securities issued by that entity. Typically, IOs do not have a principal balance and they will not receive principal payments. Interest payments to IOs usually equal an interest rate formula multiplied by a “notional” principal balance. The notional principal balance for an IO is typically reduced over time as the actual principal balance of the underlying pool of assets pays down, thus reducing the cash flows to the IO over time. IO cash flows are typically reduced more quickly if asset prepayments accelerate.
72 | | The Redwood Review 2nd Quarter 2007 |
LEVERAGE RATIOS
We use collateralized debt to finance on the accumulation of inventory assets prior to sale to a securitization entity and to finance investments in high-quality loans and IGS. As we increase these investments, Redwood debt is growing, although balances are still at what would be considered by many analysts to be low levels for financial institutions. However, because of the consolidation of independent securitization entities, it appears on our GAAP Consolidated Financial Statements that Redwood is highly leveraged, with total liabilities significantly greater than equity. The obligations of these securitization entities are not obligations of Redwood. When determining Redwood’s financial leverage, traditional leverage ratios may be misleading in some respects if consolidated ABS issued from securitization entities are included as part of Redwood’s obligations when calculating the ratio.
MARK-TO-MARKET ACCOUNTING
Mark-to-market accounting uses estimated current fair market values of assets, liabilities, and hedges. Many of our assets currently are carried on our balance sheet at their market value rather than historical amortized cost. The changes in the fair market value of some of our assets and hedges are reported through our income statement. Increasingly in the future, we expect to use mark-to-market accounting for income statement purposes for a wider variety of assets and liabilities. This will likely make quarter-to-quarter GAAP earnings trends more volatile, although core earning and taxable income will not be affected to the same degree.
NEGATIVE AMORTIZATION ADJUSTABLE-RATE MORTGAGES (NEG AM ARMS, OPTION ARMS, OR MTA ARMS)
Negative amortization ARMs (neg am ARMs, option ARMs, pay option ARMs, or monthly treasury average (MTA) ARMs) are adjustable-rate mortgages that allow the borrower to choose between different payment options. One of these options allows the borrower to make a minimum payment. This minimum payment is less than the interest accrued on the mortgage during that period. As a result of this feature, the borrower’s loan balance may increase (causing negative amortization of the loan balance).
NET INTEREST MARGIN SECURITIES (NIMs)
Net interest margin securities (NIMs) are securities backed by cash flows that otherwise would be payable to the residual security. Through a new securitization, cash flows are diverted from the residual to amortize the NIM principal in addition to paying a coupon on the NIM. Since NIMs receive cash flows immediately or soon after securitization and tend to have short-averaged lives, they are rated by a rating agency. Rating can range from AAA down to single-B. NIMs are mostly an interest-only (IO) security because residuals (which back the NIMs) are mostly an IO security. Effectively, the IO-like cash flow is transformed into coupon and principal payments on the NIM.
The Redwood Review 2nd Quarter 2007 | | 73 |
OPTION ARMS
See Negative Amortization Adjustable-rate mortgages
OTHER REAL ESTATE INVESTMENTS
Other real estate investments (OREI) are assets that we mark-to-market for income statement purposes, in many cases because they may otherwise be deemed to contain embedded derivatives for accounting purposes under FAS 155.
PRIME RESIDENTIAL REAL ESTATE LOANS
Prime loans are residential loans with high quality credit characteristics, such as borrowers with high FICO credit scores, lower loan-to-value ratios, lower debt-to-income ratios, greater reserves, and more documentation.
PRIME SECURITIES
Prime securities are residential mortgage-backed securities backed by high credit, quality loans, generally with balances greater than conforming loan limits. Prime securities are typically backed by loans that have relatively high weighted average FICO scores (700 or higher), low weighted averages LTVs (75% or less), limited concentrations of investor properties, and low percentages of loans with low FICO or high LTV.
PROFITABILITY RATIOS
Many financial institution analysts use asset-based profitability ratios such as interest rate spread and interest rate margin in their work analyzing financial institutions. These are asset-based measures. Because we consolidate the assets and liabilities of securitization entities for GAAP purposes, our total GAAP assets and liabilities may vary strongly over time, and may not be comparable in economic reality to assets typically used in these calculations for other financial institutions. As a result, we believe equity-based profitability ratios may be more appropriate than asset-based measures for some analyses of Redwood’s operations. We believe, for example, that net interest income as a percentage of equity is a useful measure of profitability. For operating expenses, we believe useful measures are operating efficiency ratio (operating expenses as a percentage of net interest income) and operating expenses as a percentage of equity.
74 | | The Redwood Review 2nd Quarter 2007 |
REAL ESTATE INVESTMENT TRUST (REIT)
A REIT is an entity that makes a tax election to be taxed as a REIT, invests in real estate assets, and meets other REIT qualifications, including the distribution as dividends of at least 90% of REIT taxable income. A REIT’s profits are not taxed at the corporate level to the extent that these profits are distributed as dividends to stockholders. This provides an operating cost savings, as most profits are not taxed at the entity level. On the other hand, the requirement to pay out as dividends most of the REIT profits means it can be harder for a REIT to grow if using only internally-generated funds (as opposed to issuing new stock).
REDWOOD DEBT
Redwood debt is all the debt that is an obligation of Redwood, with the exception of junior subordinated notes that we treat as part of our capital base. We obtain this debt from a variety of Wall Street firms, banks, and other institutions. As another form of Redwood debt, we issue collateralized commercial paper.
REIT RETAINED TAXABLE INCOME
REIT retained taxable income is not a measure calculated in accordance with GAAP. REIT retained taxable income is the taxable income earned at the REIT after dividend distributions to our shareholders, less corporate income taxes and excise taxes paid at the REIT level. A reconciliation of REIT retained taxable income to GAAP income appears in Table 3 in the Appendix.
REIT SUBSIDIARY
A REIT subsidiary is a subsidiary of a REIT that is taxed as a REIT.
REIT TAXABLE INCOME
REIT taxable income is not a measure calculated in accordance with GAAP. REIT taxable income is pre-tax income calculated for tax purposes at Redwood including only its qualified REIT subsidiaries (excluding its taxable subsidiaries). REIT taxable income is an important measure as it is the basis of our dividend distributions to shareholders. We must distribute at least 90% of REIT taxable income as dividends to shareholders over time. As a REIT, we are not subject to corporate income taxes on the REIT taxable income we distribute. We pay income tax on the REIT taxable income we retain (up to 10% of total REIT taxable income). A reconciliation of REIT taxable income to GAAP income appears in Table 3 in the Appendix.
RESIDUALS
Residuals are first-loss securities that are not rated by a rating agency. Residuals are called such because they get the last (or residual) claim on the cash flow from a securitization after ABS debt interest expense, losses, and servicing have been deducted from the interest paid by the underlying mortgage loans. The value of residual securities can vary greatly and is highly dependent on prepayment speeds. The value is also dependent on the level and timing of credit losses, but often is not as sensitive to losses as it is to prepayment speeds. These securities perform poorly when prepayments are fast and losses are higher than expected.
The Redwood Review 2nd Quarter 2007 | | 75 |
RETURN ON EQUITY (ROE) AND ADJUSTED RETURN ON EQUITY
ROE is the amount of profit we generate each year per dollar of equity capital and equals GAAP income divided by GAAP equity. Adjusted ROE is GAAP income divided by core equity. Core equity excludes balance sheet mark-to-market adjustments. Thus, only those asset market value changes that are included in our income statement will affect adjusted ROE. A reconciliation of ROE to adjusted ROE appears in Table 8 in the Appendix.
SEQUOIA
Sequoia is the brand name for most of the securitizations of residential real estate loans we have sponsored.
SUBPRIME SECURITIES
Subprime securities are residential mortgage-backed securities backed by loans to borrowers who have impaired credit histories, but who appear to exhibit the ability to repay the current loan. Typically, these borrowers have lower credit scores and/or other credit deficiencies that prevent them from qualifying for prime or alt-a mortgages and may have experienced credit problems in the past, such as late payments or bankruptcies.. To compensate for the greater risks and higher costs to service the loans, subprime borrowers pay higher interest rates, points, and origination fees.
Typical characteristics of subprime loan pools include more than 60% of loans with FICO scores below 680; weighted average LTV over 85%; more than 70% of loans with LTV over 75%; loans with LTV over 80% with no mortgage insurance.
TAXABLE SUBSIDIARY
A taxable subsidiary is a subsidiary of a REIT that is not taxed as a REIT and thus pays taxes on its income. A taxable subsidiary is not limited to investing in real estate and it can choose to retain all of its after-tax profits.
TOTAL RETAINED TAXABLE INCOME
Total retained taxable income is not a measure calculated in accordance with GAAP. Total retained taxable income is the taxable income earned at the REIT after dividend distributions to shareholders, plus all of the taxable income earned at our taxable subsidiaries, less corporate income taxes and excise taxes paid. A reconciliation of total retained taxable income to GAAP income appears in Table 3 in the Appendix.
TOTAL TAXABLE INCOME
Total taxable income is not a measure calculated in accordance with GAAP. Total taxable income is pre-tax income for Redwood and all its subsidiaries as calculated for tax purposes. Taxable income calculations differ significantly from GAAP income calculations. The remainder of our total taxable income is income we earn in taxable subsidiaries. We pay income tax on this income and we generally retain the after-tax income at the subsidiary level. A reconciliation of total taxable income to GAAP income appears in Table 3 in the Appendix.
76 | | The Redwood Review 2nd Quarter 2007 |
|
| | |
Financial Tables 2nd Quarter 2007 |
|
Page Intentionally Left Blank
78 | | The Redwood Review 2nd Quarter 2007 |
|
| | | | | | | | | | | Six Months | Six Months |
| | Q2:2007 | Q1:2007 | Q4:2006 | Q3:2006 | Q2:2006 | Q1:2006 | Q4:2005 | Q3:2005 | Q2:2005 | 2007 | 2006 |
| | | | | | | | | | | | |
| Interest income | $208,039 | $207,906 | $213,504 | $217,504 | $214,544 | $224,795 | $234,531 | $246,810 | $248,786 | $415,945 | $439,339 |
| Net securities discount amortization income | 23,849 | 20,268 | 18,665 | 17,842 | 13,234 | 13,245 | 10,971 | 11,523 | 8,049 | 44,117 | 26,479 |
| Other real estate investment interest income | 669 | 2,465 | - | - | - | - | - | - | - | 3,134 | - |
| Non real estate investment interest income | 464 | - | - | - | - | - | - | - | - | 464 | - |
| Net loan premium amortization expense | (10,863) | (11,705) | (13,272) | (11,232) | (12,046) | (11,982) | (13,486) | (14,507) | (9,857) | (22,568) | (24,028) |
| (Provision for) reversal of credit reserve | (2,500) | (3,829) | (1,506) | (465) | 2,506 | (176) | (877) | 805 | 1,527 | (6,329) | 2,330 |
| Total GAAP interest income | 219,658 | 215,105 | 217,391 | 223,649 | 218,238 | 225,882 | 231,139 | 244,631 | 248,505 | 434,763 | 444,120 |
| | | | | | | | | | | | |
| Interest expense on Redwood debt | (22,700) | (31,094) | (16,520) | (9,422) | (1,822) | (2,072) | (3,521) | (3,789) | (1,789) | (53,794) | (3,894) |
| | | | | | | | | | | | |
| ABS interest expense consolidated from trusts | (140,512) | (131,391) | (152,043) | (165,177) | (171,659) | (178,183) | (186,433) | (190,996) | (191,966) | (271,903) | (349,842) |
| ABS issuance expense amortization | (5,681) | (7,068) | (7,897) | (5,786) | (6,079) | (5,907) | (6,069) | (5,162) | (5,386) | (12,749) | (11,986) |
| ABS interest rate agreement income | 3,358 | 1,646 | 2,497 | 3,317 | 3,678 | 2,980 | 3,573 | 623 | 876 | 5,004 | 6,658 |
| ABS issuance premium amortization income | 2,294 | 1,869 | 1,529 | 2,395 | 2,363 | 2,527 | 2,793 | 2,733 | 3,140 | 4,163 | 4,890 |
| Total consolidated ABS expense | (140,541) | (134,944) | (155,914) | (165,251) | (171,697) | (178,583) | (186,136) | (192,802) | (193,336) | (275,485) | (350,280) |
| | | | | | | | | | | | |
| Subordinated notes interest expense | (2,516) | (2,057) | (423) | - | - | - | - | - | - | (4,573) | - |
| | | | | | | | | | | | |
| GAAP net interest income | 53,901 | 47,010 | 44,534 | 48,976 | 44,719 | 45,227 | 41,481 | 48,040 | 53,380 | 100,911 | 89,946 |
| | | | | | | | | | | | |
| Fixed compensation expense | (4,286) | (4,616) | (3,688) | (3,437) | (3,310) | (3,437) | (2,879) | (2,802) | (2,623) | (8,902) | (6,747) |
| Variable compensation expense | (198) | (2,251) | (1,666) | (2,630) | (1,900) | (1,514) | (2,110) | (1,980) | (2,420) | (2,449) | (3,414) |
| Equity compensation expense | (3,540) | (3,349) | (3,233) | (2,579) | (2,991) | (2,694) | (2,793) | (2,145) | (2,657) | (6,889) | (5,685) |
| Severance expense | - | (2,380) | - | - | - | - | - | - | - | (2,380) | - |
| Other operating expense | (4,670) | (4,479) | (4,732) | (4,425) | (5,149) | (4,505) | (4,685) | (4,362) | (3,639) | (9,149) | (9,654) |
| Due diligence expenses | (78) | (707) | (532) | (384) | (2,687) | (432) | (298) | (1,075) | (117) | (785) | (3,119) |
| Total GAAP operating expenses | (12,772) | (17,782) | (13,851) | (13,455) | (16,037) | (12,582) | (12,765) | (12,364) | (11,456) | (30,554) | (28,619) |
| | | | | | | | | | | | |
| Realized gains on sales | 1,428 | 303 | 5,308 | 4,968 | 8,241 | 1,062 | 14,815 | 23,053 | 516 | 1,731 | 9,303 |
| Realized gains on calls | 1,310 | 843 | 1,511 | 722 | 747 | - | 4,265 | 2,914 | 4,421 | 2,153 | 747 |
| Unrealized market valuation adjustments | (29,430) | (10,264) | (1,404) | (5,257) | (2,995) | (2,932) | (1,205) | (1,051) | (1,892) | (39,694) | (5,927) |
| Net gains and valuation adjustments | (26,692) | (9,118) | 5,415 | 433 | 5,993 | (1,870) | 17,875 | 24,916 | 3,045 | (35,810) | 4,123 |
| | | | | | | | | | | | |
| Provision for income taxes | (3,021) | (1,801) | (407) | (3,538) | (3,265) | (2,760) | (4,097) | (4,693) | (4,054) | (4,822) | (6,025) |
| GAAP net income | $11,416 | $18,309 | $35,691 | $32,416 | $31,410 | $28,015 | $42,495 | $55,899 | $40,915 | $29,725 | $59,425 |
| | | | | | | | | | | | |
| Diluted average shares | 28,165 | 27,684 | 27,122 | 26,625 | 26,109 | 25,703 | 25,311 | 25,314 | 25,196 | 27,918 | 25,910 |
| GAAP earnings per share | $0.41 | $0.66 | $1.32 | $1.22 | $1.20 | $1.09 | $1.68 | $2.21 | $1.62 | $1.06 | $2.29 |
The Redwood Review 2nd Quarter | Appendix Table 1 - GAAP Earnings | 79 |
|
| | | | | | | | | | | Six Months | Six Months |
| | Q2:2007 | Q1:2007 | Q4:2006 | Q3:2006 | Q2:2006 | Q1:2006 | Q4:2005 | Q3:2005 | Q2:2005 | 2007 | 2006 |
| | | | | | | | | | | | |
| GAAP net income | $11,416 | $18,309 | $35,691 | $32,416 | $31,410 | $28,015 | $42,495 | $55,899 | $40,915 | $29,725 | $59,425 |
GAAP income items not included in core earnings | | | | | | | | | | | |
| Severance expense | - | (2,380) | - | - | - | - | - | - | - | (2,380) | - |
| Realized gains on sales | 1,428 | 303 | 5,308 | 4,968 | 8,241 | 1,062 | 14,815 | 23,053 | 516 | 1,731 | 9,303 |
| Realized gains on calls | 1,310 | 843 | 1,511 | 722 | 747 | - | 4,265 | 2,914 | 4,421 | 2,153 | 747 |
| Unrealized market valuation adjustments | (29,430) | (10,264) | (1,404) | (5,257) | (2,995) | (2,932) | (1,205) | (1,051) | (1,892) | (39,694) | (5,927) |
| Variable stock option market value change | - | - | - | - | - | - | 25 | 16 | (2) | - | - |
| Total GAAP / core earnings differences | (26,692) | (11,498) | 5,415 | 433 | 5,993 | (1,870) | 17,900 | 24,932 | 3,043 | (38,190) | 4,123 |
| | | | | | | | | | | | |
| Core earnings | $38,108 | $29,807 | $30,276 | $31,983 | $25,417 | $29,885 | $24,594 | $30,967 | $37,872 | $67,915 | $55,302 |
Per share analysis | | | | | | | | | | | |
| GAAP earnings per share | $0.41 | $0.66 | $1.32 | $1.22 | $1.20 | $1.09 | $1.68 | $2.21 | $1.62 | $1.06 | $2.29 |
GAAP income items not included in core earnings | | | | | | | | | | | |
| Severance expense | - | (0.09) | - | - | - | - | - | - | - | (0.09) | - |
| Realized gains on sales | 0.05 | 0.01 | 0.20 | 0.19 | 0.32 | 0.04 | 0.59 | 0.91 | 0.02 | 0.06 | 0.36 |
| Realized gains on calls | 0.05 | 0.03 | 0.05 | 0.03 | 0.03 | - | 0.17 | 0.12 | 0.18 | 0.08 | 0.03 |
| Valuation adjustments | (1.04) | (0.37) | (0.05) | (0.20) | (0.11) | (0.11) | (0.05) | (0.04) | (0.08) | (1.42) | (0.23) |
| Variable stock option market value change | - | - | - | - | - | - | - | - | - | - | - |
| GAAP / Core earnings differences per share | (0.94) | (0.42) | 0.20 | 0.02 | 0.23 | (0.07) | 0.71 | 0.98 | 0.12 | (1.37) | 0.16 |
| | | | | | | | | | | | |
| Core earnings per share | $1.35 | $1.08 | $1.12 | $1.20 | $0.97 | $1.16 | $0.97 | $1.22 | $1.50 | $2.43 | $2.13 |
| | | | | | | | | | | | |
The Redwood Review 2nd Quarter | Appendix Table 2 - Core Earnings | 80 |
|
| | | | | Estimated | Estimated |
| | Estimated | | | Six Months | Six Months |
| | Q2:2007 | Q1:2007 | Q4:2006 | Q3:2006 | Q2:2006 | Q1:2006 | Q4:2005 | Q3:2005 | Q2:2005 | 2007 | 2006 |
| | | | | | | | | | | | |
| GAAP net income | $11,416 | $18,309 | $35,691 | $32,416 | $31,410 | $28,015 | $42,495 | $55,899 | $40,915 | $29,725 | $59,425 |
Difference in Taxable Income Calculations | | | | | | | | | | | |
| Amortization and credit losses (net interest income) | 10,298 | 10,417 | 12,794 | 12,558 | 12,779 | 4,939 | (1,314) | 202 | (7,079) | 20,715 | 17,718 |
| Operating expense differences | (2,921) | (1,713) | (12,090) | 2,545 | (288) | 1,604 | 396 | 576 | 2,438 | (4,634) | 1,316 |
| Realized gains on calls and sales | (4,735) | 2,100 | (5,073) | (1,141) | (699) | (613) | (5,959) | (8,582) | 823 | (2,635) | (1,312) |
| Unrealized market valuation adjustments | 30,576 | 9,118 | 6,571 | 484 | 2,305 | 3,226 | 1,772 | 2,048 | 820 | 39,694 | 5,531 |
| Income tax provisions | 1,662 | 1,800 | 405 | 4,123 | 3,265 | (703) | 4,096 | 5,013 | 3,035 | 3,462 | 2,562 |
| Total differences in GAAP / Tax income | 34,880 | 21,722 | 2,607 | 18,569 | 17,362 | 8,453 | (1,009) | (743) | 37 | 56,602 | 25,815 |
| | | | | | | | | | | | |
| Taxable Income | $46,296 | $40,031 | $38,298 | $50,985 | $48,772 | $36,468 | $41,486 | $55,156 | $40,952 | $86,327 | $85,240 |
| | | | | | | | | | | | |
| | | | | | | | | | | | |
| | | | | | | | | | | | |
| REIT taxable income | $45,233 | $35,112 | $40,829 | $45,751 | $45,040 | $35,382 | $39,793 | $47,118 | $39,237 | $80,345 | $80,422 |
| Taxable income in taxable subsidiaries | 1,063 | 4,919 | (2,531) | 5,234 | 3,732 | 1,086 | 1,694 | 8,038 | 1,715 | 5,982 | 4,818 |
| Total taxable income | $46,296 | $40,031 | $38,298 | $50,985 | $48,772 | $36,468 | $41,487 | $55,156 | $40,952 | $86,327 | $85,240 |
| | | | | | | | | | | | |
| Retained REIT taxable income (after-tax) | $2,490 | $1,933 | $673 | $2,500 | $2,166 | $1,313 | $1,895 | $1,164 | $1,798 | $4,423 | $3,479 |
| Retained taxable income in taxable subsidiaries (after-tax) | 677 | 3,133 | (953) | 3,156 | 2,032 | 556 | 1,238 | 4,386 | 845 | 3,811 | 2,588 |
| Total retained taxable income (after-tax) | $3,167 | $5,066 | ($280) | $5,656 | $4,198 | $1,869 | $3,133 | $5,550 | $2,643 | $8,234 | $6,067 |
| | | | | | | | | | | | |
| Shares used for taxable EPS calculation | 27,816 | 27,129 | 26,733 | 26,053 | 25,668 | 25,382 | 25,133 | 24,764 | 24,647 | 27,816 | 25,668 |
| | | | | | | | | | | | |
| REIT taxable income per share | $1.63 | $1.29 | $1.53 | $1.76 | $1.75 | $1.39 | $1.58 | $1.90 | $1.59 | $2.92 | $3.14 |
| Taxable income in taxable subsidiaries per share | $0.03 | $0.19 | ($0.11) | $0.20 | $0.16 | $0.04 | $0.07 | $0.32 | $0.07 | $0.22 | $0.20 |
| Total taxable income per share | $1.66 | $1.48 | $1.42 | $1.96 | $1.91 | $1.44 | $1.65 | $2.23 | $1.66 | $3.14 | $3.35 |
| | | | | | | | | | | | |
| Total retained taxable income (after-tax) | $0.11 | $0.19 | ($0.01) | $0.22 | $0.16 | $0.07 | $0.12 | $0.22 | $0.11 | $0.30 | $0.23 |
| | | | | | | | | | | | |
The Redwood Review 2nd Quarter | Appendix Table 3 - Table Taxable Income and GAAP/Tax Differences | 81 |
|
| | | | | | | | | | | Estimated | Estimated |
| | Estimated | Estimated | Actual | Six Months | Six Months |
| | Q2:2007 | Q1:2007 | Q4:2006 | Q3:2006 | Q2:2006 | Q1:2006 | Q4:2005 | Q3:2005 | Q2:2005 | 2007 | 2006 |
| | | | | | | | | | | | |
| Dividends declared | $20,862 | $20,347 | $97,665 | $18,237 | $17,967 | $17,767 | $92,150 | $17,335 | $17,253 | $41,209 | $35,734 |
| Dividend deduction on stock issued through DRIP | 933 | 660 | 812 | 177 | 239 | 176 | 263 | 128 | 112 | 1,593 | 415 |
| Total dividend deductions | $21,795 | $21,007 | $98,477 | $18,414 | $18,206 | $17,943 | $92,413 | $17,463 | $17,365 | $42,802 | $36,149 |
| | | | | | | | | | | | |
| Regular dividend per share | $0.75 | $0.75 | $0.70 | $0.70 | $0.70 | $0.70 | $0.70 | $0.70 | $0.70 | $1.50 | $1.40 |
| Special dividend per share | - | - | 3.00 | - | - | - | 3.00 | - | - | - | - |
| Total dividends per share | $0.75 | $0.75 | $3.70 | $0.70 | $0.70 | $0.70 | $3.70 | $0.70 | $0.70 | $1.50 | $1.40 |
| | | | | | | | | | | | |
| Undistributed REIT taxable income at beginning of period (pre-tax): | $60,490 | $49,721 | $111,248 | $88,257 | $65,687 | $51,568 | $106,719 | $80,166 | $62,218 | $49,721 | $51,568 |
| REIT taxable income (pre-tax) | 45,233 | 35,112 | 40,829 | 45,751 | 45,040 | 35,382 | 39,793 | 47,118 | 39,237 | 80,345 | 80,422 |
| Permanently retained (pre-tax) | (4,297) | (3,336) | (3,879) | (4,346) | (4,263) | (3,320) | (2,531) | (3,102) | (3,924) | (7,633) | (7,583) |
| Dividend of 2004 income | - | - | - | - | - | - | - | (2,710) | (17,365) | - | - |
| Dividend of 2005 income | - | - | - | (15,418) | (18,207) | (17,943) | (92,413) | (14,753) | - | - | (36,150) |
| Dividend of 2006 income | (21,795) | (21,007) | (98,477) | (2,996) | - | - | - | - | - | (42,802) | - |
| Dividend of 2007 income | - | - | - | - | - | - | - | - | - | - | - |
Undistributed REIT taxable income at period end (pre-tax): | $79,631 | $60,490 | $49,721 | $111,248 | $88,257 | $65,687 | $51,568 | $106,719 | $80,166 | $79,631 | $88,257 |
| | | | | | | | | | | | |
| Undistributed REIT taxable income (pre-tax) at period end | | | | | | | | | | | |
| From 2004's income | $- | $- | $- | $- | $- | $- | $- | $- | $2,710 | $- | $- |
| From 2005's income | - | - | - | - | 15,418 | 33,625 | 51,568 | 106,719 | 77,456 | - | 15,418 |
| From 2006's income | 6,919 | 28,714 | 49,721 | 111,248 | 72,839 | 32,062 | - | - | - | 6,919 | 72,839 |
| From 2007's income | 72,712 | 31,776 | - | - | - | - | - | - | - | 72,712 | - |
Total | $79,631 | $60,490 | $49,721 | $111,248 | $88,257 | $65,687 | $51,568 | $106,719 | $80,166 | $79,631 | $88,257 |
| | | | | | | | | | | | |
| Shares outstanding at period end | 27,816 | 27,129 | 26,733 | 26,053 | 25,668 | 25,382 | 25,133 | 24,764 | 24,647 | 27,816 | 25,668 |
| Undistributed REIT taxable income (pre-tax) | | | | | | | | | | | |
| per share outstanding at period end | $2.86 | $2.23 | $1.86 | $4.27 | $3.44 | $2.59 | $2.04 | $4.31 | $3.25 | $2.86 | $3.44 |
The Redwood Review 2nd Quarter | Appendix Table 4 - Retention and Distribution of Taxable Income | 82 |
|
| | | | | | | | | | |
| | Q2:2007 | Q1:2007 | Q4:2006 | Q3:2006 | Q2:2006 | Q1:2006 | Q4:2005 | Q3:2005 | Q2:2005 |
| Residential CES owned by Redwood | $259 | $256 | $230 | $291 | $403 | $303 | $309 | $338 | $469 |
| Residential CES consolidated from Acacia | 486 | 496 | 492 | 424 | 274 | 292 | 284 | 305 | 215 |
| Total GAAP residential CES | $745 | $752 | $722 | $715 | $677 | $595 | $593 | $643 | $684 |
| | | | | | | | | | |
| Residential loans owned by Redwood | $878 | $1,256 | $1,339 | $520 | $351 | $87 | $45 | $17 | $300 |
| Residential loans consolidated from Sequoia | 7,473 | 7,424 | 7,985 | 9,323 | 10,102 | 11,903 | 13,830 | 16,539 | 19,330 |
| Total GAAP residential loans | $8,351 | $8,680 | $9,324 | $9,843 | $10,453 | $11,990 | $13,875 | $16,556 | $19,630 |
| | | | | | | | | | |
| Residential IGS owned by Redwood | $204 | $106 | $318 | $105 | $206 | $42 | $151 | $139 | $140 |
| Residential IGS consolidated from Acacia | 1,958 | 1,920 | 1,379 | 1,369 | 1,184 | 1,305 | 1,109 | 1,140 | 1,053 |
| Total GAAP residential IGS | $2,162 | $2,026 | $1,697 | $1,474 | $1,390 | $1,347 | $1,260 | $1,279 | $1,193 |
| | | | | | | | | | |
| Commercial CES owned by Redwood | $180 | $189 | $224 | $156 | $93 | $68 | $59 | $98 | $79 |
| Commercial CES consolidated from Acacia | 271 | 246 | 224 | 224 | 178 | 156 | 160 | 89 | 59 |
| Total GAAP commercial CES | $451 | $435 | $448 | $380 | $271 | $224 | $219 | $187 | $138 |
| | | | | | | | | | |
| Commercial loans owned by Redwood | $0 | $0 | $2 | $2 | $2 | $2 | $7 | $21 | $16 |
| Commercial loans consolidated from securitization | 26 | 26 | 26 | 30 | 36 | 53 | 53 | 35 | 26 |
| Total GAAP commercial loans | $26 | $26 | $28 | $32 | $38 | $55 | $60 | $56 | $42 |
| | | | | | | | | | |
| Commercial IGS owned by Redwood | $6 | $9 | $0 | $0 | $1 | $3 | $6 | $23 | $10 |
| Commercial IGS consolidated from Acacia | 105 | 107 | 120 | 135 | 130 | 182 | 179 | 200 | 208 |
| Total GAAP commercial IGS | $111 | $116 | $120 | $135 | $131 | $185 | $185 | $223 | $218 |
| | | | | | | | | | |
| CDO CES owned by Redwood | $8 | $4 | $9 | $10 | $5 | $5 | $5 | $12 | $2 |
| CDO CES consolidated from Acacia | 13 | 12 | 13 | 13 | 10 | 9 | 7 | - | - |
| Total GAAP CDO CES | $21 | $16 | $22 | $23 | $15 | $14 | $12 | $12 | $2 |
| | | | | | | | | | |
| CDO IGS owned by Redwood | $16 | $20 | $14 | $2 | $17 | $4 | $6 | $5 | $6 |
| CDO IGS consolidated from Acacia | 219 | 234 | 210 | 183 | 160 | 160 | 145 | 141 | 143 |
| Total GAAP CDO IGS | $235 | $254 | $224 | $185 | $177 | $164 | $151 | $146 | $149 |
| | | | | | | | | | |
| Other real estate investments owned by Redwood | $32 | $47 | $0 | $0 | $0 | $0 | $0 | $0 | $0 |
| Other real estate investments consolidated from Acacia | 2 | 3 | - | - | - | - | - | - | - |
| Total other real estate investments | $34 | $50 | $0 | $0 | $0 | $0 | $0 | $0 | $0 |
| | | | | | | | | | |
| Non-real estate investments owned by Redwood | $0 | $0 | $0 | $0 | $0 | $0 | $0 | $0 | $0 |
| Non-real estate investments consolidated from Acacia | 80 | - | - | - | - | - | - | - | - |
| Total non-real estate investments | $80 | $0 | $0 | $0 | $0 | $0 | $0 | $0 | $0 |
| | | | | | | | | | |
| Cash owned by Redwood | $83 | $92 | $168 | $113 | $106 | $85 | $176 | $163 | $72 |
| Restricted cash consolidated from entities | 207 | 340 | 112 | 139 | 86 | 131 | 72 | 59 | 48 |
| Accrued interest receivable | 57 | 65 | 71 | 67 | 67 | 73 | 76 | 80 | 85 |
| Principal receivable | 4 | 7 | 4 | 1 | 1 | 2 | - | 2 | - |
| Derivative assets | 41 | 18 | 27 | 30 | 54 | 48 | 31 | 25 | 13 |
| Deferred tax asset | 5 | 6 | 5 | 3 | 5 | 5 | 5 | 8 | 7 |
| Deferred asset-backed security issuance costs | 49 | 41 | 42 | 47 | 46 | 52 | 54 | 56 | 59 |
| Other assets | 19 | 23 | 16 | 13 | 13 | 10 | 8 | 10 | 6 |
| Total GAAP assets | $12,681 | $12,947 | $13,030 | $13,200 | $13,530 | $14,979 | $16,777 | $19,505 | $22,346 |
| | | | | | | | | | |
| Residential CES owned by Redwood | $259 | $256 | $230 | $291 | $403 | $303 | $309 | $338 | $469 |
| Residential loans owned by Redwood | 878 | 1,256 | 1,339 | 520 | 351 | 87 | 45 | 17 | 300 |
| Residential IGS owned by Redwood | 204 | 106 | 318 | 105 | 206 | 42 | 151 | 139 | 140 |
| Commercial CES owned by Redwood | 180 | 189 | 224 | 156 | 93 | 68 | 59 | 98 | 79 |
| Commercial loans owned by Redwood | - | - | 2 | 2 | 2 | 2 | 7 | 21 | 16 |
| Commercial IGS owned by Redwood | 6 | 9 | - | - | 1 | 3 | 6 | 23 | 10 |
| CDO CES owned by Redwood | 8 | 4 | 9 | 10 | 5 | 5 | 5 | 12 | 2 |
| CDO IGS owned by Redwood | 16 | 20 | 14 | 2 | 17 | 4 | 6 | 5 | 6 |
| Other real estate investments owned by Redwood | 32 | 47 | - | - | - | - | - | - | - |
| Cash owned by Redwood | 83 | 92 | 168 | 113 | 106 | 85 | 176 | 163 | 72 |
| Total assets owned by Redwood | 1,666 | 1,979 | 2,304 | 1,199 | 1,184 | 599 | 764 | 816 | 1,094 |
| Assets of securitizations for GAAP | 10,553 | 10,468 | 10,449 | 11,701 | 12,074 | 14,060 | 15,767 | 18,449 | 21,034 |
| ABS liabilities of entities for GAAP | (10,675) | (9,947) | (9,979) | (11,554) | (11,898) | (13,930) | (15,585) | (18,237) | (20,815) |
| Redwood earning assets - GAAP basis | $1,544 | $2,500 | $2,774 | $1,346 | $1,360 | $729 | $946 | $1,028 | $1,313 |
The Redwood Review 2nd Quarter | Appendix Table 5 - Assets | 83 |
| |
| | | | | | | | | | |
| | Q2:2007 | Q1:2007 | Q4:2006 | Q3:2006 | Q2:2006 | Q1:2006 | Q4:2005 | Q3:2005 | Q2:2005 |
| | | | | | | | | | |
| Redwood debt | $658 | $1,630 | $1,556 | $510 | $529 | $0 | $170 | $162 | $453 |
| Madrona commercial paper | 191 | 250 | 300 | - | - | - | - | - | - |
| Total Redwood debt | 849 | 1,880 | 1,856 | 510 | 529 | - | 170 | 162 | 453 |
| | | | | | | | | | |
| ABS issued, consolidated from entities | 10,630 | 9,890 | 9,907 | 11,466 | 11,775 | 13,788 | 15,422 | 18,049 | 20,598 |
| Unamortized IO issuance premium | 51 | 62 | 75 | 90 | 106 | 124 | 143 | 163 | 186 |
| Unamortized ABS issuance premium (discount) | (6) | (5) | (3) | (2) | 17 | 18 | 20 | 25 | 31 |
| ABS obligations of entities | 10,675 | 9,947 | 9,979 | 11,554 | 11,898 | 13,930 | 15,585 | 18,237 | 20,815 |
| | | | | | | | | | |
| Subordinated notes | 150 | 100 | 100 | - | - | - | - | - | - |
| | | | | | | | | | |
| Accrued interest payable | 48 | 52 | 50 | 51 | 47 | 43 | 41 | 42 | 43 |
| Interest rate agreements | 6 | 7 | 6 | 6 | 4 | 0 | 1 | 1 | 3 |
| Accrued expenses and other liabilities | 56 | 17 | 17 | 18 | 29 | 21 | 28 | 30 | 23 |
| Dividends payable | 21 | 20 | 19 | 18 | 18 | 18 | 17 | 17 | 17 |
| Total GAAP liabilities | 11,805 | 12,023 | 12,027 | 12,157 | 12,525 | 14,012 | 15,842 | 18,489 | 21,354 |
| | | | | | | | | | |
| | | | | | | | | | |
| Common stock and paid-in capital | 965 | 928 | 904 | 875 | 853.9 | 839 | 825 | 808 | 803 |
| Accumulated other comprehensive income | (81) | (6) | 93 | 95 | 91 | 82 | 74 | 117 | 137 |
| Cumulative GAAP earnings | 839 | 827 | 809 | 773 | 740.41 | 709 | 681 | 639 | 583 |
| Cumulative distributions to shareholders | (847) | (825) | (803) | (700) | (681) | (663) | (645) | (548) | (531) |
| GAAP stockholders' equity | 876 | 924 | 1,003 | 1,043 | 1,004 | 967 | 935 | 1,016 | 992 |
| | | | | | | | | | |
| Total GAAP liabilities and equity | $12,681 | $12,947 | $13,030 | $13,200 | $13,530 | $14,979 | $16,777 | $19,505 | $22,346 |
| | | | | | | | | | |
| Total Redwood debt | $849 | $1,880 | $1,856 | $510 | $529 | $0 | $170 | $162 | $453 |
| Subordinated notes | 150 | 100 | 100 | - | - | - | - | - | - |
| Redwood obligations | $999 | $1,980 | $1,956 | $510 | $529 | $0 | $170 | $162 | $453 |
| | | | | | | | | | |
| GAAP stockholders' equity | $876 | $924 | $1,003 | $1,043 | $1,004 | $967 | $935 | $1,016 | $992 |
| | | | | | | | | | |
| Redwood obligations to equity | 1.1 | 2.1 | 2.0 | 0.5 | 0.5 | - | 0.2 | 0.2 | 0.5 |
| Redwood obligations to (equity + Redwood obligations) | 53% | 68% | 66% | 33% | 35% | 0% | 15% | 14% | 31% |
| | | | | | | | | | |
| Redwood obligations | $999 | $1,980 | $1,956 | $510 | $529 | $0 | $170 | $162 | $453 |
| ABS obligations of consolidated entities | 10,675 | 9,947 | 9,979 | 11,554 | 11,898 | 13,930 | 15,585 | 18,237 | 20,815 |
| GAAP debt | $11,674 | $11,927 | $11,935 | $12,064 | $12,427 | $13,930 | $15,755 | $18,399 | $21,268 |
| | | | | | | | | | |
| GAAP debt to equity | 13.3 | 12.9 | 11.9 | 11.6 | 12.4 | 14.4 | 16.9 | 18.1 | 21.4 |
| GAAP debt to (equity + GAAP debt) | 93% | 93% | 92% | 92% | 93% | 94% | 94% | 95% | 96% |
| | | | | | | | | | |
The Redwood Review 2nd Quarter | Appendix Table 6 - Liabilities and Equity | 84 |
| |
| | | | | | | | | | | Six Months | Six Months |
| | Q2:2007 | Q1:2007 | Q4:2006 | Q3:2006 | Q2:2006 | Q1:2006 | Q4:2005 | Q3:2005 | Q2:2005 | 2007 | 2006 |
| | | | | | | | | | | | |
| GAAP stockholders' equity | $876,084 | $924,040 | $1,002,690 | $1,042,661 | $1,004,265 | $967,333 | $934,960 | $1,016,065 | $991,757 | $876,084 | $1,004,265 |
| Balance sheet mark-to-market adjustments | (80,913) | (6,183) | 93,158 | 94,780 | 90,937 | 81,591 | 73,731 | 117,043 | 137,380 | (80,913) | 90,937 |
| Core equity | $956,997 | $930,223 | $909,532 | $947,881 | $913,328 | $885,742 | $861,229 | $899,022 | $854,377 | $956,997 | $913,328 |
| | | | | | | | | | | | |
| Shares outstanding at quarter end | 27,816 | 27,129 | 26,733 | 26,053 | 25,668 | 25,382 | 25,133 | 24,764 | 24,647 | 27,816 | 25,668 |
| | | | | | | | | | | | |
| GAAP equity per share | $31.50 | $34.06 | $37.51 | $40.02 | $39.13 | $38.11 | $37.20 | $41.03 | $40.24 | 31.50 | $39.13 |
| Core equity per share | $34.40 | $34.29 | $34.02 | $36.38 | $35.58 | $34.90 | $34.27 | $36.30 | $34.66 | 34.40 | $35.58 |
| | | | | | | | | | | | |
| Net interest income | $53,901 | $47,010 | $44,534 | $48,976 | $44,719 | $45,227 | $41,481 | $48,040 | $53,380 | $100,911 | $89,946 |
| Net interest income / average core equity | 22.66% | 20.33% | 19.28% | 21.02% | 19.91% | 20.62% | 18.85% | 21.82% | 25.42% | 21.51% | 20.26% |
| | | | | | | | | | | | |
| Operating expenses (excluding severance expense) | $12,772 | $15,402 | $13,851 | $13,455 | $16,037 | $12,582 | $12,765 | $12,364 | $11,456 | $28,174 | $28,619 |
| | | | | | | | | | | | |
| Average total assets | $12,688,468 | $12,865,979 | $13,041,794 | $13,480,361 | $14,168,755 | $15,839,483 | $18,348,681 | $20,991,299 | $23,365,553 | $12,779,089 | $14,999,505 |
| Average total equity | $946,454 | $1,008,688 | $1,008,863 | $1,011,609 | $980,402 | $952,230 | $999,313 | $1,014,329 | $970,344 | $977,068 | $966,394 |
| | | | | | | | | | | | |
| Operating expenses / net interest income | 23.70% | 32.76% | 31.10% | 27.47% | 35.86% | 27.82% | 30.77% | 25.74% | 21.46% | 27.92% | 31.82% |
| Operating expenses / average total assets | 0.40% | 0.48% | 0.42% | 0.40% | 0.45% | 0.32% | 0.28% | 0.24% | 0.20% | 0.44% | 0.38% |
| Operating expenses / average total equity | 5.40% | 6.11% | 5.49% | 5.32% | 6.54% | 5.29% | 5.11% | 4.88% | 4.72% | 5.77% | 5.92% |
| | | | | | | | | | | | |
| GAAP net income | $11,416 | $18,309 | $35,691 | $32,416 | $31,410 | $28,015 | $42,495 | $55,899 | $40,915 | $29,725 | $59,425 |
| GAAP net income / average total assets | 0.36% | 0.57% | 1.09% | 0.96% | 0.89% | 0.71% | 0.93% | 1.07% | 0.70% | 0.47% | 0.79% |
| GAAP net income / average equity (GAAP ROE) | 4.82% | 7.26% | 14.15% | 12.44% | 12.51% | 11.58% | 18.18% | 22.01% | 16.50% | 6.08% | 12.30% |
| GAAP net income / average core equity (adjusted ROE) | 4.80% | 7.92% | 15.45% | 13.91% | 13.98% | 12.77% | 19.31% | 25.39% | 19.48% | 6.34% | 13.39% |
| | | | | | | | | | | | |
| Core earnings | $38,108 | $29,807 | $30,276 | $31,983 | $25,417 | $29,885 | $24,594 | $30,967 | $37,872 | $67,915 | $55,302 |
| Average core equity | $951,378 | $925,128 | $923,856 | $932,030 | $898,409 | $877,212 | $880,329 | $880,482 | $840,098 | $938,212 | $887,870 |
| Core earnings / average core equity (core ROE) | 16.02% | 12.89% | 13.11% | 13.73% | 11.32% | 13.63% | 11.18% | 14.07% | 18.03% | 14.48% | 12.46% |
| | | | | | | | | | | | |
| Interest income | $219,658 | $215,105 | $217,391 | $223,649 | $218,238 | $225,882 | $231,139 | $244,631 | $248,505 | $434,763 | $444,120 |
| Average consolidated earning assets | $12,301,562 | $12,279,814 | $12,498,889 | $12,860,488 | $13,581,710 | $15,229,790 | $17,542,352 | $20,085,392 | $22,606,037 | $12,291,559 | $14,401,199 |
| Asset yield | 7.14% | 7.01% | 6.96% | 6.96% | 6.43% | 5.93% | 5.27% | 4.87% | 4.40% | 7.07% | 6.17% |
| | | | | | | | | | | | |
| Interest expense | ($165,757) | ($168,095) | ($172,434) | ($174,673) | ($173,519) | ($180,655) | ($189,657) | ($196,591) | ($195,125) | ($333,852) | ($354,174) |
| Average consolidated interest-bearing liabilities | $11,580,196 | $11,623,627 | $11,836,717 | $12,332,390 | $13,055,417 | $14,800,315 | $17,194,545 | $19,840,201 | $22,283,915 | $11,603,779 | $13,923,046 |
| Cost of funds | 5.73% | 5.78% | 5.83% | 5.67% | 5.32% | 4.88% | 4.41% | 3.96% | 3.50% | 5.75% | 5.09% |
| | | | | | | | | | | | |
| Asset yield | 7.14% | 7.01% | 6.96% | 6.96% | 6.43% | 5.93% | 5.27% | 4.87% | 4.40% | 7.07% | 6.17% |
| Cost of funds | -5.73% | -5.78% | -5.84% | -5.67% | -5.32% | -4.88% | -4.41% | -3.96% | -3.50% | -5.75% | -5.09% |
| Interest rate spread | 1.42% | 1.22% | 1.12% | 1.29% | 1.11% | 1.05% | 0.86% | 0.91% | 0.89% | 1.32% | 1.08% |
| | | | | | | | | | | | |
| Net interest income | $53,901 | $47,010 | $44,534 | $48,976 | $44,719 | $45,227 | $41,481 | $48,040 | $53,380 | $100,911 | $89,946 |
| Average consolidated earning assets | $12,301,562 | $12,279,814 | $12,498,889 | $12,860,488 | $13,581,710 | $15,229,790 | $17,542,352 | $20,085,392 | $22,606,037 | $12,291,559 | $14,401,199 |
| Net interest margin | 1.75% | 1.53% | 1.43% | 1.52% | 1.32% | 1.19% | 0.95% | 0.96% | 0.94% | 1.64% | 1.25% |
| | | | | | | | | | | | |
The Redwood Review 2nd Quarter | Appendix Table 7 - Book Value and Profitability Ratios | 85 |
| |
| | | | | | | | | | | Six Months | Six Months |
| | Q2:2007 | Q1:2007 | Q4:2006 | Q3:2006 | Q2:2006 | Q1:2006 | Q4:2005 | Q3:2005 | Q2:2005 | 2007 | 2006 |
Average GAAP balances | | | | | | | | | | | |
| Residential CES | $695,709 | $673,114 | $654,909 | $641,694 | $573,253 | $516,962 | $517,138 | $567,689 | $531,456 | $684,474 | $545,108 |
| Residential loans | 8,232,476 | 8,704,147 | 9,212,346 | 9,947,068 | 10,789,275 | 12,542,519 | 14,821,587 | 17,597,906 | 20,312,485 | 8,467,009 | 11,661,054 |
| Residential IGS | 2,119,280 | 1,795,130 | 1,513,794 | 1,404,281 | 1,358,453 | 1,299,933 | 1,263,277 | 1,219,034 | 1,122,945 | 1,958,101 | 1,329,514 |
| Commercial CES | 456,039 | 426,121 | 364,405 | 328,211 | 253,429 | 215,769 | 191,586 | 152,641 | 123,390 | 441,163 | 234,599 |
| Commercial loans | 25,846 | 28,186 | 29,571 | 32,194 | 42,912 | 56,777 | 59,049 | 47,703 | 45,214 | 27,009 | 49,807 |
| Commercial IGS | 118,231 | 122,099 | 106,902 | 128,355 | 132,154 | 181,549 | 188,445 | 215,109 | 204,247 | 120,154 | 156,852 |
| CDO CES | 18,365 | 18,348 | 19,539 | 20,999 | 13,950 | 14,709 | 12,231 | 11,892 | 2,816 | 18,357 | 14,330 |
| CDO IGS | 262,005 | 230,684 | 198,749 | 174,363 | 171,687 | 157,570 | 149,660 | 138,996 | 138,777 | 246,431 | 164,629 |
| Other real estate investments | 44,061 | 37,169 | - | - | - | - | - | - | - | 40,634 | - |
| Non real Estate Investments | 38,681 | - | - | - | - | - | - | - | - | 19,448 | - |
| Cash and cash equivalents | 290,869 | 244,816 | 398,674 | 183,323 | 246,597 | 244,002 | 339,379 | 134,422 | 124,707 | 268,779 | 245,306 |
| Earning assets | 12,301,562 | 12,279,814 | 12,498,889 | 12,860,488 | 13,581,710 | 15,229,790 | 17,542,352 | 20,085,392 | 22,606,037 | 12,291,559 | 14,401,199 |
| Other assets | 386,906 | 586,165 | 542,905 | 619,873 | 587,045 | 609,693 | 806,329 | 905,907 | 759,516 | 487,530 | 598,306 |
| Total assets | $12,688,468 | $12,865,979 | $13,041,794 | $13,480,361 | $14,168,755 | $15,839,483 | $18,348,681 | $20,991,299 | $23,365,553 | $12,779,089 | $14,999,505 |
| | | | | | | | | | | | |
| | | | | | | | | | | | |
| Redwood debt | $1,515,988 | $2,188,561 | $1,090,480 | $647,978 | $85,616 | $137,181 | $253,302 | $297,788 | $216,639 | $1,850,144 | $111,256 |
| Subordinated notes | 117,934 | 97,013 | 21,401 | - | - | - | - | - | - | 107,531 | - |
| ABS obligations of entities | 9,946,274 | 9,338,053 | 10,724,837 | 11,684,412 | 12,969,801 | 14,663,134 | 16,941,243 | 19,542,413 | 22,067,276 | 9,646,104 | 13,811,790 |
| Other liabilities | 161,819 | 233,664 | 196,214 | 136,362 | 132,936 | 86,938 | 154,823 | 136,769 | 111,294 | 198,242 | 110,065 |
| Total liabilities | 11,742,015 | 11,857,291 | 12,032,931 | 12,468,752 | 13,188,353 | 14,887,253 | 17,349,368 | 19,976,970 | 22,395,209 | 11,802,021 | 14,033,111 |
| | | | | | | | | | | | |
| Core equity | 951,378 | 925,128 | 923,856 | 932,030 | 898,409 | 877,212 | 880,329 | 880,482 | 840,098 | 938,212 | 887,870 |
| Balance sheet mark-to-market adjustments | (4,924) | 83,560 | 85,007 | 79,579 | 81,993 | 75,018 | 118,984 | 133,847 | 130,246 | 38,856 | 78,525 |
| Total equity | 946,454 | 1,008,688 | 1,008,863 | 1,011,609 | 980,402 | 952,230 | 999,313 | 1,014,329 | 970,344 | 977,068 | 966,394 |
| Total liabilities and equity | $12,688,468 | $12,865,979 | $13,041,794 | $13,480,361 | $14,168,755 | $15,839,483 | $18,348,681 | $20,991,299 | $23,365,553 | $12,779,089 | $14,999,505 |
The Redwood Review 2nd Quarter | Appendix Table 8 Average Balance Sheet | 86 |
| Table 9 - Balances & Yields by Portfolio ($ in thousands) |
| |
Residential IGS | | | | | | | | | | |
| | Q2: 2007 | Q1: 2007 | Q4: 2006 | Q3: 2006 | Q2: 2006 | Q1: 2006 | Q4: 2005 | Q3: 2005 | Q2: 2005 | |
| Current face | $2,276,704 | $2,094,494 | $1,708,607 | $1,484,095 | $1,406,195 | $1,361,245 | $1,273,985 | $1,282,132 | $1,189,207 | |
| Unamortized discount | (32,187) | (19,617) | (16,382) | (17,362) | (18,788) | (19,874) | (11,595) | (13,970) | (12,165) | |
| Credit protection | - | - | - | - | - | - | - | - | - | |
| Unrealized market value gains/(losses) | (81,571) | (49,027) | 5,025 | 8,270 | 2,609 | 5,304 | (2,300) | 11,082 | 16,252 | |
Net book value | $2,162,946 | $2,025,850 | $1,697,250 | $1,475,002 | $1,390,016 | $1,346,675 | $1,260,090 | $1,279,244 | $1,193,294 | |
| | | | | | | | | | | |
| Average balance | $2,119,280 | $1,795,130 | $1,513,794 | $1,404,281 | $1,358,453 | $1,299,933 | $1,263,277 | $1,219,034 | $1,122,945 | |
| Interest income | $36,061 | $29,420 | $25,626 | $24,961 | $22,287 | $20,180 | $18,148 | $16,942 | $13,909 | |
| Yield | 6.80% | 6.56% | 6.77% | 7.11% | 6.56% | 6.21% | 5.75% | 5.56% | 4.95% | |
| | | | | | | | | | | |
Residential CES | | | | | | | | | | |
| | Q2: 2007 | Q1: 2007 | Q4: 2006 | Q3: 2006 | Q2: 2006 | Q1: 2006 | Q4: 2005 | Q3: 2005 | Q2: 2005 | |
| Current face | $1,291,193 | $1,259,446 | $1,180,605 | $1,183,142 | $1,168,602 | $1,034,069 | $1,013,793 | $1,029,786 | $1,079,323 | |
| Unamortized discount | (125,948) | (158,664) | (144,842) | (140,585) | (116,702) | (108,371) | (121,824) | (84,084) | (90,716) | |
| Credit protection | (453,076) | (392,768) | (372,247) | (384,397) | (425,578) | (373,781) | (354,610) | (382,862) | (404,180) | |
| Unrealized market value gains/(losses) | 32,806 | 44,263 | 58,015 | 57,495 | 50,854 | 43,522 | 55,193 | 80,867 | 99,380 | |
Net book value | $744,975 | $752,277 | $721,531 | $715,655 | $677,176 | $595,439 | $592,552 | $643,707 | $683,807 | |
| | | | | | | | | | | |
| Average balance | $695,709 | $673,114 | $654,909 | $641,694 | $573,253 | $516,962 | $517,138 | $567,689 | $531,456 | |
| Interest income | $40,885 | $37,664 | $35,650 | $34,585 | $28,059 | $26,245 | $22,556 | $23,640 | $18,778 | |
| Yield | 23.51% | 22.38% | 21.77% | 21.56% | 19.58% | 20.31% | 17.45% | 16.66% | 14.13% | |
| | | | | | | | | | | |
Other Real Estate Investments | | | | | | | | | | |
Other Real Estate Investments | Q2: 2007 | Q1: 2007 | Q4: 2006 | Q3: 2006 | Q2: 2006 | Q1: 2006 | Q4: 2005 | Q3: 2005 | Q2: 2005 | |
| Current face | $33,340 | $38,670 | - | - | - | - | - | - | - | |
| Unamortized premium | - | - | - | - | - | - | - | - | - | |
| Credit protection | - | - | - | - | - | - | - | - | - | |
| Unrealized market value gains/(losses) | 828 | 11,387 | - | - | - | - | - | - | - | |
Net book value | $34,168 | $50,057 | - | - | - | - | - | - | - | |
| | | | - | - | - | - | - | - | - | |
| Average balance | $44,061 | $37,169 | - | - | - | - | - | - | - | |
| Interest income | $669 | $2,465 | - | - | - | - | - | - | - | |
| Yield | 6.07% | 26.53% | - | - | - | - | - | - | - | |
| | | | | | | | | | | |
The Redwood Review 2nd Quarter | Appendix Table 9 - Balances and Yields by Portfolio | 87 |
| Table 9 - Balances & Yields by Portfolio ($ in thousands) |
| |
Residential Real Estate Loans | | | | | | | | | | |
| | Q2: 2007 | Q1: 2007 | Q4: 2006 | Q3: 2006 | Q2: 2006 | Q1: 2006 | Q4: 2005 | Q3: 2005 | Q2: 2005 | |
| Current face | $8,269,306 | $8,582,964 | $9,212,002 | $9,718,985 | $10,318,641 | $11,846,454 | $13,719,242 | $16,386,833 | $19,443,387 | |
| Unamortized premium | 98,757 | 117,477 | 132,052 | 143,135 | 155,101 | 166,134 | 178,206 | 191,513 | 210,137 | |
| Credit protection | (16,416) | (19,954) | (20,119) | (19,326) | (19,450) | (22,372) | (22,656) | (22,029) | (22,959) | |
| Unrealized market value gains/(losses) | - | - | - | - | - | - | - | - | - | |
Net book value | $8,351,647 | $8,680,487 | $9,323,935 | $9,842,794 | $10,454,292 | $11,990,216 | $13,874,792 | $16,556,317 | $19,630,565 | |
| | | | | | | | | | | |
| Average balance | $8,232,476 | $8,704,147 | $9,212,346 | $9,947,068 | $10,789,275 | $12,542,519 | $14,821,587 | $17,597,906 | $20,312,485 | |
| Interest income | $119,157 | $129,143 | $137,568 | $148,494 | $154,160 | $165,664 | $176,599 | $193,621 | $206,263 | |
| Yield | 5.79% | 5.93% | 5.97% | 5.97% | 5.72% | 5.28% | 4.77% | 4.40% | 4.06% | |
| | | | | | | | | | | |
Commercial CES | | | | | | | | | | |
| | Q2: 2007 | Q1: 2007 | Q4: 2006 | Q3: 2006 | Q2: 2006 | Q1: 2006 | Q4: 2005 | Q3: 2005 | Q2: 2005 | |
| Current face | $880,987 | $792,240 | $793,743 | $667,512 | $486,622 | $407,466 | $383,334 | $323,724 | $222,522 | |
| Unamortized discount | (95,346) | (71,455) | (71,424) | (48,712) | (28,184) | (20,473) | (28,993) | (2,428) | (8,062) | |
| Credit protection | (310,745) | (294,466) | (295,340) | (258,382) | (192,134) | (167,772) | (141,806) | (138,530) | (87,210) | |
| Unrealized market value gains/(losses) | (23,955) | 9,063 | 21,081 | 19,449 | 4,939 | 4,081 | 6,321 | 4,462 | 10,779 | |
Net book value | $450,941 | $435,382 | $448,060 | $379,867 | $271,243 | $223,302 | $218,856 | $187,228 | $138,029 | |
| | | | | | | | | | | |
| Average balance | $456,039 | $426,121 | $364,405 | $328,211 | $253,429 | $215,769 | $191,586 | $152,641 | $123,390 | |
| Interest income | $11,119 | $10,140 | $8,170 | $7,381 | $5,581 | $4,268 | $3,927 | $2,747 | $2,811 | |
| Yield | 9.75% | 9.52% | 8.97% | 9.00% | 8.81% | 7.91% | 8.20% | 7.20% | 9.11% | |
| | | | | | | | | | | |
Commercial IGS | | | | | | | | | | |
| | Q2: 2007 | Q1: 2007 | Q4: 2006 | Q3: 2006 | Q2: 2006 | Q1: 2006 | Q4: 2005 | Q3: 2005 | Q2: 2005 | |
| Current face | $121,131 | $121,737 | $122,869 | $133,361 | $134,244 | $182,041 | $180,213 | $209,524 | $199,957 | |
| Unamortized premium/ (discount) | (3,103) | (3,172) | (3,367) | 701 | 727 | 5,295 | 8,100 | 13,303 | 14,129 | |
| Credit protection | - | - | - | - | - | - | - | - | - | |
| Unrealized market value gains/(losses) | (6,884) | (2,071) | 111 | 577 | (3,937) | (2,936) | (3,281) | (44) | 3,762 | |
Net book value | $111,144 | $116,494 | $119,613 | $134,639 | $131,034 | $184,400 | $185,032 | $222,783 | $217,848 | |
| | | | | | | | | | | |
| Average balance | $118,231 | $122,099 | $106,902 | $128,355 | $132,154 | $181,549 | $188,445 | $215,109 | $204,247 | |
| Interest income | $1,827 | $1,875 | $2,344 | $2,342 | $2,133 | $2,880 | $3,102 | $3,398 | $3,036 | |
| Yield | 6.18% | 6.14% | 8.77% | 7.30% | 6.46% | 6.35% | 6.58% | 6.32% | 5.95% | |
| | | | | | | | | | | |
The Redwood Review 2nd Quarter | Appendix Table 9 Balances and Yields by Portfolio | 88 |
| Table 9 - Balances & Yields by Portfolio ($ in thousands) |
| |
Commercial Loans | | | | | | | | | | |
| | Q2: 2007 | Q1: 2007 | Q4: 2006 | Q3: 2006 | Q2: 2006 | Q1: 2006 | Q4: 2005 | Q3: 2005 | Q2: 2005 | |
| Current face | $38,311 | $38,394 | $38,360 | $42,384 | $46,959 | $65,508 | $70,091 | $66,348 | $51,778 | |
| Unamortized discount | (1,995) | (2,022) | (2,047) | (2,073) | (2,096) | (2,200) | (2,258) | (2,105) | (1,843) | |
| Credit protection | (10,489) | (10,489) | (8,141) | (8,141) | (8,141) | (8,141) | (8,141) | (8,141) | (8,141) | |
| Unrealized market value gains/(losses) | - | - | - | - | - | - | - | - | - | |
Net book value | $25,827 | $25,883 | $28,172 | $32,170 | $36,722 | $55,167 | $59,692 | $56,102 | $41,794 | |
| | | | | | | | | | | |
| Average balance | $25,846 | $28,186 | $29,571 | $32,194 | $42,912 | $56,777 | $59,049 | $47,703 | $45,214 | |
| Interest (loss) income | $419 | (2,293) | $409 | $524 | $812 | $1,238 | $1,281 | $1,209 | $1,208 | |
| Yield | 6.48% | -32.54% | 5.53% | 6.51% | 7.57% | 8.72% | 8.68% | 10.14% | 10.69% | |
| | | | | | | | | | | |
CDO CES | | | | | | | | | | |
| | Q2: 2007 | Q1: 2007 | Q4: 2006 | Q3: 2006 | Q2: 2006 | Q1: 2006 | Q4: 2005 | Q3: 2005 | Q2: 2005 | |
| Current face | $31,381 | $23,731 | $28,731 | $29,231 | $22,226 | $23,226 | $20,226 | $20,226 | $10,184 | |
| Unamortized discount | (9,955) | (7,004) | (6,889) | (7,298) | (7,978) | (8,048) | (8,004) | (7,907) | (7,232) | |
| Credit protection | - | - | - | - | - | - | - | - | - | |
| Unrealized market value gains/(losses) | (293) | (575) | 122 | 326 | 470 | (436) | (484) | 144 | (187) | |
Net book value | $21,133 | $16,152 | $21,964 | $22,259 | $14,718 | $14,742 | $11,738 | $12,463 | $2,765 | |
| | | | | | | | | | | |
| Average balance | $18,365 | $18,348 | $19,539 | $20,999 | $13,950 | $14,709 | $12,231 | $11,892 | $2,816 | |
| Interest income | $660 | $497 | $570 | $609 | $236 | $439 | $125 | $131 | $127 | |
| Yield | 14.38% | 10.84% | 11.67% | 11.60% | 6.77% | 11.94% | 4.09% | 4.41% | 18.04% | |
| | | | | | | | | | | |
CDO IGS | | | | | | | | | | |
| | Q2: 2007 | Q1: 2007 | Q4: 2006 | Q3: 2006 | Q2: 2006 | Q1: 2006 | Q4: 2005 | Q3: 2005 | Q2: 2005 | |
| Current face | $262,881 | $263,237 | $222,413 | $182,352 | $175,586 | $162,844 | $149,812 | $144,246 | $145,933 | |
| Unamortized discount | (7,096) | (945) | (238) | (236) | (241) | (249) | (257) | (264) | (470) | |
| Credit protection | - | - | - | - | - | - | - | - | - | |
| Unrealized market value gains/(losses) | (21,152) | (7,985) | 2,174 | 2,826 | 1,718 | 944 | 1,092 | 2,362 | 3,221 | |
Net book value | $234,633 | $254,307 | $224,349 | $184,942 | $177,063 | $163,539 | $150,647 | $146,344 | $148,684 | |
| | | | | | | | | | | |
| Average balance | $262,005 | $230,684 | $198,749 | $174,363 | $171,687 | $157,570 | $149,660 | $138,996 | $138,777 | |
| Interest income | $4,641 | $3,862 | $3,335 | $2,881 | $2,099 | $2,491 | $2,571 | $1,953 | $1,569 | |
| Yield | 7.08% | 6.70% | 6.71% | 6.61% | 4.89% | 6.32% | 6.87% | 5.62% | 4.52% | |
| | | | | | | | | | | |
The Redwood Review 2nd Quarter | Appendix Table 9 Balances and Yields by Portfolio | 89 |
| Table 9 - Balances & Yields by Portfolio ($ in thousands) |
| |
Non Real Estate Investments | | | | | | | | | | |
| | Q2: 2007 | Q1: 2007 | Q4: 2006 | Q3: 2006 | Q2: 2006 | Q1: 2006 | Q4: 2005 | Q3: 2005 | Q2: 2005 | |
| Current face | $80,000 | - | - | - | - | - | - | - | - | |
| Unamortized premium/ (discount) | - | - | - | - | - | - | - | - | - | |
| Credit protection | - | - | - | - | - | - | - | - | - | |
| Unrealized market value gains/(losses) | - | - | - | - | - | - | - | - | - | |
Net book value | $80,000 | - | - | - | - | - | - | - | - | |
| | | | | | | | | | | |
| Average balance | $38,681 | $0 | $0 | $0 | $0 | $0 | $0 | $0 | $0 | |
| Interest income | $464 | $0 | $0 | $0 | $0 | $0 | $0 | $0 | $0 | |
| Yield | 4.80% | 0.00% | 0.00% | 0.00% | 0.00% | 0.00% | 0.00% | 0.00% | 0.00% | |
| | | | | | | | | | | |
Cash & Equivalents | | | | | | | | | | |
| | Q2: 2007 | Q1: 2007 | Q4: 2006 | Q3: 2006 | Q2: 2006 | Q1: 2006 | Q4: 2005 | Q3: 2005 | Q2: 2005 | |
| Current face | $82,626 | $91,656 | $168,016 | $112,926 | $106,491 | $85,466 | $175,885 | $163,160 | $72,193 | |
| Unamortized premium/ (discount) | - | - | - | - | - | - | - | - | - | |
| Credit protection | - | - | - | - | - | - | - | - | - | |
| Unrealized market value gains/(losses) | - | - | - | - | - | - | - | - | - | |
Net book value | $82,626 | $91,656 | $168,016 | $112,926 | $106,491 | $85,466 | $175,885 | $163,160 | $72,193 | |
| | | | | | | | | | | |
| Average balance | $290,869 | $244,816 | $398,674 | $183,323 | $246,597 | $244,002 | $339,379 | $134,422 | $124,707 | |
| Interest income | $3,756 | $2,332 | $3,719 | $1,872 | $2,871 | $2,477 | $2,830 | $990 | $804 | |
| Yield | 5.17% | 3.81% | 3.73% | 4.08% | 4.66% | 4.06% | 3.34% | 2.95% | 2.58% | |
| | | | | | | | | | | |
Total Earning Assets (GAAP) | | | | | | | | | | |
| | Q2: 2007 | Q1: 2007 | Q4: 2006 | Q3: 2006 | Q2: 2006 | Q1: 2006 | Q4: 2005 | Q3: 2005 | Q2: 2005 | |
| Current face | $13,367,860 | $13,306,569 | $13,475,346 | $13,553,988 | $13,865,566 | $15,168,319 | $16,986,581 | $19,625,979 | $22,414,484 | |
| Unamortized premium/ (discount) | (176,873) | (129,027) | (113,137) | (72,430) | (18,161) | 12,214 | 13,375 | 94,058 | 103,778 | |
| Credit protection | (790,726) | (717,677) | (695,847) | (670,246) | (645,303) | (572,066) | (527,213) | (551,562) | (522,490) | |
| Unrealized market value gains/(losses) | (100,221) | (11,320) | 86,528 | 88,943 | 56,653 | 50,479 | 56,541 | 98,873 | 133,207 | |
Net book value | $12,300,040 | $12,448,545 | $12,752,890 | $12,900,255 | $13,258,755 | $14,658,946 | $16,529,284 | $19,267,348 | $22,128,979 | |
| | | | | | | | | | | |
| Average balance | $12,301,562 | $12,279,814 | $12,498,889 | $12,860,487 | $13,581,710 | $15,229,790 | $17,542,352 | $20,085,392 | $22,606,037 | |
| Interest income | $219,658 | $215,105 | $217,391 | $223,649 | $218,238 | $225,882 | $231,139 | $244,631 | $248,505 | |
| Yield | 7.14% | 7.01% | 6.96% | 6.96% | 6.43% | 5.93% | 5.27% | 4.87% | 4.40% | |
| | | | | | | | | | | |
The Redwood Review 2nd Quarter | Appendix Table 9 Balances and Yields by Portfolio | 90 |
| Table 10: Portfolio Activity (in thousands) |
| |
| |
Residential IGS |
| | Q2: 2007 | Q1: 2007 | Q4: 2006 | Q3: 2006 | Q2: 2006 | Q1: 2006 | Q4: 2005 | Q3: 2005 | Q2: 2005 | |
| Beginning balance | $2,025,850 | $1,697,250 | $1,475,002 | $1,390,015 | $1,346,674 | $1,260,089 | $1,279,243 | $1,193,293 | $1,087,396 | |
| Acquisitions | 267,695 | 535,346 | 352,292 | 120,316 | 179,115 | 80,970 | 116,987 | 114,699 | 128,708 | |
| Upgrades / downgrades | - | - | - | - | - | 30,667 | - | - | - | |
| Transfer to other portfolios | - | (13,816) | - | - | - | - | - | - | - | |
| Sales | (52,217) | (108,372) | (97,124) | (12,669) | (104,442) | (3,984) | (95,328) | 4,000 | (3,012) | |
| Principal payments | (45,857) | (32,248) | (31,398) | (29,997) | (31,136) | (25,445) | (29,834) | (27,627) | (22,961) | |
| Discount amortization | 2,449 | 1,321 | 1,023 | 1,943 | 1,446 | 853 | 790 | 761 | 347 | |
| Net mark-to-market adjustment | (34,974) | (53,631) | (2,545) | 5,394 | (1,642) | 3,524 | (11,769) | (5,883) | 2,815 | |
Ending Balance | $2,162,946 | $2,025,850 | $1,697,250 | $1,475,002 | $1,390,015 | $1,346,674 | $1,260,089 | $1,279,243 | $1,193,293 | |
| |
Residential CES |
| | Q2: 2007 | Q1: 2007 | Q4: 2006 | Q3: 2006 | Q2: 2006 | Q1: 2006 | Q4: 2005 | Q3: 2005 | Q2: 2005 | |
| Beginning balance | $752,277 | $721,531 | $715,655 | $677,176 | $595,439 | $592,552 | $643,707 | $683,807 | $587,760 | |
| Acquisitions | 39,381 | 73,725 | 20,870 | 87,305 | 89,217 | 52,822 | 54,664 | 57,479 | 87,864 | |
| Upgrades / downgrades | - | - | - | - | - | (30,667) | - | - | - | |
| Transfer to other portfolios | - | (4,480) | - | - | - | - | - | - | - | |
| Sales | (3,292) | (5,214) | (962) | (47,585) | (4,035) | (9,650) | (81,292) | (98,775) | - | |
| Principal payments | (43,556) | (35,672) | (32,639) | (28,835) | (23,302) | (14,110) | (21,523) | (17,013) | (18,931) | |
| Discount amortization | 21,065 | 18,892 | 17,412 | 15,917 | 11,684 | 12,391 | 10,098 | 10,766 | 7,424 | |
| Net mark-to-market adjustment | (20,900) | (16,505) | 1,195 | 11,677 | 8,173 | (7,899) | (13,102) | 7,443 | 19,690 | |
Ending balance | $744,975 | $752,277 | $721,531 | $715,655 | $677,176 | $595,439 | $592,552 | $643,707 | $683,807 | |
| |
Other Real Estate Investments |
| | Q2: 2007 | Q1: 2007 | Q4: 2006 | Q3: 2006 | Q2: 2006 | Q1: 2006 | Q4: 2005 | Q3: 2005 | Q2: 2005 | |
| Beginning balance | $50,057 | $0 | - | - | - | - | - | - | - | |
| Acquisitions | - | 40,790 | - | - | - | - | - | - | - | |
| Upgrades / downgrades | - | - | - | - | - | - | - | - | - | |
| Transfer from other portfolios | - | 18,296 | - | - | - | - | - | - | - | |
| Sales | (2,237) | - | - | - | - | - | - | - | - | |
| Principal payments | (5,301) | (3,079) | - | - | - | - | - | - | - | |
| Premium amortization | (2,104) | (532) | - | - | - | - | - | - | - | |
| Net mark-to-market adjustment | (6,247) | (5,418) | - | - | - | - | - | - | - | |
Ending balance | $34,168 | $50,057 | - | - | - | - | - | - | - | |
| | | | | | | | | | | |
The Redwood Review 2nd Quarter | Appendix Table 10 Portfolio Activity | 91 |
| Table 10: Portfolio Activity (in thousands) |
| |
Real Estate Loans |
| | Q2: 2007 | Q1: 2007 | Q4: 2006 | Q3: 2006 | Q2: 2006 | Q1: 2006 | Q4: 2005 | Q3: 2005 | Q2: 2005 | |
| Beginning balance | $8,680,487 | $9,323,935 | $9,842,794 | $10,454,292 | $11,990,216 | $13,874,792 | $16,556,317 | $19,630,565 | $21,772,696 | |
| Acquisitions | 674,932 | 415,283 | 725,695 | 966,673 | 272,627 | 52,691 | 271,875 | 332,049 | 426,933 | |
| Sales | (2,191) | - | - | - | - | - | (240,987) | (263,079) | (3,378) | |
| Principal payments | (983,557) | (1,047,170) | (1,230,545) | (1,567,041) | (1,799,401) | (1,925,475) | (2,698,500) | (3,129,492) | (2,557,675) | |
| Premium amortization | (10,889) | (11,726) | (13,298) | (11,254) | (12,073) | (12,075) | (13,334) | (14,438) | (9,758) | |
| Credit provision | (2,500) | (1,481) | (1,505) | (465) | 2,507 | (141) | (877) | 805 | 1,527 | |
| Net charge-offs / (recoveries) | (4,635) | 1,646 | 794 | 589 | 416 | 424 | 250 | 125 | (34) | |
| Net mark-to-market adjustment | - | - | - | - | - | - | 48 | (218) | 254 | |
Ending balance | $8,351,647 | $8,680,487 | $9,323,935 | $9,842,794 | $10,454,292 | $11,990,216 | $13,874,792 | $16,556,317 | $19,630,565 | |
| |
Commercial CES |
| | Q2: 2007 | Q1: 2007 | Q4: 2006 | Q3: 2006 | Q2: 2006 | Q1: 2006 | Q4: 2005 | Q3: 2005 | Q2: 2005 | |
| Beginning balance | $435,382 | $448,060 | $379,867 | $271,243 | $223,302 | $218,856 | $187,228 | $138,029 | $127,687 | |
| Acquisitions | 49,177 | 2,743 | 76,496 | 99,065 | 51,978 | 11,130 | 30,293 | 55,941 | 4,263 | |
| Upgrades / downgrades | - | (3,501) | - | - | - | (3,966) | - | - | - | |
| Sales | - | - | (9,914) | (4,216) | (2,820) | - | - | - | - | |
| Principal payments | - | - | (13) | (9) | (9) | (10) | (9) | (8) | (8) | |
| Discount / (premium) amortization | 200 | (9) | (289) | (451) | (257) | (564) | (276) | (416) | 68 | |
| Net mark-to-market adjustment | (33,818) | (11,911) | 1,913 | 14,235 | (951) | (2,144) | 1,620 | (6,318) | 6,019 | |
Ending Balance | $450,941 | $435,382 | $448,060 | $379,867 | $271,243 | $223,302 | $218,856 | $187,228 | $138,029 | |
| |
Commercial Loans |
| | Q2: 2007 | Q1: 2007 | Q4: 2006 | Q3: 2006 | Q2: 2006 | Q1: 2006 | Q4: 2005 | Q3: 2005 | Q2: 2005 | |
| Beginning balance | $25,883 | $28,172 | $32,170 | $36,722 | $55,167 | $59,692 | $56,102 | $41,794 | $56,604 | |
| Acquisitions | - | - | - | - | - | - | 4,248 | 14,219 | - | |
| Sales | - | - | - | - | (8,408) | - | - | (17) | (11,192) | |
| Principal payments | (82) | 38 | (4,024) | (4,574) | (10,049) | (4,583) | (506) | 158 | (3,769) | |
| Discount / (premium) amortization | 26 | 21 | 26 | 22 | 27 | 93 | (152) | (69) | (99) | |
| Credit provision | - | (2,348) | - | - | - | (35) | - | - | - | |
| Net mark-to-market adjustment | - | - | - | - | (14) | - | - | 17 | 250 | |
Ending Balance | $25,827 | $25,883 | $28,172 | $32,170 | $36,722 | $55,167 | $59,692 | $56,102 | $41,794 | |
| | | | | | | | | | | |
The Redwood Review 2nd Quarter | Appendix Table 10 Portfolio Activity | 92 |
| Table 10: Portfolio Activity (in thousands) |
| |
Commercial IGS |
| | Q2: 2007 | Q1: 2007 | Q4: 2006 | Q3: 2006 | Q2: 2006 | Q1: 2006 | Q4: 2005 | Q3: 2005 | Q2: 2005 | |
| Beginning balance | $116,494 | $119,613 | $134,639 | $131,034 | $184,400 | $185,032 | $222,783 | $217,848 | $206,590 | |
| Acquisitions | - | 2,964 | 8,999 | (3) | - | 2,177 | 29,684 | 17,179 | 7,845 | |
| Upgrades / downgrades | - | 3,501 | - | - | - | 3,966 | - | - | - | |
| Sales | - | (6,464) | (24,007) | - | (51,501) | - | (56,292) | (4,000) | - | |
| Principal payments | (607) | (938) | (737) | (883) | (998) | (5,006) | (8,560) | (4,174) | (594) | |
| Discount / (premium) amortization | 69 | 67 | 51 | (14) | (90) | (159) | (145) | (269) | (281) | |
| Net mark-to-market adjustment | (4,812) | (2,249) | 668 | 4,505 | (777) | (1,610) | (2,438) | (3,801) | 4,288 | |
Ending Balance | $111,144 | $116,494 | $119,613 | $134,639 | $131,034 | $184,400 | $185,032 | $222,783 | $217,848 | |
| |
CDO CES |
| | Q2: 2007 | Q1: 2007 | Q4: 2006 | Q3: 2006 | Q2: 2006 | Q1: 2006 | Q4: 2005 | Q3: 2005 | Q2: 2005 | |
| Beginning balance | $16,152 | $21,964 | $22,259 | $14,718 | $14,742 | $11,738 | $12,463 | $2,765 | $2,784 | |
| Acquisitions | 4,804 | (149) | - | 7,714 | (87) | 3,000 | (97) | 9,970 | (119) | |
| Upgrades / downgrades | - | (5,000) | - | - | - | - | - | - | - | |
| Sales | - | - | - | (722) | - | - | - | - | - | |
| Principal payments | (105) | - | (769) | (29) | (1,017) | (44) | - | 42 | - | |
| Discount amortization | - | - | - | - | - | - | - | 36 | - | |
| Net mark-to-market adjustment | 282 | (663) | 474 | 578 | 1,080 | 48 | (628) | (350) | 100 | |
Ending Balance | $21,133 | $16,152 | $21,964 | $22,259 | $14,718 | $14,742 | $11,738 | $12,463 | $2,765 | |
| |
CDO IGS |
| | Q2: 2007 | Q1: 2007 | Q4: 2006 | Q3: 2006 | Q2: 2006 | Q1: 2006 | Q4: 2005 | Q3: 2005 | Q2: 2005 | |
| Beginning balance | $254,307 | $224,349 | $184,942 | $177,063 | $163,539 | $150,647 | $146,344 | $148,684 | $133,123 | |
| Acquisitions | - | 35,496 | 45,388 | 7,000 | 13,000 | 13,500 | 5,900 | 9,553 | 15,485 | |
| Upgrades / downgrades | - | 5,000 | - | - | - | - | - | - | - | |
| Sales | - | - | (5,350) | - | - | - | - | - | - | |
| Principal payments | (356) | (376) | (338) | (235) | (257) | (468) | (335) | (11,240) | (237) | |
| Discount / (premium) amortization | 66 | (3) | 9 | 5 | 7 | 8 | 7 | 10 | 18 | |
| Net mark-to-market adjustment | (19,384) | (10,159) | (302) | 1,109 | 774 | (148) | (1,269) | (663) | 295 | |
Ending Balance | $234,633 | $254,307 | $224,349 | $184,942 | $177,063 | $163,539 | $150,647 | $146,344 | $148,684 | |
The Redwood Review 2nd Quarter | Appendix Table 10 Portfolio Activity | 93 |
| | |
| | | Managed Loans | Internally-Designated Credit Reserve | External Credit Enhancement | Total Credit Protection (1) | Total Credit Protection as % of Loans | Seriously Delinquent Loans | Seriously Delinquent Loan % of Current Balance | Total Credit Losses | Losses To Securities Junior to Redwood's Interest | Redwood's Share of Net Charge-offs/(Recoveries) | Total Credit Losses As % of Loans (Annualized) | |
| | | | | | | | | | | | | | |
Total Managed | Q2: 2005 | $192,291,401 | $427,139 | $139,847 | $566,986 | 0.29% | $230,538 | 0.12% | $740 | $196 | $544 | <0.01% | |
Residential Portfolio | Q3: 2005 | 192,368,457 | 404,891 | 133,080 | 537,971 | 0.28% | 268,341 | 0.14% | 1,812 | 220 | 1,592 | <0.01% | |
Portfolio | Q4: 2005 | 190,570,193 | 377,266 | 139,129 | 516,395 | 0.27% | 349,068 | 0.18% | 1,175 | - | 1,175 | <0.01% | |
| | 2005 | 190,570,193 | 377,266 | 139,129 | 516,395 | 0.27% | 349,068 | 0.18% | 5,104 | 416 | 4,688 | <0.01% | |
| | Q1: 2006 | 198,252,684 | 396,153 | 126,376 | 522,529 | 0.26% | 467,352 | 0.24% | 3,002 | - | 3,002 | 0.01% | |
| | Q2: 2006 | 227,928,505 | 445,028 | 126,264 | 571,292 | 0.25% | 441,430 | 0.19% | 1,464 | - | 1,464 | <0.01% | |
| | Q3: 2006 | 235,127,925 | 403,723 | 215,285 | 619,008 | 0.26% | 658,262 | 0.28% | 2,748 | 155 | 2,593 | <0.01% | |
| | Q4: 2006 | 219,178,838 | 392,365 | 302,072 | 694,437 | 0.32% | 842,746 | 0.39% | 5,058 | 196 | 4,862 | 0.01% | |
| | 2006 | 219,178,838 | 392,365 | 302,072 | 694,437 | 0.32% | 842,746 | 0.39% | 12,272 | 351 | 11,921 | 0.01% | |
| | Q1: 2007 | 245,080,031 | 412,717 | 355,855 | 768,572 | 0.31% | 1,075,683 | 0.44% | 5,776 | 325 | 5,451 | 0.01% | |
| | Q2: 2007 | $227,973,546 | $469,492 | $356,374 | $825,866 | 0.36% | $1,431,963 | 0.63% | $12,157 | $471 | $11,686 | 0.02% | |
| | | | | | | | | | | | | | |
Residential Real | Q2: 2005 | $19,443,387 | $22,959 | - | $22,959 | 0.12% | $16,514 | 0.08% | ($34) | - | ($34) | <0.01% | |
Estate Loans | Q3: 2005 | 16,386,833 | 22,029 | - | 22,029 | 0.13% | 22,956 | 0.14% | 90 | - | 90 | <0.01% | |
| | Q4: 2005 | 13,719,242 | 22,656 | - | 22,656 | 0.17% | 37,335 | 0.27% | 251 | - | 251 | <0.01% | |
| | 2005 | 13,719,242 | 22,656 | - | 22,656 | 0.17% | 37,335 | 0.27% | 461 | - | 461 | <0.01% | |
| | Q1: 2006 | 11,846,454 | 22,372 | - | 22,372 | 0.19% | 48,677 | 0.41% | 425 | - | 425 | <0.01% | |
| | Q2: 2006 | 10,318,641 | 19,450 | - | 19,450 | 0.19% | 47,162 | 0.46% | 423 | - | 423 | <0.01% | |
| | Q3: 2006 | 9,718,985 | 19,326 | - | 19,326 | 0.20% | 61,447 | 0.63% | 589 | - | 589 | 0.02% | |
| | Q4: 2006 | 9,212,002 | 20,119 | - | 20,119 | 0.22% | 65,071 | 0.79% | 711 | - | 711 | 0.02% | |
| | 2006 | 9,212,002 | 20,119 | - | 20,119 | 0.22% | 65,071 | 0.79% | 2,148 | - | 2,148 | 0.02% | |
| | Q1: 2007 | 8,582,964 | 19,954 | - | 19,954 | 0.23% | 68,632 | 0.92% | 1,646 | - | 1,646 | 0.08% | |
| | Q2: 2007 | $8,256,759 | $16,416 | - | $16,416 | 0.20% | $55,674 | 0.67% | $6,038 | - | $6,038 | 0.29% | |
| | | | | | | | | | | | | | |
Residential CES | Q2: 2005 | $172,848,014 | $404,180 | $139,847 | $544,027 | 0.31% | $214,024 | 0.12% | $774 | $196 | $578 | <0.01% | |
| | Q3: 2005 | 175,981,624 | 382,862 | 133,080 | 515,942 | 0.29% | 245,385 | 0.14% | 1,722 | 220 | 1,502 | <0.01% | |
| | Q4: 2005 | 176,850,951 | 354,610 | 139,129 | 493,739 | 0.28% | 311,733 | 0.18% | 924 | 0 | 924 | <0.01% | |
| | 2005 | 176,850,951 | 354,610 | 139,129 | 493,739 | 0.28% | 311,733 | 0.18% | 4,643 | 416 | 4,227 | <0.01% | |
| | Q1: 2006 | 186,406,230 | 373,781 | 126,376 | 500,157 | 0.27% | 418,675 | 0.22% | 2,577 | 0 | 2,577 | <0.01% | |
| | Q2: 2006 | 217,609,864 | 425,578 | 126,264 | 551,842 | 0.25% | 394,268 | 0.18% | 1,041 | 0 | 1,041 | <0.01% | |
| | Q3: 2006 | 225,408,940 | 384,397 | 215,285 | 599,682 | 0.27% | 596,815 | 0.26% | 2,159 | 155 | 2,004 | <0.01% | |
| | Q4: 2006 | 209,966,836 | 372,246 | 302,072 | 674,318 | 0.32% | 777,675 | 0.37% | 4,347 | 196 | 4,151 | <0.01% | |
| | 2006 | 209,966,836 | 372,246 | 302,072 | 674,318 | 0.32% | 777,675 | 0.37% | 10,124 | 351 | 9,773 | <0.01% | |
| | Q1: 2007 | 236,497,067 | 392,763 | 355,855 | 748,618 | 0.32% | 1,007,051 | 0.43% | 4,130 | 325 | 3,805 | <0.01% | |
| | Q2: 2007 | $219,716,787 | $453,076 | $356,374 | $809,450 | 0.37% | $1,376,289 | 0.63% | $6,119 | $471 | $5,648 | 0.01% | |
| | | | | | | | | | | | | | |
| | (1) The credit reserve on residential real estate loans is only available to absorb losses on our residential real estate loans. Internally-designated credit reserves and external credit enhancement are only available to absorb losses on our residential CES. | |
| | |
The Redwood Review 2nd Quarter | Appendix Table 11A - Managed Residential Loans Credit Performance | 94 |
| | |
| | | Managed Loans (1) | Internally-Designated Credit Reserve | Total Credit Reserve as % of Loans | Seriously Delinquent Loans | Seriously Delinquent Loan % of Current Balance | Redwood's Share of Losses | Total Credit Losses As % of Loans (Annualized) | |
| | | | | | | | | | |
Total Managed | Q2: 2005 | $130,690,357 | $426,834 | 0.33% | $194,431 | 0.15% | $544 | 0.00% | |
Residential Loans and | Q3: 2005 | 125,971,360 | 404,191 | 0.32% | 230,263 | 0.18% | 1,592 | 0.00% | |
Non-Rated Securities | Q4: 2005 | 129,833,862 | 377,259 | 0.29% | 318,112 | 0.25% | 1,175 | 0.00% | |
| | 2005 | 129,833,862 | 377,259 | 0.29% | 318,112 | 0.25% | 3,465 | 0.00% | |
| | Q1: 2006 | 150,039,853 | 433,658 | 0.29% | 432,120 | 0.29% | 3,002 | 0.00% | |
| | Q2: 2006 | 159,800,662 | 444,323 | 0.28% | 402,617 | 0.25% | 1,464 | 0.00% | |
| | Q3: 2006 | 141,357,008 | 402,655 | 0.28% | 463,911 | 0.33% | 2,593 | 0.00% | |
| | Q4: 2006 | 134,696,897 | 392,366 | 0.29% | 540,695 | 0.40% | 4,862 | 0.00% | |
| | 2006 | 134,696,897 | 392,366 | 0.29% | 540,695 | 0.40% | 11,921 | 0.01% | |
| | Q1: 2007 | 114,624,260 | 412,717 | 0.36% | 672,234 | 0.59% | 5,451 | 0.02% | |
| | Q2: 2007 | $115,584,033 | $460,152 | 0.40% | $816,092 | 0.71% | $11,687 | 0.04% | |
| | | | | | | | | | |
Residential Alt-A Non-Rated | Q2: 2005 | $15,865,802 | $67,319 | 0.42% | $28,293 | 0.18% | $225 | 0.01% | |
| | Q3: 2005 | 14,615,816 | 58,323 | 0.40% | 34,698 | 0.24% | 271 | 0.01% | |
| | Q4: 2005 | 15,778,989 | 58,241 | 0.37% | 58,614 | 0.37% | 53 | 0.00% | |
| | 2005 | 15,778,989 | 58,241 | 0.37% | 58,614 | 0.37% | 549 | 0.00% | |
| | Q1: 2006 | 15,660,444 | 68,077 | 0.43% | 86,641 | 0.55% | 174 | 0.00% | |
| | Q2: 2006 | 19,960,837 | 115,170 | 0.58% | 106,953 | 0.54% | 225 | 0.00% | |
| | Q3: 2006 | 19,200,967 | 107,140 | 0.56% | 132,968 | 0.69% | 178 | 0.00% | |
| | Q4: 2006 | 18,127,353 | 115,315 | 0.64% | 187,465 | 1.03% | 1,311 | 0.03% | |
| | 2006 | 18,127,353 | 115,315 | 0.64% | 187,465 | 1.03% | 1,887 | 0.01% | |
| | Q1: 2007 | 18,577,577 | 128,772 | 0.69% | 278,021 | 1.50% | 1,331 | 0.03% | |
| | Q2: 2007 | $19,580,134 | $150,801 | 0.77% | $376,151 | 1.92% | $2,408 | 0.05% | |
| | | | | | | | | | |
Residential Prime Non-Rated | Q2: 2005 | $95,381,168 | $336,556 | 0.35% | $149,624 | 0.16% | $353 | <0.01% | |
| | Q3: 2005 | 94,968,711 | 323,839 | 0.34% | 172,609 | 0.18% | 1,231 | 0.01% | |
| | Q4: 2005 | 100,335,631 | 296,362 | 0.30% | 222,162 | 0.22% | 871 | 0.00% | |
| | 2005 | 100,335,631 | 296,362 | 0.30% | 222,162 | 0.22% | 2,455 | 0.00% | |
| | Q1: 2006 | 122,532,955 | 343,209 | 0.28% | 296,802 | 0.24% | 2,403 | 0.01% | |
| | Q2: 2006 | 129,521,184 | 309,703 | 0.24% | 248,502 | 0.19% | 816 | <0.01% | |
| | Q3: 2006 | 112,437,056 | 276,189 | 0.25% | 269,496 | 0.24% | 1,826 | 0.01% | |
| | Q4: 2006 | 107,357,542 | 256,932 | 0.24% | 288,159 | 0.27% | 2,840 | 0.01% | |
| | 2006 | 107,357,542 | 256,932 | 0.24% | 288,159 | 0.27% | 7,886 | 0.01% | |
| | Q1: 2007 | 87,463,719 | 263,991 | 0.30% | 325,581 | 0.37% | 2,474 | 0.01% | |
| | Q2: 2007 | $87,747,140 | $292,935 | 0.33% | $384,267 | 0.44% | $3,241 | 0.01% | |
| | | | | | | | | | |
Residential Real | Q2: 2005 | $19,443,387 | $22,959 | 0.12% | $16,514 | 0.08% | ($34) | 0.00% | |
Estate Loans | Q3: 2005 | 16,386,833 | 22,029 | 0.13% | 22,956 | 0.14% | 90 | <0.01% | |
| | Q4: 2005 | 13,719,242 | 22,656 | 0.17% | 37,335 | 0.27% | 251 | <0.01% | |
| | 2005 | 13,719,242 | 22,656 | 0.17% | 37,335 | 0.27% | 461 | <0.01% | |
| | Q1: 2006 | 11,846,454 | 22,372 | 0.19% | 48,677 | 0.41% | 425 | <0.01% | |
| | Q2: 2006 | 10,318,641 | 19,450 | 0.19% | 47,162 | 0.46% | 423 | 0.02% | |
| | Q3: 2006 | 9,718,985 | 19,326 | 0.20% | 61,447 | 0.63% | 589 | 0.02% | |
| | Q4: 2006 | 9,212,002 | 20,119 | 0.22% | 65,071 | 0.71% | 711 | 0.03% | |
| | 2006 | 9,212,002 | 20,119 | 0.22% | 65,071 | 0.71% | 2,148 | 0.02% | |
| | Q1: 2007 | 8,582,964 | 19,954 | 0.23% | 68,632 | 0.80% | 1,646 | 0.08% | |
| | Q2: 2007 | $8,256,759 | $16,416 | 0.20% | $55,674 | 0.67% | $6,038 | 0.29% | |
| | | | | | | | | | |
| (1) The credit reserve on residential real estate loans is only available to absorb losses on our residential real estate loan portfolio. The managed loans amount for residential CES prime and alt-a portfolios represents the loan balances for the securities where Redwood is first in line to absorb losses. The internally-designated credit reserve is established to protect Redwood against losses suffered from these underlying loan balances. | |
| | |
The Redwood Review 2nd Quarter | Appendix Table 11B - Managed Residential Loans Credit Performance | 95 |
| Table 12A: Residential Prime CES and Underlying Loan Characteristics ($ in thousands) |
| |
Residential Prime CES | Q2:2007 | Q1:2007 | Q4:2006 | Q3:2006 | Q2:2006 | Q1:2006 | Q4:2005 | Q3:2005 | Q2:2005 |
| Principal value | $915,731 | $899,856 | $871,984 | $900,358 | $925,212 | $849,556 | $858,999 | $885,264 | $908,780 |
| Unamortized premium | (98,787) | (115,563) | (117,016) | (113,398) | (105,707) | (52,906) | (105,078) | (76,264) | (80,172) |
| Credit protection | (292,934) | (263,991) | (256,932) | (276,189) | (309,703) | (343,209) | (296,362) | (323,839) | (336,556) |
| Unrealized market value | 45,779 | 50,847 | 57,333 | 57,459 | 51,733 | 43,276 | 55,293 | 74,925 | 93,954 |
| Market value (book value) | $569,789 | $571,149 | $555,369 | $568,230 | $561,535 | $496,717 | $512,852 | $560,086 | $586,006 |
| Market value / principal value | $62.22 | $63.47 | $63.69 | $63.11 | $60.69 | $58.47 | $59.70 | $63.27 | $64.48 |
| | | | | | | | | | |
Current Rating | | | | | | | | | |
| BB | $317,589 | $315,865 | $307,713 | $314,279 | $286,321 | $255,488 | $271,389 | $270,770 | $259,922 |
| B | 131,015 | 131,224 | 118,836 | 119,458 | 133,410 | 108,574 | 107,091 | 156,951 | 194,911 |
| Non Rated | 121,185 | 124,060 | 128,820 | 134,493 | 141,804 | 132,655 | 134,372 | 132,365 | 131,173 |
| Total market value | $569,789 | $571,149 | $555,369 | $568,230 | $561,535 | $496,717 | $512,852 | $560,087 | $586,006 |
| | | | | | | | | | |
Security Type | | | | | | | | | |
| Option ARM | $238,728 | $235,959 | $226,014 | $227,349 | $202,377 | $188,202 | $197,411 | $178,816 | $156,537 |
| ARM | 44,470 | 48,424 | 48,610 | 53,596 | 72,806 | 65,937 | 76,658 | 93,613 | 94,983 |
| Hybrid | 220,043 | 226,520 | 221,094 | 227,093 | 223,716 | 183,392 | 174,886 | 216,545 | 254,741 |
| Fixed | 66,548 | 60,246 | 59,651 | 60,193 | 62,636 | 59,185 | 63,896 | 71,112 | 79,745 |
| Total market value | $569,789 | $571,149 | $555,369 | $568,230 | $561,535 | $496,717 | $512,852 | $560,087 | $586,006 |
| | | | | | | | | | |
| Interest income | $13,973 | $14,443 | $13,776 | $16,745 | $14,629 | $11,619 | $10,535 | $11,143 | $9,845 |
| Discount amortization | 16,926 | 15,644 | 14,084 | 13,987 | 10,205 | 10,957 | 9,523 | 10,311 | 7,051 |
| Total interest income | $30,899 | $30,087 | $27,860 | $30,732 | $24,834 | $22,576 | $20,058 | $21,454 | $16,896 |
| | | | | | | | | | |
| Average Balance | $510,835 | $511,659 | $491,576 | $497,983 | $466,605 | $424,723 | $439,171 | $489,342 | $447,454 |
| | | | | | | | | | |
| Interest income % | 10.94% | 11.29% | 11.21% | 13.45% | 12.54% | 10.94% | 9.60% | 9.11% | 8.80% |
| Discount amort % | 13.25% | 12.23% | 11.46% | 11.23% | 8.75% | 10.32% | 8.67% | 8.43% | 6.30% |
| Yield | 24.19% | 23.52% | 22.67% | 24.69% | 21.29% | 21.26% | 18.27% | 17.54% | 15.10% |
| | | | | | | | | | |
Underlying Loan Characteristics | | | | | | | | | |
| Number of loans | 554,494 | 600,406 | 551,613 | 569,884 | 559,587 | 508,003 | 464,904 | 451,718 | 436,791 |
| Total loan face | $195,757,045 | $213,261,566 | $186,501,498 | $197,336,150 | $197,813,355 | $170,935,424 | $161,295,244 | $161,719,044 | $154,885,307 |
| Average loan size | $353 | $355 | $338 | $346 | $353 | $336 | $347 | $358 | $355 |
| | | | | | | | | | |
| Southern CA | 24% | 24% | 25% | 25% | 25% | 26% | 24% | 23% | 23% |
| Northern CA | 21% | 21% | 22% | 22% | 22% | 24% | 21% | 20% | 20% |
| Florida | 6% | 6% | 6% | 6% | 6% | 5% | 5% | 5% | 5% |
| New York | 5% | 5% | 5% | 5% | 5% | 5% | 5% | 5% | 5% |
| Georgia | 2% | 2% | 2% | 2% | 2% | 2% | 2% | 2% | 2% |
| New Jersey | 3% | 3% | 3% | 4% | 4% | 3% | 4% | 4% | 4% |
| Texas | 3% | 3% | 3% | 3% | 3% | 3% | 3% | 3% | 3% |
| Arizona | 2% | 2% | 2% | 2% | 2% | 2% | 2% | 2% | 2% |
| Illinois | 3% | 3% | 3% | 3% | 3% | 3% | 3% | 3% | 3% |
| Colorado | 2% | 2% | 2% | 2% | 2% | 2% | 2% | 3% | 3% |
| Virginia | 4% | 4% | 4% | 4% | 4% | 4% | 4% | 4% | 4% |
| Other states | 25% | 25% | 23% | 22% | 22% | 21% | 25% | 26% | 26% |
The Redwood Review 2nd Quarter | Appendix Table 12A - Residential CES Prime and Underlying Loan Characteristics | 96 |
| Table 12A: Residential Prime CES and Underlying Loan Characteristics ($ in thousands) |
|
| | Q2:2007 | Q1:2007 | Q4:2006 | Q3:2006 | Q2:2006 | Q1:2006 | Q4:2005 | Q3:2005 | Q2:2005 |
| Year 2007 origination | 4% | 2% | 0% | 0% | 0% | 0% | 0% | 0% | 0% |
| Year 2006 origination | 20% | 20% | 11% | 14% | 11% | 1% | 0% | 0% | 0% |
| Year 2005 origination | 27% | 28% | 28% | 27% | 29% | 32% | 23% | 16% | 7% |
| Year 2004 origination and earlier | 48% | 50% | 61% | 59% | 60% | 67% | 77% | 84% | 93% |
| | | | | | | | | | |
| Wtd Avg Original LTV | 68% | 68% | 68% | 68% | 68% | 68% | 67% | 67% | 67% |
| Original LTV: 0 - 50 | 13% | 13% | 14% | 13% | 13% | 14% | 14% | 14% | 14% |
| Original LTV: 50.01 - 60 | 12% | 12% | 12% | 12% | 12% | 12% | 13% | 13% | 12% |
| Original LTV: 60.01 - 70 | 22% | 22% | 22% | 22% | 22% | 22% | 23% | 23% | 23% |
| Original LTV: 70.01 - 80 | 50% | 50% | 49% | 50% | 50% | 49% | 47% | 47% | 48% |
| Original LTV: 80.01 - 90 | 2% | 2% | 2% | 2% | 2% | 2% | 2% | 2% | 2% |
| Original LTV: 90.01 - 100 | 1% | 1% | 1% | 1% | 1% | 1% | 1% | 1% | 1% |
| Unknown | 0% | 0% | 0% | 0% | 0% | 0% | 0% | 0% | 0% |
| | | | | | | | | | |
| Wtd Avg FICO | 737 | 737 | 735 | 734 | 734 | 734 | 729 | 729 | 727 |
| FICO: <= 600 | 1% | 1% | 1% | 1% | 1% | 1% | 0% | 0% | 0% |
| FICO: 601 - 620 | 1% | 1% | 1% | 1% | 1% | 1% | 1% | 0% | 0% |
| FICO: 621 - 640 | 2% | 2% | 2% | 2% | 2% | 2% | 2% | 2% | 2% |
| FICO: 641 - 660 | 3% | 3% | 3% | 3% | 3% | 3% | 4% | 4% | 4% |
| FICO: 661 - 680 | 6% | 6% | 6% | 7% | 6% | 6% | 7% | 7% | 7% |
| FICO: 681 - 700 | 10% | 10% | 10% | 10% | 10% | 11% | 11% | 11% | 11% |
| FICO: 701 - 720 | 13% | 12% | 12% | 13% | 13% | 12% | 12% | 13% | 13% |
| FICO: 721 - 740 | 14% | 14% | 13% | 13% | 13% | 13% | 14% | 14% | 14% |
| FICO: 741 - 760 | 15% | 15% | 15% | 15% | 15% | 15% | 15% | 15% | 15% |
| FICO: 761 - 780 | 18% | 18% | 18% | 17% | 17% | 17% | 17% | 18% | 18% |
| FICO: 781 - 800 | 14% | 14% | 14% | 13% | 13% | 13% | 13% | 12% | 12% |
| FICO: >= 801 | 5% | 4% | 4% | 4% | 4% | 4% | 3% | 3% | 3% |
| Unknown | 1% | 0% | 1% | 1% | 2% | 2% | 1% | 1% | 1% |
| | | | | | | | | | |
| Conforming at Origination % | 31% | 31% | 34% | 34% | 33% | 35% | 25% | 23% | 23% |
| > $1 MM % | 9% | 9% | 8% | 9% | 9% | 7% | 7% | 6% | 6% |
| | | | | | | | | | |
| 2nd Home % | 7% | 7% | 6% | 6% | 6% | 6% | 6% | 6% | 5% |
| Investment Home % | 2% | 2% | 2% | 2% | 2% | 2% | 2% | 2% | 2% |
| | | | | | | | | | |
| Purchase | 42% | 42% | 39% | 39% | 39% | 38% | 36% | 36% | 35% |
| Cash Out Refi | 27% | 27% | 27% | 29% | 30% | 28% | 27% | 26% | 25% |
| Rate-Term Refi | 30% | 30% | 33% | 31% | 31% | 33% | 36% | 37% | 39% |
| Construction | 0% | 0% | 0% | 0% | 0% | 0% | 0% | 0% | 0% |
| Other | 1% | 1% | 1% | 1% | 0% | 1% | 1% | 1% | 1% |
| | | | | | | | | | |
| Full Doc | 45% | 45% | 46% | 44% | 44% | 47% | 47% | 53% | 52% |
| No Doc | 6% | 6% | 7% | 6% | 5% | 5% | 4% | 5% | 5% |
| Other Doc (Lim, Red, Stated, etc) | 49% | 49% | 47% | 50% | 51% | 48% | 49% | 42% | 43% |
| | | | | | | | | | |
| 2-4 Family | 2% | 2% | 2% | 2% | 2% | 2% | 2% | 2% | 2% |
| Condo | 9% | 9% | 8% | 8% | 8% | 8% | 4% | 3% | 3% |
| Single Family | 88% | 88% | 89% | 89% | 89% | 89% | 55% | 56% | 53% |
| Other | 1% | 1% | 1% | 1% | 1% | 1% | 39% | 39% | 42% |
The Redwood Review 2nd Quarter | Appendix Table 12A - Residential CES Prime and Underlying Loan Characteristics | 97 |
| Table 12B: Residential Alt-A CES and Underlying Loan Characteristics ($ in thousands) |
|
Residential CES Alt A | Q2:2007 | Q1:2007 | Q4:2006 | Q3:2006 | Q2:2006 | Q1:2006 | Q4:2005 | Q3:2005 | Q2:2005 |
| Principal value | $365,837 | $348,371 | $298,780 | $272,957 | $243,391 | $184,513 | $154,794 | $144,521 | $170,543 |
| Unamortized premium | (30,054) | (41,680) | (26,440) | (26,849) | (11,700) | (17,960) | (16,752) | (8,520) | (10,849) |
| Credit protection | (150,801) | (128,772) | (115,315) | (107,140) | (115,170) | (68,077) | (58,241) | (58,323) | (67,319) |
| Unrealized market value | (12,626) | (5,932) | (166) | 52 | (879) | 246 | (99) | 5,942 | 5,427 |
| Market value (book value) | $172,356 | $171,987 | $156,859 | $139,020 | $115,642 | $98,722 | $79,702 | $83,620 | $97,802 |
| Market value / principal value | $47.11 | $49.37 | $52.50 | $50.93 | $47.51 | $53.50 | $51.49 | $57.86 | $57.35 |
| | | | | | | | | | |
Current Rating | | | | | | | | | |
| BB | $103,717 | $100,895 | $94,239 | $85,874 | $62,063 | $63,244 | $51,175 | $55,065 | $50,983 |
| B | 33,911 | 30,989 | 22,861 | 19,722 | 22,122 | 13,377 | 7,969 | 8,451 | 27,370 |
| Non Rated | 34,728 | 40,103 | 39,759 | 33,424 | 31,457 | 22,101 | 20,558 | 20,104 | 19,449 |
| Total market value | $172,356 | $171,987 | $156,859 | $139,020 | $115,642 | $98,722 | $79,702 | $83,620 | $97,802 |
| | | | | | | | | | |
Security Type | | | | | | | | | |
| Option ARM | $162,924 | $158,116 | $133,411 | $117,908 | $92,209 | $76,868 | $60,635 | $59,978 | $53,459 |
| ARM | 720 | 837 | 990 | 4,483 | 7,318 | 6,457 | 2,671 | 6,823 | 23,549 |
| Hybrid | 6,664 | 10,701 | 21,835 | 16,012 | 15,589 | 14,867 | 15,741 | 16,000 | 18,871 |
| Fixed | 2,048 | 2,333 | 623 | 616 | 526 | 529 | 654 | 819 | 1,922 |
| Total market value | $172,356 | $171,987 | $156,859 | $139,019 | $115,642 | $98,721 | $79,701 | $83,620 | $97,801 |
| | | | | | | | | | |
| Interest income | $5,632 | $4,143 | $4,312 | $1,872 | $1,746 | $2,235 | $1,926 | $1,732 | $1,508 |
| Discount amortization | 4,013 | 3,197 | 3,307 | 1,915 | 1,479 | 1,434 | 575 | 455 | 373 |
| Total interest income | $9,645 | $7,340 | $7,619 | $3,787 | $3,225 | $3,669 | $2,501 | $2,187 | $1,881 |
| | | | | | | | | | |
| Average Balance | $176,130 | $151,740 | $154,988 | $135,489 | $106,648 | $92,239 | $70,315 | $78,347 | $84,002 |
| | | | | | | | | | |
| Interest income % | 12.79% | 10.92% | 11.13% | 5.53% | 6.55% | 9.69% | 10.96% | 8.84% | 7.18% |
| Discount amort % | 9.11% | 8.43% | 8.53% | 5.65% | 5.55% | 6.22% | 3.27% | 2.32% | 1.78% |
| Yield | 21.90% | 19.35% | 19.66% | 11.18% | 12.10% | 15.91% | 14.23% | 11.17% | 8.96% |
| | | | | | | | | | |
Underlying Loan Characteristics | | | | | | | | | |
| Number of loans | 59,767 | 58,960 | 54,599 | 67,132 | 60,471 | 50,168 | 49,596 | 46,682 | 58,163 |
| Total loan face | $20,523,349 | $19,620,740 | $18,026,078 | $22,126,922 | $19,796,509 | $15,470,805 | $15,555,706 | $14,262,580 | $17,962,707 |
| Average loan size | $343 | $333 | $330 | $330 | $327 | $308 | $314 | $306 | $309 |
| | | | | | | | | | |
| Southern CA | 31% | 31% | 32% | 31% | 34% | 35% | 35% | 35% | 36% |
| Northern CA | 21% | 21% | 22% | 22% | 23% | 24% | 22% | 21% | 21% |
| Florida | 10% | 10% | 10% | 9% | 9% | 8% | 8% | 7% | 7% |
| New York | 2% | 2% | 2% | 2% | 1% | 1% | 1% | 1% | 1% |
| Georgia | 1% | 1% | 1% | 1% | 1% | 1% | 1% | 1% | 1% |
| New Jersey | 3% | 3% | 3% | 3% | 2% | 2% | 2% | 3% | 2% |
| Texas | 1% | 1% | 1% | 1% | 1% | 1% | 1% | 1% | 1% |
| Arizona | 4% | 4% | 4% | 4% | 3% | 3% | 2% | 2% | 2% |
| Illinois | 1% | 1% | 1% | 1% | 1% | 1% | 2% | 2% | 2% |
| Colorado | 3% | 3% | 3% | 3% | 3% | 3% | 3% | 4% | 3% |
| Virginia | 3% | 3% | 3% | 3% | 3% | 2% | 2% | 2% | 2% |
| Other states | 20% | 20% | 18% | 20% | 19% | 19% | 21% | 21% | 22% |
| | | | | | | | | | |
The Redwood Review 2nd Quarter | Appendix Table 12B - Residential CES Alt-A and Underlying Loan Characteristics | 98 |
| Table 12B: Residential Alt-A CES and Underlying Loan Characteristics ( $ in thousands) |
|
| | Q2:2007 | Q1:2007 | Q4:2006 | Q3:2006 | Q2:2006 | Q1:2006 | Q4:2005 | Q3:2005 | Q2:2005 |
| Year 2007 origination | 14% | 4% | 0% | 0% | 0% | 0% | 0% | 0% | 0% |
| Year 2006 origination | 23% | 25% | 21% | 19% | 9% | 1% | 0% | 0% | 0% |
| Year 2005 origination | 33% | 39% | 38% | 41% | 45% | 39% | 35% | 21% | 19% |
| Year 2004 origination and earlier | 30% | 32% | 41% | 40% | 46% | 60% | 65% | 79% | 81% |
| | | | | | | | | | |
| Wtd Avg Original LTV | 75% | 75% | 75% | 75% | 75% | 74% | 75% | 75% | 74% |
| Original LTV: 0 - 50 | 4% | 4% | 4% | 4% | 4% | 5% | 4% | 5% | 5% |
| Original LTV: 50.01 - 60 | 6% | 6% | 6% | 6% | 6% | 7% | 6% | 6% | 7% |
| Original LTV: 60.01 - 70 | 15% | 15% | 16% | 16% | 16% | 16% | 15% | 16% | 16% |
| Original LTV: 70.01 - 80 | 61% | 61% | 61% | 58% | 59% | 59% | 62% | 60% | 62% |
| Original LTV: 80.01 - 90 | 10% | 10% | 9% | 11% | 10% | 9% | 8% | 8% | 7% |
| Original LTV: 90.01 - 100 | 4% | 4% | 4% | 5% | 5% | 4% | 5% | 5% | 3% |
| Unknown | 0% | 0% | 0% | 0% | 0% | 0% | 0% | 0% | 0% |
| | | | | | | | | | |
| Wtd Avg FICO | 707 | 708 | 708 | 708 | 708 | 710 | 706 | 708 | 707 |
| FICO: <= 600 | 1% | 2% | 1% | 3% | 2% | 2% | 0% | 0% | 0% |
| FICO: 601 - 620 | 1% | 1% | 1% | 1% | 1% | 1% | 1% | 0% | 0% |
| FICO: 621 - 640 | 5% | 5% | 5% | 5% | 5% | 5% | 5% | 5% | 5% |
| FICO: 641 - 660 | 9% | 9% | 8% | 8% | 8% | 8% | 8% | 8% | 8% |
| FICO: 661 - 680 | 14% | 14% | 14% | 13% | 13% | 12% | 13% | 12% | 12% |
| FICO: 681 - 700 | 15% | 15% | 15% | 15% | 15% | 13% | 15% | 15% | 15% |
| FICO: 701 - 720 | 14% | 13% | 13% | 13% | 13% | 12% | 14% | 15% | 15% |
| FICO: 721 - 740 | 11% | 11% | 11% | 11% | 11% | 11% | 12% | 13% | 13% |
| FICO: 741 - 760 | 9% | 9% | 10% | 10% | 10% | 9% | 11% | 11% | 11% |
| FICO: 761 - 780 | 8% | 8% | 8% | 8% | 8% | 8% | 9% | 10% | 10% |
| FICO: 781 - 800 | 4% | 5% | 5% | 5% | 5% | 5% | 5% | 5% | 5% |
| FICO: >= 801 | 1% | 1% | 1% | 1% | 1% | 1% | 1% | 1% | 1% |
| Unknown | 7% | 7% | 8% | 7% | 8% | 13% | 6% | 5% | 5% |
| | | | | | | | | | |
| Conforming at Origination % | 47% | 49% | 52% | 53% | 53% | 56% | 46% | 49% | 48% |
| > $1 MM % | 12% | 10% | 9% | 8% | 7% | 7% | 6% | 6% | 6% |
| | | | | | | | | | |
| 2nd Home % | 6% | 6% | 6% | 5% | 5% | 5% | 5% | 5% | 5% |
| Investment Home % | 11% | 11% | 12% | 11% | 11% | 11% | 11% | 10% | 10% |
| | | | | | | | | | |
| Purchase | 35% | 37% | 41% | 42% | 40% | 41% | 45% | 47% | 48% |
| Cash Out Refi | 43% | 41% | 39% | 38% | 40% | 38% | 37% | 34% | 34% |
| Rate-Term Refi | 22% | 22% | 19% | 21% | 20% | 21% | 18% | 19% | 18% |
| Construction | 0% | 0% | 0% | 0% | 0% | 0% | 0% | 0% | 0% |
| Other | 0% | 0% | 0% | 0% | 0% | 0% | 0% | 0% | 0% |
| | | | | | | | | | |
| Full Doc | 17% | 18% | 23% | 24% | 22% | 22% | 19% | 19% | 19% |
| No Doc | 1% | 1% | 1% | 1% | 1% | 1% | 0% | 0% | 0% |
| Other Doc (Lim, Red, Stated, etc) | 74% | 71% | 67% | 64% | 67% | 62% | 81% | 81% | 81% |
| Unknown/Not Categorized | 8% | 10% | 9% | 11% | 10% | 15% | 0% | 0% | 0% |
| | | | | | | | | | |
| 2-4 Family | 4% | 4% | 4% | 4% | 4% | 4% | 4% | 3% | 3% |
| Condo | 11% | 11% | 11% | 11% | 11% | 11% | 1% | 1% | 1% |
| Single Family | 85% | 85% | 85% | 85% | 85% | 85% | 6% | 6% | 4% |
| Other | 0% | 0% | 0% | 0% | 0% | 0% | 89% | 90% | 92% |
The Redwood Review 2nd Quarter | Appendix Table 12B - Residential CES Alt-A and Underlying Loan Characteristics | 99 |
| Table 12C: Residential Subprime CES and Underlying Loan Characteristics ($ in thousands) |
|
Residential CES Subprime | Q2:2007 | Q1:2007 | Q4:2006 | Q3:2006 | Q2:2006 | Q1:2006 | Q4:2005 | Q3:2005 | Q2:2005 |
| Principal value | $9,625 | 11,219 | 9,841 | $9,841 | - | - | - | - | - |
| Unamortized premium | 2,893 | (1,426) | (1,387) | (1,407) | - | - | - | - | - |
| Credit protection | (9,341) | 0 | 0 | - | - | - | - | - | - |
| Unrealized market value | (347) | (652) | 849 | (15) | - | - | - | - | - |
| Market value (book value) | $2,830 | 9,141 | 9,303 | $8,419 | - | - | - | - | - |
| Market value / principal value | $29.40 | $81.48 | $94.53 | $85.55 | - | - | - | - | - |
| | | | | | | | | | |
Current Rating | | | | | | | | | |
| BB | $2,830 | $9,141 | $6,678 | $5,919 | - | - | - | - | - |
| B | - | - | - | - | - | - | - | - | - |
| Non Rated | - | - | 2,625 | 2,500 | - | - | - | - | - |
| Total market value | $2,830 | $9,141 | $9,303 | $8,419 | - | - | - | - | - |
| | | | | | | | | | |
Security Type | | | | | | | | | |
| Option ARM | $0 | $0 | $0 | $0 | - | - | - | - | - |
| ARM | - | - | - | - | - | - | - | - | - |
| Hybrid | 400 | 1,013 | 4,127 | 4,064 | - | - | - | - | - |
| Fixed | 2,430 | 8,128 | 5,176 | 4,355 | - | - | - | - | - |
| Total market value | $2,830 | $9,141 | $9,303 | $8,419 | - | - | - | - | - |
| | | | | | | | | | |
| Interest income | $215 | $186 | $151 | $51 | - | - | - | - | - |
| Discount amortization | 126 | 51 | 22 | 15 | - | - | - | - | - |
| Total interest income | $341 | $237 | $173 | $66 | - | - | - | - | - |
| | | | | | | | | | |
| Average Balance | $8,744 | $9,715 | $8,344 | $8,223 | - | - | - | - | - |
| | | | | | | | | | |
| Interest income % | 9.84% | 7.66% | 7.24% | 2.48% | - | - | - | - | - |
| Discount amort % | 5.76% | 2.10% | 1.05% | 0.73% | - | - | - | - | - |
| Yield | 15.60% | 9.76% | 8.29% | 3.21% | - | - | - | - | - |
| | | | | | | | | | |
Underlying Loan Characteristics | | | | | | | | | |
| Number of loans | 23,662 | 25,001 | 31,873 | 34,841 | - | - | - | - | - |
| Total loan face | $3,436,393 | $3,614,761 | $5,439,260 | $5,945,868 | - | - | - | - | - |
| Average loan size | $145 | $145 | $171 | $171 | - | - | - | - | - |
| | | | | | | | | | |
| Southern CA | 19% | 18% | 19% | 19% | - | - | - | - | - |
| Northern CA | 14% | 13% | 14% | 14% | - | - | - | - | - |
| Florida | 12% | 12% | 12% | 12% | - | - | - | - | - |
| New York | 4% | 4% | 4% | 4% | - | - | - | - | - |
| Georgia | 1% | 1% | 1% | 1% | - | - | - | - | - |
| New Jersey | 3% | 4% | 4% | 4% | - | - | - | - | - |
| Texas | 4% | 4% | 4% | 4% | - | - | - | - | - |
| Arizona | 5% | 5% | 4% | 4% | - | - | - | - | - |
| Illinois | 5% | 6% | 6% | 6% | - | - | - | - | - |
| Colorado | 2% | 2% | 2% | 2% | - | - | - | - | - |
| Virginia | 1% | 2% | 2% | 2% | - | - | - | - | - |
| Other states | 29% | 29% | 28% | 28% | - | - | - | - | - |
| | | | | | | | | | |
The Redwood Review 2nd Quarter | Appendix Table 12B - Residential CES Subprime and Underlying Loan Characteristics | 100 |
| Table 12C: Residential Subprime CES and Underlying Loan Characteristics ($ in thousands) |
|
| | Q2:2007 | Q1:2007 | Q4:2006 | Q3:2006 | Q2:2006 | Q1: 2006 | Q4:2005 | Q3:2005 | Q2:2005 |
| Year 2007 origination | 2% | 2% | 0% | 0% | - | - | - | - | - |
| Year 2006 origination | 98% | 98% | 100% | 100% | - | - | - | - | - |
| Year 2005 origination | 0% | 0% | 0% | 0% | - | - | - | - | - |
| Year 2004 origination and earlier | 0% | 0% | 0% | 0% | - | - | - | - | - |
| | | | | | | | | | |
| Wtd Avg Original LTV | 69% | 75% | 73% | 73% | - | - | - | - | - |
| Original LTV: 0 - 50 | 20% | 13% | 14% | 14% | - | - | - | - | - |
| Original LTV: 50.01 - 60 | 3% | 2% | 3% | 3% | - | - | - | - | - |
| Original LTV: 60.01 - 70 | 6% | 6% | 6% | 6% | - | - | - | - | - |
| Original LTV: 70.01 - 80 | 44% | 43% | 47% | 47% | - | - | - | - | - |
| Original LTV: 80.01 - 90 | 22% | 22% | 23% | 23% | - | - | - | - | - |
| Original LTV: 90.01 - 100 | 6% | 14% | 7% | 7% | - | - | - | - | - |
| Unknown | 0% | 0% | 0% | 0% | - | - | - | - | - |
| | | | | | | | | | |
| Wtd Avg FICO | 640 | 642 | 636 | 636 | - | - | - | - | - |
| FICO: <= 600 | 24% | 25% | 25% | 25% | - | - | - | - | - |
| FICO: 601 - 620 | 12% | 12% | 13% | 13% | - | - | - | - | - |
| FICO: 621 - 640 | 17% | 16% | 17% | 17% | - | - | - | - | - |
| FICO: 641 - 660 | 13% | 12% | 13% | 13% | - | - | - | - | - |
| FICO: 661 - 680 | 10% | 10% | 10% | 10% | - | - | - | - | - |
| FICO: 681 - 700 | 8% | 9% | 8% | 8% | - | - | - | - | - |
| FICO: 701 - 720 | 6% | 6% | 5% | 5% | - | - | - | - | - |
| FICO: 721 - 740 | 4% | 4% | 4% | 4% | - | - | - | - | - |
| FICO: 741 - 760 | 3% | 3% | 2% | 2% | - | - | - | - | - |
| FICO: 761 - 780 | 2% | 2% | 2% | 2% | - | - | - | - | - |
| FICO: 781 - 800 | 1% | 1% | 1% | 1% | - | - | - | - | - |
| FICO: >= 801 | 0% | 0% | 0% | 0% | - | - | - | - | - |
| Unknown | 0% | 0% | 0% | 0% | - | - | - | - | - |
| | | | | | | | | | |
| Conforming at Origination % | 77% | 77% | 75% | 75% | - | - | - | - | - |
| > $1 MM % | 0% | 0% | 0% | 0% | - | - | - | - | - |
| | | | | | | | | | |
| 2nd Home % | 2% | 2% | 1% | 1% | - | - | - | - | - |
| Investment Home % | 9% | 9% | 8% | 8% | - | - | - | - | - |
| | | | | | | | | | |
| Purchase | 52% | 52% | 50% | 50% | - | - | - | - | - |
| Cash Out Refi | 44% | 44% | 47% | 47% | - | - | - | - | - |
| Rate-Term Refi | 4% | 4% | 3% | 3% | - | - | - | - | - |
| Construction | 0% | 0% | 0% | 0% | - | - | - | - | - |
| Other | 0% | 0% | 0% | 0% | - | - | - | - | - |
| | | | | | | | | | |
| Full Doc | 50% | 49% | 53% | 53% | - | - | - | - | - |
| No Doc | 1% | 1% | 0% | 0% | - | - | - | - | - |
| Other Doc (Lim, Red, Stated, etc) | 49% | 50% | 47% | 47% | - | - | - | - | - |
| | | | | | | | | | |
| 2-4 Family | 8% | 7% | 7% | 7% | - | - | - | - | - |
| Condo | 7% | 7% | 7% | 7% | - | - | - | - | - |
| Single Family | 85% | 86% | 86% | 86% | - | - | - | - | - |
| Other | 0% | 0% | 0% | 0% | - | - | - | - | - |
The Redwood Review 2nd Quarter | Appendix Table 12B - Residential CES Subprime and Underlying Loan Characteristics | 101 |
|
| | Q2:2007 | Q1:2007 | Q4:2006 | Q3:2006 | Q2:2006 | Q1:2006 | Q4:2005 | Q3:2005 | Q2:2005 |
| | | | | | | | | | |
| Market Value | $34,168 | $50,057 | - | - | - | - | - | - | - |
| | | | | | | | | | |
Current Rating | | | | | | | | | |
| AAA | $1,804 | $2,038 | - | - | - | - | - | - | - |
| AA | - | - | - | - | - | - | - | - | - |
| A | 13,958 | 18,699 | - | - | - | - | - | - | - |
| BBB | 4,437 | 5,729 | - | - | - | - | - | - | - |
| BB | 3,775 | 4,185 | - | - | - | - | - | - | - |
| B | - | - | - | - | - | - | - | - | - |
| Non-rated | 10,194 | 19,406 | - | - | - | - | - | - | - |
| Total market value | $34,168 | $50,057 | - | - | - | - | - | - | - |
| | | | | | | | | | |
Security Type | | | | | | | | | |
| ARM | $398 | $422 | - | - | - | - | - | - | - |
| Option ARM | 2,597 | 3,198 | - | - | - | - | - | - | - |
| Hybrid | 29,245 | 43,969 | - | - | - | - | - | - | - |
| Fixed | 1,928 | 2,468 | - | - | - | - | - | - | - |
| Total market value | $34,168 | $50,057 | - | - | - | - | - | - | - |
| | | | | | | | | | |
| Interest income | $669 | $2,465 | - | - | - | - | - | - | - |
| | | | | | | | | | |
| Avg Balance | $44,061 | $37,169 | - | - | - | - | - | - | - |
| | | | | | | | | | |
| Yield | 6.07% | 26.53% | - | - | - | - | - | - | - |
| | | | | | | | | | |
The Redwood Review 2nd Quarter | Appendix Table 13 - OREI and Underlying Characteristics | 102 |
|
| | Q2:2007 | Q1:2007 | Q4:2006 | Q3:2006 | Q2:2006 | Q1:2006 | Q4:2005 | Q3:2005 | Q2:2005 |
| | | | | | | | | | |
| Residential Loans | $8,256,759 | $8,582,964 | $9,212,002 | $9,718,985 | $10,318,641 | $11,846,454 | $13,719,242 | $16,386,833 | $19,443,387 |
| Number of loans | 24,452 | 25,579 | 27,695 | 31,744 | 34,013 | 37,458 | 33,863 | 51,593 | 58,941 |
| Average loan size | $338 | $336 | $333 | $306 | $303 | $316 | $405 | $318 | $330 |
| |
| Adjustable % | 71% | 79% | 85% | 89% | 99% | 99% | 98% | 100% | 100% |
| Hybrid % | 29% | 20% | 15% | 11% | 1% | 1% | 2% | 0% | 0% |
| Fixed % | 0% | 1% | 0% | 0% | 0% | 0% | 0% | 0% | 0% |
| |
| Amortizing % | 5% | 4% | 3% | 3% | 1% | 1% | 1% | 0% | 0% |
| Interest-only % | 95% | 96% | 97% | 97% | 99% | 99% | 99% | 100% | 100% |
| Negatively amortizing % | 0% | 0% | 0% | 0% | 0% | 0% | 0% | 0% | 0% |
| |
| Southern California | 14% | 14% | 13% | 12% | 11% | 11% | 11% | 11% | 12% |
| Northern California | 11% | 10% | 10% | 10% | 10% | 10% | 12% | 11% | 12% |
| Florida | 12% | 13% | 12% | 12% | 13% | 12% | 13% | 12% | 11% |
| New York | 6% | 6% | 6% | 6% | 6% | 6% | 5% | 5% | 5% |
| Georgia | 4% | 5% | 5% | 5% | 5% | 5% | 5% | 5% | 5% |
| New Jersey | 4% | 4% | 4% | 4% | 4% | 4% | 4% | 4% | 4% |
| Texas | 5% | 5% | 5% | 5% | 5% | 5% | 4% | 4% | 4% |
| Arizona | 4% | 4% | 4% | 4% | 4% | 4% | 4% | 4% | 4% |
| Illinois | 3% | 3% | 3% | 3% | 2% | 2% | 2% | 3% | 3% |
| Colorado | 3% | 3% | 4% | 4% | 4% | 4% | 4% | 4% | 4% |
| Virginia | 3% | 3% | 3% | 3% | 3% | 3% | 3% | 3% | 3% |
| Other states (none greater than 3%) | 31% | 30% | 31% | 32% | 33% | 34% | 33% | 34% | 33% |
| |
| Year 2007 origination | 11% | 3% | 0% | 0% | 0% | 0% | 0% | 0% | 0% |
| Year 2006 origination | 18% | 19% | 17% | 10% | 0% | 0% | 0% | 0% | 0% |
| Year 2005 origination | 5% | 5% | 5% | 5% | 5% | 5% | 6% | 5% | 4% |
| Year 2004 origination or earlier | 66% | 73% | 78% | 85% | 95% | 95% | 94% | 95% | 96% |
| |
| Wtd Avg Original LTV | 68% | 68% | 68% | 68% | 68% | 68% | 69% | 68% | 69% |
| Original LTV: 0 - 50 | 15% | 15% | 16% | 15% | 15% | 15% | 13% | 14% | 13% |
| Original LTV: 50 - 60 | 11% | 12% | 12% | 12% | 12% | 12% | 11% | 11% | 11% |
| Original LTV: 60 - 70 | 20% | 20% | 20% | 20% | 21% | 21% | 21% | 20% | 20% |
| Original LTV: 70 - 80 | 47% | 46% | 45% | 46% | 45% | 45% | 48% | 46% | 47% |
| Original LTV: 80 - 90 | 2% | 2% | 2% | 2% | 2% | 2% | 2% | 2% | 2% |
| Original LTV: 90 - 100 | 5% | 5% | 5% | 5% | 5% | 5% | 5% | 7% | 7% |
| |
| Wtg Avg FICO | 732 | 727 | 733 | 730 | 730 | 730 | 731 | 731 | 731 |
| FICO: <= 600 | 1% | 1% | 1% | 1% | 1% | 1% | 1% | 1% | 1% |
| FICO: 601 -620 | 1% | 1% | 1% | 1% | 1% | 1% | 1% | 1% | 1% |
| FICO: 621 - 640 | 2% | 2% | 1% | 1% | 1% | 2% | 1% | 1% | 1% |
| FICO: 641 -660 | 3% | 3% | 3% | 3% | 3% | 3% | 3% | 3% | 3% |
| FICO: 661 - 680 | 7% | 7% | 8% | 8% | 8% | 8% | 8% | 8% | 8% |
| FICO: 681 - 700 | 12% | 12% | 12% | 12% | 12% | 12% | 12% | 12% | 12% |
| FICO: 701 - 720 | 14% | 14% | 14% | 14% | 14% | 14% | 15% | 14% | 14% |
| FICO: 721 - 740 | 13% | 13% | 13% | 14% | 13% | 13% | 13% | 14% | 14% |
| FICO: 741 - 760 | 15% | 15% | 15% | 15% | 15% | 15% | 15% | 15% | 15% |
| FICO: 761 - 780 | 17% | 17% | 17% | 17% | 17% | 17% | 17% | 17% | 17% |
| FICO: 781 - 800 | 13% | 12% | 12% | 12% | 12% | 11% | 11% | 11% | 11% |
| FICO: >= 801 | 4% | 3% | 3% | 2% | 3% | 3% | 3% | 3% | 3% |
| |
| |
| Conforming balance at origination % | 35% | 37% | 38% | 41% | 45% | 37% | 38% | 37% | 37% |
| % balance in loans > $1mm per loan | 15% | 16% | 18% | 14% | 14% | 14% | 13% | 14% | 13% |
| |
| 2nd home % | 11% | 11% | 11% | 11% | 11% | 11% | 10% | 10% | 10% |
| Investment home % | 3% | 3% | 3% | 3% | 3% | 3% | 2% | 2% | 2% |
| |
| Purchase | 35% | 35% | 34% | 34% | 33% | 33% | 33% | 33% | 33% |
| Cash out refinance | 32% | 31% | 32% | 32% | 32% | 34% | 34% | 34% | 34% |
| Rate-term refinance | 31% | 32% | 32% | 32% | 34% | 32% | 32% | 32% | 32% |
| Construction | 0% | 0% | 0% | 0% | 0% | 0% | 0% | 0% | 0% |
| Other | 2% | 2% | 2% | 2% | 1% | 1% | 1% | 1% | 1% |
The Redwood Review 2nd Quarter | Appendix Table 14 - Residential Real Estate Loan Characteristics | 103 |
| Table 15: Commercial Real Estate Loans Credit Performance ($ in thousands) |
| | | Managed Loans | Internally-Designated Credit Reserve | External Credit Enhancement | Total Credit Protection (1) | Total Credit Protection as % of Loans | Seriously Delinquent Loans | Seriously Delinquent Loan % of Current Balance | Total Credit Losses | Third Parties' Share of Net Charge-offs/ (Recoveries) | Redwood's Share of Net Charge-offs/ (Recoveries) | Total Credit Losses As % of Loans (Annualized) | |
| | | | | | | | | | | | | | |
Total Managed | Q2: 2005 | $31,324,563 | $95,351 | $681,133 | $776,484 | 2.48% | $35,971 | 0.11% | $1,213 | $1,213 | $0 | 0.02% | |
Commercial | Q3: 2005 | 40,081,879 | 146,671 | 706,532 | 853,203 | 2.13% | 20,690 | 0.05% | 59 | 59 | - | 0.00% | |
Portfolio | Q4: 2005 | 46,825,453 | 149,947 | 714,168 | 864,115 | 1.85% | 40,916 | 0.09% | - | - | - | 0.00% | |
| | 2005 | 46,825,453 | 149,947 | 714,168 | 864,115 | 1.85% | 40,916 | 0.09% | 1,587 | 1,272 | 315 | 0.00% | |
| | Q1: 2006 | 48,366,213 | 175,913 | 645,675 | 821,588 | 1.70% | 38,124 | 0.08% | 90 | 55 | 35 | 0.00% | |
| | Q2: 2006 | 51,635,796 | 200,275 | 653,476 | 853,751 | 1.65% | 44,632 | 0.09% | 1,463 | 1,463 | - | 0.01% | |
| | Q3: 2006 | 58,106,355 | 266,523 | 678,489 | 945,012 | 1.63% | 70,586 | 0.12% | 2,167 | 1,705 | 462 | 0.01% | |
| | Q4: 2006 | 57,789,159 | 303,481 | 472,669 | 776,150 | 1.34% | 64,367 | 0.11% | 1,156 | 1,132 | 24 | 0.01% | |
| | 2006 | 57,789,159 | 303,481 | 472,669 | 776,150 | 1.34% | 64,367 | 0.11% | 4,876 | 4,355 | 521 | 0.03% | |
| | Q1: 2007 | 57,450,042 | 304,955 | 551,917 | 856,872 | 1.49% | 77,726 | 0.14% | 1,471 | 1,417 | 24 | 0.01% | |
| | Q2: 2007 | $70,009,123 | $321,234 | $584,706 | $905,940 | 1.29% | $73,104 | 0.10% | $76 | $30 | $46 | 0.00% | |
| | | | | | | | | | | | | | |
Commercial | Q2: 2005 | $51,778 | $8,141 | $0 | $8,141 | 15.72% | $0 | 0.00% | $0 | $0 | $0 | 0.00% | |
Real Estate | Q3: 2005 | 66,348 | 8,141 | - | 8,141 | 12.27% | - | 0.00% | - | - | - | 0.00% | |
Loans | Q4: 2005 | 70,091 | 8,141 | - | 8,141 | 11.61% | - | 0.00% | - | - | - | 0.00% | |
| | 2005 | 70,091 | 8,141 | - | 8,141 | 11.61% | - | 0.00% | 315 | - | 315 | 0.45% | |
| | Q1: 2006 | 65,508 | 8,141 | - | 8,141 | 12.43% | - | 0.00% | 35 | - | 35 | 0.21% | |
| | Q2: 2006 | 46,959 | 8,141 | - | 8,141 | 17.34% | - | 0.00% | - | - | - | 0.00% | |
| | Q3: 2006 | 42,384 | 8,141 | - | 8,141 | 19.21% | - | 0.00% | - | - | - | 0.00% | |
| | Q4: 2006 | 38,360 | 8,141 | - | 8,141 | 21.22% | - | 0.00% | - | - | - | 0.00% | |
| | 2006 | 38,360 | 8,141 | - | 8,141 | 21.22% | - | 0.00% | 35 | - | 35 | 0.36% | |
| | Q1: 2007 | 38,394 | 10,489 | - | 10,489 | 27.32% | - | 0.00% | - | - | - | 0.00% | |
| | Q2: 2007 | $38,311 | $10,489 | $0 | $10,489 | 27.38% | $0 | 0.00% | $0 | $0 | $0 | 0.00% | |
| | | | | | | | | | | | | | |
Commercial CES | Q2: 2005 | $31,272,785 | $87,210 | $681,133 | $768,343 | 2.46% | $35,971 | 0.12% | $1,213 | $1,213 | $0 | 0.02% | |
| | Q3: 2005 | 40,015,531 | 138,530 | 706,532 | 845,062 | 2.11% | 20,690 | 0.05% | 59 | 59 | - | 0.00% | |
| | Q4: 2005 | 46,755,362 | 141,806 | 714,168 | 855,974 | 1.83% | 40,916 | 0.09% | - | - | - | 0.00% | |
| | 2005 | 46,755,362 | 141,806 | 714,168 | 855,974 | 1.83% | 40,916 | 0.09% | 1,272 | 1,272 | - | 0.00% | |
| | Q1: 2006 | 48,300,705 | 167,772 | 645,675 | 813,447 | 1.68% | 38,124 | 0.08% | 55 | 55 | - | 0.00% | |
| | Q2: 2006 | 51,588,837 | 192,134 | 653,476 | 845,610 | 1.64% | 44,632 | 0.09% | 1,463 | 1,463 | - | 0.01% | |
| | Q3: 2006 | 58,063,971 | 258,382 | 678,489 | 936,871 | 1.61% | 70,586 | 0.12% | 2,167 | 1,705 | 462 | 0.01% | |
| | Q4: 2006 | 57,750,799 | 295,340 | 472,669 | 768,009 | 1.33% | 64,367 | 0.11% | 1,156 | 1,132 | 24 | 0.01% | |
| | 2006 | 57,750,799 | 295,340 | 472,669 | 768,009 | 1.33% | 64,367 | 0.11% | 4,841 | 4,355 | 486 | 0.01% | |
| | Q1: 2007 | 57,411,648 | 294,466 | 551,917 | 846,383 | 1.47% | 77,726 | 0.14% | 1,471 | 1,417 | 24 | 0.01% | |
| | Q2: 2007 | $69,970,812 | $310,745 | $584,706 | $895,451 | 1.28% | $73,104 | 0.10% | $76 | $30 | $46 | 0.00% | |
| | | | | | | | | | | | | | |
(1) The credit reserve on commercial real estate loans is only available to absorb losses on our commercial real estate loan portfolio. Internally-designated credit reserves and external credit enhancement are only available to absorb losses on the commercial CES. Much of the external credit enhancement will share loan losses with Redwood rather than protect Redwood from losses. | |
| | |
The Redwood Review 2nd Quarter | Appendix Table 15 - Commercial Real Estate Loans Credit Performance | 104 |
| |
| | | | | | | | | | |
| | Q2:2007 | Q1:2007 | Q4:2006 | Q3:2006 | Q2:2006 | Q1:2006 | Q4:2005 | Q3:2005 | Q2:2005 |
| Commercial CES Loans | $69,970,812 | $57,411,648 | $57,750,799 | $58,063,971 | $51,588,837 | $48,300,705 | $46,755,362 | $40,015,531 | $31,272,785 |
| Number of loans | 4,648 | 3,968 | 3,889 | 4,032 | 3,456 | 3,737 | 3,618 | 2,866 | 2,248 |
| Average face value | $15,054 | $14,469 | $14,850 | $14,401 | $14,927 | $12,925 | $12,923 | $13,962 | $13,911 |
| | | | | | | | | | |
| | | | | | | | | | |
State Distribution | | | | | | | | | |
| CA | 16% | 17% | 17% | 18% | 18% | 17% | 17% | 16% | 18% |
| NY | 13% | 13% | 13% | 11% | 12% | 12% | 13% | 13% | 14% |
| TX | 8% | 8% | 8% | 5% | 6% | 6% | 6% | 7% | 7% |
| VA | 4% | 4% | 4% | 2% | 2% | 2% | 2% | 3% | 1% |
| FL | 6% | 6% | 6% | 5% | 5% | 5% | 5% | 5% | 4% |
| Other | 52% | 52% | 52% | 59% | 57% | 58% | 57% | 56% | 56% |
| | | | | | | | | | |
Property Type Distribution | | | | | | | | | |
| Office | 38% | 35% | 37% | 30% | 36% | 32% | 37% | 39% | 40% |
| Retail | 30% | 30% | 31% | 32% | 32% | 33% | 33% | 34% | 34% |
| Multi-family | 15% | 12% | 12% | 11% | 11% | 16% | 12% | 10% | 10% |
| Hospitality | 7% | 7% | 7% | 6% | 5% | 7% | 3% | 5% | 4% |
| Self-storage | 2% | 3% | 3% | 0% | 0% | 0% | 0% | 0% | 0% |
| Industrial | 4% | 3% | 3% | 1% | 1% | 2% | 2% | 1% | 2% |
| Other | 4% | 10% | 7% | 20% | 15% | 10% | 13% | 11% | 10% |
| | | | | | | | | | |
| Weighted average LTV | 70% | 68% | 69% | 69% | 69% | 68% | 68% | 68% | 67% |
| | | | | | | | | | |
| Weighted average debt service coverage ratio | 1.59 | 1.73 | 1.60 | 1.72 | 1.75 | 1.99 | 2.05 | 1.88 | 1.79 |
| | | | | | | | | | |
The Redwood Review 2nd Quarter | Appendix Table 16 - Commercial CES Loan Characteristics | 105 |
|
| | | | | | | | | |
| | Q2:2007 | Q1:2007 | Q4:2006 | Q3:2006 | Q2:2006 | Q1:2006 | Q4:2005 | Q3:2005 |
| Commercial mortgage loans, reported value | $25,827 | $25,883 | $28,172 | $32,170 | $36,722 | $55,167 | $59,692 | $56,102 |
| Number of loans | 7 | 7 | 7 | 8 | 9 | 12 | 13 | 12 |
| Average loan size | $3,690 | $3,698 | $4,025 | $4,021 | $4,080 | $4,597 | $4,592 | $4,675 |
| Seriously delinquent loans | - | - | - | - | - | - | - | - |
| Realized credit losses | - | - | - | - | - | - | - | - |
| California % (based on reported value) | 1% | 1% | 7% | 7% | 6% | 19% | 25% | 28% |
| | | | | | | | | |
The Redwood Review 2nd Quarter | Appendix Table 17 - Commercial Real Estate Loan Characteristics | 106 |
| Table 18: Securities Portfolios Credit Rating and Collateral Type ($ in millions) |
| |
At June 30, 2007: | CURRENT RATING AT 6/30/2007 |
| | Total | AAA | AA | A | BBB | BB | B | Unrated |
| Residential prime | $1,440 | $153 | $180 | $255 | $282 | $318 | $131 | $121 |
| Residential alt-a | 1,028 | 235 | 101 | 271 | 249 | 103 | 34 | 35 |
| Residential sub-prime | 440 | 14 | 154 | 149 | 120 | 3 | - | - |
| Other real estate investments | 34 | 2 | - | 14 | 4 | 4 | - | 10 |
| Commercial | 563 | 8 | 4 | 23 | 76 | 215 | 99 | 137 |
| CDO | 256 | 81 | 30 | 48 | 76 | 13 | - | 8 |
Total securities portfolio market value | $3,760 | $493 | $469 | $760 | $807 | $656 | $264 | $311 |
| |
At March 31, 2007: | CURRENT RATING AT 3/31/2007 |
| | Total | AAA | AA | A | BBB | BB | B | Unrated |
| Residential prime | $1,361 | $67 | $180 | $247 | $295 | $316 | $132 | $124 |
| Residential alt-a | 938 | 207 | 92 | 225 | 243 | 101 | 30 | 40 |
| Residential sub-prime | 480 | 8 | 152 | 173 | 138 | 9 | - | - |
| Other real estate investments | 50 | 2 | - | 19 | 6 | 4 | - | 19 |
| Commercial | 551 | 9 | 4 | 24 | 79 | 222 | 89 | 124 |
| CDO | 270 | 86 | 27 | 57 | 84 | 13 | - | 3 |
Total securities portfolio market value | $3,650 | $379 | $455 | $745 | $845 | $665 | $251 | $310 |
|
At December 31, 2006: | CURRENT RATING AT 12/31/2006 |
| | Total | AAA | AA | A | BBB | BB | B | Unrated |
| Residential prime | $1,278 | $14 | $181 | $243 | $285 | $307 | $119 | $129 |
| Residential alt-a | 613 | 136 | 84 | 106 | 130 | 94 | 23 | 40 |
| Residential sub-prime | 528 | 8 | 127 | 209 | 174 | 7 | - | 3 |
| Commercial | 568 | 9 | 2 | 16 | 93 | 224 | 90 | 134 |
| CDO | 246 | 66 | 30 | 52 | 76 | 14 | - | 8 |
Total securities portfolio market value | $3,233 | $233 | $424 | $626 | $757 | $648 | $232 | $313 |
|
The Redwood Review 2nd Quarter | Appendix Table 18 - Securities Portfolios Credit Rating and Collateral Type | 107 |
| |
Sequoia ABS Issued | Issue Date | Original Issue Amount | Stated Maturity | Estimated Callable Date | Outstanding Balance June 30, 2007 |
| Sequoia 1 | 07/29/97 | $534,347 | 2028 | Called | $0 |
| Sequoia 2 | 11/06/97 | 749,160 | 2029 | Called | - |
| Sequoia 3 | 06/26/98 | 635,288 | 2028 | Called | - |
| Sequoia 1A | 05/04/99 | 157,266 | 2028 | Called | - |
| Sequoia 4 | 03/21/00 | 377,119 | 2024 | 2007 | 60,600 |
| Sequoia 5 | 10/29/01 | 510,047 | 2026 | 2007 | 87,695 |
| Sequoia 6 | 04/26/02 | 506,142 | 2027 | 2007 | 90,669 |
| Sequoia 7 | 05/29/02 | 572,000 | 2032 | Called | - |
| Sequoia 8 | 07/30/02 | 642,998 | 2032 | Called | - |
| Sequoia 9 | 08/28/02 | 558,266 | 2032 | 2007 | 79,698 |
| Sequoia 10 | 09/26/02 | 1,041,600 | 2027 | 2008 | 184,600 |
| Sequoia 11 | 10/30/02 | 704,936 | 2032 | 2007 | 103,311 |
| Sequoia 12 | 12/19/02 | 1,096,891 | 2033 | Called | - |
| Sequoia 2003-1 | 02/27/03 | 1,012,321 | 2033 | 2007 | 170,783 |
| Sequoia 2003-2 | 04/29/03 | 815,080 | 2022 | 2007 | 138,001 |
| Sequoia 2003-3 | 06/26/03 | 538,452 | 2023 | 2007 | 93,673 |
| MLCC 2003-C | 06/26/03 | 984,349 | 2023 | 2008 | 183,670 |
| MLCC 2003-D | 07/29/03 | 1,003,591 | 2028 | 2008 | 198,365 |
| Sequoia 2003-4 | 07/29/03 | 504,273 | 2033 | 2007 | 141,595 |
| Sequoia 2003-5 | 08/27/03 | 840,248 | 2033 | 2007 | 117,566 |
| Sequoia 2003-6 | 10/29/03 | 649,999 | 2033 | Called | - |
| Sequoia 2003-7 | 11/25/03 | 811,707 | 2034 | Called | - |
| Sequoia 2003-8 | 12/23/03 | 964,238 | 2034 | 2007 | 166,344 |
| MLCC 2003-E | 08/28/03 | 983,852 | 2028 | 2008 | 194,514 |
| MLCC 2003-F | 09/25/03 | 1,297,913 | 2028 | 2007 | 251,942 |
| MLCC 2003-H | 12/22/03 | 739,196 | 2029 | 2008 | 134,184 |
The Redwood Review 2nd Quarter | Appendix Table 19 Sequoia ABS Issued | 108 |
| Table 19: Sequoia ABS Issued ($ in thousands) |
| |
Sequoia ABS Issued | Issue Date | Original Issue Amount | Stated Maturity | Estimated Callable Date | Outstanding Balance June 30, 2007 |
| Sequoia 2004-1 | 01/28/04 | $616,562 | 2034 | 2007 | $105,125 |
| Sequoia 2004-2 | 02/25/04 | 690,548 | 2034 | Called | - |
| Sequoia 2004-3 | 03/30/04 | 917,673 | 2034 | 2007 | 130,677 |
| Sequoia 2004-4 | 04/29/04 | 808,933 | 2010 | 2007 | 122,198 |
| Sequoia 2004-5 | 05/27/04 | 831,540 | 2012 | 2008 | 137,030 |
| Sequoia 2004-6 | 06/29/04 | 910,662 | 2012 | 2008 | 173,056 |
| SEMHT 2004-01 | 06/29/04 | 317,044 | 2014 | 2008 | 75,571 |
| Sequoia 2004-7 | 07/29/04 | 1,032,685 | 2034 | 2008 | 179,730 |
| Sequoia 2004-8 | 08/27/04 | 807,699 | 2034 | 2008 | 176,976 |
| Sequoia 2004-9 | 09/29/04 | 772,831 | 2034 | 2008 | 195,266 |
| Sequoia 2004-10 | 10/28/04 | 673,356 | 2034 | 2008 | 160,143 |
| Sequoia 2004-11 | 11/23/04 | 705,746 | 2034 | 2008 | 210,777 |
| Sequoia 2004-12 | 12/22/04 | 821,955 | 2035 | 2008 | 195,459 |
| Sequoia 2005-1 | 01/27/05 | 409,071 | 2035 | 2008 | 112,440 |
| Sequoia 2005-2 | 02/24/05 | 338,481 | 2035 | 2008 | 81,427 |
| Sequoia 2005-3 | 04/28/05 | 359,182 | 2035 | 2008 | 102,348 |
| Madrona 2005-A | 08/25/05 | 5,400 | 2008 | 2008 | 5,400 |
| Sequoia 2005-4 | 09/29/05 | 324,576 | 2035 | 2009 | 195,074 |
| Sequoia 2006-1 | 08/30/06 | 742,507 | 2046 | 2011 | 604,377 |
| Sequoia 2007-1 | 03/30/07 | 864,089 | 2047 | 2015 | 821,307 |
| Sequoia 2007-2 | 05/25/07 | 1,018,484 | 2038 | 2017 | 994,791 |
Total Sequoia ABS Issuance | | $33,200,303 | | | $7,176,382 |
The Redwood Review 2nd Quarter | Appendix Table 19 Sequoia ABS Issued | 109 |
| |
Sequoia ABS IO's Issued | Issue Date | Original Issue Amount | Stated Maturity | Estimated Callable Date | Outstanding Balance At June 30, 2007 |
| MLCC 2003-C X-A-2 | 06/26/03 | $12,662 | 2007 | 2007 | $0 |
| MLCC 2003-D X-A-1 | 07/29/03 | 22,371 | 2007 | 2007 | - |
| MLCC 2003-E X-A-1 | 08/28/03 | 16,550 | 2007 | 2007 | 138 |
| MLCC 2003-F X-A-1 | 09/25/03 | 18,666 | 2007 | 2007 | - |
| Sequoia 2003-6 X-1 | 10/29/03 | 8,220 | 2007 | Called | - |
| SMFC 2003A AX1 | 10/31/03 | 70,568 | 2007 | 2007 | 495 |
| Sequoia 2003-7 X-1 | 11/25/03 | 10,345 | 2007 | Called | - |
| Sequoia 2003-8 X-1 | 12/23/03 | 12,256 | 2007 | 2007 | - |
| Sequoia 2004-1 X-1 | 01/28/04 | 7,801 | 2007 | 2007 | - |
| Sequoia 2004-2 X-1 | 02/25/04 | 8,776 | 2007 | Called | - |
| SMFC 2004A AX1 | 02/26/04 | 10,626 | 2007 | 2007 | 297 |
| MLCC 2003-H X-A-1 | 12/22/03 | 10,430 | 2007 | 2007 | 469 |
| Sequoia 2004-4 X-1 | 05/28/04 | 9,789 | 2010 | 2007 | 281 |
| Sequoia 2004-5 X-1 | 05/27/04 | 3,371 | 2012 | 2008 | 154 |
| Sequoia 2004-6 X-A | 06/29/04 | 10,884 | 2012 | 2008 | 2,874 |
| Sequoia 2004-7 X-A | 07/29/04 | 12,145 | 2034 | 2008 | 3,590 |
| Sequoia 2004-8 X-A | 08/27/04 | 18,270 | 2034 | 2008 | 5,380 |
| Sequoia 2004-9 X-A | 09/29/04 | 16,951 | 2034 | 2008 | 5,642 |
| Sequoia 2004-10 X-A | 10/28/04 | 14,735 | 2034 | 2008 | 4,887 |
| Sequoia 2004-11 X-A-1 | 11/23/04 | 12,603 | 2034 | 2008 | 4,732 |
| Sequoia 2004-11 X-A-2 | 11/23/04 | 4,697 | 2034 | 2008 | 1,973 |
| Sequoia 2004-12 X-A-1 | 12/22/04 | 14,453 | 2035 | 2008 | 5,158 |
| Sequoia 2004-12 X-A-2 | 12/22/04 | 5,081 | 2035 | 2008 | 5,081 |
| Sequoia 2005-1 X-A | 01/27/05 | 9,669 | 2035 | 2008 | 3,748 |
| Sequoia 2005-2 X-A | 02/24/05 | 7,484 | 2035 | 2008 | 2,769 |
| Sequoia 2005-3 X-A | 04/28/05 | 8,183 | 2035 | 2008 | 3,518 |
Total Sequoia Issuance | | $357,586 | | | $51,187 |
The Redwood Review 2nd Quarter | Appendix Table 20 - Sequoia IO ABS Issued | 110 |
| Table 21: Acacia CDO ABS Issued ($ in thousands) |
|
CDO Issuance | Issue Date | Original Issue Amount | Stated Maturity | Optional Redemption Date | Principal Outstanding At June 30, 2007 |
| Acacia CDO 1 | 12/10/02 | $285,000 | 2023 | Called | $0 |
| Acacia CDO 2 | 05/13/03 | 283,875 | 2023 | Called | - |
| Acacia CDO 3 | 11/04/03 | 284,250 | 2038 | Called | - |
| Acacia CDO 4 | 04/08/04 | 293,400 | 2039 | Called | - |
| Acacia CDO 5 | 07/14/04 | 282,125 | 2039 | 2007 | 245,560 |
| Acacia CDO 6 | 11/09/04 | 282,000 | 2040 | 2007 | 270,540 |
| Acacia CDO 7 | 03/10/05 | 282,000 | 2045 | 2008 | 281,112 |
| Acacia CDO 8 | 07/14/05 | 252,000 | 2045 | 2008 | 251,345 |
| Acacia CRE 1 | 12/14/05 | 261,750 | 2045 | 2010 | 261,543 |
| Acacia CDO 9 | 03/09/06 | 277,800 | 2046 | 2009 | 277,787 |
| Acacia CDO 10 | 08/02/06 | 436,500 | 2046 | 2009 | 436,500 |
| Acacia CDO 11 | 02/15/07 | 476,660 | 2047 | 2010 | 476,660 |
| Acacia CDO 12 | 05/18/07 | 458,000 | 2047 | 2010 | 458,000 |
| Acacia CDO OA 1 (1) | 06/14/07 | 486,000 | 2052 | 2010 | 494,800 |
| | | | | | |
Total Acacia CDO Issuance | | $4,641,360 | | | $3,453,848 |
| | | | | | |
(1) The principal outstanding for Acacia CDO OA 1 includes $8.8 million of additional principal outstanding related to deal issuance costs.
The Redwood Review 2nd Quarter | Appendix Table 21 - Sequoia CDO ABS Issued | 111 |