Introduction | | | 2 | |
Shareholder Letter | | | 3 | |
Quarterly Overview | | | 5 | |
Mark-to-Market Adjustments | | | 12 | |
| | | | | |
Financial and Business Modules | | | | |
| | | | | |
| • Financial | | | 22 | |
| • Residential | | | 32 | |
| • Commercial | | | 54 | |
| • CDO | | | 61 | |
| • Capital and Liquidity | | | 66 | |
| • Debt | | | 68 | |
| • ABS Issued | | | 70 | |
| | | | | |
Appendix | | | | |
| • Glossary | | | 76 | |
| • Financial Tables | | | 83 | |
The Redwood Review 3rd Quarter 2007 | | 1 |
Note to Readers:
We file quarterly reports (on Form 10-Q) and annual reports (on Form 10-K) with the Securities and Exchange Commission. These filings and our earnings press releases provide information about our financial results in accordance with Generally Accepted Accounting Principles (GAAP). We urge you to review these documents, which are available through our web site, www.redwoodtrust.com.
This document, called the Redwood Review, provides supplemental information about Redwood through a discussion of many GAAP as well as non-GAAP metrics, such as core earnings and taxable income. We believe that these figures provide additional insight into Redwood’s business and future prospects. In each case in which we discuss a non-GAAP metric, you will find an explanation of how it has been calculated and why we think the figure is important. In the Appendix, you will find reconciliations between GAAP and non-GAAP figures. We hope you find the Redwood Review to be helpful to your understanding of our business.
The form and content of the Redwood Review will likely change over time. We welcome your input and suggestions.
Selected Financial Highlights
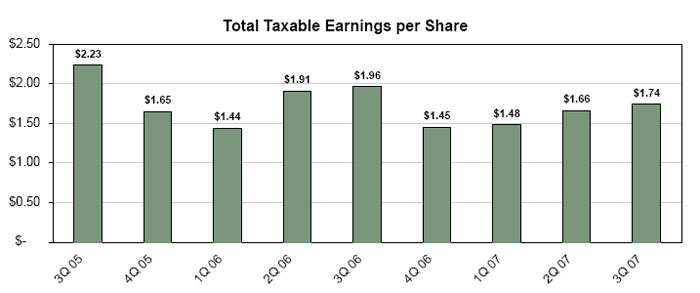
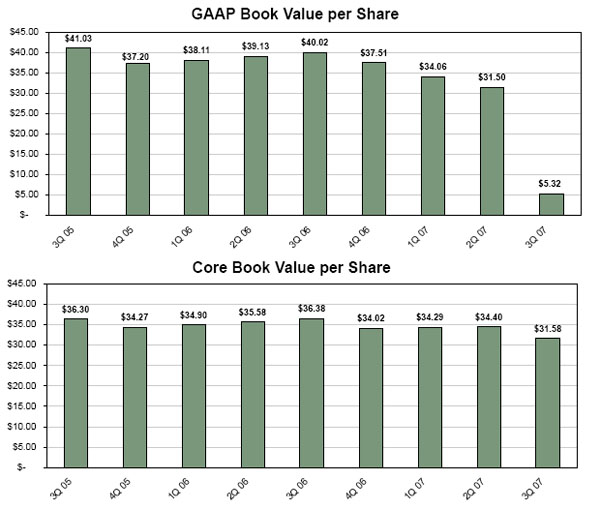
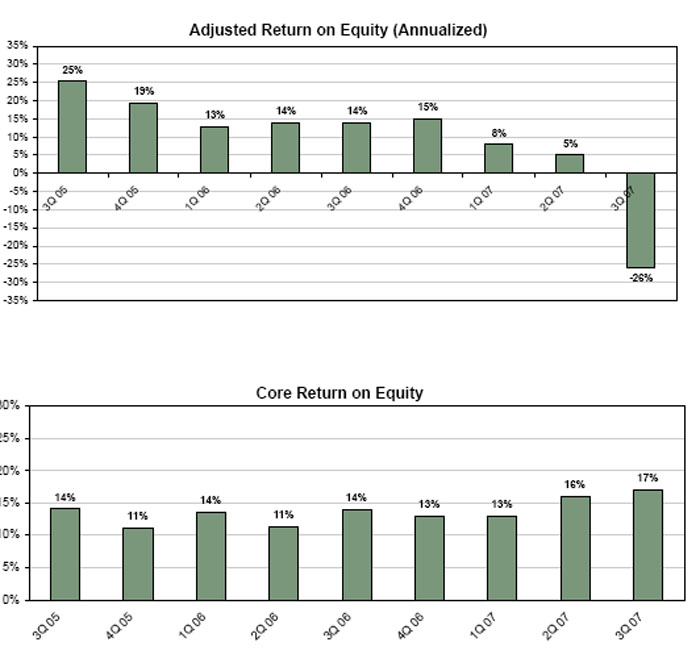
Quarter: Year | GAAP Earnings per Share | Core Earnings per Share | Total Taxable Earnings per Share | Adjusted Return on Equity | GAAP Book Value per Share | Core Book Value per Share | Total Dividends per Share |
Q3:05 | $2.21 | $1.22 | $2.23 | 25% | $41.03 | $36.30 | $0.70 |
Q4:05 | $1.68 | $0.97 | $1.65 | 19% | $37.20 | $34.27 | $3.70 |
Q1:06 | $1.09 | $1.16 | $1.44 | 13% | $38.11 | $34.90 | $0.70 |
Q2:06 | $1.20 | $0.97 | $1.91 | 14% | $39.13 | $35.58 | $0.70 |
Q3:06 | $1.22 | $1.20 | $1.96 | 14% | $40.02 | $36.38 | $0.70 |
Q4:06 | $1.32 | $1.12 | $1.45 | 15% | $37.51 | $34.02 | $3.70 |
Q1:07 | $0.66 | $1.08 | $1.48 | 8% | $34.06 | $34.29 | $0.75 |
Q2:07 | $0.41 | $1.35 | $1.66 | 5% | $31.50 | $34.40 | $0.75 |
Q3:07 | ($2.18) | $1.43 | $1.74 | (26%) | $5.32 | $31.58 | $0.75 |
Cautionary Statement: This Redwood Review contains forward-looking statements within the safe harbor provisions of the Private Securities Litigation Reform Act of 1995. Forward-looking statements involve numerous risks and uncertainties. Our actual results may differ from our expectations, estimates, and projections and, consequently, you should not rely on these forward-looking statements as predictions of future events. Forward-looking statements are not historical in nature and can be identified by words such as “anticipate,” “estimate,” “will,” “should,” “expect,” “believe,” “intend,” “seek,” “plan,” and similar expressions or their negative forms, or by references to strategy, plans, or intentions. These forward-looking statements are subject to risks and uncertainties, including, among other things, those described in our Annual Report on Form 10-K for the year ended December 31, 2006 under the caption “Risk Factors.” Other risks, uncertainties, and factors that could cause actual results to differ materially from those projected are described below and may be described from time to time in reports we file with the Securities and Exchange Commission (SEC), including reports on Forms 10-K, 10-Q, and 8-K. We undertake no obligation to update or revise any forward-looking statements, whether as a result of new information, future events, or otherwise.
Important factors, among others, that may affect our actual results include: changes in interest rates; changes in prepayment rates; general economic conditions, particularly as they affect the price of earning assets and the credit status of borrowers; the availability of high quality assets for purchase at attractive prices; declines in home prices; increases in mortgage payment delinquencies; changes in the level of liquidity in the capital markets which may adversely affect our ability to finance our real estate asset portfolio; changes in liquidity in the market for real estate securities, the re-pricing of credit risk in the capital markets, rating agency downgrades of securities and increases in the supply of real estate securities available for sale, each of which may adversely affect the values of securities we own; the extent of changes in the values of securities we own and the impact of adjustments reflecting those changes on our income statement and balance sheet, including our stockholders’ equity; our ability to maintain the positive stockholders’ equity necessary to enable us to pay the dividends required to maintain our status as a real estate investment trust for tax purposes; and other factors not presently identified. This Redwood Review contains statistics and other data that in some cases have been obtained from or compiled from information made available by servicers and other third-party service providers.
| 2 | | The Redwood Review 3rd Quarter 2007 |
Dear Fellow Shareholders:
To us, the best way to characterize Redwood’s economic progress in the third quarter is to call it “mixed.”
On the one hand, our strategy of structuring our balance sheet in a way that minimizes liquidity risk paid off, and our prospects in the midst of the mortgage market turmoil are excellent and continue to improve. Net interest income is strong, operating expenses are down, realized credit losses remained very low, and core income and taxable income results are excellent. On the other hand, the amount of our assets for which we have heightened credit concerns, while remaining relatively limited, has grown during the quarter.
Our balance sheet and income statement results as reported under GAAP accounting are not representative of how we view the economics of our company. That is particularly true this quarter, largely due to current GAAP rules which require us to mark-to-market assets that are consolidated for GAAP purposes but do not permit us to mark-to-market the corresponding paired liabilities. The impact of this inconsistent treatment of assets and liabilities consolidated on our GAAP balance sheet and income statement could lead one to draw inaccurate conclusions about the health of our business. We encourage you to read the detailed discussion on the real economics of our business in the pages that follow.
At quarter end, our unrestricted cash exceeds our short-term debt by $271 million. We have no liquidity issues, we have the absolute ability to hold all our current assets to maturity, and we do not need to raise additional capital in order to fund substantial growth in invested assets over the next year.
We continue to expect healthy ongoing cash flows from our existing assets. These assets have substantial upside potential, and we continue to expect to realize a healthy amount of this potential over the next five to ten years.
A relatively small percentage of our assets now look like they will disappoint. The good news is that most of these assets are segregated within securitizations and thus Redwood’s exposure is limited. For instance, many of the assets that are of concern are owned by the last four Acacia CDO entities in which we invested. Our net cash investment in these entities is fairly small. Overall, including our investment in Acacia, less than 15% of our equity base is exposed to assets that look like they may underperform our initial expectations. We are not pleased with this, but we realize it could be worse.
The well publicized liquidity crisis has brought some long overdue changes to the residential and commercial mortgage markets. A renewed appreciation for credit risk has new asset spreads at the widest levels we have seen in years. More stringent underwriting is leading to improvements in loan quality, and the overall level of exuberance has greatly subsided. We have started to make attractive investments in new residential transactions and in seasoned assets sold at a discount by forced sellers. We expect to have excellent residential and commercial investment opportunities going forward, both for our balance sheet and for one or more third-party asset management accounts we intend to create and market to generate fee income for Redwood.
The Redwood Review 3rd Quarter 2007 | | 3 |
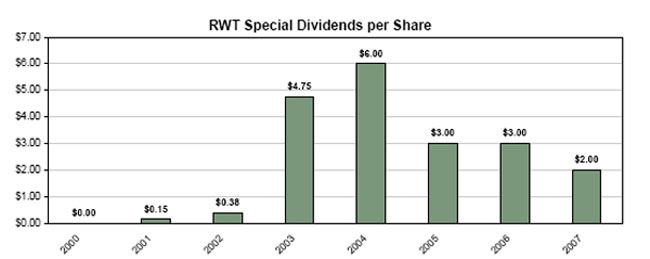
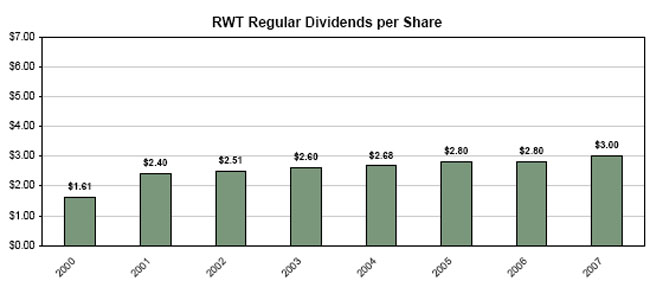
Strong taxable income has enabled us to declare a $2.00 per share special dividend for 2007 and we expect to continue our $3.00 per share regular dividend for 2008. In addition to this, while we believe the payment of a special dividend is possible for 2008, the amount will depend largely on the amount of credit losses we actually realize during the year.
Preparing for these current market events over the last two years was not easy. It was not completely clear during this period that selling off risk, reducing growth, and holding large unutilized cash balances would ultimately prove to be a good strategy, but we believe in hindsight that it was.
Moving ahead from here will be more straightforward - we will absorb losses from some of our assets, while also realizing strong cash flows from most of our assets and taking advantage of the ample opportunities in this new mortgage world.
We hope stock market participants will look at our GAAP income and book value results, understand what is to be learned there, and then look at our economic disclosures to get the rest of the picture. We have confidence in the long-term value of our assets and, through our recently authorized stock repurchase program, we are ready to repurchase shares if we believe they are trading at attractive levels.
We have been through several liquidity and credit cycles in the past. Each time we have emerged as a stronger company, and we believe we are well positioned to do so again this time around. Our current liquidity position and our balance sheet are strong, and we believe we are in a good position to continue to develop our businesses and their competitive advantages over time.
Sincerely,
| | |
| George E. Bull, III | | Douglas B. Hansen |
Chairman and CEO | | President |
| 4 | | The Redwood Review 3rd Quarter 2007 |
During the third quarter, our GAAP loss was $2.18 per share, reflecting significant asset market value declines recognized through our income statement. Core earnings, which exclude market valuation adjustments and are described later in this Review, were $1.43 per share. Estimated total taxable earnings were $1.74 per share. Reported GAAP book value was $5.32 per share and core book value was $31.58 per share at September 30, 2007. GAAP book value includes an asymmetrical mark-to-market of some assets but not consolidated liabilities, whereas core book value does not include mark-to-market valuations. We would caution that we believe that none of these metrics individually provide, on their own, an especially useful measure of our results or our balance sheet. Details and caveats regarding the use and determination of these calculations are found later in this Review.
Given the turmoil in the capital markets during the quarter, we limited our acquisition activity and focused our efforts on further strengthening our liquidity position and freeing up capital for deployment into higher yielding assets. We also focused our efforts on fostering and reinforcing business relationships to assure our business partners of our long-term positive market outlook.
During the third quarter, in order to free up capital, we securitized our whole loan inventory and sold AAA-rated securities. We realized some small losses on our asset sales, and the securitizations we completed during the quarter will likely generate a small negative yield for us in future quarters since the securities were sold at relatively high yields. Under the circumstances, we considered these outcomes to be an acceptable price to pay to free up capital for new asset acquisitions.
Our net liquidity position was strong at the beginning of the third quarter and even stronger at September 30, 2007.
Net Liquidity Position ($ in millions) |
| | | Sept. 30, 2007 | | June 30, 2007 | |
| | | | | | |
| Unrestricted cash | | | $310 | | | $83 | |
| Unsecuritized residential loans | | | 6 | | | 888 | |
| AAA-rated residential securities | | | 45 | | | 168 | |
| | | | | | | | |
| Liquid assets | | | 361 | | | 1,139 | |
| Repo and CP borrowings | | | (39 | ) | | (849 | ) |
| | | | | | | | |
Net Liquidity Position | | | $322 | | | $290 | |
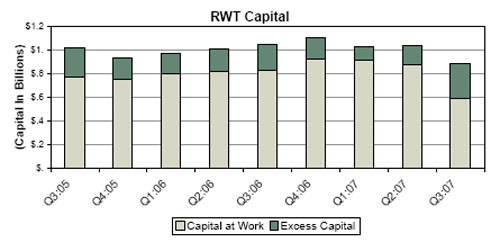
Our excess capital position during the quarter also increased from $158 million at June 30, 2007 to $298 million at September 30, 2007. We derive our excess capital by calculating the cash we would have available for investment if we fully leveraged our loans and securities in accordance with our internal risk-adjusted capital policies and deducted our estimate of cash necessary to fund operations and working capital, and provide for any liquidity risks. We include long-term subordinated notes as part of our capital base calculations.
The Redwood Review 3rd Quarter 2007 | | 5 |
Third Quarter 2007 (continued)
We believe our strengthened liquidity and capital positions provide us with options and flexibility. We are well positioned to build our franchise and make good long-term investments in our core residential and commercial credit-enhancement business. In addition, if we believe Redwood shares are trading at attractive levels relative to other uses of cash, we have the liquidity and capital resources to repurchase Redwood shares. In that regard, on November 5, 2007, Redwood’s Board of Directors authorized Redwood to purchase up to five million shares of Redwood common stock. The Board authorization replaces a previously Board-authorized stock purchase program under which Redwood had remaining authority to purchase up to one million shares.
In the near term, we expect to finance most of our new investments with capital. In today’s turbulent market, CDO financing is unavailable and short-term borrowing facilities remain unstable. This condition will temporarily slow our acquisitions of loans and investment-grade securities, but it will not impact the acquisition of core residential and commercial credit-enhancement securities as we fund these assets with capital. We are beginning to see some attractive core business opportunities, in particular, for new and seasoned prime residential credit-enhancement securities.
We are also pursuing attractive investment opportunities to acquire CDO and subprime securities that are trading at high risk-adjusted returns. This represents a growing market opportunity that we believe could offer exceptional upside potential. Our subprime and CDO structuring and investment expertise gives us a competitive advantage in evaluating these investments. As we continue to allocate capital to our core residential and commercial credit-enhancement businesses, we expect that our capital available for investments in CDO and subprime securities will be limited relative to the amount of opportunity we expect to become available. For that reason, we are considering raising third-party capital through a new fund to invest in these securities. Redwood will be an investor in and the asset manager of the fund. This structure will allow us to take advantage of market opportunities, expand our asset management business, and benefit from some of the potential investment upside.
Our rate of excess capital utilization will depend on future market conditions. In this market, large and attractive investment opportunities may arise suddenly. We expect that our current excess capital will be absorbed quickly during the next one-to-three quarters.
We have been cautioning for some time that mark-to-market accounting could cause volatility in our reported GAAP earnings and book value. In the third quarter, that omen came true. Mark-to-market adjustments for real estate securities, net of hedges, resulted in accounting write-downs of $757 million for the quarter. Of this amount, $103 million ($3.69 per share) was recognized through our GAAP income statement and reduced earnings, and $654 million ($23.44 per share) was recorded on our balance sheet as a reduction of stockholders’ equity.
We strongly believe the real economic impact on Redwood of diminished market values is significantly less severe than the financial reporting impact reflected in our GAAP financial statements. The primary reason for the divergence between economics and GAAP is the accounting treatment required for our investments in our Acacia CDO entities, which requires us to mark-to-market the assets owned by Acacia entities, but does not permit us to mark-to-market paired Acacia CDO liabilities.
| 6 | | The Redwood Review 3rd Quarter 2007 |
Third Quarter 2007 (continued)
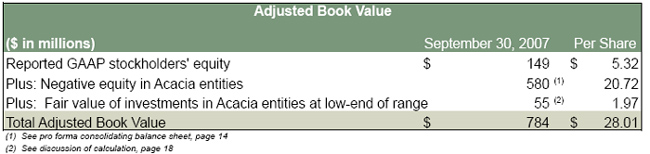
We go into great detail on this topic in a new and separate mark-to-market adjustment module in this edition of the Redwood Review. The short summary of the divergence between accounting and economic results is highlighted by the fact that our investment in the equity and other securities of Acacia CDO entities at the end of the third quarter was carried on our consolidated GAAP balance sheet at a negative value of $580 million (GAAP value of Acacia assets less GAAP value of Acacia liabilities). From an economic perspective, the lowest possible economic value of our investments in the Acacia entities is zero. We cannot lose more than the $113 million net cash we have invested in these assets. GAAP mark-to-market adjustments for Acacia entities totaled $641 million (out of a total of $757 million) of GAAP mark-to-market adjustments for the quarter. Of these Acacia adjustments, $85 million ($3.01 per share) was recorded as a reduction in income and $556 million ($19.93 per share) as a reduction of stockholders equity.
Although shown with negative value on our GAAP balance sheet, we believe our investments in the Acacia entities have positive economic value. We receive cash from our Acacia investments in the form of net interest income and asset management fees, and we expect to continue to do so going forward.
Using our estimates of our future cash flows from Acacia assets, estimates that incorporate what we believe to be realistic assumptions regarding a significant increase in projected credit losses, we calculate the net present value of the projected cash flows we might receive from our investments in Acacia assets to be $55 million ($1.97 per share) using a 45% discount rate and $145 million ($5.18 per share) using a 14% discount rate. Because there is very little trading visibility for CDO equity such as our Acacia investments, it is difficult to determine with any reasonable precision the current fair market value of these Acacia investments, but we estimate the current market value to be closer to $55 million than $145 million.
If we carried our investments in Acacia at a book value of $55 million instead of the negative $580 million reported under GAAP, our adjusted book value at September 30, 2007 would have been $784 million, or $28.01 per share. Adjusted book value is a non-GAAP measure. We believe that $28.01 represents a good overall quarter end per share estimate of the fair value of all of our financial assets, less the fair value of all our liabilities.
The effect of mark-to-markets on our reported GAAP earnings also may be less than effective at portraying economic reality. The determination of whether GAAP asset value write-downs end up in the income statement or balance sheet can be somewhat arbitrary, as the determination depends on changes in highly uncertain projections of future cash flows. Furthermore, the amount of income statement expense recorded may differ materially from the economic value of the change in projected cash flows.
If markets recover in the future, some of the negative markdowns of assets for book value and income statement purposes could reverse, boosting future GAAP income and reported book value. For other assets, we will not be able to recognize any future increases in market valuations in our GAAP income statements. Depending on future credit loss rates, ongoing core income generation could increase as a result of the reduced basis at which we now hold some of our assets.
We are currently considering adopting a new mark-to-market accounting rule that become available for adoption on January 1, 2008. These rules may allow us to better conform our book value and GAAP income results more closely to what we believe economic reality to be. However, we do not believe the new rules will address all of the related mark-to-market challenges, and our reported numbers are likely to remain volatile. Therefore, a true understanding of our results and progress will continue to require thought and analysis from a number of different perspectives.
The Redwood Review 3rd Quarter 2007 | | 7 |
Third Quarter 2007 (continued)
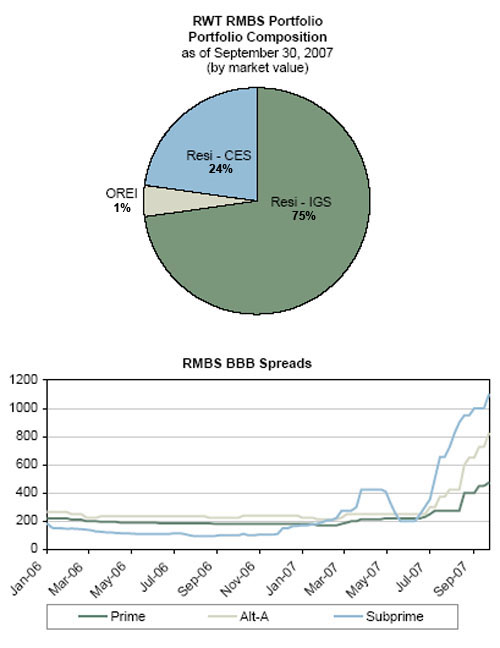
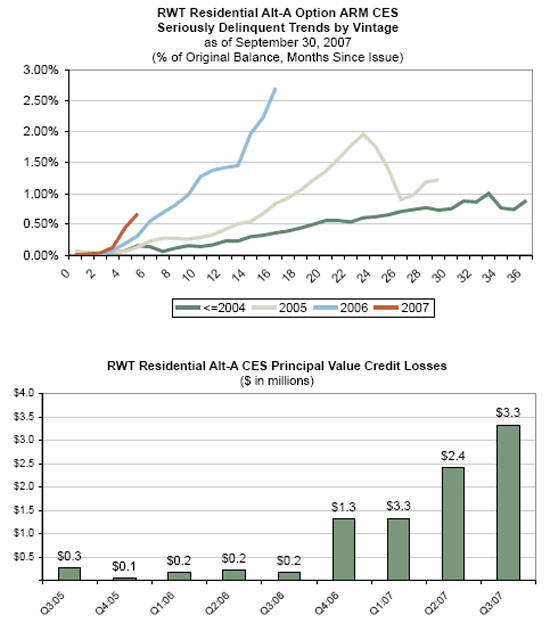
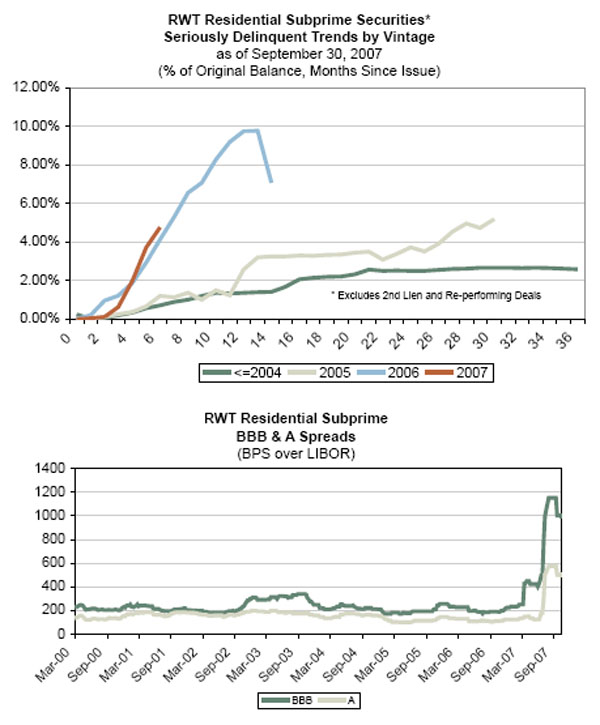
Overall, credit performance for our residential credit-enhancement securities (CES) remains favorable relative to our modeling expectations and GAAP reserve levels. Realized credit losses for tax remained low at $2 million for the quarter. Credit performance trends vary by the underlying collateral type and loan vintage. Our CES portfolio is backed 77% by prime loans, 20% by alt-a option ARMs, and 3% by other alt-a loans and subprime. By vintage, 73% of our CES portfolio was originated in 2005 and prior and 27% was originated in 2006 and 2007. Credit performance for CES backed by 2005 and prior prime and alt-a option ARM loan vintages remains strong and continues to exceed our initial modeling expectations. The credit performance for 2006 and 2007 for these same loan types is in-line with our initial expectations, but is beginning to trend worse. While these loans were made to strong borrowers, we believe that ultimate credit performance will be closely tied to the economy, home prices and interest rates. A slowing economy, higher unemployment, or further declines in home prices would have a negative impact, while further decreases in mortgage rates would offer an opportunity for some of these borrowers to refinance and would have a favorable impact. The credit performance for CES backed by other alt-a and subprime loans, which is a relatively small investment for us, is performing worse than our expectations.
We are also closely watching the credit performance of residential and CDO investment grade securities backed by 2006 and 2007 subprime and weak alt-a borrowers. These securities have incurred numerous down-grades from the rating agencies. Over 98% of these securities were financed through Acacia and our capital exposure is limited. These securities are performing significantly worse than our initial credit expectations. Declining home prices, tightening credit standards, and little or no equity in their homes have left many of these borrowers with no option to refinance or modify their loans. Given the early results and the unfavorable outlook, we have reassessed and significantly increased our loss expectations on these securities.
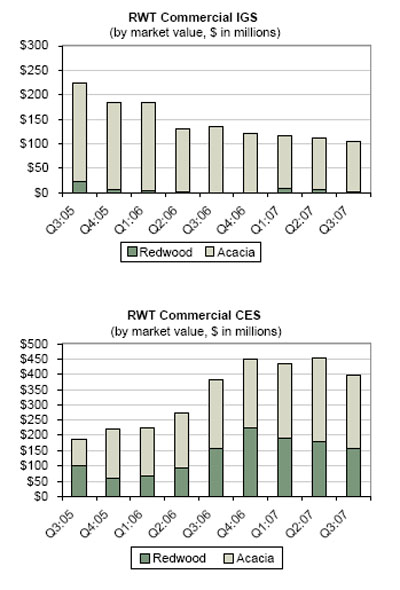
The credit performance for our commercial CES remains strong. Credit losses on this portfolio to date total less than one basis point (.01%) of the underlying loans.
We expect that over the next two to three years, we will likely experience delinquencies and credit losses that will increase materially on a percentage basis in comparison to the low levels we experienced over the last few years. However, we believe we have established appropriate reserves for these increased losses and we expect most of our assets to produce healthy economic returns even with the increased losses that we currently anticipate. That being said, we don’t know how long or how severe this credit cycle will be, and our current expectations about the level of future losses could be overly optimistic.
Overall, we believe the most appropriate expectation over the next few years is that credit losses will escalate and likely reduce the amount of our special dividends in the next several years. In a severe case -- a case that we are not expecting despite current market turmoil -- taxable income alone may be less than our regular dividend for some period of time.
Nevertheless, we believe we are in a great position, with a rare opportunity to invest in and strengthen our business, given that many of our competitors have suffered from the impact of this market turmoil, most of our assets will continue to generate healthy cash flows, and we have a strong liquidity position with a lack of short-term debt and a large balance of cash to invest.
| 8 | | The Redwood Review 3rd Quarter 2007 |
Financial Insights
The mark-to-market adjustments reflected in our consolidated GAAP financial statements for the third quarter, make it difficult for a reader to assess our financial condition. We thought it would be helpful to provide some summary balance sheet insights. We encourage you to read all the financial and mark-to-market modules for a more complete discussion.
Balance Sheet
| l | We believe the easiest way to evaluate our consolidated balance sheet is by separately analyzing Redwood and Acacia. By separating Acacia from Redwood, the following balance sheet more clearly highlights and provides insight into where the vast majority of Redwood’s capital is invested. |
| l | The pro forma balance sheet below shows Redwood at September 30, 2007 excluding the assets and liabilities of Acacia entities. |
Pro Forma Balance Sheet Redwood Excluding Acacia as of September 30, 2007 ($ in millions) |
| | | | |
| Real estate loans | | | $7,630 | |
| Real estate securities | | | 429 | |
| Cash and cash equivalents | | | 310 | |
| Total earning assets | | | 8,369 | |
| Restricted cash | | | 14 | |
| Other assets | | | 95 | |
| | | | | |
Total Assets | | | $8,478 | |
| | | | | |
| Redwood debt | | | $39 | |
| Asset-backed securities issued | | | 7,500 | |
| Subordinated notes | | | 150 | |
| Other liabilities | | | 60 | |
Total Liabilities | | | 7,749 | |
| | | | | |
| Total Stockholders’ Equity | | | 729 | |
| | | | | |
Total Liabilities & Stockholders’ Equity | | | $8,478 | |
The preceding pro forma presentation is not a GAAP measurement. The pro forma information is reconciled to our GAAP consolidated balance sheet on a table presented on page 14 of this Redwood Review under Mark-to-Market Adjustments; Impact on Redwood. The purpose is to show information about Redwood’s balance sheet without any investment in Acacia entities at September 30, 2007. |
| l | If you valued our investment in Acacia entities at the low end of the range discussed on page 7 equaling $55 million, then our overall adjusted book value would be $784 million ($729 million plus $55 million). Thus, 7% of our capital is invested in Acacia entities and 93% is at Redwood. |
The Redwood Review 3rd Quarter 2007 | | 9 |
Financial Insights (continued)
Real estate securities
The following table details Redwood’s investment in real estate securities. This table does not include securities owned by Acacia entities.
Pro Forma Balance Sheet Information Securities: Underlying Collateral Type by Vintage Redwood Excluding Acacia as of September 30, 2007 ($ in millions) | |
| | | | | | | | | | | | |
| | | 2004 & Earlier | | 2005 | | 2006 | | 2007 | | Total | |
| | | | | | | | | | | | |
| Residential IGS | | | | | | | | | | | |
| Prime | | $ | 2 | | $ | - | | $ | - | | $ | - | | $ | 2 | |
| Alt-a | | | - | | | - | | | - | | | 46 | | | 46 | |
| Subprime | | | 1 | | | - | | | - | | | 12 | | | 13 | |
| Residential IGS | | | 3 | | | - | | | - | | | 58 | | | 61 | |
| | | | | | | | | | | | | | | | | |
| Residential CES | | | | | | | | | | | | | | | | |
| Prime | | | 77 | | | 24 | | | 13 | | | 18 | | | 132 | |
| Alt-a | | | 7 | | | 10 | | | 9 | | | 18 | | | 44 | |
| Subprime | | | 1 | | | - | | | - | | | - | | | 1 | |
| Residential CES | | | 85 | | | 34 | | | 22 | | | 36 | | | 177 | |
| | | | | | | | | | | | | | | | | |
| Residential OREI | | | 2 | | | - | | | 17 | | | 5 | | | 24 | |
| Commercial IGS | | | 1 | | | - | | | - | | | - | | | 1 | |
| Commercial CES | | | 26 | | | 35 | | | 75 | | | 21 | | | 157 | |
| CDO IGS | | | 2 | | | - | | | 1 | | | 3 | | | 6 | |
| CDO CES | | | 1 | | | - | | | - | | | 2 | | | 3 | |
| | | | | | | | | | | | | | | | | |
Totals | | $ | 120 | | $ | 69 | | $ | 115 | | $ | 125 | | $ | 429 | |
The preceding pro forma presentation is not a GAAP measurement. The pro forma information is reconciled to our GAAP consolidated balance sheet on a table presented on page 14 of this Redwood Review under Mark-to-Market Adjustments, Impact on Redwood. The purpose is to show information about Redwood’s balance sheet excluding Acacia at September 30, 2007. |
| · | All of the securities are financed with capital, except for $45 million of residential IGS, which are funded with Redwood debt of $39 million and capital of $6 million. The total capital invested in real estate securities is $390 million. |
| 10 | | The Redwood Review 3rd Quarter 2007 |
Financial Insights (continued)
Credit Reserves
| · | Our potential GAAP earnings upside from good credit performance can be estimated by referencing the size of our credit reserves. In the event we experience no future credit losses, our GAAP earnings would benefit by the amount of these credit reserves as these loans pay off. Our current earnings incorporate these loss estimates, so income from the reversal of credit reserves would add to our current GAAP earnings run rate (all other factors being equal). |
| · | Our investments incorporate a high degree of credit risk, so high credit loss rates would reduce GAAP earnings, taxable income, and dividends. |
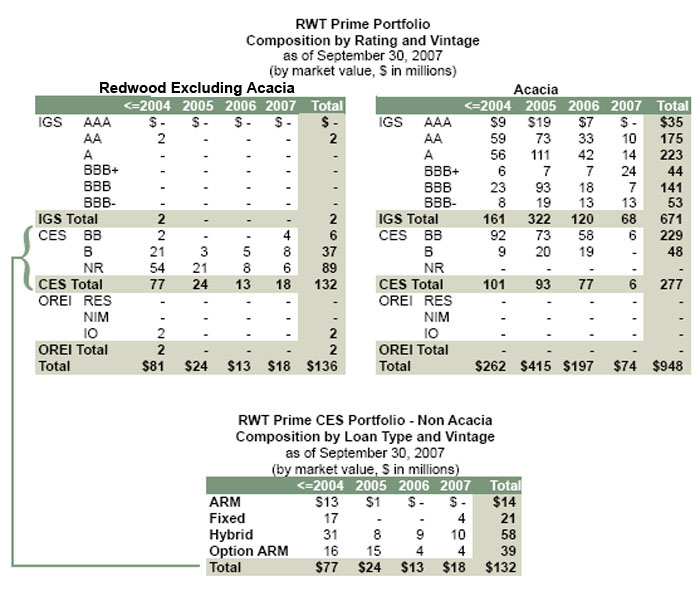
| · | The following table shows the components comprising the carrying value of our residential prime and alt-a CES and our commercial CES at Redwood. This table does not include securities owned by Acacia. |
Pro Forma Balance Sheet Information Credit Enhancement Securities Redwood Excluding Acacia as of September 30, 2007 ($ in millions) | |
| | | Residential | | | |
| | | | | | | | |
| | | Prime | | Alt-a | | Commercial | |
| | | | | | | | | | | |
| Current face | | | $417 | | | $244 | | | $500 | |
| Unamortized discount, net | | | (64 | ) | | (9 | ) | | (10 | ) |
| Discount designated as credit reserve | | | (223 | ) | | (159 | ) | | (310 | ) |
| Amortized cost | | | 130 | | | 76 | | | 180 | |
| Gross unrealized market value gains | | | 29 | | | 1 | | | 8 | |
| Gross unrealized market value losses | | | (27 | ) | | (33 | ) | | (31 | ) |
| | | | | | | | | | | |
Carrying value | | | $132 | | | $44 | | | $157 | |
The preceding pro forma presentation is not a GAAP measurement. The pro forma information is reconciled to our GAAP consolidated balance sheet on a table presented on page 14 of this Redwood Review under Mark-to-Market Adjustments, Impact on Redwood. The purpose is to show information about Redwood’s balance sheet as if there was no investment in Acacia at September 30, 2007. |
The Redwood Review 3rd Quarter 2007 | | 11 |
| Mark-to-Market Adjustments |
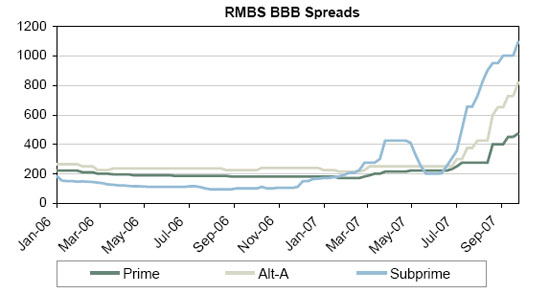
Market Conditions
| Ø | The mortgage market faced adversity in the third quarter of 2007 as the continued broad re-pricing of mortgage credit risk led to a severe contraction in market liquidity. The most dramatic price adjustments involved residential mortgage-backed securities (RMBS) and CDO securities backed by subprime and alt-a mortgages originated in 2006 and 2007. |
| Ø | We believe several converging factors led to the broad re-pricing, including general concerns over the decline in home prices, the rapid increase in the number of delinquent subprime and alt-a loans, the reduced willingness of investors to acquire commercial paper backed by mortgage collateral and the resulting contraction in market liquidity and availability of financing lines, the numerous rating agency downgrades of securities, and an increase in the supply of securities potentially available for sale. |
| Ø | The downward spiraling of negative pricing adjustments on assets had a snowball effect as lower prices led to increased lender margin calls for some market participants, which in turn, forced additional selling, causing yet further declines in prices. These events continued to feed off each other through much of the quarter. |
| Ø | Normal market trading activity during the quarter was unusually light as uncertainty related to future loss estimates made it difficult for willing buyers and sellers to agree on price. This condition is particularly acute with respect to RMBS and CDO securities backed by 2006 and 2007 subprime and alt-a loans where market participants are setting price levels based on widely varied opinions about future loan performance and loan loss severity. While the early credit performance for these securities has been clearly far worse than initial expectations, the ultimate level of realized losses will largely be influenced by events that will likely unfold over the next 12 to 36 months, including the severity of housing price declines and the overall strength of the economy. |
| Ø | The actions taken late in the quarter by the Federal Reserve to reduce the federal funds and discount rates provided some temporary market confidence. We caution that Federal Reserve actions alone are not likely to result in price stability as the aforementioned market concerns remain largely unresolved. From the end of the third quarter through the beginning of November, prices for RMBS and CDO securities continued to decline, in particular for those securities backed by 2006 and 2007 subprime loans. |
| 12 | | The Redwood Review 3rd Quarter 2007 |
| Mark-to-Market Adjustments |
Impact on Redwood
| Ø | We believe that, in the long run, the widening spreads (reduction in asset prices) will be advantageous to us as we are buying and will continue to buy high quality assets at more attractive prices than we have seen in recent years. |
| Ø | During the quarter, we experienced no liquidity issues as all of our credit-sensitive investments were financed with capital or through our Acacia securitization entities. Additionally, we only had a small amount of less credit sensitive assets borrowed on repo facilities. Our cash balances exceed our short-term debt. |
| Ø | The continued extensive price decline in real estate securities in the third quarter had a significant negative GAAP financial reporting impact on Redwood, as mark-to-market (MTM) adjustments to our real estate securities portfolio caused our GAAP book value and our GAAP earnings to decline significantly. We strongly believe that the real economic effect of MTM is significantly less than the impact shown under GAAP. The primary reason for the divergence between economics and GAAP is the accounting treatment required for our investments in Acacia CDOs. |
The Redwood Review 3rd Quarter 2007 | | 13 |
| Mark-to-Market Adjustments |
Impact on Redwood (continued)
| Ø | As a result of this accounting treatment, our investments in Acacia CDO entities, in which we have a net cash investment of $113 million, are carried in our reported GAAP consolidated statement of stockholders’ equity as having $580 million of negative book value at September 30, 2007. (See the consolidating balance sheet below). However, economically this investment cannot be worth less than zero, because in the worst case, we cannot lose more than the amount we invested. Nonetheless, GAAP requires us to prepare our financials in a manner that could cause readers to conclude that market values declined by more than we invested. The debt of Acacia is not an obligation of Redwood and we have not provided Acacia with any guarantees. Therefore, even if you assume that our investment in Acacia is worthless, our reported GAAP book value is understated by $580 million. Furthermore, we believe that our investments in Acacia have positive value and will continue to generate cash flow. Our calculation of the present value of the future cash flows (adjusted for projected credit losses) from Acacia entities discounted at 45% and 14% range from $55 million to $145 million. Due to the current market illiquidity for CDO equity, we would expect that the fair value of our Acacia investments at the end of the quarter to be on the lower end of the range. |
Pro Forma Consolidating Balance Sheet as of September 30, 2007 ($ in millions) | |
| | | Redwood Excluding Acacia | | Acacia | | Intercompany | | Redwood Consolidated | |
| | | | | | | | | | | | | | |
| Real estate loans | | | $7,630 | | | $26 | | | $0 | | | $7,656 | |
| Real estate & other securities | | | 429 | | | 2,715 | | | (113 | ) | | 3,031 | |
| Cash and cash equivalents | | | 310 | | | - | | | - | | | 310 | |
| Total earning assets | | | 8,369 | | | 2,741 | | | (113 | ) | | 10,997 | |
| Restricted cash | | | 14 | | | 123 | | | - | | | 137 | |
| Other assets | | | 95 | | | 54 | | | - | | | 149 | |
| | | | | | | | | | | | | | |
Total Assets | | | $8,478 | | | $2,918 | | | ($113 | ) | | $11,283 | |
| | | | | | | | | | | | | | |
| Redwood debt | | | $39 | | | $0 | | | $0 | | | $39 | |
| Asset-backed securities issued | | | 7,500 | | | 3,416 | | | (113 | ) | | 10,803 | |
| Subordinated notes | | | 150 | | | - | | | - | | | 150 | |
| Other liabilities | | | 60 | | | 82 | | | - | | | 142 | |
Total Liabilities | | | 7,749 | | | 3,498 | | | (113 | ) | | 11,134 | |
| | | | | | | | | | | | | | |
| Total Stockholders’ Equity | | | 729 | | | (580 | ) | | - | | | 149 | |
| | | | | | | | | | | | | | |
Total Liabilities & Stockholders’ Equity | | | $8,478 | | | $2,918 | | | ($113 | ) | | $11,283 | |
The purpose of this pro forma presentation is to show the consolidating components to our balance sheet and to highlight the negative impact that Acacia has on our consolidated stockholders’ equity at quarter end. The Redwood excluding Acacia column reflects Redwood without any investment in Acacia entities. While the components reconcile to our consolidated GAAP balance sheet, this is a non-GAAP presentation. In a GAAP presentation, the Redwood excluding Acacia balance sheet shown above would have reflected an investment in Acacia and reflected the negative equity of Acacia. |
| Ø | Unless RMBS and CDO securities prices recover from early November levels, we would be required to record additional negative mark-to-market valuation adjustments in the fourth quarter. These adjustments could cause our GAAP stockholders’ equity at December 31, 2007 to be negative. We are considering adopting FAS 159 on January 1, 2008, which would enable us to mark-to-market the Acacia liabilities. These rules would allow us to better conform our GAAP stockholders’ equity and what we believe economic reality to be. |
| 14 | | The Redwood Review 3rd Quarter 2007 |
| Mark-to-Market Adjustments |
Impact on Redwood (continued)
| Ø | From an income statement perspective, MTM adjustments reduced our third quarter earnings by $103 million, of which $85 million were related to assets owned by Acacia. |
Pro Forma Consolidating Income Statement Three Months Ended September 30, 2007 ($ in millions) | |
| | | Redwood Excluding Acacia | | Acacia | | Redwood Consolidated | |
| | | | | | | | |
Net interest income | | | $42 | | | $12 | | | $54 | |
| Operating expenses | | | (12 | ) | | - | | | (12 | ) |
Realized gains on sales and calls, net | | | 2 | | | - | | | 2 | |
Market valuation adjustments, net | | | (18 | ) | | (85 | ) | | (103 | ) |
Provision for income taxes taxes | | | (2 | ) | | - | | | (2 | ) |
| | | | | | | | | | | |
Net Income (Loss) | | | $12 | | | ($73 | ) | | ($61 | ) |
Nine Months Ended September 30, 2007 ($ in millions) | |
| | | Redwood Excluding Acacia | | Acacia | | Redwood Consolidated | |
| | | | | | | | |
Net interest income | | | $120 | | | $34 | | | $154 | |
Operating expenses | | | (42 | ) | | - | | | (42 | ) |
Realized gains on sales and calls,net | | | 6 | | | - | | | 6 | |
Market valuation adjustments, net | | | (44 | ) | | (98 | ) | | (142 | ) |
Provision for income taxes | | | (7 | ) | | - | | | (7 | ) |
| | | | | | | | | | | |
Net Income (Loss) | | | $33 | | | ($64 | ) | | ($31 | ) |
The purpose of this pro forma presentation is to show the consolidating components to our income statement and to highlight the negative impact that Acacia had on our consolidated net loss for the three and nine months ended September 30, 2007. While components reconciled to our consolidated GAAP income statement, this is a non-GAAP presentation. In a GAAP presentation, the Redwood excluding Acacia income statement shown above would have reflected the loss from Acacia. |
The Redwood Review 3rd Quarter 2007 | | 15 |
| Mark-to-Market Adjustments |
Impact on Redwood (continued)
| Ø | Total MTM adjustments taken during the three and nine months ended September 30, 2007 were $757 million and $969 million, respectively. The tables below show the breakdown of these MTM adjustments between Redwood and Acacia. They also detail the amounts that flowed through our income statement and stockholders’ equity. |
Pro Forma Balance Sheet and Income Statement Information Mark-to-Market Adjustments Three Months Ended September 30, 2007 ($ in millions) | |
| | | Redwood Excluding Acacia | | Acacia | | Redwood Consolidated | |
| | | | | | | | |
Balance Sheet Impact | | | | | | | |
| Reduction in stockholders' equity | | | ($98 | ) | | ($556 | ) | | ($654 | ) |
| | | | | | | | | | | |
Income Statement Impact | | | | | | | | | | |
| Market Valuation adjustments | | | | | | | | | | |
| Impairment valuation on AFS securities | | | (15 | ) | | (68 | ) | | (83 | ) |
| Fair value adjustment on trading assets | | | (3 | ) | | (17 | ) | | (20 | ) |
| Total income statement impact | | | (18 | ) | | (85 | ) | | (103 | ) |
| | | | | | | | | | | |
Total Mark-to-Market Adjustments | | | ($116 | ) | | ($641 | ) | | ($757 | ) |
Nine Months Ended September 30, 2007 ($ in millions) | |
| | | Redwood Excluding Acacia | | Acacia | | Redwood Consolidated | |
| | | | | | | | |
Balance Sheet Impact | | | | | | | |
Reduction in stockholders' equity | | | ($132 | ) | | ($696 | ) | | ($828 | ) |
| | | | | | | | | | | |
Income Statement Impact | | | | | | | | | | |
Market valuation adjustments | | | | | | | | | | |
| Impairment valuation on AFS securities | | | (28 | ) | | (79 | ) | | (107 | ) |
| Fair value adjustment on trading assets | | | (28 | ) | | (79 | ) | | (34 | ) |
| Total income statement impact | | | (43 | ) | | (98 | ) | | (141 | ) |
| | | | | | | | | | | |
Total Mark-to-Market Adjustments | | | ($175 | ) | | ($794 | ) | | ($969 | ) |
The purpose of this pro forma presentation is to show the consolidating components for total mark-to-market adjustments for the three and nine months ended September 30, 2007. These mark-to-market adjustments are further detailed by the balance sheet (stockholders’ equity) and income statement impact. This is a non-GAAP presentation. The total stockholders’ equity impact of $654 million and $828 million for the three and nine months ended September 30, 2007, respectively, agree to our consolidated statement of comprehensive income for those periods. The total income statement impact of $103 million and $141 million for the three and nine month periods ended September 30, 2007, respectively, agree to our consolidated income statement for those periods. |
| Ø | MTM adjustments on securities can result from a decline in the economic value of the securities (i.e., increased credit loss estimates reduce expected future cash flows), or from changes in market discount rates (i.e., the market requires a greater risk premium and/or interest rates rise), or a combination of both. A summary of the accounting rules regarding MTMs is provided below. |
| Ø | If the change in fair value for available-for-sale securities (AFS) is due solely to changes in market discount rates, then the entire MTM adjustment is flowed through our balance sheet as an adjustment to stockholders’ equity. These adjustments can go back and forth (positive or negative) from period to period. |
| 16 | | The Redwood Review 3rd Quarter 2007 |
| Mark-to-Market Adjustments |
Impact on Redwood (continued)
| Ø | If the change in fair value for AFS is accompanied by an adverse change in projected cash flows, then the entire MTM adjustment is flowed through the income statement. This is required even if the change in projected cash flows is small relative to the resulting MTM income statement charge. We offer the following example: Assume Redwood acquired a security for $100 and the value of this acquisition was based on $150 of future expected cash flows discounted at 12%. If at the end of an accounting period, the market value of the security was $50 and that value was based on $149 of future expected cash flows discounted at 25% (the prevailing market rates), the entire $50 change in value is considered “permanently impaired” for accounting purposes. AFS deemed permanently impaired for accounting purposes cannot be written back up through market valuation adjustments in our income statement. This does not mean the underlying security could not recover in economic or market value. If the economic value of an impaired security does recover, we would recognize this benefit through higher interest yields over time. It is often difficult to separate with precision how much of the change in fair value is driven by changes in expected cash flows versus changes in required market discount rates, but during periods of market illiquidity and uncertainty, the market discount rate component can be significant. Therefore, some of our securities classified as permanently impaired for accounting purposes during the third quarter may eventually prove to have significant economic value to us. |
| Ø | All changes in fair value for trading securities or derivative instruments flow through the income statement. These adjustments can be either positive or negative from period to period. |
| Ø | The table below details the total MTM adjustments by the underlying collateral type. |
Total Mark-To-Market Adjustments | |
By Underlying Collateral Type | |
| Three Months Ended September 30, 2007 | |
| ($ in millions) | |
| | | | | | | | | | | | |
| | | | | | | OREI & | | | | MTM | |
| | | IGS | | CES | | Derivatives | | Total | | Percent (1) | |
| | | | | | | | | | | | |
| Residential | | | | | | | | | | | |
| Prime | | $ | (82 | ) | $ | (131 | ) | $ | - | | $ | (213 | ) | | (16 | )% |
| Alt-a | | | (197 | ) | | (67 | ) | | (13 | ) | | (277 | ) | | (22 | )% |
| Subprime | | | (92 | ) | | (11 | ) | | (5 | ) | | (108 | ) | | (24 | )% |
| Residential total | | | (371 | ) | | (209 | ) | | (18 | ) | | (598 | ) | | | |
| | | | | | | | | | | | | | | | | |
| Commercial | | | (6 | ) | | (56 | ) | | - | | | (62 | ) | | (11 | )% |
| CDO | | | (57 | ) | | (9 | ) | | - | | | (66 | ) | | (26 | )% |
| Derivatives | | | - | | | - | | | (31 | ) | | (31 | ) | | | |
| | | | | | | | | | | | | | | | | |
Total mark-to-market adjustments | | $ | (434 | ) | $ | (274 | ) | $ | (49 | ) | $ | (757 | ) | | | |
| Nine Months Ended September 30, 2007 | |
| ($ in millions) | |
| | | | | | | | | | | | |
| | | | | | | OREI & | | | | MTM | |
| | | IGS | | CES | | Derivatives | | Total | | Percent (1) | |
| | | | | | | | | | | | |
| Residential | | | | | | | | | | | |
| Prime | | $ | (100 | ) | $ | (146 | ) | $ | 1 | | $ | (245 | ) | | (19 | )% |
| Alt-a | | | (234 | ) | | (85 | ) | | (28 | ) | | (347 | ) | | (29 | )% |
| Subprime | | | (128 | ) | | (18 | ) | | (6 | ) | | (152 | ) | | (32 | )% |
| Residential total | | | (462 | ) | | (249 | ) | | (33 | ) | | (744 | ) | | | |
| | | | | | | | | | | | | | | | | |
| Commercial | | | (13 | ) | | (101 | ) | | - | | | (114 | ) | | (20 | )% |
| CDO | | | (86 | ) | | (11 | ) | | - | | | (97 | ) | | (36 | )% |
| Derivatives | | | - | | | - | | | (14 | ) | | (14 | ) | | | |
| | | | | | | | | | | | | | | | | |
Total mark-to-market adjustments | | $ | (561 | ) | $ | (361 | ) | $ | (47 | ) | $ | (969 | ) | | | |
(1) This percentage represents the MTMs taken as a percentage of the reported market values at the beginning of the period, or purchase price if acquired during the period. It is intended to highlight the price declines by collateral type for the three and nine month periods ended September 30, 2007. These price declines are for our specific portfolio and may not be indicative of price declines in the market in general. |
The Redwood Review 3rd Quarter 2007 | | 17 |
| Mark-to-Market Adjustments |
CDO Economic and Accounting Analysis
Economics
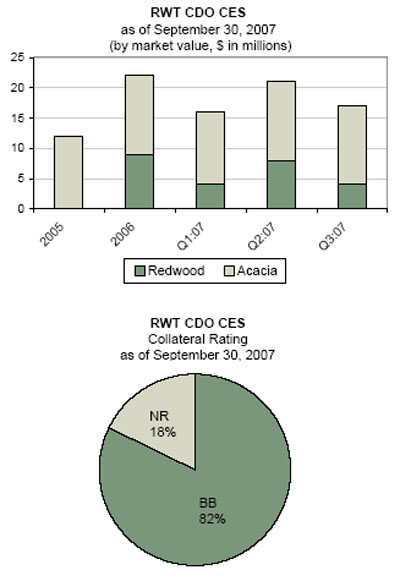
| Ø | Under our Acacia program we re-securitize real estate securities using bankruptcy remote CDO entities that sell ABS (asset backed securities) to independent third-party debt investors. We typically retain an equity interest in the Acacia CDOs. This allows us to generate asset management fees and what we believe to be attractive assets for our portfolio. Our equity investments are entitled to the net cash flows (i.e., the net cash flows generated by the assets after deducting the money owed to the ABS debt holders) of the Acacia entities. Our share of any credit losses generated by the underlying Acacia assets is capped for us at the amount of our net equity investment, with the remainder of losses borne by the ABS holders. |
| Ø | As a hypothetical example, an Acacia CDO transaction might have $300 million of assets, $285 million of liabilities (ABS issued), and $15 million of equity. If in any year the assets earned 6% or $18 million, and the ABS were paid interest of 5% or $14.25 million, our equity would be entitled to a distribution of $3.75 million in that year. In certain circumstances, our equity cash distributions can be disrupted based on rating agency down-grades or due to a deterioration in collateral performance. |
| Ø | We have ten Acacia CDO transactions outstanding. Our investment in each of these transactions are separate and independent, thus diminished cash flow generated by any one of our CDO equity investments would have no effect on our other CDO equity investments. During the three and nine months ended September 30, 2007, we collected $5.3 million and $14.6 million, respectively, of cash flow distributions from our Acacia investments. Currently, we are continuing to receive distributions from all Acacias. We are closely monitoring the four Acacia transactions issued since August 2006 as further rating agency down-grades or further deterioration in collateral performance could disrupt cash distributions from these Acacia entities. During the three and nine months ended September 30, 2007, we received cash distributions of $1.5 million and $3.4 million, respectively, from these four Acacia entities (Acacia’s 10, 11, 12, and option ARM). |
| Ø | We believe the best measure of economic value for our Acacia equity investment is the net present value of the future cash flow distributions, though we would caution that in this environment it is particularly difficult to predict future cash flows with much certainty given the potential for future rating agency down-grades and the uncertainties around future credit performance and the problems in the housing market that we discussed above. Our calculation of the present value of the future cash flows (adjusted for projected credit losses) from Acacia entities discounted at 45% and 14% range from $55 million to $145 million. Due to the current market illiquidity for CDO equity, we would expect that the fair value of our Acacia investments to be on the lower end of the range rather than the higher end. Our initial cash investment in these Acacia transactions was $140 million. Cumulatively, we have received cash distributions of $27 million on our investments in these Acacia entities. In addition, we have received management fees of $8 million. |
| 18 | | The Redwood Review 3rd Quarter 2007 |
| Mark-to-Market Adjustments |
CDO Economic and Accounting Analysis (continued)
Accounting
| Ø | The assets, liabilities, and earnings from the Acacia entities are consolidated for GAAP purposes with Redwood. Over time, the economic and GAAP results of Acacia will be the same. However, there can be interim periods when GAAP and economic losses diverge significantly. This results from the fact that under GAAP we are not permitted to adjust the carrying values of our Acacia liabilities until actual losses are passed through to debt holders or the securitization is called (which may not occur for a significant period of time), but we are required to mark-to-market all of the Acacia assets on a quarterly basis. This GAAP accounting treatment resulted in the carrying value of Acacia to be negative $580 million. However, since the economic value of our equity investment cannot be less than zero, our September 30, 2007 consolidated GAAP book value of $149 million understates the value of Acacia by at least $580 million. |
| Ø | The divergence between economic and accounting results, is highlighted by Acacia OA (option ARM) in the table below. We made an initial $14 million cash investment. We have already recognized $20 million of losses through the income statement ($6 million more than our investment). In addition we have further reduced stockholders’ equity by $149 million for negative MTM adjustments. Thus, our $14 million investment, in which our maximum loss is $14 million, is carried at a $155 million negative book value on our consolidated balance sheet at September 30, 2007. |
Acacia Balance Sheets | |
| as of September 30, 2007 | |
| ($ in millions) | |
| | | | | | | | | | | | | | | | | | | | | | | | |
| | | Acacia | | Acacia | | Acacia | | Acacia | | Acacia | | Acacia | | Acacia | | Acacia | | Acacia | | Acacia | | | |
| | | 5 | | 6 | | 7 | | 8 | | CRE1 | | 9 | | 10 | | 11 | | OA | | 12 | | Total | |
Issue Date | | Jul-04 | | Nov-04 | | Mar-05 | | Jul-05 | | Dec-05 | | Mar-06 | | Aug-06 | | Feb-07 | | May-07 | | Jun-07 | | Acacia | |
| | | | | | | | | | | | | | | | | | | | | | | | |
| Real estate investments | | | | | | | | | | | | | | | | | | | | | | | |
| Current face | | | $247 | | | $283 | | | $293 | | | $288 | | | $300 | | | $301 | | | $503 | | | $499 | | | $424 | | | $484 | | | $3,622 | |
| Unamortized discount, net | | | (6 | ) | | (9 | ) | | (8 | ) | | (18 | ) | | (32 | ) | | (10 | ) | | (43 | ) | | (29 | ) | | (5 | ) | | (35 | ) | | (195 | ) |
| Designated credit reserve | | | (2 | ) | | (3 | ) | | (2 | ) | | (5 | ) | | - | | | (3 | ) | | (37 | ) | | (32 | ) | | - | | | (15 | ) | | (99 | ) |
| Unrealized (losses) | | | (26 | ) | | (35 | ) | | (33 | ) | | (45 | ) | | (41 | ) | | (50 | ) | | (88 | ) | | (109 | ) | | (149 | ) | | (92 | ) | | (668 | ) |
| Other investments | | | - | | | - | | | - | | | - | | | - | | | - | | | 1 | | | - | | | 80 | | | - | | | 81 | |
| Total earning assets | | | 213 | | | 236 | | | 250 | | | 220 | | | 227 | | | 238 | | | 336 | | | 329 | | | 350 | | | 342 | | | 2,741 | |
| Restricted cash | | | 17 | | | 15 | | | 18 | | | 12 | | | 6 | | | 6 | | | 5 | | | 5 | | | 14 | | | 25 | | | 123 | |
| Other assets | | | 2 | | | 3 | | | 4 | | | 5 | | | 9 | | | 4 | | | 5 | | | 6 | | | 9 | | | 7 | | | 54 | |
Total Assets | | | $232 | | | $254 | | | $272 | | | $237 | | | $242 | | | $248 | | | $346 | | | $340 | | | $373 | | | $374 | | | $2,918 | |
| | | | | | | | | | | | | | | | | | | | | | | | | | | | | | | | | | | |
| ABS issued | | | $242 | | | $269 | | | $279 | | | $250 | | | $262 | | | $277 | | | $412 | | | $472 | | | $495 | | | $458 | | | $3,416 | |
| Other liabilities | | | 2 | | | 8 | | | 10 | | | 2 | | | 4 | | | 4 | | | 7 | | | 3 | | | 33 | | | 9 | | | 82 | |
Total Liabilities | | | 244 | | | 277 | | | 289 | | | 252 | | | 266 | | | 281 | | | 419 | | | 475 | | | 528 | | | 467 | | | 3,498 | |
| | | | | | | | | | | | | | | | | | | | | | | | | | | | | | | | | | | |
| Initial investment | | | 8 | | | 8 | | | 11 | | | 18 | | | 14 | | | 11 | | | 29 | | | 5 | | | 14 | | | 22 | | | 140 | |
| Cummulative Earnings | | | 10 | | | 8 | | | 5 | | | 13 | | | 7 | | | 8 | | | (6 | ) | | (27 | ) | | (20 | ) | | (21 | ) | | (23 | ) |
| Cummulative Distributions | | | (6 | ) | | (6 | ) | | (3 | ) | | (4 | ) | | (2 | ) | | (2 | ) | | (3 | ) | | (1 | ) | | - | | | - | | | (27 | ) |
| OCI | | | (24 | ) | | (33 | ) | | (30 | ) | | (42 | ) | | (43 | ) | | (50 | ) | | (93 | ) | | (112 | ) | | (149 | ) | | (94 | ) | | (670 | ) |
Total Equity | | | (12 | ) | | (23 | ) | | (17 | ) | | (15 | ) | | (24 | ) | | (33 | ) | | (73 | ) | | (135 | ) | | (155 | ) | | (93 | ) | | (580 | ) |
| | | | | | | | | | | | | | | | | | | | | | | | | | | | | | | | | | | |
Total Liabilities & Equity | | | $232 | | | $254 | | | $272 | | | $237 | | | $242 | | | $248 | | | $346 | | | $340 | | | $373 | | | $374 | | | $2,918 | |
| | | | | | | | | | | | | | | | | | | | | | | | | | | | | | | | | | | |
| Summary of Cash Activity | | | | | | | | | | | | | | | | | | | | | | | | | | | | | | | | | | |
| Initial Investment | | | ($8 | ) | | ($8 | ) | | ($11 | ) | | ($18 | ) | | ($14 | ) | | ($11 | ) | | ($29 | ) | | ($5 | ) | | ($14 | ) | | ($22 | ) | | ($140 | ) |
| Cash received * | | | 6 | | | 6 | | | 3 | | | 4 | | | 2 | | | 2 | | | 3 | | | 1 | | | - | | | - | | | 27 | |
| | | | | | | | | | | | | | | | | | | | | | | | | | | | | | | | | | | |
Net cash flow to date | | | ($2 | ) | | ($2 | ) | | ($8 | ) | | ($14 | ) | | ($12 | ) | | ($9 | ) | | ($26 | ) | | ($4 | ) | | ($14 | ) | | ($22 | ) | | ($113 | ) |
* This does not include $8 million of asset management fees.
The Redwood Review 3rd Quarter 2007 | | 19 |
| Mark-to-Market Adjustments |
CDO Economic and Accounting Analysis (continued)
Accounting
| Ø | With respect to the four Acacia transactions that currently concern us, our net cash investment as of September 30, 2007 was $66 million. From a GAAP income statement standpoint, we have already collectively recognized losses of $74 million. Therefore, we have already effectively taken $8 million of write-offs through the income statement in excess of the maximum loss value of these investments. |
| Ø | On January 1, 2008, FASB Statement No. 159, The Fair Value Option for Financial Assets and Financial Liabilities Including an Amendment of FASB Statement No. 115 (FAS 159) becomes effective. If adopted by us, FAS 159 will enable us to mark-to-market the Acacia liabilities. We are considering adopting FAS 159 for valuing the assets and liabilities owned by Acacia on January 1, 2008. These rules may allow us to better conform our book value and GAAP income results more closely to what we believe economic reality to be. However, we do not believe the new rules will address all of the related mark-to-market challenges and our reported numbers are likely to remain volatile. |
| Ø | The following table details Acacia’s exposure to different collateral types owned by Acacia entities. |
Acacia Balance Sheet Information | |
Underlying Collateral Type | |
| as of September 30, 2007 | |
| ($ in millions) | |
| | | | | | | | | | | | | | | | | | | | | | | | |
| | | Acacia | | Acacia | | Acacia | | Acacia | | Acacia | | Acacia | | Acacia | | Acacia | | Acacia | | Acacia | | | |
| | | 5 | | 6 | | 7 | | 8 | | CRE1 | | 9 | | 10 | | 11 | | OA | | 12 | | | |
Issue Date | | Jul-04 | | Nov-04 | | Mar-05 | | Jul-05 | | Dec-05 | | Mar-06 | | Aug-06 | | Feb-07 | | May-07 | | Jun-07 | | Total | |
| | | | | | | | | | | | | | | | | | | | | | | | |
| Resi IGS | | | | | | | | | | | | | | | | | | | | | | | |
| Prime Sequoia | | | $15 | | | $15 | | | $11 | | | $6 | | | $1 | | | $3 | | | $4 | | | $3 | | | $8 | | | $21 | | | $87 | |
| Prime Other | | | 43 | | | 57 | | | 73 | | | 77 | | | 52 | | | 133 | | | 115 | | | 52 | | | 9 | | | 60 | | | 671 | |
| Alt-a | | | 27 | | | 18 | | | 25 | | | 23 | | | 5 | | | 23 | | | 44 | | | 124 | | | 244 | | | 125 | | | 658 | |
| Subprime | | | 62 | | | 81 | | | 66 | | | 8 | | | - | | | 12 | | | 11 | | | 31 | | | 2 | | | 39 | | | 312 | |
| | | | | | | | | | | | | | | | | | | | | | | | | | | | | | | | | | | |
| Resi CES | | | | | | | | | | | | | | | | | | | | | | | | | | | | | | | | | | |
| Prime Sequoia | | | 3 | | | 5 | | | 4 | | | 7 | | | - | | | 2 | | | 5 | | | - | | | - | | | - | | | 26 | |
| Prime Other | | | 28 | | | 23 | | | 16 | | | 42 | | | - | | | 25 | | | 102 | | | 26 | | | - | | | 15 | | | 277 | |
| Alt-a | | | 1 | | | 6 | | | 3 | | | 16 | | | - | | | 3 | | | 3 | | | 25 | | | - | | | 10 | | | 67 | |
| Subprime | | | - | | | - | | | - | | | - | | | - | | | - | | | 5 | | | 4 | | | - | | | 3 | | | 12 | |
| | | | | | | | | | | | | | | | | | | | | | | | | | | | | | | | | | | |
| COMM IGS | | | 12 | | | 11 | | | 8 | | | 9 | | | 56 | | | 3 | | | 1 | | | - | | | - | | | 3 | | | 103 | |
| COMM CES | | | 2 | | | 5 | | | 16 | | | 24 | | | 86 | | | 15 | | | 29 | | | 26 | | | - | | | 35 | | | 238 | |
| COMM Loans | | | 4 | | | - | | | 9 | | | 4 | | | 9 | | | - | | | - | | | - | | | - | | | - | | | 26 | |
| CDO: CMBS | | | 3 | | | 2 | | | 2 | | | - | | | 18 | | | 12 | | | 10 | | | 20 | | | 7 | | | 9 | | | 83 | |
| CDO: RMBS | | | 13 | | | 13 | | | 17 | | | 4 | | | - | | | 7 | | | 6 | | | 18 | | | - | | | 22 | | | 100 | |
| GIC | | | - | | | - | | | - | | | - | | | - | | | - | | | - | | | - | | | 80 | | | - | | | 80 | |
| Other | | | - | | | - | | | - | | | - | | | - | | | - | | | 1 | | | - | | | - | | | - | | | 1 | |
| | | | | | | | | | | | | | | | | | | | | | | | | | | | | | | | | | | |
Totals | | | $213 | | | $236 | | | $250 | | | $220 | | | $227 | | | $238 | | | $336 | | | $329 | | | $350 | | | $342 | | | $2,741 | |
| Ø | Net interest income earned on Acacia’s 5-9, and Acacia CRE 1 was $7 million and $21 million, respectively, for the three month and nine month periods ended September 30, 2007. After market valuation adjustments, on Acacia’s 5-9 and CRE 1 our net loss was $3 million and our net income was $9 million, respectively, for the three month and nine month periods ended September 30, 2007. |
| Ø | Net interest income earned on Acacia’s 10, 11, 12, and OA 1 was $5 million and $13 million, respectively, for the three month and nine month periods ended September 30, 2007. Our net loss, after market valuation adjustments, on Acacia’s 10, 11, 12, and OA 1 was $70 million and $74 million, respectively, for the three month and nine month periods ended September 30, 2007. |
| 20 | | The Redwood Review 3rd Quarter 2007 |
| Mark-to-Market Adjustments |
Mark-to-Market Valuation Process
| Ø | Our fair market values reflect what we believe we could realize if we chose to sell our securities. However, most of our securities (in particular our CES and CDO investments) are generally illiquid. Consequently, establishing fair market values for these securities is inherently subjective and is dependent upon modeling assumptions and indications of value obtained from brokers or dealers. |
| Ø | As a consequence of limited trading visibility during the quarter and the significant uncertainties regarding credit loss levels, the fair market values underpinning our market valuation adjustments are based on facts that are far less certain than has historically been the case in prior periods. We expect that the market valuations will continue to be highly volatile over time. |
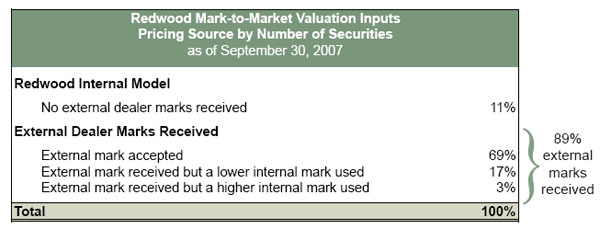
| Ø | To establish fair market values at September 30, 2007, we relied heavily on indications of value (marks) from dealers, and to a lesser extent, on values derived from our internal cash flow modeling. We received third-party dealer marks on 89% of the number of securities reflected on our balance sheet, and with respect to the remaining 11% for which we did not receive third party dealer marks, we used our internal model to establish fair value. |
| Ø | We compared all of the dealers’ marks to our internal model for reasonableness. As a result of this process, we accepted some of these marks as an indication of fair value and rejected others. If we rejected the dealer mark, we used our internal model. The table below details the breakdown of internal and external inputs used. |
| Ø | In only 3% of the cases in which we had a third-party dealer mark did we value securities above the dealer mark. For these 3%, the difference between the lower dealer marks and our higher internal marks was $9.6 million at September 30, 2007. |
| Ø | Our internal pricing model calculates fair value based on the net present value of projected future cash flows of each individual security. This calculation is dependent on a number of assumptions including: future interest rates, prepayment rates, market discount rates, and timing and amount of future credit losses. The valuation parameters of these models are calibrated to what we believe are bid-side fair market assumptions. |
| Ø | The dealers we received marks from are active participants in the capital markets. However, it is likely that most of the dealer marks we received this period were based on their pricing models and not on actual trade information. Their indications of value are based on a variety of assumptions they do not share and may prove to be inaccurate. |
The Redwood Review 3rd Quarter 2007 | | 21 |
| GAAP Earnings and Core Earnings |
Summary
What is this?
GAAP income is income calculated under Generally Accepted Accounting Principles (GAAP) in the United States.
Core earnings is a profitability measure that highlights earnings that are more likely to be ongoing in nature. In calculating core earnings, we start with GAAP earnings and then exclude realized gains and losses on calls and sales, unrealized market value adjustments, and one-time items that are unlikely to be repeated. Table 2 in the Appendix shows a reconciliation of core earnings to GAAP earnings.
Insights
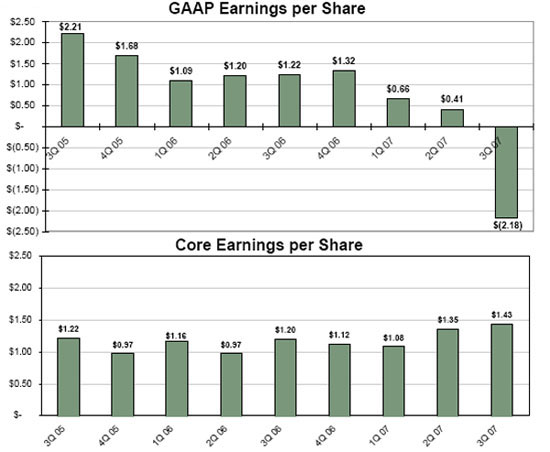
| Ø | GAAP loss per share for the third quarter of $2.18 per share was primarily due to $103 million negative unrealized mark-to-market valuation adjustments. Net interest income for the third quarter was strong. |
| Ø | For the past year and a half, quarterly core earnings have ranged from $0.97 to $1.43 per share. Our third quarter core earnings of $1.43 per share were at the top of this range. |
| | | For the Quarter Ended | |
GAAP Earnings | | Sep-07 | | Jun-07 | | Sep-06 | |
| | | | | | | | |
| Net interest income | | | $53,594 | | | $53,901 | | | $48,976 | |
| | | | | | | | | | | |
| Operating expenses | | | (11,732 | ) | | (12,772 | ) | | (13,455 | ) |
| Gains (losses) on sales | | | (1,460 | ) | | 1,428 | | | 4,967 | |
| Gains (losses) on calls | | | 3,284 | | | 1,310 | | | 723 | |
| Valuation adjustments, net | | | (102,766 | ) | | (29,430 | ) | | (5,257 | ) |
| Provision for income taxes | | | (1,837 | ) | | (3,021 | ) | | (3,538 | ) |
| | | | | | | | | | |
GAAP earnings (loss) | | | ($60,917 | ) | | $11,416 | | | $32,416 | |
| | | | | | | | | | | |
| GAAP earnings (loss) per share | | | $ (2.18 | ) | | $ 0.41 | | | $ 1.22 | |
| | | For the Quarter Ended | |
Core Earnings | | Sep-07 | | Jun-07 | | Sep-06 | |
| | | | | | | | |
| Net interest income | | | $53,594 | | | $53,901 | | | $48,976 | |
| | | | | | | | | | | |
| Operating expenses | | | (11,732 | ) | | (12,772 | ) | | (13,455 | ) |
| Gains (losses) on sales | | | - | | | - | | | - | |
| Gains (losses) on calls | | | - | | | - | | | - | |
| Valuation adjustments, net | | | - | | | - | | | - | |
| Provision for income taxes | | | (1,837 | ) | | (3,021 | ) | | (3,538 | ) |
| | | | | | | | | | | |
Core earnings (loss) | | | $40,025 | | | $38,108 | | | $31,983 | |
| | | | | | | | | | | |
| Core earnings (loss) per share | | | $ 1.43 | | | $ 1.35 | | | $ 1.20 | |
| 22 | | The Redwood Review 3rd Quarter 2007 |
| GAAP Earnings and Core Earnings |
Quarterly Update
| Ø | Net interest income for the third quarter of 2007 was similar to net interest income in the second quarter of 2007 and $5 million higher than the third quarter of 2006. Higher net interest income earnings from our securities more than offset a decrease in net interest income from a decline in balance of the consolidated residential loan portfolio. The average balance of this residential loan portfolio continued to decline due to high prepayments on adjustable-rate residential loans acquired and securitized under our Sequoia program. |
| Ø | Our residential CES portfolio continues to benefit from strong credit performance and from rapid prepayments on securities backed by ARM loans. The yield for the residential CES portfolio was 22% in the third quarter of 2007, 24% in the second quarter of 2007, and 22% in the third quarter of 2006. Prepayments have slowed by quarter end, which may lower yields going forward. |
| Ø | Operating expenses in the third quarter of 2007 were $1 million lower than the second quarter of 2007 and $2 million lower in comparison to third quarter of last year. The primary reason for this decline was lower bonus accruals. |
| Ø | The largest factor causing a decline in our GAAP earnings was $103 million of negative unrealized mark-to-market (MTM) valuation adjustments. These negative adjustments were $73 million greater than the second quarter of 2007 and $98 million greater than the third quarter of 2006. The decrease in fair value reflects the overall market decline in prices for real estate securities (particularly, securities backed by subprime and low quality alt-a loans) that occurred during the third quarter of 2007. Of the $103 million income statement MTM write-downs taken during the third quarter, $83 million were impairments as defined by GAAP and $20 million were changes in fair value on assets accounted for as trading investments. |
The Redwood Review 3rd Quarter 2007 | | 23 |
NOTE: Not all companies and analysts calculate non-GAAP measures in the same fashion. As a result, certain measures as calculated by Redwood may not be comparable to similarly titled measures reported by other companies.
ACACIA
Acacia is the brand name for the collateralized debt obligation (CDO) securitizations Redwood sponsors. The underlying pool of assets for these CDO securitizations generally consists of IGS and, in some pools, some below-investment-grade rated securities backed by residential prime, residential subprime, and commercial real estate loans. Acacia also owns related assets such as CDO securities issued by other real estate oriented CDOs, corporate debt issued by equity REITs, commercial real estate loans, and synthetic assets derived from real estate assets. Redwood typically acquires a portion of the CDO credit-enhancement (or “equity”) securities issued by Acacia; these are the securities that are in the first-loss (highest risk) position with respect to absorbing any credit losses that may occur within the assets owned by the Acacia entities. Redwood also earns asset management fees for ongoing management of the Acacia entities.
ADJUSTABLE-RATE MORTGAGES (ARMs)
Adjustable-rate mortgages are loans that have coupons that adjust at least once per year. We make a distinction between ARMs (loans with a rate adjustment at least annually) and hybrids (loans that have a fixed-rate period of two to 10 years and then become adjustable-rate).
ALT-A SECURITIES
Alt-a securities are residential mortgage-backed securities backed by loans that have higher credit quality than subprime and lower credit quality than prime. Alt-a originally represented loans with alternative documentation, but the definition has shifted over time to include loans with additional risk characteristics and a higher percentage of investor loans. For example, in an alt-a loan the borrower’s income may not be verified, and in some cases, may not be disclosed on the loan application. Alt-a loans may also have expanded criteria that allow for higher debt-to-income ratios with higher accompanying LTV than would otherwise be permissible for prime loans.
ASSET-BACKED SECURITIES (ABS)
ABS are securities backed by financial assets that generate cash flows. Each ABS issued from a securitization entity has a unique priority with respect to receiving principal and interest cash flows from the assets, and absorbing any credit losses, owned by the entity.
BOOK VALUE
Book value is the value of our common equity. As measured for GAAP, reported book value generally incorporates mark-to-market adjustments for securities and interest rate agreements, but not for loans or liabilities.
COLLATERALIZED DEBT OBLIGATION (CDO) SECURITIZATIONS
The securitization of a diverse pool of assets. See “Acacia”.
| 76 | | The Redwood Review 3rd Quarter 2007 |
CDO EQUITY SECURITIES
CDO equity securities (or CDO CES) are credit-enhancement securities that bear the initial credit losses of the assets owned by CDO securitization entities.
COMMERCIAL B-NOTE LOANS
Commercial b-note loans are structured loans that are subordinated to the more senior portions of loans secured by the same commercial real estate.
COMMERCIAL MEZZANINE LOANS
Commercial mezzanine loans are junior subordinated loans that are not secured by a lien on commercial real estate; rather, they are secured by a pledge from an equity entity of its equity interests in commercial real estate.
COMMERCIAL WHOLE LOANS
Commercial whole loans are unsecuritized first-lien loans that are secured by commercial real estate.
CONDUIT
An entity that acquires closed loans from originators, accumulates loans over a period, and sells these loans, seeking to generate a gain on sale. Sales are usually made via securitization, but also can be made through bulk whole loan sales.
CORE EARNINGS
Core earnings is not a measure of earnings in accordance with GAAP. In calculating core earnings, we attempt to strip some of the elements out of GAAP earnings that are temporary, one-time, or non-economic in nature, or that primarily relate to the past with little relevance to the future. In calculating core earnings, we are trying to show the trend of underlying ongoing earnings. For example, we sell assets from time to time as part of our ongoing portfolio management activities. These sales can produce material gains and losses that can obscure the underlying trend of our long-term portfolio earnings. Thus, we exclude realized gains (and losses) resulting from asset sales and calls that are included in GAAP income. Similarly, we exclude gains from calls of residential credit-enhancement securities, as these are essentially sales of assets. GAAP earnings also include mark-to-market income and expenses for certain of our assets and interest rate agreements. These are unrealized market value fluctuations, and we exclude them from core earnings. Core earnings also exclude other, one-time expenses such as severance.
Management believes that core earnings provide relevant and useful information regarding results from operations. This information can be used in conjunction with and in addition to GAAP measures of performance. Core earnings can be useful, in part, because market valuation adjustments on only a portion of our assets and none of our liabilities are recognized through the income statement under GAAP. Thus, GAAP valuation adjustments may not be fully indicative of changes in market values on the balance sheet as a whole and may not be a reliable guide to current operating performance. Furthermore, gains or losses realized upon sales of assets vary based on portfolio management decisions; a sale of an asset for a gain or a loss may or may not affect ongoing earnings from operations. A reconciliation of core earnings to GAAP income appears in Table 2 in the Appendix.
The Redwood Review 3rd Quarter 2007 | | 77 |
CORE EQUITY (CORE BOOK VALUE)
Core equity is not a measure calculated in accordance with GAAP. GAAP equity includes mark-to-market adjustments for certain of our assets and interest rate agreements (“accumulated other comprehensive income”). Core equity excludes these mark-to-market adjustments. Core equity in some ways approximates what our equity value would be if we used historical amortized cost accounting exclusively. A reconciliation of core equity to GAAP equity appears in Table 7 of the Appendix.
CONSTANT (OR CONDITIONAL) PREPAYMENT RATE (CPR)
Constant (or conditional) prepayment rate (CPR) is an industry-standard measure of the speed at which mortgage loans prepay. It approximates the annual percentage rate at which a pool of loans is paying down due to prepayments.
CREDIT-ENHANCEMENT SECURITIES (CES)
Credit-enhancement securities (CES) absorb the initial credit losses generated by a pool of securitized assets. As a result, the more senior securities issued from that securitization are credit-enhanced because they carry less credit risk. Our definition of CES includes all the below investment-grade rated bonds issued from a securitization. These securities are also referred to as subordinated securities and B-pieces. For a typical securitization of prime residential loans, there are three CES: the first-loss, second-loss, and third-loss bonds. The first-loss security takes the initial risk. If credit losses within the securitized asset pool exceed the principal value of the first-loss security, the second-loss security is at risk. If cumulative losses exceed the principal value of the first- and second-loss securities, then the third-loss security is at risk. Generally, for these securitizations, the third-loss security has a credit rating of BB, the second-loss has a credit rating of B, and the first-loss is unrated. Other types of securitizations, such as commercial, CDO, subprime residential, and some alt-a residential transactions, are structured differently. Nevertheless, the non-investment rated securities issued from these securitizations function as credit-enhancement securities for these transactions.
GAAP
Generally Accepted Accounting Principles in the United States.
INTEREST-ONLY SECURITIES (IOs)
Interest-only securities (IOs) are specialized securities that are backed by income-producing assets. They receive interest payments calculated by a formula wherein IO cash flows vary as a function of interest payments generated by the underlying assets within a securitization or as a function of the spread between the yield on the loans owned by a securitization entity and the cost of funds of the securities issued by that entity. Typically, IOs do not have a principal balance and they will not receive principal payments. Interest payments to IOs usually equal an interest rate formula multiplied by a “notional” principal balance. The notional principal balance for an IO is typically reduced over time as the actual principal balance of the underlying pool of assets pays down, thus reducing the cash flows to the IO over time. IO cash flows are typically reduced more quickly if asset prepayments accelerate.
| 78 | | The Redwood Review 3rd Quarter 2007 |
LEVERAGE RATIOS
We use collateralized debt to finance on the accumulation of inventory assets prior to sale to a securitization entity and to finance investments in high-quality loans and IGS. As we increase these investments, Redwood debt is growing, although balances are still at what would be considered by many analysts to be low levels for financial institutions. However, because of the consolidation of independent securitization entities, it appears on our GAAP Consolidated Financial Statements that Redwood is highly leveraged, with total liabilities significantly greater than equity. The obligations of these securitization entities are not obligations of Redwood. When determining Redwood’s financial leverage, traditional leverage ratios may be misleading in some respects if consolidated ABS issued from securitization entities are included as part of Redwood’s obligations when calculating the ratio.
MARK-TO-MARKET ACCOUNTING
Mark-to-market accounting uses estimated current fair market values of assets, liabilities, and hedges. Many of our assets currently are carried on our balance sheet at their market value rather than historical amortized cost. The changes in the fair market value of some of our assets and hedges are reported through our income statement. Increasingly in the future, we expect to use mark-to-market accounting for income statement purposes for a wider variety of assets and liabilities. This will likely make quarter-to-quarter GAAP earnings trends more volatile, although core earning and taxable income will not be affected to the same degree.
NEGATIVE AMORTIZATION ADJUSTABLE-RATE MORTGAGES (NEG AM ARMS, OPTION ARMS, OR MTA ARMS)
Negative amortization ARMs (neg am ARMs, option ARMs, pay option ARMs, or monthly treasury average (MTA) ARMs) are adjustable-rate mortgages that allow the borrower to choose between different payment options. One of these options allows the borrower to make a minimum payment. This minimum payment is less than the interest accrued on the mortgage during that period. As a result of this feature, the borrower’s loan balance may increase (causing negative amortization of the loan balance).
NET INTEREST MARGIN SECURITIES (NIMs)
Net interest margin securities (NIMs) are securities backed by cash flows that otherwise would be payable to the residual security. Through a new securitization, cash flows are diverted from the residual to amortize the NIM principal in addition to paying a coupon on the NIM. Since NIMs receive cash flows immediately or soon after securitization and tend to have short-averaged lives, they are rated by a rating agency. Rating can range from AAA down to single-B. NIMs are mostly an interest-only (IO) security because residuals (which back the NIMs) are mostly an IO security. Effectively, the IO-like cash flow is transformed into coupon and principal payments on the NIM.
OPTION ARMS
See Negative Amortization Adjustable-rate mortgages
The Redwood Review 3rd Quarter 2007 | | 79 |
OTHER REAL ESTATE INVESTMENTS
Other real estate investments (OREI) are assets that we mark-to-market for income statement purposes, in many cases because they may otherwise be deemed to contain embedded derivatives for accounting purposes under FAS 155.
PRIME RESIDENTIAL REAL ESTATE LOANS
Prime loans are residential loans with high quality credit characteristics, such as borrowers with high FICO credit scores, lower loan-to-value ratios, lower debt-to-income ratios, greater reserves, and more documentation.
PRIME SECURITIES
Prime securities are residential mortgage-backed securities backed by high credit, quality loans, generally with balances greater than conforming loan limits. Prime securities are typically backed by loans that have relatively high weighted average FICO scores (700 or higher), low weighted averages LTVs (75% or less), limited concentrations of investor properties, and low percentages of loans with low FICO or high LTV.
PROFITABILITY RATIOS
Many financial institution analysts use asset-based profitability ratios such as interest rate spread and interest rate margin in their work analyzing financial institutions. These are asset-based measures. Because we consolidate the assets and liabilities of securitization entities for GAAP purposes, our total GAAP assets and liabilities may vary strongly over time, and may not be comparable in economic reality to assets typically used in these calculations for other financial institutions. As a result, we believe equity-based profitability ratios may be more appropriate than asset-based measures for some analyses of Redwood’s operations. We believe, for example, that net interest income as a percentage of equity is a useful measure of profitability. For operating expenses, we believe useful measures are operating efficiency ratio (operating expenses as a percentage of net interest income) and operating expenses as a percentage of equity.
REAL ESTATE INVESTMENT TRUST (REIT)
A REIT is an entity that makes a tax election to be taxed as a REIT, invests in real estate assets, and meets other REIT qualifications, including the distribution as dividends of at least 90% of REIT taxable income. A REIT’s profits are not taxed at the corporate level to the extent that these profits are distributed as dividends to stockholders. This provides an operating cost savings, as most profits are not taxed at the entity level. On the other hand, the requirement to pay out as dividends most of the REIT profits means it can be harder for a REIT to grow if using only internally-generated funds (as opposed to issuing new stock).
REDWOOD DEBT
Redwood debt is all the debt that is an obligation of Redwood, with the exception of junior subordinated notes that we treat as part of our capital base. We obtain this debt from a variety of Wall Street firms, banks, and other institutions. As another form of Redwood debt, we issue collateralized commercial paper.
| 80 | | The Redwood Review 3rd Quarter 2007 |
REIT RETAINED TAXABLE INCOME
REIT retained taxable income is not a measure calculated in accordance with GAAP. REIT retained taxable income is the taxable income earned at the REIT after dividend distributions to our shareholders, less corporate income taxes and excise taxes paid at the REIT level. A reconciliation of REIT retained taxable income to GAAP income appears in Table 3 in the Appendix.
REIT SUBSIDIARY
A REIT subsidiary is a subsidiary of a REIT that is taxed as a REIT.
REIT TAXABLE INCOME
REIT taxable income is not a measure calculated in accordance with GAAP. REIT taxable income is pre-tax income calculated for tax purposes at Redwood including only its qualified REIT subsidiaries (excluding its taxable subsidiaries). REIT taxable income is an important measure as it is the basis of our dividend distributions to shareholders. We must distribute at least 90% of REIT taxable income as dividends to shareholders over time. As a REIT, we are not subject to corporate income taxes on the REIT taxable income we distribute. We pay income tax on the REIT taxable income we retain (up to 10% of total REIT taxable income). A reconciliation of REIT taxable income to GAAP income appears in Table 3 in the Appendix.
RESIDUALS
Residuals are first-loss securities that are not rated by a rating agency. Residuals are called such because they get the last (or residual) claim on the cash flow from a securitization after ABS debt interest expense, losses, and servicing have been deducted from the interest paid by the underlying mortgage loans. The value of residual securities can vary greatly and is highly dependent on prepayment speeds. The value is also dependent on the level and timing of credit losses, but often is not as sensitive to losses as it is to prepayment speeds. These securities perform poorly when prepayments are fast and losses are higher than expected.
RETURN ON EQUITY (ROE) AND ADJUSTED RETURN ON EQUITY
ROE is the amount of profit we generate each year per dollar of equity capital and equals GAAP income divided by GAAP equity. Adjusted ROE is GAAP income divided by core equity. Core equity excludes balance sheet mark-to-market adjustments. Thus, only those asset market value changes that are included in our income statement will affect adjusted ROE. A reconciliation of ROE to adjusted ROE appears in Table 8 in the Appendix.
SEQUOIA
Sequoia is the brand name for most of the securitizations of residential real estate loans we have sponsored.
SUBPRIME SECURITIES
Subprime securities are residential mortgage-backed securities backed by loans to borrowers who have impaired credit histories, but who appear to exhibit the ability to repay the current loan. Typically, these borrowers have lower credit scores and/or other credit deficiencies that prevent them from qualifying for prime or alt-a mortgages and may have experienced credit problems in the past, such as late payments or bankruptcies.. To compensate for the greater risks and higher costs to service the loans, subprime borrowers pay higher interest rates, points, and origination fees.
The Redwood Review 3rd Quarter 2007 | | 81 |
Typical characteristics of subprime loan pools include more than 60% of loans with FICO scores below 680; weighted average LTV over 85%; more than 70% of loans with LTV over 75%; loans with LTV over 80% with no mortgage insurance.
TAXABLE SUBSIDIARY
A taxable subsidiary is a subsidiary of a REIT that is not taxed as a REIT and thus pays taxes on its income. A taxable subsidiary is not limited to investing in real estate and it can choose to retain all of its after-tax profits.
TOTAL RETAINED TAXABLE INCOME
Total retained taxable income is not a measure calculated in accordance with GAAP. Total retained taxable income is the taxable income earned at the REIT after dividend distributions to shareholders, plus all of the taxable income earned at our taxable subsidiaries, less corporate income taxes and excise taxes paid. A reconciliation of total retained taxable income to GAAP income appears in Table 3 in the Appendix.
TOTAL TAXABLE INCOME
Total taxable income is not a measure calculated in accordance with GAAP. Total taxable income is pre-tax income for Redwood and all its subsidiaries as calculated for tax purposes. Taxable income calculations differ significantly from GAAP income calculations. The remainder of our total taxable income is income we earn in taxable subsidiaries. We pay income tax on this income and we generally retain the after-tax income at the subsidiary level. A reconciliation of total taxable income to GAAP income appears in Table 3 in the Appendix.
| 82 | | The Redwood Review 3rd Quarter 2007 |