| THE REDWOOD REVIEW 4TH QUARTER 2009 | 23 |
 | |
| FINANCIAL INSIGHTS |
| u | The table below presents cash flow, by type of security and investment, for the fourth and third quarters of 2009. |
| | | | | | | |
| Redwood |
| Cash Flow from Securities and Investments |
| ($ in millions) |
| | | | | | | |
| | | Three Months Ended | |
| | | 12/31/09 | | | 9/30/09 | |
| | | | | | | |
| Securities at Redwood | | | | | | |
| Residential Seniors | | $ | 41 | | | $ | 45 | |
| Residential Re-REMICs | | | 4 | | | | 3 | |
| Residential Subordinates | | | 10 | | | | 14 | |
| Commercial and CDO Subordinates | | | 1 | | | | 3 | |
| Total cash flow from securities at Redwood | | | 56 | | | | 65 | |
| | | | | | | | | |
| Investments in the Fund | | | 2 | | | | 2 | |
| Investments in Sequoia entities | | | 10 | | | | 11 | |
| Investments in Acacia entities | | | - | | | | - | |
| Total cash flow from securities and investments | | $ | 68 | | | $ | 78 | |
| 24 | THE REDWOOD REVIEW 4TH QUARTER 2009 |
Cash Flow (continued)
| u | Fourth quarter cash flow from securities and investments included $29 million of coupon interest and $39 million of principal payments, compared to $32 million of coupon interest and $46 million of principal payments in the third quarter. |
| u | We evaluate cash flow performance over the life of an investment. Interim quarter–to-quarter analysis has limitations and readers should use caution in drawing conclusions from quarterly cash flow data. In particular, we note: |
| • | Cash flow from securities and investments can be volatile from quarter to quarter depending on the level of invested capital, the timing of credit losses, and changes in prepayments and interest rates. |
| • | The timing of acquisitions and sales will have an impact on quarterly cash flow. |
| • | Given the nature of our investments (senior and subordinated securities acquired at deep discounts and IOs) it is difficult to draw conclusions in any one period about what portion of our cash flow represents “income” and what represents a “return of capital.” It is only at the end of an asset’s life that we can accurately determine what portion of the cumulative cash received (whether principal or interest) was income and what was a return of capital. |
| • | Many of our investments may generate cash flow in a quarter that is not necessarily reflective of the long-term economic yield we will earn on the investments. For example, we acquired re-REMIC support securities at what we believe to be attractive yields, although, due to their terms, the securities are locked out of receiving any principal payments for years. Because of the deferred receipt of principal payments (which modeled into our acquisition assumptions), formulating any conclusions on the value or performance of these securities by looking solely at the quarterly cash flow may not be appropriate. |
| THE REDWOOD REVIEW 4TH QUARTER 2009 | 25 |
 | |
| RESIDENTIAL REAL ESTATE SECURITIES |
Summary
Redwood invests in securities that are backed by pools of residential real estate loans. Some of our investments in residential real estate securities are backed by prime residential loans, while others are backed by non-prime loans such as Alt-A loans. Historically, we used our credit risk analysis capabilities to guide us in the acquisition of subordinate securities, which carry concentrated credit risk. More recently, our credit risk analysis has been applicable to understanding the range of risks and returns applicable to senior securities, which carry less concentrated credit risk, and since 2008 our acquisitions have been heavily weighted to this type of security. The following discussion refers only to the residential securities owned by Redwood, exclusive of the securities owned by the Fund, Sequoia entities, and Acacia entities, and exclusive of Redwood’s investments in these entities.
Market Conditions and Portfolio Activity
| u | Market prices continued to appreciate for non-agency residential mortgage-backed securities (RMBS) during the fourth quarter of 2009, as investors with a renewed appetite for risk, strong cash inflows into fixed-income mutual funds, and a renewed availability of leverage for RMBS purchases all contributed to increased prices. |
| u | The following chart illustrates generic prices that investors were willing to pay for senior RMBS from the beginning of 2008 through January 2010. |
| 26 | THE REDWOOD REVIEW 4TH QUARTER 2009 |
| |
| RESIDENTIAL REAL ESTATE SECURITIES |
Market Conditions and Portfolio Activity (continued)
| u | During the fourth quarter, we invested $68 million in RMBS and sold $58 million of RMBS and $8 million of commercial securities. Generally, our intent is to invest in assets that generate long-term cash flow. The return of greater liquidity in the RMBS market, however, has allowed us to monetize some of this future cash flow in the current period. We may continue to sell assets into this market if we believe it is in the best interest of our shareholders in the long term. |
| u | In the first quarter of 2010 through February 15, we invested $74 million in RMBS and sold $103 million of RMBS assets. |
Housing Prices
| u | We believe housing prices are much closer to the bottom of this housing cycle, but we expect further price declines. |
| u | We note that home price depreciation since 2006 (~29% in the Case Shiller Composite-20) has been sufficient to restore nation-wide housing affordability to levels consistent with long-term stability. Price-to-rent and price-to-income metrics are within their historic range, which suggests that the fundamentally driven reversion in home prices is nearing an end for the nation as a whole, but not necessarily in each market. |
| u | Oversupply continues to be the major obstacle to a recovery in home prices. Even in markets where affordability has been restored, supply overhang is holding prices down. This is the primary reason for our belief that housing prices have further to decline. |
| u | Inventories, on the surface, appear to be improving. The National Association of Realtors’ (NAR) estimate of existing home inventories has steadily declined since July 2009, and months’ supply has decreased from 10.1 in April 2009 to 7.2 in December 2009. However, this obscures two key facts: |
| • | The improvement has been strongly concentrated in low-end markets which have benefited from a tax credit and low-cost government backed loans. (The tax credit is set to expire in April 2010 and mortgage rates may increase as the Federal Reserve completes its program of acquiring $1.25 trillion of agency mortgage-backed securities.) |
| • | The “shadow inventory” of seriously delinquent mortgage properties remains a serious concern. Amherst Securities estimates that over seven million of these homes will eventually be sold as distressed properties. This represents an additional 15 months of supply. |
Loan Modifications
| u | It appears that the Administration’s Home Affordable Modification Program (HAMP) may fall short of its goal of modifying the loans of three-to-four million borrowers who are at risk of default. According to the Treasury Department’s latest data for January 2010, 1.3 million borrowers have been offered trial modifications through HAMP, and although 940,000 modification trials have been initiated, only 116,000 trials have been made permanent. |
| THE REDWOOD REVIEW 4TH QUARTER 2009 | 27 |
| |
| RESIDENTIAL REAL ESTATE SECURITIES |
Loan Modifications (continued)
| u | There are various reasons often cited for HAMP's slow start, including: |
| • | Loan servicers are overwhelmed and unable to process modifications on a timely basis. |
| • | Conflicts between first and second-lien holders. |
| • | Borrowers are either unwilling or unable to complete the necessary documentation to obtain a permanent modification. |
| • | Borrowers are indicating a willingness to walk away from significant negative equity positions rather than accept a modification that will likely keep them making payments for an extended period on a home in which they have negative equity. |
| u | While all of these explanations have some validity, in our opinion, the most significant factor is negative equity. First American CoreLogic, Inc. estimates that 24% of U.S. households currently owe more than their homes are worth, and Deutsche Bank projects that by early 2011, that figure will increase to 48%. Unfortunately, as borrower equity continues to decline, borrowers will have even less incentive to modify their loans unless modifications include principal reductions. |
| u | Although some are in favor of loan modifications that include significant principal reductions to address the negative equity issue, policy makers are struggling to address the “moral hazard” of appearing to reward at-risk and delinquent homeowners, while other homeowners continue to make their payments. As foreclosures increase and put additional pressure on housing values, we expect the debate over loan modifications and principal reductions to be elevated. To the extent that significant principal reductions on first lien mortgages become part of HAMP or are implemented through other government actions, it could undermine the value of existing RMBS (particularly RMBS backed by weaker collateral) and cause the pricing of future mortgage credit risk to increase. |
Credit
| u | Industry-wide, the fourth quarter increase in the level of delinquencies continues to be within our expectations. According to LoanPerformance, the non-agency universe of borrowers who have missed two or more payments (60+ days) is nearly 9% for prime borrowers and 30% for Alt-A borrowers. At Redwood, 60+ days delinquencies on loans underlying the prime RMBS we own are in line with the industry, while 60+ days delinquencies on loans underlying the Alt-A RMBS we own are performing better than the industry average. |
Prepayments
| u | According to data from LoanPerformance, industry-wide prepayment rates on prime loans averaged about 15% CPR for the fourth quarter, slightly slower than prepayment rates in the third quarter. Prepayment rates on prime RMBS held by Redwood have been modestly faster than the industry, reflecting the concentration of securities we own in older vintages. |
| 28 | THE REDWOOD REVIEW 4TH QUARTER 2009 |
| |
| RESIDENTIAL REAL ESTATE SECURITIES |
Prepayments (continued)
| u | Prepayment speeds on many of the securities we own have generally been ahead of our expectations from the time of acquisition. To the extent that prepayment rates remain above our expectations, all else being equal, the yields on our securities will increase over time as we are able to realize our unamortized discount sooner. |
| u | Industry-wide, prime prepayment speeds have been strongly correlated with loan age as more seasoned loans are prepaying in the mid-to-high teens compared to low-teens for more recent vintages. |
| u | Industry-wide, prepayment rates for Alt-A loans were approximately 5% in the fourth quarter according to data from LoanPerformance. The prepayment rates on non-prime securities we own (which are predominately backed by Alt-A loans) were modestly faster than the industry, reflecting the concentration of our securities in older vintages. Given the more stringent underwriting guidelines in the current environment, we expect prepayment rates on Alt-A loans to remain at low levels. |
| u | The following table breaks out the loans underlying the prime residential securities we own by size, loan type, and vintage. |
| | | | | | | | | | | | | | | | | | | | | | | | | | | | | | | | | | | | | |
| Prime Securities at Redwood |
| Composition by Product Type, Vintage, and Balance |
| December 31, 2009 |
| | | | | | | | | | | | | | | | | | | | | | | | | | | | | | | | | | | | | |
| | | <= 2004 | | 2005 | | 2006 | | 2007 | | 2008 | | Total |
| Product | | % of Balance | | | Wtd Avg Loan Rate(1) | | % of Balance | | | Wtd Avg Loan Rate(1) | | % of Balance | | | Wtd Avg Loan Rate(1) | | % of Balance | | | Wtd Avg Loan Rate(1) | | % of Balance | | | Wtd Avg Loan Rate(1) | | % of Balance | | | Wtd Avg Loan Rate(1) |
| | | | | | | | | | | | | | | | | | | | | | | | | | | | | | | | | | | | | |
| Hybrid/ARM | | | 26 | % | | | 4.00 | % | | | 45 | % | | | 5.39 | % | | | 32 | % | | | 5.93 | % | | | 17 | % | | | 6.46 | % | | | 10 | % | | | 6.13 | % | | | 29 | % | | | 4.83 | % |
| Fixed | | | 12 | % | | | 5.68 | % | | | 2 | % | | | 6.04 | % | | | 13 | % | | | 6.28 | % | | | 44 | % | | | 6.38 | % | | | 71 | % | | | 6.60 | % | | | 14 | % | | | 6.00 | % |
| | | | | | | | | | | | | | | | | | | | | | | | | | | | | | | | | | | | | | | | | | | | | | | | | |
| Jumbo | | | 38 | % | | | | | | | 47 | % | | | | | | | 45 | % | | | | | | | 62 | % | | | | | | | 81 | % | | | | | | | 43 | % | | | | |
| | | | | | | | | | | | | | | | | | | | | | | | | | | | | | | | | | | | | | | | | | | | | | | | | |
| Hybrid/ARM | | | 35 | % | | | 4.08 | % | | | 51 | % | | | 5.46 | % | | | 42 | % | | | 5.97 | % | | | 7 | % | | | 6.42 | % | | | 3 | % | | | 6.38 | % | | | 36 | % | | | 4.78 | % |
| Fixed | | | 27 | % | | | 5.64 | % | | | 2 | % | | | 6.01 | % | | | 14 | % | | | 6.25 | % | | | 32 | % | | | 6.37 | % | | | 17 | % | | | 6.46 | % | | | 21 | % | | | 5.81 | % |
| | | | | | | | | | | | | | | | | | | | | | | | | | | | | | | | | | | | | | | | | | | | | | | | | |
| Conforming | | | 62 | % | | | | | | | 53 | % | | | | | | | 55 | % | | | | | | | 38 | % | | | | | | | 19 | % | | | | | | | 57 | % | | | | |
| | | | | | | | | | | | | | | | | | | | | | | | | | | | | | | | | | | | | | | | | | | | | | | | | |
| Totals | | | 100 | % | | | | | | | 100 | % | | | | | | | 100 | % | | | | | | | 100 | % | | | | | | | 100 | % | | | | | | | 100 | % | | | | |
(1) Average rate is based on underlying loan balances.
| u | The majority (57%) of the loans underlying prime residential securities we own are within the Agency conforming loan limits. These limits vary by county and are as high as $729,750 in certain areas. |
| u | The table above also provides the weighted average coupon rates for the respective year of issuance and for our entire portfolio by product. For example, within the conforming 2004 bucket, the average interest rate of the fixed rate loans underlying our portfolio is 5.64%. In mid-February 2010, the interest rate on a new conforming 30-year fixed rate mortgages was just under 5.00%. Although at this rate many borrowers would appear to have an incentive to refinance, the ability to refinance is dependent upon a number of factors in addition to mortgage interest rates, including loan-to-value ratios, ability to provide necessary documentation, and employment status. As a result of these factors, we generally expect prepayments to remain at historically slow levels. |
| THE REDWOOD REVIEW 4TH QUARTER 2009 | 29 |
| |
| RESIDENTIAL REAL ESTATE SECURITIES |
Quarterly Update
| u | Interest income generated by residential securities we own was $24 million in the fourth quarter, an annualized yield of 14% on our amortized cost of these securities. |
| u | At December 31, 2009, the fair value of residential securities we own totaled $771 million, consisting of $329 million in prime senior securities, $315 million in non-prime senior securities, $106 million in re-REMIC securities, and $21 million in subordinate securities. Each of these is further discussed below. |
| u | At December 31, 2009, the securities we held consisted of fixed-rate assets (22%), adjustable-rate and hybrid assets that have reset to adjustable-rate assets (22%), hybrid assets that will reset within 12 months (29%), hybrid assets that will reset after 12 months (26%), and other (1%). |
| u | At December 31, 2009, the investments we own in the Fund and securitization entities consisted of fixed-rate assets (1%), adjustable-rate and hybrid assets that have reset to adjustable-rate assets (88%), hybrid assets that will reset within 12 months (6%), hybrid assets that will reset after 12 months (<1%), and other (6%). |
| 30 | THE REDWOOD REVIEW 4TH QUARTER 2009 |
| |
| RESIDENTIAL REAL ESTATE SECURITIES |
Residential Prime Senior Securities Portfolio
What is this?
Residential prime securities are mortgage-backed securities backed by prime residential mortgage loans. Senior securities are those interests in a securitization that have the first right to cash flows and are last in line to absorb losses. Information on prime senior securities we own and underlying loan characteristics are set forth in Tables 6, 7, 8, and 9A in the Financial Tables in this Review.
Quarterly Update
| u | Most of the senior securities we own are from the 2005 vintage. The following table presents information on residential prime senior securities at Redwood at December 31, 2009. |
| | | | | | | | | | | | | | | | |
| Credit Support Analysis - Prime Senior Securities at Redwood |
| By Vintage |
| December 31, 2009 |
| ($ in millions) |
| | | | | | | | | | | | | | | | |
| | <=2004 | | | 2005 | | | 2006 | | | 2007 | | Total | |
| | | | | | | | | | | | | | | | |
| Current face | | $ | 17 | | | $ | 306 | | | $ | 17 | | | $ | 71 | | | $ | 411 | |
| Net unamortized discount | | | (4 | ) | | | (90 | ) | | | (5 | ) | | | (16 | ) | | | (115 | ) |
| Credit reserve | | | - | | | | (6 | ) | | | - | | | | (5 | ) | | | (11 | ) |
| Unrealized gains (losses) | | | 1 | | | | 38 | | | | (2 | ) | | | 7 | | | | 44 | |
| | | | | | | | | | | | | | | | | | | | | |
| Fair value of AFS Prime Senior Securities | | $ | 14 | | | $ | 248 | | | $ | 10 | | | $ | 57 | | | $ | 329 | |
| | | | | | | | | | | | | | | | | | | | | |
Overall credit support to Prime Senior Securities (1) | | | 10.87 | % | | | 7.34 | % | | | 6.29 | % | | | 7.68 | % | | | 7.55 | % |
Serious delinquencies as a % of collateral balance (1) | | | 7.83 | % | | | 6.83 | % | | | 7.85 | % | | | 6.40 | % | | | 6.78 | % |
| | | | | | | | | | | | | | | | | | | | | |
(1) Overall credit support and serious delinquency rates are weighted by securitization balances. Credit support and delinquencies may vary significantly by securitization. Serious delinquencies include loans over 90-days past due, in foreclosure, and REO.
| u | The overall credit support data presented in the table above represents the level of support for prime securities owned by Redwood. At December 31, 2009, the overall level of credit support was 7.55%, which means that losses in the aggregate would have to exceed this amount of the current face amount of the securities before Redwood would suffer losses. However, some securities have either more or less credit support than others, so it is possible for some securities to incur losses without aggregate losses exceeding 7.55%. For example, in the fourth quarter we incurred losses of $1 million on senior securities, even though aggregate losses did not exceed 7.55%. Over time, the performance of these securities may require a change in the amount of credit reserves we designate. We acquire securities assuming a range of outcomes and believe our returns can still be attractive even if losses increase above our current estimates. |
| u | Comparing the level of credit support available to seriously delinquent loans provides a measure of the level of credit sensitivity that exists within our senior securities portfolio. For example, the senior securities have 7.55% of credit support with serious delinquencies currently at 6.78%. Assuming a historically high 50% loss severity on these delinquencies would produce losses of 3.39%, leaving enough credit support for an additional 4.16% of losses before the senior securities would start to absorb credit losses. |
| THE REDWOOD REVIEW 4TH QUARTER 2009 | 31 |
| |
| RESIDENTIAL REAL ESTATE SECURITIES |
Residential Non-Prime Senior Securities Portfolio
What is this?
Residential non-prime securities are mortgage-backed securities backed by non-prime residential mortgage loans. Non-prime residential loans include Alt-A and Option ARM mortgage loans. Senior securities are those interests in a securitization that have the first right to cash flows and are last in line to absorb losses. Information on non-prime senior securities we own and underlying loan characteristics are set forth in Tables 6, 7, 8, and 9B in the Financial Tables in this Review.
Quarterly Update
| u | Most of the non-prime senior securities we own are from 2005 and prior vintages. The following table presents information on residential non-prime senior securities at Redwood at December 31, 2009. |
| | | | | | | | | | | | | | | | |
| Credit Support Analysis - Non-Prime Senior Securities at Redwood |
| By Vintage |
| December 31, 2009 |
| ($ in millions) |
| | | | | | | | | | | | | | | | |
| | | <=2004 | | | 2005 | | | 2006 | | | 2007 | | | Total | |
| | | | | | | | | | | | | | | | |
| Current face | | $ | 146 | | | $ | 253 | | | $ | 23 | | | $ | 2 | | | $ | 424 | |
| Net unamortized discount | | | (42 | ) | | | (82 | ) | | | (10 | ) | | | - | | | | (134 | ) |
| Credit reserve | | | (1 | ) | | | (12 | ) | | | - | | | | - | | | | (13 | ) |
| Unrealized gains (losses) | | | 15 | | | | 18 | | | | (1 | ) | | | - | | | | 32 | |
| | | | | | | | | | | | | | | | | | | | | |
| Fair value of Non-Prime Senior Securities (AFS) | | $ | 118 | | | $ | 177 | | | $ | 12 | | | $ | 2 | | | $ | 309 | |
| | | | | | | | | | | | | | | | | | | | | |
Overall credit support to Non-Prime Senior Securities(1) | | | 15.42 | % | | | 20.07 | % | | | 34.56 | % | | | 4.27 | % | | | 19.14 | % |
Serious delinquencies as a % of collateral balance(1) | | | 10.51 | % | | | 15.39 | % | | | 19.37 | % | | | 6.24 | % | | | 14.29 | % |
| | | | | | | | | | | | | | | | | | | | | |
| Fair value of Non-Prime Senior Securities (trading) | | $ | - | | | $ | 6 | | | $ | - | | | $ | - | | | $ | 6 | |
| | | | | | | | | | | | | | | | | | | | | |
| Total fair value of Non-Prime Senior Securities | | $ | 118 | | | $ | 183 | | | $ | 12 | | | $ | 2 | | | $ | 315 | |
(1) Overall credit support and serious delinquency rates are weighted by securitization balances. Credit support and delinquencies may vary significantly by securitization. Serious delinquencies include loans over 90-days past due, in foreclosure, and REO.
| u | Serious delinquencies in our non-prime senior portfolio are significantly higher than in our prime senior portfolio. However, the levels of credit and structural support are also significantly higher and, as a result, our non-prime senior portfolio is able to withstand the higher levels of credit losses we expect to incur on these pools. |
| 32 | THE REDWOOD REVIEW 4TH QUARTER 2009 |
| |
| RESIDENTIAL REAL ESTATE SECURITIES |
Residential Re-REMIC Support Securities Portfolio
What is this?
A re-REMIC is a re-securitization of asset-backed securities. Depending on the structure of the re-REMIC, the cash flows from, and any credit losses absorbed by, the underlying asset-backed securities are allocated among the re-REMIC securities issued in the re-securitization transaction in a variety of ways. Information on our re-REMIC securities is set forth in Tables 6, 7, and 8 in the Financial Tables in this Review.
Recently, prime residential senior securities have been pooled and securitized to create a two-tranche structure with a re-REMIC senior security and a re-REMIC support security. In these re-REMICs, all principal payments from the underlying senior securities are directed to the re-REMIC senior security until its face value is zero. Thereafter, all principal payments are directed to the re-REMIC support security. Credit losses, if any, are first absorbed by the re-REMIC support security; however, these credit losses occur only when credit losses exceed the credit protection provided to the underlying senior securities by the subordinate securities within their respective securitization structures. Both the re-REMIC senior security and the re-REMIC support security generally receive interest while any face value is outstanding.
Quarterly Update
| u | The following table presents information on residential re-REMIC support securities at Redwood at December 31, 2009. |
| | | | | | | | | | | | | | | | |
| Credit Support Analysis - Re-REMIC Support Securities at Redwood |
| By Vintage |
| December 31, 2009 |
| ($ in millions) |
| | | | | | | | | | | | | | | | |
| | <=2004 | | | 2005 | | | 2006 | | | 2007 | | Total | |
| | | | | | | | | | | | | | | | |
| Current face | | $ | 10 | | | $ | 33 | | | $ | 179 | | | $ | 35 | | | $ | 257 | |
| Net unamortized discount | | | (6 | ) | | | (19 | ) | | | (70 | ) | | | (16 | ) | | | (111 | ) |
| Credit reserve | | | (1 | ) | | | (6 | ) | | | (66 | ) | | | (9 | ) | | | (82 | ) |
| Unrealized gains | | | 1 | | | | 5 | | | | 32 | | | | 4 | | | | 42 | |
| | | | | | | | | | | | | | | | | | | | | |
| Fair value of AFS re-REMIC Support Securities | | $ | 4 | | | $ | 13 | | | $ | 75 | | | $ | 14 | | | $ | 106 | |
| | | | | | | | | | | | | | | | | | | | | |
Overall credit support to re-REMIC support securities (1) | | | 8.99 | % | | | 10.64 | % | | | 4.90 | % | | | 6.48 | % | | | 7.37 | % |
Serious delinquencies as a % of collateral balance (1) | | | 4.12 | % | | | 4.45 | % | | | 4.94 | % | | | 5.61 | % | | | 5.06 | % |
| | | | | | | | | | | | | | | | | | | | | |
(1) Overall credit support and serious delinquency rates are weighted by securitization balances. Credit support and delinquencies may vary significantly by securitization. Serious delinquencies include loans over 90-days past due, in foreclosure, and REO.
| u | In the first quarter through February 15, 2010, we sold $44 million of re-REMIC support securities, primarily from the 2006 vintage, at prices in excess of GAAP carrying value at December 31, 2009. |
| THE REDWOOD REVIEW 4TH QUARTER 2009 | 33 |
| |
| RESIDENTIAL REAL ESTATE SECURITIES |
Residential Subordinate Securities Portfolio
What is this?
Subordinate securities are the interests in a securitization that are not senior interests. Subordinate securities are those interests in a securitization that have the last right to cash flows and are first in line to absorb losses. Residential subordinate securities owned at Redwood are backed by prime and non-prime residential loans. Information on our subordinate securities and underlying loan characteristics are set forth in Tables 6, 7, 8, 9A, and 9B in the Financial Tables in this Review.
Quarterly Update
| u | The table below presents the components of fair value (which equals GAAP carrying value) of residential subordinate securities at Redwood at December 31, 2009. |
| | | | | | | | | | |
| Residential Subordinate Securities at Redwood |
| December 31, 2009 |
| ($ in millions) |
| | | | | | | | | | |
| | | Vintage | | | | |
| | | <=2004 | | | >=2005 | | | Total | |
| Available for sale (AFS) | | | | | | | | | |
| Current face | | $ | 200 | | | $ | 220 | | | $ | 420 | |
| Credit reserve | | | (157 | ) | | | (196 | ) | | | (353 | ) |
| Net unamortized discount | | | (15 | ) | | | (8 | ) | | | (23 | ) |
| Amortized cost | | | 28 | | | | 16 | | | | 44 | |
| | | | | | | | | | | | | |
| Unrealized gains | | | 1 | | | | 1 | | | | 2 | |
| Unrealized losses | | | (15 | ) | | | (11 | ) | | | (26 | ) |
| | | | | | | | | | | | | |
| Fair value of AFS subordinate securities | | $ | 14 | | | $ | 6 | | | $ | 20 | |
| | | | | | | | | | | | | |
| Fair value of trading subordinate securities | | | 1 | | | | - | | | | 1 | |
| | | | | | | | | | | | | |
| Total fair value of subordinate securities | | $ | 15 | | | $ | 6 | | | $ | 21 | |
| u | Credit losses totaled $98 million in our residential subordinate portfolio in the fourth quarter, a modest increase from $97 million in the third quarter of 2009. We expect future losses will extinguish the large majority of the securities in the 2005 and later category as reflected by the $196 million of credit reserves we have provided for on the $220 million face value of those securities. We expect losses on the securities in the 2004 and earlier category will also be high based on our level of reserves to face value, but we expect to recover some principal over time. Until then, we will continue to earn interest on the face value of those securities. |
| u | Due to the structure of RMBS, once losses in a pool of mortgages exceed our investment in that pool, we cannot suffer additional losses as our potential loss is capped at our investment in the securities in that pool. |
| 34 | THE REDWOOD REVIEW 4TH QUARTER 2009 |
| |
| COMMERCIAL REAL ESTATE SECURITIES |
Summary
Redwood invests in commercial real estate loans and securities. Our existing commercial investments at Redwood are predominately subordinate securities. We expect to invest in commercial loans in 2010. This discussion is exclusive of commercial securities and loans owned by Acacia entities.
Market Conditions
| u | Due to generally deteriorating fundamentals, all participants in the commercial real estate markets must confront the reality of declining property valuations, more conservative underwriting, lower advance rates, and fewer providers of capital. |
| u | The chart below shows the dramatic rise and fall of commercial real estate prices since December 2000. In our opinion, it is still too early in the cycle to be seduced by lower prices, as prices may decline further. |
Price Indices — Commercial Real Estate
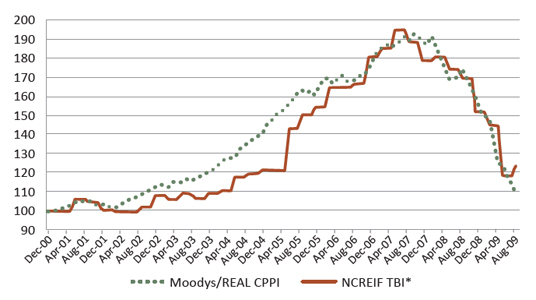
Source: MBA, Moody’s Investors Services and MIT, * National Council of Real Estate Fiduciaries Transaction Based Index
| u | Among other factors, lower valuations and deleveraging have reduced the pipeline of sales and financing transactions to historically low levels. As an example, commercial real estate sales were down about 65% in 2009 as compared to 2008, according to Real Capital Analytics. |
| u | We generally classify the existing commercial market into three distinct sectors: 1) GOOD: high quality, stabilized assets that have been appropriately revalued; 2) BAD: over-levered assets that have yet to establish new valuation baselines and still face both operational and capital structure risks; and, 3) UGLY: those assets where property fundamentals are under extreme pressure, where the borrowers and lenders are uncertain of what actions to take in the face of current market conditions, and where few investors are willing to engage in refinancing transactions (outside of opportunistic capital providers who have considerable patience and operational infrastructure). Redwood’s current focus in the commercial sector is squarely on the “GOOD” sector, where we will look for opportunities to provide financing to bridge funding gaps that may arise as owners refinance their maturing commercial real estate loans. |
| THE REDWOOD REVIEW 4TH QUARTER 2009 | 35 |
| |
| COMMERCIAL REAL ESTATE SECURITIES |
Market Conditions (continued)
| u | The diagram below shows the hypothetical capital structure that could be used to refinance a maturing commercial real estate loan. In particular, the diagram illustrates the funding gap that could result from the combination of a reduced property value, a lower loan-to-value (LTV) ratio resulting from more conservative underwriting by senior lenders, and the infusion of new equity in an amount limited to 15% - 20% of the current value of the property. |
Hypothetical Capital Structure for Refinancing a Commercial Real Estate Asset
| u | Providing financing to fill the funding gap in the example illustrated above represents one type of investment opportunity that Redwood plans to evaluate as an opportunity for investment in commercial real estate credit risk as a subordinate debt provider, mezzanine lender, or investor in preferred equity. |
Quarterly Update
| u | Our legacy portfolio of commercial securities (acquired prior to 2008) generated $1 million of cash flow during the fourth quarter, down from $3 million in the third quarter. The decline in cash flow is attributable to the sale of some of our securities during the quarter, as well as increasing delinquencies in our portfolio, reducing cash receipts. |
| u | In early October, we sold the majority of our 2006 and 2007 vintage CMBS and generated proceeds of $8 million. |
| u | Our remaining investments in commercial securities consist of predominantly 2004 and 2005 subordinate bonds with a fair market value of $9 million. These securities have a face value of $159 million and credit reserves of $146 million. |
| u | Realized credit losses on our commercial subordinate securities of $11 million were charged against our designated credit reserve in the fourth quarter of 2009. |
| 36 | THE REDWOOD REVIEW 4TH QUARTER 2009 |
| |
| INVESTMENTS IN SECURITIZATION ENTITIES |
Summary
What is this?
We sponsor Sequoia and Acacia securitization entities that acquire mortgage loans and securities and create and issue ABS backed by these loans and securities. While we have not sponsored any securitizations since mid-2007, we plan to sponsor new Sequoia securitization entities in the future.
Our investments in Sequoia entities include senior and subordinate securities issued by these entities as well as interest only securities (IOs) issued by these entities. Our investments in Acacia entities include equity interests and other securities issued by these entities. We also receive asset management fees from Acacia entities.
Quarterly Update
| u | Cash generated by our investments in Sequoia and Acacia entities totaled $10 million in the fourth quarter of 2009 compared to $11 million in the third quarter of 2009. The majority ($9 million) of this cash flow was generated from Sequoia IOs we own, which were primarily issued in 2005 and earlier. |
| u | In the fourth quarter, we reported GAAP income of $5 million from the Sequoia and Acacia entities. This was an increase from the $3 million reported in the third quarter due to a reduction in loan loss provision expense and lower negative market valuation adjustments. |
| u | Since 1996, Redwood has sponsored 46 Sequoia securitizations of prime residential mortgage loans with aggregate original balances in excess of $33 billion. The majority of the loans in these securitizations (95%) were ARMs and the remaining were hybrid loans. Most of the securitizations (41) occurred in 2005 and earlier, and thus, the majority of the loans in these pools were originated in 2005 and earlier. |
| u | Our investments in consolidated securitization entities do not appear on our balance sheet as assets; rather, they are reflected as the difference between the consolidated assets of Sequoia and Acacia entities ($4.2 billion at December 31, 2009) and the consolidated Sequoia and Acacia ABS issued to third parties ($4.1 billion at December 31, 2009). The assets and liabilities of consolidated Sequoia entities are carried on our consolidated balance sheet at their amortized cost and the assets and liabilities of consolidated Acacia entities are carried on our balance sheet at their fair market values. At December 31, 2009, the GAAP book value of Redwood’s investments in Sequoia and Acacia entities was $75 million, or 8% of our reported book value. |
| u | The reported book value of our investments in Sequoia and Acacia entities differs from the $46 million estimated fair value of our investments in these securitization entities, which consists of $41 million of IOs issued by Sequoia entities, $2 million of senior and subordinate securities issued by Sequoia entities, and a $3 million investment in Acacia entities (derived from expected future management fees discounted at 45%). |
| u | The consolidation of the assets and liabilities of securitization entities may lead to potentially volatile reported earnings for a variety of reasons including the amortization of premium on the loans and liabilities of Sequoia entities, changes in credit loss provisions for loans held by Sequoia entities, fair value adjustments for the assets and liabilities of the Acacia entities, and deconsolidation events. Each of these factors could cause income reported from these entities to vary significantly from quarter to quarter. |
| THE REDWOOD REVIEW 4TH QUARTER 2009 | 37 |
| |
| INVESTMENTS IN SECURITIZATION ENTITIES |
Quarterly Update (continued)
| u | Our Sequoia IOs have significant prepayment risk. These IOs earn the “spread” between the coupon rate on the $2.4 billion notional amount of underlying adjustable-rate mortgage (ARM) loans and the cost of funds (indexed to one-month LIBOR) on the ABS issued within each respective securitization entity. Since these IOs do not receive any principal cash flows, the longer they receive this interest rate spread, the higher the return. Thus, slower rates of principal repayments (i.e., the longer a loan is outstanding) increase cash flows and returns. |
| u | Prepayment speeds remain low, averaging less than 10% CPR for the fourth consecutive quarter for the underlying loans in the Sequoia entities. In December 2009, these loans had a weighted average coupon of 2.20%. Given the current very low coupon rates, we expect prepayment speeds on these loans to remain low, which is positive for the future cash flow generation from our IO investments. |
| u | In 2009, the cash flow and earnings from our Sequoia IOs benefitted from the historically large difference between six-month LIBOR (which is the index on the majority of the loans underlying our IOs) and one-month LIBOR (which is the index on the majority of the debt issued by these entities). Over the past year, this spread has decreased and we do not anticipate having this same benefit to our cash flow in future periods. |
| u | For the $29.6 billion in prime residential loan securitizations we sponsored in 2005 and earlier, credit losses to date have totaled $26 million, or 0.09% (nine basis points) of original balance. As of December 31, 2009, seriously delinquent (over 90 days past due, in foreclosure, or REO) loans held in these Sequoia entities totaled $122 million, or 0.4% of the original balance and 4.3% of the outstanding balance. While we still expect additional losses on these loans, we believe their credit performance will remain better than anticipated at the time of securitization. |
| u | The $3.6 billion of Sequoia securitizations that we sponsored in 2006 and 2007 have not performed as well as Sequoia securitizations we sponsored before 2006. To date, these pools have incurred $39 million of credit losses, or 1.1% of original balance. As of December 31, 2009, seriously delinquent loans held in these Sequoia entities totaled $264 million, or 7.3% of the original balance and 11.2% of the outstanding balance. To date, credit losses have not yet been incurred on any of the senior securities issued by Sequoia entities in these securitizations, although a few of these senior securities may incur losses in the future, depending on the magnitude and timing of additional credit losses incurred by the underlying loans. |
| u | The information provided in the preceding two paragraphs reflects all the prime residential Sequoia securitizations, regardless of whether we are currently consolidating the assets and liabilities for the specific Sequoia entity as of the end of 2009. Thus, delinquency information presented herein will differ from information provided regarding Sequoia entities included in our consolidated balance sheet as of December 31, 2009. |
| 38 | THE REDWOOD REVIEW 4TH QUARTER 2009 |
Mark-to-Market Valuation Process
| u | Establishing market values is inherently subjective and requires us to make a number of assumptions, including the future of interest rates, prepayment rates, discount rates, credit loss rates, and the timing of credit losses. The assumptions we apply are specific to each asset or liability. Market values reflect an “exit price,” or the amount we believe we would realize if we sold an asset or would pay if we repurchased a liability in an orderly transaction, even though we generally have no intention to sell assets or repurchase liabilities. |
| u | Although we rely on our internal calculations to compute the fair value of our securities, we request and consider indications of value (marks) from third-party dealers to assist us in our mark-to-market valuation process. For December 31, 2009, we received dealer marks on 83% of our assets and 93% of our liabilities. In the aggregate, our internal valuations of the securities on which we received dealer marks were 3% lower (i.e., more conservative) than the dealer marks and our internal valuations of our ABS issued on which we received dealer marks were 9% higher (i.e., more conservative) than the dealer marks. |
| 40 | THE REDWOOD REVIEW 4TH QUARTER 2009 |
Accounting Discussion
| u | As discussed in our second quarter 2009 Redwood Review, on April 1, 2009, we were required to adopt a new accounting principle affecting the determination of other-than-temporary impairment (OTTI) and its recognition through the income statement and balance sheet. The revised process is presented below. Upon adoption, we made a one-time retained earnings reclassification of $60 million of prior impairments. As a result of this reclassification, our book value did not change. Under the new accounting principle, as this impairment is recovered over time, rather than flow through earnings (where the impairment was originally reported), it will instead be credited to equity. The net impact is that our future cumulative reported earnings will now be $60 million less than it would have been prior to adopting this required accounting principle. We estimate that most of these earnings would have been recognized in 2009 through 2011. |
| u | Accounting for negative changes in the fair value of AFS securities in any period requires a multi-step process involving quantitative and judgmental evaluations. The following diagram outlines the process for determining the amount of impairments and what portion flows through our income statement and what portion flows through our balance sheet. |

| THE REDWOOD REVIEW 4TH QUARTER 2009 | 41 |
ACACIA
Acacia is the brand name for the collateralized debt obligation (CDO) securitizations Redwood sponsored.
ADJUSTABLE-RATE MORTGAGES (ARMs)
Adjustable-rate mortgages are loans that have coupons that adjust at least once per year. We make a distinction between ARMs (loans with a rate adjustment at least annually) and hybrids (loans that have a fixed-rate period of two-to-10 years and then become adjustable-rate).
AGENCY
Agency refers to government-sponsored enterprises (GSEs), including the Federal National Mortgage Association (Fannie Mae), the Federal Home Loan Mortgage Corporation (Freddie Mac), and the Government National Mortgage Association (Ginnie Mae).
ALT-A SECURITIES and ALT-A LOANS
Alt-A securities are residential mortgage-backed securities backed by loans that have higher credit quality than subprime and lower credit quality than prime. Alt-A originally represented loans with alternative documentation, but the definition has shifted over time to include loans with additional risk characteristics and a higher percentage of investor loans. In an Alt-A loan, the borrower’s income may not be verified, and in some cases, may not be disclosed on the loan application. Alt-A loans may also have expanded criteria that allow for higher debt-to-income ratios with higher accompanying loan-to-value ratios than would otherwise be permissible for prime loans.
AMORTIZED COST
Amortized cost is the initial acquisition cost of an available for sale (AFS) security, minus principal repayments or principal reductions through credit losses, plus or minus premium or discount amortization. At the point in time an AFS security is deemed other-than-temporarily impaired, the amortized cost is adjusted (by changing the amount of unamortized premium or discount) by the amount of impairment taken through the income statement.
ASSET-BACKED SECURITIES (ABS)
Asset-backed securities (ABS) are securities backed by financial assets that generate cash flows. Each ABS issued from a securitization entity has a unique priority with respect to receiving principal and interest cash flows and absorbing any credit losses from the assets owned by the entity.
AVAILABLE FOR SALE (AFS)
An accounting method for debt and equity securities in which the securities are reported at their fair value on the balance sheet. Positive changes in the fair value are accounted for as increases to stockholders’ equity and do not flow through the income statement. Negative changes in fair value may be recognized through the income statement or balance sheet, as further detailed in the Accounting Discussion module.
| 42 | THE REDWOOD REVIEW 4TH QUARTER 2009 |
BOOK VALUE (GAAP)
Book value is the value of our common equity in accordance with GAAP.
COLLATERALIZED DEBT OBLIGATION (CDO) SECURITIZATIONS
The securitization of a diverse pool of assets.
COMMERCIAL MORTGAGE-BACKED SECURITIES (CMBS)
A type of mortgage-backed security that is secured by one or more loans on commercial properties.
CONSTANT (or CONDITIONAL) PREPAYMENT RATE (CPR)
Constant (or conditional) prepayment rate (CPR) is an industry-standard measure of the speed at which mortgage loans prepay. It approximates the annual percentage rate at which a pool of loans is paying down due to unscheduled principal prepayments.
CORE EQUITY
Core equity is not a measure calculated in accordance with GAAP. GAAP equity includes mark-to-market adjustments for some of our assets and interest rate agreements in “accumulated other comprehensive income (loss).” Core equity excludes accumulated other comprehensive income (loss). Core equity in some ways approximates what our equity value would be if we used historical amortized cost accounting exclusively. A reconciliation of core equity to GAAP appears in the Table 4 in the Financial Tables in this Review.
CREDIT SUPPORT
Credit support is the face amount of securities subordinate (or junior) to the applicable security that protects the security from credit losses and is generally expressed as a percentage of the securitization’s underlying pool balance.
DEBT
Debt is an obligation of Redwood. See Long-term debt and Short-term debt.
ECONOMIC VALUE (MANAGEMENT’S ESTIMATE OF ECONOMIC VALUE)
Economic value closely relates to liquidation value and is calculated using the bid-side marks (or estimated bid-side values) for all of our financial assets, and offered-side marks (or estimated offered-side values) for all of our financial liabilities. We calculate management’s estimate of economic value as a supplemental measure to book value calculated under GAAP. Our economic value estimates on a per-share basis are reconciled to GAAP book values per share in Table 4 in the Financial Tables of this Review.
FASB
Financial Accounting Standards Board.
| THE REDWOOD REVIEW 4TH QUARTER 2009 | 43 |
THE FUND
The Fund refers to the Redwood Opportunity Fund, L.P., which is managed by Redwood Asset Management, Inc., a wholly-owned subsidiary of Redwood.
GAAP
Generally Accepted Accounting Principles in the United States.
INTEREST-ONLY SECURITIES (IOs)
Interest-only securities (IOs) are specialized securities created by securitization entities where the projected cash flows generated by the underlying assets exceed the cash flows projected to be paid to the ABS issued that have principal balances. Typically, IOs do not have a principal balance and they will not receive principal payments. Interest payments to IOs usually equal an interest rate formula multiplied by a “notional” principal balance. The notional principal balances for IOs are typically reduced over time as the actual principal balances of the underlying pools of assets pay down, thus reducing the cash flows to the IOs over time. Cash flows on IOs are typically reduced more quickly when asset prepayments accelerate.
LEVERAGE RATIOS
When determining Redwood’s financial leverage, traditional leverage ratios may be misleading in some respects if consolidated ABS issued from securitization entities are included as part of Redwood’s obligations when calculating this or similar ratios. Because of the requirement to consolidate the independent securitization entities for GAAP accounting purposes, it appears that Redwood is highly leveraged, with total consolidated liabilities significantly greater than equity. The obligations of these securitization entities are not obligations of Redwood.
LONG-TERM DEBT
Long-term debt is debt that is an obligation of Redwood that is not payable within a year and includes junior subordinated notes and trust preferred securities. We generally treat long-term debt as part of our capital base when it is not payable in the near future.
MARK-TO-MARKET (MTM) ACCOUNTING
Mark-to-market accounting uses estimated fair values of assets, liabilities, and hedges. Many of our assets are carried on our balance sheet at their fair value rather than amortized cost. Taxable income is generally not affected by market valuation adjustments.
MARKET VALUATION ADJUSTMENTS (MVA)
Market valuation adjustments (MVA) are changes in market values for certain assets and liabilities that are reported through our GAAP income statement. They include all changes in market values for assets and liabilities accounted for at fair value, such as trading securities and derivatives. They also include the credit portion of other-than-temporary impairments on securities available-for-sale, as well as impairments of loans held-for-sale and REO properties.
| 44 | THE REDWOOD REVIEW 4TH QUARTER 2009 |
NON-GAAP METRICS
Not all companies and analysts calculate non-GAAP metrics in the same manner. As a result, certain metrics as calculated by Redwood may not be comparable to similarly titled metrics reported by other companies. Redwood uses non-GAAP metrics such as management’s estimate of economic value and core equity to provide greater transparency for investors. Our non-GAAP metrics are reconciled to GAAP in the Financial Tables in this Review.
NON-PRIME SECURITIES
Non-prime securities are Alt-A, option ARM, and subprime securities. See definitions of Alt-A, option ARM, and subprime securities.
OPTION ARM LOAN
An option ARM loan is a residential mortgage loan that generally offers a borrower monthly payment options such as: 1) a minimum payment that results in negative amortization; 2) an interest-only payment; 3) a payment that would fully amortize the loan over an original 30-year amortization schedule; and, 4) a payment that would fully amortize the loan over a 15-year year amortization schedule. To the extent the borrower has chosen an option that is not fully amortizing the loan (or negatively amortizing the loan), after a period — usually five years or once the negatively amortized loan balance reaches a certain level (generally 15% to 25% higher than the original balance) — the loan payments are recast. This recast provision resets the payment at a level that fully amortizes the loan over its remaining life and the new payment may be materially different than under the borrowers’ previous option.
PRIME RESIDENTIAL REAL ESTATE LOANS
Prime loans are residential loans with high quality credit characteristics, such as borrowers with higher FICO credit scores, lower loan-to-value ratios, lower debt-to-income ratios, greater levels of other assets, and more documentation.
PRIME SECURITIES
Prime securities are residential mortgage-backed securities backed by high credit-quality loans, generally with balances greater than conforming loan limits. Prime securities are typically backed by loans that have relatively high weighted average FICO scores (700 or higher), low weighted average LTVs (75% or less), limited concentrations of investor properties, and a low percentages of loans with low FICO scores or high loan-to-value ratios.
| THE REDWOOD REVIEW 4TH QUARTER 2009 | 45 |
PROFITABILITY RATIOS
Many financial institution analysts use asset-based profitability ratios such as interest rate spread and interest rate margin when analyzing financial institutions. These are asset-based measures. Since we consolidate the assets and liabilities of securitization entities for GAAP purposes, our total GAAP assets and liabilities may vary over time, and may not be comparable to assets typically used in profitability calculations for other financial institutions. As a result, we believe equity-based profitability ratios may be more appropriate than asset-based measures for analyzing Redwood’s operations and results. We believe, for example, that net interest income as a percentage of equity is a useful measure of profitability. For operating expenses, we believe useful measures are operating efficiency ratio (operating expenses as a percentage of net interest income) and operating expenses as a percentage of equity. We provide various profitability ratios in Table 5 in the Financial Tables in this Review.
REAL ESTATE INVESTMENT TRUST (REIT)
A real estate investment trust (REIT) is an entity that makes a tax election to be taxed as a REIT, invests in real estate assets, and meets other REIT qualifications, including the distribution as dividends of at least 90% of REIT taxable income. A REIT’s profits are not taxed at the corporate level to the extent that these profits are distributed as dividends to stockholders, providing an operating cost savings. On the other hand, the requirement to pay out as dividends most of the REIT’s profits means it can be harder for a REIT to grow using only internally-generated funds (as opposed to raising new capital).
REAL ESTATE OWNED (REO)
Real estate owned (REO) refers to real property owned by the lender or loan owner that has been acquired through foreclosure.
REIT SUBSIDIARY
A REIT subsidiary is a subsidiary of a REIT that is taxed as a REIT.
REIT TAXABLE INCOME
REIT taxable income is not a measure calculated in accordance with GAAP. REIT taxable income is pre-tax income calculated for tax purposes at Redwood including only its qualifying REIT subsidiaries (i.e., excluding its taxable subsidiaries). REIT taxable income is an important measure as it is the basis of our dividend distribution requirements. We must distribute at least 90% of REIT taxable income as dividends to shareholders over time. As a REIT, we are not subject to corporate income taxes on the REIT taxable income we distribute. We pay income tax on the REIT taxable income we retain (and we are permitted to retain up to 10% of total REIT taxable income). A reconciliation of REIT taxable income to GAAP income appears in Table 2 in the Financial Tables in this Review.
| 46 | THE REDWOOD REVIEW 4TH QUARTER 2009 |
REMIC
A real estate mortgage investment conduit (REMIC) is a special purpose vehicle used to pool real estate mortgages and issue mortgage-backed securities. REMICs are typically exempt from tax at the entity level. REMICs may invest only in qualified mortgages and permitted investments, including single family or multifamily mortgages, commercial mortgages, second mortgages, mortgage participations, and federal agency pass-through securities.
RE-REMIC SECURITY
A re-REMIC is a resecuritization of asset-backed securities. The cash flows from and any credit losses absorbed by the underlying assets can be redirected to the resulting re-REMIC securities in a variety of ways.
RESIDENTIAL MORTGAGE-BACKED SECURITIES (RMBS)
A type of mortgage-backed security that is backed by a pool of mortgages on residential properties.
RETURN ON EQUITY (ROE) AND ADJUSTED RETURN ON EQUITY
ROE is the amount of profit we generate each year per dollar of equity capital and equals GAAP income divided by GAAP equity. Adjusted ROE is not a measure calculated in accordance with GAAP – it is GAAP income divided by core equity.
SENIOR SECURITIES
Senior securities have the least credit risk in a securitization transaction because they are generally the last securities to absorb credit losses. In addition, the senior securities have the highest claim on the principal and interest payments (after the fees to servicers and trustees are paid.) To further reduce credit risk, most if not all, principal collected from the underlying asset pool is used to paydown the senior securities until certain performance tests are satisfied. If certain performance tests are satisfied, principal payments are shared between the senior securities and the subordinate securities, generally on a pro rata basis. At issuance, senior securities are generally AAA-rated.
SEQUOIA
Sequoia is the brand name for securitizations of residential real estate loans Redwood sponsors.
| THE REDWOOD REVIEW 4TH QUARTER 2009 | 47 |
SHORT-TERM DEBT
Short-term debt is debt that is an obligation of Redwood and payable within a year. We may obtain this debt from a variety of Wall Street firms, banks, and other institutions. In the past, as another form of short-term debt, we have issued collateralized commercial paper. We may issue these or other forms of short-term debt in the future. We may use short-term debt to finance the accumulation of assets prior to sale to a securitization entity and to finance investments in high-quality loans and securities.
SUBORDINATE SECURITIES (JUNIOR SECURITIES)
Subordinate securities absorb the initial credit losses from a securitization structure, thus protecting the senior securities. Subordinate securities have a lower priority to receive principal and interest payments than the senior securities. Subordinate securities receive little, if any, principal payments until certain performance tests are satisfied. If certain performance tests are satisfied, principal payments are shared between the senior securities and the subordinate securities, generally on a pro rata basis. Subordinate securities generally receive interest payments even if they do not receive principal payments. At issuance, subordinate securities are generally rated AA or below.
SUBPRIME SECURITIES
Subprime securities are residential mortgage-backed securities backed by loans to borrowers who typically have lower credit scores and/or other credit deficiencies that prevent them from qualifying for prime or Alt-A mortgages and may have experienced credit problems in the past, such as late payments or bankruptcies. To compensate for the greater risks and higher costs to service the loans, subprime borrowers pay higher interest rates, points, and origination fees.
Typical characteristics of subprime loan pools include more than 60% of loans with FICO scores below 680, weighted average LTVs over 85%, more than 70% of loans with LTVs over 75%, and loans with LTVs over 80% with no mortgage insurance.
TAXABLE INCOME and DIVIDENDS
Taxable income is not a measure calculated in accordance with GAAP. Taxable income is pre-tax income for Redwood and all its subsidiaries as calculated for tax purposes. Taxable income calculations differ significantly from GAAP income calculations. A reconciliation of taxable income to GAAP income appears in Table 2 in the Financial Tables in this Review.
TAXABLE SUBSIDIARY
A taxable subsidiary is a subsidiary of a REIT that is not taxed as a REIT and thus pays taxes on its income. A taxable subsidiary is not limited to investing in real estate and it can choose to retain all of its after-tax profits.
| 48 | THE REDWOOD REVIEW 4TH QUARTER 2009 |
| Table 1: GAAP Earnings ($ in thousands, except per share data) | 50 |
| | | | | | | | | | | | | | | | | | | | | | | | | | | | | | Twelve | | | Twelve | |
| | | 2009 | | | 2009 | | | 2009 | | | 2009 | | | 2008 | | | 2008 | | | 2008 | | | 2008 | | | 2007 | | | Months | | | Months | |
| | | Q4 | | | Q3 | | | Q2 | | | Q1 | | | Q4 | | | Q3 | | | Q2 | | | Q1 | | | Q4 | | | 2009 | | | 2008 | |
| | | | | | | | | | | | | | | | | | | | | | | | | | | | | | | | | | | | | | | | | | | |
Interest income | | $ | 57,717 | | | $ | 64,424 | | | $ | 74,332 | | | $ | 83,903 | | | $ | 124,452 | | | $ | 126,227 | | | $ | 140,444 | | | $ | 171,978 | | | $ | 193,728 | | | $ | 280,376 | | | $ | 563,101 | |
Discount amortization on securities, net | | | 7,432 | | | | 9,575 | | | | 3,864 | | | | 4,917 | | | | (1,189 | ) | | | 7,850 | | | | 6,258 | | | | 10,864 | | | | 18,869 | | | | 25,788 | | | | 23,783 | |
Other investment interest income | | | 12 | | | | 25 | | | | 54 | | | | 76 | | | | 572 | | | | 487 | | | | 514 | | | | 732 | | | | 984 | | | | 167 | | | | 2,305 | |
Premium amortization expense on loans | | | (3,365 | ) | | | (3,642 | ) | | | (3,988 | ) | | | (7,459 | ) | | | (548 | ) | | | (3,372 | ) | | | (10,215 | ) | | | (7,509 | ) | | | (6,656 | ) | | | (18,454 | ) | | | (21,644 | ) |
Total interest income | | | 61,796 | | | | 70,382 | | | | 74,262 | | | | 81,437 | | | | 123,287 | | | | 131,192 | | | | 137,001 | | | | 176,065 | | | | 206,925 | | | | 287,877 | | | | 567,545 | |
| | | | | | | | | | | | | | | | | | | | | | | | | | | | | | | | | | | | | | | | | | | | | |
Interest expense on short-term debt | | | - | | | | - | | | | - | | | | - | | | | (2 | ) | | | (65 | ) | | | (68 | ) | | | (183 | ) | | | (377 | ) | | | - | | | | (318 | ) |
| | | | | | | | | | | | | | | | | | | | | | | | | | | | | | | | | | | | | | | | | | | | | |
Interest expense on ABS | | | (17,930 | ) | | | (22,071 | ) | | | (36,066 | ) | | | (44,517 | ) | | | (94,431 | ) | | | (88,294 | ) | | | (93,993 | ) | | | (123,431 | ) | | | (147,799 | ) | | | (120,584 | ) | | | (400,149 | ) |
ABS issuance expense amortization | | | (575 | ) | | | (570 | ) | | | (586 | ) | | | (553 | ) | | | (1,470 | ) | | | (930 | ) | | | (1,921 | ) | | | (2,093 | ) | | | (4,644 | ) | | | (2,284 | ) | | | (6,414 | ) |
ABS interest rate agreement (expense) income | | | (1,123 | ) | | | (1,123 | ) | | | (1,111 | ) | | | (1,098 | ) | | | (1,934 | ) | | | (1,259 | ) | | | (1,246 | ) | | | (1,245 | ) | | | 1,265 | | | | (4,455 | ) | | | (5,684 | ) |
ABS issuance premium amortization income | | | 223 | | | | 234 | | | | 313 | | | | 335 | | | | 476 | | | | 557 | | | | 1,955 | | | | 2,183 | | | | 1,930 | | | | 1,105 | | | | 5,171 | |
Total ABS expense consolidated from trusts | | | (19,405 | ) | | | (23,530 | ) | | | (37,450 | ) | | | (45,833 | ) | | | (97,359 | ) | | | (89,926 | ) | | | (95,205 | ) | | | (124,586 | ) | | | (149,248 | ) | | | (126,218 | ) | | | (407,076 | ) |
| | | | | | | | | | | | | | | | | | | | | | | | | | | | | | | | | | | | | | | | | | | | | |
Interest expense on long-term debt | | | (1,167 | ) | | | (1,307 | ) | | | (1,502 | ) | | | (1,809 | ) | | | (2,345 | ) | | | (2,164 | ) | | | (2,233 | ) | | | (2,533 | ) | | | (3,055 | ) | | | (5,785 | ) | | | (9,275 | ) |
| | | | | | | | | | | | | | | | | | | | | | | | | | | | | | | | | | | | | | | | | | | | | |
Net interest income | | | 41,224 | | | | 45,545 | | | | 35,310 | | | | 33,795 | | | | 23,581 | | | | 39,037 | | | | 39,495 | | | | 48,763 | | | | 54,245 | | | | 155,874 | | | | 150,876 | |
Provision for credit reserve | | | (8,997 | ) | | | (9,998 | ) | | | (14,545 | ) | | | (16,033 | ) | | | (18,659 | ) | | | (18,333 | ) | | | (10,061 | ) | | | (8,058 | ) | | | (4,972 | ) | | | (49,573 | ) | | | (55,111 | ) |
Market valuation adjustments, net | | | (4,191 | ) | | | (11,058 | ) | | | (29,135 | ) | | | (43,244 | ) | | | (111,331 | ) | | | (127,146 | ) | | | (60,496 | ) | | | (193,929 | ) | | | (1,118,989 | ) | | | (87,628 | ) | | | (492,902 | ) |
Net interest income (loss) after provision and market valuation adjustments | | $ | 28,036 | | | $ | 24,489 | | | $ | (8,370 | ) | | $ | (25,482 | ) | | $ | (106,409 | ) | | $ | (106,442 | ) | | $ | (31,062 | ) | | $ | (153,224 | ) | | $ | (1,069,716 | ) | | $ | 18,673 | | | $ | (397,137 | ) |
| | | | | | | | | | | | | | | | | | | | | | | | | | | | | | | | | | | | | | | | | | | | | |
Fixed compensation expense | | | (3,261 | ) | | | (3,726 | ) | | | (3,572 | ) | | | (4,028 | ) | | | (3,575 | ) | | | (4,331 | ) | | | (4,648 | ) | | | (5,674 | ) | | | (4,316 | ) | | | (14,587 | ) | | | (18,228 | ) |
Variable compensation expense | | | (566 | ) | | | (5,216 | ) | | | (1,132 | ) | | | (556 | ) | | | 418 | | | | (616 | ) | | | (330 | ) | | | (1,857 | ) | | | (434 | ) | | | (7,470 | ) | | | (2,385 | ) |
Equity compensation expense | | | (1,553 | ) | | | (420 | ) | | | (2,337 | ) | | | (1,795 | ) | | | (2,378 | ) | | | (3,080 | ) | | | (3,502 | ) | | | (3,306 | ) | | | (2,767 | ) | | | (6,105 | ) | | | (12,266 | ) |
Severance expense | | | - | | | | (398 | ) | | | - | | | | (28 | ) | | | (1,814 | ) | | | - | | | | - | | | | - | | | | (1,340 | ) | | | (426 | ) | | | (1,814 | ) |
Other operating expense | | | (5,453 | ) | | | (5,046 | ) | | | (3,778 | ) | | | (4,130 | ) | | | (6,104 | ) | | | (8,824 | ) | | | (5,775 | ) | | | (5,510 | ) | | | (7,412 | ) | | | (18,407 | ) | | | (26,213 | ) |
Total operating expenses | | | (10,833 | ) | | | (14,806 | ) | | | (10,819 | ) | | | (10,537 | ) | | | (13,453 | ) | | | (16,851 | ) | | | (14,255 | ) | | | (16,347 | ) | | | (16,269 | ) | | | (46,995 | ) | | | (60,906 | ) |
| | | | | | | | | | | | | | | | | | | | | | | | | | | | | | | | | | | | | | | | | | | | | |
Realized gains (losses) on sales, net | | | 19,618 | | | | 17,561 | | | | 25,525 | | | | 462 | | | | 5,823 | | | | (15 | ) | | | 2,757 | | | | (3 | ) | | | 7,199 | | | | 63,166 | | | | 8,562 | |
Realized (losses) gains on calls, net | | | - | | | | - | | | | - | | | | - | | | | - | | | | (50 | ) | | | (43 | ) | | | 42 | | | | (126 | ) | | | - | | | | (51 | ) |
Realized gains (losses), net | | | 19,618 | | | | 17,561 | | | | 25,525 | | | | 462 | | | | 5,823 | | | | (65 | ) | | | 2,714 | | | | 39 | | | | 7,073 | | | | 63,166 | | | | 8,511 | |
| | | | | | | | | | | | | | | | | | | | | | | | | | | | | | | | | | | | | | | | | | | | | |
Noncontrolling interest | | | (143 | ) | | | (363 | ) | | | (127 | ) | | | 716 | | | | 2,366 | | | | 2,194 | | | | (2,369 | ) | | | (255 | ) | | | - | | | | 83 | | | | 1,936 | |
Credit (provision) for income taxes | | | 3,612 | | | | 247 | | | | 514 | | | | (105 | ) | | | (3,913 | ) | | | 9,860 | | | | (937 | ) | | | (1,800 | ) | | | 1,467 | | | | 4,268 | | | | 3,210 | |
Net income (loss) | | $ | 40,290 | | | $ | 27,128 | | | $ | 6,723 | | | $ | (34,946 | ) | | $ | (115,586 | ) | | $ | (111,304 | ) | | $ | (45,909 | ) | | $ | (171,587 | ) | | $ | (1,077,445 | ) | | $ | 39,195 | | | $ | (444,386 | ) |
| | | | | | | | | | | | | | | | | | | | | | | | | | | | | | | | | | | | | | | | | | | | | |
Diluted average shares | | | 78,101 | | | | 78,223 | | | | 66,446 | | | | 53,632 | | | | 33,366 | | | | 33,334 | | | | 32,871 | | | | 32,511 | | | | 29,531 | | | | 68,991 | | | | 33,023 | |
Net income (loss) per share | | $ | 0.51 | | | $ | 0.34 | | | $ | 0.10 | | | $ | (0.65 | ) | | $ | (3.46 | ) | | $ | (3.34 | ) | | $ | (1.40 | ) | | $ | (5.28 | ) | | $ | (36.49 | ) | | $ | 0.55 | | | $ | (13.46 | ) |
| | | |
| THE REDWOOD REVIEW 4TH QUARTER 2009 | Table 1: GAAP Earnings | |
| | | |
| Table 2: Taxable (Loss) Income and GAAP Income (Loss) Differences ($ in thousands, except per share data) | |
| | | | Estimated 2009 Q4(3) | | | Estimated Twelve Months 2009 | | | Actual Twelve Months 2008 | |
| | | Taxable | | | GAAP | | | | | | Taxable | | | GAAP | | | | | | Taxable | | | GAAP | | | | |
| | | Loss | | | Income | | | Differences | | | Loss | | | Income | | | Differences | | | Income | | | Loss | | | Differences | |
| | | | | | | | | | | | | | | | | | | | | | | | | | | | | |
| Interest income | | $ | 39,011 | | | $ | 61,795 | | | $ | (22,784 | ) | | $ | 193,106 | | | $ | 287,877 | | | $ | (94,771 | ) | | $ | 201,857 | | | $ | 567,545 | | | $ | (365,688 | ) |
| Interest expense | | | (1,143 | ) | | | (20,573 | ) | | | 19,430 | | | | (5,009 | ) | | | (132,003 | ) | | | 126,994 | | | | (7,784 | ) | | | (416,669 | ) | | | 408,885 | |
| Net interest income | | | 37,868 | | | | 41,222 | | | | (3,354 | ) | | | 188,097 | | | | 155,874 | | | | 32,223 | | | | 194,073 | | | | 150,876 | | | | 43,197 | |
| Provision for loan losses | | | - | | | | (8,997 | ) | | | 8,997 | | | | - | | | | (49,573 | ) | | | 49,573 | | | | - | | | | (55,111 | ) | | | 55,111 | |
| Realized credit losses | | | (54,486 | ) | | | - | | | | (54,486 | ) | | | (223,910 | ) | | | - | | | | (223,910 | ) | | | (116,546 | ) | | | - | | | | (116,546 | ) |
| Market valuation adjustments, net | | | - | | | | (4,190 | ) | | | 4,190 | | | | - | | | | (87,628 | ) | | | 87,628 | | | | - | | | | (492,902 | ) | | | 492,902 | |
| Operating expenses | | | (17,837 | ) | | | (10,835 | ) | | | (7,002 | ) | | | (54,237 | ) | | | (46,995 | ) | | | (7,242 | ) | | | (58,335 | ) | | | (60,906 | ) | | | 2,571 | |
Realized gains on sales and calls, net (1) | | | - | | | | 19,618 | | | | (19,618 | ) | | | 6,625 | | | | 63,166 | | | | (56,541 | ) | | | - | | | | 8,511 | | | | (8,511 | ) |
| (Provision for) benefit from income taxes | | | (9 | ) | | | 3,613 | | | | (3,622 | ) | | | (10 | ) | | | 4,268 | | | | (4,278 | ) | | | (113 | ) | | | 3,210 | | | | (3,323 | ) |
| Less: Net income attributable to noncontrolling interest | | | - | | | | 144 | | | | (144 | ) | | | - | | | | (83 | ) | | | 83 | | | | - | | | | (1,936 | ) | | | 1,936 | |
| | | | | | | | | | | | | | | | | | | | | | | | | | | | | | | | | | | | | |
| Taxable (loss) income | | $ | (34,464 | ) | | $ | 40,287 | | | $ | (74,751 | ) | | $ | (83,435 | ) | | $ | 39,195 | | | $ | (122,630 | ) | | $ | 19,079 | | | $ | (444,386 | ) | | $ | 463,465 | |
| | | | | | | | | | | | | | | | | | | | | | | | | | | | | | | | | | | | | |
| REIT taxable (loss) income | | $ | (25,688 | ) | | | | | | | | | | $ | (69,701 | ) | | | | | | | | | | $ | 18,541 | | | | | | | | | |
| Taxable (loss) income in taxable subsidiaries | | | (8,776 | ) | | | | | | | | | | | (13,734 | ) | | | | | | | | | | | 538 | | | | | | | | | |
| Taxable (loss) income | | $ | (34,464 | ) | | | | | | | | | | $ | (83,435 | ) | | | | | | | | | | $ | 19,079 | | | | | | | | | |
| | | | | | | | | | | | | | | | | | | | | | | | | | | | | | | | | | | | | |
| | | | | | | | | | | | | | | | | | | | | | | | | | | | | | | | | | | | | |
| Shares used for taxable EPS calculation | | | 77,737 | | | | | | | | | | | | 71,800 | | | | | | | | | | | | 32,283 | | | | | | | | | |
REIT taxable (loss) income per share (2) | | $ | (0.33 | ) | | | | | | | | | | $ | (0.93 | ) | | | | | | | | | | $ | 0.57 | | | | | | | | | |
| Taxable (loss) income in taxable subsidiaries per share | | $ | (0.11 | ) | | | | | | | | | | $ | (0.19 | ) | | | | | | | | | | $ | 0.01 | | | | | | | | | |
Taxable (loss) income per share (2) | | $ | (0.44 | ) | | | | | | | | | | $ | (1.12 | ) | | | | | | | | | | $ | 0.58 | | | | | | | | | |
(1) In July 2009, we repurchased $10 million principal amount of our long-term debt for $3.4 million. This resulted in an ordinary gain for tax and GAAP of $6.6 million.
(2) REIT taxable (loss) income per share and taxable (loss) income per share are based on the number of shares outstanding at the end of each quarter. The annual REIT taxable income (loss) per share and taxable income (loss) per share are the sum of the four quarterly per share estimates.
(3) Reconciliation of GAAP income to taxable income for prior quarters is provided in the respective Redwood Reviews for those quarters.
| | | |
| THE REDWOOD REVIEW 4TH QUARTER 2009 | Table 2: GAAP and Taxable (Loss) Income Differences | 51 |
| | | |
| Table 3: Retention and Distribution of Taxable Income ($ in thousands, except per share data) | 52 |
| | | | | | | | | Estimated | | | Actual | | | Actual | | | Estimated | | | Actual | |
| | | | | | | | | | | | | | | | | | | | | | | | | | | | | | Twelve | | | Twelve | |
| | | 2009 | | | 2009 | | | 2009 | | | 2009 | | | 2008 | | | 2008 | | | 2008 | | | 2008 | | | 2007 | | | Months | | | Months | |
| | | Q4 | | | Q3 | | | Q2 | | | Q1 | | | Q4 | | | Q3 | | | Q2 | | | Q1 | | | Q4 | | | 2009 | | | 2008 | |
| | | | | | | | | | | | | | | | | | | | | | | | | | | | | | | | | | | | | | | | | | | |
| Dividends declared | | $ | 19,434 | | | $ | 19,417 | | | $ | 19,376 | | | $ | 15,057 | | | $ | 25,103 | | | $ | 24,928 | | | $ | 24,887 | | | $ | 24,532 | | | $ | 80,496 | | | $ | 73,284 | | | $ | 99,450 | |
| Dividend deductions on stock issued through | | | | | | | | | | | | | | | | | | | | | | | | | | | | | | | | | | | | | | | | | | | | |
| direct stock purchase plan | | | 6 | | | | 2 | | | | 2 | | | | 30 | | | | 45 | | | | 165 | | | | 288 | | | | 192 | | | | 2,605 | | | | 40 | | | | 690 | |
| Total dividend deductions | | $ | 19,440 | | | $ | 19,419 | | | $ | 19,378 | | | $ | 15,087 | | | $ | 25,148 | | | $ | 25,093 | | | $ | 25,175 | | | $ | 24,724 | | | $ | 83,101 | | | $ | 73,324 | | | $ | 100,140 | |
| | | | | | | | | | | | | | | | | | | | | | | | | | | | | | | | | | | | | | | | | | |
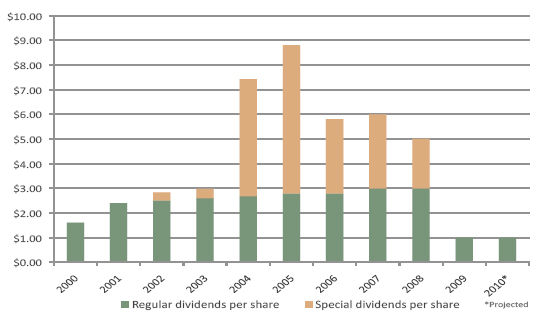
| Regular dividend per share | | $ | 0.25 | | | $ | 0.25 | | | $ | 0.25 | | | $ | 0.25 | | | $ | 0.75 | | | $ | 0.75 | | | $ | 0.75 | | | $ | 0.75 | | | $ | 0.75 | | | $ | 1.00 | | | $ | 3.00 | |
| Special dividend per share | | | - | | | | - | | | | - | | | | - | | | | - | | | | - | | | | - | | | | - | | | | 2.00 | | | | - | | | | - | |
Total dividends per share (1) | | $ | 0.25 | | | $ | 0.25 | | | $ | 0.25 | | | $ | 0.25 | | | $ | 0.75 | | | $ | 0.75 | | | $ | 0.75 | | | $ | 0.75 | | | $ | 2.75 | | | $ | 1.00 | | | $ | 3.00 | |
| Undistributed REIT taxable income at beginning of period (pre-tax): | | $ | - | | | $ | - | | | $ | - | | | $ | - | | | $ | 21,128 | | | $ | 43,821 | | | $ | 64,582 | | | $ | 64,572 | | | $ | 115,548 | | | $ | - | | | $ | 64,572 | |
| REIT taxable (loss) income (pre-tax) | | | (25,688 | ) | | | (24,933 | ) | | | (10,379 | ) | | | (8,701 | ) | | | (13,007 | ) | | | 2,400 | | | | 4,414 | | | | 24,734 | | | | 32,125 | | | | (69,701 | ) | | | 18,541 | |
| Dividend of 2007 income | | | - | | | | - | | | | - | | | | - | | | | | | | | (14,673 | ) | | | (25,175 | ) | | | (24,724 | ) | | | (83,101 | ) | | | - | | | | (64,572 | ) |
| Dividend of 2008 income | | | - | | | | - | | | | - | | | | - | | | | (8,121 | ) | | | (10,420 | ) | | | - | | | | - | | | | - | | | | - | | | | (18,541 | ) |
| Dividend of 2009 income | | | - | | | | - | | | | - | | | | - | | | | - | | | | - | | | | - | | | | - | | | | - | | | | - | | | | - | |
| Undistributed REIT taxable income (pre-tax) at period end: | | $ | - | | | $ | - | | | $ | - | | | $ | - | | | $ | - | | | $ | 21,128 | | | $ | 43,821 | | | $ | 64,582 | | | $ | 64,572 | | | $ | - | | | $ | - | |
| Undistributed REIT taxable income (pre-tax) at period end | | | | | | | | | | | - | | | | | | | | | | | | | | | | | | | | | | | | | | | | - | | | | - | |
| From 2007 | | $ | - | | | $ | - | | | $ | - | | | $ | - | | | $ | - | | | $ | - | | | $ | 14,673 | | | $ | 39,848 | | | $ | 64,572 | | | $ | - | | | $ | - | |
| From 2008 | | | - | | | | - | | | | - | | | | - | | | | - | | | | 20,872 | | | | 29,148 | | | | 24,734 | | | | - | | | | - | | | | - | |
| Total | | $ | - | | | $ | - | | | $ | | | | $ | - | | | $ | - | | | $ | 20,872 | | | $ | 43,821 | | | $ | 64,582 | | | $ | 64,572 | | | $ | - | | | $ | - | |
| | | | | | | | | | | | | | | | | | | | | | | | | | | | | | | | | | | | | | | | | | | | | |
| Shares outstanding at period end | | | 77,737 | | | | 77,669 | | | | 77,503 | | | | 60,228 | | | | 33,471 | | | | 33,238 | | | | 33,184 | | | | 32,710 | | | | 32,385 | | | | 77,737 | | | | 33,471 | |
| Undistributed REIT taxable income (pre-tax) | | | | | | | | | | | | | | | | | | | | | | | | | | | | | | | | | | | | | | | | | | | | |
| per share outstanding at period end | | $ | - | | | $ | - | | | $ | - | | | $ | - | | | $ | - | | | $ | 0.63 | | | $ | 1.32 | | | $ | 1.97 | | | $ | 1.99 | | | $ | - | | | $ | - | |
| | | | | | | | | | | | | | | | | | | | | | | | | | | | | | | | | | | | | | | | | | | | | |
| | | | | | | | | | | | | | | | | | | | | | | | | | | | | | | | | | | | | | | | | | | | | |
| (1) Dividends in 2008 exceeded the year's taxable income plus undistributed income carried over from prior years. Thus, the 2008 dividends included a $9.9 million return of capital. The 2009 dividends are characterized as a return of capital. The portion of Redwood's dividends characterized as a return of capital is not taxable to a shareholder and reduces a shareholder's basis for shares held at each quarterly distribution date. | |
| | |
| | | |
| THE REDWOOD REVIEW 4TH QUARTER 2009 | Table 3: Retention and Distribution of Taxable Income | |
| | | |
| Table 4 : Book Value and Other Ratios ($ in millions, except per share data) | |
| | | | | | | | | | | | | | | | | | | | | | | | | | | | | | | |
| | | 2009 | | | 2009 | | | 2009 | | | 2009 | | | 2008 | | | 2008 | | | 2008 | | | 2008 | | | January 1, | | | 2007 | |
| | | Q4 | | | Q3 | | | Q2 | | | Q1 | | | Q4 | | | Q3 | | | Q2 | | | Q1 | | | 2008 (1) | | | Q4 | |
| Short-term debt | | $ | - | | | $ | - | | | $ | - | | | $ | - | | | $ | - | | | $ | 7 | | | $ | 9 | | | $ | 2 | | | $ | 8 | | | $ | 8 | |
| Long-term debt | | | 140 | | | | 140 | | | | 150 | | | | 150 | | | | 150 | | | | 150 | | | | 150 | | | | 150 | | | | 150 | | | | 150 | |
Redwood debt (2) | | $ | 140 | | | $ | 140 | | | $ | 150 | | | $ | 150 | | | $ | 150 | | | $ | 157 | | | $ | 159 | | | $ | 152 | | | $ | 158 | | | $ | 158 | |
| | | | | | | | | | | | | | | | | | | | | | | | | | | | | | | | | | | | | | | | | |
| GAAP stockholders' equity | | $ | 972 | | | $ | 907 | | | $ | 802 | | | $ | 506 | | | $ | 302 | | | $ | 412 | | | $ | 564 | | | $ | 585 | | | $ | 751 | | | $ | (718 | ) |
| | | | | | | | | | | | | | | | | | | | | | | | | | | | | | | | | | | | | | | | | |
| Redwood debt to equity | | | 0.1 | x | | | 0.2 | x | | | 0.2 | x | | | 0.3 | x | | | 0.5 | x | | | 0.4 | x | | | 0.3 | x | | | 0.3 | x | | | 0.2 | x | | | (0.2 | )x |
| Redwood debt to (equity + debt) | | | 13 | % | | | 13 | % | | | 16 | % | | | 23 | % | | | 33 | % | | | 28 | % | | | 22 | % | | | 21 | % | | | 17 | % | | | -28 | % |
| | | | | | | | | | | | | | | | | | | | | | | | | | | | | | | | | | | | | | | | | |
| Redwood debt | | $ | 140 | | | $ | 140 | | | $ | 150 | | | $ | 150 | | | $ | 150 | | | $ | 157 | | | $ | 159 | | | $ | 152 | | | $ | 158 | | | $ | 158 | |
| ABS obligations of consolidated securitization entities | | | 3,943 | | | | 4,016 | | | | 4,185 | | | | 4,709 | | | | 4,855 | | | | 6,603 | | | | 7,110 | | | | 7,591 | | | | 8,839 | | | | 10,329 | |
| GAAP debt | | $ | 4,083 | | | $ | 4,156 | | | $ | 4,335 | | | $ | 4,859 | | | $ | 5,005 | | | $ | 6,760 | | | $ | 7,269 | | | $ | 7,743 | | | $ | 8,997 | | | $ | 10,487 | |
| | | | | | | | | | | | | | | | | | | | | | | | | | | | | | | | | | | | | | | | | |
| GAAP debt to equity | | | 4.2 | x | | | 4.6 | x | | | 5.4 | x | | | 9.6 | x | | | 16.6 | x | | | 16.4 | x | | | 12.9 | x | | | 13.2 | x | | | 12.0 | x | | | (14.6 | )x |
| GAAP debt to (equity + GAAP debt) | | | 81 | % | | | 82 | % | | | 84 | % | | | 91 | % | | | 94 | % | | | 94 | % | | | 93 | % | | | 93 | % | | | 92 | % | | | 107 | % |
| | | | | | | | | | | | | | | | | | | | | | | | | | | | | | | | | | | | | | | | | |
| GAAP stockholders' equity | | $ | 972 | | | $ | 907 | | | $ | 802 | | | $ | 506 | | | $ | 302 | | | $ | 412 | | | $ | 564 | | | $ | 585 | | | $ | 751 | | | $ | (718 | ) |
| Balance sheet mark-to-market adjustments | | | 58 | | | | 21 | | | | (78 | ) | | | (85 | ) | | | (57 | ) | | | (84 | ) | | | (68 | ) | | | (93 | ) | | | (99 | ) | | | (574 | ) |
| Core equity (non-GAAP) | | $ | 914 | | | $ | 886 | | | $ | 880 | | | $ | 591 | | | $ | 359 | | | $ | 496 | | | $ | 632 | | | $ | 678 | | | $ | 850 | | | $ | (145 | ) |
| | | | | | | | | | | | | | | | | | | | | | | | | | | | | | | | | | | | | | | | | |
| Shares outstanding at period end | | | 77,737 | | | | 77,669 | | | | 77,503 | | | | 60,228 | | | | 33,471 | | | | 33,238 | | | | 33,184 | | | | 32,710 | | | | 32,385 | | | | 32,385 | |
| | | | | | | | | | | | | | | | | | | | | | | | | | | | | | | | | | | | | | | | | |
| GAAP equity per share | | $ | 12.50 | | | $ | 11.68 | | | $ | 10.35 | | | $ | 8.40 | | | $ | 9.02 | | | $ | 12.40 | | | $ | 17.00 | | | $ | 17.89 | | | $ | 23.18 | | | $ | (22.18 | ) |
Adjustments: GAAP equity to economic value (3) | | | | | | | | | | | | | | | | | | | | | | | | | | | | | | | | | | | | | | | | |
| Investments in Sequoia | | $ | (0.37 | ) | | $ | (0.37 | ) | | $ | (0.35 | ) | | $ | (0.15 | ) | | $ | (0.95 | ) | | $ | (1.65 | ) | | $ | (1.96 | ) | | $ | (1.65 | ) | | $ | (1.45 | ) | | $ | (1.45 | ) |
| Investments in Acacia | | | - | | | | - | | | | 0.01 | | | | (0.03 | ) | | | (0.21 | ) | | | (0.18 | ) | | | (0.66 | ) | | | (0.58 | ) | | | (1.17 | ) | | | 44.19 | |
| Long-term debt | | | 0.90 | | | | 0.97 | | | | 1.29 | | | | 1.79 | | | | 3.24 | | | | 2.61 | | | | 2.34 | | | | 2.38 | | | | 1.73 | | | | 1.73 | |
| Estimate of economic value per share (non-GAAP) | | $ | 13.03 | | | $ | 12.28 | | | $ | 11.30 | | | $ | 10.01 | | | $ | 11.10 | | | $ | 13.18 | | | $ | 16.72 | | | $ | 18.04 | | | $ | 22.29 | | | $ | 22.29 | |
| | |
| (1) On January 1, 2008 we elected the fair value option for the assets and liabilities of Acacia entities and certain other assets. | |
| (2) Excludes obligations of consolidated securitization entities. | |
| (3) Differences between GAAP and econcomic value per share are adjustments to reflect our estimate of the economic value of investmenst in Sequoia and Acacia, and our long-term debt. See pages 16 and 17. | |
| | |
| | | |
| THE REDWOOD REVIEW 4TH QUARTER 2009 | Table 4: Book Value and Other Ratios | 53 |
| | | |
| Table 5 : Profitability Ratios (1) ($ in thousands) | 54 |
| | | | | | | | | | | | | | | | | | | | | | | | | | | | | | Twelve | | | Twelve | |
| | | 2009 | | | 2009 | | | 2009 | | | 2009 | | | 2008 | | | 2008 | | | 2008 | | | 2008 | | | 2007 | | | Months | | | Months | |
| | | Q4 | | | Q3 | | | Q2 | | | Q1 | | | Q4 | | | Q3 | | | Q2 | | | Q1 | | | Q4 | | | 2009 | | | 2008 | |
| | | | | | | | | | | | | | | | | | | | | | | | | | | | | | | | | | | | | | | | | | | |
| Interest income | | $ | 61,796 | | | $ | 70,382 | | | $ | 74,262 | | | $ | 81,437 | | | $ | 123,287 | | | $ | 131,192 | | | $ | 137,001 | | | $ | 176,065 | | | $ | 206,925 | | | $ | 287,877 | | | $ | 567,545 | |
| Average consolidated earning assets | | $ | 5,175,337 | | | $ | 5,128,893 | | | $ | 5,325,322 | | | $ | 5,553,470 | | | $ | 7,006,592 | | | $ | 7,594,682 | | | $ | 8,137,261 | | | $ | 9,090,678 | | | $ | 11,521,330 | | | $ | 5,294,037 | | | $ | 7,962,454 | |
| Asset yield | | | 4.78 | % | | | 5.49 | % | | | 5.58 | % | | | 5.87 | % | | | 7.04 | % | | | 6.91 | % | | | 6.73 | % | | | 7.75 | % | | | 7.18 | % | | | 5.44 | % | | | 7.13 | % |
| | | | | | | | | | | | | | | | | | | | | | | | | | | | | | | | | | | | | | | | | | | | | |
| Interest expense | | $ | (20,572 | ) | | $ | (24,837 | ) | | $ | (38,952 | ) | | $ | (47,642 | ) | | $ | (99,706 | ) | | $ | (92,155 | ) | | $ | (97,506 | ) | | $ | (127,302 | ) | | $ | (152,680 | ) | | $ | (132,003 | ) | | $ | (416,669 | ) |
| Average consolidated interest-bearing liabilities | | $ | 4,096,928 | | | $ | 4,193,650 | | | $ | 4,651,125 | | | $ | 4,940,304 | | | $ | 6,613,677 | | | $ | 7,106,052 | | | $ | 7,499,474 | | | $ | 8,383,296 | | | $ | 10,716,433 | | | $ | 4,468,725 | | | $ | 7,397,670 | |
| Cost of funds | | | 2.01 | % | | | 2.37 | % | | | 3.35 | % | | | 3.86 | % | | | 6.03 | % | | | 5.19 | % | | | 5.20 | % | | | 6.07 | % | | | 5.70 | % | | | 2.95 | % | | | 5.63 | % |
| | | | | | | | | | | | | | | | | | | | | | | | | | | | | | | | | | | | | | | | | | | | | |
| Asset yield | | | 4.78 | % | | | 5.49 | % | | | 5.58 | % | | | 5.87 | % | | | 7.04 | % | | | 6.91 | % | | | 6.73 | % | | | 7.75 | % | | | 7.18 | % | | | 5.44 | % | | | 7.13 | % |
| Cost of funds | | | (2.01 | %) | | | (2.37 | %) | | | (3.35 | %) | | | (3.86 | %) | | | (6.03 | %) | | | (5.19 | %) | | | (5.20 | %) | | | (6.07 | %) | | | (5.70 | %) | | | (2.95 | %) | | | (5.63 | %) |
| Interest rate spread | | | 2.77 | % | | | 3.12 | % | | | 2.23 | % | | | 2.01 | % | | | 1.01 | % | | | 1.72 | % | | | 1.53 | % | | | 1.67 | % | | | 1.49 | % | | | 2.48 | % | | | 1.50 | % |
| | | | | | | | | | | | | | | | | | | | | | | | | | | | | | | | | | | | | | | | | | | | | |
| Net interest income | | $ | 41,224 | | | $ | 45,545 | | | $ | 35,310 | | | $ | 33,795 | | | $ | 23,581 | | | $ | 39,037 | | | $ | 39,495 | | | $ | 48,763 | | | $ | 54,245 | | | $ | 155,874 | | | $ | 150,876 | |
| Average consolidated earning assets | | $ | 5,175,337 | | | $ | 5,128,893 | | | $ | 5,325,322 | | | $ | 5,553,470 | | | $ | 7,006,592 | | | $ | 7,594,682 | | | $ | 8,137,261 | | | $ | 9,090,678 | | | $ | 11,521,330 | | | $ | 5,294,037 | | | $ | 7,962,454 | |
| Net interest margin | | | 3.19 | % | | | 3.55 | % | | | 2.65 | % | | | 2.43 | % | | | 1.35 | % | | | 2.06 | % | | | 1.94 | % | | | 2.15 | % | | | 1.88 | % | | | 2.94 | % | | | 1.89 | % |
| | | | | | | | | | | | | | | | | | | | | | | | | | | | | | | | | | | | | | | | | | | | | |
| Operating expenses | | $ | (10,833 | ) | | $ | (14,806 | ) | | $ | (10,819 | ) | | $ | (10,537 | ) | | $ | (13,453 | ) | | $ | (16,851 | ) | | $ | (14,255 | ) | | $ | (16,347 | ) | | $ | (16,269 | ) | | $ | (46,995 | ) | | $ | (60,906 | ) |
| | | | | | | | | | | | | | | | | | | | | | | | | | | | | | | | | | | | | | | | | | | | | |
| Average total assets | | $ | 5,293,887 | | | $ | 5,138,793 | | | $ | 5,315,643 | | | $ | 5,575,619 | | | $ | 7,040,306 | | | $ | 7,648,102 | | | $ | 8,203,461 | | | $ | 9,223,464 | | | $ | 10,866,153 | | | $ | 5,329,461 | | | $ | 8,026,050 | |
| Average total equity | | $ | 945,862 | | | $ | 833,227 | | | $ | 575,661 | | | $ | 556,861 | | | $ | 371,503 | | | $ | 533,755 | | | $ | 602,402 | | | $ | 720,035 | | | $ | 97,534 | | | $ | 729,032 | | | $ | 556,354 | |
| | | | | | | | | | | | | | | | | | | | | | | | | | | | | | | | | | | | | | | | | | | | | |
| Operating expenses / net interest income | | | 26.28 | % | | | 32.51 | % | | | 30.64 | % | | | 31.18 | % | | | 57.05 | % | | | 43.17 | % | | | 36.09 | % | | | 33.52 | % | | | 27.52 | % | | | 30.15 | % | | | 40.37 | % |
| Operating expenses / average total assets | | | 0.82 | % | | | 1.15 | % | | | 0.81 | % | | | 0.76 | % | | | 0.76 | % | | | 0.88 | % | | | 0.70 | % | | | 0.71 | % | | | 0.55 | % | | | 0.88 | % | | | 0.76 | % |
| Operating expenses / average total equity | | | 4.58 | % | | | 7.11 | % | | | 7.52 | % | | | 7.57 | % | | | 14.49 | % | | | 12.63 | % | | | 9.47 | % | | | 9.08 | % | | | 61.23 | % | | | 6.45 | % | | | 10.95 | % |
| | | | | | | | | | | | | | | | | | | | | | | | | | | | | | | | | | | | | | | | | | | | | |
| GAAP net income (loss) | | $ | 40,290 | | | $ | 27,128 | | | $ | 6,723 | | | $ | (34,946 | ) | | $ | (115,586 | ) | | $ | (111,304 | ) | | $ | (45,909 | ) | | $ | (171,587 | ) | | $ | (1,077,445 | ) | | $ | 39,195 | | | $ | (444,386 | ) |
| GAAP net income (loss) / average total assets | | | 3.04 | % | | | 2.11 | % | | | 0.51 | % | | | (2.51 | %) | | | (6.57 | %) | | | (5.82 | %) | | | (2.24 | %) | | | (7.44 | %) | | | (39.66 | %) | | | 0.74 | % | | | (5.54 | %) |
| GAAP net income (loss) / average equity (GAAP ROE) | | | 17.04 | % | | | 13.02 | % | | | 4.67 | % | | | (25.10 | %) | | | (124.45 | %) | | | (83.41 | %) | | | (30.48 | %) | | | (95.32 | %) | | | (4418.75 | %) | | | 5.38 | % | | | (79.87 | %) |
GAAP net income (loss) / average core equity (adjusted ROE) (2) | | | 17.99 | % | | | 12.22 | % | | | 4.10 | % | | | (22.64 | %) | | | (103.09 | %) | | | (79.62 | %) | | | (28.42 | %) | | | (83.31 | %) | | | (610.31 | %) | | | 5.12 | % | | | (69.53 | %) |
| | | | | | | | | | | | | | | | | | | | | | | | | | | | | | | | | | | | | | | | | | | | | |
| Average core equity | | $ | 896,034 | | | $ | 888,107 | | | $ | 655,695 | | | $ | 617,325 | | | $ | 448,484 | | | $ | 559,150 | | | $ | 646,211 | | | $ | 823,843 | | | $ | 706,167 | | | $ | 765,393 | | | $ | 639,123 | |
| | | | | | | | | | | | | | | | | | | | | | | | | | | | | | | | | | | | | | | | | | | | | |
| | |
| (1) All percentages in this table are shown on an annualized basis. | |
| (2) Non-GAAP metric. Core equity excludes accumulated other comprehensive income (loss). | |
| | |
| | | |
| THE REDWOOD REVIEW 4TH QUARTER 2009 | Table 5: Profitability Ratios1 | |
| | | |
| Table 6: Average Balance Sheet ($ in thousands) | |
| | | | | | | | | | | | | | | | | | | | | | | | | | | Twelve | | | Twelve | |
| | | 2009 | | | 2009 | | | 2009 | | | 2009 | | | 2008 | | | 2008 | | | 2008 | | | 2008 | | | Months | | | Months | |
| | | Q4 | | | Q3 | | | Q2 | | | Q1 | | | Q4 | | | Q3 | | | Q2 | | | Q1 | | | 2009 | | | 2008 | |
| | | | | | | | | | | | | | | | | | | | | | | | | | | | | | | | | | | | | | | |
| Real estate assets at Redwood | | | | | | | | | | | | | | | | | | | | | | | | | | | | | | | | | | | | | | |
| | | | | | | | | | | | | | | | | | | | | | | | | | | | | | | | | | | | | | | |
| Senior Residential Securities | | | | | | | | | | | | | | | | | | | | | | | | | | | | | | | | | | | | | | |
| Prime | | $ | 280,101 | | | $ | 264,773 | | | $ | 164,386 | | | $ | 77,651 | | | $ | 37,746 | | | $ | 27,880 | | | $ | 15,040 | | | $ | 663 | | | $ | 197,469 | | | $ | 14,528 | |
| Non-prime | | | 263,022 | | | | 270,353 | | | | 168,383 | | | | 87,464 | | | | 63,050 | | | | 63,818 | | | | 50,056 | | | | 7,061 | | | | 197,987 | | | | 40,312 | |
| Total Senior Residential Securities | | | 543,124 | | | | 535,126 | | | | 332,769 | | | | 165,114 | | | | 100,796 | | | | 91,698 | | | | 65,096 | | | | 7,724 | | | | 395,456 | | | | 54,839 | |
| | | | | | | | | | | | | | | | | | | | | | | | | | | | | | | | | | | | | | | | | |
| Residential Re-REMIC Securities | | | 73,938 | | | | 69,980 | | | | 26,419 | | | | - | | | | - | | | | - | | | | - | | | | - | | | | 42,862 | | | | - | |
| | | | | | | | | | | | | | | | | | | | | | | | | | | | | | | | | | | | | | | | | |
| Subordinate Residential Securities | | | | | | | | | | | | | | | | | | | | | | | | | | | | | | | | | | | | | | | | |
| Prime | | | 47,083 | | | | 58,637 | | | | 43,020 | | | | 47,070 | | | | 88,943 | | | | 147,513 | | | | 177,996 | | | | 145,756 | | | | 48,979 | | | | 157,088 | |
| Non-prime | | | 1,377 | | | | 2,218 | | | | 2,767 | | | | 3,450 | | | | 4,105 | | | | 4,450 | | | | 17,184 | | | | 54,464 | | | | 2,446 | | | | 25,366 | |
| Total Subordinate Residential Securities | | | 48,460 | | | | 60,855 | | | | 45,787 | | | | 50,519 | | | | 93,048 | | | | 151,963 | | | | 195,180 | | | | 200,220 | | | | 51,425 | | | | 182,454 | |
| | | | | | | | | | | | | | | | | | | | | | | | | | | | | | | | | | | | | | | | | |
| Commercial subordinate securites | | | 8,090 | | | | 13,504 | | | | 25,006 | | | | 46,382 | | | | 63,969 | | | | 98,534 | | | | 106,314 | | | | 183,446 | | | | 23,114 | | | | 129,431 | |
| Commercial loans | | | 245 | | | | 246 | �� | | | 247 | | | | 248 | | | | 249 | | | | 250 | | | | 251 | | | | 250 | | | | 247 | | | | 250 | |
| Residential loans | | | 2,314 | | | | 2,315 | | | | 2,435 | | | | 2,600 | | | | 2,960 | | | | 3,671 | | | | 3,759 | | | | 4,507 | | | | 2,415 | | | | 3,979 | |
| CDO | | | 1,962 | | | | 2,255 | | | | 2,595 | | | | 3,429 | | | | 3,856 | | | | 8,628 | | | | 15,492 | | | | 21,297 | | | | 2,555 | | | | 15,139 | |
| Other real estate investments | | | - | | | | - | | | | - | | | | - | | | | 50 | | | | 75 | | | | 2,328 | | | | 5,836 | | | | - | | | | 2,746 | |
| Total real estate assets at Redwood | | | 678,133 | | | | 684,281 | | | | 435,258 | | | | 268,293 | | | | 264,927 | | | | 354,819 | | | | 388,420 | | | | 423,280 | | | | 518,074 | | | | 388,840 | |
| | | | | | | | | | | | | | | | | | | | | | | | | | | | | | | | | | | | | | | | | |
| Earning assets at Acacia | | | 304,436 | | | | 298,615 | | | | 321,206 | | | | 404,596 | | | | 575,709 | | | | 830,311 | | | | 982,169 | | | | 1,439,913 | | | | 331,847 | | | | 1,084,131 | |
| Earning assets at Sequoia | | | 3,767,112 | | | | 3,864,796 | | | | 4,305,159 | | | | 4,568,212 | | | | 5,966,898 | | | | 6,170,944 | | | | 6,483,475 | | | | 6,895,529 | | | | 4,123,409 | | | | 6,516,649 | |
| Earning assets at the Fund | | | 53,990 | | | | 57,070 | | | | 58,054 | | | | 62,319 | | | | 71,792 | | | | 75,321 | | | | 56,183 | | | | 33,180 | | | | 57,833 | | | | 54,895 | |
| | | | | | | | | | | | | | | | | | | | | | | | | | | | | | | | | | | | | | | | | |
| Cash and cash equivalents | | | 321,838 | | | | 279,011 | | | | 285,680 | | | | 310,514 | | | | 204,246 | | | | 229,778 | | | | 311,052 | | | | 402,584 | | | | 299,236 | | | | 314,471 | |
| Earning assets | | | 5,125,509 | | | | 5,183,773 | | | | 5,405,357 | | | | 5,613,934 | | | | 7,083,573 | | | | 7,661,173 | | | | 8,221,299 | | | | 9,194,486 | | | | 5,330,399 | | | | 8,358,986 | |
| Balance sheet mark-to-market adjustments | | | 49,828 | | | | (54,880 | ) | | | (80,035 | ) | | | (60,464 | ) | | | (76,981 | ) | | | (66,491 | ) | | | (84,038 | ) | | | (103,808 | ) | | | (36,361 | ) | | | (84,779 | ) |
| Earning assets - reported value | | | 5,175,337 | | | | 5,128,893 | | | | 5,325,322 | | | | 5,553,470 | | | | 7,006,592 | | | | 7,594,682 | | | | 8,137,261 | | | | 9,090,678 | | | | 5,294,037 | | | | 8,274,207 | |
| Other assets | | | 118,550 | | | | 9,900 | | | | (9,680 | ) | | | 22,148 | | | | 33,714 | | | | 53,420 | | | | 66,200 | | | | 132,786 | | | | 35,424 | | | | 84,135 | |
| Total assets | | $ | 5,293,887 | | | $ | 5,138,793 | | | $ | 5,315,643 | | | $ | 5,575,619 | | | $ | 7,040,306 | | | $ | 7,648,102 | | | $ | 8,203,461 | | | $ | 9,223,464 | | | $ | 5,329,461 | | | $ | 8,358,342 | |
| | | | | | | | | | | | | | | | | | | | | | | | | | | | | | | | | | | | | | | | | |
| Short-term debt | | $ | - | | | $ | - | | | $ | - | | | $ | - | | | $ | 975 | | | $ | 7,825 | | | $ | 4,904 | | | $ | 21,477 | | | $ | - | | | $ | 11,402 | |
| Sequoia ABS issued | | | 3,666,201 | | | | 3,765,292 | | | | 4,211,937 | | | | 4,460,951 | | | | 5,804,702 | | | | 6,040,634 | | | | 6,349,661 | | | | 6,745,556 | | | | 4,023,203 | | | | 6,378,617 | |
| Acacia ABS issued | | | 288,041 | | | | 283,996 | | | | 285,698 | | | | 325,392 | | | | 652,398 | | | | 900,611 | | | | 986,915 | | | | 1,456,506 | | | | 295,647 | | | | 1,114,677 | |
| Other liabilities | | | 231,553 | | | | 91,027 | | | | 66,588 | | | | 55,487 | | | | 32,533 | | | | (22,524 | ) | | | 72,870 | | | | 126,790 | | | | 111,589 | | | | 59,045 | |
| Long-term debt | | | 137,907 | | | | 139,190 | | | | 147,430 | | | | 147,193 | | | | 146,944 | | | | 146,705 | | | | 146,480 | | | | 146,242 | | | | 142,894 | | | | 146,476 | |
| Total liabilities | | | 4,323,702 | | | | 4,279,505 | | | | 4,711,653 | | | | 4,989,023 | | | | 6,637,552 | | | | 7,073,251 | | | | 7,560,830 | | | | 8,496,572 | | | | 4,573,334 | | | | 7,710,218 | |
| | | | | | | | | | | | | | | | | | | | | | | | | | | | | | | | | | | | | | | | | |
| | | | | | | | | | | | | | | | | | | | | | | | | | | | | | | | | | | | | | | | | |
| Noncontrolling interest | | | 24,322 | | | | 26,061 | | | | 28,330 | | | | 29,735 | | | | 31,251 | | | | 41,096 | | | | 40,229 | | | | 6,858 | | | | 27,094 | | | | 29,394 | |
| | | | | | | | | | | | | | | | | | | | | | | | | | | | | | | | | | | | | | | | | |
| Core equity (non-GAAP) | | | 896,034 | | | | 888,107 | | | | 655,695 | | | | 617,325 | | | | 448,484 | | | | 600,246 | | | | 686,440 | | | | 823,843 | | | | 765,393 | | | | 703,510 | |
| Accumulated other comprehensive income (loss) | | | 49,829 | | | | (54,880 | ) | | | (80,035 | ) | | | (60,464 | ) | | | (76,981 | ) | | | (66,491 | ) | | | (84,038 | ) | | | (103,808 | ) | | | (36,360 | ) | | | (84,779 | ) |
| Total equity | | | 945,863 | | | | 833,227 | | | | 575,661 | | | | 556,861 | | | | 371,503 | | | | 533,755 | | | | 602,402 | | | | 720,035 | | | | 729,033 | | | | 618,731 | |
| | | | | | | | | | | | | | | | | | | | | | | | | | | | | | | | | | | | | | | | | |
| Total liabilities and equity | | $ | 5,293,887 | | | $ | 5,138,793 | | | $ | 5,315,643 | | | $ | 5,575,619 | | | $ | 7,040,306 | | | $ | 7,648,102 | | | $ | 8,203,461 | | | $ | 9,223,464 | | | $ | 5,329,461 | | | $ | 8,358,342 | |
| | | |
| THE REDWOOD REVIEW 4TH QUARTER 2009 | Table 6: Average Balance Sheet | 55 |
| | | |
| Table 7 - Balances & Yields by Securities Portfolio at Redwood ($ in thousands) | 56 |
| | | 2009 | | | 2009 | | | 2009 | | | 2009 | | | 2008 | | | | | 2009 | | | 2009 | | | 2009 | | | 2009 | | | 2008 | |
| | | Q4 | | | Q3 | | | Q2 | | | Q1 | | | Q4 | | | | | Q4 | | | Q3 | | | Q2 | | | Q1 | | | Q4 | |
Residential Prime Senior | | | | | | | | | | | | | | | | | | | | Residential Non-Prime Subordinate | | | | | | | | | | | | | | | | | |
| Current face | | $ | 412,471 | | | $ | 431,289 | | | $ | 276,444 | | | $ | 160,009 | | | $ | 90,256 | | | Current face | | $ | 86,802 | | | $ | 158,613 | | | $ | 230,404 | | | $ | 327,766 | | | $ | 452,327 | |
| Unamortized discount | | | (116,801 | ) | | | (124,295 | ) | | | (91,221 | ) | | | (64,884 | ) | | | (41,980 | ) | | Unamortized discount | | | (14,863 | ) | | | (16,556 | ) | | | (18,846 | ) | | | (19,512 | ) | | | (29,092 | ) |
| Credit reserve | | | (9,898 | ) | | | (11,069 | ) | | | (3,486 | ) | | | (621 | ) | | | - | | | Credit reserve | | | (70,806 | ) | | | (140,046 | ) | | | (208,839 | ) | | | (305,422 | ) | | | (419,194 | ) |
| Unrealized gains (losses) | | | 43,436 | | | | 40,734 | | | | 1,729 | | | | (6,738 | ) | | | 2,689 | | | Unrealized gains (losses) | | | 162 | | | | (806 | ) | | | 473 | | | | 1,705 | | | | 3,272 | |
| Fair value | | $ | 329,208 | | | $ | 336,659 | | | $ | 183,466 | | | $ | 87,766 | | | $ | 50,965 | | | Fair value | | $ | 1,295 | | | $ | 1,205 | | | $ | 3,192 | | | $ | 4,537 | | | $ | 7,313 | |
| | | | | | | | | | | | | | | | | | | | | | | | | | | | | | | | | | | | | | | | | | | |
| Average amortized cost | | $ | 280,101 | | | $ | 264,773 | | | $ | 164,386 | | | $ | 77,651 | | | $ | 37,746 | | | Average amortized cost | | $ | 1,377 | | | $ | 2,218 | | | $ | 2,767 | | | $ | 3,450 | | | $ | 4,105 | |
| Interest income | | $ | 8,610 | | | $ | 8,431 | | | $ | 5,475 | | | $ | 2,798 | | | $ | 992 | | | Interest income | | $ | 359 | | | $ | 1,271 | | | $ | 2,086 | | | $ | 6,315 | | | $ | 5,283 | |
| Annualized yield | | | 12.30 | % | | | 12.74 | % | | | 13.32 | % | | | 14.41 | % | | | 10.51 | % | | Annualized yield | | | 104.23 | % | | | 229.25 | % | | | 301.61 | % | | | 732.26 | % | | | 514.79 | % |
| | | | | | | | | | | | | | | | | | | | | | | | | | | | | | | | | | | | | | | | | | | |
Residential Non-Prime Senior | | | | | | | | | | | | | | | | | | | Commercial Subordinate | | | | | | | | | | | | | | | | | | | |
| Current face | | $ | 430,698 | | | $ | 403,675 | | | $ | 396,135 | | | $ | 182,851 | | | $ | 108,871 | | | Current face | | $ | 158,997 | | | $ | 486,245 | | | $ | 506,746 | | | $ | 512,117 | | | $ | 514,169 | |
| Unamortized discount | | | (134,649 | ) | | | (137,899 | ) | | | (141,761 | ) | | | (77,193 | ) | | | (50,687 | ) | | Unamortized (discount) premium | | | (5,130 | ) | | | (1,624 | ) | | | (120 | ) | | | 13,798 | | | | 35,069 | |
| Credit reserve | | | (13,468 | ) | | | (10,098 | ) | | | (16,009 | ) | | | (4,159 | ) | | | (3,827 | ) | | Credit reserve | | | (146,018 | ) | | | (471,957 | ) | | | (492,459 | ) | | | (497,784 | ) | | | (497,047 | ) |
| Unrealized gains (losses) | | | 32,371 | | | | 23,322 | | | | (7,410 | ) | | | (27,116 | ) | | | (11,537 | ) | | Unrealized gains (losses) | | | 1,351 | | | | 4,169 | | | | 1,502 | | | | (5,216 | ) | | | (9,701 | ) |
| Fair value | | $ | 314,952 | | | $ | 279,000 | | | $ | 230,955 | | | $ | 74,383 | | | $ | 42,820 | | | Fair value | | $ | 9,200 | | | $ | 16,833 | | | $ | 15,669 | | | $ | 22,915 | | | $ | 42,490 | |
| | | | | | | | | | | | | | | | | | | | | | | | | | | | | | | | | | | | | | | | | | | |
| Average amortized cost | | $ | 263,022 | | | $ | 270,353 | | | $ | 168,383 | | | $ | 87,464 | | | $ | 63,050 | | | Average amortized cost | | $ | 8,090 | | | $ | 13,504 | | | $ | 25,006 | | | $ | 46,382 | | | $ | 63,969 | |
| Interest income | | $ | 8,489 | | | $ | 10,513 | | | $ | 6,737 | | | $ | 3,311 | | | $ | 1,590 | | | Interest income | | $ | 1,233 | | | $ | 2,192 | | | $ | 1,599 | | | $ | 500 | | | $ | (1,000 | ) |
| Annualized yield | | | 12.91 | % | | | 15.55 | % | | | 16.00 | % | | | 15.14 | % | | | 10.09 | % | | Annualized yield | | | 60.97 | % | | | 64.93 | % | | | 25.58 | % | | | 4.31 | % | | | -6.25 | % |
| | | | | | | | | | | | | | | | | | | | | | | | | | | | | | | | | | | | | | | | | | | |
| Residential Re-REMIC | | | | | | | | | | | | | | | | | | | | | | CDO Subordinate | | | | | | | | | | | | | | | | | | | | |
| Current face | | $ | 255,975 | | | $ | 318,703 | | | $ | 236,070 | | | $ | - | | | | - | | | Current face | | $ | 35,371 | | | $ | 35,344 | | | $ | 35,311 | | | $ | 35,277 | | | $ | 38,405 | |
| Unamortized discount | | | (109,807 | ) | | | (144,351 | ) | | | (134,621 | ) | | | - | | | | - | | | Unamortized discount | | | (20,521 | ) | | | (19,632 | ) | | | (19,460 | ) | | | (19,086 | ) | | | (18,319 | ) |
| Credit reserve | | | (81,726 | ) | | | (94,626 | ) | | | (45,874 | ) | | | - | | | | - | | | Credit reserve | | | (13,628 | ) | | | (13,600 | ) | | | (13,568 | ) | | | (13,534 | ) | | | (16,476 | ) |
| Unrealized gains (losses) | | | 41,509 | | | | 13,781 | | | | (434 | ) | | | - | | | | - | | | Unrealized gains | | | 25 | | | | 25 | | | | 25 | | | | - | | | | - | |
| Fair value | | $ | 105,951 | | | $ | 93,507 | | | $ | 55,141 | | | $ | - | | | | - | | | Fair value | | $ | 1,247 | | | $ | 2,137 | | | $ | 2,308 | | | $ | 2,657 | | | $ | 3,610 | |
| | | | | | | | | | | | | | | | - | | | | - | | | | | | | | | | | | | | | | | | | | | | | |
| Average amortized cost | | $ | 73,938 | | | $ | 69,980 | | | $ | 26,419 | | | $ | - | | | | - | | | Average amortized cost | | $ | 1,962 | | | $ | 2,255 | | | $ | 2,595 | | | $ | 25 | | | $ | 3,931 | |
| Interest income | | $ | 2,941 | | | $ | 3,110 | | | $ | 573 | | | $ | - | | | | - | | | Interest income | | $ | 138 | | | $ | 73 | | | $ | 163 | | | $ | 10 | | | $ | 376 | |
| Annualized yield | | | 15.91 | % | | | 17.77 | % | | | 8.67 | % | | | - | | | | - | | | Annualized yield | | | 28.24 | % | | | 12.97 | % | | | 25.09 | % | | | 153.66 | % | | | 38.21 | % |
| | | | | | | | | | | | | | | | | | | | | | | | | | | | | | | | | | | | | | | | |
Residential Prime Subordinate | | | | | | | | | | | | | | | | | | | Note on annualized yields: Cash flows from our investments can be very sporadic and, to some | |
| Current face | | $ | 348,678 | | | $ | 379,276 | | | $ | 412,052 | | | $ | 419,631 | | | $ | 448,943 | | | extent, unexpected. The fair value of some assets is close to zero and any interest income results in unusally high reported yields that are not sustainable. | |
| Unamortized discount | | | (22,099 | ) | | | (22,979 | ) | | | (28,545 | ) | | | (87,421 | ) | | | (90,582 | ) | | | |
| Credit reserve | | | (282,813 | ) | | | (306,728 | ) | | | (319,653 | ) | | | (291,592 | ) | | | (308,447 | ) | | | | | |
| Unrealized losses | | | (24,256 | ) | | | (27,643 | ) | | | (37,112 | ) | | | (11,606 | ) | | | (6,127 | ) | | | | | | | | | | | | | | | | | | | | | | |
| Fair value | | $ | 19,510 | | | $ | 21,926 | | | $ | 26,742 | | | $ | 29,012 | | | $ | 43,787 | | | | | | | | | | | | | | | | | | | | | | | |
| | | | | | | | | | | | | | | | | | | | | | | | | | | | | | | | | | | | | | | | | | | |
| Average amortized cost | | $ | 47,083 | | | $ | 58,637 | | | $ | 43,020 | | | $ | 47,070 | | | $ | 88,943 | | | | | | | | | | | | | | | | | | | | | | | |
| Interest income | | $ | 3,533 | | | $ | 4,299 | | | $ | 3,907 | | | $ | 8,220 | | | $ | 8,185 | | | | | | | | | | | | | | | | | | | | | | | |
| Annualized yield | | | 30.02 | % | | | 29.33 | % | | | 36.32 | % | | | 69.85 | % | | | 36.81 | % | | | | | | | | | | | | | | | | | | | | | | |
| | | |
| THE REDWOOD REVIEW 4TH QUARTER 2009 | Table 7: Balances & Yields by Securities Portfolio at Redwood | |
| | | |
| Table 8: Securities Portfolio Activity at Redwood ($ in thousands) | |
| | | 2009 | | | 2009 | | | 2009 | | | 2009 | | | 2008 | | | | | 2009 | | | 2009 | | | 2009 | | | 2009 | | | 2008 | |
| | | Q4 | | | Q3 | | | Q2 | | | Q1 | | | Q4 | | | | | Q4 | | | Q3 | | | Q2 | | | Q1 | | | Q4 | |
| Residential Prime Senior | | | | | | | | | | | | | | | | | | | | | | Residential Real Estate Loans | | | | | | | | | | | | | | | | | | | | |
| Beginning fair value | | $ | 336,659 | | | $ | 183,466 | | | $ | 87,766 | | | $ | 50,965 | | | $ | 21,395 | | | Beginning fair value | | $ | 2,299 | | | $ | 2,336 | | | $ | 2,577 | | | $ | 2,624 | | | $ | 3,150 | |
| Acquisitions | | | 27,607 | | | | 134,738 | | | | 120,982 | | | | 49,107 | | | | 35,866 | | | Principal payments | | | (30 | ) | | | (28 | ) | | | (185 | ) | | | (27 | ) | | | (40 | ) |
| Sales | | | (24,104 | ) | | | (5,091 | ) | | | (35,713 | ) | | | - | | | | - | | | Premium amortization | | | - | | | | - | | | | - | | | | - | | | | - | |
| Effect of principal payments | | | (13,632 | ) | | | (13,121 | ) | | | (6,499 | ) | | | (2,337 | ) | | | (347 | ) | | Transfers to REO | | | - | | | | - | | | | - | | | | - | | | | (14 | ) |
| Change in fair value, net | | | 2,678 | | | | 36,667 | | | | 16,930 | | | | (9,969 | ) | | | (5,949 | ) | | Changes in fair value, net | | | 105 | | | | (9 | ) | | | (56 | ) | | | (20 | ) | | | (472 | ) |
| Ending fair value | | $ | 329,208 | | | $ | 336,659 | | | $ | 183,466 | | | $ | 87,766 | | | $ | 50,965 | | | Ending fair value | | $ | 2,374 | | | $ | 2,299 | | | $ | 2,336 | | | $ | 2,577 | | | $ | 2,624 | |
| | | | | | | | | | | | | | | | | | | | | | | | | | | | | | | | | | | | | | | | | | | |
| Residential Non-Prime Senior | | | | | | | | | | | | | | | | | | | | | | Commercial Subordinate | | | | | | | | | | | | | | | | | | | | |
| Beginning fair value | | $ | 279,000 | | | $ | 230,955 | | | $ | 74,383 | | | $ | 42,820 | | | $ | 48,246 | | | Beginning fair value | | $ | 16,833 | | | $ | 15,669 | | | $ | 22,915 | | | $ | 42,490 | | | $ | 63,686 | |
| Acquisitions | | | 37,157 | | | | 84,837 | | | | 162,745 | | | | 48,444 | | | | 10,419 | | | Acquisitions | | | - | | | | - | | | | - | | | | - | | | | - | |
| Sales | | | - | | | | (56,299 | ) | | | (14,613 | ) | | | (373 | ) | | | (867 | ) | | Sales | | | (4,778 | ) | | | - | | | | - | | | | - | | | | - | |
| Effect of principal payments | | | (10,214 | ) | | | (11,083 | ) | | | (5,128 | ) | | | (1,573 | ) | | | (549 | ) | | Effect of principal payments | | | - | | | | - | | | | - | | | | - | | | | - | |
| Change in fair value, net | | | 9,009 | | | | 30,590 | | | | 13,568 | | | | (14,935 | ) | | | (14,429 | ) | | Change in fair value, net | | | (2,855 | ) | | | 1,164 | | | | (7,246 | ) | | | (19,575 | ) | | | (21,196 | ) |
| Ending fair value | | $ | 314,952 | | | $ | 279,000 | | | $ | 230,955 | | | $ | 74,383 | | | $ | 42,820 | | | Ending fair value | | $ | 9,200 | | | $ | 16,833 | | | $ | 15,669 | | | $ | 22,915 | | | $ | 42,490 | |
| | | | | | | | | | | | | | | | | | | | | | | | | | | | | | | | | | | | | | | | | | | |
| Re-REMIC | | | | | | | | | | | | | | | | | | | | | | Commercial Real Estate Loans | | | | | | | | | | | | | | | | | | | | |
| Beginning fair value | | $ | 93,507 | | | $ | 55,141 | | | $ | - | | | $ | - | | | $ | - | | | Beginning fair value | | $ | 246 | | | $ | 247 | | | $ | 248 | | | $ | 249 | | | $ | 250 | |
| Acquisitions | | | 3,367 | | | | 25,073 | | | | 55,562 | | | | - | | | | - | | | Principal payments | | | (2 | ) | | | (2 | ) | | | (2 | ) | | | (2 | ) | | | (2 | ) |
| Sales | | | (17,368 | ) | | | - | | | | - | | | | - | | | | - | | | Discount amortization | | | 1 | | | | 1 | | | | 1 | | | | 1 | | | | 1 | |
| Effect of principal payments | | | - | | | | - | | | | - | | | | - | | | | - | | | Credit provision | | | - | | | | - | | | | - | | | | - | | | | - | |
| Change in fair value, net | | | 26,445 | | | | 13,293 | | | | (421 | ) | | | - | | | | - | | | Changes in fair value, net | | | - | | | | - | | | | - | | | | - | | | | - | |
| Ending fair value | | $ | 105,951 | | | $ | 93,507 | | | $ | 55,141 | | | $ | - | | | $ | - | | | Ending fair value | | $ | 245 | | | $ | 246 | | | $ | 247 | | | $ | 248 | | | $ | 249 | |
| | | | | | | | | | | | | | | | | | | | | | | | | | | | | | | | | | | | | | | | | | | |
| Residential Prime Subordinate | | | | | | | | | | | | | | | | | | | | | | CDO Subordinate | | | | | | | | | | | | | | | | | | | | |
| Beginning fair value | | $ | 21,926 | | | $ | 26,742 | | | $ | 29,012 | | | $ | 43,787 | | | $ | 86,272 | | | Beginning fair value | | $ | 2,137 | | | $ | 2,308 | | | $ | 2,657 | | | $ | 3,610 | | | $ | 4,065 | |
| Acquisitions | | | - | | | | 1,390 | | | | 1,829 | | | | - | | | | - | | | Acquisitions | | | - | | | | - | | | | - | | | | - | | | | - | |
| Sales | | | - | | | | (1,409 | ) | | | - | | | | - | | | | - | | | Sales | | | - | | | | - | | | | - | | | | - | | | | - | |
| Effect of principal payments | | | (526 | ) | | | (880 | ) | | | (1,050 | ) | | | (946 | ) | | | (1,311 | ) | | Effect of principal payments | | | - | | | | - | | | | - | | | | (37 | ) | | | (69 | ) |
| Change in fair value, net | | | (1,890 | ) | | | (3,917 | ) | | | (3,049 | ) | | | (13,829 | ) | | | (41,174 | ) | | Change in fair value, net | | | (890 | ) | | | (171 | ) | | | (349 | ) | | | (916 | ) | | | (386 | ) |
| Ending fair value | | $ | 19,510 | | | $ | 21,926 | | | $ | 26,742 | | | $ | 29,012 | | | $ | 43,787 | | | Ending fair value | | $ | 1,247 | | | $ | 2,137 | | | $ | 2,308 | | | $ | 2,657 | | | $ | 3,610 | |
| | | | | | | | | | | | | | | | | | | | | | | | | | | | | | | | | | | | | | | | | | | |
| Residential Non-Prime Subordinate | | | | | | | | | | | | | | | | | | | | | | | | | | | | | | | | | | | | | | | | | | |
| Beginning fair value | | $ | 1,205 | | | $ | 3,192 | | | $ | 4,537 | | | $ | 7,313 | | | $ | 5,073 | | | | | | | | | | | | | | | | | | | | | | | |
| Acquisitions | | | - | | | | - | | | | - | | | | - | | | | 3,630 | | | | | | | | | | | | | | | | | | | | | | | |
| Sales | | | - | | | | - | | | | - | | | | - | | | | - | | | | | | | | | | | | | | | | | | | | | | | |
| Effect of principal payments | | | (25 | ) | | | (38 | ) | | | (67 | ) | | | (98 | ) | | | (148 | ) | | | | | | | | | | | | | | | | | | | | | | |
| Change in fair value, net | | | 115 | | | | (1,949 | ) | | | (1,278 | ) | | | (2,678 | ) | | | (1,242 | ) | | | | | | | | | | | | | | | | | | | | | | |
| Ending fair value | | $ | 1,295 | | | $ | 1,205 | | | $ | 3,192 | | | $ | 4,537 | | | $ | 7,313 | | | | | | | | | | | | | | | | | | | | | | | |
| | | |
| THE REDWOOD REVIEW 4TH QUARTER 2009 | Table 8: Securities Portfolio Activity at Redwood | 57 |
| | | |
| Table 9 A: Residential Prime Securities at Redwood and Underlying Loan Characteristics ($ in thousands) | 58 |
| | | 2009 | | | 2009 | | | 2009 | | | 2009 | | | 2008 | | | | | 2009 | | | 2009 | | | 2009 | | | 2009 | | | 2008 | |
| | | Q4 | | | Q3 | | | Q2 | | | Q1 | | | Q4 | | | | | Q4 | | | Q3 | | | Q2 | | | Q1 | | | Q4 | |
| Residential Senior Prime | | | | | | | | | | | | | | | | | | | | | | | | | | | | | | | | | | | | | | | | | | |
| Principal value | | $ | 412,471 | | | $ | 431,289 | | | $ | 276,444 | | | $ | 160,009 | | | $ | 90,256 | | | Southern CA | | | 25 | % | | | 27 | % | | | 24 | % | | | 24 | % | | | 24 | % |
| Unamortized discount | | | (116,801 | ) | | | (124,295 | ) | | | (91,221 | ) | | | (64,884 | ) | | | (41,980 | ) | | Northern CA | | | 22 | % | | | 20 | % | | | 23 | % | | | 23 | % | | | 22 | % |
| Credit reserve | | | (9,898 | ) | | | (11,069 | ) | | | (3,486 | ) | | | (621 | ) | | | - | | | New York | | | 7 | % | | | 6 | % | | | 7 | % | | | 7 | % | | | 7 | % |
| Unrealized gain (loss) | | | 43,436 | | | | 40,734 | | | | 1,729 | | | | (6,738 | ) | | | 2,689 | | | Florida | | | 6 | % | | | 7 | % | | | 5 | % | | | 5 | % | | | 5 | % |
| Fair value | | $ | 329,208 | | | $ | 336,659 | | | $ | 183,466 | | | $ | 87,766 | | | $ | 50,965 | | | Virginia | | | 4 | % | | | 2 | % | | | 4 | % | | | 4 | % | | | 4 | % |
| Fair value / principal value | | | 80 | % | | | 78 | % | | | 66 | % | | | 55 | % | | | 56 | % | | New Jersey | | | 3 | % | | | 3 | % | | | 3 | % | | | 3 | % | | | 3 | % |
| | | | | | | | | | | | | | | | | | | | | | | Illinois | | | 3 | % | | | 2 | % | | | 3 | % | | | 3 | % | | | 3 | % |
| Security Type | | | | | | | | | | | | | | | | | | | | | | Georgia | | | 2 | % | | | 2 | % | | | 2 | % | | | 2 | % | | | 2 | % |
| ARM | | $ | - | | | $ | - | | | $ | - | | | $ | - | | | $ | - | | | Texas | | | 2 | % | | | 3 | % | | | 2 | % | | | 2 | % | | | 3 | % |
| Hybrid | | | 298,245 | | | | 306,402 | | | | 175,940 | | | | 86,282 | | | | 48,805 | | | Arizona | | | 2 | % | | | 2 | % | | | 2 | % | | | 2 | % | | | 2 | % |
| Fixed | | | 30,963 | | | | 30,257 | | | | 7,526 | | | | 1,484 | | | | 2,160 | | | Colorado | | | 2 | % | | | 4 | % | | | 2 | % | | | 2 | % | | | 2 | % |
| Total fair value | | $ | 329,208 | | | $ | 336,659 | | | $ | 183,466 | | | $ | 87,766 | | | $ | 50,965 | | | Other states | | | 22 | % | | | 22 | % | | | 23 | % | | | 23 | % | | | 23 | % |
| | | | | | | | | | | | | | | | | | | | | | | | | | | | | | | | | | | | | | | | | | | |
| Residential Senior Prime | | | | | | | | | | | | | | | | | | | | | | Wtd Avg Original LTV | | | 68 | % | | | 68 | % | | | 68 | % | | | 68 | % | | | 68 | % |
| Coupon income | | $ | 5,057 | | | $ | 4,743 | | | $ | 3,066 | | | $ | 1,733 | | | $ | 749 | | | Original LTV: 0 - 50 | | | 13 | % | | | 13 | % | | | 13 | % | | | 13 | % | | | 13 | % |
| Discount amortization | | | 3,553 | | | | 3,688 | | | | 2,410 | | | | 1,128 | | | | 243 | | | Original LTV: 50.01 - 60 | | | 11 | % | | | 12 | % | | | 12 | % | | | 12 | % | | | 12 | % |
| Total interest income | | $ | 8,610 | | | $ | 8,431 | | | $ | 5,476 | | | $ | 2,861 | | | $ | 992 | | | Original LTV: 60.01 - 70 | | | 22 | % | | | 22 | % | | | 22 | % | | | 22 | % | | | 22 | % |
| | | | | | | | | | | | | | | | | | | | | | | Original LTV: 70.01 - 80 | | | 50 | % | | | 50 | % | | | 49 | % | | | 49 | % | | | 49 | % |
| Average amortized cost | | $ | 280,101 | | | $ | 264,773 | | | $ | 164,386 | | | $ | 77,651 | | | $ | 37,746 | | | Original LTV: 80.01 - 90 | | | 2 | % | | | 2 | % | | | 2 | % | | | 2 | % | | | 3 | % |
| | | | | | | | | | | | | | | | | | | | | | | Original LTV: 90.01 - 100 | | | 1 | % | | | 1 | % | | | 1 | % | | | 1 | % | | | 1 | % |
| Coupon income % | | | 7.22 | % | | | 7.17 | % | | | 7.46 | % | | | 8.93 | % | | | 7.94 | % | | Unknown | | | 1 | % | | | 0 | % | | | 1 | % | | | 1 | % | | | 0 | % |
| Discount amortization % | | | 5.07 | % | | | 5.57 | % | | | 5.86 | % | | | 5.81 | % | | | 2.58 | % | | | | | | | | | | | | | | | | | | | | | | |
| Annualized yield | | | 12.30 | % | | | 12.74 | % | | | 13.32 | % | | | 14.74 | % | | | 10.51 | % | | Wtd Avg FICO | | | 740 | | | | 740 | | | | 741 | | | | 741 | | | | 741 | |
| | | | | | | | | | | | | | | | | | | | | | | FICO: <= 600 | | | 0 | % | | | 0 | % | | | 0 | % | | | 0 | % | | | 0 | % |
| Residential Subordinate Prime | | | | | | | | | | | | | | | | | | | | | | FICO: 601 - 620 | | | 0 | % | | | 0 | % | | | 0 | % | | | 0 | % | | | 0 | % |
| Principal value | | $ | 348,678 | | | $ | 379,276 | | | $ | 412,052 | | | $ | 419,631 | | | $ | 448,943 | | | FICO: 621 - 640 | | | 1 | % | | | 1 | % | | | 1 | % | | | 1 | % | | | 1 | % |
| Unamortized discount | | | (22,099 | ) | | | (22,979 | ) | | | (28,545 | ) | | | (87,421 | ) | | | (90,582 | ) | | FICO: 641 - 660 | | | 2 | % | | | 2 | % | | | 2 | % | | | 2 | % | | | 2 | % |
| Credit reserve | | | (282,813 | ) | | | (306,728 | ) | | | (319,653 | ) | | | (291,592 | ) | | | (308,447 | ) | | FICO: 661 - 680 | | | 5 | % | | | 5 | % | | | 5 | % | | | 5 | % | | | 5 | % |
| Unrealized loss | | | (24,256 | ) | | | (27,643 | ) | | | (37,112 | ) | | | (11,606 | ) | | | (6,127 | ) | | FICO: 681 - 700 | | | 9 | % | | | 9 | % | | | 9 | % | | | 9 | % | | | 8 | % |
| Fair value | | $ | 19,510 | | | $ | 21,926 | | | $ | 26,742 | | | $ | 29,012 | | | $ | 43,787 | | | FICO: 701 - 720 | | | 14 | % | | | 14 | % | | | 13 | % | | | 13 | % | | | 13 | % |
| Fair value / principal value | | | 6 | % | | | 6 | % | | | 6 | % | | | 7 | % | | | 10 | % | | FICO: 721 - 740 | | | 14 | % | | | 14 | % | | | 14 | % | | | 14 | % | | | 14 | % |
| | | | | | | | | | | | | | | | | | | | | | | FICO: 741 - 760 | | | 16 | % | | | 16 | % | | | 16 | % | | | 16 | % | | | 16 | % |
| Security Type | | | | | | | | | | | | | | | | | | | | | | FICO: 761 - 780 | | | 19 | % | | | 19 | % | | | 19 | % | | | 19 | % | | | 19 | % |
| ARM | | $ | 1,202 | | | $ | 1,301 | | | $ | 1,413 | | | $ | 1,736 | | | $ | 2,580 | | | FICO: 781 - 800 | | | 14 | % | | | 14 | % | | | 15 | % | | | 15 | % | | | 15 | % |
| Hybrid | | | 13,028 | | | | 14,780 | | | | 18,544 | | | | 20,325 | | | | 32,482 | | | FICO: >= 801 | | | 4 | % | | | 4 | % | | | 4 | % | | | 4 | % | | | 4 | % |
| Fixed | | | 5,280 | | | | 5,845 | | | | 6,785 | | | | 6,951 | | | | 8,725 | | | Unknown | | | 2 | % | | | 2 | % | | | 2 | % | | | 2 | % | | | 3 | % |
| Total fair value | | $ | 19,510 | | | $ | 21,926 | | | $ | 26,742 | | | $ | 29,012 | | | $ | 43,787 | | | | | | | | | | | | | | | | | | | | | | | |
| | | | | | | | | | | | | | | | | | | | | | | Conforming % (1) | | | 58 | % | | | 59 | % | | | 59 | % | | | 60 | % | | | 61 | % |
| Residential Subordinate Prime | | | | | | | | | | | | | | | | | | | | | | > $1 MM % | | | 9 | % | | | 8 | % | | | 8 | % | | | 8 | % | | | 8 | % |
| Coupon income | | $ | 3,972 | | | $ | 4,698 | | | $ | 5,155 | | | $ | 5,615 | | | $ | 6,219 | | | | | | | | | | | | | | | | | | | | | | | |
| (Premium) discount amortization | | | (439 | ) | | | (399 | ) | | | (1,248 | ) | | | 2,887 | | | | 1,966 | | | 2nd Home % | | | 7 | % | | | 7 | % | | | 7 | % | | | 7 | % | | | 6 | % |
| Total interest income | | $ | 3,533 | | | $ | 4,299 | | | $ | 3,907 | | | $ | 8,502 | | | $ | 8,185 | | | Investment Home % | | | 2 | % | | | 2 | % | | | 2 | % | | | 1 | % | | | 1 | % |
| | | | | | | | | | | | | | | | | | | | | | | | | | | | | | | | | | | | | | | | | | | |
| Average amortized cost | | $ | 47,083 | | | $ | 58,637 | | | $ | 43,020 | | | $ | 47,070 | | | $ | 88,943 | | | | | | | | | | | | | | | | | | | | | | | |
| | | | | | | | | | | | | | | | | | | | | | | Purchase | | | 44 | % | | | 44 | % | | | 44 | % | | | 44 | % | | | 44 | % |
| Coupon income % | | | 33.74 | % | | | 32.05 | % | | | 47.93 | % | | | 47.72 | % | | | 27.97 | % | | Cash Out Refi | | | 22 | % | | | 22 | % | | | 21 | % | | | 21 | % | | | 21 | % |
| (Premium) discount amortization % | | | -3.73 | % | | | -2.72 | % | | | -11.61 | % | | | 24.53 | % | | | 8.84 | % | | Rate-Term Refi | | | 33 | % | | | 33 | % | | | 34 | % | | | 34 | % | | | 35 | % |
| Annualized yield | | | 30.02 | % | | | 29.33 | % | | | 36.32 | % | | | 72.25 | % | | | 36.81 | % | | Construction | | | 0 | % | | | 0 | % | | | 0 | % | | | 0 | % | | | 0 | % |
| | | | | | | | | | | | | | | | | | | | | | | Other | | | 1 | % | | | 1 | % | | | 1 | % | | | 1 | % | | | 0 | % |
Underlying Prime Loan Characteristics | | | | | | | | | | | | | | | | | | | | | | | | | | | | | | | | | | | | | | | |
| | | | | | | | | | | | | | | | | | | | | | | Full Doc | | | 55 | % | | | 55 | % | | | 56 | % | | | 55 | % | | | 55 | % |
| Number of loans | | | 168,449 | | | | 184,849 | | | | 201,789 | | | | 216,362 | | | | 237,131 | | | No Doc | | | 5 | % | | | 5 | % | | | 4 | % | | | 4 | % | | | 4 | % |
| Total loan face | | $ | 76,332,218 | | | $ | 84,519,707 | | | $ | 92,121,182 | | | $ | 98,573,943 | | | $ | 107,131,216 | | | Other Doc (Lim, Red, Stated, etc) | | | 37 | % | | | 37 | % | | | 37 | % | | | 38 | % | | | 38 | % |
| Average loan size | | $ | 453 | | | $ | 457 | | | $ | 457 | | | $ | 456 | | | $ | 452 | | | Unknown/Not Categorized | | | 3 | % | | | 3 | % | | | 3 | % | | | 3 | % | | | 3 | % |
| | | | | | | | | | | | | | | | | | | | | | | | | | | | | | | | | | | | | | | | | | | |
| Year 2008 origination | | | 1 | % | | | 0 | % | | | 0 | % | | | 0 | % | | | 0 | % | | 2-4 Family | | | 2 | % | | | 1 | % | | | 1 | % | | | 1 | % | | | 1 | % |
| Year 2007 origination | | | 10 | % | | | 9 | % | | | 9 | % | | | 9 | % | | | 9 | % | | Condo | | | 10 | % | | | 10 | % | | | 10 | % | | | 10 | % | | | 10 | % |
| Year 2006 origination | | | 12 | % | | | 12 | % | | | 12 | % | | | 14 | % | | | 14 | % | | Single Family | | | 87 | % | | | 88 | % | | | 88 | % | | | 88 | % | | | 87 | % |
| Year 2005 origination | | | 19 | % | | | 20 | % | | | 19 | % | | | 17 | % | | | 17 | % | | Other | | | 1 | % | | | 1 | % | | | 1 | % | | | 1 | % | | | 2 | % |
| Year 2004 origination and earlier | | | 58 | % | | | 59 | % | | | 60 | % | | | 60 | % | | | 60 | % | | | | | | | | | | | | | | | | | | | | | | |
| | | | | | | | | | | | | | | | | | | | | | | | | | | | | | | | | | | | | | | | | | | |
| | | | | | | | | | | | | | | | | | | | | | | | | | | | | | | | | | | | | | | | | | | |
| | | | | | | | | | | | | | | | | | | | | | | | | | | | | | | | | | | | | | | | | | | |
| (1) The definition of a conforming loan has significantly changed over time. For all periods shown in this table, the conforming loan definition available in Febuary 2009 was used (which had a maximum loan balance of $729,750). |
| (2) Only the loan groups providing direct cash flow to securities we own are included. | | | | | | | | | | | | | | | | | |
| | | | | | | | | | | | | | | | | | | | | | | | | | | | | | | | | | | | | | | | | | | |
| | | |
| THE REDWOOD REVIEW 4TH QUARTER 2009 | Table 9A: Residential Prime Securities at Redwood and Underlying Loan Characteristics | |
| | | |
| Table 9 B: Residential Non-Prime Securities at Redwood and Underlying Loan Characteristics ($ in thousands) | |
| | | 2009 | | | 2009 | | | 2009 | | | 2009 | | | 2008 | | | | | 2009 | | | 2009 | | | 2009 | | | 2009 | | | 2008 | |
| | | Q4 | | | Q3 | | | Q2 | | | Q1 | | | Q4 | | | | | Q4 | | | Q3 | | | Q2 | | | Q1 | | | Q4 | |
Residential Senior Non-Prime | | | | | | | | | | | | | | | | | | | | | | | | | | | | | | | | | | | | | | | | | | |
| Principal value | | $ | 430,698 | | | $ | 403,675 | | | $ | 396,135 | | | $ | 182,851 | | | $ | 108,871 | | | Southern CA | | | 25 | % | | | 26 | % | | | 25 | % | | | 27 | % | | | 30 | % |
| Unamortized discount | | | (134,649 | ) | | | (137,899 | ) | | | (141,761 | ) | | | (77,193 | ) | | | (50,687 | ) | | Northern CA | | | 18 | % | | | 16 | % | | | 18 | % | | | 19 | % | | | 22 | % |
| Credit reserve | | | (13,468 | ) | | | (10,098 | ) | | | (16,009 | ) | | | (4,159 | ) | | | (3,827 | ) | | Florida | | | 8 | % | | | 9 | % | | | 9 | % | | | 10 | % | | | 10 | % |
| Unrealized gain (loss) | | | 32,371 | | | | 23,322 | | | | (7,410 | ) | | | (27,116 | ) | | | (11,537 | ) | | New York | | | 5 | % | | | 5 | % | | | 5 | % | | | 5 | % | | | 4 | % |
| Fair value | | $ | 314,952 | | | $ | 279,000 | | | $ | 230,955 | | | $ | 74,383 | | | $ | 42,820 | | | New Jersey | | | 4 | % | | | 2 | % | | | 4 | % | | | 4 | % | | | 3 | % |
| Fair value / principal value | | | 73 | % | | | 69 | % | | | 58 | % | | | 41 | % | | | 39 | % | | Arizona | | | 3 | % | | | 4 | % | | | 3 | % | | | 3 | % | | | 3 | % |
| | | | | | | | | | | | | | | | | | | | | | | Virginia | | | 3 | % | | | 2 | % | | | 3 | % | | | 3 | % | | | 3 | % |
| Security Type | | | | | | | | | | | | | | | | | | | | | | Georgia | | | 2 | % | | | 3 | % | | | 2 | % | | | 1 | % | | | 1 | % |
| ARM | | $ | 2,015 | | | $ | - | | | $ | - | | | $ | - | | | $ | - | | | Texas | | | 2 | % | | | 2 | % | | | 2 | % | | | 1 | % | | | 1 | % |
| Option ARM | | | 26,004 | | | | 25,747 | | | | 18,586 | | | | 17,796 | | | | 23,820 | | | Illinois | | | 2 | % | | | 2 | % | | | 2 | % | | | 3 | % | | | 2 | % |
| Hybrid | | | 160,494 | | | | 154,998 | | | | 158,886 | | | | 50,616 | | | | 13,519 | | | Colorado | | | 2 | % | | | 3 | % | | | 2 | % | | | 2 | % | | | 2 | % |
| Fixed | | | 126,439 | | | | 98,255 | | | | 53,483 | | | | 5,971 | | | | 5,481 | | | Other states | | | 26 | % | | | 26 | % | | | 25 | % | | | 22 | % | | | 19 | % |
| Total fair value | | $ | 314,952 | | | $ | 279,000 | | | $ | 230,955 | | | $ | 74,383 | | | $ | 42,820 | | | | | | | | | | | | | | | | | | | | | | | |
| | | | | | | | | | | | | | | | | | | | | | | Wtd Avg Original LTV | | | 73 | % | | | 74 | % | | | 74 | % | | | 74 | % | | | 74 | % |
Residential Senior Non-Prime | | | | | | | | | | | | | | | | | | | Original LTV: 0 - 50 | | | 5 | % | | | 5 | % | | | 5 | % | | | 5 | % | | | 5 | % |
| Coupon income | | $ | 4,000 | | | $ | 4,156 | | | $ | 2,871 | | | $ | 1,251 | | | $ | 879 | | | Original LTV: 50.01 - 60 | | | 8 | % | | | 7 | % | | | 7 | % | | | 7 | % | | | 7 | % |
| Discount amortization | | | 4,489 | | | | 6,357 | | | | 3,865 | | | | 2,194 | | | | 711 | | | Original LTV: 60.01 - 70 | | | 19 | % | | | 17 | % | | | 17 | % | | | 18 | % | | | 19 | % |
| Total interest income | | $ | 8,489 | | | $ | 10,513 | | | $ | 6,736 | | | $ | 3,445 | | | $ | 1,590 | | | Original LTV: 70.01 - 80 | | | 59 | % | | | 59 | % | | | 59 | % | | | 60 | % | | | 59 | % |
| | | | | | | | | | | | | | | | | | | | | | | Original LTV: 80.01 - 90 | | | 6 | % | | | 8 | % | | | 8 | % | | | 7 | % | | | 7 | % |
| Average amortized cost | | $ | 263,022 | | | $ | 270,353 | | | $ | 168,383 | | | $ | 87,464 | | | $ | 63,050 | | | Original LTV: 90.01 - 100 | | | 3 | % | | | 4 | % | | | 4 | % | | | 3 | % | | | 3 | % |
| | | | | | | | | | | | | | | | | | | | | | | Unknown | | | 0 | % | | | 0 | % | | | 0 | % | | | 0 | % | | | 0 | % |
| Coupon income % | | | 6.08 | % | | | 6.15 | % | | | 6.82 | % | | | 5.72 | % | | | 5.58 | % | | | | | | | | | | | | | | | | | | | | | | |
| Discount amortization % | | | 6.83 | % | | | 9.41 | % | | | 9.18 | % | | | 10.03 | % | | | 4.51 | % | | Wtd Avg FICO | | | 712 | | | | 707 | | | | 705 | | | | 705 | | | | 706 | |
| Annualized yield | | | 12.91 | % | | | 15.55 | % | | | 16.00 | % | | | 15.75 | % | | | 10.09 | % | | FICO: <= 600 | | | 1 | % | | | 2 | % | | | 2 | % | | | 2 | % | | | 3 | % |
| | | | | | | | | | | | | | | | | | | | | | | FICO: 601 - 620 | | | 2 | % | | | 2 | % | | | 3 | % | | | 3 | % | | | 3 | % |
Residential Subordinate Non-Prime | | | | | | | | | | | | | | | | | | | FICO: 621 - 640 | | | 4 | % | | | 5 | % | | | 5 | % | | | 5 | % | | | 5 | % |
| Principal value | | $ | 86,802 | | | $ | 86,802 | | | $ | 230,404 | | | $ | 327,766 | | | $ | 452,327 | | | FICO: 641 - 660 | | | 7 | % | | | 8 | % | | | 8 | % | | | 8 | % | | | 7 | % |
| Unamortized discount | | | (14,863 | ) | | | (14,863 | ) | | | (18,846 | ) | | | (19,512 | ) | | | (29,092 | ) | | FICO: 661 - 680 | | | 12 | % | | | 13 | % | | | 12 | % | | | 12 | % | | | 12 | % |
| Credit reserve | | | (70,806 | ) | | | (70,806 | ) | | | (208,839 | ) | | | (305,422 | ) | | | (419,194 | ) | | FICO: 681 - 700 | | | 15 | % | | | 15 | % | | | 16 | % | | | 16 | % | | | 16 | % |
| Unrealized (loss) gain | | | 162 | | | | 162 | | | | 473 | | | | 1,705 | | | | 3,272 | | | FICO: 701 - 720 | | | 15 | % | | | 14 | % | | | 14 | % | | | 14 | % | | | 14 | % |
| Fair value | | $ | 1,295 | | | $ | 1,295 | | | $ | 3,192 | | | $ | 4,537 | | | $ | 7,313 | | | FICO: 721 - 740 | | | 13 | % | | | 12 | % | | | 12 | % | | | 12 | % | | | 13 | % |
| Fair value / principal value | | | 1 | % | | | 1 | % | | | 1 | % | | | 1 | % | | | 2 | % | | FICO: 741 - 760 | | | 11 | % | | | 11 | % | | | 11 | % | | | 11 | % | | | 11 | % |
| | | | | | | | | | | | | | | | | | | | | | | FICO: 761 - 780 | | | 10 | % | | | 9 | % | | | 9 | % | | | 9 | % | | | 9 | % |
| Security Type | | | | | | | | | | | | | | | | | | | | | | FICO: 781 - 800 | | | 7 | % | | | 6 | % | | | 5 | % | | | 5 | % | | | 5 | % |
| Option ARM | | $ | 1,061 | | | $ | 907 | | | $ | 2,639 | | | $ | 3,618 | | | $ | 5,082 | | | FICO: >= 801 | | | 2 | % | | | 2 | % | | | 2 | % | | | 2 | % | | | 2 | % |
| Hybrid | | | 234 | | | | 293 | | | | 400 | | | | 571 | | | | 1,307 | | | Unknown | | | 1 | % | | | 1 | % | | | 1 | % | | | 1 | % | | | 0 | % |
| Fixed | | | - | | | | 5 | | | | 153 | | | | 348 | | | | 924 | | | | | | | | | | | | | | | | | | | | | | | |
| Total fair value | | $ | 1,295 | | | $ | 1,205 | | | $ | 3,192 | | | $ | 4,537 | | | $ | 7,313 | | | Conforming % (1) | | | 76 | % | | | 74 | % | | | 71 | % | | | 62 | % | | | 60 | % |
| | | | | | | | | | | | | | | | | | | | | | | > $1 MM % | | | 9 | % | | | 9 | % | | | 10 | % | | | 17 | % | | | 19 | % |
Residential Subordinate Non-Prime | | | | | | | | | | | | | | | | | | | | | | | | | | | | | | | | | | | | | | | |
| Coupon income | | $ | 701 | | | $ | 1,128 | | | $ | 2,318 | | | $ | 5,779 | | | $ | 4,503 | | | 2nd Home % | | | 5 | % | | | 5 | % | | | 5 | % | | | 7 | % | | | 7 | % |
| (Premium) discount amortization | | | (342 | ) | | | 143 | | | | (703 | ) | | | 553 | | | | 780 | | | Investment Home % | | | 9 | % | | | 8 | % | | | 8 | % | | | 7 | % | | | 7 | % |
| Total interest income | | $ | 359 | | | $ | 1,271 | | | $ | 1,615 | | | $ | 6,332 | | | $ | 5,283 | | | | | | | | | | | | | | | | | | | | | | | |
| | | | | | | | | | | | | | | | | | | | | | | | | | | | | | | | | | | | | | | | | | | |
| Average amortized cost | | $ | 1,377 | | | $ | 2,218 | | | $ | 2,767 | | | $ | 3,450 | | | $ | 4,105 | | | Purchase | | | 40 | % | | | 40 | % | | | 41 | % | | | 37 | % | | | 35 | % |
| | | | | | | | | | | | | | | | | | | | | | | Cash Out Refi | | | 42 | % | | | 42 | % | | | 42 | % | | | 44 | % | | | 46 | % |
| Coupon income % | | | 203.65 | % | | | 203.50 | % | | | 335.10 | % | | | 670.16 | % | | | 438.78 | % | | Rate-Term Refi | | | 17 | % | | | 17 | % | | | 16 | % | | | 19 | % | | | 19 | % |
| Discount (premium) amortization % | | | -99.42 | % | | | 25.74 | % | | | -101.60 | % | | | 64.12 | % | | | 76.00 | % | | Construction | | | 0 | % | | | 0 | % | | | 0 | % | | | 0 | % | | | 0 | % |
| Annualized yield | | | 104.23 | % | | | 229.25 | % | | | 233.50 | % | | | 734.28 | % | | | 514.79 | % | | Other | | | 1 | % | | | 1 | % | | | 1 | % | | | 0 | % | | | 0 | % |
| | | | | | | | | | | | | | | | | | | | | | | | | | | | | | | | | | | | | | | | | | | |
Underlying Non-Prime Loan Characteristics | | | | | | | | | | | | | | | Full Doc | | | 34 | % | | | 34 | % | | | 32 | % | | | 27 | % | | | 24 | % |
| | | | | | | | | | | | | | | | | | | | | | | No Doc | | | 2 | % | | | 2 | % | | | 2 | % | | | 6 | % | | | 4 | % |
| Number of loans | | | 73,102 | | | | 73,970 | | | | 71,041 | | | | 64,541 | | | | 88,331 | | | Other Doc (Lim, Red, Stated, etc) | | | 62 | % | | | 62 | % | | | 64 | % | | | 66 | % | | | 71 | % |
| Total loan face | | $ | 20,445,051 | | | $ | 21,588,255 | | | $ | 22,498,418 | | | $ | 24,833,600 | | | $ | 36,262,301 | | | Unknown/Not Categorized | | | 2 | % | | | 2 | % | | | 2 | % | | | 1 | % | | | 1 | % |
| Average loan size | | $ | 280 | | | $ | 292 | | | $ | 317 | | | $ | 385 | | | $ | 411 | | | | | | | | | | | | | | | | | | | | | | | |
| | | | | | | | | | | | | | | | | | | | | | | 2-4 Family | | | 5 | % | | | 5 | % | | | 5 | % | | | 4 | % | | | 4 | % |
| Year 2008 origination | | | 0 | % | | | 0 | % | | | 0 | % | | | 0 | % | | | 0 | % | | Condo | | | 9 | % | | | 9 | % | | | 9 | % | | | 10 | % | | | 10 | % |
| Year 2007 origination | | | 11 | % | | | 22 | % | | | 23 | % | | | 36 | % | | | 33 | % | | Single Family | | | 86 | % | | | 86 | % | | | 86 | % | | | 85 | % | | | 86 | % |
| Year 2006 origination | | | 5 | % | | | 8 | % | | | 8 | % | | | 12 | % | | | 22 | % | | Other | | | 0 | % | | | 0 | % | | | 0 | % | | | 1 | % | | | 0 | % |
| Year 2005 origination | | | 47 | % | | | 36 | % | | | 34 | % | | | 27 | % | | | 28 | % | | | | | | | | | | | | | | | | | | | | | | |
| Year 2004 origination and earlier | | | 37 | % | | | 34 | % | | | 35 | % | | | 25 | % | | | 17 | % | | | | | | | | | | | | | | | | | | | | | | |
| | | | | | | | | | | | | | | | | | | | | | | | | | | | | | | | | | | | | | | | | | | |
| | | | | | | | | | | | | | | | | | | | | | | | | | | | | | | | | | | | | | | | | | | |
| | | | | | | | | | | | | | | | | | | | | | | | | | | | | | | | | | | | | | | | | | | |
| | | | | | | | | | | | | | | | | | | | | | | | | | | | | | | | | | | | | | | | | | | |
| (1) The definition of a conforming loan has significantly changed over time. For all periods shown in this table, the conforming loan definition available in Febuary 2009 was used (which had a maximum loan balance of $729,750). |
| (2) Only the loan groups providing direct cash flow to securities we own are included. | | | | | | | | | |
| | | |
| THE REDWOOD REVIEW 4TH QUARTER 2009 | Table 9B: Residential Non-Prime Securities at Redwood and Underlying Loan Characteristics | 59 |
| | | |
| Table 10: Residential Real Estate Loan Characteristics ($ in thousands) (1) | 60 |
| | | 2009 | | | 2009 | | | 2009 | | | 2009 | | | 2008 | | | 2008 | | | 2008 | | | 2008 | | | 2007 | |
| | | Q4 | | | Q3 | | | Q2 | | | Q1 | | | Q4 | | | Q3 | | | Q2 | | | Q1 | | | Q4 | |
| | | | | | | | | | | | | | | | | | | | | | | | | | | | | | | | | | | | | |
| Residential loans | | $ | 3,733,173 | | | $ | 3,827,086 | | | $ | 3,952,147 | | | $ | 4,523,877 | | | $ | 4,617,269 | | | $ | 6,070,083 | | | $ | 6,322,868 | | | $ | 6,702,726 | | | $ | 7,106,018 | |
| Number of loans | | | 12,930 | | | | 13,232 | | | | 13,648 | | | | 14,880 | | | | 15,203 | | | | 18,037 | | | | 18,706 | | | | 19,801 | | | | 21,000 | |
| Average loan size | | $ | 289 | | | $ | 289 | | | $ | 290 | | | $ | 304 | | | $ | 304 | | | $ | 337 | | | $ | 338 | | | $ | 339 | | | $ | 338 | |
| | | | | | | | | | | | | | | | | | | | | | | | | | | | | | | | | | | | | |
| Adjustable % | | | 95 | % | | | 95 | % | | | 95 | % | | | 85 | % | | | 85 | % | | | 67 | % | | | 67 | % | | | 67 | % | | | 68 | % |
| Hybrid % | | | 5 | % | | | 5 | % | | | 5 | % | | | 15 | % | | | 15 | % | | | 33 | % | | | 33 | % | | | 33 | % | | | 32 | % |
| Fixed % | | | 0 | % | | | 0 | % | | | 0 | % | | | 0 | % | | | 0 | % | | | 0 | % | | | 0 | % | | | 0 | % | | | 0 | % |
| | | | | | | | | | | | | | | | | | | | | | | | | | | | | | | | | | | | | |
| Amortizing % | | | 3 | % | | | 3 | % | | | 3 | % | | | 4 | % | | | 4 | % | | | 5 | % | | | 5 | % | | | 5 | % | | | 5 | % |
| Interest-only % | | | 97 | % | | | 97 | % | | | 97 | % | | | 96 | % | | | 96 | % | | | 95 | % | | | 95 | % | | | 95 | % | | | 95 | % |
| Negatively amortizing % | | | 0 | % | | | 0 | % | | | 0 | % | | | 0 | % | | | 0 | % | | | 0 | % | | | 0 | % | | | 0 | % | | | 0 | % |
| | | | | | | | | | | | | | | | | | | | | | | | | | | | | | | | | | | | | |
| Florida | | | 14 | % | | | 14 | % | | | 14 | % | | | 13 | % | | | 13 | % | | | 13 | % | | | 13 | % | | | 13 | % | | | 13 | % |
| Southern California | | | 11 | % | | | 11 | % | | | 11 | % | | | 12 | % | | | 12 | % | | | 15 | % | | | 15 | % | | | 15 | % | | | 14 | % |
| Northern California | | | 8 | % | | | 8 | % | | | 8 | % | | | 9 | % | | | 9 | % | | | 11 | % | | | 11 | % | | | 11 | % | | | 10 | % |
| New York | | | 7 | % | | | 7 | % | | | 7 | % | | | 6 | % | | | 6 | % | | | 6 | % | | | 6 | % | | | 6 | % | | | 6 | % |
| Georgia | | | 5 | % | | | 5 | % | | | 5 | % | | | 5 | % | | | 5 | % | | | 4 | % | | | 4 | % | | | 4 | % | | | 4 | % |
| New Jersey | | | 5 | % | | | 4 | % | | | 4 | % | | | 4 | % | | | 4 | % | | | 4 | % | | | 4 | % | | | 4 | % | | | 4 | % |
| Texas | | | 5 | % | | | 5 | % | | | 5 | % | | | 5 | % | | | 5 | % | | | 4 | % | | | 4 | % | | | 4 | % | | | 5 | % |
| Colorado | | | 4 | % | | | 4 | % | | | 4 | % | | | 4 | % | | | 4 | % | | | 3 | % | | | 3 | % | | | 3 | % | | | 3 | % |
| Virginia | | | 3 | % | | | 3 | % | | | 3 | % | | | 3 | % | | | 3 | % | | | 3 | % | | | 3 | % | | | 3 | % | | | 3 | % |
| Arizona | | | 2 | % | | | 3 | % | | | 3 | % | | | 3 | % | | | 3 | % | | | 3 | % | | | 3 | % | | | 3 | % | | | 4 | % |
| Illinois | | | 2 | % | | | 2 | % | | | 2 | % | | | 3 | % | | | 3 | % | | | 3 | % | | | 3 | % | | | 3 | % | | | 3 | % |
| Other states | | | 34 | % | | | 34 | % | | | 34 | % | | | 33 | % | | | 33 | % | | | 31 | % | | | 30 | % | | | 30 | % | | | 31 | % |
| | | | | | | | | | | | | | | | | | | | | | | | | | | | | | | | | | | | | |
| Year 2008 origination | | | 0 | % | | | 0 | % | | | 0 | % | | | 0 | % | | | 0 | % | | | 0 | % | | | 0 | % | | | 0 | % | | | 0 | % |
| Year 2007 origination | | | 2 | % | | | 2 | % | | | 2 | % | | | 2 | % | | | 2 | % | | | 13 | % | | | 13 | % | | | 13 | % | | | 13 | % |
| Year 2006 origination | | | 6 | % | | | 5 | % | | | 5 | % | | | 15 | % | | | 15 | % | | | 21 | % | | | 21 | % | | | 20 | % | | | 20 | % |
| Year 2005 origination | | | 4 | % | | | 4 | % | | | 4 | % | | | 4 | % | | | 4 | % | | | 5 | % | | | 5 | % | | | 5 | % | | | 5 | % |
| Year 2004 origination or earlier | | | 88 | % | | | 89 | % | | | 89 | % | | | 79 | % | | | 79 | % | | | 61 | % | | | 61 | % | | | 62 | % | | | 62 | % |
| | | | | | | | | | | | | | | | | | | | | | | | | | | | | | | | | | | | | |
| Wtd Avg Original LTV | | | 67 | % | | | 67 | % | | | 67 | % | | | 68 | % | | | 68 | % | | | 69 | % | | | 69 | % | | | 69 | % | | | 69 | % |
| Original LTV: 0 - 50 | | | 18 | % | | | 18 | % | | | 18 | % | | | 17 | % | | | 17 | % | | | 15 | % | | | 15 | % | | | 15 | % | | | 15 | % |
| Original LTV: 50 - 60 | | | 11 | % | | | 11 | % | | | 11 | % | | | 11 | % | | | 11 | % | | | 11 | % | | | 11 | % | | | 11 | % | | | 11 | % |
| Original LTV: 60 - 70 | | | 20 | % | | | 20 | % | | | 20 | % | | | 19 | % | | | 19 | % | | | 19 | % | | | 19 | % | | | 19 | % | | | 19 | % |
| Original LTV: 70 - 80 | | | 43 | % | | | 43 | % | | | 43 | % | | | 46 | % | | | 46 | % | | | 49 | % | | | 49 | % | | | 49 | % | | | 48 | % |
| Original LTV: 80 - 90 | | | 2 | % | | | 2 | % | | | 2 | % | | | 2 | % | | | 2 | % | | | 2 | % | | | 2 | % | | | 2 | % | | | 2 | % |
| Original LTV: 90 - 100 | | | 6 | % | | | 6 | % | | | 6 | % | | | 5 | % | | | 5 | % | | | 4 | % | | | 4 | % | | | 4 | % | | | 5 | % |
| | | | | | | | | | | | | | | | | | | | | | | | | | | | | | | | | | | | | |
| Wtg Avg FICO | | | 730 | | | | 730 | | | | 731 | | | | 731 | | | | 732 | | | | 732 | | | | 732 | | | | 732 | | | | 732 | |
| FICO: <= 600 | | | 1 | % | | | 1 | % | | | 1 | % | | | 1 | % | | | 1 | % | | | 1 | % | | | 1 | % | | | 1 | % | | | 1 | % |
| FICO: 601 -620 | | | 1 | % | | | 1 | % | | | 1 | % | | | 1 | % | | | 1 | % | | | 1 | % | | | 1 | % | | | 1 | % | | | 1 | % |
| FICO: 621 - 640 | | | 2 | % | | | 2 | % | | | 2 | % | | | 2 | % | | | 2 | % | | | 1 | % | | | 1 | % | | | 2 | % | | | 1 | % |
| FICO: 641 -660 | | | 4 | % | | | 4 | % | | | 4 | % | | | 4 | % | | | 4 | % | | | 3 | % | | | 3 | % | | | 3 | % | | | 3 | % |
| FICO: 661 - 680 | | | 8 | % | | | 8 | % | | | 8 | % | | | 7 | % | | | 7 | % | | | 7 | % | | | 8 | % | | | 7 | % | | | 7 | % |
| FICO: 681 - 700 | | | 12 | % | | | 12 | % | | | 12 | % | | | 12 | % | | | 12 | % | | | 12 | % | | | 12 | % | | | 12 | % | | | 12 | % |
| FICO: 701 - 720 | | | 13 | % | | | 13 | % | | | 14 | % | | | 13 | % | | | 13 | % | | | 13 | % | | | 14 | % | | | 13 | % | | | 14 | % |
| FICO: 721 - 740 | | | 13 | % | | | 13 | % | | | 13 | % | | | 13 | % | | | 13 | % | | | 13 | % | | | 14 | % | | | 13 | % | | | 13 | % |
| FICO: 741 - 760 | | | 14 | % | | | 14 | % | | | 14 | % | | | 15 | % | | | 15 | % | | | 15 | % | | | 15 | % | | | 15 | % | | | 15 | % |
| FICO: 761 - 780 | | | 16 | % | | | 16 | % | | | 16 | % | | | 17 | % | | | 17 | % | | | 17 | % | | | 17 | % | | | 17 | % | | | 17 | % |
| FICO: 781 - 800 | | | 12 | % | | | 12 | % | | | 12 | % | | | 12 | % | | | 12 | % | | | 13 | % | | | 13 | % | | | 13 | % | | | 13 | % |
| FICO: >= 801 | | | 4 | % | | | 4 | % | | | 3 | % | | | 3 | % | | | 3 | % | | | 4 | % | | | 4 | % | | | 4 | % | | | 3 | % |
| | | | | | | | | | | | | | | | | | | | | | | | | | | | | | | | | | | | | |
Conforming % (2) | | | 56 | % | | | 56 | % | | | 56 | % | | | 55 | % | | | 52 | % | | | 34 | % | | | 33 | % | | | 34 | % | | | 34 | % |
| % balance in loans > $1mm per loan | | | 16 | % | | | 16 | % | | | 16 | % | | | 14 | % | | | 14 | % | | | 15 | % | | | 15 | % | | | 15 | % | | | 15 | % |
| | | | | | | | | | | | | | | | | | | | | | | | | | | | | | | | | | | | | |
| 2nd home % | | | 12 | % | | | 12 | % | | | 12 | % | | | 11 | % | | | 11 | % | | | 11 | % | | | 11 | % | | | 11 | % | | | 11 | % |
| Investment home % | | | 4 | % | | | 4 | % | | | 4 | % | | | 3 | % | | | 3 | % | | | 3 | % | | | 3 | % | | | 3 | % | | | 3 | % |
| | | | | | | | | | | | | | | | | | | | | | | | | | | | | | | | | | | | | |
| Purchase | | | 31 | % | | | 31 | % | | | 31 | % | | | 34 | % | | | 34 | % | | | 36 | % | | | 36 | % | | | 36 | % | | | 36 | % |
| Cash out refinance | | | 36 | % | | | 36 | % | | | 35 | % | | | 34 | % | | | 34 | % | | | 32 | % | | | 32 | % | | | 32 | % | | | 32 | % |
| Rate-term refinance | | | 31 | % | | | 31 | % | | | 32 | % | | | 31 | % | | | 31 | % | | | 30 | % | | | 30 | % | | | 30 | % | | | 30 | % |
| Other | | | 2 | % | | | 2 | % | | | 2 | % | | | 1 | % | | | 1 | % | | | 2 | % | | | 2 | % | | | 2 | % | | | 2 | % |
| | | | | | | | | | | | | | | | | | | | | | | | | | | | | | | | | | | | | |
| | | | | | | | | | | | | | | | | | | | | | | | | | | | | | | | | | | | | |
(1) This table presents characteristics of residential real estate loans held by consolidated Sequoia entities. (2) The definition of a conforming loan has significantly changed over time. For all periods shown in this table, the conforming loan definition available during the corresponding period was used. For December 31, 2009, the conforming loan definition available in Febuary 2009 was used (which had a maximum loan balance of $729,750). | |
| | | |
| THE REDWOOD REVIEW 4TH QUARTER 2009 | Table 10: Residential Real Estate Loan Characteristics | |
| | | |
Redwood Trust Corporate Information
EXECUTIVE OFFICERS:
George E. Bull, III Chairman of the Board and Chief Executive Officer
Martin S. Hughes President, Chief Financial Officer, and Co-Chief Operating Officer
Brett D. Nicholas Chief Investment Officer and Co-Chief Operating Officer
Harold F. Zagunis Chief Risk Officer and Managing Director
STOCK LISTING: The Company’s common stock is traded on the New York Stock Exchange under the symbol RWT
CORPORATE HEADQUARTERS: One Belvedere Place, Suite 300 Mill Valley, California 94941 Telephone: (415) 389-7373
NEW YORK OFFICE: 245 Park Avenue, 39th Floor New York, New York 10167 Telephone: (212) 792-4209
INVESTOR RELATIONS: Mike McMahon Managing Director Paula Kwok Assistant Vice President Investor Relations Hotline: (866) 269-4976 Email: investorrelations@redwoodtrust.com
GRAPHIC DESIGN: Emily Spoon | DIRECTORS:
George E. Bull, III Chairman of the Board and Chief Executive Officer
Richard D. Baum Former Chief Deputy Insurance Commissioner for the State of California
Thomas C. Brown COO, McGuire Real Estate and Principal Shareholder, Urban Bay Properties, Inc.
Mariann Byerwalter Chairman, JDN Corporate Advisory LLC
Douglas B. Hansen Private Investor
Greg H. Kubicek President, The Holt Group, Inc.
Jeffrey T. Pero Retired Partner, Latham & Watkins LLP
Georganne C. Proctor Executive Vice President Chief Financial Officer, and Chief Integration Officer, TIAA-CREF
Charles J. Toeniskoetter Chairman, Toeniskoetter & Breeding, Inc. Development Chairman & CEO, Toeniskoetter Construction, Inc.
David L. Tyler Private Investor
TRANSFER AGENT: Computershare 2 North LaSalle Street Chicago, IL 60602 Telephone: (888) 472-1955 |
For more information about Redwood Trust, please visit our website at: www.redwoodtrust.com