This Redwood Review contains forward-looking statements within the meaning of the safe harbor provisions of the Private Securities Litigation Reform Act of 1995. Forward-looking statements involve numerous risks and uncertainties. Our actual results may differ from our expectations, estimates, and projections and, consequently, you should not rely on these forward-looking statements as predictions of future events. Forward-looking statements are not historical in nature and can be identified by words such as “anticipate,” “estimate,” “will,” “should,” “expect,” “believe,” “intend,” “seek,” “plan,” and similar expressions or their negative forms, or by references to strategy, plans, or intentions. These forward-looking statements are subject to risks and uncertainties, including, among other things, those described in our Annual Report on Form 10-K for the year ended December 31, 2009 under the caption “Risk Factors.” Other risks, uncertainties, and factors that could cause actual results to differ materially from those projected are described below and may be described from time to time in reports we file with the Securities and Exchange Commission, including reports on Forms 10-K, 10-Q, and 8-K. We undertake no obligation to update or revise forward-looking statements, whether as a result of new information, future events, or otherwise.
Statements regarding the following subjects, among others, are forward-looking by their nature: (i) our belief that we are making progress toward our goal of revitalizing our residential and commercial real estate investment businesses and our beliefs regarding our competitive position and our ability to compete in the future; (ii) our belief that we will be able to deploy capital into investment opportunities over the next few quarters and other statements regarding our future investment strategy and our ability to find attractive investments and future trends relating to our pace of acquiring or selling assets, including, without limitation, statements relating to our efforts to acquire residential mortgage loans; (iii) our statements relating to completing a securitization transaction in the first quarter of 2011 and, more generally, regarding the likelihood and timing of, and our participation in, future securitization transactions and our ability to finance loan acquisitions through the execution of securitization transactions, (iv) our statements that we expect new Sequoia securitization entities to represent a larger portion of our balance sheet in the future, and our belief that progress in our residential and commercial real estate businesses will allow us to get fully and profitably invested; (v) our statements regarding our potential future investment activity in the commercial real estate sector, our expectation that we will fund additional commercial real estate loans in future quarters, and that the investment opportunity in commercial real estate loans could account for a significant portion of the capital we invest in 2011; (vi) our ability to access additional capital if needed, and our expectations regarding the future use of short-term debt financing, including through warehouse credit and repurchase facilities; (vii) statements relating to our estimate of our current excess capital and changes we may make in the amount of capital we allocate under our risk-adjusted capital policy; (viii) the future returns we may earn on our investment portfolio, including future trends in interest income and interest expense; (ix) future market and economic conditions, including, without limitation, future conditions in the residential and commercial real estate markets and related financing markets, and the related potential opportunities for our residential and commercial businesses; (x) the future competitiveness of our Sequoia securitization platform, including our belief that private sector investors will favor platforms such as the Sequoia platform due to, among other things, factors that differentiate our platform from those of competitors, and our beliefs regarding the willingness of private sector investors to invest in future private sector securitizations of residential mortgage loans, the conditions those investors would require before investing, and the amount of capital those investors might allocate to these types of investment opportunities; (xi) our belief that there will be a minimal impact on us from the issues that have been identified with respect to the integrity of loan servicers’ processes for handling foreclosures on residential borrowers, from the issues that have been raised relating to the documentation of transfers of residential mortgage debt and whether these transfers were legally effective, and from the renewed focus by investors on demanding that loan originators repurchase securitized residential mortgage loans based on alleged violations of representations and warranties; (xii) our belief that some of the senior securities previously issued through our Sequoia securitization platform may incur losses in the future, depending on the magnitude and timing of additional credit losses incurred on the underlying loans; (xiii) our beliefs about the future direction of housing market fundamentals, including, without limitation, home prices, demand for housing, delinquency rates, foreclosure rates, prepayment rates, inventory of homes for sale, and mortgage interest rates and their potential impact on our business and results of operations; (xiv) our beliefs about the future direction of commercial real estate fundamentals, including, without limitation, vacancy rates, rental rates, default rates, and availability of financing; (xv) the impact of recent and future legislative and regulatory changes that affect our business and the mortgage finance markets and the future of the status of the GSEs, including Fannie Mae and Freddie Mac, including our statement that we believe the GSEs role in mortgage finance will eventually diminish creating investment opportunities for us; (xvi) our expectations regarding future credit losses and impairments on our investments (including as compared to our original expectations and credit reserve levels) and the timing of those losses and impairments, our statement that the amount of credit reserves we designate may require changes in the future, and our belief that our current GAAP income statements are reflective
of our current underlying business trends; (xvii) the drivers of our future earnings, future earnings volatility, and future trends in operating expenses; (xviii) our board of directors’ intention to pay a regular dividend of $0.25 per share per quarter in 2010; (xix) that we do not anticipate raising additional capital in the near future or anticipate that Redwood will pay a special dividend; and (xx) our expectations relating to tax accounting, including our anticipation of additional losses for tax accounting purposes, that we currently anticipate reporting a taxable loss in 2010, and that we anticipate that all 2010 dividends will be characterized as a return of capital.
Important factors, among others, that may affect our actual results include: general economic trends, the performance of the housing, mortgage, credit, and broader financial markets, and their effects on the prices of earning assets and the credit status of borrowers; federal and state legislative and regulatory developments, and the actions of governmental authorities, including those affecting the mortgage industry or our business; our exposure to credit risk and the timing of credit losses within our portfolio; the concentration of the credit risks we are exposed to, including due to the structure of assets we hold and the geographical concentration of real estate underlying assets we own; our exposure to adjustable-rate and negative amortization mortgage loans; the efficacy and expense of our efforts to manage or hedge credit risk, interest rate risk, and other financial and operational risks; changes in credit ratings on assets we own and changes in the rating agencies’ credit rating methodologies; changes in interest rates; changes in mortgage prepayment rates; the availability of high-quality assets for purchase at attractive prices and our ability to reinvest cash we hold; changes in the values of assets we own; changes in liquidity in the market for real estate securities; our ability to finance the acquisition of real estate-related assets with short-term debt; the ability of counterparties to satisfy their obligations to us; our involvement in securitization transactions and the risks we are exposed to in executing securitization transactions; exposure to litigation arising from our involvement in securitization transactions; whether we have sufficient liquid assets to meet short-term needs; our ability to successfully compete and retain or attract key personnel; our ability to adapt our business model and strategies to changing circumstances; changes in our investment, financing, and hedging strategies and new risks we may be exposed to if we expand our business activities; exposure to environmental liabilities and the effects of global climate change; failure to comply with applicable laws and regulations; our failure to maintain appropriate internal controls over financial reporting and disclosure controls and procedures; changes in accounting principles and tax rules; our ability to maintain our status as a real estate investment trust (REIT) for tax purposes; limitations imposed on our business due to our REIT status and our status as exempt from registration under the Investment Company Act of 1940; decisions about raising, managing, and distributing capital; and other factors not presently identified.
This Redwood Review may contain statistics and other data that in some cases have been obtained from or compiled from information made available by servicers and other third-party service providers.
| THE REDWOOD REVIEW 3RD QUARTER 2010 | 3 |
 | |
| INTRODUCTION |
Note to Readers:
We file annual reports (on Form 10-K) and quarterly reports (on Form 10-Q) with the Securities and Exchange Commission. These filings and our earnings press releases provide information about Redwood and our financial results in accordance with generally accepted accounting principles (GAAP). We urge you to review these documents, which are available through our web site, www.redwoodtrust.com.
This document, called The Redwood Review, is an additional format for providing information about Redwood through a discussion of many GAAP as well as non-GAAP metrics, such as taxable income and economic book value. Supplemental information is also provided in the Financial Tables in this Review to facilitate more detailed understanding and analysis of Redwood. When we use non-GAAP metrics it is because we believe that these figures provide additional insight into Redwood’s business. In each case in which we discuss a non-GAAP metric, you will find an explanation of how it has been calculated, why we think the figure is important, and reconciliations between the GAAP and non-GAAP figures.
References herein to “Redwood,” the “company,” “we,” “us,” and “our” include Redwood Trust, Inc. and its consolidated subsidiaries. References to “at Redwood” exclude all consolidated securitization entities in order to present our operations in the way management analyzes them.
We hope you find this Review helpful to your understanding of our business. We thank you for your input and suggestions, which have resulted in our changing the form and content of The Redwood Review over time.
We welcome your continued interest and comments.
| | | | | | | |
| Selected Financial Highlights |
| | | | | | | |
| Quarter:Year | GAAP Income (Loss) per Share | Taxable Income (Loss) per Share(1) | Annualized Return on Equity | GAAP Book Value per Share | Non-GAAP Economic Value per Share (2) | Dividends per Share |
| Q308 | ($3.34) | $0.07 | (83%) | $12.40 | $13.18 | $0.75 |
| Q408 | ($3.46) | ($0.39) | (124%) | $9.02 | $11.10 | $0.75 |
| Q109 | ($0.65) | ($0.22) | (25%) | $8.40 | $10.01 | $0.25 |
| Q209 | $0.10 | ($0.16) | 5% | $10.35 | $11.30 | $0.25 |
| Q309 | $0.34 | ($0.30) | 13% | $11.68 | $12.28 | $0.25 |
| Q409 | $0.51 | ($0.44) | 17% | $12.50 | $13.03 | $0.25 |
| Q110 | $0.58 | $0.01 | 19% | $12.84 | $13.32 | $0.25 |
| Q210 | $0.35 | ($0.03) | 11% | $12.71 | $13.37 | $0.25 |
| Q310 | $0.25 | ($0.11) | 8% | $13.02 | $13.73 | $0.25 |
(1) Taxable income (loss) per share for 2010 are estimates until we file our tax return.
(2) Non-GAAP economic value per share is calculated using estimated bid-side values (which take into account available bid-side marks) for our financial assets and estimated offer-side values (which take into account available offer-side marks) for our financial liabilities and we believe it more accurately reflects liquidation value than does GAAP book value per share. Non-GAAP economic value per share is reconciled to GAAP book value per share in Table 4 in the Financial Tables in this Review.
| 4 | THE REDWOOD REVIEW 3RD QUARTER 2010 |
|  |
| SHAREHOLDER LETTER |
Dear Fellow Shareholders:
Overview
We remain tenacious and resolute as we plow forward toward our goal of revitalizing our residential and commercial investment franchises. Progress is slower than any of us would like, but we are making progress nonetheless. Our residential loan conduit is up and running and we are hopeful that we can complete our second securitization in the first quarter of 2011. On the commercial front — the team has come together, originated its first loan, and is seeing an increasing number of potential opportunities to invest at attractive yields. It will take some time, but we believe these two efforts will allow us to get fully and profitably invested.
We are keenly aware that in rebuilding our residential franchise, we are running smack into serious headwinds. Reform of the government-sponsored entities (GSEs) has not yet begun, major bank originators are reluctant to sell loans due to their high level of excess liquidity, and uncertainty abounds as the implementation of the Dodd-Frank Act proceeds, with intended and unintended consequences beginning to emerge.
Some have asked, “Why not wait until the residential road is paved and clear?” In our view, hoping and waiting is not a strategy.
We believe that waiting until the road is clear will cause us to lose a significant competitive opportunity. If we are right, the GSEs will eventually shrink, resulting in significant investment opportunities for companies like Redwood to act as an intermediary between residential borrowers and suppliers of private mortgage capital. Our goal has been to align ourselves early with originators and become the partner of choice for originators and triple-A investors, based on our consistent and reliable execution.
As an early and active participant with a proven track record, we believe that we have an important opportunity to help standardize and shape the new rules of the road that will govern private (non government-backed) mortgage securitization. For example, in sponsoring our April 2010 securitization, we added binding arbitration as a required and effective method to deal with possible representation and warranty violations. We have worked with prospective investors to understand their concerns and preferences and we are convinced that private mortgage securitization can flourish under the right rules or flounder if important fixes are not put in place.
Third Quarter Results
Our third quarter earnings contained few surprises. We reported $20 million in GAAP income, or $0.25 per fully diluted share. In the second quarter, we reported $29 million in GAAP income, or $0.35 per fully diluted share. The third quarter contained modest gains on sales of assets: $2 million — predominantly related to gains from calls on securities we owned below par. Gains are markedly lower than what was realized in the prior quarters of 2010. We benefited from $16 million in gains in the second quarter and from $44 million in gains in the first quarter. Net interest income in the third quarter was approximately equal to the second quarter’s level. Loan loss provisions and net negative valuation adjustments were improved from the levels reported in the second quarter. Operating expenses in the third quarter at $12 million were $1 million higher than the prior quarter, roughly in line with expectations.
| THE REDWOOD REVIEW 3RD QUARTER 2010 | 5 |
| |
| SHAREHOLDER LETTER |
Third Quarter Results (continued)
Redwood’s estimated taxable loss for the third quarter of 2010 was $9 million, or $0.11 per share, as compared to estimated taxable loss of $3 million, or $0.03 per share, for the second quarter of 2010. Credit losses are charged against taxable income when write-offs occur since one cannot build loan loss reserves for tax. The lag between when the reserve for losses is established in GAAP and when the loss is taken for tax creates a timing difference. Because of the backlog of unrecognized tax credit losses, we still expect significant credit charges to work their way through taxable income over the balance of 2010 and 2011.
We continue to expect to realize a taxable loss for 2010, which would result in the full year’s dividend being classified as a return of capital. We note, however, that it is difficult to precisely forecast quarter-by-quarter timing of credit losses, especially with the potential for foreclosure process delays. Therefore, it is possible that a relatively small portion of this year’s dividend distribution could be characterized as ordinary income if fourth quarter credit losses are substantially below third quarter levels.
Book value per share rose to $13.02 at September 30, 2010, a $0.31 increase from the $12.71 per share reported on June 30, 2010. This increase in book value primarily reflected net appreciation in our mortgage securities portfolio, as quarterly earnings of $0.25 per share matched our dividend of $0.25 per share.
Estimated non-GAAP economic book value per share rose to $13.73 at September 30, 2010 from $13.37 at June 30, 2010. The $0.36 per share increase in estimated economic book value reflected essentially the same factors that drove GAAP book value up: earnings that covered dividends plus an increase in net unrealized gains.
Commercial Loan Business
A year ago we began building a commercial team with the long- term objective of originating a portfolio of individual, high quality commercial real estate investments. We plan to selectively provide capital to established borrowers with successful track records on stabilized commercial real estate. Thanks in part to our efforts in building our platform and to general market trends, we are seeing a significant increase in the flow of opportunities to make targeted investments. We originated a mezzanine loan ($12 million) shortly after September 30. We expect to fund additional loans in the coming quarters and we believe the investment opportunity in commercial real estate could account for a significant portion of the capital we invest in 2011.
There is an estimated $1.4 trillion in commercial real estate debt (out of a total market of roughly $3 trillion) that will likely need to be financed over the next five years. In recent years, the largest suppliers of commercial real estate debt capital — commercial banks and CMBS lenders — have been absent. Recently, there has been a resurgence of interest in commercial lending, especially from CMBS lenders. However, given tighter prevailing underwriting standards, a decrease in capacity, and significantly less appetite for risk, we believe our commercial efforts are timely.
| 6 | THE REDWOOD REVIEW 3RD QUARTER 2010 |
| |
| SHAREHOLDER LETTER |
Commercial Loan Business (continued)
Our focus has been and continues to be squarely on stabilized commercial real estate properties, not distressed or transitional properties. While the demand for our targeted assets from both debt and equity investors continues to escalate, we believe we are well positioned given our experienced team’s long-standing relationships, our balance sheet, and our disciplined underwriting. We are excited about the opportunity to be an originator and capital provider for well-underwritten commercial loans throughout this cycle and throughout the eventual recovery.
Residential Mortgage Loan Business
We are open for business and purchasing mortgage loans, primarily on a flow basis, from a few originators, with the intent of financing those loans through securitization. We remain engaged in discussions with additional originators to purchase loans from them in the near future. As of October 31, we had purchased $160 million of residential mortgage loans, as compared with $5 million at July 31. As of October 31, we had commitments to purchase an additional $138 million in mortgage loans, compared with $149 million at July 31. We continue to target another securitization, likely in the first quarter of 2011, assuming market conditions are favorable and that the rating agency issues are resolved (as discussed below).
Our business is to act as a financial intermediary between prime residential mortgage borrowers and investors, largely in the jumbo sector. Our goal is to create subordinate investments we want to own. Our balance sheet is especially well positioned to hold the long-term, illiquid subordinate investments that are created. We are prepared to retain triple-A securities as well, until the form of required risk retention is determined. While our preference is to create our own investments, we have the option to acquire subordinate securities issued by other securitization sponsors, presuming those investments meet our risk / return criterion.
There are numerous headwinds confronting this business. As we mentioned earlier, the government continues to support over 90% of the residential mortgage market and banks are generally reluctant sellers of non-agency residential mortgages. Another headwind is that activity in the high-end home market is limited — partly related to uncertainty regarding home values.
One important regulatory issue is that the future role of rating agencies in securitizations is unclear. In the Dodd-Frank Act, increased liability was imposed on rating agencies for their ratings of publicly issued asset-backed securities (ABS). Some of the rating agencies responded by refusing to rate new ABS offerings, which then led the SEC to promulgate a 6-month solution, in order to avoid an immediate shut down of the ABS market. The temporary solution ends in late January 2011, at which point the public ABS market is likely to shut down unless an additional extension is granted or another solution is formulated that works for issuers and rating agencies.
Another important regulatory issue is that the form and amount of risk retention required of residential mortgage securitization sponsors has yet to be determined. We discuss this important topic in detail in our forthcoming report addressing what it takes to restore the private MBS market. (Please visit our website for a copy of this report.)
| THE REDWOOD REVIEW 3RD QUARTER 2010 | 7 |
| |
| SHAREHOLDER LETTER |
Despite these obstacles, we are encouraged by our competitive positioning. Further, there are a number of macro factors that make us optimistic about the future of our residential mortgage loan business. First, there is consensus among policy makers that the GSEs need to shrink. Second, bank capital requirements under Basel III are increasing, which will likely cause some increase in bank sales of residential mortgage loans over time. Third, as a non-bank, we believe Redwood is better positioned to partner with banks as a loan buyer and securitization sponsor (as compared with prospective bank partners). Fourth, Redwood is structuring its securitizations with triple-A investors in mind (including our holding first-loss risk even if not required by regulators), which we expect will differentiate our securitizations from others.
Residential Portfolio Business
Fixed-income investors have continued their race to the bottom for yields: the 10-year Treasury yield declined in the third quarter by 43 basis points and year-to-date by 132 basis points to 2.52% at September 30, 2010. Against this backdrop, our investment activity in seasoned non-agency RMBS remained subdued in the third quarter.
As we have noted in the past, the opportunity to acquire seasoned non-agency senior RMBS at extraordinary prices that began in late 2008 had largely run its course by mid-2009, with prices appreciating rapidly. Unleveraged base case yields for the older vintage RMBS declined from high teens in late 2008 to low teens by mid-year 2009, to mid-single digits currently.
During the third quarter, our investment portfolio increased by $63 million to $797 million at September 30, 2010. The increase was driven by $50 million in acquisitions and $34 million in price appreciation, only partly offset by $21 million in pay downs. We had no sales in the third quarter. In October, we acquired $16 million and had no sales of securities.
Mortgage Issues in the News
There are a number of mortgage-related issues in the news as a result of allegations and conjectures made by various and, at many times, competing stakeholders. Views on these issues are passionate and divergent and have been the source of much media attention. Simply put, it’s a mess.
As both an investor in and sponsor of residential mortgage securitizations, these are issues we and our shareholders need to understand. We offer our thoughts on these issues based on today’s facts and circumstances. Ultimately, because of the importance, scope, and complexity of the issues, it is difficult to make definitive statements about where the dust will settle. At this point, as we look at our investment portfolio and our position as a sponsor, we see a minimal impact on Redwood. For what it is worth, the fixed-income market’s reaction to the headlines has been fairly muted and prices for RMBS have generally held steady.
| 8 | THE REDWOOD REVIEW 3RD QUARTER 2010 |
| |
| SHAREHOLDER LETTER |
Mortgage Issues in the News (continued)
The first issue is the use of so called “robo-signers” and other process shortcuts taken by mortgage servicers to expedite foreclosures. Second, there are questions regarding the documentation and enforceability of legal assignments or transfers of residential mortgages and the related deeds of trust, with particular concerns when the receiving entity is a securitization trust. Third, there has been a renewed focus on repurchase requests or loan put-backs to originators and securitization sponsors for breaches of loan level representations and warranties.
With respect to servicers’ foreclosures practices, it is clear that there has been sloppiness on the part of some mortgage servicers, who have been operationally challenged to handle an unprecedented volume of foreclosures. In most cases, we don’t think the shortcuts will excuse borrower defaults. Servicers need to double-back, follow proper procedures, and make things right. To us, the issue boils down to one of time delays. We believe the consequence will primarily be additional cost and reputational damage to servicers, with relatively minimal additional losses to investors.
The questions regarding whether there are inherent flaws in how securitization trusts and other secondary purchasers took legal ownership of mortgage debt seem unlikely to us to result in the large-scale forgiveness or invalidation of mortgage liens, as some are predicting. Many of the theories that are being put forth contradict settled case law and long-established documentation practices. In addition, if these arguments do somehow gain traction, it seems unlikely that the federal government, which arguably has the largest exposure to this issue through the GSEs, will somehow stand by and simply let vast numbers of homeowners walk away from their debt obligations. Although there may be anecdotal instances of documentation problems that result in windfalls to individual homeowners, we do not believe that this is a significant issue for Redwood.
Finally, the renewed focus on loan put-backs — when loan investors demand that loan originators or securitization sponsors repurchase loans they claim have not performed because of faulty underwriting — is one we are familiar with as both an investor and a securitization sponsor. As a sponsor, our exposure to this issue is limited, as representations and warranty violations for loans within Sequoia securitizations would generally be a contingency to the company from whom we acquired the loans and covered by our recourse to those companies. Thus, we believe that the impact on Redwood as a sponsor will be minimal.
As an investor, we are cognizant of the difficulties in getting past the allegation stage and actually meeting the burden of proof necessary to compel a loan repurchase. In 2008, we spent a considerable sum to have lawyers research the legal hurdles and help us to analyze the costs and potential benefits of pursuing possible representation and warranty violations relating to loans underlying third-party securities that we had purchased. The economics led us to give up the pursuit. Loans that have gone delinquent because of declines in the borrowers’ creditworthiness are not likely going to be repurchased, as representations and warranties generally address the loan underwriting process rather than the impact of subsequent credit events, such as unemployment. Consequently, we believe the impact on our investments will be minimal.
| THE REDWOOD REVIEW 3RD QUARTER 2010 | 9 |
| |
| SHAREHOLDER LETTER |
Cash
We have carried a reasonable amount of excess cash in recent quarters — frustrated by low yields, but confident we would find investment opportunities in our residential and commercial loan businesses. In the third quarter, we used some of our excess cash to fund the acquisition of residential loans, which was a key reason our cash balance declined by roughly $100 million during the third quarter, to $189 million at September 30, 2010.
We intend to continue to use excess cash to fund the accumulation of loans prior to securitization. In addition, we will look to our senior RMBS portfolio and the residential loans themselves to provide a source of temporary liquidity for this purpose. We will continue to be prudent in our use of any borrowings. We do not anticipate raising additional capital in the near future and we do not anticipate paying a special dividend.
We believe we are well on our way to putting capital to work over the next few quarters as we build our residential and commercial franchises, even as we continue to be patient in our investment decisions. Under our risk-adjusted capital guidelines, we estimate that our investment capacity is $222 million at September 30, 2010, down slightly from $240 million at June 30, 2010.
Closing
We like our competitive positioning and we are confident that we are on the correct path. Building a strong franchise in accumulating prime quality, non government-guaranteed loans for future securitization makes sense. The government will not consistently back 90% to 95% of residential mortgages; taxpayers cannot afford this level of government involvement. Commercial real estate will also present opportunities for good investments with your money. We will keep our heads down, focus on execution, and clear roadblocks as best we can. We appreciate your continued support.
| |
| Martin S. Hughes | Brett D. Nicholas |
| President and | Executive Vice President, |
| Chief Investment Officer, and |
| | Chief Operating Officer |
| 10 | THE REDWOOD REVIEW 3RD QUARTER 2010 |
| The following table shows the components of our GAAP book value and management’s estimate of non-GAAP economic value at September 30, 2010. |
| | | | | | | | | |
| Components of Book Value* |
| September 30, 2010 |
| ($ in millions, except per share data) |
| | | | | | | Management's | |
| | | | | | | Estimate of | |
| | GAAP | | | | Non-GAAP | |
| | Book Value | Adj. | | Economic Value | |
| Cash and cash equivalents | $ | 189 | | | | $ | 189 | |
| | | | | | | | | |
| Real estate loans at Redwood | | 64 | | | | | 64 | |
| Real estate securities at Redwood | | | | | | | | |
| Residential | | 788 | | | | | 788 | |
| Commercial | | 8 | | | | | 8 | |
| CDO | | 1 | | | | | 1 | |
| Total real estate securities at Redwood | $ | 797 | | | | $ | 797 | |
| | | | | | | | | |
| Investments in the Fund | | 14 | | | | | 14 | |
| Investments in Sequoia | | 97 | | (19) | | | 78 | |
| Investments in Acacia | | 4 | | (3) | | | 1 | |
| Other assets | | 59 | | | | | 59 | |
| Total assets | $ | 1,224 | | | | $ | 1,202 | |
| | | | | | | | | |
| Long-term debt | | (140) | | 77 | | | (63) | |
| | | | | | | | | |
| Other liabilities | | (68) | | | | | (68) | |
| | | | | | | | | |
| Stockholders' equity | $ | 1,016 | | | | $ | 1,071 | |
| | | | | | | | | |
| Book value per share | $ | 13.02 | | | | $ | 13.73 | |
| During the third quarter of 2010 our GAAP book value increased by $0.31 per share to $13.02 per share. The increase resulted from $0.27 per share from earnings before market valuation adjustments, $0.42 per share of positive market valuation adjustments, plus $0.01 per share from equity issuance related to dividend reinvestment, less $0.14 per share of unrealized loss on cash flow hedges and $0.25 per share of dividends paid to shareholders. |
| During the third quarter our estimate of non-GAAP economic value increased by $0.36 per share to $13.73 per share. The net increase resulted from $0.69 per share from net cash flows and net positive market valuation adjustments on our securities and investments plus $0.01 per share from equity issuance related to dividend reinvestment, less $0.01 per share from valuation changes related to our long-term debt, $0.08 per share of cash operating and interest expense, and $0.25 per share of dividends paid to shareholders. |
| * | The components of book value table presents our assets and liabilities as calculated and reported under GAAP and as adjusted to reflect our estimate of economic value, a non-GAAP metric. We show our investments in the Redwood Opportunity Fund, L.P. (the Fund) and in Sequoia and Acacia securitization entities in separate line items, similar to the equity method of accounting, reflecting the reality that the underlying assets and liabilities owned by these entities are legally not ours. We own only the securities and interests that we have acquired from these entities. See page 15 for an explanation of the adjustments set forth in this table. |
| THE REDWOOD REVIEW 3RD QUARTER 2010 | 11 |
 | |
| FINANCIAL INSIGHTS |
Balance Sheet
| The following table shows the components of our balance sheet at September 30, 2010. |
| | | | | | | | | | | | | | | | |
| Consolidating Balance Sheet |
| September 30, 2010 |
| ($ in millions) |
| |
| | At Redwood | | 2010 Sequoia | | Other Consolidated Entities | | Intercompany | | Redwood Consolidated | |
| Real estate loans | $ | 64 | | $ | 193 | | $ | 3,495 | | $ | - | | $ | 3,752 | |
| Real estate securities | | 797 | | | - | | | 311 | | | - | | | 1,108 | |
| Investments in 2010 Sequoia | | 26 | | | - | | | - | | | (26) | | | - | |
| Investment in Other Consolidated Entities | | 89 | | | - | | | - | | | (89) | | | - | |
| Cash and cash equivalents | | 189 | | | - | | | - | | | - | | | 189 | |
| Total earning assets | | 1,165 | | | 193 | | | 3,806 | | | (115) | | | 5,049 | |
| | | | | | | | | | | | | | | | |
| Other assets | | 59 | | | 2 | | | 52 | | | - | | | 113 | |
| | | | | | | | | | | | | | | | |
| Total assets | $ | 1,224 | | $ | 195 | | $ | 3,858 | | $ | (115) | | $ | 5,162 | |
| Short-term debt | $ | - | | $ | - | | $ | - | | $ | - | | $ | - | |
| Other liabilities | | 68 | | | 1 | | | 94 | | | - | | | 163 | |
| Asset-backed securities issued | | - | | | 168 | | | 3,664 | | | - | | | 3,832 | |
| Long-term debt | | 140 | | | - | | | - | | | - | | | 140 | |
| Total liabilities | | 208 | | | 169 | | | 3,758 | | | - | | | 4,135 | |
| | | | | | | | | | | | | | | | |
| Stockholders’ equity | | 1,016 | | | 26 | | | 89 | | | (115) | | | 1,016 | |
| Noncontrolling interest | | - | | | - | | | 11 | | | - | | | 11 | |
| Total equity | | 1,016 | | | 26 | | | 100 | | | (115) | | | 1,027 | |
| | | | | | | | | | | | | | | | |
| Total liabilities and stockholders’ equity | $ | 1,224 | | $ | 195 | | $ | 3,858 | | $ | (115) | | $ | 5,162 | |
| We present this table to highlight the impact that consolidation has on our GAAP balance sheet. As shown, Redwood’s $115 million GAAP investment in the consolidated entities (including 2010 Sequoia) increased our consolidated assets by $4.0 billion and liabilities by $3.9 billion. |
| We are required under GAAP to consolidate all of the assets, liabilities, and noncontrolling interests of the Fund (due to our significant general and limited partnership interests in the Fund and ongoing asset management responsibilities), and certain Sequoia and Acacia securitization entities that are treated as secured borrowing transactions. However, the assets of these entities are not available to Redwood. Similarly, the liabilities of these entities are obligations payable only from the cash flow generated by their assets and are not obligations of Redwood. |
| The consolidating balance sheet presents the 2010 Sequoia securitization entity separately from all other consolidated entities to highlight our renewed focus on growing our core business of creating credit investments. As we complete additional securitizations, we expect new Sequoia securitization entities to represent a larger portion of our consolidated balance sheet. |
| 12 | THE REDWOOD REVIEW 3RD QUARTER 2010 |
Balance Sheet (continued)
| The following table presents the fair value (which equals GAAP carrying value) of real estate securities at Redwood at September 30, 2010. We segment our securities portfolio by vintage (the year(s) the securities were issued), priority of cash flow (senior, re-REMIC, and subordinate), and by quality of underlying loans (prime and non-prime securities) for residential. |
| | | | | | | | | | | | | | | | |
| Real Estate Securities at Redwood |
| September 30, 2010 |
| ($ in millions) |
| | | | | | | | | | | | | | | % of Total | |
| | | <=2004 | | 2005 | | 2006-2008 | | Total | | Securities | |
| | | | | | | | | | | | | | | | |
| Residential | | | | | | | | | | | | | | |
| Seniors | | | | | | | | | | | | | | |
| Prime | $ | 14 | | $ | 226 | | $ | 76 | | $ | 316 | | 40% | |
| Non-prime | | 117 | | | 228 | | | 9 | | | 354 | | 44% | |
| Total Seniors | $ | 131 | | $ | 454 | | $ | 85 | | $ | 670 | | 84% | |
| | | | | | | | | | | | | | | |
| Re-REMIC | | | | | | | | | | | | | | |
| Prime | $ | 5 | | $ | 11 | | $ | 59 | | $ | 75 | | 9% | |
| Total Re-REMIC | $ | 5 | | $ | 11 | | $ | 59 | | $ | 75 | | 9% | |
| | | | | | | | | | | | | | | |
| Subordinates | | | | | | | | | | | | | | |
| Prime | $ | 26 | | $ | 5 | | $ | 2 | | $ | 33 | | 4% | |
| Non-prime | | 10 | | | - | | | - | | | 10 | | 2% | |
| Total Subordinates | $ | 36 | | $ | 5 | | $ | 2 | | $ | 43 | | 6% | |
| | | | | | | | | | | | | | | | |
| Total Residential | $ | 172 | | $ | 470 | | $ | 146 | | $ | 788 | | 99% | |
| | | | | | | | | | | | | | | | |
| Commercial Subordinates | $ | 7 | | $ | 1 | | $ | - | | $ | 8 | | 1% | |
| CDO Subordinates | $ | - | | $ | 1 | | $ | - | | $ | 1 | | 0% | |
| | | | | | | | | | | | | | | | |
| Total Real Estate Securities | $ | 179 | | $ | 472 | | $ | 146 | | $ | 797 | | 100% | |
| THE REDWOOD REVIEW 3RD QUARTER 2010 | 13 |
| |
| FINANCIAL INSIGHTS |
Balance Sheet (continued)
Real Estate Securities (continued)
| The table below details the change in fair value of securities at Redwood during the third and second quarters of 2010. |
| | | | | | | |
| Real Estate Securities at Redwood |
| ($ in millions) |
| | | | | | | |
| | Three Months Ended | |
| | 9/30/10 | | 6/30/10 | |
| Beginning fair value | $ | 734 | | $ | 840 | |
| | | | | | | |
| Acquisitions | | 50 | | | 23 | |
| Sales | | - | | | (116) | |
| Effect of principal payments | | (21) | | | (27) | |
| Change in fair value, net | | 34 | | | 14 | |
| | | | | | | |
| Ending fair value | $ | 797 | | $ | 734 | |
| During the third quarter, the market value of our real estate securities increased by $63 million as acquisitions, and increases in fair value, exceeded the effect of principal payments, as itemized in the table above. |
| Our acquisitions in the third quarter included $10 million of prime senior securities, $33 million of non-prime senior securities, and $7 million of prime subordinate securities. Of the $50 million of securities acquired, $43 million were from 2005 and earlier vintages. |
| During October, we acquired $16 million of securities. We did not sell securities in October. |
| 14 | THE REDWOOD REVIEW 3RD QUARTER 2010 |
Balance Sheet (continued)
Investments in the Fund and the Securitization Entities
| Our investments in the Fund, Sequoia, and Acacia securitization entities, as reported for GAAP, totaled $115 million, or 11% of our equity at September 30, 2010. |
| The GAAP carrying value and the fair value of our investment in the Fund was $14 million. The Fund is primarily invested in non-prime residential securities and is managed by a subsidiary of Redwood. Our investment represents a 52% interest in the Fund. |
| The GAAP carrying value of our investments in Sequoia was $97 million and management’s estimate of the non-GAAP economic value of those investments was $78 million. We estimated the non-GAAP economic value for our investments, consisting of $44 million of IOs and $34 million of senior and subordinate securities, using the same valuation process that we follow to fair value our other real estate securities. For GAAP, we account for the assets and liabilities at historical cost and the net $97 million carrying value represents the difference between the carrying costs of the assets ($3.7 billion at September 30, 2010) and liabilities ($3.6 billion at September 30, 2010) owned by the Sequoia entities. |
| The GAAP carrying value of our investments in Acacia entities was $4 million and management’s estimate of the non-GAAP economic value of those investments was $1 million, which primarily reflects the present value of the management fees we expect to earn from these entities. The equity interests and securities we own in the Acacia entities have minimal value. |
| We had no short-term recourse debt at September 30, 2010. We continue to fund our investments with permanent capital (equity and long-term debt) that is not subject to margin calls or financial covenants. |
| We expect to utilize short-term debt to finance the acquisition of prime mortgage loans prior to securitizing those loans through our Sequoia program. We are currently using our excess cash to purchase mortgage loans. We plan to use existing repurchase facilities collateralized by our residential senior securities to facilitate the continued acquisition of loans prior to securitization. In addition, we are in discussions with various counterparties to re-establish warehouse facilities that will provide additional resources to accumulate loans. |
| At September 30, 2010, we had $140 million of long-term debt outstanding with a stated interest rate of LIBOR plus 225 basis points due in 2037. Earlier in 2010, through interest rate hedging arrangements, we effectively fixed the interest rate on this long-term debt at 6.75% (excluding issuance costs). We calculated the $63 million estimate of non-GAAP economic value of this long-term debt based on its stated interest rate using the same valuation process used to fair value our other financial assets and liabilities. As a result of declining interest rates in the third quarter, the fair value of the interest rate hedges related to this long-term debt declined by $11 million, and is reflected in shareholders’ equity on our balance sheet. |
| THE REDWOOD REVIEW 3RD QUARTER 2010 | 15 |
| |
| FINANCIAL INSIGHTS |
Balance Sheet (continued)
| At September 30, 2010, our total capital amounted to $1.1 billion, including $1.0 billion in shareholders’ equity and $140 million of long-term debt. We use our capital to invest in earning assets, meet lender capital requirements, and to fund our operations and working capital needs. |
| Our cash balance was $189 million at September 30, 2010. During the third quarter we used some of our excess cash to fund the acquisition of residential loans we are accumulating to securitize, which was the main reason our cash balance declined by roughly $100 million from the beginning of the quarter. |
| We intend to continue to use excess cash to fund the accumulation of loans prior to securitization. In addition, we will look to our senior RMBS portfolio and the residential loans themselves to provide a source of temporary liquidity through borrowing facilities for this purpose. |
| We manage our capital through our risk-adjusted capital policy which has served us well over the past few years of market turmoil. We have successfully managed through two tumultuous periods (1998 and 2008) and we remain thoughtful about the liquidity risk associated with short-term recourse debt. |
| Under our risk-adjusted capital guidelines, we estimate that our investment capacity is $222 million at September 30, 2010, down slightly from $240 million at June 30, 2010. |
| Over the past several years we generally allocated capital equal to 100% of the fair value of all our investments through our risk-adjusted capital policy. Now, with more stability in the funding markets and greater ability to access financing through a variety of counterparties, we may consider allocating less than 100% capital to some of the more liquid assets in our portfolio. |
| We believe we have sufficient access to cash to fund our acquisition of loans and have sufficient capital to fund our investment growth opportunities for the foreseeable future. |
| 16 | THE REDWOOD REVIEW 3RD QUARTER 2010 |
| The following table provides a summary of our consolidated GAAP income for the third and second quarters of 2010. |
| | | | | | | |
| GAAP Income |
| ($ in millions, except per share data) |
| | Three Months Ended | |
| | 9/30/10 | | 6/30/10 | |
| Interest income | $ | 59 | | $ | 56 | |
| Interest expense | | (24) | | | (21) | |
| Net interest income | | 35 | | | 35 | |
| | | | | | | |
| Provision for loan losses | | (2) | | | (4) | |
| Market valuation adjustments, net | | (2) | | | (7) | |
| Net interest income after provision and market valuation adjustments | | 31 | | | 24 | |
| | | | | | | |
| Operating expenses | | (12) | | | (11) | |
| Realized gains on sales and calls, net | | 2 | | | 16 | |
| Noncontrolling interest | | (1) | | | - | |
| Benefit from (provision for) income taxes | | - | | | - | |
| | | | | | | |
| GAAP income | $ | 20 | | $ | 29 | |
| | | | | | | |
| GAAP income per share | $ | 0.25 | | $ | 0.35 | |
| Our consolidated GAAP income for the third quarter of 2010 was $20 million, or $0.25 per share, as compared to $29 million, or $0.35 per share, for the second quarter of 2010. The decrease in income is the result of lower gains, partially offset by lower negative market valuation adjustments. We had minimal gains from the sale of les than $1 million of securities in the third quarter (but did generate gains of $2 million from securities called from us), compared to gains of $16 million on sales of $100 million in the second quarter. |
| THE REDWOOD REVIEW 3RD QUARTER 2010 | 17 |
| |
| FINANCIAL INSIGHTS |
GAAP Income (continued)
Summary (continued)
| The following tables show the estimated effect that Redwood, our recent Sequoia securitization, and our other consolidated entities had on GAAP income for the third quarter of 2010 and the second quarter of 2010. These components of our income statement are not separate business segments. |
| | | | | | | | | | | | | | | | |
| Consolidating Income Statement |
| Three Months Ended September 30, 2010 |
| ($ in millions) |
| | | | | | | | | | | | | | | | |
| | At Redwood | | 2010 Sequoia | | Other Consolidated Entities | | Intercompany Adjustments | | Redwood Consolidated | |
| Interest income | $ | 17 | | $ | 2 | | $ | 30 | | $ | - | | $ | 49 | |
| Net discount (premium) amortization | | 10 | | | - | | | - | | | - | | | 10 | |
| Total interest income | | 27 | | | 2 | | | 30 | | | - | | | 59 | |
| | | | | | | | | | | | | | | | |
| Interest expense | | (3) | | | (1) | | | (20) | | | - | | | (24) | |
| Net interest income | | 24 | | | 1 | | | 10 | | | - | | | 35 | |
| | | | | | | | | | | | | | | | |
| Provision for loan losses | | - | | | - | | | (2) | | | - | | | (2) | |
| Market valuation adjustments, net | | - | | | - | | | (2) | | | - | | | (2) | |
| Net interest income after provision and market valuation adjustments | 24 | | | 1 | | | 6 | | | - | | | 31 | |
| | | | | | | | | | | | | | | | |
| Operating expenses | | (12) | | | - | | | - | | | - | | | (12) | |
| Realized gains on sales and calls, net | | 2 | | | - | | | - | | | - | | | 2 | |
| Income from 2010 Sequoia | | 1 | | | - | | | - | | | (1) | | | - | |
| Income from Other Consolidated Entities | | 5 | | | - | | | - | | | (5) | | | - | |
| Noncontrolling interest | | - | | | - | | | (1) | | | - | | | (1) | |
| Provision for income taxes | | - | | | - | | | - | | | - | | | - | |
| | | | | | | | | | | | | | | | |
| Net income | $ | 20 | | $ | 1 | | $ | 5 | | $ | (6) | | $ | 20 | |
| | | | | | | | | | | | | | | | |
| Consolidating Income Statement |
| Three Months Ended June 30, 2010 |
| ($ in millions) |
| | | | | | | | | | | | | | | | |
| | At Redwood | | 2010 Sequoia | | Other Consolidated Entities | | Intercompany Adjustments | | Redwood Consolidated | |
| Interest income | $ | 16 | | $ | 1 | | $ | 30 | | $ | - | | $ | 47 | |
| Net discount (premium) amortization | | 10 | | | - | | | (1) | | | - | | | 9 | |
| Total interest income | | 26 | | | 1 | | | 29 | | | - | | | 56 | |
| | | | | | | | | | | | | | | | |
| Interest expense | | (2) | | | (1) | | | (18) | | | - | | | (21) | |
| Net interest income | | 24 | | | - | | | 11 | | | - | | | 35 | |
| | | | | | | | | | | | | | | | |
| Provision for loan losses | | - | | | - | | | (4) | | | - | | | (4) | |
| Market valuation adjustments, net | | (4) | | | - | | | (3) | | | - | | | (7) | |
| Net interest income after provision and market valuation adjustments | 20 | | | - | | | 4 | | | - | | | 24 | |
| | | | | | | | | | | | | | | | |
| Operating expenses | | (11) | | | - | | | - | | | - | | | (11) | |
| Realized gains on sales and calls, net | | 16 | | | - | | | - | | | - | | | 16 | |
| Income from 2010 Sequoia | | - | | | - | | | - | | | - | | | - | |
| Income from Other Consolidated Entities | | 4 | | | - | | | - | | | (4) | | | - | |
| Noncontrolling interest | | - | | | - | | | - | | | - | | | - | |
| Provision for income taxes | | - | | | - | | | - | | | - | | | - | |
| | | | | | | | | | | | | | | | |
| Net income | $ | 29 | | $ | - | | $ | 4 | | $ | (4) | | $ | 29 | |
| 18 | THE REDWOOD REVIEW 3RD QUARTER 2010 |
At Redwood — Net Interest Income after MVA
| Net interest income after market value adjustments at Redwood increased to $24 million in the third quarter from $20 million in the second quarter as net interest income was flat and negative MVA decreased by $4 million. |
| In the near term, we continue to expect interest income to be driven by our residential securities, which accounted for the majority of total interest income generated at Redwood during the third quarter. While interest income on these securities increased $1 million to $23 million during the third quarter, the effective yield decreased by 1% as our average amortized cost basis increased as a result of acquisitions during the quarter. |
| Senior residential securities account for the majority of total interest income from residential securities and we expect yields on existing securities to remain relatively stable over time. Primary factors that cause volatility in income recognition include changes in prepayment rates, credit losses, and interest rates. |
| Interest expense was $3 million in the third quarter of 2010, a $1 million increase from the prior quarter. This increase was primarily attributable to interest rate agreements used to fix the interest expense of our long-term floating rate debt. As of the end of the third quarter, the interest expense of our long-term debt is fully fixed through interest rate swaps and we anticipate our periodic expense yield to remain stable. |
| The following table presents the components of Redwood’s market valuation adjustments. |
| | | | | | | |
| Market Valuation Adjustments at Redwood |
| ($ in millions) |
| | Three Months Ended | |
| | 9/30/10 | | 6/30/10 | |
| Trading securities | $ | 5 | | $ | 2 | |
| Impairment on AFS securities | | (2) | | | (4) | |
| Derivatives | | (3) | | | (2) | |
| | | | | | | |
| Total Market Valuation Adjustments | $ | - | | $ | (4) | |
| Net negative market valuation adjustments were minimal in the third quarter, a $4 million improvement from the prior quarter. This improvement was primarily a result of increased valuations on certain residential securities that we mark-to-market each quarter through the income statement, as well as a decrease in impairments on available-for-sale securities of $2 million from the prior quarter. Offsetting these improvements was a $1 million increase in negative market valuation adjustments related to derivative financial instruments. We continue to increase our use of derivatives to manage certain risks associated with our accumulation of residential loans as part of our residential loan business. |
| THE REDWOOD REVIEW 3RD QUARTER 2010 | 19 |
| |
| FINANCIAL INSIGHTS |
At Redwood — Realized Gains and Operating Expenses
| During the third quarter of 2010 there were no sales of securities and $2 million of gains on called securities. When a security we own is called we receive a cash payment equal to the outstanding principal and, to the extent this is above our carrying value, a gain is realized. Sales of securities generated gains of $16 million (and generated total proceeds of $116 million) for the second quarter of 2010. |
| The following table presents the components of Redwood’s operating expenses. |
| | | | | | | |
| Operating Expenses at Redwood |
| ($ in millions) |
| | Three Months Ended | |
| | 9/30/10 | | 6/30/10 | |
| Fixed compensation expense | $ | 3 | | $ | 4 | |
| Variable compensation expense | | 2 | | | 1 | |
| Equity compensation expense | | 2 | | | 2 | |
| Total compensation expense | $ | 7 | | $ | 7 | |
| | | | | | | |
| Systems | | 2 | | | 2 | |
| Office costs | | 2 | | | 2 | |
| Accounting and legal | | 1 | | | - | |
| Total non-compensation expense | $ | 5 | | $ | 4 | |
| | | | | | | |
| Total Operating Expense | $ | 12 | | $ | 11 | |
| Operating expenses at Redwood were $12 million during the third quarter, up $1 million from the second quarter, and remained in line with our expectations. |
Other Consolidated Entities
| We recognized net income of $5 million in the third quarter from our investments in the Fund, Sequoia, and Acacia securitization entities, an increase of $1 million from the second quarter. This increase was due to a lower provision for loan losses and lower negative market valuation adjustments. |
| Net interest income declined from the second quarter by $1 million to $10 million. |
| The provision for loan losses for Sequoia entities totaled $2 million in the third quarter, a decrease of $2 million from the second quarter of 2010. Excluding the Sequoia 2010 securitization (which has no delinquencies) serious delinquencies (90+ days past due) declined to 3.75% in the third quarter from 4.04% at the end of the second quarter as more loans were liquidated than transitioned to serious delinquency status. The allowance for loan losses as a percent of serious delinquencies increased to 45% at the end of the third quarter, from 42% at the end of the second quarter. There are currently four Sequoia entities for which we have expensed aggregate loan loss provisions of $2 million in excess of our reported investment for GAAP purposes. At this time we do not expect to deconsolidate any Sequoia entities in 2010. |
| Market valuation adjustments were negative $2 million in the third quarter, an improvement $1 million from the second quarter. This improvement was primarily a result of lower other-than-temporary impairments at the Fund. |
| 20 | THE REDWOOD REVIEW 3RD QUARTER 2010 |
Taxable Income and Dividends
As a REIT, Redwood is required to distribute at least 90% of its REIT taxable income (and meet certain other requirements), although Redwood’s board of directors can declare dividends in excess of this minimum requirement. REIT taxable income is defined as income as calculated for tax accounting that is earned by Redwood Trust, Inc. and its qualified REIT subsidiaries. Redwood also earns taxable income at its taxable subsidiaries which it is not required to distribute. To the extent Redwood retains REIT taxable income that is not distributed to shareholders, it is taxed at corporate tax rates. A reconciliation of GAAP and taxable income is set forth in Table 2 in the Financial Tables in this Review.
| Redwood’s estimated taxable loss for the third quarter of 2010 was $9 million, or $0.11 per share, as compared to estimated taxable loss of $3 million, or $0.03 per share, for the second quarter of 2010. (Reconciliations of GAAP and tax income are shown in Table 2 in the Financial Tables in this Review.) |
| Credit losses continue to be the significant driver of our taxable results and account for the majority of the difference between GAAP and taxable income. In the third and second quarters, credit losses as calculated for tax purposes totaled $31 million and $24 million, respectively. Under GAAP, these credit losses were charged against our previously established credit reserves. |
| We continue to expect to realize a taxable loss for the full year in 2010. However, the timing of credit losses on securities we own has a large impact on our quarterly taxable income. We anticipate an additional $201 million of losses on securities in future periods for tax purposes; for GAAP purposes, as noted above, we have already established credit reserves for these anticipated losses. |
| We currently expect a REIT taxable loss in 2010, and thus anticipate that this year’s dividend distributions will be characterized as return of capital. However, if fourth quarter credit losses are sufficiently delayed, then a portion of this year’s dividend distributions could be characterized as ordinary income. Through the third quarter of 2010, estimated REIT taxable income was $4 million. |
| On September 9, 2010, our board of directors declared a regular dividend of $0.25 per share for the third quarter, which was paid on October 21, 2010 to shareholders of record on September 30, 2010. This is consistent with the board of directors’ announcement in November 2009 that it intended to declare and pay quarterly regular dividends at this rate throughout 2010. |
| THE REDWOOD REVIEW 3RD QUARTER 2010 | 21 |
| |
| FINANCIAL INSIGHTS |
| In the third quarter, our cash flow remained in line with our expectations. We ended the third quarter with $189 million of cash, down from $288 million at the end of the prior quarter, reflecting the acquisition of securities and loans. |
| We believe our current GAAP income statements are reflective of our current underlying business trends, especially given the nature of the assets we currently hold. We also consider cash flow one of a number of important operating metrics; however, we realize that quarterly cash flow measures have limitations. In particular, we note: |
| • | When securities are purchased at large discounts from face value it is difficult to determine what portion of the cash received is a return “of” principal and what portion is a return “on” principal. It is only at the end of an asset’s life that we can accurately determine what portion of the cumulative cash received (whether principal or interest) was income and what was a return of capital. |
| • | Certain investments may generate cash flow in a quarter that is not necessarily reflective of the long-term economic yield we will earn on the investments. For example, we acquired certain re-REMIC support securities at prices that we believe will produce attractive yields. Due to their terms, however, these securities are locked out of receiving any principal payments for years. Because of the deferred receipt of principal payments, formulating any conclusions on the value or performance of these securities by looking solely at the early quarterly cash flow may not be indicative of economic returns. |
| • | Cash flow from securities and investments can be volatile from quarter to quarter depending on the level of invested capital, the timing of credit losses, acquisitions, sales, and changes in prepayments and interest rates. |
| • | We may use excess cash to acquire assets and not borrow against our securities and loans even when financing is available. As a result, our cash balances will likely not reflect the amount of cash we could have available through borrowing to invest in new opportunities. |
| 22 | THE REDWOOD REVIEW 3RD QUARTER 2010 |
| The sources and uses of cash in the table below are derived from our GAAP Consolidated Statement of Cash Flow for the third and second quarters of 2010 by aggregating and netting all items in a manner consistent with the way management analyzes them. This table excludes the gross cash flow generated by our Sequoia and Acacia securitization entities and the Fund (cash flow that is not available to Redwood), but does include the cash flow distributed to Redwood as a result of our investments in these entities. The beginning and ending cash balances presented in the table below are GAAP amounts. |
| | | | | | | |
| Redwood |
| Sources and Uses of Cash |
| ($ in millions) |
| | Three Months Ended | |
| | 9/30/10 | | 6/30/10 | |
| | | | | | | |
| Beginning cash balance | $ | 288 | | $ | 242 | |
| Sources of cash | | | | | | |
| Securities at Redwood - principal and interest | | | | | | |
| Residential senior | | 36 | | | 42 | |
| Residential Re-REMIC | | 2 | | | 2 | |
| Residential subordinate | | 9 | | | 8 | |
| Commercial and CDO | | 2 | | | 1 | |
| Securities at Redwood - sales | | - | | | 116 | |
| Investments in Consolidated Entities | | 11 | | | 8 | |
| Total sources of cash | | 60 | | | 177 | |
| | | | | | | |
| Uses of cash | | | | | | |
| Acquisitions of loans | | (62) | | | - | |
| Acquisitions of securities | | (48) | | | (55) | |
| Investment in 2010 Sequoia | | - | | | (28) | |
| Cash operating expenses | | (9) | | | (10) | |
| Interest expense on long-term debt | | (2) | | | (1) | |
| Derivative margin posted | | (17) | | | (20) | |
| Dividends | | (20) | | | (20) | |
| Changes in working capital | | (1) | | | 3 | |
| Total uses of cash | | (159) | | | (131) | |
| | | | | | | |
| Net (uses) sources of cash | $ | (99) | | $ | 46 | |
| Ending cash balance | $ | 189 | | $ | 288 | |
| |
| (1)Total acquisitions in the third quarter of 2010 were $50 million, $3 million which are not reflected in this table because they did not settle until early October. Also, $1 million of acquisitions made in the second quarter that did not settle until early July are reflected in this table. |
| As shown in the table above, total sources of cash were $60 million for the third quarter of 2010, compared to $177 million in the second quarter, due primarily to a substantial reduction in sales of securities. There were no sales of securities in the third quarter, compared to $116 million in second quarter. |
| Cash flow excluding proceeds from sales totaled $60 million in the third quarter, compared to $61 million in the prior quarter, and continued to exceed the sum of cash operating expenses, interest, and dividends. |
| THE REDWOOD REVIEW 3RD QUARTER 2010 | 23 |
 | |
| RESIDENTIAL MORTGAGE LOAN BUSINESS |
Summary
We purchase newly originated loans (primarily prime jumbo loans) that meet our collateral criteria from approved lenders on a flow or bulk basis. Loans acquired through this process (our “conduit”) are expected to be securitized through new Sequoia securitization entities. Our conduit allows lenders to reduce their exposure to credit risk associated with residential mortgage loans, free up capital for additional lending, and potentially reduce hedging costs as a result of our price commitments.
Quarterly Update
| At September 30, 2010, the pipeline of residential mortgage loans we plan to purchase through our conduit totaled $219 million, up from $154 million at June 30, 2010. At September 30, 2010, loans purchased and held on our balance sheet for future securitization totaled $62 million. At October 31, 2010, the pipeline totaled $138 million and loans purchased and held on our balance sheet for future securitization totaled $160 million. |
| We are encouraged by our progress and contemplate executing another Sequoia securitization once we acquire approximately $300 million of loans, which is now targeted for the first quarter of 2011, assuming favorable market and regulatory conditions. |
| Over time, our goal is to establish our conduit as the leading source of liquidity for the prime jumbo mortgage market, where originators are able to obtain timely purchase commitment decisions and price protection. |
| The size of the jumbo market is potentially vast — suggesting an opportunity that well exceeds our current capital available to invest. For example, if annual residential mortgage originations return to $1.3 trillion (one-third of the peak level in 2003) and jumbo loans account for 20%, jumbo loan originations would amount to $260 billion. If 30% of these loans were securitized and Redwood were to credit enhance 10%, or $7.8 billion, our annual investment would be approximately $270 million, assuming we retained only the subordinate securities (at market prices) equal to 5% of the securitizations. |
| The temporary GSE conforming loan limit for high cost areas of $729,750, which was established during the financial crisis, was recently extended until September 20, 2011, as a result of policymaker concerns about the capacity of the private market to fund non-government backed mortgage loans. Without the extension, the maximum conforming loan limit would have declined to $625,500 in January. Inside Mortgage Finance estimates the extension will facilitate the funding of between $25 billion to $30 billion of loans by the GSEs. |
| Although policymakers remain unconvinced about the private sector’s capacity or willingness to fund non-government backed mortgage loans, we believe that the private sector is, in fact, willing to provide this funding and we estimate that, at September 30, 2010, Redwood alone had the immediate capacity to provide through securitization first-loss credit support for approximately $6 billion of securitized prime residential mortgage loans assuming retention of the subordinated securities equal to 5% of the securitizations. Furthermore, it is Redwood’s intention to provide credit support for even more loans over time, and we believe we could access additional capital that would be needed to do so. |
| 24 | THE REDWOOD REVIEW 3RD QUARTER 2010 |
| |
| INVESTMENTIN 2010 SEQUOIA |
Summary
This new module reflects our investment in Sequoia securitization entities created in 2010. Sequoia securitization entities are entities that acquire residential mortgage loans through our conduit and issue asset-backed securities (ABS) backed by these loans. Generally, the loans that 2010 Sequoia entities have acquired are prime-quality loans. Most of the senior or investment-grade rated ABS issued by 2010 Sequoia entities have been sold to third-party investors; Redwood has retained 5% of the triple-A securities the subordinate or non-investment grade securities and the interest-only securities (IOs).
| In the third quarter, the first full quarter of reporting for the 2010 Sequoia securitization transaction we sponsored in April 2010, we reported GAAP income of $1 million from interest on our investments, and our investments in this securitization entity generated cash of $2 million. |
| At September 30, 2010, our investment in our 2010 Sequoia securitization totaled $26 million. Our investment consists of senior and subordinate securities and IOs. |
| There were no delinquencies in the loans underlying our 2010 Sequoia securitization at September 30, 2010. |
| Prepayments on this pool of loans have been high (nearly 40% CPR from inception through September 30, 2010) due to both a decline in mortgage rates and the borrowers’ ability to refinance — a reflection of the creditworthiness of many of these borrowers and their equity in the underlying properties. |
| For GAAP purposes, we account for this Sequoia securitization as a financing and the assets and liabilities are carried on our balance sheet at their amortized cost. As a result, our $26 million investment in 2010 Sequoia does not appear on our GAAP consolidated balance sheet as an investment; rather, it is reflected as the difference, at September 30, 2010, between the $195 million of consolidated assets of 2010 Sequoia and the $169 million of consolidated ABS issued to third parties. |
| THE REDWOOD REVIEW 3RD QUARTER 2010 | 25 |
 | |
| RESIDENTIAL REAL ESTATE SECURITIES |
Summary
Redwood invests in securities that are backed by pools of residential real estate loans. Some of our investments in residential real estate securities are backed by prime residential loans, while others are backed by non-prime loans such as Alt-A loans. The following discussion refers only to the residential securities owned by Redwood, exclusive of its investments in the Fund, and the Sequoia and Acacia entities.
Market Conditions and Portfolio Activity
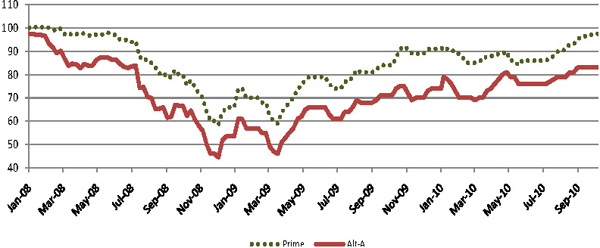
| Prices for non-agency RMBS continued to move higher during the third quarter as buyers out numbered sellers. Across all fixed income sectors, asset managers of every type (banks, insurance companies, hedge funds, money managers) continue to be challenged to find places to deploy cash. Prices ended the quarter up several points, particularly for longer duration fixed-rate assets, which benefitted from the rally in the Treasury market. |
| Senior RMBS Prices |
| |
|
| |
| Source: JP Morgan |
| As discussed earlier in our shareholder letter, the uncertainty surrounding foreclosure timelines has not impacted prices of non-agency RMBS, but we are monitoring developments surrounding the foreclosure controversy closely. |
| 26 | THE REDWOOD REVIEW 3RD QUARTER 2010 |
| |
| RESIDENTIAL REAL ESTATE SECURITIES |
Housing Activity
| House sales activity slowed considerably in the third quarter — the National Association of Realtors (NAR) reported that the pace of existing home sales was down 20% since the homebuyer tax credit expired in May. It appears that the tax credit pulled forward a significant amount of housing demand into the first half of the year, at the expense of the second half. However, sales have increased in August and September since the initial drop in July, suggesting that this may have been a one-time event and not the beginning of a new downward trend. |
| House inventories have stabilized after rising almost 18% in the first half of the year. NAR reported existing home inventories of 4 million units in September, only 4% higher than June 2010. Many analysts have focused on the 20% jump in “months supply” (inventory divided by monthly sales) over this period, but that was almost entirely a consequence of reduced sales after the tax credit expired, not increased inventories. Nevertheless, oversupply remains a primary obstacle to a housing market recovery. |
| On average, we expect an additional 5-8% decline in the value of currently securitized non-agency collateral over the next 6 -12 months, with significant geographic variation. We also expect a prolonged trough at that level before home prices return to an upwards trajectory. |
Delinquencies
| Delinquency trends are generally stable to improving slightly, but are at elevated levels. According to LoanPerformance, serious (60+ day) delinquencies rose by 0.4% quarter over quarter to 10.4% for prime loans and fell 0.61% quarter over quarter to 32.6% for Alt-A loans. We caution that some of the improvement is related to loan modifications. The delinquencies on loans underlying Redwood’s portfolio are modestly lower than the industry as a whole. |
| Early-stage roll rates (from loans always current to 30 days delinquent) continue to improve for both prime and Alt-A collateral. Only 0.6% of previously ‘always current’ prime loans missed their first payment in September, down from 0.9% in January, while the same metric for Alt-A loans fell to 1.4% from 2.1% over the same period. Over time, a drop in this roll rate will cause overall delinquencies to fall, but for now the slowdown in new delinquencies is being balanced out by an extension in liquidation timelines. |
Prepayments
| Prepayments remain elevated for borrowers with equity in their homes and good credit, and very low for all others. Prime borrowers with loan-to-value (LTV) ratios below 100% prepaid at 22% CPR in September (up from 16% in June), while Alt-A borrowers with equity in their homes only prepaid at 9% CPR (up from 7%). This suggests that tight underwriting continues to be an impediment to refinancing activity. Borrowers without equity prepaid very slowly regardless of credit quality, with prime and Alt-A loans with LTV ratios above 100% ratios prepaying at only 6% and 2% CPR, respectively. |
| THE REDWOOD REVIEW 3RD QUARTER 2010 | 27 |
| |
| RESIDENTIAL REAL ESTATE SECURITIES |
Quarterly Update
| Interest income generated by residential AFS securities we own was $24 million in the third quarter of 2010, an annualized yield of 13.3% on the amortized cost of these securities. |
| At September 30, 2010, the fair value of residential securities we own totaled $788 million, consisting of $316 million in prime senior securities, $354 million in non-prime senior securities, $75 million in re-REMIC securities, and $43 million in subordinate securities. Each of these categories is further discussed below. |
| The securities we held at September 30, 2010, consisted of fixed-rate assets (39%), adjustable-rate assets that reset within the next year (42%), hybrid assets that reset between 12 and 36 months from now (5%), and hybrid assets that reset more than 36 months from now (14%). |
| 28 | THE REDWOOD REVIEW 3RD QUARTER 2010 |
| |
| RESIDENTIAL REAL ESTATE SECURITIES |
Residential Prime Senior Securities Portfolio
What is this?
Residential prime securities are mortgage-backed securities generally backed by prime residential mortgage loans. Senior securities are those interests in a securitization that generally have the first right to cash flows and are generally last in line to absorb losses. Information on prime senior securities we own and underlying loan characteristics are set forth in Tables 6 through 9A in the Financial Tables in this Review.
Quarterly Update
| The following table presents information on residential prime senior securities at Redwood at September 30, 2010. For GAAP, we account for all of these securities as available-for-sale. |
| | | | | | | | | | | | | | | | |
| Credit Support Analysis - Prime Senior Securities at Redwood |
| By Vintage |
| September 30, 2010 |
| | | | | | | | | | | | | | | | |
| | | | | | | | | | | | | | | | |
| | <=2004 | | 2005 | | 2006 | | 2007 | | Total | |
| | | | | | | | | | | | | | | | |
| Current face | $ | 16 | | $ | 265 | | $ | 13 | | $ | 75 | | $ | 369 | |
| Net unamortized discount | | (3) | | | (66) | | | (4) | | | (16) | | | (89) | |
| Credit reserve | | - | | | (9) | | | - | | | (4) | | | (13) | |
| Unrealized gains | | 1 | | | 37 | | | 1 | | | 11 | | | 50 | |
| | | | | | | | | | | | | | | | |
| Fair value of prime senior securities | $ | 14 | | $ | 227 | | $ | 10 | | $ | 66 | | $ | 317 | |
| | | | | | | | | | | | | | | | |
Overall credit support to prime senior securities (1) | | 11.84% | | | 7.29% | | | 5.23% | | | 9.38% | | | 8.11% | |
Serious delinquencies as a % of collateral balance (1) | | 9.99% | | | 6.80% | | | 9.53% | | | 7.45% | | | 7.38% | |
(1) Overall credit support and serious delinquency rates are weighted by securitization balances. Credit support and delinquencies may vary significantly by securitization. Serious delinquencies include loans over 90-days past due, in foreclosure, and REO.
| The overall credit support data presented in the table above represents the level of support for prime securities owned by Redwood weighted by the securitization, or underlying collateral, balance rather than the book value or market value of the securities. We present a similar table for our non-prime securities on page 31. |
| At September 30, 2010, the average overall level of credit support was 8.11%. For an individual security with this level of credit support, this would mean that losses experienced on the collateral would have to exceed 8.11% before the security would suffer losses. Comparing the level of credit support available to seriously delinquent loans provides one measure of the level of credit sensitivity that exists within our senior securities portfolio. For example, assuming an individual bond has the average characteristics of the portfolio, 8.11% of credit support and serious delinquencies of 7.38%, all of the seriously delinquent loans could be liquidated with a 50% severity, generating losses of 3.69%. The security would then have 4.42% credit support remaining to absorb future losses, before the senior securities would start to absorb losses. |
| THE REDWOOD REVIEW 3RD QUARTER 2010 | 29 |
| |
| RESIDENTIAL REAL ESTATE SECURITIES |
Residential Prime Senior Securities Portfolio (continued)
Quarterly Update (continued)
| We would emphasize that no individual security has the average characteristics of the portfolio. Individual securities may have more or less credit support than the average, or more or less seriously delinquent loans than the average. As such, certain securities have a more positive credit enhancement to serious delinquency ratio while others have a less positive or negative ratio. As a result, it is possible for some securities to incur losses without aggregate losses exceeding the overall credit support. For example, in the first quarter of 2010, we incurred credit losses of $2 million for GAAP purposes on senior securities, even though aggregate losses did not exceed our overall credit support. (There were no credit losses on our prime senior securities in either the third or second quarters of 2010.) |
| Securities are acquired assuming a range of outcomes based on modeling of expected performance at the individual loan level for both delinquent and current loans. Over time, the performance of these securities may require a change in the amount of credit reserves we designate. |
| The fair market value of our prime senior securities was equal to 86% of the face value of the portfolio, while our amortized cost was equal to 72% of the face value at September 30, 2010. These securities generated $19 million of cash from principal and interest in the third quarter compared to $20 million in the second quarter, excluding proceeds from sales. The annualized yield in the third quarter for our prime senior securities was 11.3% |
| 30 | THE REDWOOD REVIEW 3RD QUARTER 2010 |
| |
| RESIDENTIAL REAL ESTATE SECURITIES |
Residential Non-Prime Senior Securities Portfolio
What is this?
Residential non-prime securities are mortgage-backed securities generally backed by non-prime residential mortgage loans. Non-prime residential loans include Alt-A and Option ARM mortgage loans. Senior securities are those interests in a securitization that generally have the first right to cash flows and are generally last in line to absorb losses. Information on non-prime senior securities we own and underlying loan characteristics are set forth in Tables 6 through 9B in the Financial Tables in this Review.
Quarterly Update
| The following table presents information on residential non-prime senior securities at Redwood at September 30, 2010. We account for the large majority of these securities as available-for-sale and others as trading securities. |
| | | | | | | | | | | | | |
| Credit Support Analysis - Non-Prime Senior Securities at Redwood |
| By Vintage |
| September 30, 2010 |
| ($ in millions) |
| | | | | | | | | | | | | |
| | <=2004 | | 2005 | | 2006 | | Total | |
| | | | | | | | | | | | | |
| Current face | $ | 139 | | $ | 281 | | $ | 11 | | $ | 431 | |
| Net unamortized discount | | (36) | | | (73) | | | (3) | | | (112) | |
| Credit reserve | | (1) | | | (13) | | | (1) | | | (15) | |
| Unrealized gains | | 14 | | | 13 | | | 1 | | | 28 | |
| | | | | | | | | | | | | |
| Fair value of non-prime senior securities - AFS | $ | 116 | | $ | 208 | | $ | 8 | | $ | 332 | |
| | | | | | | | | | | | | |
Overall credit support to non-prime senior securities (1) | | 18.16% | | | 12.28% | | | 22.90% | | | 15.04% | |
Serious delinquencies as a % of collateral balance (1) | | 15.75% | | | 14.69% | | | 14.82% | | | 15.18% | |
| | | | | | | | | | | | | |
| Fair value of non-prime senior securities - trading | $ | 1 | | $ | 20 | | $ | - | | $ | 21 | |
| | | | | | | | | | | | | |
| Fair value of non-prime senior securities | $ | 117 | | $ | 228 | | $ | 8 | | $ | 353 | |
| |
| (1) Overall credit support and serious delinquency rates are weighted by securitization balances. Credit support and delinquencies may vary significantly by securitization. Serious delinquencies include loans over 90-days past due, in foreclosure, and REO. |
| Serious delinquencies in our non-prime senior portfolio are significantly higher than in our prime senior portfolio. However, the levels of credit and structural support are also significantly higher and, as a result, our non-prime senior portfolio is better able to withstand the higher levels of credit losses we expect to incur on these pools. In the third quarter, our senior non-prime securities incurred credit losses of $1 million, compared to $3 million in the second quarter. Please refer to the first two bullets under the table on page 29 and the first bullet on the top of page 30 for further discussion on the characteristics and limitations of the table on page 29, which discussion is also applicable to the table above. |
| THE REDWOOD REVIEW 3RD QUARTER 2010 | 31 |
| |
| RESIDENTIAL REAL ESTATE SECURITIES |
Residential Non-Prime Senior Securities Portfolio (continued)
Quarterly Update (continued)
| The fair market value of our non-prime senior securities AFS was equal to 77% of the face value of the portfolio while our amortized cost was equal to 71% of the face value at September 30, 2010. (We also own non-prime senior securities that are accounted for as trading securities, which are carried at their fair market value of $21 million and which do not have GAAP credit reserves or purchase discounts.) |
| The non-prime AFS senior securities portfolio generated $15 million of cash from principal and interest in the third quarter. The annualized yield in the third quarter for our non-prime AFS senior securities was 11.5%. The non-prime trading senior securities portfolio generated $2 million of cash from principal and interest in the third quarter. The annualized yield in the third quarter for our non-prime trading senior securities was 47.1%. |
| 32 | THE REDWOOD REVIEW 3RD QUARTER 2010 |
| |
| RESIDENTIAL REAL ESTATE SECURITIES |
Residential Non-Senior Securities Portfolio
What is this?
Non-senior securities include subordinate and re-REMIC securities. We have combined them in this section because together they currently represent a small portion of our investments. Subordinate securities are those interests in a securitization that have the last right to cash flows and are first in line to absorb losses and are backed by prime and non-prime residential loans. A re-REMIC is a re-securitization of asset-backed securities where the re-REMIC, the cash flows from, and any credit losses absorbed by the underlying asset-backed securities are allocated among the securities issued in the re-securitization transaction in a variety of ways. Information on our non-senior securities is set forth in Tables 6 through 9B in the Financial Tables in this Review.
Quarterly Update
| The following table presents information on residential non-senior securities at Redwood at September 30, 2010. We account for all of these securities as available-for-sale. |
| | | | | | | | | | |
| Residential Non-Senior Securities at Redwood | |
| September 30, 2010 |
| ($ in millions) |
| | | | | | | | | | |
| | Subordinate | | Re-REMIC | | Total | |
| Current face | $ | 318 | | $ | 139 | | $ | 457 | |
| Credit reserve | | (229) | | | (41) | | | (270) | |
| Net unamortized discount | | (43) | | | (65) | | | (108) | |
| Amortized cost | | 46 | | | 33 | | | 79 | |
| | | | | | | | | | |
| Unrealized gains | | 7 | | | 42 | | | 49 | |
| Unrealized losses | | (10) | | | - | | | (10) | |
| | | | | | | | | | |
| Fair value of non-senior securities | $ | 43 | | $ | 75 | | $ | 118 | |
| Credit losses totaled $28 million in our residential subordinate portfolio in the third quarter, compared to $57 million of losses in the second quarter of 2010. We expect future losses will extinguish the majority of these securities as reflected by the $229 million of credit reserves we have provided for the $318 million face value of those securities. Until the losses occur, we will continue to earn interest on the face value of those securities. |
| The fair market value of our subordinate securities was equal to 14% of the face value, while our amortized cost was equal to 14% of the face value of the portfolio at September 30, 2010. These securities generated $9 million of cash in the third quarter compared to $8 million in the second quarter. The annualized yield for our subordinate securities portfolio was 34.9%. |
| THE REDWOOD REVIEW 3RD QUARTER 2010 | 33 |
| |
| RESIDENTIAL REAL ESTATE SECURITIES |
Residential Non-Senior Securities Portfolio (continued)
Quarterly Update (continued)
| Our existing portfolio of re-REMIC securities consists of prime residential senior securities that were pooled and re-securitized in 2009 to create two-tranche structures and we own support (or junior) securities within those structures. |
| The fair market value of our re-REMIC securities was equal to 54% of the face value of the portfolio, while our amortized cost was equal to 24% of the face value at September 30, 2010. These securities generated $2 million of cash exclusively from interest in both the third and second quarters of 2010, excluding proceeds from sales. The annualized yield in the third quarter for our re-REMIC securities portfolio was 17.5%. |
| There were no credit losses in our re-REMIC portfolio in the third quarter. We anticipate losses, which were included in our acquisition assumptions, and have allocated $41 million of the purchase discount to credit reserves. |
| 34 | THE REDWOOD REVIEW 3RD QUARTER 2010 |
Redwood invests in commercial real estate loans and securities. As we identify attractive investment opportunities, we generally expect to invest in newly originated commercial loans. Our existing commercial investments at Redwood are predominately subordinate securities that were acquired prior to 2008. This discussion is exclusive of commercial securities and loans owned by Acacia entities.
| Property level fundamentals are slowly beginning to show signs of marginal improvement. In the second quarter of 2010 net absorption turned positive for apartments, office, retail, and industrial space, and vacancy rates declined for all property types except office properties, which held steady. This marks the first quarter since 2007 where vacancy rates across commercial real estate have improved. Rental rates, which often lag vacancies, continued to decline for most property types, although the pace of decline has slowed markedly. |
| Despite these signs of improvement in commercial real estate, the commercial mortgage market is still experiencing elevated levels of distress. However, this market has become increasing fragmented and there is high demand for stabilized assets from both commercial mortgage lenders and equity investors. This has resulted in attractive first mortgage rates, albeit at lower leverage levels, for borrowers with high quality assets. |
| After a two year hiatus, the CMBS market has re-emerged. Annual volume is expected to exceed $10 billion for new issuance in 2010 and Standard and Poor’s estimates that total CMBS volume will increase to over $35 billion in 2011. |
| Commercial mortgage borrowers seeking full leverage (higher LTV) loans are faced with a formidable funding gap relative to the lower LTVs loans offered by senior lenders. Mezzanine providers, lenders, and borrowers are working towards providing the needed financing. |
| Our commercial strategy is to build a portfolio of attractive commercial real estate investments by providing long-term debt solutions for well-capitalized borrowers with successful track records on high quality commercial real estate. |
| We continue to collaborate with portfolio and CMBS lenders to opportunistically source mezzanine and other subordinate debt investments. We are actively pursuing a commercial business that will allow us to create a portfolio of high-quality credit assets generating long-term cash flows. |
| THE REDWOOD REVIEW 3RD QUARTER 2010 | 35 |
Quarterly Update
| At September 30, 2010, our investments in commercial securities consisted of predominantly 2004 and 2005 vintage subordinate securities with a fair market value of $8 million. These securities have a face value of $109 million and credit reserves of $97 million. |
| As reflected by the large credit reserve relative to face value, we continue to expect to incur significant credit losses on these securities. The timing, however, of these credit losses is difficult to forecast and credit losses will likely vary significantly every quarter. This volatility was experienced over the last two quarters as credit losses in the third quarter totaled $31 million compared to $12 million in the second quarter. |
| Many of these securities are not receiving periodic principal or interest due to the level of delinquencies in the underlying pool of loans. However, as specially serviced loans are resolved, there may be lump sum payments. For this reason, the cash flow generated by these securities in the third quarter increased to $2 million from $1 million the previous quarter. The timing and amount of cash distributed from these resolutions is difficult to anticipate and we expect our cash flow from our commercial subordinate securities will continue to vary. |
| In early October, we originated a $12 million mezzanine loan concurrently with a $46 million first mortgage provided by a large bank. It exemplifies the type of loan we want to make and the level of risk we believe is appropriate in order to earn double-digit rates of return without short-term financial leverage. The loan is related to a landmark office building in Chicago that features stable operations, ample debt service coverage, and overall leverage of 71% based on a new baseline valuation determined at the time we made the loan. The institutional borrower is an experienced owner/operator of more than 10 million square feet of commercial real estate. We believe we will have similar opportunities to originate additional loans in the near future and are currently analyzing a significant pipeline of transactions. |
| 36 | THE REDWOOD REVIEW 3RD QUARTER 2010 |
| |
| LEGACY INVESTMENTS IN OTHER CONSOLIDATED ENTITIES |
Prior to 2010, we sponsored Sequoia and Acacia securitization entities that acquired mortgage loans and securities and created and issued ABS backed by these loans and securities. Also included in this discussion is the Opportunity Fund. Our Sequoia program is active and issued ABS in 2010, which is discussed in the Investments in 2010 Sequoia module.
| In the third quarter, we reported GAAP income of $5 million from legacy Sequoia and Acacia entities. This was an increase from the $4 million reported in the second quarter due primarily to lower loan loss provision expense. |
| Cash generated by our investments in legacy Sequoia and Acacia entities totaled $7 million in the third and second quarters of 2010. |
| Cumulative losses for all 53 legacy Sequoia residential mortgage securitizations (totaling $35 billion at issuance) totaled 0.36% of the original face amount of the securities through September 30, 2010. |
| To date, credit losses have not yet been incurred on any of the senior securities issued by legacy Sequoia securitization entities, although some of these senior securities may incur losses in the future, depending on the magnitude and timing of additional credit losses incurred on the underlying loans. |
| The consolidation of the assets and liabilities of securitization entities may lead to potentially volatile quarterly reported earnings for a variety of reasons, including the amortization of premium on the loans and liabilities of Sequoia entities, changes in credit loss provisions for loans held by Sequoia entities, fair value adjustments for the assets and liabilities of the Acacia entities, and deconsolidation events. |
| THE REDWOOD REVIEW 3RD QUARTER 2010 | 37 |
Mark-to-Market Valuation Process
| Market values reflect an “exit price,” or the amount we believe we would realize if we sold an asset or would pay if we repurchased a liability in an orderly transaction, even though we generally have no intention — nor would we be required — to sell assets or repurchase liabilities. Establishing market values is inherently subjective and requires us to make a number of assumptions, including the future of interest rates, prepayment rates, discount rates, credit loss rates, and the timing of credit losses. The assumptions we apply are specific to each asset or liability. |
| Although we rely on our internal calculations to compute the fair value of our securities, we request and consider indications of value (marks) from third-party dealers to assist us in our mark-to-market valuation process. For September 30, 2010, we received dealer marks on 78% of our consolidated assets and 94% of our consolidated liabilities. In the aggregate, our internal valuations of the securities on which we received dealer marks were 1% lower (i.e., more conservative) than the dealer marks and our internal valuations of our ABS issued on which we received dealer marks were 3% higher (i.e., more conservative) than the dealer marks. |
Determining Other-Than-Temporary Impairments
| As discussed in our second quarter 2009 Redwood Review, on April 1, 2009, we were required to adopt a new accounting principle affecting the determination of other-than-temporary impairment (OTTI) and its recognition through the income statement and balance sheet (outlined below). The revised multi-step process is presented below. Upon adoption, we made a one-time retained earnings reclassification of $60 million of prior impairments. Our book value did not change as a result of this reclassification. As this impairment is recovered over time, rather than flow through earnings (where the impairment was originally reported), it will instead be credited to equity. The net impact is that our cumulative reported earnings will now be $60 million less than they would have been prior to adopting this required accounting principle. |
| 40 | THE REDWOOD REVIEW 3RD QUARTER 2010 |
ACACIA
Acacia is the brand name for the collateralized debt obligation (CDO) securitizations Redwood sponsored.
ADJUSTABLE-RATE MORTGAGES (ARMs)
Adjustable-rate mortgages are loans that have coupons that adjust at least once per year. We make a distinction between ARMs (loans with a rate adjustment at least annually) and hybrids (loans that have a fixed-rate period of 2-to-10 years and then become adjustable-rate).
AGENCY
Agency refers to government-sponsored enterprises (GSEs), including Federal National Mortgage Association (Fannie Mae), Federal Home Loan Mortgage Corporation (Freddie Mac), and Government National Mortgage Association (Ginnie Mae).
ALT-A SECURITIES and ALT-A LOANS
Alt-A securities are residential mortgage-backed securities backed by loans that have higher credit quality than subprime and lower credit quality than prime. Alt-A originally represented loans with alternative documentation, but the definition has shifted over time to include loans with additional risk characteristics and a higher percentage of investor loans. In an Alt-A loan, the borrower’s income may not be verified, and in some cases, may not be disclosed on the loan application. Alt-A loans may also have expanded criteria that allow for higher debt-to-income ratios with higher accompanying loan-to-value ratios than would otherwise be permissible for prime loans.
AMORTIZED COST
Amortized cost is the initial acquisition cost of an available-for-sale (AFS) security, minus principal repayments or principal reductions through credit losses, plus or minus premium or discount amortization. At the point in time an AFS security is deemed other-than-temporarily impaired, the amortized cost is adjusted (by changing the amount of unamortized premium or discount) by the amount of other-than-temporary impairment taken through the income statement.
ASSET-BACKED SECURITIES (ABS)
Asset-backed securities (ABS) are securities backed by financial assets that generate cash flows. Each ABS issued from a securitization entity has a unique priority with respect to receiving principal and interest cash flows and absorbing any credit losses from the assets owned by the entity.
AVAILABLE-FOR-SALE (AFS)
An accounting method for debt and equity securities in which the securities are reported at their fair value on the balance sheet. Positive changes in the fair value are accounted for as increases to stockholders’ equity and do not flow through the income statement. Negative changes in fair value may be recognized through the income statement or balance sheet, as further detailed in the Accounting Discussion module.
BOOK VALUE (GAAP)
Book value is the value of our common equity in accordance with GAAP.
COLLATERALIZED DEBT OBLIGATION (CDO) SECURITIZATIONS
The securitization of a diverse pool of assets.
COMMERCIAL MORTGAGE-BACKED SECURITIES (CMBS)
A type of mortgage-backed security that is secured by one or more loans on commercial properties.
| THE REDWOOD REVIEW 3RD QUARTER 2010 | 41 |
CONSTANT (or CONDITIONAL) PREPAYMENT RATE (CPR)
Constant (or conditional) prepayment rate (CPR) is an industry-standard measure of the speed at which mortgage loans prepay. It approximates the annual percentage rate at which a pool of loans is paying down due to unscheduled principal prepayments.
CORE EQUITY
Core equity is not a measure calculated in accordance with GAAP. GAAP equity includes mark-to-market adjustments for some of our assets and interest rate agreements in “accumulated other comprehensive income (loss).” Core equity excludes accumulated other comprehensive income (loss). Core equity in some ways approximates what our equity value would be if we used historical amortized cost accounting exclusively. A reconciliation of core equity to GAAP appears in the Table 4 in the Financial Tables in this Review.
CREDIT SUPPORT
Credit support is the face amount of securities subordinate (or junior) to the applicable security that protects the security from credit losses and is generally expressed as a percentage of the securitization’s underlying pool balance.
DEBT
Debt is an obligation of Redwood. See Long-term debt and Short-term debt.
ECONOMIC VALUE (MANAGEMENT’S ESTIMATE OF ECONOMIC VALUE)
Economic value closely relates to liquidation value and is calculated using the bid-side marks (or estimated bid-side values) for all of our financial assets, and offered-side marks (or estimated offered-side values) for all of our financial liabilities. We calculate management’s estimate of economic value as a supplemental measure to book value calculated under GAAP. Our economic value estimates on a per-share basis are reconciled to GAAP book values per share in Table 4 in the Financial Tables of this Review.
FASB
Financial Accounting Standards Board.
THE FUND
The Fund refers to the Redwood Opportunity Fund, L.P., which is managed by Redwood Asset Management, Inc., a wholly-owned subsidiary of Redwood.
GAAP
Generally Accepted Accounting Principles in the United States.
GOVERNMENT SPONSORED ENTERPRISE (GSE)
A government sponsored enterprise is a financial services corporation created by the United States Congress to enhance the flow of credit to targeted sectors of the economy. Among the GSEs charted by Congress are Fannie Mae, Freddie Mac, and Ginnie Mae.
| 42 | THE REDWOOD REVIEW 3RD QUARTER 2010 |
INTEREST-ONLY SECURITIES (IOs)
Interest-only securities (IOs) are specialized securities created by securitization entities where the projected cash flows generated by the underlying assets exceed the cash flows projected to be paid to the ABS issued that have principal balances. Typically, IOs do not have a principal balance and they will not receive principal payments. Interest payments to IOs usually equal an interest rate formula multiplied by a “notional” principal balance. The notional principal balances for IOs are typically reduced over time as the actual principal balances of the underlying pools of assets pay down, thus reducing the cash flows to the IOs over time. Cash flows on IOs are typically reduced more quickly when asset prepayments accelerate.
INVESTMENT CAPACITY
The amount of capacity we have to invest in new assets. It is equal to the amount of capital we have that exceeds our risk-adjusted capital guidelines, less pending investment settlements, margin requirements, near-term operating expenses, and other miscellaneous capital allocations. Our risk-adjusted capital guidelines are subject to change over time based on market and financing conditions.
JUMBO LOAN
A jumbo loan is a mortgage loan that generally conforms to the underwriting standards of Fannie Mae and Freddie Mac except that the dollar amount of the loan exceeds the maximum limit set by the two GSEs for loans salable to the two companies.
LEVERAGE RATIOS
When determining Redwood’s financial leverage, traditional leverage ratios may be misleading in some respects if consolidated ABS issued from securitization entities are included as part of Redwood’s obligations when calculating this or similar ratios. Because of the requirement to consolidate the independent securitization entities for GAAP accounting purposes, it appears that Redwood is highly leveraged, with total consolidated liabilities significantly greater than equity. The obligations of these securitization entities are not obligations of Redwood.
LONG-TERM DEBT
Long-term debt is debt that is an obligation of Redwood that is not payable within a year and includes junior subordinated notes and trust preferred securities. We generally treat long-term debt as part of our capital base when it is not payable in the near future.
MARK-TO-MARKET (MTM) ACCOUNTING
Mark-to-market accounting uses estimated fair values of assets, liabilities, and hedges. Many assets on our consolidated balance sheet are carried at their fair value rather than amortized cost. Taxable income is generally not affected by market valuation adjustments.
MARKET VALUATION ADJUSTMENTS (MVAs)
Market valuation adjustments (MVAs) are changes in market values for certain assets and liabilities that are reported through our GAAP income statement. They include all changes in market values for assets and liabilities accounted for at fair value, such as trading securities and derivatives. They also include the credit portion of other-than-temporary impairments on securities available-for-sale, as well as impairments of loans held-for-sale and REO properties.
NON-GAAP METRICS
Not all companies and analysts calculate non-GAAP metrics in the same manner. As a result, certain metrics as calculated by Redwood may not be comparable to similarly titled metrics reported by other companies. Redwood uses non-GAAP metrics such as management’s estimate of economic value and core equity to provide greater transparency for investors. Our non-GAAP metrics are reconciled to GAAP in the Financial Tables in this Review.
| THE REDWOOD REVIEW 3RD QUARTER 2010 | 43 |
NON-PRIME SECURITIES
Non-prime securities are Alt-A, option ARM, and subprime securities. See definitions of Alt-A, option ARM, and subprime securities.
OPTION ARM LOAN
An option ARM loan is a residential mortgage loan that generally offers a borrower monthly payment options such as: 1) a minimum payment that results in negative amortization; 2) an interest-only payment; 3) a payment that would fully amortize the loan over an original 30-year amortization schedule; and, 4) a payment that would fully amortize the loan over a 15-year year amortization schedule. To the extent the borrower has chosen an option that is not fully amortizing the loan (or negatively amortizing the loan), after a period — usually five years or once the negatively amortized loan balance reaches a certain level (generally 15% to 25% higher than the original balance) — the loan payments are recast. This recast provision resets the payment at a level that fully amortizes the loan over its remaining life and the new payment may be materially different than under the borrowers’ previous option.
PRIME RESIDENTIAL REAL ESTATE LOANS
Prime loans are residential loans with higher quality credit characteristics, such as borrowers with higher FICO credit scores, lower loan-to-value ratios, lower debt-to-income ratios, greater levels of other assets, and more documentation.
PRIME SECURITIES
Prime securities are residential mortgage-backed securities backed by prime loans, generally with balances greater than conforming loan limits. Prime securities are typically backed by loans that have relatively high weighted average FICO scores (700 or higher), low weighted average LTVs (75% or less), limited concentrations of investor properties, and a low percentages of loans with low FICO scores or high loan-to-value ratios.
PROFITABILITY RATIOS
Many financial institution analysts use asset-based profitability ratios such as interest rate spread and interest rate margin when analyzing financial institutions. These are asset-based measures. Since we consolidate the assets and liabilities of securitization entities for GAAP purposes, our total GAAP assets and liabilities may vary over time, and may not be comparable to assets typically used in profitability calculations for other financial institutions. As a result, we believe equity-based profitability ratios may be more appropriate than asset-based measures for analyzing Redwood’s operations and results. We believe, for example, that net interest income as a percentage of equity is a useful measure of profitability. For operating expenses, we believe useful measures are operating efficiency ratio (operating expenses as a percentage of net interest income) and operating expenses as a percentage of equity. We provide various profitability ratios in Table 5 in the Financial Tables in this Review.
REAL ESTATE INVESTMENT TRUST (REIT)
A real estate investment trust (REIT) is an entity that makes a tax election to be taxed as a REIT, invests in real estate assets, and meets other REIT qualifications, including the distribution as dividends of at least 90% of REIT taxable income. A REIT’s profits are not taxed at the corporate level to the extent that these profits are distributed as dividends to stockholders, providing an operating cost savings. On the other hand, the requirement to pay out as dividends most of the REIT’s taxable profits means it can be harder for a REIT to grow using only internally-generated funds (as opposed to raising new capital).
| 44 | THE REDWOOD REVIEW 3RD QUARTER 2010 |
REAL ESTATE OWNED (REO)
Real estate owned (REO) refers to real property owned by the lender or loan owner that has been acquired through foreclosure.
REIT SUBSIDIARY
A REIT subsidiary is a subsidiary of a REIT that is taxed as a REIT.
REIT TAXABLE INCOME
REIT taxable income is not a measure calculated in accordance with GAAP. REIT taxable income is pre-tax income calculated for tax purposes at Redwood including only its qualifying REIT subsidiaries (i.e., excluding its taxable subsidiaries). REIT taxable income is an important measure as it is the basis of our dividend distribution requirements. We must distribute at least 90% of REIT taxable income as dividends to shareholders over time. As a REIT, we are not subject to corporate income taxes on the REIT taxable income we distribute. We pay income tax on the REIT taxable income we retain, if any, (and we are permitted to retain up to 10% of total REIT taxable income). A reconciliation of REIT taxable income to GAAP income appears in Table 2 in the Financial Tables in this Review.
REMIC
A real estate mortgage investment conduit (REMIC) is a special purpose vehicle used to pool real estate mortgages and issue mortgage-backed securities. REMICs are typically exempt from tax at the entity level. REMICs may invest only in qualified mortgages and permitted investments, including single family or multifamily mortgages, commercial mortgages, second mortgages, mortgage participations, and federal agency pass-through securities.
RE-REMIC SECURITY
A re-REMIC is a resecuritization of asset-backed securities. The cash flows from and any credit losses absorbed by the underlying assets can be redirected to the resulting re-REMIC securities in a variety of ways.
RESIDENTIAL MORTGAGE-BACKED SECURITIES (RMBS)
A type of mortgage-backed security that is backed by a pool of mortgages on residential properties.
RETURN ON EQUITY (ROE) and ADJUSTED RETURN ON EQUITY
ROE is the amount of profit we generate each year per dollar of equity capital and equals GAAP income divided by GAAP equity. Adjusted ROE is not a measure calculated in accordance with GAAP — it is GAAP income divided by core equity.
SENIOR SECURITIES
Senior securities have the least credit risk in a securitization transaction because they are generally the last securities to absorb credit losses. In addition, the senior securities have the highest claim on the principal and interest payments (after the fees to servicers and trustees are paid.) To further reduce credit risk, most if not all, principal collected from the underlying asset pool is used to pay down the senior securities until certain performance tests are satisfied. If certain performance tests are satisfied, principal payments are shared between the senior securities and the subordinate securities, generally on a pro rata basis. At issuance, senior securities are generally AAA-rated.
| THE REDWOOD REVIEW 3RD QUARTER 2010 | 45 |
SEQUOIA
Sequoia is the brand name for securitizations of residential real estate loans Redwood sponsors. Sequoia entities are independent securitization entities that acquire residential mortgage loans and create and issue asset-backed securities (ABS) backed by these loans. Most of the loans that Sequoia entities acquire are prime-quality loans. Most of the senior ABS created by Sequoia are sold to third-party investors. Redwood usually acquires most of the subordinated ABS and occasionally acquires the interest-only securities (IOs).
SHORT-TERM DEBT
Short-term debt is debt that is an obligation of Redwood and payable within a year. We may obtain this debt from a variety of Wall Street firms, banks, and other institutions. In the past, as another form of short-term debt, we have issued collateralized commercial paper. We may issue these or other forms of short-term debt in the future. We may use short-term debt to finance the accumulation of assets prior to sale to a securitization entity and to finance investments in high-quality loans and securities.
SUBORDINATE SECURITIES (JUNIOR SECURITIES or NON-SENIOR SECURITIES)
Subordinate securities absorb the initial credit losses from a securitization structure, thus protecting the senior securities. Subordinate securities have a lower priority to receive principal and interest payments than the senior securities. Subordinate securities receive little, if any, principal payments until certain performance tests are satisfied. If certain performance tests are satisfied, principal payments are shared between the senior securities and the subordinate securities, generally on a pro rata basis. Subordinate securities generally receive interest payments even if they do not receive principal payments. At issuance, subordinate securities are generally rated AA or below.
SUBPRIME SECURITIES
Subprime securities are residential mortgage-backed securities backed by loans to borrowers who typically have lower credit scores and/or other credit deficiencies that prevent them from qualifying for prime or Alt-A mortgages and may have experienced credit problems in the past, such as late payments or bankruptcies. To compensate for the greater risks and higher costs to service the loans, subprime borrowers pay higher interest rates, points, and origination fees.
TAXABLE INCOME
Taxable income is not a measure calculated in accordance with GAAP. Taxable income is pre-tax income for Redwood and all its subsidiaries as calculated for tax purposes. Taxable income calculations differ significantly from GAAP income calculations. A reconciliation of taxable income to GAAP income appears in Table 2 in the Financial Tables in this Review.
TAXABLE SUBSIDIARY
A taxable subsidiary is a subsidiary of a REIT that is not taxed as a REIT and thus pays taxes on its income. A taxable subsidiary is not limited to investing in real estate and it can choose to retain all of its after-tax profits.
| 46 | THE REDWOOD REVIEW 3RD QUARTER 2010 |

| | | | | | | | | | | | | | | | | | | | | | | | | | | | | | Nine | | | Nine | |
| | | 2010 | | | 2010 | | | 2010 | | | 2009 | | | 2009 | | | 2009 | | | 2009 | | | 2008 | | | 2008 | | | Months | | | Months | |
| | | Q3 | | | Q2 | | | Q1 | | | Q4 | | | Q3 | | | Q2 | | | Q1 | | | Q4 | | | Q3 | | | 2010 | | | 2009 | |
| | | | | | | | | | | | | | | | | | | | | | | | | | | | | | | | | | | | | | | | | | | |
| Interest income | | $ | 49,249 | | | $ | 47,730 | | | $ | 50,449 | | | $ | 57,718 | | | $ | 64,425 | | | $ | 74,332 | | | $ | 83,903 | | | $ | 124,452 | | | $ | 126,227 | | | $ | 147,428 | | | $ | 222,660 | |
| Discount amortization on securities, net | | | 10,991 | | | | 10,821 | | | | 10,629 | | | | 7,432 | | | | 9,575 | | | | 3,864 | | | | 4,917 | | | | (1,189 | ) | | | 7,850 | | | | 32,441 | | | | 18,356 | |
| Other investment interest income | | | 2 | | | | 4 | | | | 9 | | | | 12 | | | | 25 | | | | 53 | | | | 76 | | | | 572 | | | | 487 | | | | 15 | | | | 154 | |
| Premium amortization expense on loans | | | (1,227 | ) | | | (1,985 | ) | | | (2,371 | ) | | | (3,365 | ) | | | (3,642 | ) | | | (3,988 | ) | | | (7,459 | ) | | | (548 | ) | | | (3,372 | ) | | | (5,583 | ) | | | (15,089 | ) |
| Total interest income | | | 59,015 | | | | 56,570 | | | | 58,716 | | | | 61,797 | | | | 70,382 | | | | 74,261 | | | | 81,437 | | | | 123,287 | | | | 131,192 | | | | 174,301 | | | | 226,081 | |
| | | | | | | | | | | | | | | | | | | | | | | | | | | | | | | | | | | | | | | | | | | | | |
| Interest expense on short-term debt | | | (2 | ) | | | (36 | ) | | | - | | | | - | | | | - | | | | - | | | | - | | | | (2 | ) | | | (65 | ) | | | (38 | ) | | | - | |
| | | | | | | | | | | | | | | | | | | | | | | | | | | | | | | | | | | | | | | | | | | | | |
| Interest expense on ABS | | | (19,582 | ) | | | (17,582 | ) | | | (16,144 | ) | | | (17,930 | ) | | | (22,071 | ) | | | (36,115 | ) | | | (44,517 | ) | | | (94,431 | ) | | | (88,294 | ) | | | (53,308 | ) | | | (102,703 | ) |
| ABS issuance expense amortization | | | (575 | ) | | | (475 | ) | | | (634 | ) | | | (575 | ) | | | (570 | ) | | | (586 | ) | | | (553 | ) | | | (1,470 | ) | | | (930 | ) | | | (1,684 | ) | | | (1,709 | ) |
| ABS interest rate agreement expense | | | (1,104 | ) | | | (1,127 | ) | | | (495 | ) | | | (1,123 | ) | | | (1,123 | ) | | | (1,111 | ) | | | (1,098 | ) | | | (1,934 | ) | | | (1,259 | ) | | | (2,726 | ) | | | (3,332 | ) |
ABS issuance premium amortization income | | | 187 | | | | 196 | | | | 208 | | | | 223 | | | | 234 | | | | 313 | | | | 335 | | | | 476 | | | | 557 | | | | 591 | | | | 882 | |
| Total ABS expense consolidated from trusts | | | (21,074 | ) | | | (18,988 | ) | | | (17,065 | ) | | | (19,405 | ) | | | (23,530 | ) | | | (37,499 | ) | | | (45,833 | ) | | | (97,359 | ) | | | (89,926 | ) | | | (57,127 | ) | | | (106,862 | ) |
| | | | | | | | | | | | | | | | | | | | | | | | | | | | | | | | | | | | | | | | | | | | | |
| Interest expense on long-term debt | | | (2,619 | ) | | | (2,140 | ) | | | (1,116 | ) | | | (1,167 | ) | | | (1,307 | ) | | | (1,502 | ) | | | (1,808 | ) | | | (2,345 | ) | | | (2,164 | ) | | | (5,875 | ) | | | (4,617 | ) |
| | | | | | | | | | | | | | | | | | | | | | | | | | | | | | | | | | | | | | | | | | | | | |
| Net interest income | | | 35,320 | | | | 35,406 | | | | 40,535 | | | | 41,225 | | | | 45,545 | | | | 35,260 | | | | 33,795 | | | | 23,581 | | | | 39,037 | | | | 111,261 | | | | 114,602 | |
| Provision for loan losses | | | (2,436 | ) | | | (4,321 | ) | | | (9,476 | ) | | | (8,997 | ) | | | (9,998 | ) | | | (14,545 | ) | | | (16,032 | ) | | | (18,659 | ) | | | (18,333 | ) | | | (16,233 | ) | | | (40,575 | ) |
Market valuation adjustments, net | | | (1,573 | ) | | | (7,125 | ) | | | (11,237 | ) | | | (4,191 | ) | | | (11,058 | ) | | | (29,135 | ) | | | (43,244 | ) | | | (111,331 | ) | | | (127,146 | ) | | | (19,935 | ) | | | (83,437 | ) |
| Net interest income (loss) after provision and market valuation adjustments | | | 31,311 | | | | 23,960 | | | | 19,822 | | | | 28,037 | | | | 24,489 | | | | (8,420 | ) | | | (25,481 | ) | | | (106,409 | ) | | | (106,442 | ) | | | 75,093 | | | | (9,410 | ) |
| | | | | | | | | | | | | | | | | | | | | | | | | | | | | | | | | | | | | | | | | | | | | |
| Fixed compensation expense | | | (3,314 | ) | | | (3,661 | ) | | | (4,109 | ) | | | (3,261 | ) | | | (3,726 | ) | | | (3,572 | ) | | | (4,029 | ) | | | (3,575 | ) | | | (4,331 | ) | | | (11,084 | ) | | | (11,327 | ) |
| Variable compensation expense | | | (2,206 | ) | | | (1,303 | ) | | | (1,880 | ) | | | (566 | ) | | | (5,216 | ) | | | (1,132 | ) | | | (556 | ) | | | 418 | | | | (616 | ) | | | (5,389 | ) | | | (6,904 | ) |
| Equity compensation expense | | | (1,507 | ) | | | (2,077 | ) | | | (6,059 | ) | | | (1,553 | ) | | | (420 | ) | | | (2,337 | ) | | | (1,795 | ) | | | (2,378 | ) | | | (3,080 | ) | | | (9,643 | ) | | | (4,552 | ) |
| Severance expense | | | (48 | ) | | | (229 | ) | | | (81 | ) | | | - | | | | (398 | ) | | | - | | | | (28 | ) | | | (1,814 | ) | | | - | | | | (358 | ) | | | (426 | ) |
Other operating expense | | | (5,170 | ) | | | (3,957 | ) | | | (5,177 | ) | | | (5,453 | ) | | | (5,046 | ) | | | (3,728 | ) | | | (4,132 | ) | | | (6,104 | ) | | | (8,824 | ) | | | (14,304 | ) | | | (12,906 | ) |
| Total operating expenses | | | (12,245 | ) | | | (11,227 | ) | | | (17,306 | ) | | | (10,833 | ) | | | (14,806 | ) | | | (10,769 | ) | | | (10,540 | ) | | | (13,453 | ) | | | (16,851 | ) | | | (40,778 | ) | | | (36,115 | ) |
| | | | | | | | | | | | | | | | | | | | | | | | | | | | | | | | | | | | | | | | | | | | | |
| Realized gains (losses) on sales, net | | | 72 | | | | 16,080 | | | | 44,339 | | | | 19,618 | | | | 17,561 | | | | 25,525 | | | | 462 | | | | 5,823 | | | | (15 | ) | | | 60,491 | | | | 43,548 | |
Realized gains (losses) on calls, net | | | 1,494 | | | | - | | | | - | | | | - | | | | - | | | | - | | | | - | | | | - | | | | (50 | ) | | | 1,494 | | | | - | |
| Realized gains (losses), net | | | 1,566 | | | | 16,080 | | | | 44,339 | | | | 19,618 | | | | 17,561 | | | | 25,525 | | | | 462 | | | | 5,823 | | | | (65 | ) | | | 61,985 | | | | 43,548 | |
| | | | | | | | | | | | | | | | | | | | | | | | | | | | | | | | | | | | | | | | | | | | | |
| Noncontrolling interest | | | (532 | ) | | | (186 | ) | | | 15 | | | | (143 | ) | | | (363 | ) | | | (127 | ) | | | 716 | | | | 2,366 | | | | 2,194 | | | | (703 | ) | | | 226 | |
(Provision for) benefit from income taxes | | | (202 | ) | | | (26 | ) | | | (26 | ) | | | 3,612 | | | | 247 | | | | 514 | | | | (105 | ) | | | (3,913 | ) | | | 9,860 | | | | (254 | ) | | | 656 | |
Net income (loss) | | $ | 19,898 | | | $ | 28,601 | | | $ | 46,844 | | | $ | 40,291 | | | $ | 27,128 | | | $ | 6,723 | | | $ | (34,948 | ) | | $ | (115,586 | ) | | $ | (111,304 | ) | | $ | 95,343 | | | $ | (1,095 | ) |
| | | | | | | | | | | | | | | | | | | | | | | | | | | | | | | | | | | | | | | | | | | | | |
Diluted average shares | | | 78,961 | | | | 78,852 | | | | 78,542 | | | | 78,101 | | | | 78,223 | | | | 66,446 | | | | 53,632 | | | | 33,366 | | | | 33,334 | | | | 77,794 | | | | 65,363 | |
Net income (loss) per share | | $ | 0.25 | | | $ | 0.35 | | | $ | 0.58 | | | $ | 0.51 | | | $ | 0.34 | | | $ | 0.10 | | | $ | (0.65 | ) | | $ | (3.46 | ) | | $ | (3.34 | ) | | $ | 1.18 | | | $ | (0.02 | ) |
| | | |
THE REDWOOD REVIEW 3RD QUARTER 2010 | Table 1: GAAP Earnings | |
| | | |
| ($ in thousands, except per share data) | |
| | | Estimated 2010 Q3 (2) | | | Actual Twelve Months 2009 | | | Actual Twelve Months 2008 | |
| | | Taxable | | | GAAP | | | | | | Taxable | | | GAAP | | | | | | Taxable | | | GAAP | | | | |
| | | Loss | | | Income | | | Differences | | | Loss | | | Income | | | Differences | | | Income | | | Loss | | | Differences | |
| | | | | | | | | | | | | | | | | | | | | | | | | | | | | | | | | | | | | |
| Interest income | | $ | 36,957 | | | $ | 59,015 | | | $ | (22,058 | ) | | $ | 192,921 | | | $ | 287,877 | | | $ | (94,956 | ) | | $ | 201,857 | | | $ | 567,545 | | | $ | (365,688 | ) |
Interest expense | | | (2,921 | ) | | | (23,695 | ) | | | 20,774 | | | | (5,009 | ) | | | (132,003 | ) | | | 126,994 | | | | (7,784 | ) | | | (416,669 | ) | | | 408,885 | |
| Net interest income | | | 34,036 | | | | 35,320 | | | | (1,284 | ) | | | 187,912 | | | | 155,874 | | | | (32,038 | ) | | | 194,073 | | | | 150,876 | | | | 43,197 | |
| Provision for loan losses | | | - | | | | (2,436 | ) | | | 2,436 | | | | - | | | | (49,573 | ) | | | 49,573 | | | | - | | | | (55,111 | ) | | | 55,111 | |
| Realized credit losses | | | (31,232 | ) | | | - | | | | (31,232 | ) | | | (223,902 | ) | | | - | | | | (223,902 | ) | | | (116,546 | ) | | | - | | | | (116,546 | ) |
| Market valuation adjustments, net | | | - | | | | (1,573 | ) | | | 1,573 | | | | - | | | | (87,628 | ) | | | 87,628 | | | | - | | | | (492,902 | ) | | | 492,902 | |
| Operating expenses | | | (11,376 | ) | | | (12,245 | ) | | | 869 | | | | (54,178 | ) | | | (46,995 | ) | | | (7,183 | ) | | | (58,335 | ) | | | (60,906 | ) | | | 2,571 | |
| Realized gains, net | | | - | | | | 1,566 | | | | (1,566 | ) | | | 6,625 | | | | 63,166 | | | | (56,541 | ) | | | - | | | | 8,511 | | | | (8,511 | ) |
| (Provision for) benefit from income taxes | | | - | | | | (202 | ) | | | 202 | | | | (10 | ) | | | 4,268 | | | | (4,278 | ) | | | (113 | ) | | | 3,210 | | | | (3,323 | ) |
| Less: Net income attributable to noncontrolling interest | | | - | | | | 532 | | | | (532 | ) | | | - | | | | (83 | ) | | | 83 | | | | - | | | | (1,936 | ) | | | 1,936 | |
| | | | | | | | | | | | | | | | | | | | | | | | | | | | | | | | | | | | | |
Taxable (loss) income | | $ | (8,572 | ) | | $ | 19,898 | | | $ | (28,470 | ) | | $ | (83,553 | ) | | $ | 39,195 | | | $ | (122,748 | ) | | $ | 19,079 | | | $ | (444,386 | ) | | $ | 463,465 | |
| | | | | | | | | | | | | | | | | | | | | | | | | | | | | | | | | | | | | |
| REIT taxable (loss) income | | $ | (8,763 | ) | | | | | | | | | | $ | (69,819 | ) | | | | | | | | | | $ | 18,541 | | | | | | | | | |
Taxable income (loss) at taxable subsidiaries | | | 191 | | | | | | | | | | | | (13,734 | ) | | | | | | | | | | | 538 | | | | | | | | | |
| Taxable (loss) income | | $ | (8,572 | ) | | | | | | | | | | $ | (83,553 | ) | | | | | | | | | | $ | 19,079 | | | | | | | | | |
| | | | | | | | | | | | | | | | | | | | | | | | | | | | | | | | | | | | | |
| Shares used for taxable EPS calculation | | | 77,984 | | | | | | | | | | | | 71,800 | | | | | | | | | | | | 32,283 | | | | | | | | | |
REIT taxable (loss) income per share (3) | | $ | (0.11 | ) | | | | | | | | | | $ | (0.93 | ) | | | | | | | | | | $ | 0.57 | | | | | | | | | |
Taxable income (loss) at taxable subsidiaries per share | | $ | 0.00 | | | | | | | | | | | $ | (0.19 | ) | | | | | | | | | | $ | 0.01 | | | | | | | | | |
Taxable (loss) income per share (3) | | $ | (0.11 | ) | | | | | | | | | | $ | (1.12 | ) | | | | | | | | | | $ | 0.58 | | | | | | | | | |
(1) Taxable (loss) income for 2010 is an estimate until we file tax returns for that year.
(2) Reconciliation of GAAP income to taxable income for prior quarters is provided in the respective Redwood Reviews for those quarters.
(3) REIT taxable (loss) income per share and taxable (loss) income per share are based on the number of shares outstanding at the end of each quarter. The annual and nine month REIT taxable income (loss) per share and taxable income (loss) per share are the sum of the four or three quarterly per share estimates, respectively.
| | | |
THE REDWOOD REVIEW 3RD QUARTER 2010 | Table 2: Taxable Income (Loss) and GAAP Income (Loss) Differences | 49 |
| | | |
| | | | | | Estimated | | | Actual | | | Actual | | | Estimated | | | Actual | |
| | | | | | | | | | | | | | | | | | | | | | | | | | | | | | Nine | | | Nine | |
| | | 2010 | | | 2010 | | | 2010 | | | 2009 | | | 2009 | | | 2009 | | | 2009 | | | 2008 | | | 2008 | | | Months | | | Months | |
| | | Q3 | | | Q2 | | | Q1 | | | Q4 | | | Q3 | | | Q2 | | | Q1 | | | Q4 | | | Q3 | | | 2010 | | | 2009 | |
| | | | | | | | | | | | | | | | | | | | | | | | | | | | | | | | | | | | | | | | | | | |
| Dividends declared | | $ | 19,496 | | | $ | 19,477 | | | $ | 19,438 | | | $ | 19,434 | | | $ | 19,417 | | | $ | 19,376 | | | $ | 15,057 | | | $ | 25,103 | | | $ | 24,928 | | | $ | 58,411 | | | $ | 53,850 | |
Dividend deductions on stock issued through direct stock purchase plan | | | 21 | | | | 21 | | | | 37 | | | | 6 | | | | 2 | | | | 2 | | | | 30 | | | | 45 | | | | 165 | | | | 79 | | | | 34 | |
| Total dividend deductions | | $ | 19,517 | | | $ | 19,498 | | | $ | 19,475 | | | $ | 19,440 | | | $ | 19,419 | | | $ | 19,378 | | | $ | 15,087 | | | $ | 25,148 | | | $ | 25,093 | | | $ | 58,490 | | | $ | 53,884 | |
Regular dividend per share (1) | | $ | 0.25 | | | $ | 0.25 | | | $ | 0.25 | | | $ | 0.25 | | | $ | 0.25 | | | $ | 0.25 | | | $ | 0.25 | | | $ | 0.75 | | | $ | 0.75 | | | $ | 0.75 | | | $ | 0.75 | |
| | | | | | | | | | | | | | | | | | | | | | | | | | | | | | | | | | | | | | | | | | | | | |
| Undistributed REIT taxable income at beginning of period (pre-tax) | | $ | - | | | $ | - | | | $ | - | | | $ | - | | | $ | - | | | $ | - | | | $ | - | | | $ | 21,128 | | | $ | 43,821 | | | $ | - | | | $ | - | |
| REIT taxable income (loss) (pre-tax) | | | (8,763 | ) | | | 2,883 | | | | 9,831 | | | | (25,806 | ) | | | (24,933 | ) | | | (10,379 | ) | | | (8,701 | ) | | | (13,007 | ) | | | 2,400 | | | | 3,951 | | | | (44,013 | ) |
| Dividend of 2007 income | | | - | | | | - | | | | - | | | | - | | | | - | | | | - | | | | - | | | | - | | | | (14,673 | ) | | | - | | | | - | |
| Dividend of 2008 income | | | - | | | | - | | | | - | | | | - | | | | - | | | | - | | | | - | | | | (8,121 | ) | | | (10,420 | ) | | | - | | | | - | |
| Dividend of 2009 income | | | - | | | | - | | | | - | | | | - | | | | - | | | | - | | | | - | | | | - | | | | - | | | | - | | | | - | |
Dividend of 2010 income | | | - | | | | - | | | | - | | | | - | | | | - | | | | - | | | | - | | | | - | | | | - | | | | - | | | | - | |
| Undistributed REIT taxable income (pre-tax) at period end | | $ | - | | | $ | - | | | $ | - | | | $ | - | | | $ | - | | | $ | - | | | $ | - | | | $ | - | | | $ | 21,128 | | | $ | - | | | $ | - | |
| | | | | | | | | | | | | | | | | | | | | | | | | | | | | | | | | | | | | | | | | | | | | |
| Undistributed REIT taxable income (pre-tax) at period end | | | | | | | | | | | | | | | | | | | | | | | | | | | | | | | | | | | | | | | | | | | | |
| From 2008 | | $ | - | | | $ | - | | | $ | - | | | $ | - | | | $ | - | | | $ | - | | | $ | - | | | $ | - | | | $ | 20,872 | | | $ | - | | | $ | - | |
| From 2009 | | | - | | | | - | | | | - | | | | - | | | | - | | | | - | | | | - | | | | - | | | | - | | | | - | | | | - | |
From 2010 | | | - | | | | - | | | | - | | | | - | | | | - | | | | - | | | | - | | | | - | | | | - | | | | - | | | | - | |
Total | | $ | - | | | $ | - | | | $ | - | | | $ | - | | | $ | - | | | $ | - | | | $ | - | | | $ | - | | | $ | 20,872 | | | $ | - | | | $ | - | |
| Shares outstanding at period end | | | 77,984 | | | | 77,908 | | | | 77,751 | | | | 77,737 | | | | 77,669 | | | | 77,503 | | | | 60,228 | | | | 33,471 | | | | 33,238 | | | | 77,984 | | | | 77,669 | |
| Undistributed REIT taxable income (pre-tax) per share outstanding at period end | | $ | - | | | $ | - | | | $ | - | | | $ | - | | | $ | - | | | $ | - | | | $ | - | | | $ | - | | | $ | 0.63 | | | $ | - | | | $ | - | |
(1) Dividends in 2008 exceeded that year's taxable income plus undistributed income carried over from prior years and included a $9.9 million return of capital. The 2009 dividends were characterized as a return of capital. At this time, we currently expect the 2010 dividends to be characterized as a return of capital (which is why we show no distribution of first nine months of 2010 income and no undistributed income in the table). The portion of Redwood's dividends characterized as a return of capital is not taxable to a shareholder and reduces a shareholder's basis for shares held at each quarterly distribution date.
| | | |
THE REDWOOD REVIEW 3RD QUARTER 2010 | Table 3: Retention and Distribution of Taxable Income | |
| | | |
| | | | | | | | | | | | | | | | | | | | | | | | | | | | |
| | | 2010 | | | 2010 | | | 2010 | | | 2009 | | | 2009 | | | 2009 | | | 2009 | | | 2008 | | | 2008 | |
| | | Q3 | | | Q2 | | | Q1 | | | Q4 | | | Q3 | | | Q2 | | | Q1 | | | Q4 | | | Q3 | |
| | | | | | | | | | | | | | | | | | | | | | | | | | | | | | | | | | | | | |
| Short-term debt | | $ | - | | | $ | - | | | $ | - | | | $ | - | | | $ | - | | | $ | - | | | $ | - | | | $ | - | | | $ | 7 | |
Long-term debt | | | 140 | | | | 140 | | | | 140 | | | | 140 | | | | 140 | | | | 150 | | | | 150 | | | | 150 | | | | 150 | |
Redwood debt (1) | | $ | 140 | | | $ | 140 | | | $ | 140 | | | $ | 140 | | | $ | 140 | | | $ | 150 | | | $ | 150 | | | $ | 150 | | | $ | 157 | |
| | | | | | | | | | | | | | | | | | | | | | | | | | | | | | | | | | | | | |
| GAAP stockholders' equity | | $ | 1,016 | | | $ | 991 | | | $ | 998 | | | $ | 972 | | | $ | 907 | | | $ | 802 | | | $ | 506 | | | $ | 302 | | | $ | 412 | |
| | | | | | | | | | | | | | | | | | | | | | | | | | | | | | | | | | | | | |
| Redwood debt to equity | | | 0.1 | x | | | 0.1 | x | | | 0.1 | x | | | 0.1 | x | | | 0.2 | x | | | 0.2 | x | | | 0.3 | x | | | 0.5 | x | | | 0.4 | x |
| Redwood debt to (equity + debt) | | | 12 | % | | | 12 | % | | | 12 | % | | | 13 | % | | | 13 | % | | | 16 | % | | | 23 | % | | | 33 | % | | | 28 | % |
| | | | | | | | | | | | | | | | | | | | | | | | | | | | | | | | | | | | | |
| Redwood debt | | $ | 140 | | | $ | 140 | | | $ | 140 | | | $ | 140 | | | $ | 140 | | | $ | 150 | | | $ | 150 | | | $ | 150 | | | $ | 157 | |
ABS obligations of consolidated securitization entities | | | 3,832 | | | | 3,961 | | | | 3,837 | | | | 3,943 | | | | 4,016 | | | | 4,185 | | | | 4,709 | | | | 4,855 | | | | 6,603 | |
| GAAP obligation | | $ | 3,972 | | | $ | 4,101 | | | $ | 3,977 | | | $ | 4,083 | | | $ | 4,156 | | | $ | 4,335 | | | $ | 4,859 | | | $ | 5,005 | | | $ | 6,760 | |
| | | | | | | | | | | | | | | | | | | | | | | | | | | | | | | | | | | | | |
| GAAP obligation to equity | | | 3.9 | x | | | 4.0 | x | | | 4.0 | x | | | 4.2 | x | | | 4.6 | x | | | 5.4 | x | | | 9.6 | x | | | 16.6 | x | | | 16.4 | x |
| GAAP obligation to (equity + GAAP debt) | | | 80 | % | | | 81 | % | | | 80 | % | | | 81 | % | | | 82 | % | | | 84 | % | | | 91 | % | | | 94 | % | | | 94 | % |
| | | | | | | | | | | | | | | | | | | | | | | | | | | | | | | | | | | | | |
| GAAP stockholders' equity | | $ | 1,016 | | | $ | 991 | | | $ | 998 | | | $ | 972 | | | $ | 907 | | | $ | 802 | | | $ | 506 | | | $ | 302 | | | $ | 412 | |
Balance sheet mark-to-market adjustments | | | 61 | | | | 38 | | | | 58 | | | | 65 | | | | 23 | | | | (77 | ) | | | (85 | ) | | | (57 | ) | | | (84 | ) |
| Core equity (non-GAAP) | | $ | 955 | | | $ | 953 | | | $ | 940 | | | $ | 907 | | | $ | 884 | | | $ | 879 | | | $ | 591 | | | $ | 359 | | | $ | 496 | |
| | | | | | | | | | | | | | | | | | | | | | | | | | | | | | | | | | | | | |
| Shares outstanding at period end | | | 77,984 | | | | 77,908 | | | | 77,751 | | | | 77,737 | | | | 77,669 | | | | 77,503 | | | | 60,228 | | | | 33,471 | | | | 33,238 | |
| | | | | | | | | | | | | | | | | | | | | | | | | | | | | | | | | | | | | |
| GAAP equity per share | | $ | 13.02 | | | $ | 12.71 | | | $ | 12.84 | | | $ | 12.50 | | | $ | 11.68 | | | $ | 10.35 | | | $ | 8.40 | | | $ | 9.02 | | | $ | 12.40 | |
Adjustments: GAAP equity to
economic value (2) | | | | | | | | | | | | | | | | | | | | | | | | | | | | | | | | | | | | |
| Investments in Sequoia | | $ | (0.24 | ) | | $ | (0.31 | ) | | $ | (0.37 | ) | | $ | (0.37 | ) | | $ | (0.37 | ) | | $ | (0.35 | ) | | $ | (0.15 | ) | | $ | (0.95 | ) | | $ | (1.65 | ) |
| Investments in Acacia | | | (0.04 | ) | | | (0.03 | ) | | | - | | | | - | | | | - | | | | 0.01 | | | | (0.03 | ) | | | (0.21 | ) | | | (0.18 | ) |
Long-term debt | | | 0.99 | | | | 1.00 | | | | 0.85 | | | | 0.90 | | | | 0.97 | | | | 1.29 | | | | 1.79 | | | | 3.24 | | | | 2.61 | |
Estimate of economic value per share (non-GAAP) | | $ | 13.73 | | | $ | 13.37 | | | $ | 13.32 | | | $ | 13.03 | | | $ | 12.28 | | | $ | 11.30 | | | $ | 10.01 | | | $ | 11.10 | | | $ | 13.18 | |
(1) Excludes obligations of consolidated securitization entities.
(2) Differences between GAAP and econcomic value per share reflect our estimate of the economic value of investments in Sequoia and Acacia and our long-term debt.
| | | |
THE REDWOOD REVIEW 3RD QUARTER 2010 | Table 4: Book Value and Other Ratios | 51 |
| | | |
| | | | | | | | | | | | | | | | | | | | | | | | | | | | | | Nine | | | Nine | |
| | | 2010 | | | 2010 | | | 2010 | | | 2009 | | | 2009 | | | 2009 | | | 2009 | | | 2008 | | | 2008 | | | Months | | | Months | |
| | | Q3 | | | Q2 | | | Q1 | | | Q4 | | | Q3 | | | Q2 | | | Q1 | | | Q4 | | | Q3 | | | 2010 | | | 2009 | |
| | | | | | | | | | | | | | | | | | | | | | | | | | | | | | | | | | | | | | | | | | | |
| Interest income | | $ | 59,015 | | | $ | 56,570 | | | $ | 58,716 | | | $ | 61,797 | | | $ | 70,382 | | | $ | 74,261 | | | $ | 81,437 | | | $ | 123,287 | | | $ | 131,192 | | | $ | 174,301 | | | $ | 226,080 | |
Average consolidated earning assets | | $ | 5,030,680 | | | $ | 5,139,945 | | | $ | 5,070,987 | | | $ | 5,175,337 | | | $ | 5,128,893 | | | $ | 5,325,322 | | | $ | 5,553,470 | | | $ | 7,006,592 | | | $ | 7,594,682 | | | $ | 5,080,390 | | | $ | 5,334,340 | |
| Asset yield | | | 4.69 | % | | | 4.40 | % | | | 4.63 | % | | | 4.78 | % | | | 5.49 | % | | | 5.58 | % | | | 5.87 | % | | | 7.04 | % | | | 6.91 | % | | | 4.57 | % | | | 5.65 | % |
| | | | | | | | | | | | | | | | | | | | | | | | | | | | | | | | | | | | | | | | | | | | | |
| Interest expense | | $ | (23,695 | ) | | $ | (21,164 | ) | | $ | (18,181 | ) | | $ | (20,572 | ) | | $ | (24,837 | ) | | $ | (39,001 | ) | | $ | (47,641 | ) | | $ | (99,706 | ) | | $ | (92,155 | ) | | $ | (63,040 | ) | | $ | (111,479 | ) |
Average consolidated interest-bearing liabilities | | $ | 4,016,680 | | | $ | 4,077,992 | | | $ | 4,015,655 | | | $ | 4,096,928 | | | $ | 4,193,650 | | | $ | 4,651,125 | | | $ | 4,940,304 | | | $ | 6,613,677 | | | $ | 7,106,052 | | | $ | 4,036,779 | | | $ | 4,586,297 | |
| Cost of funds | | | 2.36 | % | | | 2.08 | % | | | 1.81 | % | | | 2.01 | % | | | 2.37 | % | | | 3.35 | % | | | 3.86 | % | | | 6.03 | % | | | 5.19 | % | | | 2.08 | % | | | 3.24 | % |
| | | | | | | | | | | | | | | | | | | | | | | | | | | | | | | | | | | | | | | | | | | | | |
| Asset yield | | | 4.69 | % | | | 4.40 | % | | | 4.63 | % | | | 4.78 | % | | | 5.49 | % | | | 5.58 | % | | | 5.87 | % | | | 7.04 | % | | | 6.91 | % | | | 4.57 | % | | | 5.65 | % |
Cost of funds | | | (2.36 | %) | | | (2.08 | %) | | | (1.81 | %) | | | (2.01 | %) | | | (2.37 | %) | | | (3.35 | %) | | | (3.86 | %) | | | (6.03 | %) | | | (5.19 | %) | | | (2.08 | %) | | | (3.24 | %) |
| Interest rate spread | | | 2.33 | % | | | 2.33 | % | | | 2.82 | % | | | 2.77 | % | | | 3.12 | % | | | 2.22 | % | | | 2.01 | % | | | 1.01 | % | | | 1.72 | % | | | 2.49 | % | | | 2.41 | % |
| | | | | | | | | | | | | | | | | | | | | | | | | | | | | | | | | | | | | | | | | | | | | |
| Net interest income | | $ | 35,320 | | | $ | 35,406 | | | $ | 40,535 | | | $ | 41,225 | | | $ | 45,545 | | | $ | 35,260 | | | $ | 33,795 | | | $ | 23,581 | | | $ | 39,037 | | | $ | 111,261 | | | $ | 114,600 | |
Average consolidated earning assets | | $ | 5,030,680 | | | $ | 5,139,945 | | | $ | 5,070,987 | | | $ | 5,175,337 | | | $ | 5,128,893 | | | $ | 5,325,322 | | | $ | 5,553,470 | | | $ | 7,006,592 | | | $ | 7,594,682 | | | $ | 5,080,390 | | | $ | 5,334,340 | |
| Net interest margin | | | 2.81 | % | | | 2.76 | % | | | 3.20 | % | | | 3.19 | % | | | 3.55 | % | | | 2.65 | % | | | 2.43 | % | | | 1.35 | % | | | 2.06 | % | | | 2.92 | % | | | 2.86 | % |
| | | | | | | | | | | | | | | | | | | | | | | | | | | | | | | | | | | | | | | | | | | | | |
| Operating expenses | | $ | (12,245 | ) | | $ | (11,227 | ) | | $ | (17,306 | ) | | $ | (10,833 | ) | | $ | (14,806 | ) | | $ | (10,769 | ) | | $ | (10,540 | ) | | $ | (13,453 | ) | | $ | (16,851 | ) | | $ | (40,778 | ) | | $ | (36,115 | ) |
| | | | | | | | | | | | | | | | | | | | | | | | | | | | | | | | | | | | | | | | | | | | | |
| Average total assets | | $ | 5,161,498 | | | $ | 5,263,730 | | | $ | 5,219,636 | | | $ | 5,293,887 | | | $ | 5,138,793 | | | $ | 5,315,643 | | | $ | 5,575,619 | | | $ | 7,040,306 | | | $ | 7,648,102 | | | $ | 5,214,742 | | | $ | 5,341,751 | |
| Average total equity | | $ | 1,003,372 | | | $ | 1,005,212 | | | $ | 985,350 | | | $ | 945,862 | | | $ | 833,227 | | | $ | 575,661 | | | $ | 556,861 | | | $ | 371,503 | | | $ | 533,755 | | | $ | 998,044 | | | $ | 656,262 | |
| | | | | | | | | | | | | | | | | | | | | | | | | | | | | | | | | | | | | | | | | | | | | |
| Operating expenses / net interest income | | | 34.67 | % | | | 31.71 | % | | | 42.69 | % | | | 26.28 | % | | | 32.51 | % | | | 30.54 | % | | | 31.19 | % | | | 57.05 | % | | | 43.17 | % | | | 48.87 | % | | | 42.02 | % |
| Operating expenses / average total assets | | | 0.95 | % | | | 0.85 | % | | | 1.33 | % | | | 0.82 | % | | | 1.15 | % | | | 0.81 | % | | | 0.76 | % | | | 0.76 | % | | | 0.88 | % | | | 1.04 | % | | | 0.90 | % |
| Operating expenses / average total equity | | | 4.88 | % | | | 4.47 | % | | | 7.03 | % | | | 4.58 | % | | | 7.11 | % | | | 7.48 | % | | | 7.57 | % | | | 14.49 | % | | | 12.63 | % | | | 5.45 | % | | | 7.34 | % |
| | | | | | | | | | | | | | | | | | | | | | | | | | | | | | | | | | | | | | | | | | | | | |
| GAAP net income (loss) | | $ | 19,898 | | | $ | 28,601 | | | $ | 46,844 | | | $ | 40,291 | | | $ | 27,128 | | | $ | 6,723 | | | $ | (34,948 | ) | | $ | (115,586 | ) | | $ | (111,304 | ) | | $ | 95,343 | | | $ | (1,097 | ) |
| GAAP net income (loss) / average total assets | | | 1.54 | % | | | 2.17 | % | | | 3.59 | % | | | 3.04 | % | | | 2.11 | % | | | 0.51 | % | | | (2.51 | %) | | | (6.57 | %) | | | (5.82 | %) | | | 2.44 | % | | | (0.03 | %) |
| GAAP net income (loss) / average equity (GAAP ROE) | | | 7.93 | % | | | 11.38 | % | | | 19.02 | % | | | 17.04 | % | | | 13.02 | % | | | 4.67 | % | | | (25.10 | %) | | | (124.45 | %) | | | (83.41 | %) | | | 12.74 | % | | | (0.22 | %) |
GAAP net income (loss) / average core equity (adjusted ROE) (2) | | | 8.25 | % | | | 12.00 | % | | | 20.09 | % | | | 17.99 | % | | | 12.22 | % | | | 4.10 | % | | | (22.64 | %) | | | (103.09 | %) | | | (79.62 | %) | | | 13.38 | % | | | (0.20 | %) |
| | | | | | | | | | | | | | | | | | | | | | | | | | | | | | | | | | | | | | | | | | | | | |
Average core equity (2) | | $ | 964,249 | | | $ | 953,720 | | | $ | 932,721 | | | $ | 896,034 | | | $ | 888,107 | | | $ | 655,695 | | | $ | 617,325 | | | $ | 448,484 | | | $ | 559,150 | | | $ | 950,345 | | | $ | 721,368 | |
(1) All percentages in this table are shown on an annualized basis.
(2) Core equity is a non-GAAP metric and is equal to GAAP equity excluding accumulated other comprehensive income (loss). It is reconciled to GAAP equity in Tables 4 and 6.
| | | |
THE REDWOOD REVIEW 3RD QUARTER 2010 | Table 5: Profitability Ratios | |
| | | |
| Table 6: Average Balance Sheet ($ in thousands) | |
| | | | | | | | | | | | | | | | | | | | | | | | | | | | | | Nine | | | Nine | |
| | | 2010 | | | 2010 | | | 2010 | | | 2009 | | | 2009 | | | 2009 | | | 2009 | | | 2008 | | | 2008 | | | Months | | | Months | |
| | | Q3 | | | Q2 | | | Q1 | | | Q4 | | | Q3 | | | Q2 | | | Q1 | | | Q4 | | | Q3 | | | 2010 | | | 2009 | |
| | | | | | | | | | | | | | | | | | | | | | | | | | | | | | | | | | | | | | | | | | | |
Real estate assets at Redwood | | | | | | | | | | | | | | | | | | | | | | | | | | | | | | | | | | | | | | | | | | |
| | | | | | | | | | | | | | | | | | | | | | | | | | | | | | | | | | | | | | | | | | | |
| Senior Residential Securities | | | | | | | | | | | | | | | | | | | | | | | | | | | | | | | | | | | | | | | | | | |
| Prime | | $ | 270,286 | | | $ | 278,472 | | | $ | 283,477 | | | $ | 280,101 | | | $ | 264,773 | | | $ | 164,386 | | | $ | 77,651 | | | $ | 37,746 | | | $ | 27,880 | | | $ | 277,363 | | | $ | 169,622 | |
Non-prime | | | 316,089 | | | | 302,461 | | | | 310,948 | | | | 263,022 | | | | 270,353 | | | | 168,383 | | | | 87,464 | | | | 63,050 | | | | 63,818 | | | | 309,852 | | | | 176,070 | |
| Total Senior Residential Securities | | | 586,375 | | | | 580,933 | | | | 594,426 | | | | 543,124 | | | | 535,126 | | | | 332,769 | | | | 165,114 | | | | 100,796 | | | | 91,698 | | | | 587,215 | | | | 345,692 | |
| | | | | | | | | | | | | | | | | | | | | | | | | | | | | | | | | | | | | | | | | | | | | |
| Residential Re-REMIC Securities | | | 33,250 | | | | 34,385 | | | | 45,852 | | | | 73,938 | | | | 69,980 | | | | 26,419 | | | | - | | | | - | | | | - | | | | 37,783 | | | | 32,389 | |
| | | | | | | | | | | | | | | | | | | | | | | | | | | | | | | | | | | | | | | | | | | | | |
| Subordinate Residential Securities | | | | | | | | | | | | | | | | | | | | | | | | | | | | | | | | | | | | | | | | | | | | |
| Prime | | | 35,794 | | | | 38,079 | | | | 41,701 | | | | 47,083 | | | | 58,637 | | | | 43,020 | | | | 47,070 | | | | 88,943 | | | | 147,513 | | | | 38,503 | | | | 49,618 | |
Non-prime | | | 9,181 | | | | 7,708 | | | | 4,253 | | | | 1,377 | | | | 2,218 | | | | 2,767 | | | | 3,450 | | | | 4,105 | | | | 4,450 | | | | 7,065 | | | | 2,807 | |
| Total Subordinate Residential Securities | | | 44,975 | | | | 45,787 | | | | 45,954 | | | | 48,460 | | | | 60,855 | | | | 45,787 | | | | 50,519 | | | | 93,048 | | | | 151,963 | | | | 45,568 | | | | 52,425 | |
| | | | | | | | | | | | | | | | | | | | | | | | | | | | | | | | | | | | | | | | | | | | | |
| Commercial subordinate securites | | | 7,274 | | | | 7,417 | | | | 7,670 | | | | 8,090 | | | | 13,504 | | | | 25,006 | | | | 46,382 | | | | 63,969 | | | | 98,534 | | | | 7,452 | | | | 28,177 | |
| Commercial loans | | | 242 | | | | 243 | | | | 244 | | | | 245 | | | | 246 | | | | 247 | | | | 248 | | | | 249 | | | | 250 | | | | 243 | | | | 247 | |
| Residential loans | | | 16,463 | | | | 2,299 | | | | 2,313 | | | | 2,314 | | | | 2,315 | | | | 2,435 | | | | 2,600 | | | | 2,960 | | | | 3,671 | | | | 7,077 | | | | 2,449 | |
| CDO | | | 1,103 | | | | 1,207 | | | | 1,222 | | | | 1,962 | | | | 2,255 | | | | 2,595 | | | | 3,429 | | | | 3,856 | | | | 8,628 | | | | 1,177 | | | | 2,755 | |
Other real estate investments | | | - | | | | - | | | | - | | | | - | | | | - | | | | - | | | | - | | | | 50 | | | | 75 | | | | - | | | | - | |
| Total real estate assets at Redwood | | | 689,682 | | | | 672,270 | | | | 697,681 | | | | 678,133 | | | | 684,281 | | | | 435,258 | | | | 268,293 | | | | 264,927 | | | | 354,819 | | | | 686,515 | | | | 464,134 | |
| | | | | | | | | | | | | | | | | | | | | | | | | | | | | | | | | | | | | | | | | | | | | |
| Earning assets at Acacia | | | 292,468 | | | | 290,060 | | | | 299,843 | | | | 304,436 | | | | 298,615 | | | | 321,206 | | | | 404,596 | | | | 575,709 | | | | 830,311 | | | | 294,097 | | | | 341,084 | |
| Earning assets at pre-2010 Sequoia | | | 3,505,497 | | | | 3,589,882 | | | | 3,666,884 | | | | 3,767,112 | | | | 3,864,796 | | | | 4,305,159 | | | | 4,568,212 | | | | 5,966,898 | | | | 6,170,944 | | | | 3,586,830 | | | | 4,243,479 | |
| Earning assets at 2010 Sequoia | | | 204,504 | | | | 161,502 | | | | - | | | | - | | | | - | | | | - | | | | - | | | | - | | | | - | | | | 122,751 | | | | - | |
| Earning assets at the Fund | | | 34,334 | | | | 35,526 | | | | 42,134 | | | | 53,990 | | | | 57,070 | | | | 58,054 | | | | 62,319 | | | | 71,792 | | | | 75,321 | | | | 37,303 | | | | 59,128 | |
| | | | | | | | | | | | | | | | | | | | | | | | | | | | | | | | | | | | | | | | | | | | | |
Cash and cash equivalents | | | 265,071 | | | | 339,212 | | | | 311,816 | | | | 321,838 | | | | 279,011 | | | | 285,680 | | | | 310,514 | | | | 204,246 | | | | 229,778 | | | | 305,195 | | | | 291,619 | |
| Earning assets | | | 4,991,557 | | | | 5,088,452 | | | | 5,018,358 | | | | 5,125,509 | | | | 5,183,773 | | | | 5,405,357 | | | | 5,613,934 | | | | 7,083,573 | | | | 7,661,173 | | | | 5,032,691 | | | | 5,399,446 | |
Balance sheet mark-to-market adjustments | | | 39,123 | | | | 51,493 | | | | 52,629 | | | | 49,828 | | | | (54,880 | ) | | | (80,035 | ) | | | (60,464 | ) | | | (76,981 | ) | | | (66,491 | ) | | | 47,699 | | | | (65,106 | ) |
| Earning assets - reported value | | | 5,030,680 | | | | 5,139,945 | | | | 5,070,987 | | | | 5,175,337 | | | | 5,128,893 | | | | 5,325,322 | | | | 5,553,470 | | | | 7,006,592 | | | | 7,594,682 | | | | 5,080,390 | | | | 5,334,340 | |
Other assets | | | 130,818 | | | | 123,785 | | | | 148,649 | | | | 118,550 | | | | 9,900 | | | | (9,680 | ) | | | 22,148 | | | | 33,714 | | | | 53,420 | | | | 134,352 | | | | 7,411 | |
Total assets | | $ | 5,161,498 | | | $ | 5,263,730 | | | $ | 5,219,636 | | | $ | 5,293,887 | | | $ | 5,138,793 | | | $ | 5,315,643 | | | $ | 5,575,619 | | | $ | 7,040,306 | | | $ | 7,648,102 | | | $ | 5,214,742 | | | $ | 5,341,751 | |
| | | | | | | | | | | | | | | | | | | | | | | | | | | | | | | | | | | | | | | | | | | | | |
| Short-term debt | | $ | - | | | $ | 7,920 | | | $ | - | | | $ | - | | | $ | - | | | $ | - | | | $ | - | | | $ | 975 | | | $ | 7,825 | | | $ | 2,640 | | | $ | - | |
| Pre-2010 Sequoia ABS issued | | | 3,439,201 | | | | 3,518,773 | | | | 3,589,269 | | | | 3,666,201 | | | | 3,765,292 | | | | 4,211,937 | | | | 4,460,951 | | | | 5,804,702 | | | | 6,040,634 | | | | 3,515,198 | | | | 4,143,512 | |
| New Sequoia ABS issued | | | 184,615 | | | | 144,201 | | | | - | | | | - | | | | - | | | | - | | | | - | | | | - | | | | - | | | | 110,282 | | | | - | |
| Acacia ABS issued | | | 254,244 | | | | 268,715 | | | | 288,241 | | | | 288,041 | | | | 283,996 | | | | 285,698 | | | | 325,392 | | | | 652,398 | | | | 900,611 | | | | 270,276 | | | | 298,210 | |
| Other liabilities | | | 126,428 | | | | 164,764 | | | | 200,096 | | | | 231,553 | | | | 91,027 | | | | 66,588 | | | | 55,487 | | | | 32,533 | | | | (22,524 | ) | | | 163,493 | | | | 71,164 | |
Long-term debt | | | 138,620 | | | | 138,383 | | | | 138,145 | | | | 137,907 | | | | 139,190 | | | | 147,430 | | | | 147,193 | | | | 146,944 | | | | 146,705 | | | | 138,384 | | | | 144,575 | |
| Total liabilities | | | 4,143,108 | | | | 4,242,755 | | | | 4,215,751 | | | | 4,323,702 | | | | 4,279,505 | | | | 4,711,653 | | | | 4,989,023 | | | | 6,637,552 | | | | 7,073,251 | | | | 4,200,272 | | | | 4,657,461 | |
| | | | | | | | | | | | | | | | | | | | | | | | | | | | | | | | | | | | | | | | | | | | | |
| Noncontrolling interest | | | 15,018 | | | | 15,763 | | | | 18,535 | | | | 24,322 | | | | 26,061 | | | | 28,330 | | | | 29,735 | | | | 31,251 | | | | 41,096 | | | | 16,426 | | | | 28,029 | |
| | | | | | | | | | | | | | | | | | | | | | | | | | | | | | | | | | | | | | | | | | | | | |
| Core equity (1) | | | 964,249 | | | | 953,720 | | | | 932,721 | | | | 896,034 | | | | 888,107 | | | | 655,695 | | | | 617,325 | | | | 448,484 | | | | 600,246 | | | | 950,345 | | | | 721,368 | |
Accumulated other comprehensive income (loss) | | | 39,123 | | | | 51,493 | | | | 52,629 | | | | 49,829 | | | | (54,880 | ) | | | (80,035 | ) | | | (60,464 | ) | | | (76,981 | ) | | | (66,491 | ) | | | 47,699 | | | | (65,106 | ) |
| Total equity | | | 1,003,372 | | | | 1,005,212 | | | | 985,350 | | | | 945,863 | | | | 833,227 | | | | 575,661 | | | | 556,861 | | | | 371,503 | | | | 533,755 | | | | 998,044 | | | | 656,262 | |
Total liabilities and equity | | $ | 5,161,498 | | | $ | 5,263,730 | | | $ | 5,219,636 | | | $ | 5,293,887 | | | $ | 5,138,793 | | | $ | 5,315,643 | | | $ | 5,575,619 | | | $ | 7,040,306 | | | $ | 7,648,102 | | | $ | 5,214,742 | | | $ | 5,341,751 | |
(1) Core equity is a non-GAAP metric and is equal to GAAP equity excluding accumulated other comprehensive income (loss).
| | | |
THE REDWOOD REVIEW 3RD QUARTER 2010 | Table 6: Average Balance Sheet | 53 |
| | | |
| Table 7: Balances & Yields by Securities Portfolio at Redwood ($ in thousands) (1) | 54 |
| | | 2010 | | | 2010 | | | 2010 | | | 2009 | | | 2009 | | | 2009 | | | 2009 | | | | | 2010 | | | 2010 | | | 2010 | | | 2009 | | | 2009 | | | 2009 | | | 2009 | |
| | | Q3 | | | Q2 | | | Q1 | | | Q4 | | | Q3 | | | Q2 | | | Q1 | | | | | Q3 | | | Q2 | | | Q1 | | | Q4 | | | Q3 | | | Q2 | | | Q1 | |
| Residential Prime Senior AFS | | | | | | | | | | | | | | | | | | | | | | | Residential Non-Prime Subordinate AFS | | | | | | | | | | | | | | | | | | | | | |
| Current face | | $ | 368,191 | | | $ | 371,066 | | | $ | 450,647 | | | $ | 412,471 | | | $ | 431,289 | | | $ | 276,444 | | | $ | 160,009 | �� | | Current face | | $ | 27,461 | | | $ | 32,443 | | | $ | 56,128 | | | $ | 71,963 | | | $ | 143,357 | | | $ | 210,475 | | | $ | 307,754 | |
| Unamortized discount | | | (88,978 | ) | | | (93,502 | ) | | | (113,757 | ) | | | (116,801 | ) | | | (124,295 | ) | | | (91,221 | ) | | | (64,884 | ) | | Unamortized (discount) premium | | | (7,279 | ) | | | (7,558 | ) | | | (2,742 | ) | | | (242 | ) | | | (1,524 | ) | | | 852 | | | | 227 | |
| Credit reserve | | | (12,822 | ) | | | (10,084 | ) | | | (14,637 | ) | | | (9,898 | ) | | | (11,069 | ) | | | (3,486 | ) | | | (621 | ) | | Credit reserve | | | (11,323 | ) | | | (15,775 | ) | | | (47,805 | ) | | | (70,806 | ) | | | (140,046 | ) | | | (208,839 | ) | | | (305,422 | ) |
Unrealized gains (losses), net | | | 49,543 | | | | 42,222 | | | | 49,887 | | | | 43,436 | | | | 40,734 | | | | 1,729 | | | | (6,738 | ) | | Unrealized gains (losses), net | | | 953 | | | | 732 | | | | 772 | | | | 162 | | | | (806 | ) | | | 473 | | | | 1,705 | |
Fair value | | $ | 315,934 | | | $ | 309,702 | | | $ | 372,140 | | | $ | 329,208 | | | $ | 336,659 | | | $ | 183,466 | | | $ | 87,766 | | | Fair value | | $ | 9,812 | | | $ | 9,842 | | | $ | 6,353 | | | $ | 1,077 | | | $ | 981 | | | $ | 2,961 | | | $ | 4,264 | |
| | | | | | | | | | | | | | | | | | | | | | | | | | | | | | | | | | | | | | | | | | | | | | | | | | | | | | | | | | | |
| Average amortized cost | | $ | 270,286 | | | $ | 278,472 | | | $ | 283,477 | | | $ | 280,101 | | | $ | 264,773 | | | $ | 164,386 | | | $ | 77,602 | | | Average amortized cost | | $ | 8,988 | | | $ | 7,519 | | | $ | 4,047 | | | $ | 1,156 | | | $ | 1,994 | | | $ | 2,503 | | | $ | 3,149 | |
| Interest income | | $ | 7,617 | | | $ | 7,868 | | | $ | 8,455 | | | $ | 8,610 | | | $ | 8,431 | | | $ | 5,475 | | | $ | 2,798 | | | Interest income | | $ | 545 | | | $ | 603 | | | $ | 129 | | | $ | 8 | | | $ | 392 | | | $ | 1,615 | | | $ | 3,911 | |
| Annualized yield | | | 11.27 | % | | | 11.30 | % | | | 11.93 | % | | | 12.30 | % | | | 12.74 | % | | | 13.32 | % | | | 14.42 | % | | Annualized yield | | | 24.25 | % | | | 32.10 | % | | | 12.75 | % | | | 2.67 | % | | | 78.65 | % | | | 258.13 | % | | | 496.86 | % |
| | | | | | | | | | | | | | | | | | | | | | | | | | | | | | | | | | | | | | | | | | | | | | | | | | | | | | | | | | | |
| Residential Non-Prime Senior AFS | | | | | | | | | | | | | | | | | | | | | | | Commercial Subordinate AFS | | | | | | | | | | | | | | | | | | | | | |
| Current face | | $ | 431,143 | | | $ | 399,988 | | | $ | 471,894 | | | $ | 423,961 | | | $ | 395,311 | | | $ | 387,431 | | | $ | 173,962 | | | Current face | | $ | 109,275 | | | $ | 140,547 | | | $ | 152,408 | | | $ | 158,997 | | | $ | 486,245 | | | $ | 506,746 | | | $ | 512,117 | |
| Unamortized discount | | | (111,709 | ) | | | (110,018 | ) | | | (133,479 | ) | | | (133,995 | ) | | | (132,036 | ) | | | (133,753 | ) | | | (69,015 | ) | | Unamortized (discount) premium | | | (5,610 | ) | | | (5,534 | ) | | | (5,660 | ) | | | (5,130 | ) | | | (1,624 | ) | | | (120 | ) | | | 13,798 | |
| Credit reserve | | | (14,193 | ) | | | (10,894 | ) | | | (13,830 | ) | | | (13,468 | ) | | | (10,098 | ) | | | (16,009 | ) | | | (4,159 | ) | | Credit reserve | | | (96,657 | ) | | | (127,627 | ) | | | (139,320 | ) | | | (146,018 | ) | | | (471,957 | ) | | | (492,459 | ) | | | (497,784 | ) |
Unrealized gains (losses), net | | | 27,588 | | | | 24,559 | | | | 24,556 | | | | 32,371 | | | | 23,322 | | | | (7,410 | ) | | | (27,116 | ) | | Unrealized gains (losses), net | | | 904 | | | | 224 | | | | 1,448 | | | | 1,351 | | | | 4,169 | | | | 1,502 | | | | (5,216 | ) |
Fair value | | $ | 332,829 | | | $ | 303,635 | | | $ | 349,141 | | | $ | 308,869 | | | $ | 276,499 | | | $ | 230,259 | | | $ | 73,672 | | | Fair value | | $ | 7,912 | | | $ | 7,610 | | | $ | 8,876 | | | $ | 9,200 | | | $ | 16,833 | | | $ | 15,669 | | | $ | 22,915 | |
| | | | | | | | | | | | | | | | | | | | | | | | | | | | | | | | | | | | | | | | | | | | | | | | | | | | | | | | | | | |
| Average amortized cost | | $ | 297,197 | | | $ | 286,462 | | | $ | 292,210 | | | $ | 259,911 | | | $ | 269,501 | | | $ | 167,679 | | | $ | 86,599 | | | Average amortized cost | | $ | 7,274 | | | $ | 7,417 | | | $ | 7,670 | | | $ | 8,090 | | | $ | 13,504 | | | $ | 25,006 | | | $ | 46,382 | |
| Interest income | | $ | 8,583 | | | $ | 9,007 | | | $ | 10,208 | | | $ | 7,907 | | | $ | 10,374 | | | $ | 6,607 | | | $ | 3,311 | | | Interest income | | $ | 2,135 | | | $ | 696 | | | $ | 716 | | | $ | 1,233 | | | $ | 2,192 | | | $ | 1,599 | | | $ | 500 | |
| Annualized yield | | | 11.55 | % | | | 12.58 | % | | | 13.97 | % | | | 12.17 | % | | | 15.40 | % | | | 15.76 | % | | | 15.29 | % | | Annualized yield | | | 117.40 | % | | | 37.55 | % | | | 37.36 | % | | | 60.97 | % | | | 64.93 | % | | | 25.58 | % | | | 4.31 | % |
| | | | | | | | | | | | | | | | | | | | | | | | | | | | | | | | | | | | | | | | | | | | | | | | | | | | | | | | | | | |
| Residential Re-REMIC AFS | | | | | | | | | | | | | | | | | | | | | | | CDO Subordinate AFS | | | | | | | | | | | | | | | | | | | | | |
| Current face | | $ | 139,426 | | | $ | 139,426 | | | $ | 146,964 | | | $ | 255,975 | | | $ | 318,703 | | | $ | 236,070 | | | $ | - | | | Current face | | $ | 14,786 | | | $ | 14,761 | | | $ | 14,736 | | | $ | 14,710 | | | $ | 14,683 | | | $ | 14,650 | | | $ | 14,616 | |
| Unamortized discount | | | (65,691 | ) | | | (68,049 | ) | | | (68,806 | ) | | | (109,807 | ) | | | (144,351 | ) | | | (134,621 | ) | | | - | | | Unamortized discount | | | (1,082 | ) | | | (1,083 | ) | | | (1,083 | ) | | | (1,082 | ) | | | (1,083 | ) | | | (1,082 | ) | | | (1,057 | ) |
| Credit reserve | | | (40,656 | ) | | | (37,962 | ) | | | (42,299 | ) | | | (81,726 | ) | | | (94,626 | ) | | | (45,874 | ) | | | - | | | Credit reserve | | | (13,704 | ) | | | (13,678 | ) | | | (13,653 | ) | | | (13,628 | ) | | | (13,600 | ) | | | (13,568 | ) | | | (13,534 | ) |
Unrealized gains (losses), net | | | 41,812 | | | | 35,655 | | | | 31,054 | | | | 41,509 | | | | 13,781 | | | | (434 | ) | | | - | | | Unrealized gains, net | | | - | | | | - | | | | - | | | | 25 | | | | 25 | | | | 25 | | | | - | |
Fair value | | $ | 74,891 | | | $ | 69,070 | | | $ | 66,913 | | | $ | 105,951 | | | $ | 93,507 | | | $ | 55,141 | | | $ | - | | | Fair value | | $ | - | | | $ | - | | | $ | - | | | $ | 25 | | | $ | 25 | | | $ | 25 | | | $ | 25 | |
| | | | | | | | | | | | | | | | | | | | | | | | | | | | | | | | | | | | | | | | | | | | | | | | | | | | | | | | | | | |
| Average amortized cost | | $ | 33,250 | | | $ | 34,385 | | | $ | 45,852 | | | $ | 73,938 | | | $ | 69,980 | | | $ | 26,419 | | | $ | - | | | Average amortized cost | | $ | - | | | $ | - | | | $ | - | | | $ | - | | | $ | - | | | $ | 21 | | | $ | 25 | |
| Interest income | | $ | 1,458 | | | $ | 1,382 | | | $ | 1,925 | | | $ | 2,941 | | | $ | 3,110 | | | $ | 573 | | | $ | - | | | Interest income | | $ | 8 | | | $ | 82 | | | $ | 12 | | | $ | 96 | | | $ | 24 | | | $ | 96 | | | $ | 10 | |
| Annualized yield | | | 17.55 | % | | | 16.08 | % | | | 16.79 | % | | | 15.91 | % | | | 17.77 | % | | | 8.67 | % | | | - | | | Annualized yield | | | N/A | | | | N/A | | | | N/A | | | | N/A | | | | 12.97 | % | | | 25.09 | % | | | 153.66 | % |
| | | | | | | | | | | | | | | | | | | | | | | | | | | | | | | | | | | | | | | | | | | | | | | | | | | | | | | | | | | |
| Residential Prime Subordinate AFS | | | | | | | | | | | | | | | | | | | | | | | Fair Value Securities | | | | | | | | | | | | | | | | | | | | | |
| Current face | | $ | 278,171 | | | $ | 297,932 | | | $ | 324,226 | | | $ | 347,848 | | | $ | 378,417 | | | $ | 411,166 | | | $ | 418,714 | | | | | | | | | | | | | | | | | | | | | | | | | | | | | | | |
| Unamortized discount | | | (23,488 | ) | | | (22,886 | ) | | | (23,310 | ) | | | (21,588 | ) | | | (22,597 | ) | | | (28,259 | ) | | | (87,196 | ) | | | | | | | | | | | | | | | | | | | | | | | | | | | | | | |
| Credit reserve | | | (217,996 | ) | | | (240,357 | ) | | | (261,854 | ) | | | (282,813 | ) | | | (306,728 | ) | | | (319,653 | ) | | | (291,592 | ) | | | | | | | | | | | | | | | | | | | | | | | | | | | | | | |
Unrealized losses, net | | | (3,663 | ) | | | (18,665 | ) | | | (22,812 | ) | | | (24,256 | ) | | | (27,643 | ) | | | (37,112 | ) | | | (11,606 | ) | | | | | | | | | | | | | | | | | | | | | | | | | | | | | | |
Fair value | | $ | 33,024 | | | $ | 16,024 | | | $ | 16,250 | | | $ | 19,191 | | | $ | 21,449 | | | $ | 26,142 | | | $ | 28,320 | | | Fair value | | $ | 22,826 | | | $ | 18,464 | | | $ | 19,990 | | | $ | 7,842 | | | $ | 5,314 | | | $ | 3,810 | | | $ | 4,308 | |
| | | | | | | | | | | | | | | | | | | | | | | | | | | | | | | | | | | | | | | | | | | | | | | | | | | | | | | | | | | |
| Average amortized cost | | $ | 35,443 | | | $ | 37,731 | | | $ | 41,373 | | | $ | 46,637 | | | $ | 58,063 | | | $ | 42,353 | | | $ | 46,021 | | | Average fair value | | $ | 20,539 | | | $ | 17,743 | | | $ | 20,494 | | | $ | 5,740 | | | $ | 3,905 | | | $ | 4,209 | | | $ | 2,316 | |
| Interest income | | $ | 3,328 | | | $ | 3,219 | | | $ | 2,847 | | | $ | 3,406 | | | $ | 4,135 | | | $ | 3,703 | | | $ | 8,220 | | | Interest income | | $ | 2,350 | | | $ | 2,559 | | | $ | 2,957 | | | $ | 1,102 | | | $ | 1,231 | | | $ | 872 | | | $ | 2,858 | |
Annualized yield | | | 37.55 | % | | | 34.13 | % | | | 27.53 | % | | | 29.21 | % | | | 28.49 | % | | | 34.97 | % | | | 71.44 | % | | Annualized yield | | | 45.76 | % | | | 57.68 | % | | | 57.72 | % | | | 76.79 | % | | | 126.12 | % | | | 82.86 | % | | | 493.71 | % |
(1) Cash flows from our investments can be very sporadic and, to some extent, unexpected. The fair value of some assets is close to zero and any interest income results in unusually high reported yields that are not sustainable.
| | | |
THE REDWOOD REVIEW 3RD QUARTER 2010 | Table 7: Balances & Yields by Securities Portfolio at Redwood | |
| | | |
| Table 8: Securities Portfolio Activity at Redwood ($ in thousands) | |
| | | 2010 | | | 2010 | | | 2010 | | | 2009 | | | 2009 | | | 2009 | | | 2009 | | | | | 2010 | | | 2010 | | | 2010 | | | 2009 | | | 2009 | | | 2009 | | | 2009 | |
| | | Q3 | | | Q2 | | | Q1 | | | Q4 | | | Q3 | | | Q2 | | | Q1 | | | | | Q3 | | | Q2 | | | Q1 | | | Q4 | | | Q3 | | | Q2 | | | Q1 | |
| Residential Prime Senior | | | | | | | | | | | | | | | | | | | | | | | Residential Real Estate Loans | | | | | | | | | | | | | | | | | | | | | |
| Beginning fair value | | $ | 309,702 | | | $ | 372,140 | | | $ | 329,208 | | | $ | 336,659 | | | $ | 183,466 | | | $ | 87,766 | | | $ | 50,965 | | | Beginning fair value | | $ | 2,404 | | | $ | 2,227 | | | $ | 2,374 | | | $ | 2,299 | | | $ | 2,336 | | | $ | 2,577 | | | $ | 2,624 | |
| Acquisitions | | | 9,954 | | | | 1,055 | | | | 56,010 | | | | 27,607 | | | | 134,738 | | | | 120,982 | | | | 49,107 | | | Principal payments | | | 62,135 | | | | - | | | | - | | | | - | | | | - | | | | - | | | | - | |
| Sales | | | - | | | | (43,485 | ) | | | (8,780 | ) | | | (24,104 | ) | | | (5,091 | ) | | | (35,713 | ) | | | - | | | (Premium) discount amortization | | | (601 | ) | | | 46 | | | | (27 | ) | | | (30 | ) | | | (28 | ) | | | (185 | ) | | | (27 | ) |
| Effect of principal payments | | | (12,186 | ) | | | (13,065 | ) | | | (11,220 | ) | | | (13,632 | ) | | | (13,121 | ) | | | (6,499 | ) | | | (2,337 | ) | | Transfers to REO | | | (63 | ) | | | (165 | ) | | | - | | | | - | | | | - | | | | - | | | | - | |
Change in fair value, net | | | 8,464 | | | | (6,943 | ) | | | 6,922 | | | | 2,678 | | | | 36,667 | | | | 16,930 | | | | (9,969 | ) | | Changes in fair value, net | | | (388 | ) | | | 296 | | | | (120 | ) | | | 105 | | | | (9 | ) | | | (56 | ) | | | (20 | ) |
Ending fair value | | $ | 315,934 | | | $ | 309,702 | | | $ | 372,140 | | | $ | 329,208 | | | $ | 336,659 | | | $ | 183,466 | | | $ | 87,766 | | | Ending fair value | | $ | 63,487 | | | $ | 2,404 | | | $ | 2,227 | | | $ | 2,374 | | | $ | 2,299 | | | $ | 2,336 | | | $ | 2,577 | |
| | | | | | | | | | | | | | | | | | | | | | | | | | | | | | | | | | | | | | | | | | | | | | | | | | | | | | | | | | | |
| Residential Non-Prime Senior | | | | | | | | | | | | | | | | | | | | | | | Commercial Subordinate | | | | | | | | | | | | | | | | | | | | | |
| Beginning fair value | | $ | 320,397 | | | $ | 367,372 | | | $ | 314,952 | | | $ | 279,000 | | | $ | 230,955 | | | $ | 74,383 | | | $ | 42,820 | | | Beginning fair value | | $ | 7,610 | | | $ | 8,876 | | | $ | 9,200 | | | $ | 16,833 | | | $ | 15,669 | | | $ | 22,915 | | | $ | 42,490 | |
| Acquisitions | | | 32,777 | | | | 16,113 | | | | 118,195 | | | | 37,157 | | | | 84,837 | | | | 162,745 | | | | 48,444 | | | Acquisitions | | | - | | | | - | | | | - | | | | - | | | | - | | | | - | | | | - | |
| Sales | | | - | | | | (54,285 | ) | | | (49,361 | ) | | | - | | | | (56,299 | ) | | | (14,613 | ) | | | (373 | ) | | Sales | | | - | | | | - | | | | - | | | | (4,778 | ) | | | - | | | | - | | | | - | |
| Effect of principal payments | | | (9,657 | ) | | | (12,582 | ) | | | (10,242 | ) | | | (10,214 | ) | | | (11,083 | ) | | | (5,128 | ) | | | (1,573 | ) | | Effect of principal payments | | | - | | | | - | | | | - | | | | - | | | | - | | | | - | | | | - | |
Change in fair value, net | | | 10,589 | | | | 3,779 | | | | (6,171 | ) | | | 9,009 | | | | 30,590 | | | | 13,568 | | | | (14,935 | ) | | Change in fair value, net | | | 302 | | | | (1,266 | ) | | | (324 | ) | | | (2,855 | ) | | | 1,164 | | | | (7,246 | ) | | | (19,575 | ) |
Ending fair value | | $ | 354,106 | | | $ | 320,397 | | | $ | 367,372 | | | $ | 314,952 | | | $ | 279,000 | | | $ | 230,955 | | | $ | 74,383 | | | Ending fair value | | $ | 7,912 | | | $ | 7,610 | | | $ | 8,876 | | | $ | 9,200 | | | $ | 16,833 | | | $ | 15,669 | | | $ | 22,915 | |
| | | | | | | | | | | | | | | | | | | | | | | | | | | | | | | | | | | | | | | | | | | | | | | | | | | | | | | | | | | |
| Re-REMIC | | | | | | | | | | | | | | | | | | | | | | | Commercial Real Estate Loans | | | | | | | | | | | | | | | | | | | | | |
| Beginning fair value | | $ | 69,070 | | | $ | 66,913 | | | $ | 105,951 | | | $ | 93,507 | | | $ | 55,141 | | | $ | - | | | $ | - | | | Beginning fair value | | $ | 243 | | | $ | 244 | | | $ | 245 | | | $ | 246 | | | $ | 247 | | | $ | 248 | | | $ | 249 | |
| Acquisitions | | | - | | | | - | | | | - | | | | 3,367 | | | | 25,073 | | | | 55,562 | | | | - | | | Principal payments | | | (2 | ) | | | (2 | ) | | | (2 | ) | | | (2 | ) | | | (2 | ) | | | (2 | ) | | | (2 | ) |
| Sales | | | - | | | | (1,960 | ) | | | (27,932 | ) | | | (17,368 | ) | | | - | | | | - | | | | - | | | Discount amortization | | | 1 | | | | 1 | | | | 1 | | | | 1 | | | | 1 | | | | 1 | | | | 1 | |
| Effect of principal payments | | | - | | | | - | | | | - | | | | - | | | | - | | | | - | | | | - | | | Credit provision | | | - | | | | - | | | | - | | | | - | | | | - | | | | - | | | | - | |
Change in fair value, net | | | 5,821 | | | | 4,117 | | | | (11,106 | ) | | | 26,445 | | | | 13,293 | | | | (421 | ) | | | - | | | Changes in fair value, net | | | - | | | | - | | | | - | | | | - | | | | - | | | | - | | | | - | |
Ending fair value | | $ | 74,891 | | | $ | 69,070 | | | $ | 66,913 | | | $ | 105,951 | | | $ | 93,507 | | | $ | 55,141 | | | $ | - | | | Ending fair value | | $ | 242 | | | $ | 243 | | | $ | 244 | | | $ | 245 | | | $ | 246 | | | $ | 247 | | | $ | 248 | |
| | | | | | | | | | | | | | | | | | | | | | | | | | | | | | | | | | | | | | | | | | | | | | | | | | | | | | | | | | | |
| Residential Prime Subordinate | | | | | | | | | | | | | | | | | | | | | | | CDO Subordinate | | | | | | | | | | | | | | | | | | | | | |
| Beginning fair value | | $ | 16,406 | | | $ | 16,596 | | | $ | 19,510 | | | $ | 21,926 | | | $ | 26,742 | | | $ | 29,012 | | | $ | 43,787 | | | Beginning fair value | | $ | 1,132 | | | $ | 1,222 | | | $ | 1,247 | | | $ | 2,137 | | | $ | 2,308 | | | $ | 2,657 | | | $ | 3,610 | |
| Acquisitions | | | 7,088 | | | | 2,223 | | | | - | | | | - | | | | 1,390 | | | | 1,829 | | | | - | | | Acquisitions | | | - | | | | - | | | | - | | | | - | | | | - | | | | - | | | | - | |
| Sales | | | - | | | | - | | | | - | | | | - | | | | (1,409 | ) | | | - | | | | - | | | Sales | | | - | | | | - | | | | - | | | | - | | | | - | | | | - | | | | - | |
| Effect of principal payments | | | 883 | | | | (474 | ) | | | (415 | ) | | | (526 | ) | | | (880 | ) | | | (1,050 | ) | | | (946 | ) | | Effect of principal payments | | | - | | | | - | | | | - | | | | - | | | | - | | | | - | | | | (37 | ) |
Change in fair value, net | | | 9,007 | | | | (1,939 | ) | | | (2,499 | ) | | | (1,890 | ) | | | (3,917 | ) | | | (3,049 | ) | | | (13,829 | ) | | Change in fair value, net | | | (172 | ) | | | (90 | ) | | | (25 | ) | | | (890 | ) | | | (171 | ) | | | (349 | ) | | | (916 | ) |
Ending fair value | | $ | 33,384 | | | $ | 16,406 | | | $ | 16,596 | | | $ | 19,510 | | | $ | 21,926 | | | $ | 26,742 | | | $ | 29,012 | | | Ending fair value | | $ | 960 | | | $ | 1,132 | | | $ | 1,222 | | | $ | 1,247 | | | $ | 2,137 | | | $ | 2,308 | | | $ | 2,657 | |
| | | | | | | | | | | | | | | | | | | | | | | | | | | | | | | | | | | | | | | | | | | | | | | | | | | | | | | | | | | |
| Residential Non-Prime Subordinate | | | | | | | | | | | | | | | | | | | | | | | | | | | | | | | | | | | | | | | | | | | | | | | | | | | |
| Beginning fair value | | $ | 10,030 | | | $ | 6,544 | | | $ | 1,295 | | | $ | 1,205 | | | $ | 3,192 | | | $ | 4,537 | | | $ | 7,313 | | | | | | | | | | | | | | | | | | | | | | | | | | | | | | | |
| Acquisitions | | | - | | | | 3,894 | | | | 5,472 | | | | - | | | | - | | | | - | | | | - | | | | | | | | | | | | | | | | | | | | | | | | | | | | | | | |
| Sales | | | - | | | | - | | | | - | | | | - | | | | - | | | | - | | | | - | | | | | | | | | | | | | | | | | | | | | | | | | | | | | | | |
| Effect of principal payments | | | (320 | ) | | | (352 | ) | | | (111 | ) | | | (25 | ) | | | (38 | ) | | | (67 | ) | | | (98 | ) | | | | | | | | | | | | | | | | | | | | | | | | | | | | | | |
Change in fair value, net | | | 331 | | | | (56 | ) | | | (112 | ) | | | 115 | | | | (1,949 | ) | | | (1,278 | ) | | | (2,678 | ) | | | | | | | | | | | | | | | | | | | | | | | | | | | | | | |
Ending fair value | | $ | 10,041 | | | $ | 10,030 | | | $ | 6,544 | | | $ | 1,295 | | | $ | 1,205 | | | $ | 3,192 | | | $ | 4,537 | | | | | | | | | | | | | | | | | | | | | | | | | | | | | | | |
| | | |
THE REDWOOD REVIEW 3RD QUARTER 2010 | Table 8: Securities Portfolio Activity at Redwood | 55 |
| | | |
| Table 9A: Residential Prime Securities at Redwood and Underlying Loan Characteristics ($ in thousands) | 56 |
| | | 2010 | | | 2010 | | | 2010 | | | 2009 | | | 2009 | | | 2009 | | | 2009 | | | | | 2010 | | | 2010 | | | 2010 | | | 2009 | | | 2009 | | | 2009 | | | 2009 | |
| | | Q3 | | | Q2 | | | Q1 | | | Q4 | | | Q3 | | | Q2 | | | Q1 | | | | | Q3 | | | Q2 | | | Q1 | | | Q4 | | | Q3 | | | Q2 | | | Q1 | |
| Residential Senior Prime | | | | | | | | | | | | | | | | | | | | | | | | | | | | | | | | | | | | | | | | | | | | | | | | | | | | | | | | | | |
| Principal value | | $ | 368,191 | | | $ | 371,066 | | | $ | 450,647 | | | $ | 412,471 | | | $ | 431,289 | | | $ | 276,444 | | | $ | 160,009 | | | Southern CA | | | 25 | % | | | 25 | % | | | 25 | % | | | 25 | % | | | 27 | % | | | 24 | % | | | 24 | % |
| Unamortized discount | | | (88,978 | ) | | | (93,502 | ) | | | (113,757 | ) | | | (116,801 | ) | | | (124,295 | ) | | | (91,221 | ) | | | (64,884 | ) | | Northern CA | | | 22 | % | | | 22 | % | | | 22 | % | | | 22 | % | | | 20 | % | | | 23 | % | | | 23 | % |
| Credit reserve | | | (12,822 | ) | | | (10,084 | ) | | | (14,637 | ) | | | (9,898 | ) | | | (11,069 | ) | | | (3,486 | ) | | | (621 | ) | | New York | | | 7 | % | | | 6 | % | | | 7 | % | | | 7 | % | | | 6 | % | | | 7 | % | | | 7 | % |
| Unrealized gains (losses) | | | 49,543 | | | | 42,222 | | | | 49,887 | | | | 43,436 | | | | 40,734 | | | | 1,729 | | | | (6,738 | ) | | Florida | | | 6 | % | | | 6 | % | | | 6 | % | | | 6 | % | | | 7 | % | | | 5 | % | | | 5 | % |
| Fair value | | $ | 315,934 | | | $ | 309,702 | | | $ | 372,140 | | | $ | 329,208 | | | $ | 336,659 | | | $ | 183,466 | | | $ | 87,766 | | | Virginia | | | 4 | % | | | 4 | % | | | 4 | % | | | 4 | % | | | 2 | % | | | 4 | % | | | 4 | % |
| Fair value / principal value | | | 86 | % | | | 83 | % | | | 83 | % | | | 80 | % | | | 78 | % | | | 66 | % | | | 55 | % | | New Jersey | | | 3 | % | | | 3 | % | | | 3 | % | | | 3 | % | | | 3 | % | | | 3 | % | | | 3 | % |
| | | | | | | | | | | | | | | | | | | | | | | | | | | | | | | Illinois | | | 3 | % | | | 3 | % | | | 3 | % | | | 3 | % | | | 2 | % | | | 3 | % | | | 3 | % |
| Security Type | | | | | | | | | | | | | | | | | | | | | | | | | | | | | | Georgia | | | 2 | % | | | 2 | % | | | 2 | % | | | 2 | % | | | 2 | % | | | 2 | % | | | 2 | % |
| ARM | | $ | - | | | $ | - | | | $ | - | | | $ | - | | | $ | - | | | $ | - | | | $ | - | | | Texas | | | 2 | % | | | 2 | % | | | 2 | % | | | 2 | % | | | 3 | % | | | 2 | % | | | 2 | % |
| Hybrid | | | 273,281 | | | | 272,866 | | | | 333,760 | | | | 298,245 | | | | 306,402 | | | | 175,940 | | | | 86,282 | | | Arizona | | | 2 | % | | | 2 | % | | | 2 | % | | | 2 | % | | | 2 | % | | | 2 | % | | | 2 | % |
| Fixed | | | 42,653 | | | | 36,836 | | | | 38,380 | | | | 30,963 | | | | 30,257 | | | | 7,526 | | | | 1,484 | | | Colorado | | | 2 | % | | | 2 | % | | | 2 | % | | | 2 | % | | | 4 | % | | | 2 | % | | | 2 | % |
| Total fair value | | $ | 315,934 | | | $ | 309,702 | | | $ | 372,140 | | | $ | 329,208 | | | $ | 336,659 | | | $ | 183,466 | | | $ | 87,766 | | | Other states | | | 22 | % | | | 23 | % | | | 22 | % | | | 22 | % | | | 22 | % | | | 23 | % | | | 23 | % |
| | | | | | | | | | | | | | | | | | | | | | | | | | | | | | | | | | | | | | | | | | | | | | | | | | | | | | | | | | | |
| Residential Senior Prime | | | | | | | | | | | | | | | | | | | | | | | | | | | | | | Wtd Avg Original LTV | | | 68 | % | | | 68 | % | | | 68 | % | | | 68 | % | | | 68 | % | | | 68 | % | | | 68 | % |
| Coupon income | | $ | 3,989 | | | $ | 4,356 | | | $ | 4,870 | | | $ | 5,057 | | | $ | 4,743 | | | $ | 3,066 | | | $ | 1,733 | | | Original LTV: 0 - 50 | | | 13 | % | | | 13 | % | | | 13 | % | | | 13 | % | | | 13 | % | | | 13 | % | | | 13 | % |
| Discount amortization | | | 3,628 | | | | 3,512 | | | | 3,585 | | | | 3,553 | | | | 3,688 | | | | 2,410 | | | | 1,128 | | | Original LTV: 50.01 - 60 | | | 11 | % | | | 12 | % | | | 11 | % | | | 11 | % | | | 12 | % | | | 12 | % | | | 12 | % |
| Total interest income | | $ | 7,617 | | | $ | 7,868 | | | $ | 8,455 | | | $ | 8,610 | | | $ | 8,431 | | | $ | 5,476 | | | $ | 2,861 | | | Original LTV: 60.01 - 70 | | | 22 | % | | | 22 | % | | | 22 | % | | | 22 | % | | | 22 | % | | | 22 | % | | | 22 | % |
| | | | | | | | | | | | | | | | | | | | | | | | | | | | | | | Original LTV: 70.01 - 80 | | | 49 | % | | | 50 | % | | | 51 | % | | | 50 | % | | | 50 | % | | | 49 | % | | | 49 | % |
| Average amortized cost | | $ | 270,286 | | | $ | 278,472 | | | $ | 283,477 | | | $ | 280,101 | | | $ | 264,773 | | | $ | 164,386 | | | $ | 77,602 | | | Original LTV: 80.01 - 90 | | | 3 | % | | | 2 | % | | | 2 | % | | | 2 | % | | | 2 | % | | | 2 | % | | | 2 | % |
| | | | | | | | | | | | | | | | | | | | | | | | | | | | | | | Original LTV: 90.01 - 100 | | | 2 | % | | | 1 | % | | | 1 | % | | | 1 | % | | | 1 | % | | | 1 | % | | | 1 | % |
| Coupon income % | | | 5.90 | % | | | 6.26 | % | | | 6.87 | % | | | 7.22 | % | | | 7.17 | % | | | 7.46 | % | | | 8.93 | % | | Unknown | | | 0 | % | | | 0 | % | | | 0 | % | | | 1 | % | | | 0 | % | | | 1 | % | | | 1 | % |
| Discount amortization % | | | 5.37 | % | | | 5.04 | % | | | 5.06 | % | | | 5.07 | % | | | 5.57 | % | | | 5.86 | % | | | 5.81 | % | | | | | | | | | | | | | | | | | | | | | | | | | | | | | | |
| Annualized yield | | | 11.27 | % | | | 11.30 | % | | | 11.93 | % | | | 12.30 | % | | | 12.74 | % | | | 13.32 | % | | | 14.75 | % | | Wtd Avg FICO | | | 738 | | | | 739 | | | | 740 | | | | 740 | | | | 740 | | | | 741 | | | | 741 | |
| | | | | | | | | | | | | | | | | | | | | | | | | | | | | | | FICO: <= 600 | | | 0 | % | | | 0 | % | | | 0 | % | | | 0 | % | | | 0 | % | | | 0 | % | | | 0 | % |
| Residential Subordinate Prime | | | | | | | | | | | | | | | | | | | | | | | | | | | | | | FICO: 601 - 620 | | | 0 | % | | | 0 | % | | | 0 | % | | | 0 | % | | | 0 | % | | | 0 | % | | | 0 | % |
| Principal value | | $ | 278,417 | | | $ | 298,707 | | | $ | 324,045 | | | $ | 348,678 | | | $ | 379,276 | | | $ | 412,052 | | | $ | 419,631 | | | FICO: 621 - 640 | | | 1 | % | | | 1 | % | | | 1 | % | | | 1 | % | | | 1 | % | | | 1 | % | | | 1 | % |
| Unamortized discount | | | (23,374 | ) | | | (23,279 | ) | | | (23,783 | ) | | | (22,099 | ) | | | (22,979 | ) | | | (28,545 | ) | | | (87,421 | ) | | FICO: 641 - 660 | | | 2 | % | | | 2 | % | | | 2 | % | | | 2 | % | | | 2 | % | | | 2 | % | | | 2 | % |
| Credit reserve | | | (217,996 | ) | | | (240,357 | ) | | | (261,854 | ) | | | (282,813 | ) | | | (306,728 | ) | | | (319,653 | ) | | | (291,592 | ) | | FICO: 661 - 680 | | | 5 | % | | | 5 | % | | | 5 | % | | | 5 | % | | | 5 | % | | | 5 | % | | | 5 | % |
| Unrealized loss | | | (3,663 | ) | | | (18,665 | ) | | | (22,812 | ) | | | (24,256 | ) | | | (27,643 | ) | | | (37,112 | ) | | | (11,606 | ) | | FICO: 681 - 700 | | | 10 | % | | | 9 | % | | | 9 | % | | | 9 | % | | | 9 | % | | | 9 | % | | | 9 | % |
| Fair value | | $ | 33,384 | | | $ | 16,406 | | | $ | 16,596 | | | $ | 19,510 | | | $ | 21,926 | | | $ | 26,742 | | | $ | 29,012 | | | FICO: 701 - 720 | | | 14 | % | | | 14 | % | | | 14 | % | | | 14 | % | | | 14 | % | | | 13 | % | | | 13 | % |
| Fair value / principal value | | | 12 | % | | | 5 | % | | | 5 | % | | | 6 | % | | | 6 | % | | | 6 | % | | | 7 | % | | FICO: 721 - 740 | | | 15 | % | | | 15 | % | | | 14 | % | | | 14 | % | | | 14 | % | | | 14 | % | | | 14 | % |
| | | | | | | | | | | | | | | | | | | | | | | | | | | | | | | FICO: 741 - 760 | | | 16 | % | | | 16 | % | | | 16 | % | | | 16 | % | | | 16 | % | | | 16 | % | | | 16 | % |
| Security Type | | | | | | | | | | | | | | | | | | | | | | | | | | | | | | FICO: 761 - 780 | | | 19 | % | | | 19 | % | | | 19 | % | | | 19 | % | | | 19 | % | | | 19 | % | | | 19 | % |
| ARM | | $ | 5,526 | | | $ | 3,262 | | | $ | 1,164 | | | $ | 1,202 | | | $ | 1,301 | | | $ | 1,413 | | | $ | 1,736 | | | FICO: 781 - 800 | | | 13 | % | | | 13 | % | | | 14 | % | | | 14 | % | | | 14 | % | | | 15 | % | | | 15 | % |
| Hybrid | | | 18,695 | | | | 8,884 | | | | 10,334 | | | | 13,028 | | | | 14,780 | | | | 18,544 | | | | 20,325 | | | FICO: >= 801 | | | 3 | % | | | 3 | % | | | 4 | % | | | 4 | % | | | 4 | % | | | 4 | % | | | 4 | % |
| Fixed | | | 9,163 | | | | 4,260 | | | | 5,098 | | | | 5,280 | | | | 5,845 | | | | 6,785 | | | | 6,951 | | | Unknown | | | 2 | % | | | 3 | % | | | 2 | % | | | 2 | % | | | 2 | % | | | 2 | % | | | 2 | % |
| Total fair value | | $ | 33,384 | | | $ | 16,406 | | | $ | 16,596 | | | $ | 19,510 | | | $ | 21,926 | | | $ | 26,742 | | | $ | 29,012 | | | | | | | | | | | | | | | | | | | | | | | | | | | | | | | |
| | | | | | | | | | | | | | | | | | | | | | | | | | | | | | | Conforming balance % (2) | | | 58 | % | | | 58 | % | | | 57 | % | | | 58 | % | | | 59 | % | | | 59 | % | | | 60 | % |
| Residential Subordinate Prime | | | | | | | | | | | | | | | | | | | | | | | | | | | | | | > $1 MM % | | | 9 | % | | | 9 | % | | | 9 | % | | | 9 | % | | | 8 | % | | | 8 | % | | | 8 | % |
| Coupon income | | $ | 2,910 | | | $ | 3,201 | | | $ | 3,172 | | | $ | 3,972 | | | $ | 4,698 | | | $ | 5,155 | | | $ | 5,615 | | | | | | | | | | | | | | | | | | | | | | | | | | | | | | | |
| Discount (premium) amortization | | | 495 | | | | 96 | | | | (228 | ) | | | (439 | ) | | | (399 | ) | | | (1,248 | ) | | | 2,887 | | | 2nd Home % | | | 7 | % | | | 7 | % | | | 7 | % | | | 7 | % | | | 7 | % | | | 7 | % | | | 7 | % |
| Total interest income | | $ | 3,405 | | | $ | 3,297 | | | $ | 2,944 | | | $ | 3,533 | | | $ | 4,299 | | | $ | 3,907 | | | $ | 8,502 | | | Investment Home % | | | 2 | % | | | 2 | % | | | 2 | % | | | 2 | % | | | 2 | % | | | 2 | % | | | 1 | % |
| | | | | | | | | | | | | | | | | | | | | | | | | | | | | | | | | | | | | | | | | | | | | | | | | | | | | | | | | | | |
| Average amortized cost | | $ | 35,794 | | | $ | 38,079 | | | $ | 41,701 | | | $ | 46,637 | | | $ | 58,063 | | | $ | 42,353 | | | $ | 46,021 | | | | | | | | | | | | | | | | | | | | | | | | | | | | | | | |
| | | | | | | | | | | | | | | | | | | | | | | | | | | | | | | Purchase | | | 43 | % | | | 43 | % | | | 45 | % | | | 44 | % | | | 44 | % | | | 44 | % | | | 44 | % |
| Coupon income % | | | 32.52 | % | | | 33.62 | % | | | 30.43 | % | | | 34.07 | % | | | 32.37 | % | | | 48.69 | % | | | 48.81 | % | | Cash Out Refi | | | 22 | % | | | 22 | % | | | 22 | % | | | 22 | % | | | 22 | % | | | 21 | % | | | 21 | % |
| Discount (premium) amortization % | | | 5.53 | % | | | 1.01 | % | | | (2.19 | %) | | | (3.76 | %) | | | (2.75 | %) | | | (11.79 | %) | | | 25.09 | % | | Rate-Term Refi | | | 34 | % | | | 34 | % | | | 33 | % | | | 33 | % | | | 33 | % | | | 34 | % | | | 34 | % |
| Annualized yield | | | 38.05 | % | | | 34.63 | % | | | 28.24 | % | | | 30.30 | % | | | 29.62 | % | | | 36.90 | % | | | 73.90 | % | | Construction | | | 0 | % | | | 0 | % | | | 0 | % | | | 0 | % | | | 0 | % | | | 0 | % | | | 0 | % |
| | | | | | | | | | | | | | | | | | | | | | | | | | | | | | | Other | | | 1 | % | | | 1 | % | | | 0 | % | | | 1 | % | | | 1 | % | | | 1 | % | | | 1 | % |
Underlying Prime Loan Characteristics (1) | | | | | | | | | | | | | | | | | | | | | | | | | | | | | | | | | | | | | | | | | | | | | | | | | | | | | | | | | | |
| | | | | | | | | | | | | | | | | | | | | | | | | | | | | | | Full Doc | | | 50 | % | | | 55 | % | | | 55 | % | | | 55 | % | | | 55 | % | | | 56 | % | | | 55 | % |
| Number of loans | | | 124,536 | | | | 140,951 | | | | 156,375 | | | | 168,449 | | | | 184,849 | | | | 201,789 | | | | 216,362 | | | No Doc | | | 5 | % | | | 5 | % | | | 5 | % | | | 5 | % | | | 5 | % | | | 4 | % | | | 4 | % |
| Total loan face | | $ | 52,490,472 | | | $ | 59,814,476 | | | $ | 71,413,439 | | | $ | 76,332,218 | | | $ | 84,519,707 | | | $ | 92,121,182 | | | $ | 98,573,943 | | | Other Doc (Lim, Red, Stated, etc) | | | 42 | % | | | 38 | % | | | 37 | % | | | 37 | % | | | 37 | % | | | 37 | % | | | 38 | % |
| Average loan size | | $ | 421 | | | $ | 424 | | | $ | 457 | | | $ | 453 | | | $ | 457 | | | $ | 457 | | | $ | 456 | | | Unknown/Not Categorized | | | 3 | % | | | 2 | % | | | 3 | % | | | 3 | % | | | 3 | % | | | 3 | % | | | 3 | % |
| | | | | | | | | | | | | | | | | | | | | | | | | | | | | | | | | | | | | | | | | | | | | | | | | | | | | | | | | | | |
| Year 2008 origination | | | 0 | % | | | 0 | % | | | 0 | % | | | 1 | % | | | 0 | % | | | 0 | % | | | 0 | % | | 2-4 Family | | | 1 | % | | | 1 | % | | | 2 | % | | | 2 | % | | | 1 | % | | | 1 | % | | | 1 | % |
| Year 2007 origination | | | 11 | % | | | 7 | % | | | 10 | % | | | 10 | % | | | 9 | % | | | 9 | % | | | 9 | % | | Condo | | | 10 | % | | | 10 | % | | | 10 | % | | | 10 | % | | | 10 | % | | | 10 | % | | | 10 | % |
| Year 2006 origination | | | 11 | % | | | 14 | % | | | 12 | % | | | 12 | % | | | 12 | % | | | 12 | % | | | 14 | % | | Single Family | | | 88 | % | | | 87 | % | | | 87 | % | | | 87 | % | | | 88 | % | | | 88 | % | | | 88 | % |
| Year 2005 origination | | | 16 | % | | | 20 | % | | | 21 | % | | | 19 | % | | | 20 | % | | | 19 | % | | | 17 | % | | Other | | | 1 | % | | | 1 | % | | | 1 | % | | | 1 | % | | | 1 | % | | | 1 | % | | | 1 | % |
| Year 2004 origination and earlier | | | 62 | % | | | 59 | % | | | 57 | % | | | 58 | % | | | 59 | % | | | 60 | % | | | 60 | % | | | | | | | | | | | | | | | | | | | | | | | | | | | | | | |
| | | | | | | | | | | | | | | | | | | | | | | | | | | | | | | | | | | | | | | | | | | | | | | | | | | | | | | | | | | |
(1) Only the loan groups providing direct cash flow to securities we own are included.
(2) The definition of a conforming loan has significantly changed over time. For all periods shown in this table, the conforming balance definition available in September 2010 was used (which had a maximum loan balance of $729,750).
| | | | | |
THE REDWOOD REVIEW 3RD QUARTER 2010 | | Table 9A: Residential Prime Securities at Redwood and Underlying Loan Characteristics | | |
| | | | | |
| Table 9B: Residential Non-Prime Securities at Redwood and Underlying Loan Characteristics ($ in thousands) | |
| | | 2010 | | | 2010 | | | 2010 | | | 2009 | | | 2009 | | | 2009 | | | 2009 | | | | | 2010 | | | 2010 | | | 2010 | | | 2009 | | | 2009 | | | 2009 | | | 2009 | |
| | | Q3 | | | Q2 | | | Q1 | | | Q4 | | | Q3 | | | Q2 | | | Q1 | | | | | Q3 | | | Q2 | | | Q1 | | | Q4 | | | Q3 | | | Q2 | | | Q1 | |
| Residential Senior Non-Prime | | | | | | | | | | | | | | | | | | | | | | | | | | | | | | | | | | | | | | | | | | | | | | | | | | | | | | | | | | |
| Principal value | | $ | 431,143 | | | $ | 401,049 | | | $ | 475,950 | | | $ | 430,698 | | | $ | 403,675 | | | $ | 396,135 | | | $ | 182,851 | | | Southern CA | | | 21 | % | | | 22 | % | | | 23 | % | | | 25 | % | | | 26 | % | | | 25 | % | | | 27 | % |
| Unamortized discount | | | (111,709 | ) | | | (94,316 | ) | | | (119,303 | ) | | | (134,649 | ) | | | (137,899 | ) | | | (141,761 | ) | | | (77,193 | ) | | Northern CA | | | 14 | % | | | 14 | % | | | 17 | % | | | 18 | % | | | 16 | % | | | 18 | % | | | 19 | % |
| Credit reserve | | | (14,193 | ) | | | (10,894 | ) | | | (13,830 | ) | | | (13,468 | ) | | | (10,098 | ) | | | (16,009 | ) | | | (4,159 | ) | | Florida | | | 9 | % | | | 9 | % | | | 8 | % | | | 8 | % | | | 9 | % | | | 9 | % | | | 10 | % |
| Unrealized gains (losses) | | | 27,588 | | | | 24,559 | | | | 24,556 | | | | 32,371 | | | | 23,322 | | | | (7,410 | ) | | | (27,116 | ) | | New York | | | 5 | % | | | 5 | % | | | 5 | % | | | 5 | % | | | 5 | % | | | 5 | % | | | 5 | % |
| Fair value | | $ | 332,829 | | | $ | 320,398 | | | $ | 367,373 | | | $ | 314,952 | | | $ | 279,000 | | | $ | 230,955 | | | $ | 74,383 | | | Arizona | | | 4 | % | | | 4 | % | | | 3 | % | | | 3 | % | | | 4 | % | | | 3 | % | | | 3 | % |
| Fair value / principal value | | | 77 | % | | | 80 | % | | | 77 | % | | | 73 | % | | | 69 | % | | | 58 | % | | | 41 | % | | New Jersey | | | 3 | % | | | 4 | % | | | 3 | % | | | 4 | % | | | 2 | % | | | 4 | % | | | 4 | % |
| | | | | | | | | | | | | | | | | | | | | | | | | | | | | | | Virginia | | | 3 | % | | | 3 | % | | | 3 | % | | | 3 | % | | | 2 | % | | | 3 | % | | | 3 | % |
| Security Type | | | | | | | | | | | | | | | | | | | | | | | | | | | | | | Georgia | | | 2 | % | | | 2 | % | | | 2 | % | | | 2 | % | | | 3 | % | | | 2 | % | | | 1 | % |
| ARM | | $ | 4,721 | | | $ | 5,467 | | | $ | 5,806 | | | $ | 2,015 | | | $ | - | | | $ | - | | | $ | - | | | Texas | | | 3 | % | | | 3 | % | | | 3 | % | | | 2 | % | | | 2 | % | | | 2 | % | | | 1 | % |
| Option ARM | | | 12,813 | | | | 12,408 | | | | 28,891 | | | | 26,004 | | | | 25,747 | | | | 18,586 | | | | 17,796 | | | Illinois | | | 3 | % | | | 3 | % | | | 2 | % | | | 2 | % | | | 2 | % | | | 2 | % | | | 3 | % |
| Hybrid | | | 117,887 | | | | 118,199 | | | | 122,084 | | | | 160,494 | | | | 154,998 | | | | 158,886 | | | | 50,616 | | | Colorado | | | 3 | % | | | 3 | % | | | 3 | % | | | 2 | % | | | 3 | % | | | 2 | % | | | 2 | % |
| Fixed | | | 197,408 | | | | 184,324 | | | | 210,592 | | | | 126,439 | | | | 98,255 | | | | 53,483 | | | | 5,971 | | | Other states | | | 30 | % | | | 30 | % | | | 28 | % | | | 26 | % | | | 26 | % | | | 25 | % | | | 22 | % |
| Total fair value | | $ | 332,829 | | | $ | 320,398 | | | $ | 367,373 | | | $ | 314,952 | | | $ | 279,000 | | | $ | 230,955 | | | $ | 74,383 | | | | | | | | | | | | | | | | | | | | | | | | | | | | | | | |
| | | | | | | | | | | | | | | | | | | | | | | | | | | | | | | Wtd Avg Original LTV | | | 73 | % | | | 73 | % | | | 73 | % | | | 73 | % | | | 74 | % | | | 74 | % | | | 74 | % |
| Residential Senior Non-Prime | | | | | | | | | | | | | | | | | | | | | | | | | | | | | | Original LTV: 0 - 50 | | | 7 | % | | | 7 | % | | | 6 | % | | | 5 | % | | | 5 | % | | | 5 | % | | | 5 | % |
| Coupon income | | $ | 4,819 | | | $ | 5,016 | | | $ | 5,994 | | | $ | 4,000 | | | $ | 4,156 | | | $ | 2,871 | | | $ | 1,251 | | | Original LTV: 50.01 - 60 | | | 8 | % | | | 8 | % | | | 8 | % | | | 8 | % | | | 7 | % | | | 7 | % | | | 7 | % |
| Discount amortization | | | 5,989 | | | | 6,410 | | | | 7,017 | | | | 4,489 | | | | 6,357 | | | | 3,865 | | | | 2,194 | | | Original LTV: 60.01 - 70 | | | 18 | % | | | 18 | % | | | 18 | % | | | 19 | % | | | 17 | % | | | 17 | % | | | 18 | % |
| Total interest income | | $ | 10,808 | | | $ | 11,426 | | | $ | 13,011 | | | $ | 8,489 | | | $ | 10,513 | | | $ | 6,736 | | | $ | 3,445 | | | Original LTV: 70.01 - 80 | | | 58 | % | | | 58 | % | | | 58 | % | | | 59 | % | | | 59 | % | | | 59 | % | | | 60 | % |
| | | | | | | | | | | | | | | | | | | | | | | | | | | | | | | Original LTV: 80.01 - 90 | | | 6 | % | | | 6 | % | | | 7 | % | | | 6 | % | | | 8 | % | | | 8 | % | | | 7 | % |
| Average amortized cost | | $ | 297,197 | | | $ | 302,461 | | | $ | 310,948 | | | $ | 263,022 | | | $ | 270,353 | | | $ | 168,383 | | | $ | 87,464 | | | Original LTV: 90.01 - 100 | | | 3 | % | | | 3 | % | | | 3 | % | | | 3 | % | | | 4 | % | | | 4 | % | | | 3 | % |
| | | | | | | | | | | | | | | | | | | | | | | | | | | | | | | Unknown | | | 0 | % | | | 0 | % | | | 0 | % | | | 0 | % | | | 0 | % | | | 0 | % | | | 0 | % |
| Coupon income % | | | 6.49 | % | | | 6.63 | % | | | 7.71 | % | | | 6.08 | % | | | 6.15 | % | | | 6.82 | % | | | 5.72 | % | | | | | | | | | | | | | | | | | | | | | | | | | | | | | | |
| Discount amortization % | | | 8.06 | % | | | 8.48 | % | | | 9.03 | % | | | 6.83 | % | | | 9.41 | % | | | 9.18 | % | | | 10.03 | % | | Wtd Avg FICO | | | 711 | | | | 711 | | | | 712 | | | | 712 | | | | 707 | | | | 705 | | | | 705 | |
| Annualized yield | | | 14.55 | % | | | 15.11 | % | | | 16.74 | % | | | 12.91 | % | | | 15.55 | % | | | 16.00 | % | | | 15.75 | % | | FICO: <= 600 | | | 2 | % | | | 2 | % | | | 2 | % | | | 1 | % | | | 2 | % | | | 2 | % | | | 2 | % |
| | | | | | | | | | | | | | | | | | | | | | | | | | | | | | | FICO: 601 - 620 | | | 2 | % | | | 2 | % | | | 2 | % | | | 2 | % | | | 2 | % | | | 3 | % | | | 3 | % |
| Residential Subordinate Non-Prime | | | | | | | | | | | | | | | | | | | | | | | | | | | | | | FICO: 621 - 640 | | | 4 | % | | | 5 | % | | | 4 | % | | | 4 | % | | | 5 | % | | | 5 | % | | | 5 | % |
| Principal value | | $ | 39,659 | | | $ | 44,659 | | | $ | 68,700 | | | $ | 86,802 | | | $ | 158,613 | | | $ | 230,404 | | | $ | 327,766 | | | FICO: 641 - 660 | | | 7 | % | | | 7 | % | | | 7 | % | | | 7 | % | | | 8 | % | | | 8 | % | | | 8 | % |
| Unamortized discount | | | (19,248 | ) | | | (19,586 | ) | | | (15,123 | ) | | | (14,863 | ) | | | (16,556 | ) | | | (18,846 | ) | | | (19,512 | ) | | FICO: 661 - 680 | | | 12 | % | | | 12 | % | | | 11 | % | | | 12 | % | | | 13 | % | | | 12 | % | | | 12 | % |
| Credit reserve | | | (11,323 | ) | | | (15,775 | ) | | | (47,805 | ) | | | (70,806 | ) | | | (140,046 | ) | | | (208,839 | ) | | | (305,422 | ) | | FICO: 681 - 700 | | | 14 | % | | | 14 | % | | | 14 | % | | | 15 | % | | | 15 | % | | | 16 | % | | | 16 | % |
| Unrealized gain | | | 953 | | | | 732 | | | | 772 | | | | 162 | | | | (806 | ) | | | 473 | | | | 1,705 | | | FICO: 701 - 720 | | | 14 | % | | | 14 | % | | | 15 | % | | | 15 | % | | | 14 | % | | | 14 | % | | | 14 | % |
| Fair value | | $ | 10,041 | | | $ | 10,030 | | | $ | 6,544 | | | $ | 1,295 | | | $ | 1,205 | | | $ | 3,192 | | | $ | 4,537 | | | FICO: 721 - 740 | | | 12 | % | | | 12 | % | | | 13 | % | | | 13 | % | | | 12 | % | | | 12 | % | | | 12 | % |
| Fair value / principal value | | | 25 | % | | | 22 | % | | | 10 | % | | | 1 | % | | | 1 | % | | | 1 | % | | | 1 | % | | FICO: 741 - 760 | | | 12 | % | | | 11 | % | | | 12 | % | | | 11 | % | | | 11 | % | | | 11 | % | | | 11 | % |
| | | | | | | | | | | | | | | | | | | | | | | | | | | | | | | FICO: 761 - 780 | | | 10 | % | | | 10 | % | | | 10 | % | | | 10 | % | | | 9 | % | | | 9 | % | | | 9 | % |
| Security Type | | | | | | | | | | | | | | | | | | | | | | | | | | | | | | FICO: 781 - 800 | | | 7 | % | | | 7 | % | | | 7 | % | | | 7 | % | | | 6 | % | | | 5 | % | | | 5 | % |
| Option ARM | | $ | 631 | | | $ | 623 | | | $ | 645 | | | $ | 1,061 | | | $ | 907 | | | $ | 2,639 | | | $ | 3,618 | | | FICO: >= 801 | | | 2 | % | | | 2 | % | | | 2 | % | | | 2 | % | | | 2 | % | | | 2 | % | | | 2 | % |
| Hybrid | | | 558 | | | | 477 | | | | 504 | | | | 234 | | | | 293 | | | | 400 | | | | 571 | | | Unknown | | | 2 | % | | | 2 | % | | | 1 | % | | | 1 | % | | | 1 | % | | | 1 | % | | | 1 | % |
| Fixed | | | 8,852 | | | | 8,930 | | | | 5,395 | | | | - | | | | 5 | | | | 153 | | | | 348 | | | | | | | | | | | | | | | | | | | | | | | | | | | | | | | |
| Total fair value | | $ | 10,041 | | | $ | 10,030 | | | $ | 6,544 | | | $ | 1,295 | | | $ | 1,205 | | | $ | 3,192 | | | $ | 4,537 | | | Conforming balance % (2) | | | 86 | % | | | 85 | % | | | 81 | % | | | 76 | % | | | 74 | % | | | 71 | % | | | 62 | % |
| | | | | | | | | | | | | | | | | | | | | | | | | | | | | | | > $1 MM % | | | 3 | % | | | 4 | % | | | 6 | % | | | 9 | % | | | 9 | % | | | 10 | % | | | 17 | % |
| Residential Subordinate Non-Prime | | | | | | | | | | | | | | | | | | | | | | | | | | | | | | | | | | | | | | | | | | | | | | | | | | | | | | | | | | |
| Coupon income | | $ | 179 | | | $ | 313 | | | $ | 169 | | | $ | 701 | | | $ | 1,128 | | | $ | 2,318 | | | $ | 5,779 | | | 2nd Home % | | | 4 | % | | | 4 | % | | | 5 | % | | | 5 | % | | | 5 | % | | | 5 | % | | | 7 | % |
| Discount (premium) amortization | | | 376 | | | | 300 | | | | (25 | ) | | | (342 | ) | | | 143 | | | | (703 | ) | | | 553 | | | Investment Home % | | | 13 | % | | | 13 | % | | | 11 | % | | | 9 | % | | | 8 | % | | | 8 | % | | | 7 | % |
| Total interest income | | $ | 555 | | | $ | 613 | | | $ | 144 | | | $ | 359 | | | $ | 1,271 | | | $ | 1,615 | | | $ | 6,332 | | | | | | | | | | | | | | | | | | | | | | | | | | | | | | | |
| | | | | | | | | | | | | | | | | | | | | | | | | | | | | | | | | | | | | | | | | | | | | | | | | | | | | | | | | | | |
| Average amortized cost | | $ | 9,181 | | | $ | 7,708 | | | $ | 4,253 | | | $ | 1,377 | | | $ | 2,218 | | | $ | 2,767 | | | $ | 3,450 | | | Purchase | | | 42 | % | | | 40 | % | | | 39 | % | | | 40 | % | | | 40 | % | | | 41 | % | | | 37 | % |
| | | | | | | | | | | | | | | | | | | | | | | | | | | | | | | Cash Out Refi | | | 41 | % | | | 41 | % | | | 42 | % | | | 42 | % | | | 42 | % | | | 42 | % | | | 44 | % |
| Coupon income % | | | 7.80 | % | | | 16.25 | % | | | 15.89 | % | | | 203.65 | % | | | 203.50 | % | | | 335.10 | % | | | 670.16 | % | | Rate-Term Refi | | | 16 | % | | | 18 | % | | | 18 | % | | | 17 | % | | | 17 | % | | | 16 | % | | | 19 | % |
| Discount (premium) amortization % | | | 16.38 | % | | | 15.58 | % | | | (2.35 | %) | | | (99.42 | %) | | | 25.74 | % | | | -101.60 | % | | | 64.12 | % | | Construction | | | 0 | % | | | 0 | % | | | 0 | % | | | 0 | % | | | 0 | % | | | 0 | % | | | 0 | % |
| Annualized yield | | | 24.18 | % | | | 31.83 | % | | | 13.54 | % | | | 104.23 | % | | | 229.25 | % | | | 233.50 | % | | | 734.28 | % | | Other | | | 1 | % | | | 1 | % | | | 1 | % | | | 1 | % | | | 1 | % | | | 1 | % | | | 0 | % |
| | | | | | | | | | | | | | | | | | | | | | | | | | | | | | | | | | | | | | | | | | | | | | | | | | | | | | | | | | | |
Underlying Non-Prime Loan Characteristics (1) | | | | | | | | | | | | | | | | | | | | | | | | | | | | | | Full Doc | | | 38 | % | | | 36 | % | | | 37 | % | | | 34 | % | | | 34 | % | | | 32 | % | | | 27 | % |
| | | | | | | | | | | | | | | | | | | | | | | | | | | | | | | No Doc | | | 3 | % | | | 3 | % | | | 3 | % | | | 2 | % | | | 2 | % | | | 2 | % | | | 6 | % |
| Number of loans | | | 67,713 | | | | 72,621 | | | | 79,448 | | | | 73,102 | | | | 73,970 | | | | 71,041 | | | | 64,541 | | | Other Doc (Lim, Red, Stated, etc) | | | 57 | % | | | 59 | % | | | 59 | % | | | 62 | % | | | 62 | % | | | 64 | % | | | 66 | % |
| Total loan face | | $ | 15,181,465 | | | $ | 16,931,963 | | | $ | 19,644,742 | | | $ | 20,445,051 | | | $ | 21,588,255 | | | $ | 22,498,418 | | | $ | 24,833,600 | | | Unknown/Not Categorized | | | 2 | % | | | 2 | % | | | 1 | % | | | 2 | % | | | 2 | % | | | 2 | % | | | 1 | % |
| Average loan size | | $ | 224 | | | $ | 233 | | | $ | 247 | | | $ | 280 | | | $ | 292 | | | $ | 317 | | | $ | 385 | | | | | | | | | | | | | | | | | | | | | | | | | | | | | | | |
| | | | | | | | | | | | | | | | | | | | | | | | | | | | | | | 2-4 Family | | | 8 | % | | | 8 | % | | | 6 | % | | | 5 | % | | | 5 | % | | | 5 | % | | | 4 | % |
| Year 2008 origination | | | 0 | % | | | 0 | % | | | 0 | % | | | 0 | % | | | 0 | % | | | 0 | % | | | 0 | % | | Condo | | | 8 | % | | | 8 | % | | | 8 | % | | | 9 | % | | | 9 | % | | | 9 | % | | | 10 | % |
| Year 2007 origination | | | 0 | % | | | 7 | % | | | 10 | % | | | 11 | % | | | 22 | % | | | 23 | % | | | 36 | % | | Single Family | | | 84 | % | | | 84 | % | | | 86 | % | | | 86 | % | | | 86 | % | | | 86 | % | | | 85 | % |
| Year 2006 origination | | | 18 | % | | | 18 | % | | | 9 | % | | | 5 | % | | | 8 | % | | | 8 | % | | | 12 | % | | Other | | | 0 | % | | | 0 | % | | | 0 | % | | | 0 | % | | | 0 | % | | | 0 | % | | | 1 | % |
| Year 2005 origination | | | 49 | % | | | 45 | % | | | 50 | % | | | 47 | % | | | 36 | % | | | 34 | % | | | 27 | % | | | | | | | | | | | | | | | | | | | | | | | | | | | | | | |
| Year 2004 origination and earlier | | | 33 | % | | | 30 | % | | | 31 | % | | | 37 | % | | | 34 | % | | | 35 | % | | | 25 | % | | | | | | | | | | | | | | | | | | | | | | | | | | | | | | |
| | | | | | | | | | | | | | | | | | | | | | | | | | | | | | | | | | | | | | | | | | | | | | | | | | | | | | | | | | | |
(1) Only the loan groups providing direct cash flow to securities we own are included.
(2) The definition of a conforming loan has significantly changed over time. For all periods shown in this table, the conforming balance definition available in September 2010 was used (which had a maximum loan balance of $729,750).
| | | | | |
THE REDWOOD REVIEW 3RD QUARTER 2010 | | Table 9B: Residential Non-Prime Securities at Redwood and Underlying Loan Characteristics | | 57 |
| | | | | |
| Table 10: Residential Real Estate Loan Characteristics ($ in thousands)1 | 58 |
| | | 2010 | | | 2010 | | | 2010 | | | 2009 | | | 2009 | | | 2009 | | | 2009 | | | 2008 | | | 2008 | |
| | | Q3 | | | Q2 | | | Q1 | | | Q4 | | | Q3 | | | Q2 | | | Q1 | | | Q4 | | | Q3 | |
| | | | | | | | | | | | | | | | | | | | | | | | | | | | | | | | | | | | | |
| Residential loans | | $ | 3,754,053 | | | $ | 3,807,334 | | | $ | 3,661,063 | | | $ | 3,733,173 | | | $ | 3,827,086 | | | $ | 3,952,147 | | | $ | 4,523,877 | | | $ | 4,617,269 | | | $ | 6,070,083 | |
| Number of loans | | | 12,500 | | | | 12,725 | | | | 12,721 | | | | 12,930 | | | | 13,232 | | | | 13,648 | | | | 14,880 | | | | 15,203 | | | | 18,037 | |
| Average loan size | | $ | 300 | | | $ | 299 | | | $ | 288 | | | $ | 289 | | | $ | 289 | | | $ | 290 | | | $ | 304 | | | $ | 304 | | | $ | 337 | |
| | | | | | | | | | | | | | | | | | | | | | | | | | | | | | | | | | | | | |
| Adjustable % | | | 90 | % | | | 90 | % | | | 96 | % | | | 95 | % | | | 95 | % | | | 95 | % | | | 85 | % | | | 85 | % | | | 67 | % |
| Hybrid % | | | 10 | % | | | 10 | % | | | 4 | % | | | 5 | % | | | 5 | % | | | 5 | % | | | 15 | % | | | 15 | % | | | 33 | % |
| Fixed % | | | 0 | % | | | 0 | % | | | 0 | % | | | 0 | % | | | 0 | % | | | 0 | % | | | 0 | % | | | 0 | % | | | 0 | % |
| | | | | | | | | | | | | | | | | | | | | | | | | | | | | | | | | | | | | |
| Amortizing % | | | 5 | % | | | 4 | % | | | 3 | % | | | 3 | % | | | 3 | % | | | 3 | % | | | 4 | % | | | 4 | % | | | 5 | % |
| Interest-only % | | | 95 | % | | | 96 | % | | | 97 | % | | | 97 | % | | | 97 | % | | | 97 | % | | | 96 | % | | | 96 | % | | | 95 | % |
| | | | | | | | | | | | | | | | | | | | | | | | | | | | | | | | | | | | | |
| Florida | | | 13 | % | | | 13 | % | | | 14 | % | | | 14 | % | | | 14 | % | | | 14 | % | | | 13 | % | | | 13 | % | | | 13 | % |
| Southern California | | | 11 | % | | | 11 | % | | | 11 | % | | | 11 | % | | | 11 | % | | | 11 | % | | | 12 | % | | | 12 | % | | | 15 | % |
| Northern California | | | 10 | % | | | 9 | % | | | 8 | % | | | 8 | % | | | 8 | % | | | 8 | % | | | 9 | % | | | 9 | % | | | 11 | % |
| New York | | | 8 | % | | | 8 | % | | | 7 | % | | | 7 | % | | | 7 | % | | | 7 | % | | | 6 | % | | | 6 | % | | | 6 | % |
| Georgia | | | 5 | % | | | 5 | % | | | 5 | % | | | 5 | % | | | 5 | % | | | 5 | % | | | 5 | % | | | 5 | % | | | 4 | % |
| New Jersey | | | 4 | % | | | 4 | % | | | 5 | % | | | 5 | % | | | 4 | % | | | 4 | % | | | 4 | % | | | 4 | % | | | 4 | % |
| Texas | | | 5 | % | | | 5 | % | | | 5 | % | | | 5 | % | | | 5 | % | | | 5 | % | | | 5 | % | | | 5 | % | | | 4 | % |
| Colorado | | | 4 | % | | | 4 | % | | | 4 | % | | | 4 | % | | | 4 | % | | | 4 | % | | | 4 | % | | | 4 | % | | | 3 | % |
| Virginia | | | 3 | % | | | 3 | % | | | 3 | % | | | 3 | % | | | 3 | % | | | 3 | % | | | 3 | % | | | 3 | % | | | 3 | % |
| Arizona | | | 2 | % | | | 2 | % | | | 2 | % | | | 2 | % | | | 3 | % | | | 3 | % | | | 3 | % | | | 3 | % | | | 3 | % |
| Illinois | | | 2 | % | | | 3 | % | | | 2 | % | | | 2 | % | | | 2 | % | | | 2 | % | | | 3 | % | | | 3 | % | | | 3 | % |
| Other states | | | 33 | % | | | 33 | % | | | 34 | % | | | 34 | % | | | 34 | % | | | 34 | % | | | 33 | % | | | 33 | % | | | 31 | % |
| | | | | | | | | | | | | | | | | | | | | | | | | | | | | | | | | | | | | |
| Year 2010 origination | | | 2 | % | | | 0 | % | | | 0 | % | | | 0 | % | | | 0 | % | | | 0 | % | | | 0 | % | | | 0 | % | | | 0 | % |
| Year 2009 origination | | | 5 | % | | | 6 | % | | | 0 | % | | | 0 | % | | | 0 | % | | | 0 | % | | | 0 | % | | | 0 | % | | | 0 | % |
| Year 2008 origination | | | 0 | % | | | 0 | % | | | 0 | % | | | 0 | % | | | 0 | % | | | 0 | % | | | 0 | % | | | 0 | % | | | 0 | % |
| Year 2007 origination | | | 2 | % | | | 2 | % | | | 2 | % | | | 2 | % | | | 2 | % | | | 2 | % | | | 2 | % | | | 2 | % | | | 13 | % |
| Year 2006 origination | | | 5 | % | | | 5 | % | | | 6 | % | | | 6 | % | | | 5 | % | | | 5 | % | | | 15 | % | | | 15 | % | | | 21 | % |
| Year 2005 origination | | | 4 | % | | | 4 | % | | | 4 | % | | | 4 | % | | | 4 | % | | | 4 | % | | | 4 | % | | | 4 | % | | | 5 | % |
| Year 2004 origination or earlier | | | 82 | % | | | 83 | % | | | 88 | % | | | 88 | % | | | 89 | % | | | 89 | % | | | 79 | % | | | 79 | % | | | 61 | % |
| | | | | | | | | | | | | | | | | | | | | | | | | | | | | | | | | | | | | |
| Wtd Avg Original LTV | | | 66 | % | | | 66 | % | | | 67 | % | | | 67 | % | | | 67 | % | | | 67 | % | | | 68 | % | | | 68 | % | | | 69 | % |
| Original LTV: 0 - 50 | | | 19 | % | | | 19 | % | | | 18 | % | | | 18 | % | | | 18 | % | | | 18 | % | | | 17 | % | | | 17 | % | | | 15 | % |
| Original LTV: 50 - 60 | | | 12 | % | | | 12 | % | | | 11 | % | | | 11 | % | | | 11 | % | | | 11 | % | | | 11 | % | | | 11 | % | | | 11 | % |
| Original LTV: 60 - 70 | | | 21 | % | | | 20 | % | | | 20 | % | | | 20 | % | | | 20 | % | | | 20 | % | | | 19 | % | | | 19 | % | | | 19 | % |
| Original LTV: 70 - 80 | | | 41 | % | | | 42 | % | | | 43 | % | | | 43 | % | | | 43 | % | | | 43 | % | | | 46 | % | | | 46 | % | | | 49 | % |
| Original LTV: 80 - 90 | | | 2 | % | | | 2 | % | | | 2 | % | | | 2 | % | | | 2 | % | | | 2 | % | | | 2 | % | | | 2 | % | | | 2 | % |
| Original LTV: 90 - 100 | | | 5 | % | | | 5 | % | | | 6 | % | | | 6 | % | | | 6 | % | | | 6 | % | | | 5 | % | | | 5 | % | | | 4 | % |
| | | | | | | | | | | | | | | | | | | | | | | | | | | | | | | | | | | | | |
| Wtg Avg FICO | | | 733 | | | | 733 | | | | 730 | | | | 730 | | | | 730 | | | | 731 | | | | 731 | | | | 732 | | | | 732 | |
| FICO: <= 600 | | | 1 | % | | | 1 | % | | | 1 | % | | | 1 | % | | | 1 | % | | | 1 | % | | | 1 | % | | | 1 | % | | | 1 | % |
| FICO: 601 -620 | | | 1 | % | | | 1 | % | | | 1 | % | | | 1 | % | | | 1 | % | | | 1 | % | | | 1 | % | | | 1 | % | | | 1 | % |
| FICO: 621 - 640 | | | 2 | % | | | 2 | % | | | 2 | % | | | 2 | % | | | 2 | % | | | 2 | % | | | 2 | % | | | 2 | % | | | 1 | % |
| FICO: 641 -660 | | | 4 | % | | | 4 | % | | | 4 | % | | | 4 | % | | | 4 | % | | | 4 | % | | | 4 | % | | | 4 | % | | | 3 | % |
| FICO: 661 - 680 | | | 7 | % | | | 7 | % | | | 8 | % | | | 8 | % | | | 8 | % | | | 8 | % | | | 7 | % | | | 7 | % | | | 7 | % |
| FICO: 681 - 700 | | | 11 | % | | | 11 | % | | | 12 | % | | | 12 | % | | | 12 | % | | | 12 | % | | | 12 | % | | | 12 | % | | | 12 | % |
| FICO: 701 - 720 | | | 13 | % | | | 13 | % | | | 13 | % | | | 13 | % | | | 13 | % | | | 14 | % | | | 13 | % | | | 13 | % | | | 13 | % |
| FICO: 721 - 740 | | | 13 | % | | | 13 | % | | | 13 | % | | | 13 | % | | | 13 | % | | | 13 | % | | | 13 | % | | | 13 | % | | | 13 | % |
| FICO: 741 - 760 | | | 14 | % | | | 14 | % | | | 14 | % | | | 14 | % | | | 14 | % | | | 14 | % | | | 15 | % | | | 15 | % | | | 15 | % |
| FICO: 761 - 780 | | | 17 | % | | | 17 | % | | | 16 | % | | | 16 | % | | | 16 | % | | | 16 | % | | | 17 | % | | | 17 | % | | | 17 | % |
| FICO: 781 - 800 | | | 13 | % | | | 13 | % | | | 12 | % | | | 12 | % | | | 12 | % | | | 12 | % | | | 12 | % | | | 12 | % | | | 13 | % |
| FICO: >= 801 | | | 4 | % | | | 4 | % | | | 4 | % | | | 4 | % | | | 4 | % | | | 3 | % | | | 3 | % | | | 3 | % | | | 4 | % |
| | | | | | | | | | | | | | | | | | | | | | | | | | | | | | | | | | | | | |
Conforming balance % (2) | | | 53 | % | | | 53 | % | | | 56 | % | | | 56 | % | | | 56 | % | | | 56 | % | | | 55 | % | | | 52 | % | | | 34 | % |
| % balance in loans > $1mm per loan | | | 18 | % | | | 18 | % | | | 16 | % | | | 16 | % | | | 16 | % | | | 16 | % | | | 14 | % | | | 14 | % | | | 15 | % |
| | | | | | | | | | | | | | | | | | | | | | | | | | | | | | | | | | | | | |
| 2nd home % | | | 12 | % | | | 12 | % | | | 12 | % | | | 12 | % | | | 12 | % | | | 12 | % | | | 11 | % | | | 11 | % | | | 11 | % |
| Investment home % | | | 4 | % | | | 4 | % | | | 4 | % | | | 4 | % | | | 4 | % | | | 4 | % | | | 3 | % | | | 3 | % | | | 3 | % |
| | | | | | | | | | | | | | | | | | | | | | | | | | | | | | | | | | | | | |
| Purchase | | | 31 | % | | | 31 | % | | | 31 | % | | | 31 | % | | | 31 | % | | | 31 | % | | | 34 | % | | | 34 | % | | | 36 | % |
| Cash out refinance | | | 34 | % | | | 34 | % | | | 36 | % | | | 36 | % | | | 36 | % | | | 35 | % | | | 34 | % | | | 34 | % | | | 32 | % |
| Rate-term refinance | | | 34 | % | | | 34 | % | | | 31 | % | | | 31 | % | | | 31 | % | | | 32 | % | | | 31 | % | | | 31 | % | | | 30 | % |
| Other | | | 1 | % | | | 1 | % | | | 2 | % | | | 2 | % | | | 2 | % | | | 2 | % | | | 1 | % | | | 1 | % | | | 2 | % |
| | | | | | | | | | | | | | | | | | | | | | | | | | | | | | | | | | | | | |
(1) This table presents characteristics of residential real estate loans held by consolidated Sequoia entities.
(2) The definition of a conforming loan has significantly changed over time. For all periods shown in this table, the conforming balance definition available in September 2010 was used (which had a maximum loan balance of $729,750).
| | | |
THE REDWOOD REVIEW 3RD QUARTER 2010 | Table 10: Residential Real Estate Loan Characteristics | |
| | | |
Redwood Trust Corporate Information
| SENIOR OFFICERS: | | DIRECTORS: |
| | | |
| Martin S. Hughes | | George E. Bull, III |
| President and | | Chairman of the Board |
| Chief Executive Officer | | |
| | | Richard D. Baum |
| Brett D. Nicholas | | Former Chief Deputy Insurance |
| Executive Vice President, | | Commissioner for the State of California |
| Chief Investment Officer, | | |
| and Chief Operating Officer | | Thomas C. Brown |
| | | COO, McGuire Real Estate and |
| Diane L. Merdian | | Principal Shareholder, Urban Bay Properties, Inc. |
| Chief Financial Officer | | |
| | | Mariann Byerwalter |
| Harold F. Zagunis | | Chairman, JDN Corporate Advisory LLC |
| Chief Risk Officer | | |
| | | Douglas B. Hansen |
| | | Private Investor |
| | | |
| | | Greg H. Kubicek |
| | | President, The Holt Group, Inc. |
| STOCK LISTING: | | |
| The Company’s common stock is traded | | Jeffrey T. Pero |
| on the New York Stock Exchange under | | Retired Partner, Latham & Watkins LLP |
the symbol RWT | | |
| | | Georganne C. Proctor |
| CORPORATE HEADQUARTERS: | | Former Chief Financial Officer of TIAA-CREF |
| One Belvedere Place, Suite 300 | | |
| Mill Valley, California 94941 | | Charles J. Toeniskoetter |
| Telephone: (415) 389-7373 | | Chairman, Toeniskoetter & Breeding, Inc. Development |
| | | Chairman & CEO, Toeniskoetter Construction, Inc. |
| NEW YORK OFFICE: | | |
| 245 Park Avenue, 39th Floor | | |
| New York, New York 10167 | | |
| | | |
| | | |
| INVESTOR RELATIONS: | | TRANSFER AGENT: |
| Mike McMahon | | Computershare Trust Company, N.A. |
| Managing Director | | 2 North LaSalle Street |
| | | Chicago, IL 60602 |
| Paula Kwok | | Telephone: (888) 472-1955 |
| Assistant Vice President | | |
| Investor Relations Hotline: (866) 269-4976 | | |
| Email: investorrelations@redwoodtrust.com | | |
For more information about Redwood Trust, please visit our website at: www.redwoodtrust.com