Exhibit 99.2

| | |

| | |
TABLE OF CONTENTS | |
| | | | |
Introduction | | | 4 | |
| |
Shareholder Letter | | | 5 | |
| |
Quarterly Overview | | | 7 | |
| |
Financial Insights | | | 14 | |
| |
u GAAP Income | | | 14 | |
| |
u Balance Sheet | | | 18 | |
| |
u Taxable Income and Dividends | | | 27 | |
| |
u Business Segments | | | 29 | |
| |
– Residential Mortgage Banking | | | 30 | |
| |
– Residential Investments | | | 31 | |
| |
– Commercial Mortgage Banking and Investments | | | 33 | |
| |
Appendix | | | 37 | |
| |
u Redwood’s Business Strategy | | | 38 | |
| |
u Glossary | | | 39 | |
| |
u Financial Tables | | | 47 | |
| | | | |
| THE REDWOOD REVIEW | 2ND QUARTER 2014 | | | 1 | |
| | |
| |
|
| | CAUTIONARY STATEMENT |
This Redwood Review contains forward-looking statements within the meaning of the safe harbor provisions of the Private Securities Litigation Reform Act of 1995. Forward-looking statements involve numerous risks and uncertainties. Our actual results may differ from our expectations, estimates, and projections and, consequently, you should not rely on these forward-looking statements as predictions of future events. Forward-looking statements are not historical in nature and can be identified by words such as “anticipate,” “estimate,” “will,” “should,” “expect,” “believe,” “intend,” “seek,” “plan,” and similar expressions or their negative forms, or by references to strategy, plans, goals, or intentions. These forward-looking statements are subject to risks and uncertainties, including, among other things, those described in our most recent Annual Report on Form 10-K under the caption “Risk Factors.” Other risks, uncertainties, and factors that could cause actual results to differ materially from those projected are described below and may be described from time to time in reports we file with the Securities and Exchange Commission, including reports on Forms 10-K, 10-Q, and 8-K. We undertake no obligation to update or revise forward-looking statements, whether as a result of new information, future events, or otherwise.
Statements regarding the following subjects, among others, are forward-looking by their nature: (i) statements we make regarding Redwood’s business strategy and strategic focus, including statements relating to our confidence in our overall market position, strategy and long-term prospects, and our belief in the long-term efficiency of private label securitization as a form of mortgage financing; (ii) statements we make regarding the “three levers” that we expect to drive higher earnings and investment creation in our residential business; (iii) statements we make regarding our new business relationships with the Federal Home Loan Bank of Chicago (FHLBC), including our belief that these relationships will add new sellers and broaden the reach of our loan acquisition efforts by positioning us to acquire high balance residential loans from up to approximately 750 Federal Home Loan Bank members and provide us with access to collateralized financing for mortgage loans and securities, our expectations regarding the timing for commencing the acquisition program, our statements relating to quantifying the acquisition opportunity, and statements related to potential uses for the financing that may be available from the FHBLC; (iv) statements we make regarding the potential for long-term growth and profitability in our conforming loan business, including our belief that it is a better business decision to invest and build near the bottom of a market cycle and position ourselves for upside as the cycle turns, our belief that the pressure on margins that is broadly impacting the residential mortgage industry will gradually correct, as market capacity and pricing move back in line with origination volumes, our belief that we can improve our conforming loan sale margins by increasing loan purchase volumes and better leveraging the cost of our operating infrastructure, our belief that our conforming loan business also opens up opportunities to invest in “homegrown” servicing and potentially in credit risk transfers with the GSEs and our statement that we are optimistic about reaching our goal of acquiring $1 billion of conforming loans per month by the end of 2014; (v) statements we make regarding the outlook for our commercial business, including our positioning to benefit from both the tailwinds of an expanding economy and a substantial wave of maturing commercial loans that will need to be refinanced over the next few years, our belief that we are currently on track to exceed last year’s origination volume and achieve our annual origination goal for commercial loans in 2014, while maintaining healthy margins, and our expectation to contribute approximately $300 million of senior loans to a third-party CMBS transaction in September; (vi) statements we make regarding the outlook for the mortgage market, including expectations relating to residential loan originations in 2014; (vii) statements relating to acquiring residential mortgage loans in the future that we have identified for purchase or plan to purchase, including the amount of such loans that we identified for purchase during the second quarter of 2014 and at June 30, 2014, and statements relating to expected fallout and the corresponding volume of residential mortgage loans expected to be available for purchase; (viii) statements relating to our estimate of our investment capacity (including that we estimate our investment capacity at June 30, 2014 to be approximately $62 million), our statement that we may need to source additional capital prior to the end of 2014, and our expectations relating to our ability to source capital internally, by selling or financing existing investments, and externally, via the issuance of convertible debt or common equity, other debt securities, or similar or other types of securities in public or private offerings; (ix) statements we make regarding our dividend policy and our
| | |
| 2 | | THE REDWOOD REVIEW | 2ND QUARTER 2014 |
| | |
| | |
CAUTIONARY STATEMENT | |
process for determining dividends; and (x) statements regarding our expectations and estimates relating to the characterization for income tax purposes of our dividend distributions, our expectations and estimates relating to tax accounting, tax liabilities and tax savings, and GAAP tax provisions, our estimates of REIT taxable income and TRS taxable income, and our anticipation of additional credit losses for tax purposes in future periods (and, in particular, our statement that, for tax purposes, we expect an additional $40 million of tax credit losses on residential securities we currently own to be realized over an estimated three- to five-year period).
Important factors, among others, that may affect our actual results include: general economic trends, the performance of the housing, commercial real estate, mortgage, credit, and broader financial markets, and their effects on the prices of earning assets and the credit status of borrowers; federal and state legislative and regulatory developments, and the actions of governmental authorities, including those affecting the mortgage industry or our business; developments related to the fixed income and mortgage finance markets and the Federal Reserve’s statements regarding its future open market activity and monetary policy; our exposure to credit risk and the timing of credit losses within our portfolio; the concentration of the credit risks we are exposed to, including due to the structure of assets we hold and the geographical concentration of real estate underlying assets we own; our exposure to adjustable-rate mortgage loans; the efficacy and expense of our efforts to manage or hedge credit risk, interest rate risk, and other financial and operational risks; changes in credit ratings on assets we own and changes in the rating agencies’ credit rating methodologies; changes in interest rates; changes in mortgage prepayment rates; the availability of assets for purchase at attractive prices and our ability to reinvest cash we hold; changes in the values of assets we own; changes in liquidity in the market for real estate securities and loans; our ability to finance the acquisition of real estate-related assets with short-term debt; the ability of counterparties to satisfy their obligations to us; our involvement in securitization transactions, the profitability of those transactions, and the risks we are exposed to in engaging in securitization transactions; exposure to claims and litigation, including litigation arising from our involvement in securitization transactions; whether we have sufficient liquid assets to meet short-term needs; our ability to successfully compete and retain or attract key personnel; our ability to adapt our business model and strategies to changing circumstances; changes in our investment, financing, and hedging strategies and new risks we may be exposed to if we expand our business activities; exposure to environmental liabilities; our failure to comply with applicable laws and regulations; our failure to maintain appropriate internal controls over financial reporting and disclosure controls and procedures; the impact on our reputation that could result from our actions or omissions or from those of others; changes in accounting principles and tax rules; our ability to maintain our status as a REIT for tax purposes; limitations imposed on our business due to our REIT status and our status as exempt from registration under the Investment Company Act of 1940; decisions about raising, managing, and distributing capital; and other factors not presently identified.
This Redwood Review may contain statistics and other data that in some cases have been obtained from or compiled from information made available by servicers and other third-party service providers.
| | | | |
| THE REDWOOD REVIEW | 2ND QUARTER 2014 | | | 3 | |
| | |
| |
|
| | INTRODUCTION |
Note to Readers:
We file annual reports (on Form 10-K) and quarterly reports (on Form 10-Q) with the Securities and Exchange Commission. These filings and our earnings press releases provide information about Redwood and our financial results in accordance with generally accepted accounting principles (GAAP). We urge you to review these documents, which are available through our website, www.redwoodtrust.com.
This document, called The Redwood Review, is an additional format for providing information about Redwood through a discussion of our GAAP financial results, as well as other metrics, such as taxable income. Supplemental information is also provided in the Financial Tables in this Review to facilitate more detailed understanding and analysis of Redwood. We may also provide non-GAAP financial measures in this Review. When we use non-GAAP financial measures it is because we believe that these figures provide additional insight into Redwood’s business. In each case in which we discuss a non-GAAP financial measure you will find an explanation of how it has been calculated, why we think the figure is important, and a reconciliation between the GAAP and non-GAAP figures.
References herein to “Redwood,” the “company,” “we,” “us,” and “our” include Redwood Trust, Inc. and its consolidated subsidiaries. Note that because we round numbers in the tables to millions, except per share amounts, some numbers may not foot due to rounding. References to the “second quarter” refer to the quarter ending June 30, 2014, and references to the “first quarter” refer to the quarter ending March 31, 2014, unless otherwise specified.
We hope you find this Review helpful to your understanding of our business. We thank you for your input and suggestions, which have resulted in our changing the form and content of The Redwood Review over time.
| | | | | | | | | | |
Selected Financial Highlights |
| Quarter:Year | | GAAP
Income
per Share | | REIT
Taxable Income
per Share(1) | | Annualized
GAAP Return on Equity | | GAAP Book
Value per Share | | Dividends per
Share |
| Q214 | | $0.18 | | $0.17 | | 5% | | $15.03 | | $0.28 |
| Q114 | | $0.14 | | $0.19 | | 4% | | $15.14 | | $0.28 |
| Q413 | | $0.29 | | $0.24 | | 8% | | $15.10 | | $0.28 |
| Q313 | | $0.25 | | $0.24 | | 7% | | $14.65 | | $0.28 |
| Q213 | | $0.71 | | $0.25 | | 22% | | $14.69 | | $0.28 |
| Q113 | | $0.69 | | $0.20 | | 21% | | $14.54 | | $0.28 |
| Q412 | | $0.50 | | $0.21 | | 15% | | $13.95 | | $0.25 |
| Q312 | | $0.48 | | $0.19 | | 16% | | $12.88 | | $0.25 |
| Q212 | | $0.24 | | $0.22 | | 8% | | $12.00 | | $0.25 |
| | | | | | | | | | | | |
|
(1) REIT taxable income per share for 2013 and 2014 are estimates until we file tax returns. |
| | |
| 4 | | THE REDWOOD REVIEW | 2ND QUARTER 2014 |
| | |
| | |
SHAREHOLDER LETTER | |
Dear Fellow Shareholders:
Your Redwood team is actively managing, investing and positioning our residential and commercial businesses for long-term growth and to build sustainable franchise value. With these goals in mind, it is encouraging that both businesses continue to make really solid, measurable progress.
Adding new products, new sellers, and more distribution capability are the “three levers” that will drive higher earnings and investment creation in our residential business. We made significant progress on all of these fronts during the second quarter, and two important puzzle pieces fell into place with the recent announcement of our new business relationships with the Federal Home Loan Bank of Chicago (“FHLBC”). We believe one of these relationships will add new sellers and broaden the reach of our loan acquisition efforts by positioning us to acquire high balance residential loans from up to approximately 750 Federal Home Loan Bank members that participate in the FHLBC’s Mortgage Partnership Finance® Program. The other relationship is through our wholly owned subsidiary, RWT Financial LLC, which has become a member of the FHLBC. This relationship provides us with access to collateralized financing for mortgage loans and securities, while contributing to the Federal Home Loan Bank system’s mission of funding residential mortgage lending.
Unfortunately, despite all the good news with key growth metrics, our near-term quarterly earnings remain under pressure and are lagging the progress we see in our operations. This fact is not lost on us. Both of us have significant personal equity stakes in Redwood and most of our annual and longer-term compensation is performance-based, linked to return-on-equity or total shareholder return. We don’t make decisions that may negatively impact near-term earnings lightly, but we do so when we believe the short-term pain is justified by the potential for long-term gain.
The earnings from our commercial mortgage banking business and our investment portfolio continue to be in line with, or ahead of, our expectations. The primary earnings pressure we face currently relates to our residential mortgage banking business. While our established jumbo mortgage banking activities continue to produce healthy returns, our expansion into conforming loan products is being impacted by a double whammy of sorts. First, industrywide gain-on-sale margins for conforming loans remain under pressure as refinance origination volumes wane. Additionally, we are incurring upfront costs as we build our operations and systems to facilitate long-term growth and profitability. Although this expansion has placed near-term pressure on earnings, all in all, we still think it is a better business decision to invest and build near the bottom of a market cycle and position ourselves for upside as the cycle turns, rather than waiting to build and invest near the top of a cycle, only to chase diminishing returns. We have also chosen an economical loan acquisition model of acquiring closed loans from third parties, which relieves us of the costs associated with loan origination (personnel, compliance, and bricks and mortar).
Ultimately, we believe the pressure on margins that is broadly impacting the residential mortgage industry will gradually correct, as market capacity and pricing move back in line with origination volumes. Additionally, we believe we can improve our conforming loan sale margins by increasing loan purchase volumes and better leveraging the cost of our operating infrastructure. Our conforming loan business also opens up opportunities to invest in “homegrown” servicing and potentially in credit risk transfers with the GSEs.
In our commercial mortgage banking business, we continue to build our brand as a provider of senior and mezzanine financing for a variety of stabilized property types. We have an experienced commercial team that is performing well in terms of its growth metrics and its contribution to earnings, and we ended the second quarter with a strong commercial mortgage pipeline. They have positioned us to benefit from both
| | | | |
| THE REDWOOD REVIEW | 2ND QUARTER 2014 | | | 5 | |
| | |
| |
|
| | SHAREHOLDER LETTER |
the tailwinds of an expanding economy that is driving property fundamentals in the right direction and a substantial wave of maturing commercial loans that will need to be refinanced over the next few years. To take advantage of this opportunity, we are adding originators and support staff, and have expanded our footprint in New York. While the market for originating loans remains highly competitive, putting pressure on margins over time, we believe we are currently on track to exceed last year’s origination volume and achieve our origination goals for 2014, while maintaining healthy margins.
In closing, we remain highly focused on positioning Redwood for long-term growth and building sustainable franchise value. While external market factors may temporarily aid or hinder our progress in any given quarter, we are working on what we can control, including the “three levers” — new products, sellers, and distribution capabilities — that will drive our residential business forward. Our more established jumbo and commercial mortgage banking activities are generating attractive earnings, and over time we expect to see similar results from our conforming mortgage banking activities. We remain excited about the potential need for private capital to play a larger role in the residential mortgage market, and the ways Redwood can participate.
Thank you as always for your continuing support.
| | |
 | |  |
| Martin S. Hughes | | Brett D. Nicholas |
| CEO | | President |
| | |
| 6 | | THE REDWOOD REVIEW | 2ND QUARTER 2014 |
| | |
| | |
QUARTERLY OVERVIEW | |
Second Quarter 2014 Results
Overview
We made great progress on some of our long-term initiatives during the second quarter of 2014 while generating positive momentum in both our residential and commercial businesses. In our residential business, we achieved a significant increase in loan acquisition volume compared to the prior quarter, and our pipeline of both jumbo and conforming loans remained strong at quarter-end. Our commercial origination activity grew compared to the first quarter of 2014, ending the second quarter with a record pipeline of senior commercial loans under application.
In June 2014, we announced an agreement with the Federal Home Loan Bank of Chicago (FHLBC) to purchase high-balance residential loans through the FHLBC’s Mortgage Partnership Finance® (MPF®) Program under the MPF Direct™ Product (MPF Direct). We expect the program to commence early in the fourth quarter of 2014. We also announced that our subsidiary, RWT Financial, LLC, was approved as a member in the FHLBC, and this new subsidiary is currently using borrowings from the FHLBC to finance certain jumbo loans.
Before we get into any further details, here is a summary of Redwood’s second quarter 2014 results:
| u | | Earnings per share were $0.18 for the second quarter of 2014, up from $0.14 per share in the first quarter of 2014. The increase in earnings is largely attributable to higher mortgage banking income, particularly from our commercial mortgage banking activities, combined with a steady contribution of net interest income from our investment portfolio. |
| u | | Our GAAP book value per share was $15.03 at June 30, 2014, a decrease from $15.14 per share at March 31, 2014. The second quarter decline is net of $0.18 per share of net income and $0.15 per share of net unrealized gains on securities, and also reflects the $0.28 per share second quarter dividend paid to shareholders and an increase in shares outstanding related to our annual distribution of common stock underlying vested equity awards. |
| u | | Our residential loan acquisition volume was $1.8 billion in the second quarter of 2014, up 64% from the first quarter of 2014. At June 30, 2014, our pipeline of loans identified for purchase was $2.0 billion and included $1.6 billion of jumbo loans and $0.4 billion of conforming loans, unadjusted for fallout expectations. |
| u | | We originated $149 million of senior commercial loans and $6 million of mezzanine commercial loans in the second quarter of 2014. Our senior commercial loan pipeline, defined as loans under application, totaled $347 million at June 30, 2014. |
| u | | Our residential securities portfolio increased by 6%, or $102 million, to $1.8 billion at June 30, 2014, from $1.7 billion at March 31, 2014. |
| | | | |
| THE REDWOOD REVIEW | 2ND QUARTER 2014 | | | 7 | |
| | |
| |
|
| | QUARTERLY OVERVIEW |
Residential Mortgage Banking
The residential mortgage market improved in the second quarter of 2014 after a steep decline in industry origination volume in the first quarter of 2014, but remained down compared to the year-ago period. Despite stronger economic data, interest rates generally fell during the second quarter. The 10-year Treasury fell to 2.52% on June 30, 2014, from 2.72% on March 31, 2014, which resulted in higher overall industry origination volume during the second quarter. While the Mortgage Bankers Association of America projected second quarter originations to increase by 18% compared to the first quarter (and to decline by 40% annually in 2014), many market participants believe that second quarter originations have exceeded those projections.
In the second quarter of 2014, we continued to advance our residential mortgage banking business in what is still a challenging operating environment. We expanded our residential business by adding loan sellers — the number of sellers has increased by 19% year-to-date, to 140 sellers at June 30, 2014. This contributed to a record $3.2 billion of loans identified for purchase during the second quarter of 2014, up from $1.7 billion in the prior quarter. In addition, with the upcoming launch of MPF Direct with the FHLBC (more on that below), we expect to add a substantial number of new sellers over the next few years. Our conforming loan activity continues to ramp up as well, following our fourth quarter 2013 test phase. We added new sellers and several of our existing jumbo sellers also began to deliver conforming loans to us in the second quarter. This led to $868 million of conforming loan acquisitions in the second quarter of 2014, a 190% increase compared to the first quarter of 2014. Based on our recent activity, we are optimistic about reaching our goal of acquiring $1 billion of conforming loans per month by the end of 2014.
Private-label securitization activity remained subdued during the second quarter of 2014, but showed signs of improvement. Our recent July Sequoia securitization (SEMT 2014-2) was met with strong investor interest and the triple-A rated securities priced at spreads that were tighter than our April 2014 (SEMT 2014-1) securitization. When we consider the profitability, franchise value, and ability to create investments for our investment portfolio, Sequoia securitization execution is becoming more competitive with whole loan sales, which significantly outpaced securitization activity in the first quarter of 2014.
We also continued to make progress on non-Qualified Mortgage (non-QM) loans and conforming loan risk-sharing during the second quarter of 2014. We included a small number of non-QM loans in our July Sequoia securitization and were satisfied with the execution and investor reception. As a result, in early August we expanded the menu of jumbo loan products we acquire to include non-QM loans with characteristics similar to those of jumbo loans we had historically acquired prior to the implementation of the QM rule in early 2014.
| | |
| 8 | | THE REDWOOD REVIEW | 2ND QUARTER 2014 |
| | |
| | |
QUARTERLY OVERVIEW | |
MPF Direct™ Loans
In June we announced a new business relationship with the FHLBC under which we will purchase high-balance mortgage loans that are originated by participating member banks in various Federal Home Loan Bank districts. This business relationship is separate and distinct from our subsidiary’s membership in the FHLBC. In summary, we will be able to purchase, through the FHLBC (as administrator of the MPF Program), high-balance residential mortgage loans that conform to our underwriting standards from member banks that participate in the MPF Program. Eligible loans will generally have balances between $417,000 and $729,270. There are 12 Federal Home Loan Banks (FHLBanks) located throughout the U.S. and more than 7,400 total members (banks, thrifts, insurance companies, and credit unions), of which about 750 members are currently active MPF Program participants that could sell us high balance loans under MPF Direct. Ten of the FHLBanks offered their members the opportunity to participate in the MPF Program as of June 30, 2014. We are currently working with the FHLBC to identify a target list of potential sellers from within the FHLBC, with the goal of beginning a test phase of MPF Direct early in the fourth quarter of 2014. After the test phase, we plan to roll out MPF Direct to other participating FHLBanks. At this time, it is too early to quantify the overall opportunity, which we believe could be substantial over time.
Commercial Mortgage Banking Market Conditions
In the second quarter of 2014, our commercial team increased originations and generated higher loan sale profit margins compared to the first quarter of 2014. We remain optimistic that our positive momentum will enable us to achieve our annual origination goal for 2014. During the second quarter, we originated 15 senior commercial loans totaling $149 million, as compared to six loans totaling $119 million in the first quarter of 2014. We entered the third quarter with our largest-ever pipeline of loans under application at $347 million, and in September expect to contribute approximately $300 million of senior loans to a CMBS transaction sponsored by a third party.
| | | | |
| THE REDWOOD REVIEW | 2ND QUARTER 2014 | | | 9 | |
| | |
| |
|
| | QUARTERLY OVERVIEW |
Summary of Financial Results
GAAP Earnings
In the second quarter of 2014, we earned $16 million, or $0.18 per share, an increase from $12 million, or $0.14 per share, in the first quarter of 2014. The following table sets forth the components of Redwood’s GAAP income for the second and first quarters of 2014.
| | | | | | | | |
GAAP Income | |
($ in millions, except per share data) | |
| | | Three Months Ended | |
| | | 6/30/14 | | | 3/31/14 | |
| Net interest income | | | 37 | | | | 36 | |
| Reversal of provision (provision) for loan losses | | | 0 | | | | (1 | ) |
| Noninterest income | | | | | | | | |
Mortgage banking activities, net | | | 6 | | | | (0 | ) |
MSR income, net | | | (2 | ) | | | 1 | |
Other | | | (3 | ) | | | (5 | ) |
Total noninterest income (loss), net | | | 1 | | | | (5 | ) |
| | | | | | | | | |
| Operating expenses | | | (22 | ) | | | (20 | ) |
| (Provision for) benefit from income taxes | | | (0 | ) | | | 2 | |
| | | | | | | | | |
| GAAP income | | $ | 16 | | | $ | 12 | |
| | | | | | | | | |
| GAAP income per share | | $ | 0.18 | | | $ | 0.14 | |
The increase in earnings shown above primarily resulted from a $6 million improvement in income from mortgage banking activities, which was partially offset by higher operating expenses related to the expansion of our residential mortgage banking operations.
Our second quarter earnings were negatively impacted by timing differences related to how we account for our $1.6 billion jumbo mortgage pipeline and the hedges for those loans, in addition to differences in how changes in the fair value of certain securities and hedges for those securities are recognized in earnings. The GAAP Income section on page 14 provides a detailed analysis of our second quarter 2014 earnings.
| | |
| 10 | | THE REDWOOD REVIEW | 2ND QUARTER 2014 |
| | |
| | |
QUARTERLY OVERVIEW | |
GAAP Book Value
At June 30, 2014, our GAAP book value was $1.2 billion, or $15.03 per share, a decrease from $15.14 per share at March 31, 2014. The following table sets forth the changes in Redwood’s GAAP book value per share for the second and first quarters of 2014.
| | | | | | | | | | | | |
Changes in GAAP Book Value Per Share | |
($ in per share) | |
| | | | Q2 2014 | | | | Q1 2014 | | | | Variance | |
| | | | |
Beginning book value | | $ | 15.14 | | | $ | 15.10 | | | $ | 0.04 | |
Net income | | | 0.18 | | | | 0.14 | | | | 0.04 | |
Unrealized gains (losses), net | | | 0.09 | | | | 0.14 | | | | (0.05 | ) |
Equity award distributions | | | (0.14 | ) | | | (0.02 | ) | | | (0.12 | ) |
Other, net | | | 0.04 | | | | 0.06 | | | | (0.02 | ) |
Dividends | | | (0.28 | ) | | | (0.28 | ) | | | - | |
| | | | | | | | | | | | | |
Ending book value | | $ | 15.03 | | | $ | 15.14 | | | $ | (0.11 | ) |
The decrease in GAAP book value per share shown above primarily resulted from dividends paid in excess of GAAP earnings, combined with an increase in shares outstanding related to our annual distribution of common stock underlying vested equity awards in May 2014. These effects were partially offset by net unrealized gains, primarily resulting from an increase in the market value of our securities during the second quarter of 2014. The Financial Insights section on page 18 provides a detailed analysis of the components of our GAAP balance sheet and book value.
| | | | |
| THE REDWOOD REVIEW | 2ND QUARTER 2014 | | | 11 | |
| | |
| |
|
| | QUARTERLY OVERVIEW |
Quarterly Investment Activity
Our capital deployment modestly increased in the second quarter of 2014. The following table details our capital invested for the second and first quarters of 2014.
| | | | | | | | |
Quarterly Investment Activity | |
($ in millions) | |
| | | | Q2 2014 | | | | Q1 2014 | |
| | | |
Sequoia RMBS | | $ | 85 | | | $ | - | |
Third-party RMBS(1) | | | 56 | | | | 74 | |
Less: Short-term debt/Other liabilities | | | (121 | ) | | | (67 | ) |
MSR investments | | | 12 | | | | 3 | |
Total residential | | | 32 | | | | 10 | |
| | | |
Commercial mezzanine loans | | | 6 | | | | 2 | |
Commercial B-Notes | | | - | | | | 5 | |
Less: Borrowings | | | (2 | ) | | | (2 | ) |
Total commercial | | | 4 | | | | 5 | |
Capital invested | | $ | 36 | | | $ | 15 | |
(1) Included in our third-party RMBS acquisitions was $4.4 million of acquisitions late in the second quarter of 2014 that did not settle until early in the third quarter of 2014. In order to reflect the fact that capital had not yet been used to acquire this asset at June 30, 2014, the Short-term debt / Other liabilities line item in the table above includes a $4.4 million payable associated with this transaction. In early July 2014, we completed the purchase of this security using $4.0 million of short-term debt, resulting in net capital invested of $0.4 million that is not reflected in the table above.
At June 30, 2014, our residential securities portfolio had a market value of $1.8 billion, up from $1.7 billion at March 31, 2014. This increase included $142 million of acquisitions, $3 million in positive valuation adjustments, $10 million in discount accretion, and $53 million in net principal paydowns. Included in these numbers are $159 million of Sequoia senior and IO securities, which are included in our Residential Mortgage Banking segment for financial reporting purposes.
Our residential securities acquisitions of $142 million in the second quarter of 2014 included $115 million of senior securities, $20 million of subordinate securities retained from our Sequoia 2014-1 securitization, and $7 million of additional subordinate securities purchased from third parties. These acquisitions were funded with $121 million of short-term debt and $21 million of capital. We also invested $6 million in commercial mezzanine loans. Finally, we added $12 million of MSRs in the second quarter of 2014 associated with $1.2 billion of residential loans serviced, increasing our investment in MSRs to $71 million associated with $7.1 billion of residential loans serviced.
Following the end of the second quarter of 2014 and through July 31, 2014, we acquired $22 million of securities from SEMT 2014-2 and $6 million of MSR investments.
| | |
| 12 | | THE REDWOOD REVIEW | 2ND QUARTER 2014 |
|
|
QUARTERLY OVERVIEW |
Capital and Liquidity
During June 2014, our subsidiary, RWT Financial, LLC, was approved as a member of the FHLBC. This membership provides access to attractive short- and long-term financing options that broaden our sources of liquidity and potentially increase investment opportunities for us that require tailored funding. Because there is no amount of financing that the FHLBC has committed to provide to RWT Financial at any given time, we may not be able to obtain additional financing from FHLBC when we request it. At July 31, 2014, we had utilized $26 million of FHLBC advances to fund $30 million of jumbo residential loans. In future periods, RWT Financial may seek to use financing from the FHLBC for MPF Direct loans we acquire through the FHLBC. However, our agreement with the FHLBC relating to MPF Direct is separate from RWT Financial’s membership in the FHLBC. Any limitation on RWT Financial’s ability to borrow from FHLBC would not necessarily impact our ability to acquire MPF Direct loans.
At June 30, 2014, we held $157 million in cash, and our investment capacity (defined as the approximate amount of capital we had readily available for long-term investments) was estimated to be approximately $62 million. Total capital of $1.7 billion at June 30, 2014, included $1.2 billion of equity capital, $140 million of long-term debt, and $288 million of long-term convertible debt.
While we had previously expected our available capital and liquidity to be sufficient to fund our business and investment objectives for most of 2014, as a result of improving market conditions, our rate of capital deployment in the second half of 2014 may require us to source additional capital prior to the end of the year. As we have stated in the past, we look first to our own balance sheet for attractive opportunities to raise capital through sales or financings of assets before we look externally. Since the end of the second quarter of 2014, we sold $229 million of third-party securities generating net proceeds to Redwood of $21 million after repaying the associated financing. Should we decide we need to raise additional external capital to fund our business activities, we would consider the issuance of convertible debt securities under the shelf registration statement we currently have on file with the SEC, as well as the issuance of common equity, other debt securities, or similar or other types of securities in public or private offerings.
| | | | |
| THE REDWOOD REVIEW | 2ND QUARTER 2014 | | | 13 | |
| | |
| |
|
| | FINANCIAL INSIGHTS |
GAAP Income
Our consolidated GAAP net income for the second quarter of 2014 was $16 million, or $0.18 per diluted common share, as compared to $12 million, or $0.14 per diluted common share, for the first quarter of 2014. The following table presents the GAAP income statements for the second and first quarters of 2014.
| | | | | | | | |
Consolidated Income Statements | |
($ in millions, except per share data) | |
| | | Three Months Ended | |
| | | 6/30/14 | | | 3/31/14 | |
| Interest income | | $ | 48 | | | $ | 45 | |
| Net discount (premium) amortization | | | 10 | | | | 10 | |
| Total interest income | | | 58 | | | | 55 | |
| | | | | | | | | |
| Interest expense | | | (21 | ) | | | (19 | ) |
| Net interest income | | | 37 | | | | 36 | |
| | | | | | | | | |
| Reversal of provision (provision) for loan losses | | | 0 | | | | (1 | ) |
| Net interest income after provision | | | 37 | | | | 35 | |
| | | | | | | | | |
| Noninterest income | | | | | | | | |
Mortgage banking activities, net | | | 6 | | | | (0 | ) |
MSR income, net | | | (2 | ) | | | 1 | |
Other market valuation adjustments, net | | | (4 | ) | | | (6 | ) |
Realized gains, net | | | 1 | | | | 1 | |
Total noninterest income (loss), net | | | 1 | | | | (5 | ) |
| | | | | | | | | |
| Operating expenses | | | (22 | ) | | | (20 | ) |
| | | | | | | | | |
| (Provision for) benefit from income taxes | | | (0 | ) | | | 2 | |
| | | | | | | | | |
| Net income | | $ | 16 | | | $ | 12 | |
| | | | | | | | | |
| | | | | | | | | |
| Net income per share | | $ | 0.18 | | | $ | 0.14 | |
| | |
| 14 | | THE REDWOOD REVIEW | 2ND QUARTER 2014 |
| | |
| | |
FINANCIAL INSIGHTS | |
Net Interest Income
Net interest income was $37 million in the second quarter of 2014, an increase of $1 million from the first quarter of 2014. The following table highlights the components of net interest income for the second and first quarters of 2014.
| | | | | | | | |
Net Interest Income | |
($ in millions) | |
| | | Three Months Ended | |
| | | 6/30/14 | | | 3/31/14 | |
| | | |
Net interest income by segment | | | | | | | | |
| | | |
Residential Mortgage Banking | | $ | 10 | | | $ | 9 | |
| | | |
Residential Investments | | | 25 | | | | 25 | |
| | | |
Commercial Mortgage Banking and Investments | | | 7 | | | | 7 | |
| | | |
Corporate/Other net interest expense(1) | | | (5 | ) | | | (5 | ) |
Total Net Interest Income | | $ | 37 | | | $ | 36 | |
(1) For each of the three months ended 6/30/2014 and 3/31/14, net interest income from Corporate/Other includes $6 million of interest expense from long-term debt that is not directly assigned or allocated to any segment and $1 million of net interest income from legacy Sequoia entities.
Net interest income from our residential mortgage banking operations increased $1 million in the second quarter of 2014, as the average balance of residential loans held-for-sale on our balance sheet increased 43% to $740 million. The amount of interest income earned from loans held-for-sale is dependent on many factors, including the amount of loans, the length of time they are on our balance sheet, and their interest rates.
Net interest income from our residential investments portfolio remained stable as increases in interest income from a higher average balance of securities were offset by lower average yields. The average balance of our available-for-sale securities increased 5% to $1.5 billion in the second quarter of 2014, primarily from the acquisition of $150 million of Sequoia subordinate securities and third-party securities during the first and second quarters of 2014. The average yield on our available-for-sale securities declined to 7.4% from 7.7% in the first quarter of 2014, offsetting most of the benefit from higher average security balances.
Net interest income from our commercial operations remained stable as the average balances of senior loans held-for-sale as well as our investment portfolio of loans held-for-investment increased only slightly during the second quarter of 2014.
| | | | |
| THE REDWOOD REVIEW | 2ND QUARTER 2014 | | | 15 | |
| | |
| |
|
| | FINANCIAL INSIGHTS |
Mortgage Banking Activities
The following table presents the components of our mortgage banking activities for the second and first quarters of 2014.
| | | | | | | | |
Mortgage Banking Activities | |
($ in millions) | |
| | | Three Months Ended | |
| | | 6/30/14 | | | 3/31/14 | |
| | | |
| Residential mortgage banking activities | | | | | | | | |
Residential loans | | $ | 18 | | | $ | 7 | |
Risk management derivatives | | | (8 | ) | | | (4 | ) |
Sequoia securities | | | (9 | ) | | | (4 | ) |
Total residential mortgage banking activities | | | 1 | | | | (1 | ) |
| | | |
| Commercial mortgage banking activities | | | | | | | | |
Commercial loans | | | 6 | | | | 4 | |
Risk management derivatives | | | (1 | ) | | | (3 | ) |
Total commercial mortgage banking activities | | | 5 | | | | 1 | |
Total mortgage banking activities, net | | $ | 6 | | | $ | (0 | ) |
Income from mortgage banking activities was $6 million for the second quarter of 2014, as compared to a loss of less than $1 million in the first quarter of 2014, primarily reflecting increased income from commercial mortgage banking.
Income from residential mortgage banking activities improved with a gain of $1 million in the second quarter of 2014, as compared to a loss of $1 million in the first quarter of 2014. The improvement resulted primarily from a substantial increase in loan acquisition volume and related fair value gains during the second quarter.
Consistent with prior quarters, we continue to experience timing differences related to our jumbo mortgage pipeline (defined as those loans we have identified for purchase) and the hedging for those loans, making it difficult to fully ascertain our quarterly operating performance from our high-level GAAP results. In the second quarter, we incurred hedging expenses that were reflected in that period’s earnings, but the change in value of the $1.6 billion (unadjusted for expected fallout) of jumbo loans we expect to purchase in the pipeline at June 30, 2014, was not reflected in earnings. Instead, the valuation change on these loans will be reflected in earnings when they are purchased in the third quarter of 2014.
Our commercial operations generated income from mortgage banking activities of $5 million in the second quarter of 2014, up from $1 million in the first quarter of 2014. The improvement is due to a combination of increased loan sale profit margins and higher origination volume, which improved from a seasonally low level in the first quarter of 2014. During the second quarter of 2014, we originated 15 senior commercial loans totaling $149 million, as compared to six loans totaling $119 million in the first quarter of 2014.
| | |
| 16 | | THE REDWOOD REVIEW | 2ND QUARTER 2014 |
| | |
| | |
FINANCIAL INSIGHTS | |
MSR Income, Net
Income from our investments in mortgage servicing rights was negative $2 million in the second quarter of 2014, as compared to positive $1 million in the first quarter of 2014. Fee income generated from MSRs was $4 million for the second quarter of 2014, as compared to $3 million in the first quarter, as the amount of loans associated with our servicing rights increased $1.2 billion to $7.1 billion at June 30, 2014. Our second quarter MSR income was adversely impacted by continued declines in interest rates that resulted in $6 million of negative market valuation adjustments, as compared to negative $3 million in the first quarter.
Other Market Valuation Adjustments
Other market valuation adjustments were negative $4 million for the second quarter of 2014, a $2 million improvement from the first quarter of 2014. The majority of this expense is attributable to declines in the value of interest rate hedging derivatives caused by declining interest rates during the second quarter of 2014. These derivatives are used to manage risks associated with the net interest rate exposure at our Residential Investments segment. The Residential Investments segment includes fixed-rate securities, which increase in value as rates decline, and MSRs, which decrease in value as rates decline. The fair value of the hedged securities increased $12 million and the MSRs declined in value by $6 million in the second quarter of 2014. The aggregate changes in security values include changes attributable to interest rates, and this increase was recorded through other comprehensive income on our balance sheet rather than through our reported earnings.
Realized Gains, Net
In both the second and first quarters of 2014, we recognized $1 million of gains related to sales and calls of residential investment securities.
Operating Expenses
Operating expenses were $22 million for the second quarter of 2014, as compared to $20 million for the first quarter of 2014, primarily due to an increase in compensation and other personnel-related expenses associated with the expansion of our residential and commercial mortgage banking operations.
Provision for Income Taxes
During the second quarter of 2014, we recognized a provision for income taxes of less than $1 million primarily related to GAAP income generated at our taxable REIT subsidiaries. See the Taxable Income and Dividends section on page 27 for further information.
| | | | |
| THE REDWOOD REVIEW | 2ND QUARTER 2014 | | | 17 | |
| | |
| |
|
| | FINANCIAL INSIGHTS |
Balance Sheet
The following table shows the components of our balance sheet at June 30, 2014.
| | | | | | | | | | | | |
Consolidating Balance Sheet(1) | |
June 30, 2014 ($ in millions) | |
| | | At
Redwood | | | Consolidated
VIEs(2) | | | Redwood
Consolidated | |
| | | | |
Residential loans | | $ | 1,108 | | | $ | 1,617 | | | $ | 2,724 | |
Commercial loans | | | 214 | | | | 255 | | | | 469 | |
Real estate securities - Third party | | | 990 | | | | 246 | | | | 1,236 | |
Real estate securities - Sequoia(3) | | | 609 | | | | - | | | | 609 | |
Mortgage servicing rights | | | 71 | | | | - | | | | 71 | |
Cash and cash equivalents | | | 157 | | | | - | | | | 157 | |
Total earning assets | | | 3,150 | | | | 2,117 | | | | 5,267 | |
| | | | |
Other assets | | | 100 | | | | 12 | | | | 112 | |
Total assets | | $ | 3,250 | | | $ | 2,129 | | | $ | 5,379 | |
| | | | |
Short-term debt | | | | | | | | | | | | |
Mortgage loan warehouse debt | | $ | 865 | | | $ | - | | | $ | 865 | |
Security repurchase facilities | | | 854 | | | | - | | | | 854 | |
Other liabilities | | | 94 | | | | 2 | | | | 97 | |
Asset-backed securities issued | | | - | | | | 1,768 | | | | 1,768 | |
Long-term debt | | | 547 | | | | - | | | | 547 | |
Total liabilities | | | 2,359 | | | | 1,770 | | | | 4,130 | |
| | | | |
Stockholders’ equity | | | 890 | | | | 359 | | | | 1,249 | |
Total liabilities and equity | | $ | 3,250 | | | $ | 2,129 | | | $ | 5,379 | |
(1) We changed the format of this consolidating balance sheet to more clearly delineate between (i) the $2.1 billion of assets belonging to certain securitization entities (variable interest entities, or VIEs) that we are required to consolidate on our balance sheet in accordance with GAAP, but which are not legally ours, and the $1.8 billion of liabilities of these VIEs, which are payable only from the cash flows generated by their assets and are, therefore, nonrecourse to us, and (ii) the $3.3 billion of assets that are legally ours and the $2.4 billion of liabilities of ours for which there is recourse to us.
(2) Consolidated VIEs include certain Sequoia securitizations completed prior to 2012 as well as the Residential Resecuritization and Commercial Securitization transactions we completed in 2011 and 2012, respectively, that we are required to consolidate under GAAP. Our estimated GAAP investment in these entities was $359 million at June 30, 2014, representing the difference between the aggregate assets and liabilities of these entities. Legally, we own only the securities and interests that we acquired from these VIEs.
(3) Sequoia securitizations completed between January 2012 and June 2014 are treated as sales for GAAP, and the $609 million of securities we have retained from these transactions are reflected in the “At Redwood” column above in “Real Estate Securities — Sequoia.”
| | |
| 18 | | THE REDWOOD REVIEW | 2ND QUARTER 2014 |
| | |
| | |
FINANCIAL INSIGHTS | |
Residential Loans
The table below details residential loan activity at Redwood during the second and first quarters of 2014.
| | | | | | | | |
Residential Loans at Redwood | |
($ in millions) | |
| | | Three Months Ended | |
| | | 6/30/14 | | | 3/31/14 | |
Beginning fair value | | $ | 775 | | | $ | 404 | |
| | | |
| | | | | | | | | |
Acquisitions | | | 1,791 | | | | 1,093 | |
Sales | | | (1,467 | ) | | | (722 | ) |
Principal payments | | | (5 | ) | | | (7 | ) |
Change in fair value, net | | | 14 | | | | 7 | |
| | | |
| | | | | | | | | |
Ending fair value | | $ | 1,108 | | | $ | 775 | |
At June 30, 2014, we owned $1.1 billion of prime residential loans, including $848 million of jumbo loans and $260 million of conforming loans. These loans included $840 million of 30-year fixed-rate loans, $84 million of 10-year to 25-year fixed-rate loans, $182 million of hybrid loans, and $2 million of ARM loans. At June 30, 2014, our pipeline of loans identified for purchase (unadjusted for fallout) included $1.6 billion of jumbo loans and $379 million of conforming loans. See the Residential Mortgage Banking section on page 30 for additional information.
The remainder of our residential loans, totaling $1.6 billion, are held in consolidated Sequoia entities. Our investments in these entities, as estimated for GAAP, totaled $69 million at June 30, 2014. This amount reflects the book value of our retained investments in consolidated Sequoia entities and is based on the difference between the consolidated assets and liabilities of the entities in the aggregate according to their GAAP carrying amounts.
| | | | |
| THE REDWOOD REVIEW | 2ND QUARTER 2014 | | | 19 | |
| | |
| |
|
| | FINANCIAL INSIGHTS |
Commercial Loans
The following table details commercial loan activity during the second and first quarters of 2014.
| | | | | | | | | | | | | | | | | | | | |
Commercial Loans | |
| Three Months Ended June 30, 2014 | |
($ in millions) | |
| | | Senior | | | A/B Notes | | | Unsecuritized
Mezzanine | | | Securitized
Mezzanine | | | Total | |
Beginning carrying value | | $ | 77 | | | $ | 69 | | | $ | 87 | | | $ | 257 | | | $ | 491 | |
| | | | | | |
Originations | | | 149 | | | | - | | | | 6 | | | | - | | | | 155 | |
Sales | | | (181 | ) | | | - | | | | - | | | | - | | | | (181 | ) |
Principal payments/amortization | | | (0 | ) | | | (0 | ) | | | 0 | | | | (2 | ) | | | (2 | ) |
Change in fair value, net | | | 6 | | | | 2 | | | | - | | | | - | | | | 7 | |
Change in allowance for loan losses | | | - | | | | - | | | | (0 | ) | | | (0 | ) | | | (0 | ) |
| | | | | | | | | | | | | | | | | | | | | |
Ending carrying value | | $ | 51 | | | $
|
71 |
| | $ | 92 | | | $ | 255 | | | $ | 469 | |
| | | | | | | | | | | | | | | | | | | | |
Commercial Loans | |
| Three Months Ended March 31, 2014 | |
($ in millions) | |
| | | Senior | | | A/B Notes | | | Unsecuritized
Mezzanine | | | Securitized
Mezzanine | | | Total | |
Beginning carrying value | | $ | 89 | | | $ | - | | | $ | 86 | | | $ | 258 | | | $ | 432 | |
| | | | | | |
Originations | | | 88 | | | | 31 | | | | 2 | | | | - | | | | 121 | |
Sales | | | (65 | ) | | | - | | | | - | | | | - | | | | (65 | ) |
A/B-note reclassification | | | (38 | ) | | | 38 | | | | - | | | | - | | | | - | |
Principal payments/amortization | | | (0 | ) | | | - | | | | - | | | | - | | | | (0 | ) |
Change in fair value, net | | | 3 | | | | - | | | | - | | | | - | | | | 3 | |
Change in allowance for loan losses | | | - | | | | - | | | | - | | | | (1 | ) | | | (1 | ) |
| | | | | | | | | | | | | | | | | | | | | |
Ending carrying value | | $ | 77 | | | $ | 69 | | | $ | 87 | | | $ | 257 | | | $ | 491 | |
At June 30, 2014, we owned $469 million of commercial loans, as compared to $491 million of commercial loans at March 31, 2014. During the second quarter of 2014, we originated 15 senior loans and sold 13 senior loans. Additionally, we originated two mezzanine loans. During the second quarter of 2014, we also sold an A-note that did not qualify as a sale under GAAP and continues to be consolidated on our balance sheet. A-notes we sell and the associated B-notes we retain are both held at fair value and are shown separately in the table above. See the Commercial Mortgage Banking Activities section on page 33 for additional information.
| | |
| 20 | | THE REDWOOD REVIEW | 2ND QUARTER 2014 |
|
|
FINANCIAL INSIGHTS |
Residential Real Estate Securities
The following table details commercial loan activity during the second and first quarters of 2014.
| | | | | | | | | | | | | | | | | | | | | | | | |
Real Estate Securities (1) June 30, 2014 ($ in millions) | |
| | | Sequoia
Securities
2012-2014 | | | Third-party Securities | | | Total
Securities | | | % of Total
Securities | |
| | | | <=2005 | | | 2006-2008 | | | 2012-2014 | | | |
| | | | | | | | | | | | | | | | | | | |
Seniors | | | | | | | | | | | | | | | | | | | | | | | | |
Prime | | $ | 162 | | | $ | 503 | | | $ | 207 | | | $ | - | | | $ | 872 | | | | 47 | % |
Non-prime(2) | | | - | | | | 195 | | | | 5 | | | | - | | | | 200 | | | | 12 | % |
Total seniors | | | 162 | | | | 698 | | | | 212 | | | | - | | | | 1,072 | | | | 59 | % |
| | | | | | | |
Prime re-REMIC | | | - | | | | 77 | | | | 116 | | | | - | | | | 193 | | | | 10 | % |
| | | | | | | |
Prime Subordinates | | | | | | | | | | | | | | | | | | | | | | | | |
Mezzanine(3) | | | 371 | | | | - | | | | - | | | | 54 | | | | 425 | | | | 23 | % |
Subordinate | | | 76 | | | | 59 | | | | 1 | | | | 19 | | | | 155 | | | | 8 | % |
Prime subordinates | | | 447 | | | | 59 | | | | 1 | | | | 73 | | | | 580 | | | | 31 | % |
Total real estate securities | | $ | 609 | | | $ | 834 | | | $ | 329 | | | $ | 73 | | | $ | 1,845 | | | | 100 | % |
(1) Included in the real estate securities table above are $246 million of senior securities that are included in the Residential Resecuritization that we completed in July 2011. Under GAAP accounting, we account for the resecuritization as a financing even though these securities are owned by the resecuritization entity and are legally not ours. We own only the securities and interests that we acquired from the resecuritization entity, which amounted to $165 million at June 30, 2014. As a result, to adjust at June 30, 2014 for the legal and economic interests that resulted from the resecuritization, Total Senior Securities would be decreased by $246 million to $826 million, Prime Re-REMIC Securities would be increased by $165 million to $358 million, and Total Real Estate Securities would be reduced by $81 million to $1.76 billion.
(2) Non-prime residential securities consist of Alt-A senior securities.
(3) Prime mezzanine includes securities initially rated AA, A, and BBB- and issued in 2012 or later.
| | | | |
| THE REDWOOD REVIEW | 2ND QUARTER 2014 | | | 21 | |
| | |
| |
|
| | FINANCIAL INSIGHTS |
Residential Real Estate Securities (continued)
The table below details the change in fair value of real estate securities during the second and first quarters of 2014.
| | | | | | | | |
Real Estate Securities | |
($ in millions) | |
| | | Three Months Ended | |
| | | 6/30/14 | | | 3/31/14 | |
Beginning fair value | | $ | 1,743 | | | $ | 1,683 | |
Acquisitions | | | | | | | | |
Sequoia securities | | | 85 | | | | - | |
Third-party securities | | | 56 | | | | 74 | |
Sales | | | | | | | | |
Third-party securities | | | (1 | ) | | | - | |
Gain on sale | | | 1 | | | | - | |
Gain on calls, net | | | - | | | | 1 | |
Effect of principal payments | | | (51 | ) | | | (39 | ) |
Change in fair value, net | | | 12 | | | | 24 | |
| | | |
| | | | | | | | | |
Ending fair value | | $ | 1,845 | | | $ | 1,743 | |
During the second quarter of 2014, we acquired $65 million of senior Sequoia securities, $20 million of mezzanine and subordinate Sequoia securities, $51 million of third-party senior securities and $6 million of third-party subordinate securities. We sold one third-party residential senior security during the second quarter of 2014, resulting in a $1 million gain.
At June 30, 2014, residential securities we owned (as a percentage of current market value) consisted of fixed-rate assets (46%), adjustable-rate assets (16%), hybrid assets that reset within the next year (33%), and hybrid assets that reset between 12 and 36 months (5%).
| | |
| 22 | | THE REDWOOD REVIEW | 2ND QUARTER 2014 |
|
|
FINANCIAL INSIGHTS |
Mortgage Servicing Rights (MSRs)
The table below details the change in fair value of Redwood’s MSRs during the second and first quarters of 2014.
| | | | | | | | |
MSRs | |
($ in millions) | |
| | | Three Months Ended | |
| | | 6/30/14 | | | 3/31/14 | |
Beginning fair value | | $ | 65 | | | $ | 65 | |
Additions | | | 12 | | | | 3 | |
Change in fair value, net | | | (6 | ) | | | (3 | ) |
| | | | | | | | | |
| Ending fair value | | $ | 71 | | | $ | 65 | |
At June 30, 2014, we owned $56 million of jumbo MSR investments and $15 million of conforming MSR investments associated with residential loan aggregate principal balances of $5.6 billion and $1.4 billion, respectively. We earn fees from these MSRs, but outsource the actual servicing of the associated loans to a third-party servicer.
During the second quarter of 2014, we added $12 million of MSRs associated with $1.2 billion of residential loans primarily acquired through our residential mortgage banking operations. The GAAP carrying value, which is the estimated fair value, of our MSRs at June 30, 2014 was equal to 1.01% of the aggregate principal balance of the associated residential loans. At June 30, 2014, the 30-day delinquency ratio was 0.19%. There was one loan delinquent greater than 30 days.
| | | | |
| THE REDWOOD REVIEW | 2ND QUARTER 2014 | | | 23 | |
| | |
| |
|
| | FINANCIAL INSIGHTS |
Derivatives
The following table presents the fair value and notional value of derivative financial instruments held at June 30, 2014 and March 31, 2014, which are components of other assets and other liabilities on our consolidated balance sheet.
| | | | | | | | | | | | | | | | |
Derivatives | |
($ in millions) | |
| | | 6/30/14 | | | 3/31/14 | |
| | | Fair Value | | | Notional | | | Fair Value | | | Notional | |
| Risk management derivatives, net | | | | | | | | | | | | | | | | |
Residential mortgage banking | | $ | (0 | ) | | $ | 1,641 | | | $ | 1 | | | $ | 1,115 | |
Residential investments | | | (2 | ) | | | 256 | | | | 1 | | | | 215 | |
Commercial mortgage banking and investments | | | 0 | | | | 65 | | | | (0 | ) | | | 26 | |
| Loan purchase and forward sale commitments | | | 1 | | | | 625 | | | | (0 | ) | | | 171 | |
| Cash flow hedges on long-term debt | | | (31 | ) | | | 140 | | | | (25 | ) | | | 140 | |
| | | | | | | | | | | | | | | | | |
| Total derivative financial instruments, net | | $ | (33 | ) | | $ | 2,726 | | | $ | (23 | ) | | $ | 1,668 | |
We use derivative financial instruments in part to mitigate the interest rate risk associated with some of our residential and commercial loan activity, in addition to the net interest rate exposure within our investment portfolio. Net changes in the fair value of risk management derivatives are reflected in our income statement in Mortgage banking activities, net, for residential and commercial mortgage banking segments and in Other market valuation adjustments, net for our residential investments segment. The timing of when we enter into and exit these derivatives, and the corresponding levels of benchmark interest rates, has a significant effect on the amount of valuation income or loss recognized. During the second quarter of 2014, the aggregate fair value of risk management derivatives, including those agreements that we exited during the quarter, declined by $12 million.
We also record conforming loan purchase and forward sale commitments as derivatives. In the second quarter of 2014, these derivatives increased in value by $4 million.
Falling benchmark interest rates resulted in a $5 million increase to our derivative liability related to cash flow hedges on our long-term debt. Changes in the fair value of our cash flow hedges were recorded in shareholders’ equity through accumulated other comprehensive income.
| | |
| 24 | | THE REDWOOD REVIEW | 2ND QUARTER 2014 |
| | |
| | |
FINANCIAL INSIGHTS | |
Short-Term Debt
At June 30, 2014, we had short-term residential mortgage warehouse debt outstanding of $852 million, which was used to finance a portion of the $1.1 billion inventory of residential mortgage loans held for sale. We also had short-term commercial mortgage warehouse debt outstanding of $12 million, which was used to finance a portion of the $51 million inventory of commercial mortgage loans held for sale.
At June 30, 2014, we had five uncommitted residential mortgage warehouse facilities with an aggregate borrowing capacity of $1.4 billion, and one uncommitted commercial mortgage warehouse facility for senior loans with a borrowing capacity of $100 million.
At June 30, 2014, we had short-term debt incurred through securities repurchase facilities of $854 million, which was secured by $1.0 billion of residential securities, resulting in a debt-to-equity leverage ratio for these residential securities of 5.8x (excluding the additional risk capital we hold related to these short-term borrowings).
The table below details the activity of short-term debt during the second and first quarters of 2014.
| | | | | | | | | | | | | | | | | | | | | | | | |
Short-Term Debt by Collateral Type | |
($ in millions) | |
| | | Residential Loans | | | Residential Securities | | | Senior Commercial Loans | |
| | | Q2 2014 | | | Q1 2014 | | | Q2 2014 | | | Q1 2014 | | | Q2 2014 | | | Q1 2014 | |
Beginning balance | | $ | 512 | | | $ | 185 | | | $ | 708 | | | $ | 678 | | | $ | 68 | | | $ | - | |
Borrowings | | | 1,230 | | | | 718 | | | | 180 | | | | 80 | | | | 87 | | | | 123 | |
Repayments | | | (890 | ) | | | (391 | ) | | | (34 | ) | | | (50 | ) | | | (143 | ) | | | (55 | ) |
| | | | | | | |
| | | | | | | | | | | | | | | | | | | | | | | | | |
Ending balance | | $ | 852 | | | $ | 512 | | | $ | 854 | | | $ | 708 | | | $ | 12 | | | $ | 68 | |
| | | | |
| THE REDWOOD REVIEW | 2ND QUARTER 2014 | | | 25 | |
| | |
| |
|
| | FINANCIAL INSIGHTS |
Long-Term Debt and ABS Issued
At June 30, 2014, we had $288 million of convertible senior notes outstanding at a stated interest rate of 4.625% (excluding deferred issuance costs), that are convertible into 41.1320 shares of common stock per $1,000 principal amount (equivalent to a conversion price of $24.31 per common share and subject to certain adjustments) on or before their maturity in April 2018.
At June 30, 2014, we had $140 million of other long-term debt outstanding due in 2037 with a stated interest rate of three-month LIBOR plus 225 basis points (excluding deferred issuance costs). In 2010, we effectively fixed the interest rate on this long-term debt at approximately 6.75% (excluding deferred issuance costs) through interest rate swaps.
At June 30, 2014, we had $53 million of borrowings outstanding under a $150 million commercial warehouse facility for mezzanine and B-note loans. Due to the 15-month remaining term of this facility as of June 30, 2014, it is classified as long-term debt on our consolidated balance sheet.
At June 30, 2014, we had commercial secured borrowings of $67 million as a result of our requirement under GAAP to classify certain senior commercial loans we originated and sold to third-parties as financings and not sales. These secured borrowings are recorded at their fair value, which is equal to the fair value of the associated senior loans that were sold but not derecognized.
At June 30, 2014, we had $1.8 billion outstanding of non-recourse, asset-backed debt issued at consolidated VIEs. Included in this amount was $70 million at a stated interest rate of one-month LIBOR plus 200 basis points related to our Residential Resecuritization, $145 million at a stated interest rate of 5.62% (excluding deferred issuance costs) related to our Commercial Securitization, and $1.6 billion at consolidated Sequoia entities.
| | |
| 26 | | THE REDWOOD REVIEW | 2ND QUARTER 2014 |
| | |
| | |
FINANCIAL INSIGHTS | |
Taxable Income and Dividends
Summary
As a REIT, Redwood is required to distribute to shareholders at least 90% of its REIT taxable income. REIT taxable income is defined as taxable income earned at Redwood and its qualified REIT subsidiaries. To the extent Redwood retains REIT taxable income, it is taxed at corporate tax rates. Redwood also earns taxable income at its taxable REIT subsidiaries (TRS), which it is not required to distribute.
Dividend Policy Overview
Our Board of Directors has maintained a policy of paying regular quarterly dividends, although we have not been required to distribute dividends in recent years under the provisions of the Internal Revenue Code applicable to REITs. In November 2013, the Board of Directors announced its intention to pay a regular dividend of $0.28 per share per quarter in 2014. On May 20, 2014, the Board of Directors declared a regular dividend of $0.28 per share for the second quarter which was paid on June 30, 2014, to shareholders of record on June 13, 2014. In August, 2014, the Board of Directors declared a regular dividend of $0.28 per share for the third quarter which is payable on September 30, 2014 to shareholders of record on September 15, 2014.
We are regularly asked about dividends and our process for determining the quarterly dividends we distribute to shareholders. Our regular quarterly dividend rate is ultimately a Board of Directors’ decision. Our Board’s practice has been to announce its intention with respect to the regular quarterly dividend for the upcoming calendar year towards the end of the fourth quarter of each year. The consistency and sustainability of the dividend over time has always been an important consideration and priority.
In recent years, the quarterly dividend rate has not been directly tied to GAAP or REIT taxable earnings for any particular quarter. In addition, in deliberating about dividends, the Board has generally considered numerous factors, including management’s projections for the company’s GAAP and REIT taxable earnings, and also projections of cash flows, capital, and liquidity. For example, in 2011, no change to the dividend rate was made, even though our earnings were lower than the quarterly dividend, as we invested in building our residential and commercial platforms.
Dividend Distribution Requirement
Our estimated REIT taxable income was $14 million, or $0.17 per share, for the second quarter of 2014 and $15 million, or $0.19 per share, for the first quarter of 2014. Under normal circumstances, our minimum REIT dividend requirement would be 90% of our annual REIT taxable income. However, we currently maintain a federal $70 million REIT net operating loss carry forward (NOL) that affords us the option of retaining REIT taxable income up to the NOL amount, tax free, rather than distributing it as dividends. Federal income tax rules require the dividends paid deduction to be applied to reduce taxable income before the applicability of NOLs is considered. We do not expect our estimated REIT taxable income to exceed our dividend distributions in 2014; therefore, our entire NOL will likely carry forward into 2015.
| | | | |
| THE REDWOOD REVIEW | 2ND QUARTER 2014 | | | 27 | |
| | |
| |
|
| | FINANCIAL INSIGHTS |
Taxable Income and Dividends (Continued)
Income Tax Characterization of Dividend for Shareholders
Irrespective of our minimum distribution requirement, federal income tax rules require that the actual dividends we distribute in 2014 be taxed at the shareholder level based on our full year 2014 taxable income plus net capital gains before application of any loss carry forwards. Based on this requirement, we expect much of the dividends we distribute in 2014 will be taxable as ordinary income to shareholders and a smaller portion to be a return of capital, which is generally non-taxable. None of Redwood’s 2014 dividend distributions are expected to be characterized as long-term capital gains for federal income tax purposes. Factors that significantly affected the taxation of our 2014 dividends to shareholders include but are not limited to: (i) the timing of realized credit losses on legacy investments and (ii) capital gains on sales of securities.
(i) Our estimated REIT taxable income for the six months ended June 30, 2014 included $4 million of realized credit losses on legacy investments that were taken in previous periods for GAAP reporting purposes. We anticipate an additional $40 million of tax credit losses to be realized over an estimated three- to five-year period based on the securities we currently own. This is a decrease from $59 million at December 31, 2013 and $111 million at December 31, 2012. Even though the impact of realized losses on our current period taxable income is declining, our GAAP earnings, which have provisioned for these losses in prior periods, will likely continue to exceed our REIT taxable income.
(ii) For the six months ended June 30, 2014, we realized net capital gains of $1 million at the REIT level for tax purposes. Net capital gains generated by the REIT for the entire year could increase the portion of our 2014 dividends that are characterized as ordinary income to our shareholders. However, if the REIT realizes net capital losses for 2014, those losses would have no effect on the taxability of our 2014 dividends. None of our 2014 dividend distributions are expected to be characterized as long-term capital gains based on applicable federal income tax rules.
GAAP Provision for Income Tax at Taxable REIT Subsidiaries
To the extent we expect to pay tax at the corporate level (generally as a result of activity at our taxable REIT subsidiaries), we are required to record a tax provision for GAAP reporting purposes. We recorded a tax provision of less than $1 million for the second quarter of 2014, as compared to a $2 million tax benefit for the first quarter of 2014. The provision was primarily due to GAAP income recorded at our TRS during the second quarter of 2014. Our total tax benefit of $2 million through the first six months of 2014 is not intended to reflect an actual amount we expect to receive as an income tax refund in the current year, but rather a deferred GAAP benefit that we expect to utilize in future periods as GAAP income is earned at our TRS. A reconciliation of GAAP and taxable income is set forth in Table 2 of the Financial Tables of this Redwood Review. We do not expect to generate excess inclusion income in 2014, but in the event we do, it is our intention to retain it at our TRS and not pass it through to our shareholders.
| | |
| 28 | | THE REDWOOD REVIEW | 2ND QUARTER 2014 |
|
|
BUSINESS SEGMENTS |
Summary
We operate our business in three segments: residential mortgage banking, residential investments, and commercial mortgage banking and investments.
The table below presents our consolidated financial results for the second quarter of 2014 by presenting the direct contribution of each segment separately. The table also includes a reconciling column labeled “Corporate/Other” that includes the impact of our legacy Consolidated Sequoia Entities, certain long-term debt, and corporate operations not directly attributable to our operating segments. Following the table below are descriptions of each segment along with a summary of activity in each segment. Additional detail on our segments and their results will be provided in our Quarterly Report on Form 10-Q.
| | | | | | | | | | | | | | | | | | | | |
Segment Results | |
| Three Months Ended June 30, 2014 | |
($ in millions) | |
| | | Residential Mortgage Banking | | | Residential Investments | | | Commercial Mortgage Banking and Investments | | | Corporate/ Other | | | Total | |
| | | | | | |
| Interest income | | $ | 12 | | | $ | 28 | | | $ | 11 | | | $ | 6 | | | $ | 58 | |
| Interest expense | | | (2 | ) | | | (3 | ) | | | (4 | ) | | | (11 | ) | | | (21 | ) |
| Net interest income (loss) | | | 10 | | | | 25 | | | | 7 | | | | (5 | ) | | | 37 | |
| Reversal of provision (provision) for loan losses | | | - | | | | - | | | | (0 | ) | | | 1 | | | | 0 | |
| Net interest income (loss) after provision | | | 10 | | | | 25 | | | | 7 | | | | (4 | ) | | | 37 | |
| | | | | | |
| Noninterest income | | | | | | | | | | | | | | | | | | | | |
Mortgage banking activities, net | | | 1 | | | | - | | | | 5 | | | | - | | | | 6 | |
MSR income, net | | | - | | | | (2 | ) | | | - | | | | - | | | | (2 | ) |
Other market valuation adjustments, net | | | 0 | | | | (4 | ) | | | - | | | | (0 | ) | | | (4 | ) |
Realized gains, net | | | - | | | | 1 | | | | - | | | | 0 | | | | 1 | |
Total noninterest income (loss), net | | | 1 | | | | (5 | ) | | | 5 | | | | (0 | ) | | | 1 | |
| | | | | | |
| Operating expenses | | | (10 | ) | | | (1 | ) | | | (2 | ) | | | (10 | ) | | | (22 | ) |
| Other expense | | | - | | | | - | | | | - | | | | - | | | | - | |
| | | | | | |
(Provision for) benefit from income taxes | | | 0 | | | | 0 | | | | (1 | ) | | | 0 | | | | (0 | ) |
| Segment contribution | | $ | 2 | | | $ | 20 | | | $ | 9 | | | $ | (15 | ) | | | | |
| | | | | | | | | | | | | | | | | | | | | |
| Net income | | | | | | | | | | | | | | | | | | $ | 16 | |
| Additional Information: | | | | | | | | | | | | | | | | | | | | |
| Residential loans - unsecuritized | | $ | 1,108 | | | $ | - | | | $ | - | | | $ | - | | | $ | 1,108 | |
| Residential loans - securitized | | | - | | | | - | | | | - | | | | 1,617 | | | | 1,617 | |
| Commercial loans | | | - | | | | - | | | | 469 | | | | - | | | | 469 | |
| Real estate securities | | | 159 | | | | 1,686 | | | | - | | | | - | | | | 1,845 | |
| Mortgage servicing rights | | | - | | | | 71 | | | | - | | | | - | | | | 71 | |
| Total Assets | | $ | 1,292 | | | $ | 1,775 | | | $ | 475 | | | $ | 1,837 | | | $ | 5,379 | |
| | | | |
| THE REDWOOD REVIEW | 2ND QUARTER 2014 | | | 29 | |
| | |
| |
|
| | BUSINESS SEGMENTS |
Residential Mortgage Banking
Summary
The Residential Mortgage Banking segment primarily consists of a mortgage loan conduit that acquires residential loans from third-party originators for subsequent sale. The jumbo loans we acquire are typically sold through our Sequoia private-label securitization program or to institutions that acquire pools of whole loans. The conforming loans we acquire are generally sold to Fannie Mae and Freddie Mac. Our residential loan acquisitions are usually made on a flow basis as they are originated by banks or mortgage companies. We occasionally supplement our flow purchases with bulk acquisitions as well.
This segment’s main source of revenue is income from mortgage banking activities, which includes valuation increases (or gains) on the sale or securitization of loans, and from IO securities and derivatives used to manage risks associated with these activities. Additionally, this segment may generate interest income on loans held pending sale. Funding expenses, direct operating expenses, and tax expenses associated with these activities are also included.
| u | | During the second quarter of 2014, we identified $3.2 billion of loans for purchase and we acquired $1.8 billion of loans, compared to the first quarter of 2014, when we identified $1.7 billion of loans for purchase and we acquired $1.1 billion of loans. |
| u | | During the second quarter of 2014, we completed one prime jumbo securitization totaling $351 million, 6 jumbo whole loan sale transactions totaling $357 million, and $757 million of conforming loan sales to the GSEs, as compared to the first quarter of 2014 when we completed 12 whole loan sale transactions totaling $562 million and sold $160 million of conforming loans to the GSEs. |
| u | | In the second quarter of 2014, industry-wide private-label jumbo RMBS issuance totaled $1.0 billion, compared to $1.3 billion in the first quarter of 2014, according to Inside Nonconforming Markets. |
| u | | Redwood has sponsored, through its Sequoia platform, $8.8 billion, or 44%, of the $20.0 billion of total private-label RMBS issuance from 2010 through June 30, 2014, as reported by Inside Nonconforming Markets. |
| u | | At June 30, 2014, the fair value of our residential loans held for sale was $1.1 billion, an increase from $775 million at March 31, 2014. At June 30, 2014, our pipeline of residential loans identified for purchase (unadjusted for fallout) was $1.6 billion of jumbo loans and $379 million of conforming loans. |
| u | | Active sellers increased to a total of 140 at June 30, 2014, from 124 at March 31, 2014. |
| u | | At June 30, 2014, IO and senior securities retained from Sequoia securitizations totaled $159 million at this segment. |
| | |
| 30 | | THE REDWOOD REVIEW | 2ND QUARTER 2014 |
|
|
BUSINESS SEGMENTS |
Residential Investments
Summary
The Residential Investments segment includes a portfolio of investments in residential mortgage-backed securities (RMBS) retained from our Sequoia securitizations, as well as RMBS issued by third parties. This segment also includes mortgage servicing rights (MSRs) associated with residential loans securitized through our Sequoia program or sold to the GSEs or other third parties, and MSRs purchased from third parties.
This segment’s main source of revenue is net interest income from portfolio securities and income from MSRs. Additionally, this segment may realize gains upon the sale of securities or MSRs. Funding expenses, hedging expenses, direct operating expenses, and tax expenses associated with these activities are also included.
| u | | At June 30, 2014, the fair value of the residential securities in the residential investments segment totaled $1.7 billion, consisting of $712 million in prime senior securities, $201 million in non-prime senior securities, $193 million in re-REMIC securities, $425 million in mezzanine securities, and $156 million in subordinate securities. The amortized cost of our available-for-sale securities, which accounted for all but $14 million of securities (held as trading securities) in this segment, was 79% of face value and the fair value was 90% of face value at June 30, 2014. |
| u | | We financed our holdings of residential securities through a combination of short-term debt secured by securities, our Residential Resecuritization, long-term debt and equity capital. During the second quarter of 2014, average short-term debt secured by securities was $840 million and the average asset-backed securities outstanding in the Residential Resecuritization was $74 million. |
| u | | During the second quarter of 2014, we sponsored one Sequoia securitization and retained $65 million of senior securities, $20 million of mezzanine and subordinate securities and $2 million of MSR investments. The senior securities retained from this securitization are included in the Residential Mortgage Banking segment. In the first quarter of 2014, we did not sponsor any Sequoia securitizations. At June 30, 2014, retained investments acquired from Sequoia securitizations totaled $664 million, including $162 million of senior securities, $371 million of mezzanine securities, $76 million of subordinate securities, and $55 million of MSRs. |
| u | | Information on the residential securities we own is set forth in Tables 5 through 7 in the Appendix. |
| | | | |
| THE REDWOOD REVIEW | 2ND QUARTER 2014 | | | 31 | |
| | |
| |
|
| | BUSINESS SEGMENTS |
Residential Investments (continued)
The following table presents information on residential securities in our residential investments segment at June 30, 2014. For GAAP, we account for the large majority of these securities as available-for-sale (AFS) and others as trading securities, and in both cases the securities are reported at their fair value at the report date.
| | | | | | | | | | | | | | | | | | | | | | | | |
Residential Securities | |
| June 30, 2014 | |
($ in millions) | |
| | | Senior | | | | | | Subordinate | | | | |
| | | Prime | | | Non-prime | | | Re-REMIC | | | Mezzanine | | | Subordinate | | | Total | |
| Available-for-sale securities | | | | | | | | | | | | | | | | | | | | | | | | |
Current face | | $ | 711 | | | $ | 210 | | | $ | 223 | | | $ | 460 | | | $ | 258 | | | $ | 1,862 | |
Credit reserve | | | (5 | ) | | | (10 | ) | | | (18 | ) | | | (0 | ) | | | (50 | ) | | | (83 | ) |
Net unamortized discount | | | (38 | ) | | | (36 | ) | | | (89 | ) | | | (43 | ) | | | (98 | ) | | | (304 | ) |
Amortized cost | | | 667 | | | | 164 | | | | 117 | | | | 417 | | | | 110 | | | | 1,474 | |
| | | | | | | |
Unrealized gains | | | 46 | | | | 28 | | | | 76 | | | | 12 | | | | 42 | | | | 205 | |
Unrealized losses | | | (2 | ) | | | (0 | ) | | | 0 | | | | (4 | ) | | | (2 | ) | | | (7 | ) |
| | | | | | | |
Trading securities | | | - | | | | 9 | | | | - | | | | - | | | | 6 | | | | 14 | |
| Fair value of residential securities | | $ | 712 | | | $ | 201 | | | $ | 193 | | | $ | 425 | | | $ | 156 | | | $ | 1,686 | |
Investments in MSRs
| u | | In the second quarter of 2014, Redwood’s investment in MSRs increased to $71 million, as we added $12 million of MSRs associated with $1.2 billion of residential loans and recognized market valuation adjustments of negative $6 million. At June 30, 2014 the value of loans associated with our investment in MSRs was $7.1 billion and the GAAP carrying value of our MSRs was equal to 1.01% of the principal balance of the associated residential loans. |
| | |
| 32 | | THE REDWOOD REVIEW | 2ND QUARTER 2014 |
|
|
BUSINESS SEGMENTS |
Commercial Mortgage Banking and Investments
Summary
The Commercial Mortgage Banking and Investments segment consists primarily of a mortgage loan conduit that originates senior commercial loans for subsequent sale to third-party CMBS sponsors or other investors. This segment also provides other forms of commercial real estate financing directly to borrowers that may include mezzanine loans, subordinate mortgage loans, and other forms of financing. We typically hold the mezzanine and other subordinate loans we originate in our commercial investment portfolio.
This segment’s main sources of revenue are mortgage banking income, which includes valuation increases (or gains) on the sale of senior commercial loans and associated hedges, and net interest income from mezzanine or subordinate loans held in our investment portfolio. Funding expenses, direct operating expenses, and tax expenses associated with these activities are also included.
| u | | Income from commercial mortgage banking activities was $5 million in the second quarter of 2014, as compared to $1 million in the first quarter of 2014. |
| u | | During the second quarter of 2014, we originated and funded 15 senior commercial loans for $149 million, and sold 13 senior loans totaling $181 million. This compares to the first quarter of 2014 when we originated and funded 6 senior loans for $119 million, and sold 6 senior loans totaling $65 million. |
| u | | At June 30, 2014, we had seven senior commercial loans held for sale with a carrying value of $51 million. |
| u | | At June 30, 2014, we had $71 million of commercial loans at fair value classified as held-for-investment. Of these loans, $67 million of A-notes were sold to third-parties but did not meet the sale criteria under GAAP, and remain on our balance sheet. As a result, we also recorded secured borrowings of $67 million, which are also carried at fair value. Our investments in the B-notes related to these loan sales were $5 million at June 30, 2014. |
| u | | During the second quarter of 2014, we originated two commercial mezzanine loans for $6 million, compared to one mezzanine loan for $2 million in the first quarter of 2014. At June 30, 2014, our unsecuritized and securitized portfolio of commercial mezzanine loans held for investment were $92 million and $255 million, respectively. |
| u | | At June 30, 2014, commercial loans held for investment had an outstanding principal balance of $362 million (excluding A-notes), unamortized discount of $2 million, an allowance for loan losses of $8 million, and a carrying value of $351 million. |
| u | | On average, our commercial held-for-investment mezzanine loans have a maturity of more than five years, an unlevered yield in excess of 10% per annum before credit costs, a loan-to-value ratio of 73% at origination, and a debt service coverage ratio at origination of 1.31x based on underwritten cash flows at origination. |
| u | | At June 30, 2014, we had one loan with a carrying value of $26 million on our watch list. The loan is current and we currently expect to receive all amounts due according to the contractual terms of the loan. |
| | | | |
| THE REDWOOD REVIEW | 2ND QUARTER 2014 | | | 33 | |
| | |
| |
|
| | BUSINESS SEGMENTS |
Commercial Mortgage Banking and Investments (continued)
The following table and charts provide information on our commercial mezzanine loan portfolio as of June 30, 2014.
| | | | | | | | |
Commercial Mezzanine Loans at Redwood |
June 30, 2014 |
| Property Type | | Number of Loans | | Original
Weighted Average
DSCR(1) | | Original
Weighted Average
LTV(2) | | Average
Loan Size
($ in millions) |
Multifamily | | 25 | | 1.25x | | 79% | | $10 |
Hospitality | | 9 | | 1.41x | | 62% | | 5 |
Office | | 8 | | 1.36x | | 72% | | 9 |
Retail | | 6 | | 1.16x | | 76% | | 6 |
Self Storage | | 3 | | 1.39x | | 75% | | 2 |
Industrial | | 2 | | 1.37x | | 70% | | 9 |
Total portfolio | | 53 | | 1.31x | | 73% | | $7 |
| | (1) | The debt service coverage ratio (DSCR) is defined as the property’s annual net operating income divided by the annual principal and interest payments. The weighted average DSCRs in this table are based on the ratios at the time the loans were originated and are not based on subsequent time periods during which there may have been increases or decreases in each property’s operating income. | |
| | (2) | The loan-to-value (LTV) calculation is defined as the sum of the senior and all subordinate loan amounts divided by the value of the property at the time the loan was originated. | |
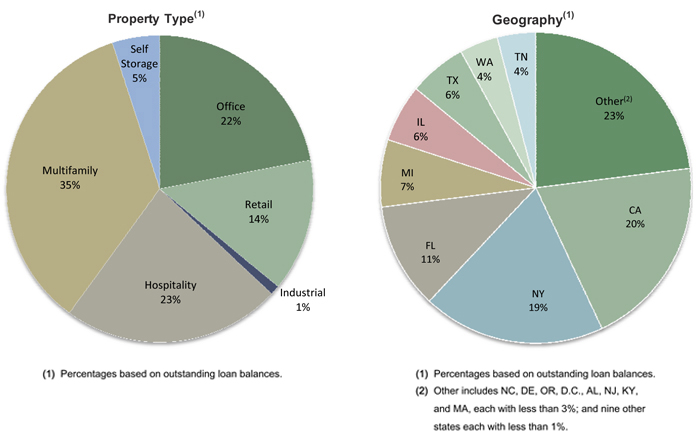
| | |
| 34 | | THE REDWOOD REVIEW | 2ND QUARTER 2014 |
This Page Intentionally Left Blank
This Page Intentionally Left Blank

| | |
| |
|
| | REDWOOD’S BUSINESS STRATEGY |
Redwood’s Business Strategy
We made a strategic decision in late 2009 to invest in and build out our residential and commercial loan platforms. We did this in order to create our own steady sources of attractive investments and fee-generating opportunities, as we assumed that large bank originators with excess liquidity would be more likely to retain their originations for their own investment portfolios than sell them into the secondary market to aggregators such as Redwood.
There is commonality between our residential and commercial business activities. In both cases, we have established ourselves as an intermediary between borrowers and senior investors in the capital markets. We believe that this strategy should work well with the structure of our balance sheet and the talents and extensive relationships of the professionals who make up our residential and commercial teams.
On the residential side, our focus since mid-2010 has been to acquire prime, jumbo mortgages and the related mortgage servicing rights and to sell the loans through private-label securitization and whole-loan bulk-sales. While the initial market opportunity appeared small, our confidence was driven by three primary business assumptions: 1) the government would eventually reduce its outsized role in the mortgage market; 2) new bank regulation, Basel III, and legacy portfolio issues would open up an opportunity for independent mortgage companies; and 3) traditional triple-A institutional investors would return to the market to provide attractive financing for prime residential loans through their investment in private-label securities (“PLS”). In order to leverage the platform, in the fourth quarter of 2013, we entered the conforming segment of the market (defined as loans eligible for sale to Fannie Mae and Freddie Mac) and we began to acquire conforming loans and the related servicing rights from many of our jumbo loan sellers and new conforming-only loan sellers. Conforming loans we acquire are expected to be sold to Fannie Mae or Freddie Mac.
On the commercial side, our focus has been on commercial loan refinancing demand expected to result from the pre-crisis era of high-leverage lending. An immediate need was identified for mezzanine capital that could bridge the gap between commercial borrowers’ funding needs and what traditional senior lenders would provide in refinancing transactions. We also assumed that we would eventually position our platform to become an originator of senior commercial loans, offering value through greater flexibility and certainty of execution for borrowers. We have made progress in both areas, as we have originated more than $350 million of mezzanine loans since late 2010, and have originated more than $1.0 billion of senior commercial loans since mid-2012.
Redwood’s Business Model
Our business model has evolved substantially since the financial crisis began in 2007. This evolution has, in part, been driven by our desire to build a franchise value-producing business model positioned to capitalize on the expected eventual reform of Fannie Mae and Freddie Mac and to be competitive in the post-crisis era of greater regulatory and capital requirements for all mortgage market participants, particularly for the more heavily regulated banks.
Today, Redwood is a specialty finance company focused on investing in mortgage- and other real estate-related assets and engaging in residential and commercial mortgage banking activities. While we remain structured as a REIT for tax purposes, we compliment our tax-advantaged investments with mortgage-banking activities conducted through taxable REIT subsidiaries that pay taxes and, if desired, can generally retain earnings and reinvest the cash flows generated therein.
| | |
| 38 | | THE REDWOOD REVIEW | 2ND QUARTER 2014 |
| | |
| | |
GLOSSARY | |
A-NOTES
A-Notes are senior interests in commercial mortgage debt which are promissory notes secured by either a deed of trust or a mortgage. A-Notes are senior to any subordinate financing, such as B-Notes, and mezzanine financing. See B-Notes and Mezzanine Loan definitions.
ADJUSTABLE-RATE MORTGAGES (ARM)
Adjustable-rate mortgages (“ARMs”) are loans that have coupons that adjust at least once per year. We make a distinction between ARMs (loans with a rate adjustment at least annually) and hybrids (loans that have a fixed-rate period of 2-10 years and then become adjustable-rate).
AGENCY
Agency refers to government-sponsored enterprises (“GSEs”), including Federal National Mortgage Association (“Fannie Mae”), Federal Home Loan Mortgage Corporation (“Freddie Mac”), and Government National Mortgage Association (“Ginnie Mae”).
ALT-A SECURITIES and ALT-A LOANS
Alt-A securities are residential mortgage-backed securities backed by loans that have higher credit quality than subprime and lower credit quality than prime. Alt-A originally represented loans with alternative documentation, but the definition has shifted over time to include loans with additional risk characteristics and in some cases investor loans. In an Alt-A loan, the borrower’s income may not be verified, and in some cases, may not be disclosed on the loan application. Alt-A loans may also have expanded criteria that allow for higher debt-to-income ratios with higher accompanying loan-to-value ratios than would otherwise be permissible for prime loans.
AMORTIZED COST
Amortized cost is the initial acquisition cost of an available-for-sale (“AFS”) security, minus principal repayments or principal reductions through credit losses, plus or minus premium or discount amortization. At the point in time an AFS security is deemed other-than-temporarily impaired, the amortized cost is adjusted (by changing the amount of unamortized premium or discount) by the amount of other-than temporary impairment taken through the income statement.
ASSET-BACKED SECURITIES (ABS)
Asset-backed securities (“ABS”) are securities backed by financial assets that generate cash flows. Each ABS issued from a securitization entity has a unique priority with respect to receiving principal and interest cash flows and absorbing any credit losses from the assets owned by the entity.
AVAILABLE-FOR-SALE (AFS)
An accounting method for debt and equity securities in which the securities are reported at their fair value. Positive changes in the fair value are accounted for as increases to stockholders’ equity and do not flow through the income statement. Negative changes in fair value may be recognized through the income statement or balance sheet.
B-NOTES
B-Notes are subordinate interests in commercial mortgage debt which are either (i) evidenced by a subordinated promissory note secured by the same mortgage that also secures the senior debt relating to the same property or (ii) junior participation interests in mortgage debt that are subordinate to senior participation interests in the same mortgage debt. B-Notes typically provide the holder with certain rights to approve modifications to related lending agreements and to trigger foreclosure under the mortgage following an event of default. B-Notes also typically provide the holder certain limited rights to cure a borrower default under senior debt secured by the same mortgage in order to keep the senior debt current and avoid foreclosure.
| | | | |
| THE REDWOOD REVIEW | 2ND QUARTER 2014 | | | 39 | |
| | |
| |
|
| | GLOSSARY |
BOOK VALUE (GAAP)
Book value is the value of our common equity in accordance with GAAP.
COMMERCIAL MORTGAGE-BACKED SECURITIES (CMBS)
A type of mortgage-backed security that is secured by one or more loans on commercial properties.
CONFORMING LOAN
A conforming loan is a mortgage loan that conforms to the underwriting standards of Fannie Mae and Freddie Mac, including the maximum loan limit, which is currently $417,000 except in defined high-cost areas of the country, where the limit is higher. Changes to this maximum loan limit are announced annually by the Federal Housing Finance Agency (“FHFA”), which is the regulator and conservator of both Fannie Mae and Freddie Mac.
CONSTANT (or CONDITIONAL) PREPAYMENT RATE (CPR)
Constant (or conditional) prepayment rate (“CPR”) is an industry-standard measure of the speed at which mortgage loans prepay. It approximates the annual percentage rate at which a pool of loans is paying down due to unscheduled principal prepayments.
CREDIT SUPPORT
Credit support is the face amount of securities subordinate (or junior) to the applicable security that protects the security from credit losses and is generally expressed as a percentage of the securitization’s underlying pool balance.
DEBT
Debt is an obligation of Redwood. See Long-term debt and Short-term debt.
FALLOUT
The percentage of loans that an originator plans or commits to sell to a buyer that ultimately do not close and are not delivered to the buyer.
FASB
Financial Accounting Standards Board.
FHFA
The FHFA refers to the Federal Housing Finance Authority.
FHLB
The FHLB refers to the Federal Home Loan Bank. Chartered by Congress, there are twelve Federal Home Loan Banks throughout the United States that lending institutions use to finance housing and economic development in local communities.
FORWARD SALE COMMITMENT
A contract pertaining to the future sale of a loan at a specified price and within a specified time period. Mortgage bankers often use forward sale commitments to hedge interest rate risk between the date they agree to buy and the date in which the loan is sold, which is often between 30 and 60 days. This commitment qualifies as a derivative in accordance with GAAP. Any change in the value of this forward sale commitment is recorded as a market valuation adjustment in mortgage banking activities, net.
GAAP
Generally Accepted Accounting Principles in the United States.
GOVERNMENT SPONSORED ENTERPRISE (GSE)
A government sponsored enterprise is a financial services corporation created by the United States Congress to enhance the flow of credit to targeted sectors of the economy. Among the GSEs chartered by Congress are Fannie Mae, Freddie Mac, Ginnie Mae, and the Federal Home Loan Banks.
| | |
| 40 | | THE REDWOOD REVIEW | 2ND QUARTER 2014 |
| | |
| | |
GLOSSARY | |
INTEREST-ONLY SECURITIES (IOs)
Interest-only securities (“IOs”) are specialized securities created by securitization entities where the projected cash flows generated by the underlying assets exceed the cash flows projected to be paid to the securities that are issued with principal balances. Typically, IOs do not have a principal balance and they will not receive principal payments. Interest payments to IOs usually equal an interest rate formula multiplied by a “notional” principal balance. The notional principal balances for IOs are typically reduced over time as the actual principal balance of the underlying pool of assets pays down, thus reducing the cash flows to the IOs over time. Cash flows on IOs are typically reduced more quickly when asset prepayments increase.
INVESTMENT CAPACITY
The amount of capacity we estimate that we have to invest in new assets. Our estimate of our investment capacity takes into account, among other things, cash on hand, cash we estimate we could raise by prudently increasing short-term borrowings, and cash needed to cover short-term operations, working capital, and a liquidity cushion.
JUMBO LOAN
A jumbo loan is a mortgage loan that generally conforms to the underwriting standards of Fannie Mae and Freddie Mac except that the dollar amount of the loan exceeds the conforming loan limit set annually by the FHFA. See Conforming Loan Definition.
LEVERAGE RATIOS
Leverage ratios measure financial leverage and are used to assess a company’s ability to meet its financial obligations. Financial leverage ratios are often expressed as debt to equity and assets to equity. In the mortgage banking industry, financial leverage is most commonly calculated using debt to equity. At Redwood, the two financial leverage ratios used are consolidated GAAP debt to equity and recourse debt to equity. The former calculation includes the consolidated ABS issued from certain Sequoia securitization entities (generally those issued prior to 2012) even though those obligations are not financial obligations of Redwood but are obligations of each the consolidated securitization trusts and are payable only from the cash flow from the assets owned by each of those trusts. The latter calculation of recourse debt to equity excludes debt related to consolidated securitizations and only includes debt for which Redwood has an obligation to repay. Both ratios are calculated at the bottom of Table 3: Book Value and Financial Ratios in the Appendix section.
LOAN PURCHASE COMMITMENT
A commitment to purchase a residential mortgage loan from a mortgage loan originator at a specified price and within a specified time period. A “best efforts” loan purchase commitment becomes effective once the originator has closed the loan with the borrower. A “mandatory” loan purchase commitment becomes effective once the commitment is entered into among the buyer and the originator, regardless if the originator has closed the loan. Mortgage buyers such as Redwood often issue 30 to 60 day loan purchase commitments to loan originators so that they can in turn offer a similar commitments to their borrowers. To hedge interest rate risk during the commitment period, buyers will often enter in to a forward sale commitment or hedge the risk using derivatives. (See forward sale commitment definition.) A loan purchase commitment for a conforming loan qualifies as a derivative in accordance with GAAP. Any change in the value of a loan purchase commitment is recorded as a market valuation adjustment in mortgage banking activities, net. Our loan purchase commitment for a non-conforming loan does not qualify as a derivative in accordance with GAAP and is not recorded as an asset or liability.
| | | | |
| THE REDWOOD REVIEW | 2ND QUARTER 2014 | | | 41 | |
| | |
| |
|
| | GLOSSARY |
LONG-TERM DEBT
Long-term debt is debt that is an obligation of Redwood that is not payable within a year and includes convertible debt, junior subordinated notes and trust preferred securities. We generally treat long-term debt as part of our capital base when it is not payable in the near future.
MARK-TO-MARKET (MTM) ACCOUNTING
Mark-to-market (“MTM”) accounting uses estimated fair values of assets, liabilities, and hedges. Many assets on our consolidated balance sheet are carried at their fair value rather than amortized cost. Taxable income is generally not affected by market valuation adjustments.
MARKET VALUATION ADJUSTMENTS (MVAs)
Market valuation adjustments (“MVAs”) are changes in market values for certain assets and liabilities that are reported through our GAAP income statement. They include all changes in market values for assets and liabilities accounted for at fair value, such as trading securities and derivatives. They also include the credit portion of other-than-temporary impairments on securities available-for-sale, as well as impairments of loans held-for-sale and REO properties.
MEZZANINE LOAN
A mezzanine loan is a loan secured by the membership interests, partnership interests, and/or stock in a single purpose entity formed to own a commercial property, for example. If the mezzanine borrower fails to make its payments or otherwise defaults under the mezzanine loan documents, the mezzanine lender may pursue its remedies, including taking control of the single purpose entity that owns the property.
MEZZANINE SECURITIES
Mezzanine securities are a type of subordinate security and refer to the securities in a residential mortgage-backed securitization that are rated AA, A, and BBB. They rank junior to the AAA securities, and senior to the securities rated below BBB which typically include BB and B rated securities, and any non-rated securities.
MORTGAGE SERVICING RIGHT (MSR)
A mortgage servicing right (“MSR”) gives the holder the contractual right to service a mortgage loan. MSRs typically include the right to collect monthly mortgage principal and interest payments, as well as related tax and insurance payments, from borrowers, disburse funds to the mortgage debt holders and remit related insurance and tax payments, collect late payments, and process modifications and foreclosures. MSRs are created when mortgage loans are sold in a transaction in which the seller retains the right to service the loans. The holder of an MSR receives a monthly servicing fee (which generally ranges from 0.25% to 0.375% per annum of the outstanding principal balance of the related mortgage loan), which is deducted from the borrower’s monthly interest payments. For accounting purposes, MSRs are capitalized at the net present value of the servicing fee less the servicing cost. When Redwood holds MSRs relating to residential mortgage loans, it retains a sub-servicer to carry out actual servicing functions, as Redwood does not directly service residential mortgage loans.
NON-PRIME SECURITIES
Non-prime securities are Alt-A, option ARM, and subprime securities. See definitions of Alt-A, option ARM, and subprime securities.
OPTION ARM LOAN
An option ARM loan is a residential mortgage loan that generally offers a borrower monthly payment options such as: 1) a minimum payment that results in negative amortization; 2) an interest-only payment; 3) a payment that would fully amortize the loan over an original 31-year amortization schedule; and, 4) a payment that would fully amortize the loan over a 15-year amortization schedule. To the extent the
| | |
| 42 | | THE REDWOOD REVIEW | 2ND QUARTER 2014 |
| | |
| | |
GLOSSARY | |
borrower has chosen an option that is not fully amortizing the loan (or negatively amortizing the loan), after a period — usually five years or once the negatively amortized loan balance reaches a certain level (generally 15% to 25% higher than the original balance) — the loan payments are recast. This recast provision resets the payment at a level that fully amortizes the loan over its remaining life and the new payment may be materially different than under the borrowers’ previous option.
PREFERRED EQUITY
A preferred equity investment is an investment in preferred equity of a special purpose entity that directly or indirectly owns a commercial property. An investor in preferred equity is typically entitled to a preferred return (relative to a holder of common equity of the same entity) and has the right, if the preferred return is not paid, to take control of the entity (and thereby control the underlying commercial property).
PRIME RESIDENTIAL REAL ESTATE LOANS
Prime loans are residential loans with higher quality credit characteristics, such as borrowers with higher FICO credit scores, lower loan-to-value ratios, lower debt-to-income ratios, greater levels of other assets, and more documentation.
PRIME SECURITIES
Prime securities are residential mortgage-backed securities backed by prime loans, generally with balances greater than conforming loan limits. Prime securities are typically backed by loans that have relatively high weighted average FICO scores (e.g., 700 or higher at origination), low weighted average LTVs (e.g., 75% or less at origination), limited concentrations of investor properties, and low percentages of loans with low FICO scores or high loan-to-value ratios.
PRINCIPAL-ONLY SECURITIES (POs)
Principal-only securities (“POs”) are specialized securities created by securitization entities where the holder is only entitled to receive regular cash flows that are derived from incoming principal repayments on an underlying mortgage loan pool. This security is created by splitting a mortgage-backed security into its interest and principal payments. The principal payments create a string of cash flows which are sold at a discount to investors. These investors will receive the principal portions of the monthly mortgage payments from the underlying pool of loans. The yield on a PO strip depends on the prepayment speed of the underlying loan. The faster the principal is repaid, the higher the yield an investor will receive.
PROFITABILITY RATIOS
Many financial institution analysts use asset-based profitability ratios such as interest rate spread and interest rate margin when analyzing financial institutions. These are asset-based measures. Since we consolidate the assets and liabilities of certain securitization entities for GAAP purposes, our total GAAP assets and liabilities may vary over time, and may not be comparable to assets typically used in profitability calculations for other financial institutions. As a result, we believe equity-based profitability ratios may be more appropriate than asset-based measures for analyzing Redwood’s operations and results. We provide various profitability ratios in Table 4 in the Financial Tables in this Review.
REAL ESTATE INVESTMENT TRUST (REIT)
A real estate investment trust (“REIT”) is an entity that makes a tax election to be taxed as a REIT, invests in real estate assets, and meets other REIT qualifications, including the distribution as dividends of at least 90% of its REIT taxable income. A REIT’s profits are not taxed at the corporate level to the extent that these profits are distributed as dividends to stockholders, providing an operating cost savings. On the other hand, the requirement to pay out as dividends most of the REIT’s taxable profits means it can be harder for a REIT to grow using only internally-generated funds (as opposed to raising new capital).
| | | | |
| THE REDWOOD REVIEW | 2ND QUARTER 2014 | | | 43 | |
| | |
| |
|
| | GLOSSARY |
REAL ESTATE OWNED (REO)
Real estate owned (“REO”) refers to real property owned by the lender or loan owner that has been acquired through foreclosure.
REIT SUBSIDIARY
A REIT subsidiary is a subsidiary of a REIT that is taxed as a REIT.
REIT TAXABLE INCOME
REIT taxable income is not a measure calculated in accordance with GAAP. REIT taxable income is pretax income calculated for tax purposes at Redwood including only its qualifying REIT subsidiaries (i.e., excluding its taxable subsidiaries, with certain adjustments). REIT taxable income is an important measure as it is the basis of our dividend distribution requirements. We must annually distribute at least 90% of REIT taxable income as dividends to shareholders. As a REIT, we are not subject to corporate income taxes on the REIT taxable income we distribute. We pay corporate income tax on the REIT taxable income we retain, if any (and we are permitted to retain up to 10% of total REIT taxable income). A reconciliation of REIT taxable income to GAAP income appears in Table 2 in the Financial Tables in this Review.
REMIC
A real estate mortgage investment conduit (“REMIC”) is a special purpose vehicle used to pool real estate mortgages and issue mortgage-backed securities. REMICs are typically exempt from tax at the entity level. REMICs may invest only in qualified mortgages and permitted investments, including single family or multifamily mortgages, commercial mortgages, second mortgages, mortgage participations, and federal agency pass-through securities.
RE-REMIC SECURITY
A re-REMIC is a re-securitization of asset-backed securities. The cash flows from and any credit losses absorbed by the underlying assets can be redirected to the resulting re-REMIC securities in a variety of ways.
RESECURITIZATION
A resecuritization is a securitization of two or more mortgage-backed securities into a new mortgage-backed security.
RESIDENTIAL MORTGAGE-BACKED SECURITIES (RMBS)
A type of mortgage-backed security that is backed by a pool of mortgages on residential properties.
RETURN ON EQUITY (ROE)
ROE is the amount of profit we generate each year per dollar of equity capital and equals GAAP income divided by GAAP equity.
SENIOR SECURITIES
Generally, senior securities have the least credit risk in a securitization transaction because they are generally the last securities to absorb credit losses. In addition, the senior securities have the highest claim on the principal and interest payments (after the fees to servicers and trustees are paid). To further reduce credit risk, most if not all, principal collected from the underlying asset pool is used to pay down the senior securities until certain performance tests are satisfied. If certain performance tests are satisfied, principal payments are shared between the senior securities and the subordinate securities, generally on a pro rata basis. At issuance, senior securities are generally triple A-rated.
| | |
| 44 | | THE REDWOOD REVIEW | 2ND QUARTER 2014 |
| | |
| | |
GLOSSARY | |
SEQUOIA
Sequoia is the brand name for securitizations of residential real estate loans Redwood sponsors. Sequoia entities are independent securitization entities that acquire residential mortgage loans and create and issue asset-backed securities (“ABS”) backed by these loans. Most of the loans that Sequoia entities acquire are prime-quality loans. Most of the senior ABS created by Sequoia are sold to third-party investors. Redwood usually acquires most of the subordinated ABS and may also acquire the interest-only securities (“IOs”).
SHORT-TERM DEBT
Short-term debt is debt that is an obligation of Redwood and payable within a year. We may obtain this debt from a variety of Wall Street firms, banks, and other institutions. We may issue these or other forms of short term debt in the future. We may use short-term debt to finance the accumulation of assets prior to sale to a securitization entity and to finance investments in loans and securities.
SUBORDINATE DEBT INVESTMENTS
Subordinate Debt Investments mean Mezzanine Loans, Preferred Equity, and B-Notes.
SUBORDINATE SECURITIES (JUNIOR SECURITIES or NON-SENIOR SECURITIES)
Subordinate securities absorb the initial credit losses from a securitization structure, thus protecting the senior securities. Subordinate securities have a lower priority to receive principal and interest payments than the senior securities. Subordinate securities receive little, if any, principal payments until certain performance tests are satisfied. If certain performance tests are satisfied, principal payments are shared between the senior securities and the subordinate securities, generally on a pro rata basis. Subordinate securities generally receive interest payments even if they do not receive principal payments. At issuance, subordinate securities are generally rated double-A or below.
SUBPRIME SECURITIES
Subprime securities are residential mortgage-backed securities backed by loans to borrowers who typically have lower credit scores and/or other credit deficiencies that prevent them from qualifying for prime or Alt-A mortgages and may have experienced credit problems in the past, such as late payments or bankruptcies. To compensate for the greater risks and higher costs to service the loans, subprime borrowers pay higher interest rates, points, and origination fees.
TAXABLE INCOME
Taxable income is not a measure calculated in accordance with GAAP. Taxable income is pre-tax income for Redwood and all its subsidiaries as calculated for tax purposes. Taxable income calculations differ significantly from GAAP income calculations. A reconciliation of taxable income to GAAP income appears in Table 2 in the Financial Tables in this Review.
TAXABLE SUBSIDIARY
A taxable subsidiary is a subsidiary of a REIT that is not taxed as a REIT and thus pays taxes on its income. A taxable subsidiary is not limited to investing in real estate and it can choose to retain all of its after-tax profits.
TO BE ANNOUNCED (TBA)
A term used to describe a forward Agency mortgage-backed securities trade. Pass-through securities issued by Freddie Mac, Fannie Mae and Ginnie Mae trade in the TBA market. The term TBA is derived from the fact that the actual mortgage-backed security that will be delivered to fulfill a TBA trade is not designated at the time the trade is made. The securities are “to be announced” 48 hours prior to the established trade settlement date.
| | | | |
| THE REDWOOD REVIEW | 2ND QUARTER 2014 | | | 45 | |
This Page Intentionally Left Blank

| | | | |
| | |
 | | Table 1: GAAP Earnings ($ in thousands, except per share data) | | 48 |
| | | | | | | | | | | | | | | | | | | | | | | | | | | | | | | | | | | | | | | | | | | | |
| | | 2014 Q2 | | | 2014 Q1 | | | 2013 Q4 | | | 2013 Q3 | | | 2013 Q2 | | | 2013 Q1 | | | 2012 Q4 | | | 2012 Q3 | | | 2012 Q2 | | | Six Months
2014 | | | Six Months
2013 | |
Interest income | | $ | 48,347 | | | $ | 45,145 | | | $ | 48,331 | | | $ | 50,139 | | | $ | 51,195 | | | $ | 47,360 | | | $ | 48,025 | | | $ | 54,001 | | | $ | 52,629 | | | $ | 93,492 | | | $ | 98,555 | |
Discount amortization on securities, net | | | 10,586 | | | | 11,298 | | | | 10,311 | | | | 8,785 | | | | 8,153 | | | | 7,672 | | | | 7,103 | | | | 7,317 | | | | 8,318 | | | | 21,884 | | | | 15,825 | |
Premium amortization expense on loans | | | (940 | ) | | | (967 | ) | | | (1,150 | ) | | | (1,504 | ) | | | (1,629 | ) | | | (1,508 | ) | | | (1,731 | ) | | | (1,595 | ) | | | (1,424 | ) | | | (1,907 | ) | | | (3,137 | ) |
Total interest income | | | 57,993 | | | | 55,476 | | | | 57,492 | | | | 57,420 | | | | 57,719 | | | | 53,524 | | | | 53,397 | | | | 59,723 | | | | 59,523 | | | | 113,469 | | | | 111,243 | |
| | | | | | | | | | | | |
Interest expense on short-term debt | | | (5,142 | ) | | | (3,827 | ) | | | (3,715 | ) | | | (5,227 | ) | | | (4,686 | ) | | | (3,808 | ) | | | (2,526 | ) | | | (2,737 | ) | | | (2,299 | ) | | | (8,969 | ) | | | (8,494 | ) |
| | | | | | | | | | | | |
Interest expense on ABS | | | (7,024 | ) | | | (7,288 | ) | | | (7,697 | ) | | | (8,182 | ) | | | (8,724 | ) | | | (9,346 | ) | | | (15,051 | ) | | | (21,370 | ) | | | (22,337 | ) | | | (14,312 | ) | | | (18,070 | ) |
ABS issuance expense amortization | | | (630 | ) | | | (633 | ) | | | (737 | ) | | | (811 | ) | | | (882 | ) | | | (985 | ) | | | (915 | ) | | | (552 | ) | | | (602 | ) | | | (1,263 | ) | | | (1,867 | ) |
ABS interest rate agreement expense | | | (39 | ) | | | (61 | ) | | | (62 | ) | | | (62 | ) | | | (68 | ) | | | (87 | ) | | | (11,561 | ) | | | (1,127 | ) | | | (1,136 | ) | | | (100 | ) | | | (155 | ) |
ABS issuance premium amortization expense | | | (490 | ) | | | (459 | ) | | | (407 | ) | | | (548 | ) | | | (576 | ) | | | (542 | ) | | | (412 | ) | | | (113 | ) | | | (115 | ) | | | (949 | ) | | | (1,118 | ) |
Total ABS expense consolidated from trusts(1) | | | (8,183 | ) | | | (8,441 | ) | | | (8,903 | ) | | | (9,603 | ) | | | (10,250 | ) | | | (10,960 | ) | | | (27,939 | ) | | | (23,162 | ) | | | (24,190 | ) | | | (16,624 | ) | | | (21,210 | ) |
| | | | | | | | | | | | |
Interest expense on long-term debt | | | (7,826 | ) | | | (6,792 | ) | | | (6,910 | ) | | | (6,894 | ) | | | (6,480 | ) | | | (3,534 | ) | | | (2,451 | ) | | | (2,377 | ) | | | (2,379 | ) | | | (14,618 | ) | | | (10,014 | ) |
Total interest expense | | | (21,151 | ) | | | (19,060 | ) | | | (19,528 | ) | | | (21,724 | ) | | | (21,416 | ) | | | (18,302 | ) | | | (32,916 | ) | | | (28,276 | ) | | | (28,868 | ) | | | (40,211 | ) | | | (39,718 | ) |
| | | | | | | | | | | | |
Net interest income | | | 36,842 | | | | 36,416 | | | | 37,964 | | | | 35,696 | | | | 36,303 | | | | 35,222 | | | | 20,481 | | | | 31,447 | | | | 30,655 | | | | 73,258 | | | | 71,525 | |
(Provision for) reversal of provision for loan losses | | | 315 | | | | (1,282 | ) | | | (4,243 | ) | | | (1,728 | ) | | | 3,272 | | | | (2,039 | ) | | | (3,394 | ) | | | (1,319 | ) | | | 1,340 | | | | (967 | ) | | | 1,233 | |
Net interest income after provision | | | 37,157 | | | | 35,134 | | | | 33,721 | | | | 33,968 | | | | 39,575 | | | | 33,183 | | | | 17,087 | | | | 30,128 | | | | 31,995 | | | | 72,291 | | | | 72,758 | |
| | | | | | | | | | | | |
Noninterest income | | | | | | | | | | | | | | | | | | | | | | | | | | | | | | | | | | | | | | | | | | | | |
| | | | | | | | | | | | |
Mortgage banking activities, net | | | 6,310 | | | | (231 | ) | | | 16,932 | | | | (8,698 | ) | | | 48,723 | | | | 45,537 | | | | 21,765 | | | | 12,775 | | | | (3,173 | ) | | | 6,079 | | | | 94,260 | |
MSR income (loss), net | | | (1,777 | ) | | | 606 | | | | 5,628 | | | | 3,113 | | | | 10,547 | | | | 1,021 | | | | (479 | ) | | | (472 | ) | | | (434 | ) | | | (1,171 | ) | | | 11,568 | |
Other market valuation adjustments, net | | | (4,121 | ) | | | (6,139 | ) | | | 390 | | | | 462 | | | | (6,258 | ) | | | (303 | ) | | | 1,941 | | | | 957 | | | | (86 | ) | | | (10,260 | ) | | | (6,561 | ) |
Realized gains on sales, net(2) | | | 1,063 | | | | 105 | | | | 1,935 | | | | 10,469 | | | | 223 | | | | 12,267 | | | | 20,336 | | | | 13,940 | | | | 6,995 | | | | 1,168 | | | | 12,490 | |
Realized gains on calls, net | | | - | | | | 987 | | | | 33 | | | | - | | | | 333 | | | | - | | | | 29 | | | | - | | | | - | | | | 987 | | | | 333 | |
Realized gains, net | | | 1,063 | | | | 1,092 | | | | 1,968 | | | | 10,469 | | | | 556 | | | | 12,267 | | | | 20,365 | | | | 13,940 | | | | 6,995 | | | | 2,155 | | | | 12,823 | |
Total noninterest income (loss), net | | | 1,475 | | | | (4,672 | ) | | | 24,918 | | | | 5,346 | | | | 53,568 | | | | 58,522 | | | | 43,592 | | | | 27,200 | | | | 3,302 | | | | (3,197 | ) | | | 112,090 | |
| | | | | | | | | | | | |
Fixed compensation expense | | | (6,872 | ) | | | (6,742 | ) | | | (5,750 | ) | | | (5,808 | ) | | | (6,080 | ) | | | (5,636 | ) | | | (4,275 | ) | | | (4,412 | ) | | | (4,373 | ) | | | (13,614 | ) | | | (11,716 | ) |
Variable compensation expense | | | (3,021 | ) | | | (2,751 | ) | | | (3,908 | ) | | | (5,636 | ) | | | (3,960 | ) | | | (4,836 | ) | | | (5,475 | ) | | | (5,602 | ) | | | (3,037 | ) | | | (5,772 | ) | | | (8,796 | ) |
Equity compensation expense | | | (2,824 | ) | | | (2,360 | ) | | | (2,196 | ) | | | (1,997 | ) | | | (3,396 | ) | | | (2,487 | ) | | | (2,499 | ) | | | (2,151 | ) | | | (2,958 | ) | | | (5,184 | ) | | | (5,883 | ) |
Severance expense | | | (222 | ) | | | - | | | | - | | | | (445 | ) | | | (3,366 | ) | | | (68 | ) | | | - | | | | - | | | | - | | | | (222 | ) | | | (3,434 | ) |
Other operating expense | | | (9,343 | ) | | | (8,119 | ) | | | (7,816 | ) | | | (8,434 | ) | | | (7,628 | ) | | | (7,159 | ) | | | (6,176 | ) | | | (4,946 | ) | | | (4,810 | ) | | | (17,462 | ) | | | (14,786 | ) |
Total operating expenses | | | (22,282 | ) | | | (19,972 | ) | | | (19,670 | ) | | | (22,320 | ) | | | (24,430 | ) | | | (20,186 | ) | | | (18,425 | ) | | | (17,111 | ) | | | (15,178 | ) | | | (42,254 | ) | | | (44,616 | ) |
| | | | | | | | | | | | |
Other expense | | | - | | | | - | | | | (12,000 | ) | | | - | | | | - | | | | - | | | | - | | | | - | | | | - | | | | - | | | | - | |
| | | | | | | | | | | | |
Benefit from (provision for) income taxes | | | (333 | ) | | | 1,843 | | | | (1,835 | ) | | | 4,935 | | | | (3,140 | ) | | | (10,909 | ) | | | (176 | ) | | | (516 | ) | | | (592 | ) | | | 1,510 | | | | (14,049 | ) |
Net income | | $ | 16,017 | | | $ | 12,333 | | | $ | 25,134 | | | $ | 21,929 | | | $ | 65,573 | | | $ | 60,610 | | | $ | 42,078 | | | $ | 39,701 | | | $ | 19,527 | | | $ | 28,350 | | | $
| 126,183
|
|
| | | | | | | | | | | | |
Diluted average shares | | | 85,033 | | | | 84,941 | | | | 84,395 | | | | 84,422 | | | | 96,172 | | | | 87,345 | | | | 82,498 | | | | 80,764 | | | | 78,815 | | | | 84,994 | | | | 91,647 | |
Net income per share | | $ | 0.18 | | | $ | 0.14 | | | $ | 0.29 | | | $ | 0.25 | | | $ | 0.71 | | | $ | 0.69 | | | $ | 0.50 | | | $ | 0.48 | | | $ | 0.24 | | | $ | 0.32 | | | $ | 1.40 | |
(1) Interest expense on ABS issued for the fourth quarter of 2012 includes accelerated recognition of $11 million of deferred hedging costs relating to Acacia entities upon deconsolidation of these entities.
(2) Realized gains on sales, net includes $15 million of gains related to the deconsolidation of certain Sequoia and Acacia entities during the fourth quarter of 2012.
| | | | |
| | |
THE REDWOOD REVIEW 2ND QUARTER 2014 | | Table 1: GAAP Earnings | | |
| | | | |
| | |
| | | Table 2: Taxable and GAAP Income1 Differences and Dividends ($ in thousands, except per share data) | | |
| | | | | | | | | | | | | | | | | | | | | | | | | | | | | | | | | | | | |
| | | Estimated Six Months 2014(2) | | | Estimated Twelve Months 2013(2) | | | Actual Twelve Months 2012(2) | |
| | | Taxable
Income | | | GAAP
Income | | | Differences | | | Taxable
Income | | | GAAP
Income | | | Differences | | | Taxable
Income | | | GAAP
Income | | | Differences | |
Taxable and GAAP Income Differences | | | | | | | | | | | | | | | | | | | | | | | | | | | | | | | | | | | | |
Interest income | | $ | 95,295 | | | $ | 113,469 | | | $ | (18,174 | ) | | $ | 208,627 | | | $ | 226,156 | | | $ | (17,529 | ) | | $ | 160,737 | | | $ | 231,384 | | | $ | (70,647 | ) |
Interest expense | | | (38,412 | ) | | | (40,211 | ) | | | 1,799 | | | | (55,470 | ) | | | (80,971 | ) | | | 25,501 | | | | (26,187 | ) | | | (120,705 | ) | | | 94,518 | |
Net interest income | | | 56,883 | | | | 73,258 | | | | (16,375 | ) | | | 153,157 | | | | 145,185 | | | | 7,972 | | | | 134,550 | | | | 110,679 | | | | 23,871 | |
Provision for loan losses | | | - | | | | (967 | ) | | | 967 | | | | - | | | | (4,737 | ) | | | 4,737 | | | | - | | | | (3,648 | ) | | | 3,648 | |
Realized credit losses | | | (4,103 | ) | | | - | | | | (4,103 | ) | | | (13,068 | ) | | | - | | | | (13,068 | ) | | | (25,609 | ) | | | - | | | | (25,609 | ) |
Other market valuation adjustments, net | | | - | | | | (10,260 | ) | | | 10,260 | | | | - | | | | (5,709 | ) | | | 5,709 | | | | - | | | | 1,539 | | | | (1,539 | ) |
Mortgage banking activities, net | | | 8,166 | | | | 6,079 | | | | 2,087 | | | | 17,708 | | | | 100,676 | | | | (82,968 | ) | | | (401 | ) | | | 36,319 | | | | (36,720 | ) |
MSR income, net | | | 6,874 | | | | (1,171 | ) | | | 8,045 | | | | 8,218 | | | | 20,309 | | | | (12,091 | ) | | | 623 | | | | (1,391 | ) | | | 2,014 | |
Operating expenses | | | (41,836 | ) | | | (42,254 | ) | | | 418 | | | | (72,406 | ) | | | (84,789 | ) | | | 12,383 | | | | (56,156 | ) | | | (65,359 | ) | | | 9,203 | |
Other expense | | | - | | | | - | | | | - | | | | - | | | | (12,000 | ) | | | 12,000 | | | | - | | | | - | | | | - | |
Realized gains, net | | | - | | | | 2,155 | | | | (2,155 | ) | | | - | | | | 25,259 | | | | (25,259 | ) | | | - | | | | 54,921 | | | | (54,921 | ) |
(Provision for) benefit from income taxes | | | (65 | ) | | | 1,510 | | | | (1,575 | ) | | | (291 | ) | | | (10,948 | ) | | | 10,657 | | | | (93 | ) | | | (1,291 | ) | | | 1,198 | |
Income | | $ | 25,919 | | | $ | 28,350 | | | $ | (2,431 | ) | | $ | 93,318 | | | $ | 173,246 | | | $ | (79,928 | ) | | $ | 52,914 | | | $ | 131,769 | | | $ | (78,855 | ) |
| | | | | | | | | | |
REIT taxable income | | $ | 29,665 | | | | | | | | | | | $ | 76,169 | | | | | | | | | | | $ | 60,541 | | | | | | | | | |
Taxable (loss) income at taxable subsidiaries | | | (3,746 | ) | | | | | | | | | | | 17,149 | | | | | | | | | | | | (7,627 | ) | | | | | | | | |
Taxable income | | $ | 25,919 | | | | | | | | | | | $ | 93,318 | | | | | | | | | | | $ | 52,914 | | | | | | | | | |
| | | | | | | | | | |
Shares used for taxable EPS calculation | | | 83,080 | | | | | | | | | | | | 82,505 | | | | | | | | | | | | 81,716 | | | | | | | | | |
REIT taxable income per share(3) | | $ | 0.36 | | | | | | | | | | | $ | 0.93 | | | | | | | | | | | $ | 0.75 | | | | | | | | | |
Taxable income (loss) per share at taxable subsidiaries | | $ | (0.05 | ) | | | | | | | | | | $ | 0.21 | | | | | | | | | | | $ | (0.09 | ) | | | | | | | | |
Taxable income per share(3) | | $ | 0.31 | | | | | | | | | | | $ | 1.14 | | | | | | | | | | | $ | 0.66 | | | | | | | | | |
| | | | | | | | | | |
Dividends | | | | | | | | | | | | | | | | | | | | | | | | | | | | | | | | | | | | |
Dividends declared | | $ | 46,342 | | | | | | | | | | | $ | 92,005 | | | | | | | | | | | $ | 80,134 | | | | | | | | | |
Dividends per share(4) | | $ | 0.56 | | | | | | | | | | | $ | 1.12 | | | | | | | | | | | $ | 1.00 | | | | | | | | | |
(1) Taxable income for 2014 and 2013 are estimates until we file our tax returns for those years.
(2) Reconciliation of GAAP income to taxable income (loss) for prior quarters is provided in the respective Redwood Reviews for those quarters.
(3) REIT taxable income per share and taxable income (loss) per share are based on the number of shares outstanding at the end of each quarter. The annual REIT taxable income per share and taxable income (loss) per share are the sum of the four quarterly per share estimates.
(4) Dividends in 2013 are expected to be characterized as 89% ordinary income, or $82 million, and 11% return of capital, or $10 million. Dividends in 2012 were characterized as 77% ordinary income, or $62 million, and 23% return of capital, or $18 million. The portion of Redwood’s dividends characterized as a return of capital is not taxable to a shareholder and reduces a shareholder’s basis for shares held at each quarterly distribution date, but not to below $0.
| | | | |
| | |
THE REDWOOD REVIEW 2ND QUARTER 2014 | | Table 2: Taxable and GAAP Income Differences and Dividends | | 49 |
| | | | |
| | |
| | | Table 3: Book Value and Financial Ratios ($ in millions, except per share data) | | 50 |
| | | | | | | | | | | | | | | | | | | | | | | | | | | | | | | | | | | | |
| | | 2014 Q2 | | | 2014 Q1 | | | 2013 Q4 | | | 2013 Q3 | | | 2013 Q2 | | | 2013 Q1 | | | 2012 Q4 | | | 2012 Q3 | | | 2012 Q2 | |
| | | | | | | | | | |
Short-term debt | | $ | 1,719 | | | $ | 1,288 | | | $ | 863 | | | $ | 838 | | | $ | 1,446 | | | $ | 721 | | | $ | 552 | | | $ | 522 | | | $ | 455 | |
Long-term debt | | | 480 | | | | 479 | | | | 476 | | | | 472 | | | | 444 | | | | 444 | | | | 140 | | | | 140 | | | | 140 | |
Total debt at Redwood(1) | | $ | 2,199 | | | $ | 1,767 | | | $ | 1,339 | | | $ | 1,310 | | | $ | 1,890 | | | $ | 1,165 | | | $ | 692 | | | $ | 662 | | | $ | 595 | |
| | | | | | | | | | |
Long-term debt - Commercial secured borrowing | | | 67 | | | | 35 | | | | - | | | | - | | | | - | | | | - | | | | - | | | | - | | | | - | |
| | | | | | | | | | |
ABS issued at consolidated entities | | | | | | | | | | | | | | | | | | | | | | | | | | | | | | | | | | | | |
Residential Resecuritization ABS issued | | | 70 | | | | 82 | | | | 95 | | | | 112 | | | | 134 | | | | 149 | | | | 165 | | | | 179 | | | | 193 | |
Commercial Securitization ABS issued | | | 145 | | | | 148 | | | | 154 | | | | 159 | | | | 160 | | | | 160 | | | | 172 | | | | - | | | | - | |
Legacy Sequoia entities ABS issued | | | 1,554 | | | | 1,624 | | | | 1,694 | | | | 1,791 | | | | 1,921 | | | | 2,056 | | | | 2,193 | | | | 2,995 | | | | 3,126 | |
Legacy Acacia entities ABS issued | | | - | | | | - | | | | - | | | | - | | | | - | | | | - | | | | - | | | | 255 | | | | 244 | |
Total ABS issued | | | 1,769 | | | | 1,854 | | | | 1,943 | | | | 2,062 | | | | 2,214 | | | | 2,365 | | | | 2,530 | | | | 3,429 | | | | 3,564 | |
Consolidated GAAP Debt | | $ | 4,035 | | | $ | 3,656 | | | $ | 3,282 | | | $ | 3,372 | | | $ | 4,104 | | | $ | 3,529 | | | $ | 3,222 | | | $ | 4,091 | | | $ | 4,159 | |
| | | | | | | | | | |
Stockholders’ equity | | $ | 1,249 | | | $ | 1,251 | | | $ | 1,245 | | | $ | 1,207 | | | $ | 1,209 | | | $ | 1,188 | | | $ | 1,140 | | | $ | 1,050 | | | $ | 951 | |
| | | | | | | | | | |
Debt at Redwood to stockholders’ equity | | | 1.8x | | | | 1.4x | | | | 1.1x | | | | 1.1x | | | | 1.6x | | | | 1.0x | | | | 0.6x | | | | 0.6x | | | | 0.6x | |
| | | | | | | | | | |
Consolidated GAAP debt to stockholders’ equity | | | 3.2x | | | | 2.9x | | | | 2.6x | | | | 2.8x | | | | 3.4x | | | | 3.0x | | | | 2.8x | | | | 3.9x | | | | 4.4x | |
| | | | | | | | | | |
Shares outstanding at period end (in thousands) | | | 83,080 | | | | 82,620 | | | | 82,505 | | | | 82,389 | | | | 82,332 | | | | 81,706 | | | | 81,716 | | | | 81,526 | | | | 79,263 | |
| | | | | | | | | | |
Book value per share | | $ | 15.03 | | | $ | 15.14 | | | $ | 15.10 | | | $ | 14.65 | | | $ | 14.69 | | | $ | 14.54 | | | $ | 13.95 | | | $ | 12.88 | | | $ | 12.00 | |
(1) Excludes obligations of consolidated securitization entities, including legacy Sequoia securitizations completed prior to 2012, the residential resecuritization completed in 2011, and the commercial securitization completed in 2012. Also excludes commercial secured borrowings associated with commercial A-note loans sold that were treated as secured borrowings under GAAP.
| | | | |
| | |
THE REDWOOD REVIEW 2ND QUARTER 2014 | | Table 3: Book Value and Financial Ratios | | |
| | | | |
| | |
| | | Table 4: Yields and Profitability Ratios1 ($ in thousands) | | |
| | | | | | | | | | | | | | | | | | | | | | | | | | | | | | | | | | | | | | | | | | | | |
| | | 2014 Q2 | | | 2014 Q1 | | | 2013 Q4 | | | 2013 Q3 | | | 2013 Q2 | | | 2013 Q1 | | | 2012 Q4 | | | 2012 Q3 | | | 2012 Q2 | | | Six Months 2014 | | | Six Months 2013 | |
| | | | | | | | | | | | |
Interest income | | $ | 57,993 | | | $ | 55,476 | | | $ | 57,492 | | | $ | 57,420 | | | $ | 57,719 | | | $ | 53,524 | | | $ | 53,397 | | | $ | 59,723 | | | $ | 59,523 | | | $ | 113,469 | | | $ | 111,243 | |
Average consolidated earning assets | | $ | 4,883,555 | | | $ | 4,558,020 | | | $ | 4,482,980 | | | $ | 4,808,815 | | | $ | 4,858,695 | | | $ | 4,569,121 | | | $ | 4,856,538 | | | $ | 5,178,913 | | | $ | 5,146,111 | | | $ | 4,721,687 | | | $ | 4,693,842 | |
Asset yield | | | 4.75% | | | | 4.87% | | | | 5.13% | | | | 4.78% | | | | 4.75% | | | | 4.69% | | | | 4.40% | | | | 4.61% | | | | 4.63% | | | | 4.81% | | | | 4.74% | |
| | | | | | | | | | | | |
Interest expense | | $ | (21,151 | ) | | $ | (19,060 | ) | | $ | (19,528 | ) | | $ | (21,724 | ) | | $ | (21,416 | ) | | $ | (18,302 | ) | | $ | (32,916 | ) | | $ | (28,276 | ) | | $ | (28,868 | ) | | $ | (40,211 | ) | | $ | (39,718 | ) |
Average consolidated interest-bearing liabilities | | $ | 3,654,609 | | | $ | 3,361,509 | | | $ | 3,333,438 | | | $ | 3,710,613 | | | $ | 3,747,078 | | | $ | 3,494,668 | | | $ | 3,727,576 | | | $ | 4,166,828 | | | $ | 4,207,316 | | | $ | 3,508,869 | | | $ | 3,621,570 | |
Cost of funds | | | 2.31% | | | | 2.27% | | | | 2.34% | | | | 2.34% | | | | 2.29% | | | | 2.09% | | | | 3.53% | | | | 2.71% | | | | 2.74% | | | | 2.29% | | | | 2.19% | |
| | | | | | | | | | | | |
Asset yield | | | 4.75% | | | | 4.87% | | | | 5.13% | | | | 4.78% | | | | 4.75% | | | | 4.69% | | | | 4.40% | | | | 4.61% | | | | 4.63% | | | | 4.81% | | | | 4.74% | |
Cost of funds | | | (2.31% | ) | | | (2.27% | ) | | | (2.34% | ) | | | (2.34% | ) | | | (2.29% | ) | | | (2.09% | ) | | | (3.53% | ) | | | (2.71% | ) | | | (2.74% | ) | | | (2.29% | ) | | | (2.19% | ) |
Interest rate spread | | | 2.44% | | | | 2.60% | | | | 2.79% | | | | 2.43% | | | | 2.47% | | | | 2.59% | | | | 0.87% | | | | 1.90% | | | | 1.88% | | | | 2.51% | | | | 2.55% | |
| | | | | | | | | | | | |
Net interest income | | $ | 36,842 | | | $ | 36,416 | | | $ | 37,964 | | | $ | 35,696 | | | $ | 36,303 | | | $ | 35,222 | | | $ | 20,481 | | | $ | 31,447 | | | $ | 30,655 | | | $ | 73,258 | | | $ | 71,525 | |
Average consolidated earning assets | | $ | 4,883,555 | | | $ | 4,558,020 | | | $ | 4,482,980 | | | $ | 4,808,815 | | | $ | 4,858,695 | | | $ | 4,569,121 | | | $ | 4,856,538 | | | $ | 5,178,913 | | | $ | 5,146,111 | | | $ | 4,721,687 | | | $ | 4,693,842 | |
Net interest margin | | | 3.02% | | | | 3.20% | | | | 3.39% | | | | 2.97% | | | | 2.99% | | | | 3.08% | | | | 1.69% | | | | 2.43% | | | | 2.38% | | | | 3.10% | | | | 3.05% | |
| | | | | | | | | | | | |
Operating expenses | | $ | (22,282 | ) | | $ | (19,972 | ) | | $ | (19,670 | ) | | $ | (22,320 | ) | | $ | (24,430 | ) | | $ | (20,186 | ) | | $ | (18,425 | ) | | $ | (17,111 | ) | | $ | (15,178 | ) | | $ | (42,254 | ) | | $ | (44,616 | ) |
| | | | | | | | | | | | |
Average total assets | | $ | 5,140,932 | | | $ | 4,791,512 | | | $ | 4,681,988 | | | $ | 5,010,779 | | | $ | 5,103,812 | | | $ | 4,823,321 | | | $ | 5,090,253 | | | $ | 5,371,679 | | | $ | 5,307,961 | | | $ | 4,967,187 | | | $ | 4,964,342 | |
Average total equity | | $ | 1,245,346 | | | $ | 1,243,006 | | | $ | 1,217,273 | | | $ | 1,217,418 | | | $ | 1,204,807 | | | $ | 1,161,546 | | | $ | 1,088,565 | | | $ | 987,692 | | | $ | 945,805 | | | $ | 1,244,182 | | | $ | 1,183,297 | |
| | | | | | | | | | | | |
Operating expenses / net interest income | | | 60.48% | | | | 54.84% | | | | 51.81% | | | | 62.53% | | | | 67.29% | | | | 57.31% | | | | 89.96% | | | | 54.41% | | | | 49.51% | | | | 57.68% | | | | 62.38% | |
Operating expenses / average total assets | | | 1.73% | | | | 1.67% | | | | 1.68% | | | | 1.78% | | | | 1.91% | | | | 1.67% | | | | 1.45% | | | | 1.27% | | | | 1.14% | | | | 1.70% | | | | 1.80% | |
Operating expenses / average total equity | | | 7.16% | | | | 6.43% | | | | 6.46% | | | | 7.33% | | | | 8.11% | | | | 6.95% | | | | 6.77% | | | | 6.93% | | | | 6.42% | | | | 6.79% | | | | 7.54% | |
| | | | | | | | | | | | |
GAAP net income | | $ | 16,017 | | | $ | 12,333 | | | $ | 25,134 | | | $ | 21,929 | | | $ | 65,573 | | | $ | 60,610 | | | $ | 42,078 | | | $ | 39,701 | | | $ | 19,527 | | | $ | 28,350 | | | $ | 126,183 | |
GAAP net income / average total assets | | | 1.25% | | | | 1.03% | | | | 2.15% | | | | 1.75% | | | | 5.14% | | | | 5.03% | | | | 3.31% | | | | 2.96% | | | | 1.47% | | | | 1.14% | | | | 5.08% | |
GAAP net income / average equity (GAAP ROE) | | | 5.14% | | | | 3.97% | | | | 8.26% | | | | 7.21% | | | | 21.77% | | | | 20.87% | | | | 15.46% | | | | 16.08% | | | | 8.26% | | | | 4.56% | | | | 21.33% | |
(1) All percentages in this table are shown on an annualized basis.
| | | | |
| | |
THE REDWOOD REVIEW 2ND QUARTER 2014 | | Table 4: Yields and Profitability Ratios | | 51 |
| | | | |
| | |
| | | Table 5: Average Balance Sheet ($ in thousands) | | 52 |
| | | | | | | | | | | | | | | | | | | | | | | | | | | | | | | | | | | | | | | | | | | | |
| | | 2014 Q2 | | | 2014 Q1 | | | 2013 Q4 | | | 2013 Q3 | | | 2013 Q2 | | | 2013 Q1 | | | 2012 Q4 | | | 2012 Q3 | | | 2012 Q2 | | | Six Months 2014 | | | Six Months 2013 | |
Real estate assets | | | | | | | | | | | | | | | | | | | | | | | | | | | | | | | | | | | | | | | | | | | | |
Residential loans, held-for-sale, at fair value | | $ | 739,934 | | | $ | 518,054 | | | $ | 554,467 | | | $ | 860,923 | | | $ | 1,060,347 | | | $ | 818,950 | | | $ | 418,722 | | | $ | 466,246 | | | $ | 363,882 | | | $ | 629,606 | | | $ | 940,315 | |
Residential loans, held-for-investment(1) | | | 1,642,410 | | | | 1,711,438 | | | | 1,793,535 | | | | 1,910,814 | | | | 2,043,820 | | | | 2,177,315 | | | | 2,751,130 | | | | 3,128,076 | | | | 3,258,137 | | | | 1,676,734 | | | | 2,110,199 | |
Commercial loans, held-for-sale | | | 75,449 | | | | 68,169 | | | | 73,204 | | | | 67,999 | | | | 50,366 | | | | 49,061 | | | | 6,886 | | | | - | | | | - | | | | 71,829 | | | | 49,717 | |
Commercial loans, held-for-investment, at fair value | | | 69,565 | | | | 20,626 | | | | - | | | | - | | | | - | | | | - | | | | - | | | | - | | | | - | | | | 45,231 | | | | - | |
Commercial loans, held-for-investment, at amortized cost | | | 343,815 | | | | 343,705 | | | | 346,333 | | | | 347,633 | | | | 332,113 | | | | 319,760 | | | | 296,990 | | | | 267,032 | | | | 199,440 | | | | 343,760 | | | | 325,971 | |
| | | | | | | | | | | | |
Senior residential securities | | | | | | | | | | | | | | | | | | | | | | | | | | | | | | | | | | | | | | | | | | | | |
Prime | | | 835,987 | | | | 725,551 | | | | 586,675 | | | | 440,616 | | | | 453,230 | | | | 416,774 | | | | 427,149 | | | | 447,994 | | | | 457,549 | | | | 781,074 | | | | 435,103 | |
Non-prime | | | 171,033 | | | | 174,811 | | | | 178,994 | | | | 187,724 | | | | 227,295 | | | | 235,583 | | | | 243,336 | | | | 236,006 | | | | 262,084 | | | | 172,912 | | | | 231,416 | |
Total senior residential securities | | | 1,007,020 | | | | 900,362 | | | | 765,669 | | | | 628,340 | | | | 680,525 | | | | 652,357 | | | | 670,485 | | | | 684,000 | | | | 719,633 | | | | 953,986 | | | | 666,519 | |
| | | | | | | | | | | | |
Residential Re-REMIC securities | | | 115,746 | | | | 109,753 | | | | 102,836 | | | | 101,808 | | | | 100,824 | | | | 99,769 | | | | 99,088 | | | | 99,890 | | | | 105,281 | | | | 112,766 | | | | 100,299 | |
| | | | | | | | | | | | |
Subordinate residential securities | | | | | | | | | | | | | | | | | | | | | | | | | | | | | | | | | | | | | | | | | | | | |
Prime | | | 530,273 | | | | 509,906 | | | | 492,708 | | | | 440,235 | | | | 320,490 | | | | 218,477 | | | | 153,223 | | | | 118,549 | | | | 104,078 | | | | 520,146 | | | | 269,766 | |
Non-prime | | | - | | | | - | | | | - | | | | 1,286 | | | | 2,051 | | | | 2,064 | | | | 3,783 | | | | 6,669 | | | | 8,325 | | | | - | | | | 2,057 | |
Total subordinate residential securities | | | 530,273 | | | | 509,906 | | | | 492,708 | | | | 441,521 | | | | 322,541 | | | | 220,541 | | | | 157,006 | | | | 125,218 | | | | 112,403 | | | | 520,146 | | | | 271,823 | |
| | | | | | | | | | | | |
Other Securities | | | - | | | | - | | | | - | | | | - | | | | - | | | | 766 | | | | 2,158 | | | | 4,061 | | | | 3,994 | | | | - | | | | 381 | |
Earning assets at Acacia | | | - | | | | - | | | | - | | | | - | | | | - | | | | - | | | | 171,650 | | | | 270,891 | | | | 262,959 | | | | - | | | | - | |
Mortgage servicing rights | | | 65,705 | | | | 62,943 | | | | 60,822 | | | | 55,622 | | | | 31,318 | | | | 10,299 | | | | 4,867 | | | | 2,122 | | | | 1,729 | | | | 64,332 | | | | - | |
Total real estate assets | | | 4,589,917 | | | | 4,244,956 | | | | 4,189,574 | | | | 4,414,660 | | | | 4,621,854 | | | | 4,348,818 | | | | 4,578,982 | | | | 5,047,536 | | | | 5,027,458 | | | | 4,418,390 | | | | 4,465,224 | |
| | | | | | | | | | | | |
Cash and cash equivalents | | | 131,557 | | | | 159,089 | | | | 167,453 | | | | 274,657 | | | | 96,998 | | | | 77,911 | | | | 177,555 | | | | 86,531 | | | | 94,511 | | | | 145,247 | | | | 87,507 | |
Earning assets | | | 4,721,474 | | | | 4,404,045 | | | | 4,357,027 | | | | 4,689,317 | | | | 4,718,852 | | | | 4,426,729 | | | | 4,756,537 | | | | 5,134,067 | | | | 5,121,969 | | | | 4,563,637 | | | | 4,552,731 | |
Balance sheet mark-to-market adjustments | | | 162,081 | | | | 153,975 | | | | 125,953 | | | | 119,498 | | | | 139,843 | | | | 142,392 | | | | 100,001 | | | | 44,846 | | | | 24,142 | | | | 158,050 | | | | 141,111 | |
Earning assets - reported value | | | 4,883,555 | | | | 4,558,020 | | | | 4,482,980 | | | | 4,808,815 | | | | 4,858,695 | | | | 4,569,121 | | | | 4,856,538 | | | | 5,178,913 | | | | 5,146,111 | | | | 4,721,687 | | | | 4,693,842 | |
Other assets | | | 257,377 | | | | 233,492 | | | | 199,008 | | | | 201,964 | | | | 245,117 | | | | 254,200 | | | | 233,715 | | | | 192,766 | | | | 161,850 | | | | 245,500 | | | | 270,500 | |
Total assets | | $ | 5,140,932 | | | $ | 4,791,512 | | | $ | 4,681,988 | | | $ | 5,010,779 | | | $ | 5,103,812 | | | $ | 4,823,321 | | | $ | 5,090,253 | | | $ | 5,371,679 | | | $ | 5,307,961 | | | $ | 4,967,187 | | | $ | 4,964,342 | |
Short-term debt | | $ | 1,329,568 | | | $ | 1,006,349 | | | $ | 893,481 | | | $ | 1,150,917 | | | $ | 1,053,610 | | | $ | 854,238 | | | $ | 539,579 | | | $ | 570,775 | | | $ | 474,053 | | | $ | 1,168,852 | | | $ | 954,475 | |
Residential Resecuritization ABS issued | | | 73,617 | | | | 85,236 | | | | 99,940 | | | | 118,338 | | | | 138,817 | | | | 153,487 | | | | 168,634 | | | | 182,702 | | | | 196,837 | | | | 79,394 | | | | 146,111 | |
Commercial Securitization ABS issued | | | 142,400 | | | | 144,936 | | | | 150,716 | | | | 155,661 | | | | 155,812 | | | | 163,409 | | | | 61,830 | | | | - | | | | - | | | | 143,661 | | | | 159,589 | |
Consolidated Sequoia ABS issued | | | 1,577,888 | | | | 1,644,626 | | | | 1,722,583 | | | | 1,835,401 | | | | 1,965,149 | | | | 2,099,041 | | | | 2,661,564 | | | | 3,039,273 | | | | 3,166,476 | | | | 1,611,073 | | | | 2,031,725 | |
Acacia ABS issued | | | - | | | | - | | | | - | | | | - | | | | - | | | | - | | | | 154,617 | | | | 235,789 | | | | 231,673 | | | | - | | | | - | |
Other liabilities | | | 240,977 | | | | 186,997 | | | | 131,277 | | | | 82,748 | | | | 151,927 | | | | 167,107 | | | | 274,112 | | | | 217,159 | | | | 154,840 | | | | 214,136 | | | | 159,475 | |
Other long-term debt | | | 531,136 | | | | 480,362 | | | | 466,718 | | | | 450,296 | | | | 433,690 | | | | 224,493 | | | | 141,352 | | | | 138,289 | | | | 138,277 | | | | 505,889 | | | | 329,670 | |
Total liabilities | | | 3,895,586 | | | | 3,548,506 | | | | 3,464,715 | | | | 3,793,361 | | | | 3,899,005 | | | | 3,661,775 | | | | 4,001,688 | | | | 4,383,987 | | | | 4,362,156 | | | | 3,723,005 | | | | 3,781,045 | |
| | | | | | | | | | | | |
Total equity | | | 1,245,346 | | | | 1,243,006 | | | | 1,217,273 | | | | 1,217,418 | | | | 1,204,807 | | | | 1,161,546 | | | | 1,088,565 | | | | 987,692 | | | | 945,805 | | | | 1,244,182 | | | | 1,183,297 | |
Total liabilities and equity | | $ | 5,140,932 | | | $ | 4,791,512 | | | $ | 4,681,988 | | | $ | 5,010,779 | | | $ | 5,103,812 | | | $ | 4,823,321 | | | $ | 5,090,253 | | | $ | 5,371,679 | | | $ | 5,307,961 | | | $ | 4,967,187 | | | $ | 4,964,342 | |
(1) Residential loans, held-for-investment is comprised of loans held in consolidated Sequoia entities.
| | | | |
| | |
THE REDWOOD REVIEW 2ND QUARTER 2014 | | Table 5: Average Balance Sheet | | |
| | | | |
| | |
| | | Table 6: Balances & Yields by Securities Portfolio1 ($ in thousands) | | |
| | | | | | | | | | | | | | | | | | | | | | | | | | | | | | | | | | | | | | | | | | | | | | | | | | | | |
| | | 2014 Q2 | | | 2014 Q1 | | | 2013 Q4 | | | 2013 Q3 | | | 2013 Q2 | | | 2013 Q1 | | | | | | | 2014 Q2 | | | 2014 Q1 | | | 2013 Q4 | | | 2013 Q3 | | | 2013 Q2 | | | 2013 Q1 | |
Residential Prime Senior | | | | | | | | | | | | | | | | | | | | | Residential Prime Subordinate | | | | | | | | | | | | | | | | | |
Principal balance | | $ | 772,127 | | | $ | 703,977 | | | $ | 670,051 | | | $ | 379,598 | | | $ | 435,536 | | | $ | 460,273 | | | | | Principal balance | | $ | 721,267 | | | $ | 700,081 | | | $ | 709,629 | | | $ | 664,597 | | | $ | 536,235 | | | $ | 428,588 | |
Unamortized discount | | | (36,853 | ) | | | (42,255 | ) | | | (44,133 | ) | | | (47,000 | ) | | | (42,520 | ) | | | (48,893 | ) | | | | Unamortized discount | | | (139,890 | ) | | | (135,877 | ) | | | (136,643 | ) | | | (122,631 | ) | | | (84,645 | ) | | | (71,412 | ) |
Credit reserve | | | (5,476 | ) | | | (6,815 | ) | | | (10,144 | ) | | | (12,964 | ) | | | (32,068 | ) | | | (28,326 | ) | | | | Credit reserve | | | (49,597 | ) | | | (55,874 | ) | | | (61,643 | ) | | | (76,080 | ) | | | (90,799 | ) | | | (83,148 | ) |
Unrealized gains, net | | | 44,329 | | | | 44,879 | | | | 46,532 | | | | 44,188 | | | | 49,211 | | | | 64,260 | | | | | Unrealized gains, net | | | 48,598 | | | | 34,377 | | | | 19,526 | | | | 16,778 | | | | 20,936 | | | | 25,676 | |
Interest-only securities | | | 96,894 | | | | 106,228 | | | | 110,505 | | | | 117,443 | | | | 123,591 | | | | 55,289 | | | | | Interest-only securities | | | 279 | | | | 194 | | | | 206 | | | | 252 | | | | 258 | | | | 337 | |
Fair value | | $ | 871,021 | | | $ | 806,014 | | | $ | 772,811 | | | $ | 481,265 | | | $ | 533,750 | | | $ | 502,603 | | | | | Fair value | | $ | 580,657 | | | $ | 542,901 | | | $ | 531,075 | | | $ | 482,916 | | | $ | 381,985 | | | $ | 300,041 | |
Average amortized cost | | $ | 835,987 | | | $ | 725,551 | | | $ | 586,675 | | | $ | 440,616 | | | $ | 453,230 | | | $ | 416,775 | | | | | Mezzanine | | | | | | | | | | | | | | | | | | | | | | | | |
Interest income | | $ | 15,080 | | | $ | 14,640 | | | $ | 13,230 | | | $ | 12,639 | | | $ | 12,341 | | | $ | 9,723 | | | | | Average amortized cost | | $ | 415,418 | | | $ | 399,134 | | | $ | 382,348 | | | $ | 336,781 | | | $ | 239,118 | | | $ | 145,732 | |
Annualized yield | | | 7.22% | | | | 8.07% | | | | 9.02% | | | | 11.47% | | | | 10.89% | | | | 9.33% | | | | | Interest income | | $ | 5,325 | | | $ | 5,127 | | | $ | 4,810 | | | $ | 4,153 | | | $ | 3,010 | | | $ | 1,868 | |
| | | | | | | | | | | | | | | | | | | | | | | | | | | | | Annualized yield | | | 5.13% | | | | 5.14% | | | | 5.03% | | | | 4.93% | | | | 5.04% | | | | 5.13% | |
Residential Non-Prime Senior | | | | | | | | | | | | | | | | | | | | | | | | | | | | | | | | | | | | | | | | | | | | | |
Principal balance | | $ | 209,967 | | | $ | 212,629 | | | $ | 218,603 | | | $ | 225,649 | | | $ | 259,524 | | | $ | 268,926 | | | | | Subordinate | | | | | | | | | | | | | | | | | | | | | | | | |
Unamortized discount | | | (36,387 | ) | | | (36,867 | ) | | | (36,882 | ) | | | (40,243 | ) | | | (39,030 | ) | | | (40,541 | ) | | | | Average amortized cost | | $ | 114,855 | | | $ | 110,772 | | | $ | 110,360 | | | $ | 103,454 | | | $ | 81,372 | | | $ | 72,745 | |
Credit reserve | | | (9,697 | ) | | | (11,625 | ) | | | (13,840 | ) | | | (12,813 | ) | | | (18,078 | ) | | | (18,079 | ) | | | | Interest income | | $ | 4,082 | | | $ | 4,140 | | | $ | 4,535 | | | $ | 4,370 | | | $ | 3,938 | | | $ | 3,578 | |
Unrealized gains, net | | | 28,373 | | | | 28,860 | | | | 25,505 | | | | 22,561 | | | | 22,271 | | | | 30,118 | | | | | Annualized yield | | | 14.22% | | | | 14.95% | | | | 16.44% | | | | 16.90% | | | | 19.36% | | | | 19.67% | |
Interest-only securities | | | 8,380 | | | | 8,729 | | | | 9,070 | | | | 8,864 | | | | 17,525 | | | | 21,582 | | | | | | | | | | | | | | | | | | | | | | | | | | | | | |
Fair value | | $ | 200,636 | | | $ | 201,726 | | | $ | 202,456 | | | $ | 204,018 | | | $ | 242,212 | | | $ | 262,006 | | | | | Residential Non-Prime Subordinate | | | | | | | | | | | | | | | | | |
| | | | | | | | | | | | | | | | | | | | | | | | | | | | | Principal balance | | $ | 11,925 | | | $ | 11,991 | | | $ | 12,021 | | | $ | 12,054 | | | $ | 19,294 | | | $ | 19,869 | |
Average amortized cost | | $ | 171,033 | | | $ | 174,811 | | | $ | 178,994 | | | $ | 187,724 | | | $ | 227,296 | | | $ | 235,583 | | | | | Unamortized discount | | | (11,207 | ) | | | (11,207 | ) | | | (11,207 | ) | | | (11,240 | ) | | | (11,982 | ) | | | (11,993 | ) |
Interest income | | $ | 4,404 | | | $ | 4,388 | | | $ | 4,589 | | | $ | 4,789 | | | $ | 5,825 | | | $ | 6,011 | | | | | Credit reserve | | | (718 | ) | | | (784 | ) | | | (814 | ) | | | (814 | ) | | | (5,270 | ) | | | (5,829 | ) |
Annualized yield | | | 10.30% | | | | 10.04% | | | | 10.26% | | | | 10.20% | | | | 10.25% | | | | 10.21% | | | | | Unrealized gains, net | | | 157 | | | | 159 | | | | 143 | | | | 133 | | | | 149 | | | | 394 | |
| | | | | | | | | | | | | | | | | | | | | | | | | | | | | Fair value | | $ | 157 | | | $ | 159 | | | $ | 143 | | | $ | 133 | | | $ | 2,191 | | | $ | 2,441 | |
Residential Re-REMIC | | | | | | | | | | | | | | | | | | | | | | | | | | | | | | | | | | | | | | |
Principal balance | | $ | 223,389 | | | $ | 223,709 | | | $ | 214,046 | | | $ | 214,660 | | | $ | 215,169 | | | $ | 215,235 | | | | | Average amortized cost | | $ | - | | | $ | - | | | $ | - | | | $ | 1,286 | | | $ | 2,051 | | | $ | 2,064 | |
Unamortized discount | | | (89,089 | ) | | | (87,910 | ) | | | (80,188 | ) | | | (78,789 | ) | | | (69,590 | ) | | | (64,547 | ) | | | | Interest income | | $ | 49 | | | $ | 39 | | | $ | 40 | | | $ | 124 | | | $ | 165 | | | $ | 155 | |
Credit reserve | | | (17,788 | ) | | | (20,590 | ) | | | (30,429 | ) | | | (33,621 | ) | | | (44,195 | ) | | | (50,406 | ) | | | | Annualized yield | | | N/A | | | | N/A | | | | N/A | | | | 38.57% | | | | 32.18% | | | | 30.04% | |
Unrealized gains, net | | | 76,084 | | | | 76,999 | | | | 72,947 | | | | 54,096 | | | | 52,783 | | | | 63,155 | | | | | | | | | | | | | | | | | | | | | | | | | | | | | |
Fair value | | $ | 192,596 | | | $ | 192,208 | | | $ | 176,376 | | | $ | 156,346 | | | $ | 154,167 | | | $ | 163,437 | | | | | | | | | | | | | | | | | | | | | | | | | | | | | |
Average amortized cost | | $ | 115,746 | | | $ | 109,753 | | | $ | 102,836 | | | $ | 101,808 | | | $ | 100,824 | | | $ | 99,769 | | | | | | | | | | | | | | | | | | | | | | | | | | | | | |
Interest income | | $ | 4,231 | | | $ | 4,096 | | | $ | 3,883 | | | $ | 3,574 | | | $ | 3,835 | | | $ | 3,758 | | | | | | | | | | | | | | | | | | | | | | | | | | | | | |
Annualized yield | | | 14.62% | | | | 14.93% | | | | 15.10% | | | | 14.04% | | | | 15.21% | | | | 15.07% | | | | | | | | | | | | | | | | | | | | | | | | | | | | | |
(1) Annualized yields for AFS portfolios are based on average amortized cost. Cash flows from many of our subordinate securities can be volatile and in certain cases (e.g., when the fair value of certain securities are close to zero) any interest income earned can result in unusually high reported yields that are not sustainable and not necessarily meaningful.
| | | | |
| | |
THE REDWOOD REVIEW 2ND QUARTER 2014 | | Table 6: Balances & Yields by Securities Portfolio | | 53 |
| | | | |
| | |
| | | Table 7: Securities and Loans Portfolio Activity ($ in thousands) | | 54 |
| | | | | | | | | | | | | | | | | | | | | | | | | | | | | | | | | | | | | | | | | | | | | | | | | | | | |
| | | 2014 Q2 | | | 2014 Q1 | | | 2013 Q4 | | | 2013 Q3 | | | 2013 Q2 | | | 2013 Q1 | | | | | | | 2014 Q2 | | | 2014 Q1 | | | 2013 Q4 | | | 2013 Q3 | | | 2013 Q2 | | | 2013 Q1 | |
Residential Prime Senior | | | | | | | | | | | | | | | | | | | | | | | | | Other Securities | | | | | | | | | | | | | | | | | | | | | |
Beginning fair value | | $ | 806,014 | | | $ | 772,811 | | | $ | 481,265 | | | $ | 533,750 | | | $ | 502,603 | | | $ | 476,932 | | | | | Beginning fair value | | $ | - | | | $ | - | | | $ | - | | | $ | - | | | $ | - | | | $ | 14,069 | |
Acquisitions | | | 111,520 | | | | 63,889 | | | | 318,983 | | | | 112,644 | | | | 40,642 | | | | 51,208 | | | | | Acquisitions | | | - | | | | - | | | | - | | | | - | | | | - | | | | - | |
Sales | | | (321 | ) | | | - | | | | (13,036 | ) | | | (137,807 | ) | | | (8,677 | ) | | | (8,257 | ) | | | | Sales | | | - | | | | - | | | | - | | | | - | | | | - | | | | (2,031 | ) |
Effect of principal payments | | | (41,144 | ) | | | (29,307 | ) | | | (26,055 | ) | | | (24,159 | ) | | | (24,019 | ) | | | (23,840 | ) | | | | Effect of principal payments | | | - | | | | - | | | | - | | | | - | | | | - | | | | - | |
Change in fair value, net | | | (5,048 | ) | | | (1,379 | ) | | | 11,654 | | | | (3,163 | ) | | | 23,201 | | | | 6,560 | | | | | Change in fair value, net(1) | | | - | | | | - | | | | - | | | | - | | | | - | | | | (12,038 | ) |
Ending fair value | | $ | 871,021 | | | $ | 806,014 | | | $ | 772,811 | | | $ | 481,265 | | | $ | 533,750 | | | $ | 502,603 | | | | | Ending fair value | | $ | - | | | $ | - | | | $ | - | | | $ | - | | | $ | - | | | $ | - | |
| | | | | | | | | | | | | | | | | | | | | | | | | | | | | | | | | | | | | | | | | | | | | | | | | | | | | |
Residential Non-Prime Senior | | | | | | | | | | | | | | | | | | | | | | | | | Residential Loans at Redwood | | | | | | | | | | | | | | | | | | | | | |
Beginning fair value | | $ | 201,726 | | | $ | 202,456 | | | $ | 204,018 | | | $ | 242,212 | | | $ | 262,006 | | | $ | 267,400 | | | | | Beginning carrying value | | $ | 774,936 | | | $ | 404,267 | | | $ | 727,879 | | | $ | 1,221,098 | | | $ | 831,953 | | | $ | 562,658 | |
Acquisitions | | | 3,613 | | | | - | | | | - | | | | - | | | | - | | | | - | | | | | Acquisitions | | | 1,790,909 | | | | 1,092,971 | | | | 658,806 | | | | 1,294,372 | | | | 2,567,426 | | | | 2,586,899 | |
Sales | | | - | | | | - | | | | - | | | | (31,725 | ) | | | - | | | | - | | | | | Sales | | | (1,466,955 | ) | | | (722,403 | ) | | | (979,661 | ) | | | (1,771,726 | ) | | | (2,135,166 | ) | | | (2,349,089 | ) |
Effect of principal payments | | | (5,593 | ) | | | (5,294 | ) | | | (6,145 | ) | | | (7,969 | ) | | | (8,397 | ) | | | (8,110 | ) | | | | Principal repayments | | | (5,006 | ) | | | (7,025 | ) | | | (9,511 | ) | | | (4,190 | ) | | | (1,768 | ) | | | (3,286 | ) |
Change in fair value, net | | | 890 | | | | 4,564 | | | | 4,583 | | | | 1,500 | | | | (11,397 | ) | | | 2,716 | | | | | Changes in fair value, net | | | 13,993 | | | | 7,126 | | | | 6,754 | | | | (11,675 | ) | | | (41,347 | ) | | | 34,771 | |
Ending fair value | | $ | 200,636 | | | $ | 201,726 | | | $ | 202,456 | | | $ | 204,018 | | | $ | 242,212 | | | $ | 262,006 | | | | | Ending fair value | | $ | 1,107,877 | | | $ | 774,936 | | | $ | 404,267 | | | $ | 727,879 | | | $ | 1,221,098 | | | $ | 831,953 | |
| | | | | | | | | | | | | | | | | | | | | | | | | | | | | | | | | | | | | | | | | | | | | | | | | | | | | |
Residential Re-REMIC | | | | | | | | | | | | | | | | | | | | | | | | | Residential Loans at Consolidated Sequoia Entities | | | | | | | | | | | | | | | | | | | | | |
Beginning fair value | | $ | 192,208 | | | $ | 176,376 | | | $ | 156,346 | | | $ | 154,167 | | | $ | 163,437 | | | $ | 163,035 | | | | | Beginning carrying value | | $ | 1,689,994 | | | $ | 1,762,167 | | | $ | 1,864,652 | | | $ | 1,998,177 | | | $ | 2,133,254 | | | $ | 2,272,812 | |
Acquisitions | | | - | | | | 10,200 | | | | - | | | | - | | | | - | | | | - | | | | | Principal repayments | | | (71,903 | ) | | | (70,649 | ) | | | (97,231 | ) | | | (130,766 | ) | | | (136,179 | ) | | | (135,975 | ) |
Sales | | | - | | | | - | | | | - | | | | - | | | | - | | | | - | | | | | Charge-Offs | | | 994 | | | | 484 | | | | 1,163 | | | | 818 | | | | 1,750 | | | | 795 | |
Effect of principal payments | | | - | | | | - | | | | - | | | | - | | | | - | | | | - | | | | | Transfers to REO | | | (2,094 | ) | | | (267 | ) | | | (1,692 | ) | | | (1,052 | ) | | | (3,046 | ) | | | (1,326 | ) |
Change in fair value, net | | | 388 | | | | 5,632 | | | | 20,030 | | | | 2,179 | | | | (9,270 | ) | | | 402 | | | | | Loan loss (provision) reversal | | | 605 | | | | (628 | ) | | | (3,374 | ) | | | (883 | ) | | | 4,163 | | | | (1,354 | ) |
Ending fair value | | $ | 192,596 | | | $ | 192,208 | | | $ | 176,376 | | | $ | 156,346 | | | $ | 154,167 | | | $ | 163,437 | | | | | Discount amortization, net | | | (1,092 | ) | | | (1,113 | ) | | | (1,351 | ) | | | (1,642 | ) | | | (1,765 | ) | | | (1,698 | ) |
| | | | | | | | | | | | | | | | | | | | | | | | | | | | | Ending carrying value | | $ | 1,616,504 | | | $ | 1,689,994 | | | $ | 1,762,167 | | | $ | 1,864,652 | | | $ | 1,998,177 | | | $ | 2,133,254 | |
Residential Prime Subordinate | | | | | | | | | | | | | | | | | | | | | | | | | | | | | | | | | | | | | | | | | | | | | | | | | |
Beginning fair value | | $ | 542,901 | | | $ | 531,075 | | | $ | 482,916 | | | $ | 381,985 | | | $ | 300,041 | | | $ | 184,996 | | | | | Commercial Loans | | | | | | | | | | | | | | | | | | | | | |
Acquisitions | | | 26,361 | | | | - | | | | 49,437 | | | | 110,213 | | | | 92,368 | | | | 114,728 | | | | | Beginning carrying value | | $ | 491,275 | | | $ | 432,455 | | | $ | 379,853 | | | $ | 494,823 | | | $ | 401,438 | | | $ | 313,010 | |
Sales | | | - | | | | - | | | | (1,095 | ) | | | - | | | | - | | | | - | | | | | Originations | | | 154,907 | | | | 121,412 | | | | 245,045 | | | | 121,523 | | | | 168,365 | | | | 189,407 | |
Effect of principal payments | | | (4,587 | ) | | | (3,351 | ) | | | (4,409 | ) | | | (5,481 | ) | | | (4,549 | ) | | | (4,002 | ) | | | | Sales | | | (180,651 | ) | | | (65,336 | ) | | | (186,443 | ) | | | (238,102 | ) | | | (73,780 | ) | | | (88,212 | ) |
Change in fair value, net | | | 15,982 | | | | 15,177 | | | | 4,226 | | | | (3,801 | ) | | | (5,875 | ) | | | 4,319 | | | | | Principal repayments | | | (4,101 | ) | | | (370 | ) | | | (11,200 | ) | | | (848 | ) | | | (100 | ) | | | (12,272 | ) |
Ending fair value | | $ | 580,657 | | | $ | 542,901 | | | $ | 531,075 | | | $ | 482,916 | | | $ | 381,985 | | | $ | 300,041 | | | | | Provision for loan losses | | | (289 | ) | | | (655 | ) | | | (869 | ) | | | (844 | ) | | | (891 | ) | | | (685 | ) |
| | | | | | | | | | | | | | | | | | | | | | | | | | | | | Discount/fee amortization | | | 152 | | | | 145 | | | | 201 | | | | 138 | | | | 136 | | | | 190 | |
Residential Non-Prime Subordinate | | | | | | | | | | | | | | | | | | | | | Changes in fair value, net | | | 7,473 | | | | 3,624 | | | | 5,868 | | | | 3,163 | | | | (345 | ) | | | - | |
Beginning fair value | | $ | 159 | | | $ | 143 | | | $ | 133 | | | $ | 2,191 | | | $ | 2,441 | | | $ | 2,321 | | | | | Ending carrying value | | $ | 468,766 | | | $ | 491,275 | | | $ | 432,455 | | | $ | 379,853 | | | $ | 494,823 | | | $ | 401,438 | |
Acquisitions | | | - | | | | - | | | | - | | | | - | | | | - | | | | - | | | | | | | | | | | | | | | | | | | | | | | | | | | | | |
Sales | | | - | | | | - | | | | - | | | | (2,185 | ) | | | - | | | | - | | | | | | | | | | | | | | | | | | | | | | | | | | | | | |
Effect of principal payments | | | (9 | ) | | | (5 | ) | | | (5 | ) | | | (16 | ) | | | (14 | ) | | | (66 | ) | | | | | | | | | | | | | | | | | | | | | | | | | | | | |
Change in fair value, net | | | 7 | | | | 21 | | | | 15 | | | | 143 | | | | (236 | ) | | | 186 | | | | | | | | | | | | | | | | | | | | | | | | | | | | | |
Ending fair value | | $ | 157 | | | $ | 159 | | | $ | 143 | | | $ | 133 | | | $ | 2,191 | | | $ | 2,441 | | | | | | | | | | | | | | | | | | | | | | | | | | | | | |
| | | | | | | | | | | | | | | | | | | | | | | | | | | | | | | | | | | | | | | | | | | | | | | | | | | | | |
(1) During the first quarter of 2013, the change in fair value, net reflects the liquidation of our remaining commercial securities, resulting in an ending fair value of zero for this portfolio.
| | | | |
| | |
THE REDWOOD REVIEW 2ND QUARTER 2014 | | Table 7: Securities and Loans Portfolio Activity | | |
This Page Intentionally Left Blank
REDWOOD TRUST CORPORATE INFORMATION
EXECUTIVE OFFICERS:
Martin S. Hughes
Chief Executive Officer
Brett D. Nicholas
President
Fred J. Matera
Chief Investment Officer
Christopher J. Abate
Chief Financial Officer
Andrew P. Stone
General Counsel
CORPORATE HEADQUARTERS:
One Belvedere Place, Suite 300
Mill Valley, California 94941
Telephone: (415) 389-7373
COLORADO OFFICE:
8310 South Valley Highway, Suite 425
Englewood, Colorado 80112
NEW YORK OFFICE:
1114 Avenue of the Americas,
Suite 2810
New York, New York 10036
STOCK LISTING:
The Company’s common stock is traded
on the New York Stock Exchange under
the symbolRWT
TRANSFER AGENT:
Computershare Trust Company, N.A.
2 North LaSalle Street
Chicago, IL 60602
Telephone: (888) 472-1955
DIRECTORS:
Richard D. Baum
Chairman of the Board
and Former Chief Deputy Insurance
Commissioner for the State of California
Douglas B. Hansen
Vice-Chairman of the Board
and Private Investor
Mariann Byerwalter
Chairman, JDN Corporate Advisory LLC
Martin S. Hughes
Chief Executive Officer
Greg H. Kubicek
President, The Holt Group, Inc.
Jeffrey T. Pero
Retired Partner, Latham & Watkins LLP
Georganne C. Proctor
Former Chief Financial Officer, TIAA-CREF
Charles J. Toeniskoetter
Chairman, Toeniskoetter Development, Inc.
Chairman & CEO, Toeniskoetter
Construction, Inc.
INVESTOR RELATIONS:
Mike McMahon
Managing Director
Investor Relations Hotline: (866) 269-4976
Email: investorrelations@redwoodtrust.com
For more information about Redwood Trust, please visit our website at: www.redwoodtrust.com
56