UNITED STATES
SECURITIES AND EXCHANGE COMMISSION
Washington, D.C. 20549
FORM 6-K
REPORT OF FOREIGN PRIVATE ISSUER
Pursuant to Rule 13a-16 or 15d-16
under the Securities Exchange Act of 1934
For the month of November, 2013
Commission File Number: 333-13302
ETABLISSEMENTS DELHAIZE FRÈRES
ET CIE “LE LION” (GROUPE DELHAIZE)
(Exact name of registrant as specified in its charter)*
DELHAIZE BROTHERS AND CO.
“THE LION” (DELHAIZE GROUP)
(Translation of registrant’s name into English)*
SQUARE MARIE CURIE 40
1070 BRUSSELS, BELGIUM
(Address of principal executive offices)
* The registrant’s charter (articles of association) specifies the registrant’s name in French, Dutch and English.
Indicate by check mark whether the registrant files or will file annual reports under cover of Form 20-F or Form 40-F.
Form 20-F X Form 40-F
Indicate by check mark if the registrant is submitting the Form 6-K in paper as permitted by Regulation S-T Rule 101(b)(1):
Indicate by check mark if the registrant is submitting the Form 6-K in paper as permitted by Regulation S-T Rule 101(b)(7):
Indicate by check mark whether by furnishing the information contained in this Form, the registrant is also thereby furnishing the information to the Commission pursuant to Rule 12g3-2(b) under the Securities Exchange Act of 1934.
Yes No X
If “Yes” is marked, indicate below the file number assigned to the registrant in connection with Rule 12g3-2(b): 82-
 | Interim Financial Reporting Third Quarter 2013 Regulated Information November 7, 2013 – 7:00 a.m. CET | |
DELHAIZE GROUP THIRD QUARTER 2013 RESULTS
Financial Summary Third Quarter 2013
| » | Revenue growth of 2.9% at identical exchange rates (3.1% organic growth) |
| » | Comparable store sales growth of 2.2% in the U.S. and 1.5% in Belgium |
| » | Group underlying operating margin of 3.3% (3.9% in the U.S., 2.6% in Belgium, 3.2% in Southeastern Europe) |
Highlights
| » | Appointment of Frans Muller as new CEO of Delhaize Group as of November 8, 2013 |
| » | Year-to-date free cash flow generation of€463 million |
| » | €195 million impairment on Maxi goodwill and trade names |
2013 Outlook
| » | Confirmation of our 2013 guidance of underlying operating profit of at least€755 million at identical exchange rates compared to€785 million in 2012 and free cash flow of approximately€500 million |
» CEO Comments
Pierre-Olivier Beckers, President and Chief Executive Officer of Delhaize Group, commented: “We delivered solid results in the U.S. during the third quarter. Food Lion continued to show good momentum as reflected in the fourth consecutive quarter of positive volume and comparable store sales growth. At Hannaford, we experienced similar positive trends supported by further price investments since the second quarter.”
“In Belgium, we have maintained market share, helped by network expansion and higher comparable store sales growth. As a result of our decision to increase price investments and promotions, profitability has declined. In Southeastern Europe, we continue to maintain or even improve our market share in the largest three markets. This has resulted in further improved profitability for the region as a whole.”
“For 2013, we reiterate our confidence that the Group will generate an underlying operating profit of at least€755 million at identical exchange rates and a free cash flow of approximately€500 million.”
“Tomorrow, I will hand over my position as CEO of Delhaize Group to Frans Muller. Since joining the company a few weeks ago, Frans has spent a lot of time at our various European and American operations and has already brought a lot of energy to the Group. His experience in food retail combined with continued positive momentum in the Group and our solid balance sheet strengthens my confidence in the future of Delhaize Group.”
» Financial Summary
| Q3 2013(1) | YTD 2013(1) | |||||||||||||||||||||||
|
|
|
| |||||||||||||||||||||
| Actual Results | At Actual Rates | At Identical | In millions of €, except EPS (in €) | Actual Results | At Actual Rates | At Identical Rates | ||||||||||||||||||
|
|
|
|
| ||||||||||||||||||||
| 5 339 | -0.5% | +2.9% | Revenues | 15 770 | +0.7% | +2.5% | ||||||||||||||||||
| 323 | -15.2% | -12.0% | EBITDA | 967 | +10.7% | +12.7% | ||||||||||||||||||
| (20) | N/A | N/A | Operating profit (loss) | 330 | -22.2% | -19.8% | ||||||||||||||||||
| (0.4%) | - | - | Operating margin | 2.1% | - | - | ||||||||||||||||||
| 176 | -22.0% | -18.7% | Underlying operating profit | 571 | -3.1% | -1.2% | ||||||||||||||||||
| 3.3% | - | - | Underlying operating margin | 3.6% | - | - | ||||||||||||||||||
| (66) | N/A | N/A | Profit (loss) before taxes and discontinued operations | 190 | -29.7% | -27.1% | ||||||||||||||||||
| (78) | N/A | N/A | Net profit (loss) from continuing operations | 126 | -54.3% | -52.3% | ||||||||||||||||||
| (87) | N/A | N/A | Group share in net profit (loss) | 78 | -71.5% | -69.8% | ||||||||||||||||||
| (0.86) | N/A | N/A | Basic earnings per share - Group share in net profit (loss) | 0.77 | -71.6% | -69.9% | ||||||||||||||||||
|
|
|
|
| ||||||||||||||||||||
| (1) | The average exchange rate of the U.S. dollar against the euro weakened by 5.6% in the third quarter of 2013 (€1 = $1.3242) and weakened by 2.8% in the first nine months of 2013 compared to last year. |
| Delhaize Group – Earnings Release – Third Quarter 2013 | 1 of 25 | |||||
» Third Quarter 2013 Income Statement
Revenues
In the third quarter of 2013, Delhaize Group’s revenues declined by 0.5% at actual exchange rates but increased by 2.9% at identical exchange rates. Organic revenue growth was 3.1%.
In the U.S., revenue growth in local currency was +2.2% (excluding the revenues from Sweetbay, Harveys and Reid´s pending their planned divestiture). Excluding the impact from the 11 store closures announced in early 2013, revenues in local currency increased by 2.6%. U.S. comparable store sales growth was +2.2%. During the quarter, we experienced low retail inflation (+0.5%) combined with positive volume growth at both Food Lion and Hannaford. Revenues at Delhaize Belgium increased by 4.3% and were driven by a favorable calendar impact, inflation and network growth. Comparable store sales growth was +1.5% (+3.4% including a +1.9% calendar impact). Revenues in Southeastern Europe grew by 3.9% at identical exchange rates and exclude the revenues from the activities in Montenegro pending their planned divestiture. In Greece, we reported positive comparable store sales growth and overall revenue growth while revenue trends at Maxi deteriorated although we have maintained market share. High growth in Romania continued, supported by network expansion and comparable sales growth.
Gross margin
Gross margin was 24.0% of revenues which represents a decline of 30 basis points at identical exchange rates. Price investments across the Group and an increase in competitive activity in Belgium in particular were not fully offset by improved supplier terms.
Other operating income
Other operating income was€41 million and increased by€13 million compared to last year, due to the reversal of certain litigation and legal provisions in Serbia.
Selling, general and administrative expenses
Selling, general and administrative expenses (SG&A) were 21.3% of revenues, an increase of 66 basis points compared to the third quarter of last year at identical exchange rates mainly due to the release of the bonus accrual in the U.S. last year and to termination benefits incurred in the third quarter of 2013.
Other operating expenses
Other operating expenses were€204 million and included€199 million of impairment charges, mainly related to the Serbian goodwill and trade names.
Underlying operating profit
Underlying operating profit decreased by 22.0% at actual exchange rates and by 18.7% at identical exchange rates. The decline was mainly driven by the bonus reversal in the U.S. last year and the gross margin decline. Underlying operating margin was 3.3% of revenues compared to 4.2% in the third quarter of 2012.
Underlying EBITDA
Underlying EBITDA decreased by 15.4% at actual exchange rates and 12.0% at identical exchange rates. Group EBITDA decreased by 15.2% at actual exchange rates and 12.0% at identical exchange rates.
Operating profit (loss)
Operating profit declined from€226 million last year to a€20 million loss this year mainly as a result of a lower underlying operating profit and the€199 million impairment charges.
Net financial expenses
Net financial expenses decreased to€47 million compared to€53 million last year. The lower finance costs result primarily from a lower average interest cost on lower outstanding debt and lower finance lease interest due to store closings.
Income tax
During the third quarter of 2013 the effective tax rate was negative by 18.1%, which is largely reflective of the non-deductible goodwill impairment charge at Maxi.
Net profit (loss) from continuing operations
Net profit from continuing operations declined from€193 million last year to a€78 million loss in this year´s third quarter. This resulted in a basic loss of€0.80 earnings per share compared to basic earnings per share of€1.91 in the third quarter of 2012.
Result from discontinued operations (net of tax)
The result from discontinued operations net of tax was a€6 million loss compared to a€2 million loss in the third quarter of last year mainly due to a€11 million impairment loss related to the planned divestiture of our operations in Montenegro.
| Delhaize Group – Earnings Release – Third Quarter 2013 | 2 of 25 | |||||
Net profit (loss)
Group share in net result amounted to a€87 million loss. Basic and diluted net loss per share was€0.86 and€0.85 respectively, compared to a profit of respectively€1.88 and€1.87 in the third quarter of 2012.
» Year-to-Date 2013 Income Statement
Revenues
In the first nine months of 2013, Delhaize Group’s revenues increased by 0.7% and 2.5% at actual and identical exchange rates, respectively. Organic revenue growth was 3.0%.
In the U.S., revenue growth in local currency was +1.6% (excluding the revenues from Sweetbay, Harveys and Reid´s pending their planned divestiture) including a 0.1% positive calendar impact. Excluding the impact from the store closures announced in early 2012 and 2013, revenues in local currency increased by 2.5%. U.S. comparable store sales growth was +1.8% (+1.9% including the 0.1% positive calendar effect). Revenues at Delhaize Belgium increased by 3.2% and comparable store sales growth was +1.6% (+1.5% including a -0.1% calendar impact). Revenues in Southeastern Europe grew by 5.1% at identical exchange rates.
Gross margin
Gross margin was 24.3% of revenues, a decrease of 4 basis points at identical exchange rates. Price investments and promotional activity across the Group were almost fully offset by better supplier terms, Bottom Dollar Food’s improved results and lower shrink at Delhaize America.
Other operating income
Other operating income was€95 million and increased by€8 million compared to last year.
Selling, general and administrative expenses
Selling, general and administrative expenses (SG&A) were 21.3% of revenues or flat compared to the first nine months of last year at identical exchange rates.
Other operating expenses
Other operating expenses were€242 million compared to€148 million last year, which is mainly the result of the impairment charges related to the Serbian goodwill and trade names, partly offset by lower store closing charges compared to last year.
Underlying operating profit
Underlying operating profit decreased by 3.1% at actual exchange rates and by 1.2% at identical exchange rates. The decline was driven by the decrease of our U.S. underlying operating profit resulting from the release of the bonus accrual in the third quarter of last year. Underlying operating margin was 3.6% of revenues compared to 3.8% in the first nine months of 2012.
Underlying EBITDA
Underlying EBITDA decreased by 2.7% at actual exchange rates and 0.9% at identical exchange rates. Group EBITDA increased by 10.7% at actual exchange rates and 12.7% at identical exchange rates.
Operating profit
Operating profit decreased from€424 million to€330 million due to the lower underlying operating profit and the impairment charges which were partially offset by lower store closing charges.
Net financial expenses
Net financial expenses decreased by 9.0% to€142 million compared to€156 million last year. The lower finance costs result primarily from a lower average interest cost on lower outstanding debt and less finance lease interest as a result of store closings.
Income tax
During the first nine months of 2013, the effective tax rate was 34.3%, compared to approximately zero last year. Last year’s tax rate was close to zero because of the positive impact of the resolution of several tax matters in the U.S., while in 2013 the rate is negatively impacted by the non-deductible goodwill impairment charge at Maxi.
Net profit from continuing operations
Net profit from continuing operations was€126 million in the first nine months of 2013 compared to€275 million in 2012. This resulted in€1.22 basic earnings per share compared to€2.73 last year.
Result from discontinued operations (net of tax)
The result from discontinued operations net of tax was a loss of€45 million compared to a loss of€1 million last year. This year’s loss is mainly related to€50 million of store closing expenses which we recorded as a result of
| Delhaize Group – Earnings Release – Third Quarter 2013 | 3 of 25 | |||||
the decision to close 34 Sweetbay stores in January and to the€11 million impairment charge related to Montenegro.
Net profit
Group share in net profit amounted to€78 million in the first nine months of 2013. Basic and diluted net profit per share were both€0.77 compared to€2.71 in 2012.
» Year-to-date 2013 Cash Flow Statement and Balance Sheet
Free cash flow
Free cash flow rose to€463 million in the first nine months of 2013 compared to€326 million in the first nine months of last year. This is mainly explained by continued capital expenditures discipline and lower payments of interest and taxes partially offset by higher EBITDA.
Net debt
The net debt to equity ratio was 33.6% at the end of the third quarter compared to 39.9% at the end of 2012. Net debt decreased by€377 million to€1.7 billion mainly as a result of the€463 million free cash flow generation, which was partially offset by the dividend payment.
| Delhaize Group – Earnings Release – Third Quarter 2013 | 4 of 25 | |||||
» Segment Information (at actual exchange rates)
| Q3 | Revenues | Underlying Operating Margin(3) | Underlying Operating Profit/(Loss) (3) | |||||||||||||||
| (in millions) | Q3 2013 | Q3 2012 | 2013 /2012 | Q3 2013 | Q3 2012 | Q3 2013 | Q3 2012 | 2013 /2012 | ||||||||||
United States(1) | $ | 4 396 | 4 299 | +2.2% | 3.9% | 4.9% | 169 | 213 | -20.2% | |||||||||
United States(1) | € | 3 320 | 3 436 | -3.4% | 3.9% | 4.9% | 128 | 169 | -24.2% | |||||||||
Belgium | € | 1 255 | 1 203 | +4.3% | 2.6% | 3.5% | 33 | 42 | -20.5% | |||||||||
Southeastern Europe(2) | € | 764 | 730 | +4.9% | 3.2% | 2.9% | 25 | 20 | +18.8% | |||||||||
Corporate | € | - | - | N/A | N/A | N/A | (10) | (6) | -64.3% | |||||||||
TOTAL | € | 5 339 | 5 369 | -0.5% | 3.3% | 4.2% | 176 | 225 | -22.0% | |||||||||
| YTD | Revenues | Underlying Operating Margin(3) | Underlying Operating Profit/(Loss)(3) | |||||||||||||||
| (in millions) | YTD 2013 | YTD 2012 | 2013 /2012 | YTD 2013 | YTD 2012 | YTD 2013 | YTD 2012 | 2013 /2012 | ||||||||||
United States(1) | $ | 12 826 | 12 623 | +1.6% | 4.0% | 4.2% | 511 | 527 | -2.9% | |||||||||
United States(1) | € | 9 738 | 9 856 | -1.2% | 4.0% | 4.2% | 388 | 411 | -5.6% | |||||||||
Belgium | € | 3 736 | 3 619 | +3.2% | 3.9% | 4.0% | 147 | 144 | +2.2% | |||||||||
Southeastern Europe(2) | € | 2 296 | 2 181 | +5.3% | 2.8% | 2.8% | 64 | 61 | +4.8% | |||||||||
Corporate | € | - | - | N/A | N/A | N/A | (28) | (27) | -5.3% | |||||||||
TOTAL | € | 15 770 | 15 656 | +0.7% | 3.6% | 3.8% | 571 | 589 | -3.1% | |||||||||
| (1) | The segment “United States” includes the banners Food Lion, Hannaford and Bottom Dollar Food. Sweetbay, Harveys and Reid´s are included in discontinued operations given their planned divestiture. |
| (2) | The segment “Southeastern Europe” includes our operations in Greece, Serbia, Romania, Bulgaria and Bosnia and Herzegovina. Our operations in Indonesia are accounted for under the equity method and no longer form part of this segment. Montenegro is now included in discontinued operations given its planned divestiture. |
| (3) | For a definition of underlying operating profit, please refer to the “Definitions” page of this document. A reconciliation with reported operating profit is provided on page 13 of this document. |
United States
In the third quarter of 2013, revenues in the U.S. increased by 2.2% to $4.4 billion (€3.3 billion). Excluding the impact of the 11 stores closed in February 2013, U.S. revenues increased by 2.6%. Comparable store sales growth was +2.2%. While we experienced low retail inflation (+0.5%), volume growth was positive for the fourth consecutive quarter. This was driven by volume growth at both Food Lion and Hannaford. At Food Lion, we are launching Phase 5 on November 13, 2013 in the seaboard North and South Carolina markets, which will complete the Phase repositioning of our Food Lion network started in May 2011. In the third quarter we have also seen positive response to the targeted price investments which we have done earlier in the year at Hannaford.
In the third quarter of 2013, underlying operating profit decreased by 20.2% to $169 million (€128 million) resulting in an underlying operating margin of 3.9% compared to 4.9% last year. This decrease is the result of the release of the bonus accrual in the third quarter of 2012 and a lower gross margin due to Hannaford and Phase 4 price investments.
On May 28, 2013, Delhaize Group reached an agreement with Bi-Lo Holdings on the divestiture of Sweetbay, Harveys, Reid’s (in total 155 stores), and the leases of 10 previous Sweetbay locations. We now expect the transaction to be completed during the first quarter of 2014 rather than in the fourth quarter of 2013 as announced previously.
Belgium
In the third quarter of 2013, revenues in Belgium were€1.3 billion, an increase of 4.3% compared to 2012, with comparable store sales growth of +1.5% (or +3.4% including a positive calendar impact of 1.9%). Retail inflation (+2.4%) and network expansion continued to be the most important revenue drivers. While we maintained market share in the third quarter, our gross margin decreased due to price investments and promotions in order to deal with a more competitive market.
In the third quarter of 2013, underlying operating profit decreased by 20.5% to€33 million as a result of investments in prices and promotions and slightly higher SG&A costs.
| Delhaize Group – Earnings Release – Third Quarter 2013 | 5 of 25 | |||||
Southeastern Europe
In the third quarter of 2013, revenues in Southeastern Europe increased by 4.9% to€764 million at actual rates (+3.9% at identical exchange rates). The growth was mainly the result of store expansion and positive comparable store sales growth in Romania and Greece. In Greece, we had positive growth in terms of transactions and items sold. Our revenues in Serbia were impacted by negative volume growth, only partly offset by high inflation. As a result of revenue and profitability growth being below our expectations at Maxi, in a worsening economic environment, we recorded€195 million of impairment charges on goodwill and trade names.
In the third quarter of 2013, underlying operating profit increased by 18.8% to€25 million, and underlying operating margin increased from 2.9% to 3.2%.
On July 11, 2013, Delhaize entered into an agreement to divest its operations in Montenegro to Expo Holdings. The closing of the transaction is expected during the fourth quarter.
Corporate
In the third quarter of 2013, Corporate expenses increased from€6 million to€10 million mainly as a result of severance payments and IT related expenses.
» 2013 Outlook
We are confirming our 2013 underlying operating profit guidance of at least€755 million at identical exchange rates compared to€785 million in 2012. Both amounts exclude the activities of Sweetbay, Harveys, Reid´s and in Montenegro.
We expect our net finance costs to decline from€230 million to approximately€200 million (at identical exchange rates). In addition, we expect capital expenditures of approximately€650 million (excluding leases and at identical exchange rates) and plan to open 200 new stores for the year, mostly in Southeastern Europe. Finally, we target to generate approximately€500 million of free cash flow in 2013.
» Conference Call and Webcast
Delhaize Group’s management will comment on the third quarter 2013 results during a conference call starting November 7, 2013 at 09:00 am CET / 03:00 am ET. The conference call can be attended by calling +44 (0)20 3427 1910 (U.K.), +1 646 254 3363 (U.S.) or +32 2 620 0138 (Belgium), with “Delhaize” as password. The conference call will also be broadcast live over the internet athttp://www.delhaizegroup.com. An on-demand replay of the webcast will be available after the conference call athttp://www.delhaizegroup.com.
» Delhaize Group
Delhaize Group is a Belgian international food retailer present in ten countries on three continents. At the end of the third quarter of 2013, Delhaize Group’s sales network consisted of 3 488 stores. In 2012, Delhaize Group posted€21.0 billion ($27.0 billion) in revenues and€104 million ($134 million) in net profit (Group share). At the end of 2012, Delhaize Group employed approximately 158 000 people. Delhaize Group’s stock is listed on NYSE Euronext Brussels (DELB) and the New York Stock Exchange (DEG).
This press release is available in English, French and Dutch. You can also find it on the websitehttp://www.delhaizegroup.com. Questions can be sent toinvestor@delhaizegroup.com.
» Financial Calendar
| — Press release – 2013 fourth quarter and full year revenues | January 23, 2014 | |
— Press release – 2013 fourth quarter and full year results | March 13, 2014 | |
— Press release – 2014 first quarter results | May 7, 2014 | |
— Press release – 2014 second quarter results | August 7, 2014 | |
— Press release – 2014 third quarter results | November 6, 2014 |
» Contacts
Investor Relations: + 32 2 412 2151
Media Relations: + 32 2 412 8669
| Delhaize Group – Earnings Release – Third Quarter 2013 | 6 of 25 | |||||
DELHAIZE GROUP CONDENSED CONSOLIDATED FINANCIAL STATEMENTS
» Condensed Consolidated Balance Sheet (Unaudited)
| (in millions of€) | September 30, 2013 | December 31, 2012 | September 30, 2012 | |||
Assets | ||||||
Non-current assets | 7 963 | 8 725 | 9 094 | |||
Goodwill | 3 007 | 3 189 | 3 375 | |||
Intangible assets | 741 | 848 | 872 | |||
Property, plant and equipment | 3 938 | 4 314 | 4 486 | |||
Investment property | 102 | 116 | 110 | |||
Investments accounted for using the equity method | 24 | 28 | 26 | |||
Financial assets | 31 | 30 | 33 | |||
Derivative instruments | 3 | 61 | 66 | |||
Other non-current assets | 117 | 139 | 126 | |||
Current assets | 3 483 | 3 192 | 2 832 | |||
Inventories | 1 357 | 1 391 | 1 515 | |||
Receivables and other assets | 705 | 770 | 796 | |||
Financial assets | 153 | 93 | 96 | |||
Derivative instruments | 28 | - | - | |||
Cash and cash equivalents | 959 | 920 | 375 | |||
Assets classified as held for sale | 281 | 18 | 50 | |||
Total assets | 11 446 | 11 917 | 11 926 | |||
Liabilities | ||||||
Total equity | 5 042 | 5 188 | 5 427 | |||
Shareholders’ equity | 5 037 | 5 186 | 5 422 | |||
Non-controlling interests | 5 | 2 | 5 | |||
Non-current liabilities | 3 474 | 3 948 | 3 949 | |||
Long-term debt | 2 038 | 2 313 | 2 275 | |||
Obligations under finance lease | 509 | 612 | 638 | |||
Deferred tax liabilities | 468 | 568 | 557 | |||
Derivative instruments | 3 | 10 | 26 | |||
Provisions | 391 | 375 | 383 | |||
Other non-current liabilities | 65 | 70 | 70 | |||
Current liabilities | 2 930 | 2 781 | 2 550 | |||
Long-term debt - current portion | 231 | 156 | 82 | |||
Obligations under finance lease | 57 | 62 | 64 | |||
Bank overdrafts | 9 | - | - | |||
Accounts payable | 1 766 | 1 869 | 1 685 | |||
Derivative instruments | 2 | 4 | - | |||
Other current liabilities | 793 | 686 | 719 | |||
Liabilities associated with assets held for sale | 72 | 4 | - | |||
Total liabilities and equity | 11 446 | 11 917 | 11 926 | |||
$ per€ exchange rate | 1.3505 | 1.3194 | 1.2930 |
| Delhaize Group – Earnings Release – Third Quarter 2013 | 7 of 25 | |||||
» Condensed Consolidated Income Statement (Unaudited)
| Q3 2013 | Q3 2012 | (in millions of€) | YTD 2013 | YTD 2012 | ||||
| 5 339 | 5 369 | Revenues | 15 770 | 15 656 | ||||
| (4 059) | (4 062) | Cost of sales | (11 941) | (11 844) | ||||
| 1 280 | 1 307 | Gross profit | 3 829 | 3 812 | ||||
| 24.0% | 24.4% | Gross margin | 24.3% | 24.4% | ||||
| 41 | 28 | Other operating income | 95 | 87 | ||||
| (1 137) | (1 111) | Selling, general and administrative expenses | (3 352) | (3 327) | ||||
| (204) | 2 | Other operating expenses | (242) | (148) | ||||
| (20) | 226 | Operating profit (loss) | 330 | 424 | ||||
| (0.4%) | 4.2% | Operating margin | 2.1% | 2.7% | ||||
| (49) | (54) | Finance costs | (149) | (174) | ||||
| 2 | 1 | Income from investments | 7 | 18 | ||||
| 1 | 1 | Share of results of joint venture equity accounted | 2 | 2 | ||||
| (66) | 174 | Profit (loss) before taxes and discontinued operations | 190 | 270 | ||||
| (12) | 19 | Income tax expense | (64) | 5 | ||||
| (78) | 193 | Net profit (loss) from continuing operations | 126 | 275 | ||||
| (6) | (2) | Result from discontinued operations, net of tax | (45) | (1) | ||||
| (84) | 191 | Net profit (loss) | 81 | 274 | ||||
| 3 | 2 | Net profit attributable to non-controlling interests | 3 | 1 | ||||
| (87) | 189 | Net profit (loss) attributable to equity holders of the Group - Group share in net profit (loss) | 78 | 273 | ||||
(in€, except number of shares) | ||||||||
Group share in net profit (loss) from continuing operations: | ||||||||
| (0.80) | 1.91 | Basic earnings per share | 1.22 | 2.73 | ||||
| (0.79) | 1.90 | Diluted earnings per share | 1.21 | 2.72 | ||||
Group share in net profit (loss): | ||||||||
| (0.86) | 1.88 | Basic earnings per share | 0.77 | 2.71 | ||||
| (0.85) | 1.87 | Diluted earnings per share | 0.77 | 2.71 | ||||
Weighted average number of shares outstanding: | ||||||||
| 101 070 323 | 100 821 177 | Basic | 100 961 569 | 100 758 443 | ||||
| 101 704 840 | 101 077 123 | Diluted | 101 554 384 | 101 114 506 | ||||
| 102 449 570 | 101 892 190 | Shares issued at the end of the period | 102 449 570 | 101 892 190 | ||||
| 101 226 721 | 100 826 751 | Shares outstanding at the end of the period | 101 226 721 | 100 826 751 | ||||
| 1.3242 | 1.2502 | Average $ per€ exchange rate | 1.3171 | 1.2808 |
| Delhaize Group – Earnings Release – Third Quarter 2013 | 8 of 25 | |||||
» Condensed Consolidated Statement of Comprehensive Income (Unaudited)
| Q3 2013 | Q3 2012 | (in millions of€) | YTD 2013 | YTD 2012 | ||||
(84) |
191 |
Net profit (loss) of the period
|
81 |
274 | ||||
| - | - | Total items that will not be reclassified to profit or loss | - | - | ||||
- | (6) | Gain (loss) on cash flow hedge | - | 3 | ||||
| - | 7 | Reclassification adjustment to net profit | - | 1 | ||||
| - | - | Tax (expense) benefit | - | (1) | ||||
| - | 1 | Gain (loss) on cash flow hedge, net of tax | - | 3 | ||||
(1) | - | Unrealized gain (loss) on financial assets available for sale | (6) | (1) | ||||
| - | - | Reclassification adjustment to net profit | - | (6) | ||||
| - | - | Tax (expense) benefit | 1 | 1 | ||||
| (1) | - | Unrealized gain (loss) on financial assets available for sale, net of tax | (5) | (6) | ||||
(120) | (98) | Exchange gain (loss) on translation of foreign operations | (93) | (80) | ||||
| - | - | Reclassification adjustment to net profit | (1) | - | ||||
(120)
| (98) | Exchange gain (loss) on translation of foreign operations | (94) | (80) | ||||
| (121) | (97) | Total items that are or may be reclassified subsequently to profit or loss | (99) | (83) | ||||
(121) | (97) | Other comprehensive income | (99) | (83) | ||||
| - | - | Attributable to non-controlling interests | - | (1) | ||||
| (121) | (97) | Attributable to equity holders of the Group | (99) | (82) | ||||
(205) | 94 | Total comprehensive income for the period | (18) | 191 | ||||
| 3 | 2 | Attributable to non-controlling interests | 3 | - | ||||
| (208) | 92 | Attributable to equity holders of the Group | (21) | 191 |
| Delhaize Group – Earnings Release – Third Quarter 2013 | 9 of 25 | |||||
» Condensed Consolidated Statement of Changes in Equity (Unaudited)
| (in millions of€, except number of shares) | Shareholders’ Equity | Non-controlling Interests | Total Equity | |||
Balances at January 1, 2013 | 5 186 | 2 | 5 188 | |||
Other comprehensive income | (99) | - | (99) | |||
Net profit | 78 | 3 | 81 | |||
Total comprehensive income for the period | (21) | 3 | (18) | |||
Capital increases | 16 | - | 16 | |||
Dividends declared | (142) | - | (142) | |||
Treasury shares purchased | (15) | - | (15) | |||
Treasury shares sold upon exercise of employee stock options | 1 | - | 1 | |||
Tax payment for restricted shares vested | (4) | - | (4) | |||
Excess tax benefit on employee stock options and restricted shares | 3 | - | 3 | |||
Share-based compensation expense | 13 | - | 13 | |||
Balances at September 30, 2013 | 5 037 | 5 | 5 042 | |||
Shares issued | 102 449 570 | |||||
Treasury shares | 1 222 849 | |||||
Shares outstanding | 101 226 721 |
| (in millions of€, except number of shares) | Shareholders’ Equity | Non-controlling Interests | Total Equity | |||
Balances at January 1, 2012 | 5 411 | 5 | 5 416 | |||
Other comprehensive income | (82) | (1) | (83) | |||
Net profit | 273 | 1 | 274 | |||
Total comprehensive income for the period | 191 | - | 191 | |||
Dividends declared | (177) | - | (177) | |||
Tax payment for restricted shares vested | (2) | - | (2) | |||
Share-based compensation expense | 9 | - | 9 | |||
Purchase of non-controlling interests | (10) | - | (10) | |||
Balances at September 30, 2012 | 5 422 | 5 | 5 427 | |||
Shares issued | 101 892 190 | |||||
Treasury shares | 1 065 439 | |||||
Shares outstanding | 100 826 751 |
| Delhaize Group – Earnings Release – Third Quarter 2013 | 10 of 25 | |||||
» Condensed Consolidated Statement of Cash Flows (Unaudited)
| Q3 2013 | Q3 2012 | (in millions of€) | YTD 2013 | YTD 2012 | ||||
Operating activities | ||||||||
| (84) | 191 | Net profit (loss) | 81 | 274 | ||||
Adjustments for: | ||||||||
| (1) | (1) | Share of results of joint venture equity accounted | (2) | (2) | ||||
| 146 | 165 | Depreciation and amortization | 454 | 486 | ||||
| 211 | 3 | Impairment | 219 | 2 | ||||
| 64 | 40 | Income taxes, finance costs and income from investments | 196 | 165 | ||||
| (2) | (10) | Other non-cash items | 11 | (7) | ||||
| (13) | 30 | Changes in operating assets and liabilities | (27) | 127 | ||||
| (24) | (33) | Interest paid | (119) | (136) | ||||
| 3 | 2 | Interest received | 10 | 8 | ||||
| (41) | (34) | Income taxes paid | (83) | (96) | ||||
| 259 | 353 | Net cash provided by operating activities | 740 | 821 | ||||
Investing activities | ||||||||
| 24 | 3 | Business acquisitions and disposals | 25 | (11) | ||||
| (147) | (168) | Purchase of tangible and intangible assets (capital expenditures) | (324) | (523) | ||||
| 6 | 7 | Sale of tangible and intangible assets | 22 | 18 | ||||
| - | - | Net investment in debt securities | (45) | (3) | ||||
| 11 | - | Net investment in term deposits | (25) | - | ||||
| - | - | Other investing activities | - | 21 | ||||
| (106) | (158) | Net cash used in investing activities | (347) | (498) | ||||
| 153 | 195 | Cash flow before financing activities | 393 | 323 | ||||
Financing activities | ||||||||
| 16 | - | Exercise of share warrants and stock options | 13 | (2) | ||||
| (15) | - | Treasury shares purchased | (15) | - | ||||
| - | (14) | Non-controlling interests purchased | - | (16) | ||||
| - | (1) | Dividends paid, including dividends paid by subsidiaries to non-controlling interests | (142) | (180) | ||||
| (15) | (12) | Borrowings under (repayments of) long-term loans, net of direct financing costs | (200) | (114) | ||||
| - | (103) | Borrowings under (repayments of) short-term loans, net | - | (60) | ||||
| - | - | Settlement of derivative instruments | (1) | 1 | ||||
| (14) | (130) | Net cash used in financing activities | (345) | (371) | ||||
| (22) | (10) | Effect of foreign currency translation | (16) | 4 | ||||
| 117 | 55 | Net increase (decrease) in cash and cash equivalents | 32 | (44) | ||||
| 836 (3) | 320 | Cash and cash equivalents at beginning of period | 921 (1) | 419 | ||||
| 953 (2) | 375 | Cash and cash equivalents at end of period | 953 (2) | 375 |
| 1. | Includes €1 million in assets classified as held for sale |
| 2. | Includes €3 million in assets classified as held for sale, net of €9 million bank overdrafts |
| 3. | Includes €2 million in assets classified as held for sale |
| Delhaize Group – Earnings Release – Third Quarter 2013 | 11 of 25 | |||||
» Selected Explanatory Notes
General information
Delhaize Group is a Belgian international food retailer with operations in ten countries on three continents. The Company’s stock is listed on NYSE Euronext Brussels (DELB) and the New York Stock Exchange (DEG).
The condensed consolidated interim financial statements of the Group for the nine months ended September 30, 2013 were authorized for issue by the Board of Directors on November 6, 2013.
This interim report only provides an explanation of events and transactions that are significant to an understanding of the changes in financial position and reporting since the last annual reporting period, and should therefore be read in conjunction with the consolidated financial statements for the financial year ended on December 31, 2012.
Basis of presentation and accounting policies
These condensed consolidated interim financial statements have been prepared in accordance with International Accounting Standard (IAS) 34Interim Financial Reporting, as issued by the International Accounting Standards Board (IASB), and as adopted by the European Union (EU).
The condensed consolidated interim financial statements are presented in millions of euros, the Group’s presentation currency, except where stated otherwise.
The accounting policies adopted are consistent with those of the previous financial year except for the following new, amended or revised IASB pronouncements that have been adopted as of January 1, 2013:
| — | Amendments to IAS 1Presentation of Items of Other Comprehensive Income; |
| — | Amendments to IAS 19Employee Benefits; |
| — | Amendments to IFRS 7Disclosures – Offsetting Financial Assets and Financial Liabilities; |
| — | Improvements to IFRS (issued May 2012); |
| — | IFRS 10Consolidated Financial Statementsand amendments to IAS 27 Separate Financial Statements; |
| — | IFRS 11Joint Arrangementsand amendments to IAS 28Investments in Associates and Joint Ventures; |
| — | IFRS 12 Disclosures of Interests in Other Entities; and |
| — | IFRS 13Fair Value Measurements. |
The initial application of these new, amended or revised pronouncements did not have a material impact on the Group and comparative information has been revised to reflect the initial application of (i) the revised IAS 19 and (ii) IFRS 11. For more detail, see Note 2.5 to the Delhaize Group 2012 consolidated financial statements.
Delhaize Group did not early adopt any new IFRS standards or interpretations which were issued but not yet effective as of the balance sheet date.
| Delhaize Group – Earnings Release – Third Quarter 2013 | 12 of 25 | |||||
Segment reporting
| Q3 | Revenues | Operating Margin | Operating Profit/(Loss) | |||||||||||||||
| (in millions) | Q3 2013 | Q3 2012 | 2013 /2012 | Q3 2013 | Q3 2012 | Q3 2013 | Q3 2012 | 2013 /2012 | ||||||||||
United States(1) | $ | 4 396 | 4 299 | +2.2% | 3.6% | 4.9% | 157 | 212 | -25.7% | |||||||||
United States(1) | € | 3 320 | 3 436 | -3.4% | 3.6% | 4.8% | 119 | 166 | -28.6% | |||||||||
Belgium | € | 1 255 | 1 203 | +4.3% | 2.8% | 3.5% | 35 | 42 | -15.2% | |||||||||
Southeastern Europe(2) | € | 764 | 730 | +4.9% | (21.3%) | 3.4% | (163) | 24 | N/A | |||||||||
Corporate | € | - | - | N/A | N/A | N/A | (11) | (6) | -73.4% | |||||||||
TOTAL | € | 5 339 | 5 369 | -0.5% | (0.4%) | 4.2% | (20) | 226 | -108.8% | |||||||||
| YTD | Revenues | Operating Margin | Operating Profit/(Loss) | |||||||||||||||
| (in millions) | YTD 2013 | YTD 2012 | 2013 /2012 | YTD 2013 | YTD 2012 | YTD 2013 | YTD 2012 | 2013 /2012 | ||||||||||
United States(1) | $ | 12 826 | 12 623 | +1.6% | 3.5% | 2.6% | 454 | 332 | +36.9% | |||||||||
United States(1) | € | 9 738 | 9 856 | -1.2% | 3.5% | 2.6% | 345 | 259 | +33.1% | |||||||||
Belgium | € | 3 736 | 3 619 | +3.2% | 3.9% | 4.0% | 146 | 145 | +0.9% | |||||||||
Southeastern Europe(2) | € | 2 296 | 2 181 | +5.3% | (5.6%) | 2.2% | (128) | 47 | N/A | |||||||||
Corporate | € | - | - | N/A | N/A | N/A | (33) | (27) | -22.2% | |||||||||
TOTAL | € | 15 770 | 15 656 | +0.7% | 2.1% | 2.7% | 330 | 424 | -22.2% | |||||||||
| (1) | The segment “United States” includes the banners Food Lion, Hannaford and Bottom Dollar Food. Sweetbay, Harveys and Reid´s are included in discontinued operations given their planned divestiture and are reflected as such in the Group’s internal reporting to the Chief Operating Decision Maker (CODM). Comparative information has been represented accordingly. |
| (2) | The segment “Southeastern Europe” includes our operations in Greece, Serbia, Romania, Bulgaria and Bosnia and Herzegovina. Our operations in Indonesia are accounted for under the equity method and are reflected as such in the Group’s internal reporting to the CODM and therefore no longer form part of this segment. Our operations in Montenegro are included in discontinued operations given their planned divestiture. Comparative information has been represented accordingly. |
Business combinations and acquisition of non-controlling interests
During the first nine months of 2013, Delhaize Group entered into some small business acquisition agreements in Southeastern Europe. The total cash consideration transferred was€4 million (of which€1 million in the third quarter) and resulted in an increase of goodwill of€1 million. No acquisition of non-controlling interests took place during the first nine months of 2013.
In the third quarter of 2013, Delhaize Group reached an agreement with the former owner of Delta Maxi to settle all remaining indemnification assets for€22 million in cash.
In February 2013, Delhaize Group launched a tender offer to acquire 16% non-controlling interests in C-Market (Serbian subsidiary), held by the Serbian Privatization Agency, at a price of€300 per share. In early April 2013, the Serbian Privatization Agency informed the Group about its decision to temporarily suspend the privatization procedures of C-Market, due to a probe into the entity´s earlier privatization. Early October 2013, this suspension was extended by an additional 180 business days due to a prolongation of an ongoing investigation of the entity´s original public offering on the Belgrade Stock Exchange in 2005. Neither the Group nor the current privatization process are target of these investigations. As the tender offer did not close at September 30, 2013, Delhaize Group continues to own 75.4% of C-Market.
| Delhaize Group – Earnings Release – Third Quarter 2013 | 13 of 25 | |||||
Divestitures and discontinued operations
Divestitures
In the first nine months of 2013, Delhaize Group converted several of its Belgian company-operated City stores into affiliated Proxy stores, operated by independent third-parties. Delhaize Group received a total cash consideration of€7 million (of which€4 million in the third quarter), and recognized a gain of approximately€6 million (of which€3 million in the third quarter), classified as “Other operating income.”
Disposal groups and assets held for sale
Albania
In February 2013, Delhaize Group completed the sale of its Albanian activities (“Delhaize Albania”) for a sales price of€1 million. The assets and liabilities of Delhaize Albania, that was part of the previously called “Southeastern Europe & Asia” segment had been presented as “held for sale” as of December 31, 2012 and the operating results of the Albanian company in previous years as well as the gain of€1 million realized on the sale were classified as “Results from discontinued operations” in the income statement.
Sweetbay, Harveys and Reid’s
On May 27, 2013, Delhaize Group signed an agreement with Bi-Lo Holdings to divest its Sweetbay, Harveys, and Reid´s operations for a total sales price of $265 million (€196 million) in cash, subject to customary adjustments.
Assets and liabilities relating to these operations (being part of the “United States” segment) are classified as a disposal group held for sale, including the leases of ten previously closed Sweetbay locations but excluding Sweetbay’s distribution center, which is not part of the agreement and currently does not meet the IFRS 5 requirements for classification as held for sale. The transaction also meets the definition of discontinued operations. Consequently, the relevant profit or loss after tax has been classified as “Result of discontinued operations”, with comparative information being re-presented.
The transaction is expected to be completed in the first quarter of 2014 and is subject to regulatory approval as well as customary closing conditions. In 2012, the 165 stores included in the transaction generated revenues of approximately $1.8 billion.
Delhaize Montenegro
On July 11, 2013, Delhaize Group announced the planned sale of its Montenegrin operations to Expo Commerce, for a total sales price of€5 million, subject to customary adjustments. In the third quarter of 2013, the Group classified the related assets and liabilities as a disposal group held for sale. This component of the Group also meets the requirements of discontinued operations and therefore, the profit or loss after tax relating to our operations in Montenegro has been classified as “Result of discontinued operations” and comparative information re-presented.
The transaction is expected to close in the fourth quarter of 2013 and is subject to regulatory approval.
At September 30, 2013, the carrying value of assets classified as assets held for sale and associated liabilities related to the disposal of Sweetbay, Harveys and Reid’s as well as Delhaize Montenegro were as follows:
(in millions of€) | September 30, 2013 | |||
Intangible assets | 13 | |||
Property, plant and equipment | 171 | |||
Inventories | 76 | |||
Receivables and other assets | 6 | |||
Cash and cash equivalents | 3 | |||
|
| |||
Assets classified as held for sale | 269 | |||
Less: | ||||
Obligations under finance lease | (54) | |||
Accounts payable and accrued expenses | (18) | |||
|
| |||
Assets classified as held for sale, net of associated liabilities | 197 | |||
In addition, Delhaize Group has identified a number of individual properties, mainly small shops, office buildings, pharmacies or bank branches, which it considers not incremental to its retail operations. The carrying value of these assets held for sale amounts to€12 million at September 30, 2013, of which€8 million in the U.S. and€4 million in the “Southeastern Europe” segment.
| Delhaize Group – Earnings Release – Third Quarter 2013 | 14 of 25 | |||||
Discontinued operations
The “Result from discontinued operations” and corresponding net cash flows of the entities classified as discontinued operations are summarized as follows:
(in millions of€, except per share information) | YTD 2013 | YTD 2012(1) | ||||||||||
Revenues | 1 038 | 1 227 | ||||||||||
Cost of sales | (759) | (891) | ||||||||||
Other operating income | 9 | 5 | ||||||||||
Selling, general and administrative expenses | (260) | (327) | ||||||||||
Other operating expenses | (72) | (1) | ||||||||||
Finance costs (2) | (10) | (10) | ||||||||||
|
|
|
| |||||||||
Result before tax | (54) | 3 | ||||||||||
Income taxes | 20 | (4) | ||||||||||
|
|
|
| |||||||||
Result of discontinued operations (net of tax) | (34) | (1) | ||||||||||
Pre-tax loss recognized on re-measurement of assets of disposal groups | (11) | - | ||||||||||
Income taxes | - | - | ||||||||||
|
|
|
| |||||||||
Result from discontinued operations (net of tax), fully attributable to equity holders of the Group | (45) | (1) | ||||||||||
Basic earnings per share from discontinued operations | (0.45) | (0.01) | ||||||||||
Diluted earnings per share from discontinued operations | (0.44) | (0.01) | ||||||||||
Operating cash flows | 2 | 1 | ||||||||||
Investing cash flows | (4) | (10) | ||||||||||
Financing cash flows | 16 | (8) | ||||||||||
|
|
|
| |||||||||
Total cash flows | 14 | (17) | ||||||||||
(1) 2012 includes the Albanian operations. (2) Including a gain of€1 million realized on the sale of Albania in 2013. |
| |||||||||||
In January 2013, the Group recognized store closing expenses in connection with the closing of 34 stores for a total amount of€65 million, as part of a single plan to cease Sweetbay’s operations in 2013. These costs were reclassified in the second quarter of 2013 into result of discontinued operations (see also below “Other operating expenses”). It is expected that Bi-Lo will acquire ten of the previously closed locations. Consequently, store closing expenses of€15 million were reversed, resulting in net store closing expenses of€50 million included in other operating expenses above. In addition, Delhaize Group recognized onerous lease contract expenses, severance costs and impairment charges relating to headquarters and distribution centers that are impacted by the planned transaction for a total amount of€13 million and incurred cost to sell of€7 million.
The Group recognized an impairment loss of€11 million to write down the carrying value of Delhaize Montenegro to its estimated fair value less cost to sell.
| Delhaize Group – Earnings Release – Third Quarter 2013 | 15 of 25 | |||||
» Balance Sheet and Cash Flow Statement
Goodwill and intangible assets
During the third quarter of 2013, the general economic situation in Serbia worsened significantly, impacting the Groups short- to mid-term expectations for its Serbian operations and resulting in an impairment indicator. Consequently, Delhaize Group performed an impairment review of its Serbian trade names and goodwill. The Group also identified impairment indicators with respect to the trade names recognized in Bulgaria.
As a result of the above, the Group recognized impairment charges of a total amount of€195 million, which can be detailed as follows:
(in millions of€) | Impairment recognized | Carrying value after impairment | ||||||
Serbia | ||||||||
Goodwill | 124 | 194 | ||||||
Trade names | 67 | 84 | ||||||
Bulgaria | ||||||||
Trade names | 4 | 10 | ||||||
|
|
|
| |||||
Total impairment | 195 | 288 | ||||||
The Group continues to expect to achieve significant growth in Serbia and therefore, consistently with the year-end valuation, determined the recoverable amount based on a Fair Value Less Cost to Sell (FVLCTS) calculation. The key assumptions applied were as follows:
| Perpetual Growth Rate | Pre-Tax discount rate | |||||||
Serbia | 2.8 | % | 15.0 | % | ||||
Delhaize Group estimated that a decrease in growth rate by 50 basis points, keeping all other constant, would further decrease the FVLCTS by€16 million. An increase of the discount rate by 100 basis points, keeping all other constant, would decrease the FVLCTS by€45 million. A simultaneous increase in the discount rate and decrease in growth rate by the before mentioned amounts would result in the carrying value of Serbia exceeding the FVLCTS by an additional€59 million. Alternatively, a reduction in the total projected future cash flows by 10%, keeping all other constant, would result in the carrying amount of Serbia exceeding the FVLCTS by an additional€48 million.
The recoverable amount of the trade names has been estimated using the royalty-relief-method. Royalty rates for the various brands range from 0.54% (Piccadilly) to 1.20% (Maxi), depending on the individual local strength of the different brands. Revenue growth and discount rates are consistent with the goodwill impairment testing. The Group decided to retire its Mini Maxi and Piccadilly Express brands and is converting these stores into a new format and therefore fully impaired these trade name.
Impairment losses are recognized in profit or loss in “Other operating expenses.”
Capital expenditures
During the first nine months of 2013, Delhaize Group incurred capital expenditures of€324 million, consisting of€270 million in property, plant and equipment and€54 million in intangible assets. In the third quarter of 2013, the Group incurred capital expenditures of€147 million, consisting of€127 million in property, plant and equipment and€20 million in intangible assets.
In addition, the Group added property under finance leases in the third quarter of 2013 for a total amount of€1 million. The carrying amount of tangible and intangible assets that were sold or disposed in the first nine months of 2013 was€20 million (€7 million for the third quarter of 2013).
| Delhaize Group – Earnings Release – Third Quarter 2013 | 16 of 25 | |||||
Equity
In the third quarter of 2013, Delhaize Group issued 528 072 new shares and purchased 328 924 of its own shares (none in the first half of 2013).
In the first nine months of 2013, Delhaize Group used 150 210 treasury shares (35 523 during the third quarter of 2013) satisfying mainly the vesting of restricted stock units that were granted as part of the share-based incentive plans. At September 30, 2013, the Group owned 1 222 849 treasury shares.
Dividends
At Delhaize Group’s shareholders’ meeting on May 23, 2013, Delhaize Group’s shareholders approved the distribution of a€1.40 gross dividend per share for financial year 2012. After deduction of a 25% withholding tax, this resulted in a net dividend of€1.05 per share. The 2012 dividend became payable to owners of Delhaize Group’s ordinary shares on May 31, 2013 and to owners of Delhaize Group ADRs (American Depository Receipts) on June 5, 2013 and was subsequently paid.
Financial instruments
In May 2013,€80 million bonds issued by Delhaize Group’s subsidiary Alfa Beta matured and were repaid.
On January 3, 2013, Delhaize Group redeemed the remaining $99 million of the $300 million 5.875% senior notes due 2014, as well as the underlying cross-currency swap. The redemption did not have a significant impact on the 2013 results.
Financial instruments measured at fair value by fair value hierarchy:
September 30, 2013 | ||||||||||||||||
(in millions of€) | Quoted prices in active markets (Level 1) | Significant other observable inputs (Level 2) | Significant unobservable inputs (Level 3) | Total | ||||||||||||
Financial Assets | ||||||||||||||||
Non-Current | ||||||||||||||||
Financial assets – measured at fair value | 8 | 3 | - | 11 | ||||||||||||
Derivative instruments | - | 3 | - | 3 | ||||||||||||
Current | ||||||||||||||||
Financial assets – measured at fair value | 129 | - | - | 129 | ||||||||||||
Derivative instruments | - | 28 | - | 28 | ||||||||||||
|
|
|
|
|
|
|
| |||||||||
Total financial assets measured at fair value | 137 | 34 | - | 171 | ||||||||||||
Financial assets measured at amortized cost | 1 592 | |||||||||||||||
|
| |||||||||||||||
Total financial assets | 1 763 | |||||||||||||||
Financial Liabilities | ||||||||||||||||
Non-Current | ||||||||||||||||
Derivative instruments | - | 3 | - | 3 | ||||||||||||
Current | ||||||||||||||||
Derivative instruments | - | 2 | - | 2 | ||||||||||||
|
|
|
|
|
|
|
| |||||||||
Total financial liabilities measured at fair value | - | 5 | - | 5 | ||||||||||||
Financial liabilities being part of a fair value hedge relationship | 538 | |||||||||||||||
Financial liabilities measured at amortized cost | 4 072 | |||||||||||||||
|
| |||||||||||||||
Total financial liabilities | 4 615 | |||||||||||||||
During the period there was no transfer between fair value hierarchy levels and there were no changes in the valuation techniques applied.
Fair value of financial instruments not measured at fair value:
(in millions of€) | Carrying amount | Fair value | ||||||
Long-term debt | ||||||||
Financial liabilities being part of a fair value hedge relationship | 538 | 557 | ||||||
Financial liabilities at amortized cost | 1 731 | 2 039 | ||||||
|
|
|
| |||||
Total long-term debt | 2 269 | 2 596 | ||||||
| Delhaize Group – Earnings Release – Third Quarter 2013 | 17 of 25 | |||||
The fair value of the receivables, other financial assets, cash and cash equivalent and accounts payable, all measured at amortized cost, approximate their carrying amounts.
Employee benefits
In May 2013, Delhaize Group granted 122 364 performance shares, 72 305 restricted stock unit awards and 368 139 warrants to senior management of its U.S. operating companies under the “Delhaize Group 2012 Stock Incentive Plan.” The fair value for the performance shares and restricted stock unit awards was $64.75 based on the share price at the grant date. As from 2013, the vesting scheme of restricted stock units has been changed into a cliff vesting after 3 years (instead of the previous vesting scheme with vesting over a five-year period starting at the end of the second year following the grant date). The cliff-vesting of the performance shares is linked to the achievement of a non-market financial performance condition (Return on Invested Capital (ROIC) targets over a cumulative 3-years period) which is taken into account when estimating the number of awards that will vest. The warrants were granted at an exercise price of $64.75, will vest ratably over a three-year period and expire ten years from the grant date. The fair value per warrant is $10.26 and was estimated at the date of grant using the Black-Scholes-Merton model with the following assumptions:
Expected dividend yield | 3.61% | |||
Expected volatility | 27.86% | |||
Risk-free interest rate | 0.83% | |||
Expected term in years | 4.4 |
During the acceptance period which ended in July 2013, Delhaize Group issued 267 377 stock options to senior management of its non-U.S. operating companies, at an exercise price of€49.85. The options will vest over a three and a half year period and will expire seven years from the grant date. The fair value per option is calculated based on the weighted average share price over the acceptance period and is€8.43. The Black-Scholes-Merton model was used to calculate the option fair value using the following assumptions:
Expected dividend yield | 3.39% | |||
Expected volatility | 27.03% | |||
Risk-free interest rate | 0.72% | |||
Expected term in years | 6.0 |
Pension plans
Changes in the applicable labor law in Greece resulted in a decrease of the benefit that the employer is required to pay in connection with statutory indemnification payments to employees in cases of retirement or termination of employment. The amendment limits the number of relevant service years to 16 for all employees that did not exceed that number of years at the date of publication of the amended law. The revision of the defined benefit obligation based on the new legal requirements resulted in the recognition of negative past service of€3 million in the second quarter of 2013, which in accordance with the revised IAS 19 were recognized immediately in the income statement. Further, 2013 current service cost and net interest on the net defined benefit liability will decrease by approximately€1 million.
» Income Statement
Other operating income
| Q3 2013 | Q3 2012 | (in millions of€) | YTD 2013 | YTD 2012 | ||||||||
| 12 | 13 | Rental income | 37 | 37 | ||||||||
| 6 | 5 | Income from waste recycling activities | 15 | 15 | ||||||||
| 2 | 2 | Services rendered to wholesale customers | 5 | 5 | ||||||||
| 2 | 2 | Gain on sale of property, plant and equipment | 7 | 8 | ||||||||
| 3 | - | Gain on sale of business | 6 | - | ||||||||
| 16 | 6 | Other | 25 | 22 | ||||||||
| 41 | 28 | Total | 95 | 87 | ||||||||
| Delhaize Group – Earnings Release – Third Quarter 2013 | 18 of 25 | |||||
Delhaize Group converted several of its Belgian company-operated City stores into affiliated Proxy stores operated by independent third-parties, leading to a gain of€6 million classified as “Gain on sale of business” in the first nine months of 2013.
The caption “Other” contains in the third quarter of 2013, a€7 million favorable impact of a litigation settlement for which a provision had been recorded during the purchase price allocation of Delta Maxi and a€4 million reversal of legal provisions in Serbia.
Other operating expenses
| Q3 2013 | Q3 2012 | (in millions of€) | YTD 2013 | YTD 2012 | ||||||||
| (3) | 6 | Store closing expenses | (9) | (127) | ||||||||
| - | - | Reorganization expenses | (16) | - | ||||||||
| (199) | (2 | ) | Impairment | (201) | (2) | |||||||
| (2) | (2 | ) | Loss on sale of property, plant and equipment | (13) | (9) | |||||||
| - | - | Other | (3) | (10) | ||||||||
| (204) | 2 | Total | (242) | (148) | ||||||||
On January 17, 2013, Delhaize Group announced the decision to close 52 stores, 45 stores in the U.S. (34 Sweetbay, 8 Food Lion and 3 Bottom Dollar Food), 6 stores in Southeastern Europe and 1 store in Belgium, which resulted in store closing expenses of€74 million in the first quarter of 2013. Following the announcement of the planned divesture of Sweetbay,€15 million were reversed and€50 million were reclassified in the second quarter into “Result of discontinued operations” (see also “Discontinued operations” above). Total store closing expenses for the first nine months of 2013 amount to€9 million.
In the first quarter of 2013, the Group also recorded€16 million reorganization charges related to the severance of support services senior management and employees in the U.S.
During the third quarter of 2013, Delhaize Group recognized impairment charges of€199 million, of which€124 million related to the goodwill of Serbia,€67 million for the trade names in Serbia,€4 million in connection with the Piccadilly brands in Bulgaria and€4 million for several US assets.
Income taxes
During the first nine months of 2013, the effective tax rate was 34.3%, compared to previous year’s negative rate of 1.7%. Last year’s tax rate was negative due to the positive impact of the resolution of several tax matters in the U.S, while in 2013 the rate was significantly impacted by the non-deductible goodwill impairment charges.
Related party transactions
In May 2013, an aggregate number of 131 652 stock options and warrants, and 28 380 performance shares were granted to members of the Executive Management.
On May 8, 2013, the Board of Directors and the CEO of the Group, Pierre-Olivier Beckers, announced that they had reached an agreement with respect to the retirement of Mr. Beckers as the CEO of the Group by the end of 2013. Further, Michael Waller, Executive Vice President, General Council and General Secretary of the Group, retired on June 30, 2013.
Pursuant to the mutual agreement between Pierre-Olivier Beckers and the Group, and in light of Pierre-Olivier Beckers’ 30 years of employment including almost 15 years as CEO, he will receive a severance payment equaling 18 months of compensation.
As a result, the Group recognized, in the second quarter of 2013, termination benefits of€7.6 million, including a contribution to the Group’s defined contribution pension plan. In addition, the Group recognized the related social security contributions and accelerated recognition of outstanding long-term incentive grants (stock options, warrants, restricted stock units, performance shares and performance cash plans) for both Pierre-Olivier Beckers and Michael Waller.
On September 4, 2013, Roland Smith resigned as CEO of Delhaize America. Roland Smith exercised his warrants and the vesting of his restricted stock units was accelerated. He subsequently sold the shares to Delhaize Group. The Group recorded $5.5 million (€4.2 million) of termination expenses (including 18 months of compensation and accelerated recognition of stock compensation) in the third quarter of 2013.
| Delhaize Group – Earnings Release – Third Quarter 2013 | 19 of 25 | |||||
» Contingencies, Commitments and Guarantees
In April 2007, representatives of the Belgian Competition Council visited Delhaize Group’s Procurement Department in Zellik, Belgium, and requested the provision of certain documents in connection with health and beauty products and other household goods. On October 1, 2012, the Auditor to the Belgian Competition Council issued its investigation report. On September 4, 2013, Delhaize Belgium has lodged an appeal against the decision of the Auditor to the Belgian Competition Council to utilize certain documents seized during the visit of April 2007 in Zellik. The objective of this procedure currently pending in front of the Court of Appeal of Brussels is to obtain the annulation of this Auditor’s decision. Other retailers involved in the same investigation have launched a similar procedure. In the meantime the procedure pending in front of the Competition College is provisionally suspended. A decision by the Court on the merits of the appeal is not expected before the second half of 2014. Currently, and as a result of the appeal procedure, the timing of the decision of the Competition College cannot be determined.
Following the closing of Delhaize Group’s agreed sale of Sweetbay, Harveys and Reid’s, the Group will provide guarantee for a number of existing operating or finance lease contracts, which extend through 2036.
In the event of a future default of the buyer, Delhaize Group will assume the financial obligation towards the landlords. The total undiscounted minimum lease payments for the guaranteed leases, excluding other direct costs such as common area maintenance and real estate taxes, amount to $237 million (€175 million) at September 30, 2013. Currently, the Group does not expect to be required to pay any amounts under these guarantees.
Other contingencies are materially unchanged from those described in Note 34 on page 151 of the 2012 Annual Report.
» Subsequent Events
There are no material events after balance sheet date.
OTHER FINANCIAL AND OPERATING INFORMATION (UNAUDITED)
» Use of non-GAAP (Generally Accepted Accounting Principles) Financial Measures
Delhaize Group uses certain non-GAAP measures in its financial communication. Delhaize Group does not consider these measures as alternative measures to net profit or other financial measures determined in accordance with IFRS. These measures as reported by Delhaize Group may differ from similarly titled measures used by other companies. We believe that these measures are important indicators of our business performance and are widely used by investors, analysts and other interested parties. In the press release, the non-GAAP measures are reconciled to financial measures prepared in accordance with IFRS.
» Number of Stores
| End of 2012 | End of Q2 2013 | Change Q3 2013 | End of Q3 2013 | |||||
United States(1) | 1 553 | 1 507 | 1 | 1 508 | ||||
Belgium & Luxembourg | 840 | 853 | (5) | 848 | ||||
Greece | 268 | 279 | 2 | 281 | ||||
Romania | 193 | 232 | 20 | 252 | ||||
Serbia | 363 | 366 | 5 | 371 | ||||
Bulgaria | 43 | 46 | 7 | 53 | ||||
Bosnia and Herzegovina | 41 | 39 | - | 39 | ||||
Albania | 23 | - | - | - | ||||
Montenegro(2) | 24 | 25 | (2) | 23 | ||||
Indonesia | 103 | 108 | 5 | 113 | ||||
Total | 3 451 | 3 455 | 33 | 3 488 |
| (1) | Of which 155 stores held for sale |
| (2) | Held for sale (as from the third quarter of 2013) |
| Delhaize Group – Earnings Release – Third Quarter 2013 | 20 of 25 | |||||
» Organic Revenue Growth Reconciliation
| Q3 2013 | Q3 2012 | % Change | (in millions of€) | YTD 2013 | YTD 2012 | % Change | ||||||
5 339 | 5 369 | -0.5% | Revenues | 15 770 | 15 656 | +0.7% | ||||||
185 | Effect of exchange rates | 272 | ||||||||||
5 524 | 5 369 | +2.9% | Revenues at identical exchange rates | 16 042 | 15 656 | +2.5% | ||||||
- | (13) | Effect of the U.S. store portfolio optimization(1) | (5) | (89) | ||||||||
5 524 | 5 356 | +3.1% | Organic revenue growth | 16 037 | 15 567 | +3.0% |
| (1) | The organic revenue growth excludes the revenues generated by the 126 U.S. stores, which were closed in Q1 2012 as part of the portfolio optimization, and the revenues generated by the 11 stores (8 Food Lion and 3 Bottom Dollar Food) that were closed in early 2013. |
» Underlying Operating Profit
Delhaize Group believes “underlying operating profit” is a measure that, for external users of the financial statements, offers a more detailed view than “operating profit” of the operating performance of the period for the Group as it adjusts for a number of elements that management considers as non-representative of underlying operating performance.
| Q3 2013 | ||||||||||||||||||
| (in millions) | United States | United States | Belgium | SEE | Corporate | TOTAL | ||||||||||||
| $ | € | € | € | € | € | |||||||||||||
Operating profit (loss) (as reported) | 157 | 119 | 35 | (163) | (11) | (20) | ||||||||||||
Add/(substract): | ||||||||||||||||||
Store closing expenses (reversals) | 2 | 2 | - | 1 | - | 3 | ||||||||||||
Reorganization expenses (reversals) | 1 | 1 | - | - | - | 1 | ||||||||||||
Fixed assets impairment charges (reversals) | 6 | 4 | - | 195 | - | 199 | ||||||||||||
(Gains)/losses on disposal of fixed assets | - | - | - | - | - | - | ||||||||||||
(Gains)/losses on sale of business | - | - | (3) | - | - | (3) | ||||||||||||
Other | 3 | 2 | 1 | (8) | 1 | (4) | ||||||||||||
Underlying Operating Profit | 169 | 128 | 33 | 25 | (10) | 176 | ||||||||||||
| Q3 2012 | ||||||||||||||||||
| (in millions) | United States | United States | Belgium | SEE | Corporate | TOTAL | ||||||||||||
| $ | € | € | € | € | € | |||||||||||||
Operating profit (as reported) | 212 | 166 | 42 | 24 | (6) | 226 | ||||||||||||
Add/(substract): | ||||||||||||||||||
Store closing expenses (reversals) | (4) | (1) | - | (5) | - | (6) | ||||||||||||
Reorganization expenses (reversals) | - | - | - | - | - | - | ||||||||||||
Fixed assets impairment charges (reversals) | 1 | 1 | - | 1 | - | 2 | ||||||||||||
(Gains)/losses on disposal of fixed assets | - | - | - | - | - | - | ||||||||||||
(Gains)/losses on sale of business | - | - | - | - | - | - | ||||||||||||
Other | 4 | 3 | - | - | - | 3 | ||||||||||||
Underlying Operating Profit | 213 | 169 | 42 | 20 | (6) | 225 | ||||||||||||
The third quarter of 2013 was impacted by€199 million impairment charges, of which€195 million recorded in Southeastern Europe and related to goodwill and trade names (see “Goodwill and intangible assets”). The caption “Other” primarily contains a€7 million favorable impact of a litigation settlement for which a provision was recorded during the purchase price allocation of Delta Maxi, which was partly offset by€4 million termination benefits for one Executive Committee member.
In the third quarter of 2012, Delhaize Group reversed€6 million of store closing expenses and recorded€2 million impairment charges and a€3 million retirement expense for a former EC member, the latter presented in “Other.”
| Delhaize Group – Earnings Release – Third Quarter 2013 | 21 of 25 | |||||
| YTD 2013 | ||||||||||||||||||
| (in millions) | United States | United States | Belgium | SEE | Corporate | TOTAL | ||||||||||||
| $ | € | € | € | € | € | |||||||||||||
Operating profit (as reported) | 454 | 345 | 146 | (128) | (33) | 330 | ||||||||||||
Add/(substract): | ||||||||||||||||||
Store closing expenses (reversals) | 9 | 7 | - | 2 | - | 9 | ||||||||||||
Reorganization expenses (reversals) | 25 | 19 | - | - | - | 19 | ||||||||||||
Fixed assets impairment charges (reversals) | 9 | 7 | - | 194 | - | 201 | ||||||||||||
(Gains)/losses on disposal of fixed assets | - | - | 6 | (1) | 1 | 6 | ||||||||||||
(Gains)/losses on sale of business | - | - | (6) | - | - | (6) | ||||||||||||
Other | 14 | 10 | 1 | (3) | 4 | 12 | ||||||||||||
Underlying Operating Profit | 511 | 388 | 147 | 64 | (28) | 571 | ||||||||||||
| YTD 2012 | ||||||||||||||||||
| (in millions) | United States | United States | Belgium | SEE | Corporate | TOTAL | ||||||||||||
| $ | € | € | € | € | € | |||||||||||||
Operating profit (as reported) | 332 | 259 | 145 | 47 | (27) | 424 | ||||||||||||
Add/(substract): | ||||||||||||||||||
Store closing expenses (reversals) | 145 | 113 | - | 14 | - | 127 | ||||||||||||
Reorganization expenses (reversals) | - | - | - | - | - | - | ||||||||||||
Fixed assets impairment charges (reversals) | 1 | 1 | - | 1 | - | 2 | ||||||||||||
(Gains)/losses on disposal of fixed assets | 4 | 3 | (1) | (1) | - | 1 | ||||||||||||
(Gains)/losses on sale of business | - | - | - | - | - | - | ||||||||||||
Other | 45 | 35 | - | - | - | 35 | ||||||||||||
Underlying Operating Profit | 527 | 411 | 144 | 61 | (27) | 589 | ||||||||||||
The first nine months of 2013 were impacted by€201 million impairment charges,€19 million reorganization charges related to the severance of support services senior management and employees in the U.S. (primarily included in “Other operating expenses”), and€16 million Executive Committee members termination benefits, partially offset by a€5 million net impact related to favorable litigation settlement.
The first nine months of 2012 were impacted by the store portfolio optimization:€127 million store closing expenses and€23 million of related expenses, included in the caption “Other” and mainly consisting of sales price mark-downs and accelerated depreciation. In addition, the caption “Other” contains storm damage expenses of€6 million, a settlement charge of€3 million and a retirement expense of€3 million.
» EBITDA Reconciliation
| Q3 2013 | Q3 2012 | (in millions of€) | YTD 2013 | YTD 2012 | ||||
(20) | 226 | Operating profit (loss) | 330 | 424 | ||||
144 | 153 | Depreciation and amortization | 436 | 449 | ||||
199 | 2 | Impairment | 201 | 2 | ||||
323 | 381 | EBITDA | 967 | 875 | ||||
| Q3 2013 | Q3 2012 | (in millions of€) | YTD 2013 | YTD 2012 | ||||
176 | 225 | Underlying operating profit | 571 | 589 | ||||
144 | 153 | Depreciation and amortization | 436 | 449 | ||||
- | (1) | Accelerated depreciation | - | (3) | ||||
320 | 377 | Underlying EBITDA | 1 007 | 1 035 | ||||
» Free Cash Flow Reconciliation
| Q3 2013 | Q3 2012 | (in millions of€) | YTD 2013 | YTD 2012 | ||||
259 | 353 | Net cash provided by operating activities | 740 | 821 | ||||
(106) | (158) | Net cash used in investing activities | (347) | (498) | ||||
(11) | - | Net investment in debt securities and term deposits | 70 | 3 | ||||
142 | 195 | Free cash flow | 463 | 326 |
| Delhaize Group – Earnings Release – Third Quarter 2013 | 22 of 25 | |||||
» Net Debt Reconciliation
| (in millions of€, except net debt to equity ratio) | September 30, 2013 | December 31, 2012 | September 30, 2012 | |||
Non-current financial liabilities | 2 547 | 2 925 | 2 913 | |||
Current financial liabilities | 297 | 218 | 146 | |||
Derivative liabilities | 5 | 14 | 26 | |||
Derivative assets | (31) | (61) | (66) | |||
Investment in securities - non-current | (11) | (11) | (14) | |||
Investment in securities - current | (129) | (93) | (95) | |||
Term deposits - non-current | - | - | - | |||
Term deposits - current | (24) | - | - | |||
Cash and cash equivalents | (959) | (920) | (375) | |||
Net debt | 1 695 | 2 072 | 2 535 | |||
Net debt to equity ratio | 33.6% | 39.9% | 46.7% |
» Identical Exchange Rates Reconciliation
| (in millions of€, except per share amounts) | Q3 2013 | Q3 2012 | 2013/2012 | |||||||||||||||
| At Actual Rates | Impact of Exchange Rates | At Identical Rates | At Actual Rates | At Actual Rates | At Identical Rates | |||||||||||||
Revenues | 5 339 | 185 | 5 524 | 5 369 | -0.5% | +2.9% | ||||||||||||
Operating profit (loss) | (20 | ) | 7 | (13) | 226 | N/A | N/A | |||||||||||
Net profit (loss) from continuing operations | (78 | ) | 3 | (75) | 193 | N/A | N/A | |||||||||||
Basic EPS from continuing operations | (0.80 | ) | 0.04 | (0.76) | 1.91 | N/A | N/A | |||||||||||
Group share in net profit (loss) | (87 | ) | 3 | (84) | 189 | N/A | N/A | |||||||||||
Basic EPS from Group share in net profit (loss) | (0.86 | ) | 0.04 | (0.82) | 1.88 | N/A | N/A | |||||||||||
Free cash flow | 142 | 10 | 152 | 195 | -27.3% | -22.2% | ||||||||||||
| (in millions of€, except per share amounts) | YTD 2013 | YTD 2012 | 2013/2012 | |||||||||||||||
| At Actual Rates | Impact of Exchange Rates | At Identical Rates | At Actual Rates | At Actual Rates | At Identical Rates | |||||||||||||
Revenues | 15 770 | 272 | 16 042 | 15 656 | +0.7% | +2.5% | ||||||||||||
Operating profit | 330 | 10 | 340 | 424 | -22.2% | -19.8% | ||||||||||||
Net profit from continuing operations | 126 | 5 | 131 | 275 | -54.3% | -52.3% | ||||||||||||
Basic EPS from continuing operations | 1.22 | 0.05 | 1.27 | 2.73 | -55.3% | -53.2% | ||||||||||||
Group share in net profit | 78 | 4 | 82 | 273 | -71.5% | -69.8% | ||||||||||||
Basic EPS from Group share in net profit | 0.77 | 0.05 | 0.82 | 2.71 | -71.6% | -69.9% | ||||||||||||
Free cash flow | 463 | 13 | 476 | 326 | +42.3% | +46.5% | ||||||||||||
| (in millions of€) | September 30, 2013 | December 31, 2012 | Change | |||||||||||||||
Net debt | 1 695 | (3 | ) | 1 692 | 2 072 | -18.2% | -18.4% | |||||||||||
CERTIFICATION OF RESPONSIBLE PERSONS
The undersigned Pierre-Olivier Beckers, President and Chief Executive Officer of Delhaize Group, and Pierre Bouchut, Chief Financial Officer of Delhaize Group, confirm that to the best of their knowledge:
a) these interim condensed consolidated financial statements for the nine-month period ending September 30, 2013 are prepared in accordance with IFRS (International Financial Reporting Standards) and give, in all material respects, a true and fair view of the consolidated financial position and consolidated results of Delhaize Group;
b) the interim financial report gives, in all material respects, a true and fair view of all important events and significant transactions with related parties that have occurred in the first nine months of the fiscal year 2013 and their effects on the summary financial statements, as well as an overview of the most significant risks and uncertainties with which we are confronted.
Brussels, November 6, 2013
| Pierre-Olivier Beckers | Pierre Bouchut | |||
| President and CEO | Executive Vice President and CFO |
| Delhaize Group – Earnings Release – Third Quarter 2013 | 23 of 25 | |||||
REPORT OF THE STATUTORY AUDITOR
We have performed a limited review of the accompanying condensed balance sheet, condensed consolidated income statement, condensed statements of comprehensive income, condensed statements of changes in shareholders’ equity, condensed statements of cash flows and selected explanatory notes (jointly the “interim financial information”) of Delhaize Brothers and Co “The Lion” (Delhaize Group) SA (“the company”) and its subsidiaries (jointly “the group”) for the nine-month period ended 30 September 2013. The Board of Directors of the company is responsible for the preparation and fair presentation of this interim financial information. Our responsibility is to express a conclusion on this interim financial information based on our review.
The interim financial information has been prepared in accordance with IAS 34, “Interim Financial Reporting” as adopted by the EU.
Our limited review of the interim financial information was conducted in accordance with the recommended auditing standards on limited reviews applicable in Belgium, as issued by the “Institut des Réviseurs d’Entreprises/Instituut van de Bedrijfsrevisoren”. A limited review consists of making inquiries of group management and applying analytical and other review procedures to the interim financial information and underlying financial data. A limited review is substantially less in scope than an audit performed in accordance with the auditing standards on consolidated annual accounts as issued by the “Institut des Réviseurs d’Entreprises/Instituut van de Bedrijfsrevisoren”. Accordingly, we do not express an audit opinion.
Based on our limited review, nothing has come to our attention that causes us to believe that the interim financial information for the nine-month period ended 30 September 2013 is not prepared, in all material respects, in accordance with IAS 34 Interim Financial Reporting as adopted by the EU.
RISKS
In accordance with the Belgian Royal Decree of November 14, 2007, Delhaize Group states that the fundamental risks confronting the Company are unchanged from those described on the pages 58 through 65 of the 2012 Annual Report. To the best of our knowledge as of November 6, 2013, there are no other fundamental risks confronting the Company and influencing the remaining months of the financial year 2013. On a regular basis, the Board of Directors and Company management evaluate the business risks that confront Delhaize Group.
DEFINITIONS
| — | Basic earnings per share: profit or loss attributable to ordinary equity holders of the parent entity divided by the weighted average number of shares outstanding during the period. Basic earnings per share are calculated on profit from continuing operations less non-controlling interests attributable to continuing operations, and on the group share in net profit |
| — | Comparable store sales: sales from the same stores, including relocations and expansions, and adjusted for calendar effects |
| — | Diluted earnings per share: is calculated by adjusting the profit or loss attributable to ordinary equity shareholders and the weighted average number of shares outstanding for the effects of all dilutive potential ordinary shares, including those related to convertible instruments, options or warrants or shares issued upon the satisfaction of specified conditions |
| — | EBITDA: operating profit plus depreciation, amortization and impairment |
| — | Free cash flow: cash flow before financing activities, investment in debt securities and term deposits and sale and maturity of debt securities and term deposits |
| — | Net debt: non-current financial liabilities, plus current financial liabilities and derivatives liabilities, minus derivative assets, investments in securities and term deposits, and cash and cash equivalents |
| — | Net financial expenses: finance costs less income from investments |
| — | Organic revenue growth: sales growth, excluding sales from acquisitions and divestitures, at identical currency exchange rates |
| — | Outstanding shares: the number of shares issued by the Company, excluding treasury shares |
| — | Underlying EBITDA: Underlying operating profit plus depreciation and amortization less any depreciation or amortization that has been excluded from underlying operating profit |
| — | Underlying operating profit: operating profit (as reported) excluding fixed assets impairment charges, reorganization charges, store closing expenses, gains/losses on disposal of fixed assets and businesses and other items that management considers as not being representative of the Group’s operating performance of the period |
| — | Weighted average number of shares: number of shares outstanding at the beginning of the period less treasury shares, adjusted by the number of shares cancelled, repurchased or issued during the period multiplied by a time-weighting factor |
| — | Working capital: inventories plus receivables and other current assets, minus accounts payable and other current liabilities |
| Delhaize Group – Earnings Release – Third Quarter 2013 | 24 of 25 | |||||
CAUTIONARY NOTE REGARDING FORWARD LOOKING STATEMENTS
Statements that are included or incorporated by reference in this press release and other written and oral statements made from time to time by Delhaize Group and its representatives, other than statements of historical fact, which address activities, events and developments that Delhaize Group expects or anticipates will or may occur in the future, including, without limitation, when the sale of Sweetbay, Harveys and Reid´s to Bi-Lo Holdings is expected to be completed; the financial flexibility that will result from the sale; the ultimate value of the transaction to Delhaize Group after working capital adjustments, expected costs savings, the closing, conversion and opening of stores, the expected effect of the portfolio optimization, anticipated revenue and net profit growth, anticipated free cash flow generation, strategic options, future strategies and the anticipated benefits of these strategies and (underlying) operating profit guidance, are “forward-looking statements” within the meaning of the U.S. federal securities laws that are subject to risks and uncertainties. These forward-looking statements generally can be identified as statements that include phrases such as “guidance,” “outlook,” “projected,” “believe,” “target,” “predict,” “estimate,” “forecast,” “strategy,” “may,” “goal,” “expect,” “anticipate,” “intend,” “plan,” “foresee,” “likely,” “will,” “should” or other similar words or phrases. Although such statements are based on current information, actual outcomes and results may differ materially from those projected depending upon a variety of factors, including, but not limited to, conditions to closing the sale of Sweetbay, Harveys and Reid´s to Bi-Lo Holdings, including regulatory approvals; changes in the general economy or the markets of Delhaize Group, in strategy, in consumer spending, in inflation or currency exchange rates or in legislation or regulation; competitive factors; adverse determination with respect to claims; inability to timely develop, remodel, integrate, open, convert or close stores; and supply or quality control problems with vendors. Additional risks and uncertainties that could cause actual results to differ materially from those stated or implied by such forward-looking statements are described in Delhaize Group’s most recent Annual Report on Form 20-F and other filings made by Delhaize Group with the U.S. Securities and Exchange Commission, which risk factors are incorporated herein by reference. Delhaize Group disclaims any obligation to update developments of these risk factors or to announce publicly any revision to any of the forward-looking statements contained in this release, including guidance with respect to underlying operating profit, SG&A, net finance costs, capital expenditures, store openings and free cash flow, or to make corrections to reflect future events or developments.
| Delhaize Group – Earnings Release – Third Quarter 2013 | 25 of 25 | |||||
DELHAIZE GROUP
Q3 2013 results
November 7, 2013
Forward looking statements
This presentation includes forward-looking statements within the meaning of the U.S. federal securities laws that are subject to risks and uncertainties. Forward-looking statements describe further expectations, plans, options, results or strategies. Actual outcomes and results may differ materially from those projected depending upon a variety of factors, including but not limited to changes in the general economy or the markets of Delhaize Group, in consumer spending, in inflation or currency exchange rates or in legislation or regulation; competitive factors; adverse determination with respect to claims; inability to timely develop, remodel, integrate or convert stores; and supply or quality control problems with vendors. Additional risks and uncertainties that could cause actual results to differ materially from those stated or implied by such forward-looking statements are described in our most recent annual report or Form 20-F and other filings with the Securities and Exchange Commission. Delhaize Group disclaims any obligation toupdateor revise the information contained in this presentation.
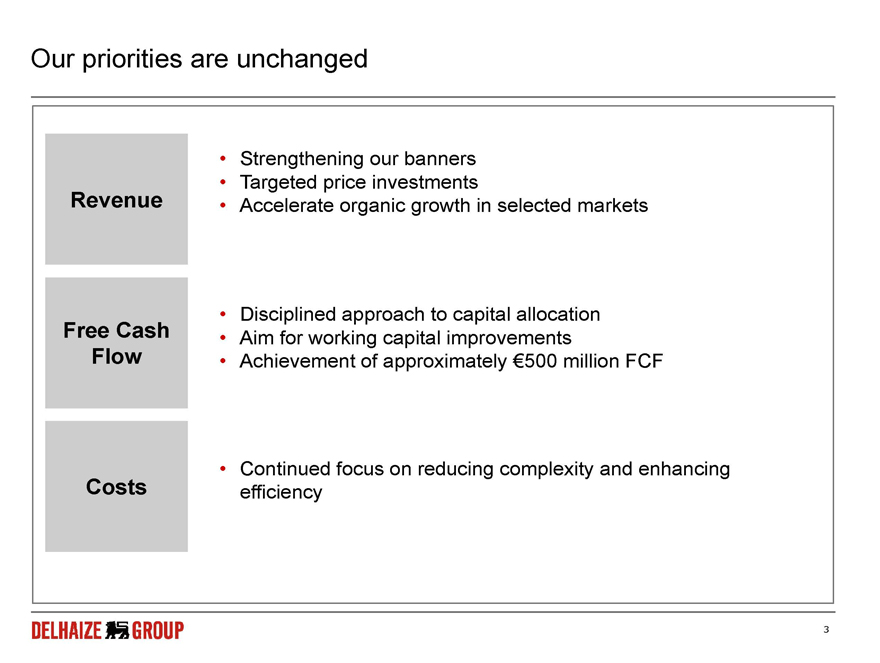
Our priorities are unchanged
• |
| Strengthening our banners |
• |
| Targeted price investments |
Revenue • Accelerate organic growth in selected markets
• |
| Disciplined approach to capital allocation Free Cash Aim for working capital improvements Flow Achievement of approximately €500 million FCF |
Costs • Continued focus on reducing complexity and enhancing efficiency
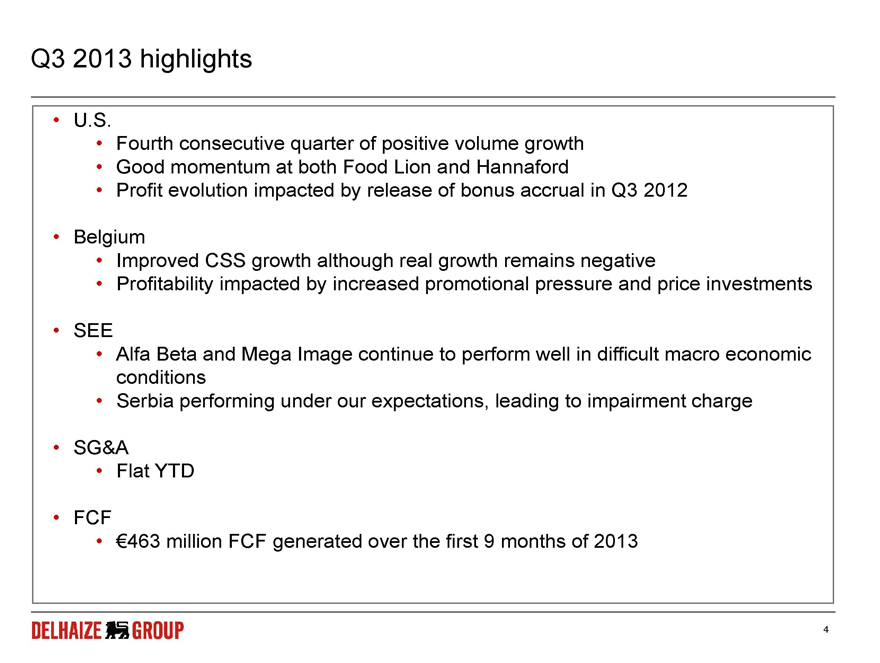
Q3 2013 highlights
• |
| U.S. |
• |
| Fourth consecutive quarter of positive volume growth |
• |
| Good momentum at both Food Lion and Hannaford |
• |
| Profit evolution impacted by release of bonus accrual in Q3 2012 |
• |
| Belgium |
• |
| Improved CSS growth although real growth remains negative |
• |
| Profitability impacted by increased promotional pressure and price investments |
• |
| SEE |
• |
| Alfa Beta and Mega Image continue to perform well in difficult macro economic conditions |
• |
| Serbia performing under our expectations, leading to impairment charge |
• |
| SG&A |
• |
| Flat YTD |
• |
| FCF |
• |
| €463 million FCF generated over the first 9 months of 2013 |
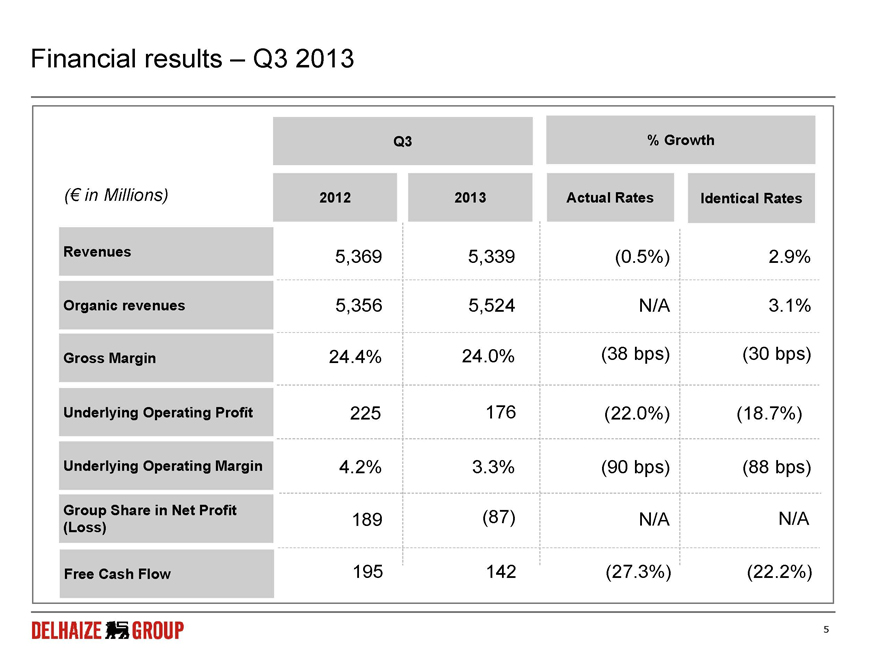
Financial results – Q3 2013
Q3 % Growth
(€ in Millions) 2012 2013 Actual Rates Identical Rates
Revenues 5,369 5,339 (0.5%) 2.9% Organic revenues 5,356 5,524 N/A 3.1% Gross Margin 24.4% 24.0% (38 bps) (30 bps)
Underlying Operating Profit 225 176 (22.0%) (18.7%)
Underlying Operating Margin 4.2% 3.3% (90 bps) (88 bps)
Group Share in Net Profit (87) N/A N/A
189
(Loss)
Free Cash Flow 195 142 (27.3%) %) (22.2%) %)
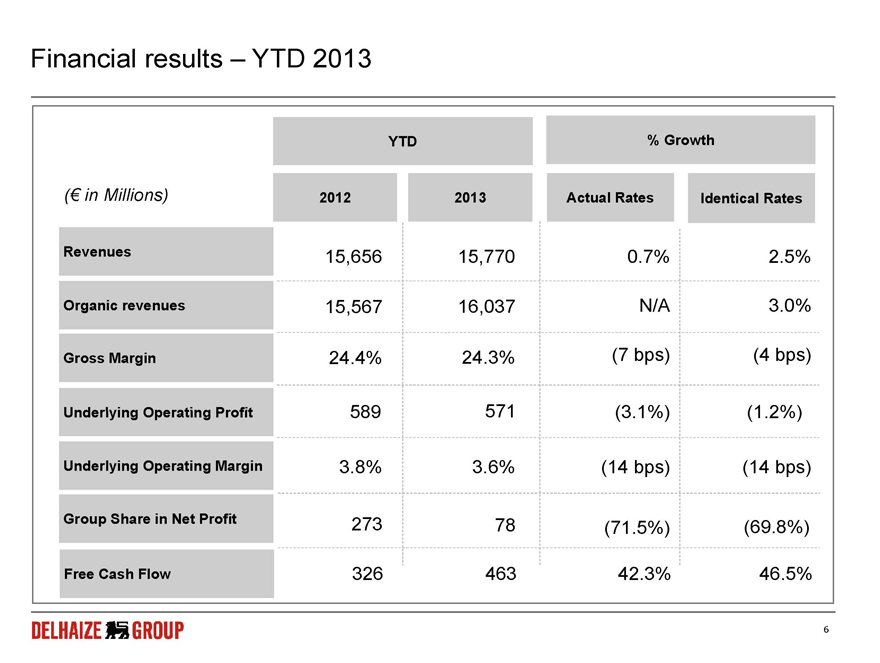
Financial results – YTD 2013
YTD % Growth
(€ in Millions) 2012 2013 Actual Rates Identical Rates
Revenues 15,656 15,770 0.7% 2.5% Organic revenues 15,567 16,037 N/A 3.0% Gross Margin 24.4% 24.3% (7 bps) (4 bps)
Underlying Operating Profit 589 571 (3.1%) (1.2%)
Underlying Operating Margin 3.8% 3.6% (14 bps) (14 bps)
Group Share in Net Profit 273 78 (71.5%) (69.8%)
Free Cash Flow 326 463 42.3% 46.5%
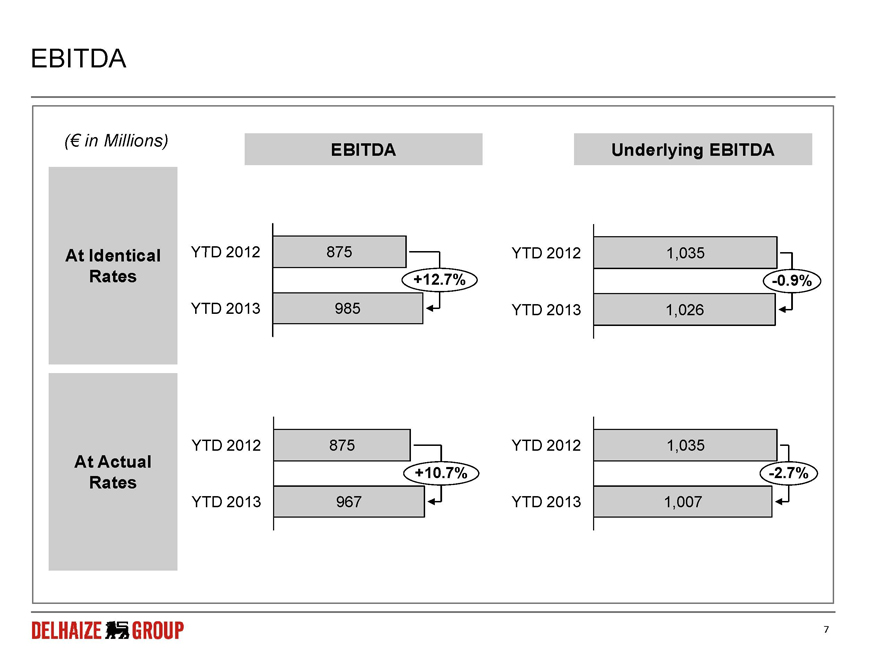
EBITDA
(€ in Millions)
EBITDA Underlying EBITDA
At Identical YTD 2012 875 YTD 2012 1,035
Rates +12.7% -0.9%
YTD 2013 985 YTD 2013 1,026
YTD 2012 875 YTD 2012 1,035
At Actual
+10.7% -2.7%
Rates
YTD 2013 967 YTD 2013 1,007
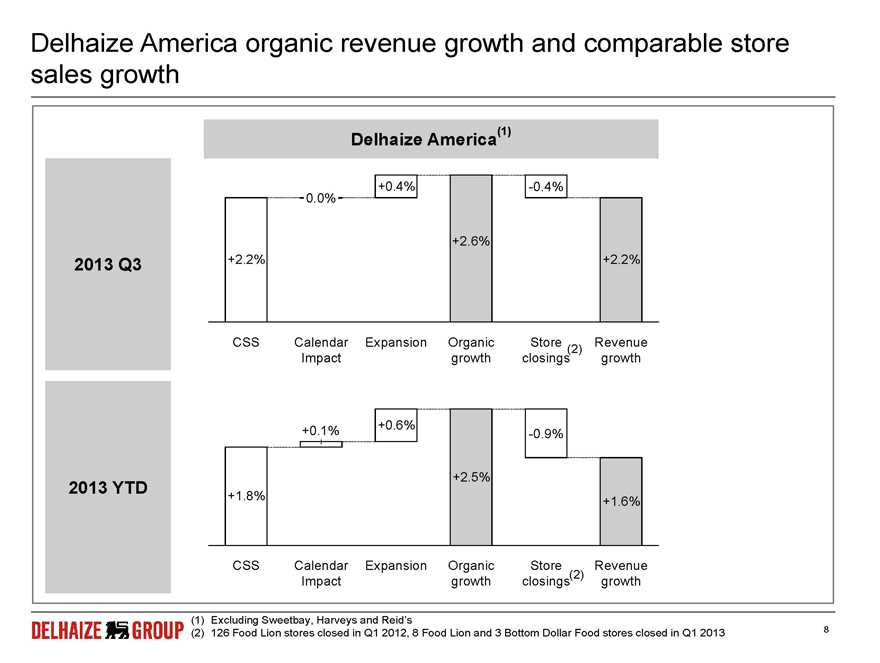
Delhaize America organic revenue growth and comparable store sales growth
Delhaize America(1)
0.0% +0.4% -0.4%
+2.6%
2013 Q3 +2.2% +2.2%
CSS Calendar Expansion Organic Store Revenue
(2) |
Impact growth closings growth
+0.1% +0.6%
-0.9%
+2.5%
2013 YTD
+1.8% +1.6%
CSS Calendar Expansion Organic Store Revenue
(2) |
Impact growth closings growth
(1) | Excluding Sweetbay, Harveys and Reid’s |
(2) | 126 Food Lion stores closed in Q1 2012, 8 Food Lion and 3 Bottom Dollar Food stores closed in Q1 2013 |
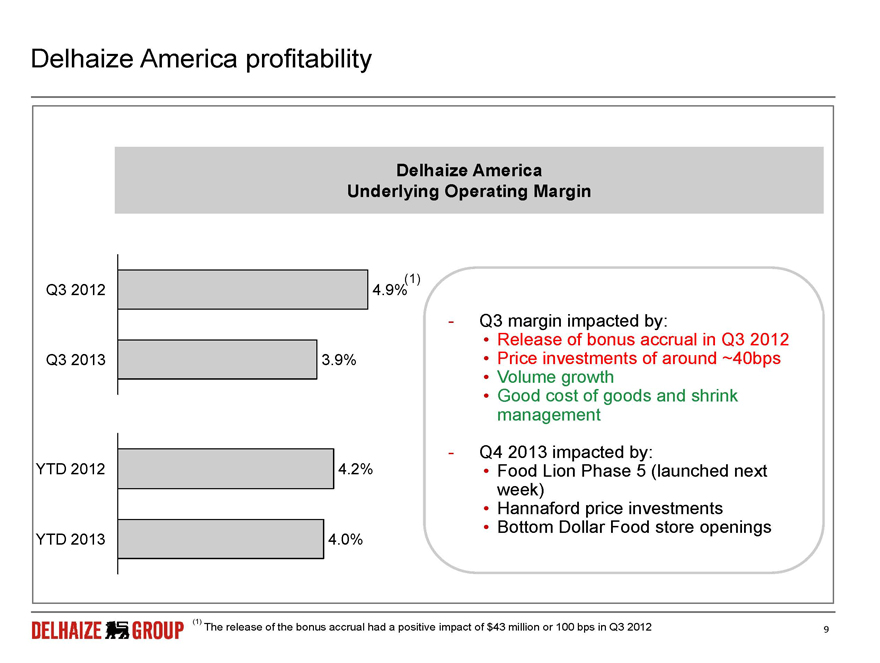
Delhaize America profitability
Delhaize America Underlying Operating Margin
(1) |
Q3 2012 4.9%
- Q3 margin impacted by:
• |
| Release of bonus accrual in Q3 2012 Q3 2013 3.9% Price investments of around ~40bps |
• |
| Volume growth |
• |
| Good cost of goods and shrink management |
- Q4 2013 impacted by:
YTD 2012 4.2% • Food Lion Phase 5 (launched next week)
• |
| Hannaford price investments |
• |
| Bottom Dollar Food store openings |
YTD 2013 4.0%
(1) | The release of the bonus accrual had a positive impact of $43 million or 100 bps in Q3 2012 |
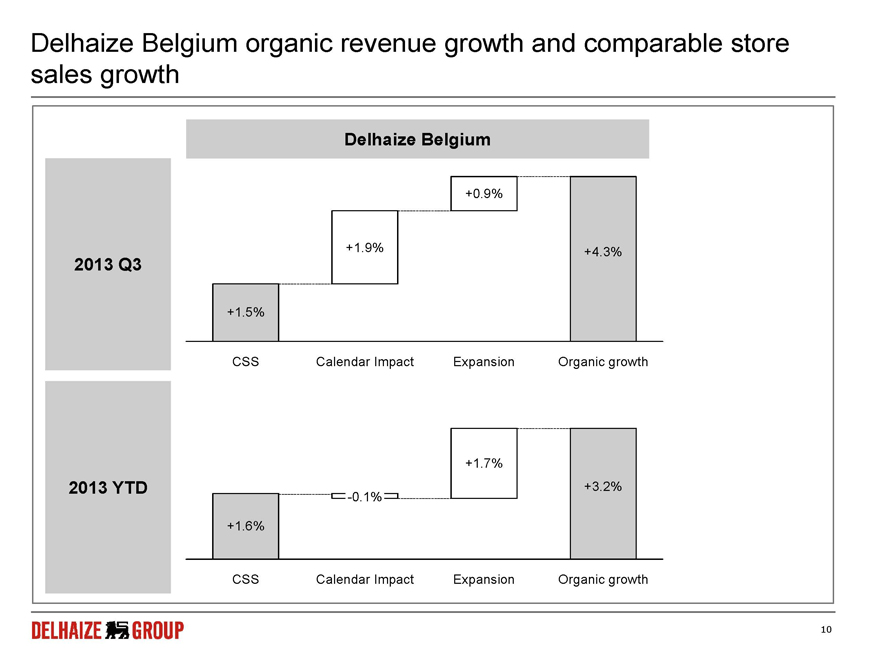
Delhaize Belgium organic revenue growth and comparable store sales growth
Delhaize Belgium
+0.9%
+1.9% +4.3%
2013 Q3
+1.5%
CSS Calendar Impact Expansion Organic growth
+1.7%
2013 YTD +3.2%
-0.1%
+1.6%
CSS Calendar Impact Expansion Organic growth
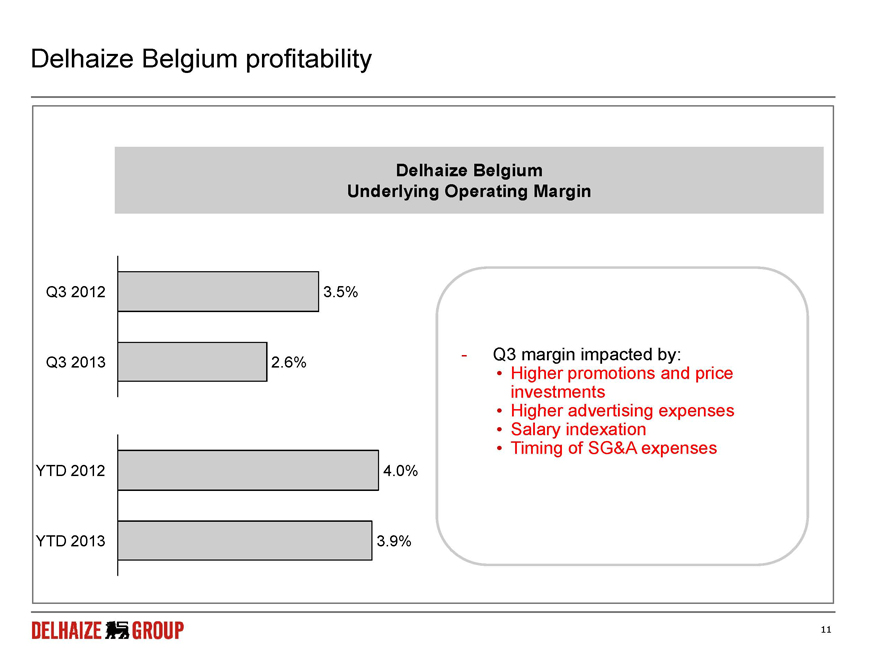
Delhaize Belgium profitability
Delhaize Belgium Underlying Operating Margin
Q3 2012 3.5%
- Q3 margin impacted by:
Q3 2013 2.6%
• |
| Higher promotions and price investments |
• |
| Higher advertising expenses |
• |
| Salary indexation |
• |
| Timing of SG&A expenses |
YTD 2012 4.0%
YTD 2013 3.9%
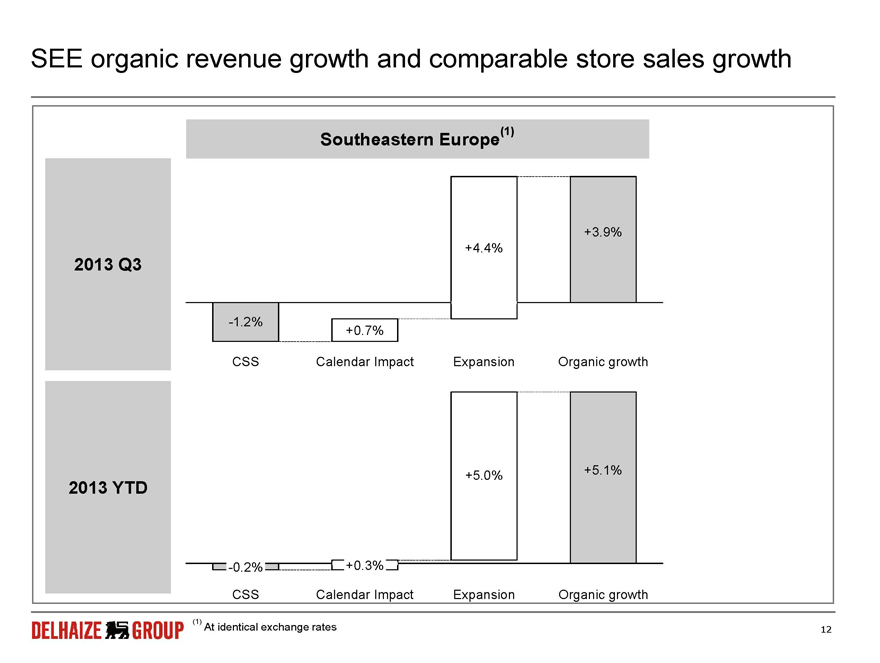
SEE organic revenue growth and comparable store sales growth
Southeastern Europe(1)
+3.9%
+4.4%
2013 Q3
-1.2%
+07% .
CSS Calendar Impact Expansion Organic growth
+5.0% +5.1%
2013 YTD
-0.2% +0.3%
CSS Calendar Impact Expansion Organic growth
(1) | At identical exchange rates |
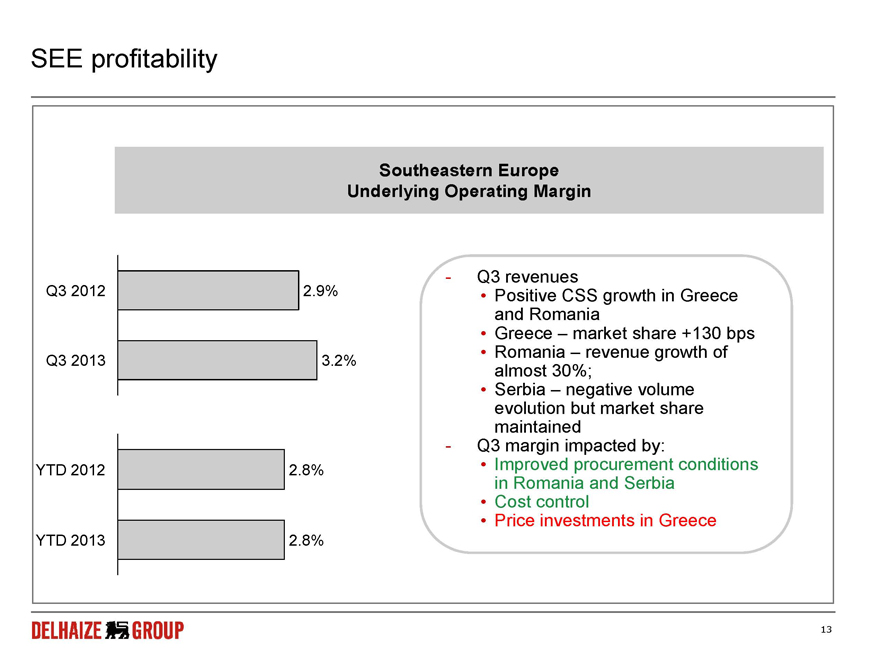
SEE profitability
Southeastern Europe Underlying Operating Margin
Q3 2012 2.9%—Q3 revenues
• |
| Positive CSS growth in Greece and Romania |
• |
| Greece market share +130 bps |
• |
| Romania – revenue growth of |
Q3 2013 3.2%
almost 30%;
• |
| Serbia – negative volume evolution but market share maintained |
- Q3 margin impacted by:
YTD 2012 2.8% • Improved procurement conditions in Romania and Serbia
• |
| Cost control |
• |
| Price investments in Greece |
YTD 2013 2.8%
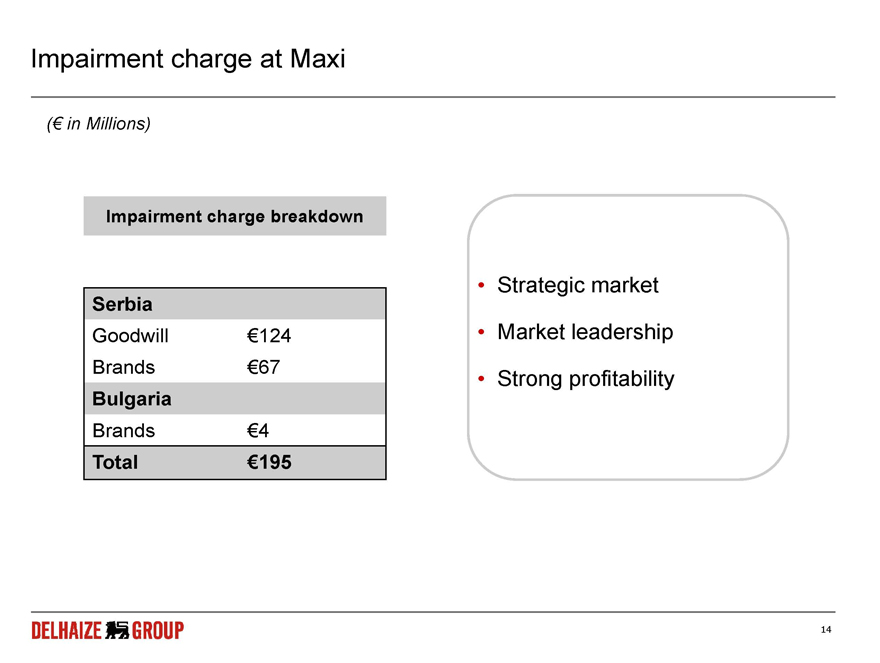
Impairment charge at Maxi
(€ in Millions)
Impairment charge breakdown
Serbia • Strategic market Goodwill €124 • Market leadership
Brands €67
• |
| Strong profitability |
Bulgaria
Brands €4
Total €195
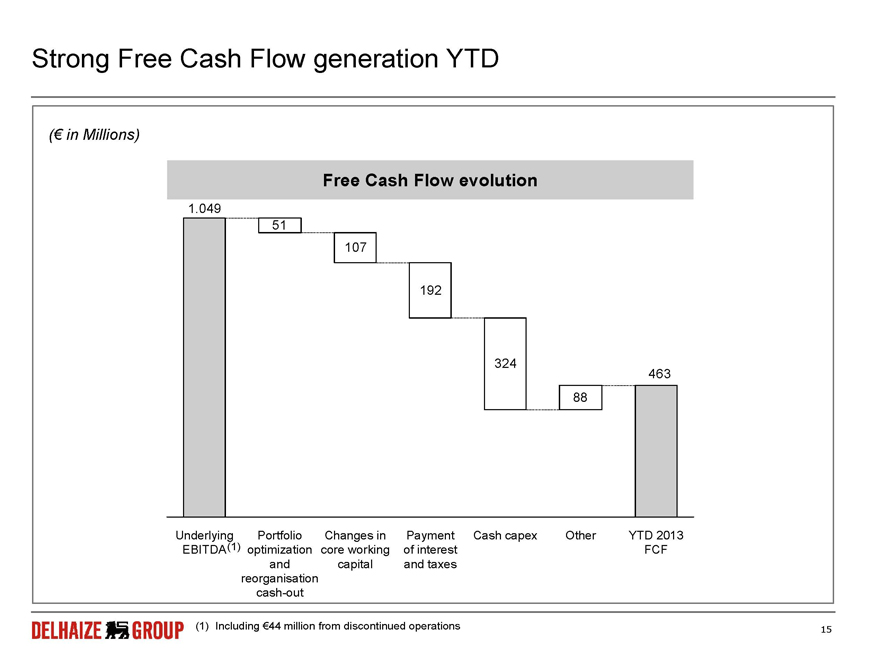
Impairment charge at Maxi
(€ in Millions)
Impairment charge breakdown
Serbia • Strategic market Goodwill €124 • Market leadership
Brands €67
• |
| Strong profitability |
Bulgaria
Brands €4
Total €195
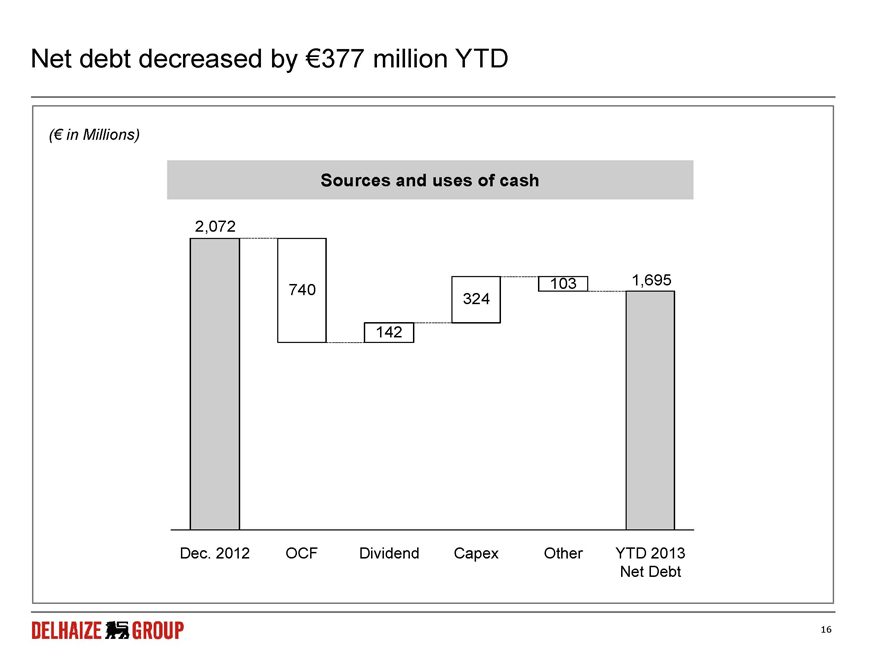
Strong Free Cash Flow generation YTD
(€ in Millions)
Free Cash Flow evolution
1.049
51
107
192
324
463 88
Underlying Portfolio Changes in Payment Cash capex Other YTD 2013 EBITDA(1) optimization core working of interest FCF and capital and taxes reorganisation cash-out
(1) | Including €44 million from discontinued operations |
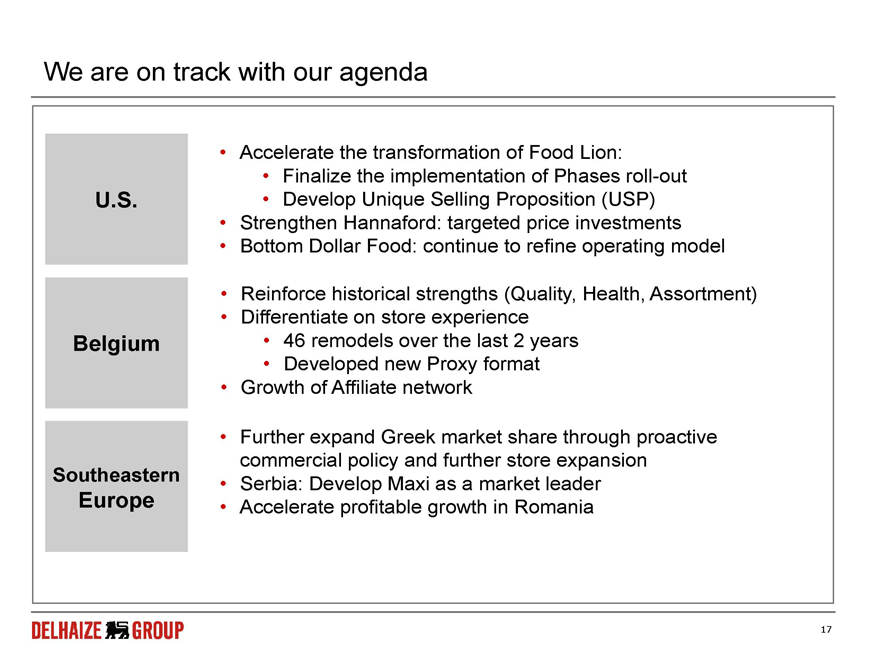
Net debt decreased by €377 million YTD
(€ in Millions)
Sources and uses of cash
2,072
103 1,695 740 324
142 1
Dec. 2012 OCF Dividend Capex Other YTD 2013 Net Debt
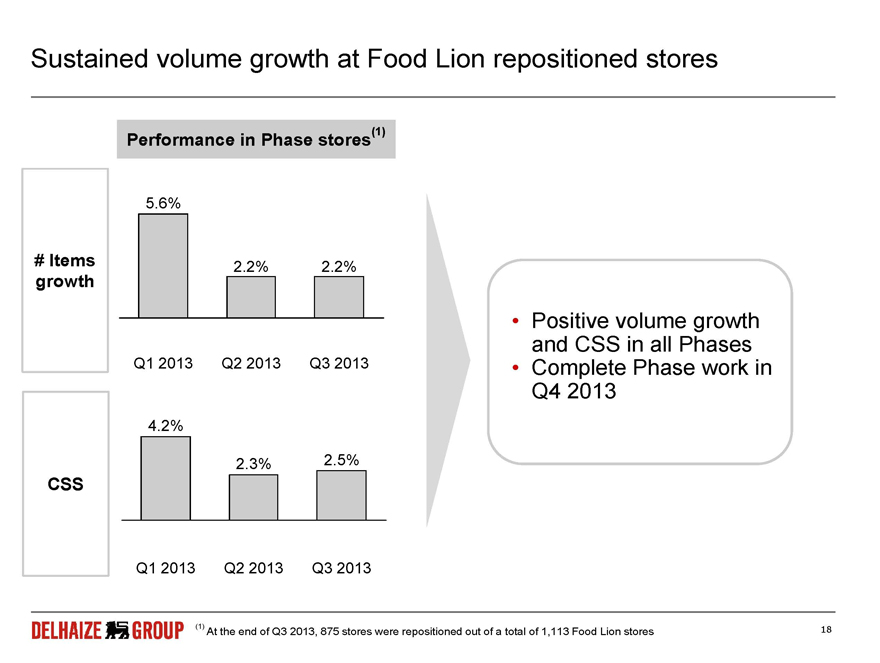
We are on track with our agenda
• |
| Accelerate the transformation of Food Lion: |
• |
| Finalize the implementation of Phases roll-out U.S. Develop Unique Selling Proposition (USP) |
• |
| Strengthen Hannaford: targeted price investments |
• |
| Bottom Dollar Food: continue to refine operating model |
• |
| Reinforce historical strengths (Quality, Health, Assortment) |
• |
| Differentiate on store experience Belgium 46 remodels over the last 2 years |
• |
| Developed new Proxy format |
• |
| Growth of Affiliate network |
• |
| Further expand Greek market share through proactive commercial policy and further store expansion Southeastern Serbia: Develop Maxi as a market leader Europe Accelerate profitable growth in Romania |
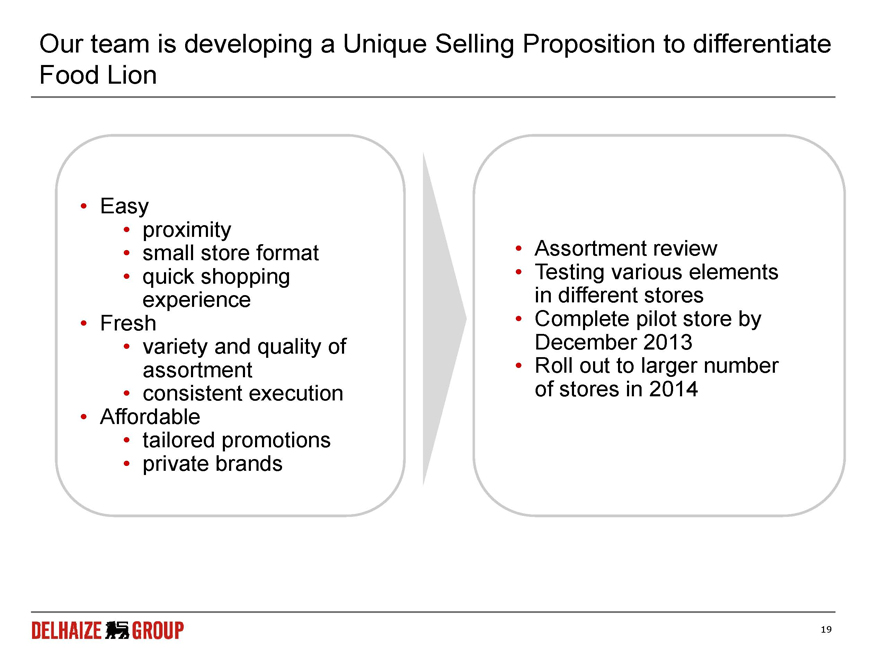
Sustained volume growth at Food Lion repositioned stores
Performance in Phase stores(1)
5.6%
# Items 2.2% 2.2%
growth
• |
| Positive volume growth and CSS in all Phases Q1 2013 Q2 2013 Q3 2013 Complete Phase work in Q4 2013 |
4.2%
2.3% 2.5%
CSS
Q1 2013 Q2 2013 Q3 2013
(1) | At the end of Q3 2013, 875 stores were repositioned out of a total of 1,113 Food Lion stores |
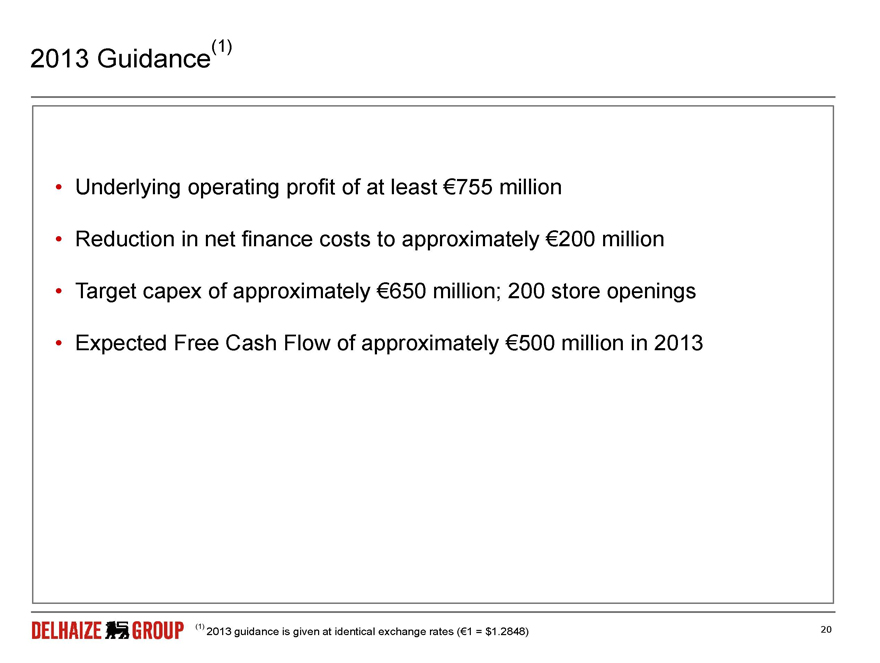
Our team is developing a Unique Selling Proposition to differentiate Food Lion
• |
| Easy proximity |
• |
| small store format Assortment review quick shopping Testing various elements experience in different stores |
• |
| Fresh Complete pilot store by variety and quality of December 2013 assortment Roll out to larger number consistent execution of stores in 2014 |
• |
| Affordable |
• |
| tailored promotions private brands |
2013 Guidance(1)
• |
| Underlying operating profit of at least €755 million |
• |
| Reduction in net finance costs to approximately €200 million |
• |
| Target capex of approximately €650 million; 200 store openings |
• |
| Expected Free Cash Flow of approximately €500 million in 2013 |
• |
|
SIGNATURES
Pursuant to the requirements of the Securities Exchange Act of 1934, the registrant has duly caused this report to be signed on its behalf by the undersigned hereunto duly authorized.
ETABLISSEMENTS DELHAIZE FRÈRES ET CIE “LE LION” (GROUPE DELHAIZE) | ||||||||
| Date:November 8, 2013 | By: | /s/ G. Linn Evans | ||||||
| G. Linn Evans | ||||||||
| Senior Vice President | ||||||||