UNITED STATES
SECURITIES AND EXCHANGE COMMISSION
Washington, D.C. 20549
FORM 6-K
REPORT OF FOREIGN PRIVATE ISSUER
Pursuant to Rule 13a-16 or 15d-16
under the Securities Exchange Act of 1934
For the month of March, 2014
Commission File Number: 333-13302
ETABLISSEMENTS DELHAIZE FRÈRES
ET CIE “LE LION” (GROUPE DELHAIZE)
(Exact name of registrant as specified in its charter)*
DELHAIZE BROTHERS AND CO.
“THE LION” (DELHAIZE GROUP)
(Translation of registrant’s name into English)*
SQUARE MARIE CURIE 40
1070 BRUSSELS, BELGIUM
(Address of principal executive offices)
| * | The registrant’s charter (articles of association) specifies the registrant’s name in French, Dutch and English. |
Indicate by check mark whether the registrant files or will file annual reports under cover of Form 20-F or Form 40-F.
Form 20-F x Form 40-F ¨
Indicate by check mark if the registrant is submitting the Form 6-K in paper as permitted by Regulation S-T Rule 101(b)(1): ¨
Indicate by check mark if the registrant is submitting the Form 6-K in paper as permitted by Regulation S-T Rule 101(b)(7): ¨
 | Fourth Quarter and Full Year 2013 Financial report | |
| Regulated Information | ||
| March 13, 2014 - 7:00 a.m. CET |
DELHAIZE GROUP 2013 RESULTS
Financial Highlights 2013
| » | Group revenue growth of 2.6% at identical exchange rates; organic revenue growth of 3.1% |
| » | Food Lion phase roll-out completed |
| » | Underlying operating profit of €753 million (-4.2%) or €769 million at identical exchange rates (-2.1%) |
| » | Free cash flow generation of €669 million |
| » | Adoption of a dividend policy to pay out approximately 35% of underlying Group share in net profit from continued operations. Proposed full year gross dividend of €1.56 per share, an 11% increase compared to 2012. |
Financial Highlights Fourth Quarter 2013
| » | Group revenue growth of 3.0% at identical exchange rates; organic revenue growth of 3.2% |
| » | Solid comparable store sales growth at Delhaize America (+2.8%) driven by Food Lion and at Delhaize Belgium (+2.4%) |
| » | Underlying operating margin of 3.4%; impacted by continued price investments in the U.S. |
Executive Committee Changes
| » | Marc Croonen appointed as Chief Human Resources Officer and member of the Executive Committee |
| » | Dirk Van den Berghe appointed as member of the Executive Committee in combination with his role as CEO Delhaize Belgium & Luxembourg |
| » | CEO Comments |
Frans Muller, Chief Executive Officer of Delhaize Group, commented: “Since joining as CEO in November 2013, I have gained a thorough understanding of our Group, of the different markets in which we operate and of our banners. Our Group has strong foundations, with leadership positions in nearly all our markets, a solid balance sheet, and passionate associates. Since the beginning of the year, we continue to have positive momentum at Delhaize America while facing challenges in Belgium and Serbia.”
“In 2014, we will further differentiate our offer and support our core banners by focusing on maintaining or strengthening our local leadership positions. We will pursue operational efficiencies and exercise continued capital discipline in order to fund this.”
“For the current year, our capital expenditures will increase to approximately €625 million and we plan to open 180 stores. We intend to maintain or improve sales growth and continue to generate a healthy level of free cash flow.”
| » | Financial Summary |
| Q4 2013(1) | 2013(1) | |||||||||||||||||||||||
| Actual Results | At Actual Rates | At Identical Rates | € in millions, except EPS (in €) | Actual Results | At Actual Rates | At Identical Rates | ||||||||||||||||||
| 5 338 | +0.1 | % | +3.0 | % | Revenues | 21 108 | +0.6 | % | +2.6 | % | ||||||||||||||
| 312 | –13.2 | % | –10.5 | % | EBITDA | 1 279 | +3.7 | % | +5.9 | % | ||||||||||||||
| 157 | N/A | N/A | Operating profit | 487 | +17.3 | % | +20.8 | % | ||||||||||||||||
| 2.9 | % | — | — | Operating margin | 2.3 | % | — | — | ||||||||||||||||
| 182 | –7.4 | % | –4.8 | % | Underlying operating profit | 753 | –4.2 | % | –2.1 | % | ||||||||||||||
| 3.4 | % | — | — | Underlying operating margin | 3.6 | % | — | — | ||||||||||||||||
| 113 | N/A | N/A | Profit before taxes and discontinued operations | 303 | +60.4 | % | +65.5 | % | ||||||||||||||||
| 100 | N/A | N/A | Net profit from continuing operations | 226 | +41.1 | % | +46.2 | % | ||||||||||||||||
| 101 | N/A | N/A | Group share in net profit | 179 | +71.8 | % | +78.5 | % | ||||||||||||||||
| 1.00 | N/A | N/A | Basic earnings per share - Group share in net profit | 1.77 | +71.4 | % | +78.1 | % | ||||||||||||||||
|
|
|
|
| ||||||||||||||||||||
| (1) | The average exchange rate of the U.S. dollar against the euro weakened by 4.7% in the fourth quarter of 2013 (€1 = $1.3610) compared to the fourth quarter of 2012 and weakened by 3.3% in 2013 (1€ = $1.3281) compared to 2012. |
| Delhaize Group – Earnings Release – Fourth Quarter and Full Year 2013 | 1 of 28 |
| » | Full Year 2013 Income Statement |
Revenues
In 2013, Delhaize Group realized revenues of €21.1 billion. This represents an increase of 0.6% at actual exchange rates or 2.6% at identical exchange rates. Organic revenue growth was 3.1%.
In 2013, the revenue performance was the result of:
| • | Revenue growth of 1.9% in the U.S. at identical exchange rates, driven by comparable store sales growth of 2.0%; |
| • | Revenue growth of 3.0% in Belgium as a result of network growth and comparable store sales growth of 1.8%, mainly resulting from retail inflation; and |
| • | Revenue growth of 5.0% at identical exchange rates in Southeastern Europe driven by a strong performance in Greece and expansion in Romania, partly offset by a -0.3% comparable store sales evolution attributable to a difficult environment in Serbia. |
Gross margin
Gross margin was 24.2% of revenues, an 8 basis points decrease at identical exchange rates due to price investments and promotional intensity in Belgium and the U.S., which was partly offset by improved procurement conditions.
Other operating income
Other operating income was €129 million, an increase of €13 million compared to last year primarily due to €9 million gains resulting from the sale of City stores in Belgium and the reversal of litigation and legal provisions in Serbia.
Selling, general and administrative expenses
Selling, general and administrative expenses were 21.2% of revenues and were 15 basis points higher than last year at identical exchange rates mainly due to the bonus reduction in the U.S. and a payroll tax refund in Belgium both in 2012 and termination benefits in 2013.
Other operating expenses
Other operating expenses were €270 million compared to €376 million last year. 2013 results included €213 million impairment losses, mainly related to Serbian goodwill and trade names whereas 2012 results included €220 million impairment losses and €126 million store closing charges.
Underlying operating profit
Underlying operating profit decreased by 4.2% at actual exchange rates to €753 million (-2.1% at identical exchange rates). Underlying operating margin decreased to 3.6% of revenues (3.7% last year).
Operating profit
Operating profit increased from €415 million in 2012 to €487 million in 2013 and the operating margin was 2.3%.
EBITDA
EBITDA increased by 3.7% at actual exchange rates to €1.3 billion (+5.9% at identical exchange rates), mostly due to lower store closing charges.
Net financial expenses
Net financial expenses were €188 million, a decrease of €37 million at identical exchange rates mainly due to non-recurring charges related to debt refinancing in 2012, less average interest cost on lower outstanding debt and lower finance lease interest due to store closings.
Effective tax rate
During 2013, the effective tax rate on continued operations was 25.9%, compared to previous year’s rate of 15.7%. 2012’s tax rate was lower due to the positive impact of the resolution of several tax matters in the U.S. Both years were significantly impacted by the non-deductible goodwill impairment charges at our Maxi operations.
Net profit from continuing operations
Net profit from continuing operations was €226 million or €2.20 basic earnings per share. This represents an increase of 41.1% compared to €160 million net profit from continuing operations or €1.61 basic earnings per share last year. This is the result of lower impairment, store closing and finance expenses partially offset by a lower underlying operating profit.
| Delhaize Group – Earnings Release – Fourth Quarter and Full Year 2013 | 2 of 28 |
Result from discontinued operations
Delhaize Group recorded a loss of €43 million from discontinued operations compared to a loss of €58 million in 2012.
Net profit
Group share in net profit amounted to €179 million, an increase of 71.8% at actual exchange rates (78.5% at identical exchange rates) compared to 2012. Per share, basic earnings were €1.77 (€1.03 in 2012) and diluted net earnings were €1.76 (€1.03 in 2012).
Dividend
The Board of Directors of Delhaize Group has adopted a dividend policy with a payout ratio of approximately 35% of underlying net profit. As a result, the Board of Directors will propose to the Ordinary Shareholders Meeting of May 22, 2014, the payment of a gross dividend of €1.56 per share. After deduction of the 25% Belgian withholding tax, the proposed net dividend is €1.17 per share. The net dividend of €1.17 per share will be payable to owners of ordinary shares against coupon no. 52. Delhaize Group ordinary shares will start trading ex-coupon on May 28, 2014 (opening of the market). The record date (i.e., the date at which shareholders are entitled to the dividend) is May 30, 2014 (closing of the market) and the payment date is June 2, 2014.
| » | Full Year 2013 Cash Flow Statement and Balance Sheet |
Net cash provided by operating activities
In 2013, net cash provided by operating activities was €1 185 million, a decrease of €217 million compared to 2012, primarily as a result of lower working capital improvement across the Group.
Free cash flow
As a result of discipline in capital expenditures (€565 million in 2013 compared to €681 million in 2012) and continued working capital control, we generated €669 million free cash flow in 2013.
Net debt
The net debt to equity ratio was 29.0% at the end of 2013 compared to 39.9% at the end of 2012. Net debt decreased by €599 million to €1.5 billion mainly as a result of strong free cash flow generation.
| » | Fourth Quarter 2013 Income Statement |
Revenues
In the fourth quarter of 2013, Delhaize Group’s revenues increased by 0.1% at actual and 3.0% at identical exchange rates, respectively. Organic revenue growth was 3.2%.
Revenues at Delhaize America increased by 2.8% in local currency. Comparable store sales grew by 2.8% despite retail deflation resulting from our price investments at Food Lion Phase 4 and Phase 5 and at Hannaford. Revenues were particularly strong at Food Lion. In Belgium, revenues increased by 2.5% as a result of 2.4% comparable store sales growth and the contribution of new stores, partly offset by a 0.5% negative calendar impact. Revenues in Southeastern Europe grew by 4.5% at identical exchange rates as a result of the strong performance in Greece and expansion in Romania partly offset by negative volume growth in Serbia. Comparable store sales evolution was -0.6% for this segment.
Gross margin
Gross margin was 23.9% of revenues, a 21 basis points decrease at identical exchange rates, mainly as a result of further price investments, primarily in the U.S., which was partly offset by improved procurement conditions.
Other operating income
Other operating income was €34 million, an increase of €5 million compared to the fourth quarter of 2012.
Selling, general and administrative expenses
Selling, general and administrative expenses were 21.0% of revenues, a 50 basis points increase at identical exchange rates mainly due to the payroll tax refund recorded in the fourth quarter of 2012 and salary indexations, both in Belgium.
| Delhaize Group – Earnings Release – Fourth Quarter and Full Year 2013 | 3 of 28 |
Other operating expenses
Other operating expenses were €28 million compared to €228 million last year. In the fourth quarter of 2012, €186 million of impairment charges related to Maxi were recorded.
Underlying operating profit
Underlying operating profit decreased by 7.4% (4.8% at identical exchange rates) as a result of continued price investments across the Group and higher selling, general and administrative expenses. Underlying operating margin was 3.4% of revenues compared to 3.7% in 2012.
Operating profit (loss)
Delhaize Group recorded an operating profit of €157 million in the fourth quarter of 2013. This represents a 2.9% operating margin.
EBITDA
EBITDA decreased by 13.2% at actual exchange rates to €312 million (-10.5% at identical exchange rates).
Net financial expenses
Net financial expenses were €46 million compared to €74 million in the fourth quarter of 2012 which included €19 million non-recurring charges related to debt refinancing.
Effective tax rate
While in the fourth quarter of 2012 our income tax expense was 40.4% of pre-tax loss, the rate decreased to 11.6% in the fourth quarter of 2013 primarily because of the non-recognition of state net operating losses in the US in 2012, the non-deductible goodwill impairment charges related to our Maxi operations in 2012, and an increase in the Serbian tax rate in 2012. Additionally, in the fourth quarter of 2013, we recognized benefits associated with the reorganization of some of our US operations.
Net profit (loss) from continuing operations
Net profit from continuing operations was €100 million or €0.98 basic earnings per share compared to a basic loss per share of €1.12 in the fourth quarter of 2012.
Result from discontinued operations (net of tax)
The result from discontinued operations net of tax was a €2 million profit compared to a loss of €57 million last year, which was primarily due to impairment losses.
Net profit
Group share in net profit was €101 million. Basic net profit per share was €1.00 compared to a loss of €1.68 in the fourth quarter of 2012 and diluted net profit per share was €0.99 compared to a net loss of €1.68 in the same quarter of 2012.
| Delhaize Group – Earnings Release – Fourth Quarter and Full Year 2013 | 4 of 28 |
| » | Segment Reporting (at actual exchange rates) |
2013 | Revenues | Underlying Operating Margin(3) | Underlying Operating Profit(3) | |||||||||||||||||||||||||||||||
(in millions) | 2013 | 2012 | 2013 /2012 | 2013 | 2012 | 2013 | 2012 | 2013 /2012 | ||||||||||||||||||||||||||
United States(1) | $ | 17 117 | 16 797 | +1.9 | % | 3.7 | % | 4.0 | % | 639 | 676 | –5.3 | % | |||||||||||||||||||||
United States(1) | € | 12 889 | 13 073 | –1.4 | % | 3.7 | % | 4.0 | % | 481 | 525 | –8.4 | % | |||||||||||||||||||||
Belgium | € | 5 071 | 4 922 | +3.0 | % | 3.9 | % | 4.0 | % | 198 | 196 | +1.0 | % | |||||||||||||||||||||
SEE(2) | € | 3 148 | 2 996 | +5.1 | % | 3.6 | % | 3.5 | % | 114 | 105 | +8.9 | % | |||||||||||||||||||||
Corporate | € | — | — | N/A | N/A | N/A | (40 | ) | (41 | ) | +0.8 | % | ||||||||||||||||||||||
|
|
|
|
|
|
|
|
|
|
|
|
|
|
|
|
| ||||||||||||||||||
TOTAL | € | 21 108 | 20 991 | +0.6 | % | 3.6 | % | 3.7 | % | 753 | 785 | –4.2 | % | |||||||||||||||||||||
|
|
|
|
|
|
|
|
|
|
|
|
|
|
|
|
| ||||||||||||||||||
Q4 2013 | Revenues | Underlying Operating Margin(3) | Underlying Operating Profit(3) | |||||||||||||||||||||||||||||||
(in millions) | Q4 2013 | Q4 2012 | 2013 /2012 | Q4 2013 | Q4 2012 | Q4 2013 | Q4 2012 | 2013 /2012 | ||||||||||||||||||||||||||
United States(1) | $ | 4 291 | 4 174 | +2.8 | % | 3.0 | % | 3.6 | % | 128 | 149 | –14.1 | % | |||||||||||||||||||||
United States(1) | € | 3 151 | 3 217 | –2.1 | % | 3.0 | % | 3.6 | % | 93 | 114 | –18.8 | % | |||||||||||||||||||||
Belgium | € | 1 335 | 1 303 | +2.5 | % | 3.8 | % | 4.0 | % | 51 | 52 | –2.5 | % | |||||||||||||||||||||
SEE(2) | € | 852 | 815 | +4.5 | % | 5.9 | % | 5.3 | % | 50 | 44 | +14.7 | % | |||||||||||||||||||||
Corporate | € | — | — | N/A | N/A | N/A | (12 | ) | (14 | ) | +13.1 | % | ||||||||||||||||||||||
|
|
|
|
|
|
|
|
|
|
|
|
|
|
|
|
| ||||||||||||||||||
TOTAL | € | 5 338 | 5 335 | +0.1 | % | 3.4 | % | 3.7 | % | 182 | 196 | –7.4 | % | |||||||||||||||||||||
|
|
|
|
|
|
|
|
|
|
|
|
|
|
|
|
| ||||||||||||||||||
| (1) | The segment “United States” includes the banners Food Lion, Hannaford and Bottom Dollar Food. Sweetbay, Harveys and Reid’s are included in discontinued operations given their planned divestiture. |
| (2) | The segment “Southeastern Europe” includes our operations in Greece, Serbia, Romania, Bulgaria and Bosnia and Herzegovina. Montenegro is included in discontinued operations given its divestiture. Our operations in Indonesia are accounted for under the equity method and no longer form part of this segment. |
| (3) | For a definition of underlying operating profit, please refer to the “Definitions” page of this document. A reconciliation with reported operating profit is provided on page xx of this document. |
United States
In2013, U.S. operations generated revenues of $17.1 billion (€12.9 billion), an increase of 1.9% compared to 2012 in local currency. Comparable store sales increased by 2.0% (adjusted for a positive calendar impact of 0.1%). In 2013, Food Lion completed its phase repositioning by implementing Phase 4 in May 2013 (178 stores) and Phase 5 (169 stores) in November 2013.
The U.S. gross margin decreased by 15 basis points to 25.9% as a result of price investments partly offset by improved procurement conditions, at both Food Lion and Hannaford.
Selling, general and administrative expenses as a percentage of revenues increased by 6 basis points to 22.6% mainly as a result of the reduction of the U.S. bonus in 2012, largely offset by cost savings.
Underlying operating margin of our U.S. business decreased by 29 basis points to 3.7% (4.0% in 2012) as a result of price investments and slightly higher SG&A. Underlying operating profit decreased by 5.3% to $639 million (€481 million). Operating margin was 3.4% mainly as a result of $53 million (€40 million) reorganization, fixed asset impairment charges and store closing expenses.
In thefourth quarter of 2013, revenues at Delhaize America increased by 2.8% to $4.3 billion (€3.2 billion). Comparable store sales growth was 2.8% despite retail inflation turning negative (-0.4%) as a result of additional price investments due to the launch of Phase 4 in the second quarter and Phase 5 in November at Food Lion and an overall low inflationary environment.
Underlying operating profit decreased by 14.1% to $128 million (€93 million) due to a lower gross margin resulting from our price investments and due to higher SG&A. Underlying operating margin for the quarter was 3.0% compared to 3.6% in 2012.
| Delhaize Group – Earnings Release – Fourth Quarter and Full Year 2013 | 5 of 28 |
Belgium
Delhaize Belgium recognized revenues of €5.1 billion in2013, an increase of 3.0% compared to 2012, as a result of comparable store sales growth of 1.8% and network growth.
Delhaize Belgium’s gross margin decreased by 10 basis points to 20.2% of revenues as a result of price investments and increased promotional activity. Delhaize Belgium maintained its market share at 25.5% in 2013.
Selling, general and administrative expenses as a percentage of revenues increased by 34 basis points to 17.1% given the impact of automatic salary indexation and the recognition of a payroll tax refund in 2012. Underlying operating profit increased by 1.0% to €198 million and the underlying operating margin of Delhaize Belgium decreased from 4.0% to 3.9%.
In thefourth quarter of 2013, revenues in Belgium were €1.3 billion, an increase of 2.5% over 2012, with comparable store sales growth of 2.4% mainly driven by retail inflation of 2.1% and solid year-end sales. Comparable store sales growth is adjusted for a negative calendar impact of 0.5%.
Underlying operating profit in Belgium decreased by 2.5% to €51 million and the underlying operating margin was 3.8% (4.0% last year) as a result of higher promotional activity and salary indexations.
Southeastern Europe
2013 revenues in Southeastern Europe increased by 5.1% to €3.1 billion (+5.0% at identical exchange rates) as a result of volume growth in Greece and growth by store expansion in Romania. Comparable store sales evolution was -0.3% for the region.
Gross margin increased by 31 basis points to 23.6% due to improved procurement conditions in Romania and Serbia. Selling, general and administrative expenses as a percentage of revenues increased by 16 basis points to 20.6% due to soft sales in Serbia and to expenses related to the rapid expansion in Romania. Underlying operating margin was 3.6% (3.5% in 2012) while underlying operating profit was €114 million, or an increase of 8.7% at identical exchange rates.
In thefourth quarter of 2013, revenues in Southeastern Europe increased by 4.5% at actual and identical exchange rates to €852 million. We experienced positive comparable store sales growth in Greece and growth by expansion in Romania. This was partially offset by negative volume growth in Serbia. Comparable store sales evolution was -0.6% for the segment.
Underlying operating profit increased by 14.6% at identical exchange rates to €50 million, while underlying operating margin increased from 5.3% to 5.9% mostly driven by improvements in Romania.
| Delhaize Group – Earnings Release – Fourth Quarter and Full Year 2013 | 6 of 28 |
| » | Executive Committee changes |
Today, we announced the appointment of Marc Croonen as new Chief Human Resources Officer. He will replace Nicolas Hollanders and join the Executive Committee on May 1. In addition, Dirk Van den Berghe, CEO of Delhaize Belgium & Luxembourg, will join the Group’s Executive Committee with immediate effect. Finally, the Delhaize Europe level no longer exists.
| » | 2014 Outlook |
In the U.S., Food Lion will roll out a new strategy, centered around Easy, Fresh & Affordable. The strategy includes assortment changes, improvements at the check-outs and increased associate trainings to underline that the customer is at the centre of what we do. We will conduct a comprehensive market test in 77 stores starting this summer. Hannaford will also look for ways to accelerate growth, including further improving its price positioning. Thus far in 2014, Delhaize America has experienced very solid sales trends, in part positively impacted by severe winter weather. This has also resulted in extra costs.
Delhaize Belgium continues to be challenged by a highly competitive environment and pressure on selling, general and administrative expenses. We have increased our focus on price and promotions as well as strengthening the quality and variety of our assortment. The foregoing elements will result in a decrease of our profitability, particularly in the first quarter.
For Southeastern Europe, we aim for additional market share gains in Greece, store network expansion in Romania and improving the execution in Serbia.
We expect Group capital expenditures of approximately €625 million at identical exchange rates excluding leases, and plan to open 180 new stores.
| » | Analyst meeting, Conference Call and Webcast |
Delhaize Group’s management is hosting an analyst meeting in Brussels starting at 10:00 am CET on March 13, 2014. The analyst meeting can be followed (audio only) by calling +44 (0)20 775 099 26 (U.K.), +32 (0)2 400 35 05 (Belgium) or +1 914 885 07 79 (U.S.), with “92065968#” as participant code. The analyst meeting will also be webcasted live over the internet athttp://www.delhaizegroup.com. An on-demand replay of the webcast will be available after the analyst meeting athttp://www.delhaizegroup.com.
| Delhaize Group – Earnings Release – Fourth Quarter and Full Year 2013 | 7 of 28 |
| » | Delhaize Group |
Delhaize Group is a Belgian international food retailer present in nine countries on three continents. At the end of 2013, Delhaize Group’s sales network consisted of 3 534 stores. In 2013, Delhaize Group posted €21.1 billion ($28.0 billion) in revenues and €179 million ($237 million) in net profit (Group share). At the end of 2013, Delhaize Group employed approximately 160 000 people. Delhaize Group’s stock is listed on NYSE Euronext Brussels (DELB) and the New York Stock Exchange (DEG).
This press release is available in English, French and Dutch. You can also find it on the websitehttp://www.delhaizegroup.com. Questions can be sent toinvestor@delhaizegroup.com.
| » | Financial Calendar |
• Press release – 2014 first quarter results | May 7, 2014 | |
• Press release – 2014 second quarter results | August 7, 2014 | |
• Press release – 2014 third quarter results | November 6, 2014 | |
| » | Contacts |
Investor Relations: +32 2 412 21 51
Media Relations: +32 2 412 86 69
| Delhaize Group – Earnings Release – Fourth Quarter and Full Year 2013 | 8 of 28 |
DELHAIZE GROUP CONDENSED CONSOLIDATED FINANCIAL STATEMENTS
| » | Condensed Consolidated Balance Sheet |
(in millions of €) | December 31, 2013 | December 31, 2012 | ||||||
Assets | ||||||||
Non-current assets | 7 930 | 8 725 | ||||||
Goodwill | 2 959 | 3 189 | ||||||
Intangible assets | 732 | 848 | ||||||
Property, plant and equipment | 3 973 | 4 314 | ||||||
Investment property | 100 | 116 | ||||||
Investments accounted for using the equity method | 24 | 28 | ||||||
Financial assets | 29 | 30 | ||||||
Derivative instruments | 1 | 61 | ||||||
Other non-current assets | 112 | 139 | ||||||
Current assets | 3 666 | 3 192 | ||||||
Inventories | 1 353 | 1 391 | ||||||
Receivables and other assets | 723 | 770 | ||||||
Financial assets | 151 | 93 | ||||||
Derivative instruments | 40 | — | ||||||
Cash and cash equivalents | 1 149 | 920 | ||||||
Assets classified as held for sale | 250 | 18 | ||||||
|
|
|
|
| ||||
Total assets | 11 596 | 11 917 | ||||||
|
|
|
|
| ||||
Liabilities | ||||||||
Total equity | 5 076 | 5 188 | ||||||
Shareholders’ equity | 5 070 | 5 186 | ||||||
Non-controlling interests | 6 | 2 | ||||||
Non-current liabilities | 3 378 | 3 948 | ||||||
Long-term debt | 2 011 | 2 313 | ||||||
Obligations under finance lease | 496 | 612 | ||||||
Deferred tax liabilities | 444 | 568 | ||||||
Derivative instruments | 8 | 10 | ||||||
Provisions | 355 | 375 | ||||||
Other non-current liabilities | 64 | 70 | ||||||
Current liabilities | 3 142 | 2 781 | ||||||
Long-term debt - current portion | 228 | 156 | ||||||
Obligations under finance lease | 59 | 62 | ||||||
Bank overdrafts | 4 | — | ||||||
Accounts payable | 1 993 | 1 869 | ||||||
Derivative instruments | 3 | 4 | ||||||
Other current liabilities | 797 | 686 | ||||||
Liabilities associated with assets held for sale | 58 | 4 | ||||||
|
|
|
|
| ||||
Total liabilities and equity | 11 596 | 11 917 | ||||||
|
|
|
| |||||
$ per € exchange rate | 1.3791 | 1.3194 | ||||||
|
|
|
| |||||
| Delhaize Group – Earnings Release – Fourth Quarter and Full Year 2013 | 9 of 28 |
| » | Condensed Consolidated Income Statement |
| Q4 2013 | Q4 2012 | (in millions of €) | YTD 2013 | YTD 2012 | ||||||||||||
| 5 338 | 5 335 | Revenues | 21 108 | 20 991 | ||||||||||||
| (4 063 | ) | (4 047 | ) | Cost of sales | (16 004 | ) | (15 891 | ) | ||||||||
|
|
|
|
|
|
|
| |||||||||
| 1 275 | 1 288 | Gross profit | 5 104 | 5 100 | ||||||||||||
| 23.9 | % | 24.1 | % | Gross margin | 24.2 | % | 24.3 | % | ||||||||
| 34 | 29 | Other operating income | 129 | 116 | ||||||||||||
| (1 124 | ) | (1 098 | ) | Selling, general and administrative expenses | (4 476 | ) | (4 425 | ) | ||||||||
| (28 | ) | (228 | ) | Other operating expenses | (270 | ) | (376 | ) | ||||||||
|
|
|
|
|
|
|
| |||||||||
| 157 | (9 | ) | Operating profit (loss) | 487 | 415 | |||||||||||
| 2.9 | % | (0.2 | %) | Operating margin | 2.3 | % | 2.0 | % | ||||||||
| (48 | ) | (72 | ) | Finance costs | (197 | ) | (246 | ) | ||||||||
| 2 | (2 | ) | Income from investments | 9 | 16 | |||||||||||
| 2 | 2 | Share of results of joint venture equity accounted | 4 | 4 | ||||||||||||
|
|
|
|
|
|
|
| |||||||||
| 113 | (81 | ) | Profit (loss) before taxes and discontinued operations | 303 | 189 | |||||||||||
| (13 | ) | (34 | ) | Income tax expense | (77 | ) | (29 | ) | ||||||||
|
|
|
|
|
|
|
| |||||||||
| 100 | (115 | ) | Net profit (loss) from continuing operations | 226 | 160 | |||||||||||
|
|
|
|
|
|
|
| |||||||||
| 2 | (57 | ) | Result from discontinued operations, net of tax | (43 | ) | (58 | ) | |||||||||
| 102 | (172 | ) | Net profit (loss) | 183 | 102 | |||||||||||
|
|
|
|
|
|
|
| |||||||||
| 1 | (3 | ) | Net profit (loss) attributable to non-controlling interests | 4 | (2 | ) | ||||||||||
| 101 | (169 | ) | Net profit (loss) attributable to equity holders of the Group - Group share in net profit (loss) | 179 | 104 | |||||||||||
|
|
|
|
|
|
|
| |||||||||
(in €, except number of shares) | ||||||||||||||||
Group share in net profit (loss) from continuing operations: | ||||||||||||||||
| 0.98 | (1.12 | ) | Basic earnings per share | 2.20 | 1.61 | |||||||||||
| 0.97 | (1.11 | ) | Diluted earnings per share | 2.19 | 1.60 | |||||||||||
|
|
|
|
|
|
|
| |||||||||
Group share in net profit (loss): | ||||||||||||||||
| 1.00 | (1.68 | ) | Basic earnings per share | 1.77 | 1.03 | |||||||||||
| 0.99 | (1.68 | ) | Diluted earnings per share | 1.76 | 1.03 | |||||||||||
|
|
|
|
|
|
|
| |||||||||
Weighted average number of shares outstanding: | ||||||||||||||||
| 101 229 472 | 100 833 290 | Basic | 101 029 095 | 100 777 257 | ||||||||||||
| 101 571 927 | 101 128 352 | Diluted | 101 569 648 | 101 133 583 | ||||||||||||
|
|
|
|
|
|
|
| |||||||||
| 102 449 570 | 101 921 498 | Shares issued at the end of the period | 102 449 570 | 101 921 498 | ||||||||||||
|
|
|
|
|
|
|
| |||||||||
| 101 248 627 | 100 877 363 | Shares outstanding at the end of the period | 101 248 627 | 100 877 363 | ||||||||||||
|
|
|
|
|
|
|
| |||||||||
| 1.3610 | 1.2967 | Average $ per € exchange rate | 1.3281 | 1.2848 | ||||||||||||
|
|
|
|
|
|
|
| |||||||||
| Delhaize Group – Earnings Release – Fourth Quarter and Full Year 2013 | 10 of 28 |
| » | Condensed Consolidated Statement of Comprehensive Income |
| Q4 2013 | Q4 2012 | (in millions of €) | YTD 2013 | YTD 2012 | ||||||||||||
| 102 | (172 | ) | Net profit (loss) of the period | 183 | 102 | |||||||||||
Items that will not be reclassified to profit or loss | ||||||||||||||||
| 11 | (16 | ) | Remeasurements of defined benefit liability (asset) | 11 | (16 | ) | ||||||||||
| (4 | ) | 4 | Tax (expense) benefit | (4 | ) | 4 | ||||||||||
|
|
|
|
|
|
|
| |||||||||
| 7 | (12 | ) | Remeasurements of defined liability (asset), net of tax | 7 | (12 | ) | ||||||||||
|
|
|
|
|
|
|
| |||||||||
| 7 | (12 | ) | Total items that will not be reclassified to profit or loss | 7 | (12 | ) | ||||||||||
|
|
|
|
|
|
|
| |||||||||
Items that are or may be reclassified subsequently to profit or loss | ||||||||||||||||
| — | — | Deferred gain (loss) on discontinued cash flow hedge | — | — | ||||||||||||
| 1 | — | Reclassification adjustment to net profit | 1 | — | ||||||||||||
| (1 | ) | — | Tax (expense) benefit | (1 | ) | — | ||||||||||
|
|
|
|
|
|
|
| |||||||||
| — | — | Deferred gain (loss) on discontinued cash flow hedge, net of tax | — | — | ||||||||||||
| — | (1 | ) | Gain (loss) on cash flow hedge | — | 2 | |||||||||||
| — | 3 | Reclassification adjustment to net profit | — | 4 | ||||||||||||
| — | (1 | ) | Tax (expense) benefit | — | (2 | ) | ||||||||||
|
|
|
|
|
|
|
| |||||||||
| — | 1 | Gain (loss) on cash flow hedge, net of tax | — | 4 | ||||||||||||
| — | — | Unrealized gain (loss) on financial assets available for sale | (6 | ) | (1 | ) | ||||||||||
| — | — | Reclassification adjustment to net profit | — | (6 | ) | |||||||||||
| — | — | Tax (expense) benefit | 1 | 1 | ||||||||||||
|
|
|
|
|
|
|
| |||||||||
| — | — | Unrealized gain (loss) on financial assets available for sale, net of tax | (5 | ) | (6 | ) | ||||||||||
| (77 | ) | (61 | ) | Exchange gain (loss) on translation of foreign operations | (170 | ) | (141 | ) | ||||||||
| — | — | Reclassification adjustment to net profit | (1 | ) | — | |||||||||||
|
|
|
|
|
|
|
| |||||||||
| (77 | ) | (61 | ) | Exchange gain (loss) on translation of foreign operations | (171 | ) | (141 | ) | ||||||||
|
|
|
|
|
|
|
| |||||||||
| (77 | ) | (60 | ) | Total items that are or may be reclassified subsequently to profit or loss | (176 | ) | (143 | ) | ||||||||
|
|
|
|
|
|
|
| |||||||||
| (70 | ) | (72 | ) | Other comprehensive income | (169 | ) | (155 | ) | ||||||||
| — | — | Attributable to non-controlling interests | — | (1 | ) | |||||||||||
| (70 | ) | (72 | ) | Attributable to equity holders of the Group | (169 | ) | (154 | ) | ||||||||
|
|
|
|
|
|
|
| |||||||||
| 32 | (244 | ) | Total comprehensive income for the period | 14 | (53 | ) | ||||||||||
| 1 | (3 | ) | Attributable to non-controlling interests | 4 | (3 | ) | ||||||||||
| 31 | (241 | ) | Attributable to equity holders of the Group | 10 | (50 | ) | ||||||||||
|
|
|
|
|
|
|
| |||||||||
| Delhaize Group – Earnings Release – Fourth Quarter and Full Year 2013 | 11 of 28 |
| » | Condensed Consolidated Statement of Changes in Equity |
(in millions of €, except number of shares) | Shareholders’ Equity | Non-controlling Interests | Total Equity | |||||||||
Balances at January 1, 2013 | 5 186 | 2 | 5 188 | |||||||||
|
|
|
|
|
| |||||||
Other comprehensive income | (169 | ) | — | (169 | ) | |||||||
Net profit | 179 | 4 | 183 | |||||||||
|
|
|
|
|
|
| ||||||
Total comprehensive income for the period | 10 | 4 | 14 | |||||||||
|
|
|
|
|
|
| ||||||
Capital increases | 16 | — | 16 | |||||||||
Dividends declared | (142 | ) | — | (142 | ) | |||||||
Treasury shares purchased | (15 | ) | — | (15 | ) | |||||||
Treasury shares sold upon exercise of employee stock options | 1 | — | 1 | |||||||||
Tax payment for restricted shares vested | (5 | ) | — | (5 | ) | |||||||
Excess tax benefit on employee stock options and restricted shares | 3 | — | 3 | |||||||||
Share-based compensation expense | 16 | — | 16 | |||||||||
|
|
|
|
|
| |||||||
(in millions of €, except number of shares) | Shareholders’ Equity | Non-controlling Interests | Total Equity | |||||||||
Balances at January 1, 2012 | 5 411 | 5 | 5 416 | |||||||||
|
|
|
|
|
| |||||||
Other comprehensive income | (154 | ) | (1 | ) | (155 | ) | ||||||
Net profit | 104 | (2 | ) | 102 | ||||||||
|
|
|
|
|
|
| ||||||
Total comprehensive income for the period | (50 | ) | (3 | ) | (53 | ) | ||||||
|
|
|
|
|
|
| ||||||
Capital increases | 1 | — | 1 | |||||||||
Dividends declared | (177 | ) | — | (177 | ) | |||||||
Tax payment for restricted shares vested | (2 | ) | — | (2 | ) | |||||||
Share-based compensation expense | 13 | — | 13 | |||||||||
Purchase of non-controlling interests | (10 | ) | — | (10 | ) | |||||||
|
|
|
|
|
|
| ||||||
Balances at December 31, 2012 | 5 186 | 2 | 5 188 | |||||||||
|
|
|
|
|
| |||||||
Shares issued | 101 921 498 | |||||||||||
Treasury shares | 1 044 135 | |||||||||||
Shares outstanding | 100 877 363 | |||||||||||
|
|
|
|
|
| |||||||
| Delhaize Group – Earnings Release – Fourth Quarter and Full Year 2013 | 12 of 28 |
| » | Condensed Consolidated Statement of Cash Flows |
| Q4 2013 | Q4 2012 | (in millions of €) | YTD 2013 | YTD 2012 | ||||||||||||
Operating activities | ||||||||||||||||
| 102 | (172 | ) | Net profit (loss) | 183 | 102 | |||||||||||
Adjustments for: | ||||||||||||||||
| (2 | ) | (2 | ) | Share of results of joint venture equity accounted | (4 | ) | (4 | ) | ||||||||
| 145 | 162 | Depreciation and amortization | 599 | 648 | ||||||||||||
| 12 | 286 | Impairment | 231 | 288 | ||||||||||||
| 65 | 98 | Income taxes, finance costs and income from investments | 261 | 263 | ||||||||||||
| 12 | 7 | Other non-cash items | 23 | — | ||||||||||||
| 213 | 303 | Changes in operating assets and liabilities | 186 | 430 | ||||||||||||
| (79 | ) | (93 | ) | Interest paid | (198 | ) | (229 | ) | ||||||||
| 2 | 1 | Interest received | 12 | 9 | ||||||||||||
| (25 | ) | (9 | ) | Income taxes paid | (108 | ) | (105 | ) | ||||||||
| 445 | 581 | Net cash provided by operating activities | 1 185 | 1 402 | ||||||||||||
|
|
|
|
|
|
|
|
| ||||||||
Investing activities | ||||||||||||||||
| 3 | 2 | Business acquisitions and disposals | 28 | (9 | ) | |||||||||||
| (241 | ) | (158 | ) | Purchase of tangible and intangible assets (capital expenditures) | (565 | ) | (681 | ) | ||||||||
| 11 | 21 | Sale of tangible and intangible assets | 33 | 39 | ||||||||||||
| 2 | 2 | Net investment in debt securities | (43 | ) | (1 | ) | ||||||||||
| 12 | — | Net investment in term deposits | (13 | ) | — | |||||||||||
| (12 | ) | 1 | Other investing activities | (12 | ) | 22 | ||||||||||
| (225 | ) | (132 | ) | Net cash used in investing activities | (572 | ) | (630 | ) | ||||||||
|
|
|
|
|
|
|
| |||||||||
| 220 | 449 | Cash flow before financing activities | 613 | 772 | ||||||||||||
|
|
|
|
|
|
|
| |||||||||
Financing activities | ||||||||||||||||
| (1 | ) | 1 | Proceeds from the exercise of share warrants and stock options | 12 | (1 | ) | ||||||||||
| — | — | Treasury shares purchased | (15 | ) | — | |||||||||||
| — | (7 | ) | Purchase of non-controlling interests | — | (23 | ) | ||||||||||
| — | — | Dividends paid, including dividends paid by subsidiaries to non-controlling interests | (142 | ) | (180 | ) | ||||||||||
| (13 | ) | 117 | Borrowings under (repayments of) long-term loans, net of direct financing costs | (213 | ) | 3 | ||||||||||
| — | — | Borrowings under (repayments of) short-term loans, net | — | (60 | ) | |||||||||||
| — | (2 | ) | Settlement of derivative instruments | (1 | ) | (1 | ) | |||||||||
|
|
|
|
|
|
|
|
| ||||||||
| (14 | ) | 109 | Net cash provided by (used in) financing activities | (359 | ) | (262 | ) | |||||||||
|
|
|
|
|
|
|
|
| ||||||||
| (12 | ) | (12 | ) | Effect of foreign currency translation | (28 | ) | (8 | ) | ||||||||
|
|
|
|
|
|
|
|
| ||||||||
| 194 | 546 | Net increase in cash and cash equivalents | 226 | 502 | ||||||||||||
|
|
|
|
|
|
|
|
| ||||||||
| 953 | (3) | 375 | Cash and cash equivalents at beginning of period | 921 | (1) | 419 | ||||||||||
| 1 147 | (2) | 921 | (1) | Cash and cash equivalents at end of period | 1 147 | (2) | 921 | (1) | ||||||||
|
|
|
|
|
|
|
| |||||||||
| (1) | Includes €1 million in assets classified as held for sale |
| (2) | Includes €2 million in assets classified as held for sale, net of €4 million bank overdrafts |
| (3) | Includes €3 million in assets classified as held for sale, net of €9 million bank overdrafts |
| Delhaize Group – Earnings Release – Fourth Quarter and Full Year 2013 | 13 of 28 |
| » | Selected Explanatory Notes |
General information
Delhaize Group is a Belgian international food retailer with operations in nine countries on three continents. The Company’s stock is listed on NYSE Euronext Brussels (DELB) and the New York Stock Exchange (DEG).
The full year 2013 and 2012 information in the condensed financial statements on pages 9-13 of this summary financial report (“report”) is based on Delhaize Group’s 2013 annual financial statements, which have not yet been published.
The condensed interim financial statements of the Group for the financial year ended December 31, 2013 were authorized for issue by the Board of Directors on March 12, 2014.
This interim report only provides an explanation of events and transactions that are significant to an understanding of the changes in financial position and reporting since the last annual reporting period, and should therefore be read in conjunction with the full 2013 consolidated financial statements, from which these condensed financial statements have been derived and which are planned to be published on the Delhaize Group website by April 7, 2014.
The Group’s statutory auditor confirmed that the audit opinion on the 2013 consolidated financial statements will be unqualified.
Basis of presentation and accounting policies
These condensed interim financial statements have been prepared in accordance with International Accounting Standard (IAS) 34Interim Financial Reporting, as issued by the International Accounting Standards Board (IASB), and as adopted by the European Union (EU).
The condensed interim financial statements are presented in millions of euros, the Group’s presentation currency, except where stated otherwise.
The accounting policies applied in this report are consistent with those applied in the Group’s 2012 consolidated financial statements except for the impact of new accounting pronouncements adopted in 2013, of which the most important ones for Delhaize Group are listed below:
| • | Amendments to IAS 1Presentation of Items of Other Comprehensive Income; |
| • | Amendments to IAS 19Employee Benefits; |
| • | Amendments to IAS 36Recoverable Amount Disclosure of Non-Financial Asset; |
| • | Amendments to IFRS 7Disclosures – Offsetting Financial Assets and Financial Liabilities; |
| • | Improvements to IFRS (issued May 2012); |
| • | IFRS 10Consolidated Financial Statementsand amendments to IAS 27 Separate Financial Statements; |
| • | IFRS 11Joint Arrangementsand amendments to IAS 28Investments in Associates and Joint Ventures; |
| • | IFRS 12 Disclosures of Interests in Other Entities; and |
| • | IFRS 13Fair Value Measurements. |
The initial application of these new, amended or revised pronouncements did not have a material impact on the financial position and financial performance of the Group. Comparative information has been revised to reflect the initial application of (i) the revised IAS 19 and (ii) IFRS 11. For more details, see Note 2.5 to the Delhaize Group 2012 consolidated financial statements.
We also refer to our comments in the section “Segment Reporting”, which explains changes made with respect to the identification of the most important measure of profit or loss.
Except for the amendments to IAS 36, Delhaize Group did not early adopt any new IASB pronouncements that were issued but not yet effective at the balance sheet date. We will report on these new pronouncements in our 2013 consolidated financial statements, too.
| Delhaize Group – Earnings Release – Fourth Quarter and Full Year 2013 | 14 of 28 |
Segment reporting
The chief operating decision maker (CODM, being the Executive Committee of Delhaize Group) internally reviews the performance of Delhaize Group’s segments against a number of measures. During 2013, internal reporting was amended to reflect the CODM’s increased attention to “underlying operating profit” (“UOP”), now representing the most important measure of profit or loss. UOP adjusts for a number of elements that the CODM considers as non-representative of the Group’s underlying operating performance. As of December 31, 2013, comparative information has been restated and a reconciliation from operating profit to UOP has been incorporated into the segment information. All other amounts of each segment items reported to the CODM equal consolidated IFRS financial information.
Segment information, including a reconciliation from operating profit to UOP, required by IAS 34 can be found on pages 5 and 23 of this press release and forms an integral part of this report.
Business combinations and acquisition of non-controlling interests
During 2013, Delhaize Group entered into several agreements in Southeastern Europe that have resulted in the acquisition of businesses and were accounted for as business combinations. The total consideration transferred during the year for these transactions was €9 million and resulted in an increase of goodwill of €3 million.
In addition, Delhaize Group reached an agreement with the former owner of Delta Maxi to settle all remaining indemnification assets and received €22 million in cash.
During 2013, Delhaize Group did not acquire additional non-controlling interests. However, during the year, Delhaize Group launched a tender offer to acquire 16% non-controlling interests in C-Market (Serbian subsidiary), held by the Serbian Privatization Agency, at a price of €300 per share (representing approximately €10 million). Later that year, the Serbian Privatization Agency informed the Group about its decision to temporarily suspend the privatization procedures of C-Market, due to a probe into the entity´s earlier privatization. This suspension was subsequently extended by an additional 180 business days due to a prolongation of an ongoing investigation of the entity´s original public offering on the Belgrade Stock Exchange in 2005. Neither the Group nor the current privatization process are target of these investigations. As the tender offer did not close at December 31, 2013, Delhaize Group continues to own 75.4% of C-Market.
Divestitures and discontinued operations
Divestitures
In 2013, Delhaize Group converted several of its Belgian company-operated City stores into affiliated Proxy stores, operated by independent third-parties. Delhaize Group received a total cash consideration of €12 million and recognized a gain on disposal of approximately €9 million, classified as “Other operating income”.
Disposal groups and assets held for sale
Disposal of Delhaize Montenegro
On July 11, 2013, Delhaize Group announced the sale of its Montenegrin operations (part of the “Southeastern Europe” segment) to Expo Commerce and presented the profit and loss as discontinued operations. Comparative information was re-presented.
Delhaize Group completed the transaction on November 19, 2013 for a total sales price of €5 million, subject to customary adjustments.
Disposal of Sweetbay, Harveys and Reid’s
On May 27 2013, Delhaize Group signed an agreement with Bi-Lo Holdings to divest its Sweetbay, Harveys, and Reid´s operations. The sales price is $267 million (€193 million) in cash, to be reduced by $20 million (€15 million) for restrictions imposed during the regulatory approval process and subject to other customary adjustments.
Assets and liabilities relating to these operations (being part of the “United States” segment) are classified as a disposal group held for sale, including the leases of ten previously closed Sweetbay locations but excluding Sweetbay’s distribution center, which is not part of the agreement and currently does not meet the criteria for
| Delhaize Group – Earnings Release – Fourth Quarter and Full Year 2013 | 15 of 28 |
classification as held for sale. The transaction also meets the definition of discontinued operations. Consequently, the relevant profit or loss after tax has been classified as “Result of discontinued operations”, with comparative information being re-presented.
The transaction is expected to be completed in 2014. In 2013, the 164 stores currently included in the transaction generated revenues of approximately $1.7 billion.
At December 31, 2013, the carrying value of assets classified as held for sale and associated liabilities related to the disposal of Sweetbay, Harveys and Reid’s were as follows:
(in millions of €) | 2013 | |||
Intangible assets | 12 | |||
Property, plant and equipment | 161 | |||
Inventories | 65 | |||
Receivables and other current assets | 3 | |||
Cash and cash equivalents | 2 | |||
Assets classified as held for sale | 243 | |||
Less: | ||||
Obligations under finance lease | (50 | ) | ||
Accounts payable, accrued expenses and other liabilities | (8 | ) | ||
Assets classified as held for sale, net of associated liabilities | 185 | |||
Disposal of Delhaize Albania SHPK
In February 2013, Delhaize Group completed the sale of its Albanian activities (“Delhaize Albania”) for a sales price of €1 million. The assets and liabilities of Delhaize Albania, that was part of the previously called “Southeastern Europe & Asia” segment had been presented as “held for sale” as of December 31, 2012 and the operating results of the Albanian company in previous years as well as the gain of €1 million realized on the sale were classified as “Results from discontinued operations” in the income statement.
Disposal of individual properties
Delhaize Group has identified a number of individual properties, mainly small shops, office buildings, pharmacies or bank branches, which it considers not incremental to its retail operations. The carrying value of these assets held for sale amounts to €7 million at December 31, 2013, of which €4 million in the U.S. and €3 million in the “Southeastern Europe” segment.
The individual properties classified as held-for-sale are predominantly measured at fair value less costs to sell. The fair values of these assets have been categorized in Level 2 in the fair value level hierarchy.
Discontinued operations
As mentioned above, Delhaize Montenegro, the banners Sweetbay, Harveys and Reid’s and Delhaize Albania qualified as discontinued operations.
The overall “Result from discontinued operations” and corresponding net cash flows of the entities classified as discontinued operations are summarized as follows:
| Delhaize Group – Earnings Release – Fourth Quarter and Full Year 2013 | 16 of 28 |
(in millions of €, except per share information) | 2013 | 2012 | ||||||
Revenues | 1 353 | 1 627 | ||||||
Cost of sales | (990 | ) | (1 183 | ) | ||||
Other operating income | 11 | 6 | ||||||
Selling, general and administrative expenses | (334 | ) | (434 | ) | ||||
Other operating expenses | (75 | ) | (54 | ) | ||||
Finance costs | (13 | ) | (13 | ) | ||||
Result before tax | (48 | ) | (51 | ) | ||||
Income taxes | 17 | 9 | ||||||
Result of discontinued operations (net of tax) | (31 | ) | (42 | ) | ||||
Pre-tax loss recognized on re-measurement of assets of disposal | (12 | ) | (16 | ) | ||||
Income taxes | — | — | ||||||
Result from discontinued operations (net of tax), fully attributable to equity holders of the Group | (43 | ) | (58 | ) | ||||
Basic earnings per share from discontinued operations | (0.43 | ) | (0.57 | ) | ||||
Diluted earnings per share from discontinued operations | (0.43 | ) | (0.57 | ) | ||||
Operating cash flows | 3 | (2 | ) | |||||
Investing cash flows | (5 | ) | (1 | ) | ||||
Financing cash flows | 15 | (16 | ) | |||||
Total cash flows | 13 | (19 | ) | |||||
In 2013, Delhaize Group recognized in “Other operating expenses” Sweetbay store closing charges of €46 million, onerous lease contract charges, severance costs and impairment losses related to headquarter and distribution centers that are impacted by the planned sale to Bi-Lo Holdings for a total amount of €19 million and incurred cost to sell of €9 million. The Group recognized a total impairment loss of €12 million to write down the carrying value of Delhaize Montenegro and Sweetbay, Harveys and Reid’s to its estimated fair value less cost to sell.
| » | Balance Sheet and Cash Flow Statement |
Goodwill and intangible assets
During the third quarter of 2013, the general economic situation in Serbia worsened significantly, impacting the Groups short- to mid-term expectations for its Serbian operations and resulting in an impairment indicator. Consequently, Delhaize Group performed an impairment review of its Serbian trade names and goodwill. The Group also identified impairment indicators with respect to the trade names recognized in Bulgaria.
As a result of the above, the Group recognized impairment charges of a total amount of €195 million, which can be detailed as follows:
(in millions of €) | Impairment recognized | Carrying value after impairment | ||||||
Serbia | ||||||||
Goodwill | 124 | 194 | ||||||
Trade names | 67 | 84 | ||||||
Bulgaria | ||||||||
Trade names | 4 | 10 | ||||||
|
|
|
| |||||
Total impairment | 195 | 288 | ||||||
The Group continues to expect to achieve long-term significant growth in Serbia and therefore, consistently with the 2012 year-end valuation, determined the recoverable amount based on a Fair Value Less Cost to Sell (FVLCTS). For December 31, 2013, the Group updated its valuation, which did not result in the recognition of any additional impairment charges. The key assumptions applied were as follows:
| Delhaize Group – Earnings Release – Fourth Quarter and Full Year 2013 | 17 of 28 |
| Perpetual Growth Rate | Pre-Tax discount rate | |||||||
Serbia | 2.8 | % | 15.1 | % | ||||
Delhaize Group estimated that a decrease in growth rate by 50 basis points, keeping all other assumptions constant, would further decrease the FVLCTS by €16 million. An increase of the discount rate by 100 basis points, keeping all other assumptions constant, would decrease the FVLCTS by €44 million. A simultaneous increase in the discount rate and decrease in growth rate by the before mentioned amounts would result in the carrying value of Serbia exceeding the FVLCTS by an additional €57 million. Alternatively, a reduction in the total projected future cash flows by 10%, keeping all other assumptions constant, would result in the carrying amount of Serbia exceeding the FVLCTS by an additional €49 million.
The recoverable amount of the trade names has been estimated using the royalty-relief-method. Royalty rates for the various brands range from 0.54% (Piccadilly) to 1.20% (Maxi), depending on the individual local strength of the different brands. Revenue growth and discount rates are consistent with the goodwill impairment testing. The Group decided to retire its Mini Maxi and Piccadilly Express brands and is converting these stores into a new format and therefore fully impaired these trade names.
During the fourth quarter, the Group performed its annual goodwill impairment review of the remaining Cash Generating Units, which did not result in the recognition of any further impairment charges.
Impairment losses are recognized in profit or loss in “Other operating expenses”.
Capital expenditures
During 2013, Delhaize Group incurred capital expenditures of €565 million, consisting of €486 million in property, plant and equipment and €79 million in intangible assets. In the fourth quarter of 2013, the Group incurred capital expenditures of €241 million, consisting of €216 million in property, plant and equipment and €25 million in intangible assets.
In addition, the Group added property under finance leases in 2013 for a total amount of €12 million (€9 million in the fourth quarter). The carrying amount of tangible and intangible assets that were sold or disposed in 2013 was €32 million (€12 million for the fourth quarter).
Equity
In 2013, Delhaize Group issued 528 072 new shares and purchased 328 924 of its own shares (none in the fourth quarter of 2013).
During 2013, Delhaize Group used 172 116 treasury shares (21 906 during the fourth quarter of 2013) satisfying mainly the vesting of restricted stock units that were granted as part of the share-based incentive plans. At December 31, 2013, the Group owned 1 200 943 treasury shares.
Dividends
At Delhaize Group’s shareholders’ meeting on May 23, 2013, Delhaize Group’s shareholders approved the distribution of a €1.40 gross dividend per share for financial year 2012. After deduction of a 25% withholding tax, this resulted in a net dividend of €1.05 per share. The 2012 dividend became payable to owners of Delhaize Group’s ordinary shares on May 31, 2013 and to owners of Delhaize Group ADRs (American Depository Receipts) on June 5, 2013 and was subsequently paid.
The Board of Directors will propose a gross dividend of €1.56 per share to be paid to owners of ordinary shares against coupon no. 52 on June 2, 2014. This dividend is subject to approval by shareholders at the Ordinary General Meeting of May 22, 2014 and, therefore, has not been included as a liability in Delhaize Group’s consolidated financial statements prepared under IFRS. After deduction of 25% Belgian withholding tax, the proposed net dividend is €1.17 per share.
Financial instruments
In May 2013, €80 million bonds issued by Delhaize Group’s subsidiary Alfa Beta matured and were repaid.
On January 3, 2013, Delhaize Group redeemed the remaining $99 million of the $300 million 5.875% senior notes due 2014, as well as the underlying cross-currency swap. The redemption did not have a significant impact on the 2013 results.
| Delhaize Group – Earnings Release – Fourth Quarter and Full Year 2013 | 18 of 28 |
Financial instruments measured at fair value by fair value hierarchy:
December 31, 2013 | ||||||||||||||||
(in millions of €) | Quoted prices in active markets (Level 1) | Significant other observable inputs (Level 2) | Significant unobservable inputs (Level 3) | Total | ||||||||||||
Financial Assets | ||||||||||||||||
Non-Current | ||||||||||||||||
Financial assets – measured at fair value | 8 | — | — | 8 | ||||||||||||
Derivative instruments | — | 1 | — | 1 | ||||||||||||
Current | ||||||||||||||||
Financial assets – measured at fair value | 126 | — | — | 126 | ||||||||||||
Derivative instruments | — | 40 | — | 40 | ||||||||||||
|
|
|
|
|
|
|
| |||||||||
Total financial assets measured at fair value | 134 | 41 | — | 175 | ||||||||||||
Financial assets measured at amortized cost | 1 813 | |||||||||||||||
|
| |||||||||||||||
Total financial assets | 1 988 | |||||||||||||||
Financial Liabilities | ||||||||||||||||
Non-Current | ||||||||||||||||
Derivative instruments | — | 8 | — | 8 | ||||||||||||
Current | ||||||||||||||||
Derivative instruments | — | 3 | — | 3 | ||||||||||||
|
|
|
|
|
|
|
| |||||||||
Total financial liabilities measured at fair value | — | 11 | — | 11 | ||||||||||||
Financial liabilities being part of a fair value hedge relationship | 530 | |||||||||||||||
Financial liabilities measured at amortized cost | 4 261 | |||||||||||||||
|
| |||||||||||||||
Total financial liabilities | 4 802 | |||||||||||||||
During the period there was no transfer between fair value hierarchy levels and there were no changes in the valuation techniques applied.
Fair value of financial instruments not measured at fair value:
(in millions of €) | Carrying amount | Fair value | ||||||
Long-term debt | ||||||||
Financial liabilities being part of a fair value hedge relationship | 530 | 546 | ||||||
Financial liabilities at amortized cost | 1 709 | 1 996 | ||||||
|
|
|
| |||||
Total long-term debt | 2 239 | 2 542 | ||||||
The fair value of the receivables, other financial assets, cash and cash equivalents and accounts payable, all measured at amortized cost, approximate their carrying amounts.
Employee benefits
U.S. operating entities Performance and Restricted Stock Unit awards and Warrants Plans
In May 2013, Delhaize Group granted 122 364 performance stock unit awards, 72 305 restricted stock unit awards and 368 139 warrants to senior management of its U.S. operating companies under the “Delhaize Group 2012 Stock Incentive Plan”. In November 2013, an additional 3 979 performance stock units and 11 237 warrants were granted. As from 2013, the vesting scheme of restricted stock units has been changed into a cliff vesting after 3 years (instead of the previous vesting scheme with vesting over a five-year period starting at the end of the second year following the grant date). The cliff-vesting of the performance stock units is linked to the achievement of a non-market financial performance condition (Return on Invested
| Delhaize Group – Earnings Release – Fourth Quarter and Full Year 2013 | 19 of 28 |
Capital (ROIC) targets over a cumulative 3-year period) which is taken into account when estimating the number of awards that will vest.
The fair value for the performance and restricted stock unit awards is based on the share price at the grant date. The warrants will vest ratably over a three-year period and expire ten years from the grant date. The fair value per warrant was estimated at the date of grant using the Black-Scholes-Merton model with the following assumptions:
| Nov. 2013 | May 2013 | |||||||
Share price (in $) | 58.40 | 64.75 | ||||||
Exercise price (in $) | 58.40 | 64.75 | ||||||
Expected dividend yield (%) | 3.6 | 3.6 | ||||||
Expected volatility (%) | 27.5 | 27.9 | ||||||
Risk-free interest rate (%) | 1.2 | 0.8 | ||||||
Expected term (years) | 4.4 | 4.4 | ||||||
Fair value per warrant | $ | 9.37 | $ | 10.26 | ||||
Non-U.S. operating entities Stock Options Plans
During the acceptance period which ended in July 2013, Delhaize Group issued 267 266 stock options to senior management of its non-U.S. operating companies. In November and December 2013, Delhaize Group granted respectively, 15 731 and 93 063 additional stock options. The options will vest over an approximately three and a half year period and will expire seven years from the grant date. The Black-Scholes-Merton model was used to calculate the option fair values (based on the weighted average share price over the acceptance period) using the following assumptions:
| Dec. 2013 | Nov. 2013 | May 2013 | ||||||||||
Share price (in €) | 43.20 | 43.67 | 50.09 | |||||||||
Exercise price (in €) | 41.71 | 43.67 | 49.85 | |||||||||
Expected dividend yield (%) | 3.4 | 3.4 | 3.4 | |||||||||
Expected volatility (%) | 24.3 | 24.5 | 27.0 | |||||||||
Risk-free interest rate (%) | 1.1 | 0.9 | 0.7 | |||||||||
Expected term (years) | 6.0 | 6.0 | 6.0 | |||||||||
Fair value per option | € | 6.98 | € | 6.52 | € | 8.43 | ||||||
Pension plans
Changes in the applicable labor law in Greece resulted in a decrease of the benefit that the employer is required to pay in connection with statutory indemnification payments to employees in cases of retirement or termination of employment. The amendment limits the number of relevant service years to 16 for all employees that did not exceed that number of years at the date of publication of the amended law. The revision of the defined benefit obligation based on the new legal requirements resulted in the recognition of negative past service cost of €3 million in the second quarter of 2013, which in accordance with the revised IAS 19 were recognized immediately in the income statement. Further, 2013 current service cost and net interest on the net defined benefit liability decreased by approximately €1 million.
| Delhaize Group – Earnings Release – Fourth Quarter and Full Year 2013 | 20 of 28 |
| » | Income Statement |
Other operating income
Q4 2013 | Q4 2012 | (in millions of €) | YTD 2013 | YTD 2012 | ||||||||||||
| 13 | 12 | Rental income | 50 | 49 | ||||||||||||
| 5 | 4 | Income from waste recycling activities | 20 | 19 | ||||||||||||
| 1 | 2 | Services rendered to wholesale customers | 6 | 7 | ||||||||||||
| 4 | 2 | Gain on sale of property, plant and equipment | 11 | 10 | ||||||||||||
| 3 | — | Gain on sale of businesses | 9 | — | ||||||||||||
| 8 | 9 | Other | 33 | 31 | ||||||||||||
|
|
|
|
|
|
|
|
| ||||||||
| 34 | 29 | Total | 129 | 116 | ||||||||||||
|
|
|
|
|
|
|
|
| ||||||||
In 2013, Delhaize Group converted several of its Belgian company-operated City stores into affiliated Proxy stores operated by independent third-parties, leading to a gain on disposal of €9 million, included in “Gain on sale of businesses”.
The caption “Other” contains a €7 million favorable impact of a litigation settlement for which a provision had been recorded during the purchase price allocation of Delta Maxi and a €4 million reversal of legal provisions in Serbia.
Other operating expenses
Q4 2013 | Q4 2012 | (in millions of €) | YTD 2013 | YTD 2012 | ||||||||||||
| 1 | 1 | Store closing expenses | (8 | ) | (126 | ) | ||||||||||
| 1 | — | Reorganization expenses | (15 | ) | — | |||||||||||
| (12 | ) | (218 | ) | Impairment | (213 | ) | (220 | ) | ||||||||
| (8 | ) | (12 | ) | Loss on sale of property, plant and equipment | (21 | ) | (21 | ) | ||||||||
| (10 | ) | 1 | Other | (13 | ) | (9 | ) | |||||||||
|
|
|
|
|
|
|
|
| ||||||||
| (28 | ) | (228 | ) | Total | (270 | ) | (376 | ) | ||||||||
|
|
|
|
|
|
|
|
| ||||||||
In January 2013, Delhaize Group announced the decision to close 52 stores, 45 stores in the U.S. (34 Sweetbay, 8 Food Lion and 3 Bottom Dollar Food), 6 stores in Southeastern Europe and 1 store in Belgium, which resulted in store closing expenses of €74 million in the first quarter of 2013. Following the announcement of the planned divesture of Sweetbay, €15 million were reversed and €50 million were reclassified in the second quarter into “Result of discontinued operations” (see also “Discontinued operations” above). Total store closing expenses in 2013 amount to €8 million.
In the first quarter of 2013, the Group also recorded €15 million reorganization charges related to the severance of support services senior management and employees in the U.S.
During the third quarter of 2013, Delhaize Group recognized €124 million goodwill impairment losses in Serbia and €72 million related to intangible assets (€67 million for the trade names in Serbia and €4 million in connection with the Piccadilly brands in Bulgaria). During 2013, additional impairment losses of €11 million were recorded on store assets, as well as €6 million on investment property.
In the fourth quarter of 2013 a legal provision of €6 million was recorded at Delhaize Belgium, which is included in the caption “Other”.
Income taxes
During 2013, the effective tax rate (on continued operations) was 25.9%, compared to previous year’s rate of 15.7%. Last year’s tax rate was lower due to the positive impact of the resolution of several tax matters in the U.S. Both years were significantly impacted by the non-deductible goodwill impairment charges at our Maxi business (in the third quarter of 2013 and the fourth quarter of 2012).
Related party transactions
In May 2013, an aggregate number of 160 943 stock options and warrants, and 28 380 performance stock units were granted to members of the Executive Committee. During the fourth quarter of 2013, an additional 120 031 stock options and warrants and 3 979 performance stock units were granted.
| Delhaize Group – Earnings Release – Fourth Quarter and Full Year 2013 | 21 of 28 |
In the second quarter, Delhaize Group announced the retirement of Pierre-Olivier Beckers, President and CEO of the Group, by the end of 2013, and the retirement of Michael Waller, Executive Vice President, General Counsel and General Secretary of the Group as of June 30, 2013. As a result of Pierre-Olivier Beckers’s retirement, the Group recognized in the second quarter termination benefits of €7.7 million, based on 18 months of compensation and a contribution to the Group’s defined contribution pension plan.
In the third quarter, Delhaize Group announced the resignation of Roland Smith, CEO of Delhaize America. As a result, the Group recognized termination benefits of €2.8 million, based on 18 months of compensation.
In the fourth quarter, Delhaize Group announced the resignation of Stefan Descheemaeker, CEO of Delhaize Europe. As a result, the Group recognized termination benefits of €0.9 million, based on ten months of compensation.
In 2013, the Group recorded an additional aggregate amount of €4.3 million related to the acceleration of the foregoing executives’ previously awarded long-term incentive grants and €1.5 million in Belgian social security contributions. Amounts were recorded in the quarter in which the executive’s departure was announced.
| » | Contingencies, Commitments and Guarantees |
In 2007, representatives of the Belgian Competition Authority visited Delhaize Belgium’s Procurement Department in Zellik, Belgium, and requested the provision of certain documents in connection with health and beauty products and other household goods. In 2012, the Auditor to the Belgian Competition Authority issued its investigation report. In September 2013, Delhaize Belgium and other retailers have lodged an appeal against the decision of the Auditor to utilize certain documents seized during the visits to Zellik and other companies’ facilities and have requested a suspension of the procedure pending in front of the Belgian Competition Authority. A decision by the Court of Appeal of Brussels on the suspension is expected in March or April 2014, and a decision on the merits of the procedural challenges is possible by the end of 2014.
In a separate matter related to another of Delhaize Group’s operations, Mega Image in Romania, the company has since 2009 answered a series of questionnaires sent by the Romanian Competition Authority to various suppliers and retailers operating in Romania in connection with an ongoing antitrust investigation. The questionnaires focused on the contractual and commercial relationships between the retailers and local food suppliers. At December 31, 2013, these broad inquiries have neither resulted in the issuance of any investigation report nor of a Statement of Objections. The Romanian legislation provides that antitrust fines, if any, are based on a percentage of the total turnover of the year preceding a decision by the Romanian Competition Plenum.
Following the closing of Delhaize Group’s agreed sale of Sweetbay, Harveys and Reid’s, the Group will provide guarantees for a number of existing operating or finance lease contracts, which extend through 2036. In the event of a future default of the buyer, Delhaize Group will be obligated under the terms of the contracts to the landlords. The future minimum lease payments over the non-cancellable lease term of the guaranteed leases, excluding other direct costs such as common area maintenance expenses and real estate taxes, amount to $275 million (€199 million) as of December 31, 2013. Currently, the Group does not expect to be required to pay any amounts under these guarantees.
Other contingencies are materially unchanged from those described in Note 34 on page 151 of the 2012 Annual Report.
| » | Subsequent Events |
In February 2014, Delhaize Group announced the planned sale of its Bulgarian operations to AP Mart. The Group expects to recognize an impairment loss of approximately €10 million and going forward will classify these operations as assets held for sale and discontinued operations. The transaction is expected to close in the second quarter of 2014 and is subject to regulatory approval as well as customary closing conditions and working capital adjustments.
Also in February 2014, Delhaize Group received approval from the U.S. Federal Trade Commission (FTC) to proceed with the sale its Sweetbay, Harveys and Reid’s operations to Bi-Lo. As part of the clearance, Bi-Lo agreed to divest 12 Delhaize America stores and Delhaize Group agreed to retain two other stores and convert them into the Food Lion banner. The final approval by the FTC will be issued after a 30-day comment period.
| Delhaize Group – Earnings Release – Fourth Quarter and Full Year 2013 | 22 of 28 |
OTHER FINANCIAL AND OPERATING INFORMATION (UNAUDITED)
| » | Use of non-GAAP (Generally Accepted Accounting Principles) Financial Measures |
Delhaize Group uses certain non-GAAP measures in its financial communication. Delhaize Group does not consider these measures as alternative measures to net profit or other financial measures determined in accordance with IFRS. These measures as reported by Delhaize Group may differ from similarly titled measures used by other companies. We believe that these measures are important indicators of our business performance and are widely used by investors, analysts and other interested parties. In the press release, the non-GAAP measures are reconciled to financial measures prepared in accordance with IFRS.
| » | Number of Stores |
| End of 2012 | End of Q3 2013 | Change Q4 2013 | End of 2013 | |||||||||||||
United States(1) | 1 553 | 1 508 | +6 | 1 514 | ||||||||||||
Belgium & Luxembourg | 840 | 848 | +4 | 852 | ||||||||||||
Greece | 268 | 281 | — | 281 | ||||||||||||
Romania | 193 | 252 | +44 | 296 | ||||||||||||
Serbia | 363 | 371 | +10 | 381 | ||||||||||||
Bulgaria | 43 | 53 | +1 | 54 | ||||||||||||
Bosnia and Herzegovina | 41 | 39 | — | 39 | ||||||||||||
Montenegro(2) | 24 | 23 | –23 | 0 | ||||||||||||
Indonesia | 103 | 113 | +4 | 117 | ||||||||||||
|
|
|
|
|
|
|
|
| ||||||||
Total | 3 428 | 3 488 | +46 | 3 534 | ||||||||||||
|
|
|
|
|
|
|
| |||||||||
| (1) | Of which 154 stores held for sale |
| (2) | Montenegro has been sold in November 2013 |
| » | Organic Revenue Growth Reconciliation |
| Q4 2013 | Q4 2012 | % Change | (in millions of €) | YTD 2013 | YTD 2012 | % Change | ||||||||||||||||||
| 5 338 | 5 335 | +0.1 | % | Revenues | 21 108 | 20 991 | +0.6 | % | ||||||||||||||||
| 158 | Effect of exchange rates | 430 | ||||||||||||||||||||||
| 5 496 | 5 335 | +3.0 | % | Revenues at identical exchange rates | 21 538 | 20 991 | +2.6 | % | ||||||||||||||||
| — | (11 | ) | Effect of the U.S. store portfolio optimization(1) | (5 | ) | (100 | ) | |||||||||||||||||
|
|
|
|
|
|
|
|
|
|
|
| |||||||||||||
| 5 496 | 5 324 | +3.2 | % | Organic revenue growth | 21 533 | 20 891 | +3.1 | % | ||||||||||||||||
|
|
|
|
|
|
|
|
|
|
|
| |||||||||||||
| (1) | The organic revenue growth excludes the revenues generated by the 126 U.S. stores, which were closed in Q1 2012 as part of the portfolio optimization, and the revenues generated by the 11 stores (8 Food Lion and 3 Bottom Dollar Food stores) closed in Q1 2013. |
| » | Underlying Operating Profit |
Delhaize Group believes “underlying operating profit” is a measure that, for external users of the financial statements, offers a more detailed view than “operating profit” of the operating performance of the period for the Group as it adjusts for a number of elements that management considers as non-representative of underlying operating performance.
| Delhaize Group – Earnings Release – Fourth Quarter and Full Year 2013 | 23 of 28 |
| Q4 2013 | ||||||||||||||||||||||||
| (in millions) | United States | United States | Belgium | SEE | Corporate | TOTAL | ||||||||||||||||||
| $ | € | € | € | € | € | |||||||||||||||||||
Operating profit (as reported) | 120 | 87 | 41 | 43 | (14 | ) | 157 | |||||||||||||||||
|
|
|
|
|
|
|
|
|
|
|
| |||||||||||||
Add/(substract): | ||||||||||||||||||||||||
Store closing expenses (reversals) | (1 | ) | (1 | ) | — | — | — | (1 | ) | |||||||||||||||
Reorganization expenses (reversals) | (1 | ) | (1 | ) | — | — | — | (1 | ) | |||||||||||||||
Fixed assets impairment charges (reversals) | 12 | 9 | 2 | 1 | — | 12 | ||||||||||||||||||
(Gains)/losses on disposal of fixed assets | (1 | ) | (1 | ) | 2 | 2 | 1 | 4 | ||||||||||||||||
(Gains)/losses on sale of business | — | — | (3 | ) | — | — | (3 | ) | ||||||||||||||||
Other | (1 | ) | — | 9 | 4 | 1 | 14 | |||||||||||||||||
|
|
|
|
|
|
|
|
|
|
|
| |||||||||||||
Underlying Operating Profit | 128 | 93 | 51 | 50 | (12 | ) | 182 | |||||||||||||||||
|
|
|
|
|
|
|
|
|
|
|
| |||||||||||||
| Q4 2012 | ||||||||||||||||||||||||
| (in millions) | United States | United States | Belgium | SEE | Corporate | TOTAL | ||||||||||||||||||
| $ | € | € | € | € | € | |||||||||||||||||||
Operating profit (loss) (as reported) | 122 | 94 | 56 | (144 | ) | (15 | ) | (9 | ) | |||||||||||||||
|
|
|
|
|
|
|
|
|
|
|
| |||||||||||||
Add/(substract): | ||||||||||||||||||||||||
Store closing expenses (reversals) | (3 | ) | (3 | ) | 1 | 1 | — | (1 | ) | |||||||||||||||
Reorganization expenses (reversals) | — | — | — | — | — | — | ||||||||||||||||||
Fixed assets impairment charges (reversals) | 34 | 27 | 5 | 186 | — | 218 | ||||||||||||||||||
(Gains)/losses on disposal of fixed assets | 2 | 1 | 8 | 1 | — | 10 | ||||||||||||||||||
(Gains)/losses on sale of business | — | — | — | — | — | — | ||||||||||||||||||
Other | (6 | ) | (5 | ) | (18 | ) | —�� | 1 | (22 | ) | ||||||||||||||
|
|
|
|
|
|
|
|
|
|
|
| |||||||||||||
Underlying Operating Profit | 149 | 114 | 52 | 44 | (14 | ) | 196 | |||||||||||||||||
|
|
|
|
|
|
|
|
|
|
|
| |||||||||||||
In the fourth quarter of 2013, the caption “Other” primarily consists of €4 million onerous lease provisions for operating stores at the SEE segment, €6 million of legal provision in Belgium and €1 million of termination expenses for one Executive Committee member.
The fourth quarter of 2012 was impacted primarily by €218 million of impairment charges, partially compensated by a net gain of €22 million in the caption “Other”. The “Other” items consist mainly of a gain of €9 million related to a settlement of a legal case in the U.S. and a payroll tax refund of €18 million in Belgium, which were primarily offset by a €6 million severance expense in the U.S.
| YTD 2013 | ||||||||||||||||||||||||
| (in millions) | United States | United States | Belgium | SEE | Corporate | TOTAL | ||||||||||||||||||
| $ | € | € | € | € | € | |||||||||||||||||||
Operating profit (as reported) | 574 | 432 | 187 | (85 | ) | (47 | ) | 487 | ||||||||||||||||
|
|
|
|
|
|
|
|
|
|
|
| |||||||||||||
Add/(substract): | ||||||||||||||||||||||||
Store closing expenses (reversals) | 8 | 6 | — | 2 | — | 8 | ||||||||||||||||||
Reorganization expenses (reversals) | 24 | 18 | — | — | — | 18 | ||||||||||||||||||
Fixed assets impairment charges (reversals) | 21 | 16 | 2 | 195 | — | 213 | ||||||||||||||||||
(Gains)/losses on disposal of fixed assets | (1 | ) | (1 | ) | 8 | 1 | 2 | 10 | ||||||||||||||||
(Gains)/losses on sale of business | — | — | (9 | ) | — | — | (9 | ) | ||||||||||||||||
Other | 13 | 10 | 10 | 1 | 5 | 26 | ||||||||||||||||||
|
|
|
|
|
|
|
|
|
|
|
| |||||||||||||
Underlying Operating Profit | 639 | 481 | 198 | 114 | (40 | ) | 753 | |||||||||||||||||
|
|
|
|
|
|
|
|
|
|
|
| |||||||||||||
| Delhaize Group – Earnings Release – Fourth Quarter and Full Year 2013 | 24 of 28 |
| YTD 2012 | ||||||||||||||||||||||||
| (in millions) | United States | United States | Belgium | SEE | Corporate | TOTAL | ||||||||||||||||||
| $ | € | € | € | € | € | |||||||||||||||||||
Operating profit (as reported) | 454 | 353 | 201 | (97 | ) | (42 | ) | 415 | ||||||||||||||||
|
|
|
|
|
|
|
|
|
|
|
| |||||||||||||
Add/(substract): | ||||||||||||||||||||||||
Store closing expenses (reversals) | 142 | 110 | 1 | 15 | — | 126 | ||||||||||||||||||
Reorganization expenses (reversals) | — | — | — | — | — | — | ||||||||||||||||||
Fixed assets impairment charges (reversals) | 35 | 28 | 5 | 187 | — | 220 | ||||||||||||||||||
(Gains)/losses on disposal of fixed assets | 6 | 4 | 7 | — | — | 11 | ||||||||||||||||||
(Gains)/losses on sale of business | — | — | — | — | — | — | ||||||||||||||||||
Other | 39 | 30 | (18 | ) | — | 1 | 13 | |||||||||||||||||
|
|
|
|
|
|
|
|
|
|
|
| |||||||||||||
Underlying Operating Profit | 676 | 525 | 196 | 105 | (41 | ) | 785 | |||||||||||||||||
|
|
|
|
|
|
|
|
|
|
|
| |||||||||||||
2013 was significantly impacted by €213 million impairment charges, €18 million reorganization charges related to the severance of support services senior management and employees in the U.S. (primarily included in “Other operating expenses”), €17 million Executive Committee members termination benefits, a €6 million legal provision in Belgium, €4 million onerous lease provisions at SEE, partially offset by a €9 million gain resulting from the sale of City stores and a €5 million net impact related to favorable litigation settlements.
2012 was impacted by €220 million impairment charges and the store portfolio optimization expenses: €126 million of store closing expenses and €22 million of related expenses, included in the caption “Other” and mainly consisting of sales price mark-downs and accelerated depreciation. In addition, the caption “Other” includes storm damage expenses of €5 million, a retirement expense of €3 million and severance expenses of €6 million, partially compensated by a net gain of €6 million on the settlement of legal cases in the U.S. and a payroll tax refund of €18 million in Belgium.
| » | EBITDA Reconciliation |
| Q4 2013 | Q4 2012 | (in millions of €) | YTD 2013 | YTD 2012 | ||||||||||||
| 157 | (9 | ) | Operating profit (loss) | 487 | 415 | |||||||||||
| 143 | 150 | Depreciation and amortization | 579 | 599 | ||||||||||||
| 12 | 218 | Impairment | 213 | 220 | ||||||||||||
|
|
|
|
|
|
|
|
| ||||||||
| 312 | 359 | EBITDA | 1 279 | 1 234 | ||||||||||||
|
|
|
|
|
|
|
| |||||||||
| » | Underlying Group Share In Net Profit From Continued Operations Reconciliation |
(in millions of €) | YTD 2013 | YTD 2012 | ||||||
Net profit from continuing operations | 226 | 160 | ||||||
|
|
|
| |||||
Add/(substract): | ||||||||
Net (profit) loss from non controlling interests | (4 | ) | 2 | |||||
Elements considered in the underlying profit calculation | 266 | 370 | ||||||
Non-recurring finance costs | 0 | 19 | ||||||
Effect of the above items on taxes and non-controlling interests | (35 | ) | (78 | ) | ||||
Non-recurring income tax expense (benefit) | 0 | (47 | ) | |||||
|
|
|
| |||||
Underlying Group share in net profit from continued operations | 453 | 426 | ||||||
|
|
|
| |||||
| » | Free Cash Flow Reconciliation |
| Q4 2013 | Q4 2012 | (in millions of €) | YTD 2013 | YTD 2012 | ||||||||||||
| 445 | 581 | Net cash provided by operating activities | 1 185 | 1 402 | ||||||||||||
| (225) | (132 | ) | Net cash used in investing activities | (572 | ) | (630 | ) | |||||||||
| (14) | (2 | ) | Net investment in debt securities and term deposits | 56 | 1 | |||||||||||
|
|
|
|
|
|
|
|
| ||||||||
| 206 | 447 | Free cash flow | 669 | 773 | ||||||||||||
|
|
|
|
|
|
|
| |||||||||
| Delhaize Group – Earnings Release – Fourth Quarter and Full Year 2013 | 25 of 28 |
| » | Net Debt Reconciliation |
(in millions of €, except net debt to equity ratio) | December 31, 2013 | December 31, 2012 | ||||||
Non-current financial liabilities | 2 507 | 2 925 | ||||||
Current financial liabilities | 291 | 218 | ||||||
Derivative liabilities | 11 | 14 | ||||||
Derivative assets | (41 | ) | (61 | ) | ||||
Investment in securities - non-current | (8 | ) | (11 | ) | ||||
Investment in securities - current | (126 | ) | (93 | ) | ||||
Term deposits - current | (12 | ) | — | |||||
Cash and cash equivalents | (1 149 | ) | (920 | ) | ||||
|
|
|
| |||||
Net debt | 1 473 | 2 072 | ||||||
Net debt to equity ratio | 29.0 | % | 39.9 | % | ||||
|
|
|
| |||||
| » | Identical Exchange Rates Reconciliation |
(in millions of €, except per share amounts) | Q4 2013 | Q4 2012 | 2013/2012 | |||||||||||||||||||||
| At Actual Rates | Impact of Exchange Rates | At Identical Rates | At Actual Rates | At Actual Rates | At Identical Rates | |||||||||||||||||||
Revenues | 5 338 | 158 | 5 496 | 5 335 | +0.1 | % | +3.0 | % | ||||||||||||||||
Operating profit (loss) | 157 | 5 | 162 | (9 | ) | N/A | N/A | |||||||||||||||||
Net profit (loss) from continuing operations | 100 | 3 | 103 | (115 | ) | N/A | N/A | |||||||||||||||||
Basic EPS from continuing operations | 0.98 | 0.02 | 1.00 | (1.12 | ) | N/A | N/A | |||||||||||||||||
Group share in net profit (loss) | 101 | 3 | 104 | (169 | ) | N/A | N/A | |||||||||||||||||
Basic EPS from Group share in net profit (loss) | 1.00 | 0.02 | 1.02 | (1.68 | ) | N/A | N/A | |||||||||||||||||
Free cash flow | 206 | 3 | 209 | 447 | –54.0 | % | –53.3 | % | ||||||||||||||||
(in millions of €, except per share amounts) | YTD 2013 | YTD 2012 | 2013/2012 | |||||||||||||||||||||
| At Actual Rates | Impact of Exchange Rates | At Identical Rates | At Actual Rates | At Actual Rates | At Identical Rates | |||||||||||||||||||
Revenues | 21 108 | 430 | 21 538 | 20 991 | +0.6 | % | +2.6 | % | ||||||||||||||||
Operating profit | 487 | 15 | 502 | 415 | +17.3 | % | +20.8 | % | ||||||||||||||||
Net profit from continuing operations | 226 | 8 | 234 | 160 | +41.1 | % | +46.2 | % | ||||||||||||||||
Basic EPS from continuing operations | 2.20 | 0.08 | 2.28 | 1.61 | +36.8 | % | +41.7 | % | ||||||||||||||||
Group share in net profit | 179 | 7 | 186 | 104 | +71.8 | % | +78.5 | % | ||||||||||||||||
Basic EPS from Group share in net profit | 1.77 | 0.07 | 1.84 | 1.03 | +71.4 | % | +78.1 | % | ||||||||||||||||
Free cash flow | 669 | 16 | 685 | 773 | –13.4 | % | –11.3 | % | ||||||||||||||||
(in millions of €) | December 31, 2013 | December 31, 2012 | Change | |||||||||||||||||||||
Net debt | 1 473 | (1 | ) | 1 472 | 2 072 | –28.9 | % | –29.0 | % | |||||||||||||||
| Delhaize Group – Earnings Release – Fourth Quarter and Full Year 2013 | 26 of 28 |
CERTIFICATION OF RESPONSIBLE PERSONS
The undersigned Frans Muller, President and Chief Executive Officer of Delhaize Group, and Pierre Bouchut, Chief Financial Officer of Delhaize Group, confirm that to the best of their knowledge:
a) these condensed consolidated financial statements for the year ended December 31, 2013 are prepared in accordance with IFRS (International Financial Reporting Standards) and give, in all material respects, a true and fair view of the consolidated financial position and consolidated results of Delhaize Group;
b) the summary financial report gives, in all material respects, a true and fair view of all important events and significant transactions with related parties that have occurred in the financial year 2013 and their effects on the summary financial statements, as well as an overview of the most significant risks and uncertainties with which we are confronted.
Brussels, March 12, 2014
| Frans Muller | Pierre Bouchut | |
| President and CEO | Executive Vice President and CFO |
REPORT OF THE STATUTORY AUDITOR
The statutory auditor, Deloitte Reviseurs d’Entreprises SCC, represented by Mr. Michel Denayer, confirmed on March 12, 2014, that the audit opinion on the annual consolidated financial statements of Delhaize Group for the year ended December 31, 2013, is unqualified. The annual financial information included in this press release is in accordance with the annual financial statements authorized for issue by the Board of Directors on March 12, 2014.
RISKS
We regularly evaluate the potential disposition of assets and businesses that may no longer help us meet our objectives. When we decide to sell assets or a business, we may encounter difficulty in finding buyers or alternative exit strategies on acceptable terms in a timely manner, which could delay the achievement of our strategic objectives. We may also dispose of a business at a price or on terms that are less desirable than we had anticipated. In addition, we may experience greater dis-synergies than expected, and the impact of the divestiture on our revenue growth may be larger than projected. After reaching an agreement with a buyer or seller for the disposition of a business, we are subject to satisfaction of pre-closing conditions as well as to necessary regulatory and governmental approvals on acceptable terms, which, if not satisfied or obtained, may prevent us from completing the transaction. Dispositions may also involve continued financial involvement in the divested business, such as through continuing equity ownership, guarantees, indemnities or other financial obligations. The company’s business or financial results may be negatively affected if divestitures are not successfully completed.
In accordance with the Belgian Royal Decree of November 14, 2007, Delhaize Group states that the other fundamental risks confronting the Company are unchanged from those described on the pages 58 through 65 of the 2012 Annual Report. To the best of our knowledge as of March 12, 2014, there are no other fundamental risks confronting the Company and influencing the remaining months of the financial year 2014. On a regular basis, the Board of Directors and Company management evaluate the business risks that confront Delhaize Group.
| Delhaize Group – Earnings Release – Fourth Quarter and Full Year 2013 | 27 of 28 |
DEFINITIONS
| • | Basic earnings per share: profit or loss attributable to ordinary equity holders of the parent entity divided by the weighted average number of shares outstanding during the period. Basic earnings per share are calculated on profit from continuing operations less non-controlling interests attributable to continuing operations, and on the group share in net profit |
| • | Comparable store sales: sales from the same stores, including relocations and expansions, and adjusted for calendar effects |
| • | Diluted earnings per share: is calculated by adjusting the profit or loss attributable to ordinary equity shareholders and the weighted average number of shares outstanding for the effects of all dilutive potential ordinary shares, including those related to convertible instruments, options or warrants or shares issued upon the satisfaction of specified conditions |
| • | EBITDA: operating profit plus depreciation, amortization and impairment |
| • | Free cash flow: cash flow before financing activities, investment in debt securities and term deposits and sale and maturity of debt securities and term deposits |
| • | Net debt: non-current financial liabilities, plus current financial liabilities and derivatives liabilities, minus derivative assets, investments in securities and term deposits, and cash and cash equivalents |
| • | Net financial expenses: finance costs less income from investments |
| • | Organic revenue growth: sales growth, excluding sales from acquisitions and divestitures, at identical currency exchange rates |
| • | Outstanding shares: the number of shares issued by the Company, excluding treasury shares |
| • | Underlying EBITDA: Underlying operating profit plus depreciation and amortization less any depreciation or amortization that has been excluded from underlying operating profit |
| • | Underlying Group share in net profit from continued operations: Net profit from continuing operations minus non-controlling interests (from continuing operations) and excluding (i) the elements excluded from operating profit to determine underlying operating profit (see separate definition), (ii) material non-recurring finance costs (e.g. debt refinancing costs) and income tax expense (e.g. tax settlements), and (iii) the potential effect of all these items on income tax and non-controlling interests. |
| • | Underlying operating profit: operating profit excluding fixed assets impairment charges, reorganization charges, store closing expenses, gains/losses on disposal of fixed assets and businesses and other items that management considers as not being representative of the Group’s operating performance of the period. Weighted average number of shares: number of shares outstanding at the beginning of the period less treasury shares, adjusted by the number of shares cancelled, repurchased or issued during the period multiplied by a time-weighting factor |
| • | Working capital: inventories plus receivables and other current assets, minus accounts payable and other current liabilities |
CAUTIONARY NOTE REGARDING FORWARD LOOKING STATEMENTS
Statements that are included or incorporated by reference in this press release and other written and oral statements made from time to time by Delhaize Group and its representatives, other than statements of historical fact, which address activities, events and developments that Delhaize Group expects or anticipates will or may occur in the future, including, without limitation, when the sale of Sweetbay, Harveys and Reid´s to Bi-Lo Holdings is expected to be completed; the financial flexibility that will result from the sale; the ultimate value of the transaction to Delhaize Group after working capital adjustments, expected costs savings, the closing, conversion and opening of stores, the expected effect of the portfolio optimization, anticipated revenue and net profit growth, anticipated free cash flow generation, strategic options, future strategies and the anticipated benefits of these strategies and (underlying) operating profit guidance, are “forward-looking statements” within the meaning of the U.S. federal securities laws that are subject to risks and uncertainties. These forward-looking statements generally can be identified as statements that include phrases such as “guidance,” “outlook,” “projected,” “believe,” “target,” “predict,” “estimate,” “forecast,” “strategy,” “may,” “goal,” “expect,” “anticipate,” “intend,” “plan,” “foresee,” “likely,” “will,” “should” or other similar words or phrases. Although such statements are based on current information, actual outcomes and results may differ materially from those projected depending upon a variety of factors, including, but not limited to, conditions to closing the sale of Sweetbay, Harveys and Reid´s to Bi-Lo Holdings, including regulatory approvals; changes in the general economy or the markets of Delhaize Group, in strategy, in consumer spending, in inflation or currency exchange rates or in legislation or regulation; competitive factors; adverse determination with respect to claims; inability to timely develop, remodel, integrate, open, convert or close stores; and supply or quality control problems with vendors. Additional risks and uncertainties that could cause actual results to differ materially from those stated or implied by such forward-looking statements are described in Delhaize Group’s most recent Annual Report on Form 20-F and other filings made by Delhaize Group with the U.S. Securities and Exchange Commission, which risk factors are incorporated herein by reference. Delhaize Group disclaims any obligation to update developments of these risk factors or to announce publicly any revision to any of the forward-looking statements contained in this release, including guidance with respect to underlying operating profit, SG&A, net finance costs, capital expenditures, store openings and free cash flow, or to make corrections to reflect future events or developments.
| Delhaize Group – Earnings Release – Fourth Quarter and Full Year 2013 | 28 of 28 |
 Analyst Meeting March 13, 2014 |
 2 Forward looking statements This presentation includes forward-looking statements within the meaning of the U.S. federal securities laws that are subject to risks and uncertainties. Forward-looking statements describe further expectations, plans, options, results or strategies. Actual outcomes and results may differ materially from those projected depending upon a variety of factors, including but not limited to changes in the general economy or the markets of Delhaize Group, in consumer spending, in inflation or currency exchange rates or in legislation or regulation; competitive factors; adverse determination with respect to claims; inability to timely develop, remodel, integrate or convert stores; and supply or quality control problems with vendors. Additional risks and uncertainties that could cause actual results to differ materially from those stated or implied by such forward-looking statements are described in our most recent annual report or Form 20-F and other filings with the Securities and Exchange Commission. Delhaize Group disclaims any obligation to update or revise the information contained in this presentation. |
 Agenda • Diagnostic • Strategic priorities • Q4 and FY 2013 results • Operational overview • Food Lion • Hannaford • Delhaize Belgium • Southeastern Europe • Financial framework • Conclusion 3 |
 CEO diagnostic • Leadership positions in most markets where we operate • Sense of momentum, notably at Food Lion • Strong financial profile with a solid BBB- credit rating • Talented and passionate associates Delhaize has strong foundations… …but we need to address specific issues • Profitability is under pressure in our key markets • Complexity • Need to accelerate omni channel 4 |
 Leadership positions in the markets where we operate Market Position (2) US (1) 1 or 2 in markets accounting for 2/3 of sales Belgium 2 Greece 1 Serbia 1 Bucharest 1 (1) Food Lion and Hannaford DMAs (2) Source: Nielsen 5 |
 6 There is a sense of momentum in the business, notably at Food Lion 2013 Organic revenue growth • Food Lion experienced volume growth for 5 quarters in a row • Positive volume growth at Hannaford • Stabilisation of market share at Delhaize Belgium • Reached #1 position in Greece 2013 Highlights SEE 5.0% Belgium 3.0% US 2.7% Delhaize Group 3.1% 1.8% Q3 2013 2.2% Q4 2013 4.4% Q1 2012 Q2 2012 Q3 2012 -4.5% Q1 2013 -2.8% 2.5% -0.3% Q4 2012 3.1% Q2 2013 Food Lion real growth |
 7 Strong Free Cash Flow generation has reinforced our financial profile • Delhaize Group is rated Baa3 by Moody’s and BBB- by S&P Baa2 Baa3 Ba1 25% 20% 3.0x 4.0x 23.7% 3.3x BBB BBB- BB+ 39.6% 1.9x 30% 25% 2.5x 3.0x Moody’s Adj. RCF / Adj. Net Debt Adj. Debt / Adj. EBITDA S&P Adj. FFO / Adj. Net Debt Adj. Net Debt / Adj. EBITDA |
 and we possess talented and passionate associates 8 |
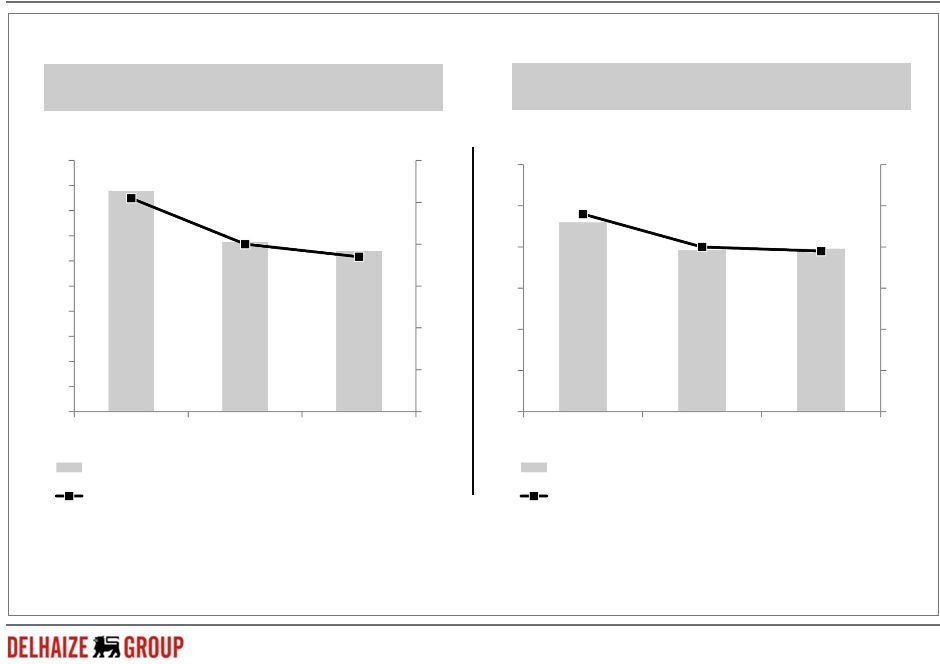 However, our profitability is under pressure in our key markets US Belgium 9 0 100 200 300 400 500 600 700 800 900 1,000 0% 1% 2% 3% 4% 5% 6% 2011 2012 2013 Underlying operating profit (in $ millions) Underlying operating margin 5.1% 4.0% 3.7% 0 50 100 150 200 250 300 2011 2012 2013 4.8% 4.0% 3.9% 0% 1% 2% 3% 4% 5% 6% Underlying operating profit (in Underlying operating margin € millions) |
 10 and we still need to address complexity Focus to reduce complexity and accelerate performance Geographies Formats Organisation - supermarkets, convenience, online - other formats - countries - regions - too many organizational layers - need for decisiveness and accountability |
 11 Agenda • Diagnostic • Strategic priorities • Q4 and FY 2013 results • Operational overview • Food Lion • Hannaford • Delhaize Belgium • Southeastern Europe • Financial framework • Conclusion |
 Priorities Principles Delhaize Group’s identity is clear Who we are • Preferred food retailer in the supermarket segment • Differentiated concept and offering that is relevant to our customers • Recognized for fresh assortment and Private Label expertise • Multinational • Strong local identity (convenient locations, local brands and assortment, local community) • Respectful of all Stakeholders 12 |
 13 We have principles to guide us Priorities Principles Who we are • Preferred food retailer in the supermarket segment • Differentiated concept and offering that is relevant to our customers • Recognized for fresh assortment and Private Label expertise • Multinational • Strong local identity (convenient locations, local brands and assortment, local community) • Respectful of all Stakeholders • The customer is at the center • Business is local and market share matters • Strengthen our core capabilities and improve those needed to succeed • Exercise discipline in capital allocation • Use scale to reduce costs • Respond to industry dynamics and trends |
 ... and we have established the following priorities Priorities Principles Who we are 14 • Put the customer back at the center • Focus on core markets • Execute with speed • The customer is at the center • Business is local and market share matters • Strengthen our core capabilities and improve those needed to succeed • Exercise discipline in capital allocation • Use scale to reduce costs • Respond to industry dynamics and trends • Preferred food retailer in the supermarket segment • Differentiated concept and offering that is relevant to our customers • Recognized for fresh assortment and Private Label expertise • Multinational • Strong local identity (convenient locations, local brands and assortment, local community) • Respectful of all Stakeholders • Realize more operating efficiencies |
 Customer-focused initiatives... Fresh and Organic Products example: Alfa Beta « close to Greek nature » assortment; Delhaize Le Lion Bio brand Tailor Assortments examples: Food Lion work on assortment; private brand positioning in the US Clear commercial positioning per banner example: Delhaize Le Lion : back to our roots Better Value through more sophisticated pricing, promotions and customer offer example: new pricing tool in the US; Alfa Beta 75 years; new CRM tool in Greece E-commerce examples: Delhaize Direct; Hannaford To Go Easier shopping experience examples: Food Lion check-out systems; Delhaize Le Lion self check-out Private brands examples: Taste of Inspirations, Delhaize brand, Maxi range extension 15 |
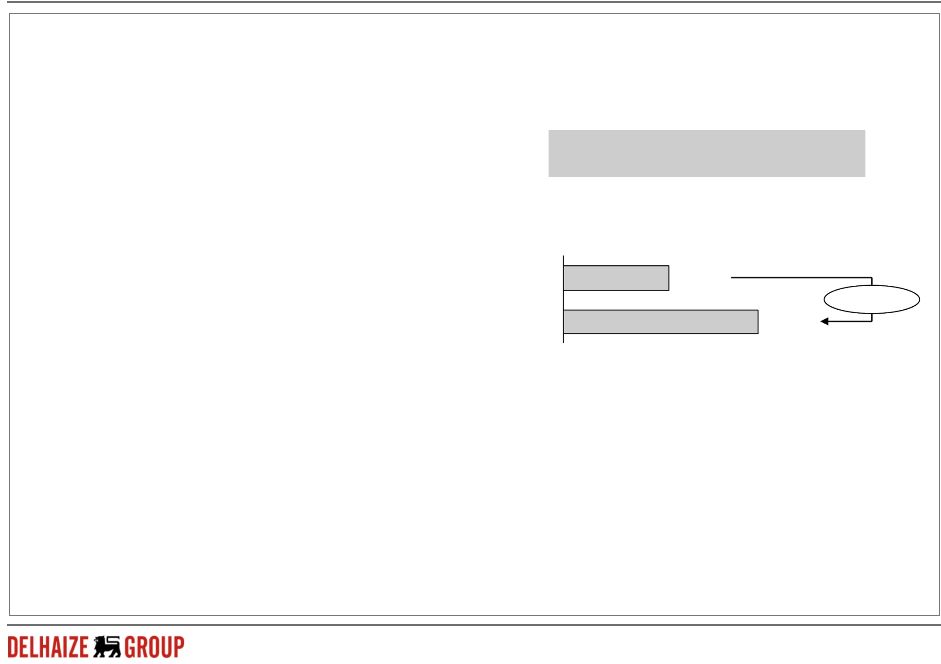 ... will be funded by efficiency improvements • SG&A reduction • Disciplined capex allocation • Further working capital improvement 21.2% 20.7% 2006 2013 SG&A (1) (1) As reported in the 2006 annual report taking into acount the then existing scope +50 bps 16 |
 We will accelerate omni channel • Digital organisation being built • Belgium • Home delivery operation and 119 PUPs at the store (largely fed by warehouse) • Web infrastructure and mobile applications in place • 2014: Build Enterprise Data Warehouse, Optimize eCommerce models, accelerate growth • Hannaford • 2 PUPs • 2014: Implement Order Management System, build team capability, 10 more PUPs • Alfa Beta • Leverage home delivery • 2014: Enterprise Data Warehouse, install web infrastructure 17 |
 18 Agenda • Diagnostic • Strategic priorities • Q4 and FY 2013 results • Operational overview • Food Lion • Hannaford • Delhaize Belgium • Southeastern Europe • Financial framework • Conclusion |
 19 Q4 2013 highlights by region • U.S. • Fifth consecutive quarter of positive volume growth • Food Lion’s momentum supported by completion of Phase repositioning • Profit evolution impacted by price investments • Belgium • Solid year-end sales • Profitability impacted by promotional environment • SEE • Alfa Beta and Mega Image continued to perform well • Serbia performing below our expectations |
 20 Financial results – Q4 2013 Revenues Gross Margin Underlying Operating Profit Underlying Operating Margin 2012 2013 Q4 Actual Rates Identical Rates 5,335 5,338 0.1% 3.0% 24.1% 23.9% 196 182 (7.4%) (4.8%) 3.7% 3.4% (28 bps) (28 bps) (26 bps) (21 bps) Group Share in Net Profit (Loss) (169) 101 Free Cash Flow 447 206 (54.0%) (53.3%) N/A N/A % Growth Organic revenues 5,324 5,496 N/A 3.2% ( in Millions) ! |
 Financial results – 2013 2012 2013 FY Actual Rates Identical Rates ( in Millions) 20,991 21,108 0.6% 2.6% 785 3.7% 753 3.6% (230) (188) (18.3%) (16.1%) (29) (77) 166.2% 171.7% (4.2%) (18 bps) (2.1%) (17 bps) 104 179 773 669 (13.4%) (11.3%) 71.8% 78.5% % Growth Revenues Net finance costs Income tax expenses Gross Margin 24.3% 24.2% (12 bps) (8 bps) Underlying Operating Profit / Margin Discontinued operations (58) (43) 25.3% 23.5% Group share in Net Profit Free Cash Flow Organic revenues 20,891 21,533 N/A 3.1% 21 ! |
 22 EBITDA At Identical Rates At Actual Rates -1.5% 2013 1,361 2012 1,381 -3.5% 2013 1,332 2012 1,381 Underlying EBITDA EBITDA +5.9% 2013 1,307 2012 1,234 +3.7% 2013 1,279 2012 1,234 ( in Millions) ! |
 23 Delhaize America - organic revenue growth and comparable store sales growth 2013 Q4 Delhaize America (1) 2013 (1) Excluding Sweetbay, Harveys and Reid’s (2) 126 Food Lion stores closed in Q1 2012, 8 Food Lion and 3 Bottom Dollar Food stores closed in Q1 2013 +2.8% +0.4% +2.8% Revenue growth Store closings -0.4% Organic growth Expansion Calendar Impact CSS +2.0% +0.6% +2.7% +1.9% +0.1% Revenue growth Store closings -0.8% Organic growth Expansion Calendar Impact CSS (2) (2) +3.2% 0.0% |
 24 Delhaize America – underlying operating margin Delhaize America Underlying Operating Margin Q4 2013 3.0% Q4 2012 3.6% 2013 3.7% 2012 4.0% - Q4 2013 margin impacted by: • Price investments of around ~70bps (Food Lion Phase 4 & 5, Hannaford) • Volume growth • Good control on cost of goods |
 Delhaize Belgium - organic revenue growth and comparable store sales growth +2.4% +0.6% Organic growth +2.5% Expansion Calendar Impact CSS -0.5% 2013 Q4 2013 Delhaize Belgium +1.8% +1.4% Organic growth +3.0% Expansion Calendar Impact -0.2% CSS 25 |
 26 Delhaize Belgium – underlying operating margin Q4 2012 Q4 2013 3.8% 4.0% 2012 2013 3.9% 4.0% Delhaize Belgium Underlying Operating Margin - Q4 margin impacted by: • Higher promotions • Timing of SG&A expenses |
 27 SEE - organic revenue growth and comparable store sales growth Organic growth +4.5% Expansion +5.5% Calendar Impact -0.4% CSS 2013 Q4 2013 Southeastern Europe Organic growth +5.0% Expansion +5.1% Calendar Impact +0.2% CSS -0.3% (1) At identical exchange rates -0.6% (1) |
 SEE – underlying operating margin Q4 2013 5.9% Q4 2012 5.3% 2013 3.6% 2012 3.5% Southeastern Europe Underlying Operating Margin 28 - Q4 margin impacted by: • Improved procurement conditions in Romania and Serbia • Cost control |
 29 Strong Free Cash Flow generation in 2013 Free Cash Flow evolution (1) Including €62 million from discontinued operations (2) Including among others €28 million from business acquisitions and disposals and the positive impact from the lower 2012 US bonus (paid in 2013) (2) 2013 FCF Other Cash capex Payment of interest and taxes Changes in core working capital Portfolio optimization and reorganisation cash-out Underlying EBITDA (1) ( in Millions) ! 87 294 565 116 669 1,394 69 |
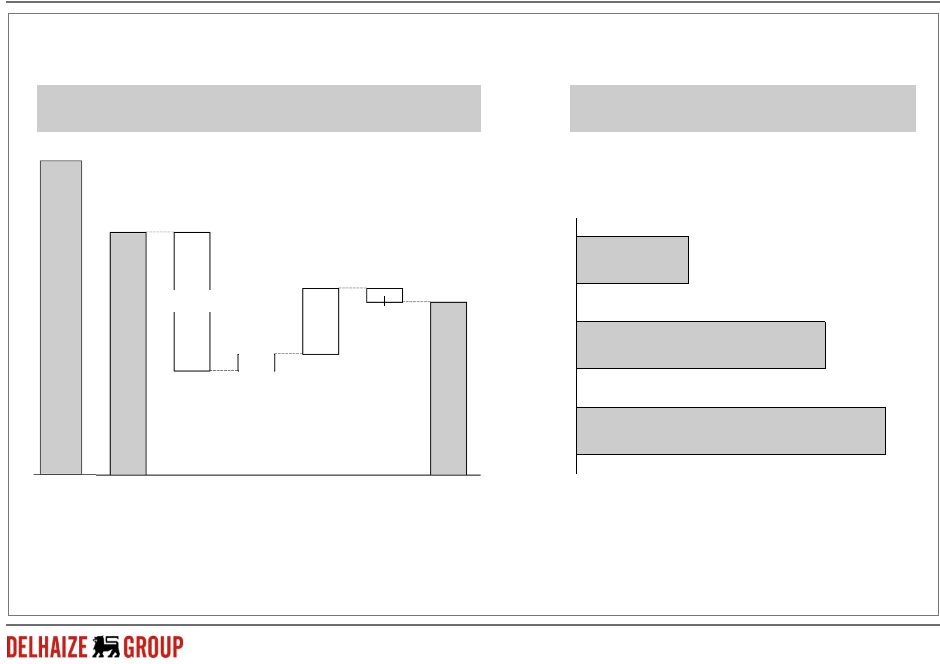 Net debt decreased by €1.2 billion over the last 2 years (! in Millions) Dec. 2013 Net Debt Other Capex Dividend OCF 1,185 Dec. 2012 Net Debt Sources and uses of funds Net cash position 419 920 Dec-13 1,149 Dec-12 Dec-11 2,660 Dec. 2011 Net Debt 30 565 1,473 121 2,072 142 |
 31 Current trading update • Very solid sales trends in the U.S., partly helped by severe winter weather • Phase repositioning completed in the U.S. • Consolidation of good momentum in Greece • Profitable network expansion in Romania • U.S.: Extra costs due to winter weather, cycling of Easter in Q1 13, cycling of price investments • Intensification of price competition in Belgium, combined with mounting SG&A pressure • Persisting adverse trading environment in Serbia |
 32 Agenda • Diagnostic • Strategic priorities • Q4 and FY 2013 results • Operational overview • Food Lion • Hannaford • Delhaize Belgium • Southeastern Europe • Financial framework • Conclusion |
 33 Food Lion has maintained strong brand equity despite facing a competitive market (1) Source: Nielsen (Spectra database, AC View) and it includes the impact of the 126 Food Lion store closures in 2012 • The US Southeast has been intensely competitive over the last 20 years • high concentration of scale (top 3 players have ~60% of sales) • low cost players (Aldi, Costco, Target, dollar stores) • Walmart has high penetration • Walmart is #1 in all Southeast states except Florida • Food Lion has not been immune • Food Lion’s market share has decreased by ~200 bps over 2007-2012 (1) • Food Lion showed negative volume growth over 2009-2012, mainly driven by a decrease in # of items sold per transaction • Price positioning has not been consistent over time • #1 or 2 in markets accounting for 72% of sales (1) • In 2013, Food Lion’s sales growth outpaced the supermarket average • Stores located in convenient locations with smaller format stores Food Lion still has solid market positions in its major markets • |
 34 We developed the Phase plan to reverse the declining financial performance... • Pricing • Lower prices by 2-2.5% • Produce (fruits & vegetables) • Improved merchandising and training • Ease & Convenience • Facilitate ease of navigation Phase plan mainly addressed our price proposition and improved execution Phase 1 May 2011 166 stores Phase 2 March 2012 268 stores Phase 3 July 2012 269 stores Phase 4 May 2013 177 stores Phase 5 November 2013 169 stores • Food Lion Everyday • Clean stores • Private brand • Increase penetration in center store • Familiar & Dependable People |
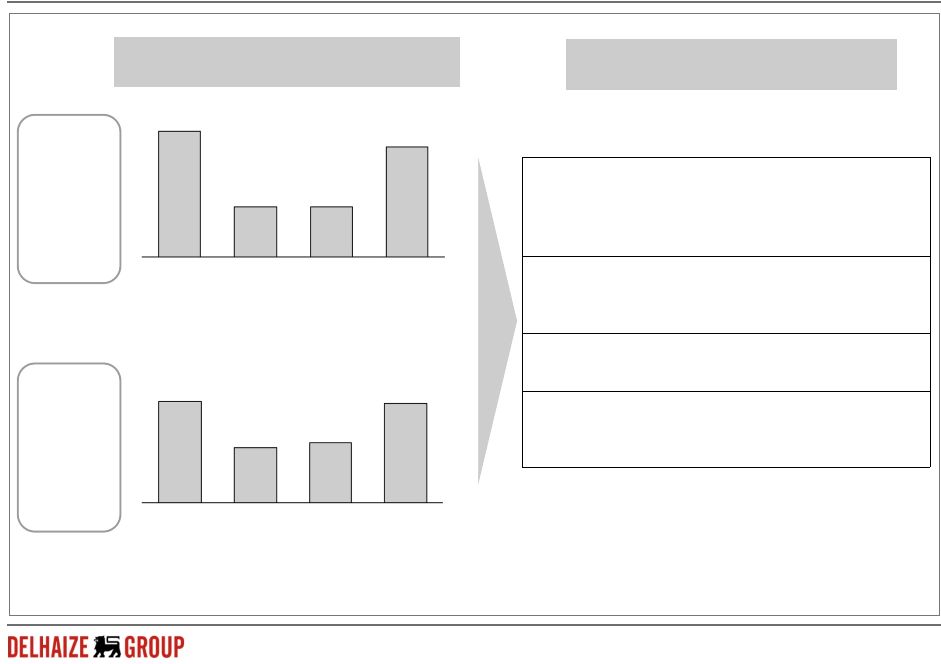 35 Q4 2013 4.9% Q3 2013 2.2% Q2 2013 2.2% Q1 2013 5.6% … with success, underlining the value of Food Lion’s brand Q4 2013 4.1% Q3 2013 2.5% Q2 2013 2.3% Q1 2013 4.2% Performance in Food Lion Phase stores Food Lion’s price equity has been strengthened # Items growth CSS Statement Phase markets March 2013 March 2013 vs July 2011 Offers lowest prices on things you buy the most 33% +7% Is good for people on a tight budget 40% +5% Has good specials throughout the store 41% +5% Source: Food Lion web based customer panel reflects sample of ~4k households |
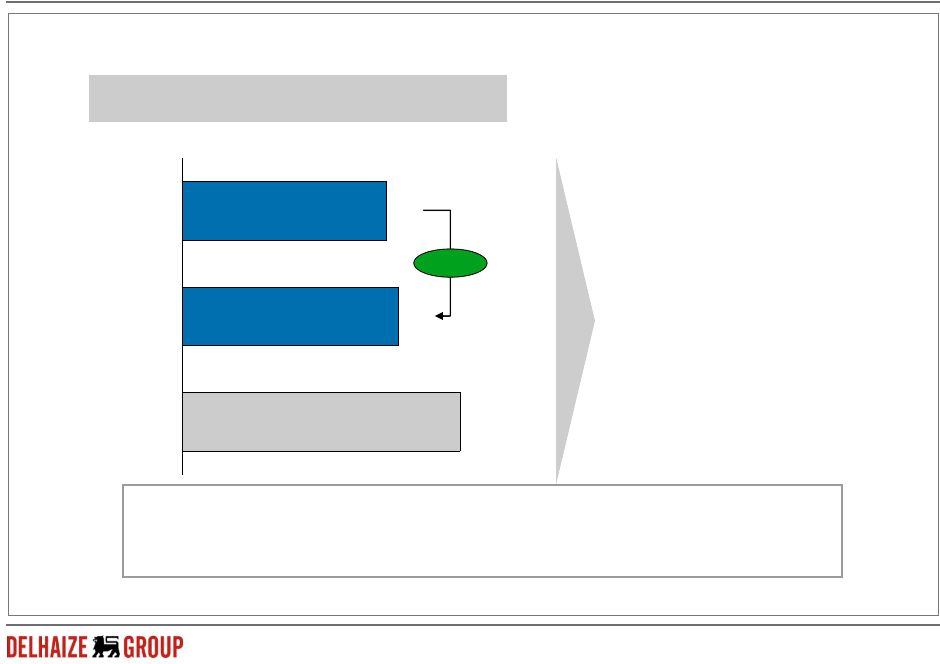 While Food Lion has increased sales, it continues to lag key competitors on sales per square foot • Sales density has started to increase with the Phase repositioning • Food Lion sales density is below the sector average Food Lion 2013 Food Lion 2010 Average selected peers (1) (1) Square footage data notes: peer data from Spectra for 17 states with DA operations, Adjusted by industry verage to reflect estimated selling sq ft; Food Lion actual selling sq ft (2) Walmart supercenter, Walmart Neighborhood Market, Bi-Lo, Harris Teeter, Publix And therefore we have developed the next step in our strategy 10.2 7.9 7.5 Average weekly sales per square foot ($) 36 +5.8% |
 37 Food Lion’s new strategy is meant to address customers’ needs and to differentiate Food Lion… TODAY Low prices driven by strong promotions Convenient locations Inconsistent fresh offering and perception More effective execution of the basics Vendor-driven center store assortment Task-oriented leadership and associates Building on our historical strengths Creates the “Easiest” shopping experience in town TOMORROW Really good everyday prices and great deals I count on Convenient locations Consistent fresh products displayed abundantly Fast and easy checkout experience Customer-driven center store assortment Caring, responsible and available associates • • • • • • • • • • • • |
 38 …and aims to increase share of wallet by delivering an Easy, Fresh, & Affordable experience |
 What our strategy will deliver to our customers… • Easy to shop • Easy to save • Easy to get in and out quickly • Easy to find dinner for tonight 39 |
 40 What our strategy will deliver to our customers… • Easy to shop • Easy to save • Easy to get in and out quickly • Easy to find dinner for tonight • Consistent quality • Fresh in the store and fresh at home • Appealing ready to eat meals • Large selection in fresh departments |
 41 What our strategy will deliver to our customers… • Easy to shop • Easy to save • Easy to get in and out quickly • Easy to find dinner for tonight • Consistent quality • Fresh in the store and fresh at home • Appealing ready to eat meals • Large selection in fresh departments • Dependable low prices • Compelling promotions • Simplified commu- nication on pricing • Private brands providing excellent value |
 What our strategy will deliver to our customers… • Easy to shop • Easy to save • Easy to get in and out quickly • Easy to find dinner for tonight • Consistent quality • Fresh in the store and fresh at home • Appealing ready to eat meals • Large selection in fresh departments • Dependable low prices • Compelling promotions • Simplified commu- nication on pricing • Private brands providing excellent value You can count on • Caring, responsive, and available associates • Involved in the community, especially when it matters • Always doing what we say, with customers, associates, vendors, and community 42 |
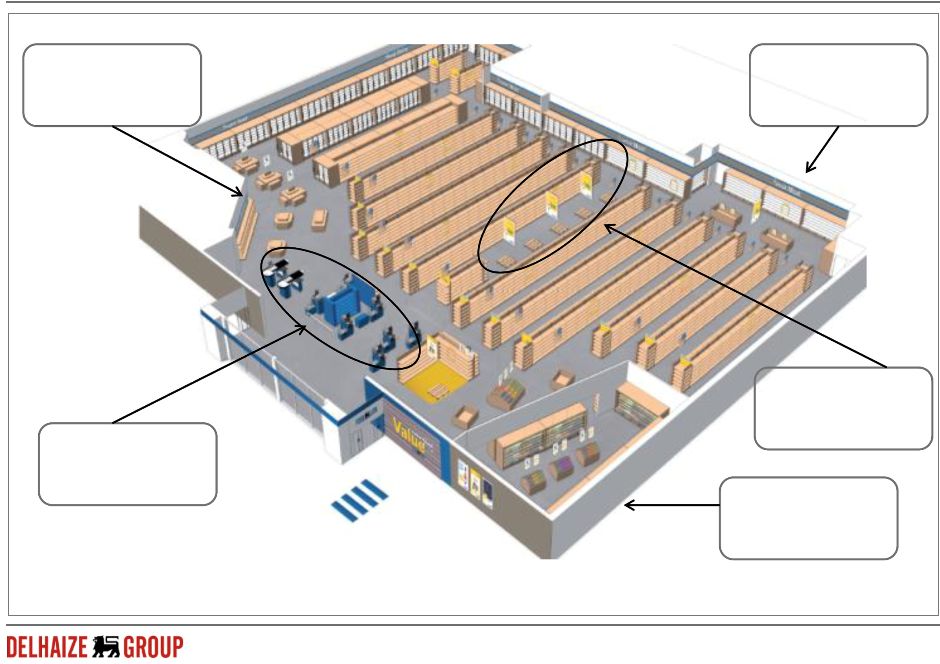 Concept store Fresh Meat Garden cooler Deli/Bakery New check- out Promo area 43 |
 We have begun the rollout of the next step and have defined milestones • Changes throughout the store network • Center store assortment review • Updated assortment rollout started in January 2014 • 50% completed in 2014 • Restricted to current space allocation • Out of the ~19,000 SKUs targeted by the assortment review: • ~ 3,300 SKUs added • ~ 6,700 SKUs deleted • A reduction of 18% of SKUs with 50% overall change • Check-out hardware & software • Rollout updated point-of-sale technology • Culture • Rollout trainings to evolve leadership behavior • Market test (77 stores): testing and fine-tuning Easy, Fresh & Affordable • Capital expenditures in market tests of $115 million • Testing different capital investments and evaluating commercial modules 44 |
 45 There is an opportunity to increase sales with current customers by growing share of wallet Estimated share of wallet potential 18% 26% 82% 74% Food Lion today Average of local peers Other grocery spend Spend at food retailer Source: Nielsen Homescan , 52 weeks ending 12/28/13, Cross Outlet Facts, Retail Banner Shopper, Total US (1) Local peers include Bi-Lo, Harris Teeter, Publix, Giant Carlisle and Martins (1) |
 46 Agenda • Diagnostic • Strategic priorities • Q4 and FY 2013 results • Operational overview • Food Lion • Hannaford • Delhaize Belgium • Southeastern Europe • Financial framework • Conclusion |
 47 Hannaford has strong foundations TODAY • #1 or 2 in markets accounting for 60% of sales • Solid brand equity • Reliable product quality and variety • Recognized for great in-store customer experience and high service • High profitability • Well-maintained store base • Proven talent development and management programs • Local player, close to communities |
 However competition is increasing in the Northeast TODAY • #1 or 2 in markets accounting for 60% of sales • Solid brand equity • Reliable product quality and variety • Recognized for great in-store customer experience and high service • High profitability • Well-maintained store base • Proven talent development and management programs • Local player, close to communities CHALLENGES • Over 2007-2013, Hannaford’s revenues increased by 3.0% p.a., of which half is driven by selling area expansion • Competition has continued to expand whereas market size and growth is limited 48 |
 Therefore Hannaford needs to maintain its differentiation and accelerate growth PRIORITIES • Continued price investments – improve price perception and positioning • Work on further differentiation – assortment review (process just started) • Online – expand click & collect points with Hannaford To Go • Accelerate growth by new stores and remodelings TODAY • #1 or 2 in markets accounting for 60% of sales • Solid brand equity • Reliable product quality and variety • Recognized for great in-store customer experience and high service • High profitability • Well-maintained store base • Proven talent development and management programs • Local player, close to communities CHALLENGES • Over 2007-2013, Hannaford’s revenues increased by 3.0% p.a., of which half is driven by selling area expansion • Competition has continued to expand whereas market size and growth is limited 49 |
 Agenda • Diagnostic • Strategic priorities • Q4 and FY 2013 results • Operational overview • Food Lion • Hannaford • Delhaize Belgium • Southeastern Europe • Financial framework • Conclusion 50 |
 51 Delhaize is a well-recognized brand in Belgium... TODAY • #2 position with a 25.5% market share • Strong brand and excellent locations • Large fresh offering and broad private label range • Expansion mainly coming from Affiliated concepts • Increase in remodeling activity (2009- 2010: 16 remodelings on average; 2011- 2013: 23 remodelings on average) |
 52 ...but it has fundamental issues to address TODAY • #2 position with a 25.5% market share • Strong brand and excellent locations • Large fresh offering and broad private label range • Expansion mainly coming from Affiliated concepts • Increase in remodeling activity (2009- 2010: 16 remodelings on average; 2011- 2013: 23 remodelings on average) CHALLENGES • Despite expansion, flat market share • Profitability under pressure • Complex organisation • Price perception • Increased competitive openings • Price-sensitive consumer given challenging economic background |
 53 Therefore Delhaize needs to re-capture its differentiated position and improve efficiency PRIORITIES • Fine-tune our differentiation • Best in Fresh • Innovative and efficient assortment • Best everyday value for all • Best shopping experience • New Generation Store • First 2 stores by April • Strengthening affiliates • Efficiency improvements • Online – accelerate growth of Delhaize Direct CHALLENGES • Despite expansion, flat market share • Profitability under pressure • Complex organisation • Price perception • Increased competitive openings • Price-sensitive consumer given challenging economic background TODAY • #2 position with a 25.5% market share • Srtong brand and excellent locations • Large fresh offering and broad private label range • Expansion mainly coming from Affiliated concepts • Increase in remodeling activity (2009- 2010: 16 remodelings on average; 2011- 2013: 23 remodelings on average) |
 54 Agenda • Diagnostic • Strategic priorities • Q4 and FY 2013 results • Operational overview • Food Lion • Hannaford • Delhaize Belgium • Southeastern Europe • Financial framework • Conclusion |
 Alfa Beta has become the market leader in Greece • Economic situation continues to be difficult but signs of optimism • Against this backdrop, Alfa Beta has continued to perform well • Alfa Beta is now the #1 food retailer in Greece, primarily due to • Customers appreciation for Alfa Beta’s unique combination of quality offering (both in product & service) and competitive pricing • Difficulties for some of the competitors 55 TODAY |
 56 However it should seek additional opportunities to grow CHALLENGES • Ongoing economic situation • Alfa Beta is not present in some important regions • Accelerated expansion plans from major competitors TODAY • Economic situation continues to be difficult but signs of optimism • Against this backdrop, Alfa Beta has continued to perform well • Alfa Beta is now the #1 food retailer in Greece, primarily due to • Customers appreciation for Alfa Beta’s unique combination of quality offering (both in product & service) and competitive pricing • Difficulties for some of the competitors |
 Therefore Alfa Beta will continue to consolidate its market position PRIORITIES • Continue store expansion • Further differentiation focused on •Targeted price investments •Assortment improvements •Online (develop omni-channel approach) TODAY • Economic situation continues to be difficult but signs of optimism • Against this backdrop, Alfa Beta has continued to perform well • Alfa Beta is now the #1 food retailer in Greece, primarily due to • Customers appreciation for Alfa Beta’s unique combination of quality offering (both in product & service) and competitive pricing • Difficulties for some of the competitors CHALLENGES • Ongoing economic situation • Alfa Beta is not present in some important regions • Accelerated expansion plans from major competitors 57 |
 58 Maxi is the market leader in Serbia... TODAY • National market leader with clear top position in Belgrade and a healthy profitability • Operates 381 stores and has a strong presence in supermarket and convenience stores with good locations • Modern grocery covers 43% of total market (1) (1) Source: Euromonitor. Modern retail market: hypermarkets, supermarkets, hard discount, convenience stores and cash & carry; 2012 data |
 but has not delivered on our expectations CHALLENGES • High unemployment • Negative GDP growth • CSS under pressure • Increased competition TODAY • National market leader with clear top position in Belgrade and a healthy profitability • Operates 381 stores and has a strong presence in supermarket and convenience stores with good locations • Modern grocery covers 43% of total market (1) 59 |
 60 Therefore it needs to improve its execution CHALLENGES • High unemployment • Negative GDP growth • CSS under pressure • Increased competition TODAY • National market leader with clear top position in Belgrade and a healthy profitability • Operates 381 stores and has a strong presence in supermarket and convenience stores with good locations • Modern grocery covers 43% of total market (1) PRIORITIES • First priority: improve execution •Pricing & promotions •IT systems •HQ & store processes •New DC (Q4 2014) to •Assortment structure • Then... •Remodelings •New store growth decrease Direct Store Delivery |
 Mega Image has become the market leader in Bucharest TODAY • Mega Image has posted high growth (296 stores in 2013 compared to 40 in 2008) • Operations mainly focused on the capital with ~20% market share • The economy has been resilient • Profitability has significantly increased • 2 store formats – convenience stores, supermarkets 61 |
 62 But competition is also expanding CHALLENGES • Competition is expanding fast • Low purchasing power outside of Bucharest • Further professionalize organization TODAY • Mega Image has posted high growth (296 stores in 2013 compared to 40 in 2008) • Operations mainly focused on the capital with ~20% market share • The economy has been resilient • Profitability has significantly increased • 2 store formats – convenience stores, supermarkets |
 63 Therefore a clear action plan for the years to come is needed PRIORITIES • Store expansion • Improve customer proposition • Better customer service • Grow private labels • Improve entry prices • Build second distribution center to support expansion and reduce cost of goods CHALLENGES • Competition is expanding fast • Low purchasing power outside of Bucharest • Further professionalize organization TODAY • Mega Image has posted high growth (296 stores in 2013 compared to 40 in 2008) • Operations mainly focused on the capital with ~20% market share • The economy has been resilient • Profitability has significantly increased • 2 store formats – convenience stores, supermarkets |
 64 Agenda • Diagnostic • Strategic priorities • Q4 and FY 2013 results • Operational overview • Food Lion • Hannaford • Delhaize Belgium • Southeastern Europe • Financial framework • Conclusion |
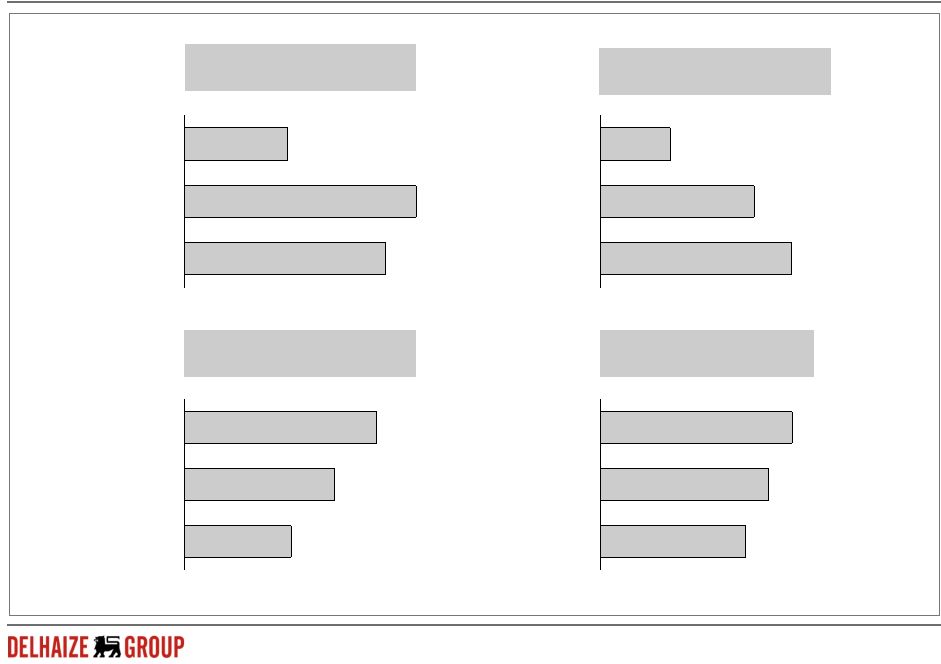 65 High free cash flow generation has improved our balance sheet S&P’s adjusted net debt / EBITDA (2) 1.9 2.2 2.5 2013 2012 2011 Net cash position 920 419 2013 1,149 2012 2011 Net debt 2013 1,473 2012 2,072 2011 2,660 669 773 345 2012 2013 2011 Free cash flow (1) ( in Millions) ! (1) Excluding Maxi acquisition (2) Adjusted for a.o. operating leases and post retirement obligations – as updated by S&P’s rating services in light of the new methodology issued in 2013; 2013 data based on Delhaize’s own estimates according to S&P’s new methodology |
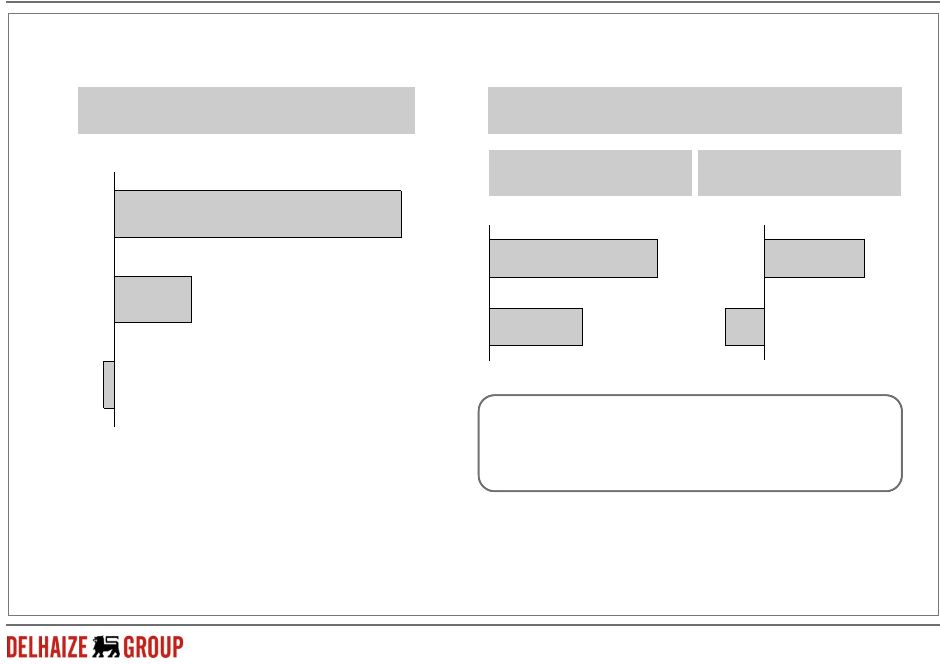 Despite progress made over the last 2 years, we still target further improvements in working capital Core Working Capital (1) (1) Inventories + accounts receivables – accounts payables (2) Core working capital * 365 / sales 571 -22 154 2013 2012 2011 Days working capital (2) US Belgium 10 18 2013 2011 -2 5 1 day of Group core working capital in 2013 = approximately €60 million 66 |
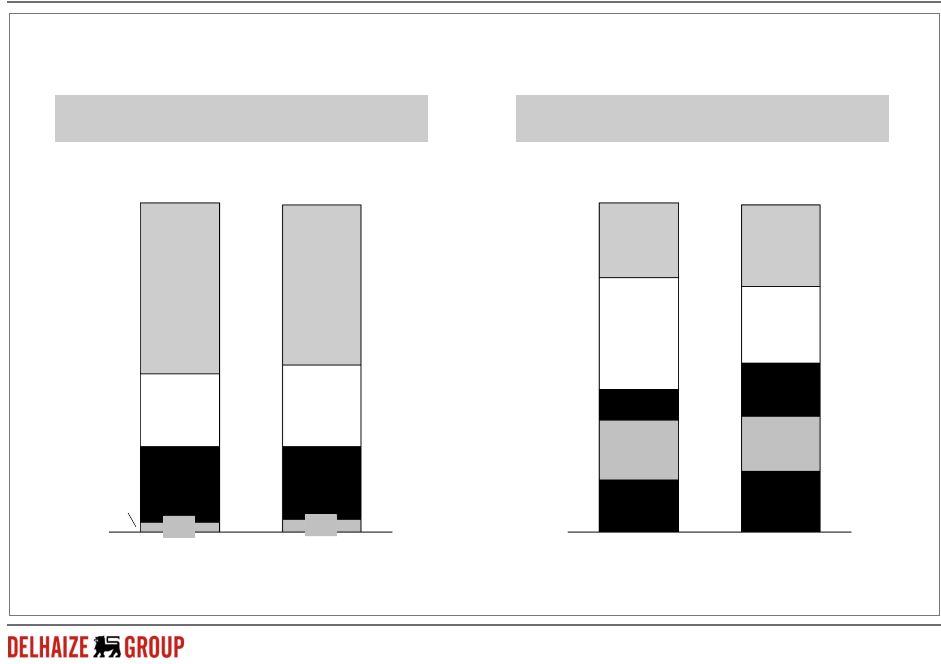 67 We will remain disciplined in our capital allocation Geography Category 23% 681 22% 565 Corporate 2013 2012 US Belgium SEE 3% 4% 16% HQ & IT Distribution Centers Remodelings New stores 2013 565 16% 2012 681 9% Maintenance & Other 19% 18% 17% 34% 23% 23% 25% 22% 25% 52% 49% ( in Millions) ! |
 DG payout ratio 2009 2010 2013 2012 2011 2008 Gross dividend (!) 1.48 1.56 1.40 1.76 1.72 1.60 2012 2013 2011 2010 2009 2008 (1) Payout on underlying Group share in net profit +11.4% 68 We have formalised our dividend policy with a payout (1) ratio of approximately 35% 5-year historical average: 31.3% 35.0% 33.5% 32.8% 29.8% 30.2% 30.3% |
 69 Agenda • Diagnostic • Strategic priorities • Q4 and FY 2013 results • Operational overview • Food Lion • Hannaford • Delhaize Belgium • Southeastern Europe • Financial framework • Conclusion |
 Conclusion • We put the customer at the center • We have leadership market positions in the majority of our US markets, in Belgium and in Greece • We will focus on our core markets • We plan to re-invest improved efficiencies and accelerate growth in our core markets • We have established clear strategic principles based on diligent analysis • We will execute with speed • We will update you along the way • Food Lion store visits in the fall 2014 • Elements of 2014 guidance • Capex of approximately €625 million (1) • 180 new stores (1) At identical exchange rates (1€ = $1.3281) 70 |
SIGNATURES
Pursuant to the requirements of the Securities Exchange Act of 1934, the registrant has duly caused this report to be signed on its behalf by the undersigned hereunto duly authorized.
ETABLISSEMENTS DELHAIZE FRÈRES ET CIE “LE LION” (GROUPE DELHAIZE) | ||||||||
| Date: | March 19, 2014 | By: | /s/ G. Linn Evans | |||||
| G. Linn Evans | ||||||||
| Senior Vice President | ||||||||